the Creative Commons Attribution 4.0 License.
the Creative Commons Attribution 4.0 License.
 | 17 Feb 2022
Effect of nitrogen limitation and soil biophysics on Holocene greening of the Sahara
Jooyeop Lee
Martin Claussen
Jeongwon Kim
Je-Woo Hong
In-Sun Song
The so-called Green Sahara (GS), which was a wet and vegetative Sahara region in the early to mid-Holocene, provides useful information on our climate simulation because it is a consequence of complex interaction between biophysical and climatic processes. It is still a challenge to simulate the GS in terms of vegetative extent and precipitation using current climate models. This study attempts to simulate the Green Sahara 8000 years ago by using the state-of-the-art Earth system model CESM that incorporates the nitrogen cycle and the soil–precipitation feedbacks. Our study puts more emphasis on the impact of soil biophysical properties (e.g., bare-soil albedo, porosity, heat capacity, and hydraulic conductivity) and soil nitrogen influenced by soil organic matter on the simulation of the GS. In this coupled simulation, vegetation interacts with changes in soil properties and soil organic matter by phenology, decomposition, and allocation of carbon and nitrogen. With changes in the Earth's orbit and dust in the early to mid-Holocene, the model simulates increased precipitation in North Africa but does not capture the extent of the GS. Our analysis shows that the Holocene greening is simulated better if the amount of soil nitrogen and soil texture is properly modified for the humid and vegetative GS period. Soil biochemical and physical properties increase precipitation and vegetation cover in North Africa through their influence on photosynthesis and surface albedo as well as their consequent enhanced albedo–precipitation and evapotranspiration–precipitation feedbacks. Our findings suggest that future climate simulation needs to consider consequent changes in soil nitrogen and texture with changes in vegetation cover and density for proper climate simulations.
- Article
(4511 KB) - Full-text XML
-
Supplement
(746 KB) - BibTeX
- EndNote


The Sahara is the largest subtropical desert on Earth, but it was wetter and had more vegetation than today during the early to mid-Holocene (EMH hereafter) (Holmes, 2008). In this Green Sahara (GS hereafter) period, the region was covered with various vegetation, inland rivers, and mega-lakes (Pachur and Kröpelin, 1987; Jolly et al., 1998; Schuster et al., 2005; Quade et al., 2018) up to 23∘ N in North Africa, unlike the current vegetation, which only exists in regions below 15∘ N. The GS was sensitive to climate change with locally rapid transitions from a humid to a more arid state some 8000 to 5000 years ago (Shanahan et al., 2015). The GS and its transition to an arid state are the results of complex interactions of the orbital forcing changes with the land–atmosphere interaction and sea surface temperature (SST) variability (Claussen et al., 2017; Braconnot et al., 2019). Future climate predictions are made using Earth system models (ESMs), and recent progress in the development of ESMs have made it possible to simulate and assess the carbon–climate feedbacks. GS is a good example to evaluate various feedback processes in state-of-the-art ESMs and evaluate the model performance accordingly (Harrison et al., 2015; Pausata et al., 2020). In this context, the GS period provides unique and useful insights for our climate prediction in a changing climate.
Many modeling studies have tried to simulate the GS and to understand the underlying mechanisms of the GS correctly. Early studies focused on the impacts of change in the Earth's orbit leading to higher summer solar insolation compared to the present (Kutzbach, 1981; Kutzbach and Street-Perrott, 1985). Further studies revealed that the following factors contributed to the amplification of the GS: the ocean–climate feedback (Kutzbach and Liu, 1997; Braconnot et al., 1999), vegetation–climate feedback (Claussen, 1998; Claussen et al., 1999, 2013; Rachmayani et al., 2015; Groner et al., 2018), soil–climate feedback (Kutzbach et al., 1996; Knorr et al., 2001; Levis et al., 2004; Knorr et al., 2006; Vamborg et al., 2011; Lu et al., 2018), inland water (Coe and Bonan, 1997; Krinner et al., 2012), and dust–climate feedback (Pausata et al., 2016; Gaetani et al., 2017). However, current state-of-the-art climate models still yield diverging results regarding the extent of the GS and the understanding of feedback processes (Claussen et al., 2017).
Recently, ESMs have begun to couple nitrogen (N hereafter) processes to the carbon cycle. The global carbon budget has been simulated more realistically with the recent inclusion of the nitrogen cycle in ESMs because of the N-limitation effect of terrestrial gross primary production (GPP) (Thornton et al., 2007; Castillo et al., 2012; Arora et al., 2020). However, the impact of nitrogen limitation on the GS simulation has not been extensively investigated as far as we know. It is also notable that soil in the GS includes more organic matter and humus compared to the current condition because vegetation leads to more organic matter in soils, thus affecting hydraulic, thermal, and radiative properties of soil (e.g., Kutzbach et al., 1996; Levis et al., 2004; Lu et al., 2018). Lu et al. (2018) concluded that organic matter in soil texture likely played an important role in the GS dynamics, but their study was based on the offline land surface model only with changes in soil hydraulic and thermal properties, and more studies need to be done to investigate impacts of the biophysical and biogeochemical changes in soil on the GS greening in the framework of fully coupled ESMs.
The present study focuses on better understanding ESM simulation ability to simulate vegetation in the GS and its uncertainties by the representation of physical processes in the land surface model. We investigate the impacts of nitrogen limitation and soil biophysical processes on the GS simulations using the Community Earth System Model (CESM, version 1.2) (Hurrell et al., 2013). Based on a series of model simulations, we examine changes in the GS extension and its associated uncertainties by related factors of orbital forcing, nitrogen and carbon in soil, and soil texture.
2.1 Model description
The Community Earth System Model (CESM, version 1.2) with the Community Atmosphere Model version 4 (CAM4; Neale et al., 2013) and Community Land Model version 4 (CLM4; Oleson et al., 2010; Lawrence et al., 2011) is employed in this study. The CESM incorporates prognostic carbon–nitrogen (CN) equations and the dynamic vegetation model into the land surface model. The model simulates carbon dynamics such as productivity, phenology, decomposition, and allocation with carbon and nitrogen fluxes at the ecosystem–atmosphere interface by the CN prognostic equations. This new CN parameterization makes a substantial difference in vegetation simulation by limiting gross primary production (GPP) with soil mineral nitrogen in the climate simulations particularly (Thornton et al., 2007; Castillo et al., 2012; Arora et al., 2020).
GPP becomes the potential GPP (GPPp) if there is no nitrogen limitation, and nitrogen limitation is linked to soil organic matter in the model. Nitrogen limitation on GPP is expressed by CFexcess, which is decided by soil mineral nitrogen (Nsminn). Nsminn is a function of the conversion rate of soil organic nitrogen to mineral nitrogen (NFsoil4n→sminn) and is affected by the amount of soil carbon (soil4c) eventually (Eqs. 2–9). It was reported that GPP in CESM version 1 was smaller than other CMIP6 models because of the larger nitrogen limitation effect. More details on the CN parameterization in the CLM can be found in Thornton et al. (2002, 2009) and Kluzek (2012). The description of the variables used in this study including those in Eq. (1) are listed in Appendix A.
The albedo–precipitation feedback has also been considered to be one of the important aspects in the land–atmosphere interaction and should be clearly examined in the GS simulation (e.g., Charney, 1975; Cess, 1978; Bonfils et al., 2001; Houldcroft et al., 2009; Levine and Boos, 2017). Precipitation increases if surface albedo decreases because of more vegetation through the stratification of the atmosphere, particularly in drylands. However, in the CMIP5 (Coupled Model Intercomparison Project 5) EMH simulations, soil moisture is irrelevant to surface albedo in most land surface models (LSMs) (e.g., Takata et al., 2003; Zeng, 2005; Houldcroft et al., 2009; Oleson et al., 2010; Watanabe et al., 2010; Vamborg et al., 2011). This study uses CLM4 for simulation of land surface processes. In the CLM4, surface albedo is parameterized as a function of soil moisture in the calculation of soil background albedo. In this parameterization, soil background albedo decreases with increases in soil moisture of the first soil layer as follows.
In addition, the soil texture distribution is classified by sand and clay percentage, and soil has 20 color classes from the low to high albedo. In the lowest albedo (darkest soil), dry (saturated) albedo is 0.08 (0.04) and 0.16 (0.08) in the visible and near-infrared (NIR) range, respectively. In the highest albedo (lightest soil), the dry (saturated) albedo is 0.36 (0.25) and 0.61 (0.50) in the visible and NIR range, respectively. αsat is equal to the albedo of the saturated soil.
2.2 Experimental design
For our CESM simulations of the GS, the horizontal resolution is in global scale with 26 vertical levels. The initial land surface data are made using CLM4 offline simulations for 600 years in the CN-accelerated decomposition mode (Thornton and Rosenbloom, 2005), and then using 1200-year CLM4 simulations with CNDV (carbon–nitrogen–dynamic–vegetation) and atmospheric forcing data for the years 1948–1972 based on Qian et al. (2006). The present (i.e., 0K) and EMH (i.e., 8K) simulations are 500-year climate simulations using the pre-industrial and EMH conditions, respectively (Table 1). The EMH period is set to 8000 years ago (8K) in this study because the 8K period was relatively greener than other periods (Jolly et al., 1998; Groner et al., 2018).
Table 1The abbreviations of the numerical experiments conducted in this study.
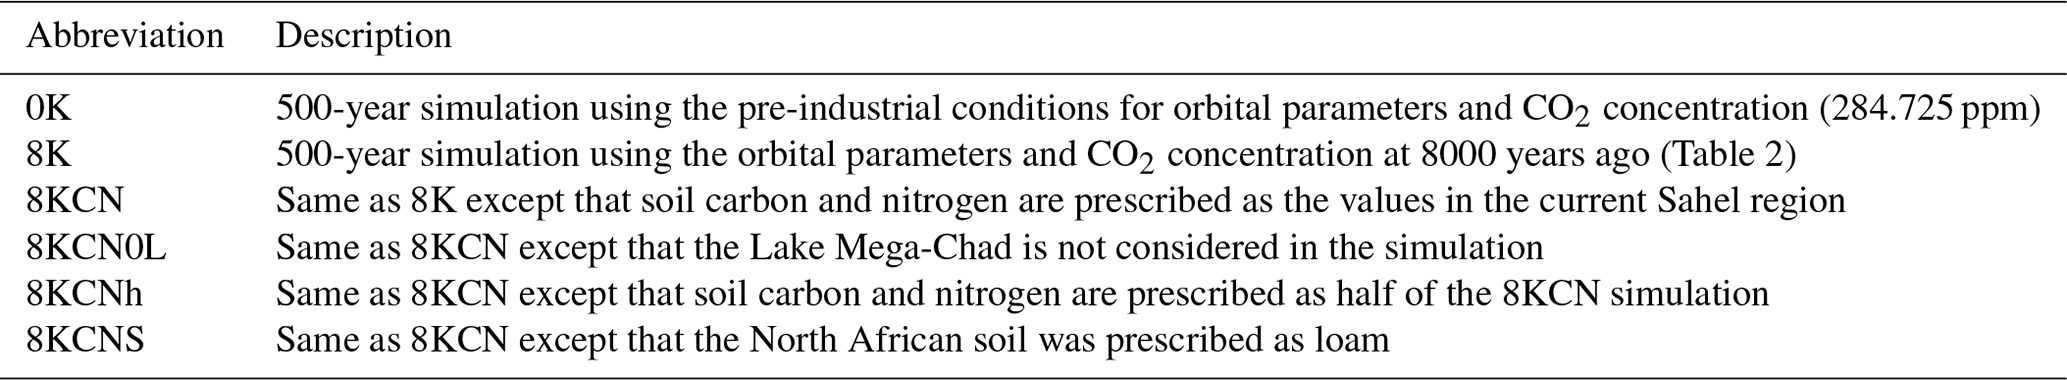
Additional sensitivity experiments using the EMH conditions are conducted with different land states to examine the impacts of soil nitrogen, soil texture, and the mega-lake on the GS simulation (Table 1). Soil carbon and nitrogen are negligible in the current Sahara. To the best of our knowledge, there is no information on soil organic carbon and nitrogen in North Africa during the EMH. It is reasonable to consider more soil carbon and nitrogen in the GS than in the present-day Sahara because of their close coupling with biomass (Brooks, 2003; Wang et al., 2010; Yang et al., 2014). To consider the possibility of relatively larger soil carbon and nitrogen in the GS, more soil carbon and nitrogen are added with less sandy soil (i.e., loamier soil with more soil organic matter) in the 8KCN and 8KCNS experiments based on Jolly et al. (1998) to prescribe soil organic matter in the GS (i.e., 10–22∘ N, 345∘ W–40∘ E) using nearby grassland grid values (Fig. 1). In these sensitivity experiments, the feedbacks between vegetation and increased soil carbon and nitrogen evolve dynamically in the model through litterfall and decomposition processes.
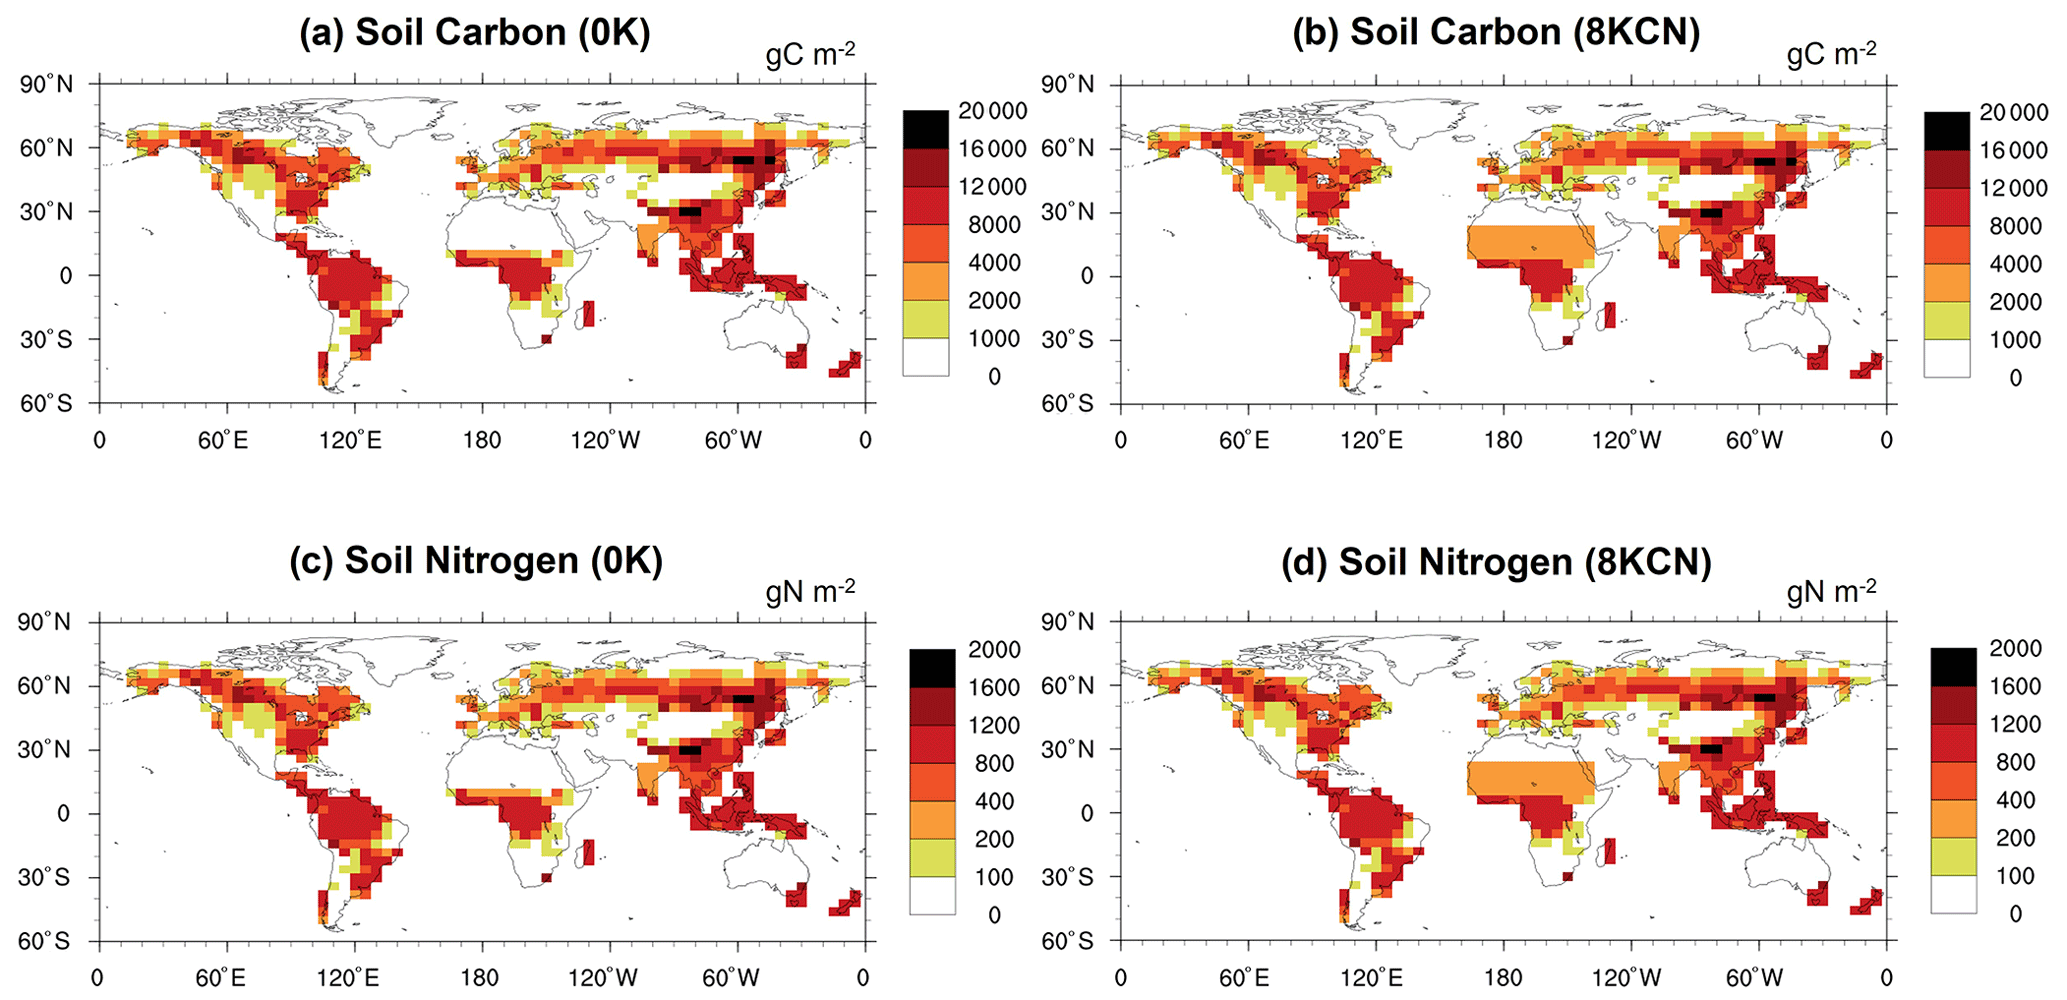
Figure 1Global maps of soil carbon (a, b) and nitrogen (c, d) used in the 0K and 8KCN simulations.
In all EMH simulations, the Earth's orbital parameters and atmospheric CO2 concentration are prescribed based on Berger (1978) with pre-industrial SST (Table 2), and atmospheric dust is reduced following Pausata et al. (2016) (Fig. 2). In addition, Lake Mega-Chad is considered in our EMH simulations by assigning 73 % of the two grids near the Lake Chad region (14–18∘ N, 15∘ E) as lake area to consider the extensive Lake Chad in the EMH (Leblanc et al., 2006; Quade et al., 2018). Our analysis focuses on three critical regions in North Africa around the border of the vegetation in our simulation: North Africa at 20∘ N (solid boxed area in Fig. 3, NA hereafter) and the Sahara–Sahel (SS hereafter) region. These regions are selected as the analysis region because the NA region is closely related to the onset and progress of the African monsoon (Levis et al., 2004) and the SS region was sensitive to precipitation–land interaction (Kutzbach et al., 1996). The Sahara–Sahel region is divided into the northern Sahara–Sahel region (dotted box area in Fig. 3, NSS hereafter) and southern Sahara–Sahel region (dashed box area in Fig. 3, SSS hereafter) with a common latitudinal band around 18∘ N in this study. The NSS is the boundary region of vegetation in the EMH, and the SSS shows substantial increases in precipitation with changes in the orbital forcings (more information in the next section). These two regions share the 18∘ N latitude band for considering the common properties between two regions and the model resolution.
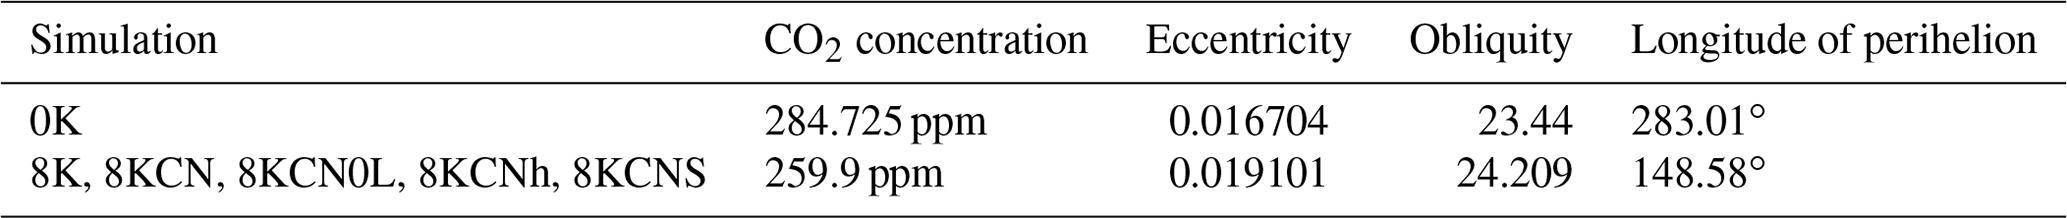
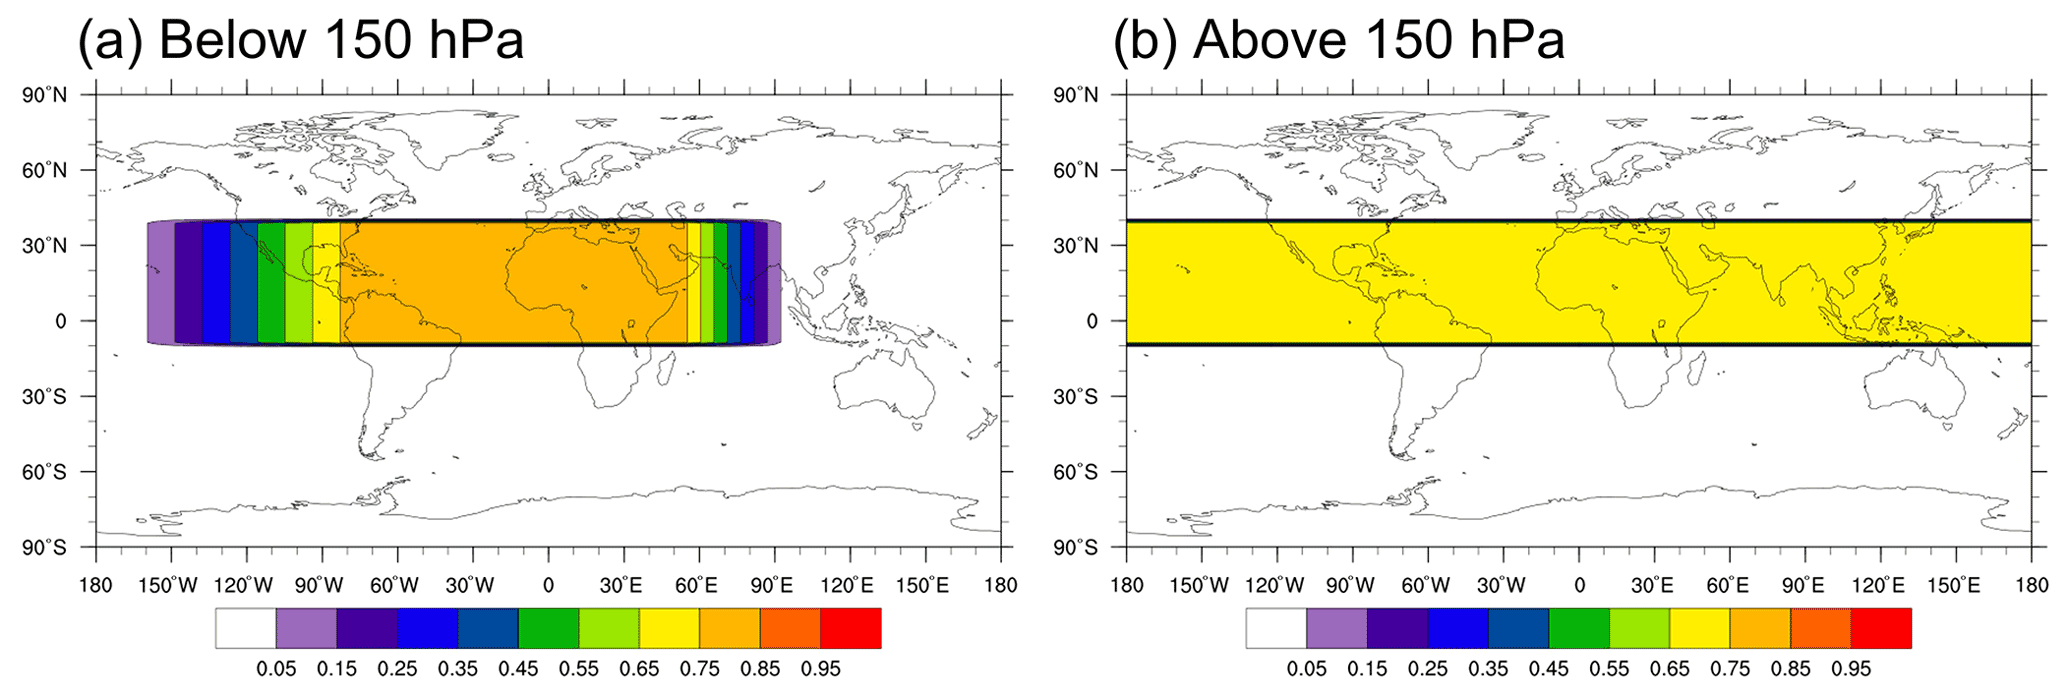
Figure 2Dust reduction fraction (a) below 150 hPa and (b) above 150 hPa in the 8K experiments compared to the present-day values.
3.1 Climate and vegetation simulation in the Green Sahara
The 8K simulation shows typical climate patterns in the Sahara–Sahel region during the EMH, and there are substantial differences of surface climates between the 0K and 8K experiments in North Africa (Fig. 3). The summer downward radiation at the top of the atmosphere increases by 6 % in the SS region compared to the present because of the change in the orbital forcing and lower amount of dust in the EMH. This increase in solar radiation leads to an increase in surface shortwave radiation and net radiation by 30 and 21 W m−2, respectively, as well as subsequent temperature warming by 1.8 ∘C in the NA region in the 8K experiment (Fig. 3). The intensified land–sea thermal contrast during the EMH makes spatial changes in precipitation and wind patterns over Holocene North Africa compared to the present climate. Notably, the increases in air temperature and shortwave radiation are not substantial in the SS region (less than 10 % compared to the NA region) because of the increase in precipitation and clouds with the northward migration of the monsoon by the intensified land–sea thermal contrast (Fig. 3d). Indeed, the meridional wind in the 18∘ N region changed from northerly (−0.7 m s−1) to southerly (0.3 m s−1) in the 8K experiment (Fig. 3g, h), indicating a northward shift of the Intertropical Convergence Zone (ITCZ) (i.e., the convergence zone of the trade winds) to above 18∘ N. This ITCZ shift caused a favorable condition for a moister Sahara by transporting more moisture and subsequently more precipitation to the SS region (Chikira et al., 2006; Larrasoaña et al., 2013). Compared to the pre-industrial simulation (i.e., 0K), summer precipitation in the EMH simulation (i.e., 8K) increases by 18 % (from 4.0 to 4.7 mm d−1) and 15 % (from 2.5 to 2.9 mm d−1) in the SSS and NSS region, respectively (Fig. 3e, f).

Figure 3Differences of climate conditions between the 8K and 0K experiment (8K–0K) in summer (June, July, August, and September; JJAS). Differences in downward shortwave radiation (a), surface net shortwave radiation (b), 2 m air temperature (c), and cloud fraction (d). (e, f) JJAS precipitation in the 0K and its differences from the 8K experiment. (g, h) JJAS surface wind vector of the 0K and 8K experiment, respectively. Black squared boxes are the NA (solid), NSS (dotted), and SSS (dashed) areas.
The pre-industrial simulation captures the observed spatial extent of the current Sahara based on MODIS (Moderate Resolution Imaging Spectroradiometer) land surface data (Fig. 4a) (Broxton et al., 2014). Importantly, the model does not simulate an increased vegetation fraction, despite the increased precipitation over the SS region during the EMH (Fig. 4b). Reconstruction of vegetation based on the pollen records reveals that grass and trees expanded up to 26 and 20∘ N over North Africa during the GS period, respectively (Hély et al., 2014; Hopcroft et al., 2017). Also, leaf wax data indicate that the GS extended as far north as 31∘ N (Tierney et al., 2017). In contrast to the proxy data, vegetation fraction and GPP show negligible changes in North Africa and even a decrease in western Africa and the southern border of the current Sahara in the 8K simulation (Fig. 4b, e). It is notable that Lake Mega-Chad did not make substantial changes in simulated summer precipitation northward movement of the 200 and 412 mm yr−1 precipitation isohyet for 20 % grassland cover, which is similar to Contoux et al. (2013) (Figs. S1, S2 in the Supplement).

Figure 4Vegetation fraction (percentage per grid, a, b, c), summertime GPP (gC m−2 per month, d, e, f), and dominant land cover (g, h, i). Panels (b) and (e) and panels (c) and (f) are differences between 8K and 0K and between 8KCN and 8K, respectively. Dominant land cover is decided as bare soil if the vegetation cover fraction is less than 20 %.
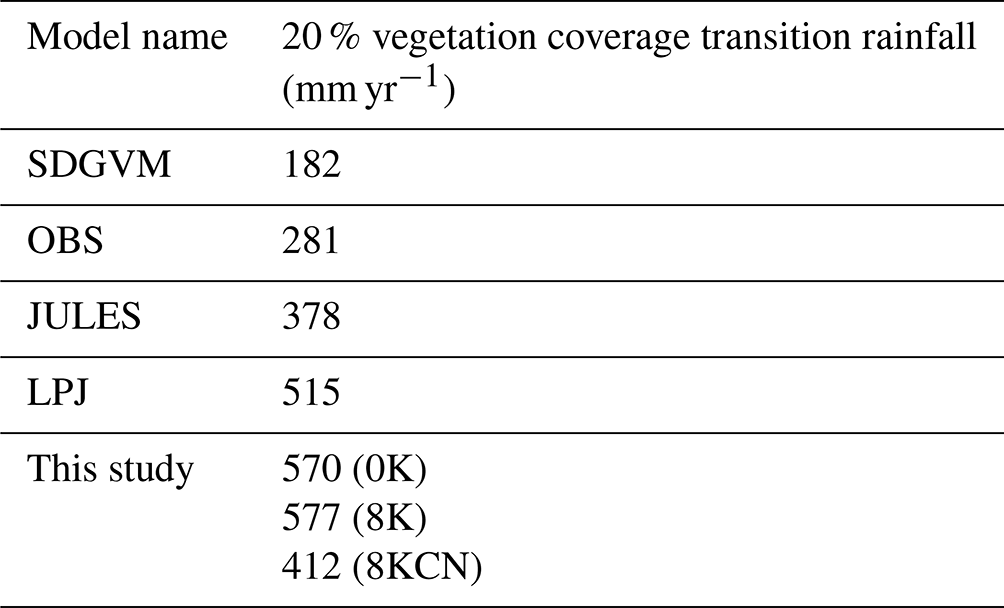
Hopcroft et al. (2017) attributed such underestimation of the GS to an excessive precipitation requirement for vegetation growth in the model (Table 3). Our investigation also shows that the minimum amount of precipitation for vegetation growth is 577 mm yr−1 in the 8K experiment, and this precipitation threshold is larger than the observation value of 281 mm yr−1 (Hopcroft et al., 2017). This larger threshold indicates that our model has relatively little vegetation cover with respect to the same amount of precipitation and is not fully understood yet in the ESM (Hopcroft et al., 2017). Our investigation reveals that this excess water requirement by vegetation growth becomes smaller with improved water use efficiency (WUE) and proper assignment of soil organic matter and soil texture, which is discussed in the next section.
Table 3The 20 % vegetation coverage transition rainfall for OBS (observation data) and four model simulations (the Joint UK Land Environment Simulator version 4.1, Lund–Potsdam–Jena dynamic vegetation model version 2.1, Sheffield Dynamic Global Vegetation Model, and CLM4 for this study). OBS, JULES, LPJ, and SDGVM indicate the value from the observation and model simulation in the pre-industrial conditions, which is from Hopcroft et al. (2017).
3.2 Impact of soil nitrogen on the Green Sahara simulation
The 8KCN experiment is designed to study the effect of an increase in soil nitrogen by vegetation on the GS and simulates typical surface climate patterns during the EMH (not shown here). Importantly, the 8KCN simulation reproduces larger precipitation and vegetative areas with an increase in GPP in the SS region compared to the 8K experiment (Fig. 4). Vegetation fraction increases by about double in the SS region (21 % and 8 % in the SSS and NSS regions, respectively) in the 8KCN experiment (Table 4). The 8KCN experiment also shows a 2 times larger vegetation fraction than the 8K experiment around the boundary of precipitation changes between the present and EMH (about 18∘ N). Particularly, the 8KCN experiment shows 3.3 and 5.3 times larger GPP in the NSS and SSS regions, respectively, compared to the 8K experiment (Table 5). Consequently, the precipitation threshold for vegetation decreases to 412 mm yr−1 in the 8KCN from 577 mm yr−1 in the 8K experiment together with increased WUE values (Figs. 5 and 6). With this increase in vegetation fraction, the desert–grassland boundary moves one grid box northward in the 8KCN simulation compared to the 8K experiment (Fig. 4i).
Table 4Vegetation fraction (%) and GPP (gC m−2 per month) in the SS region. Values in parenthesis are percentage changes in vegetation fraction and GPP to the 8K simulation.

Table 5GPP (gC m−2 per month) from five CMIP5 models (IPSL-CM5A-LR, MIROC-ESM, bcc-csm1-1, MPI-ESM-P, CCSM4) for 6K simulations and this study in the NSS region (18–22∘ N) during the pre-industrial period (PI) and early to mid-Holocene (EMH).
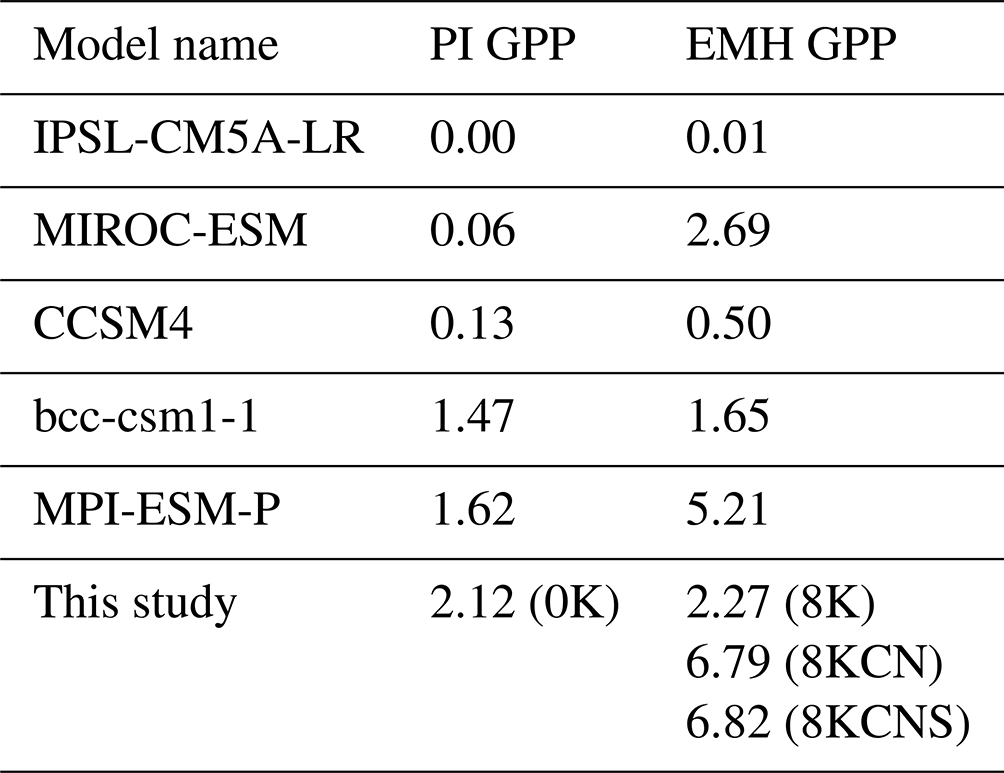
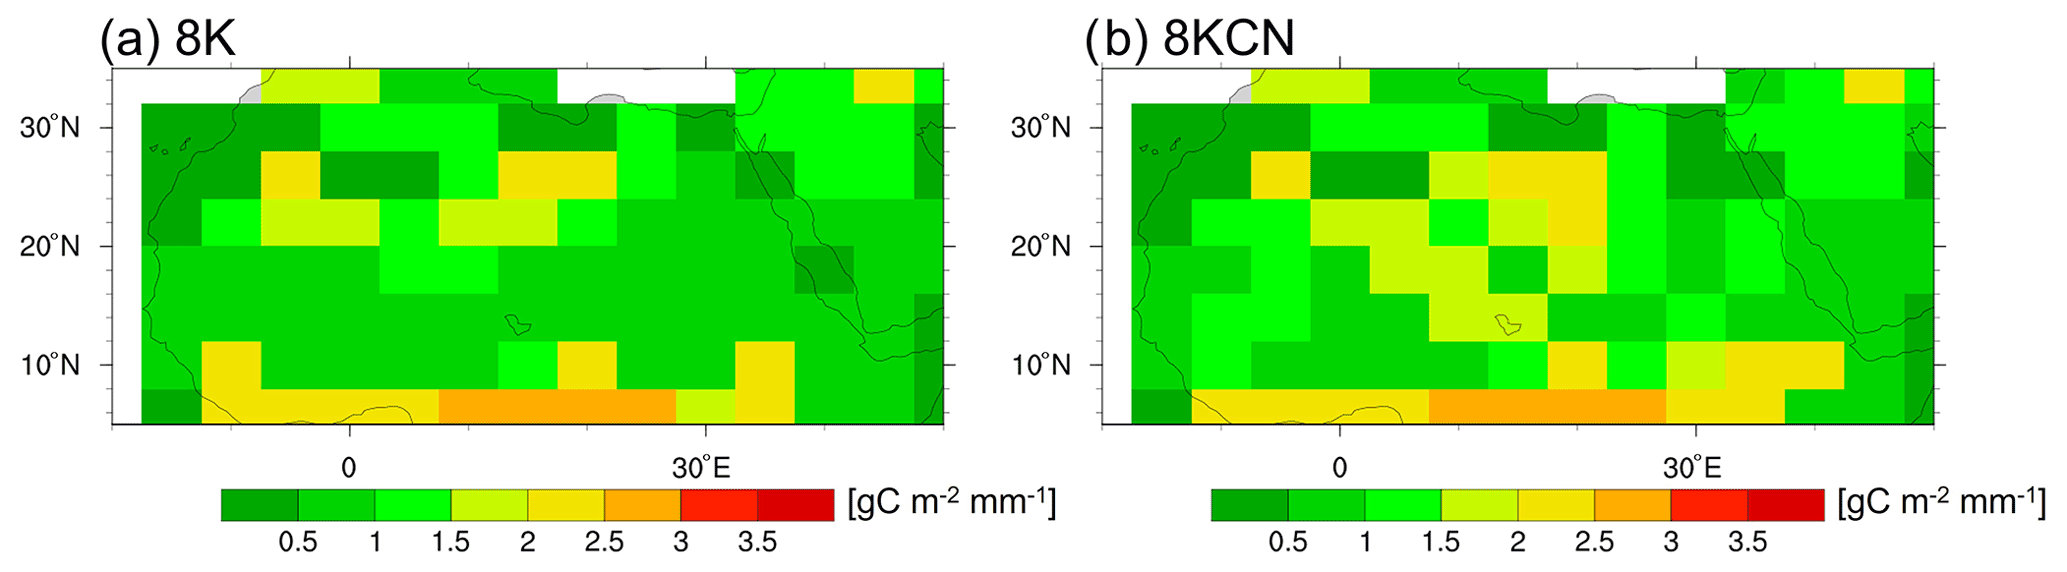
Figure 5WUE (water use efficiency, gC m−2 mm−1) during the growing season in the 8K (a) and 8KCN (b) simulations.

Figure 6Annual precipitation in North Africa from (a) the 8K and (b) 8KCN simulations. The minimum amount of precipitation for the vegetation growth boundary is plotted as a black line with its values.
Our analysis shows that this increased vegetation in the 8KCN results from moderated nitrogen limitation on photosynthetic carbon uptake (Eq. 1 and Fig. 7). The nitrogen downregulation fraction defined by is about 0.5 and 0.3 in the NSS and SSS regions, respectively, in the 8K experiment but decreases by about 0.1 in the 8KCN experiment. Our further simulation indicates that vegetation fraction and vegetation types depend on the amount of soil nitrogen (Fig. S3). The increases in vegetation fraction and tree cover fraction are approximately proportional to the amount of soil nitrogen. The vegetation fraction increase is substantially smaller in the 8KCNh (i.e., half nitrogen simulation of the 8KCN) compared to the 8KCN (Fig. S3). Trees in the 8KCN are also substantially replaced by grass and shrub in the simulation with less soil nitrogen (8KCNh).
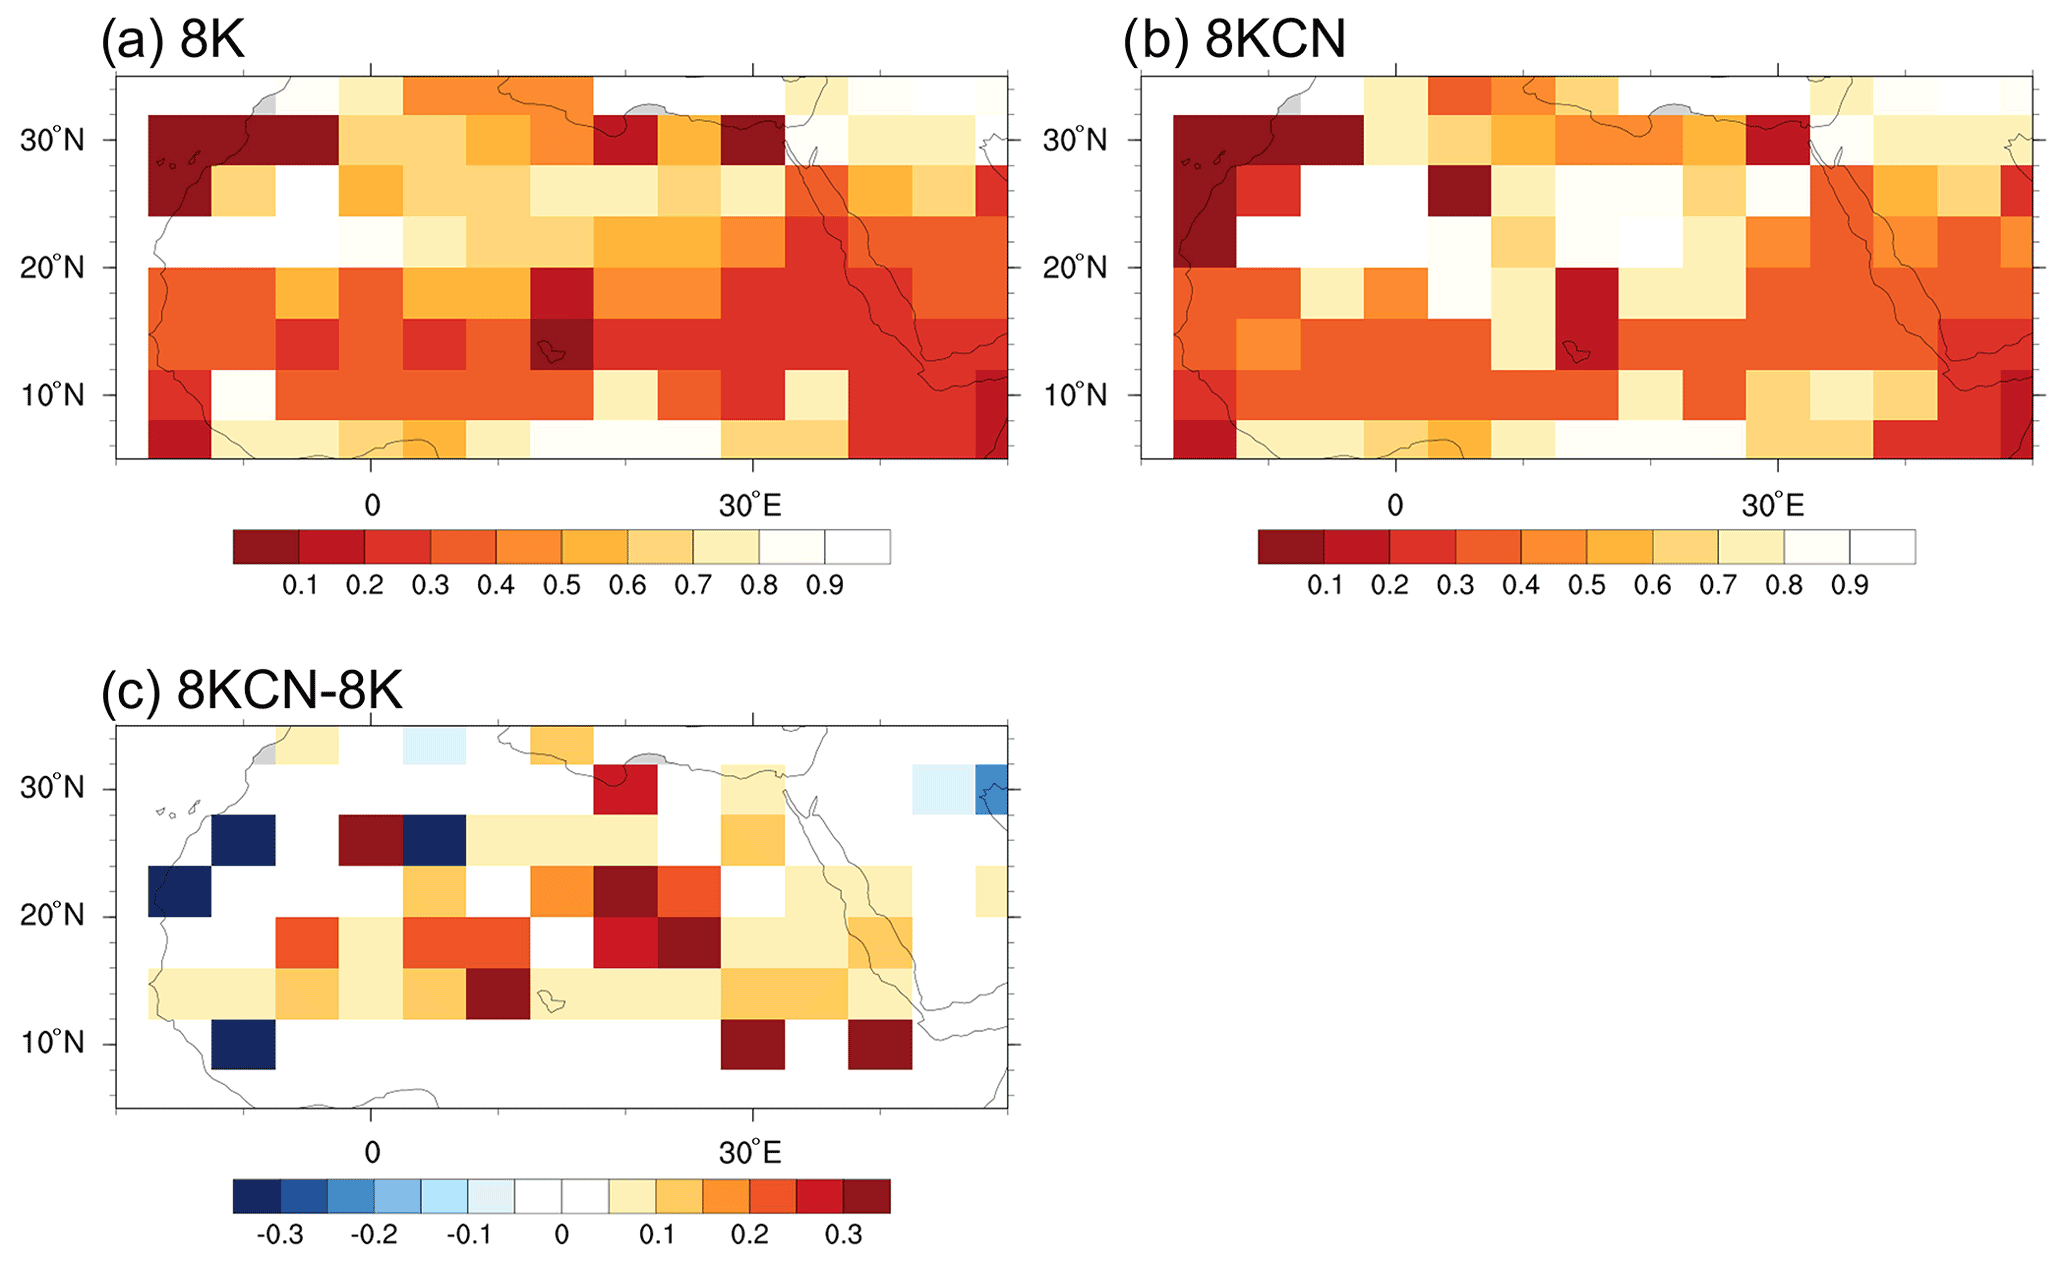
Figure 7Downregulation fraction (GPP divided by GPP not limited by nitrogen) in the (a) 8K and (b) 8KCN simulations. Downregulation fraction difference between the 8KCN and 8K simulation (c).
We speculate that albedo–precipitation feedback is reinforced with more vegetation in the 8KCN experiment. In the 8K experiment, the surface albedo decreases compared to the 0K experiment, mainly because of the increase in soil moisture by the enhanced precipitation. In the 8KCN simulation, the surface albedo diminishes more because the vegetation increases more, and the surface albedo decreases with increasing vegetation cover. Our further analysis suggests that such feedback reinforcement makes an additional 0.1 mm d−1 precipitation and expansion of vegetation, especially in the SSS region (Fig. 8a and b).
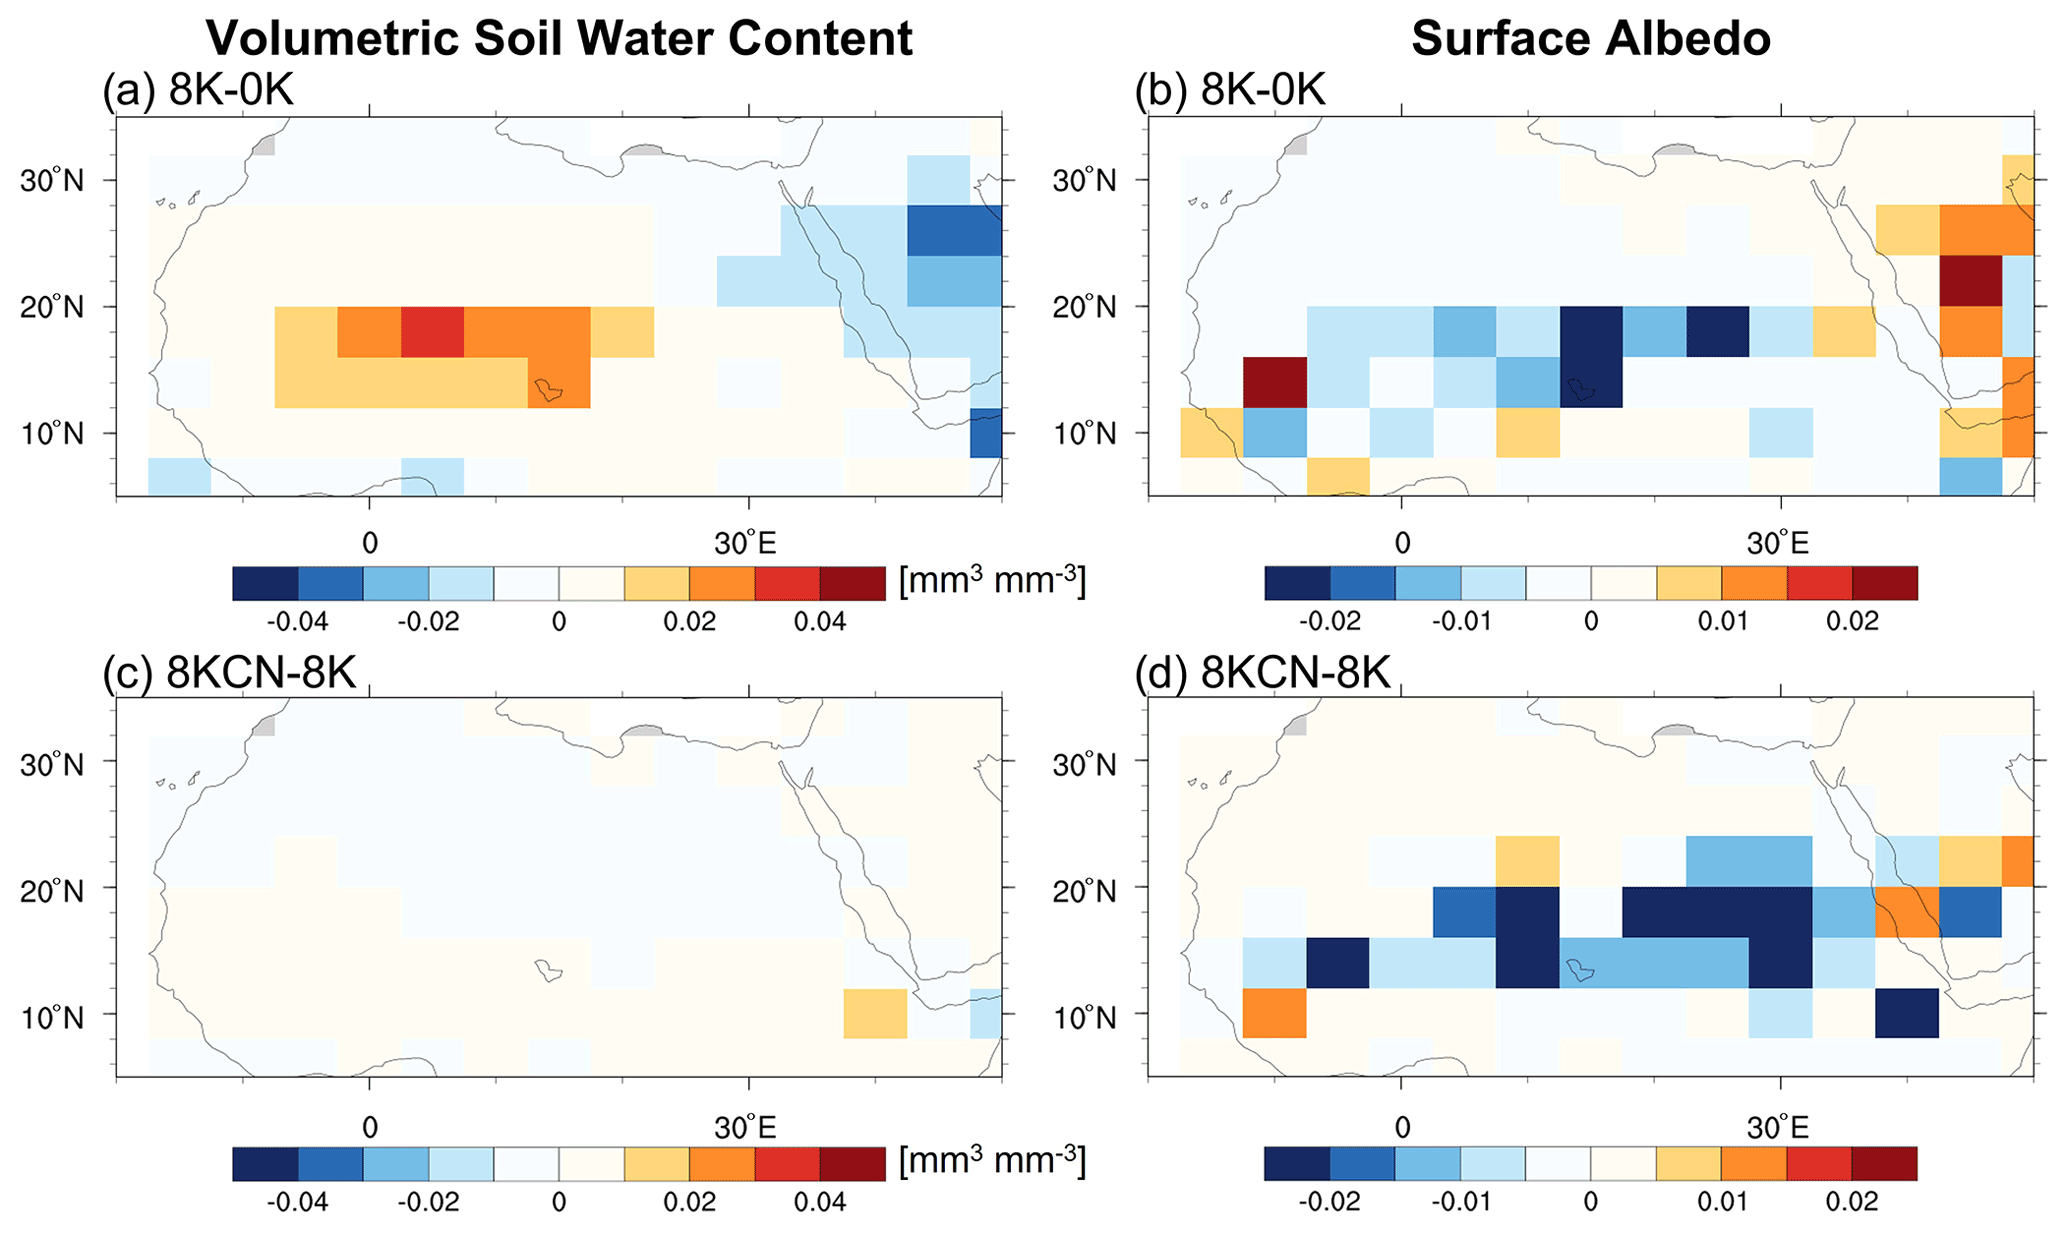
Figure 8Differences in volumetric soil water content (a, c) and surface albedo (b, d) between the 0K, 8K, and 8KCN experiments. The first and second rows show the differences between the 8K and 0K and between the 8KCN and 8K experiments, respectively.
3.3 Impact of soil texture on the Green Sahara simulation
Soil is classified as sandy soil for the present-day Sahara in the 8K and 8KCN simulations like previous studies on the GS (e.g., Hopcroft et al., 2017; Groner et al., 2018). It is, however, plausible that soil in the GS includes more nutrients and humus than sandy soil (i.e., loamier) with the extensive vegetation in this humid region because soil organic matter is formed by decomposition of litter and woody debris (Levis et al., 2004; Koven et al., 2013). Such soil type changes make impacts on soil color as well as soil hydraulic and thermal properties. Compared to sandy soil, loamy soil has larger soil porosity and heat capacity but smaller saturated hydraulic conductivity because it contains more slit and clay than sandy soils. Consequently, loamy soils have larger water-holding (i.e., soil porosity) and heat capacities (Kutzbach et al., 1996; Levis et al., 2004). A previous study based on the offline dynamic vegetation simulation of the GS shows that the simulated greening of the Sahara is sensitive to changes in soil thermal and hydraulic properties without bare-soil albedo changes (Lu et al., 2018).
Our coupled ESM simulation of 8KCNS also shows that soil texture leads to significant changes in vegetation and climate in North Africa. Vegetation cover fraction shows a 78 % increase over the SS region when the soil nitrogen and soil texture are modified all together (i.e., 8KCNS experiment) compared to the 8KCN experiment (Fig. 9e; Table 4). Notably, those feedback processes are critical in the western SSS, which is coincident with the region classified as sandy soil in the ESMs (Fig. 9f–l). A vegetation fraction increase is clearly observed, especially in the western SSS (<10∘ E) in the 8KCNS experiment, with a 2∘ N northward movement (15 to 17∘ N) of the 20 % vegetation coverage border and its related GPP increases. This result suggests that the western SSS is a hot spot from the perspective of soil texture in the EMH simulations.
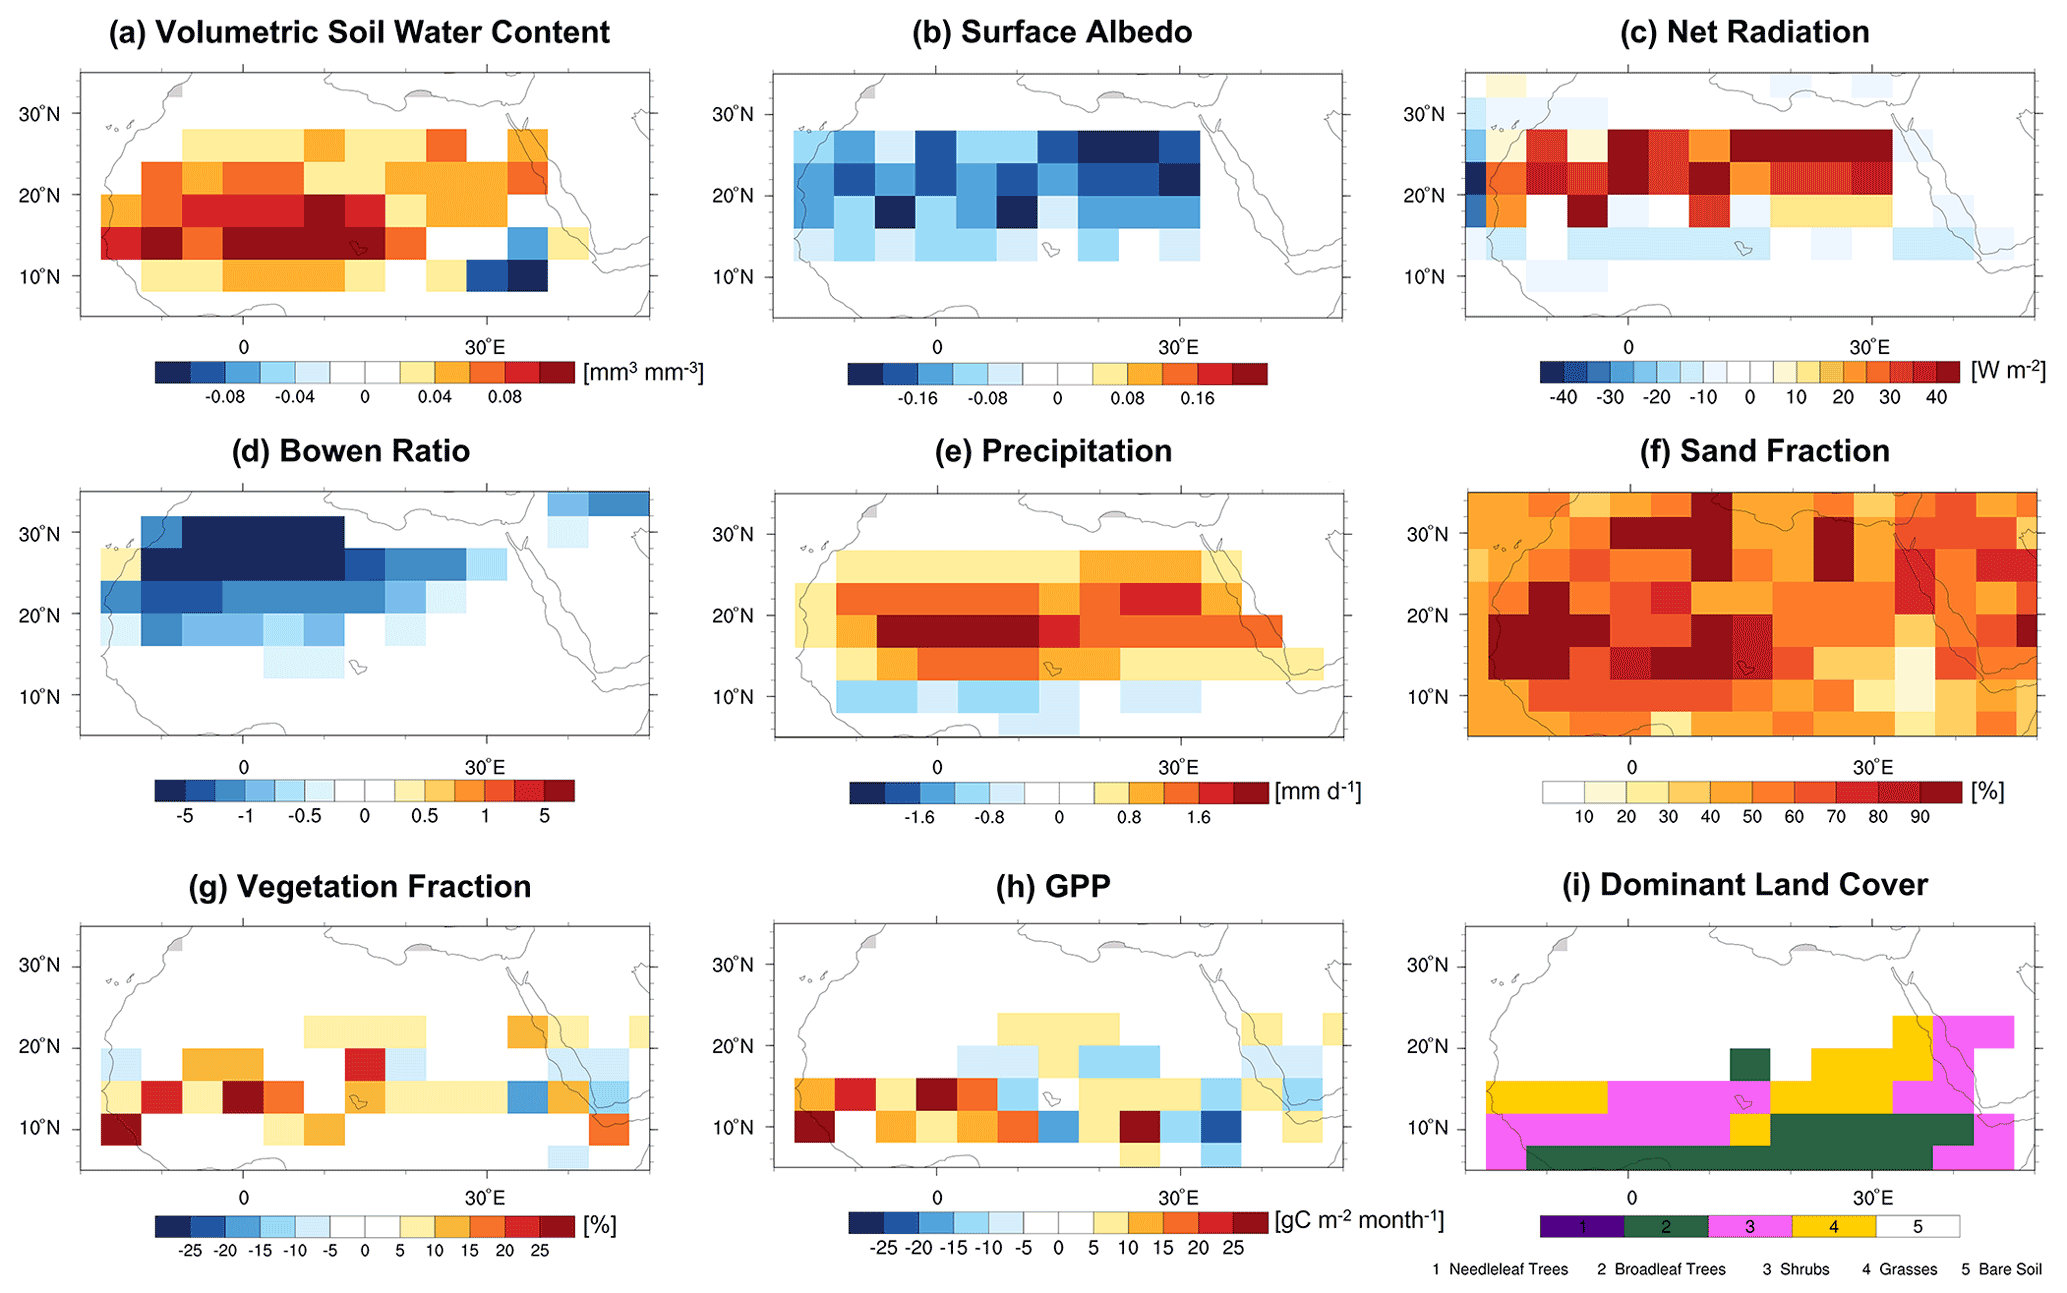
Figure 9Differences of the loamy soil experiment (8KCNS) from 8KCN. (a) Volumetric soil water content, (b) surface albedo, (c) net shortwave radiation, (d) Bowen ratio, (e) precipitation, (f) sand fraction in the grid used in 8K and 8KCN, (g) vegetation fraction, (h) GPP, and (i) dominant land cover in the 8KCNS experiment. Only grids that are significantly different at 95 % in a Student's t test are colored in (e). Soil type is decided as the relative percentages of sand, silt, and clay in soil, and soil physical parameters are assigned based on this soil type in the CLM (Fig. 8f; Bonan et al., 2002).
Our analysis indicates that such substantial sensitivity is mainly related to changes in soil hydraulic and thermal properties, but the darker soil color of loamy soils also regulates climate and vegetation in the study region. The relatively darker soil color of loamy soils in the 8KCNS experiment leads to smaller surface albedo, and its increase in reinforced by increases in summertime precipitation (see Eq. 9; Fig. 9a–b). That is, the darker soils enhance absorption of solar radiation (i.e., increase in surface net radiation) and more available energy is partitioned into latent heat fluxes (i.e., smaller Bowen ratio), leading to more precipitation in North Africa (Fig. 9c–e), possibly through the albedo–precipitation feedback and its related moisture recycling (Hopcroft et al., 2017; Levine and Boos, 2017; Groner et al., 2018). Also, previous studies indicate that enhanced evapotranspiration results in more rainfall by a weakened African easterly jet (AEJ) (Cook, 1999; Wu et al., 2009; Rachmayani et al., 2015). Our simulation also reveals that the AEJ is weakened with more evaporation and summertime rainfall, which is not found in the 8KCN experiment.
The Green Sahara indicates an extensive vegetative area and humid climate in the Sahara–Sahel region in the early to mid-Holocene. Previous studies report that the GS is a consequence of complex interactions between various climatic and biophysical factors. It is also known that land–atmosphere interaction enhances vegetation in the GS period with impacts of SST and orbital forcing change (e.g., Claussen et al., 2013; Groner et al., 2018). This study aims at examining the effect of soil nitrogen and soil physical properties on simulations of the Green Sahara 8000 years ago using a state-of-the-art ESM that incorporates soil nitrogen and albedo–soil moisture feedback processes. As far as we know, this is the first study to investigate impacts of soil nitrogen and soil texture on the GS simulation using a coupled ESM.
Our ESM simulation results clearly show that vegetation in the GS is dramatically sensitive to soil organic carbon and soil texture in North Africa (Table 5). With the changes in the Earth's orbit and dust in the EMH, the model simulates the northward movement of the tropical rainfall belt and its related precipitation increases in North Africa with the EMH conditions and present-day soil nitrogen and soil carbon. However, despite more precipitation, the meridional extent of vegetation in the Sahara–Sahel transition zone only marginally differs between the early to mid-Holocene and present-day simulation, which did not simulate greening in the early to mid-Holocene properly. This inconsistent modeling behavior between precipitation and vegetation cover can be attributed to the unrealistically high threshold of precipitation required for desert–grassland transition and low WUE in the terrestrial ecosystem model. Our analysis shows that this excessive rainfall needed for vegetation is lowered if enhanced soil nitrogen and loamier soil are considered in the model based on the extensive vegetation during the GS. This change in the vegetation threshold leads to increases in GPP and vegetation cover eventually. Particularly, the SS region is sensitive to soil nitrogen and clay as well as silt composition in soil (i.e., loamier) in our simulations. Our results suggest that soil property is as important as nitrogen fertilization in simulating precipitation, vegetation dynamics, and atmospheric circulation in North Africa during the EMH.
It is also found that the increase in vegetation cover is reinforced by more precipitation in this soil–nitrogen-enhanced simulation through the feedback in soil albedo, water-holding capacity, soil color, and precipitation processes. Our sensitivity simulations show that loamy soil having more soil organic matter also leads to more precipitation and vegetation in Holocene North Africa through albedo–precipitation and evapotranspiration–precipitation feedbacks with changes in soil color, soil nitrogen, and soil physical properties. Our results indicate that soil nitrogen through downregulation of GPP and process-based dynamics of soil properties with vegetation are critical for Green Sahara simulations in ESMs. In particular, GPP and vegetation cover show dramatic increases of 400 % and 150 % in the SS region, respectively, with changes in soil organic matter and soil texture. Our findings and their implications can be extended to future climate and dynamic vegetation simulations. More future study should be done on the role of soil biogeochemical processes in the vegetation dynamics in climate simulations, particularly if we use an ESM to incorporate carbon and nitrogen cycles into the model. Despite our important findings on impacts of soil properties on the GS simulation, further study on the vegetation–soil interactions and its related unparameterized processes such as soil migration is necessary because our modeling studies still have unsatisfactory representation of vegetation cover and WUE notwithstanding ample precipitation in North Africa.
| Symbols | Definitions |
| CFalloc | amount of carbon allocated to new growth (gC m−2 s−1) |
| CFavail_allloc | amount of total carbon available for new growth allocation (gC m−2 s−1) |
| CFexcess | amount of carbon that plants could additionally allocate if nitrogen were not limiting (gC m−2 s−1) |
| dt | decomposition time step (seconds) |
| fpg | fraction of potential growth that can be achieved with the nitrogen available to plants (no units) |
| GPPp | gross primary production when there is no nitrogen limitation (gC m−2 s−1) |
| carbon:nitrogen stoichiometry constant for new growth allocation (gC (gN)−1) | |
| MR | maintenance respiration (gC m−2 s−1) |
| Nplant_ndemand | nitrogen demand by plant for photosynthesis (gN m−2 s−1) |
| Nretrans | retranslocated nitrogen pool (gN m−2 s−1); nitrogen retranslocation is the amount of nitrogen that |
| is removed from the tissues and is stored in the other part of the plant to reuse it in the next growth | |
| Nsminn | the amount of mineral nitrogen in the total soil column (gN m−2) |
| Nuptake | amount of plant uptake from soil mineral nitrogen pool (gN m−2 s−1) |
| NFimmob | amount of immobilized nitrogen flux (gN m−2 s−1) |
| NFsoil4n→sminn | nitrogen fluxes leaving soil nitrogen pool with largest turnover time to soil mineral |
| nitrogen (gN m−2 s−1) | |
| soil4c | soil carbon pool with largest turnover time (gC m−2) |
| kdecomp | decomposition rate constant of the soil organic matter (no unit) |
| αsat | soil background albedo for saturated soil (fraction) |
| αsoil | soil background albedo (fraction) |
| Δ | variable that depends on the volumetric water content of the first soil layer |
| θ1 | the volumetric soil water content of the first soil layer (m3 m−3) |
All data are available on Zenodo (https://doi.org/10.5281/zenodo.5788013, Lee and Hong, 2021) and upon request to the corresponding author (jhong@yonsei.ac.kr, https://eapl.yonsei.ac.kr, last access: 20 February 2021).
The supplement related to this article is available online at: https://doi.org/10.5194/cp-18-313-2022-supplement.
JL and JH contributed to the numerical experimental design, model simulation, data analysis, and paper preparation. MC, JK, and JWH contributed to data interpretation and paper preparation. All authors contributed to the scientific discussion.
At least one of the (co-)authors is a member of the editorial board of Climate of the Past. The peer-review process was guided by an independent editor, and the authors also have no other competing interests to declare.
Publisher's note: Copernicus Publications remains neutral with regard to jurisdictional claims in published maps and institutional affiliations.
Our thanks go to the editor and reviewers for their constructive comments to improve our study.
This research has been supported by the National Research Foundation of Korea (grant no. NRF-2018R1A5A1024958).
This paper was edited by Qiuzhen Yin and reviewed by two anonymous referees.
Arora, V. K., Katavouta, A., Williams, R. G., Jones, C. D., Brovkin, V., Friedlingstein, P., Schwinger, J., Bopp, L., Boucher, O., Cadule, P., Chamberlain, M. A., Christian, J. R., Delire, C., Fisher, R. A., Hajima, T., Ilyina, T., Joetzjer, E., Kawamiya, M., Koven, C. D., Krasting, J. P., Law, R. M., Lawrence, D. M., Lenton, A., Lindsay, K., Pongratz, J., Raddatz, T., Séférian, R., Tachiiri, K., Tjiputra, J. F., Wiltshire, A., Wu, T., and Ziehn, T.: Carbon–concentration and carbon–climate feedbacks in CMIP6 models and their comparison to CMIP5 models, Biogeosciences, 17, 4173–4222, https://doi.org/10.5194/bg-17-4173-2020, 2020.
Berger, A. L.: Long-Term Variations of Caloric Insolation Resulting from the Earth's Orbital Elements 1, Quaternary Res., 9, 139–167, 1978.
Bonfils, C., de Noblet-Ducoudre, N., Braconnot, P., and Joussaume, S.: Hot desert albedo and climate change: Mid-Holocene monsoon in North Africa, J. Climate, 17, 3724–3737, 2001.
Braconnot, P., Joussaume, S., Marti, O., and de Noblet, N.: Synergistic Feedbacks from Ocean and Vegetation on the African Monsoon Response to Mid-Holocene Insolation, Geophys. Res. Lett., 26, 2481–2484, 1999.
Braconnot, P., Zhu, D., Marti, O., and Servonnat, J.: Strengths and challenges for transient Mid- to Late Holocene simulations with dynamical vegetation, Clim. Past, 15, 997–1024, https://doi.org/10.5194/cp-15-997-2019, 2019.
Brooks, M. L.: Effects of increased soil nitrogen on the dominance of alien annual plants in the Mojave Desert, J. Appl. Ecol., 40, 344–353, 2003.
Broxton, P. D., Zeng, X., Sulla-Menashe, D., and Troch, P. A.: A global land cover climatology using MODIS data, J. Appl. Meteorol. Clim., 53, 1593–1605, https://doi.org/10.1175/JAMC-D-13-0270.1, 2014.
Castillo, C. K. G., Levis, S., and Thornton, P. E.: Evaluation of the New CNDV Option of the Community Land Model: Effects of Dynamic Vegetation and Interactive Nitrogen on CLM4 Means and Variability, J. Climate, 25, 3702–3714, https://doi.org/10.1175/JCLI-D-11-00372.1, 2012.
Cess, R. D.: Biosphere-Albedo Feedback and Climate Modeling, J. Atmos. Sci., 35, 1765–1768, 1978.
Charney, J. G.: Dynamics of Deserts and Drought in Sahel, Q. J. Roy. Meteor. Soc., 101, 193–202, 1975.
Chikira, M., Abe-Ouchi, A., and Sumi, A.: General circulation model study on the green Sahara during the mid-Holocene: an impact of convection originating above boundary layer, J. Geophys. Res., 111, D21103, https://doi.org/10.1029/2005JD006398, 2006.
Claussen, M.: On multiple solutions of the atmosphere-vegetation system in present-day climate, Glob. Change Biol., 4, 549–559, 1998.
Claussen, M., Kubatzki, C., Brovkin, V., Ganoposki, A., Hoelzmann, P., and Pachur, H. J.: Simulation of an abrupt change in Saharan vegetation in the mid-Holocene, Geophys. Res. Lett., 26, 2037–2040, 1999.
Claussen, M., Bathiany, S., Brovkin, V., and Kleinen, T.: Simulated climate-vegetation interaction in semi-arid regions affected by plant diversity, Nat. Geosci., 6, 954–958, 2013.
Claussen, M., Dallmeyer, A., and Bader, J.: Theory and modeling of the African humid period and the green Sahara, Oxford Research Encyclopedia of Climate Science, https://doi.org/10.1093/acrefore/9780190228620.013.532, 2017.
Coe, M. and Bonan, G.: Feedbacks between climate and surface water in northern Africa during the middle Holocene, J. Geophys. Res., 102, 11087–11101, https://doi.org/10.1029/97JD00343, 1997.
Contoux, C., Jost, A., Ramstein, G., Sepulchre, P., Krinner, G., and Schuster, M.: Megalake Chad impact on climate and vegetation during the late Pliocene and the mid-Holocene, Clim. Past, 9, 1417–1430, https://doi.org/10.5194/cp-9-1417-2013, 2013.
Cook, K. H.: Generation of the African Easterly Jet and its role in determining West African precipitation, J. Climate, 12, 1165–1184, 1999.
Gaetani, M., Messori, G., Zhang, Q., Flamant, C., and Pausata, F. S. R.: Understanding the Mechanisms behind the Northward Extension of the West African Monsoon during the Mid-Holocene, J. Climate, 30, 7621–7642, https://doi.org/10.1175/JCLI-D-16-0299.1, 2017.
Groner, V. P., Raddatz, T., Reick, C. H., and Claussen, M.: Plant functional diversity affects climate–vegetation interaction, Biogeosciences, 15, 1947–1968, https://doi.org/10.5194/bg-15-1947-2018, 2018.
Harrison, S. P., Bartlein, P. J., Izumi, K., Li, G., Annan, J., Hargreaves, J., Braconnot, P. B., and Kageyama, M.: Implications of evaluation of CMIP5 palaeosimulations for climate projections, Nat. Clim. Change, 5, 735–743, https://doi.org/10.1038/nclimate2649, 2015.
Hély, C., Lézine, A.-M., and contributors, A.: Holocene changes in African vegetation: tradeoff between climate and water availability, Clim. Past, 10, 681–686, https://doi.org/10.5194/cp-10-681-2014, 2014.
Holmes, J. A.: How the Sahara became dry, Science, 320, 752–753, 2008.
Hopcroft, P. O., Valdes, P. J., Harper, A. B., and Beerling, D. J.: Multi vegetation model evaluation of the Green Sahara climate regime, Geophys. Res. Lett., 44, 6804–6813, 2017.
Houldcroft, C., Grey, W., Barnsley, M., Taylor, C., Los, S., and North, P.: New Vegetation Albedo Parameters and Global Fields of Soil Background Albedo Derived from MODIS for Use in a Climate Model, J. Hydrometeorol., 10, 183–198, 2009.
Hurrell, J. W., Holland, M. M., Gent, P. R., Ghan, S., Kay, J. E., Kushner, P., Lamarque, J.-F., Large, W. G., Lawrence, D., Lindsay, K., Lipscomb, W. H., Long, M. C., Mahowald, N., Marsh, D. R., Neale, R. B., Rasch, P., Vavrus, S., Vertenstein, M., Bader, D., Collins, W. D., Hack, J. J., Kiehl, J., and Marshall, S.: The Community Earth System Model: a framework for collaborative research, B. Am. Meteorol. Soc., 94, 1339–1360, 2013.
Jolly, D., Harrison, S. P., Damnati, B., and Bonnefille, R.: Simulated climate and biomes of Africa during the Late Quaternary: comparisons with pollen and lake status data, Quaternary Sci. Rev., 17, 629–657, 1998.
Kluzek, E.: CESM research tools: CLM4 in CESM1.0.4, User's guide documentation, National Centers for Atmospheric Research, Boulder, USA, https://svn-ccsm-models.cgd.ucar.edu/clm2/branch_tags/cesm1_0_4_rel_tags/cesm1_0_4_n05_clm4_0_32/models/lnd/clm/doc/UsersGuide/clm_ug.xml (last access: 2 February 2022), 2012.
Knorr, W. and Schnitzler, K. G.: Enhanced albedo feedback in North Africa from possible combined vegetation and soil formation processes, Clim. Dynam., 26, 55–63, 2006.
Knorr, W., Schnitzler, K. G., and Govaerts, Y.: The role of bright desert regions in shaping North African climate, Geophys. Res. Lett., 28, 3489–3492, 2001.
Koven, C. D., Riley, W. J., Subin, Z. M., Tang, J. Y., Torn, M. S., Collins, W. D., Bonan, G. B., Lawrence, D. M., and Swenson, S. C.: The effect of vertically resolved soil biogeochemistry and alternate soil C and N models on C dynamics of CLM4, Biogeosciences, 10, 7109–7131, https://doi.org/10.5194/bg-10-7109-2013, 2013.
Krinner, G., Lézine, A. M., Braconnot, P., Sepulchre, P., Ramstein, G., Grenier, C., and Gouttevin, I.: A reassessment of lake and wetland feedbacks on the North African Holocene climate, Geophys. Res. Lett., 39, L07701, https://doi.org/10.1029/2012GL050992, 2012.
Kutzbach, J., Bonan, G., Foley, J., and Harrison, S.: Vegetation and soil feedbacks on the response of the African monsoon to orbital forcing in the early to middle Holocene, Nature, 384, 623–626, 1996.
Kutzbach, J. E.: Monsoon climate of the early Holocene: Climate experiment with the Earth's orbital parameters for 9000 years ago, Science, 214, 59–61, 1981.
Kutzbach, J. E. and Liu, Z.: Response of the African Monsoon to Orbital Forcing and Ocean Feedbacks in the Middle Holocene, Science, 278, 440–443, 1997.
Kutzbach, J. E. and Street-Perrott, F. A.: Milankovitch forcing of fluctuations in the level of tropical lakes from 18 to 0 kyr BP, Nature, 317, 130–134, 1985.
Larrasoana, J. C., Roberts, A. P., and Rohling, E. J.: Dynamics of Green Sahara periods and their role in Hominin evolution, PLoS ONE, 8, e76514, https://doi.org/10.1371/journal.pone.0076514, 2013.
Lawrence, D. M., Oleson, K. W., Flanner, M. G., Thorton, P. E., Swenson, S. C., Lawrence, P. J., Zeng, X., Yang, Z.-L., Levis, S., Skaguchi, K., Bonan, G. B., and Slater, A. G.: Parameterization improvements and functional and structural advances in version 4 of the Community Land Model, J. Adv. Model. Earth Sy., 3, 2011MS000045, https://doi.org/10.1029/2011ms000045, 2011.
Leblanc, M., Favreau, G., Maley, J., Nazoumou, Y., Leduc, C., Stagnitti, F., van Oevelen, P. J., Delclaux, F., and Lemoalle, J.: Reconstruction of Megalake Chad using Shuttle Radar Topographic Mission data, Palaeogeogr. Palaeocl., 239, 16–27, https://doi.org/10.1016/j.palaeo.2006.01.003, 2006.
Lee, J. and Hong, J.: Model output data, Zenodo [data set], https://doi.org/10.5281/zenodo.5788013, 2021.
Levine, X. J. and Boos, W. R.: Land surface albedo bias in climate models and its association with tropical rainfall, Geophys. Res. Lett., 44, 6363–6372, 2017.
Levis, B. S., Bonan, G. B., and Bonfils, C.: Soil feedback drives the mid-Holocene North African monsoon northward in fully coupled CCSM2 simulations with a dynamic vegetation model, Clim. Dynam., 23, 791–802, https://doi.org/10.1007/s00382-004-0477-y, 2004.
Lu, Z., Miller, P. A., Zhang, Q., Zhang, Q., Wårlind, D., Nieradzik, L., Sjolte, J., and Smith, B.: Dynamic vegetation simulations of the mid-Holocene Green Sahara, Geophys. Res. Lett., 45, 8294–8303, 2018.
Neale, R. B., Richter, J., Park, S., Lauritzen, P. H., Vavrus, S. J., Rasch, P. J., and Zhang, M.: The Mean Climate of the Community Atmosphere Model (CAM4) in Forced SST and Fully Coupled Experiments, J. Climate, 26, 5150–5168, https://doi.org/10.1175/JCLI-D-12-00236.1, 2013.
Oleson, K. W., Lawrence, D. M., Bonan, G. B., Flanner, M. G., Kluzek, E., Lawrence, P. J., Levis, S., Swenson, S. C., Thornton, P. E., Dai, A., Decker, M., Dickinson, R., Feddema, J., Heald, C. L., Hoffman, F., Lamarque, J.-F., Mahowald, N., Niu, G.-Y., Qian, T., Randerson, J., Running, S., Sakaguchi, K., Slater, A., Stockli, R., Wang, A., Yang, Z.-L., Zeng, X., and Zeng, X.: Technical Description of version 4.0 of the Community Land Model (CLM), Tech. Rep. NCAR/TN-478+STR, National Center for Atmospheric Research, Boulder, Colorado, USA, 2010.
Pachur, H. J. and Kröpelin, S.: Wadi Howar–Paleoclimatic evidence from an extinct river system in the Southeastern Sahara, Science, 237, 298–300, 1987.
Pausata, F. S. R., Messori, G., and Zhang, Q.: Impacts of dust reduction on the northward expansion of the African monsoon during the Green Sahara period, Earth Planet. Sc. Lett., 434, 298–307, 2016.
Pausata, F. S. R., Gaetani, M., Messori, G., Berg, A., de Souza, D. M., Sage, R. F., and deMenocal, P. B.: The Greening of the Sahara: Past Changes and Future Implications, One Earth, 2, 235–250, 2020.
Quade, J., Dente, E., Armon, M., Dor, Y. B., Morin, E., Adam, O., and Enzel, Y.: Megalakes in the Sahara? A review, Quaternary Res., 90, 253–275, 2018.
Rachmayani, R., Prange, M., and Schulz, M.: North African vegetation–precipitation feedback in early and mid-Holocene climate simulations with CCSM3-DGVM, Clim. Past, 11, 175–185, https://doi.org/10.5194/cp-11-175-2015, 2015.
Schuster, M., Roquin, C., Duringer, P., Brunet, M., Caugy, M., Fontugne, M., Mackaye, H. T., Vignaud, P., and Ghienne, J. F.: Holocene Lake Mega-Chad palaeoshorelines from space, Quaternary Sci. Rev., 24, 1821–1827, 2005.
Shanahan, T. M., McKay, N. P., Hughen, K. A., Overpeck, J. T., Otto-Bliesner, B., Heil, C. W., King, J., Scholz, C. A., and Peck, J.: The time-transgressive termination of the African Humid Period, Nat. Geosci., 8, 140–144, https://doi.org/10.1038/ngeo2329, 2015.
Takata, K., Emori, S., and Watanabe, T.: Development of the minimal advanced treatments of surface interaction and runoff, Global Planet. Change, 38, 209–222, https://doi.org/10.1016/S0921-8181(03)00030-4, 2003.
Thornton, P. E. and Rosenbloom, N. A.: Ecosystem model spin-up: Estimating steady state conditions in a coupled terrestrial carbon and nitrogen cycle model, Ecol. Model., 189, 25–48, https://doi.org/10.1016/j.ecolmodel.2005.04.008, 2005.
Thornton, P. E., Law, B. E., Gholz, H. L., Clark, K. L., Falge, E., Ellsworth, D. S., Goldstein, A. H., Monson, R. K., Hollinger, D., Falk, M., Chen, J., and Sparks, J. P.: Modeling and measuring the effects of disturbance history and climate on carbon and water budgets in evergreen needleleaf forests, Agr. Forest Meteorol., 113, 185–222, https://doi.org/10.1016/S0168-1923(02)00108-9, 2002.
Thornton, P. E., Lamarque, J.-F., Rosenbloom, N. A., and Mahowald, N. M.: Influence of carbon-nitrogen cycle coupling on land model response to CO2 fertilization and climate variability, Global Biogeochem. Cy., 21, GB4018, https://doi.org/10.1029/2006GB002868, 2007.
Thornton, P. E., Doney, S. C., Lindsay, K., Moore, J. K., Mahowald, N., Randerson, J. T., Fung, I., Lamarque, J.-F., Feddema, J. J., and Lee, Y.-H.: Carbon-nitrogen interactions regulate climate-carbon cycle feedbacks: results from an atmosphere-ocean general circulation model, Biogeosciences, 6, 2099–2120, https://doi.org/10.5194/bg-6-2099-2009, 2009.
Tierney, J. E., Pausata, F. S., and deMenocal, P. B.: Rainfall regimes of the Green Sahara, Sci. Adv., 3, e1601503, https://doi.org/10.1126/sciadv.1601503, 2017.
Vamborg, F. S. E., Brovkin, V., and Claussen, M.: The effect of a dynamic background albedo scheme on Sahel/Sahara precipitation during the mid-Holocene, Clim. Past, 7, 117–131, https://doi.org/10.5194/cp-7-117-2011, 2011.
Wang, Y., Li, Y., Ye, X., Chu, Y., and Wang, X.: Profile storage of organic/inorganic carbon in soil: From forest to desert, Sci. Total Environ., 408, 1925–1931, https://doi.org/10.1016/j.scitotenv.2010.01.015, 2010.
Watanabe, M., Suzuki, T., O'ishi, R., Komuro, Y., Watanabe, S., Emori, S., Takemura, T., Chikira, M., Ogura, T., Sekiguchi, M., Takata, K., Yamazaki, D., Yokohata, T., Nozawa, T., Hasumi, H., Tatebe, H., and Kimoto, M.: Improved Climate Simulation by MIROC5: Mean States, Variability, and Climate Sensitivity, J. Climate, 23, 6312–6335, https://doi.org/10.1175/2010JCLI3679.1, 2010.
Wu, M. L. C., Reale, O., Schubert, S. D., Suarez, M. J., Koster, R. D., and Pegion, P. J.: African easterly jet: Structure and maintenance, J. Climate, 22, 4459–4480, https://doi.org/10.1175/2009JCLI2584.1, 2009.
Yang, R., Su, Y., Wang, M., Wang, T., Yang, X., Fan, G., and Wu, T.: Spatial pattern of soil organic carbon in desert grasslands of the diluvial-alluvial plains of northern Qilian Mountains, J. Arid Land, 6, 136–144, 2014.
Zeng, X.: Overview of soil, vegetation, and snow albedos in weather and climate models, Annual meeting of the American Meteorological Society, San Diego, USA, 13 January 2005.