the Creative Commons Attribution 4.0 License.
the Creative Commons Attribution 4.0 License.
 | 15 Feb 2022
Late Pleistocene glacial chronologies and paleoclimate in the northern Rocky Mountains
Elizabeth Huss
Benjamin J. C. Laabs
Eric Leonard
Joseph Licciardi
Mitchell A. Plummer
Marc W. Caffee
The geologic record of mountain glaciations is a robust indicator of terrestrial paleoclimate change. During the last glaciation, mountain ranges across the western US hosted glaciers while the Cordilleran and Laurentide ice sheets flowed to the west and east of the continental divide, respectively. Records detailing the chronologies and paleoclimate significance of these ice advances have been developed for many sites across North America. However, relatively few glacial records have been developed for mountain glaciers in the northern Rocky Mountains near former ice sheet margins. Here, we report cosmogenic beryllium-10 surface exposure ages and numerical glacier modeling results, which show that mountain glaciers in the northern Rockies abandoned terminal moraines after the end of the global Last Glacial Maximum around 17–18 ka and could have been sustained by −10 to −8.5 ∘C temperature depressions relative to modern assuming similar or less than modern precipitation. Additionally, we present a deglacial chronology from the northern Rocky Mountains that indicates while there is considerable variability in initial moraine abandonment ages across the Rocky Mountains, the pace of subsequent ice retreat through the late glacial exhibits some regional coherence. Our results provide insight on potential regional mechanisms driving the initiation of and sustained deglaciation in the western US, including rising atmospheric CO2 and ice sheet collapse.
- Article
(27288 KB) - Full-text XML
-
Supplement
(805 KB) - BibTeX
- EndNote


Mountain glaciers are widely recognized as robust indicators of modern climate change (Oerlemans, 2005; Mark and Fernández, 2017). Investigations of past glacier fluctuations preserved in the geologic record can reveal valuable information regarding past climate oscillations and variability (e.g., Gilbert, 1890; Blackwelder, 1931; McCoy et al., 1985; Marcott et al., 2019). In the Rocky Mountain region of the western US, records of mountain glaciation have been used extensively to reconstruct the regional pattern of Pleistocene glaciation in space and time (e.g., Porter et al., 1983; Leonard, 1989; Licciardi et al., 2004; Laabs et al., 2009; Quirk et al., 2020), but few studies have focused on northern ranges along the former southern margins of the Laurentide and Cordilleran ice sheets. While surficial geologic records of Pleistocene mountain glaciation in the northern Rocky Mountains of western Montana have been available for decades (Alden, 1932; Carrara, 1987), these records have seldom been used to infer climate conditions (e.g., Murray and Locke, 1989). Many ranges were occupied by coalesced valley glaciers and ice caps with high-altitude ice divides, which are especially difficult to reconstruct based solely on mapped glacial deposits and landforms. Additionally, in much of northwestern Montana, mountain glaciers likely coalesced with the southern edges of the Laurentide and Cordilleran ice sheets, which also complicates reconstructions of paleo-glaciers and limits the usefulness of traditional methods for inferring past climate from glacier equilibrium-line altitudes or mass balance gradients.
However, discrete Pleistocene mountain glaciers occupied some ranges of western Montana, as evidenced by a well-preserved record of deposits and landforms delimiting their maximum extent during the last glaciation. Such records are found in the northern Absaroka Range in southwestern Montana and the eastern Lewis Range in northwestern Montana (Fig. 1), where glaciers incised deep valleys and in some areas constructed broad terminal-moraine complexes along mountain fronts. These records present an opportunity to reconstruct mountain glacier extents and develop cosmogenic chronologies of the last glaciation. These spatiotemporally constrained paleo-glaciers can then, in turn, be used to infer paleoclimate conditions in the northern Rocky Mountains during the last glaciation for which relatively few records exist compared to other regions of western North America.
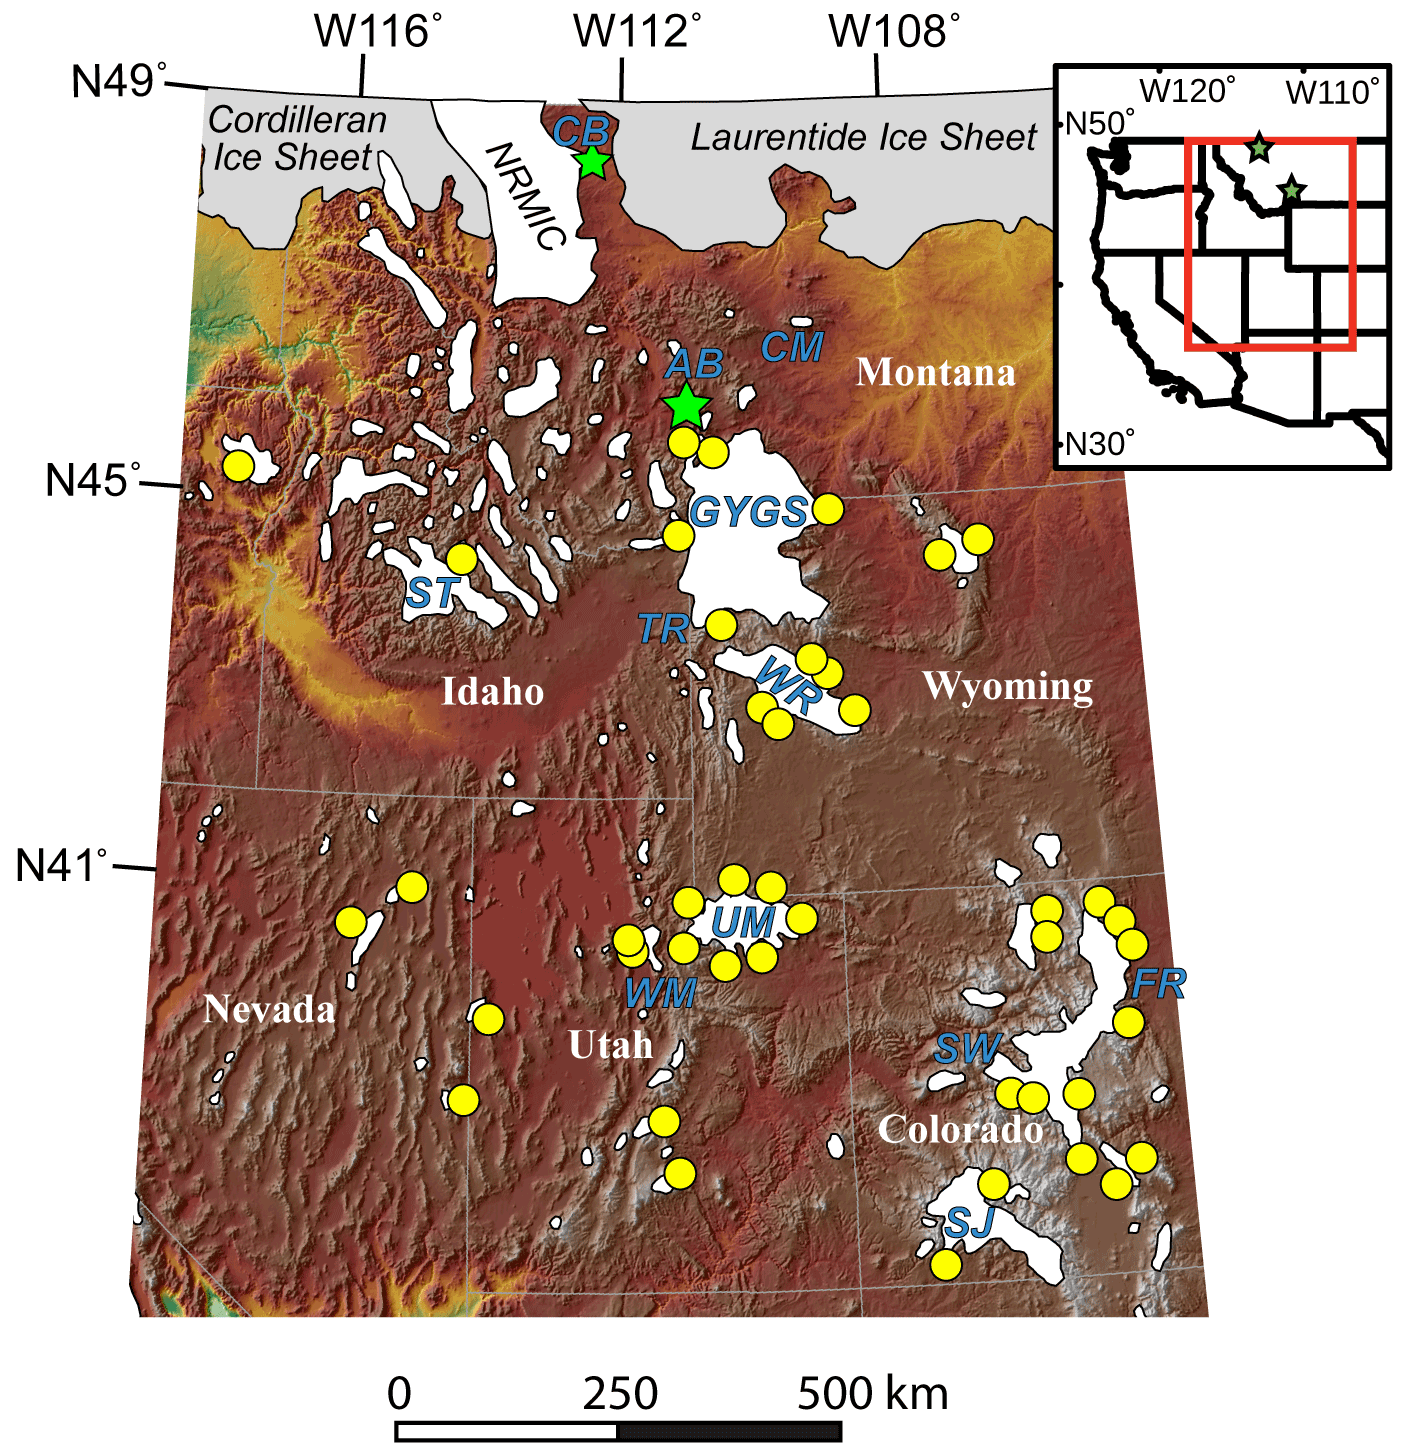
Figure 1Pleistocene ice extents in the northern US Rocky Mountains (after Porter et al., 1983; Pierce, 2003) with the locations of our two field sites, Cut Bank Creek (CB) in the Lewis Range and Pine Creek, South Fork Deep Creek, and Cascade Creek in the northern Absaroka Range (AB) indicated by green stars. Locations of previously established age control are indicated by yellow circles including the Greater Yellowstone glacial system (GYGS), Crazy Mountains (CM), Wind River (WR), Sawtooth (ST), Wasatch (WM), Uinta (UM), Front Range (FR), Sawatch (SW), and San Juan (SJ) ranges. General outlines of the Cordilleran and Laurentide ice sheets as well the northern Rocky Mountain ice cap (NRMIC) are also shown. Map of western North America (inset) with state outlines. Green stars indicate our study areas, and the red box shows the approximate coverage of the main illustration.
Here we present new surficial mapping of latero-terminal moraines of the last Pleistocene glaciation in the Cut Bank and Lake Creek valleys in the eastern Lewis Range and cosmogenic 10Be surface exposure ages of a terminal-moraine complex in Cut Bank valley. For the northern Absaroka Range, we present new exposure ages for latero-terminal moraines in South Fork Deep Creek and Cascade Creek valleys as well as glacially scoured bedrock ages from Pine Creek to track ice retreat from a previously dated terminal moraine to a cirque floor. We use the spatiotemporal glacial histories from the Lewis and Absaroka ranges to inform numerical modeling of paleo-glacier shapes, thicknesses, and paleoclimate conditions (i.e., precipitation and temperature) for mapped and dated glacial stadials. We then compare the glacial chronologies and glacier–climate modeling results developed for the Lewis and northern Absaroka ranges to those from other western North America mountain ranges and examine how these glacial histories can inform our understanding of regional patterns of glaciation and climate change.
1.1 Site descriptions
The Lewis Range (48.5∘ N, 113.5∘ W) hosted numerous glaciers during the latest Pleistocene, and in some areas these glaciers coalesced to form the northern Rocky Mountain ice cap (Locke, 1995; Fig. 1). In this study, we focus on the Cut Bank Creek glacier, which flowed east from its headwaters at 2.6 km a.s.l. and terminated on the piedmont just above 1.4 km a.s.l. at its maximum extent. The Cut Bank glacier did not coalesce with either the northern Rocky Mountain ice cap to the west and north or the Laurentide Ice Sheet to the east during Pinedale times and flowed as a discrete mountain glacier (Calhoun, 1906; Alden, 1932). The glacier was nearly 30 km long at its maximum extent and in many areas was over 200 m thick with maximum ice thickness in excess of 300 m as evidenced from apparent trimline elevations and other glacial features identified in the valley (Carrara, 1989). Modern average temperatures near Cut Bank Creek range from approximately −5 ∘C in December to 15 ∘C in July (NOAA COOP no. 242626, East Glacier, 1466 m a.s.l.). Annual precipitation on average is around 715 mm with more than 60 % occurring between October and March.
The Absaroka Range (45∘ N, 110.6∘ W), located to the north of the Greater Yellowstone glacial system (Fig. 1), also hosted several glaciers during Pinedale times including the Pine Creek, South Fork Deep Creek, and Cascade Creek glaciers. The three glaciers flowed from southeast to northwest just to the range front where they built terminal- and lateral-moraine complexes (Weed, 1893; Pierce, 1973, 1979, and references therein). All three canyons have headwaters at or above 3 km a.s.l. and generally flowed down to elevations of around 1.6–1.7 km a.s.l. The Pine Creek Pinedale glacier was the longest of the three at over 13 km at its maximum extent. The Cascade and South Fork Deep Creek glaciers were around 6 and 7 km long at their maximum Pinedale extents, respectively. Ice thicknesses were thinner in the Absaroka Range glaciers compared to the Cut Bank glacier, with many areas hosting 100–200 m thick ice and maximum thicknesses in Pine Creek of 250–300 m (Licciardi et al., 2001; Licciardi and Pierce, 2008). Modern average temperatures near the Absaroka Range range from approximately −3 ∘C in December to 19 ∘C in July (NOAA COOP no. 245080, Livingston, 1484 m a.s.l.). On average, annual precipitation is around 412 mm.
1.2 Previous studies
Reconstructions of Pleistocene glaciers in the northern Rocky Mountains of western Montana are limited (Pierce, 2003), and relatively little work has been done inferring past climate in the region from paleo-glacier characteristics. Most previous work has focused either on the Greater Yellowstone area of southern Montana or on the Glacier National Park area of northern Montana – also the foci of the current study. In these and other areas of western Montana past researchers have identified deposits and landforms from the penultimate and most recent glaciations, generally termed Bull Lake and Pinedale glaciations, following the terminology developed by Blackwelder (1915) for the Wind River Range of Wyoming (Fig. 1). Based on chronologies of glacial deposits throughout the middle and southern Rocky Mountains, these last two Pleistocene glaciations are thought to correspond broadly to intervals of global ice volume increase during Marine Isotope Stage (MIS) 2 and 6, respectively (Licciardi and Pierce, 2008, 2018; Quirk et al., 2018; Dahms et al., 2018; Schweinsberg et al., 2020; Laabs et al., 2020). Chronological work utilizing cosmogenic nuclide surface exposure dating in the Yellowstone–Grand Teton National Park area of southwestern Montana and adjacent northwestern Wyoming (Licciardi et al., 2001; Licciardi and Pierce, 2008, 2018; Pierce et al., 2018) has allowed subdivision of Pinedale-age deposits, as discussed below.
Deposits of Pleistocene mountain glaciers in the eastern Lewis Range of western Montana were mapped and described as early as 1906 by Calhoun and then later by Alden (1932), Carrara (1989), and Fullerton et al. (2004). Calhoun (1906) described the broad hummocky terminal and recessional moraines deposited on the plains to the east of Cut Bank Creek headwaters investigated in this study as well as several recessional moraine ridges deposited upvalley. Fullerton et al. (2004) inferred multiple Pinedale tills, two ages of Bull Lake till, and a possible pre-Bull Lake till in moraine deposits at Cut Bank Creek and elsewhere along the eastern front of the Lewis Range. No numerical ages are available for these deposits, although a radiocarbon age on a wood fragment, underlying two latest Pleistocene tephra layers in lake sediment at Marias Pass, provides a minimum age of 12 194 ± 145 14C years (Carrara, 1995) or 13.8–14.8 cal kyr (Fullerton et al., 2004; recalibrated here using IntCal13 (1σ); Reimer et al., 2013) for complete recession of at least one east-side outlet glacier of the northern Montana ice cap in the Glacier National Park region.
Pleistocene glacial deposits north of Yellowstone National Park and near the northern Absaroka Range were first described and mapped by Weed (1893) and then later by Pierce (1973, 1979, and references therein). Licciardi and Pierce (2018) identified three distinct phases of glaciation in the Greater Yellowstone region during the last glacial including the early (22–18 ka), middle (18–16 ka), and late (16–13 ka) Pinedale. While the early Pinedale phase in the Yellowstone area occurred mainly during the Last Glacial Maximum, defined as the period of greatest global ice volume during the most recent glacial stage (26.5–19.0 ka; Clark et al., 2009), the middle and late Pinedale phases clearly postdated the global Last Glacial Maximum (LGM), although they appear to have predated the Younger Dryas interval. Terminal and recessional moraines at the southwestern front of the northern Absaroka Range and in Paradise Valley to the south have cosmogenic 10Be exposure ages that were originally reported by Licciardi et al. (2001) and have been supplemented with additional data from Licciardi and Pierce (2008, 2018). The terminal moraine in Pine Creek valley of the northern Absaroka Range has a mean cosmogenic 10Be exposure age of 18.2 ± 0.5 ka (±1 standard error of the mean; recalculated using methods described in the Methods section). In Paradise Valley, moraines delimiting the terminus of the northern outlet of the Yellowstone glacial system have mean 10Be exposure ages of 17.9 ± 0.4 ka for the Eightmile terminal moraine and 17.1 ± 0.6 ka for the Chico recessional moraine. Here, we interpret exposure ages as ice-retreat or moraine abandonment ages. Thus, the exposure ages from the Greater Yellowstone glacial system suggest that mountain glaciers began retreating from their terminal moraines during the middle Pinedale and after the end of the global Last Glacial Maximum.
While many investigations in western Montana have focused on reconstructing the extent and chronology of the Pinedale glaciation, few have attempted to describe Pinedale climate conditions. Less attention has been paid by previous researchers to the use of paleo-glaciological methods to reconstruct late Pleistocene climate in western Montana than to reconstruction of the extent and chronology of past glaciation. Locke (1990) examined modern and reconstructed late Pleistocene glacier equilibrium lines throughout western Montana, concluding that an assumed late Pleistocene temperature depression of 10 ∘C would have been associated with decreased precipitation relative to the present. Based on mapping of glacial deposits and landforms in the Crazy Mountains of southwestern Montana (Fig. 1), Murray and Locke (1989) reconstructed the geometry and ice flux of a valley glacier in Big Timber Canyon. They interpreted the reconstructed ice-surface gradient and ice flux as indicators of a cold and dry regional climate during the last glaciation. Hostetler and Clark (1997) used a combination of climate model output and glacier equilibrium-line modeling and concluded that during the LGM in the Yellowstone region summer temperatures were 10–15 ∘C colder than present with winter precipitation approximately equal to present, while in northern Montana winter temperature depression was even greater but precipitation was reduced compared to modern.
Modern methods used to reconstruct paleo-glaciers, particularly distributed energy–mass balance or degree-day mass balance models, have been successfully applied to sites in the middle (Laabs et al., 2006; Refsnider et al., 2008; Birkel et al., 2012; Quirk et al., 2018, 2020) and southern Rocky Mountains (Ward et al., 2009; Brugger, 2010; Brugger et al., 2019a, b; Dühnforth and Anderson, 2011; Leonard et al., 2014, 2017a). In this study we apply a modified version of the Plummer and Phillips (2003) distributed energy–mass balance model to reconstructed glaciers in the Absaroka and Lewis ranges to help elucidate climate conditions in the northern Rockies during the last glaciation.
2.1 Moraine mapping
Although terminal moraines of east-flowing glaciers in the Lewis Range are known from previous studies, they were remapped here to aid with reconstructing maximum ice extent in the Cut Bank Creek and Lake Creek valleys (Fig. 2a). Moraines in both valleys were examined in aerial imagery available in Google Earth and using 1 : 24 000-scale topographic maps. The portion of the terminal moraine north of Cut Bank Creek was mapped in the field. Moraines were identified as broad (0.5–1 km wide), looping plateaus with hummocky topography (Fig. 3) on the piedmont east of the Lewis Range and featured abundant erratic boulders on their crests.
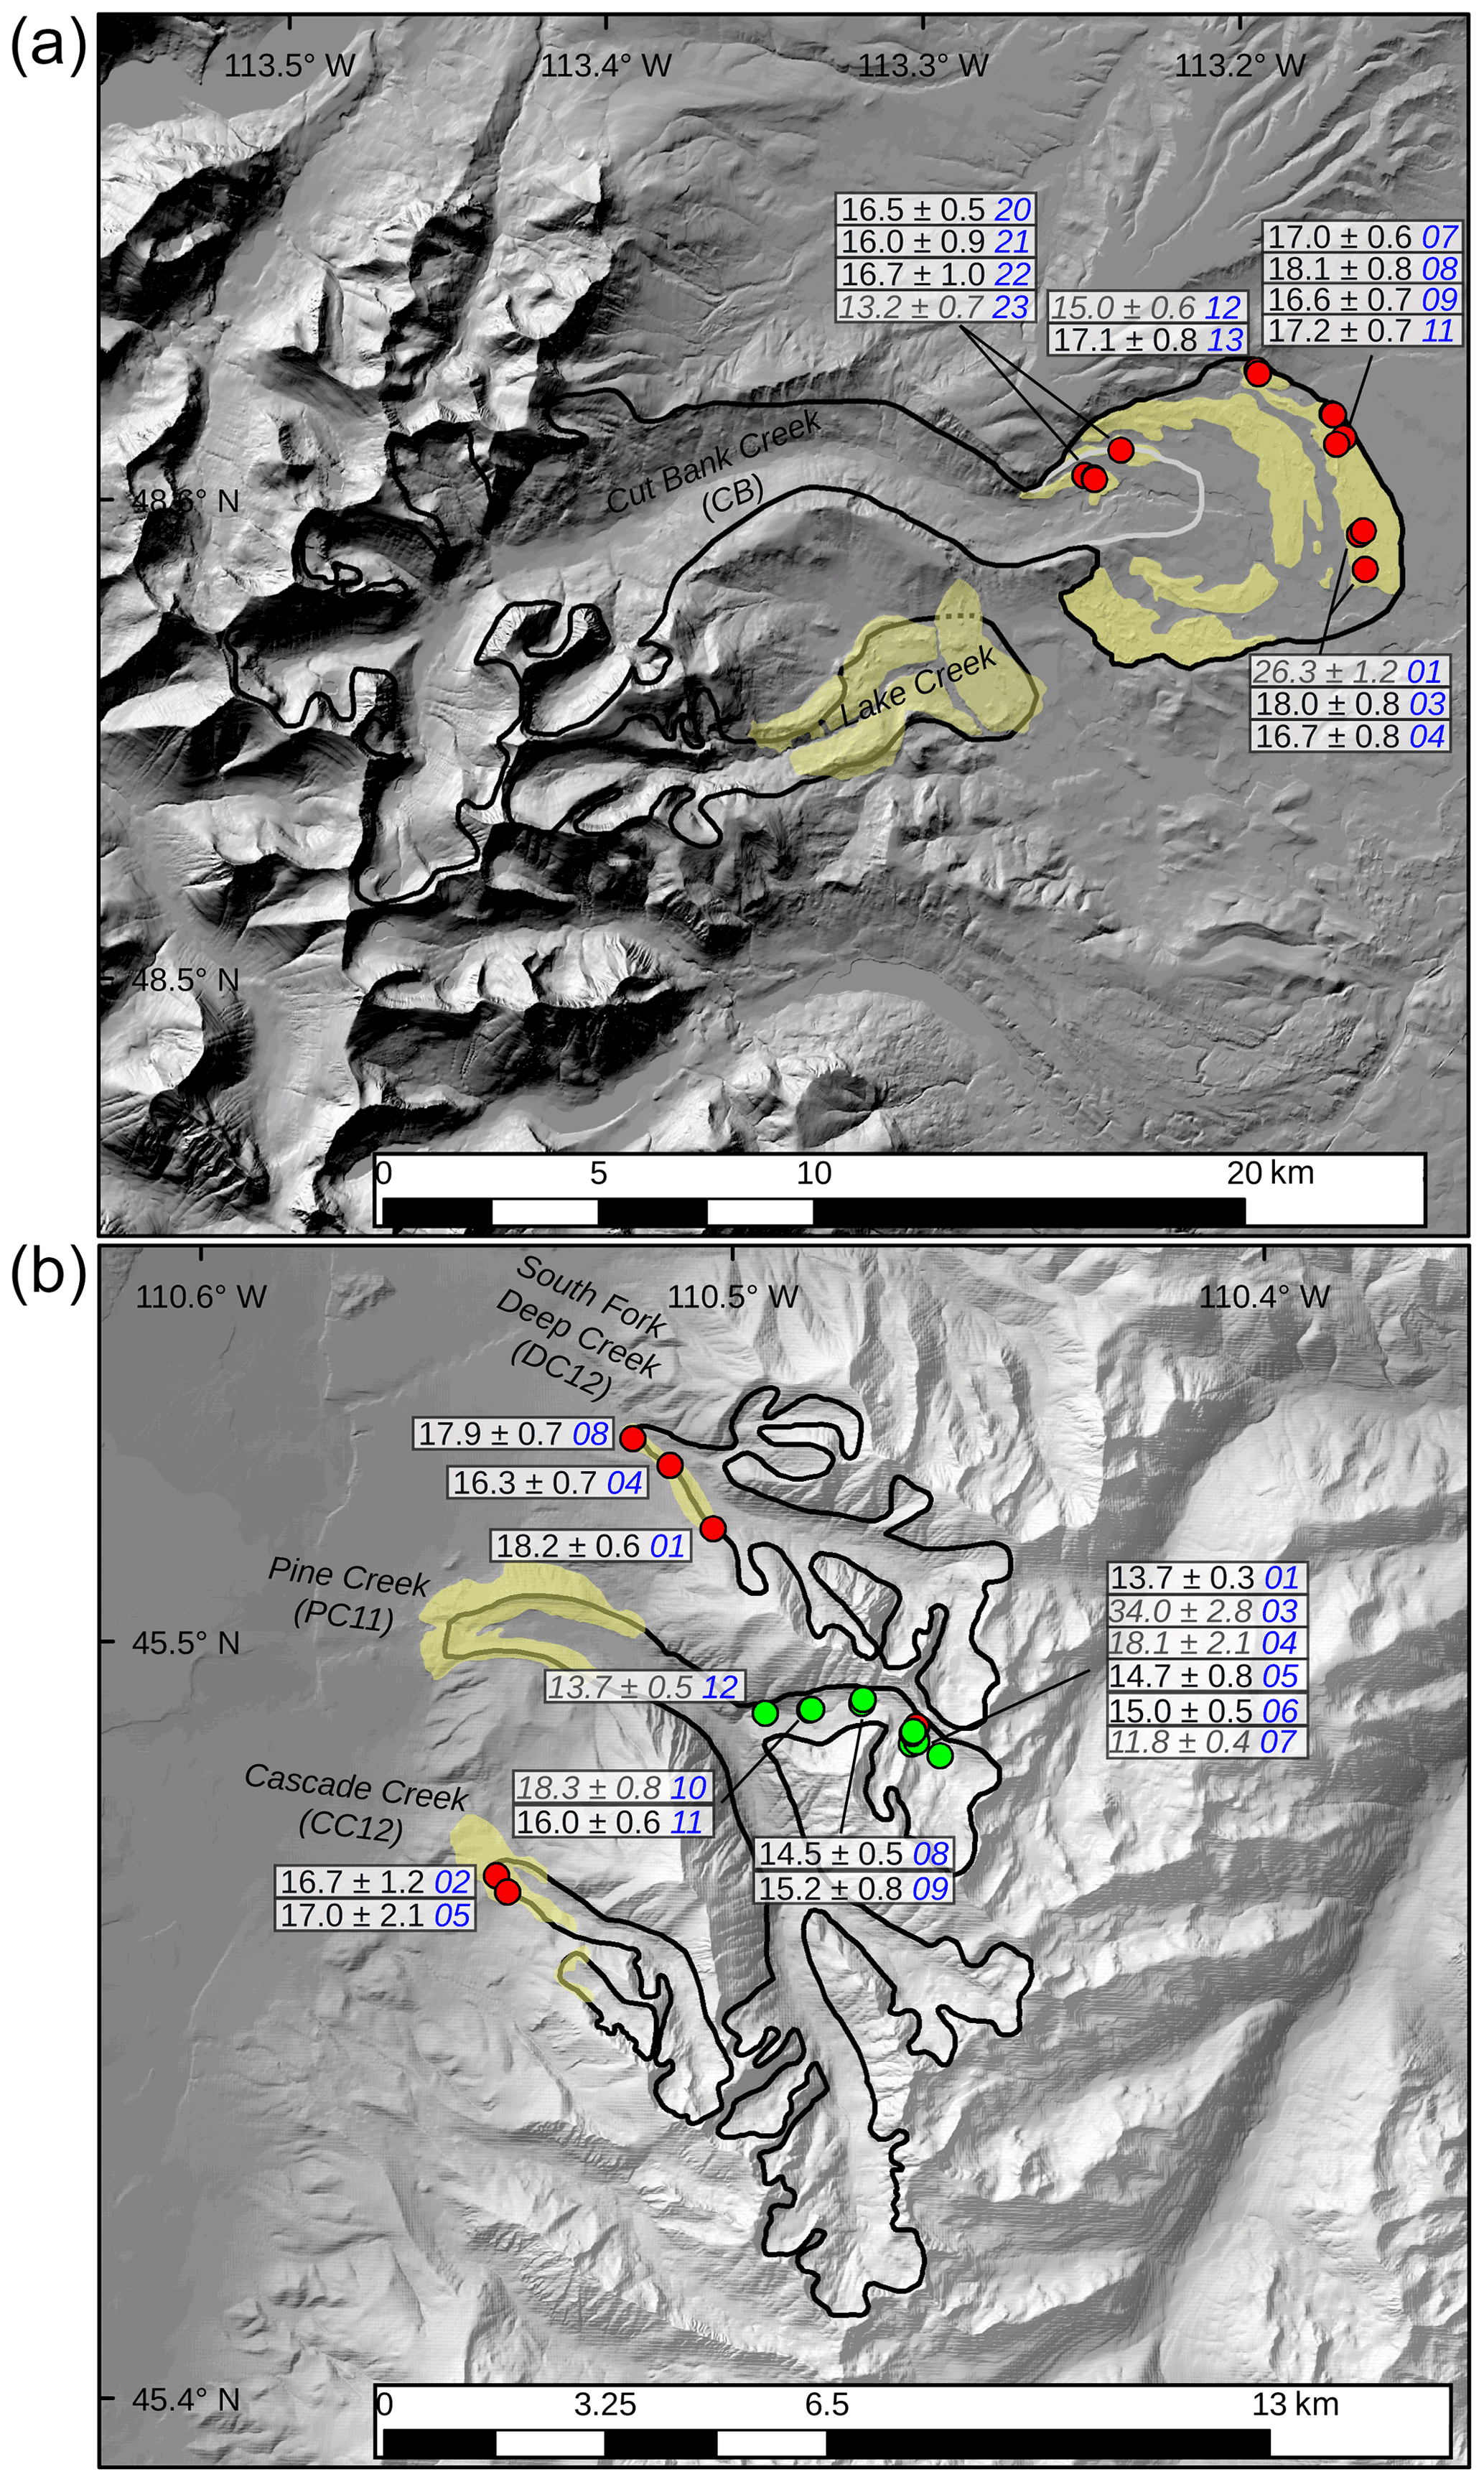
Figure 2(a) Cut Bank Creek study area located in the Lewis Range of northern Montana. (b) Northern Absaroka Range study area including South Fork Deep Creek, Pine Creek, and Cascade Creek drainages. Pinedale maximum ice extents are outlined in black (dashed where inferred). The recessional position at Cut Bank is outlined in light grey. Moraine deposits are shown in yellow, and cosmogenic 10Be boulder and bedrock sample locations are indicated by red and green circles, respectively, with exposure ages (Promontory Point calibration data and LSD scaling scheme) and analytical uncertainty (shown in ka); sample codes are in blue text. Exposure ages interpreted as outliers are shown in grey and italicized.
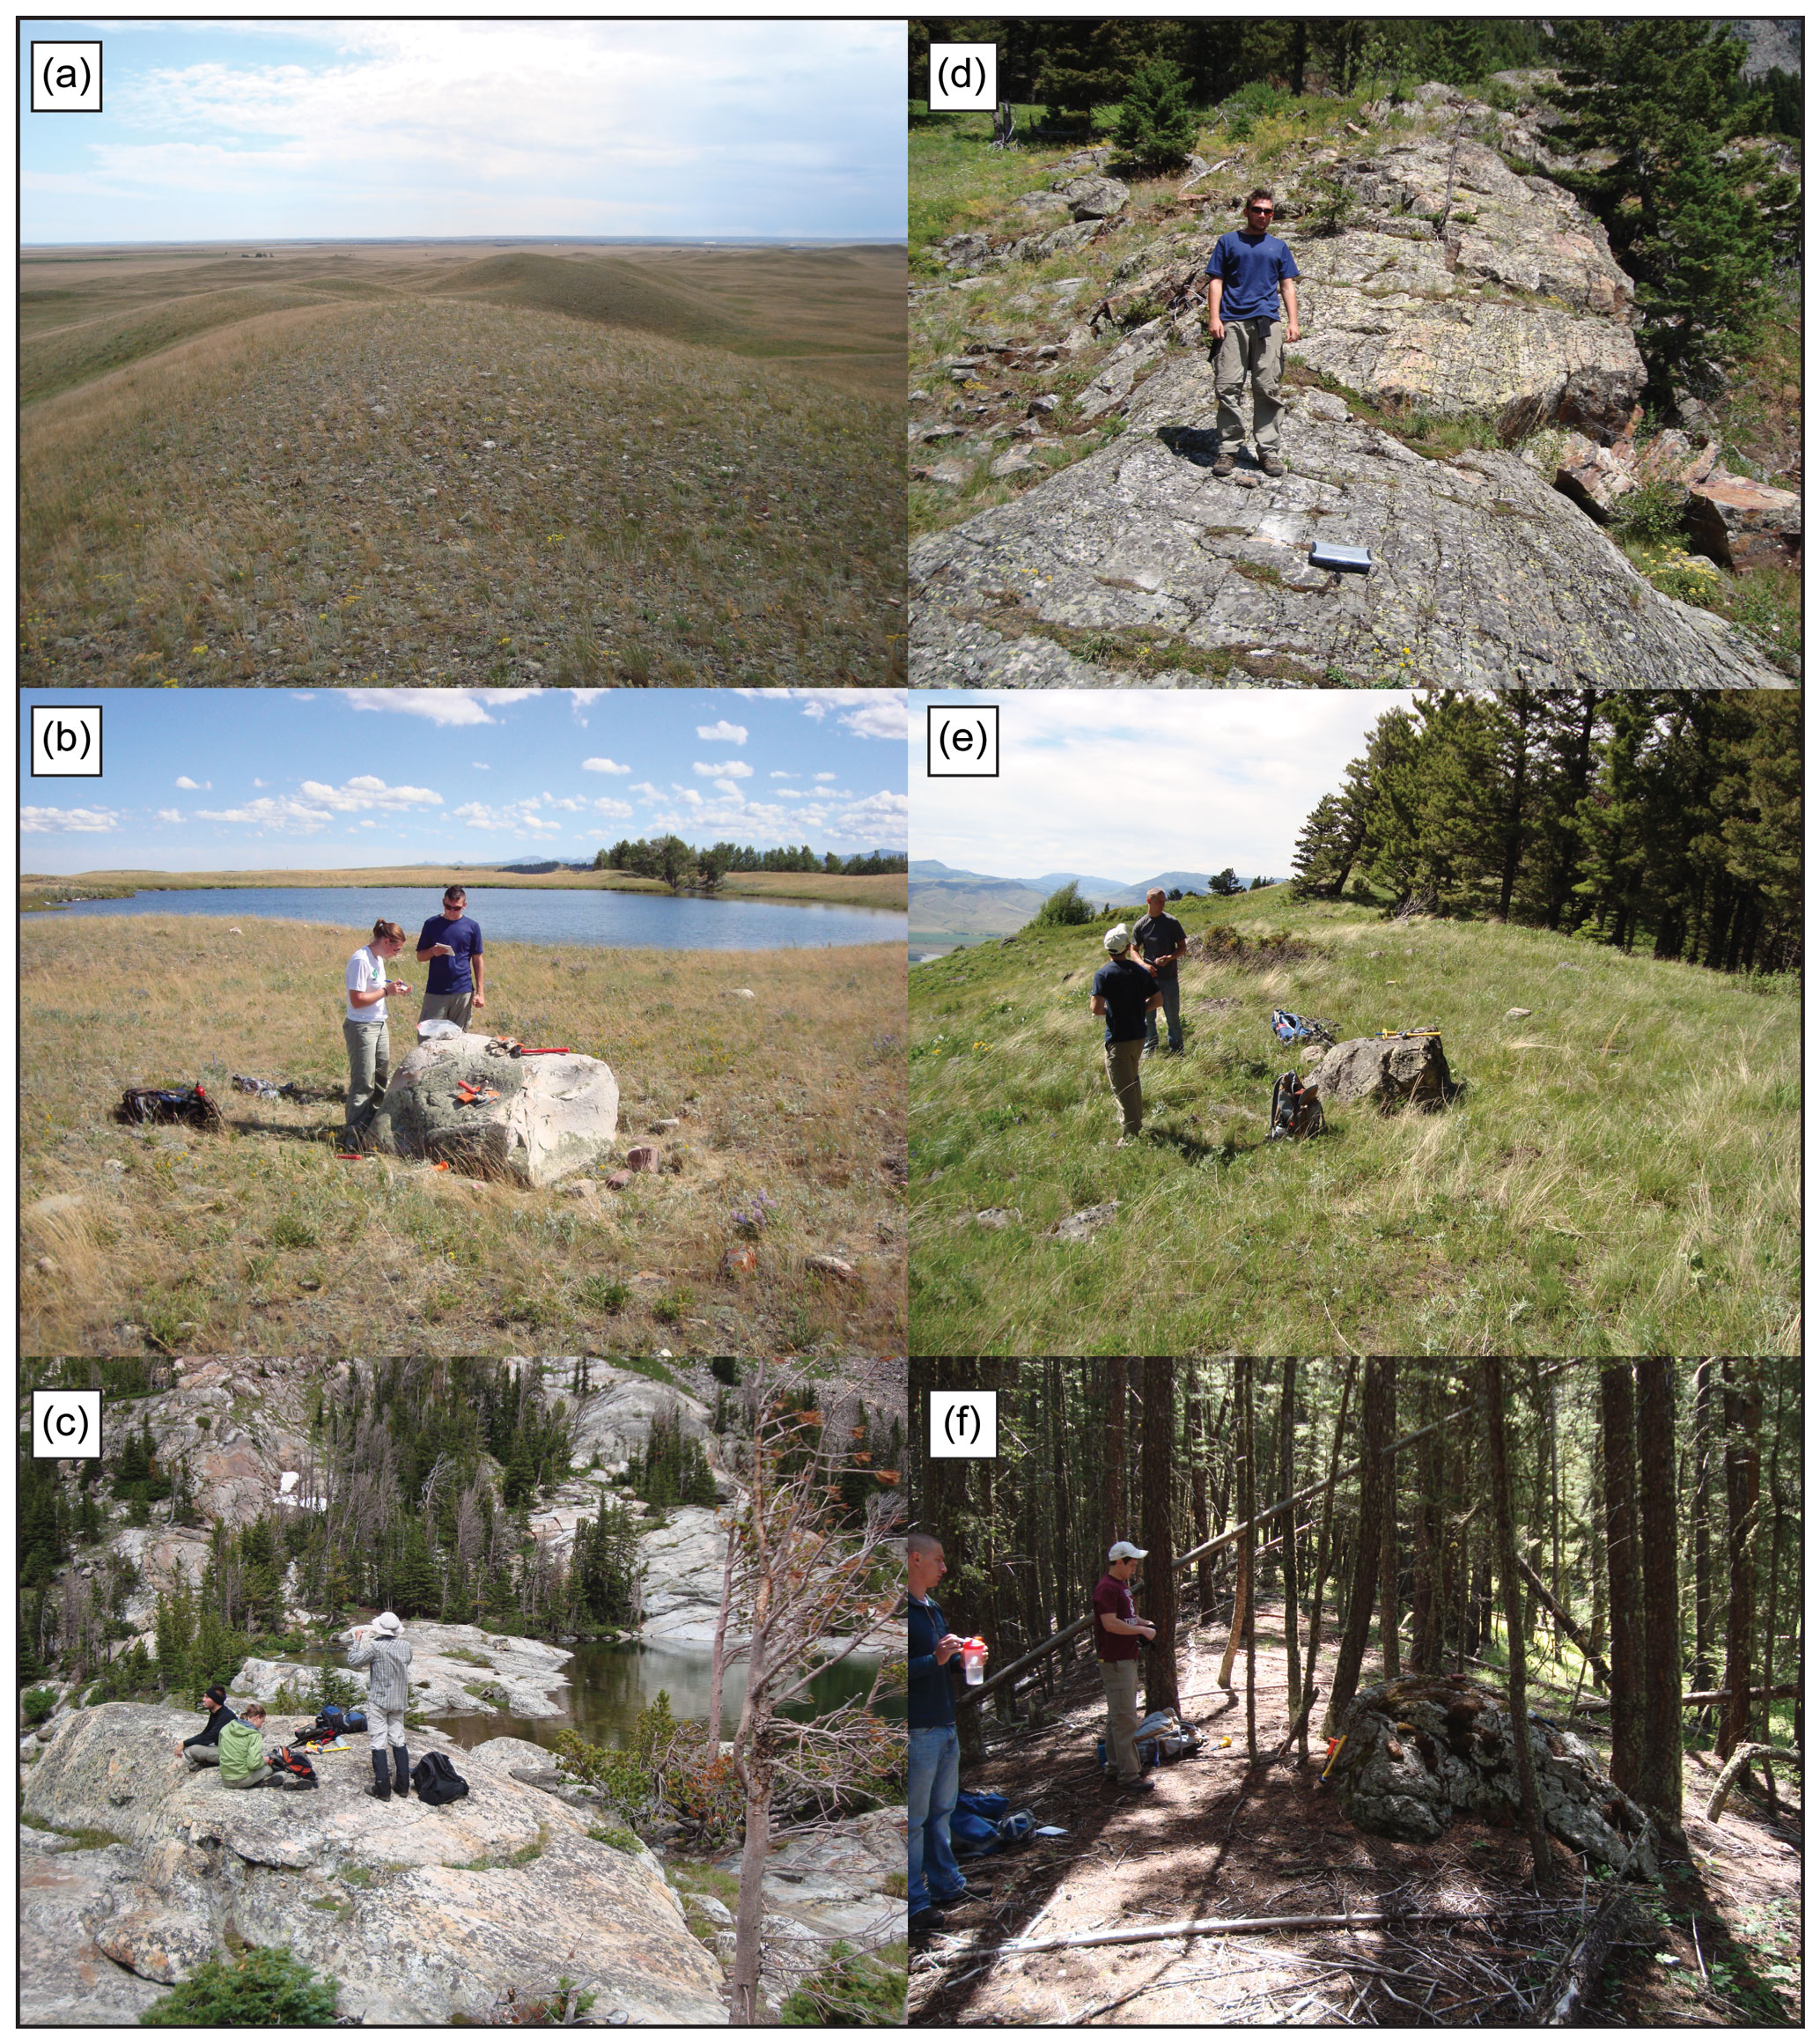
Figure 3(a) Characteristic hummocky morphology of Cut Bank Creek terminal moraine. (b) Boulder CB-03 targeted for cosmogenic exposure dating on the Cut Bank terminal moraine. (c) Photograph taken facing north-northeast looking across the threshold of Pine Creek Lake and towards bedrock sampled for cosmogenic exposure dating. (d) Location of bedrock sample PC11-11. (e) Lateral sector of the Cascade Canyon Pinedale terminal moraine. (f) South Fork Deep Creek lateral-moraine sample DC12-01.
Surficial mapping of glacial deposits within our area of interest in the Absaroka Range had been previously completed by Pierce (1979, and references therein). Mapping in the Pine Creek area was subsequently updated by Licciardi and Pierce (2008). In the field, we checked and confirmed, without modification, the moraine mapping from these previous studies.
2.2 Cosmogenic 10Be exposure dating
Following moraine mapping and field verification, we selected moraines and erratic boulders atop moraine crests for in situ cosmogenic 10Be exposure dating to determine landform ages at Cut Bank Creek, South Fork Deep Creek, and Cascade Creek canyons. We targeted two frontal moraines at Cut Bank Creek including the ice-distal terminal moraine. Boulders atop a recessional moraine identified just beyond the mouth of Cut Bank Canyon were also sampled to limit the time when moraine building at the mountain front ceased and ice retreat commenced. At South Fork Deep Creek and Cascade Creek, we targeted lateral moraines associated with maximum mapped ice extents. We collected samples from bedrock and erratic boulders not associated with moraine deposits along a transect of Pine Creek canyon.
On moraine crests, we searched for large (> 0.5 m tall), quartz-bearing boulders with broad horizontal surfaces. When possible, we selected boulders and bedrock surfaces with clear glacial polish and/or striations. In the northern Absaroka Range, most sampled moraine boulders consisted of Jewel quartzite (Archean rocks of the Wyoming Province; Zientek et al., 2005), which generally contains > 90 % quartz and some accessory minerals. In the Cut Bank Creek valley, sampled moraine boulders consisted of silica-cemented quartz arenite derived from the Appekunny Formation (subdivided from the Proterozoic Belt Supergroup), which is widely exposed along bedrock divides in the Lewis Range (Whipple et al., 1984). By selecting only samples with clear glacial polish and/or striations we determined that sample surface erosion was insignificant, and we therefore used an erosion rate of 0 cm a−1 in exposure age calculations. Samples were collected using a hammer and chisel to depths ranging from 1–5 cm, with an average depth of 3 cm. The number of samples collected from each landform varied based on the availability of suitable targets. Topographic shielding data were collected in the field with a clinometer. Target surfaces were selected so as to minimize the effect of internal shielding and cosmic ray scattering from nearby boulders.
At Pine Creek in the northern Absaroka Range, where cosmogenic 10Be exposure ages of latero-terminal moraines were already available (Licciardi and Pierce, 2008), glacially scoured bedrock and erratic boulders were sampled along the path of ice retreat. Here, we assume that bedrock surfaces became progressively exposed through time as ice retreated upvalley from the terminal moraine, and therefore exposure ages would limit the pace and timing of ice retreat (see Guido et al., 2007). Jewel quartzite, described above, as well as bedrock and erratic boulders were sampled along the length of the transect and were collected following the same procedure described above.
All samples were prepared at SUNY Geneseo for in situ cosmogenic 10Be measurement following methods in Laabs et al. (2013). Samples were crushed, milled, and sieved to a target grain size of 250–500 µm. Quartz grains were isolated using a rare earth hand magnet, Franz magnetic separator, density separation, and dilute acid treatment. The quartz purification process was accomplished by repeated etching in dilute hydrofluoric and nitric acids (Kohl and Nishiizumi, 1992). Prior to dissolution in concentrated hydrofluoric acid, the purified quartz fraction of each sample was spiked with a commercially made 9Be carrier solution purchased from SPEX CertiPrep with a certified Be concentration of 1 mg mL−1. Procedural blanks were prepared using equal carrier mass as was added to samples. The beryllium fraction of each sample was chemically isolated and loaded into targets for 10Be 9Be measurement by accelerator mass spectrometry (AMS) at the Purdue University Rare Isotope Measurement Laboratory (Sharma et al., 2000; Muzikar et al., 2003). All 10Be 9Be values were normalized to the AMS beryllium standard 07KNSTD (Nishiizumi et al., 2007).
We calculated cosmogenic 10Be exposure ages using the Balco et al. (2008) online exposure age calculator version 3.0 (http://hess.ess.washington.edu/math/, last access: 5 August 2021). This calculator and version were selected because they implement the Lifton–Sato–Dunai nuclide-dependent (LSDn; Lifton et al., 2014) scaling model and production rates based on user-defined calibration data from independently dated locations. Production rates were computed using in situ 10Be data from the independently dated surface at the Promontory Point production rate calibration site reported by Lifton et al. (2015), which features well-preserved and continuously exposed surfaces following the Bonneville flood at 18 350 ± 300 cal yr BP. We chose this calibration site because of its proximity in space and time to the study area, following other recent reports of Pleistocene moraine chronologies in the Rocky Mountains (Licciardi and Pierce, 2018; Schweinsberg et al., 2020; Laabs et al., 2020). Exposure ages calculated with other commonly used calibration (e.g., CRONUS-Earth primary 10Be calibration data; Borchers et al., 2016) and scaling schemes (Stone, 2000) result in apparent age differences of 3 %–5 %.
Moraine ages and associated uncertainties are reported as the arithmetic mean of individual boulder exposure ages and the standard error of the mean, respectively (as in Putnam et al., 2010; Quirk et al., 2020). We do not account for snow cover shielding on calculated exposure ages, noting that snow shielding corrections (∼ 3 %; Marcott et al., 2019) are typically less than the total uncertainty associated with production rate calibration and scaling schemes (∼ 6 %; Balco, 2020).
2.3 Glacier modeling
The coupled energy–mass balance and ice-flow models used in this study were originally developed by Plummer and Phillips (2003) and have been successfully used to estimate paleoclimate conditions for extinct glaciers in a variety of geologic settings (Quirk et al., 2020; Rowan et al., 2014; Leonard et al., 2014; Harrison et al., 2014; Laabs et al., 2006). Additionally, several studies have verified the model's ability to successfully predict snow accumulation (Laabs et al., 2006; Leonard et al., 2014) and melt (Quirk et al., 2020), as well as small glacier extents (Plummer, 2002) for modern conditions in the western US.
Our modeling approach is to match simulated glacier extents produced under prescribed climate perturbations relative to modern (e.g., temperature depression and precipitation change) to field evidence such as terminal and lateral moraines. In this study, we match modeled glacier shapes and thicknesses to the well-defined Pinedale maximum ice extents at Cut Bank, Pine Creek, and South Fork Deep Creek. To test the validity of the ice-flow parameters used for the Cut Bank Creek glacier detailed below, we reconstructed the undated Lake Creek glacier immediately to the south of Cut Bank at its maximum mapped extent using the same parameters. We reconstructed the Cut Bank glacier using a model spatial resolution of 180 m, while we used a resolution of 30 m for the Pine Creek and South Fork Deep Creek glaciers, which were modeled in the same domain (herein the northern Absaroka domain). We did not include Cascade Creek as a target for glacier reconstructions because mapping of the glacier's exact terminal position remains unresolved.
The energy–mass balance model calculates snow accumulation and ablation at every cell within the model domain for the time interval of interest, typically 1 to several years. Annual mass balance depends mostly on precipitation and temperature, which are the principal inputs to the model. In this study, we use an approach similar to the one used by Leonard et al. (2017a) whereby we describe the monthly spatial distribution of temperature and precipitation at every cell across the model domain with linear regressions of elevation and PRISM (Parameter-elevation Regression on Independent Slopes Model; Daly et al., 2008) monthly mean climatological models. It is important to note that in our simulations we change monthly temperature and precipitation distributions for the entire year, while glacier mass balance is primarily sensitive to ablation season temperatures and accumulation season precipitation as snowfall. Secondary climate parameters include estimates of average monthly relative humidity, cloudiness, and wind speed and are taken directly or derived from a combination of RAWS and NOAA COOP historical weather station data. We calculated average monthly cloudiness for the Cut Bank and Lake Creek Canyon domains by determining the fraction of days per month with precipitation (i.e., 0.5 cloudiness equates to 15 d of precipitation per 30 d total). For the Pine and South Fork Deep Creek domain, cloudiness was estimated using the ERA-Interim third-generation (1979–2015) reanalysis (http://cci-reanalyzer.org/reanalysis/monthly_tseries/, last access: 20 January 2021). Wind speed (Ws) was scaled for elevation from weather station data using a given weather station's reference elevation (ElevationREF) with the equation
where Ws,REF is wind speed at the reference elevation and k is a wind scaling factor. Here, k is taken as 0.001, resulting in an additional 1 m s−1 average wind speed per 1000 m of elevation. Average monthly cloudiness is held constant at every cell and elevation within the model domain. To simulate paleo-glacier extents, we varied precipitation and temperature, the two dominant climate input parameters, using multiplicative and additive variations from modern, respectively. Thus, a precipitation factor change of 1 is equal to modern precipitation, and a temperature of depression of 0 ∘C is modern temperature.
The primary output from the energy–mass balance model is a mass balance grid for model domain. The mass balance grid is input to the ice-flow model along with a digital elevation model of the drainage basins. The ice-flow model designed by Plummer and Phillips (2003) used here is similar to the finite-element ice sheet model described by Fastook and Chapman (1989) and follows the commonly used shallow-ice approximation. Snow and ice mass is gained in the accumulation zone and flows along the ice-surface gradient via deformation and sliding into the ablation zone. We run glacier simulations to steady state where the simulated terminus stabilizes at a mapped moraine position. We define the steady-state condition in our model runs as when the integrated surface balance errors are less than 5 % and typically ≈ 0 %, as described by Plummer and Phillips (2003). The time-dependent ice-flow model is an alternating direction-implicit, space-centered, finite-difference form of the continuity equation for 2-D flow:
where h is ice-surface elevation, bn is net annual mass balance, q is ice discharge per unit width, and x and y are orthogonal directions of ice flow in the horizontal plane. The ice flux between neighboring cells is determined by the thickness and depth-integrated flow velocity, U, which is the sum of ice flow via deformation and sliding:
Here, A is the deformation flow coefficient, B is the sliding flow coefficient, H is ice thickness, f is a velocity scaling parameter, and τ is basal shear stress. The exponents m and n are taken to be 3 and 2, respectively, as described by Fastook and Chapman (1989). We tuned ice-flow parameters A, B, and f to match simulated glacier shapes and ice thicknesses to the observational record. Ice-flow parameter values that simulated observed ice thicknesses well included A values for the Cut Bank and northern Absaroka domains of 8.0 × 10⁻⁵ and 1.0 × 10⁻⁷ a−1 kPa−3, B values of 0.0015 m a−1 kPa−2, and f values of 0 and 0.5, respectively. The ice-flow parameters used in the northern Absaroka domain agree well with the published range of values used in previous glacier flow models (Oerlemans, 1989; Plummer and Phillips, 2003; Laabs et al., 2006; Quirk et al., 2018).
The Cut Bank glacier required a greater value of the deformation flow coefficient compared to the steeper valley glaciers in the northern Absaroka Range. Although it is likely that the Cut Bank Creek glacier was sliding at its base, we did not account for the contribution of sliding to flow because it was likely far less than the contribution to flow by deformation as indicated by the great ice thicknesses and low surface slopes. As described previously, we also simulated the Lake Creek glacier immediately south of Cut Bank using identical ice-flow parameters to test the validity of the chosen values. Through experimentation, we tuned the ice-flow parameters to produce simulated steady-state glaciers that matched the mapped paleo-glacier thickness and shape in both valleys and thus parameterized the effects the piedmont lobe and glacier shape had on the Cut Bank glacier. (Fig. S1 in the Supplement).
3.1 Moraine mapping
The suite of moraines deposited at the mountain front in Cut Bank Creek valley features three broad, looping plateaus with hummocky topography separated by incised meltwater channels and outwash (Fig. 4). The suite includes a multi-crested terminal moraine deposited beyond the mountain front and a recessional moraine deposited near the mouth of Cut Bank Canyon (Fig. 4). The ice-distal sector of the terminal moraine has the highest internal relief (up to 30 m) along the portion of the moraine south of Cut Bank Creek, with numerous closed depressions, some of which are filled with shallow lakes. The distal slope of the moraine grades to a broad, gently sloping outwash plain known locally as Starr School Flat, featuring low-relief (< 3 m) depressions and abandoned braided channels. The ice-proximal sector of the terminal moraine is narrower with less internal relief (less than 15 m) and fewer closed depressions. The proximal slope of this sector of the moraine appears to be partially buried by outwash where it is bisected by Cut Bank Creek. The recessional moraine is best preserved north of Cut Bank Creek and features low-relief hummocky topography (less than 5 m internally). In Lake Creek valley, only a single, looping terminal-moraine ridge is preserved at the mountain front, forming a broad area of hummocky topography with greater internal relief (up to 60 m along portions north of Lake Creek).
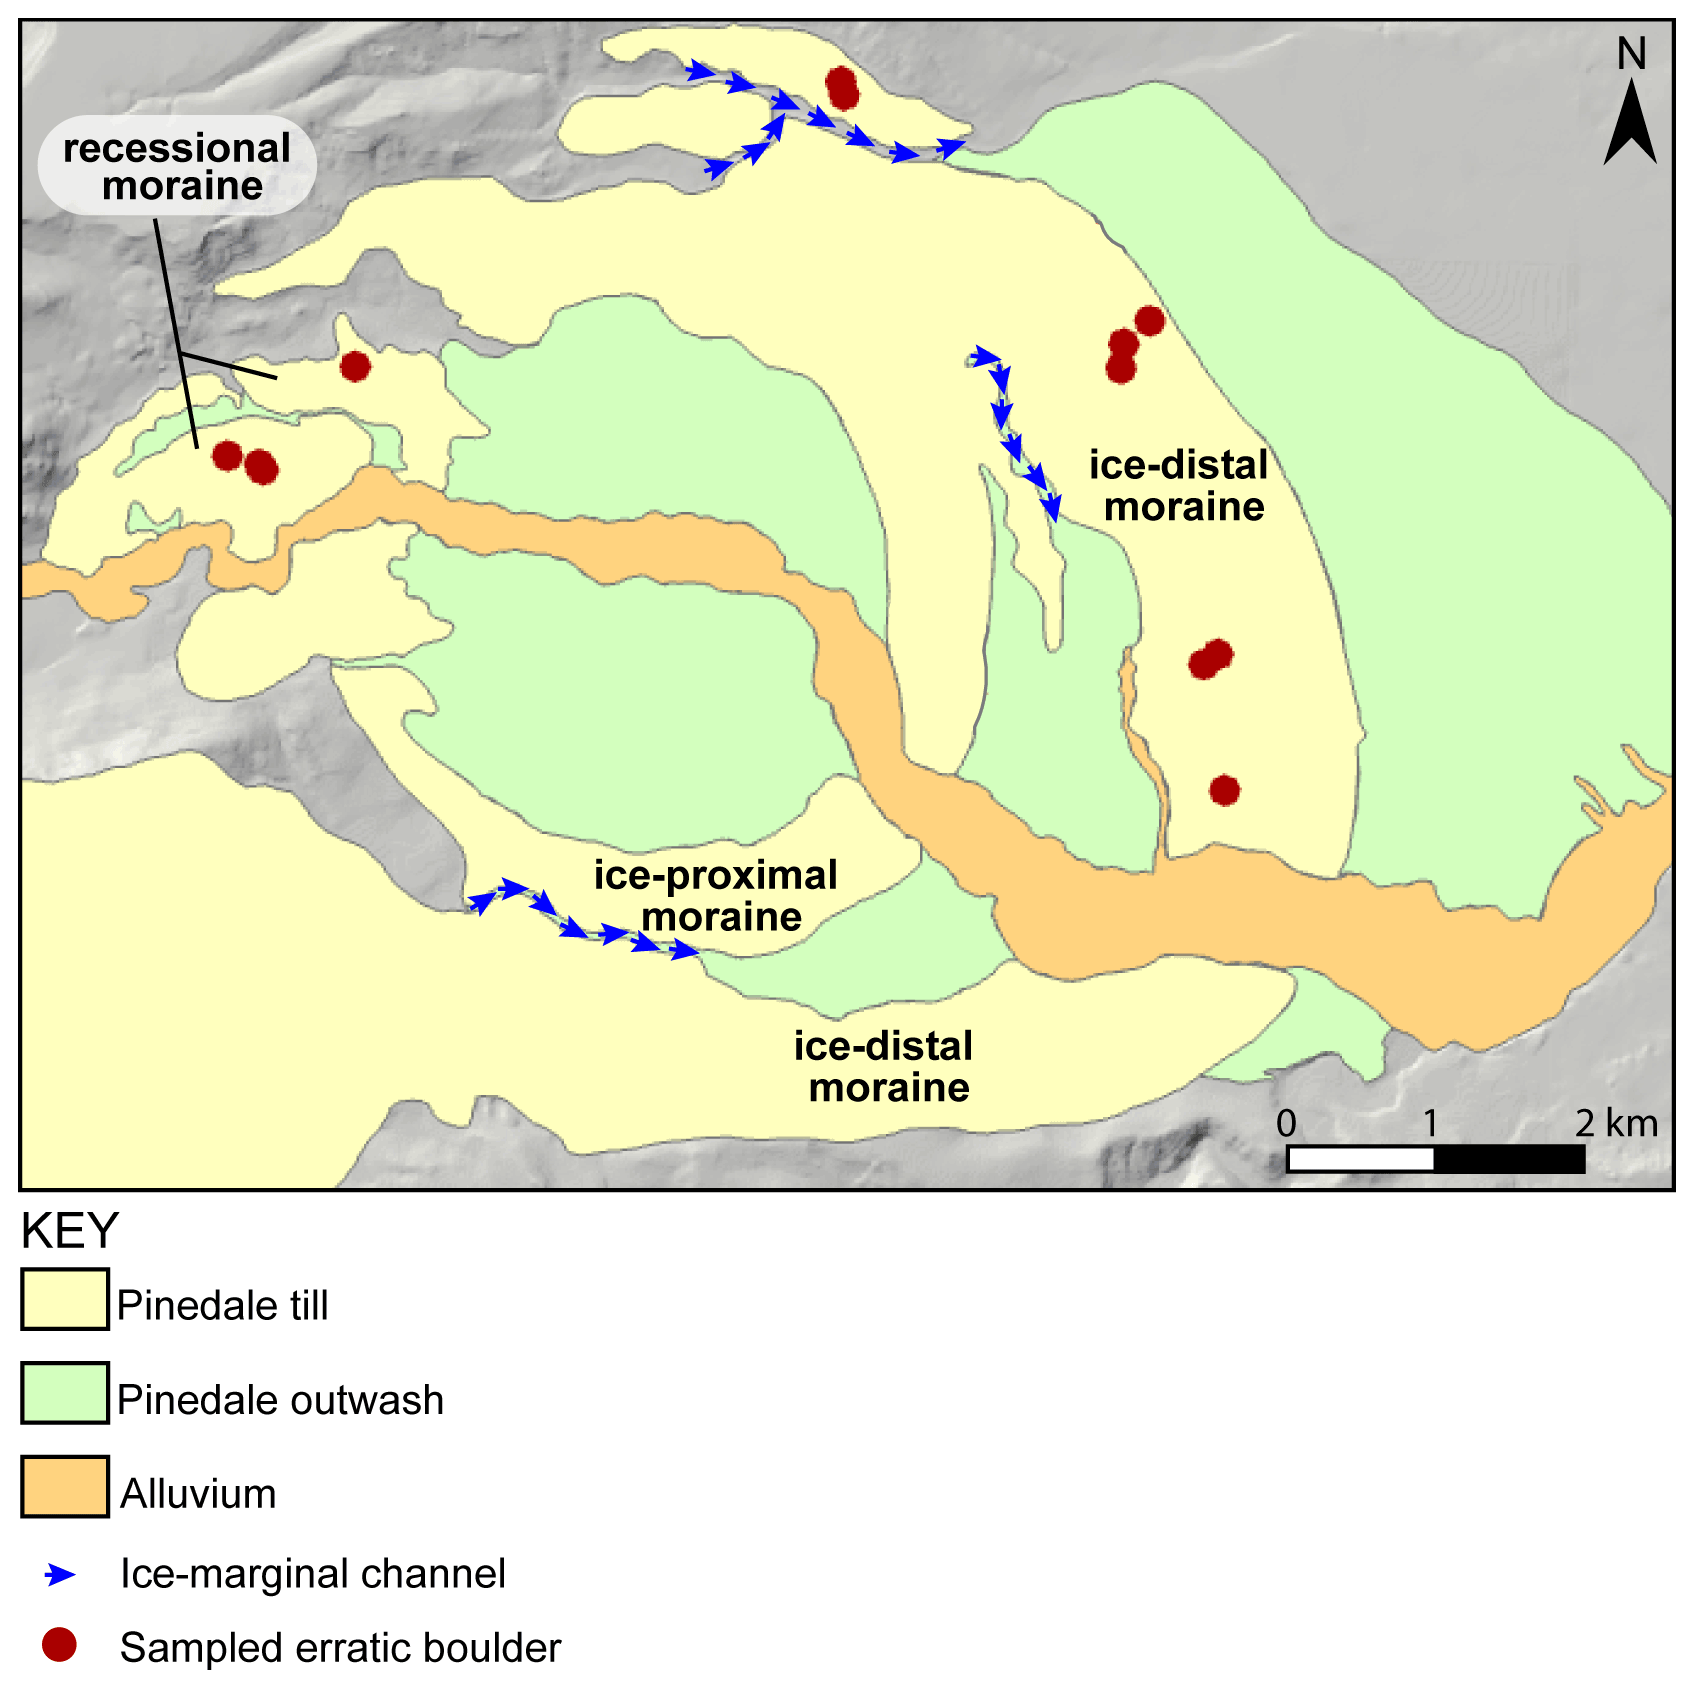
Figure 4Surficial geologic map of the Cut Bank Creek moraine complex detailing the Pinedale ice-distal, ice-proximal, and recessional moraine extents.
The moraines delimit the size and shape of the piedmont lobes formed by glaciers in the two valleys. At Cut Bank Creek, the maximum Pinedale glacier, as denoted by the ice-distal moraine, extended almost 30 km from the headwall and occupied an area of ∼ 123 km2, while the piedmont lobe had a maximum diameter of 6.8 km. While occupying the ice-proximal sector, delimited by the mapped recessional moraine, the Cut Bank glacier extended approximately 25 km downvalley and occupied an area of 86 km2, while the piedmont lobe was reduced in diameter to approximately 4.4 km. The piedmont lobe likely became thinner or formed a more gradual slope near the terminus as evidenced by the lower relief along the moraine. As the glacier terminus subsequently retreated to the recessional moraine, the piedmont glacier width was further diminished to approximately 1.3 km, only slightly wider than the mouth of Cut Bank Canyon. In Lake Creek valley, the piedmont lobe formed an irregular shape, likely due to partial confinement of the northern side of the lobe by the right-lateral moraine in the neighboring Cut Bank Creek valley. The piedmont lobe had a maximum width of about 2.5 km and a total glacier length of 12 km, and it occupied an area of 24 km2 when the terminal moraine was occupied. Upvalley of the terminal moraines in Cut Bank Creek and Lake Creek valleys, lateral moraines and other glacial features mapped by Carrara (1989) were used to delimit ice thickness and areal extent.
3.2 Cosmogenic 10Be exposure ages
Here we present 29 cosmogenic 10Be exposure ages collected from glaciated catchments in the Lewis and northern Absaroka ranges of Montana (Figs. 2, 5). In the Lewis Range, nine exposure ages are from the ice-distal sector of the terminal (frontal) moraine in Cut Bank Creek valley and four are from a recessional (frontal) moraine upvalley. In the northern Absaroka Range, 2 samples are from the Cascade Creek lateral moraine, 3 are from the South Fork Deep Creek lateral moraine, and 11 are Pine Creek Canyon bedrock and erratic samples. The 10Be 9Be ratios in procedural blanks ranged from 6.00 × 10⁻¹⁵ to 4.90 × 10⁻¹⁴. Sample 10Be 9Be ratios ranged from 3.18 × 10⁻¹³ to 1.37 × 10⁻¹² (Table S1 in the Supplement). We corrected sample 10Be 9Be ratios by subtracting the number of 10Be atoms in the corresponding blank from the sample. The range of AMS measurement uncertainties (1σ) for most samples was approximately 1.5 %–3.5 %. Both moraine boulder samples from Cascade Creek have greater AMS errors of 4.9 % (CC12-02) and 8.3 % (CC12-05).
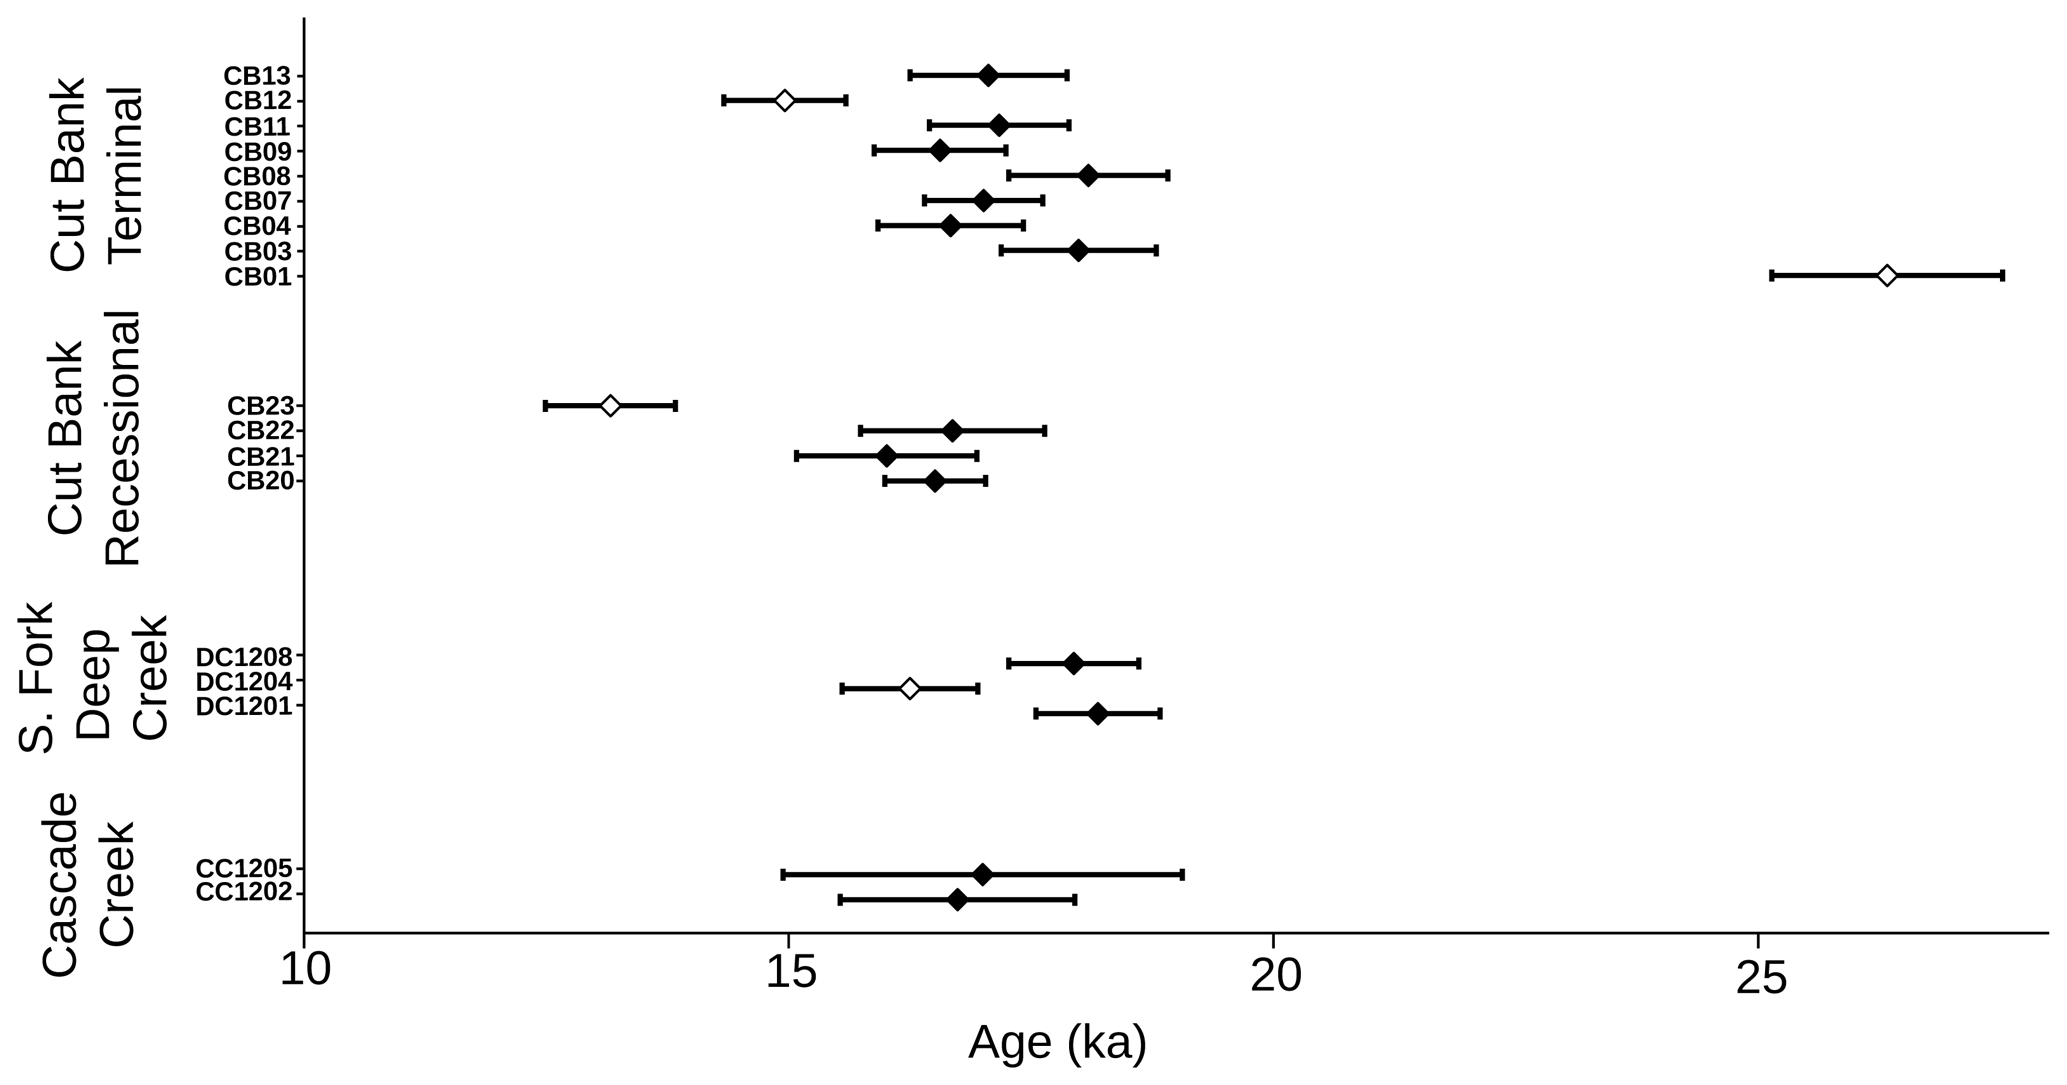
Figure 5Cosmogenic 10Be exposure ages with analytical uncertainties for samples collected from moraines at Cascade Creek and South Fork Deep Creek in the Absaroka Range and moraines at Cut Bank in the Lewis Range. Samples that have been identified as outliers are denoted by open symbols.
Table 1Cosmogenic 10Be sample information and exposure ages.
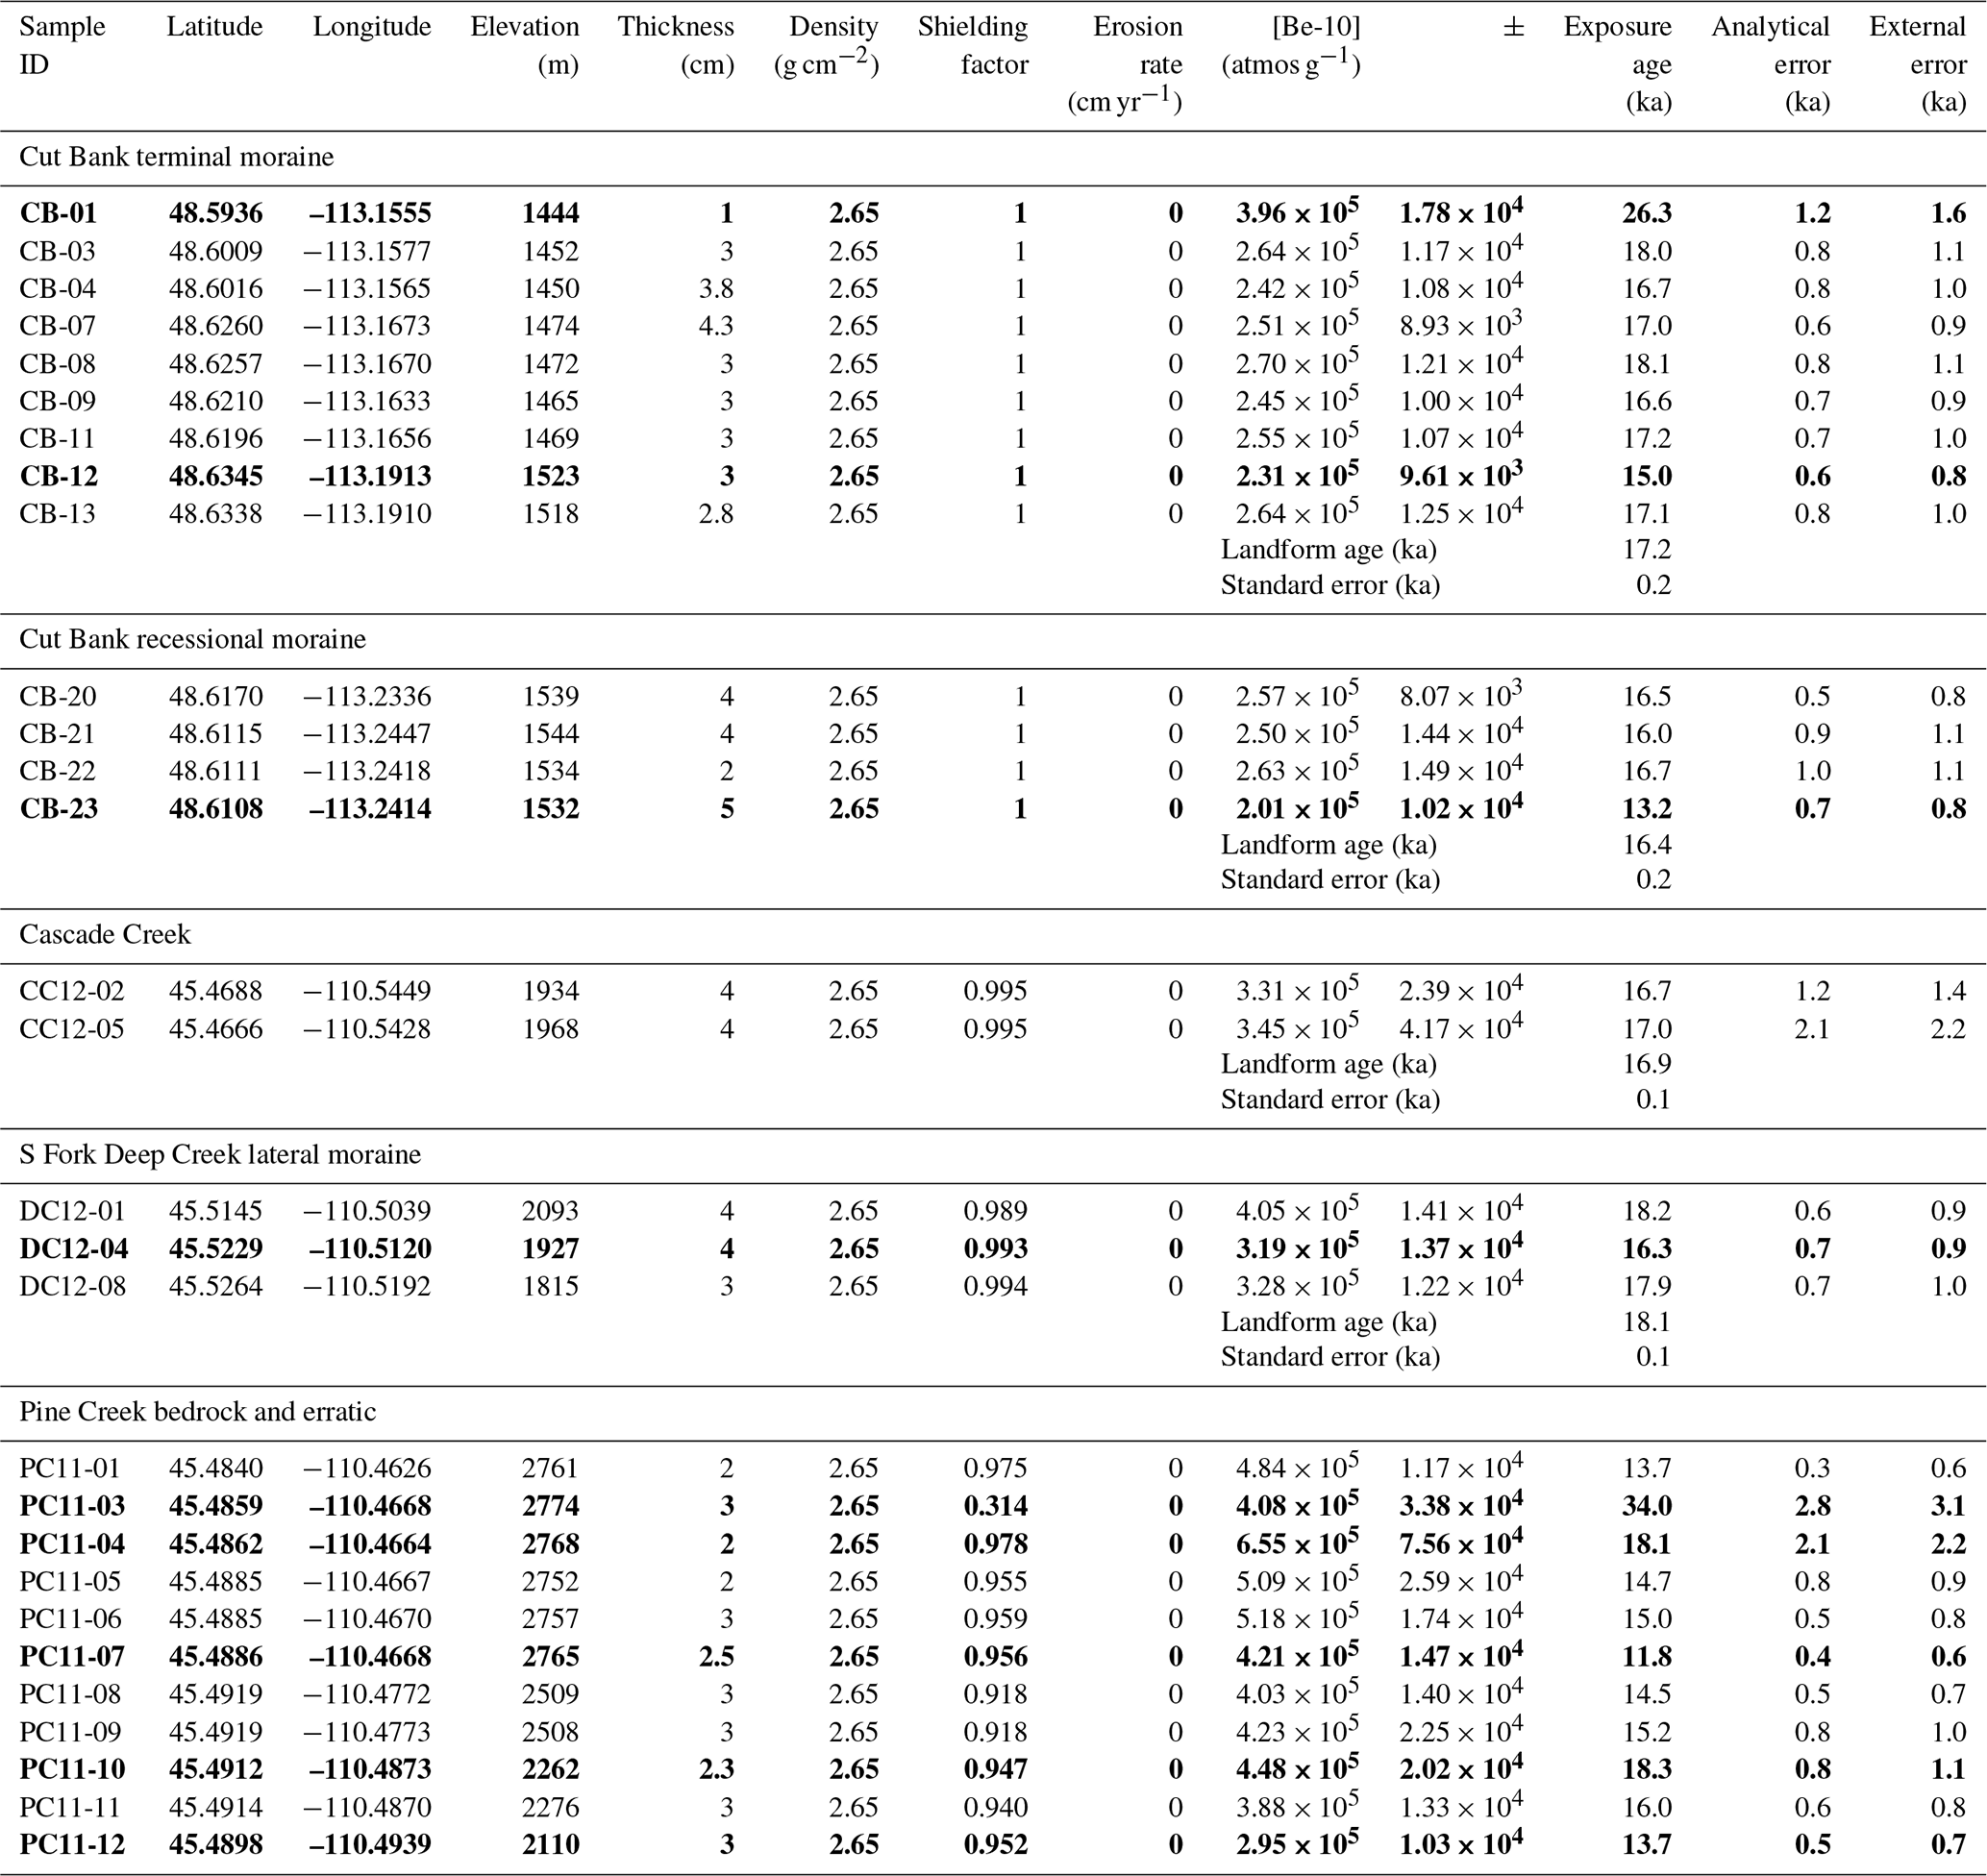
Bold font indicates outlier samples.
We identified three outliers among moraine exposure ages, including samples CB-01 and CB-12 from the Cut Bank terminal and CB-23 from the Cut Bank recessional moraine (Table 1). Sample CB-01 is more than 8 kyr older than all other boulder exposure ages from the terminal moraine and is therefore interpreted to reflect inherited 10Be nuclide inventory in the surface from a period of prior exposure. Sample CB-12 is younger than all but one of the exposure ages on the upvalley recessional moraine, which is interpreted to represent incomplete or inconsistent exposure history since the terminal moraine was deposited. Sample CB-23 has an exposure age 3 kyr younger than the other three boulders from the moraine and is also interpreted to represent incomplete or inconsistent exposure history since the recessional moraine was deposited. Although we found no evidence in the field for inconsistent exposure histories among the sampled boulders, these young exposure ages could be explained by several geologic processes including local burial by sediment followed by exhumation or significant boulder surface erosion rates. The mean of the remaining seven 10Be exposure ages from the terminal moraine in Cut Bank Creek valley limits its abandonment to 17.2 ± 0.2 ka. The abandonment age of the recessional moraine of 16.4 ± 0.2 ka is defined by three exposure ages.
Abandonment ages for the two moraines in the northern Absaroka Range at Cascade Canyon and South Fork Deep Creek are limited by the means of two boulder exposure ages each at 16.9 ± 0.1 and 18.1 ± 0.1 ka, respectively, although we reiterate that the exposure ages of the lateral moraine at Cascade Canyon are considered preliminary because of the greater-than-expected AMS measurement errors.
The set of bedrock exposure ages from the ice-recessional path in Pine Creek valley includes one (PC11-03, 34.0 ± 2.8 ka) that exceeds the exposure age of the lateral moraine downvalley (18.2 ± 0.5 ka, Licciardi and Pierce, 2008) and two (PC11-04 and PC11-10, 18.1 ± 2.1 and 18.3 ± 0.8 ka, respectively) that overlap with it. These surfaces are interpreted to reflect inherited 10Be from a period of prior exposure, which suggests that glacial scouring during the last glaciation at these sample sites was insufficient to remove the 10Be inherited from pre-glacial exposure of the valley floor. Two samples, PC11-07 and PC11-12, yield exposure ages younger than surfaces sampled at upvalley positions and are interpreted to reflect incomplete exposure due to burial by sediment. Sample PC11-07 is from an erratic boulder atop a bedrock surface with exposure ages 3 kyr older, suggesting that the boulder, originally interpreted to be an erratic deposited by glacier ice during recession, has been reworked by fluvial and mass-movement processes. The remaining six exposure ages range from 16.0 ± 0.6 ka at the farthest downvalley site (PC11-11) to 13.7 ± 0.3 ka at the farthest upvalley site (PC11-01) in the cirque occupied by Pine Creek Lake. When combined with the mean exposure age of the latero-terminal moraine of 18.2 ± 0.5 ka, these exposure ages record the pace and timing of ice retreat over a period of ∼ 4 kyr.
3.3 Glacier climate reconstructions
Model simulations were completed for the Cut Bank and northern Absaroka model domains including four simulations matching the Cut Bank terminal moraine (CBT), Cut Bank recessional moraine (CBR), and Pine Creek and South Fork Deep Creek lateral sectors of terminal moraines (NAT; Fig. 6). For simplicity, each of the sets of four simulations pin precipitation change (Px) to multiplicative factors of 0.5, 1.0, 2.0, and 3.0 times modern precipitation, while temperature depressions (Td) were independently varied in each experiment to match mapped ice extents. In each of the 12 experiments, calculated ice extents and thicknesses matched well with field evidence. The 12 experiments define three curves (Fig. 7) in Td–Px space, representing paleoclimate estimates for ice matching CBT (R2 = 0.98), CBR (R2 = 0.99), and NAT (R2 = 0.99) with the following equations.
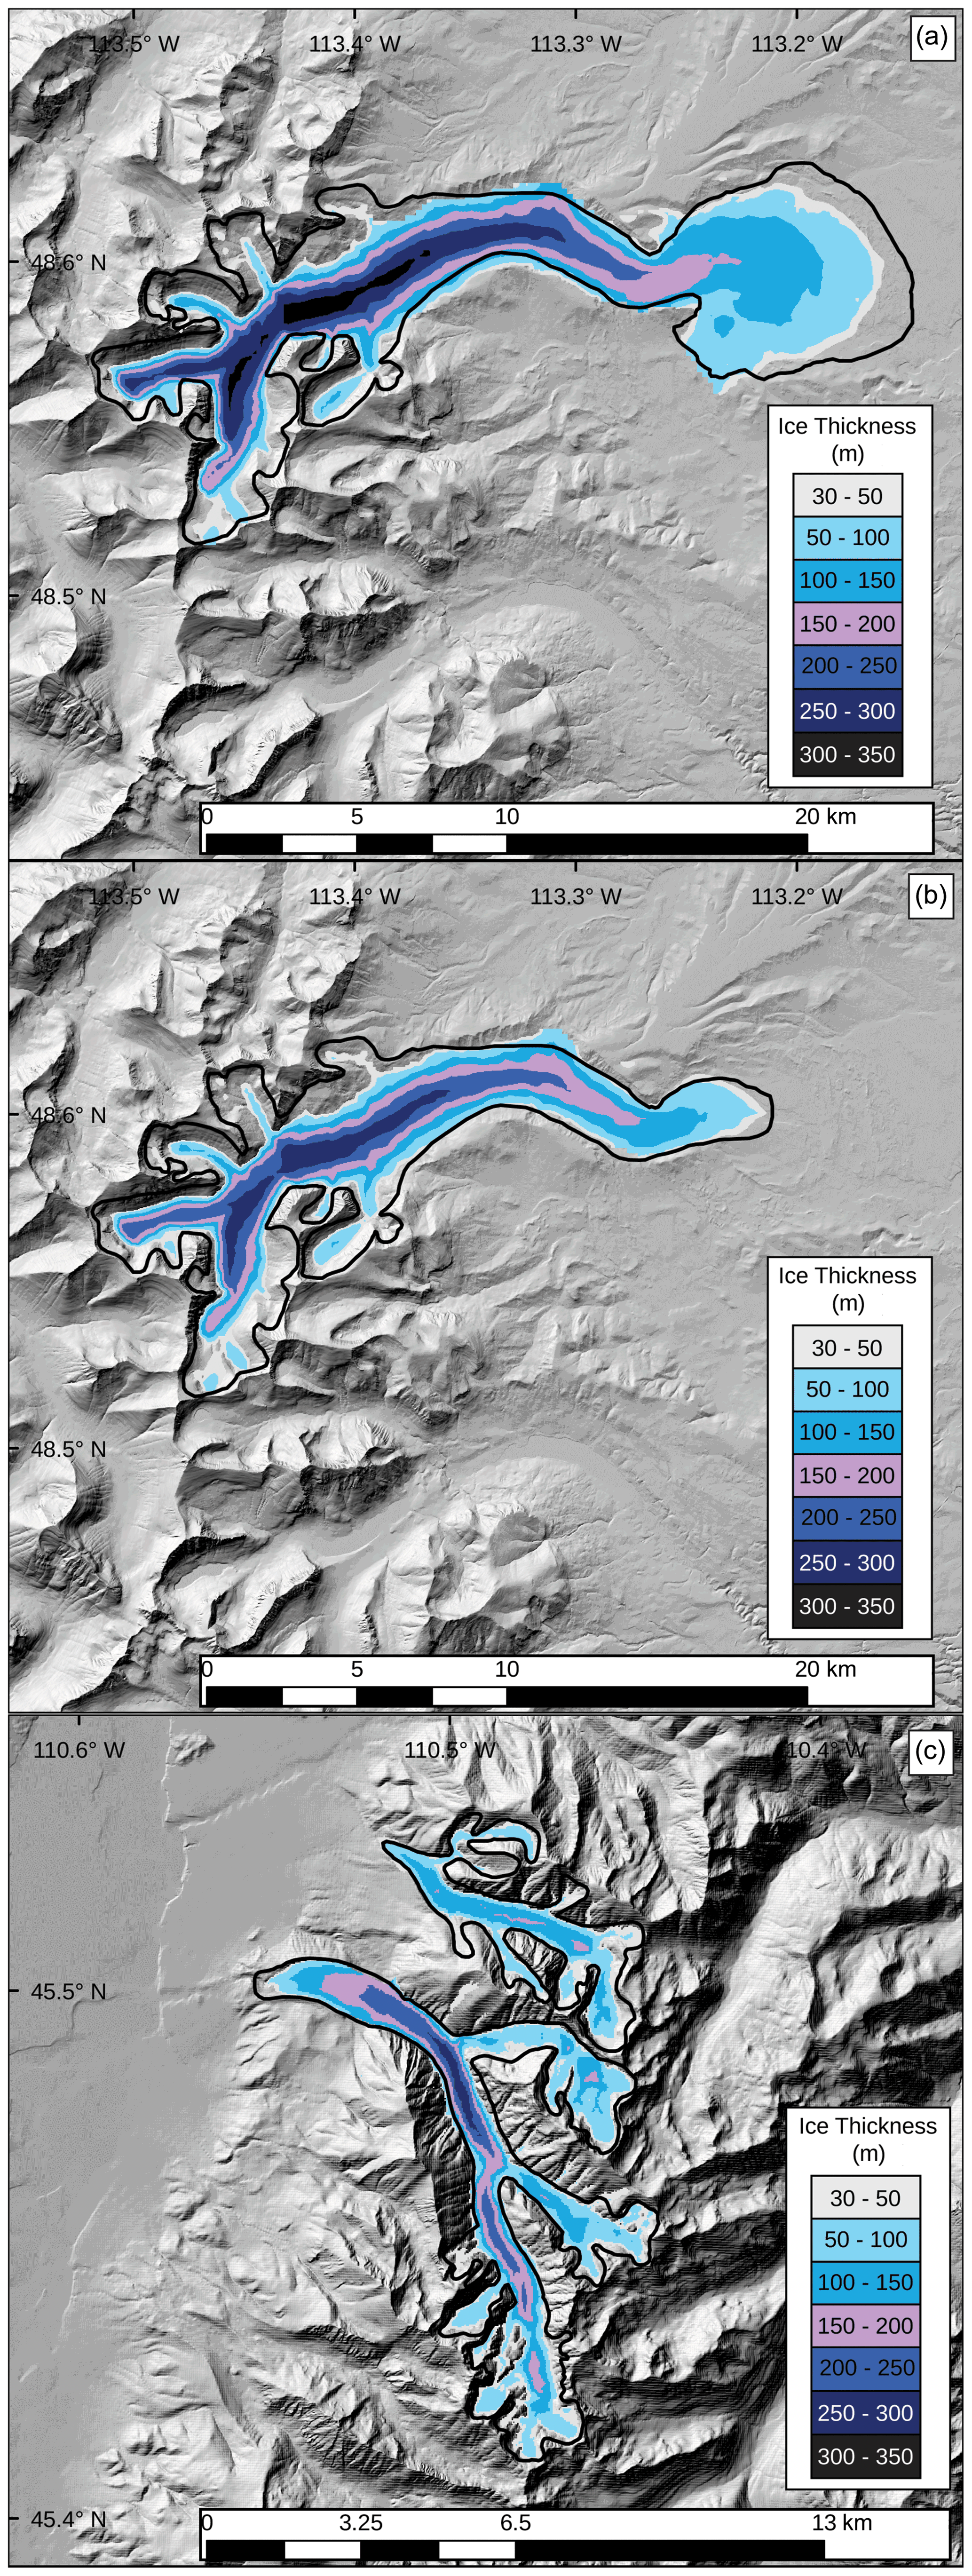
Figure 6Ice thickness maps generated from coupled energy–mass balance and ice-flow modeling for (a) Cut Bank terminal, (b) Cut Bank recessional, and (c) Pine Creek and South Fork Deep Creek in the Absaroka Range. Modeled ice extents were matched to field evidence (black outlines) by varying precipitation (Px) and temperature (Td) by multiplicative and additive changes, respectively. For each simulation, we found a series of Px–Td combinations that produced modeled ice extents that satisfactorily matched field evidence. Ice extents shown here use 100 % modern precipitation and temperature depressions of −9.2, −8.0, and −8.5 for the Cut Bank terminal (a), Cut Bank recessional (b), and Absaroka Range model domains, respectively.
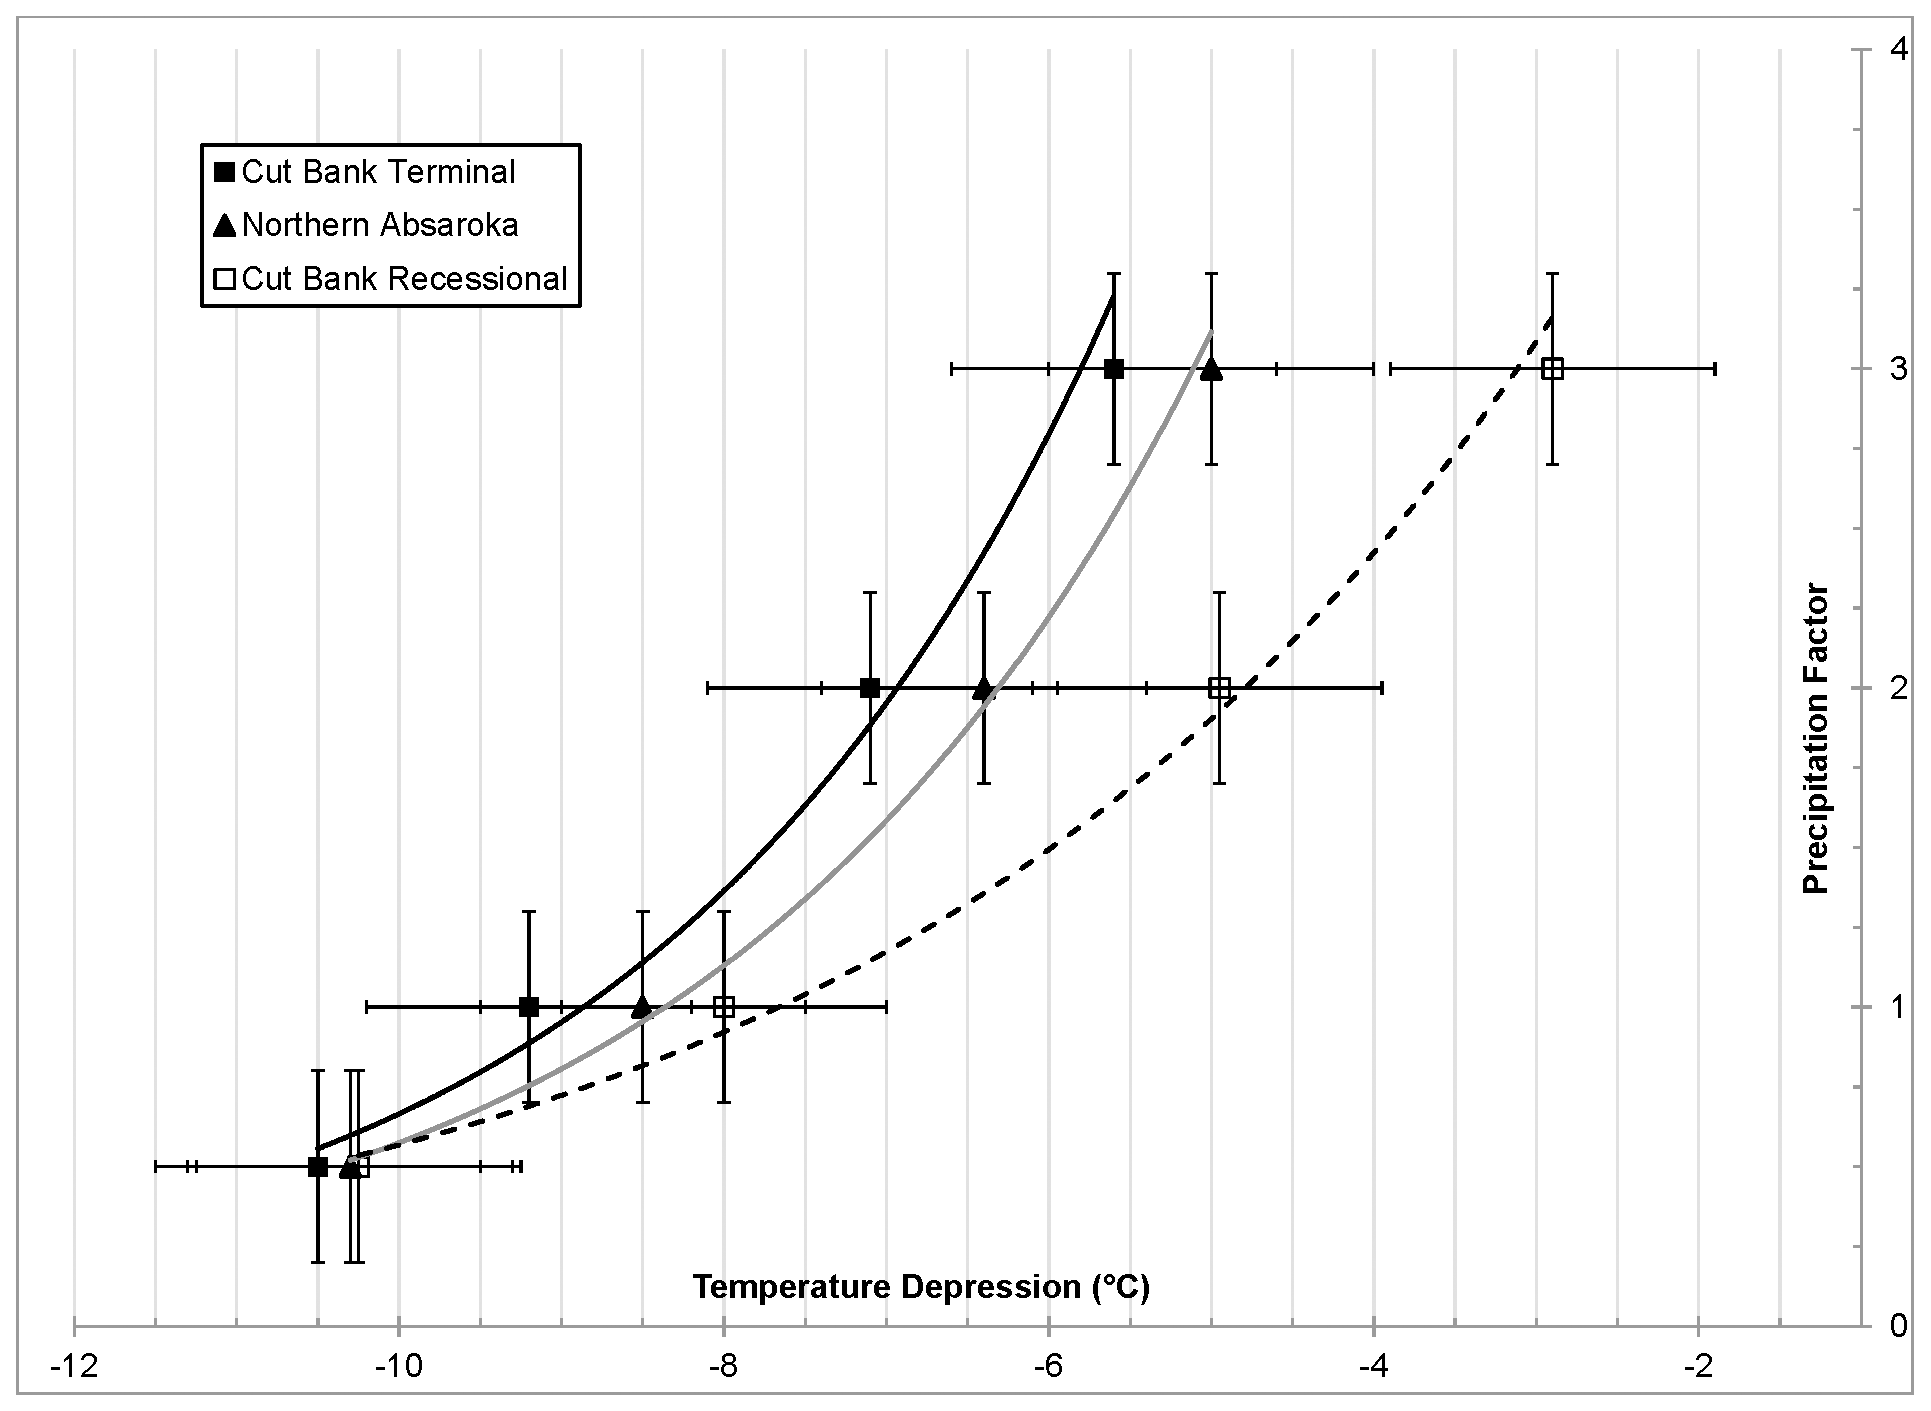
Figure 7Multiplicative precipitation factors and temperature depressions, both with respect to modern, that produced modeled ice extents matching field mapped extents for (1) Cut Bank terminal moraine, (2) northern Absaroka Range Pinedale maxima at Pine Creek and South Fork Deep Creek, and (3) Cut Bank recessional moraine.
As previously mentioned, to match the modeled glacier shape to field evidence at Cut Bank, we found it necessary to effectively set the contribution of ice velocity due to sliding to zero. To test how realistic these model conditions were for reconstructing other glaciers, we reconstructed the Pinedale glacier that occupied Lake Creek Canyon, the drainage immediately to the south of Cut Bank. We matched the modeled glacier to the mapped Pinedale maximum in Lake Creek Canyon with Td–Px combinations of −8 ∘C and 100 % as well as −6 ∘C and 190 % (Fig. S1). These Td–Px combinations are both approximately 1 ∘C warmer than results for Cut Bank's Pinedale maximum glacier given the same precipitation change. However, we find this compelling evidence that the ice-flow parameters we used to reconstruct the Cut Bank Pinedale glacier are reasonable. The temperature discrepancy between the two sites could be (1) a result of temporal offset between the two maxima as we do not have a landform age for the Lake Creek terminal moraine, (2) a real climatic difference between the two catchments, and/or (3) a reflection of unaccounted for modeling error. With regards to the latter, we assume model uncertainties of ±1.0 ∘C and 30 % for temperature and precipitation, respectively, as determined by Quirk et al. (2020) through sensitivity analyses – which would indicate overall agreement between the Cut Bank and Lake Creek simulations.
4.1 Cosmogenic exposure ages of moraines in a regional and global context
The 10Be exposure ages presented here for the South Fork Deep Creek (18.1 ± 0.1 ka) lateral moraine agree well with the landform age from the previously dated lateral moraine in the neighboring Pine Creek valley in the northern Absaroka (10Be exposure age of 18.2 ± 0.5 ka, with the standard error of ages recalculated from Licciardi and Pierce, 2008). The Cascade Creek (16.9 ± 0.1 ka) moraine exhibits a younger age than both the South Fork Deep Creek and Pine Creek moraines. However, and as previously discussed, the Cascade Creek moraine exposure ages should be considered preliminary due to relatively high analytical uncertainties. Although these moraines were deposited by discrete valley glaciers, their exposure ages are similar to the 10Be exposure age of the nearby Eightmile terminal moraine (17.9 ± 0.4 ka, recalculated from Licciardi and Pierce, 2008), the outermost moraine of the last glaciation deposited by the northern outlet glacier of the Yellowstone ice cap, as well as to the age of the Chico moraine (17.1 ± 0.6 ka, recalculated from Licciardi and Pierce, 2008), the initial moraine deposited during recession of this outlet glacier. These ages for the outermost and initial recessional moraines in the northern Yellowstone–northern Absaroka Range area in southwestern Montana are also very similar to those we report here for the terminal (17.2 ± 0.2 ka) and initial recessional (16.4 ± 0.2 ka) moraines at Cut Bank Creek in northwestern Montana. Taken together, these ages suggest that terminal moraines in western Montana were occupied until ca. 18–17 ka and that glaciers were still near their maximum lengths at ca. 17–16 ka in northern Yellowstone and in the Lewis Range, as indicated by exposure ages of the recessional moraines.
Moraines in the northern Absaroka Range have exposure ages that fall within the middle Pinedale interval of 18–16 ka, as identified in the Greater Yellowstone region by Licciardi and Pierce (2018) and after the end of the global LGM (26.5–19.0 ka; Clark et al., 2009). During this time, the Yellowstone glacier system thickened across the Yellowstone Plateau, coalesced with ice masses in some neighboring mountains (such as the Beartooth, High Absaroka, and Gallatin ranges), and formed large outlet lobes, including the northern outlet that terminated just south of the glaciated portion of the northern Absaroka Range (Licciardi and Pierce, 2008, 2018). This large glacier system persisted after the southwestern margin of the Laurentide Ice Sheet in northern Montana began retreating (Dalton et al., 2020) and middle latitudes in the Northern Hemisphere began warming (Shakun et al., 2015). Licciardi and Pierce (2018) suggest that enhanced westerly airflow into the region during the middle Pinedale interval combined with orographic effects of the thickened ice cap augmented precipitation in the northern Yellowstone region. The strengthened westerly airflow across the region likely impacted valley glaciers in the northern Absaroka Range, providing sufficient moisture for glaciers to persist at their maximum lengths despite rising summer insolation at middle latitudes (Laskar et al., 2004) and atmospheric carbon dioxide concentrations (Lüthi et al., 2008). Additionally, middle latitudes in North America may have remained cold for several millennia after the Laurentide Ice Sheet began retreating, as suggested by the persistence of other Rocky Mountain glaciers at near-maximum extents until 17 ka (Laabs et al., 2020) and model-based estimates of the regional temperatures at 17 ka (Liu et al., 2009; He, 2011).
The terminal and recessional moraines in the Lewis Range have exposure ages that also fall within the middle Pinedale interval of 18–16 ka and thus may also have been responding to similar climatic controls as in the Absaroka Range to the south. Alternatively, the post-LGM age of these moraines could be related to the Lewis Range's proximity to the southwestern margin of the Laurentide Ice Sheet. When the Shelby Lobe and other southwestern outlets of the Laurentide Ice Sheet were at their maximum extent, general circulation modeling studies suggest that a large area of high atmospheric pressure developed across the western dome of ice sheet, resulting in anticyclonic easterly airflow along the southern margins (Thompson et al., 1993; Bartlein et al., 1998). This circulation pattern likely resulted in a cold and dry climate in the Lewis Range while the southwestern outlets occupied their terminal moraines. Recent reconstructions of this sector of the Laurentide Ice Sheet suggest that the Shelby Lobe retreated to the northeast by ca. 17 ka (Dalton et al., 2020), which may have been accompanied by a weakening of easterly anticyclonic circulation at the latitude of the Lewis Range and strengthening westerly airflow that delivered moisture-laden air and enhanced precipitation in the mountains. Enhanced precipitation may have resulted in glacier advance to their maximum lengths after the Laurentide Ice Sheet began to retreat. This effect has been suggested by previous studies, including earlier interpretations of the moraine chronologies in the northern Yellowstone region (Licciardi et al., 2001) and age limits on moraines elsewhere in northern interior mountains (Licciardi et al., 2004; Thackray et al., 2004). Licciardi and Pierce (2018) note that the range of terminal-moraine exposure ages in the Yellowstone region includes some that overlap with the early Pinedale interval of 22–18 ka, which includes the latter part of the global Last Glacial Maximum when some southwestern outlets of the Laurentide Ice Sheet were at their maximum size. While the effect of the southwestern Laurentide on regional airflow may not have impacted the Yellowstone region, it may have impacted the Lewis Range as indicated by the exposure ages of the terminal and recessional moraines in Cut Bank valley. Additional age limits on moraines in the Lewis Range, other mountains in northwestern Montana, and the Shelby Lobe will aid in understanding the relative timing of mountain and continental glaciation.
Considering the glacial chronologies presented here in a larger spatial context, the exposure ages of terminal and recessional moraines show some consistency with mountain glacier moraines from elsewhere in the western United States. Elsewhere in the Rocky Mountains, moraines with age limits of ca. 18–17 ka are found in the Sawtooth Range in Idaho (Thackray et al., 2004), the Wasatch and Uinta Mountains in northern Utah, and numerous glacial valleys in the southern Rocky Mountains in Colorado (Leonard et al., 2017a; Brugger et al., 2019a, b; Schweinsberg et al., 2020). Where sequences of moraines are exposure-dated in the Rocky Mountains, the outermost moraines of the last glaciation generally have ages that fall within the early Pinedale interval of 22–18 ka and inner moraines (representing near-maximum glacier lengths) that fall within the middle Pinedale interval (Quirk et al., 2020; Laabs et al., 2020). This pattern is observed throughout the Rocky Mountains and suggests that the mountain glacier moraine chronology in western Montana differs from the rest of the region such that the outermost moraines do not represent the early Pinedale interval and only represent the middle Pinedale interval, suggesting similar or more extensive ice during the middle compared to the early Pinedale. This may reflect the importance of regional climatic effects on mountain glaciation, especially the strengthening of westerly airflow and attendant moisture delivery, as described above.
4.2 Inferred paleoclimate for the last glaciation
Glacier modeling results yielded a series of Px–Td combinations that produced ice extents that closely matched mapping-based reconstructions of the Cut Bank terminal and recessional positions, as well as the terminal positions in the Pine Creek and South Fork Deep Creek valleys (Fig. 7). Our results, particularly at Cut Bank, broadly agree with previous inferences of regional Late Pleistocene climate, including pollen-based reconstructions and other applications of paleo-glaciology (Mumma et al., 2012; Murray and Locke, 1989; Locke, 1990; Birkel et al., 2012). However, to infer changes in precipitation or temperature from our glacier modeling, one of the two variables must be limited independently (i.e., from relevant paleoclimate proxy records). In the following paragraphs, we consider the modeling results in the context of some existing inferences of paleoclimate based on other proxy records in western Montana.
Mumma et al. (2012) presented a paleoclimate record developed from Lower Red Rock Lake in southwestern Montana, alongside a synthesis of other lacustrine records from the region, spanning approximately from the entire LGM time interval (i.e., 26–19 ka) through the early Holocene. The Lower Red Rock Lake chronology is constrained by several 14C ages from organic sediments and wood, plant, and peat material as well as tephrochronology. Recalibration of radiocarbon ages using IntCal13 or 20 (Reimer et al., 2013, 2020) calibration data results in changes to the ages of ≤ 3 % and therefore does not change the interpretations presented by Mumma et al. (2012). Their interpretations of the pollen and sedimentological records indicate that from ca. 28–17 ka, southwestern Montana was dominated by a cold and dry climate. During the subsequent interval of 17.0–10.5 ka, coinciding with regional deglaciation, they suggest that temperatures increased relative to the 28–17 ka period of their record but were still colder than modern and that effective moisture likely increased. Mumma et al. (2012) attributed the rise in precipitation beginning at 17.0 ka to a northward migration of the jet stream and increasing summer insolation. Such a shift in climate at 17 ka may be reflected in the glacial chronology presented here. Increased precipitation commencing at 17 ka may have augmented the mass balance of mountain glaciers, resulting in ice advance to the terminal moraines. A glacier response to increased regional precipitation is consistent with the assertion that increased westerly airflow accompanied glacier growth in the Yellowstone region during the middle Pinedale interval. Alternatively, if the cold and dry climate during the interval 28–17 ka favored mountain glacier maxima, then the shift to a warmer and wetter climate at 17 ka may have initiated ice retreat from terminal moraines.
Reconstructions of the valley glacier that occupied Big Timber Canyon in the Crazy Mountains of western Montana by Murray and Locke (1989) provide additional limits for regional climate during the last glacial culmination. Their glacier model experiments, specifically the low mass balance gradients derived from them, indicate that the climate in the northeastern Crazy Mountains was typical of a cold, dry continental interior, with around 75 % of modern precipitation, when the glacier reached its maximum size, although the specific timing of the glacier maximum here is unknown. Additional work by Locke (1990, 1995) on paleo-glacier reconstructions suggests that last-glaciation equilibrium line altitudes (ELAs) were ∼ 450 m lower but followed a parallel trend to those of modern glacier ELAs, which he interprets to indicate similarities in temperature distributions and westerly airflow across the northern Rocky Mountains of western Montana. By using the difference between modern and Pleistocene ELAs to compute precipitation during the local glacial maximum (for an assumed temperature depression of 10 ∘C), Locke (1990) found that accumulation season precipitation ranged from 50 cm less than modern to 50 cm greater than modern (in units of water equivalent) across mountain ranges in western Montana. However, Locke suggested that based on the overall pattern of ELA change, the climate in western Montana was likely drier during the LGM. If precipitation changes during the last glacial culmination at 18–17 ka were 75 % of modern then our modeling results suggest that the accompanying temperature depression in the northern Absaroka Range and in the Lewis Range was around 8–10 ∘C. The magnitude of regional climate change at 18–17 ka in the Crazy Mountains is unclear, however, and may have differed between the latitudes of glacial valleys in the Lewis Range (48.6∘ N) and that of glacial valleys in the northern Absaroka (45.5∘ N).
While a unique temperature–precipitation combination for the culmination of the Pinedale maximum in western Montana is difficult to infer from glacier modeling results presented here, the consistent timing of the glacial culmination at 18–17 ka – after the Laurentide Ice Sheet began retreating and global LGM – suggests that a regional increase in precipitation during the middle Pinedale interval supported glacier maxima. This is consistent with inferred climate for the last glaciation in the Greater Yellowstone region described by Licciardi and Pierce (2018) and earlier studies inferring that glaciers in northern mountains in the conterminous western United States reached the maximum size after the Laurentide Ice Sheet began retreating (Thackray, 2008), as well as the regional airflow pattern implied by the paleo-glacier reconstructions of Locke (1990, 1995) and pollen records reported by Mumma et al. (2012). If strengthened westerly airflow at 18–17 ka resulted in accumulation season precipitation similar to modern amounts as suggested by regional climate proxies and model output, then a regional temperature depression can be inferred from glacier modeling results presented here. Model simulations of glaciers in the Pine Creek and South Fork Deep Creek valleys suggest a temperature depression of 8.5 ± 1.0 ∘C in southwestern Montana, whereas model simulations of the glacier in Cut Bank Creek valley suggest a temperature depression of 9.2 ± 1.0 ∘C in northwestern Montana. This magnitude of cooling for the last glacial culmination in western Montana is consistent with output of some general circulation models involved in the Paleoclimate Model Intercomparison Project (Phase 3), although these results represent the climate at 21 ka while the Laurentide Ice Sheet was still present in western Montana and reflect average annual temperature depressions, while our models likely reflect mostly changes in summer temperatures. Specifically, the average annual temperature change predicted for western Montana by all PMIP3 ensembles is −12.9 ± 4.9 ∘C (1σ; interpolated by Oster et al., 2015).
4.3 The pace of ice retreat in the Rocky Mountains
Ice-margin retreat rates following the abandonment of Pinedale maximum extents in the northern Rockies are constrained by the cosmogenic exposure age chronology of glacially scoured and striated bedrock from Pine Creek Canyon in the northern Absaroka Range (Fig. 2). First, we emphasize the uncertainty associated with this deglacial chronology from the exclusion of three assumed old and one young outlier from the data set. Furthermore, the sample transect only captures a northern tributary of the Pine Creek glacier (see sample transect in Fig. 2) and may thus not be representative of the larger main-valley glacier system. However, few glaciated valleys in the northern Rockies have age controls sufficient to estimate retreat rates; therefore, the data presented here, while limited, are valuable for inferring rates of deglaciation. Keeping these considerations in mind we can use the data to describe the pattern of deglaciation in the northern Absaroka.
We adapt the age–depth algorithm of Breitenbach et al. (2012) to model glacier age–distance and elevation relationships at Pine Creek (Fig. 8). The algorithm uses a Monte Carlo scheme to estimate age–distance and elevation confidence intervals. We use 10 000 age model realizations with age uncertainty perturbations equal to the exposure age analytical uncertainties. Additionally, all realizations are required to satisfy superposition and morphostratigraphic relationships. The results indicate that median (95 % confidence interval) horizontal ice-margin retreat rates range from 1.6 km ka−1 to approximately 4.7 km ka−1 and vertical retreat rates from 221 to 635 m ka−1. The data also suggest that the main body of ice in the Pine Creek glacier had separated from the northern tributary by ca. 16 ka, and by 13.7 ka, the northern tributary had undergone an 80 % reduction in length and retreated over 1.1 km in elevation from the terminal moraine. The remaining deglacial history of the Pine Creek glacier following the inferred recession around 13.7 ka is not constrained by the cosmogenic chronology reported here.

Figure 8Age–distance (a) and age–elevation (b) ice-retreat models for Pine Creek. Bedrock exposure ages are plotted with analytical uncertainties, while the Pine Creek moraine age uncertainty is shown as the standard error. In both transects, the data are relative to the Pine Creek headwall. Dark curves represent median age models, while dashed lines indicate boundaries of the 95 % confidence interval (CI).
Several studies of glaciated valleys in the western US have sufficient age controls to estimate retreat rates during the last glaciation along a north–south transect of the Rocky Mountains including (Fig. 9) the Pine Creek valley reported here, the Teton Range in Wyoming (Licciardi and Pierce, 2008), the Wasatch Range and Uinta Mountains in northern Utah (Laabs et al., 2011; Munroe and Laabs, 2017; Quirk et al., 2018, 2020), the Front Range (Ward et al., 2009; Dühnforth and Anderson, 2011), Sawatch Range (Briner, 2009; Young et al., 2011; Leonard et al., 2017b; Schweinsberg et al., 2020; Tulenko et al., 2020), and San Juan Range (Guido et al., 2007) in Colorado. Here, we consider vertical retreat rates for all sites to minimize the strong effects valley slope and glacier hypsometry have on apparent rates of retreat.
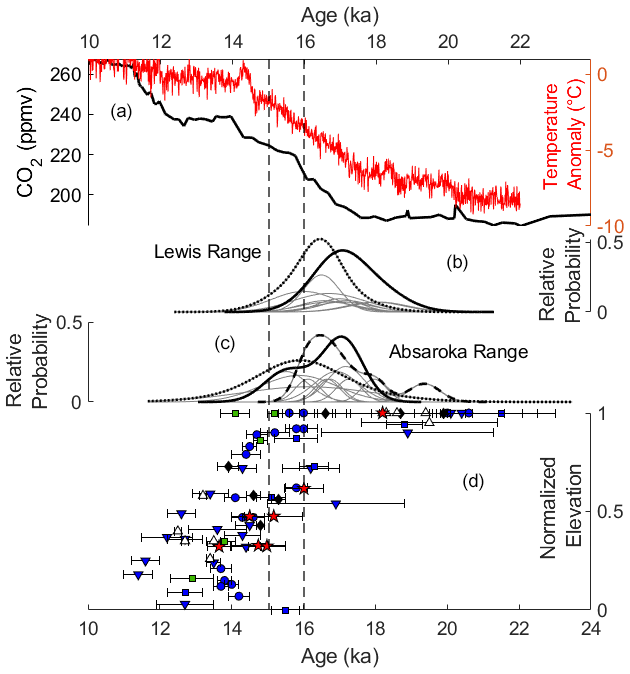
Figure 9(a) Surface temperature anomalies from TRACE-21ka for western North America (Shakun et al., 2015; red) and Epica–Vostok composite CO2 concentrations (Petit et al., 1999; Monnin et al., 2001; Pépin et al., 2001). (b) Camel plots of exposure age data from Cut Bank glacier in the Lewis Range: Cut Bank terminal (solid line) and Cut Bank recessional (dotted line). (c) Absaroka Range: South Fork Deep Creek (solid line), Cascade Creek (dotted line), and Pine Creek (dashed line). (d) Normalized glacier elevation (i.e., 1: terminus, 0: headwall) for Pine Creek glacier in the Absaroka Range (red stars), Teton Range, WY (green boxes), Wasatch Range, UT (black diamonds), Uinta Mountains, UT (white triangles), Front Range, CO (blue inverted triangles), Sawatch Range, CO (blue circles), and San Juan Range, CO (blue squares), based on cosmogenic exposure dating. Dashed vertical lines bracket the approximate timing of the separation of the Laurentide and Cordilleran ice sheets in North America.
Vertical glacier retreat rates exhibit no clear relationship with respect to latitude along a north–south transect from Pine Creek in southern Montana to the San Juan Range in Colorado. Retreat rates for sites in the middle of the transect (Wasatch, Uinta, Front Range) are somewhat lower than rates calculated from the remaining sites and could reflect a response to increased moisture at these latitudes during Heinrich Stadial 1 (e.g., Munroe and Laabs, 2013; Heinrich, 1988). While the timing of initial abandonment of ice-distal positions is variable at sites across the Rockies, which range from the end of the global LGM to ca. 16 ka, the broad pattern and timing of subsequent deglaciation after ca. 16 ka are similar across the Rocky Mountains (Fig. 9).
The timing of terminal-moraine abandonment is variable across the Rocky Mountains and spans a period of around 8 kyr, beginning during the LGM and continuing, such as in the Lewis and Absaroka ranges, into the middle Pinedale (18–16 ka). The large range in glacier retreat from ice-distal positions suggests diverse controlling mechanisms of initial deglaciation across the region. However, the coherence of ice-retreat rates in the Absaroka Range with locations across the Rockies from ca. 16 ka through the late glacial (i.e., 19–11.7 ka; Reitner et al., 2016) suggests common factors driving deglaciation across the region. For example, glacier retreat in the Rocky Mountains after ca. 16 ka coincides with sustained increases in atmospheric CO2 (Petit et al., 1999; Monnin et al., 2001; Pépin et al., 2001) and regional temperature changes despite some glacier retreat lagging behind initial rises in CO2 around 17 ka (Fig. 9). Alternatively or in addition, modeling studies have highlighted the effect North American ice sheets, in particular their demise, have on regional climate (Lora et al., 2016; Tulenko et al., 2020). Specifically, the separation of the Laurentide and Cordilleran ice sheets around 15–16 ka (Dalton et al., 2020) may have led to drier and warmer conditions across western North America (Lora et al., 2016) and may thus have contributed to sustained glacier retreat observed in the Rocky Mountains during this time period (Fig. 9). Whatever the mechanism, the data presented here highlight the dramatic age range of initial terminal-moraine abandonment and regional coherence of sustained glacier retreat throughout the late glacial.
We present cosmogenic exposure ages for moraines in the Absaroka and Lewis ranges of Montana that indicate glacial stadials during the middle Pinedale interval (18–16 ka) and thus after the end of the global LGM. We propose that regionally strengthened westerly airflow and orographic effects associated with the thickening Yellowstone ice cap nourished valley glaciers in the Absaroka Range with precipitation and allowed glaciers to persist at their maximum lengths despite rising summer insolation at middle latitudes (Laskar et al., 2004) and rising atmospheric carbon dioxide concentrations (Lüthi et al., 2008). Similarly in the Lewis Range, glaciers maintained their maximum extents following the retreat of the Shelby Lobe of the Laurentide Ice Sheet by ca. 17 ka (Dalton et al., 2020), which we propose could have been accompanied by a weakening of anticyclonic circulation and strengthening of westerly airflow that effectively increased precipitation in the Lewis Range. If we assume that precipitation during the middle Pinedale was similar to or slightly drier than modern, following a cold and likely much drier than modern early Pinedale–LGM, our model simulations of glaciers in the Absaroka Range suggest a temperature depression around 8.5–9.0 ± 1.0 ∘C, while model simulations of the Cut Bank glacier in the Lewis Range suggest a temperature depression around 9.0–10.0 ± 1.0 ∘C. Ice-retreat rates from Pine Creek in the Absaroka Range broadly coincide with other Rocky Mountain records of glacier retreat and may thus suggest regional controls.
Cosmogenic 10Be exposure age sample, AMS, and chemistry data are available in Tables 1 and S1. Glacier energy–mass balance and ice-flow model code is available upon request.
The supplement related to this article is available online at: https://doi.org/10.5194/cp-18-293-2022-supplement.
BJQ, EH, BJCL, and EL conceived the project with input from JL and MAP. All listed co-authors completed field mapping and sampling. BJQ, EH, and BJCL completed prep work for 10Be exposure dating. MWC assisted with measurement of 10Be 9Be ratios. BJQ completed all glacier modeling with significant input from the other authors. All authors contributed to data and modeling interpretations. BJQ and BJCL wrote the paper.
The contact author has declared that neither they nor their co-authors have any competing interests.
Publisher's note: Copernicus Publications remains neutral with regard to jurisdictional claims in published maps and institutional affiliations.
We thank the reviewers for thoughtful and helpful comments, which greatly improved the paper. We also thank Doug Steen and Alec Spears for help sampling the South Fork Deep Creek and Cascade Creek moraines as well as with preliminary glacier model results.
This paper was edited by Claudio Latorre and reviewed by two anonymous referees.
Alden, W. C.: Physiography and glacial geology of eastern Montana and adjacent areas, US Government Printing Office, https://doi.org/10.3133/pp174, 1932.
Balco, G.: Glacier change and paleoclimate applications of cosmogenic-nuclide exposure dating, Annu. Rev. Earth Pl. Sc., 48, 21–48, 2020.
Balco, G., Stone, J. O., Lifton, N. A., and Dunai, T. J.: A complete and easily accessible means of calculating surface exposure ages or erosion rates from 10Be and 26Al measurements, Quat. Geochronol., 3, 174–195, 2008.
Bartlein, P. J., Anderson, K. H., Anderson, P., Edwards, M., Mock, C., Thompson, R. S., Webb, R. S., Webb III, T., and Whitlock, C.: Paleoclimate simulations for North America over the past 21 000 years: features of the simulated climate and comparisons with paleoenvironmental data, Quaternary Sci. Rev., 17, 549–585, 1998.
Birkel, S. D., Putnam, A. E., Denton, G. H., Koons, P. O., Fastook, J. L., Putnam, D. E., and Maasch, K. A.: Climate inferences from a glaciological reconstruction of the late Pleistocene Wind River ice cap, Wind River Range, Wyoming, Arct. Antarct. Alp. Res., 44, 265–276, 2012.
Blackwelder, E.: Post-Cretaceous history of the mountains of central western Wyoming, J. Geol., 23, 307–340, 1915.
Blackwelder, E.: Pleistocene glaciation in the Sierra Nevada and Basin ranges, Bull. Geol. Soc. Am., 42, 865–922, 1931.
Borchers, B., Marrero, S., Balco, G., Caffee, M., Goehring, B., Lifton, N., Nishiizumi, K., Phillips, F., Schaefer, J., and Stone, J.: Geological calibration of spallation production rates in the CRONUS-Earth project, Quat. Geochronol., 31, 188–198, 2016.
Breitenbach, S. F. M., Rehfeld, K., Goswami, B., Baldini, J. U. L., Ridley, H. E., Kennett, D. J., Prufer, K. M., Aquino, V. V., Asmerom, Y., Polyak, V. J., Cheng, H., Kurths, J., and Marwan, N.: COnstructing Proxy Records from Age models (COPRA), Clim. Past, 8, 1765–1779, https://doi.org/10.5194/cp-8-1765-2012, 2012.
Briner, J. P.: Moraine pebbles and boulders yield indistinguishable 10Be ages: a case study from Colorado, USA, Quat. Geochronol., 4, 299–305, 2009.
Brugger, K. A.: Climate in the southern Sawatch Range and Elk Mountains, Colorado, USA, during the Last Glacial Maximum: inferences using a simple degree-day model, Arct. Antarct. Alp. Res., 42, 164–178, 2010.
Brugger, K. A., Ruleman, C. A., Caffee, M. W., and Mason, C. C.: Climate during the last glacial maximum in the northern Sawatch range, Colorado, USA, Quaternary, 2, 36, https://doi.org/10.3390/quat2040036, 2019a.
Brugger, K. A., Laabs, B., Reimers, A., and Bensen, N.: Late Pleistocene glaciation in the Mosquito Range, Colorado, USA: chronology and climate, J. Quaternary Sci., 34, 187–202, 2019b.
Calhoun, F. H. H.: The Montana lobe of the Keewatin ice sheet, US Government Printing Office, https://doi.org/10.3133/pp50, 1906.
Carrara, P. E.: Holocene and latest Pleistocene glacial chronology, Glacier National Park, Montana, Can. J. Earth Sci., 24, 387–395, 1987.
Carrara, P. E.: Late Quaternary glacial and vegetative history of the Glacier National Park region, Montana, USGPO; For sale by the Books and Open-File Reports Section, US Geological Survey, https://doi.org/10.3133/b1902, 1989.
Carrara, P. E.: A 12 000 year radiocarbon date of deglaciation from the Continental Divide of northwestern Montana, Can. J. Earth Sci., 32, 1303–1307, 1995.
Clark, P. U., Dyke, A. S., Shakun, J. D., Carlson, A. E., Clark, J., Wohlfarth, B., Mitrovica, J. X., Hostetler, S. W., and McCabe, A. M.: The last glacial maximum, Science, 325, 710–714, 2009.
Dahms, D., Egli, M., Fabel, D., Harbor, J., Brandová, D., de Castro Portes, R., and Christl, M.: Revised Quaternary glacial succession and post-LGM recession, southern Wind River Range, Wyoming, USA, Quaternary Sci. Rev., 192, 167–184, 2018.
Dalton, A. S., Margold, M., Stokes, C. R., Tarasov, L., Dyke, A. S., Adams, R. S., Allard, S., Arends, H. E., Atkinson, N., and Attig, J. W.: An updated radiocarbon-based ice margin chronology for the last deglaciation of the North American Ice Sheet Complex, Quaternary Sci. Rev., 234, 106223, https://doi.org/10.1016/j.quascirev.2020.106223, 2020.
Daly, C., Halbleib, M., Smith, J. I., Gibson, W. P., Doggett, M. K., Taylor, G. H., Curtis, J., and Pasteris, P. P.: Physiographically sensitive mapping of climatological temperature and precipitation across the conterminous United States, Int. J. Climatol., 28, 2031–2064, 2008.
Dühnforth, M. and Anderson, R. S.: Reconstructing the glacial history of green lakes valley, North Boulder Creek, Colorado Front Range, Arct. Antarct. Alp. Res., 43, 527–542, 2011.
Fastook, J. L. and Chapman, J. E.: A map-plane finite-element model: three modeling experiments, J. Glaciol., 35, 48–52, 1989.
Fullerton, D. S., Colton, R. B., and Bush, C. A.: Limits of mountain and continental glaciations east of the Continental Divide in northern Montana and north-western North Dakota, USA, in: Developments in Quaternary Sciences, Elsevier, 2, 131–150, https://doi.org/10.1016/S1571-0866(04)80194-5, 2004.
Gilbert, G. K.: Lake Bonneville, United States Geological Survey, https://doi.org/10.3133/m1, 1890.
Guido, Z. S., Ward, D. J., and Anderson, R. S.: Pacing the post–Last Glacial Maximum demise of the Animas Valley glacier and the San Juan Mountain ice cap, Colorado, Geology, 35, 739–742, 2007.
Harrison, S., Rowan, A. V., Glasser, N. F., Knight, J., Plummer, M. A., and Mills, S. C.: Little Ice Age glaciers in Britain: Glacier–climate modelling in the Cairngorm mountains, Holocene, 24, 135–140, 2014.
He, F.: Simulating transient climate evolution of the last deglaciation with CCSM 3, PhD dissertation, University of Wisconsin-Madison, Wisconsin, United States, 185 pp., 2011.
Heinrich, H.: Origin and consequences of cyclic ice rafting in the northeast Atlantic Ocean during the past 130 000 years, Quaternary Res., 29, 142–152, 1988.
Hostetler, S. W. and Clark, P. U.: Climatic controls of western US glaciers at the last glacial maximum, Quaternary Sci. Rev., 16, 505–511, 1997.
Kohl, C. P. and Nishiizumi, K.: Chemical isolation of quartz for measurement of in-situ-produced cosmogenic nuclides, Geochim. Cosmochim. Ac., 56, 3583–3587, 1992.
Laabs, B. J. C., Plummer, M. A., and Mickelson, D. M.: Climate during the last glacial maximum in the Wasatch and southern Uinta Mountains inferred from glacier modeling, Geomorphology, 75, 300–317, 2006.
Laabs, B. J., Refsnider, K. A., Munroe, J. S., Mickelson, D. M., Applegate, P. J., Singer, B. S., and Caffee, M. W.: Latest Pleistocene glacial chronology of the Uinta Mountains: support for moisture-driven asynchrony of the last deglaciation, Quaternary Sci. Rev., 28, 1171–1187, 2009.
Laabs, B. J. C., Marchetti, D. W., Munroe, J. S., Refsnider, K. A., Gosse, J. C., Lips, E. W., Becker, R. A., Mickelson, D. M., and Singer, B. S.: Chronology of latest Pleistocene mountain glaciation in the western Wasatch Mountains, Utah, USA, Quaternary Res., 76, 272–284, 2011.
Laabs, B. J. C., Munroe, J. S., Best, L. C., and Caffee, M. W.: Timing of the last glaciation and subsequent deglaciation in the Ruby Mountains, Great Basin, USA, Earth Planet. Sc. Lett., 361, 16–25, 2013.
Laabs, B. J., Licciardi, J. M., Leonard, E. M., Munroe, J. S., and Marchetti, D. W.: Updated cosmogenic chronologies of Pleistocene mountain glaciation in the western United States and associated paleoclimate inferences, Quaternary Sci. Rev., 242, 106427, https://doi.org/10.1016/j.quascirev.2020.106427, 2020.
Laskar, J., Robutel, P., Joutel, F., Gastineau, M., Correia, A., and Levrard, B.: A long-term numerical solution for the insolation quantities of the Earth, Astron. Astrophys., 428, 261–285, 2004.
Leonard, E. M.: Climatic change in the Colorado Rocky Mountains: Estimates based on modern climate at late Pleistocene equilibrium lines, Arctic Alpine Res., 21, 245–255, 1989.
Leonard, E. M., Plummer, M. A., and Carrara, P. E.: Numerical modeling of the Snowmass Creek paleoglacier, Colorado, and climate in the Rocky Mountains during the Bull Lake glaciation (MIS 6), Quaternary Res., 82, 533–541, 2014.
Leonard, E. M., Laabs, B. J. B., Schweinsberg, A. D., Russell, C. M., Briner, J. P., and Young, N. E.: Deglaciation of the Colorado Rocky Mountains following the last glacial maximum, Cuadernos de Investigación Geográfica, 43, 497–526, 2017a.
Leonard, E. M., Laabs, B. J. C., Plummer, M. A., Kroner, R. K., Brugger, K. A., Spiess, V. M., Refsnider, K. A., Xia, Y., and Caffee, M. W.: Late Pleistocene glaciation and deglaciation in the Crestone Peaks area, Colorado Sangre de Cristo Mountains, USA – chronology and paleoclimate, Quaternary Sci. Rev., 158, 127–144, 2017b.
Licciardi, J. M. and Pierce, K. L.: Cosmogenic exposure-age chronologies of Pinedale and Bull Lake glaciations in greater Yellowstone and the Teton Range, USA, Quaternary Sci. Rev., 27, 814–831, 2008.
Licciardi, J. M. and Pierce, K. L.: History and dynamics of the Greater Yellowstone Glacial System during the last two glaciations, Quaternary Sci. Rev., 200, 1–33, 2018.
Licciardi, J. M., Clark, P. U., Brook, E. J., Pierce, K. L., Kurz, M. D., Elmore, D., and Sharma, P.: Cosmogenic 3He and 10Be chronologies of the late Pinedale northern Yellowstone ice cap, Montana, USA, Geology, 29, 1095–1098, 2001.
Licciardi, J. M., Clark, P. U., Brook, E. J., Elmore, D., and Sharma, P.: Variable responses of western US glaciers during the last deglaciation, Geology, 32, 81–84, 2004.
Lifton, N., Sato, T., and Dunai, T. J.: Scaling in situ cosmogenic nuclide production rates using analytical approximations to atmospheric cosmic-ray fluxes, Earth Planet. Sc. Lett., 386, 149–160, 2014.
Lifton, N., Caffee, M., Finkel, R., Marrero, S., Nishiizumi, K., Phillips, F. M., Goehring, B., Gosse, J., Stone, J., and Schaefer, J.: In situ cosmogenic nuclide production rate calibration for the CRONUS-Earth project from Lake Bonneville, Utah, shoreline features, Quat. Geochronol., 26, 56–69, 2015.
Liu, Z., Otto-Bliesner, B., He, F., Brady, E., Tomas, R., Clark, P., Carlson, A., Lynch-Stieglitz, J., Curry, W., and Brook, E.: Transient simulation of last deglaciation with a new mechanism for Bølling-Allerød warming, Science, 325, 310–314, 2009.
Locke, W. W.: Late Pleistocene glaciers and the climate of western Montana, USA, Arctic Alpine Res., 22, 1–13, 1990.
Locke, W. W.: Modelling of icecap glaciation of the northern Rocky Mountains of Montana, Geomorphology, 14, 123–130, 1995.
Lora, J. M., Mitchell, J. L., and Tripati, A. E.: Abrupt reorganization of North Pacific and western North American climate during the last deglaciation, Geophys. Res. Lett., 43, 11796–11804, 2016.
Lüthi, D., Le Floch, M., Bereiter, B., Blunier, T., Barnola, J.-M., Siegenthaler, U., Raynaud, D., Jouzel, J., Fischer, H., and Kawamura, K.: High-resolution carbon dioxide concentration record 650 000–800 000 years before present, Nature, 453, 379–382, 2008.
Marcott, S. A., Clark, P. U., Shakun, J. D., Brook, E. J., Davis, P. T., and Caffee, M. W.: 10Be age constraints on latest Pleistocene and Holocene cirque glaciation across the western United States, npj Climate and Atmospheric Science, 2, 1–7, 2019.
Mark, B. G. and Fernández, A.: The significance of mountain glaciers as sentinels of climate and environmental change, Geography Compass, 11, e12318, https://doi.org/10.1111/gec3.12318, 2017.
McCoy, W. D., Williams, L. D., Kay, P. A., and Diaz, H. F.: Application of an energy-balance model to the late Pleistocene Little Cottonwood Canyon glacier with implications regarding the paleohydrology of Lake Bonneville, Problems of and prospects for predicting Great Salt Lake levels: Salt Lake City, University of Utah, 40–53, 1985.
Monnin, E., Indermühle, A., Dällenbach, A., Flückiger, J., Stauffer, B., Stocker, T. F., Raynaud, D., and Barnola, J.-M.: Atmospheric CO2 concentrations over the last glacial termination, Science, 291, 112–114, 2001.
Mumma, S. A., Whitlock, C., and Pierce, K.: A 28 000 year history of vegetation and climate from Lower Red Rock Lake, Centennial Valley, southwestern Montana, USA, Palaeogeogr. Palaeocl., 326, 30–41, 2012.
Munroe, J. S. and Laabs, B. J.: Temporal correspondence between pluvial lake highstands in the southwestern US and Heinrich Event 1, J. Quaternary Sci., 28, 49–58, 2013.
Munroe, J. S. and Laabs, B. J. C.: Combining radiocarbon and cosmogenic ages to constrain the timing of the last glacial-interglacial transition in the Uinta Mountains, Utah, USA, Geology, 45, 171–174, 2017.
Murray, D. R. and Locke, W. W.: Dynamics of the late Pleistocene Big Timber Glacier, Crazy Mountains, Montana, USA, J. Glaciol., 35, 183–190, 1989.
Muzikar, P., Elmore, D., and Granger, D. E.: Accelerator mass spectrometry in geologic research, Geol. Soc. Am. Bull., 115, 643–654, 2003.
Nishiizumi, K., Imamura, M., Caffee, M. W., Southon, J. R., Finkel, R. C., and McAninch, J.: Absolute calibration of 10Be AMS standards, Nucl. Instrum. Meth. B, 258, 403–413, 2007.
Oerlemans, J.: On the response of valley glaciers to climatic change, in: Glacier fluctuations and climatic change, Springer, 353–371, https://doi.org/10.1007/978-94-015-7823-3_23, 1989.
Oerlemans, J.: Extracting a climate signal from 169 glacier records, Science, 308, 675–677, 2005.
Oster, J. L., Ibarra, D. E., Winnick, M. J., and Maher, K.: Steering of westerly storms over western North America at the Last Glacial Maximum, Nat. Geosci., 8, 201–205, 2015.
Pépin, L., Raynaud, D., Barnola, J., and Loutre, M. F.: Hemispheric roles of climate forcings during glacial-interglacial transitions as deduced from the Vostok record and LLN-2D model experiments, J. Geophys. Res.-Atmos., 106, 31885–31892, 2001.
Petit, J.-R., Jouzel, J., Raynaud, D., Barkov, N. I., Barnola, J.-M., Basile, I., Bender, M., Chappellaz, J., Davis, M., and Delaygue, G.: Climate and atmospheric history of the past 420 000 years from the Vostok ice core, Antarctica, Nature, 399, 429–436, 1999.
Pierce, K. L.: Surficial geologic map of the Mammoth quadrangle and part of the Gardiner quadrangle, Yellowstone National Park, Wyoming and Montana, US Geological Survey, https://doi.org/10.3133/i641, 1973.
Pierce, K. L.: History and dynamics of glaciation in the northern Yellowstone National Park area: U.S. Geological Survey Professional Paper 729-F, 90 pp., https://doi.org/10.3133/pp729F, 1979.
Pierce, K. L.: Pleistocene glaciations of the Rocky Mountains, Developments in Quaternary Sciences, 1, 63–76, 2003.
Pierce, K. L., Licciardi, J. M., Good, J. M., and Jaworowski, C.: Pleistocene glaciation of the Jackson Hole area, Wyoming, US Geological Survey, 2330-7102, https://doi.org/10.3133/pp1835, 2018.
Plummer M. A.: Paleoclimate conditions during the last deglaciation inferred from combined analysis of pluvial and glacial records, PhD dissertation, New Mexico Institute of Mining and Technology, Socorro, New Mexico, United States, 346 pp., 2002.
Plummer, M. A. and Phillips, F. M.: A 2-D numerical model of snow/ice energy balance and ice flow for paleoclimatic interpretation of glacial geomorphic features, Quaternary Sci. Rev., 22, 1389–1406, 2003.
Porter, S. C., Pierce, K. L., and Hamilton, T. D.: Late Wisconsin mountain glaciation in the western United States, in: Late Quaternary environments of the United States, Volume 1, edited by: Porter, S. C., The late Pleistocene: Minneapolis, University of Minnesota Press, 71–114, ISBN 9780816611713, 1983.
Putnam, A. E., Denton, G. H., Schaefer, J. M., Barrell, D. J. A., Andersen, B. G., Finkel, R. C., Schwartz, R., Doughty, A. M., Kaplan, M. R., and Schlüchter, C.: Glacier advance in southern middle-latitudes during the Antarctic Cold Reversal, Nat. Geosci., 3, 700–704, 2010.
Quirk, B. J., Moore, J. R., Laabs, B. J. C., Caffee, M. W., and Plummer, M. A.: Termination II, last glacial maximum, and lateglacial chronologies and paleoclimate from Big Cottonwood Canyon, Wasatch Mountains, Utah, Geol. Soc. Am. Bull., 130, 1889–1902, 2018.
Quirk, B. J., Moore, J. R., Laabs, B. J. C., Plummer, M. A., and Caffee, M. W.: Latest Pleistocene glacial and climate history of the Wasatch Range, Utah, Quaternary Sci. Rev., 238, 106313, https://doi.org/10.1016/j.quascirev.2020.106313, 2020.
Refsnider, K. A., Laabs, B. J., Plummer, M. A., Mickelson, D. M., Singer, B. S., and Caffee, M. W.: Last glacial maximum climate inferences from cosmogenic dating and glacier modeling of the western Uinta ice field, Uinta Mountains, Utah, Quaternary Res., 69, 130–144, 2008.
Reimer, P. J., Bard, E., Bayliss, A., Beck, J. W., Blackwell, P. G., Ramsey, C. B., Buck, C. E., Cheng, H., Edwards, R. L., and Friedrich, M.: IntCal13 and Marine13 radiocarbon age calibration curves 0–50 000 years cal BP, Radiocarbon, 55, 1869–1887, 2013.
Reimer, P. J., Austin, W. E. N., Bard, E., Bayliss, A., Blackwell, P. G., Ramsey, C. B., Butzin, M., Cheng, H., Edwards, R. L., and Friedrich, M.: The IntCal20 Northern Hemisphere radiocarbon age calibration curve (0–55 cal kBP), Radiocarbon, 62, 725–757, 2020.
Reitner, J. M., Ivy-Ochs, S., Drescher-Schneider, R., Hajdas, I., and Linner, M.: Reconsidering the current stratigraphy of the Alpine Lateglacial: Implications of the sedimentary and morphological record of the Lienz area (Tyrol/Austria), E&G Quaternary Sci. J., 65, 113–144, https://doi.org/10.3285/eg.65.2.02, 2016.
Rowan, A. V., Brocklehurst, S. H., Schultz, D. M., Plummer, M. A., Anderson, L. S., and Glasser, N. F.: Late Quaternary glacier sensitivity to temperature and precipitation distribution in the Southern Alps of New Zealand, J. Geophys. Res.-Earth, 119, 1064–1081, 2014.
Schweinsberg, A. D., Briner, J. P., Licciardi, J. M., Shroba, R. R., and Leonard, E. M.: Cosmogenic 10Be exposure dating of Bull Lake and Pinedale moraine sequences in the upper Arkansas River valley, Colorado Rocky Mountains, USA, Quaternary Res., 97, 125–139, 2020.
Shakun, J. D., Clark, P. U., He, F., Lifton, N. A., Liu, Z., and Otto-Bliesner, B. L.: Regional and global forcing of glacier retreat during the last deglaciation, Nat. Commun., 6, 1–7, 2015.
Sharma, P., Bourgeois, M., Elmore, D., Granger, D., Lipschutz, M. E., Ma, X., Miller, T., Mueller, K., Rickey, F., Simms, P., and Vogt, S.: PRIME lab AMS performance, upgrades and research applications, Nucl. Instrum. Meth. B, 172, 112–123, 2000.
Stone, J. O.: Air pressure and cosmogenic isotope production, J. Geophys. Res.-Sol. Ea., 105, 23753–23759, 2000.
Thackray, G. D.: Varied climatic and topographic influences on Late Pleistocene mountain glaciation in the western United States, J. Quaternary Sci., 23, 671–681, 2008.
Thackray, G. D., Lundeen, K. A., and Borgert, J. A.: Latest Pleistocene alpine glacier advances in the Sawtooth Mountains, Idaho, USA: reflections of midlatitude moisture transport at the close of the last glaciation, Geology, 32, 225–228, 2004.
Thompson, R. S., Whitlock, C., Bartlein, P. J., Harrison, S. P., Spaulding, W. G., Wright, H., Kutzbach, J., Webb, T., Ruddiman, W., and Street-Perrott, F.: Climatic changes in the western United States since 18 000 yr BP, Global climates since the last glacial maximum, NED-New edition, University of Minnesota Press, 468–513, eISBN 978-0-8166-8462-5, 1993.
Tulenko, J. P., Lofverstrom, M., and Briner, J. P.: Ice sheet influence on atmospheric circulation explains the patterns of Pleistocene alpine glacier records in North America, Earth Planet. Sc. Lett., 534, 116115, https://doi.org/10.1016/j.epsl.2020.116115, 2020.
Ward, D. J., Anderson, R. S., Guido, Z. S., and Briner, J. P.: Numerical modeling of cosmogenic deglaciation records, Front Range and San Juan mountains, Colorado, J. Geophys. Res.-Earth, 114, F01026, https://doi.org/10.1029/2008JF001057, 2009.
Weed, W. H.: The glaciation of the Yellowstone Valley north of the Park, US Geological Survey, https://doi.org/10.3133/b104, 1893.
Whipple, J., Connor, J., Raup, O., McGimsey, R., McBane, J., and Garrison, P.: Preliminary report on the stratigraphy of the Belt Supergroup, Glacier National Park and adjacent Whitefish Range, Montana, Northwest Montana and adjacent Canada, in: Guidebook, edited by: McBane, J. D. and Garrison, P. B., Field Conference and Symposium, Belt Association, Pocatello, Idaho, Montana Geol. Soc., 33–50, 1984.
Young, N. E., Briner, J. P., Leonard, E. M., Licciardi, J. M., and Lee, K.: Assessing climatic and nonclimatic forcing of Pinedale glaciation and deglaciation in the western United States, Geology, 39, 171–174, 2011.
Zientek, M. L., Derkey, P. D., Miller, R. J., Causey, J. D., Bookstrom, A. A., Carlson, M. H., Green, G. N., Frost, T. P., Boleneus, D. E., and Evans, K. V.: Spatial databases for the geology of the Northern Rocky Mountains-Idaho, Montana, and Washington, US Geological Survey Open-File Report, 1235, 201, http://pubs.usgs.gov/of/2005/1235/ (last access: 20 January 2021), 2005.