the Creative Commons Attribution 4.0 License.
the Creative Commons Attribution 4.0 License.
 | 05 Dec 2022
Ring-width and blue-light chronologies of Podocarpus lawrencei from southeastern mainland Australia reveal a regional climate signal
Jacinda A. O'Connor
Matthew T. Brookhouse
Kathryn J. Allen
High-resolution palaeoclimate proxies are fundamental to our understanding of the diverse climatic history of the Australian mainland, particularly given the deficiency in instrumental datasets spanning more than a century. Annually resolved, tree-ring-based proxies play a unique role in addressing limitations in our knowledge of interannual to multi-decadal temperature and hydroclimatic variability prior to the instrumental period. Here we present cross-dated ring-width (RW) and minimum blue-intensity (BI) chronologies spanning 70 years (1929–1998) for Podocarpus lawrencei Hook.f., the Australian mainland's only alpine conifer, based on nine full-disc cross-sections from Mount Loch in the Victorian Alps. Correlations with climate variables from observation stations and gridded data across the 1929–1998 period reveal a significant positive relationship between RW and mean monthly maximum temperatures in winter throughout central Victoria (r=0.62, p<0.001) and a significant negative correlation to winter precipitation (, p<0.001). We also found significant negative correlations between RW and monthly snow depth at Spencer Creek in New South Wales (, p<0.001). Of the assessed BI parameters, delta blue intensity (ΔBI; the difference between early- and late-wood BI) displayed the greatest sensitivity to climate, with robust spatial correlations with mean October to December maximum and minimum monthly temperatures (, p<0.001; , p<0.001) and July precipitation (r=0.44, p<0.001), across large areas of northern Victoria. These promising findings highlight the utility of this species for future work. With the very limited availability of suitable long-lived and cross-datable species on the Australian mainland, these results have significant implications for advancing high-resolution palaeoclimate science in southeastern Australia and for improving our understanding of past climate in the region.
- Article
(12306 KB) - Full-text XML
- BibTeX
- EndNote


The documentation of climatic variations in the Northern Hemisphere (NH) is notably more comprehensive than that of the Southern Hemisphere (SH). Differences in the distribution of oceans and landmasses as well as disparities related to cultural and historical development continue to impair our understanding of SH climate (Villalba, 2000). A complete understanding of the climatic behaviour in a particular hemisphere is not possible without a thorough comprehension of the other (Pittock, 1978). That is, addressing the lack of SH climate knowledge is also a component of understanding NH and global climate.
The Australian continent encompasses a vast geographical extent with a diverse range of climate zones (Pittock, 2003). Instrumental and historical records of climate variables such as temperature and precipitation rarely extend beyond the start of the 20th century (Bureau of Meteorology, 2001). Palaeoclimate proxies provide an important extension of the instrumental record and aid in the development of meaningful assessments of the context of recent climate extremes and the fundamental nature of low-frequency climate variability. Dendroclimatology, the study of tree rings as a source of palaeoclimate proxies, has played an increasingly important role in our understanding of long-term climatic changes. Tree-ring studies have been widely applied, particularly in temperate environments, to produce centennial-scale climate information at annual resolution (e.g. Villalba et al., 1996; Esper et al., 2002; Cook et al., 2006). However, progress in Australian dendroclimatology has been historically challenging due to the sparse availability of suitable materials and sites (Cook et al., 2006). Materials that exhibit annual growth rings are limited (Heinrich and Allen, 2013), and many do not live to sufficient ages for the development of multi-century records (Ogden, 1978, 1981). Suitable environments for the preservation of subfossil material are also lacking in most parts of the Australian continent. Despite these setbacks, efforts to expand our knowledge of the climatic influences on mainland Australian flora are pivotal to understanding the current and future impacts of climate change.
The Australian Alps constitute mainland Australia's alpine and subalpine regions. Tree species at their altitudinal threshold, such as those growing in high-altitude and/or high-latitude sites, are typically highly sensitive to variability in climate and therefore tend to best lend themselves to reconstructions (e.g. Villalba et al., 1994; Frank and Esper, 2005; Larocque and Smith, 2005). Alpine tree species are hence important sources of local palaeoclimate proxies, and reconstructions based on upper-elevation sites have revealed a regional climate signature (e.g. Mt Read, Tasmania; Cook et al., 2000). Long-term reconstructions for mainland Australia that are based on in situ, annually resolved records (rather than remote proxies) are very limited (O'Donnell et al., 2021; Cullen and Grierson, 2008; Allen et al., 2020; notably these are all hydroclimate reconstructions). Given the strong influence of temperature as a limiting growth factor in higher-elevation areas, the Australian Alps and Victoria's central highlands are prime contenders to further validate the regional nature of these signatures back in time. Dendroclimatological studies within the Australian Alps thus far have focused on the widely distributed genus Eucalyptus, which exhibits clear annual rings at high elevations due to the strong growth limitation of winter temperatures (Brookhouse et al., 2008; Brookhouse and Bi, 2009). However, frequent mortality of specimens due to recurring fires in eucalypt habitats limits the availability of individuals of an adequate age for long-term study. Given that continuous high-quality climate records throughout the Australian Alps seldom extend beyond several decades, exploration of additional climate-sensitive species with greater longevity and less affected by fire would be beneficial.
At high elevation, fire rarely penetrates into rock-scree environments. Due to the protection these environments offer from fire, the age of vegetation growing within scree slopes can greatly exceed that of surrounding communities (Schweingruber, 1992). In the alpine environments of New South Wales and Victoria, rock-scree sites often support pure stands of Podocarpus lawrencei Hook.f. (Williams et al., 2008). In these locations, P. lawrencei occurs as a procumbent shrub and may attain an age of >500 years (Costin et al., 2000). Analysis of P. lawrencei revealed well-defined, annual growth rings and highly sensitive latewood bands, suggesting a promising opportunity for dendroclimatological study (Schweingruber, 1992). However, attempts to generate chronologies for dendroclimatological analysis have been limited. Podocarpus lawrencei exhibits highly eccentric (lobate) radial growth behaviour, with rings frequently affected by, or completely lost to, wedging. These abnormalities make dating of core samples difficult, necessitating the collection of entire stem cross-sections. While the destructive nature of collecting full cross-sections normally prevents their acquisition, sample materials became available following widespread fires in 2002/03 in the Australian Alps. The severity of these fires meant previously protected stands of fire-sensitive P. lawrencei were killed, allowing the collection of full-disc cross-sections from multiple sites and an initial investigation into their dendroclimatological potential (McDougall et al., 2012).
Although dendroclimatology has traditionally relied upon ring-width (RW) data, an array of alternative tree-ring proxies also offer insights into climate histories. Maximum latewood density (MXD), for instance, represents the greatest density in cells formed at the latest stage of the growing season (Schweingruber, 1988). Maximum latewood density has been widely used as a robust tree-ring proxy for growing-season temperature, particularly in the NH summer (e.g. Briffa et al., 1988; D'Arrigo et al., 2000; Davi et al., 2003). However, the considerable cost and effort associated with generating MXD chronologies has hindered their development and utilisation, especially in regions of the world in which dendroclimatology is uncommon. The blue-intensity (BI) technique – a recently developed approach that quantifies the intensity of blue light reflected from a wood surface (McCarroll et al., 2002) – offers a cheaper and efficient surrogate for MXD (Björklund et al., 2014; Wilson et al., 2014). Several experimental studies have demonstrated a strong, negative relationship between BI and MXD, and sample preparation and generation of BI data can be performed at comparatively low expense (Campbell et al., 2007, 2011; McCarroll et al., 2002; Björklund et al., 2014).
Although the application of the BI method has been largely restricted to NH conifers, Brookhouse and Graham (2016) conducted a preliminary assessment on the suitability of the BI method on P. lawrencei specimens from Mount Buller in alpine NE Victoria (37.15∘ S, 144.44∘ E). They reported a highly significant correlation between the resulting BI chronology and mean August–April temperature maxima (, p<0.0001). The strength of this relationship greatly exceeded that of RW. The BI method, then, may offer a superior source of climate-sensitive chronologies within the Australian Alps. Applying this technique to Australian species may be the key to significantly improving our understanding of interannual to multi-decadal climate variability prior to the instrumental period (Wilson et al., 2021). Together with existing palaeoclimatological studies, an expansion of this work could provide a critical baseline for temperature and hydroclimate prior to the industrial era and major land-use changes following European arrival.
This study will report P. lawrencei RW and BI chronologies based on sampled material from a previously unexplored site (Mt Loch) in the Victorian Alps (Fig. 1). This study will further build upon the existing works of McDougall et al. (2012) and Brookhouse and Graham (2016) by investigating the sensitivity of the RW and BI chronologies to climate variability, as well as the spatial signature of these relationships. It will additionally discuss the potential contributions of P. lawrencei in the advancement towards building reliable, multi-centennial-scale reconstructions for southeastern Australia and a strong dendroclimatic network throughout the Australian Alps.

Figure 1Left: location of Mt Loch sample site and main meteorological stations and P. lawrencei study sites from previous works (Mt Blue Cow and Schlinks Pass: McDougall et al., 2012; Mt Buller: Brookhouse and Graham, 2016). Right: (a) Highly prostrate growth of fire-killed P. lawrencei stands from the same locality. (b) Mt Loch boulder field on rock-scree slope, from which samples for this study were collected. Images taken by Matthew Brookhouse (the Australian National University (ANU)).
2.1 Sampling site
The fire-killed P. lawrencei samples employed in this study were collected from Mt Loch (36.96∘ S, 147.16∘ E) in 2007. Many P. lawrencei communities at the Mt Loch site were subjected to severe disturbance resulting from extensive bushfires throughout the southeast Australian mainland in January 2003, allowing for the collection of full-stem cross-sections. The sample site comprises a steep, south-facing rock-scree slope at ∼1800 m elevation (Fig. 1). The climate at Mt Loch, indicated by the nearby (<2 km distance) Mt Hotham meteorological station, exhibits strong seasonality in temperature due to its high altitude (Fig. 2a) and is characterised by cold winter conditions with consistent July to October snow cover (Wahren et al., 2001; Venn and Morgan, 2007). Such environments host numerous P. lawrencei communities throughout the Australian Alps (McDougall et al., 2012; Brookhouse and Graham, 2016). A total of nine stem cross-sections of up to 13 cm in diameter were examined in this study.
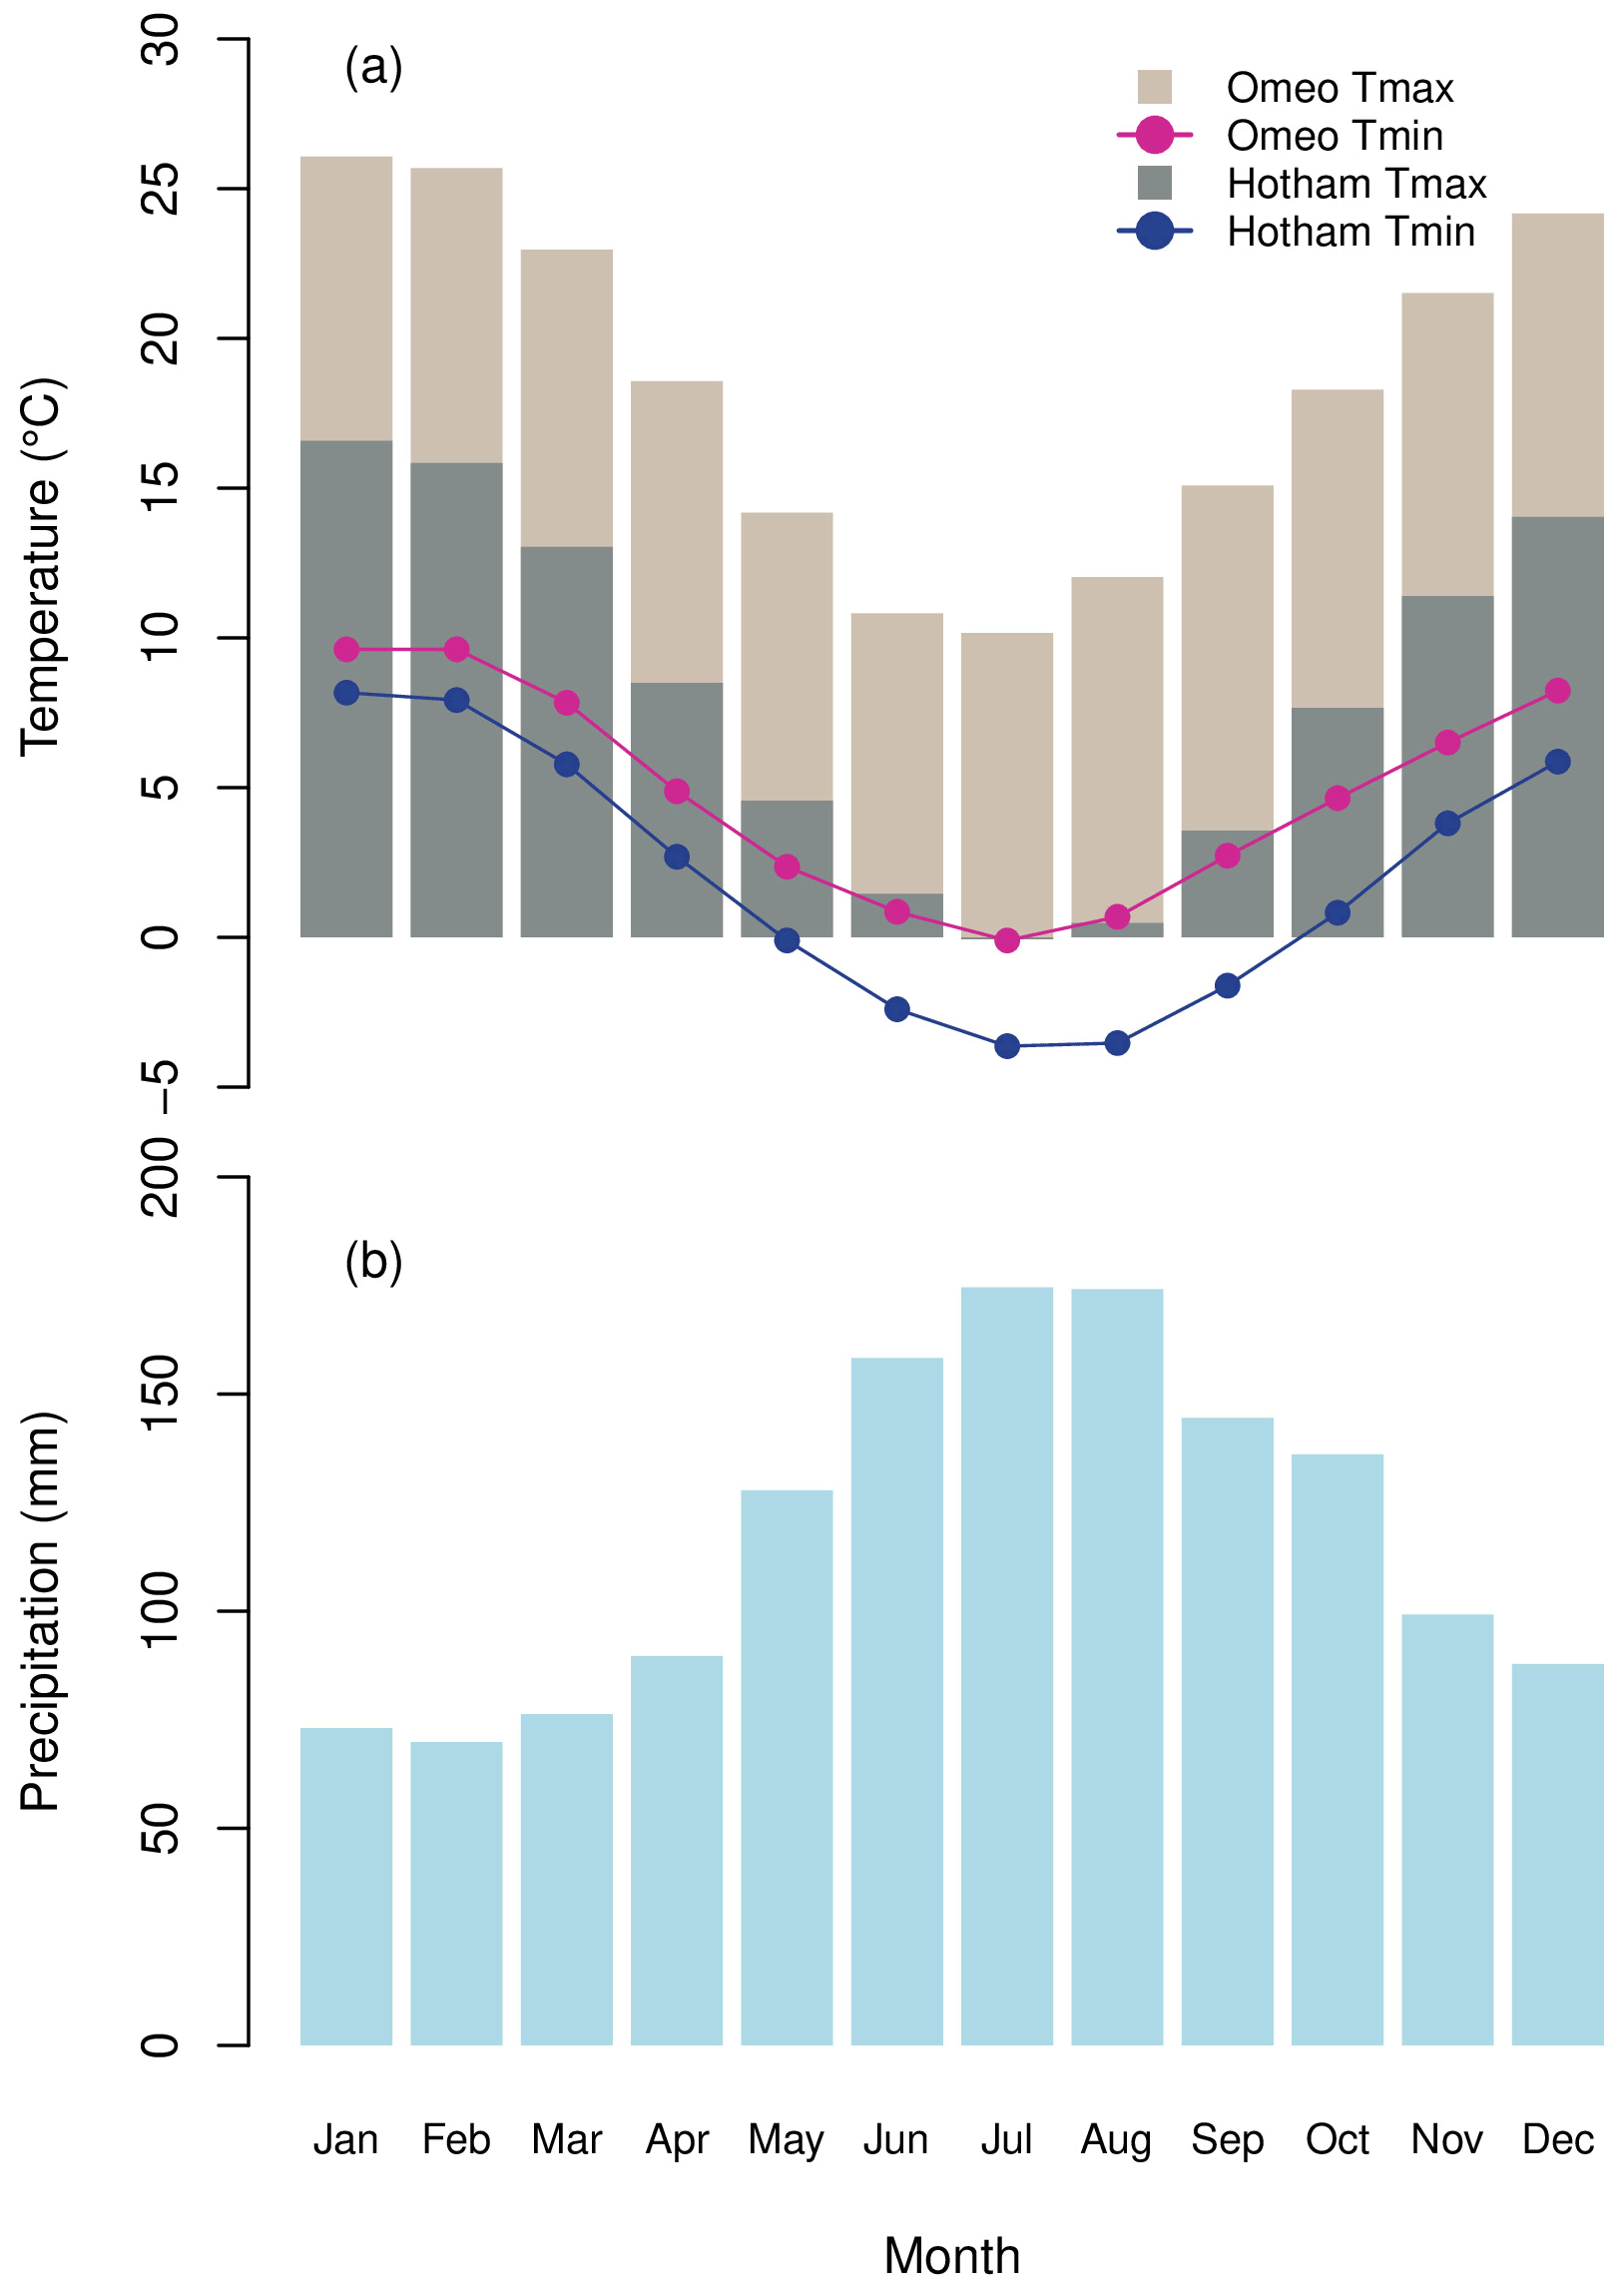
Figure 2(a) Mean monthly maximum and minimum air temperature at Omeo and Mt Hotham meteorological stations. (b) Mean monthly precipitation at Harrietville meteorological station.
2.2 Sample preparation
A transverse surface of each sample was initially flattened using a belt sander to produce a surface uniformly perpendicular to the tree-ring boundaries. Prior to scanning, resins and other extractives were removed. Because the BI technique relies upon reflected light, staining unrelated to wood formation can alter reflectance and associations with climate data. To overcome these problems, resins and stains that discolour materials are extracted in a process that may exceed 30 h for each sample. These extraction processes typically rely on a Soxhlet apparatus and a hazardous extraction solution. Previous analysis of P. lawrencei (see Brookhouse and Graham, 2016) refluxed radial laths in a Soxhlet apparatus and ethanol / toluene solution for up to 42 h. As an alternative to Soxhlet extraction, samples in this study were soaked in pure acetone. This method allows for the preparation of entire discs, which is highly advantageous given the lobate growth behaviour of P. lawrencei. Preliminary experiments using acetone treatment for resin removal (Frith, 2009) suggest a minimum required extraction time of 72 h for partially immersed 5 mm thick Pinus sylvestris L. cores. Subsequent applications of the same technique have revealed the majority of extractives are removed from fully immersed samples after just 48 h of treatment (Rydval et al., 2014). Moreover, the heartwood–sapwood colour difference may be addressed by measuring the difference between minimum and maximum BI (ΔBI) as an addition or alternative to standard BI methods, which may provide a data source that increases the climate sensitivity of BI data and eliminates the need for extraction.
A sub-sample of three discs was used in this study to assess the efficacy of acetone treatment on full cross-sections of P. lawrencei. Three samples, ranging from 7–13 cm in diameter and approximately 1 cm thick, were submerged in 100 % acetone in air-tight glass containers at room temperature for an initial 120 h period, followed by an additional 48 h of immersion. Each sample was sanded to a 2000 grit (9.5–11.1 µm) finish after each extraction stage. When the samples surfaces were free of scratches they were scanned on an Epson Perfection V850 Pro scanner using SilverFast Ai professional software, at a resolution of 4800 dots per inch (dpi). An IT8 Calibration Target (IT8.7/2) was used to calibrate the scanner to ensure the comparable reproduction of colours and brightness between scans (Campbell et al., 2011). After experimentation with different soaking times, the remaining six cross-sections were soaked in acetone for the optimal 120 h period prior to the development of ΔBI, earlywood (EWBI) and latewood BI (LWBI) chronologies.
The highly lobate radial growth of P. lawrencei and extensive ring wedging (Fig. 3) made it necessary to measure multiple axes of measurement from all samples. Ring-width (RW) measurements were produced using the program CooRecorder™ and visual cross-dating was undertaken on CDendro™, with the additional aid of separate microscope magnification of the wood surface and correlation analysis on the Dendrochronology Program Library in R (dplR: Bunn, 2008, 2010). Blue intensity reflectance parameters (delta BI (ΔBI), earlywood BI (EWBI) and latewood BI (LWBI)) were measured along the same paths used for our RW measurement. The Mt Loch RW chronology was then cross-dated against a remotely located P. lawrencei RW chronology developed by Brookhouse and Graham (2016) from Mount Buller (67 km southwest of the Mt Loch study site) over a 79-year overlapping period (1906–1985, r=0.72) to corroborate our dating.
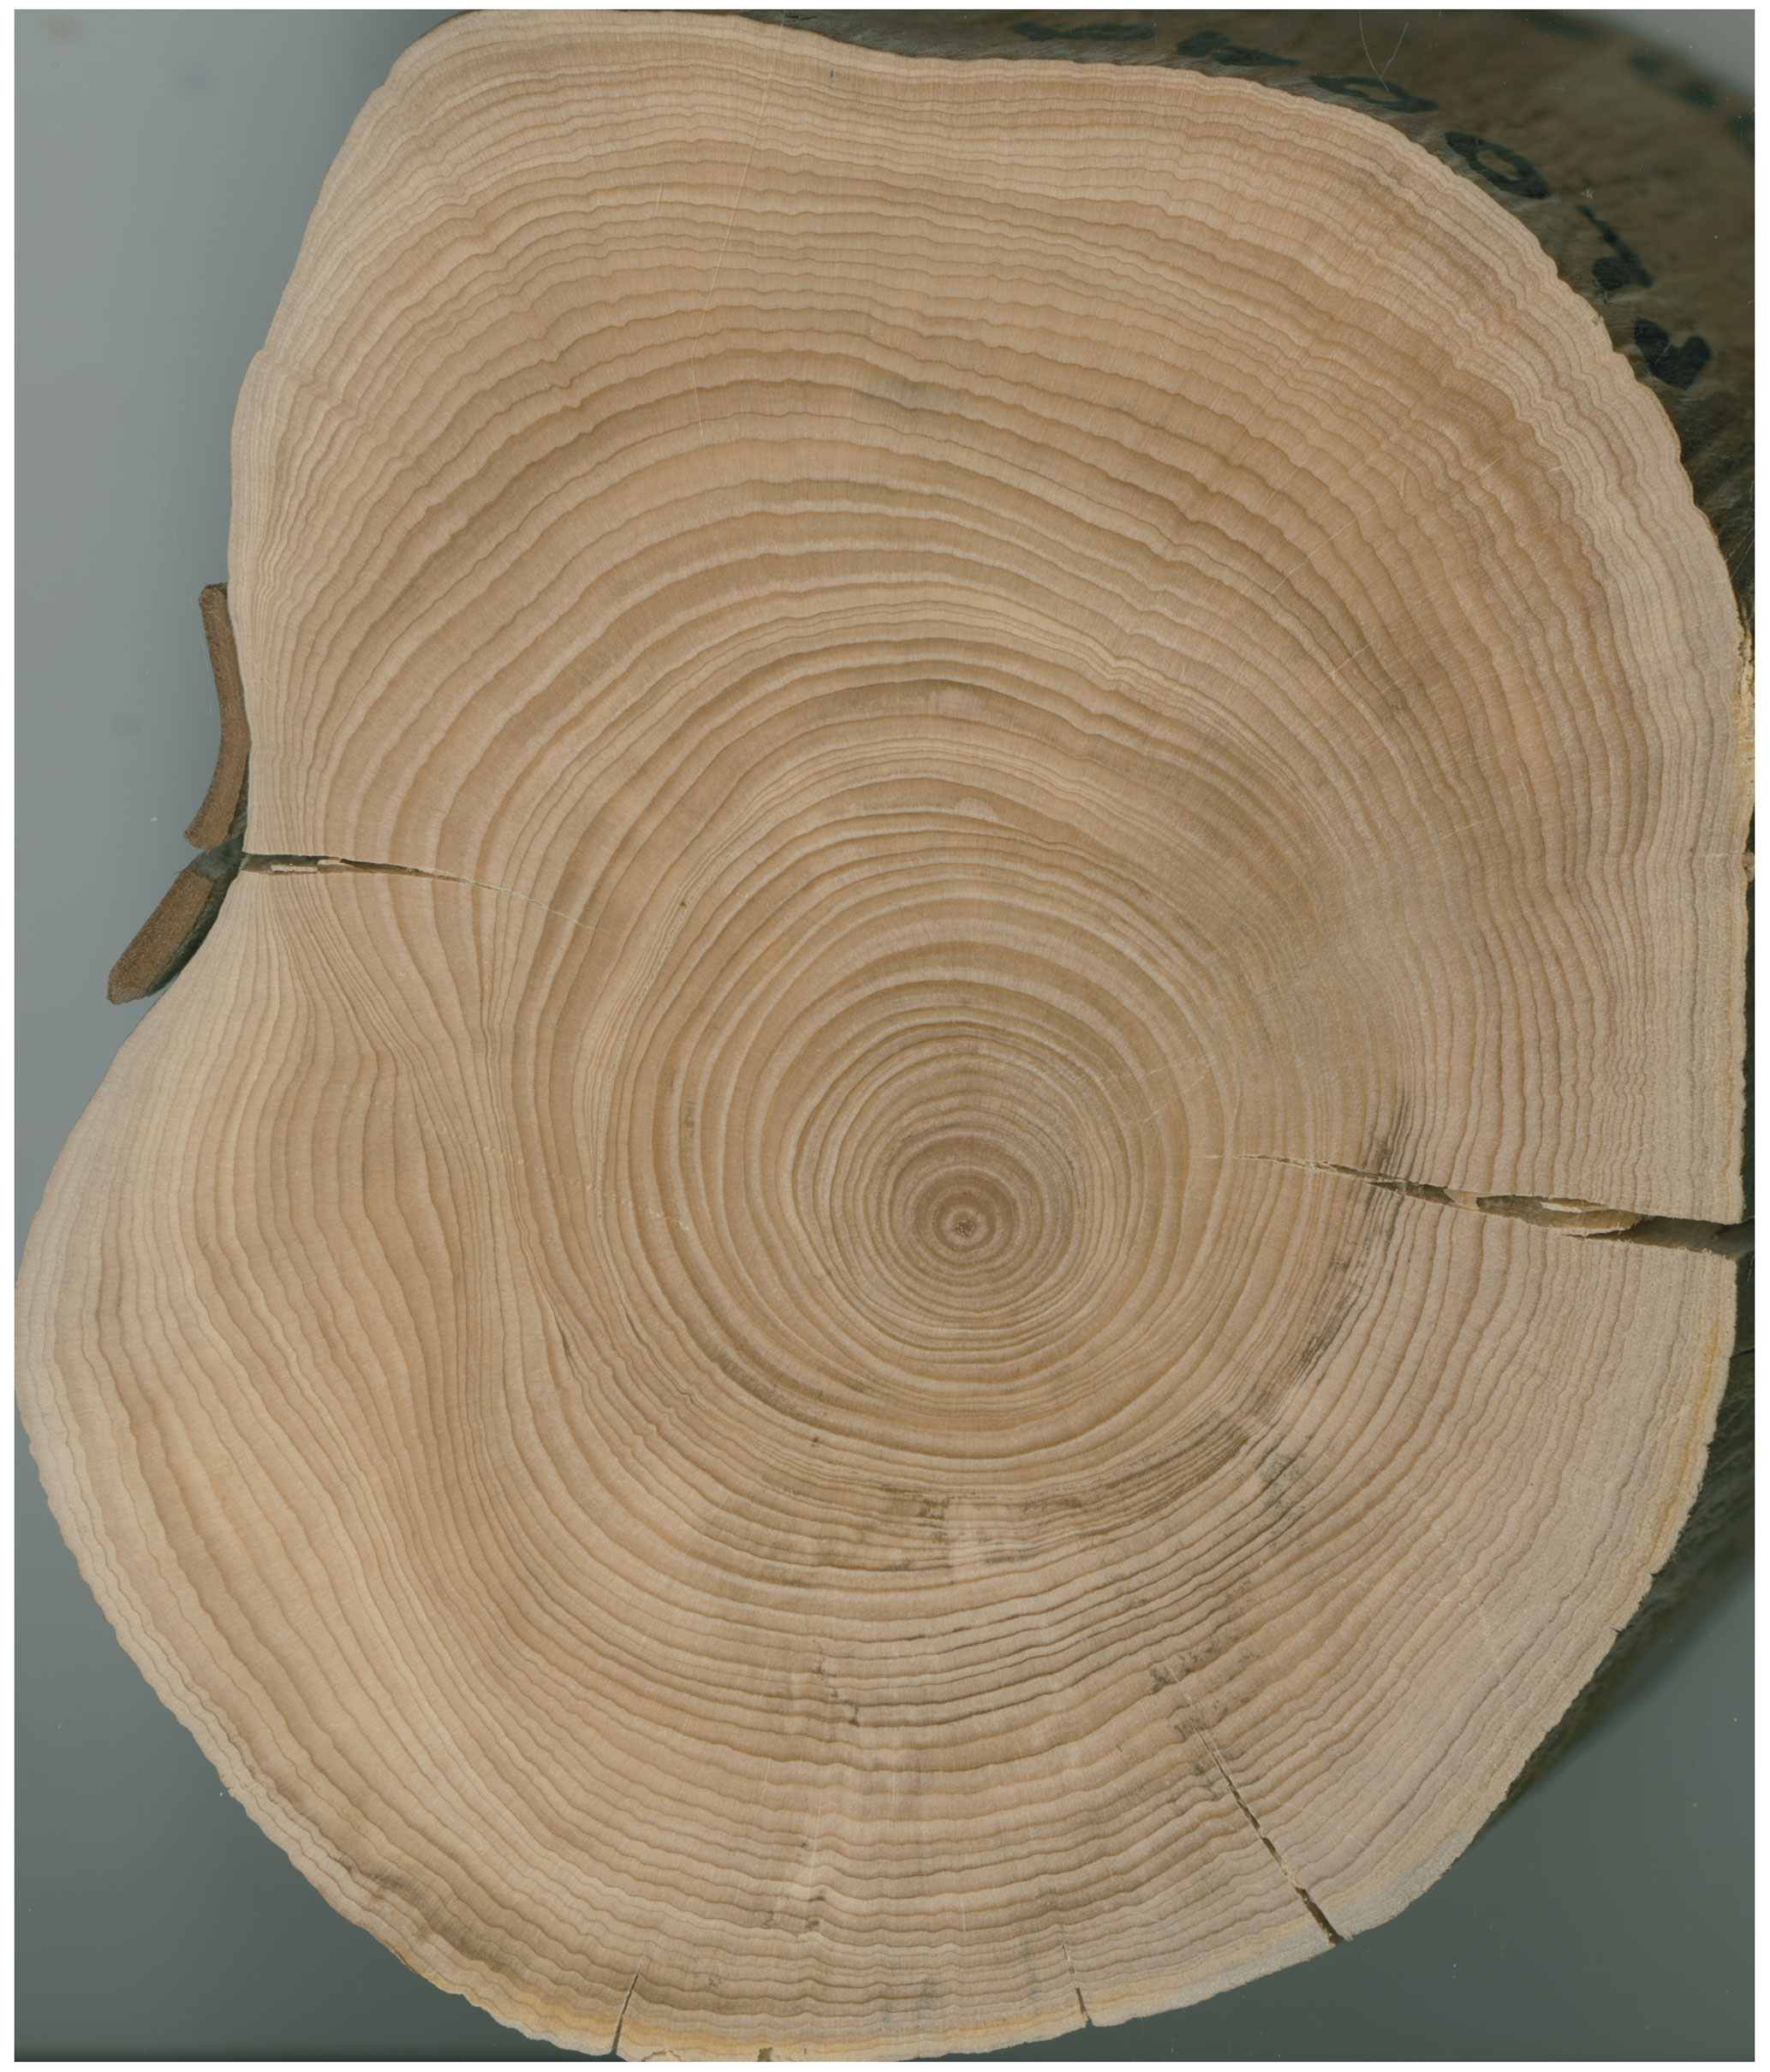
Figure 3P. lawrencei specimen from Mt Loch, demonstrating typical lobate growth behaviour and ring wedging.
2.3 Chronology development
Measured tree-ring series were detrended to remove sample-level noise prior to chronology estimation. Removing age-related trends within RW series often involves the fitting of a negative exponential function (Hughes, 2011). However, growth eccentricities associated with the lobate nature of growth in P. lawrencei means that a more flexible data-adaptive approach is required. Smoothing splines equal to 67 % of each RW series' length with a 50 % frequency cutoff were applied to each individual chronology in dplR (Bunn, 2008, 2010). Ring-width indices were calculated as residuals from the fitted curves. Due to trends specific to each individual BI series, detrending the age-related growth trends of ΔBI, EWBI and LWBI chronologies was undertaken in the same data-adaptive manner as the RW series. The robust bi-weighted mean of the detrended residual series were then calculated to produce the standardised RW and BI chronologies (Cook et al., 1990). The robust bi-weight approach produces a chronology that is relatively unaffected by outliers – an important consideration in the study of P. lawrencei given the highly eccentric growth behaviour and strong likelihood of outliers otherwise impacting the common signal (McDougall et al., 2012). We further removed autocorrelation from the tree-ring indices within dplR. The prewhitened (RES) chronologies did not differ significantly from the non-prewhitened chronologies, and we therefore used the RES chronologies to assess climate signals in the chronologies.
The quality and reliability of the chronologies were assessed using the expressed population signal (EPS), against the generally accepted threshold of >0.85 (Wigley et al., 1984). Additionally, due to a prevailing increasing trend apparent in the BI RES chronologies, we produced first-differenced BI and RW RES chronologies for use in subsequent analysis with climate data.
2.4 Climate analysis
The final chronologies were evaluated against climate data spanning 70 years (1929–1998) due to constraints associated with low sample resolution prior to the early 20th century. The relationship between the RW and BI chronologies and minimum and maximum air temperature, precipitation, snow depth and streamflow data for the current and previous growth years was then explored. Climate-correlation analysis was conducted using observational data from the Bureau of Meteorology (BoM) station in Omeo, 41.8 km southeast of Mt Loch (Fig. 2a). Continuous minimum and maximum monthly mean air temperature data from 1879 to 2009 are available at this site, which correlates strongly with the substantially shorter dataset (1925–1975) available in Hotham Heights (mean annual maximum temperature, r=0.87; mean annual minimum temperature, r=0.71). It is important to note, however, the significant elevation difference between our study location in Hotham Heights (∼1800 m) and the Omeo station (685 m) and therefore the possible variation in correlative strength of individual months. We further evaluated the sensitivity of our chronologies to total monthly precipitation data at Harrietville (Fig. 2b) – the closest station with sufficiently long records (data available from 1884–2015). We further examined the relationship between our P. lawrencei chronologies and mean monthly snow depth records from 1954–2001 at Spencers Creek in New South Wales (NSW) (∼125 km northeast of Mt Loch). Correlations with total monthly streamflow from BoM hydrologic reference stations at the Mitta Mitta River at Hinnomunjie and Livingstone creek at Omeo were also assessed. See Table 1 for metadata pertaining to BoM observation stations used in this study. In addition to individual station data, we explored relationships with the Australian Gridded Climate Data (AGCD, Evans et al., 2020), which is a recent revision of the Australian Water Availability Project (AWAP) gridded dataset (Jones et al., 2009). The AGCD extends from 1900–2020, with a grid-averaged resolution of 0.05∘ (approximately 5 km). We investigated the spatial extent of the relationship between RW and BI chronologies and mean monthly minimum and maximum temperatures and total monthly precipitation across the alpine regions of Victoria and southern New South Wales and further afield across Victoria. To ensure consistency with the detrending approach for the RW and BI chronologies, we explored the links between interannual differences in both, by applying first differencing to the climate data prior to correlation analysis.
This study presents nine successfully cross-dated P. lawrencei specimens (13 individual series). Chronology statistics are reported in Table 2. Given the relatively small sample size, a strong common signal (exceeding the 0.85 EPS threshold) throughout a portion of the resulting RW chronology (Fig. 4) is encouraging. The RW chronology reached a mean EPS of 0.86 for the period 1929–1998, suggesting that at least 11 radii are required to achieve sufficient chronology reliability. With individual specimen ages ranging from 67 to 327 years, future work with larger sample sizes would allow for the opportunity to utilise this species for climate analysis across multi-centennial timescales. Previous works have developed 114-year (McDougall et al., 2012) and 82-year (Brookhouse and Graham, 2016) RW chronologies from 48 and 13 P. lawrencei specimens respectively. Additionally, the ability to cross-date our RW chronology with a remotely located Mt Buller chronology (Fig. 5a) (Brookhouse and Graham, 2016) demonstrates the spatial coherence in the sensitivity of this species to climate variables throughout southeast Australia. Such findings highlight the possible utility of P. lawrencei in the development of a strong dendroclimatic network throughout the Australian Alps.
Table 2Statistics of RES ring-width chronology for P. lawrencei.
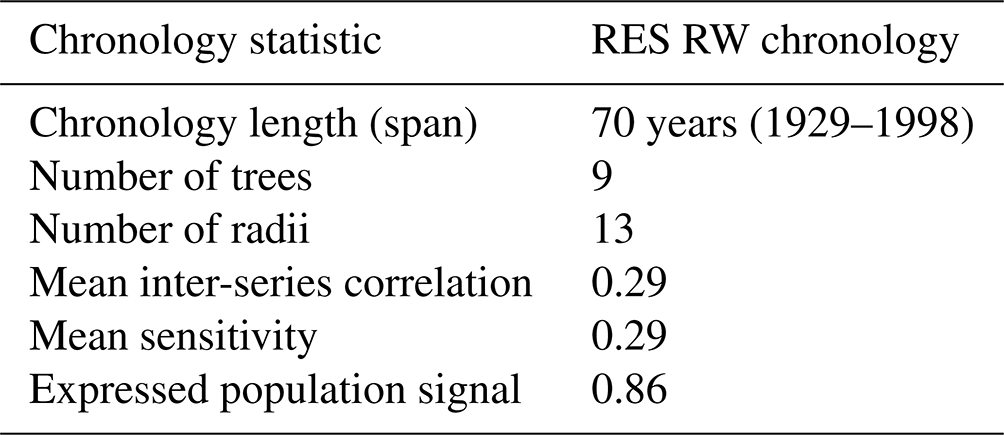
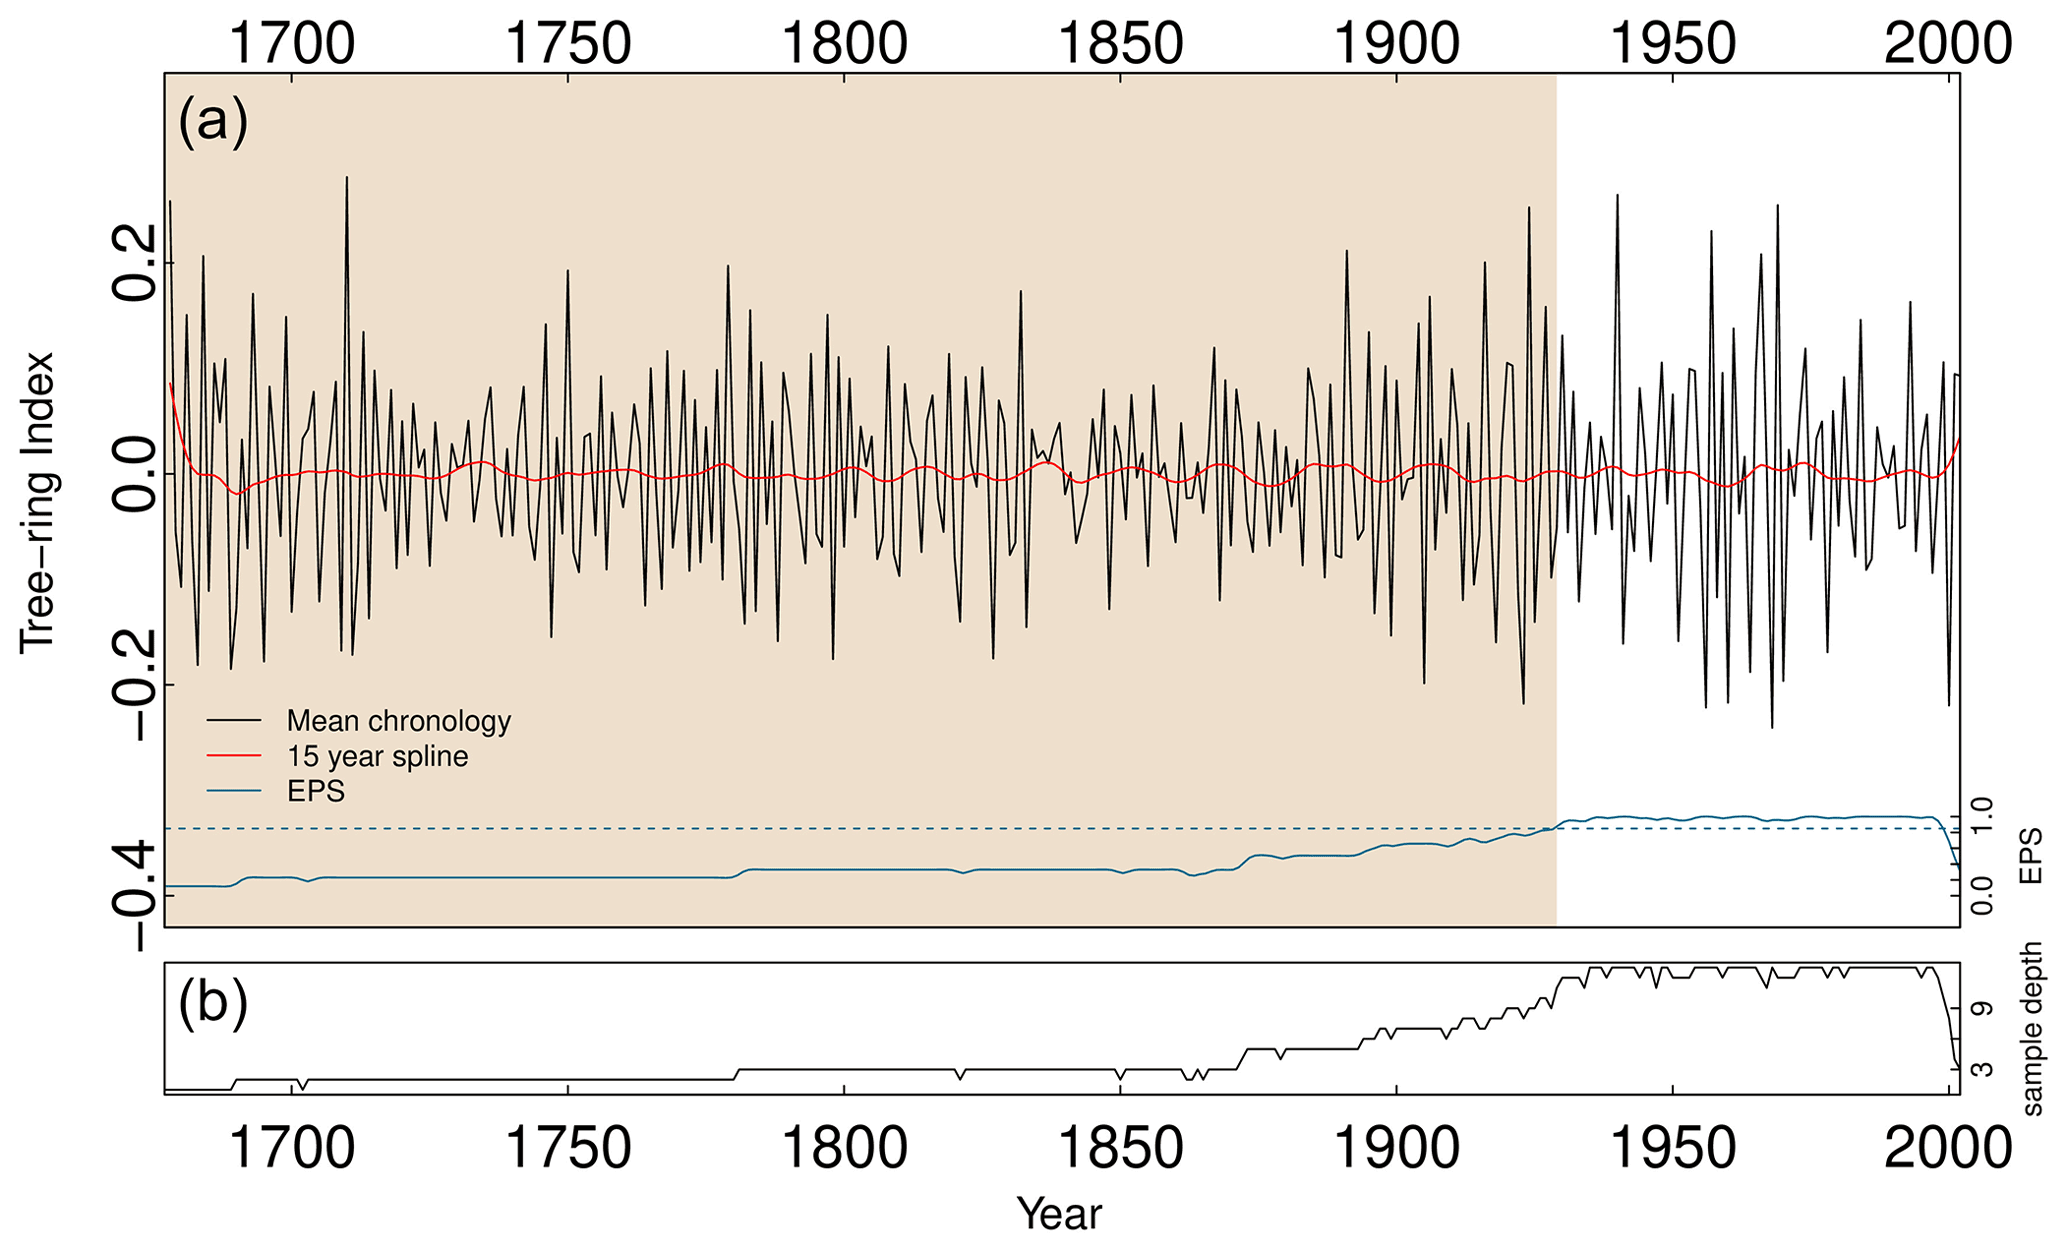
Figure 4Full mean ring-width chronology (1676–2002) based on 13 Mt Loch P. lawrencei series from 9 samples (a), with concurrent sample resolution (b). Expressed population signal (EPS) is denoted by the solid blue line (a), with the 0.85 threshold (dashed blue horizontal line).
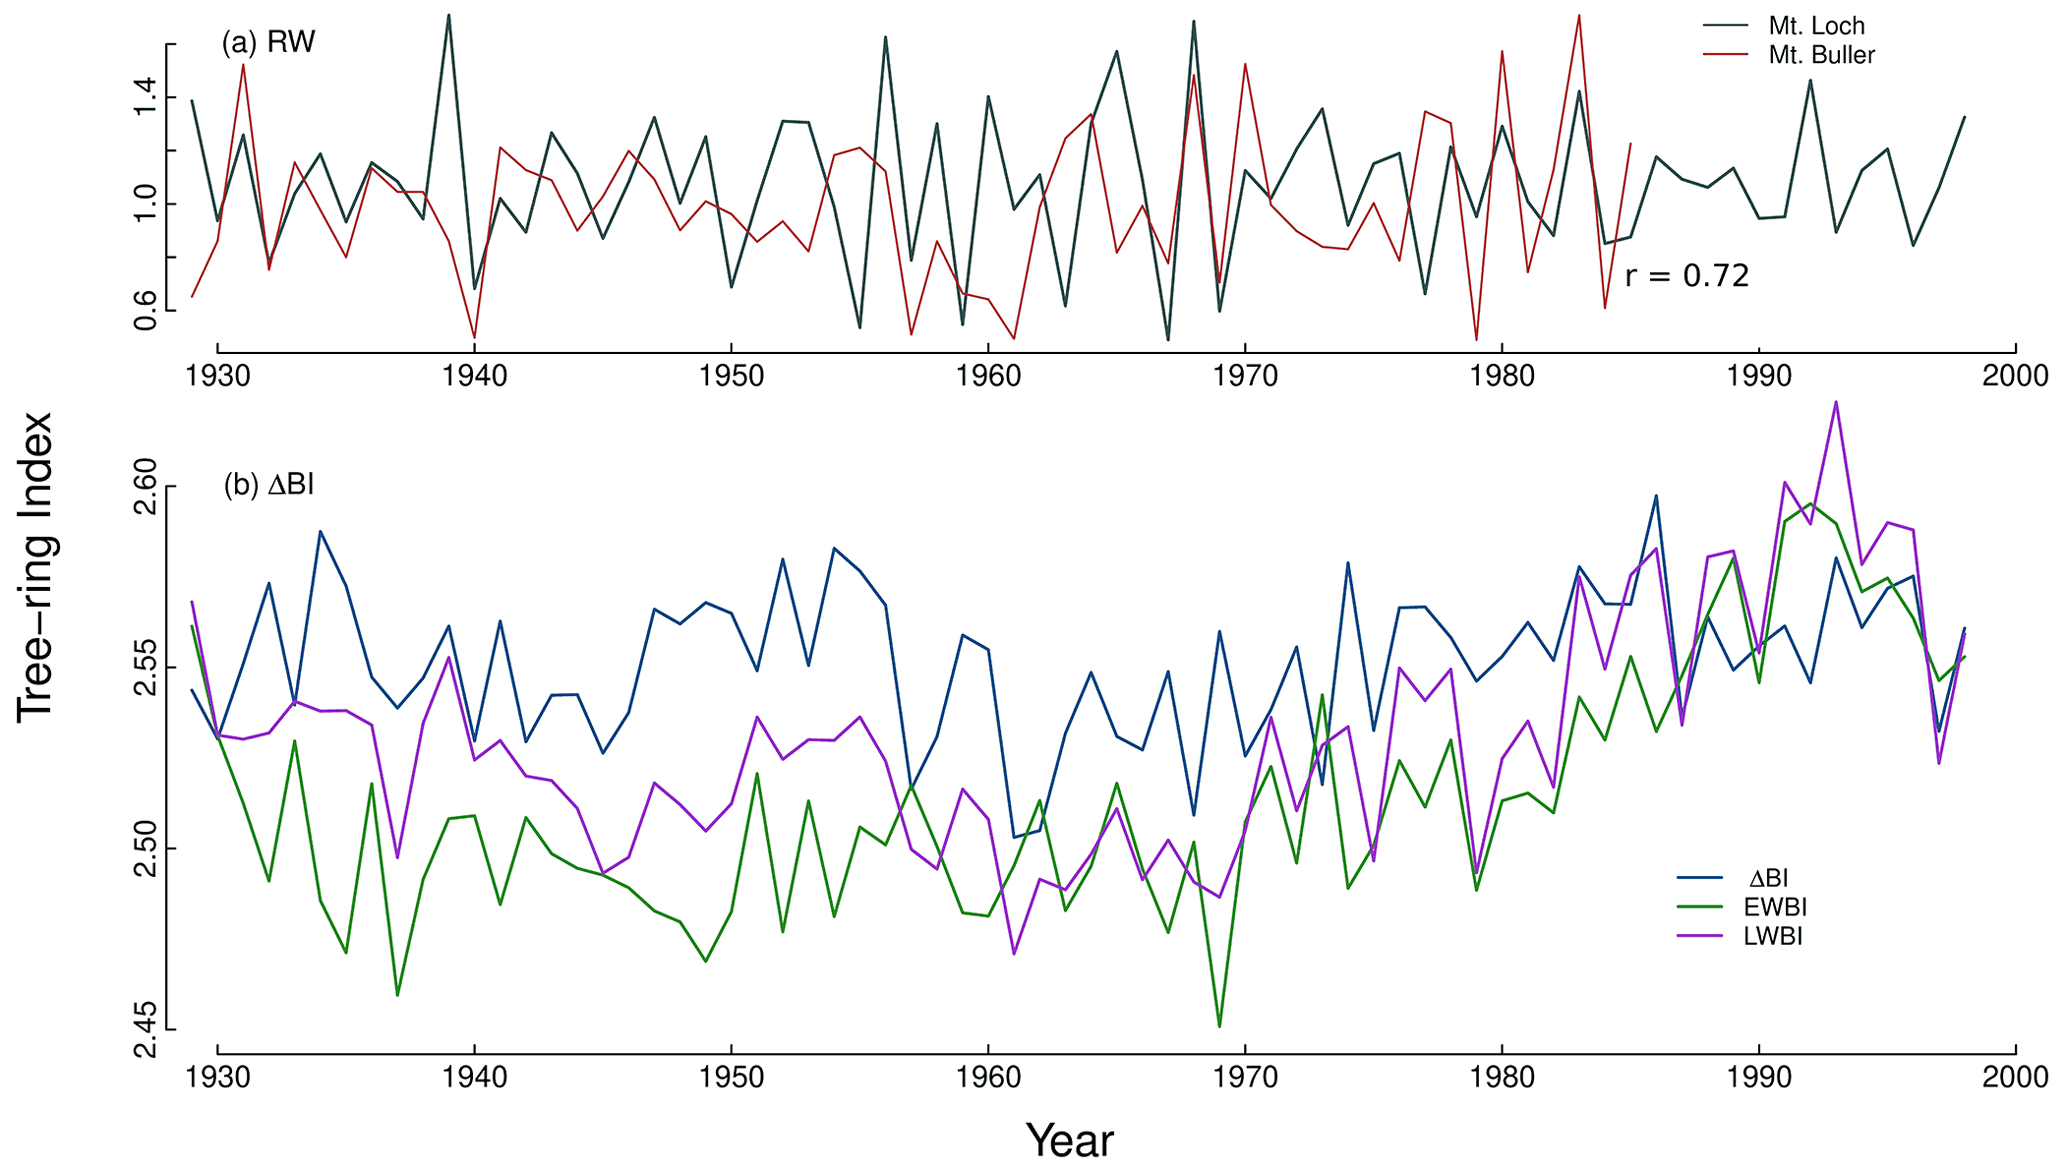
Figure 5(a) Detrended P. lawrencei ring-width (RES) chronologies for Mt Loch (this study) and Mt Buller (Brookhouse and Graham, 2016) and (b) earlywood and latewood BI chronologies, with the derived ΔBI parameter, for the 1929–1998 period.
3.1 Temperature correlations
The RW chronology shows increased variability from the 1900s, with particularly narrow rings observed in the 1950s and 1960s (Fig. 5a). With regard to observation station data, the RW chronology response to mean monthly maximum temperatures from Omeo reveals positive, statistically significant (p<0.05) correlations with the current-year winter (June, July and August) and October and November in particular and a strong, negative response to June to November temperature maxima of the previous growth season (Fig. 6a). Additionally, sensitivity of RW to mean minimum monthly temperatures at Omeo is dominated by statistically significant, positive correlations with October of the current period and September of the previous period as well as negative (statistically significant) correlations with the previous growth season's March to May minimum temperatures (Fig. 6b). The ability of our P. lawrencei RW chronology to capture temperature signals during some months of the growing season is consistent with previous dendroclimatological analysis of this species, demonstrating air temperature is a dominant limiting growth factor (McDougall et al., 2012; Brookhouse and Graham, 2016). The influence of temperature throughout the growing season has previously been extensively documented as a primary control on the growth of coniferous species in high-altitude and high-latitude environments (e.g. D'Arrigo et al., 1992; Brookhouse and Bi, 2009; Nishimura and Lovoque, 2011; Rydval et al., 2018). Concerning the strong, inverse relationship of the RW chronology to temperature of the previous growth season, similar response patterns have been found in other species such as lower-elevation Lagarostrobos franklinii (Buckley et al., 1997) and the widespread Phyllocladus aspleniifolius (Allen et al., 2001) in Tasmania and high-elevation New Zealand Libocedrus bidwillii (Palmer and Xiong, 2004). This may be related to a depletion of carbohydrate and nutrient reserves following a favourably warm growing season and accelerated growth rates.
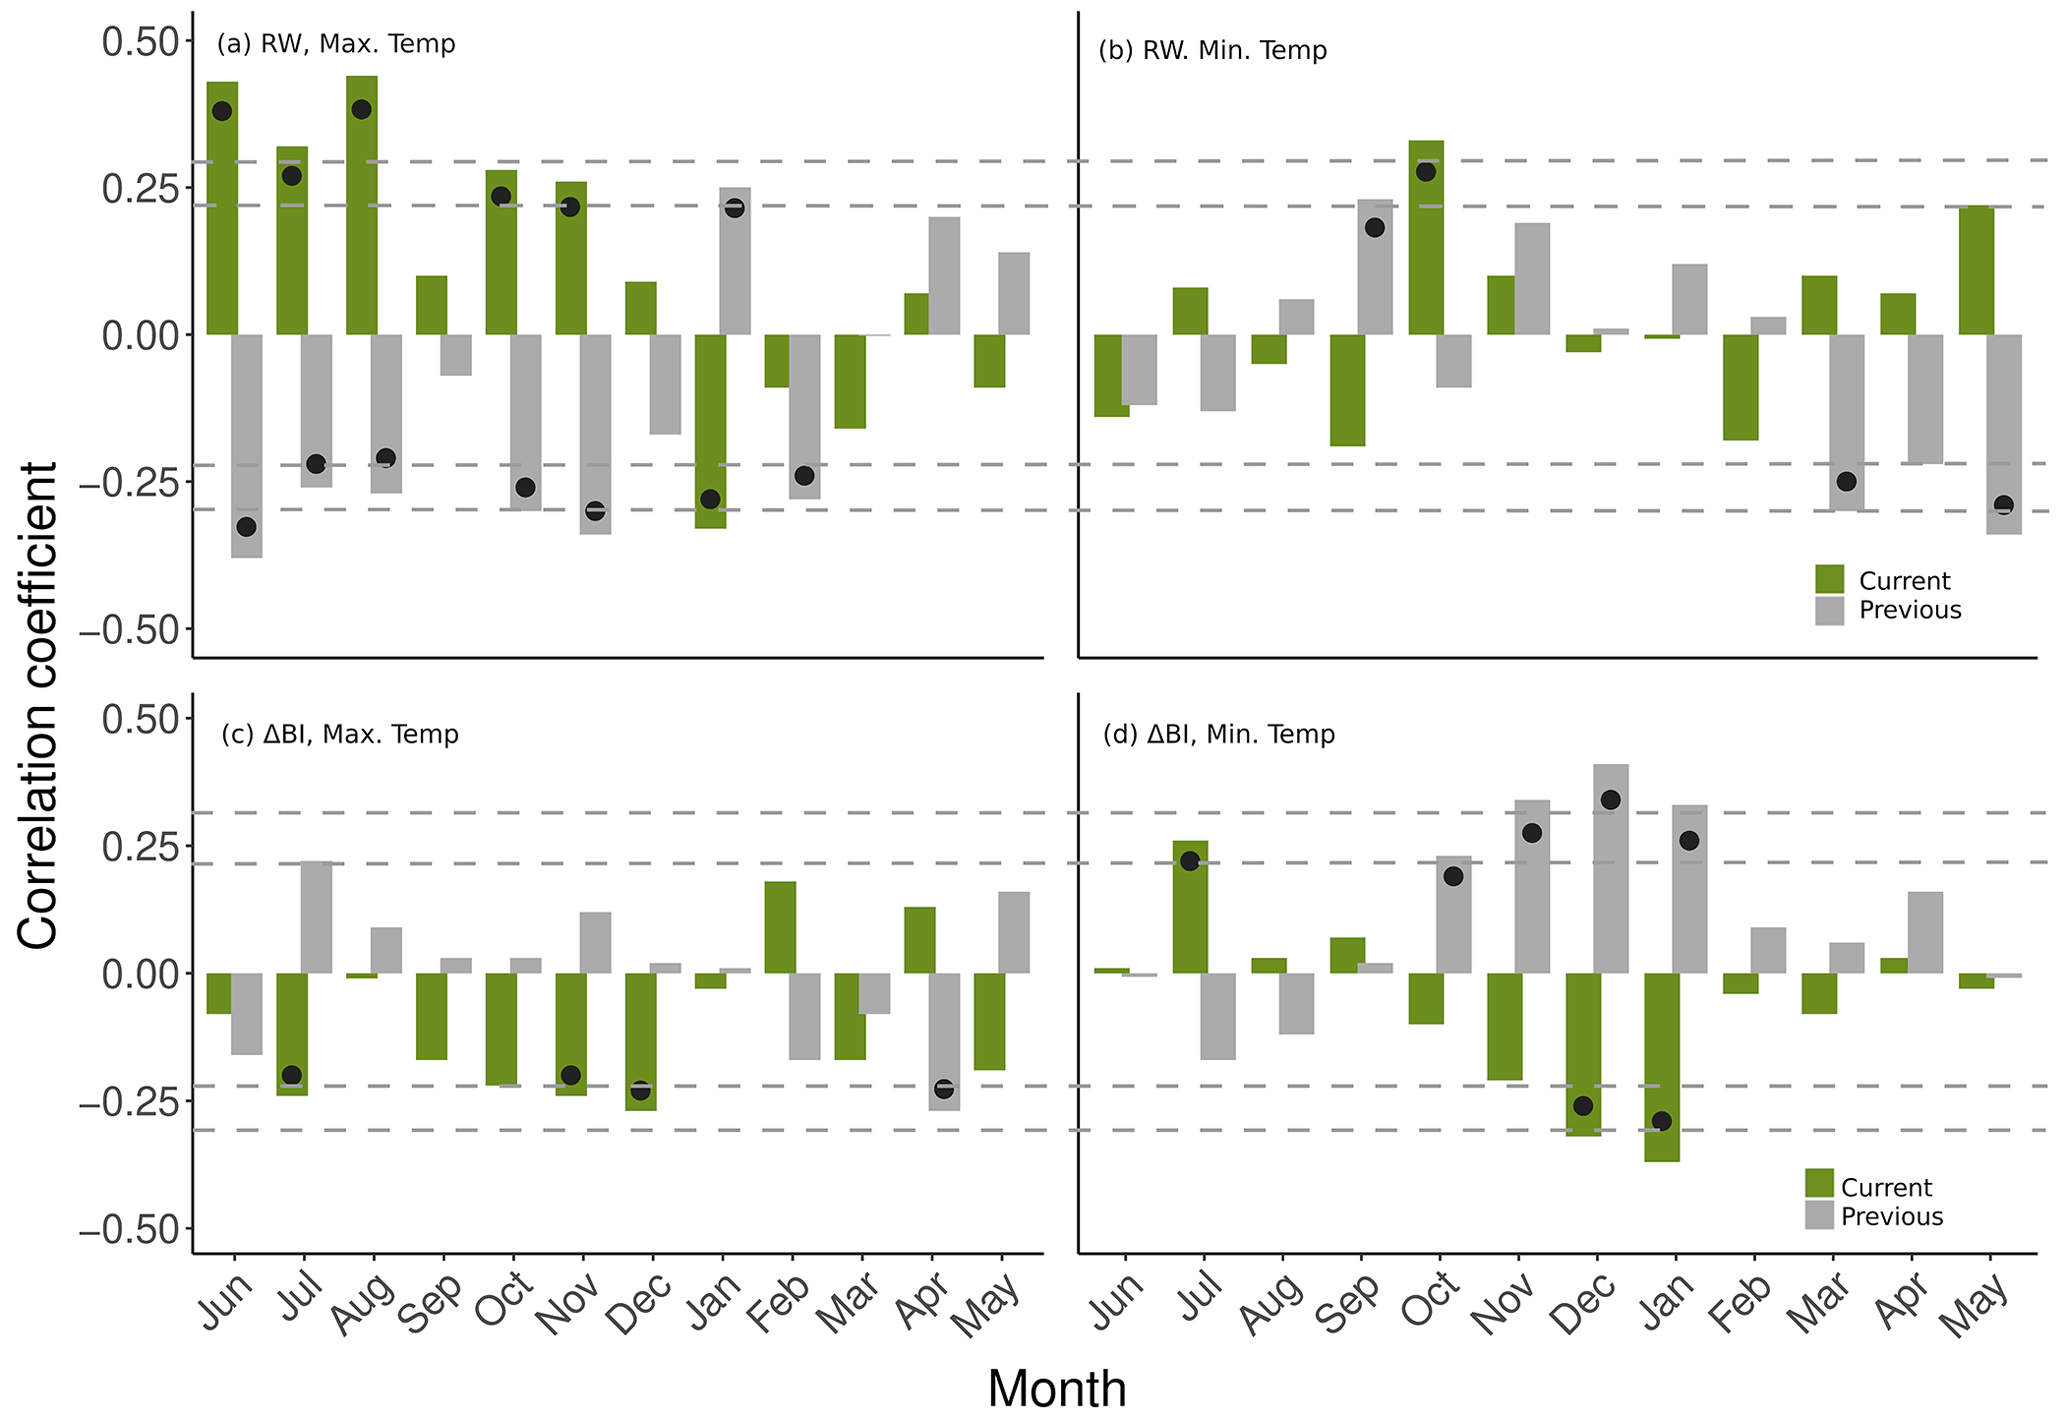
Figure 6Correlations between RW and ΔBI chronologies and mean minimum and maximum monthly temperature data from Omeo observation station across the period 1929–1998, for both the current and previous growth year. Black dots indicate statistical significance (p<0.05), and dashed horizontal lines, with increasing distance from the x axis, indicate 0.05 and 0.01 significance levels. Radial growth of P. lawrencei occurs in summer months (approximately November–March).
Following the strong, positive correlation between RW and local temperature maxima during winter months, we investigated the spatial signature of this relationship. The RW response to the AGCD was also dominated by a statistically significant, positive correlation with mean June to August maximum temperatures (r=0.62, p<0.001), encompassing a broad extent of central Victoria (Fig. 7a). This response is consistent with previously documented alpine P. lawrencei chronologies (McDougall et al., 2012; Brookhouse and Graham, 2016). McDougall et al. (2012) reported a strong positive relationship between RW and winter maximum temperatures and a negative response to mean and maximum monthly snow depth. Given the inverse relationship between winter temperature and snowfall, winter temperatures are suggested to reflect the magnitude of winter snow depth and persistence of spring snow cover, which imposes significant impacts on vegetation growth (Kudo, 1991; Halter, 1998; Brookhouse et al., 2008). Snow cover is postulated to be a major determinant of the length of the phenology and growing season of alpine vegetation (Kudo, 1991). With regard to Australian alpine flora, this sensitivity is consistent with documented responses of Eucalyptus pauciflora to winter snow cover (Brookhouse et al., 2008). The timing of growth initiation in boreal and temperate environments is largely defined by temperature (Creber and Chaloner, 1984), with many coniferous and deciduous species experiencing cessation in root growth at soil temperatures below 2–4 ∘C (Halter, 1998). Persistent spring snow cover due to cooler winter conditions delays the initiation of cambial activity (essential for the formation of wood cells) and sustains low soil temperatures, resulting in a shorter growing season and therefore a narrower growth ring (Vaganov et al., 1999; Kirdyanov et al., 2003). Additionally, considering the acute prostrate growth of P. lawrencei communities and the likelihood of stands being buried by snow throughout winter, extended spring snow cover also presents a direct impediment to wood production by delaying the commencement of photosynthesis (McDougall et al., 2012). Conversely, warm winter temperatures are expected to accelerate snowmelt in spring, resulting in an earlier onset of photosynthesis and cambial activation for P. lawrencei.
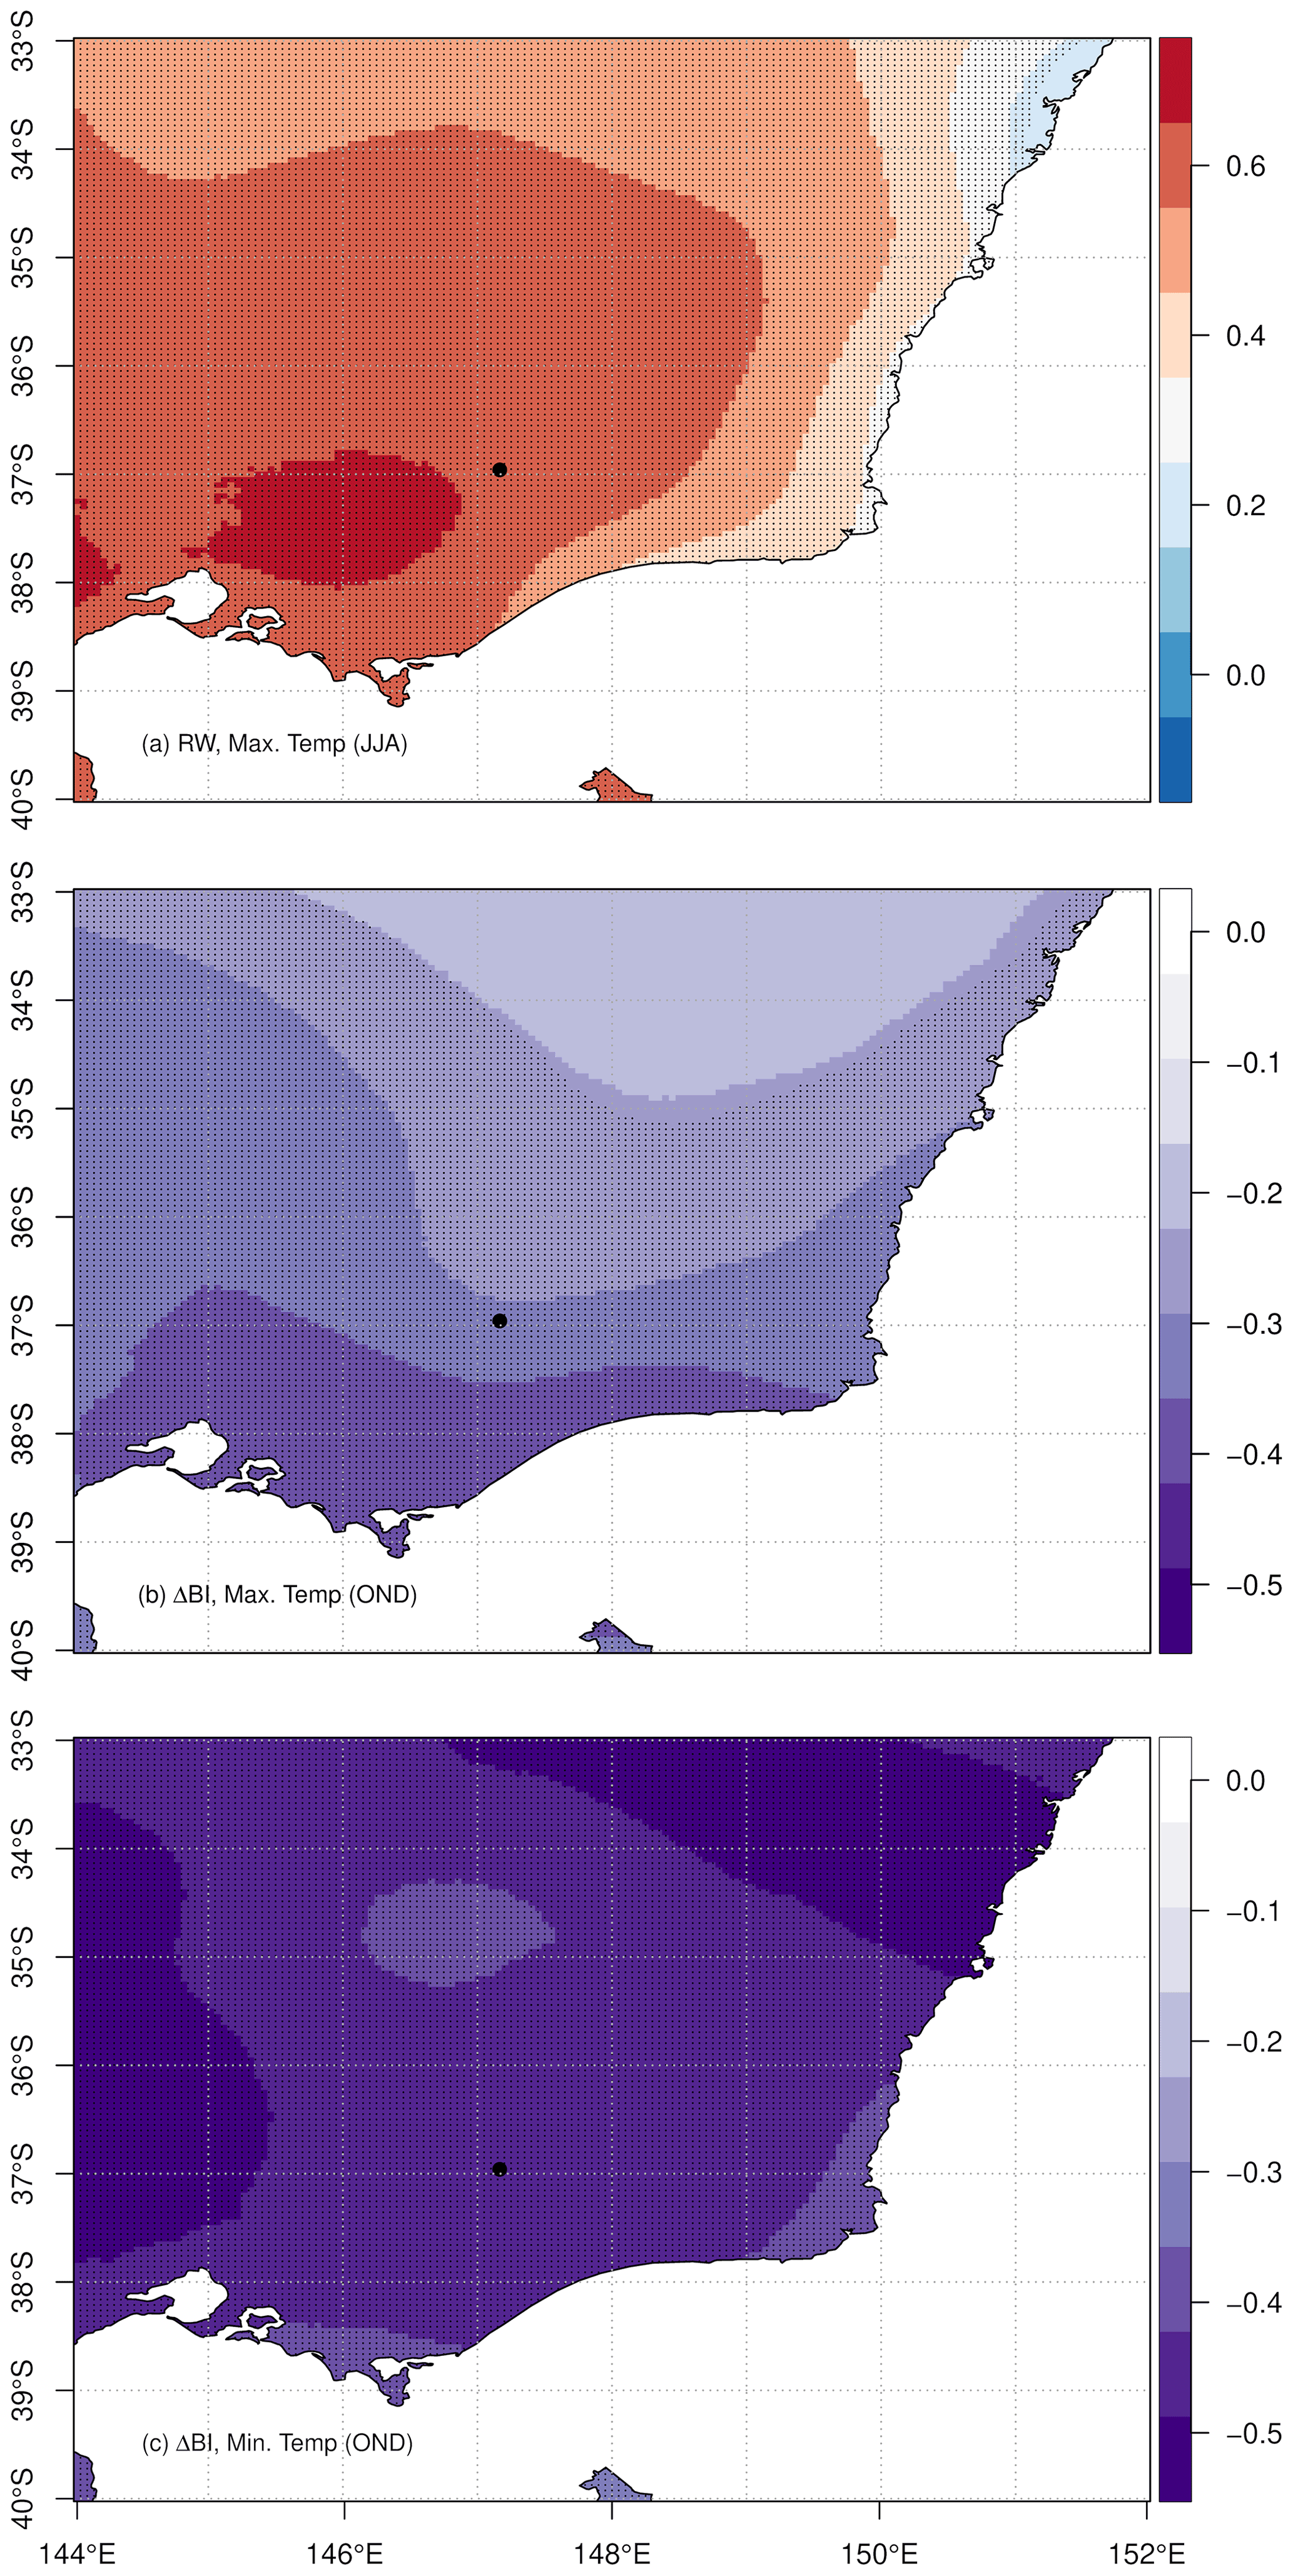
Figure 7RW and ΔBI chronology correlations with AGCD mean monthly temperature for the 1929–1998 period. (a) RW correlation with mean June, July and August (winter) maximum temperatures, (b) ΔBI correlation with mean October, November and December maximum temperatures, and (c) ΔBI correlation with mean December minimum temperature. Shaded areas represent statistically significant correlations (p<0.05), and the study site location is marked by the black dot.
The ΔBI chronology developed in this study is most notably negatively correlated with mean maximum temperatures in October, November and December of the current growth season (November and December correlations are statistically significant: Fig. 6c). Taking the averaged temperature maxima of these months produced a significantly strengthened correlation with the ΔBI chronology (Figs. A1 7b: , p<0.001). This response is comparable to the only previously constructed BI chronology for P. lawrencei by Brookhouse and Graham (2016), whereby averaged August to April temperature maxima revealed the strongest BI–temperature relationship. Moreover, ΔBI displayed a significant, positive relationship with October–January mean monthly minimum temperatures of the previous growth year (Fig. 6d) as well as a strong negative response to minimum temperature throughout the current growth year October to December period (Fig. 7c: , p<0.001).
Given that BI is negatively correlated with MXD, the negative response of our ΔBI chronology to maximum and minimum temperatures throughout October to December is consistent with many previous studies demonstrating that temperature of the growing period is the dominant climate parameter influencing latewood density (e.g. D'Arrigo et al., 2000; Davi et al., 2003; Kaczka et al., 2017; Blake et al., 2020). The anatomical basis for wood density lies in the average amount and size of cell wall material within the tracheids (Vaganov et al., 2006). During the growth season, tracheid size reduces, and density thereby increases, between earlywood and latewood formation (Rathgeber et al., 2006; Cuny et al., 2014). An investigation into the interannual variability of wood density and specific contributions of anatomical attributes in NH conifers by Björklund et al. (2017) found earlywood and latewood density to be primarily influenced by tracheid size and cell wall dimensions respectively. Since BI is an established proxy measure of density and assuming that it is recording similar variations in these structural anatomical properties (and that such responses are consistent between hemispheres), the BI data in P. lawrencei may likewise reflect changes in tracheid size and wall dimensions. Future studies of BI in P. lawrencei incorporating the exploration of interannual variations in these anatomical properties could confirm this. Such work could further our understanding of the physiological controls on the BI–density relationship, particularly as it relates to some SH species in which density variations have been noted to behave differently to what is typically observed in NH conifers (Blake et al., 2020).
3.2 Precipitation, snow depth and streamflow correlations
Correlation analysis with precipitation data revealed a strong negative relationship between RW and June to November and May precipitation of the current growth season as well as a particularly strong positive response to precipitation in November of the previous season (Fig. 8a). Additional correlations with AGCD most notably exhibited a significant negative relationship between RW and total June to August precipitation across southern Victoria and high-altitude regions (Fig. 9a). Significant negative correlations between the RW chronology and mean snow depth at Spencers Creek are also evident from June to October (Fig. 10). This response is consistent with that observed in P. lawrencei RW from Mt Blue Cow and Schlinks Pass in NSW (McDougall et al., 2012) and reflects the spatial coherence of snow depth throughout the Australian alpine region. Such results further demonstrate the previously discussed impact of temperature maxima on the persistence of spring snow cover and the consequent limitation on P. lawrencei radial growth. Additionally, given the significant contribution of snowmelt during winter and spring to the soil moisture balance in the Australian Alps (Costin et al., 1961), we postulate that the positive response of RW to monthly snow depth of the previous growth season is related to excess moisture availability providing optimum growth conditions the following growth year.

Figure 8Correlations between (a) RW and (b) ΔBI chronologies and total monthly precipitation data from Harrietville observation station across the period 1929–1998, for both the current and previous growth season. Black dots indicate statistical significance (p<0.05).
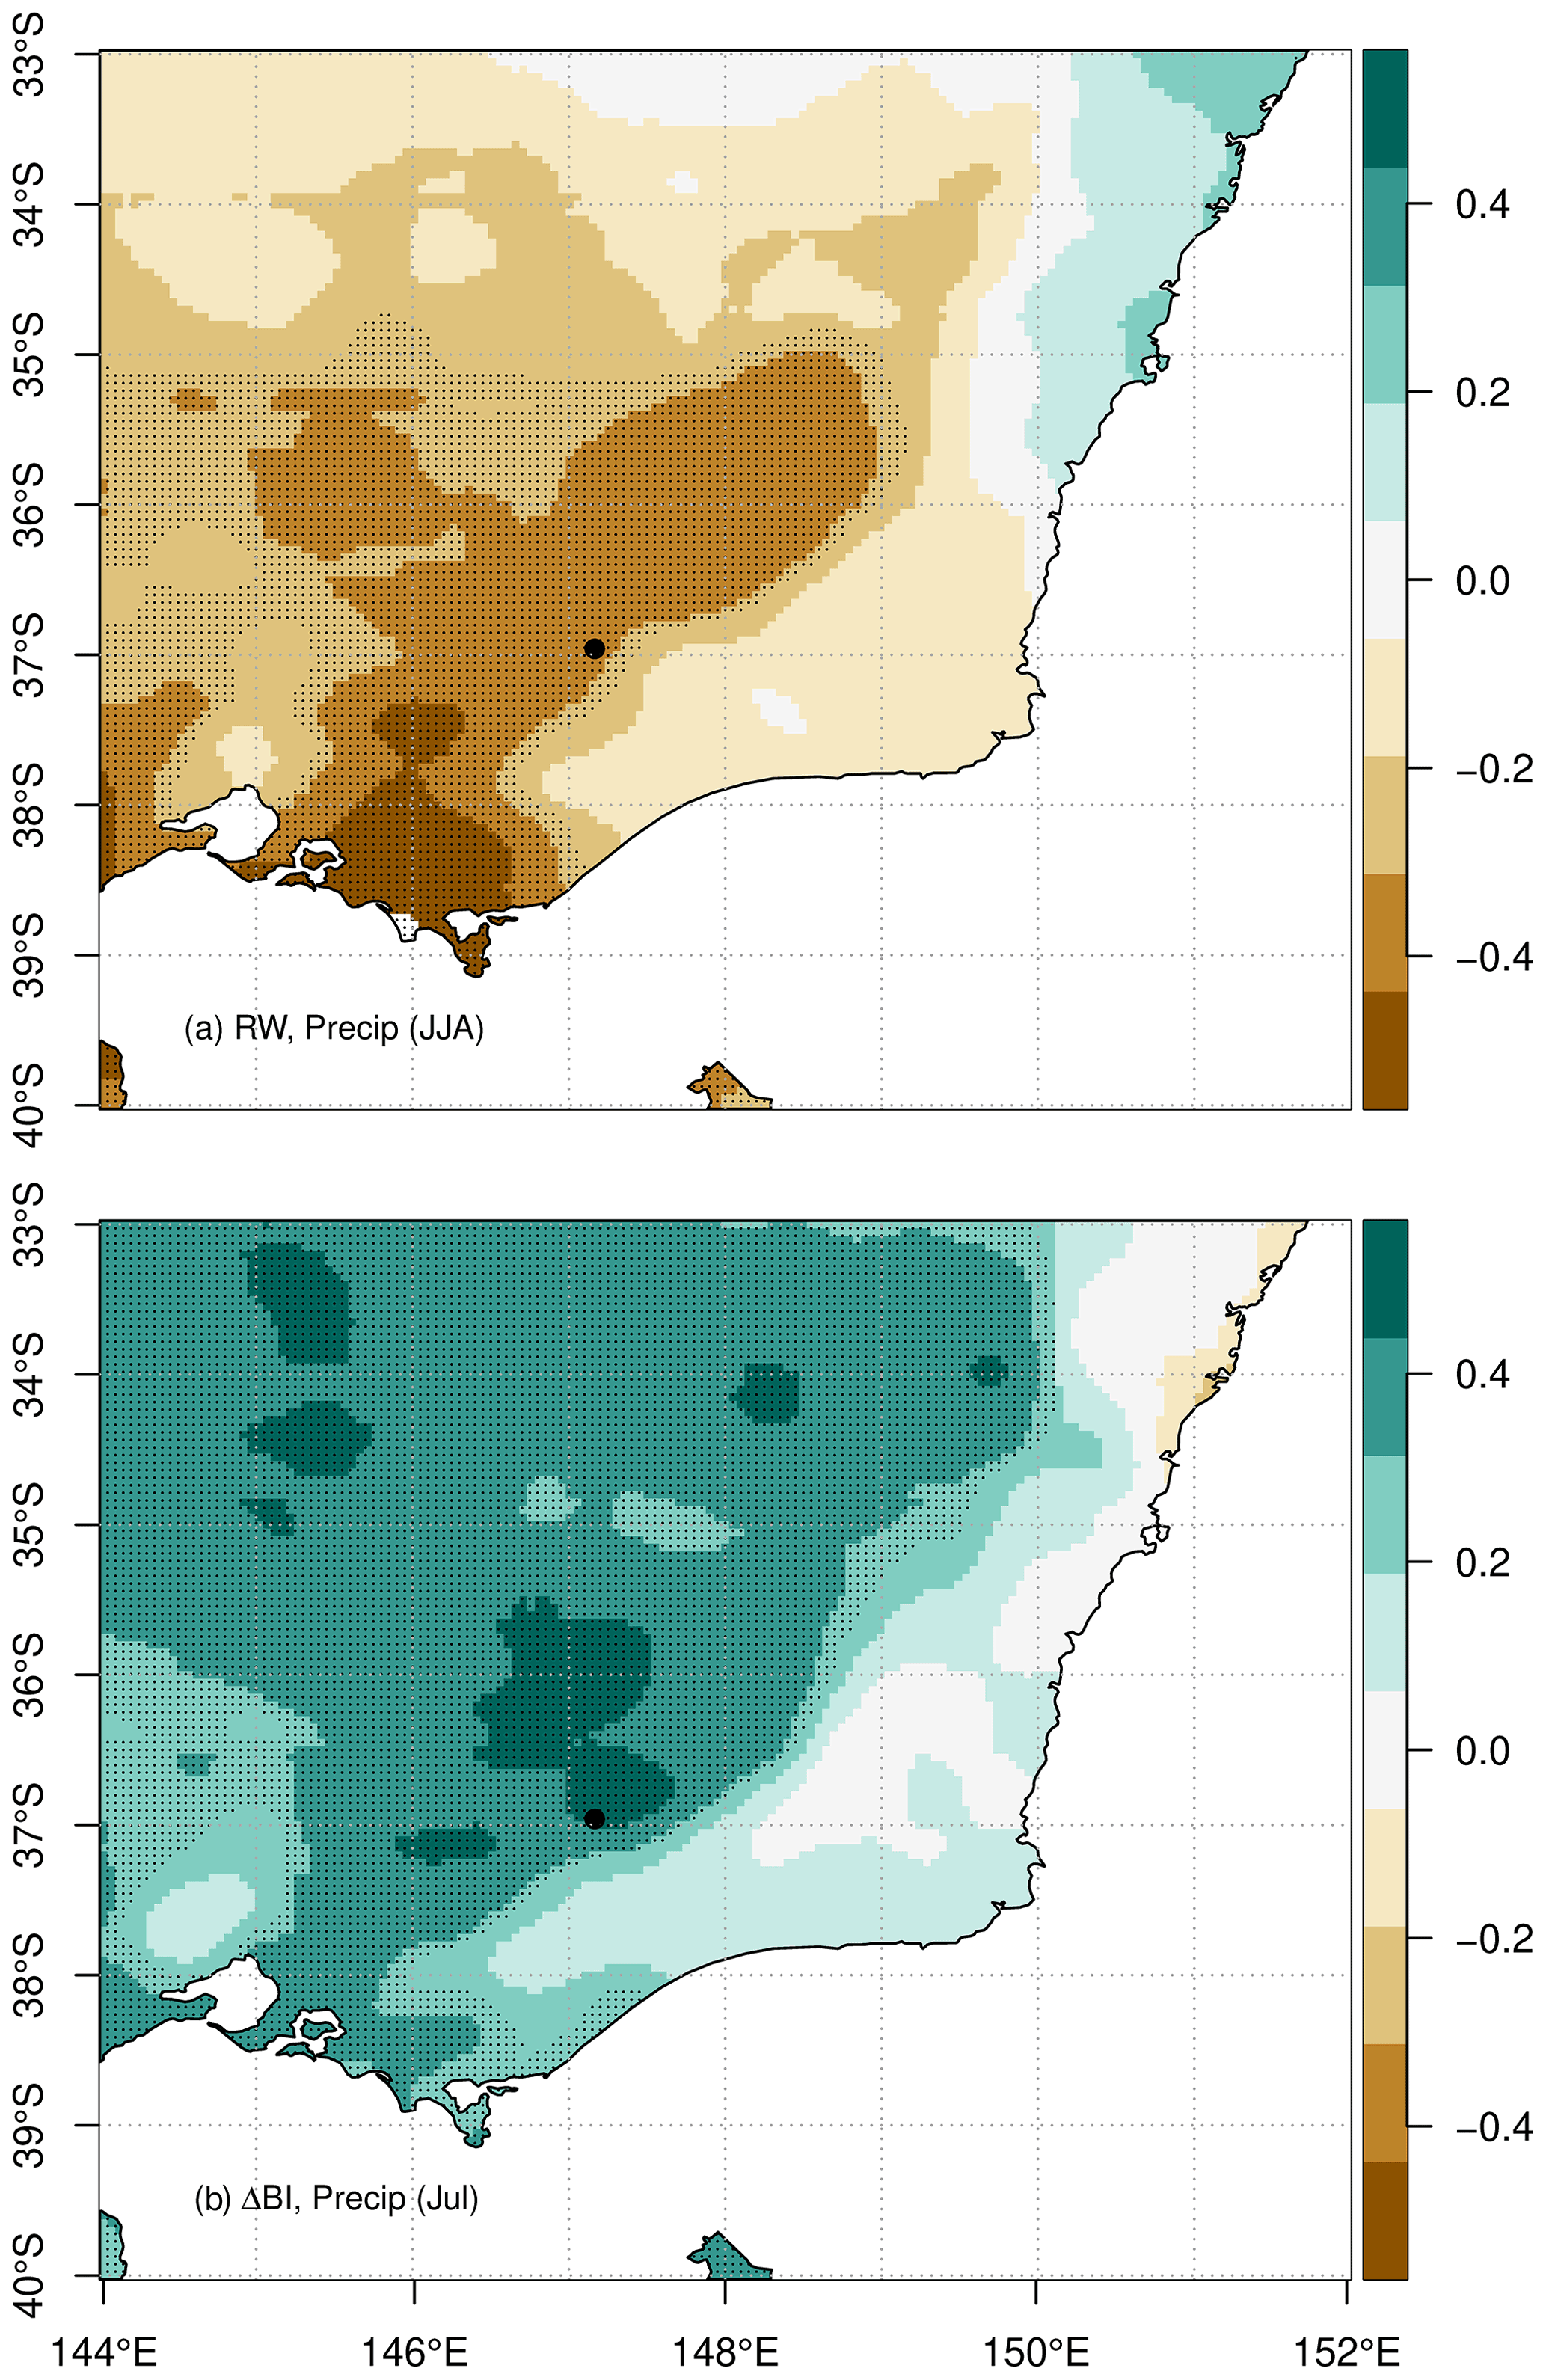
Figure 9RW and ΔBI chronology correlations with AGCD total monthly precipitation data for the 1929–1998 period. (a) RW correlation with mean June, July and August (winter) total precipitation; (b) ΔBI correlation with total July precipitation. Shaded areas represent statistically significant correlations (p<0.05), and the study site location is marked by the black dot.
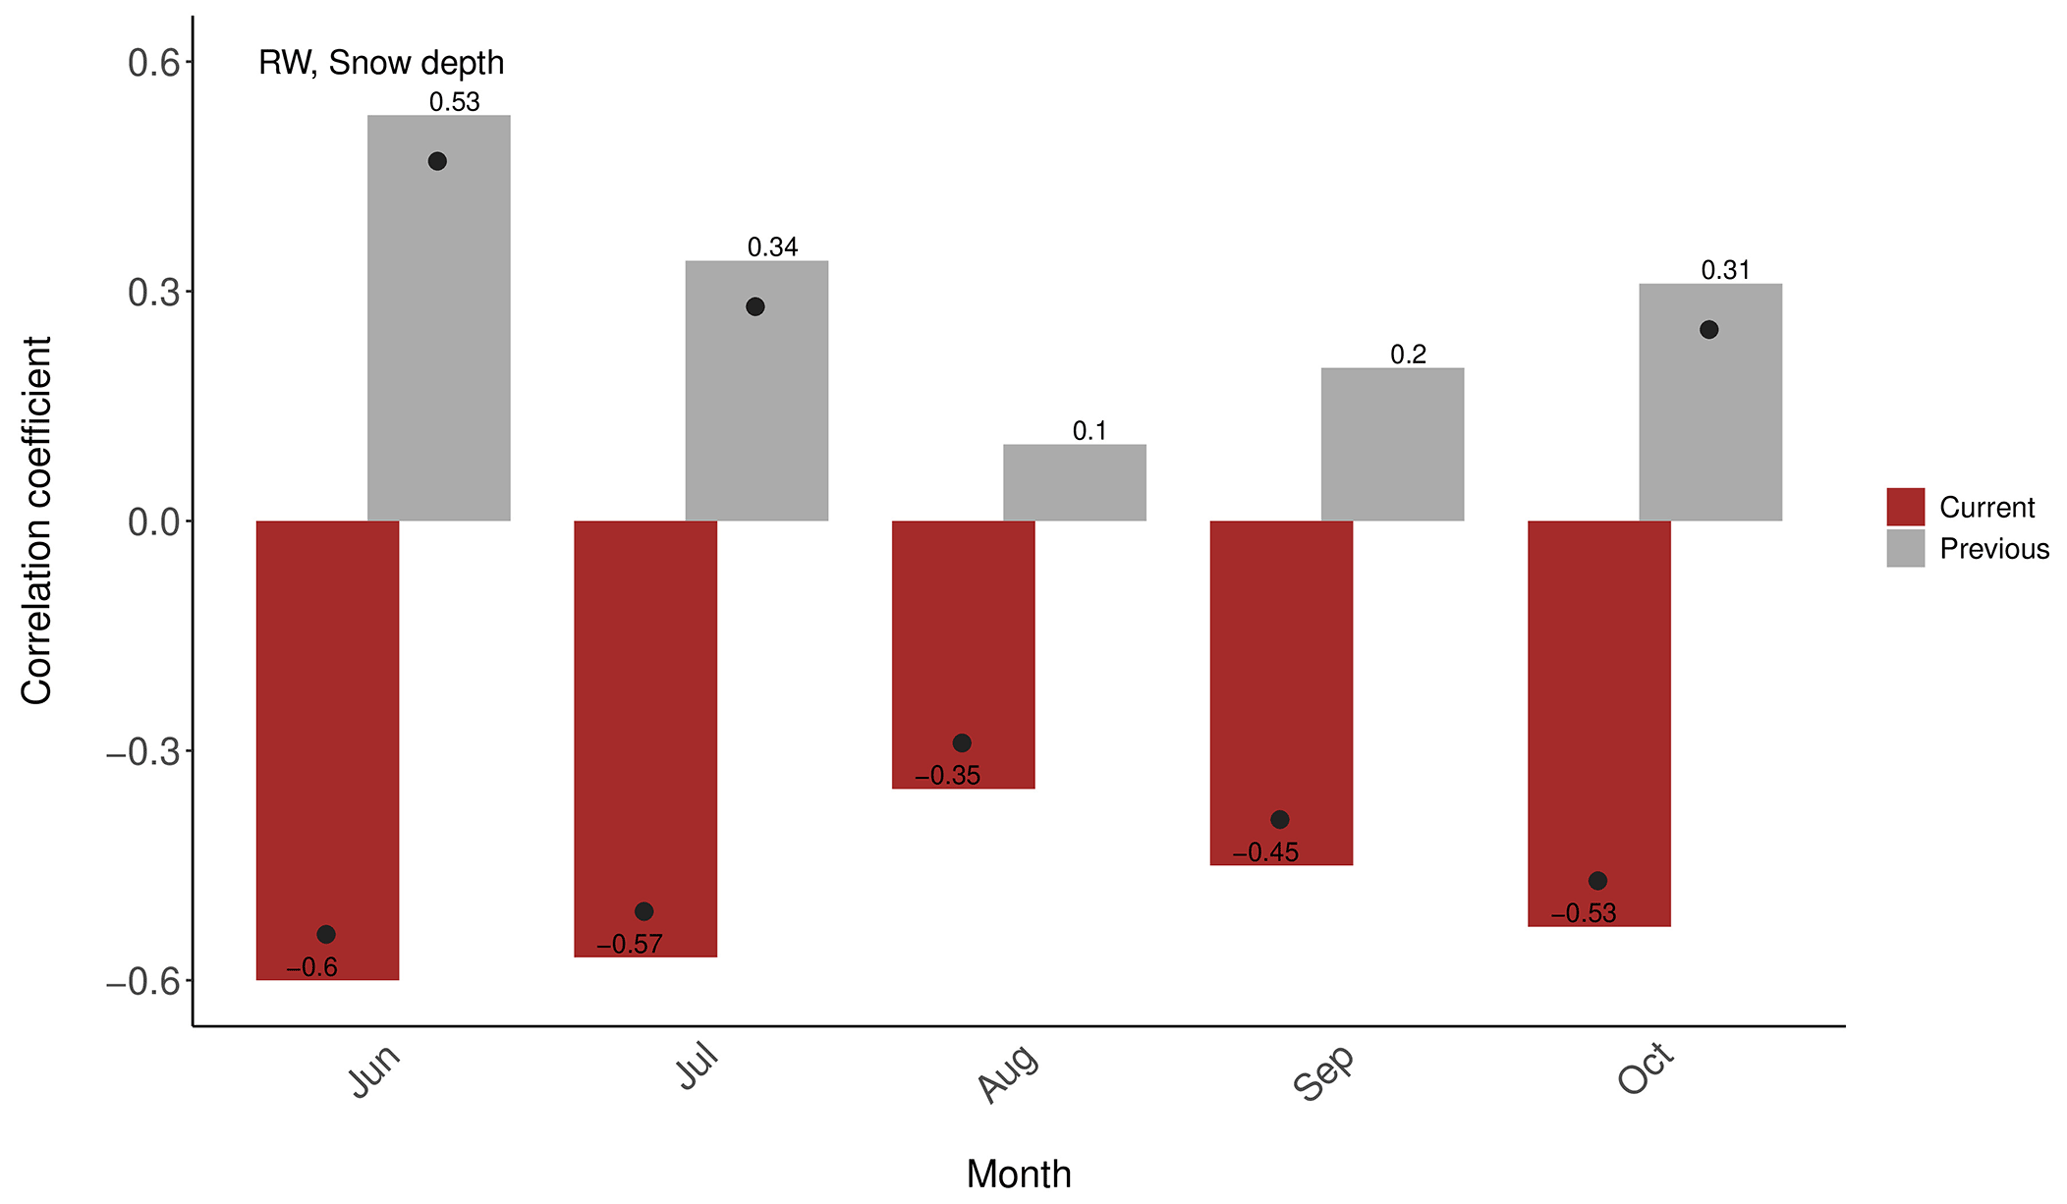
Figure 10Correlations between P. lawrencei RW chronology and mean monthly snow depth at Spencers Creek, for the period 1954–1998. Black dots indicate statistical significance.
Relationships between BI and snow depth were non-significant (data not shown). However, the ΔBI chronology exhibited particularly strong positive correlations with July total monthly precipitation (Figs. 8b, 9b). Assessments of the dendroclimatic potential of ΔBI for hydroclimatic reconstruction have thus far been limited. Notably, however, Seftigen et al., (2020) recently reported an increase in the explained variance of a warm season, ΔBI-based precipitation reconstruction of nearly 20 percentage points (to 55 %), relative to the predictive skill of the RW-based reconstruction. The strong response of RW and ΔBI in P. lawrencei to precipitation, as demonstrated in this study, hence emphasises the potential to improve the coverage of high-resolution, moisture sensitive proxy records on the Australian continent. This would present an opportunity to produce new robust multi-century precipitation reconstructions for southeast Australia.
Tree-ring-based reconstructions of additional hydrological parameters such as streamflow can provide valuable insights into water resource managers and planners, particularly considering the confined range of observational records. In this study, we therefore also conducted a preliminary evaluation of a potential P. lawrencei tree-ring–streamflow relationship. The lack of streamflow gauge datasets of comparable length to the P. lawrencei chronologies limited overlapping records to 43 years (1955–1998) for the Mitta Mitta River and just 26 years (1968–1994) for Livingstone Creek. Nonetheless, ΔBI exhibited a particularly strong positive response to the current growth season June to March streamflow at Livingstone Creek and with current season July streamflow at the Mitta Mitta River (Fig. A2). Correlations between the RW chronology and streamflow data at Livingstone Creek were non-significant. However, significant negative (positive) responses of RW to current (previous) growth season streamflow in June and November at the Mitta Mitta River are apparent (Fig. A2). Whilst some strong correlations are present, the inconsistency of results across sites requires further explanation.
3.3 Limitations and future prospects
It is important to first note the necessity of full-stem cross-sections for accurate dating of P. lawrencei due to highly eccentric growth behaviour and frequent ring wedging. Whilst the destructive sampling method required to obtain such cross-sections may not always be justified or permissible (February and Stock, 1998; McDougall et al., 2012), ample opportunity exists for further collection of fire-killed P. lawrencei stands throughout the Australian Alps, given the frequency of large-scale fire activity in recent decades.
Both RW and BI chronologies in this study were inherently challenged by a limited sample size of just nine stem cross-sections. Earlier dendroclimatological studies of P. lawrencei by McDougall et al. (2012) and Brookhouse and Graham (2016) produced chronologies based on 48 and 13 samples respectively. Whilst the ΔBI data produced in this study presented a relatively strong common climate signal, multiple BI chronologies reported in previous works have highlighted the requirement of a greater sample size to achieve comparable inter-series correlations to MXD (e.g. Wilson et al., 2014; Blake et al., 2020). It is therefore likely that the common signal strength of the P. lawrencei BI chronologies would increase substantially with the incorporation of additional series, particularly on longer timescales.
Tree-ring parameters are known to comprise a considerable degree of non-climatic variance at lower frequencies (Cook, 1985; Esper et al., 2005; Fonti et al., 2009; Björklund et al., 2020). Blue intensity chronologies in particular have displayed stronger responses to temperature at high frequencies yet generally poorer portrayals of low-frequency trends when compared to RW (e.g. Rydval et al., 2014; Wilson et al., 2021). Samples in this study consist of a vast range of ages. Whilst the smoothing spline method of detrending aims to preserve the majority of the resolvable low-frequency variance (Cook et al., 1995), the extent to which this approach impacts the expression of low-frequency variance requires further exploration with longer P. lawrencei chronologies.
Whilst correlation analysis between RW and BI chronologies and climate variables in this study has empirically highlighted the strength of the P. lawrencei growth response to climate, a more detailed understanding of physiological mechanisms is required to further establish the causality of these relationships. Given the limited study of the dendroclimatological properties of P. lawrencei thus far and our relatively rudimentary understanding of the BI–density link, further sampling and physiological investigation is warranted. This would allow for better interpretation of RW and BI data and improve upon an already encouraging expression of the climate signal.
Despite earlier quite pessimistic assessments of the Podocarpus genus for dendroclimatological purposes (Dunwiddie, 1979; February and Stock, 1998), due in part to limited sample availability (in the absence of fire-killed specimens) the strength of the observed correlations presented in this study of just nine samples is promising with regard to the future analysis of this species. The BI method appears to offer a promising additional proxy to RW for P. lawrencei, as in other SH species in which the climate signal of BI parameters has been explored (Blake et al., 2020; Wilson et al., 2021). The ongoing development and application of the BI method in P. lawrencei, particularly for longer, multi-centennial-scale chronologies may help significantly improve our understanding of past climatic changes in the SH, given the valuable position annually resolved, tree-ring-based proxies hold in palaeoclimatology.
Despite inherent challenges due to growth abnormalities, this study has presented cross-dated P. lawrencei RW and BI chronologies on the order of 70 years for climate analysis (with individual (non-cross-dated) series dating back to 1676), based on nine fire-killed specimens from Mt Loch in the Victorian Alps. Ring-width measurements displayed the strongest responses to mean winter temperature maxima and snow depth, analogous to that demonstrated by high-altitude E. pauciflora communities. The ΔBI parameter exhibited a greater sensitivity to climate than earlywood or latewood BI, presenting a particularly strong relationship with temperature and precipitation in the current growing season. This study offers encouraging results, particularly those pertaining to RW, for the increased utilisation of P. lawrencei in Australian dendroclimatology. With ongoing efforts to further reduce the limitations of the BI parameter and develop the most appropriate detrending methods as well as the incorporation of anatomical analysis, the BI method also offers an important opportunity in Australian dendroclimatology. Given the known longevity of individual P. lawrencei specimens, the temporal extension and increased utilisation of P. lawrencei chronologies from the Australian Alps may help to provide an important perspective on climate change in the region. A detailed dendroclimatological network of this species could contribute meaningfully towards improving palaeoclimate data coverage in the Southern Hemisphere.
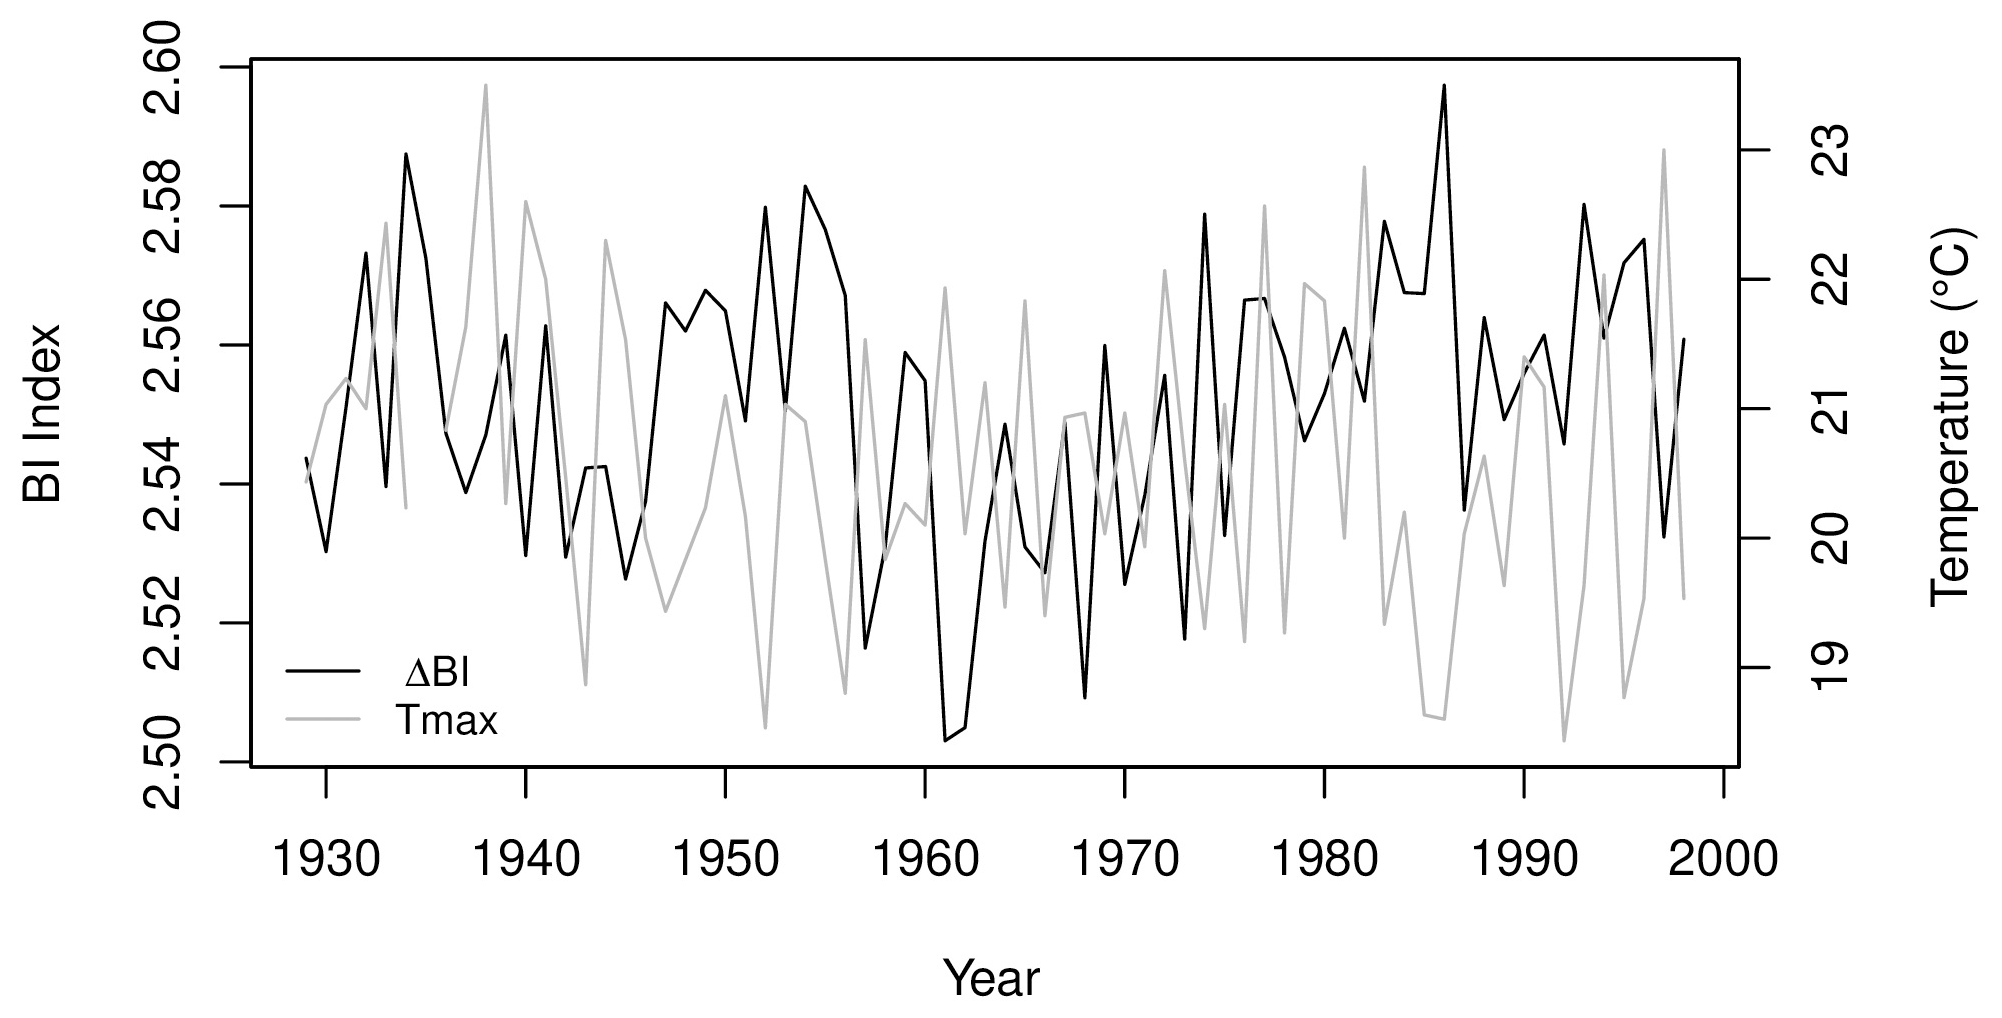
Figure A1P. lawrencei ΔBI chronology and mean October–December maximum temperature at Omeo observation station, for the 1929–1998 period.
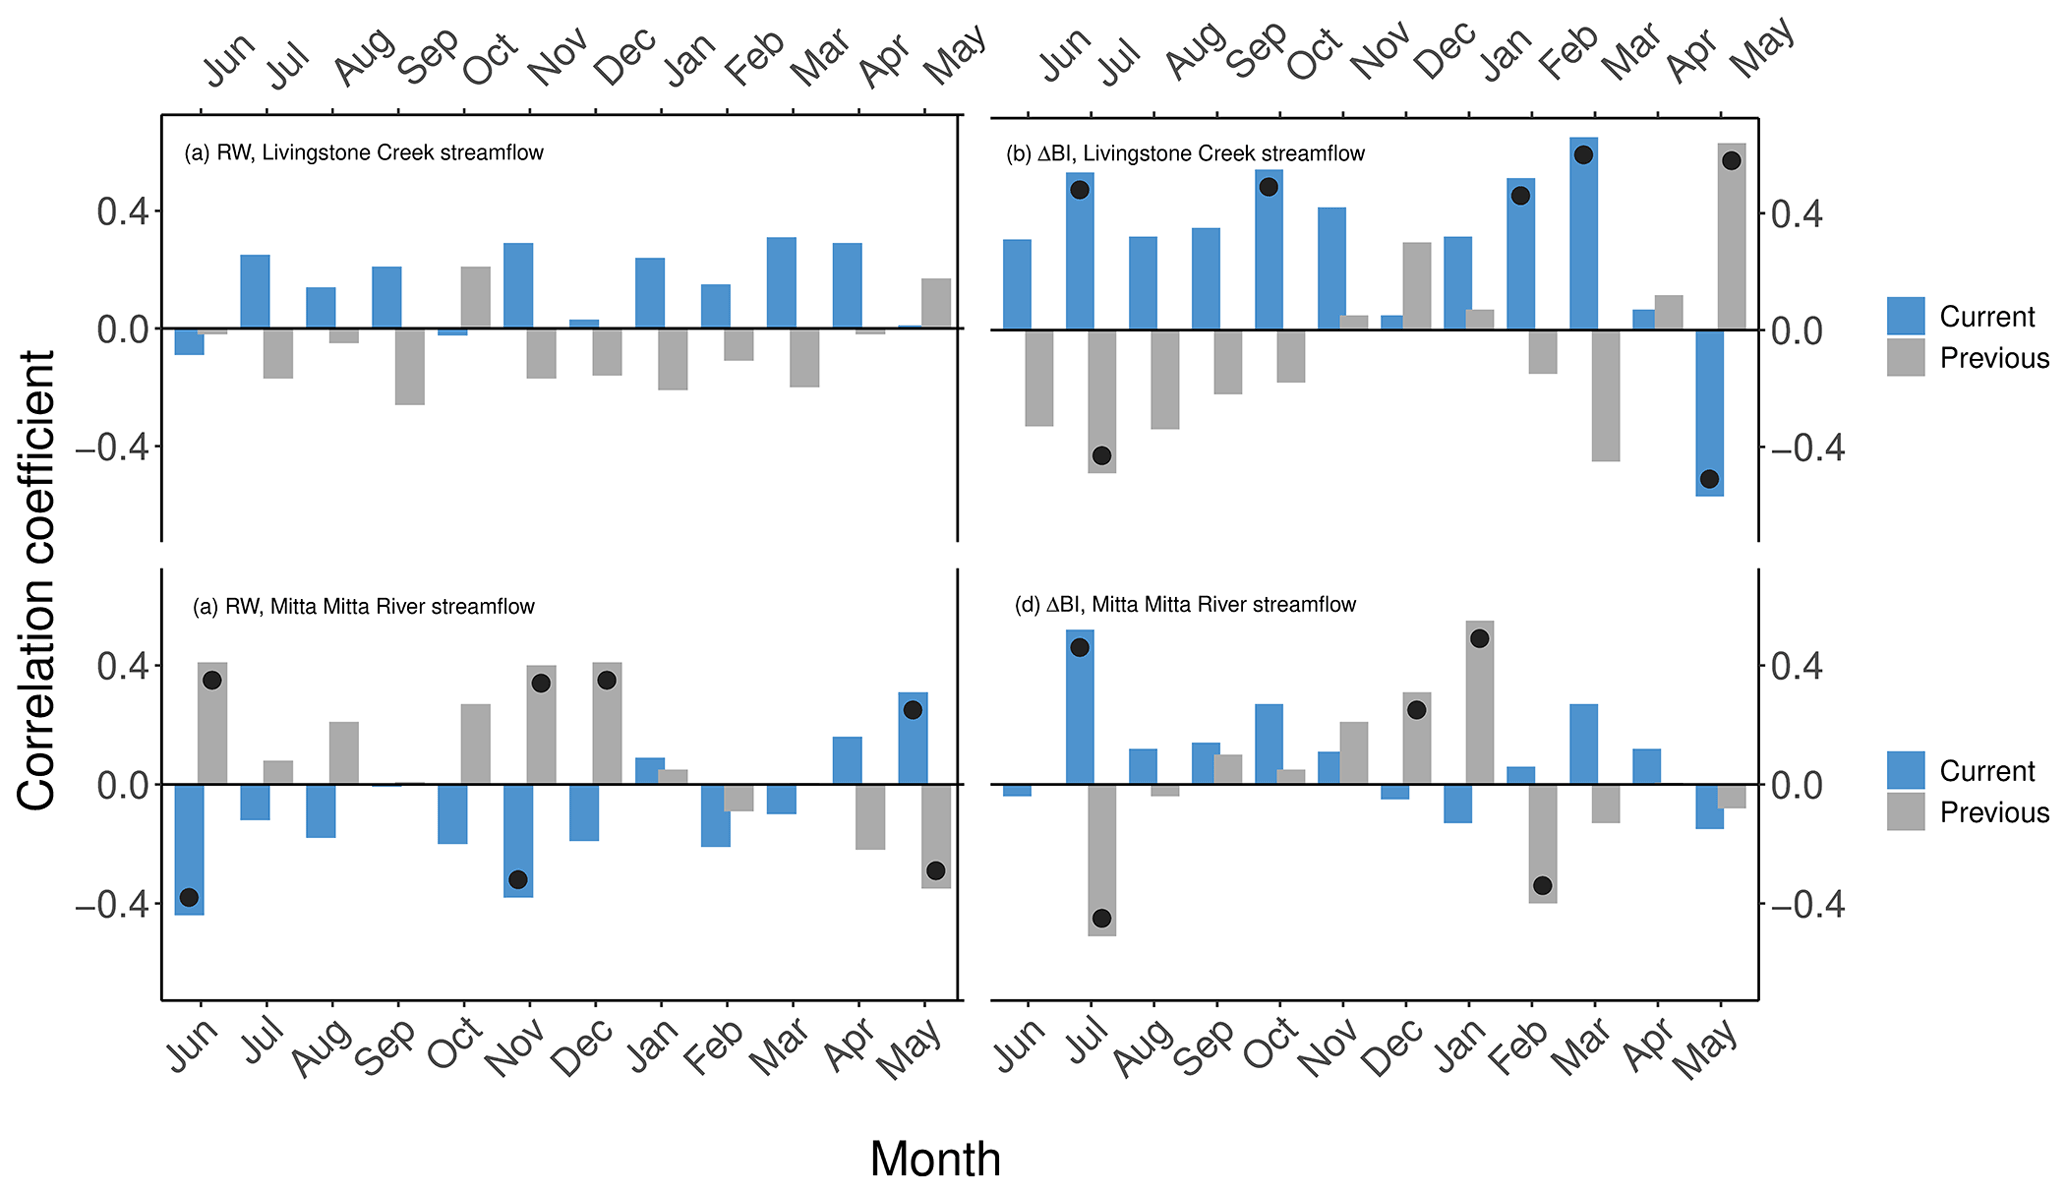
Figure A2Correlations between RW and ΔBI chronologies and total monthly streamflow (m3 s−1) at Livingstone Creek at Omeo for the 1968–1994 period and total monthly streamflow (ML) at the Mitta Mitta River at Hinnomunjie across the 1955–1998 period. Black dots indicate statistical significance (p<0.05).
The R package “dplr” used in this paper can be found at https://cran.r-project.org/web/packages/dplR/index.html (last access: 17 November 2022, Bunn et al., 2022).
The observation station data used in this paper can be found at https://doi.org/10.4227/166/5a8647d1c23e0 (Australian Bureau of Meteorology, 2019).
JAO'C undertook all of the cross-dating, measurements and climate analysis and took the lead role in writing the paper. BJH conceived and developed the project, provided supervision, mentoring and equipment, and guided the climate analysis. MTB provided the samples, conceived the study of the location and species, and advised on the interpretation of the analysis. KJA guided the dendrochronological analysis and interpretation. All authors contributed significantly to the paper.
The contact author has declared that none of the authors has any competing interests.
Publisher’s note: Copernicus Publications remains neutral with regard to jurisdictional claims in published maps and institutional affiliations.
Benjamin J. Henley and Jacinda A. O'Connor wish to thank Rob Evans (Silviscan) for his advice, support and mentorship during the project. Benjamin J. Henley and Jacinda A. O'Connor would also like to thank Johanna Speirs and James Pirozzi (Snowy Hydro) for their support for this project and for the provision of meteorological and hydrological data. This authors wish to acknowledge the Australian Bureau of Meteorology for their provision of meteorological and hydrological data.
This research was supported by the School of Earth Atmosphere and Environment at Monash University and was carried out as part of the Australian Research Council (ARC; SRIEAS grant no. SR200100005), Securing Antarctica's Environmental Future. It was also supported by the University of Melbourne (Early Career Researcher Grant to Benjamin J. Henley) and an Australian Research Council Future Fellowship (grant no. FT200100102) to Kathryn J. Allen.
This paper was edited by Julie Loisel and reviewed by two anonymous referees.
Allen, K. J., Cook, E. R., Francey, R. J., and Michael, K.: The climatic response of Phyllocladus Aspleniifolius (Labill.) Hook. f in Tasmania, J. Biogeogr., 28, 305–316, https://doi.org/10.1046/j.1365-2699.2001.00546.x, 2001.
Allen, K. J., Freund, M. B., Palmer, J. G., Simkin, R., Williams, L., Brookhouse, M., Cook, E. R., Stewart, S., and Baker, P. J.: Hydroclimate extremes in a north Australian drought reconstruction asymmetrically linked with Central Pacific Sea surface temperatures, Global Planet. Change, 195, 103329, https://doi.org/10.1016/j.gloplacha.2020.103329, 2020.
Australian Bureau of Meteorology: Australian Gridded Climate Data (AGCD), Bureau of Meteorology [data set], https://doi.org/10.4227/166/5a8647d1c23e0, 2019.
Björklund, J., Seftigen, K., Schweingruber, F., Fonti, P., von Arx, G., Bryukhanova, M. V., Cuny, H. E., Carrer, M., Castagneri, D., and Frank, D. C.: Cell size and wall dimensions drive distinct variability of earlywood and latewood density in Northern Hemisphere conifers, New Phytol., 216, 728–740, https://doi.org/10.1111/nph.14639, 2017.
Björklund, J., Seftigen, K., Fonti, P., Nievergelt, D., and von Arx, G.: Dendroclimatic potential of dendroanatomy in temperature-sensitive Pinus sylvestris, Dendrochronologia, 60, 125673, https://doi.org/10.1016/j.dendro.2020.125673, 2020.
Björklund, J. A., Gunnarson, B. E., Seftigen, K., Esper, J., and Linderholm, H. W.: Blue intensity and density from northern Fennoscandian tree rings, exploring the potential to improve summer temperature reconstructions with earlywood information, Clim. Past, 10, 877–885, https://doi.org/10.5194/cp-10-877-2014, 2014.
Blake, S. A. P., Palmer, J. G., Björklund, J., Harper, J. B., and Turney, C. S. M.: Palaeoclimate potential of New Zealand Manoao colensoi (silver pine) tree rings using Blue-Intensity (BI), Dendrochronologia, 60, 125664, https://doi.org/10.1016/j.dendro.2020.125664, 2020.
Briffa, K. R., Jones, P. D., and Schweingruber, F. H.: Summer temperature patterns over Europe: A Reconstruction from 1750 A.D. based on maximum latewood density indices of conifers, Quaternary Res., 30, 36–52, https://doi.org/10.1016/0033-5894(88)90086-5, 1988.
Brookhouse, M. and Graham, R.: Application of the Minimum Blue-Intensity Technique to A Southern-Hemisphere Conifer, Tree-Ring Res., 72, 103–107, https://doi.org/10.3959/1536-1098-72.02.103, 2016.
Brookhouse, M., Lindesay, J., and Brack, C.: The potential of tree rings in Eucalyptus pauciflora for climatological and hydrological reconstruction, Geogr. Res., 46, 421–434, https://doi.org/10.1111/j.1745-5871.2008.00535.x, 2008.
Brookhouse, M. T. and Bi, H.: Elevation-dependent climate sensitivity in Eucalyptus pauciflora Sieb. ex Spreng, Trees, 23, 1309–1320, https://doi.org/10.1007/s00468-009-0372-6, 2009.
Buckley, B. M., Cook, E. R., Peterson, M. J., and Barbetti, M.: A changing temperature response with elevation for Lagarostrobos franklinii in Tasmania, Australia, Climatic Change, 36, 477–498, https://doi.org/10.1023/a:1005322332230, 1997.
Bunn, A., Korpela, M., Biondi, F., Campelo, F., Mérian, P., Qeadan, F., Zang, C., Buras, A., Cecile, A., Mudelsee, M., Schulz, M., Klesse, S., Frank, D., Visser, R., Cook, E., and Anchukaitis, K.: dplR: Dendrochronology Program Library in R, CRAN [code], https://cran.r-project.org/web/packages/dplR/index.html, last access: 17 November 2022.
Bunn, A. G.: A Dendrochronology Program Library in R (dplr), Dendrochronologia, 26, 115–124, https://doi.org/10.1016/j.dendro.2008.01.002, 2008.
Bunn, A. G.: Statistical and visual crossdating in R using the DPLR Library, Dendrochronologia, 28, 251–258, https://doi.org/10.1016/j.dendro.2009.12.001, 2010.
Bureau of Meteorology (BOM): Australia's Global Climate Observing System, Australian Bureau of Meteorology, Melbourne, 2001.
Campbell, R., McCarroll, D., Robertson, I., Loader, N. J., Grudd, H., and Gunnarson, B.: Blue intensity in Pinus sylvestris tree rings: developing a new palaeoclimate proxy, Tree-Ring Res., 67, 127–134, https://doi.org/10.3959/2010-13.1, 2007.
Campbell, R., McCarroll, D., Robertson, I., Loader, N. J., Grudd, H., and Gunnarson, B.:. Blue Intensity In Pinus sylvestris Tree Rings: A Manual for A New Palaeoclimate Proxy, Tree-Ring Res., 67, 127–134, https://doi.org/10.3959/2010-13.1, 2011.
Cook, E., Shiyatov, S., and Mazepa, V.: Estimation of the mean chronology, Methods of dendrochronology: applications in the environmental sciences, 123–132, ISBN-10: 0792305868, 1990.
Cook, E. R.: A time series analysis approach to tree ring standardization (dendrochronology, forestry, Dendroclimatology, autoregressive process), PhD thesis, 1985.
Cook, E. R., Briffa, K. R., Meko, D. M., Graybill, D. A., and Funkhouser, G.: The “segment length curse” in long tree-ring chronology development for palaeoclimatic studies, The Holocene, 5, 229–237, https://doi.org/10.1177/095968369500500211, 1995.
Cook, E. R., Buckley, B. M., D’Arrigo, R. D., and Peterson, M. J.: Warm-season temperatures since 1600 BC reconstructed from Tasmanian tree rings and their relationship to large-scale sea surface temperature a nomalies, Clim. Dynam., 16, 79–91, https://doi.org/10.1007/s003820050006, 2000.
Cook, E. R., Buckley, B. M., Palmer, J. G., Fenwick, P., Peterson, M. J., Boswijk, G., and Fowler, A.: Millennia-long tree-ring records from Tasmania and New Zealand: A basis for modelling climate variability and forcing, past, present and future, J. Quaternary Sci., 21, 689–699, https://doi.org/10.1002/jqs.1071, 2006.
Costin, A. B., Gay, L. W., Wimbush, D. J., and Kerr, D.: Studies in catchment hydrology in the Australian Alps. III. Preliminary snow investigations, Scientific and Industrial Research Organisation, Melbourne, https://doi.org/10.25919/5f36df3c9b1aa, 1961.
Costin, A. B., Gray, M., Totterdell, C. J., and Wimbush, D.: Kosciuszko Alpine Flora, CSIRO Publishing, Clayton South, VIC, ISBN: 9781486309122, 2000.
Creber, G. T. and Chaloner, W. G.: Influence of environmental factors on the wood structure of living and fossil trees, Bot. Rev., 50, 357–448, https://doi.org/10.1007/bf02862630, 1984.
Cullen, L. E. and Grierson, P. F.: Multi-decadal scale variability in autumn-winter rainfall in south-western Australia since 1655 AD as reconstructed from tree rings of Callitris columellaris, Clim. Dynam., 33, 433–444, https://doi.org/10.1007/s00382-008-0457-8, 2008.
Cuny, H. E., Rathgeber, C. B. K., Frank, D., Fonti, P., and Fournier, M.: Kinetics of tracheid development explain conifer tree-ring structure, New Phytol., 203, 1231–1241, https://doi.org/10.1111/nph.12871, 2014.
D'Arrigo, R. D., Jacoby, G. C., and Free, R. M.: Tree-ring width and maximum latewood density at the North American Tree Line: Parameters of Climatic Change, Can. J. Forest Res., 22, 1290–1296, https://doi.org/10.1139/x92-171, 1992.
D'Arrigo, R. D., Jacoby, G. C., Bunker, D. E., Malmstrom, C. M., and Los, S. O.: Correlation between maximum latewood density of annual tree rings and NDVI based estimates of forest productivity, Int. J. Remote Sens., 21, 2329–2336, https://doi.org/10.1080/01431160050029611, 2000.
Davi, N., Davi, N. K., Jacoby, G. C., and Wiles, G. C.: Boreal temperature variability inferred from maximum latewood density and tree-ring width data, Wrangell Mountain region, Alaska, Quaternary Res., 60, 252–262, https://doi.org/10.1016/s0033-5894(03)00115-7, 2003.
Dunwiddie, P. W.: Dendrochronological studies of indigenous New Zealand trees, New Zeal. J. Bot., 17, 251–266, https://doi.org/10.1080/0028825X.1979.10426899, 1979.
Esper, J., Cook, E. R., and Schweingruber, F. H.: Low-frequency signals in long tree-ring chronologies for reconstructing past temperature variability, Science, 295, 2250–2253, https://doi.org/10.1126/science.1066208, 2002.
Esper, J., Frank, D. C., Wilson, R. J. S., and Briffa, K. R.: Effect of scaling and regression on reconstructed temperature amplitude for the past millennium, Geophys. Res. Lett., 32, L07711, https://doi.org/10.1029/2004GL021236, 2005.
Evans, A., Jones, D., Smalley, R., and Lellyett, S.: An enhanced gridded rainfall analysis scheme for Australia, Bureau of Meteorology, Melbourne, Vic, Australia, Bureau Research Report No. 41, 2020.
February, E. C. and Stock, W. D.: An assessment of the dendrochronological potential of two Podocarpus species, Holocene, 8, 747–750, https://doi.org/10.1191/095968398674919061, 1998.
Fonti, P., Treydte, K., Osenstetter, S., Frank, D., and Esper, J.: Frequency-dependent signals in multi-centennial oak vessel data, Palaeogeogr. Palaeocl., Palaeoecol., 275, 92–99, https://doi.org/10.1016/j.palaeo.2009.02.021, 2009.
Frank, D. and Esper, J.: Characterization and climate response patterns of a high-elevation, multi-species tree-ring network in the European Alps, Dendrochronologia, 22, 107–121, https://doi.org/10.1016/j.dendro.2005.02.004, 2005.
Frith, A.: Exploring Methods of Blue Intensity in Dendrochronology, unpublished undergraduate dissertation project, University of St Andrews, UK, 2009.
Halter, R.: Root growth of Eucalyptus pauciflora Sieber ex Sprengel ssp. pauciflora on Mount Stirling, southeastern Australia, Northwest Sci., 72, 274–282, 1998.
Heinrich, I. and Allen, K.: Current issues and recent advances in Australian dendrochronology: Where to next?, Geogr. Res., 51, 180–191, https://doi.org/10.1111/j.1745-5871.2012.00786.x, 2013.
Hughes, M. K.: Dendroclimatology in high-resolution paleoclimatology, in: Dendroclimatology, edited by: Hughes, M., Swetnam, T., and Diaz, H., Springer, Dordrecht, 17–34, https://doi.org/10.1007/978-1-4020-5725-0_2, 2011.
Kaczka, R. J., Spyt, B., Janecka, K., and Musioł, R.: The Blue Intensity proxy for >400 years growing season temperature reconstruction from the Tatra Mountains, TRACE, 15, 23–30, 2017.
Kudo, G.: Effects of snow-free period on the phenology of alpine plants inhabiting snow patches, Arctic Alpine Research, 23, 436–443, https://doi.org/10.2307/1551685, 1991.
Jones, D., Wang, W., and Fawcett, R.: High-quality spatial climate data-sets for Australia, Aust. Meteorol. Ocean., 58, 233–248, https://doi.org/10.22499/2.5804.003, 2009.
Larocque, S. J. and Smith, D. J.: A dendroclimatological reconstruction of climate since AD 1700 in the Mt. Waddington area, British Columbia Coast Mountains, Canada, Dendrochronologia, 22, 93–106, https://doi.org/10.1016/j.dendro.2005.02.003, 2005.
McCarroll, D., Pettigrew, E., Luckman, A., Guibal, F., and Edouard, J.-L.: Blue Reflectance Provides a Surrogate for Latewood Density of High-latitude Pine Tree Rings, Arct. Antarct. Alp. Res., 34, 450–453, https://doi.org/10.1080/15230430.2002.12003516, 2002.
McDougall, K. L., Brookhouse, M. T., and Broome, L. S.: Dendroclimatological investigation of mainland Australia's only alpine conifer, Podocarpus lawrencei Hook.f, Dendrochronologia, 30, 1–9, https://doi.org/10.1016/j.dendro.2011.01.011, 2012.
Nishimura, P. H. and Laroque, C. P.: Observed continentality in radial growth-climate relationships in a twelve site network in western Labrador, Canada, Dendrochronologia, 29, 17–23, https://doi.org/10.1016/j.dendro.2010.08.003, 2011.
O'Donnell, A. J., McCaw, W. L., Cook, E. R., and Grierson, P. F.: Megadroughts and pluvials in southwest Australia: 1350–2017 CE, Clim. Dynam., 57, 1817–1831, https://doi.org/10.1007/s00382-021-05782-0, 2021.
Ogden, J.: On the dendrochronological potential of Australian trees, Aust. J. Ecol., 3, 339–356, https://doi.org/10.1111/j.1442-9993.1978.tb01184.x, 1978.
Ogden, J.: Dendrochronological studies and the determination of Tree ages in the Australian Tropics, J. Biogeogr., 8, 405–420, https://doi.org/10.2307/2844759, 1981.
Palmer, J. G. and Xiong, L.: New Zealand climate over the last 500 years reconstructed from Libocedrus bidwillii Hook. f. tree-ring chronologies, Holocene, 14, 282–289, https://doi.org/10.1191/0959683604hl679rr, 2004.
Pittock, A. B.: A Critical Look at Long-Term Sun-Weather Relationships, Rev. Geophys., 16, 400–420, https://doi.org/10.1029/RG016i003p00400, 1978.
Pittock, A. B.: Climate change: an Australian guide to the science and potential impacts, Australian Greenhouse Office, Canberra, ISBN-10: 1920840125, 2003.
Rathgeber, C. B., Decoux, V., and Leban, J. M.: Linking intra-tree-ring wood density variations and Tracheid anatomical characteristics in Douglas fir (pseudotsuga menziesii (Mirb.) Franco), Ann. For. Sci., 63, 699–706, https://doi.org/10.1051/forest:2006050, 2006.
Rydval, M., Larsson, L. Å., McGlynn, L., Gunnarson, B. E., Loader, N. J., Young, G. H. F., and Wilson, R.: Blue intensity for dendroclimatology: Should we have the blues? Experiments from Scotland, Dendrochronologia, 32, 191–204, https://doi.org/10.1016/j.dendro.2014.04.003, 2014.
Rydval, M., Druckenbrod, D. L., Svoboda, M., Trotsiuk, V., Janda, P., Mikoláš, M., Čada, V., Bače, R., Teodosiu, M., and Wilson, R.: Influence of sampling and disturbance history on climatic sensitivity of temperature-limited conifers, Holocene, 28, 1574–1587, https://doi.org/10.1177/0959683618782605, 2018.
Schweingruber, F. H.: Tree rings: basics and applications of dendrochronology, Springer Sci. Bus. Media, ISBN-10: 0792305590, 1988.
Schweingruber, F. H.: Annual growth rings and growth zones in woody plants in Southern Australia, Int. Assoc. Wood Anat. Bull., 1, 359–379, 1992.
Seftigen, K., Fuentes, M., Ljungqvist, F. C., and Björklund, J.: Using Blue Intensity from drought-sensitive Pinus sylvestris in Fennoscandia to improve reconstruction of past hydroclimate variability, Clim. Dynam., 55, 579–594, https://doi.org/10.1007/s00382-020-05287-2, 2020.
Vaganov, E. A., Hughes, M. K., Kirdyanov, A. V., Schweingruber, F. H., and Silkin, P. P.: Influence of snowfall and melt timing on tree growth in Subarctic Eurasia, Nature, 400, 149–151, https://doi.org/10.1038/22087, 1999.
Vaganov, E. A., Hughes, M. K., and Shashkin, A. V.: Growth Dynamics of Conifer Tree Rings: Images of past and future environments, Springer, Berlin, ISBN-10: 3540260862, 2006.
Venn, S. E. and Morgan, J. W.: Phytomass and phenology of three alpine snowpatch species across a natural snowmelt gradient, Aust. J. Bot., 55, 450–456, https://doi.org/10.1071/bt06003, 2007.
Villalba, R.: Dendroclimatology: A Southern Hemisphere perspective, in: Southern Hemisphere Paleo- and Neoclimates, edited by: Smolka, P. and Volkheimer, W., Springer, Berlin, Heidelberg, 27–57, https://doi.org/10.1007/978-3-642-59694-0_4, 2000.
Villalba, R., Veblen, T. T., and Ogden, J.: Climatic influences on the growth of subalpine trees in the Colorado Front Range, Ecology, 75, 1450–1462, https://doi.org/10.2307/1937468, 1994.
Villalba, R., Boninsegna, J. A., Lara, A., Veblen, T. T., Roig, F. A., Aravena, J.-C., and Ripalta, A.: Interdecadal climatic variations in millennial temperature reconstructions from southern South America, in: Climatic Variations and Forcing Mechanisms of the Last 2000 Years, edited by: Jones, P. D., Bradley, R. S., and Jouzel, J., Springer, Berlin, Heidelberg, 161–189, https://doi.org/10.1007/978-3-642-61113-1_9, 1996.
Wahren, C. H., Williams, R. J., and Papst, W. A.: Alpine and subalpine snow patch vegetation on the Bogong High Plains, SE Australia, J. Veg. Sci., 12, 779–790, https://doi.org/10.2307/3236865, 2001.
Wigley, T. M., Briffa, K. R., and Jones, P. D.: On the average value of correlated time series, with applications in dendroclimatology and hydrometeorology, J. Clim. Appl. Meteorol., 23, 201–213, https://doi.org/10.1175/1520-0450(1984)023<0201:otavoc>2.0.co;2, 1984.
Williams, R., Wahren, C. H., Tolsma, A. D., Sanecki, G. M., Papst, W. A., Myers, B. A., McDougall, K. L., Heinze, D. A., and Green, K.: Large fires in Australian alpine landscapes: Their part in the historical fire regime and their impacts on alpine biodiversity, Int. J. Wildland Fire, 17, 793–808, https://doi.org/10.1071/WF07154, 2008.
Wilson, R., Rao, R., Rydval, M., Wood, C., Larsson, L.-Å., and Luckman, B. H.: Blue Intensity for dendroclimatology: The BC blues: A case study from British Columbia, Canada, Holocene, 24, 1428–1438, https://doi.org/10.1177/0959683614544051, 2014.
Wilson, R., Allen, K., Baker, P., Boswijk, G., Buckley, B., Cook, E., D'Arrigo, R., Druckenbrod, D., Fowler, A., Grandjean, M., Krusic, P., and Palmer, J.: Evaluating the dendroclimatological potential of blue intensity on multiple conifer species from Tasmania and New Zealand, Biogeosciences, 18, 6393–6421, https://doi.org/10.5194/bg-18-6393-2021, 2021.