the Creative Commons Attribution 4.0 License.
the Creative Commons Attribution 4.0 License.
 | 25 Oct 2022
Mid-Holocene climate of the Tibetan Plateau and hydroclimate in three major river basins based on high-resolution regional climate simulations
Yiling Huo
William Richard Peltier
Deepak Chandan
The Tibetan Plateau (TP) contains the headwaters of major Asian rivers that sustain billions of people and plays an important role in both regional and global climate through thermal and mechanical forcings. Understanding the characteristics and changes to the hydrological regimes on the TP during the mid-Holocene (MH) will help in understanding the expected future changes. Here, an analysis of the hydroclimates over the headwater regions of three major rivers originating in the TP, namely the Yellow, Yangtze, and Brahmaputra rivers, is presented, using dynamically downscaled climate simulations constructed using the Weather Research and Forecasting Model (WRF) coupled to the hydrological model WRF-Hydro. Green Sahara (GS) boundary conditions have also been incorporated into the global model so as to capture the remote feedbacks between the Saharan vegetation and the river hydrographs over the TP. Model–data comparisons show that the dynamically downscaled simulations significantly improve the regional climate simulations over the TP in both the modern day and the MH, highlighting the crucial role of downscaling in both present-day and past climates. TP precipitation is also strongly affected by the greening of the Sahara, with a particularly large increase over the southern TP, as well as a delay in the monsoon withdrawal. The simulation results were first validated over the upper basins of the three rivers before the hydrological responses to the MH forcing for the three basins were quantified. Both the upper Yellow and Yangtze rivers exhibit a decline in streamflow during the MH, especially in summer, which is a combined effect of less snowmelt and stronger evapotranspiration. The GS forcing caused a rise in temperature during the MH, as well as larger rainfall but less snowfall and greater evaporative water losses. The Brahmaputra River runoff is simulated to increase in the MH due to greater net precipitation.
- Article
(12918 KB) - Full-text XML
- BibTeX
- EndNote


The Tibetan Plateau (TP), often referred to as the Third Pole, with an average elevation exceeding 4000 m and an area of 2.5×10⁶ km2, constitutes the highest and largest plateau in the world. The TP also has the most extensive cryosphere outside the Arctic–Greenland and Antarctic regions (Yao et al., 2012), including snow cover, glaciers, and permafrost. Moreover, the TP is also widely believed to have a huge impact on both the local and global climate through thermal and mechanical forcing (Kutzbach et al., 1993; An et al., 2001; Molnar et al., 2010). Climate over the TP, featuring warm wet summers and cold dry winters, is extremely sensitive to global warming and has undergone rapid and profound changes in recent years (Lehnert et al., 2016; Yao et al., 2019). With an elevation gradually decreasing from the northwest to the southeast, the TP also acts as the “water tower” and the source region of large rivers in Asia that flow down to almost half of humanity, including the Yellow, Yangtze and Brahmaputra (Yarlung Tsangpo) rivers (Immerzeel et al., 2020).
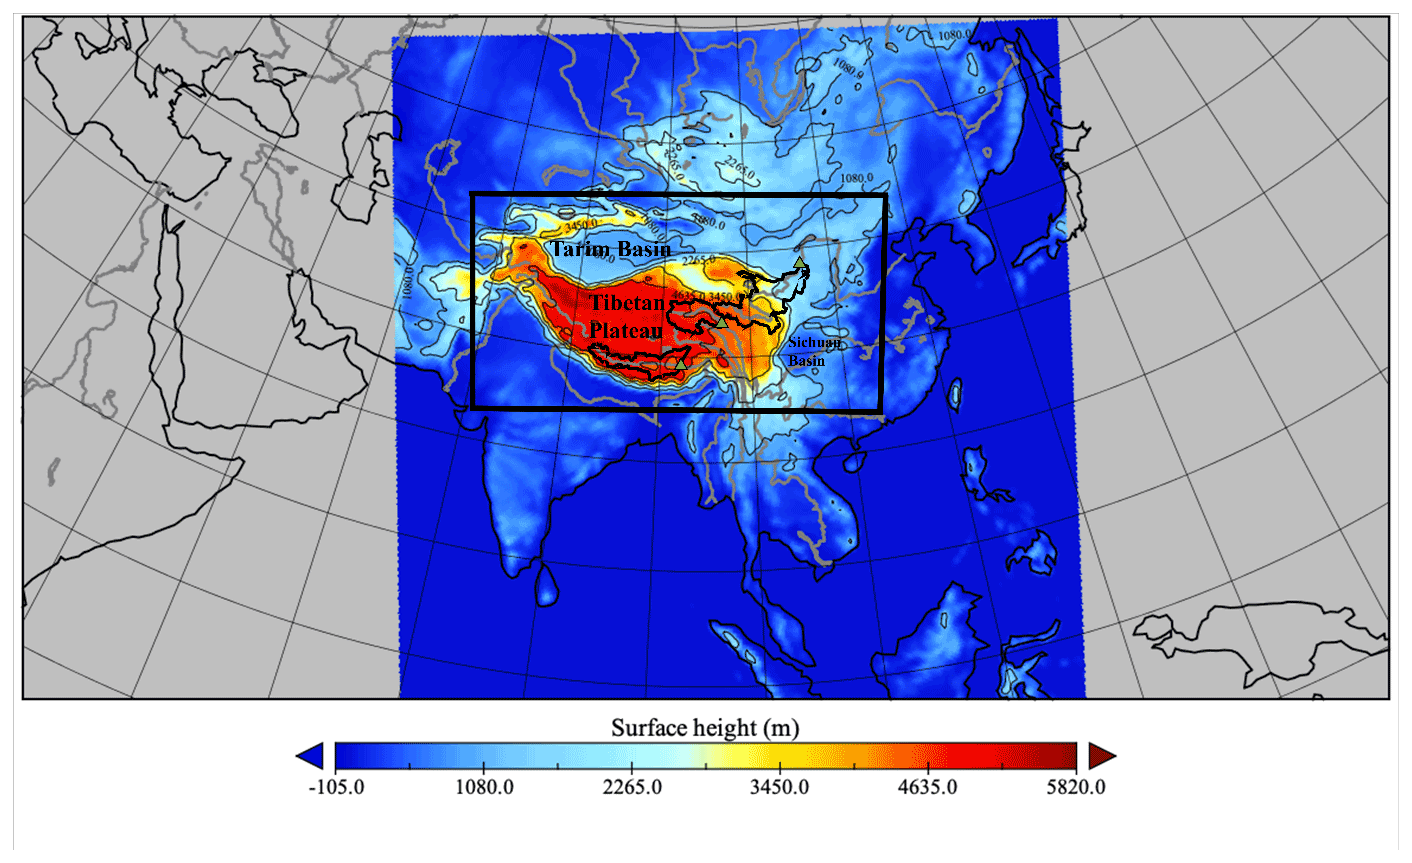
Figure 1Topography (m) in the outer WRF domain, as well as the major rivers and lakes (grey). The black rectangle represents the inner WRF domain. Black curves denote outlines of the UBB, UYAB, and UYEB at the left, middle, and right. Green triangles inside each basin denote the Yangcun (left), Zhimenda (middle), and Tanglai Qu (right) stations.
The Yellow River, which is often referred to as the cradle of the Chinese civilization, rises in the northern part of the TP (Fig. 1) and supports nearly one-third of China's population (Huang et al., 2009). It passes across the Loess Plateau and the North China Plain before emptying into the ocean on the eastern coast of China. The Yellow River's headwaters are located in the Bayan Har Mountains in the northern TP. Its water resources are vital to the unique but fragile ecosystems in the upper Yellow River basin (UYEB) and are extremely sensitive to climate change. The longest river in Asia, the Yangtze, originates in the Tanggula Mountains over the eastern part of the TP and flows eastwards to the East China Sea (Fig. 1). Its drainage basin comprises one-fifth of China's land area, which is home to nearly a third of the country's population. The Brahmaputra River, which originates in the southern TP and flows eastwards before turning southward into India in Arunachal Pradesh, is an important trans-boundary river. After entering India, it turns southwestward and eventually enters Bangladesh where it merges with the Padama River in the Ganges delta. There is dramatic climatic heterogeneity within its drainage area, from the cold dry upper region with an altitude higher than 5000 m, which features glaciers and permanent snow, to the humid and hot downstream area that is only 200 m a.s.l. (above sea level). The Brahmaputra River flows across four Asian countries, including the countries with the two largest populations in the world, China and India. Understanding hydrological processes of these rivers is necessary for water resource management and is of significant economic importance for these countries.
Observations over the TP suggest a warming trend that is twice as large as the global average (IPCC, 2013), with spatial differences in precipitation and glacier changes (Yao et al., 2012). An increasing trend in precipitation has been observed to be occurring in the western and central TP, and a smaller precipitation increase has been detected in the eastern TP (Zhou et al., 2019). The TP has generally become wetter and warmer during the past 3 decades, although the southern part has turned drier (Yang et al., 2014). As an important hydrologic process in mountain regions, the melting of glaciers can greatly modify the characteristics of streamflow, including magnitude, timing, and variability (Kaser et al., 2010; Immerzeel et al., 2020). Both temperature and precipitation changes will significantly influence glacier melt (Barnett et al., 2005; Immerzeel et al., 2020), inducing heterogenous responses over different parts of the TP. Higher temperature can significantly enhance glacier melt by removing fresh snow and hence decreasing surface albedo (Barnett et al., 2005). Glacier melt is a particularly important source of streamflow during warm and dry seasons, which will enhance the downstream discharge of the rivers (Kaser et al., 2010; Yao et al., 2004). However, this increase is transitory and is expected to cease when the glaciers have largely retreated (Yao and Yao, 2010). The eventual disappearance of mountain glaciers after melting for a long time will result in a drop in streamflow in summer (Immerzeel et al., 2020) and pose a severe threat to access to water resources in the TP and downstream areas (Kehrwald et al., 2008).
Rivers that originate in the TP often suffer from a scarcity of data necessary for hydrological simulation because of the extreme conditions under which measurements must be acquired. Regional hydrological simulation in these ungauged areas therefore faces significant technical challenges due to the complex regional topography. The resolution of most global climate models (GCMs) is insufficient for this region because regional climate over the TP is strongly affected by the steep topographic gradients that are poorly resolved in global models. This hinders our ability to characterize the water cycle, study regional climate change impacts and find solutions to local water problems. Therefore, this study has dynamically downscaled global climate simulations to better resolve important regional topographic features.
The study of past climate conditions is an important tool in any effort to understand the mechanisms influencing present and future climate and its variability. In addition, understanding the range of variability will help to improve climate models that are used to simulate the regional response to a variety of abrupt and long-term changes in temperature, atmospheric circulation, and moisture sources, which in turn regulate the river discharge flowing out of the TP. The mid-Holocene (MH, approximately 6000 years ago) is one of the most widely studied periods of the Quaternary and is a period of focus for the Paleoclimate Modelling Intercomparison Project (PMIP). In the MH, variation in the Earth's orbital parameters led to differences in the latitudinal and seasonal distribution of incoming solar radiation (Berger 1978), resulting in a climate that was remarkably different from that of the present day. The insolation was anomalously strong (weak) in summer (winter) over the Northern Hemisphere (NH), leading to an enhancement of the seasonal cycle. A temperature optimum for the TP during the MH has been indicated by pollen data (Herzschuh, 2006; Lu et al., 2011; Ma et al., 2014). Understanding MH climatic changes over the TP will help the understanding of the impact of the recent or modern global warming and predict future climate change (Wanner et al., 2008). During the MH, South and East Asian monsoons are expected to have been enhanced due to the increased boreal summer insolation (Huo et al., 2021; Maher, 2008; Herzschuh, 2006). However, compared with the reconstructions, regional biases and large spreads are found in numerical simulations of the MH climate by the PMIP models, particularly over and around the TP (Zheng et al., 2013).
During the MH, changes in insolation and albedo feedbacks also strengthened the African monsoon, making northern Africa much wetter than today (Skinner and Poulsen, 2016). Lakes, rivers, and wetlands formed and developed in the now arid regions of northern Africa and led to a northward extension of the vegetation cover over the Sahara, i.e. a “Green Sahara” (GS; Chandan and Peltier, 2020; Pausata et al., 2020). Studies have shown that a vegetated Sahara and the strengthened African monsoon enhanced the Asian monsoon by altering the Walker circulation through changes in tropical Atlantic sea surface temperatures (SSTs; Pausata et al., 2017). The TP, which is situated within the region influenced by the Asian monsoon (Conroy and Overpeck, 2011), is thus also affected by the greening of the Sahara. One of the key goals of the present study is to outline the remote response of the MH TP climate to the GS teleconnection by analysing a set of simulations in which the land cover is changed from desert to shrubland over a large part of northern Africa (Chandan and Peltier, 2020). Since there are few studies that characterize the runoff over the TP under the MH climate conditions, in this study we also analyse the hydrological response of the TP rivers to the MH climate forcing.
The objective of this article is thus to first evaluate the performance of the coupled UofT-CCSM4-WRF-Hydro model over the TP and then analyse the response of hydroclimate over the three rivers over the TP to MH orbital forcing and remote GS feedback using high-resolution regional climate simulations. Section 2 describes experimental design and the model configurations. The validation of the results is discussed in Sect. 3, before the general patterns of MH anomalies are outlined. The central point of this study is hydroclimatological anomalies in the upper Yellow, Yangtze and Brahmaputra river basins (UYEB, UYAB, and UBB, respectively), which is presented in Sect. 4. Section 5 summarizes the main results of the present study.
2.1 Experimental design
This study employs dynamical downscaling, a modelling methodology based upon the use of a dynamically consistent, physically based high-resolution regional climate model (RCM) to downscale global climate simulations to better account for regional climate feedbacks. The global climate simulations used to drive the RCM have been obtained using the University of Toronto version of the National Center for Atmospheric Research (NCAR) Community Climate System Model version 4 (UofT-CCSM4; Peltier and Vettoretti, 2014; Chandan and Peltier, 2018). The global climate simulations are then dynamically downscaled to 10 km resolution using the Weather Research and Forecasting (WRF) model version 4.1 with four different convection parameterization schemes, constituting a small physics ensemble. We have also coupled WRF-Hydro (Gochis et al., 2020) to the WRF model as a hydrological extension package for hydrometeorological (e.g. rainfall, runoff, groundwater flow, streamflow) simulations, which will also be a primary focus of the analyses to be discussed herein. The synchronously coupled WRF-Hydro modelling system outperforms the WRF-only model and thus has been employed in atmosphere–hydrology simulations over various domains around the globe (Senatore et al., 2015; Kerandi et al., 2018; Somos-Valenzuela and Palmer, 2018). Our hydroclimatic analysis is focused on the upper Yellow, Yangtze and Brahmaputra river basins (UYEB, UYAB, and UBB, respectively), the headwaters of which are all located on the TP.
Four global climate simulations were performed using UofT-CCSM4 at approximately 1∘ resolution, one for the historical period (1980–1994), one for the preindustrial (PI) reference period, and two for the MH. UofT-CCSM4 is based on the standard CCSM4 (Gent et al., 2011), but specific modifications have been made to the diapycnal diffusivity of the ocean component to make it more appropriate for paleoclimate simulations (Peltier and Vettoretti, 2014; Chandan and Peltier, 2017). These changes have been taken into account in both the MH and PI simulations to avoid introducing ambiguity related to different diapycnal mixing schemes when these two simulations are compared. Huo et al. (2021) has employed the same PI and MH global simulations for the purpose of studying MH monsoons in South and Southeast Asia. The two MH simulations differ from each other in their land surface boundary conditions over northern Africa (Chandan and Peltier, 2020), but otherwise they share the same orbital parameters and trace gases as the PMIP4 recommendations (Otto-Bliesner et al., 2017): MHREF is the “control MH” which uses the same land surface as in PI, while MHGS extends MHREF by adding the GS vegetation. Compared to the PI, the MHREF experiments are forced by precessionally enhanced boreal summer insolation and slightly lower greenhouse gas concentrations (Otto-Bliesner et al., 2017). The prescribed vegetation patterns used in the MHGS experiment are similar to those used by Pausata et al. (2016) and are consistent with the proposed MH vegetation sensitivity experiments in Otto-Bliesner et al. (2017), which involves a substitution of the Sahara desert with evergreen shrubs in the south and steppe and savanna in the north. Moreover, based on the results of Hély et al. (2014), the African Guineo-Congolian rainforest has also been extended slightly northward (Chandan and Peltier, 2020).
Each UofT-CCSM4 simulation was separately downscaled over the TP for 15 years using the WRF model with two nested domains. The outer domain covers most of Asia at 30 km resolution, and the inner domain covers the TP, as well as parts of the surrounding territory, at 10 km resolution. The outlines of the two domains, as well as the topography in the WRF outer domain, are shown in Fig. 1. This study is based on a four-member physics ensemble of dynamically downscaled climate simulations, using the same physics parameterizations as in Huo et al. (2021), where the MH climate anomalies over South and Southeast Asia were studied. The simulations in each regional climate ensemble employ different cumulus parameterizations in WRF, as in Huo et al. (2021), namely the Kain–Fritsch scheme (KF; Kain, 2004), the Grell–Freitas ensemble scheme (GF; Grell and Freitas, 2014), the Tiedtke scheme (Tiedtke, 1989), and the Betts–Miller–Janjić scheme (BMJ; Janjic, 1994), making a mini-physics ensemble for the TP that allows us to study the sensitivity of model performance to different cumulus parameterizations and thereby to estimate the uncertainty associated with these parameterizations on the simulated MH climate.
The dynamical downscaling methodology applied here is a somewhat further developed version of the dynamical downscaling “pipeline” originally introduced in Gula and Peltier (2012) and then applied in some more recent studies (d'Orgeville et al., 2014; Erler and Peltier, 2016; Peltier et al., 2018; Huo and Peltier, 2019, 2020, 2021), where the expected climate change impacts over the Great Lakes basin in North America, along the Rocky Mountains, in western Canada, and over South and Southeast Asia were investigated. In the present version of this pipeline, WRF-Hydro V5.1.1 (Gochis et al., 2020) is coupled to WRF for the purpose of performing hydrometeorological simulations. The WRF-Hydro model is a multi-scale and multi-physics hydrologic community model widely used for flash flood prediction, seasonal simulation of water cycle components, and regional hydroclimate impacts assessments over both the short term and long term. In this study, the Noah Land Surface Model (Tewari et al., 2004) is used in the coupled WRF–Hydro modelling system, and high-resolution hydrological routing modules have been adopted to represent subsurface lateral flow (Gochis and Chen, 2003). Spin-up simulations of 5 years have also been conducted to achieve numerical stability of the model outputs.
2.2 Observational datasets
To evaluate the historical simulations of temperature, the Climatic Research Unit (CRU) dataset V4.05 (Harris et al., 2020) at 0.5∘ resolution is employed. This widely used climate dataset was derived by the interpolation of monthly climate anomalies from several extensive networks of weather stations. To verify the precipitation results in the historical period, we use both the CRU dataset and APHRODITE's (Asian Precipitation – Highly Resolved Observational Data Integration Towards Evaluation) gridded precipitation dataset version 1101 (Yatagai et al., 2012), which covers monsoonal Asia (APHRO_MA_V1101) at horizontal resolution. It is a set of long-term (1951 onward) continental-scale daily products that is based on a dense network of rain gauge data for Asia including the Himalayas, South Asia, and Southeast Asia. To compute differences between model results and the observations, the latter have been reprojected and resampled onto the native grid of each model. However, using these two different observational datasets did not lead to significant differences in the major results of this study in terms of the validation of precipitation simulation (Figs. 3 and A1). We have also compared the simulated temperature anomalies during the MH with paleoclimatic reconstructions based on lake sediment (Zhang et al., 2022; Kaufman et al., 2020) and precipitation anomalies with the pollen-based proxy reconstructions by Bartlein et al. (2011) and Herzschuh et al. (2019). Note that we calculated the averages of all samples from each site within a rather broad time window (5.5–7.45 ka) to represent the MH when using the quantitative reconstructions of Holocene precipitation by Herzschuh et al. (2019), in order to be consistent with the method used for calculating the climate anomalies in Bartlein et al. (2011) and to include information from as many points as possible.
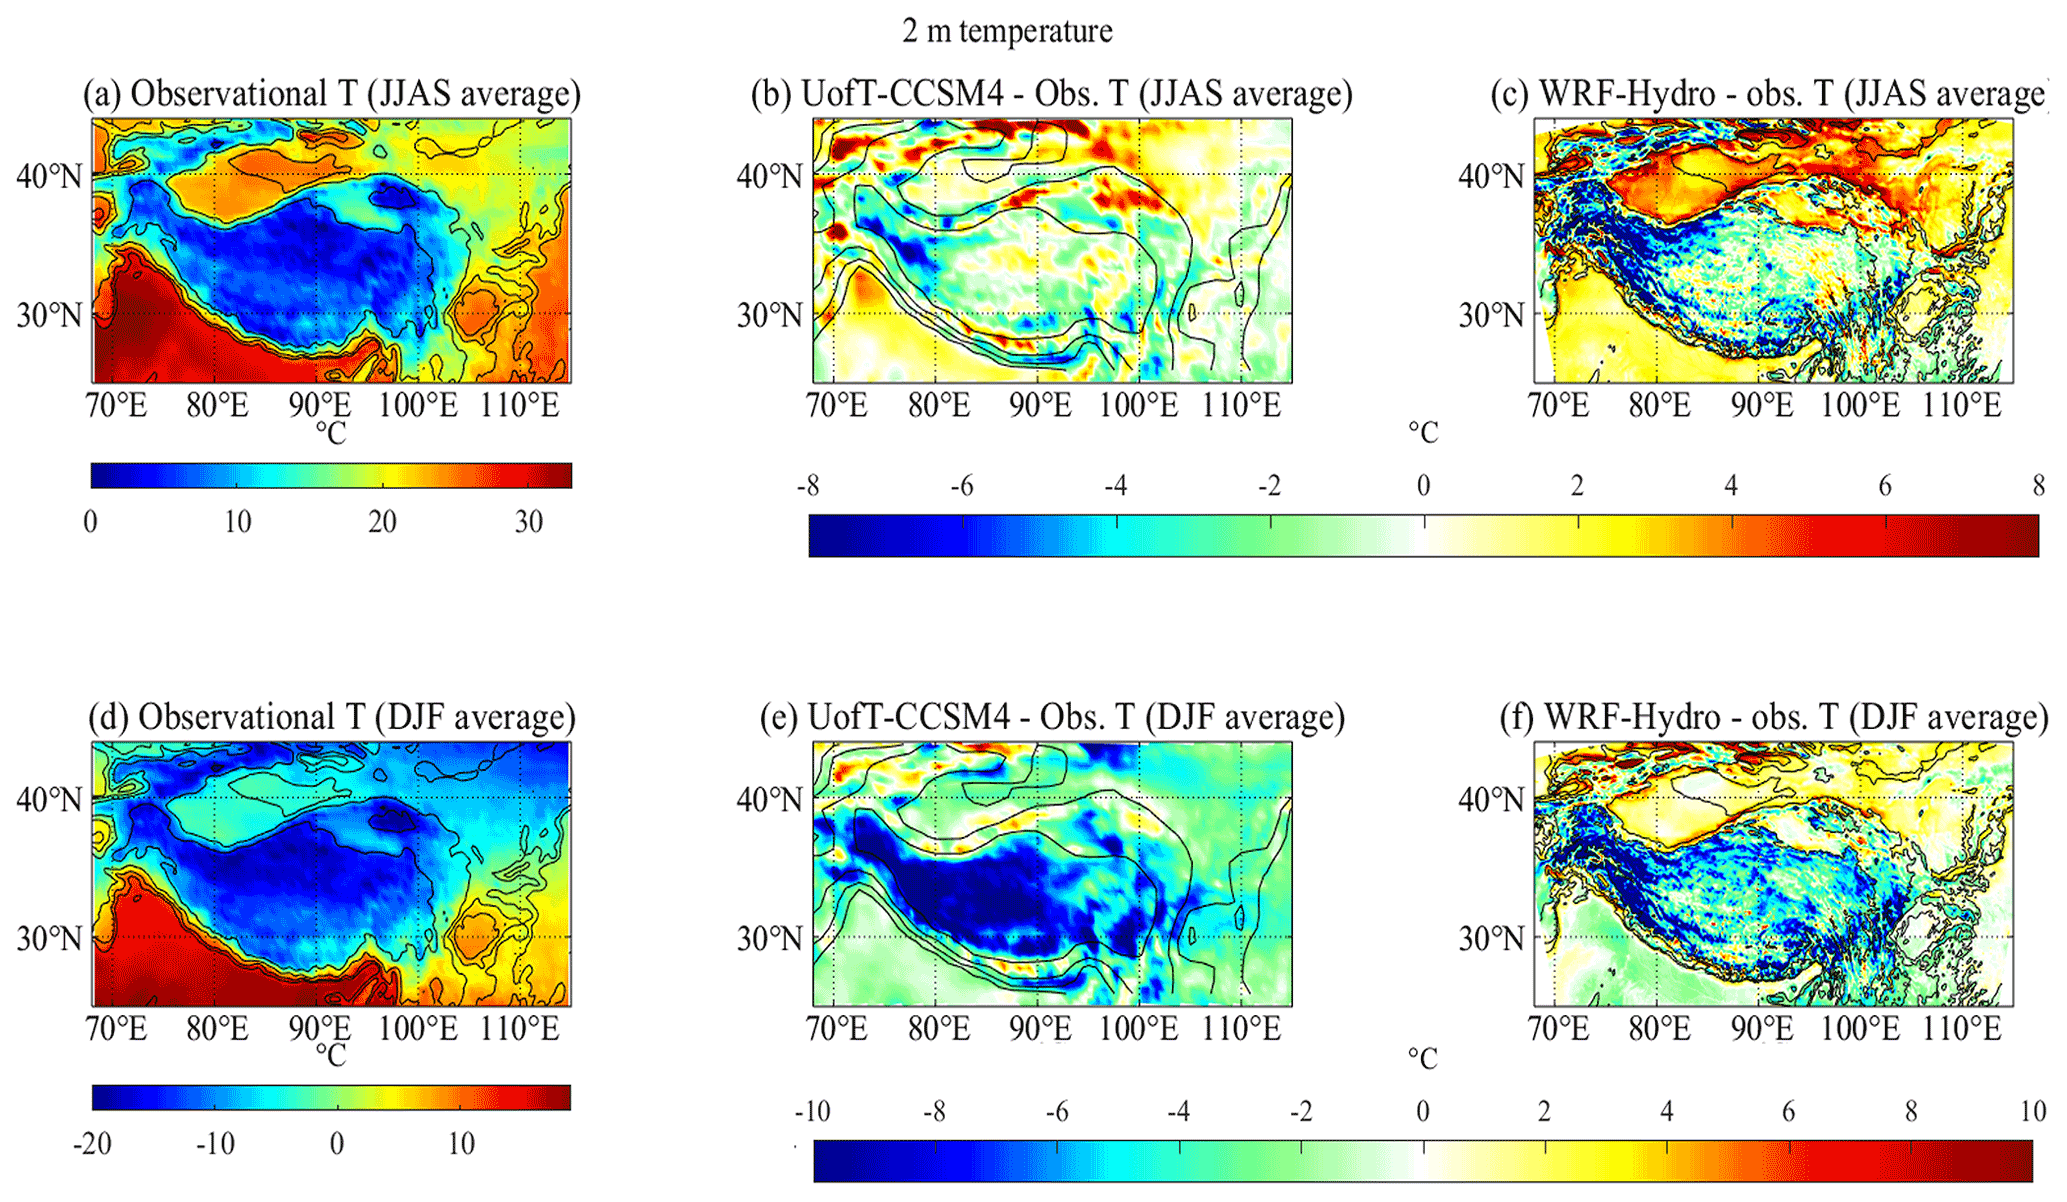
Figure 2Absolute 2 m air temperature bias with respect to (a, d) the CRU observational dataset of (b, e) UofT-CCSM4 and (c, f) the WRF ensemble in (a–c) JJAS and (d–f) DJF. The topography contours of 500, 1000, 2000, and 4000 m are also shown in black.
In addition, to evaluate the simulated hydrological metrics, mean monthly streamflow data from three stations have been obtained from the Global Runoff Data Centre (GRDC, 2015). These gauging stations (Tanglai Qu, Zhimenda and Yangcun) are located at the basin outlets of the UYEB, UYAB, and UBB (Fig. 1), respectively, and observations are available from 1978 to 1997, from 1978 to 1997, and from 1956 to 1982, respectively. There are some missing monthly data in these years of station records; however, all available streamflow data have been used to compute the average discharges discussed in Sect. 4.
In this section, we first validate our methodology against the observational dataset before presenting results from the MH simulations. Note that all temperature and precipitation biases and anomalies reported here are average values over the WRF inner domain, which covers the TP and some surrounding regions.
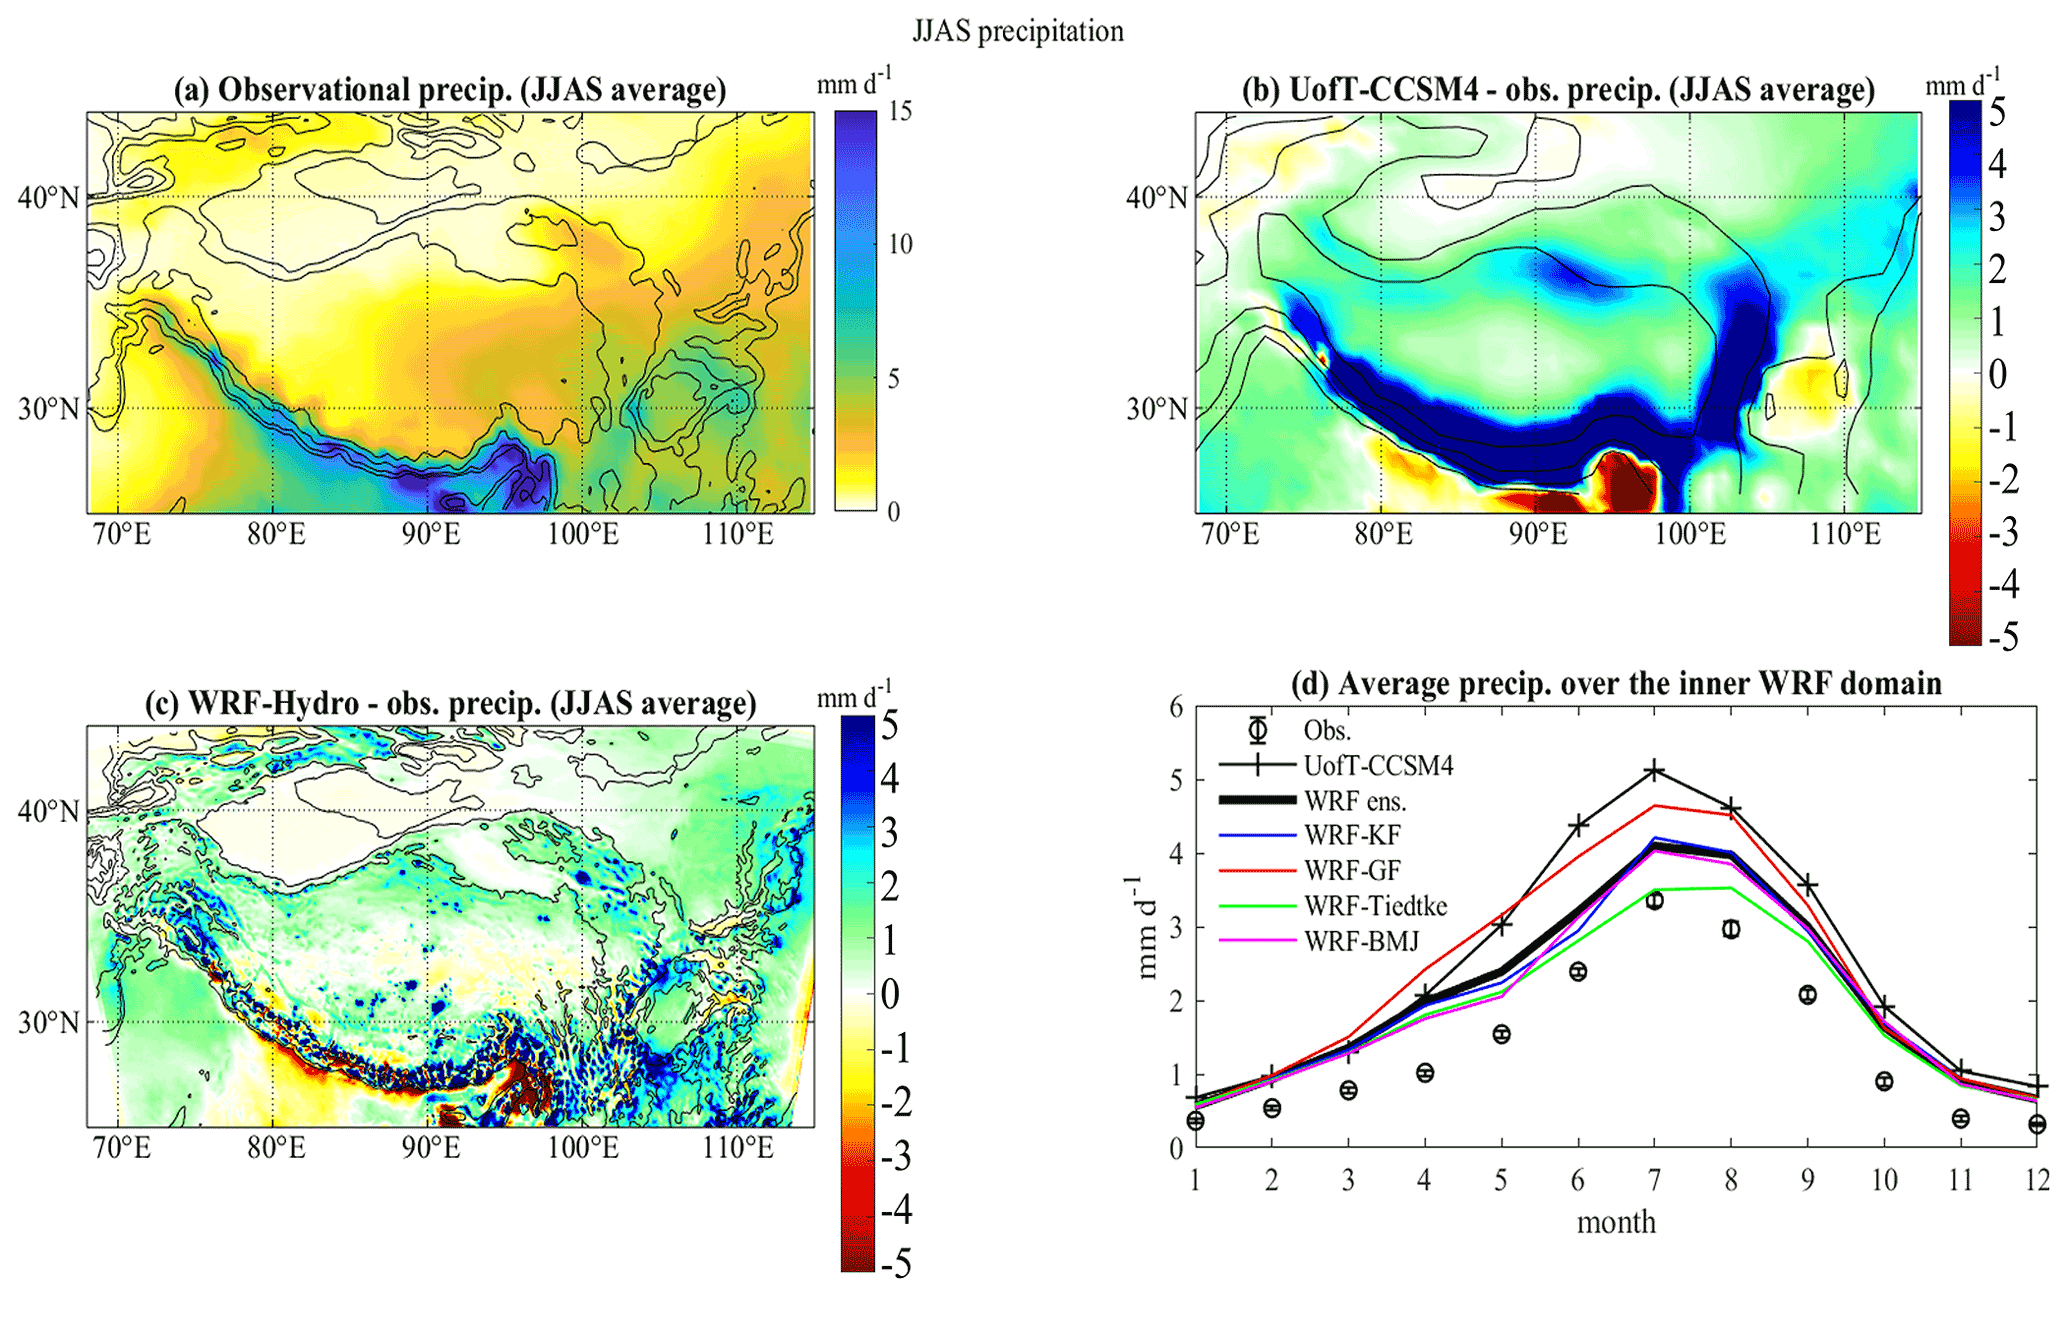
Figure 3JJAS precipitation bias with respect to (a) the APHRODITE observational dataset for (b) UofT-CCSM4 and (c) the WRF ensemble. (c) Monthly precipitation over the inner WRF domain in the observation, UofT-CCSM4, WRF ensemble average and four individual physics ensemble members. The topography contours of 500, 1000, 2000, and 4000 m are also shown in black in (a)–(c).
3.1 Validation against observations
Figure 2 shows the June–July–August–September (JJAS) and December–January–February (DJF) temperature biases, compared to the CRU dataset, in the UofT-CCSM4 historical simulation and in the WRF inner-domain ensemble average for that same time period. The temperature biases are evidently dependent on the season. In JJAS the bias pattern is fairly consistent between the global and regional models and includes a cold bias over the high elevations of the TP and a warm bias in the northeast of the TP and the lower lands around the TP, especially in the Tarim Basin. Most of the UYEB and UYAB are affected by this warm bias, which will likely reduce summer streamflow due to increased evapotranspiration. Overall, summer temperatures are simulated fairly well by both models and integrated over the entire inner WRF domain, the average temperature bias in both models is less than 0.5 ∘C. However, during winter, the GCM features a strong cold bias over the TP (>3 ∘C averaged over the inner domain), whereas the regional model has a better representation of DJF temperature with a significantly smaller average bias of approximately 1 ∘C. Among the three river basins, the UBB is most strongly affected by the cold bias in winter, which may decrease streamflow in the cold season due to late snowmelt. Since most of the precipitation over the TP occurs in summer, Fig. 3 shows the distribution of the JJAS average total precipitation in the observational dataset and the biases in the global model and the WRF ensemble. The spatial patterns in both models and observations are strongly dominated by orographic forcing with very high precipitation intensities on the south side of the Himalayas, in contrast with the small rainfall intensity in the rain shadows behind the high mountains, especially over the northern TP, which covers both the UYEB and UYAB. There is moderate rainfall over the Sichuan Basin east of the TP and the southern plateau, where the UBB is located. It is evident that the representation of orographic precipitation relies on model resolution: the coarse-resolution UofT-CCSM4 shows a severe underestimation of the peak intensities in front of the Himalayas and an overestimation of the precipitation rates in the northern TP. The representation of precipitation is greatly improved in WRF at 10 km resolution. The wet bias over the northern and eastern TP has also been eliminated in the RCM. Averaged over the WRF inner domain, the JJAS precipitation bias is 0.9 mm d−1 in the WRF ensemble average and 1.7 mm d−1 in the driving UofT-CCSM4 simulation. The overestimation in precipitation over the western and southeastern TP in WRF is also accompanied by lower surface temperature, which is likely related to the greater cloud cover reflecting more shortwave flux at high levels. Both models show a similar wet bias in winter (Fig. 3d), and such excessive snow in winter possibly contributes to the lower DJF temperature (Fig. 2) through snow–albedo feedback.
3.2 Simulated MH climate
We next turn to an attempt to analyse the climate anomalies in MHREF and MHGS and to investigate the impact of the Saharan vegetation on the TP.

Figure 4JJAS surface air temperature anomalies (∘C) for (a, b) MHREF and (c, d) MHGS in (a, c) UofT-CCSM4 and (b, d) the WRF ensemble mean. (e) Monthly continental air temperature anomalies for MHREF (solid) and MHGS (dashed). Reconstructed temperature differences between the MH and present day from Zhang et al. (2022) and Kaufman et al. (2020) are plotted as circles and diamonds, respectively. The topography contours (black) of 500, 1000, 2000, and 4000 m are shown in (a)–(d).
The simulated JJAS temperature over the TP in our MH ensembles is shown in Fig. 4. Owing to the variation in the Earth's orbital configuration, during the MH summer insolation in the NH was stronger than today, resulting in a significant warming over the TP in both the GCM and the WRF ensemble (Fig. 4a and b). The temperature response also shows cooling south of the TP and over the ocean (Huo et al., 2021). Thus, the land–sea thermal contrast is increased in the MH, favouring the enhancement of the monsoon circulations. The winter temperature over the TP shows a general cooling over the TP (Fig. 4e) that is associated with the decrease in winter solar radiation. Comparing the JJAS temperature changes produced by the GCM and RCM, the WRF ensemble shows an overall stronger warming over the TP, particularly in the northern part. Moreover, the regional model also produces a larger warm anomaly than the global model from mid-summer to early-winter (Fig. 4e). Taking the influence of a vegetated Sahara into account results in higher temperature over the TP all year round, except in winter when the difference is negligible (Fig. 4d and e). The influence of MHGS in both models is characterized by an overall increase in the annual mean temperature over the TP, which agrees with estimates from pollen records (Shi et al., 1993), while an annual cooling is obtained with MHREF. Averaged over the WRF inner domain, the JJAS temperature anomalies of the WRF ensemble mean are 1.1 ∘C with MHREF and 1.8 ∘C with MHGS. Particularly over the northern plateau, the warming is significantly enhanced from approximately 2 to 4 ∘C, leading to a better agreement with proxy-based estimation of 4–5 ∘C warming (Shi et al., 1993) over the TP. Moreover, compared to paleoclimatic reconstructions based on lake sediment in Fig. 4 (Zhang et al., 2022; Kaufman et al., 2020), both MH experiments generally capture the summer warming trend over the TP. In the southeastern TP, there is a good agreement between the model simulations and the reconstructions. The simulated temperature anomalies in MHGS fit the reconstructed paleoclimatic records in the northeastern and southern central TP better but overestimate the warming signal over the central eastern part of the TP (Fig. 4d). Meanwhile, the two proxy data points located in the central western TP west of the 85∘ W indicate strong cooling ( ∘C) during the MH, which disagrees with all model simulations. Note here that these two records are from frozen lakes, where the reconstructed temperature records reveal air temperature changes during the ice-free season (May–September) and not just JJAS. Also note that all proxy records are subject to uncertainties that arise from the dating processes (Wang et al., 2021) and site-specific factors like the change in vegetation cover and the retreat of glaciers (X. Chen et al., 2020). Averaged over all the points except these two, both UofT-CCSM4 and the WRF ensemble average have a bias of −1.2 ∘C in MHREF. Inclusion of a GS greatly reduces this cold bias to −0.1 ∘C in WRF, which is also smaller than that of the global model in MHGS (−0.4 ∘C).
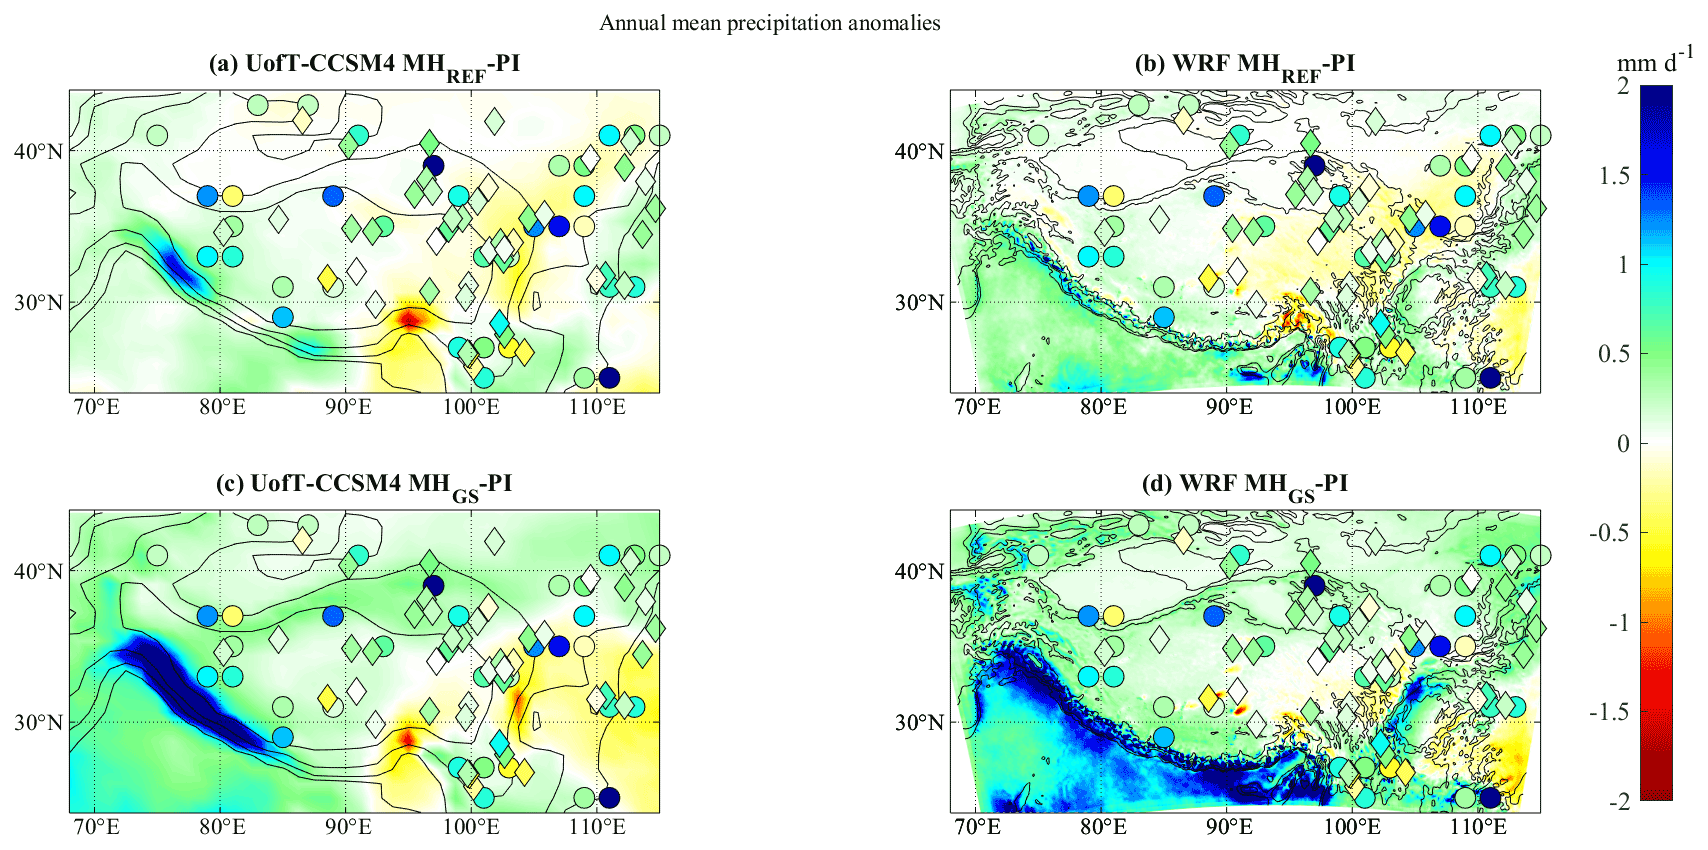
Figure 5Annual mean precipitation anomalies (mm d−1) for (a, b) MHREF and (c, d) MHGS in (a, c) UofT-CCSM4 and the (b, d) WRF ensemble mean. Reconstructed precipitation differences between the MH and present day from Bartlein et al. (2011) and Herzschuh et al. (2019) are plotted as circles and diamonds, respectively. The topography contours of 500, 1000, 2000, and 4000 m are also shown.
MH orbital and greenhouse gas forcings result in wet anomalies in both global and regional models (Fig. 5a and b). The enhanced annual precipitation in the southern parts of the TP in MHREF broadly agrees with reconstructions (Bartlein et al., 2011; Herzschuh et al., 2019). However, with orbital forcing alone (MHREF) both models fail to reproduce the wet anomaly in the east and southeast parts of the TP, although the area with reduced rainfall in the downscaled results is smaller than that in UofT-CCSM4 and thus agrees better with the overall wet signal suggested by reconstructions. Averaged over all the points that have proxy data from Bartlein et al. (2011) and Herzschuh et al. (2019) within the inner domain, the WRF ensemble average has a bias of −0.64 and −0.19 mm d−1, respectively, which is slightly smaller than that of the global model (−0.73 and −0.23 mm d−1, respectively). Under GS forcing (MHGS), precipitation is simulated to increase over almost the entire domain except a small patch in the southeast (Fig. 5d). The inclusion of GS surface boundary conditions greatly expands and intensifies the wet anomalies in WRF, further reducing the dry bias with respect to the pollen-based reconstructions (Bartlein et al., 2011) by half. The bias produced by the global model, however, only sees a small decrease from −0.73 to −0.71 mm d−1, mainly due to the dry bias over the eastern part of the TP (Fig. 5c). Compared to the reconstructed precipitation anomalies from Herzschuh et al. (2019), WRF also has a much smaller bias (0.02 mm d−1) than the global model (−0.12 mm d−1) in MHGS. Reconstructions based on lacustrine sediments (Shi and Song, 2003; Sun et al., 2006) implied an annual precipitation increase of 20 %–50 % over Diaojiao Lake (41∘ N, 112∘ E) and Daihai Lake (41∘ N. 113∘ E) during the MH. WRF produced precipitation increases of 38 % and 30 % at these two locations when the influence of a vegetated Sahara is considered, which is consistent with the reconstructed rainfall changes. However, the increase rates at these two locations are significantly underestimated by both UofT-CCSM4 in MHGS (Fig. 5c; less than 20 %) and the WRF simulation without GS forcing (Fig. 5b; less than 5 %). Comparison of downscaled results including the GS with paleoclimate reconstructions shows significant improvements, especially over the northern and western sides of the TP. These results highlight the climate sensitivity to Saharan vegetation changes via ocean–atmosphere teleconnections and emphasized the importance of incorporating MH vegetation feedbacks.
The spatial patterns of JJAS precipitation anomalies resemble those of the annual mean but with a larger magnitude (Fig. 6), which is expected since annual precipitation largely results from the summer rainfall over the TP, a region heavily influenced by the Asian monsoon circulation. The seasonal cycle of precipitation obtained with MHREF changes in response to the insolation changes at 6 ka (Fig. 6c): rainfall slightly decreases before May and then strengthens with the onset of the monsoon. Besides, the monsoon withdrawal is also delayed by 1 month as the increased rainfall persists until October. Such changes are consistent with the results obtained in PMIP models (Zheng et al., 2013). Inclusion of the GS boundary conditions not only leads to a weaker decrease in rainfall than MHREF in spring but also eliminates the negative rainfall anomaly in May in MHREF. During the monsoon season (JJAS), the precipitation increases in MHGS are more than 2 times larger than those in MHREF in both the UofT-CCSM4 and WRF physics ensemble members over the TP. Averaged over the WRF inner domain, JJAS precipitation is generally found to increase by 0.5 mm d−1 (14 %) in MHREF and 1.1 mm d−1 (31 %) in MHGS in the WRF ensemble average. Comparing different WRF ensemble members, they all share similar general characteristics, but the magnitude of the absolute precipitation changes depends on the individual ensemble member (Fig. 6c and f). The fourth ensemble member based on the BMJ cumulus scheme produces the smallest increase in JJAS precipitation in both MHREF (0.35 mm d−1) and MHGS (0.87 mm d−1) experiments, while the KF scheme (the first ensemble member) and the GF scheme (the second ensemble member) produce the greatest rainfall increases in MHREF (0.59 mm d−1) and MHGS (1.31 mm d−1), respectively. The greening of the Sahara also intensifies the precipitation over the TP in September and October, further postponing the retreat of the monsoon, which is similar to the findings in our previous studies over South and Southeast Asia (Huo et al., 2021).
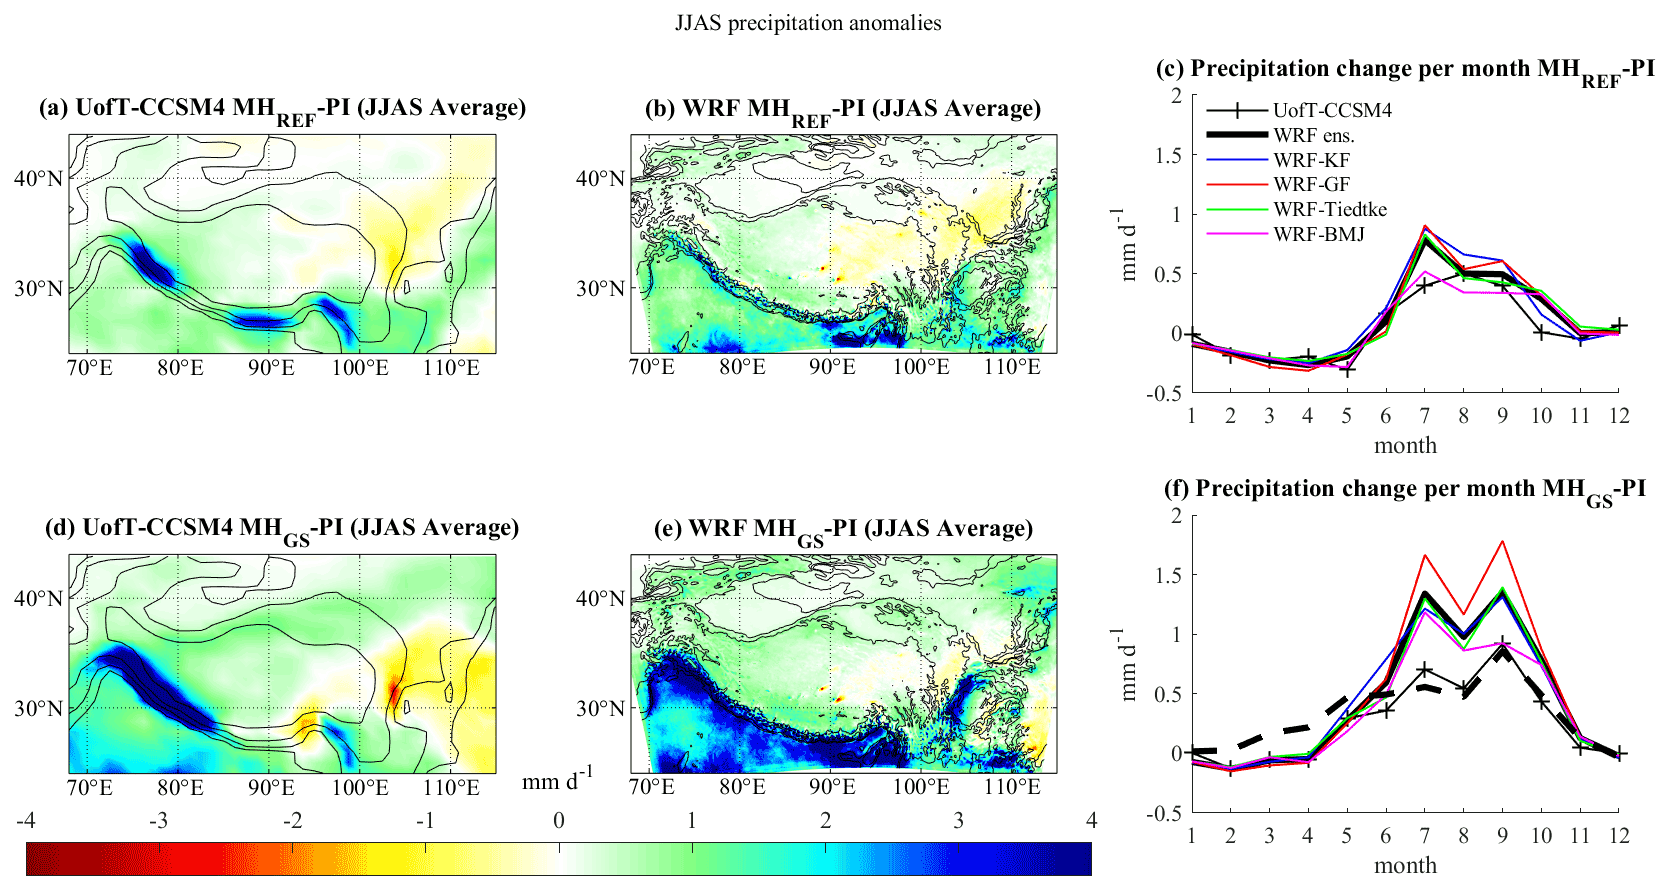
Figure 6JJAS precipitation anomalies (mm d−1) for (a, b) MHREF and (d, e) MHGS in (a, d) UofT-CCSM4 and the (b, e) WRF ensemble mean. Monthly precipitation anomalies (mm d−1) in UofT-CCSM4 and four physics ensemble members for (c) MHREF and (d) MHGS. The dashed line in (f) represents the MHGS–MHREF anomalies in the WRF ensemble mean. The topography contours of 500, 1000, 2000, and 4000 m are also shown in (a), (b), (d) and (e).
The enhanced precipitation in the MH experiment with Saharan vegetation is probably due to ocean–atmosphere teleconnections, as suggested in previous studies (Huo et al., 2021; Pausata et al., 2017). An albedo-induced warming develops over the vegetated Sahara, leading to a strong intensification and northward expansion of the West African monsoon and a significant tropical North Atlantic SST warming (Fig. 7b; Pausata et al., 2016), which in turn changes atmospheric circulation and induces a notable intensification and westward extension of the Walker circulation over the Pacific Ocean in the MHGS (Fig. 7d) compared to the MHREF experiment (Fig. 7c). The changes in the Walker circulation weaken the low-level easterly winds over the eastern Pacific but enhance easterly anomalies over the northern Indo-Pacific Ocean (Fig. 7b), which suppresses El Niño–Southern Oscillation (ENSO) activity and enhances the Asian monsoon (Pausata et al., 2017).

Figure 7SST (shaded, ∘C), precipitation (shaded, mm d−1) and 850 hPa winds (vector, m s−1) anomalies during JJAS from UofT-CCSM4 for (a) MHREF and (b) MHGS. The topography contours of 500, 1000, 2000, and 4000 m are also shown. PI climatological zonal stream function of the Walker circulation (contours: 0.2×10¹¹ kg s−1 interval from −2 to 2×10¹¹ kg s−1; 0 line in bold) and associated changes (shaded) in (c) MHREF and (d) MHGS relative to the PI.
In this section, the simulated climates for the present day and the MH over the three river basins on the TP are discussed. Figures 8–10 present the annual cycles of hydroclimatic variables over the UYEB, UYAB, and UBB during the historical period, and Figs. 11 and 12 show the anomalies during the MH. In Figs. 8–10, the WRF ensemble averages are plotted in thick black lines, while results from individual ensemble members are plotted in colour (see figure legends). The error bars on the observational data in Figs. 8–10 represent the standard error of the mean and the error bands in Figs. 11 and 12 shows the distribution range for all ensemble members. All hydroclimatic variables have been averaged over the corresponding river basin. Observational results in Figs. 8–10 are represented by open circles. Only temperature, total precipitation, and river discharge are available from observations. The observed temperature (precipitation) values are from the CRU (APHRODITE) dataset. The river discharges, recorded by gauging stations, have been normalized by the associated basin area. Areas of contribution for UYEB, UYAB, and UBB are approximately 286 000, 138 000, and 153 000 km2, respectively. Solid precipitation in panel b of Figs. 8–11 is snow and graupel, and net precipitation (panel c in Figs. 8–10 and 12) is calculated by subtracting evapotranspiration from total precipitation. Note that evapotranspiration, snowfall, and snowmelt are calculated by the Noah land surface model, while streamflow is computed by the WRF-Hydro model.
For comparison between the preindustrial and MH simulations, we applied the linear scaling method to the original streamflow results. Due to the large (negative) JJAS runoff bias in WRF during the historical period, especially in the UYEB and UYAB (Figs. 8d and 9d), it was deemed necessary to apply a simple form of bias correction to rescale the monthly river discharge so that the monthly watershed average for the historical period matches the observations (using one factor per month). Linear scaling corrects the ensemble mean values of the historical simulations based on monthly errors (Trambauer et al., 2015). The scaling factor was first obtained through calculating the ratio between the observed and modelled historical values. Following this, the monthly scaling factor was applied to each uncorrected daily runoff simulation of that month so that the monthly mean values of the historical simulations match those of the observation. The streamflow values of the MH simulations have been bias-corrected using the same factors as for the historical results so that they can be usefully compared.
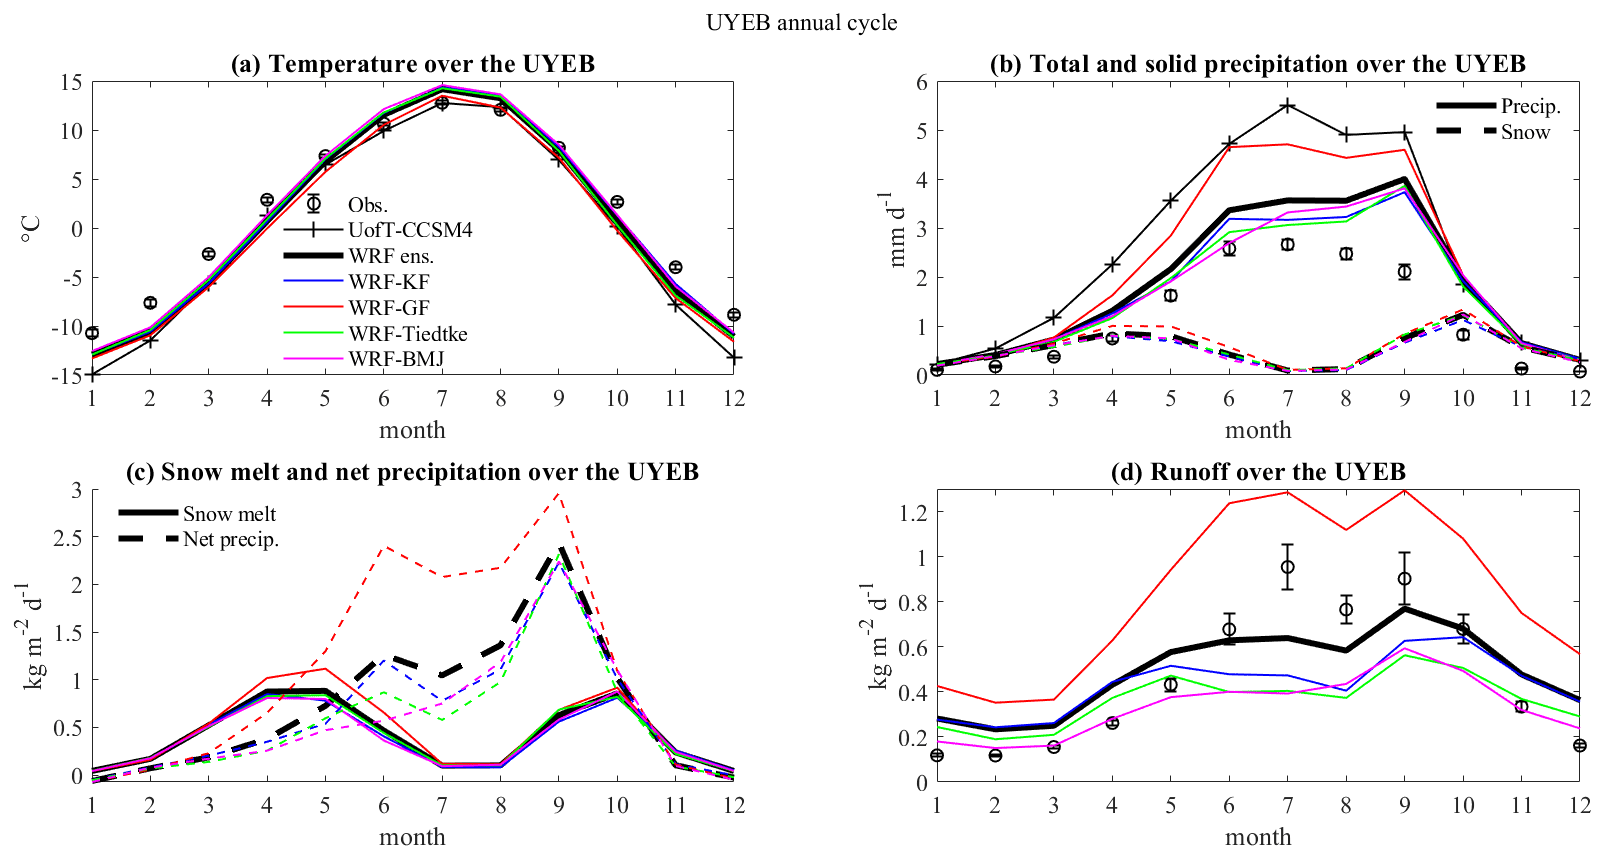
Figure 8Average seasonal cycle over the UYEB: (a) temperature, (b) total and solid precipitation, (c) net precipitation and snowmelt, and (d) discharge at the hydrometric station and total runoff from WRF. The WRF ensemble average is shown in thick black lines, with the four individual ensemble members shown by blue, red, green, and magenta lines, respectively; observations are represented by open circles. Error bars in (a), (b), and (d) show the standard error of the mean.
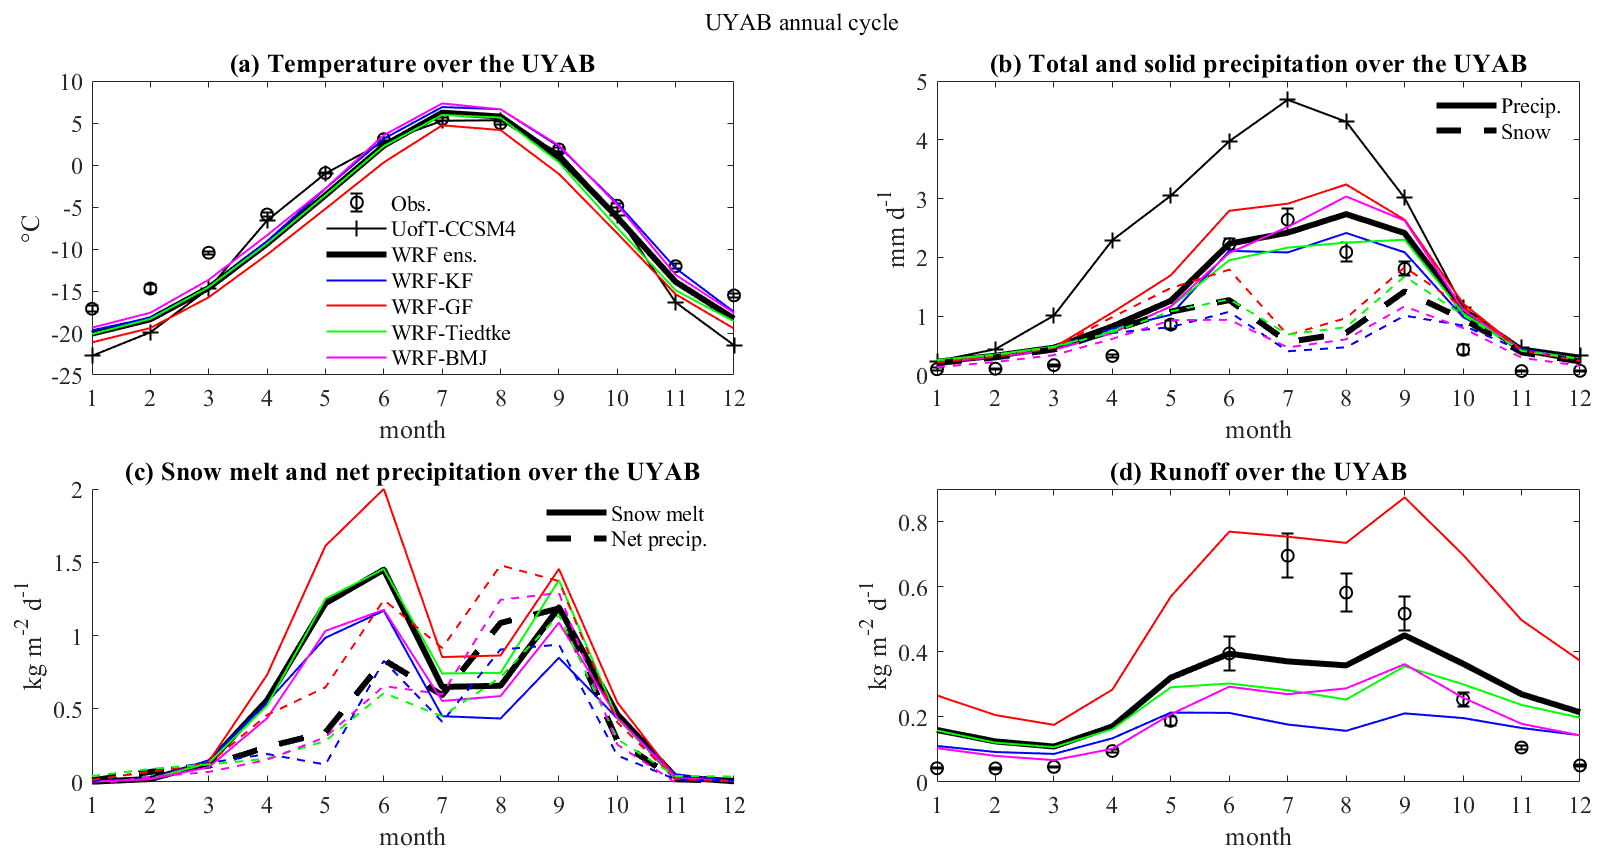
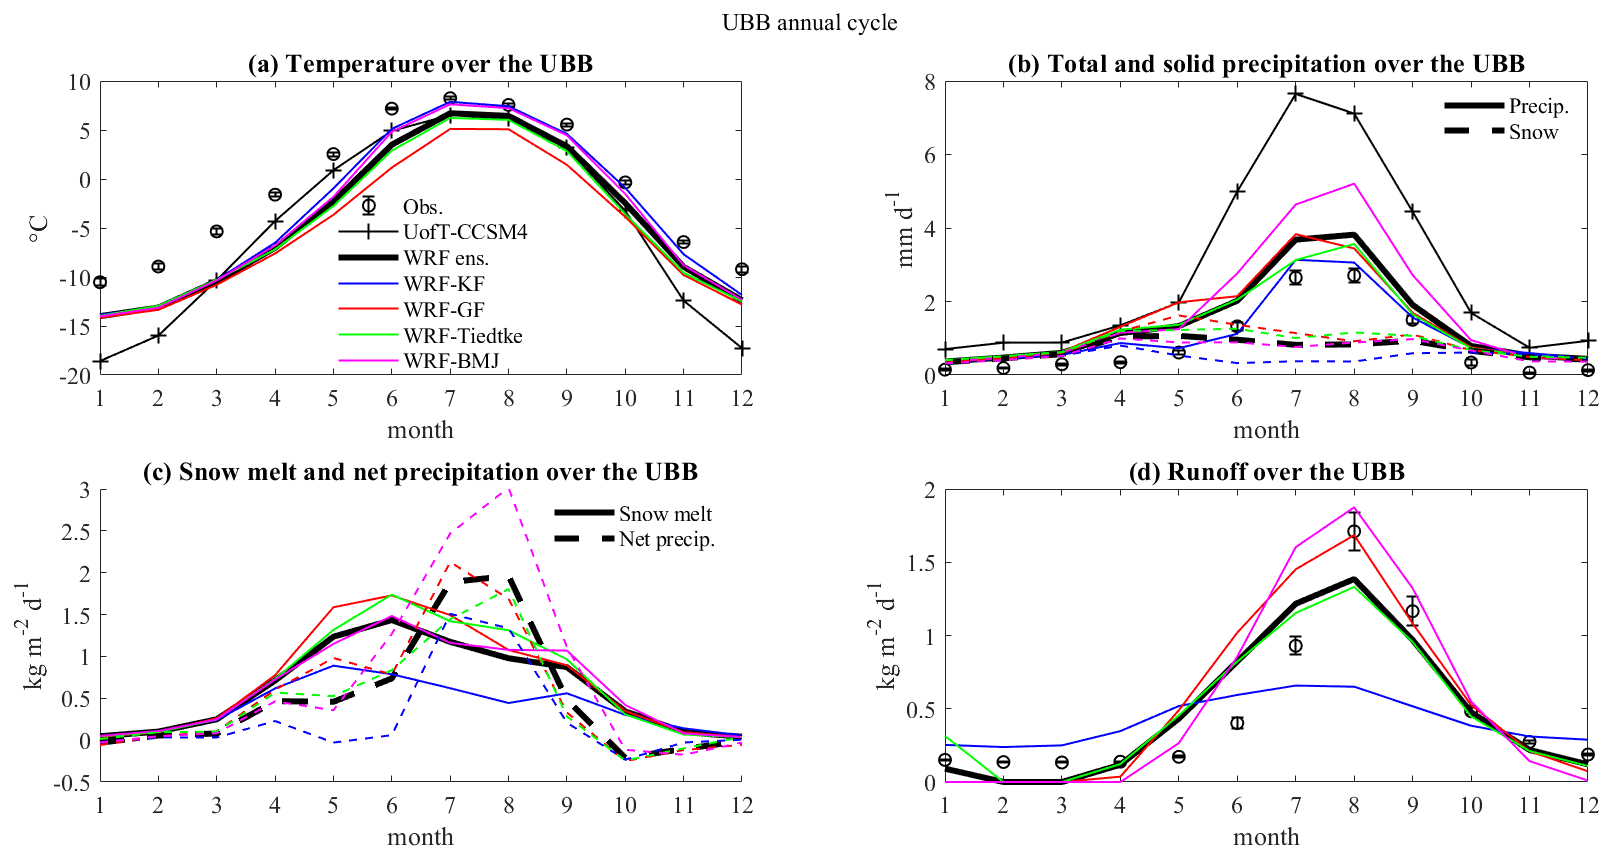
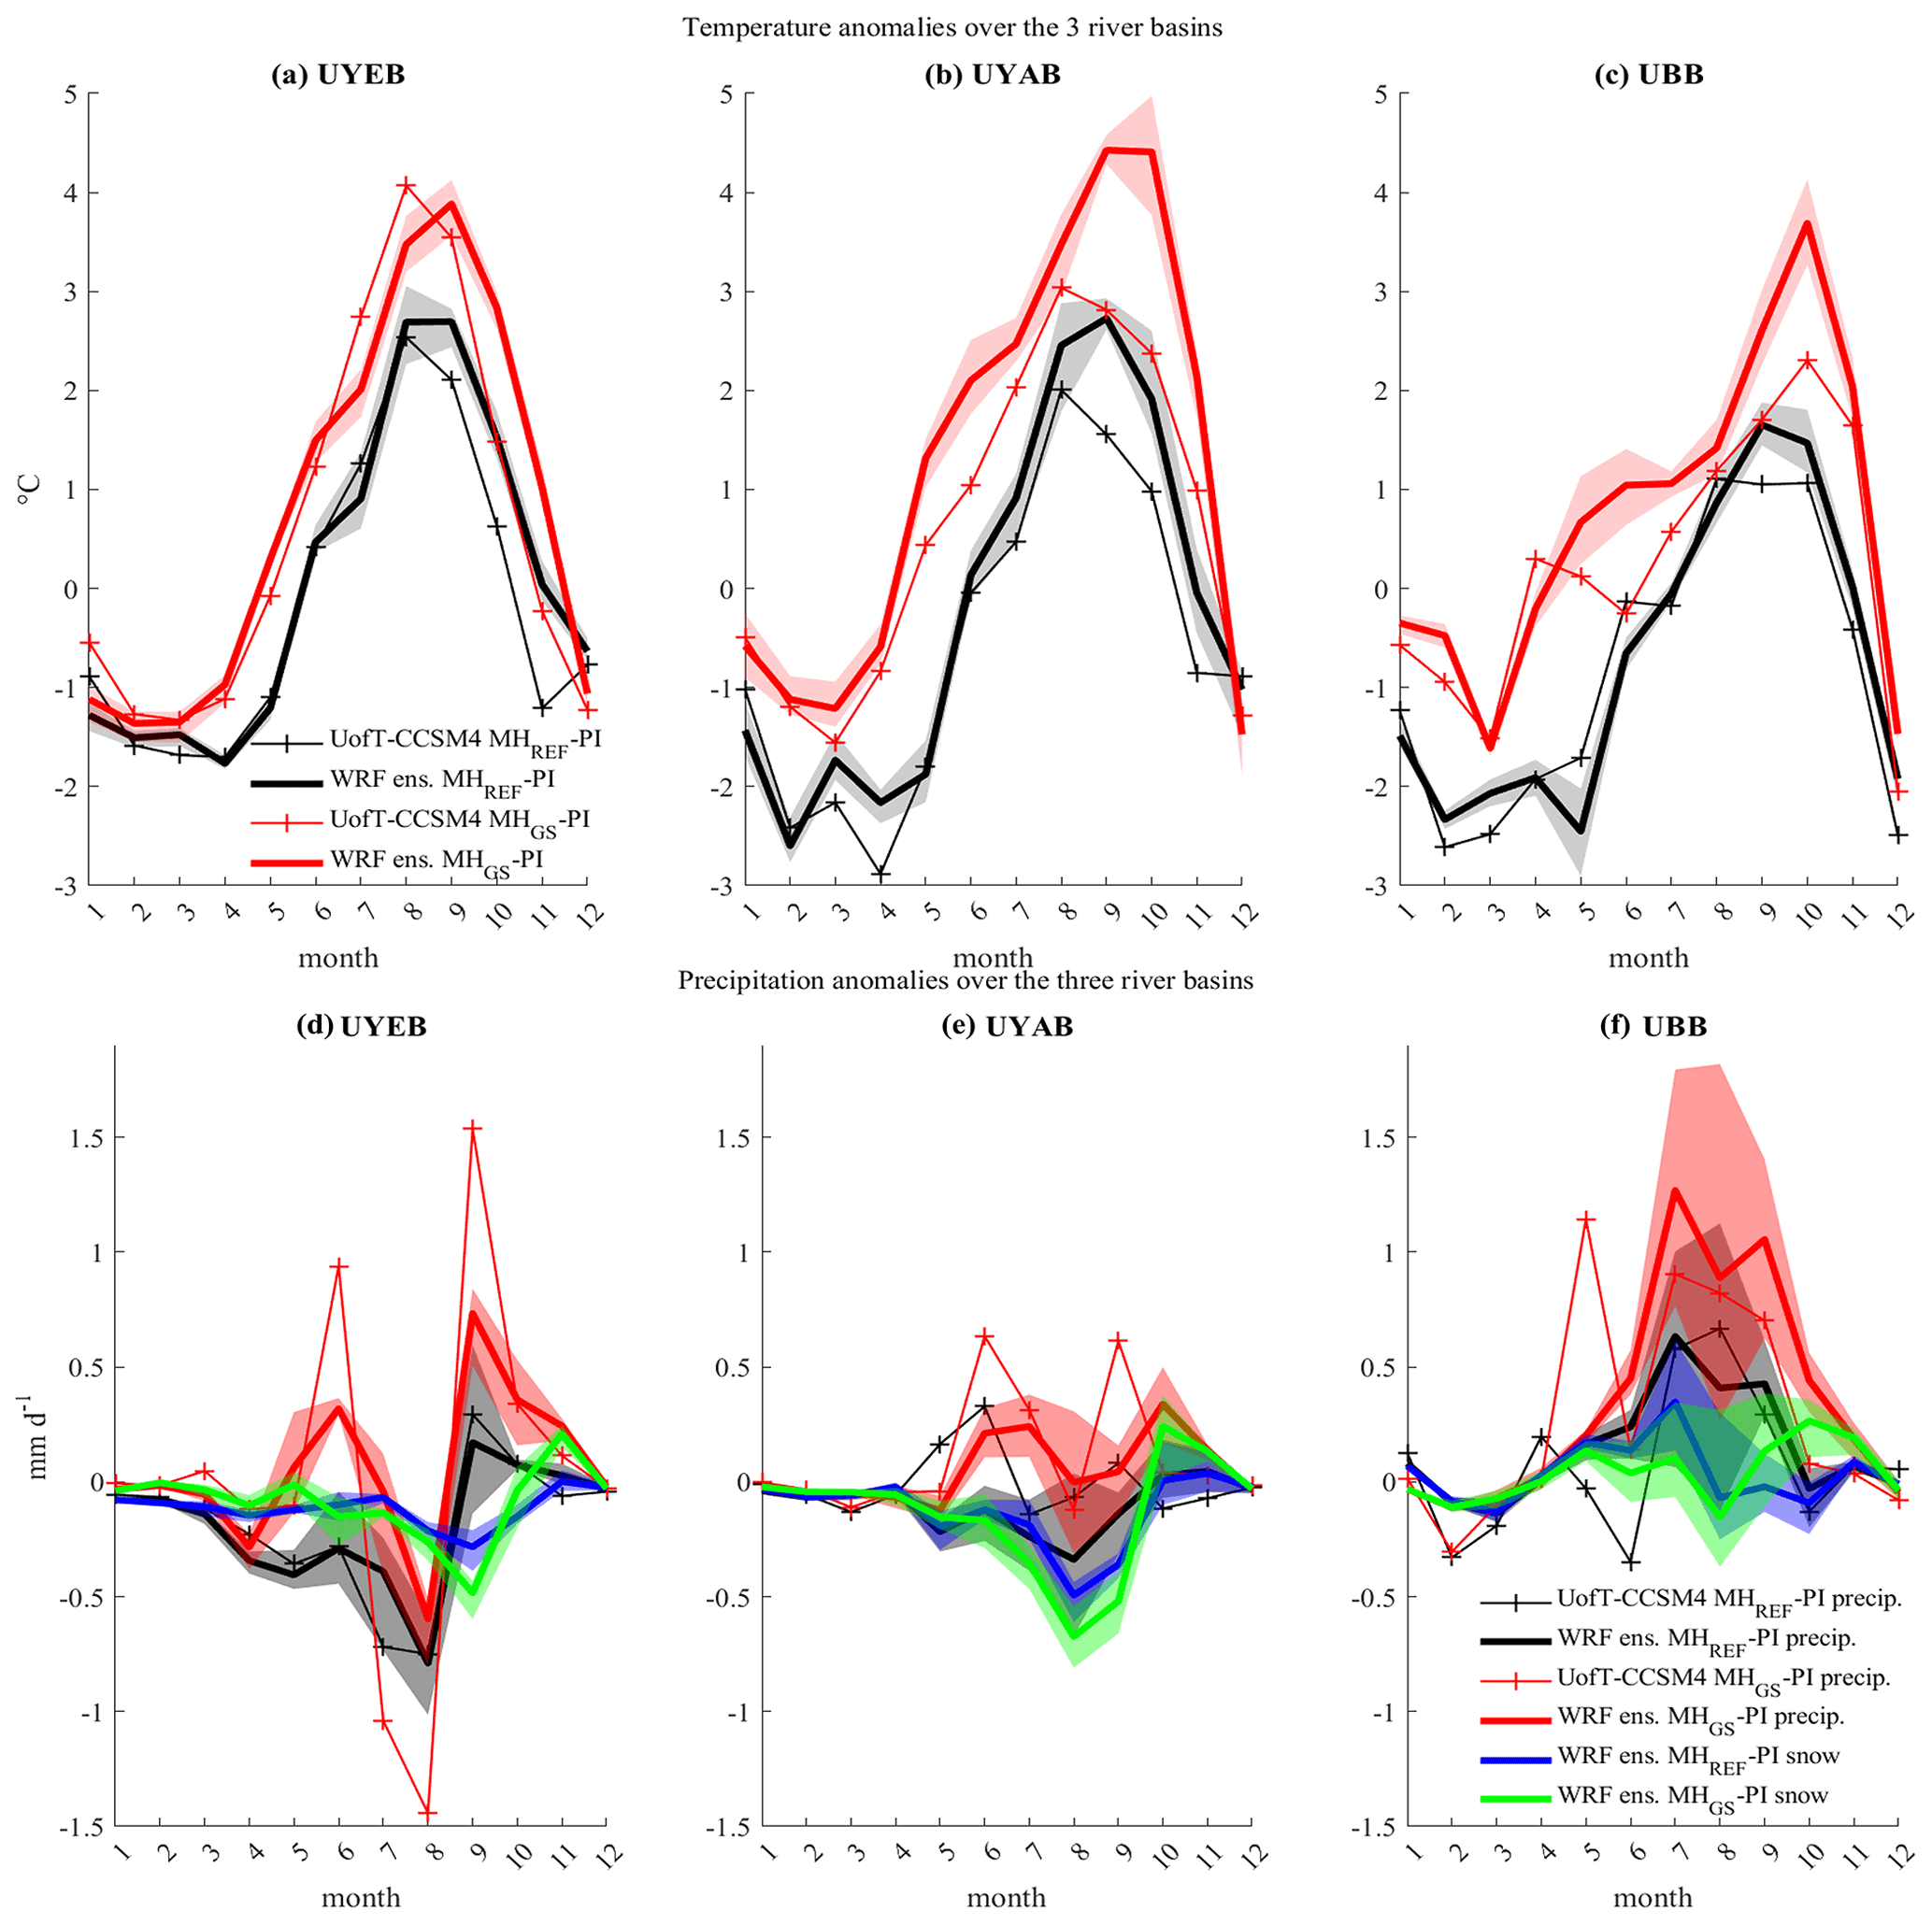
Figure 11Monthly anomalies of (a–c) temperature and (d–f) total and solid precipitation over the three basins.
4.1 Validation of the average season cycle of hydroclimatic variables
The seasonal cycles of hydroclimatic variables over the three river basins are provided in Figs. 8–10. The Yellow River originates in the northern TP and flows eastward through the Loess Plateau and the North China Plain, eventually draining into the Pacific Ocean at the Bohai Gulf on the eastern coast of China. The UYEB above the Tanglai Qu hydrometric station, with an altitude varying from 4.9 km in the southwest to 1.1 km in the northeast, is situated on the northeast side of the TP but also covers a small section of the western Loess Plateau (Fig. 1). It has over 400 mm annual rainfall according to the APHRODITE dataset and an annual mean temperature of approximately 2 ∘C based on the CRU dataset. The UYAB lies in the eastern part of the TP and is influenced by the Asian monsoon. The basin, whose altitude varies from 5.7 km in the west to 4.2 km in the east, drains past the Zhimenda hydrological station (Fig. 1). The integrated precipitation in JJAS accounts for more than 85 % of the total annual precipitation (Fig. 9b), and the JJAS discharge accounts for more than 70 % of the annual total at Zhimenda (Fig. 9d). The Brahmaputra River originates from the Himalayas and passes through the southern TP before it breaks through the eastern Himalayas and turns southward. Elevation of the UBB above the Yangcun hydrometric station ranges between 5.8 and 3.8 km and drops off from the west to the east. Based on the observations, the basin-averaged annual precipitation is 314 mm and the annual mean temperature is −1 ∘C.
The seasonal cycle of air temperature is generally accurately reproduced over the three river basins, except for a cold bias during winter, even though the downscaled simulations have already halved the DJF cold bias in the global simulation. The large cold bias in UofT-CCSM4 is likely due to excess winter precipitation (panel b in Figs. 8–10), which results in a snow–albedo feedback on temperature. It is interesting to note that the WRF ensemble actually suffers from a stronger cold bias than the UofT-CCSM4 in spring over the two cooler basins (UYAB and UBB), which is likely associated with the poor representation of snowmelt processes by the much simpler snow model employed in WRF. The JJAS temperatures simulated by both the global and regional models fit the observation well.
The Asian monsoon exerts strong influence on the three river basins over the TP: over 70 % of annual precipitation occurs in JJAS and only about 10 % falls in the winter (DJF) according to the observation. The simulated seasonal cycle of precipitation in WRF is too strong compared to the observation over the UYEB and UBB, largely due to the rainfall overestimation in summer (wet season). This bias is inherited from the GCM, and although downscaling greatly reduces the bias, precipitation is still overestimated for JJAS. Over the UYAB, qualitatively the annual precipitation pattern is well reproduced by the WRF ensemble, while UofT-CCSM4 is characterized by a much greater wet bias, with significantly more precipitation in spring and summer (Fig. 9b). The improvement in simulations of both regional temperature and precipitation by WRF indicates the fidelity brought by the use of higher resolution. There is, as expected, little solid precipitation in summer, and all precipitation falls in solid form during winter in UYEB, resulting in a streamflow peak driven by snowmelt in late spring and early summer (Fig. 8c). Summer precipitation also primarily falls as liquid rain in UYAB and UBB, but there is still snow even in July and August because of the colder climate over these two basins compared to the UYEB, and snowfall in UBB is in fact relatively evenly distributed throughout the year. Note here that the spread among the ensemble members is larger for liquid precipitation than for solid precipitation or temperature; different convection schemes greatly affect the JJAS precipitation, and the second ensemble member using the GF cumulus scheme exhibits the largest wet bias over the two basins in the northern TP, whereas the BMJ scheme produces the largest excess in precipitation over the UBB.
The seasonal cycle of net precipitation pattern in UYEB and UYAB has two peaks (June and September) due to the large evapotranspiration in July and August (Figs. 8c and 9c). Snowmelt over these two basins is also characterized by double peaks, which correspond to the two peaks in snowfall (Figs. 8b and 9b). Therefore, the melting of fresh snowfall is likely the major contributor to the snowmelt peaks simulated by the model. Over the UBB, although both observed and simulated total precipitation starts to increase in June, net precipitation is small in early summer due to evapotranspiration (Fig. 11c). Net precipitation from the first WRF ensemble member with the KF cumulus scheme is in fact negative in May and June. Runoff over the UBB starts to increase in May (Fig. 10d), which possibly comes from the snowmelt contribution that is the largest in May and June (Fig. 10c). In UBB, the runoff maximum over the UBB in August coincides with the largest net precipitation rates in July and August, which indicates that UBB rainfall plays a dominant role in peak runoff during the after-snowmelt seasons. The seasonal streamflow during the historical period for the two basins in the north exhibits a broad shape, with flow increasing slowly in April and slowly declining after October. Runoff in spring and early summer clearly follows the timing of snowmelt. The streamflow regime is also characterized by double peaks in July and September, respectively (Figs. 8d and 9d). Over the UYEB, the good correspondence between the timing of the peaks of runoff and net precipitation in September indicates that the monsoon rainfall is the dominant contributor to streamflow for UYEB. However, over the UYAB, both snow melt and precipitation contribute to the second runoff peak in September. WRF-Hydro is able to reproduce runoff that broadly agrees with observed river discharge. However, the model tends to underestimate the magnitude of the runoff peaks. This is likely a result of the stronger evapotranspiration leading to a lower runoff. The mismatch in streamflow peak magnitude against the observation is similar in all WRF simulations based on different physics configurations except the second ensemble member using the GF cumulus scheme; the GF cumulus scheme overestimates the runoff all year round and also produces the largest net precipitation and snowmelt among all four WRF ensemble members.
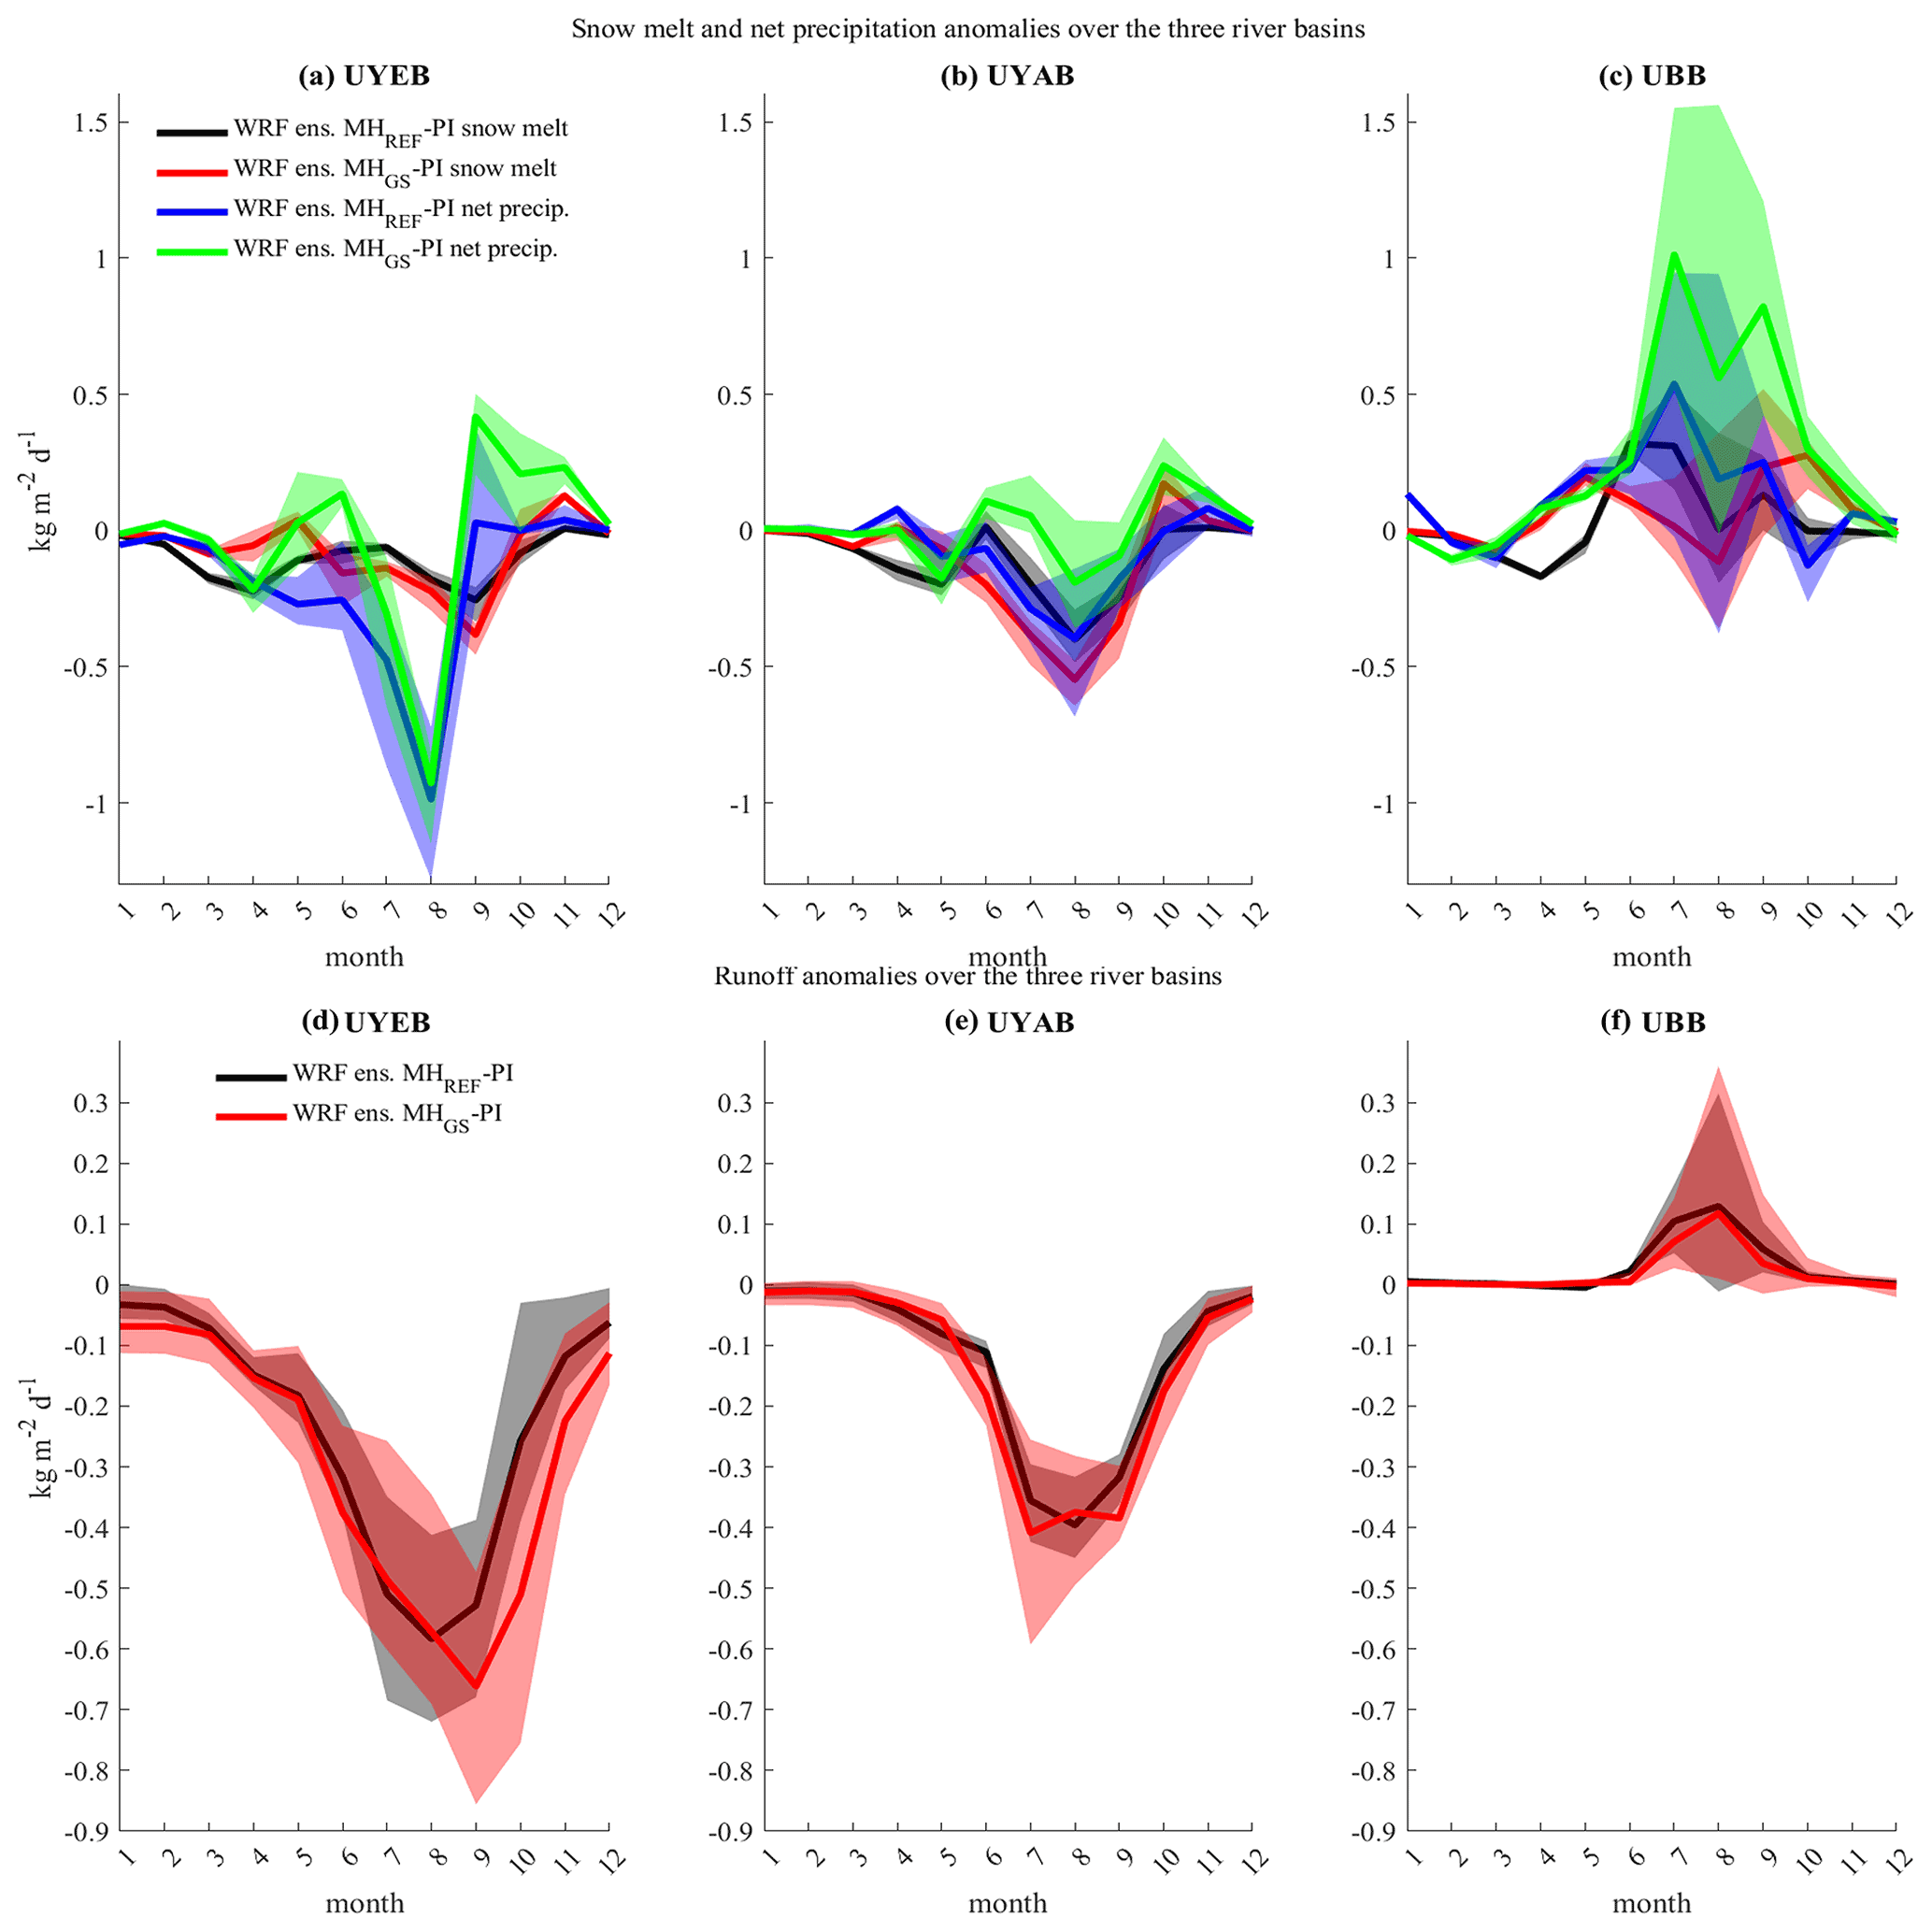
Figure 12Monthly anomalies of (a–c) net precipitation and snowmelt and (d–f) total runoff from WRF over the three basins.
4.2 Simulated MH changes
During the MH, the overall changes in mean temperature (Fig. 11a–c) follow changes in insolation, the magnitude of which increase during boreal summer and decrease in winter. The WRF model produces significantly larger positive temperature anomalies in summer compared to UofT-CCSM4. Compared with MHREF, temperature changes in experiments with the GS forcing have very similar characteristics, but the simulated temperature is generally warmer than in MHREF over all river basins in both global and regional models. Warming also starts earlier in May and ends 1 month later in November, and the peak warming also occurs 1 month later in early autumn in our WRF MHGS experiments relative to MHREF. In both MH ensembles, different WRF configurations show very similar temperature changes.
The changes in monthly precipitation are shown in Fig. 11d–f. The MHREF simulations for both UYEB and UYAB show a significant decrease in precipitation (except in autumn). The absolute regional dry anomaly is the largest in August, while September (October) experiences the largest increase in rainfall in the UYEB (UYAB). When vegetation is imposed over the Sahara, the minimum in August and the maximum in September (October) still exist, but there is another smaller precipitation increase peak in June (July), showing a strong rainfall enhancement during the early monsoon season in response to the GS forcing. However, averaged over the whole monsoon season, the WRF ensemble mean in MHGS only shows a small increase over these two basins (∼5 %) due to the offset between these positive and negative anomalies, while the WRF simulations that only account for the insolation forcing (MHREF) produce a decrease in monsoonal precipitation (9 %). Another major change to the hydroclimate over the UYEB and UYAB is the shift of part of the solid precipitation to liquid form in summer in MHGS when compared to MHREF (Fig. 11d and e), which will in turn result in a decreased snowmelt (Fig. 12a and b). Over the UBB, annual precipitation in the both MH experiments increases (∼0.15 mm d−1 or 11 % increase for MHREF and 0.35 mm d−1 or 26 % increase for MHGS), which is larger than those over the other two basins. However, although the increasing trend is robust among all WRF ensemble members, the magnitude of the increase is subject to higher model uncertainties than the other two basins. Compared to the increase in total precipitation, there is little change in snow amount for both MH experiments (<0.04 mm d−1) over the UBB, which also leads to very small changes in the annual snowmelt (Fig. 12c). Over the other two basins, however, the reduction in peak snowmelt due to the combined effects of MH insolation forcing and GS forcing is over 30 % (Fig. 12a and b). At the same time, higher temperatures during the warm season resulting from the MH insolation forcing also lead to larger evaporation, which accounts for the drop in net precipitation and also the substantial decrease in discharge, especially in summer (Fig. 12d and e). The magnitude of streamflow reductions in slightly larger in MHGS than MHREF, a consequence of the higher temperature and lower amount of snowfall in MHGS, which leads to greater evaporation and less snowmelt. Compared with UYEB, the reduction in snowmelt plays a more important role in the runoff decrease over the UYAB. Such a reduction in the upper Yellow River runoff has also been found over the past few decades, which is related to rising temperatures and decreasing wet season precipitation (Cuo et al., 2013). The simulated negative anomaly in JJAS discharge of the upper Yangtze River also agrees with CMIP5-based projections (Krysanova et al., 2017) and hydrological model results forced by PMIP4 data during the last interglacial (LIG; Scussolini et al., 2020). Among the three basins, one major difference in the hydroclimate over the UBB is the increase of net precipitation in JJAS, which also results in an overall increase in runoff. In MHREF, streamflow first decreases very slightly in April and May and then starts to increase in July. In WRF simulations that consider the influence of the Sahara greening, runoff exhibits similar increasing trends from July to September, which is consistent with changes in precipitation, but there is no decrease in May, probably due to the enhanced snowmelt compared to MHREF. Similar river runoff increases have also been found in future projections in a warmer climate using a hydrological model and multi-source spatial data (Cai et al., 2017) and LIG hydrological simulations based on PMIP4 data (Scussolini et al., 2020).
Using dynamically downscaled high-resolution climate simulations over the TP, this study analyses the hydroclimate in three major river basins, the UYEB, UYAB and UBB. Climate simulations constructed using the UofT-CCSM4 global climate model for the modern and MH time periods were dynamically downscaled to 10 km resolution using coupled WRF–WRF-Hydro with four different cumulus parameterization schemes. Compared to the GCM, WRF is far superior when representing orographic precipitation and the annual cycles of hydroclimatic variables. It captures the sharp contrast between the very high precipitation rates south of the Himalayan Mountain ranges and the dry climate over the interior plateau. Both global and regional models suffer from a winter cold bias owing to excessive snowfall, but the regional model has again significantly reduced this cold bias.
The coupled UofT-CCSM4–WRF–WRF-Hydro model has also been employed to investigate the temperature and precipitation changes over the TP during the MH. Both the GCM and the WRF ensemble average show a warming in summer and a cooling in winter over the TP, which is probably induced by insolation change. As far as the JJAS temperature is concerned, the WRF simulations show a larger warming than that in the driving global model, especially in the northern part of TP, and are thereby closer to estimates from proxy records. The strengthened thermal contrast between continent and ocean during summer enhances the monsoon circulation, leading to stronger northward winds and stronger moisture transport from the sea. The spatial patterns for the TP precipitation change are generally similar in sign between the GCM and the RCM, with a significant increase in the southern parts of the TP. The annual precipitation cycle over the TP is changed by the insolation anomalies during the MH, such that precipitation weakens slightly before the monsoon season and strengthens in summer. The annual wet anomalies are stronger and more extensive in the downscaled simulations and thus fit better with the proxy data. Since the TP plays a profound role in the development of the Asian monsoon and heavy precipitation forms when the wind from the sea rises along the south and east edges of the plateau, the model's ability to realistically represent the complex steep topography may have a great impact on the coupling between the general monsoon circulations and the regional changes over the TP. Including a GS further strengthens the TP precipitation and significantly reduces the bias against reconstructions over the TP, which highlights the significance of the teleconnections between the Saharan vegetation and the TP in paleoclimate simulations. Saharan vegetation plays a crucial role in intensifying the West African monsoon and modulating the atmospheric circulation, which alters the Walker circulation and increases Asian monsoon precipitation, through changes in equatorial Atlantic SSTs (Fig. 7). Precipitation changes in MH experiments that assume preindustrial vegetation cover are approximately half the magnitude of those in MHGS in all WRF ensemble members, although there are notable differences in the simulated MH rainfall anomalies using different physics schemes.
Both the UYEB and UYAB hydrological regimes exhibit changes in the MH as manifested by a decline in streamflow, especially in summer. Such flow decreases are a combined effect of changes in snowmelt and evapotranspiration. A significant amount of solid precipitation shifts to liquid precipitation and the JJAS net precipitation is simulated to shrink in both MH experiments. The GS forcing caused a rise in temperature during the MH, as well as larger rainfall but smaller snowmelt and larger evaporative water losses compared to the MHREF. In the UBB, the simulated annual total precipitation increase in the MH is the largest among three basins, and, unlike the other two basins, the most significant MH hydroclimatic anomaly over the UBB may be an increase in runoff in both MH experiments (particularly in mid-summer) due to greater net precipitation. The greening of the Sahara led to higher temperature and enhanced snowmelt in spring and eliminated the drop in runoff in April in MHREF.
One of the most fundamental uncertainties that limit the validity of the MH simulations in this study is natural variability, including the El Niño–Southern Oscillation. This calls for an initial condition ensemble where the RCM is forced with different periods of the global simulations. Besides, this study has used only one coupled regional modelling system to investigate the influence on the TP climate only due to the MH land cover changes over northern Africa. However, reduced dust emissions from the Sahara during the MH have also been suggested to play a role in modulating the Asian monsoon (Sun et al., 2019; Pausata et al., 2020). Moreover, reconstructions suggest extensive land cover changes during the MH, specifically higher vegetation coverage on the Eurasian continent (Tarasov et al., 1998; Zhang et al., 2014; Li et al., 2019; F. Chen et al., 2020), which has been shown to have global influence by shifting the latitudinal position of the of the intertropical convergence zone (Swann et al., 2014). These all underscore the necessity of further studies over the TP based on different climate models, as well as more realistic dust concentrations and land cover in the paleoclimate simulations.
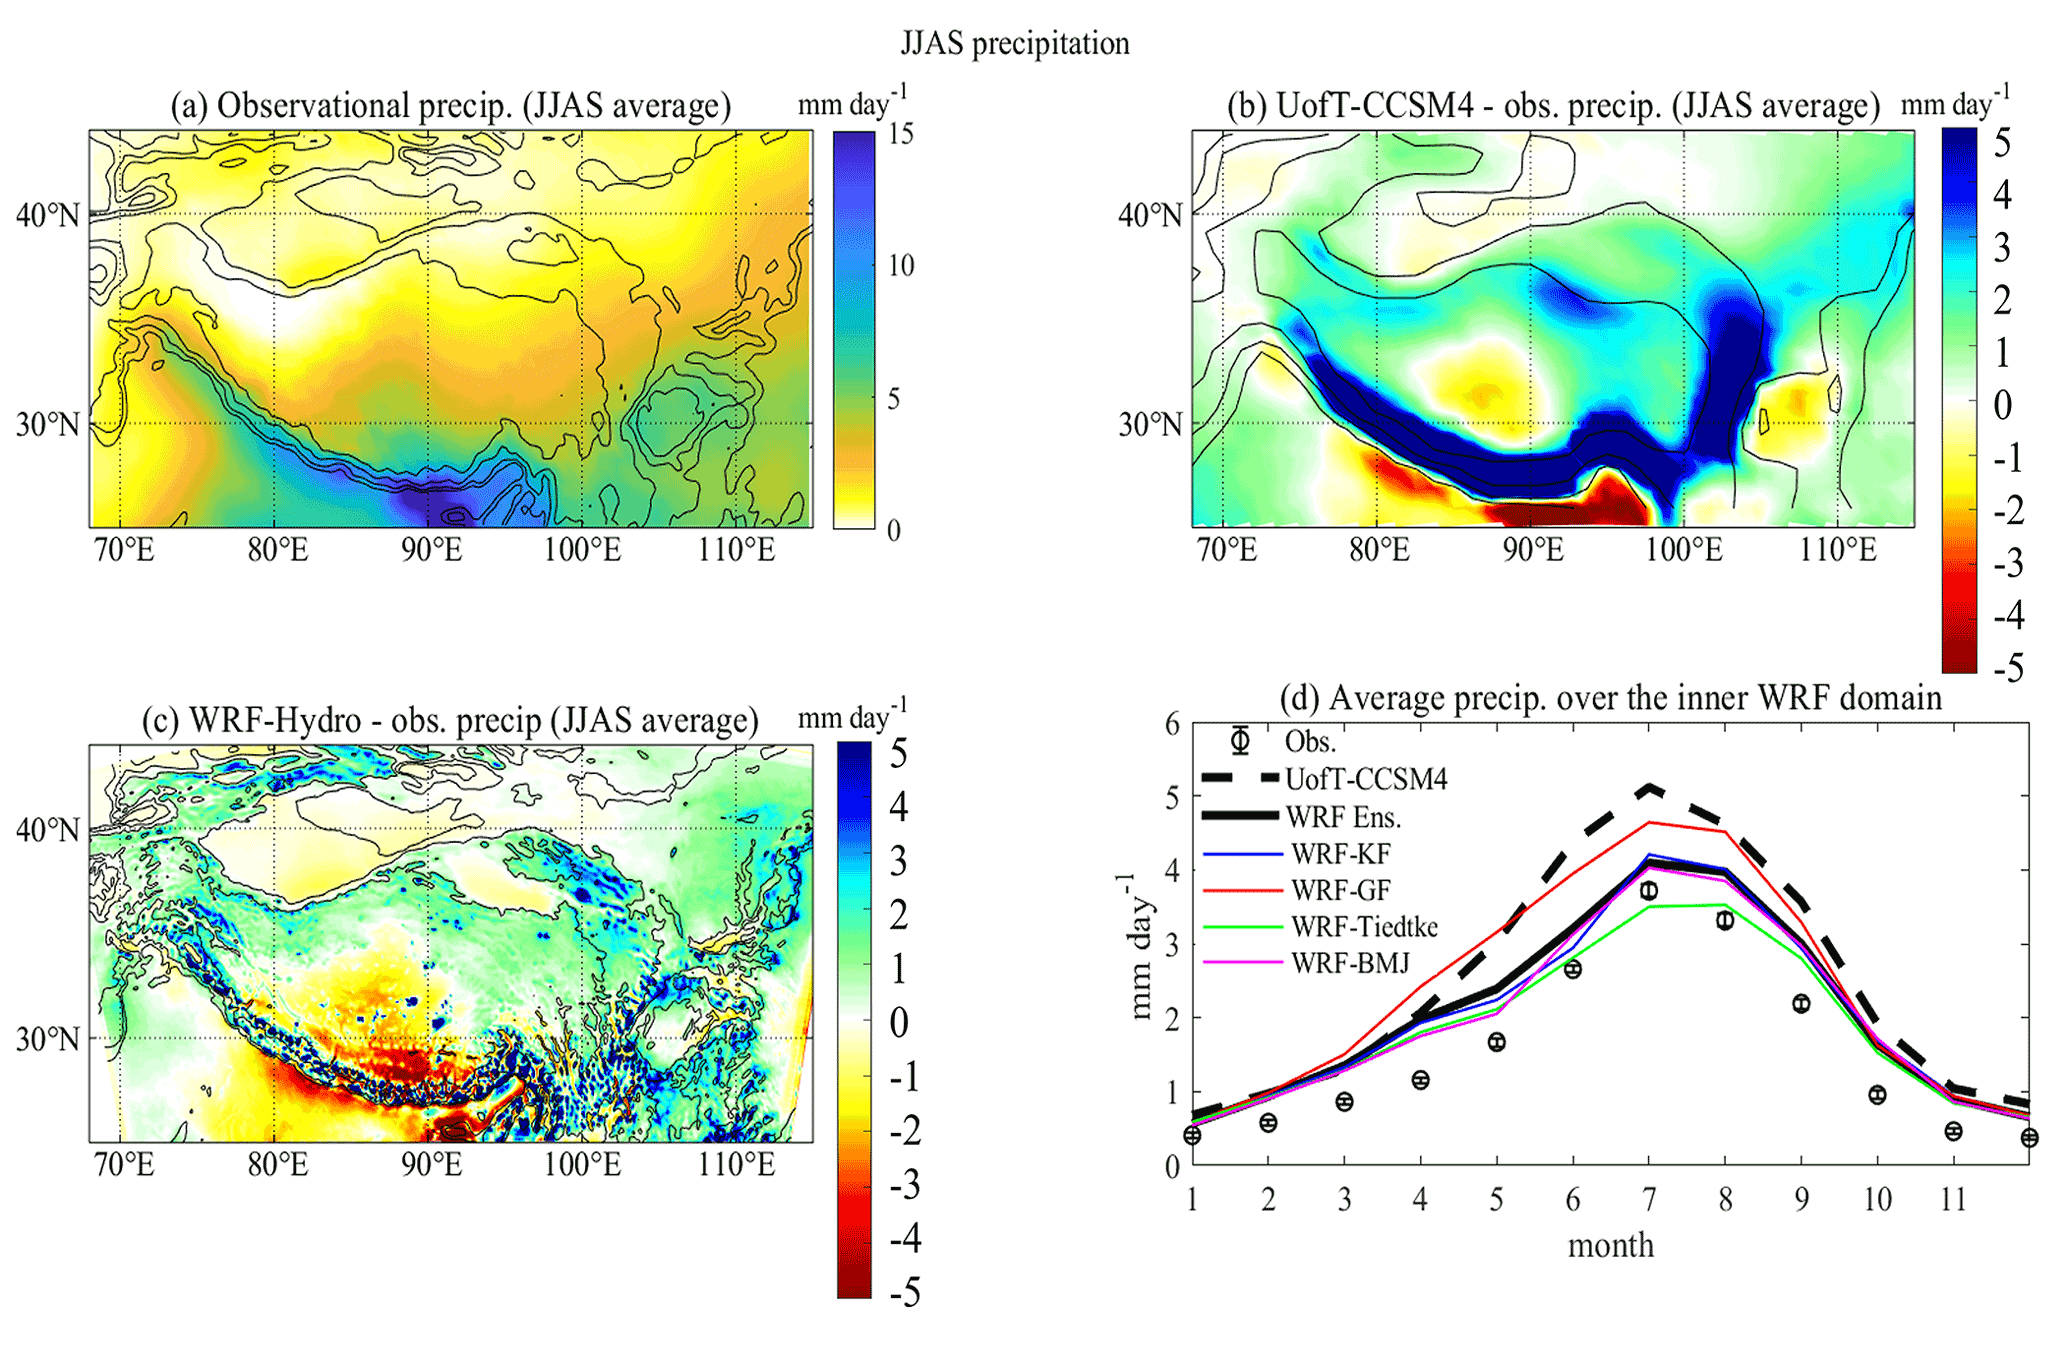
Figure A1JJAS precipitation bias with respect to (a) the CRU observational dataset for (b) UofT-CCSM4 and (c) the WRF ensemble. (c) Monthly precipitation over the inner WRF domain in the observation, UofT-CCSM4, WRF ensemble average, and four individual physics ensemble members. The topography contours of 500, 1000, 2000, and 4000 m are also shown in black in (a)–(c).
Code and data for reproducing the figures in the article can be obtained from Yiling Huo.
WRP and YH designed the experiments and YH constructed the simulations. DC designed the GS simulation and performed the UofT-CCSM4 global experiments. YH modified the dynamical downscaling pipeline to include WRF-Hydro. YH prepared the manuscript with contributions from both co-authors.
The contact author has declared that none of the authors has any competing interests.
Publisher's note: Copernicus Publications remains neutral with regard to jurisdictional claims in published maps and institutional affiliations.
The simulations analysed in this study were performed on the Niagara supercomputer, which is operated by the SciNet High-Performance Computing facility at the University of Toronto. SciNet is a component of the Compute Canada high-performance computing platform.
This research has been supported by the Natural Sciences and Engineering Research Council of Canada (grant no. A9627).
This paper was edited by Martin Claussen and reviewed by Sabin T. P. and one anonymous referee.
An, Z., Kutzbach, J., Prell, W., and Porter, S.: Evolution of Asian monsoons and phased uplift of the Himalaya–Tibetan plateau since Late Miocene times, Nature, 411, 62–66, https://doi.org/10.1038/35075035, 2001.
Barnett, T. P., Adam, J. C., and Lettenmaier, D. P.: Potential impacts of a warming climate on water availability in snow-dominated regions, Nature, 438, 303–309, https://doi.org/10.1038/nature04141, 2005.
Bartlein, P. J., Harrison, S. P., Brewer, S., Connor, S., Davis, B. A. S., Gajeweski, K., Guiot, J., Harrison-Prentice, T. I., Henderson, A., Peyron, O., Prentice, I. C., Scholze, M., Seppä, H., Shuman, B., Sugita, S., Thompson, R. S., Viau, A. E., Williams, J., and Wu, H.: Pollen-based continental climate reconstructions at 6 and 21 ka: a global synthesis, Clim. Dynam., 37, 775–802, https://doi.org/10.1007/s00382-010-0904-1, 2011.
Berger, A.: Long-term variations of daily insolation and quater-nary climatic changes, J. Atmos. Sci., 35, 2362–2367, https://doi.org/10.1175/1520-0469(1978)035<2362:LTVODI>2.0.CO;2, 1978.
Cai, M., Yang, S., Zhao, C., Zhou, Q., and Hou, L.: Insight into runoff characteristics using hydrological modeling in the data-scarce southern Tibetan Plateau: Past, present, and future, PLoS ONE, 12, e0176813. https://doi.org/10.1371/journal.pone.0176813, 2017.
Chandan, D. and Peltier, W. R.: Regional and global climate for the mid-Pliocene using the University of Toronto version of CCSM4 and PlioMIP2 boundary conditions, Clim. Past, 13, 919–942, https://doi.org/10.5194/cp-13-919-2017, 2017.
Chandan, D. and Peltier, W. R.: On the mechanisms of warming the mid-Pliocene and the inference of a hierarchy of climate sensitivities with relevance to the understanding of climate futures, Clim. Past, 14, 825–856, https://doi.org/10.5194/cp-14-825-2018, 2018.
Chandan, D. and Peltier, W. R.: African Humid Period precipitation sustained by robust vegetation, soil, and lake feedbacks, Geophys. Res. Lett., 47, e2020GL088728, https://doi.org/10.1029/2020GL088728, 2020.
Chen, F., Zhang, J., Liu, J., Cao, X., Hou, J., Zhu, L., Xu, X., Liu, X., Wang, M., Wu, D., Huang, L., Zeng, T., Zhang, S., Huang, W., Zhang, X., and Yang, K.: Climate change, vegetation history, and landscape responses on the Tibetan Plateau during the Holocene: a comprehensive review, Quaternary Sci. Rev., 243, 106444, https://doi.org/10.1016/j.quascirev.2020.106444, 2020.
Chen, X., Wu, D., Huang, X., Lv, F., Brenner, M., Jin, H., and Chen, F.: Vegetation response in subtropical southwest China to rapid climate change during the Younger Dryas, Earth-Sci. Rev., 201, 103080, https://doi.org/10.1016/j.earscirev.2020.103080, 2020.
Conroy, J. L., and Overpeck, J. T.: Regionalization of Present-Day Precipitation in the Greater Monsoon Region of Asia, J. Climate, 24, 4073–4095, https://doi.org/10.1175/2011JCLI4033.1, 2011.
Cuo, L., Zhang, Y., Gao, Y., Hao, Z., and Cairang, L.: The impacts of climate change and land cover/use transition on the hydrology in the upper Yellow River Basin, China, J. Hydrol., 502, 37–52, https://doi.org/10.1016/j.jhydrol.2013.08.003, 2013.
d'Orgeville, M., Peltier, W. R., Erler, A. R., and Gula, J.: Climate change impacts on Great Lakes Basin precipitation extremes, J. Geophys. Res., 119, 10799–10812, https://doi.org/10.1002/2014JD021855, 2014.
Erler, A. R. and Peltier, W. R.: Projected Changes in Precipitation Extremes for Western Canada based on High-resolution Regional Climate Simulations, J. Climate, 29, 8841–8863, https://doi.org/10.1175/JCLI-D-15-0530.1, 2016.
Gent, P. R., Danabasoglu, G., Donner, L. J., Holland, M. M, Hunke, E. C., Jayne, S. R., Lawrence, D. M., Neale, R. B., Rasch, P. J., Vertenstein, M., Worley, P. H., Yang, Z.-L., and Zhang, M.: The community climate system model version 4, J. Climate, 24, 4973–4991, https://doi.org/10.1175/2011JCLI4083.1, 2011.
Gochis, D. J., and Chen, F.: Hydrological Enhancements to the Community Noah Land Surface Model: Technical Description; NCAR – Center for Atmospheric Research, Boulder, CO, USA, https://doi.org/10.5065/D60P0X00, 2003.
Gochis, D. J., Barlage, M., Cabell, R., Casali, M., Dugger, A., FitzGerald, K., McAllister, M., McCreight, J., RafieeiNasab, A., Read, L., Sampson, K., Yates, D., and Zhang, Y.: The WRF-Hydro modeling system technical description, (Version 5.1.1), NCAR Technical Note, NCAR, https://ral.ucar.edu/sites/default/files/public/projects/wrf_hydro/technical-description-user-guide/wrf-hydro-v5.1.1-technical-description.pdf (last access: 24 October 2022), 2020.
GRDC: Report of the Twelfth Meeting of the GRDC Steering Committee, Koblenz, Germany, 18–19 June 2014, GRDC – Global Runoff Data Centre, Koblenz, Germany, 23 pp., https://doi.org/10.5675/GRDC_Report_46, 2015.
Grell, G. A. and Freitas, S. R.: A scale and aerosol aware stochastic convective parameterization for weather and air quality modeling, Atmos. Chem. Phys., 14, 5233–5250, https://doi.org/10.5194/acp-14-5233-2014, 2014.
Gula, J. and Peltier, W. R.: Dynamical downscaling over the Great Lakes Basin of North America using the WRF regional climate model: The impact of the Great Lakes system on regional greenhouse warming, J. Climate, 25, 7723–7742, https://doi.org/10.1175/JCLI-D-11-00388.1, 2012.
Harris, I., Osborn, T. J., Jones, P., and Lister, D.: Version 4 of the CRU TS monthly high-resolution gridded multivariate climate dataset, Sci. Data, 7, 109, https://doi.org/10.1038/s41597-020-0453-3, 2020.
Hély, C., Lézine, A.-M., and contributors, A.: Holocene changes in African vegetation: tradeoff between climate and water availability, Clim. Past, 10, 681–686, https://doi.org/10.5194/cp-10-681-2014, 2014.
Herzschuh, U.: Palaeo-moisture evolution in monsoonal Central Asia during the last 50.000 years, Quaternary Sci. Rev., 25, 163–178, https://doi.org/10.1016/j.quascirev.2005.02.006, 2006.
Herzschuh, U., Cao, X., Laepple, T., Dallmeyer, A., Telford, R. J., Ni, J., Chen, F., Kong, Z., Liu, G., Liu, K., Liu, X., Stebich, M., Tang, L., Tian, F., Wang, Y., Wischnewski, J., Xu, Q., Yan, S., Yang, Z., Yu, G., Zhang, Y., Zhao, Y., and Zheng, Z.: Position and orientation of the westerly jet determined Holocene rainfall patterns in China, Nat. Commun., 10, 2376, https://doi.org/10.1038/s41467-019-09866-8, 2019.
Huang, Y., Cai, J., Yin, H., and Cai, M.: Correlation of precipitation to temperature variation in the Huanghe River (Yellow River) basin during 1957–2006, J. Hydrol., 372, 1–8, https://doi.org/10.1016/j.jhydrol.2009.03.029, 2009.
Huo, Y. and Peltier, W. R.: Dynamically Downscaled Climate Simulations of the Indian Monsoon in the Instrumental Era: Physics Parameterization Impacts and Precipitation Extremes, J. Appl. Meteorol. Clim., 58, 831–852, https://doi.org/10.1175/JAMC-D18-0226.1, 2019.
Huo, Y. and Peltier, W. R.: Dynamically Downscaled Climate Change Projections for the South Asian Monsoon: Mean and Extreme Precipitation Changes and Physics Parameterization Impacts, J. Climate, 33, 2311–2331, https://doi.org/10.1175/JCLI-D-19-0268.1, 2020.
Huo, Y. and Peltier, W. R.: The Southeast Asian Monsoon: Dynamically Downscaled Climate Change Projections and High Resolution Regional Ocean Modelling on the Effects of the Tibetan Plateau, Clim. Dynam., 56, 2597–2616, https://doi.org/10.1007/s00382-020-05604-9, 2021.
Huo, Y., Peltier, W. R., and Chandan, D.: Mid-Holocene monsoons in South and Southeast Asia: dynamically downscaled simulations and the influence of the Green Sahara, Clim. Past, 17, 1645–1664, https://doi.org/10.5194/cp-17-1645-2021, 2021.
Immerzeel, W. W., Lutz, A. F., Andrade, M., Bahl, A., Biemans, H., Bolch, T., Hyde, S., Brumby, S., Davies, B. J., Elmore, A. C., Emmer, A., Feng, M., Fernández, A., Haritashya, U., Kargel, J. S., Koppes, M., Kraaijenbrink, P. D. A., Kulkarni, A. V., Mayewski, P. A., Nepal, S., Pacheco, P., Painter, T. H., Pellicciotti, Francesca, Rajaram, H., Rupper, S., Sinisalo, A., Shrestha, A. B., Viviroli, D., Wada, Y., Xiao, C., Yao, T., and Baillie, J. E. M.: Importance and vulnerability of the world's water towers, Nature, 577, 364–369, https://doi.org/10.1038/s41586-019-1822-y, 2020.
IPCC: Summary for Policymakers, in: Climate Change 2013: The Physical Science Basis, Contribution of Working Group I to the Fifth Assessment Report of the Intergovernmental Panel on Climate Change, Cambridge University Press, Cambridge, UK and New York, NY, USA, ISBN 978-1-107-66182-0, 2013.
Janjic, Z. I.: The Step-Mountain Eta Coordinate Model: Further developments of the convection, viscous sublayer, and turbulence closure schemes, Mon. Weather Rev., 122, 927–945, https://doi.org/10.1175/1520-0493(1994)122<0927:TSMECM>2.0.CO;2, 1994.
Kain, J. S.: The Kain–Fritsch convective parameterization: An update, J. Appl. Meteorol., 43, 170–181, https://doi.org/10.1175/1520-0450(2004)043<0170:TKCPAU>2.0.CO;2, 2004.
Kaser, G., Grosshauser, M., and Marzeion, B.: Contribution potential of glaciers to water availability in different climate regimes, P. Natl. Acad. Sci. USA, 107, 20223–20227, https://doi.org/10.1073/pnas.1008162107, 2010.
Kaufman, D., McKay, N., Routson, C., Erb, M., Davis, B., Heiri, O., Jaccard, S., Tierney, J., Dätwyler, C., Axford, Y., Brussel, T., Cartapanis, O., Chase, B., Dawson, A., de Vernal, A., Engels, S., Jonkers, L., Marsicek, J., Moffa-Sánchez, P., Morrill, C., Orsi, A., Rehfeld, K., Saunders, K., Sommer, P. S., Thomas, E., Tonello, M., Tóth, M., Vachula, R., Andreev, A., Bertrand, S., Biskaborn, B., Bringué, M., Brooks, S., Caniupán, M., Chevalier, M., Cwynar, L., Emile-Geay, J., Fegyveresi, J., Feurdean, A., Finsinger, W., Fortin, M.-C., Foster, L., Fox, M., Gajewski, K., Grosjean, M., Hausmann, S., Heinrichs, M., Holmes, N., Ilyashuk, B., Ilyashuk, E., Juggins, S., Khider, D., Koinig, K., Langdon, P., Larocque-Tobler, I., Li, J., Lotter, A., Luoto, T., Mackay, A., Magyari, E., Malevich, S., Mark, B., Massaferro, J., Montade, V., Nazarova, L., Novenko, E., Pařil, P., Pearson, E., Peros, M., Pienitz, R., Płóciennik, M., Porinchu, D., Potito, A., Rees, A., Reinemann, S., Roberts, S., Rolland, N., Salonen, S., Self, A., Seppä, H., Shala, S., St-Jacques, J.-M., Stenni, B., Syrykh, L., Tarrats, P., Taylor, K., van den Bos, V., Velle, G., Wahl, E., Walker, I., Wilmshurst, J., Zhang, E., and Zhilich, S.: A global database of Holocene paleotemperature records, Scient. Data, 7, 1–34, https://doi.org/10.1038/s41597-020-0445-3, 2020.
Kehrwald, N. M., Thompson, L. G., Tandong, Y., Mosley-Thompson, E., Schotterer, U., Alfimov, V., Beer, J., Eikenberg, J., and Davis, M. E.: Mass loss on Himalayan glacier endangers water resources, Geophys. Res. Lett., 35, L22503, https://doi.org/10.1029/2008GL035556, 2008.
Kerandi, N., Arnault, J., Laux, P., Wagner, S., Kitheka, J., and Kunstmann, H.: Joint atmospheric-terrestrial water balances for East Africa: A WRF-Hydro case study for the upper Tana River basin, Theor. Appl. Climatol., 131, 1337–1355, https://doi.org/10.1007/s00704-017-2050-8, 2018.
Krysanova, V., Vetter, T., Eisner, S., Huang, S., Pechlivanidis, I., Strauch, M., Gelfan, A., Kumar, R., Aich, V., Arheimer, B., Chamorro, A., van Griensven, A., Kundu, D., Lobanova, A., Mishra, V., Plötner, S., Reinhardt, J., Seidou, O., Wang, X., Wortmann, M., Zeng, X., and Hattermann, F. F.: Intercomparison of regional-scale hydrological models and climate change impacts projected for 12 large river basins worldwide – A synthesis, Environ. Res. Lett., 12, 105002, https://doi.org/10.1088/1748-9326/aa8359, 2017.
Kutzbach, J. E., Prell, W. L., and Ruddiman, W. F.: Sensitivity of Eurasian climate to surface uplift of the Tibetan Plateau, J. Geol., 101, 177–190, 1993.
Lehnert, L., Wesche, K., Trachte, K., Reudenbach, C., and Bendix, J.: Climate variability rather than overstocking causes recent large scale cover changes of Tibetan pastures, Sci. Rep., 6, 24367, https://doi.org/10.1038/srep24367, 2016.
Li, Q., Wu, H., Yu, Y., Sun, A., and Luo, Y.: Large-scale vegetation history in China and its response to climate change since the Last Glacial Maximum, Quatern. Int., 500, 108–119, https://doi.org/10.1016/j.quaint.2018.11.016, 2019.
Lu, H., Wu, N., Liu, K., Zhu, L., Yang, X., Yao, T., Wang, L., Li, Q., Liu, X., Shen, C., Li, X., Tong, G., and Jiang, H.: Modern pollen distributions in Qinghai-Tibetan Plateau and the development of transfer functions for reconstructing Holocene environmental changes, Quaternary Sci. Rev., 30, 947–966, https://doi.org/10.1016/j.quascirev.2011.01.008, 2011.
Ma, Q., Zhu, L., Lü, X., Guo, Y., Ju, J., Wang, J., Wang, Y., and Tang, L.: Pollen-inferred Holocene vegetation and climate histories in Taro Co, southwestern Tibetan Plateau, Chin. Sci. Bull, 59, 4101–4114, https://doi.org/10.1007/s11434-014-0505-1, 2014.
Maher, B. A.: Holocene variability of the East Asian summer monsoon from Chinese cave records: a re-assessment, Holocene, 18, 861–866, https://doi.org/10.1177/0959683608095569, 2008.
Molnar, P., Boos, W. R., and Battisti, D. S.: Orographic controls on climate and paleoclimate of asia: thermal and mechanical roles for the Tibetan Plateau, Annu. Rev. Earth Planet. Sci., 38, 77–102, https://doi.org/10.1146/annurev-earth-040809-152456, 2010.
Otto-Bliesner, B. L., Braconnot, P., Harrison, S. P., Lunt, D. J., Abe-Ouchi, A., Albani, S., Bartlein, P. J., Capron, E., Carlson, A. E., Dutton, A., Fischer, H., Goelzer, H., Govin, A., Haywood, A., Joos, F., LeGrande, A. N., Lipscomb, W. H., Lohmann, G., Mahowald, N., Nehrbass-Ahles, C., Pausata, F. S. R., Peterschmitt, J.-Y., Phipps, S. J., Renssen, H., and Zhang, Q.: The PMIP4 contribution to CMIP6 – Part 2: Two interglacials, scientific objective and experimental design for Holocene and Last Interglacial simulations, Geosci. Model Dev., 10, 3979–4003, https://doi.org/10.5194/gmd-10-3979-2017, 2017.
Pausata, F., Zhang, Q., Muschitiello, F., Lu, Z., Chafik, L., Niedermeyer, E. M., Stager J. C., Cobb, K. M., and Liu, Z.: Greening of the Sahara suppressed ENSO activity during the mid-Holocene, Nat. Commun., 8, 16020, https://doi.org/10.1038/ncomms16020, 2017.
Pausata, F. S. R., Messori, G., and Zhang, Q.: Impacts of dust reduction on the Northward expansion of the African monsoon during the Green Sahara period, Earth Planet. Sc. Lett., 434, 298–307, https://doi.org/10.1016/j.epsl.2015.11.049, 2016.
Pausata, F. S. R., Gaetani, M., Messori, G., Berg, A., Maia de Souza, D., Sage, R. F., and deMenocal, P. B.: The Greening of the Sahara: Past Changes and Future Implications, One Earth, 2, 235–250, https://doi.org/10.1016/j.oneear.2020.03.002, 2020.
Peltier, W. R. and Vettoretti, G.: Dansgaard-Oeschger oscillations predicted in a comprehensive model of glacial climate: A “kicked” salt oscillator in the Atlantic, Geophys. Res. Lett., 41, 7306–7313, https://doi.org/10.1002/2014GL061413, 2014.
Peltier, W. R., d'Orgeville, M., Erler, A. R., and Xie, F.: Uncertainty in Future Summer Precipitation in the Laurentian Great Lakes Basin: Dynamical Downscaling and the Influence of Continental Scale Processes on Regional Climate Change, J. Climate, 31, 2651–2673, https://doi.org/10.1175/JCLI-D-17-0416.1, 2018.
Scussolini, P., Eilander, D., Sutanudjaja, E. H., Ikeuchi, H., Hoch, J. M., Ward, P. J., Bakker, P., Otto-Bliesner, B. L., Guo, C., Stepanek, C., Zhang, Q., Braconnot, P., Guarino, M.-V., Muis, S., Yamazaki, D., Veldkamp, T. I. E., and Aerts, J. C. J. H.: Global river discharge and floods in the warmer climate of the Last Interglacial, Geophys. Res. Lett., 47, e2020GL089375, https://doi.org/10.1029/2020GL089375, 2020.
Senatore, A., Mendicino, G., Gochis, D. J., Yu, W., Yates, D. N., and Kunstmann, H.: Fully coupled atmosphere-hydrology simulations for the central Mediterranean: Impact of enhanced hydrological parameterization for short and long time scales, J. Adv. Model. Earth Syst.,7, 1693–1715, https://doi.org/10.1002/2015MS000510, 2015.
Shi, P. J. and Song, C. Q.: Palynological records of environmental changes in the middle part of Inner Mongolia, China, Chin. Sci. Bull., 48, 1433–1438, https://doi.org/10.1360/02wd0259, 2003.
Shi, Y. F., Kong, Z. Z., Wang, S. M., Tang, L. Y., Wang, F. B., Yao, T. D., Zhao, X. T., Zhang, P. Y., and Shi, S. H.: Mid-Holocene climates and environments in China, Global Planet. Change, 7, 219–233, https://doi.org/10.1016/0921-8181(93)90052-P, 1993.
Skinner, C. B. and Poulsen, C. J.: The role of fall season tropical plumes in enhancing Saharan rainfall during the African Humid Period, Geophys. Res. Lett., 43, 349–358, https://doi.org/10.1002/2015GL066318, 2016.
Somos-Valenzuela, M. A. and Palmer, R. N.: Use of WRF-Hydro over the Northeast of the US to Estimate Water Budget Tendencies in Small Watersheds, Water, 10, 1709, https://doi.org/10.3390/w10121709, 2018.
Sun, Q. L., Zhou, J., Shen, J., Chen, P., Wu, F., and Xie, X. P.: Environmental characteristics of Mid-Holocene recorded by lacustrine sediments from Lake Daihai, north environment sensitive zone, China, Sci. China Ser. D, 49, 968–981, https://doi.org/10.1007/s11430-006-0968-2, 2006.
Sun, W., Wang, B., Zhang, Q., Pausata, F. S. R., Chen, D., Lu, G., Yan, M., Ning, L., and Liu, J.: Northern Hemisphere Land Monsoon Precipitation Increased by the Green Sahara During Middle Holocene, Geophys. Res. Lett., 46, 9870–9879, https://doi.org/10.1029/2019GL082116, 2019.
Swann, A. L. S., Fung, I. Y., Liu, Y., and Chiang, J. C. H.: Remote Vegetation Feedbacks and the Mid-Holocene Green Sahara, J. Climate, 27, 4857–4870, https://doi.org/10.1175/JCLI-D-13-00690.1, 2014.
Tarasov, P. E., Webb III, T., Andreev, A. A., Afanas'eva, N. B., Berezina, N. A., Bezusko, L. G., Blyakharchuk, T. A., Bolikhovskaya, N. S., Cheddadi, R., Chernavskaya, M. M., Chernova, G. M., Dorofeyuk, N. I., Dirksen, V. G., Elina, G. A., Filimonova, L. V., Glebov, F. Z., Guiot, J., Gunova, V. S., Harrison, S. P., Jolly, D., Khomutova, V. I., Kvavadze, E. V., Osipova, I. M., Panova, N. K., Prentice, I. C., Saarse, L., Sevastyanov, D. V., Volkova, V. S., and Zernitskaya, V. P.: Presentday and mid-Holocene biomes reconstructed from pollen and plant macrofossil data from the former Soviet Union and Mongolia, J. Biogeogr., 25, 1029–1053, https://doi.org/10.1046/j.1365-2699.1998.00236.x, 1998.
Tewari, M., Chen, F., Wang, W., Dudhia, J., LeMone, M. A., Mitchell, K., Ek, M., Gayno, G., Wegiel, J., and Cuenca, R. H.: Implementation and verification of the unified Noah land surface model in the WRF model, in: 20th Conf. on Weather Analysis and Forecasting/16th Conf. on Numerical Weather Prediction, Seattle, WA, Amer. Meteor. Soc., https://ams.confex.com/ams/84Annual/techprogram/paper_69061.htm (last access: 25 October 2022), 2004.
Tiedtke, M.: A comprehensive mass flux scheme for cumulus parameterization in large-scale models, Mon. Weather Rev., 117, 1779–1800, https://doi.org/10.1175/1520-0493(1989)117<1779:ACMFSF>2.0.CO;2, 1989.
Trambauer, P., Werner, M., Winsemius, H. C., Maskey, S., Dutra, E., and Uhlenbrook, S.: Hydrological drought forecasting and skill assessment for the Limpopo River basin, southern Africa, Hydrol. Earth Syst. Sci., 19, 1695–1711, https://doi.org/10.5194/hess-19-1695-2015, 2015.
Wang, M., Hou, J., Duan, Y., Chen, J., Li, X., He, Y., Lee, S., and Chen, F.: Internal feedbacks forced Middle Holocene cooling on the Qinghai-Tibetan Plateau, Boreas, 50, 1116–1130, https://doi.org/10.1111/bor.12531, 2021.
Wanner, H., Beer, J., Bütikofer, J., Crowley, J. T., Cubasch, U., Flückiger, J., Goosse, H., Grosjean, M., Joos, F., Kaplan, J. O., Küttel, M., Müllerg, S. A., Prentice, I. C., Solomina, O., Stocker, T. F., Tarasov, P., Wagner, M., and Widmann, M.: Mid- to Late-Holocene climate change: An overview, Quaternary Sci. Rev., 27, 1791–1828, https://doi.org/10.1016/j.quascirev.2008.06.013, 2008.
Yang, K., Wu, H., Qin, J., Lin, C., Tang, W., and Chen, Y.: Recent climate changes over the Tibetan Plateau and their impacts on energy and water cycle: A review, Global Planet. Change, 112, 79–91, https://doi.org/10.1016/j.gloplacha.2013.12.001, 2014.
Yao, T., and Yao, Z.: Impacts of glacier retreat on runoff on Tibetan Plateau, Chin. J. Nat., 32, 4–8, 2010.
Yao, T., Wang, Y., Liu, S., Pu, J., Shen, Y., and Lu, A.: Recent glacial retreat in High Asia in China and its impact on water resource in Northwest China, Sci. China Ser. D, 47, 1065–1075, https://doi.org/10.1360/03yd0256, 2004.
Yao, T., Thompson, L., Wei, Y., Yu, W., Yang, G., Guo, X., Yang, X., Duan, K., Zhao, H., and Xu, B.: Different glacier status with atmospheric circulations in Tibetan Plateau and surroundings, Nat. Clim. Change, 2, 663–667, https://doi.org/10.1038/nclimate1580, 2012.
Yao, T., Xue, Y., Chen, D., Chen, F., Thompson, L., Cui, P., Koike, T., Lau, W. K.-M., Lettenmaier, D., and Mosbrugger, V.: Recent Third Pole's Rapid Warming Accompanies Cryospheric Melt and Water Cycle Intensification and Interactions between Monsoon and Environment: Multidisciplinary Approach with Observations, Modeling, and Analysis, B. Am. Meteorol. Soc., 100, 423–444, https://doi.org/10.1175/BAMS-D-17-0057.1, 2019.
Yatagai, A., Kamiguchi, K., Arakawa, O., Hamada, A., Yasutomi, N., and Kitoh A.: APHRODITE: Constructing a Long-term Daily Gridded Precipitation Dataset for Asia based on a Dense Network of Rain Gauges, B. Am. Meteorol. Soc., 93, 1401–1415, https://doi.org/10.1175/BAMS-D-11-00122.1, 2012.
Zhang, C., Zhao, C., Yu, S. Y., Yang, X., Cheng, J., Zhang, X., Xue, B., Shen, J., and Chen, F.: Seasonal imprint of Holocene temperature reconstruction on the Tibetan Plateau, Earth-Sci. Rev., 226, 103927, https://doi.org/10.1016/j.earscirev.2022.103927, 2022.
Zhang, W., Ming, Q., Shi, Z., Chen, G., Niu, J., Lei, G., Chang, F., and Zhang, H.: Lake Sediment Records on Climate Change and Human Activities in the Xingyun Lake Catchment, SW China, PLoS One, 9, e102167, https://doi.org/10.1371/journal.pone.0102167, 2014.
Zheng, W., Wu, B., He, J., and Yu, Y.: The East Asian Summer Monsoon at mid-Holocene: results from PMIP3 simulations, Clim. Past, 9, 453–466, https://doi.org/10.5194/cp-9-453-2013, 2013.
Zhou, C. Y., Zhao, P., and Chen, J. M.: The interdecadal change of summer water vapor over the Tibetan Plateau and associated mechanisms, J. Climate, 32, 4103–4119, https://doi.org/10.1175/JCLI-D-18-0364.1, 2019.