the Creative Commons Attribution 4.0 License.
the Creative Commons Attribution 4.0 License.
 | 25 Oct 2022
Pre-industrial temperature variability on the Swiss Plateau derived from the instrumental daily series of Bern and Zurich
Yuri Brugnara
Chantal Hari
Lucas Pfister
Veronika Valler
Stefan Brönnimann
We describe the compilation of two early instrumental daily temperature series from Bern and Zurich, Switzerland, starting from 1760 and 1756, respectively. The series are a combination of numerous small segments from different observers at different locations within and outside the two cities that are converted to modern units and homogenized. In addition, we introduce a methodology to estimate the errors affecting daily and monthly mean values derived from early instrumental observations. Given the frequent small data gaps, we merge the two daily series into a more complete series representing the central Swiss Plateau. We finally compare the homogenized monthly series with other temperature reconstructions for Switzerland. We find significant differences before 1860, pointing to biases that might affect some of the most widely used instrumental data sets. In general, the homogenization of temperature measurements at the transition between the early instrumental and national weather service eras remains a problematic issue in historical climatology and has significant implications for other fields of climate research.
- Article
(10278 KB) - Full-text XML
-
Supplement
(311 KB) - BibTeX
- EndNote


Meteorological early instrumental observations are usually defined as measurements made before the creation of national weather services (NWSs) (Brönnimann et al., 2019a). Particularly in Europe, a wealth of early instrumental data have allowed scientists to reconstruct the climate variability of the pre-industrial era (e.g., Böhm et al., 2010; Dobrovolnỳ et al., 2010; Valler et al., 2021), although many more have never been used.
Early instrumental data are generally considered of lesser quality, mainly because of the lack of standard procedures in place before the centralization of station networks, particularly for temperature measurements. Nevertheless, global climate data sets offer hundreds of temperature records derived from early instrumental measurements. In many cases, these are data that were elaborated by scientists in the 19th or early 20th century (e.g., Dove, 1839; Blodget, 1857; Eredia, 1912) and have never been re-evaluated since. Even though the data were produced by excellent climatologists, the tools and needs of 19th century scientists were quite different from today and there is still much scientific potential to be explored.
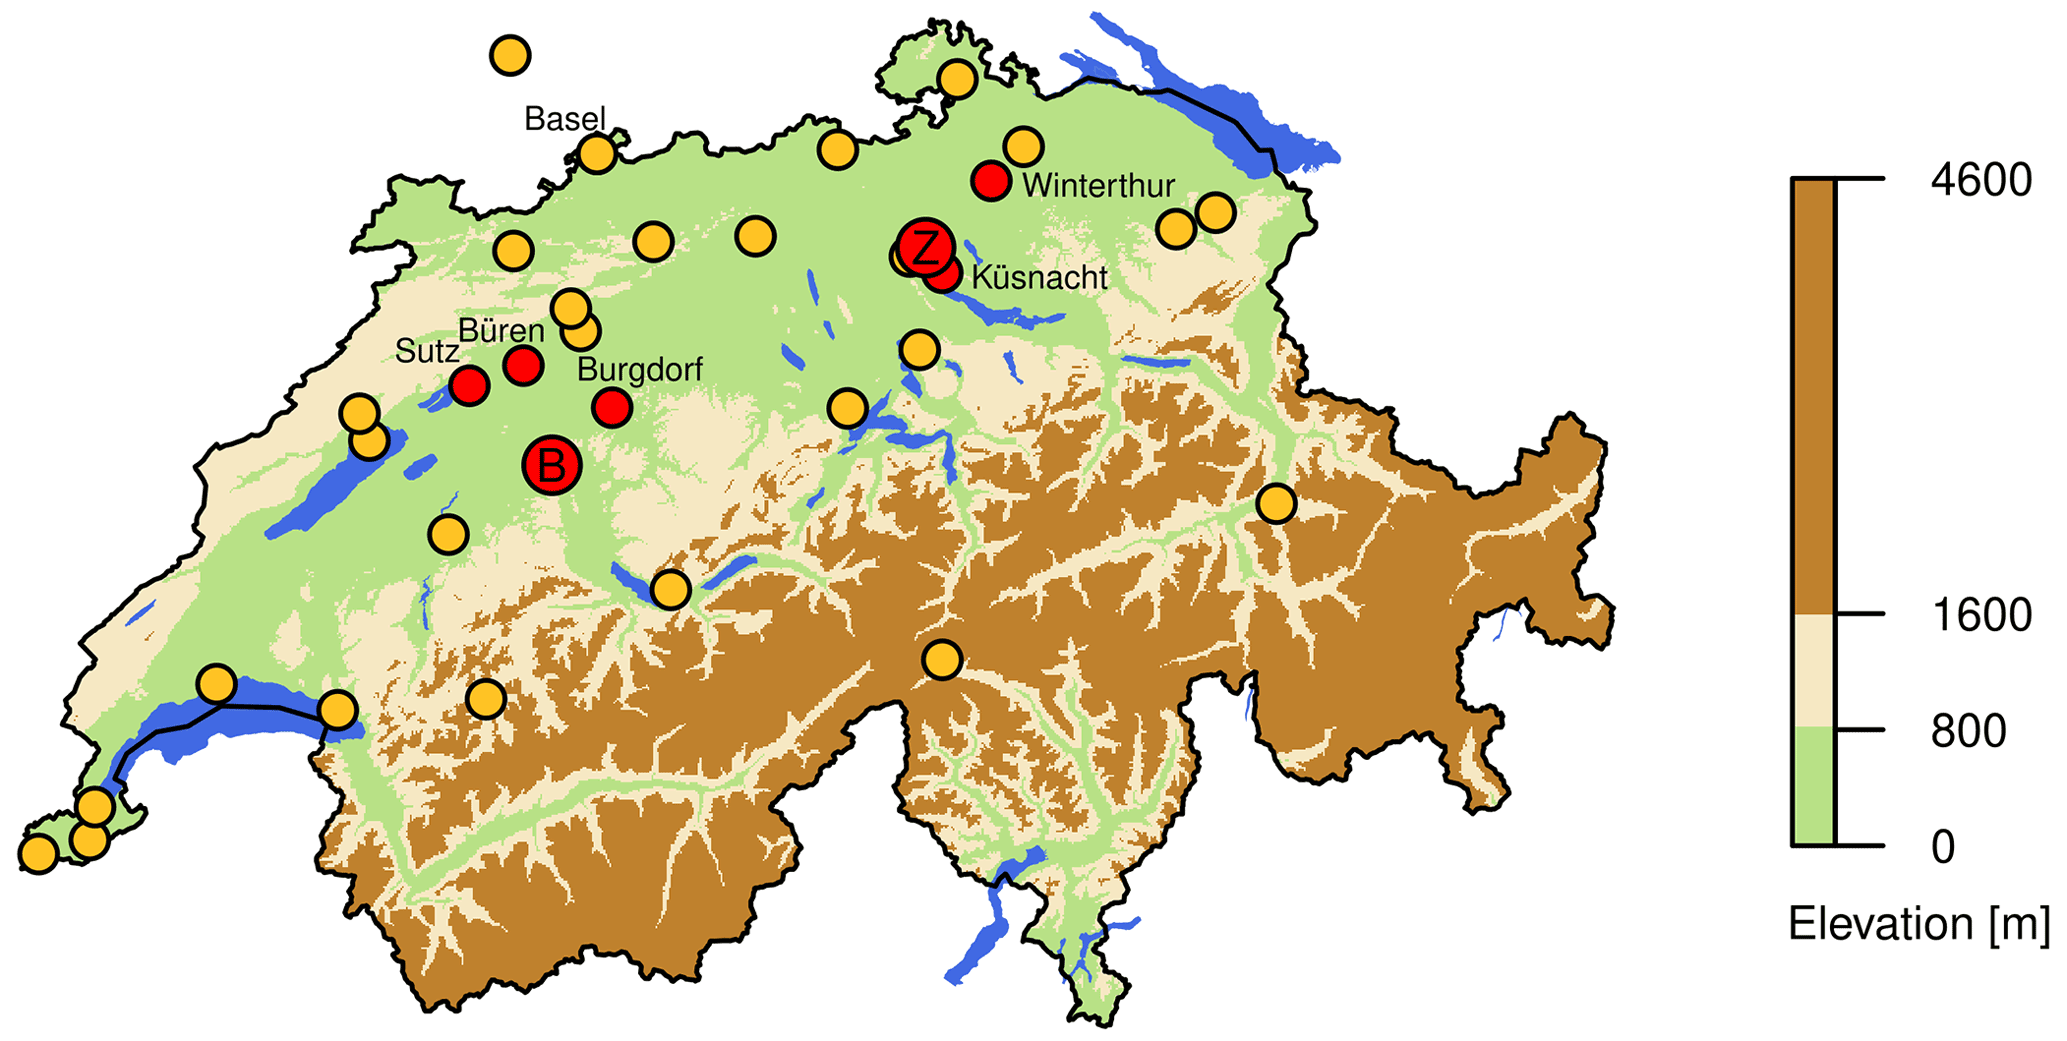
Figure 1Map of Switzerland with the stations used in the homogenization (red: stations contributing to the Bern or Zurich series, gold: reference stations; the two larger points indicate the positions of Bern – B – and Zurich – Z). The background colors represent the topography and outline the three main geographical regions of Switzerland (Jura Mountains and the Swiss Plateau in the west and the north, Swiss Alps in the south). Geographical data were provided by the Federal Office of Topography – swisstopo.
Another shortcoming of many early instrumental data series is their scarce traceability: it is often very hard, if not impossible, to trace the source of a publicly available record and the processing that it underwent, let alone to know how the underlying data were measured. This lack of transparency is becoming a more and more relevant issue in a time when climate data are crucial as never before.
In Switzerland the NWS (today: MeteoSwiss) was created in 1863, but the first regular instrumental measurements date back to the early 18th century. The history of the oldest temperature measurements in Switzerland is shaped by the success of Jacques-Barthélemy Micheli du Crest's “universal” thermometer, a spirit thermometer invented by the Genevan scientist in 1741 that became the most common thermometer in many of the Swiss cantons until the 1770s. In spite of the fact that the thermometric liquid used was not mercury, Micheli du Crest's scale was more unambiguously defined than its main alternative at the time, Réaumur's, facilitating the conversion to modern units (see Brugnara et al., 2020).
The best known and documented Swiss early instrumental temperature records are those of Basel (Bider et al., 1958), starting in 1755, and Geneva (Schüepp, 1961), starting in 1768 or 1753 (when extended using data from Neuchâtel). Due to the very fragmented records and frequent relocations, building consistent early instrumental series for Bern and Zurich brings higher hurdles. Some versions of those series were included in several global and regional data sets (e.g., Auer et al., 2007), but many parts are missing, while others are hard to identify.
During the last decade a lot of progress was made in digitizing the many existing Swiss early instrumental records (Füllemann et al., 2011; Pfister et al., 2019; Brugnara et al., 2020). This large effort allows us to produce for the first time long and nearly complete temperature series for the two main cities on the central Swiss Plateau, Bern and Zurich, reaching back to the mid-18th century. Our goal is not only to provide useful data to the scientific community, but also to guarantee full data traceability down to the original sources.
We focus on daily average temperature and also provide a tentative estimation of its uncertainty, despite the lack of metadata for many of the records. As reference series for the homogenization we use raw (i.e., non-homogenized) data from nearby stations, which allow us to produce results that are largely independent from existing temperature reconstructions.
The paper is structured as follows: in Sect. 2 we describe the many data sources in detail; in Sect. 3 we explain the methods for the calculation of daily means, the homogenization, the merging of the different segments, and the data filling; in Sect. 4 we analyze the homogenized data and compare them with existing temperature reconstructions for Switzerland, before giving our conclusions in Sect. 5.
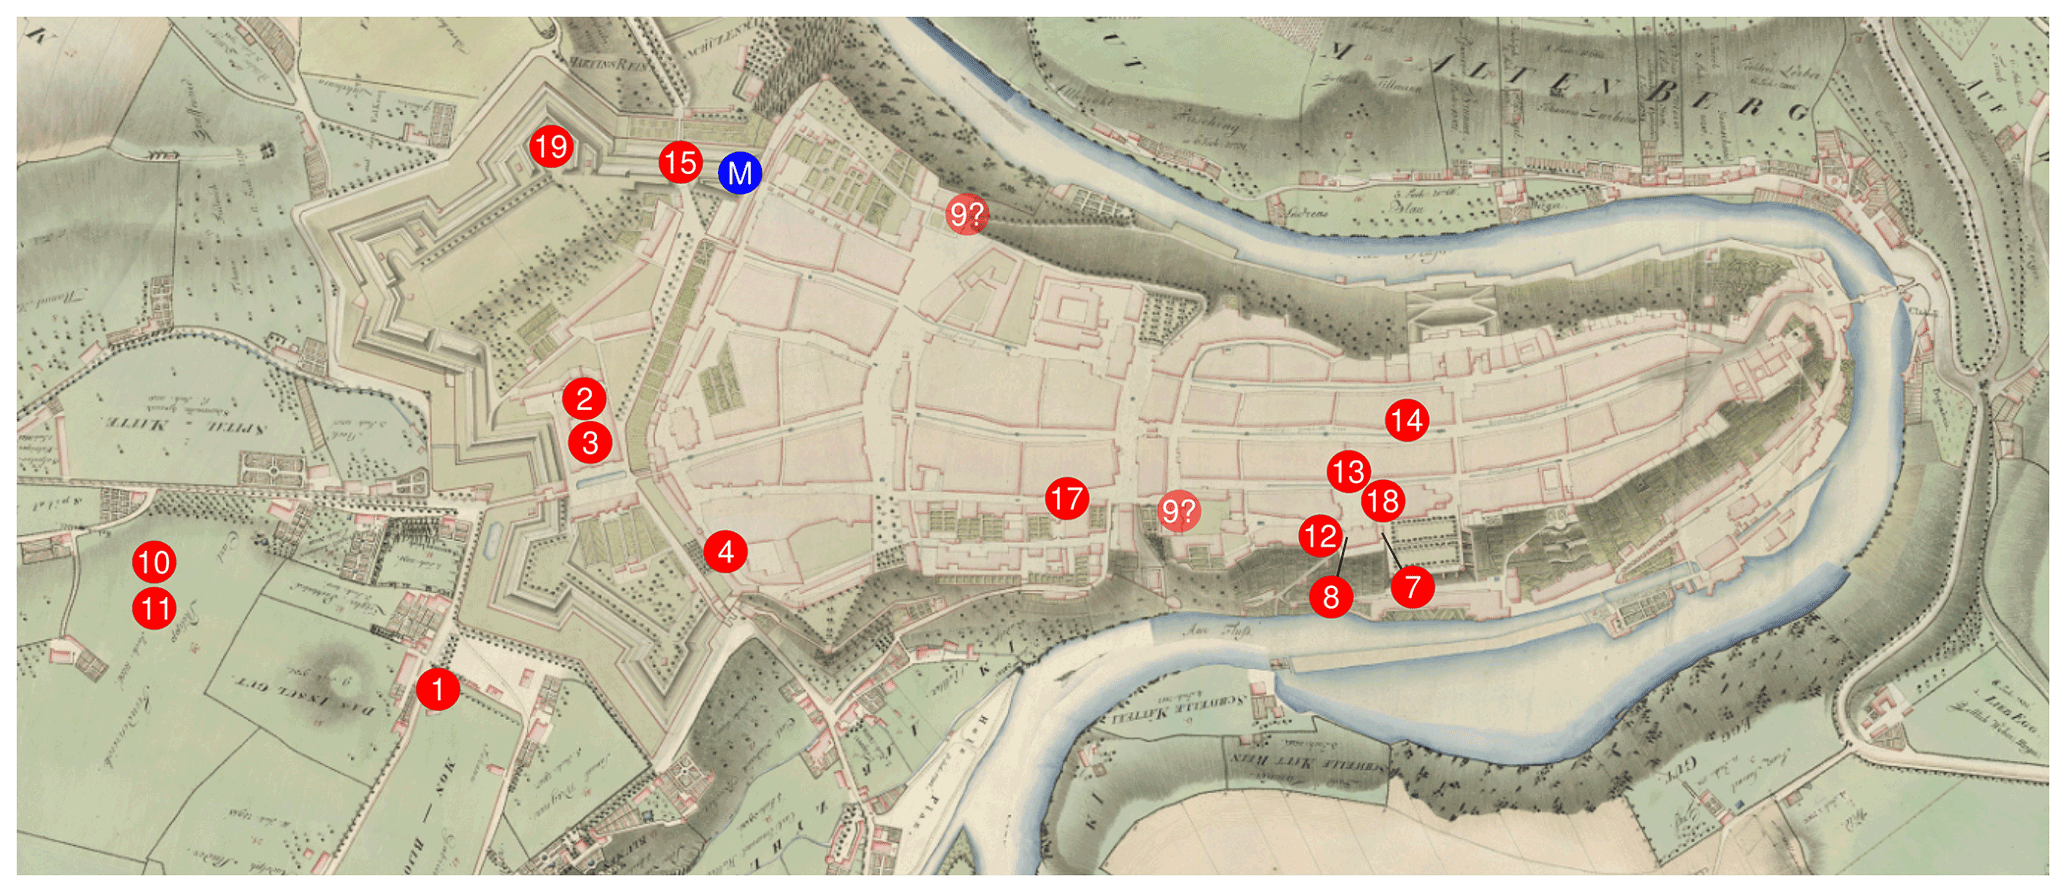
Figure 2Measurement locations drawn on a historical map of Bern (J. R. Müller, ca. 1797). The numbers refer to Table 1, and the “M” indicates the position of the MeteoSwiss station of Bern–Bollwerk. Map source: Geodaten Stadt Bern, Amt für Geoinformation des Kantons Bern.
We started from raw data digitized from numerous weather diaries and publications (Pfister et al., 2019; Brönnimann, 2020). The original temperature readings were expressed in the Micheli du Crest, Réaumur, and Celsius scales. The data conversion to modern units followed the equations given in Brugnara et al. (2020). In addition to the data quality checks described in that work, we performed systematic visual checks and corrected several minor digitization and conversion errors.
We used temperature measurements from at least 29 different locations (14 in Bern, 15 in Zurich) made between 1756 and 1867. Moreover, we used data from nearby towns (Büren an der Aare, Burgdorf, Sutz, Küsnacht, and Winterthur) to fill gaps in the two merged temperature series. In total over 300 000 data points contributed to the two merged series (169 600 for Bern and 137 884 for Zurich). All records also include pressure measurements, which were not considered in this study.
In this section we briefly describe each contributing data source and provide the relevant references for additional information. In general, temperature was measured outside a window facing north, typically 5 to 10 m from the ground and with no sheltering from radiation. Significant differences from this “standard” setting are mentioned in the source's description when known. All times refer to local time.
We used additional raw data from Brugnara et al. (2020), from the DigiHom projects (Füllemann et al., 2011), and newly rescued data from Basel and Geneva (Brönnimann et al., 2022; Brugnara and Brönnimann, 2022; Brugnara et al., 2022) as reference series for the homogenization (Fig. 1; a detailed list is provided in the Supplement). To evaluate the homogenized series, we compared them with the HISTALP version 3 (Auer et al., 2007; Böhm et al., 2010) and EKF400 version 2 (Valler et al., 2021) gridded data sets. Both products are based on the same homogenized monthly temperature series (including data from Bern and Zurich), although they follow rather different approaches: HISTALP is a simple interpolation of homogenized instrumental temperature series, while EKF400 is a paleo-reanalysis that assimilates multiple variables (temperature, pressure, precipitation) as well as documentary and proxy records (e.g., tree rings) into a global model simulation, providing a 30-member ensemble of possible realizations.
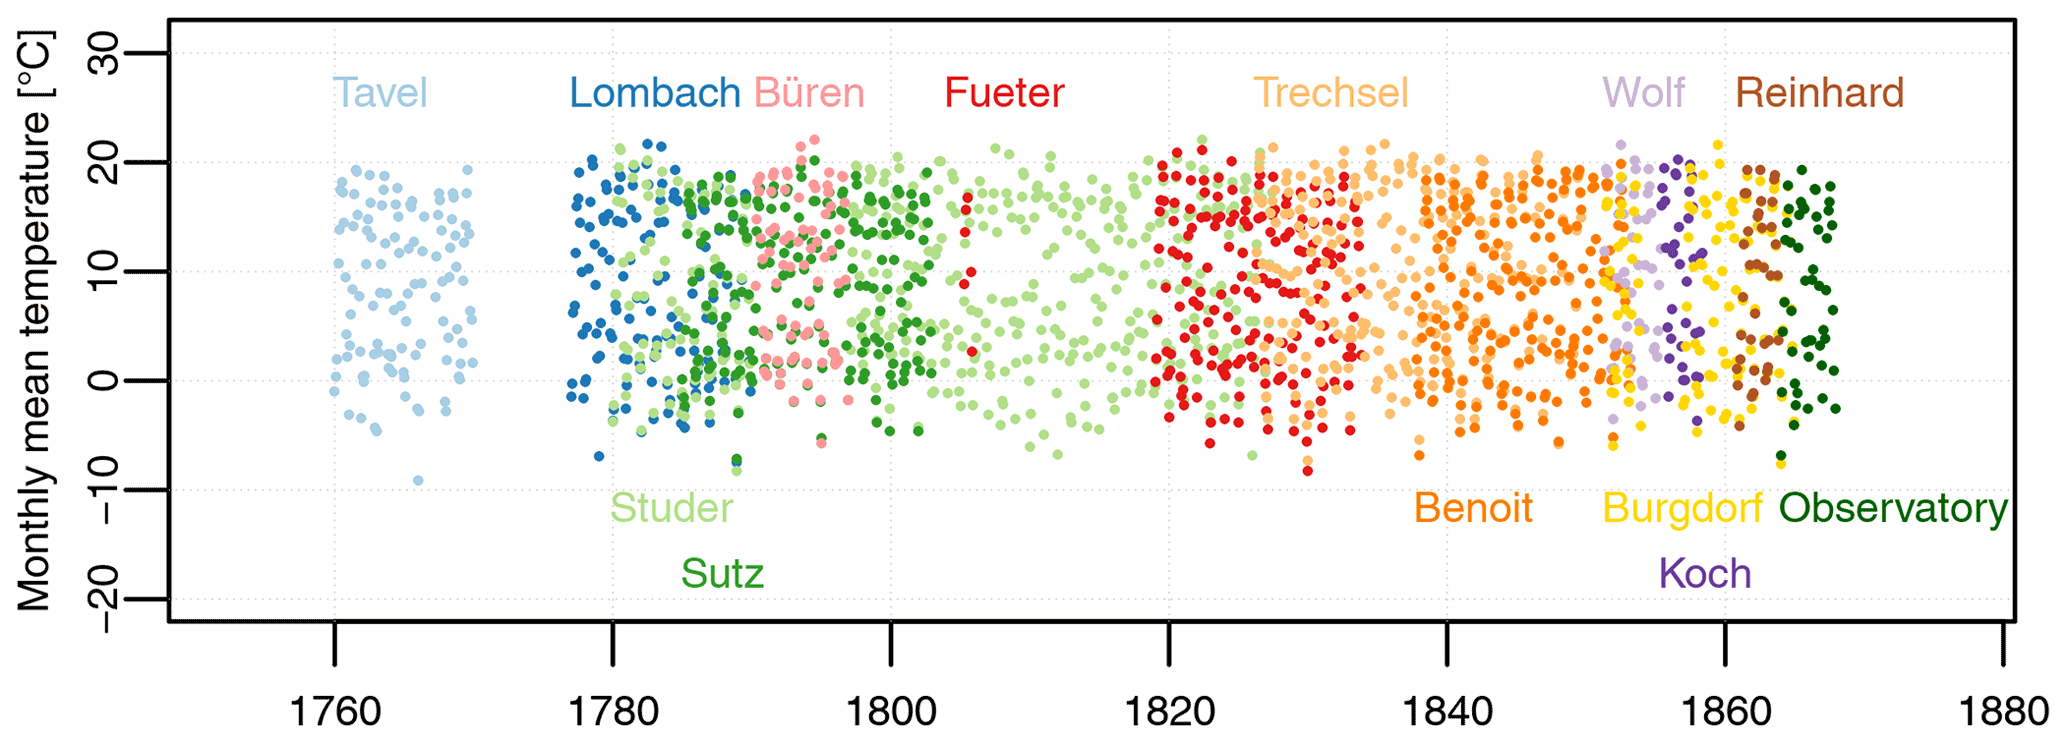
Figure 3Monthly means of the raw data used to build the Bern series with observers' names or locations.
2.1 Bern
To build the Bern series we used records that were digitized during the CHIMES project (Brugnara et al., 2020), with minor integrations from previously overlooked sources. The records are summarized in Table 1 and Fig. 2. In addition, Fig. 3 provides an overview of the time coverage of each record.
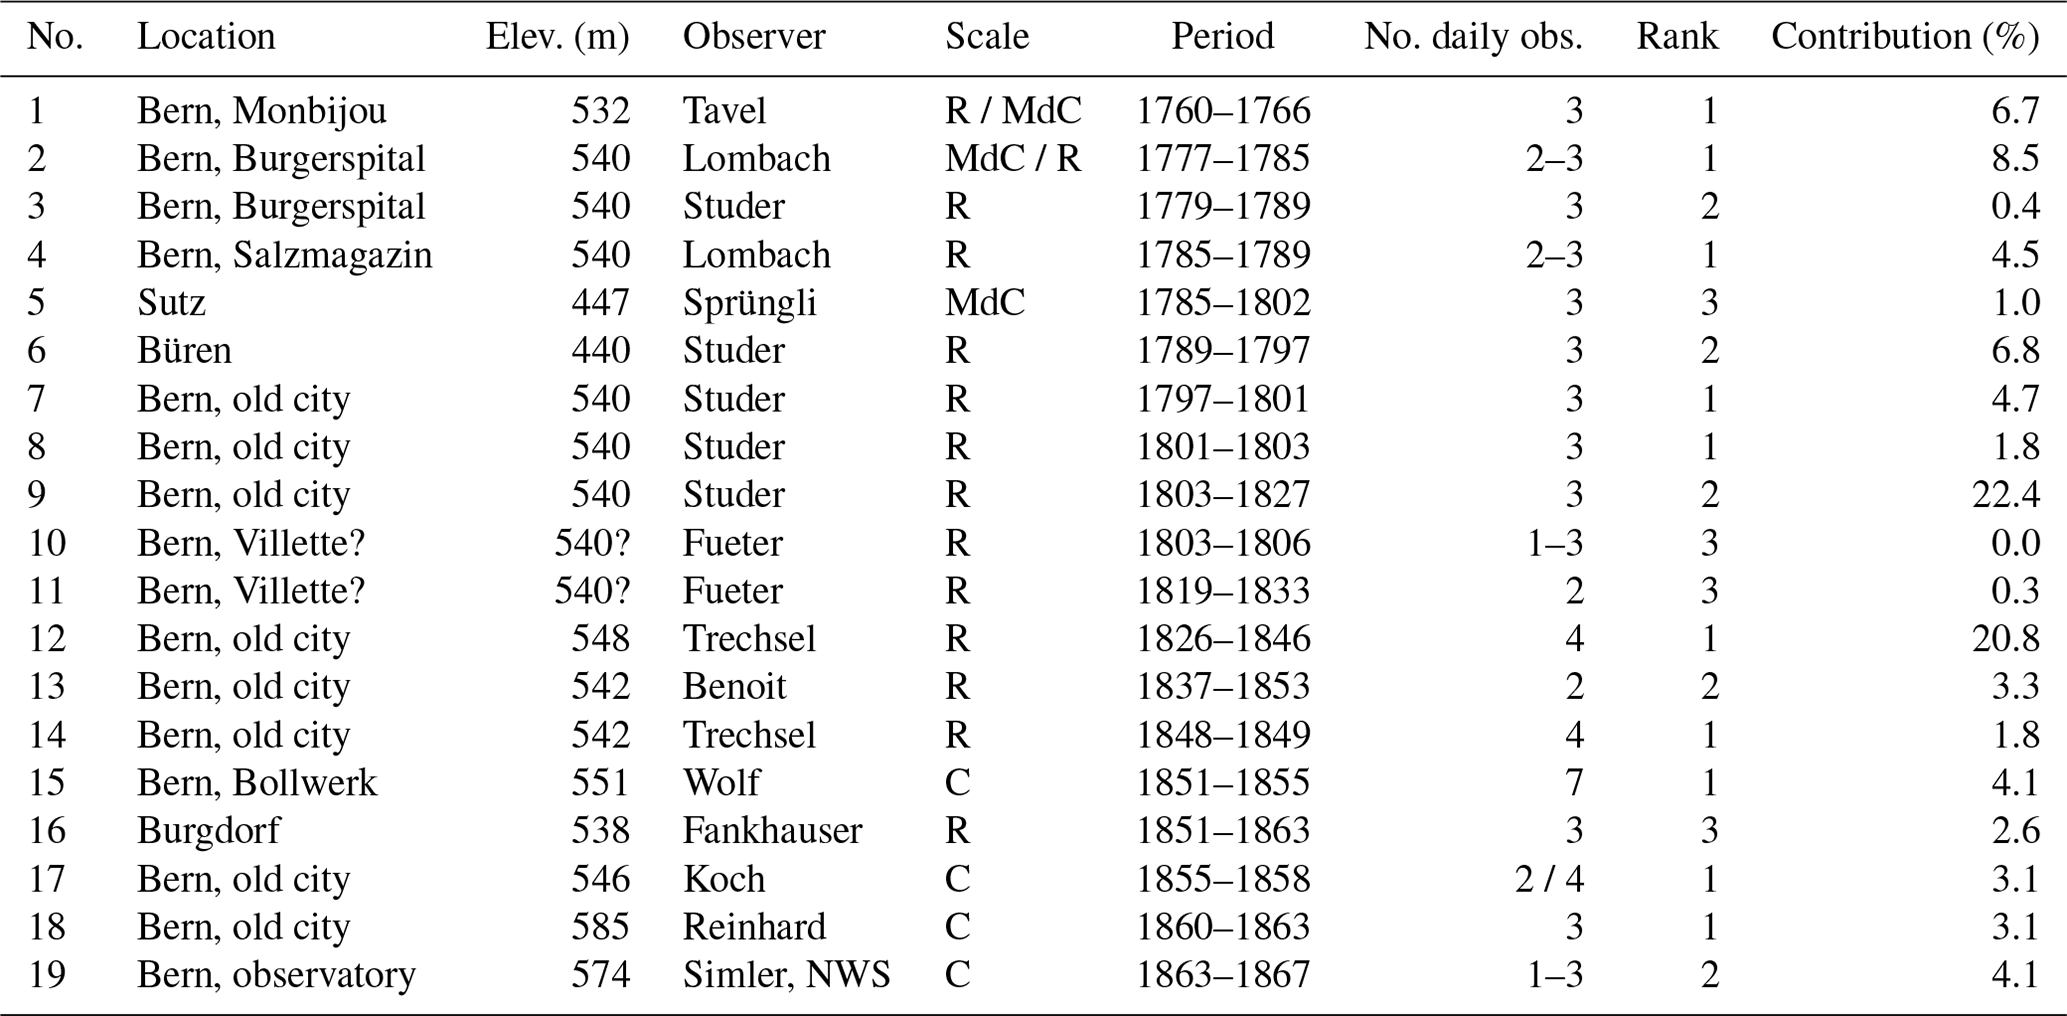
Table 1Records contributing to the daily temperature series of Bern (elevations are estimated). The employed temperature scales are Micheli du Crest (MdC), Réaumur (R), and Celsius (C)
2.1.1 Tavel, Lombach, and the Bern Economics Society (1760–1789)
The first meteorological station was established in 1760 by the Bern Economics Society (Ökonomische Gesellschaft Bern, hereafter ÖGB) as part of a network of stations in the region of Bern, one of the very first in history to use standardized instruments and measurement practices (Pfister, 1975). Franz Jakob “Monbijou” von Tavel (1729–1798) was the observer designated by the ÖGB for the station of Bern. Himself a prominent member of the ÖGB and of its meteorological commission, he started the observations in January 1760 in his estate, a few hundreds meters southwest of the city gate in what is today's Monbijoustrasse (at that time the area was not urbanized). More detailed information on this record can be found in Wyer et al. (2021).
The network of the ÖGB initially used mercury thermometers with the Réaumur scale. A comparison with other stations (Wyer et al., 2021) revealed that this was a so-called “false” Réaumur thermometer (see Camuffo, 2020), meaning that the scale was calibrated between the freezing and boiling point of water and can be transformed to Celsius through a constant factor. However, in March 1762 the instrument in Bern was replaced with a Micheli du Crest spirit thermometer, which requires more complex conversion formulas (see Brugnara et al., 2020).
The observation times recommended by the ÖGB were at sunrise and 15:00 (Pfister, 1975). We assumed that these were used by the station in Bern, although no explicit time is given in the data source. Tavel made an additional observation in the evening, which we assumed to be at 22:00 after a comparison with the modern diurnal cycle in Bern and with other stations. However, it is very likely that the observation times were not strictly followed, not least because of the low accuracy of clocks in the 18th century (see, e.g., Camuffo et al., 2021). Unfortunately, the measurements were interrupted between July 1766 and March 1767, and the data for the last three years (1767–1769) are only available as monthly means. The ÖGB eventually lost interest in the network, and in 1770 the observations were discontinued.
The ÖGB reactivated a meteorological station in the city a few years later in January 1777, when Karl Lombach (1740–1811) started his observations at the Burgerspital hospital (where he worked as a secretary – the building still exists today). Lombach initially used a Micheli du Crest thermometer but replaced it with a Deluc-type thermometer (equivalent to a false Réaumur) in January 1778. All observers who started measuring after him used this type of instrument.
The observation times were explicitly written down every day and varied depending on the season. Most of the time Lombach carried out two observations – one in the early morning and one in the afternoon – in line with the recommendations of the ÖGB. He added a third observation in the evening only in the case of unusual events, such as during extreme cold spells.
Observations temporarily stopped between March and June 1785 when the station was relocated to the salt depot, approximately corresponding to today's address of Bundesgasse 20, only 150 m to the southeast of the previous location. Observations in May and June 1787 are also missing. An analysis of Lombach's data is provided in Hari et al. (2022).
2.1.2 Studer (1779–1827)
Samuel Studer (1757–1834) was the priest of the Burgerspital and himself a member of the ÖGB as well as co-founder of the Swiss Natural Sciences Society (Schweizer Naturforschende Gesellschaft, hereafter SNG). In December 1779, on his own initiative, he started making regular temperature measurements at the same location as Lombach (but in a different apartment). He measured three times per day at variable times that he always wrote down.
In December 1789 Studer moved to Büren an der Aare, a small town located about 20 km north of Bern (and at 100 m lower elevation), where he was appointed pastor for the local parish. He continued his measurements there until January 1797, when he returned to Bern to take the position of professor of theology at the Hohe Schule (the predecessor of today's university). During this time, he measured in at least three different locations within the city. His meteorological measurements cover nearly half a century, until July 1827. An analysis of Studer's data is provided in Hari et al. (2022).
In at least two of Studer's apartments there was no suitable position with northern exposure for the thermometer. To make up for that, he installed two or sometimes three thermometers with different exposures, taking care to mark the observations that were affected by direct sunlight (we excluded those observations). We mostly used the measurements from his primary thermometer (i.e., the first value that he wrote down) except for the period after 1803, when we combined the afternoon and evening observations from the primary thermometer (eastern exposure) with the morning observations from the secondary thermometer (western exposure).
There is much uncertainty on where Studer lived and measured after 1803. On the one hand, he wrote that he lived “at the school”, which may be interpreted as the main building of the Hohe Schule on the southern side of the old city. On the other hand, he also mentioned being close to the botanical garden (Hari, 2021), which at that time was located north of the old city.
Studer was a dedicated naturalist and often traveled to the Alps. As a consequence, his meteorological observations have frequent short gaps, particularly in summer.
2.1.3 Fueter (1803–1806 and 1819–1833)
Samuel Emmanuel Fueter (1775–1851) was a tradesman dealing in colonial goods. He is remembered mainly for being the first importer of tea in Bern, while very little is known about his meteorological measurements. Most likely he measured at his family's estate just outside the city (the Villette, roughly corresponding to today's Kocher Park), not far from where Tavel used to measure. This is supported by the particularly low temperatures reported in the morning, suggesting a rural environment.
We recovered two segments of his temperature observations: (1) December 1803 to November 1806 and (2) January 1819 to November 1833. The first segment contains irregular observations, mostly once per day. In the second segment the observations are taken much more regularly – twice per day at sunrise and 14:00. An analysis of Fueter's data is provided in Hari et al. (2022).
Table 2Records contributing to the daily temperature series of Zurich (elevations are estimated).

2.1.4 Trechsel, Benoit, Wolf, Koch, Reinhard, and the Natural Sciences Society of Bern (1826–1863)
In April 1826 the Natural Sciences Society of Bern (Naturforschende Gesellschaft in Bern, hereafter NGB) established its own weather station in the city. The designated observer was the former president of the society, Friedrich Trechsel (1776–1849), who measured at his house in front of Bern's cathedral. The observation times were fixed at 09:00, 12:00, 15:00, and 22:00 (21:00 from February 1844 onward). In January 1848 Trechsel moved to a nearby house at the address Kramgasse 12, less than 100 m from the cathedral, where he continued the measurements until September 1849. Unfortunately, the data for the year 1847 could not be found. In addition, Trechsel was often away from Bern in late summer, with nobody taking over the measurements in his absence.
Daniel Gottlieb Benoit (1780–1853) was also a member and former president of the NGB but carried out his meteorological measurements as an independent amateur after leaving the NGB in 1832. He was a neighbor of Trechsel, living and measuring on the opposite side of the cathedral's square. Benoit measured twice a day at 06:00 and 14:00 between 1837 and 1853. More detailed information on Trechsel's and Benoit's records can be found in Flückiger et al. (2020).
Trechsel was followed by Johann Rudolf Wolf (1816–1893), an astronomer best known today for his work on sunspots. He was also a meteorologist and in 1863 became the first director of the Swiss NWS. Between 1851 and 1855, while director of the astronomical observatory in Bern, he measured temperature from his apartment at the foot of the hill where the observatory stood (the Grosse Schanze). Wolf measured seven times per day and was the first observer in Bern to use the Celsius scale.
When Wolf moved to Zurich in May 1855, his assistant Johann Rudolf Koch (1832–1891) took over both the job and the measurements. According to Gimmi et al. (2007), Koch measured in today's Amthausgasse in the old town. The thermometer hung about 10 m from the ground with northeast exposure. Koch measured every 4 h from 08:00 to 20:00. His observations were the first published by the NGB, although only weekly means were published for the first 6 months. Luckily, daily means based on the morning and evening observations were compiled by Wolf when he was director of the NWS and could therefore be recovered. Koch carried out temperature observations until May 1858; the publication of the other meteorological variables (pressure, precipitation, etc.), however, continued until June 1860, suggesting that they were made at a different location (perhaps the observatory).
The successor of Koch as director of the observatory was Heinrich von Wild (1833–1902), one of the most influential meteorologists of the late 19th century. In 1860 he hired the guardian of the cathedral's bell tower, Johann Reinhard, to continue the measurements on behalf of the NGB. The station was now part of a public network financed by the canton of Bern (Hupfer, 2017), similar in scope to the network created a century earlier by the ÖGB. In the meantime, the astronomical observatory was refitted to host self-registering instruments that would serve the upcoming NWS.
Reinhard measured from November 1860 until November 1863 at 07:00, 14:00, and 21:00. Wild reported that the thermometer needed a correction of −0.2 K (Wild, 1862), which we applied. The thermometer was housed inside an elaborated metallic radiation screen, which was a significant innovation for the time. Wild estimated that the use of the screen reduced the radiative bias to only 0.3 K on average when installed at least 3 m from the ground on a north-facing wall (Wild, 1860). This screen would become a standard in some parts of Europe during the following decades (e.g., K.K.-Central-Anstalt, 1893; Nordli et al., 1997). It eventually evolved into the so-called “Wild screen” (Auchmann and Brönnimann, 2012), a free-standing metallic radiation shield in use until the 1970s.
Reinhard's apartment was located inside the bell tower about 50 m above the ground. Any radiation bias was probably further reduced by the abundant ventilation at that height. On the other hand, we expect a smaller diurnal temperature range at such an exposed location, which is confirmed by a comparison with the other records.
It is not clear when systematic temperature measurements at the astronomical observatory on the Grosse Schanze began. According to Wild (1862), a self-registering thermograph was installed during the winter 1861–1862 at the latest and placed inside a wooden shelter on the northern corner of the observatory's terrace. However, we could only find tabulated data by Wild's assistant Rudolf Theodor Simler (1833–1873) starting from June 1863. The station was officially incorporated in the Swiss national network on 1 December 1863 and continued operating until 1898, when it was relocated outside the city. We used the data until December 1867 as a reference against which all other records are homogenized.

Figure 4Measurement locations drawn on a historical map of Zurich (Heinrich Keller, 1838). The numbers refer to Table 2, and the “M” indicates the position of the MeteoSwiss station of Zurich–Zeughaushof. Note that the position of the observatory (17) lies outside the map. Map source: Staatsarchiv des Kantons Zürich.
2.1.5 Other stations
Despite the many early instrumental records available for Bern, gaps remain that are not covered by any segment, mainly between 1770–1776 (1766–1776 at daily resolution), 1789–1796, and 1858–1860. In addition to the already mentioned Büren an der Aare (Sect. 2.1.2), we used data from Sutz (1785–1802) and Burgdorf (1851–1863) to fill some of these gaps.
Sutz lies 25 km northwest of Bern on the southern shore of Lake Biel at about 100 m lower elevation than Bern. The observer was Johann Jakob Sprüngli (1717–1803), a pastor. He observed three times a day – the exact times are not given but are probably rather consistent (Pfister, 1975) – using a Micheli du Crest thermometer.
Burgdorf is located less than 20 km to the northeast in a setting similar to that of Bern (hilly landscape at similar elevation). The observer in Burgdorf was Rudolf Ludwig Fankhauser (1796–1886), also a pastor. The style of his observations is very similar to that of Sprüngli: he also measured three times a day without specifying the exact time, except for the afternoon observation at 14:00.
For both stations we set the observation times to be at sunrise, 14:00, and 21:00, which are typical times for early instrumental observers. The uncertainty introduced by this assumption will be discussed in the Methods section.
We considered filling the gap between 1766 and 1776 with data from Neuchâtel and Gurzelen (Brugnara et al., 2020), both stations being relatively close to Bern, but we eventually decided not to do so. The record of Neuchâtel is problematic because of the frequent relocations and travels of the observer, while that of Gurzelen was measured indoors (Wyer et al., 2021). Moreover, the climate of these stations is slightly different from that of Bern, the former being more influenced by Lake Neuchâtel and the Jura mountains, the latter by the Alps.
2.2 Zurich
The records that we used to build the Zurich series are described in detail in Fritze et al. (2021) and Brugnara et al. (2021b) and are summarized in Table 2 and Fig. 4. In addition, Fig. 5 provides an overview of the time coverage of each record.
2.2.1 18th century: Ott, Meyer, Muralt, Hirzel, and the Physical Society
The earliest instrumental observations in Zurich date back to 1708 (Brugnara et al., 2021a). However, temperature measurements for the first half of the 18th century are either unusable or lost. The earliest record that we used is by Johann Jakob Ott (1715–1769), a correspondent of Micheli du Crest and Lambert, who measured several times per day at his estate north of the city (Rötel) from July 1756 until his death. Being head of the Meteorological Commission of the Physical Society of Zurich, he certainly had a strong influence on the three observers that started measuring in the city of Zurich shortly after him: Hans Conrad Meyer (1693–1766), Daniel von Muralt (1728–1793), and Hans Caspar Hirzel (1725–1803).
Meyer measured at the old hospital, of which he was the master, between 1759 and 1765. We could recover the original measurements in graphical form between June 1761 and December 1762, taken four times daily at fixed times. For the remaining years until 1764 we found daily means calculated by Wolf from the morning and evening observations.
Muralt was a merchant. He measured three times daily at his house in today's Bahnhofstrasse from 1760 until his death in 1793. We found the original measurements in graphical form for 1760–1769, 1781–1785, and 1787–1793. For the years 1770–1779 we could only find a transcription of the morning observations made between January and April. Exact times for afternoon and evening observations are not always given, but we assumed that they are kept constant at 13:00 and 21:00 throughout the record.
Hirzel was a prominent member of the Physical Society. We could find sporadic measurements from 1759 and more regular ones for 1761–1762, 1767–1786, and 1795–1802. Until 1786 he measured in today's Glockengasse, and later he moved to his wife's estate outside the city (the exact location is not known). We are not certain whether the later years are really from Hirzel, as the data structure and the handwriting differ from earlier data.
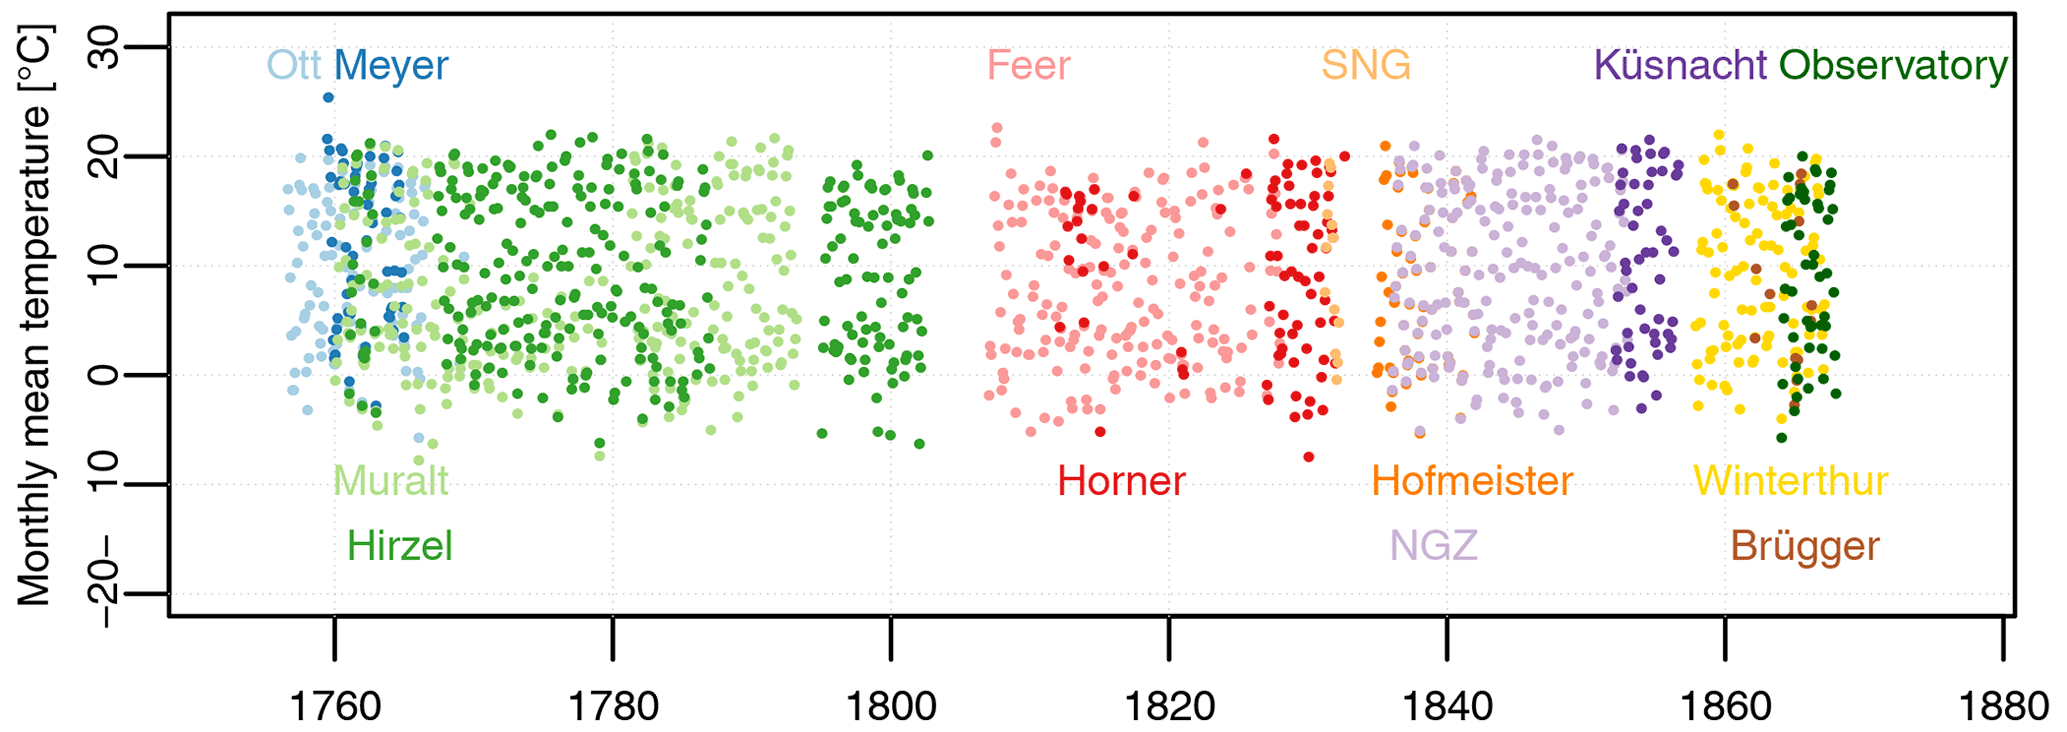
Figure 5Monthly means of the raw data used to build the Zurich series with observers' names or locations.
2.2.2 Early 19th century: Feer, Horner, Escher, and the Swiss Natural Sciences Society
The record by Johannes Feer (1763–1823), an engineer, is one of the longest available for Zurich, covering the period 1807–1827. Feer probably lived at the Hirschengraben in the eastern part of the city and measured usually three times per day at variable times. There are many short interruptions in the record, hinting at frequent traveling. Moreover, the year 1826 is entirely missing. Feer cannot actually have been the observer during the last few years, as he died in 1823.
Johann Kaspar Horner (1774–1834), a professor of mathematics, started his measurements in 1812 in today's Florhofgasse. In 1823 he moved to today's Bahnhofstrasse, where he continued measuring until his death. Therefore, his record covers an even longer period than Feer's. However, the measurements are very discontinuous before 1823, so only a handful of monthly means can be calculated in that period. Horner was probably particularly interested in studying the diurnal cycle of temperature, as he sometimes performed up to 16 measurements in a day. On average he took four observations per day at variable times.
Between 1826 and 1830 Horner sent his data to the SNG, which was trying to set up a national network of meteorological observatories. Starting from 1830 the SNG began to hire young students as temporary observers for Zurich, each measuring for only a few months at a new location. We only used the longest of these segments (February 1831–March 1832), which covers part of a 6-month gap in Horner's series. The observation times required by the SNG were 09:00, 12:00, and 15:00.
We used an additional short record in this period by Johann Kaspar Escher (1744–1829), covering 1816–1820. However, we could only find the monthly means published in Escher (1822), with the exception of the last 7 months of 1816, for which daily observations at 12:00 were published.
2.2.3 Hofmeister, Ulrich, and the Zurich Natural Sciences Society (1834–1852)
The Zurich Natural Sciences Society (Naturforschende Gesellschaft in Zürich, hereafter NGZ), successor of the Physical Society, published regular meteorological observations starting in 1836. The observer until 1842 was officially Melchior Ulrich (1802–1893), a professor of theology at the university. However, the instruments were spread over multiple locations and Ulrich was certainly not the only observer. We found handwritten data attributed to Rudolf Heinrich Hofmeister (1814–1887) that are mostly identical to those published by the NGZ but contain more frequent measurements. Hofmeister's journal goes back to September 1834 and mentions a relocation to Ulrich's house (Hirschengraben) in August 1835.
In November 1842 the station was moved to the newly built cantonal school (Kantonsschule) on the eastern outskirts of the city, where it continued operating until 1852. The publication of the data, however, stopped in 1848, and for 1849–1851 we could only find daily means (based on the morning and evening observations) published by the NWS (MCSNG, 1867).
2.2.4 The 1860s: Brügger and the Astronomical Observatory
After a 7-year gap, the next record that we could recover is by Christian Gregor Brügger (1833–1899), a natural scientist known in meteorology for organizing a large network of weather observers in the canton of Grisons during the 1850s. After moving to Zurich in 1859, he started to measure at the old botanical garden, where he was the curator of the botanical collection of the polytechnic (today's Swiss Federal Institute of Technology or ETH). His measurements, however, are of rather poor quality (see Brugnara et al., 2021b) and very discontinuous.
With the creation of an NWS at the end of 1863, Zurich got its first official station at the NWS headquarters in the newly built astronomical observatory on the hill northeast of the old city. We included the first 4 years of the observatory's record (1864–1867) in our early instrumental series in order to use it as the reference against which all previous records are homogenized.
2.2.5 Other stations
To fill the long gap between 1853 and 1863 we used data from Küsnacht (1852–1856) and Winterthur (1857–1867). Küsnacht lies on the eastern shore of Lake Zurich; Winterthur is located about 20 km northeast of Zurich at similar elevation. We did not include the station of Uetliberg (a hill west of Zurich) because of the large difference in elevation (over 400 m) and because of strong radiative biases affecting that record. Several gaps in the series of Zurich remain, in particular between 1793–1794, 1802–1806, 1832–1834, and 1856–1857 (Fig. 5). Records that would cover at least the most recent gaps probably exist but have yet to be found (see Pfister et al., 2019).
The record of Küsnacht was initiated by Heinrich Zollinger (1818–1859), a botanist known for being the first European to climb Mount Tambora after the 1815 eruption. In 1848 he took the position of director at the seminary of Küsnacht after spending 6 years on the island of Java, where he would return in 1855. His measurements at the seminary were carried on by several individuals, most likely teachers or students. The measurements were taken every 4 h between 06:00 and 22:00.
We could not find any information about the observer of Winterthur, except that the family name was probably “Furrer”. The observation times were fixed at 09:00, 12:00, and 16:00.
3.1 Daily means
Daily means should ideally be calculated from continuous (e.g., hourly) measurements. It is common practice, however, to calculate them as the arithmetic average of the daily maximum and minimum temperature. Neither approach is possible for early instrumental observations because self-registering instruments and max–min thermometers were not common until the mid-19th century. On the other hand, a simple arithmetic average of the available observations would lead to obvious inhomogeneities and would not always be representative of the true daily mean.
A common approach is to apply a correction to the arithmetic average derived from a modern mean climatological diurnal cycle of temperature (e.g., Moberg et al., 2002). The correction is different for each day because it depends on the observation times and the season. This approach works sufficiently well if the goal is to obtain homogeneous monthly means, but it will likely produce an inaccurate statistical distribution of the daily means by overestimating day-to-day variability (Brandsma and Können, 2006). To mitigate this problem, we instead used a least-squares multiple linear regression (MLR) model defined as
where the predictors xi are the elements of the vector
Tm is the mean daily temperature (i.e., the predictand), j is the Julian day, n is the number of measurements (up to six; additional measurements are excluded), Ti the observed temperature values on the analyzed day, ai the regression parameters, and ϵ the residual error. The first two elements of x are added to capture the seasonal variability of the diurnal cycle. Both Tm and Ti are expressed in terms of anomalies with respect to a daily climatology calculated by fitting to the daily means the first two harmonics of a Fourier series:
The model was trained on sub-hourly data (10 min resolution) from the MeteoSwiss urban stations of Bern–Bollwerk (located on a roof at almost the same location where Wolf's apartment stood in the 1850s) and Zurich–Zeughaushof (located in a courtyard close to the main train station), both covering the period 1991–2020. The modern-day urban heat island certainly has an effect on the diurnal cycle at these stations (e.g., Gubler et al., 2021). Nevertheless, they provide the best available estimate of the climatological diurnal cycle in the early instrumental period.
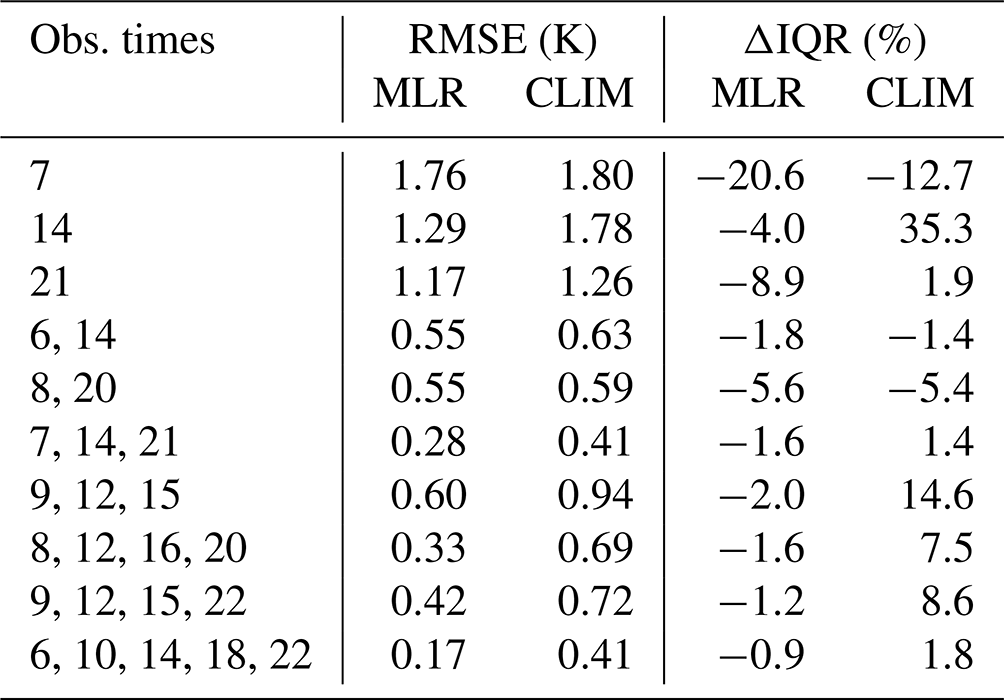
In Table 3 we show the results of a validation of our MLR approach based on the data from Bern–Bollwerk, of which we used the first 6 years (1991–1996) for validation and the rest for training the model. Our validation metrics are the root mean squared error (RMSE) and the relative bias of the interquartile range (ΔIQR) in percent, defined as
For comparison we also show the performance of the standard approach based on the climatological diurnal cycle, calculated from 31 d windows centered on each calendar day.
The MLR clearly outperforms the standard approach with respect to the RMSE, particularly when three or more measurements are taken. It tends to slightly underestimate the IQR but is more consistently close to the true value for different combinations of observation times, whereas the standard approach can lead to a large overestimation, particularly when there are measurements in the afternoon.
Table 3Performance of the MLR model compared to a correction based on the climatological diurnal cycle (CLIM) for common combinations of observation times (expressed in mean solar local time and 24 h notation).
However, we still used the mean climatological adjustments instead of the MLR for data that are only available as daily means. This is the case for 6 months in the Bern series (Koch) and 7 years in the Zurich series (Meyer and NGZ).
We set the start of each day at midnight Greenwich Meridian Time (GMT), consistent with the modern-day convention followed by MeteoSwiss. Original times were converted to GMT using mean solar local time (GMT +00:30 for Bern, GMT +00:35 for Zurich) until 1847 and Bern time (GMT +00:30) afterwards. Monthly means were calculated from daily means following the guidelines of the World Meteorological Organization (WMO, 2018).
3.2 Error estimation
Given the large heterogeneity affecting early instrumental records, an objective estimation of the error is critical for the data user. However, given the lack of metadata, it is not possible to quantify each source of error affecting the measurements in detail. Some error estimates are necessarily approximative and/or based on educated guesses.
We considered five types of error related to (1) reporting resolution (e1), (2) number of measurements in a day (e2), (3) time uncertainty (e3), (4) exposure (e4), and (5) climate (e5). The total standard error for daily means is then given by
The standard error for monthly means is
where N is the number of non-missing daily means in the month.
3.2.1 Reporting resolution
While modern thermometers employed in meteorology have a resolution of at least 0.1 K, the scales of early liquid-in-glass thermometers rarely had a resolution higher than 0.5∘. Initially only spirit thermometers could attain a finer resolution, thanks to the high thermal expansion of alcohol. Nevertheless, observers frequently reported with a resolution of 0.1∘ by extrapolating the scale visually.
We estimated the actual instrumental resolution δ from the frequency of fractional digits reported by the observer. To obtain the resolution error in the daily mean we then scaled with the number of measurements n on a certain day:
3.2.2 Number of measurements
In general, the more measurements are carried out in a day, the smaller the error of the daily mean will be. However, since the measurements are made at different times by each observer, the number of measurements alone is not sufficient to estimate the error. In addition, the number of measurements and the observation times can change from one day to another. Therefore, each day can have a different error (see Table 3). As a measure of this error we simply took the standard deviation of the residuals ϵ of the MLR model (Eq. 1), aggregated by month.
Where the MLR could not be applied, we estimated the error from the differences between the true daily means in the modern data and the means that would result from the measurement times at hand in the target day (corrected using the climatological diurnal cycle).

Figure 6Results of the comparison described in Wild (1860). The boxes give the temperature range measured by up to seven thermometers in different positions every 2 h between 08:00 and 22:00. The symbols indicate weather conditions observed by Wild (asterisk: sunshine, triangle: rain, cross: windy).
3.2.3 Time
Before the development of railways in the mid-19th century there was little need for a common time within a country. Each town had its own time, which roughly followed solar time (as measured by a sun-clock). Mechanical clocks were not yet very accurate, and long cloudy periods (particularly common on the Swiss Plateau) made sun-clocks useless.
Taking meteorological observations at fixed times was thus far from trivial, and this is probably one of the reasons why some observers did not report exact observation times. We can assume that observers relied on their daily routine, measuring at the times that were the most practical (e.g., shortly after waking up or before going to bed). However, they certainly also wanted their measurements to be as meaningful as possible. The best way to achieve that was to measure close to the coldest and warmest hours of the day, i.e., at sunrise and in the afternoon.
Our error estimation related to the precision of observation times is based on historical information and on the data themselves. We started from the assumption that the local time read by the observer had a standard error of 30 min, as a combination of unreliable clocks and the varying difference between apparent solar time and GMT +00:30, which ranges between 0 and 16 min (Camuffo et al., 2021). We then looked at the variability of observation times for observers who always noted them down. For instance, Studer's observation times had a standard deviation of about 30 min for morning and evening observations and of about 15 min in the afternoon. Feer, on the other hand, had larger standard deviations in the morning and afternoon (nearly 1 h) but much smaller in the evening (ca. 10 min). From these and other data we estimated a total standard error of 45 min for observers who noted the time once per month at most (e.g., Benoit), which we doubled to 90 min for the cases in which times are inferred (e.g., Sutz). After 1848, the year of the introduction of Bern time (GMT +00:30) in Switzerland, we reduced all time errors to 15 min. For inferred times, however, we kept the error at 90 min throughout.
The time error was empirically transformed into a daily mean temperature error from the mean diurnal cycle at Bern–Bollwerk and Zurich–Zeughaushof. For example, the error for the record of Tavel (inferred times) ranges between 0.1 K in December and 0.6 K in July.
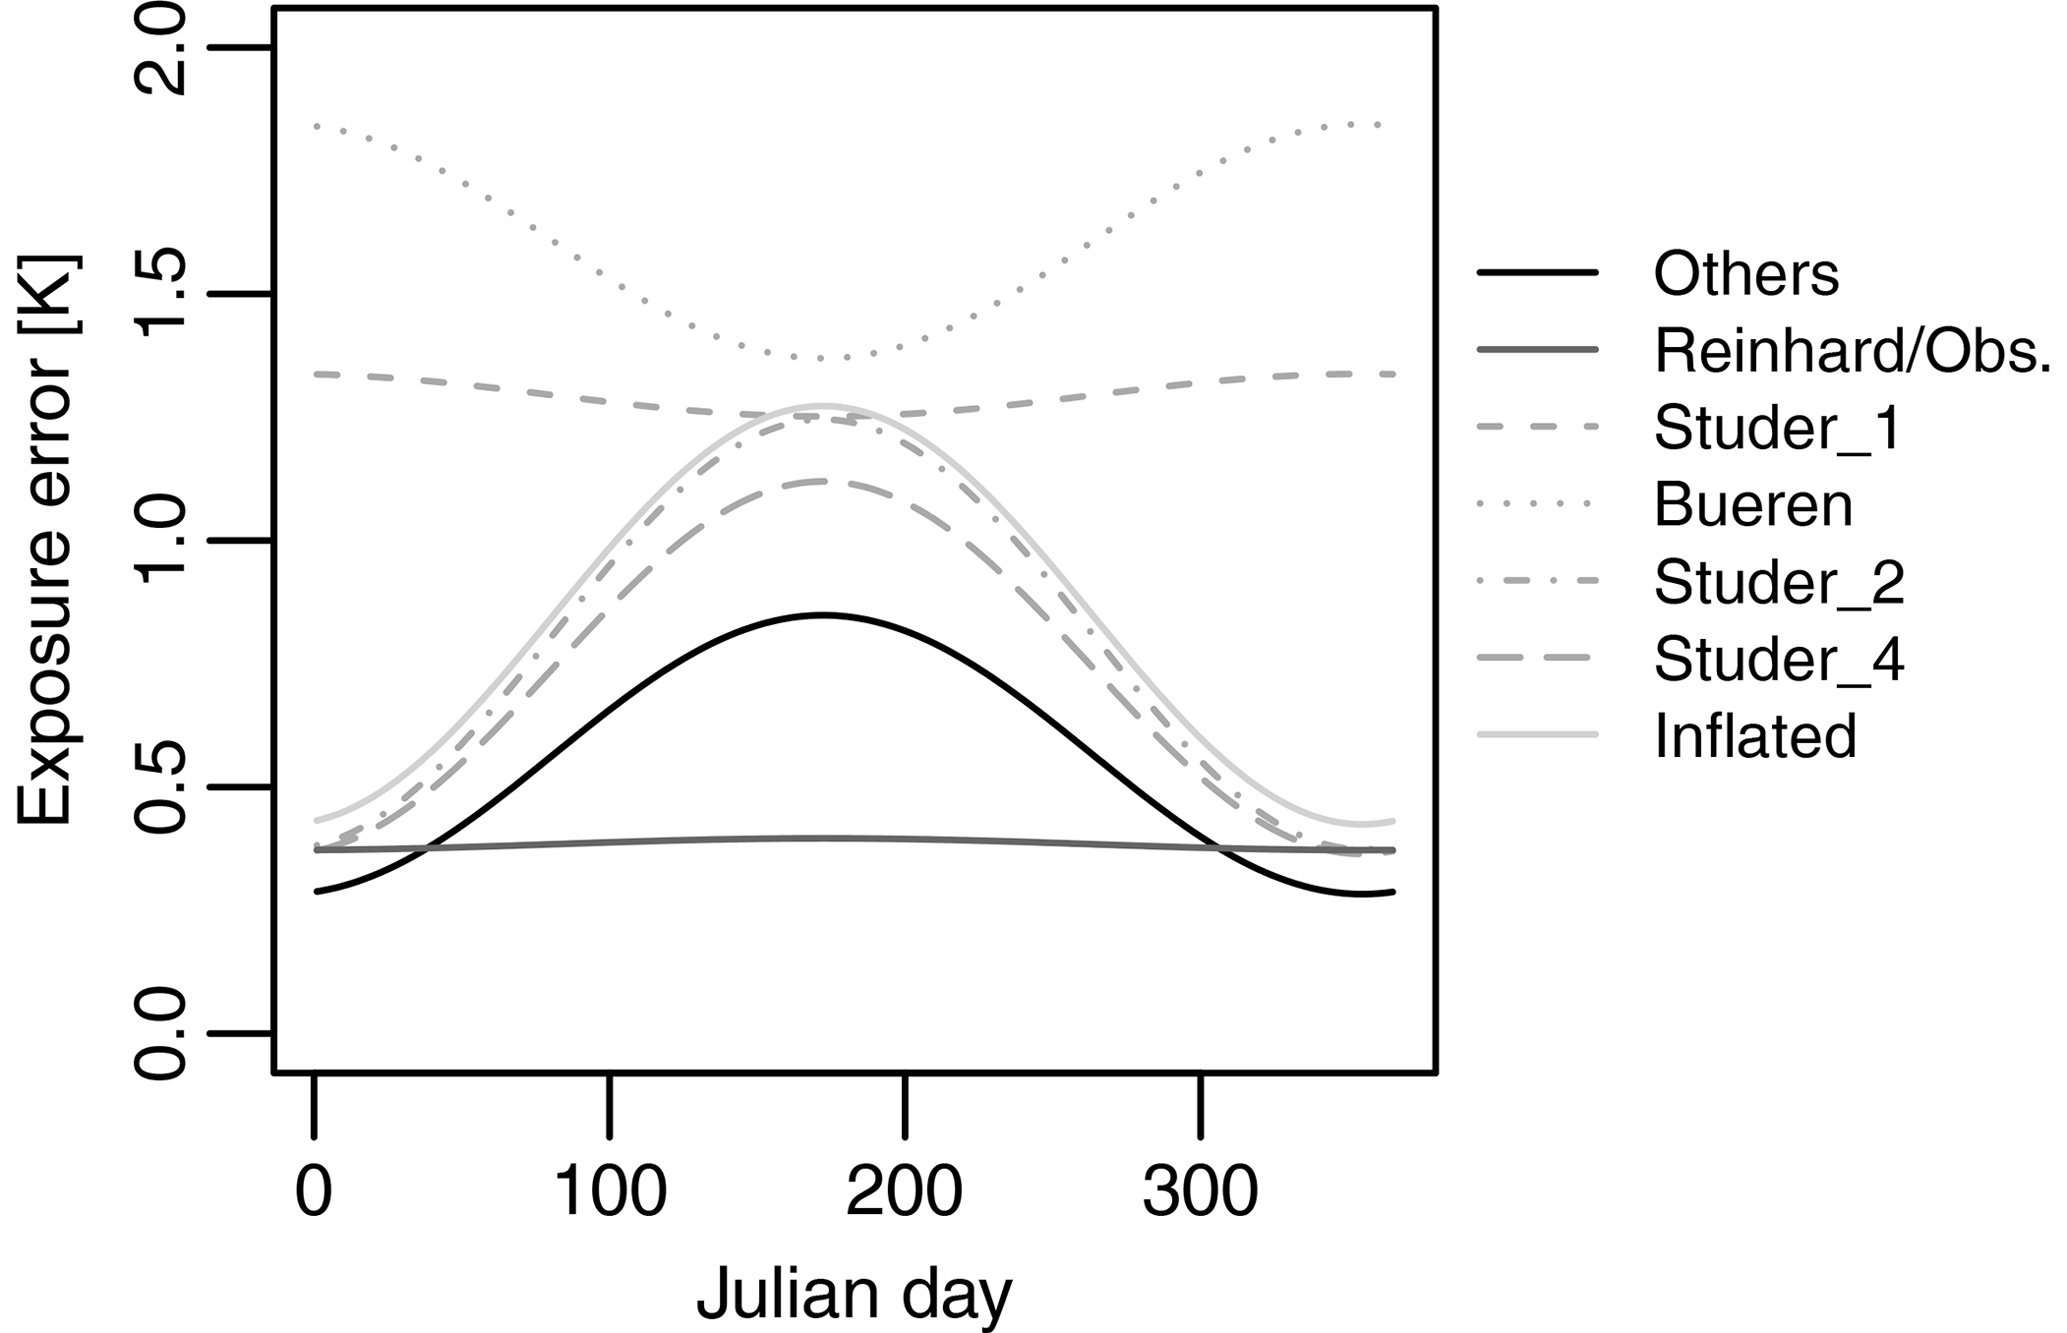
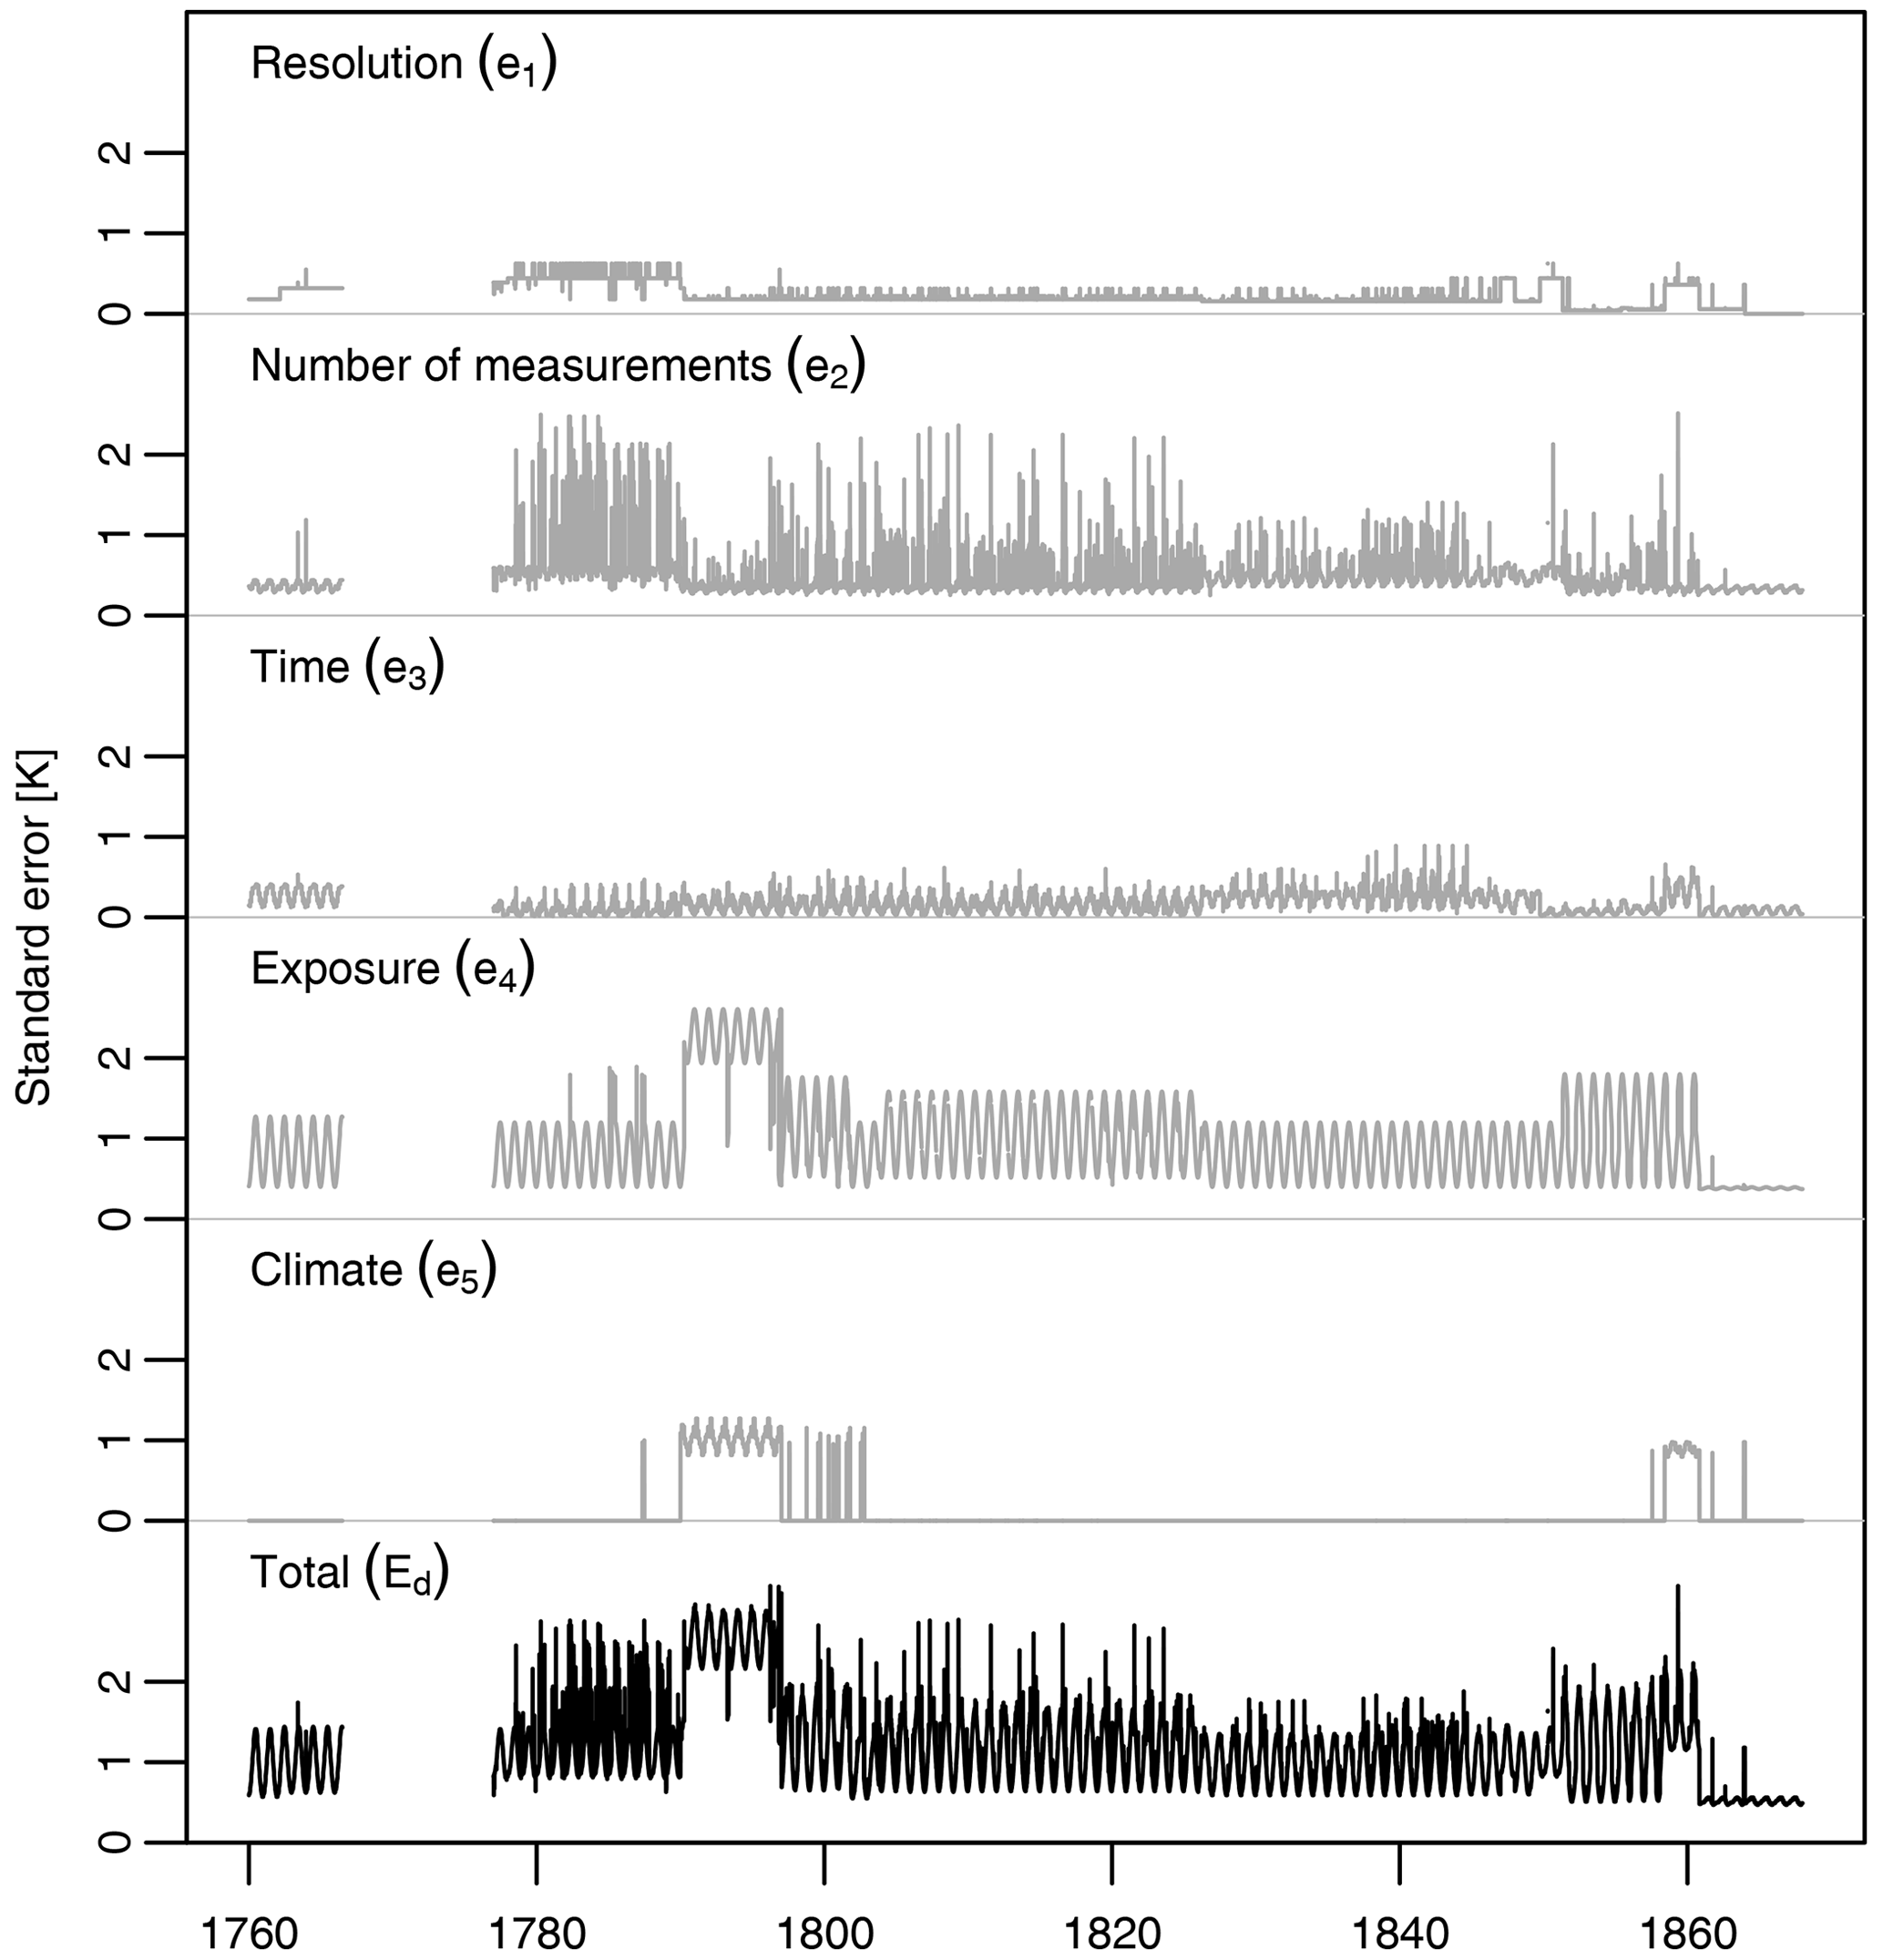
Figure 8Time evolution of the daily standard error and its components for the merged Bern series.
3.2.4 Exposure
Unscreened thermometers are very sensitive to radiation, and their exposure is thus fundamental for the reliability of the measurements. Guidelines on how to set up a thermometer already existed in the early instrumental era but were not very detailed. Some general rules (e.g., northern exposure), however, remained fairly consistent over the period covered by our data (e.g., Carrard, 1763; Wild, 1860).
An unshielded thermometer hung on a north-faced wall is subjected to radiative biases from direct and indirect radiation that result in a temperature overestimation when compared to a modern weather station, particularly in the early morning and late afternoon (Böhm et al., 2010). This bias strongly depends on the exact orientation of the building, the surrounding environment, and the season.
Several factors, however, can interfere with these expectations: for example, missing shadows from roofs or trees can lead to a stronger radiative bias in winter or early spring. In addition, not all observers had a north-facing window available (e.g., Studer), making biases more unpredictable. In some cases a wrong estimation of the observation time could result in an apparent radiative bias.
Unlike other systematic errors in the data, radiative biases are difficult to correct at daily resolution because they strongly depend on weather conditions. While the mean radiative bias can be dealt with by homogenization, the exposure error takes into account mainly the variations related to the weather.
We can rely on some literature based on data from the Alpine region to obtain a plausible estimation of the error. Wild (1860) tried to estimate the uncertainty related to the position of the thermometer to make the case for the benefits of his radiation screen. He did so by hanging seven thermometers in slightly different positions and on different materials on the northwestern and northern walls of the astronomical observatory in Bern, as well as by reading them every 2 h between 08:00 and 22:00. Even though he carried out the comparison only for 4 d (between 14 and 17 September 1859 – on the first day he read only four thermometers), his results are still interesting.
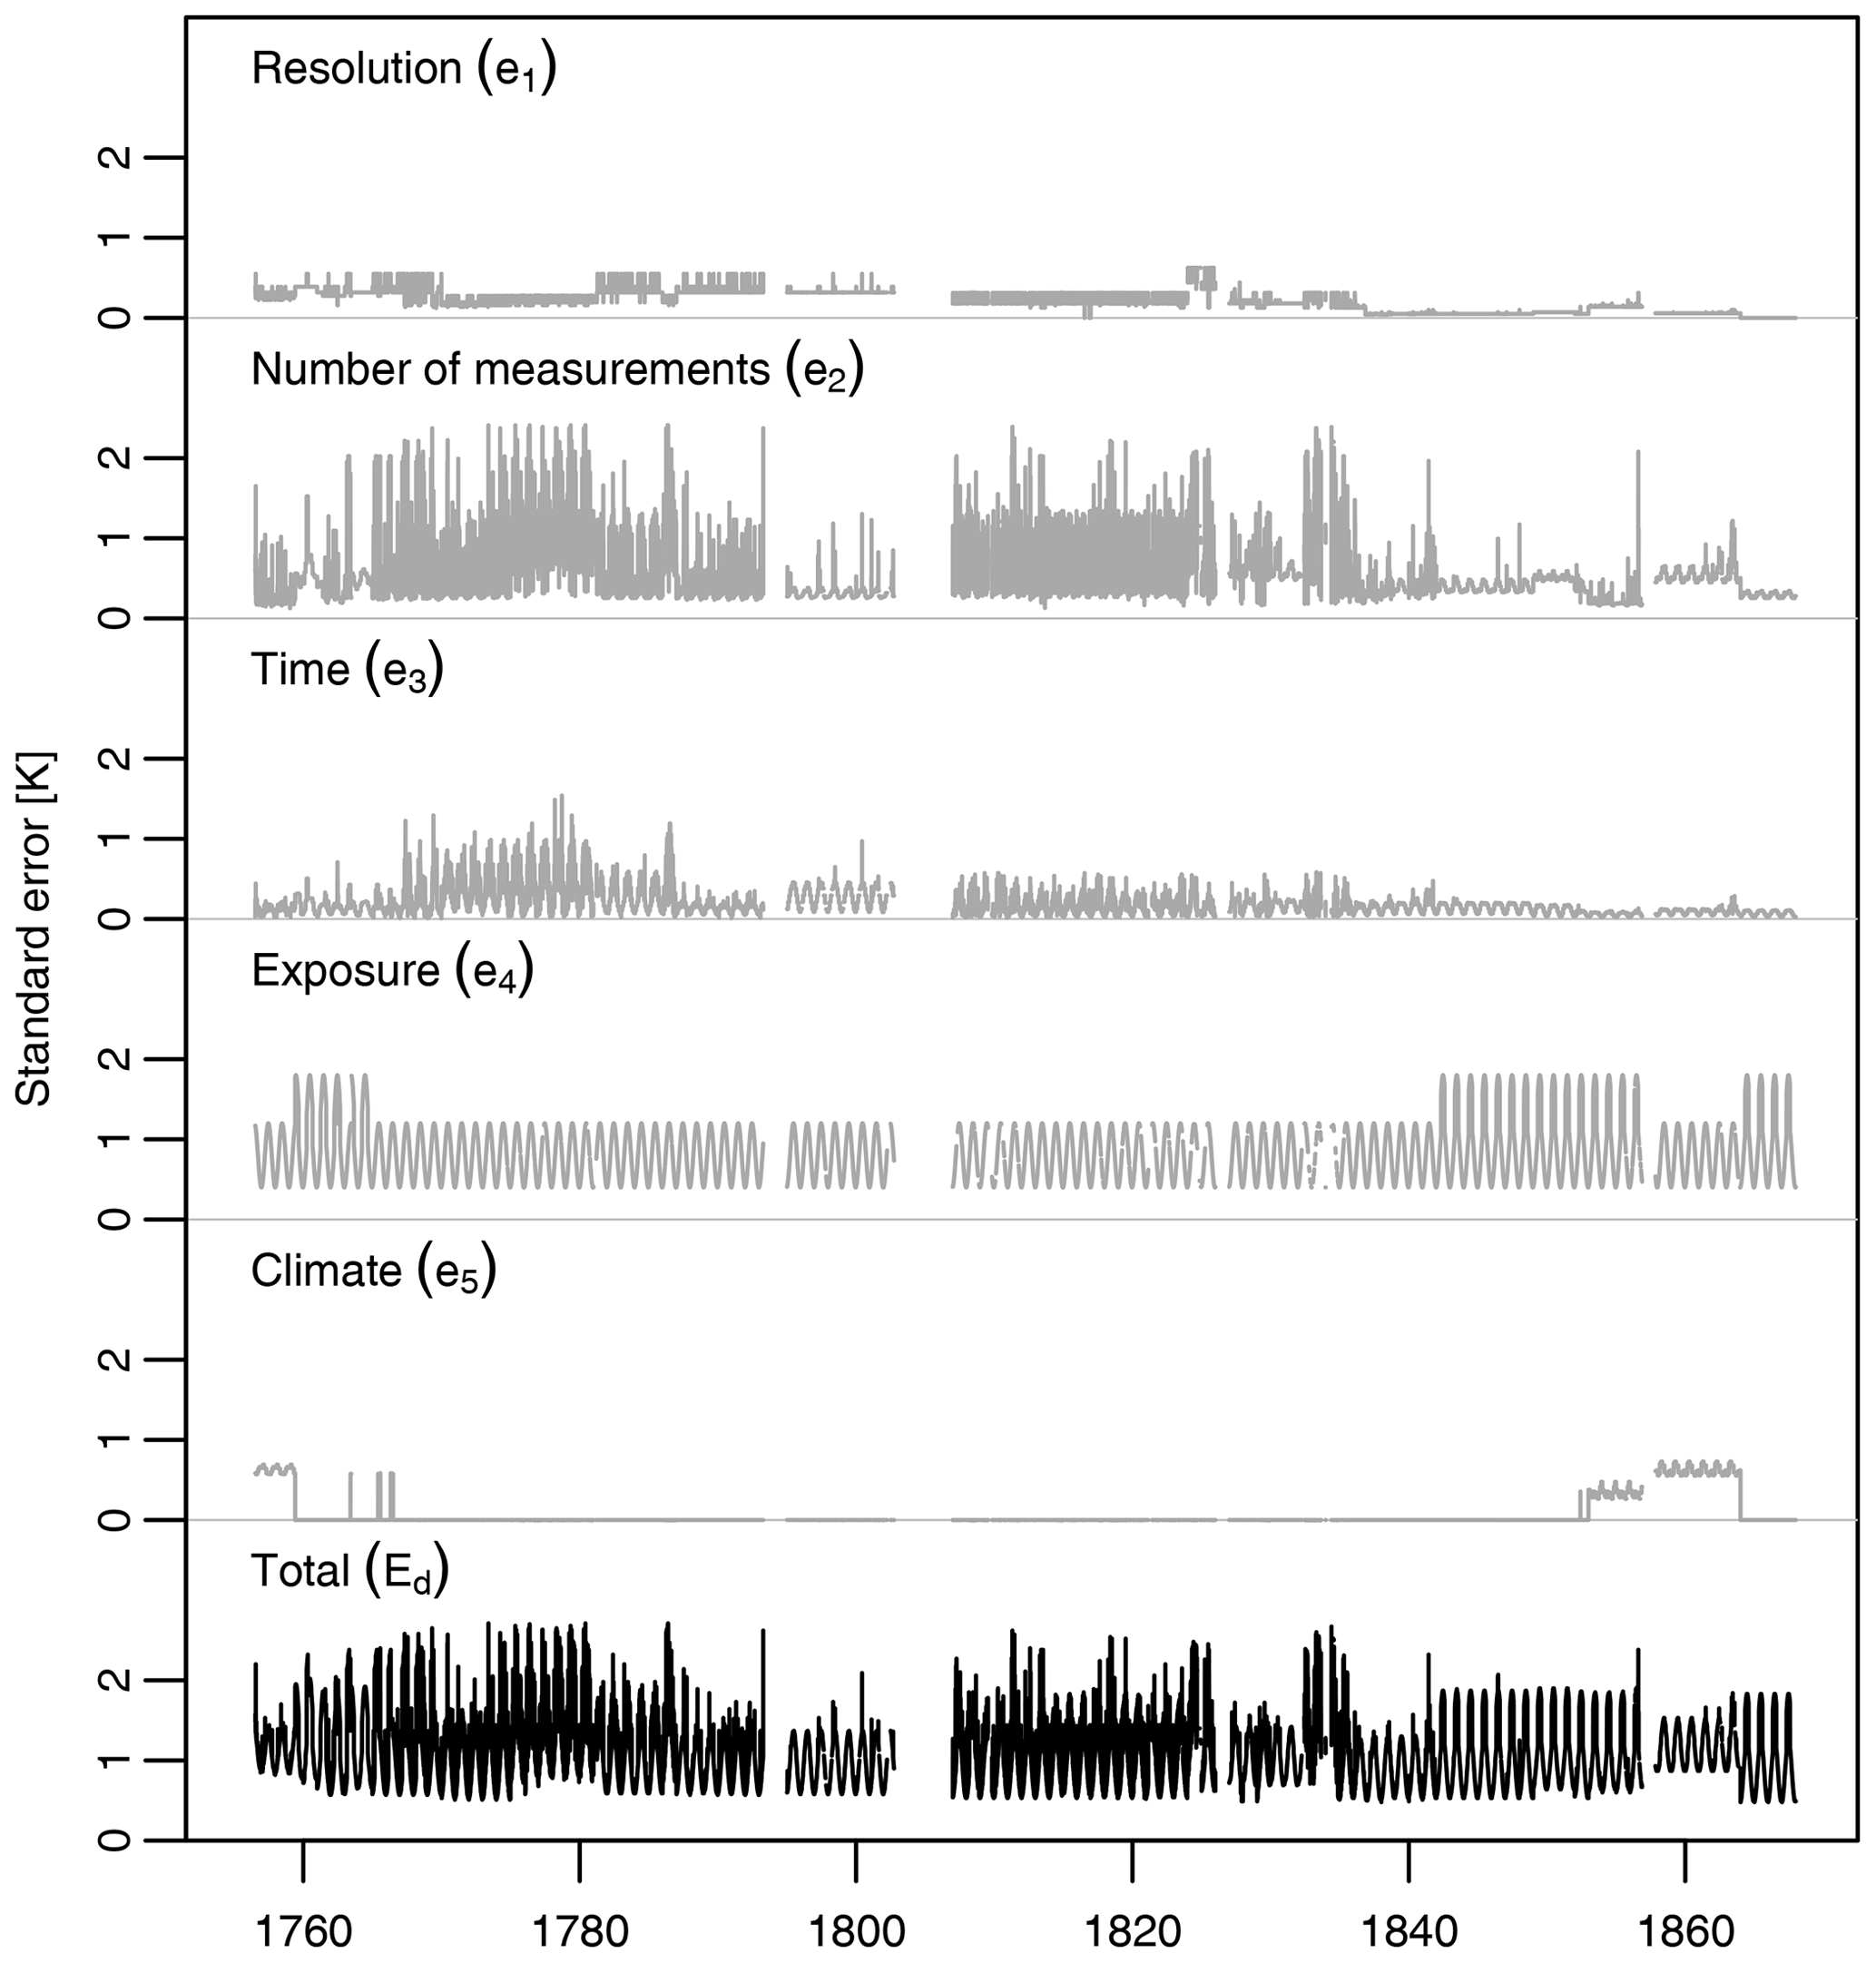
Figure 9Time evolution of the daily standard error and its components for the merged Zurich series.
As shown in Fig. 6, Wild measured differences that were usually smaller than 1 K. The largest ones were at noon, when the mean standard deviation of the measurements is 0.5 K; the smallest were at 18:00 and 20:00, with 0.2 K (note that sunset was shortly after 18:00). Certainly these differences would have been larger in early summer and with more stable weather. However, the temperature range reached 1 K even on 16 September, a rainy day with overcast sky.
One of Wild's thermometers, the one hung directly on the north-facing wall at 5 m height, illustrates the uncertainty of unscreened temperature measurements related to weather conditions particularly well. On the first day, a sunny day with little wind, it was the warmest thermometer at noon with 0.6 K above the average of all thermometers. On the second day, again sunny but windy, the same thermometer was the coldest, measuring 0.5 K below the average at noon. On the third day, rainy and calm, it was still 0.3 K below the average. Finally, on the fourth day, overcast and windy, it stood at 1.1 K below the average. Therefore, an exposure compatible with early instrumental guidelines can lead to a standard error at noon of the order of 1 K, at least in summer.
In the modern literature, Böhm et al. (2010) analyzed a parallel record at Kremsmünster, Austria, finding that exposure is more relevant between May and August and can cause temperature biases from −2 to +5 K. Given the north-northeast exposure, the most affected time at that station is the early morning, when biases cover a range of about 4.5 K in July (1st–99th percentiles). In winter, biases range ±1 K, with no preferred time. Assuming normally distributed biases, this corresponds to a standard error for sub-daily observations of about 0.4 K.
We could take advantage of several parallel records in our data to estimate the impact of different exposures. For example, the standard deviation of daily mean differences between the cathedral's tower and the astronomical observatory in Bern (both located in an elevated position and at similar elevation) was 1.1 K during November 1863 – the only month with comparable observation times. For 14:00 observations we found the largest standard deviation in July 1863 with 1.0 K, compatible with a standard error of 0.7 K at both stations. For comparison, the standard error for a modern (non-urban) station is of the order of 0.1 K (Brandsma and Van der Meulen, 2008).
Based on these considerations, we defined a rather simple but plausible error function for a northern exposure that depends on the Julian day (j) and the number of measurements per day (n), but not explicitly on the observation times:
where a=0.8 K (average error), b=0.4 K (amplitude), and N is the number of days in the year. The error has a minimum at the winter solstice and a maximum at the summer solstice. For n=3, it ranges between 0.23 and 0.69 K. When n>3, we used the same error obtained for n=3 in order to avoid errors that are too small when n is large.
We used different values of the parameters in Eq. (8) for the following records.
-
Studer (incl. Büren): we estimated a and b from the available parallel measurements (given that the error function does not depend on the observation time, we assumed that both of Studer's thermometers have the same exposure error), with the exception of 1801–1803, when the primary thermometer had a northern exposure.
-
Reinhard, Bern Observatory: we estimated a and b from the available parallel measurements at 14:00 between the two records (June to November 1863), assuming that they have identical errors.
-
Tavel, Wolf, Koch, Burgdorf, Meyer, NGZ, Küsnacht, Zurich Observatory: we inflated the error by 50 % (a=1.2 K, b=0.6 K) in months for which we found evidence of a strong radiative bias.
To identify strong radiative biases we analyzed the mean deviation of the sub-daily temperature measurements from the expected diurnal cycle of the respective months (see, e.g., Brugnara et al., 2021b). The diurnal cycle was calculated from the modern data for Bern–Bollwerk and Zurich–Zeughaushof, from which 2 K was subtracted to account for climate change. In addition, we took into account information from metadata. In fact, it was not uncommon for the observer to write about expected radiative biases in the measurements, although Wild was the only one to provide a quantitative estimation.
All different versions of the exposure error for Bern are summarized in Fig. 7. As expected, exposure errors in Studer's measurements are generally larger, while they are smaller and less season-dependent at the stations that used radiation screens (Reinhard and the observatory). The maximum error is not always in summer, which is compatible with eastern or western exposure.
3.2.5 Climate
For the records measured far from the city center of Bern (Büren, Sutz, and Burgdorf) and Zurich (Rötel, Küsnacht, and Winterthur) we need an additional error that takes into account possible climatological differences (e.g., more or less frequent fog). To do that we compared the modern daily series from the city center with data from other MeteoSwiss stations that are representative of the climate of these “outsiders”. The error is given by the root mean square deviation calculated from daily mean anomalies, aggregated by month. For Küsnacht we only took half of the resulting error because the closest representative MeteoSwiss station (Stäfa) is much further away from Zurich than Küsnacht is.
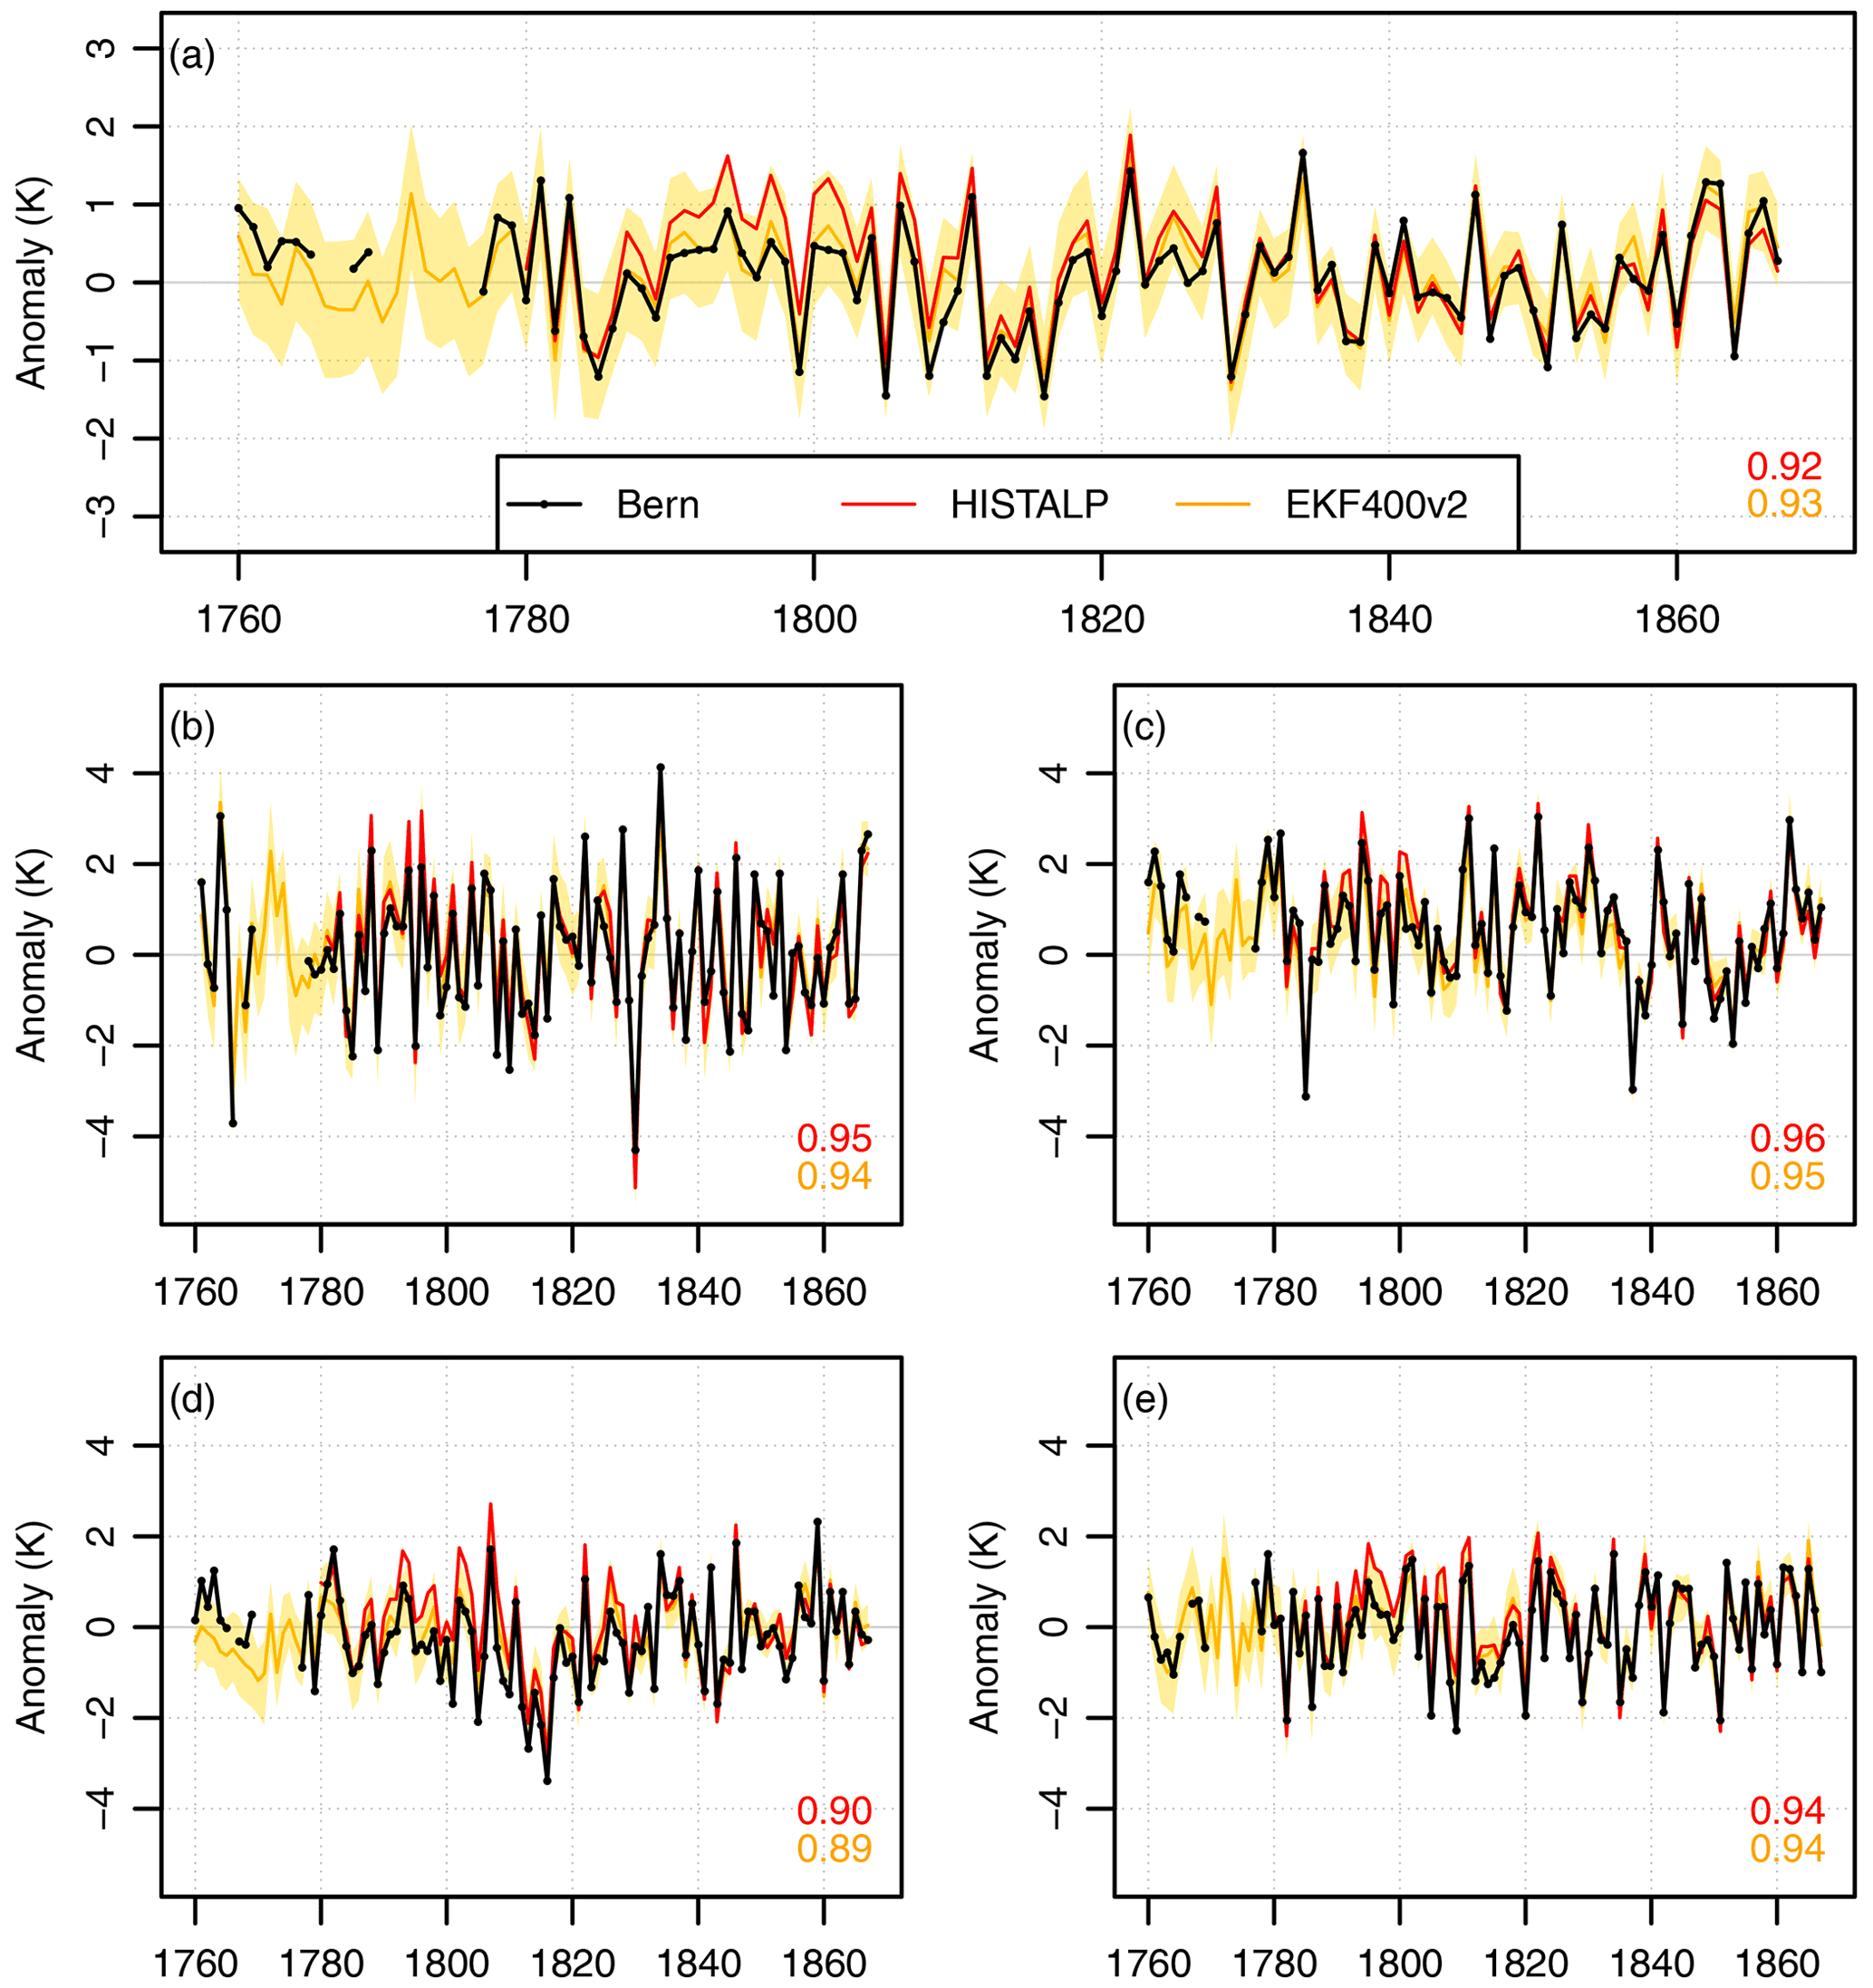
Figure 11(a) Annual temperature series for Bern and for the nearest grid point of the HISTALP and EKF400 data sets, expressed as anomalies with respect to the period 1801–1850. The shading represents the ensemble spread in EKF400. The same is also shown for (b) December–February, (c) March–April, (d) June–August, and (e) September–November. Pearson correlation coefficients between Bern and the other data sets are also given.

Figure 12(a) Annual temperature series for Zurich and for the nearest grid point of the HISTALP and EKF400 data sets, expressed as anomalies with respect to the period 1801–1850. The shading represents the ensemble spread in EKF400. The same is also shown for (b) December–February, (c) March–April, (d) June–August, and (e) September–November. Pearson correlation coefficients between Zurich and the other data sets are also given.
3.3 Homogenization
We detected inhomogeneities within each record visually using the Craddock test (Craddock, 1979). A list of detected inhomogeneities is provided in the Supplement. Station relocations were considered inhomogeneities a priori. To avoid using inhomogeneous periods as a reference, we used the same method to split reference series into homogeneous segments.
We calculated monthly adjustments from data overlaps between records and from reference series from nearby stations (a detailed list of reference series is provided in the Supplement). We then took the median of the monthly adjustments obtained from each reference series and transformed them into daily adjustments by fitting the first two harmonics of a Fourier series (see Eq. 3). For segments shorter than 12 months we simply applied a constant correction identical for all days. With the exception of Mulhouse, all reference stations are from within the borders of Switzerland (see Fig. 1). The number and quality of reference series decreases rapidly before ca. 1780 and so does the accuracy of the adjustments.
The data were adjusted backward in time starting with the most recent segment, which is the only one that was not corrected. The whole homogenization process is based exclusively on raw data, and therefore our results are not influenced by previous work.
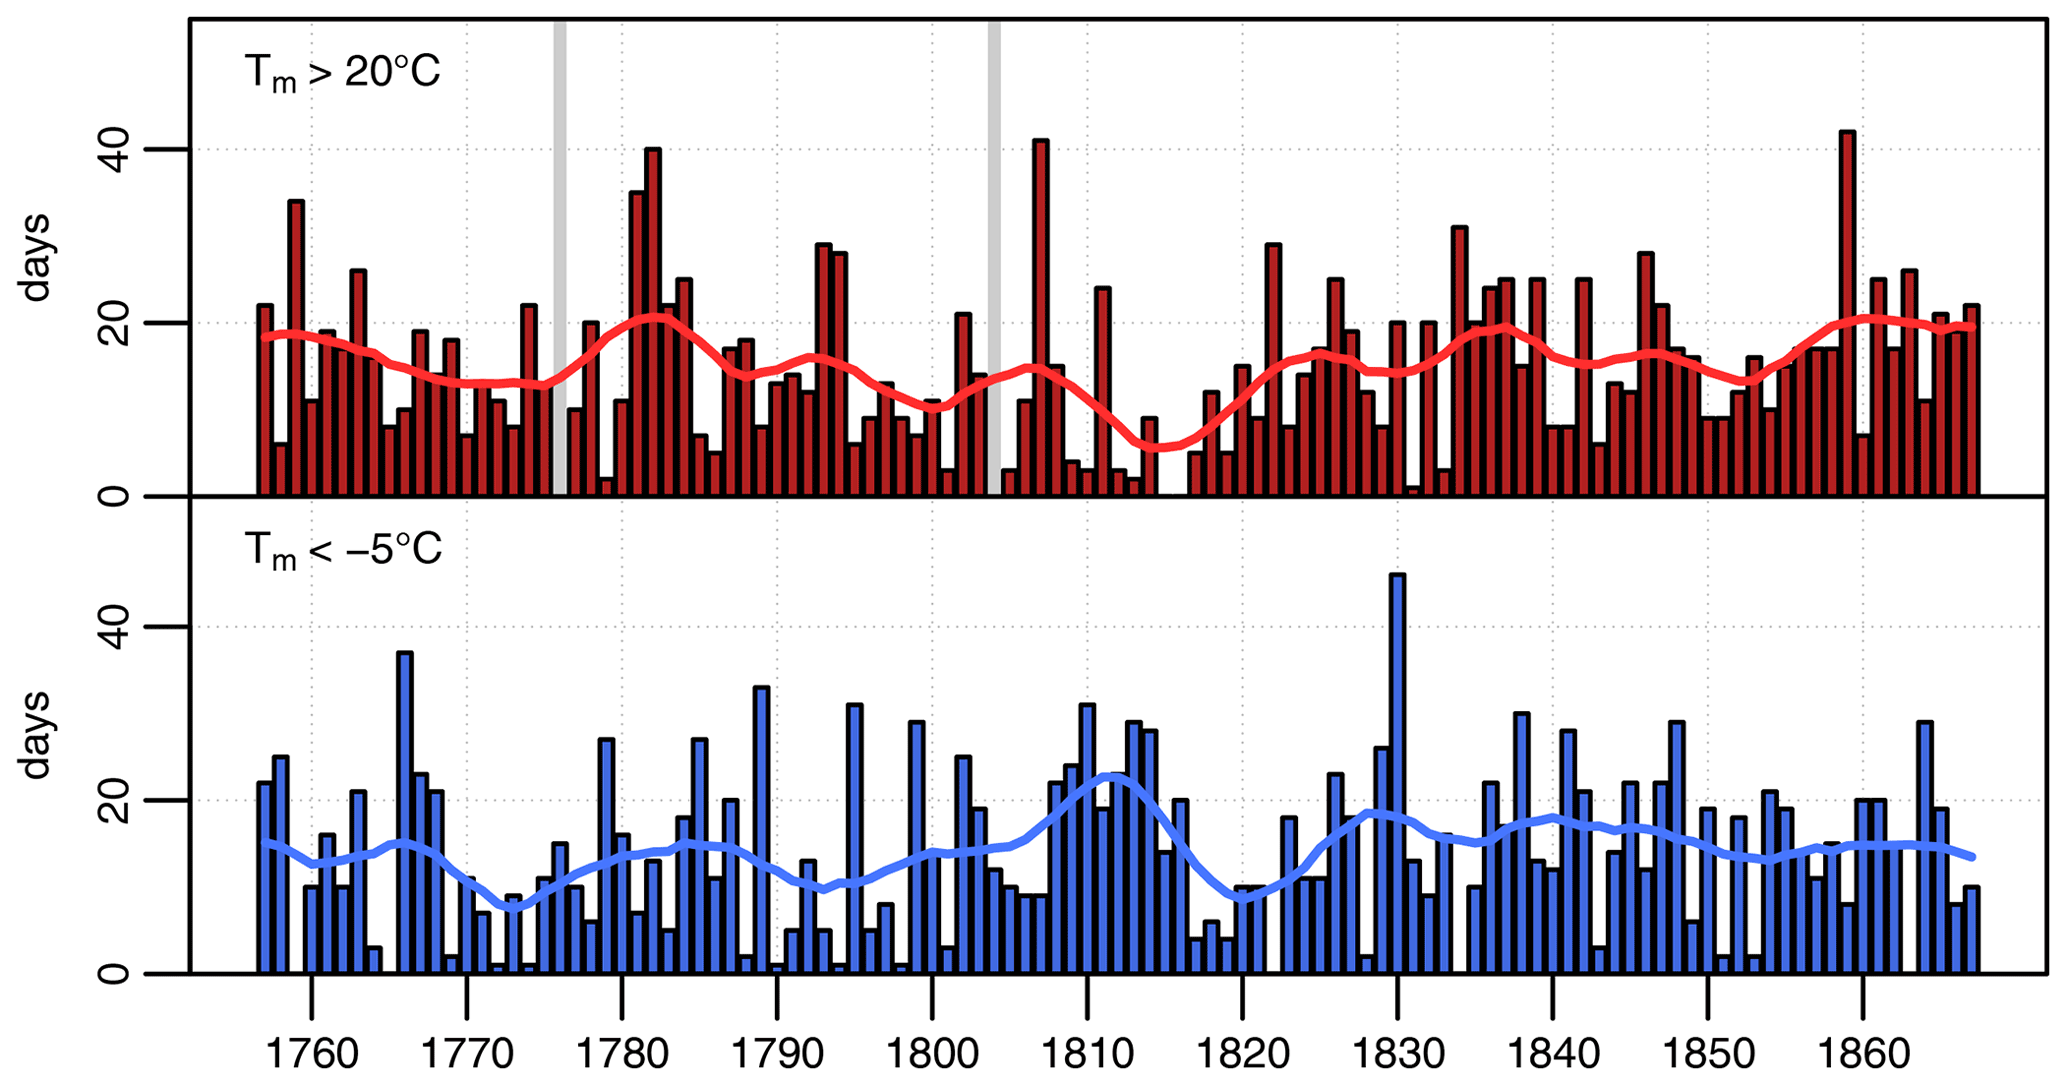
Figure 13Number of days with mean temperature above 20 ∘C in May–September (red) and below −5 ∘C in November–March (blue) in the Swiss Plateau series. The indices are not calculated in years when more than 10 % of days are missing (indicated by grey bars). The smoothed lines are produced using a Gaussian filter with σ=3 years.
3.4 Prioritization, merging of the daily data, and the Swiss Plateau series
After every record has been homogenized with respect to the latest record, the next step is to merge all records into a long temperature series. The many overlaps between different records imply that we need some criteria to choose which record to use for a given day. We introduced a subjective quality ranking (from 1 for the best to 4 for the worst) based on our knowledge of the data and metadata (homogeneity, exposure, representativity, completeness, etc.). For example, the records of Studer, Fueter, and Trechsel overlap in 1826–1827: we chose to prefer Trechsel (priority 1) because of the better metadata, more daily observations, and possibly fewer problems with radiative biases. We still preferred Studer (priority 2) over Fueter (3) because of more daily observations and because of Fueter's location probably being outside the city. Therefore, for a given day within 1826–1827, we used the daily mean by Trechsel if it was available, the one by Studer as a second choice, and the one by Fueter as a third choice. The homogenized daily means selected in this way form a merged daily series for each city, from which we then calculated a merged monthly series.
Due to the frequent missing data in most records, it is common that a monthly mean in the merged series is calculated from daily means of different records (when more than one exists). For example, the monthly mean for October 1824 was calculated from 15 daily means by Studer and 16 daily means by Fueter because Studer was absent between 4 and 19 October. On the other hand, a given daily mean and its error were always calculated from one and the same record.
To reduce the quantity of missing data we produced a combined series given by the average of the Bern and Zurich merged daily series. Missing days in one of the series were filled by adjusting the values in the corresponding days of the other series using constant monthly adjustments calculated from the difference between the two homogenized series. We call this combined series the Swiss Plateau temperature series. A monthly series was then calculated from the daily combined series.
3.5 Monthly infilling and merging with the MeteoSwiss series
Remaining isolated data gaps in the merged monthly series were reconstructed from nearby stations using a weighted average, for which the squared Pearson correlation coefficients are the weights (Alexandersson and Moberg, 1997). Each reference series was first brought to the same average of the series to be filled using the overlapping period (done separately for each month). Reference series were checked for homogeneity so that only homogeneous segments were used and only partially missing years were filled. A total of 12 monthly values were reconstructed for Bern (1 % of the series), 109 for Zurich (9 %), and 14 in the Swiss Plateau series (1 %).
Finally, in order to analyze climate variability over the last 265 years, we also merged our early instrumental series with monthly temperature series for Bern and Zurich for the period 1864–2021 homogenized by MeteoSwiss (Begert et al., 2005). For this we applied further adjustments to our data based on the mean monthly differences in the overlapping period (1864–1867), corresponding to the correction factors applied by MeteoSwiss to that period. Similarly, we extended the monthly Swiss Plateau series to the present using the average of the two MeteoSwiss series.

Figure 14Smoothed time series of the annual mean temperature anomalies (with respect to the 1871–1900 average) for Bern and Zurich, as well as their average (thick lines). The thin lines show the annual mean temperature anomalies from the nearest grid point in EKF400 and HISTALP, as well as in the Basel instrumental series. The dashed lines show the linear trends for the 19th and 20th century in the Bern and Zurich series. All data series were smoothed using a Gaussian filter with σ=3 years. Dots represent the unsmoothed annual anomalies for Bern and Zurich.
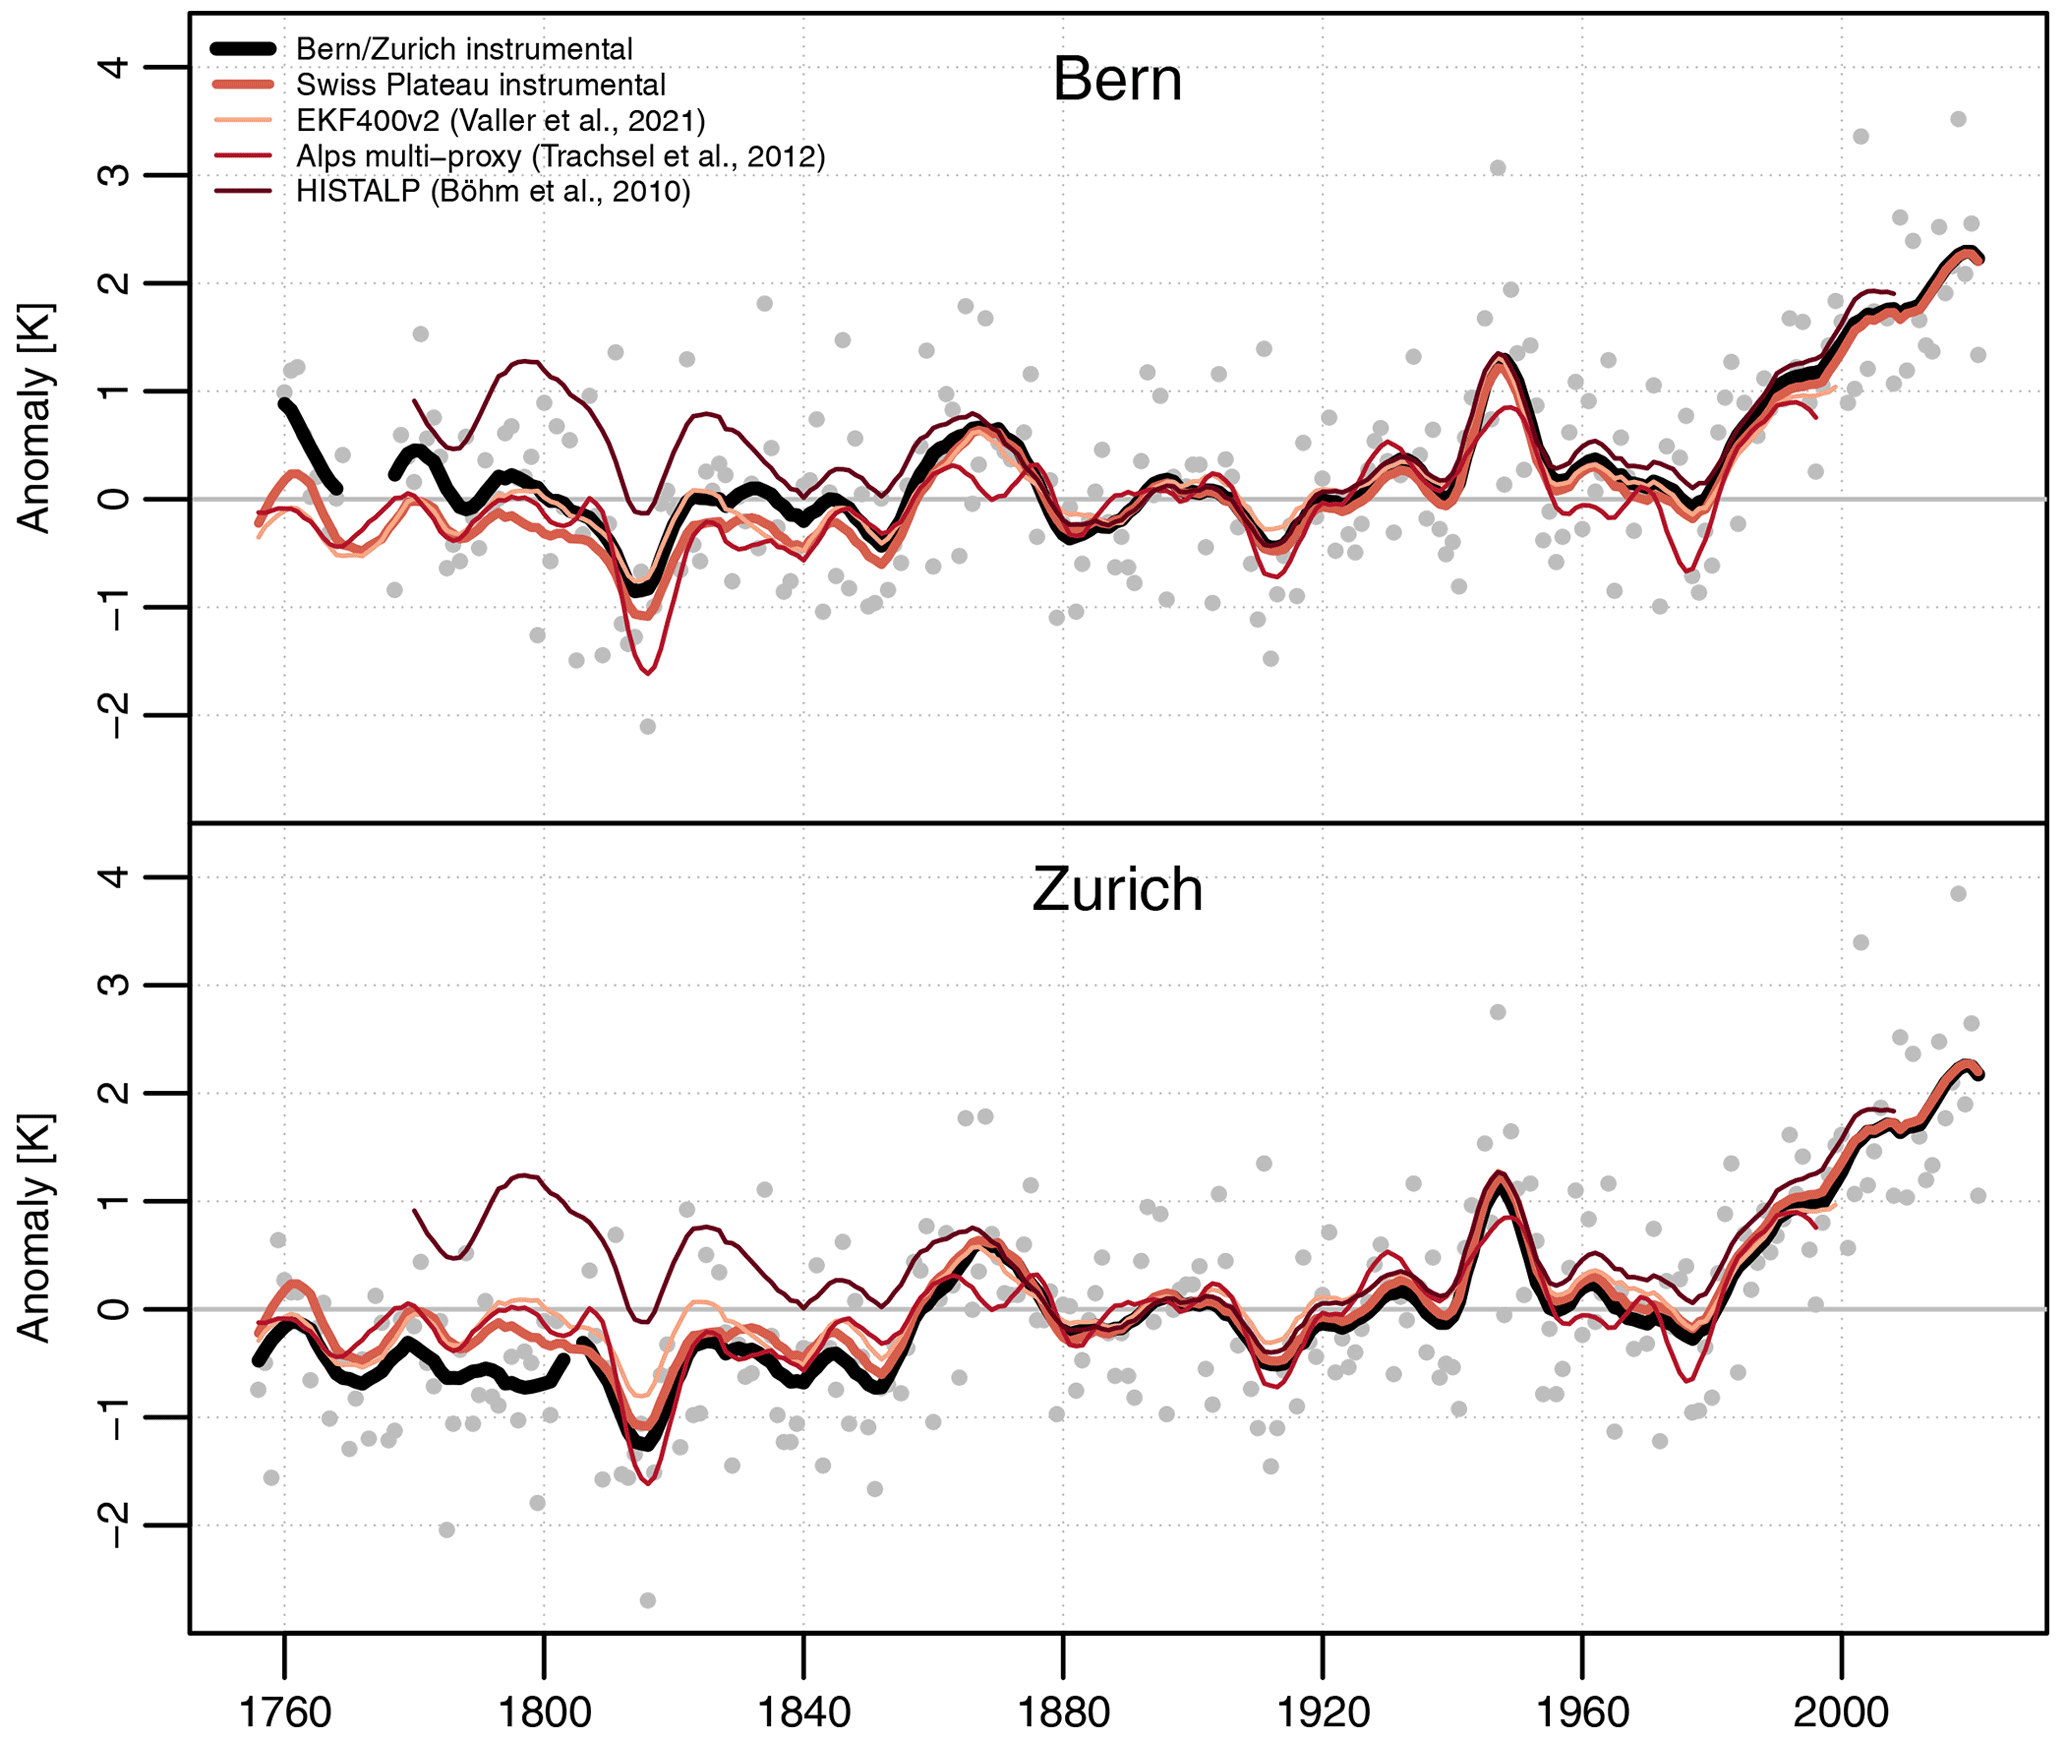
Figure 15Smoothed time series of the warm season (April–September) mean temperature anomalies (with respect to the 1871–1900 average) for Bern and Zurich, as well as their average (thick lines). The thin lines show the warm season mean temperature anomalies from the nearest grid point in EKF400 and HISTALP, as well as the summer (June–August) temperature “mean” reconstruction from multiple proxies for the Greater Alpine Region by Trachsel et al. (2012). All data series were smoothed using a Gaussian filter with σ=3 years. Dots represent the unsmoothed seasonal anomalies for Bern and Zurich.
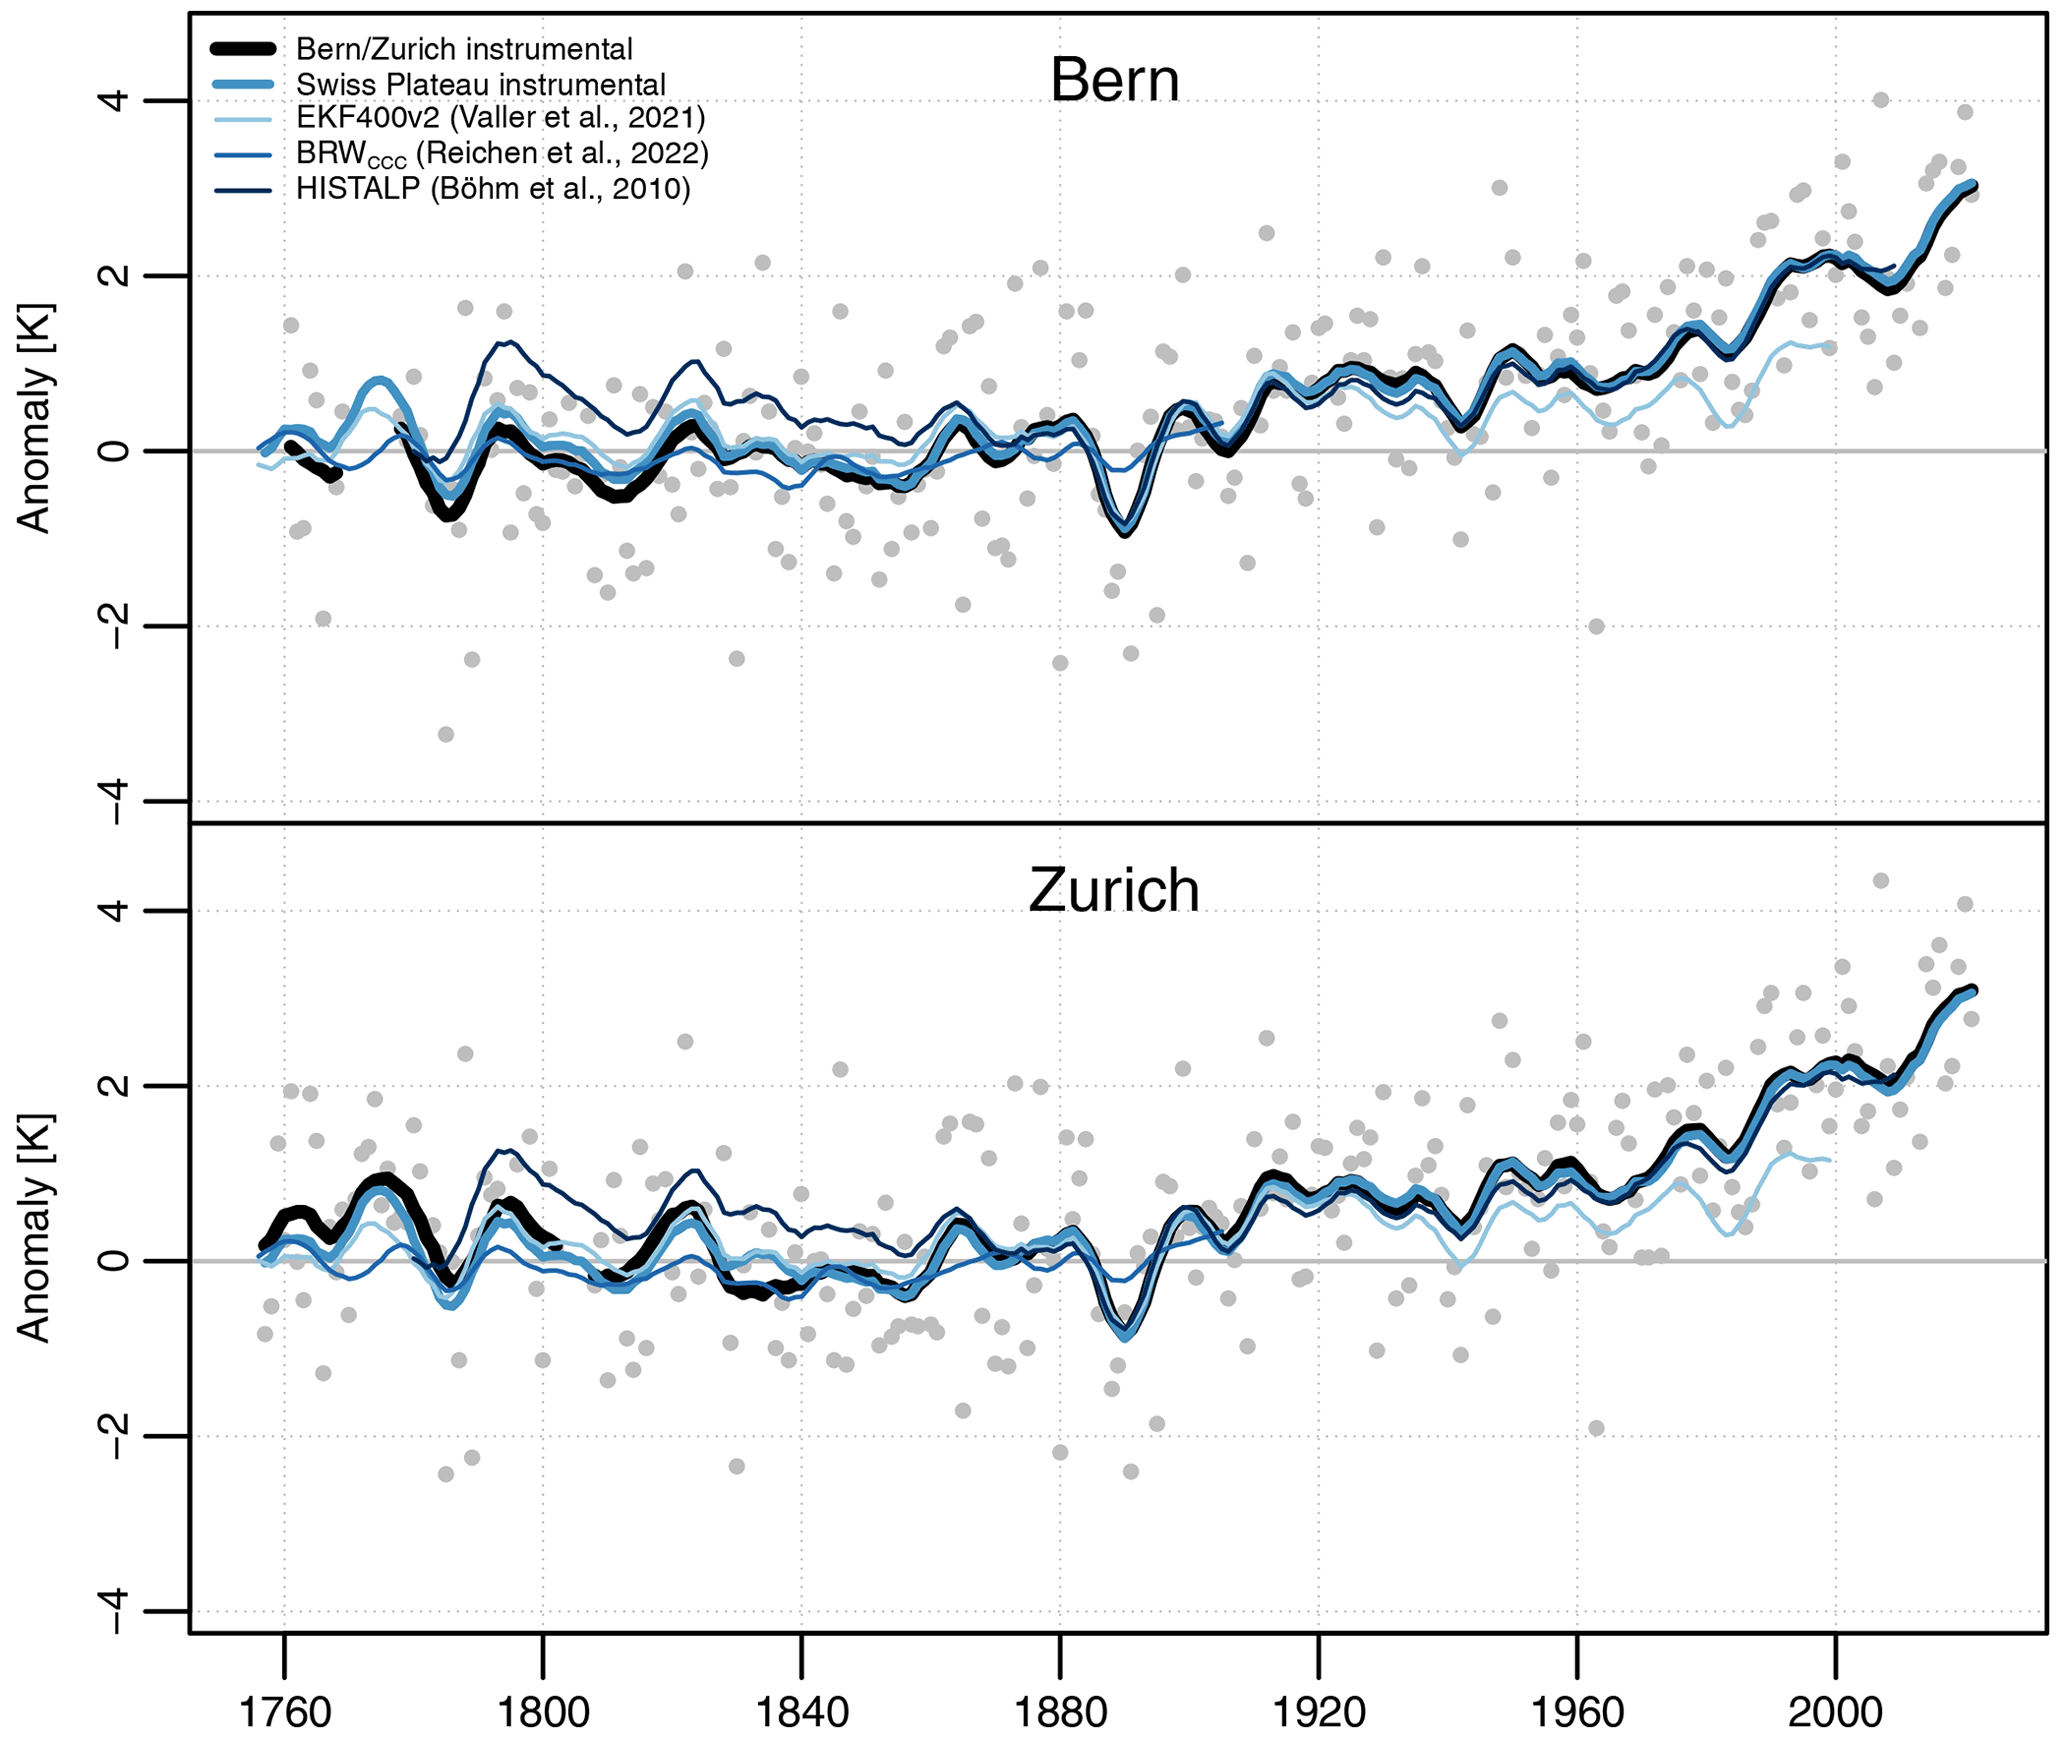
Figure 16Smoothed time series of the cold season (October–March) mean temperature anomalies (with respect to the 1871–1900 average) for Bern and Zurich, as well as their average (thick lines). The thin lines show the cold season mean temperature anomalies from the nearest grid point in EKF400, HISTALP, and the cold season (October–May) reconstruction by Reichen et al. (2022). All data series were smoothed using a Gaussian filter with σ=3 years. Dots represent the unsmoothed seasonal anomalies for Bern and Zurich.
4.1 Errors
Figures 8 and 9 show the evolution in time of the error of daily means for the series of Bern and Zurich, respectively. On average the total error is 1.16 K for Bern and 1.07 K for Zurich. The mean error difference between June and December is 0.69 and 0.82 K, respectively. The largest contributions to the total error come from the number of measurements (e2) and the exposure (e4). The climate error (e5) is also an important contributor in the segments affected by it. Total errors larger than 2 K affect 7.7 % of the Bern series (mostly the Büren segment) and 2.1 % of the Zurich series.
The standard error of monthly means is on average 0.20 K and is never larger than 0.53 K (not shown). These values are smaller than existing estimates for early instrumental data (e.g., Valler et al., 2021).
4.2 Homogenization assessment
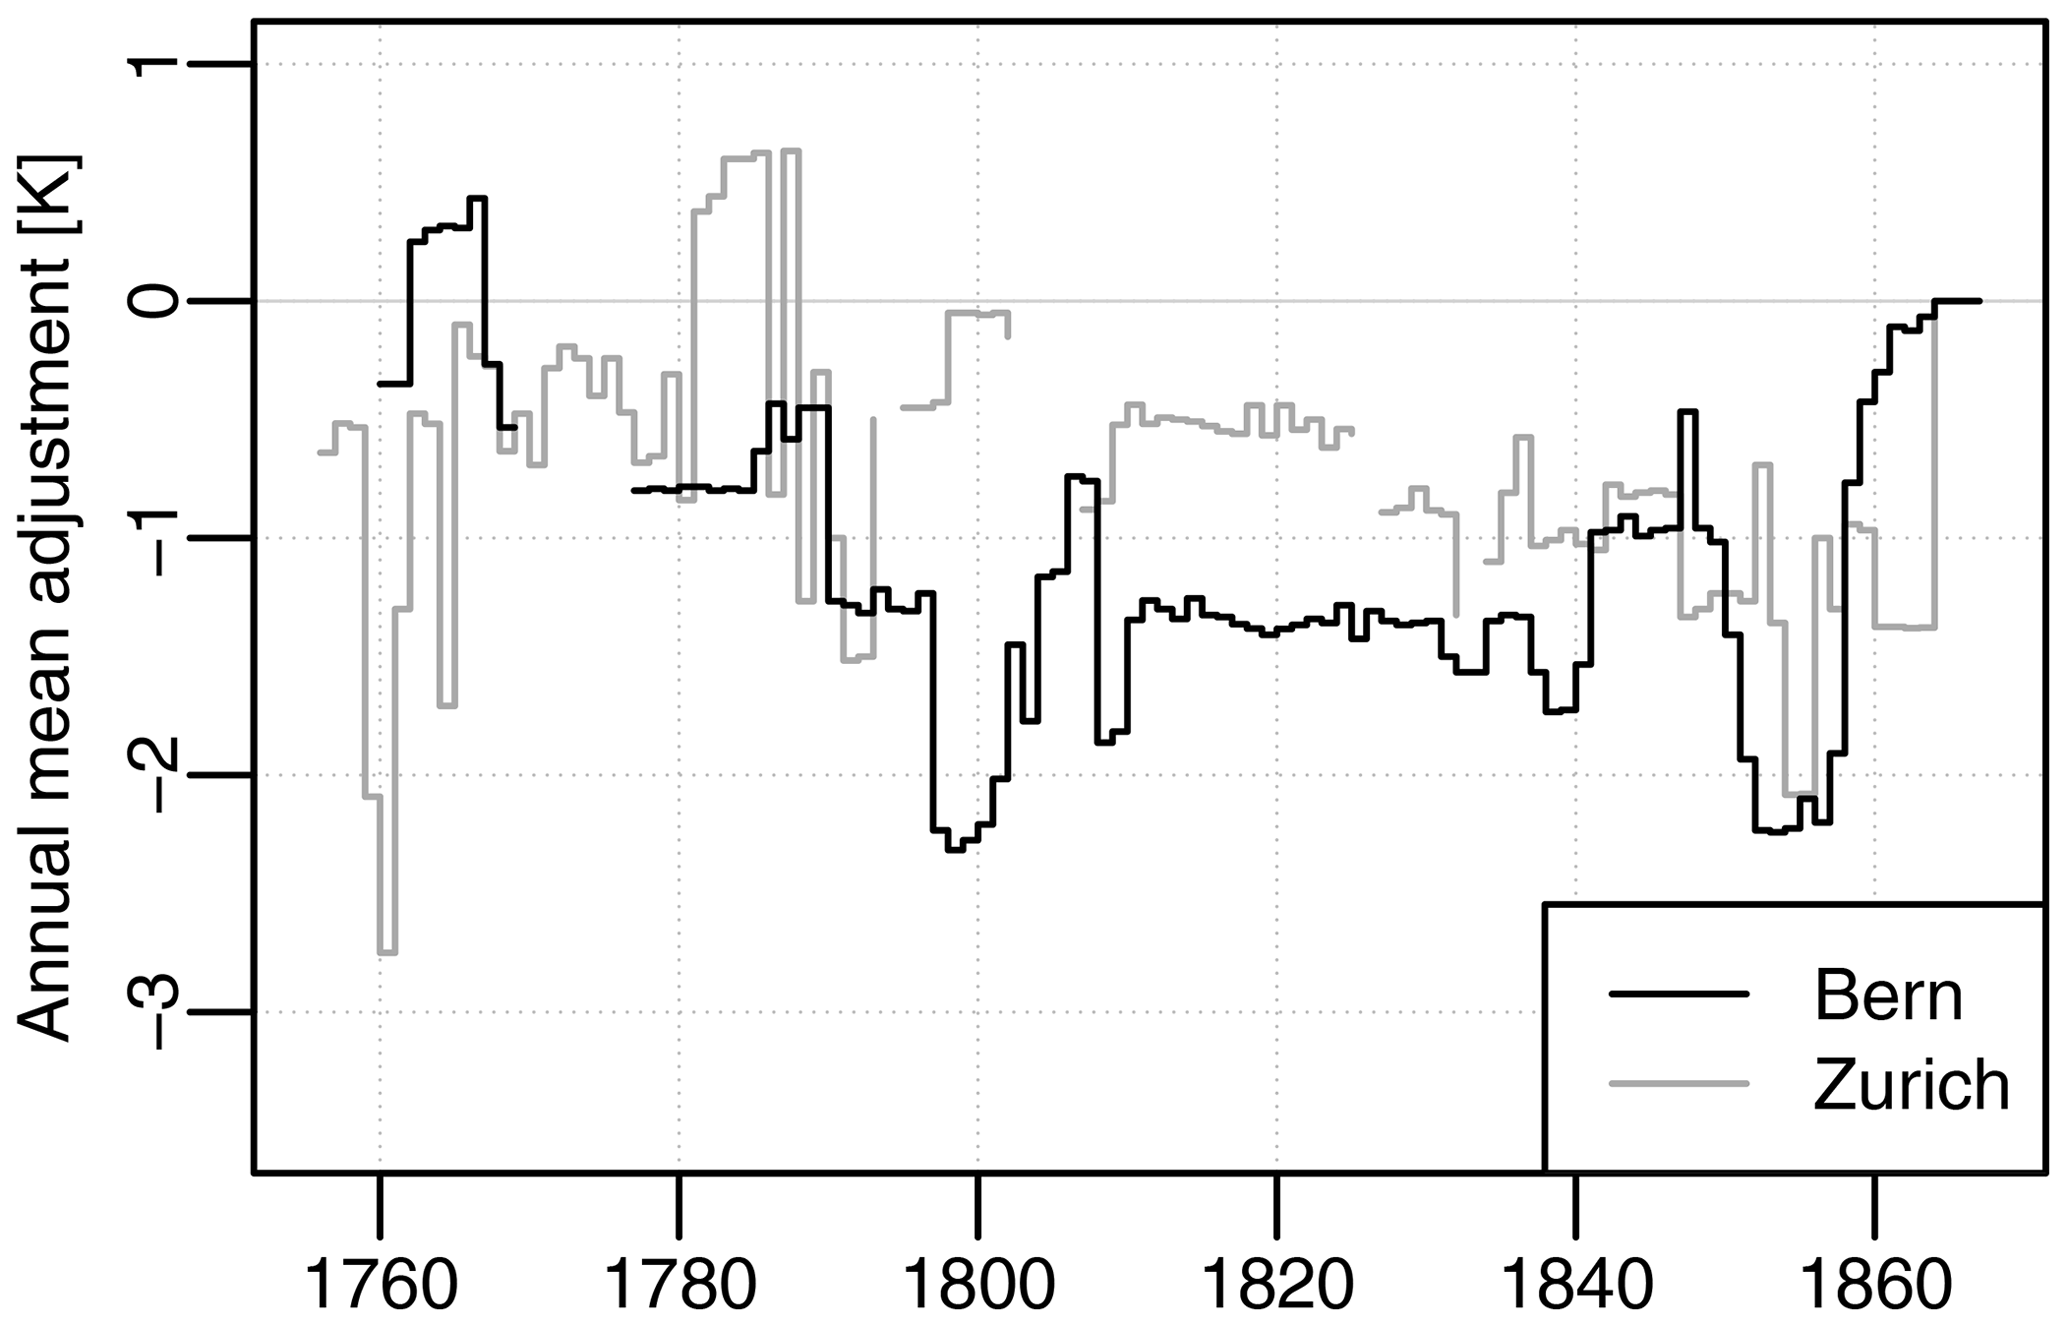
Early instrumental measurements are affected by radiative biases, poor ventilation, and heat exchange with buildings, all causing temperature overestimation on average. Consistently, the adjustments that we applied to the raw data to homogenize the series are mostly negative (Fig. 10).
Zurich is 0.8 K warmer than Bern on average after the homogenization, whereas it was 0.5 K warmer in the raw data. For comparison, the mean difference between the modern stations of Zeughaushof and Bollwerk is 1.0 K.
When comparing our homogenized early instrumental series with the closest grid point in the HISTALP and EKF400 data sets (Fig. 11 and 12), we obtained correlation coefficients between 0.83 and 0.96 for annual and seasonal averages. The lowest correlations occur in summer, when interannual variability is small and errors are large. Despite the generally high correlation, a few noteworthy differences emerge, particularly in the last decade and at the turn of the century.
Both Bern and Zurich series are warmer than HISTALP after 1860, when they show up to 0.7 K higher mean annual temperature anomalies (with respect to 1801–1850). The ensemble mean of EKF400 (which assimilates HISTALP) lies close to our data, hinting at a possible problem in HISTALP. However, it is possible that our series suffer from residual inhomogeneities in that period, too, especially considering the large fragmentation of data sources.
The warm bias shown by HISTALP between the 1790s and the early 1800s is another likely problem in that data set. Large differences with other data sets in that period were also mentioned in Böhm et al. (2010). Again, our series agree better with the ensemble mean of EKF400. The differences come mainly from the warm season and might be related to residual radiative biases in HISTALP.
Extreme seasons such as the cold summer of 1816 or the cold winter of 1829–1830 are reproduced consistently by all data sets, with some exception in early years, when the Zurich series is substantially warmer than the other series in winter. There is also very good agreement on the cold anomaly between 1812 and 1816, which affects all seasons but spring.
Deteriorating quality of the homogenization can be expected before 1777 for Bern and before 1795 for Zurich, particularly in the seasonal means. The reason is the lower number of reference series with respect to later years, a problem further exacerbated by the large data gaps in our series. Note that both EKF400 and HISTALP are fully independent from our data before 1777 for Bern and before 1830 for Zurich.
4.3 Daily indices
The daily resolution of the data allows us to analyze daily temperature indices representing, for instance, the frequency of warm and cold days. Here we focus on the number of days with mean temperature above 20 ∘C and below −5 ∘C (Fig. 13). On the Swiss Plateau these thresholds represent moderately warm (cold) summer (winter) days. In the early instrumental period they are exceeded on 17 % of the days during June–August and December–February, respectively.
For both indices the 1810s stand out as an extremely cold decade. The “year without a summer” of 1816 (Brugnara et al., 2015) was not the only year with an anomalous summer in that decade; in fact, both 1815 and 1816 had no warm days, although the summer mean temperature of 1815 was considerably higher. The years 1809, 1810, 1812, and 1813 also had a very low number of warm days. At the same time Switzerland saw an unusually long sequence of harsh winters starting with 1807–1808 (see also Reichen et al., 2022), followed by a sequence of relatively mild winters between 1817 and 1822.
A remarkable sequence of warm summers occurred in the early 1780s, a period mostly remembered by historians because of the coincidental Laki eruption in Iceland and the related optical and weather phenomena in Europe in 1783 (Zambri et al., 2019). A similar warm sequence occurred in the 1830s. At the other end of the spectrum, the coldest winter of the analyzed period (1829–1830) brought 46 cold days between 18 November and 7 February.
4.4 Climate variability since the mid-18th century
When looking at the evolution of the annual mean temperature during the last 265 years (Fig. 14), one can recognize a weak positive trend during the 19th century that accelerates, particularly in the second half of the 20th century. In contrast, the HISTALP data set shows a strong negative trend over the 19th century.
The climate of the late 18th century was in many respects similar to that of the late 19th century, including a brief cold period in the 1780s that culminated with the extremely cold winter of 1788–1789 (Pappert et al., 2022). In fact, the mean temperature of the period 1756–1800 in the Swiss Plateau series is nearly identical (<0.1 K difference) to that of the period 1856–1900. The corresponding differences in the individual series of Bern and Zurich, as well as in EKF400, are also very small (all <0.2 K), with the late 18th century always slightly colder. In HISTALP, on the other hand, the late 18th century is nearly 0.6 K warmer than the late 19th century. In all data sets but HISTALP, the early 19th century stands out as an extremely cold period: the decade between 1808 and 1817, in particular, is 0.71 K colder than the 1871–1900 average and 2.65 K colder than the 1991–2020 average in the Swiss Plateau series.
Our results for the mid-19th century – when they diverge from HISTALP – are also consistent with homogenized instrumental series from northern Italy (Brunetti et al., 2006), proxy-based reconstructions (e.g., Trachsel et al., 2012; Wetter and Pfister, 2013), and Swiss glacier variability (e.g., Zumbühl et al., 2008; Brönnimann et al., 2019b), all showing a strong positive trend (glacier retreat) between 1840 and 1870. This trend is also present in the homogenized series from Basel (Bider et al., 1958, see Fig. 14), located in northern Switzerland, and in the EKF400 reconstruction (even though it assimilates the HISTALP data set).
Therefore, HISTALP is likely to have a significant warm bias before 1860 despite the additional corrections applied by Böhm et al. (2010). This bias is relevant for climate research as it might affect many other widely used products that are based on HISTALP data (e.g., Rennie et al., 2014; Osborn et al., 2021). Moreover, HISTALP data are often used to calibrate and validate proxy-based reconstructions (Frank et al., 2007).
During most of the early instrumental period (i.e., before 1864) the Basel series is slightly warmer than the Bern and Zurich series but remains well below HISTALP. EKF400 is very close to our series, particularly for Bern and after 1780. There is also remarkable agreement between the annual series of Bern and Zurich, with the exception of the 1830s–1840s, when Bern is up to 0.5 K warmer. The mean absolute difference between the two annual series is only 0.20 K before 1864. For comparison, the mean absolute difference in the NWS era (1864–2021) is 0.11 K. The 19th century (1801–1900) warming as estimated from a least-squares linear regression is 0.37 ± 0.24 K in Bern, 0.51 ± 0.25 K in Zurich, and 0.18 ± 0.26 K in Basel.
The agreement between the Bern and Zurich series is not as good when looking at seasonal averages (April–September: Fig. 15, October–March: Fig. 16), for which Bern has higher anomalies than Zurich in the warm season (+0.51 K on average) and lower anomalies in the cold season (−0.28 K) during the early instrumental period. This is unlikely to be a true climate signal but is rather a measure of the uncertainty in the homogenization, in particular in the adjustments at the end of the early instrumental period, when the transition to a national network introduced inhomogeneities in most series.
The Swiss Plateau series matches the EKF400 reconstruction in both seasons relatively well, indicating that the homogenization errors in the Bern and Zurich series might compensate for each other on average. In winter, however, we would expect temperature from EKF400 to be slightly too high because there are fewer assimilated proxies, and therefore the influence of HISTALP should be larger.
In Fig. 15 we also show the Alpine temperature reconstruction by Trachsel et al. (2012) based on tree rings and lake proxies, while in Fig. 16 we show the cold season reconstruction by Reichen et al. (2022) based on plant and ice phenology. Both agree relatively well with the Swiss Plateau series (note that in both cases the season definition is different from ours). The winter reconstruction agrees better with the Bern series, confirming a possible temperature overestimation in EKF400 and in the Zurich series.
We provide two new long instrumental temperature series at daily resolution for Bern and Zurich, covering the period preceding the start of official measurements in Switzerland (1756–1863). Given the large heterogeneity and uncertainty of the underlying data, we also provide error estimates for each daily and monthly average. In addition, we merged the two series into a more complete series representing the central Swiss Plateau.
Some versions of early instrumental monthly temperature series for Bern and Zurich are already available in global data sets. We extended them further back in time (by over 70 years in the case of Zurich) and used more data sources. Being based on the raw sub-daily measurements, our results are independent from previous work, making them particularly valuable for assessing the quality of widely used long European records that, in some cases, were published over a century ago. Moreover, each and every measurement that we used is fully traceable down to the original historical sources, the majority of which are freely accessible from an online repository (Pfister, 2019), as are all the raw measurements (Brugnara, 2022b).
The data are homogenized by taking advantage of the large number of early instrumental Swiss series that were digitized recently and making use of detailed metadata where available. Nevertheless, the large fragmentation of the data across dozens of observers and the frequent gaps made the homogenization particularly challenging. Therefore, we expect residual biases to affect the results, particularly on seasonal and monthly scales. Additional reference series, for instance from neighboring countries, could improve data homogeneity, especially in early years and during the establishment of the NWS in the 1860s.
The comparison with existing monthly temperature reconstructions allowed us to pinpoint problematic periods in the HISTALP data set, which is integrated in all global public instrumental databases and is widely used for calibration and validation of climate reconstructions for central Europe. In particular, we pointed out a probable inhomogeneity around 1860, which causes a positive bias for the whole early instrumental period, and an additional temperature overestimation between 1790 and 1805. Increasing data availability for the early instrumental period is key to fixing these biases.
Our results suggest that the pre-industrial climate in Switzerland was colder than previously thought. This highlights the still substantial uncertainty affecting climate variability in the early instrumental period – even for annual mean temperature in data-rich central Europe – and points to the need for a revisitation of past homogenization efforts as well as for easier access to and better traceability of the raw data.
The daily and monthly raw and homogenized series are available through the data repository of the University of Bern (BORIS) at https://doi.org/10.48620/74 (Brugnara, 2022a). The underlying raw sub-daily data are available through PANGAEA at https://doi.org/10.1594/PANGAEA.948258 (Brugnara, 2022b). The R code for the homogenization is available through Zenodo at https://doi.org/10.5281/zenodo.7088968 (Brugnara, 2022c).
The supplement related to this article is available online at: https://doi.org/10.5194/cp-18-2357-2022-supplement.
YB prepared and homogenized the instrumental data, performed the analysis, and wrote the paper. LP, CH, and YB did the archive work and collected metadata. VV prepared the EKF400 data. SB supervised the work. All authors reviewed the paper.
The contact author has declared that none of the authors has any competing interests.
Publisher's note: Copernicus Publications remains neutral with regard to jurisdictional claims in published maps and institutional affiliations.
This work was supported by MeteoSwiss/GCOS Switzerland (project “Long Swiss Meteorological Series”), the Swiss National Science Foundation (projects “CHIMES” and “REUSE”), and the European Union (project “PALAEO-RA”). Post-1863 temperature data have been provided by MeteoSwiss, the Swiss Federal Office of Meteorology and Climatology. We thank the University Library Basel for providing digital images of several weather journals during the COVID-19 pandemic and the many students of the University of Bern who worked on the data keying.
This research has been supported by the Schweizerischer Nationalfonds zur Förderung der Wissenschaftlichen Forschung (grant nos. 162668 and 169676) and Horizon 2020 (PALAEO-RA, grant no. 787574).
This paper was edited by Hans Linderholm and reviewed by two anonymous referees.
Alexandersson, H. and Moberg, A.: Homogenization of Swedish temperature data. Part I: Homogeneity test for linear trends, Int. J. Climatol., 17, 25–34, https://doi.org/10.1002/(SICI)1097-0088(199701)17:1<25::AID-JOC103>3.0.CO;2-J, 1997. a
Auchmann, R. and Brönnimann, S.: A physics-based correction model for homogenizing sub-daily temperature series, J. Geophys. Res., 117, D17119, https://doi.org/10.1029/2012JD018067, 2012. a
Auer, I., Böhm, R., Jurkovic, A., Lipa, W., Orlik, A., Potzmann, R., Schöner, W., Ungersböck, M., Matulla, C., Briffa, K., Jones, P., Efthymiadis, D., Brunetti, M., Nanni, T., Maugeri, M., Mercalli, L., Mestre, O., Moisselin, J.-M., Begert, M., Müller-Westermeier, G., Kveton, V., Bochnicek, O., Stastny, P., Lapin, M., Szalai, S., Szentimrey, T., Cegnar, T., Dolinar, M., Gajic-Capka, M., Zaninovic, K., Majstorovic, Z., and Nieplova, E.: HISTALP–historical instrumental climatological surface time series of the Greater Alpine Region, Int. J. Climatol., 27, 17–46, https://doi.org/10.1002/joc.1377, 2007. a, b
Begert, M., Schlegel, T., and Kirchhofer, W.: Homogeneous temperature and precipitation series of Switzerland from 1864 to 2000, Int. J. Climatol., 25, 65–80, https://doi.org/10.1002/joc.1118, 2005. a
Bider, M., Schüepp, M., and von Rudloff, H.: Die Reduktion der 200jährigen Basler Temperaturreihe, Arch. Meteorol. Geophys. Bioklimatol. B, 9, 360–412, 1958. a, b
Blodget, L.: Climatology of the United States and Temperate Latitudes of the North American Continent, Lippincott, Philadelphia, 536 pp., 1857. a
Böhm, R., Jones, P. D., Hiebl, J., Frank, D., Brunetti, M., and Maugeri, M.: The early instrumental warm-bias: a solution for long central European temperature series 1760–2007, Clim. Change, 101, 41–67, https://doi.org/10.1007/s10584-009-9649-4, 2010. a, b, c, d, e, f
Brandsma, T. and Können, G.: Application of nearest-neighbor resampling for homogenizing temperature records on a daily to sub-daily level, Int. J. Climatol., 26, 75–89, https://doi.org/10.1002/joc.1236, 2006. a
Brandsma, T. and Van der Meulen, J.: Thermometer screen intercomparison in De Bilt (the Netherlands) – Part II: Description and modeling of mean temperature differences and extremes, Int. J. Climatol., 28, 389–400, https://doi.org/10.1002/joc.1524, 2008. a
Brönnimann, S. (Ed.): Swiss Early Instrumental Meteorological Series, vol. G96, Geographica Bernensia, https://doi.org/10.4480/GB2020.G96.01, 2020. a
Brönnimann, S., Allan, R., Ashcroft, L., Baer, S., Barriendos, M., Brázdil, R., Brugnara, Y., Brunet, M., Brunetti, M., Chimani, B., Cornes, R., Domínguez-Castro, F., Filipiak, J., Founda, D., Herrera, R. G., Gergis, J., Grab, S., Hannak, L., Huhtamaa, H., Jacobsen, K. S., Jones, P., Jourdain, S., Kiss, A., Lin, K. E., Lorrey, A., Lundstad, E., Luterbacher, J., Mauelshagen, F., Maugeri, M., Maughan, N., Moberg, A., Neukom, R., Nicholson, S., Noone, S., Nordli, O., Ólafsdóttir, K. B., Pearce, P. R., Pfister, L., Pribyl, K., Przybylak, R., Pudmenzky, C., Rasol, D., Reichenbach, D., Řezníčková, L., Rodrigo, F. S., Rohr, C., Skrynyk, O., Slonosky, V., Thorne, P., Valente, M. A., Vaquero, J. M., Westcottt, N. E., Williamson, F., and Wyszyński, P.: Unlocking pre-1850 instrumental meteorological records: A global inventory, B. Am. Meteorol. Soc., 100, ES389–ES413, https://doi.org/10.1175/BAMS-D-19-0040.1, 2019a. a
Brönnimann, S., Franke, J., Nussbaumer, S. U., Zumbühl, H. J., Steiner, D., Trachsel, M., Hegerl, G. C., Schurer, A., Worni, M., Malik, A., Flückiger, J., and Raible, C. C.: Last phase of the Little Ice Age forced by volcanic eruptions, Nat. Geosci., 12, 650–656, https://doi.org/10.1038/s41561-019-0402-y, 2019b. a
Brönnimann, S., Brugnara, Y., and Pfister, L.: Several little known meteorological series from Basel, 1766–1802, in: Swiss Early Instrumental Meteorological Series, edited by: Brönnimann, S., vol. G96, Geographica Bernensia, https://doi.org/10.4480/GB2020.G96.17, 2022. a
Brugnara, Y.: Early Instrumental Temperature Records for Basel, Bern, Geneva, and Zurich, Bern Open Repository and Information System (BORIS) [data set], https://doi.org/10.48620/74, 2022a. a
Brugnara, Y.: Swiss Early Meteorological Observations v2.0, PANGAEA [data set], https://doi.org/10.1594/PANGAEA.948258, 2022b. a, b
Brugnara, Y.: Homogenization software for early instrumental temperature series, Zenodo [code], https://doi.org/10.5281/zenodo.7088968, 2022c. a
Brugnara, Y. and Brönnimann, S.: Daniel Huber’s Meteorological Record from Basel, 1789–1829, in: Swiss Early Instrumental Meteorological Series, edited by: Brönnimann, S., vol. G96, Geographica Bernensia, https://doi.org/10.4480/GB2020.G96.18, 2022. a
Brugnara, Y., Auchmann, R., Brönnimann, S., Allan, R. J., Auer, I., Barriendos, M., Bergström, H., Bhend, J., Brázdil, R., Compo, G. P., Cornes, R. C., Dominguez-Castro, F., van Engelen, A. F. V., Filipiak, J., Holopainen, J., Jourdain, S., Kunz, M., Luterbacher, J., Maugeri, M., Mercalli, L., Moberg, A., Mock, C. J., Pichard, G., Řezníčková, L., van der Schrier, G., Slonosky, V., Ustrnul, Z., Valente, M. A., Wypych, A., and Yin, X.: A collection of sub-daily pressure and temperature observations for the early instrumental period with a focus on the ”year without a summer” 1816, Clim. Past, 11, 1027–1047, https://doi.org/10.5194/cp-11-1027-2015, 2015. a
Brugnara, Y., Pfister, L., Villiger, L., Rohr, C., Isotta, F. A., and Brönnimann, S.: Early instrumental meteorological observations in Switzerland: 1708–1873, Earth Syst. Sci. Data, 12, 1179–1190, https://doi.org/10.5194/essd-12-1179-2020, 2020. a, b, c, d, e, f, g
Brugnara, Y., Brönnimann, S., and Pfister, L.: The First Swiss Meteorological Record: Scheuchzer's Series from Zurich 1708–1733, in: Swiss Early Instrumental Meteorological Series, edited by: Brönnimann, S., vol. G96, 157–167, Geographica Bernensia, https://doi.org/10.4480/GB2020.G96.15, 2021a. a
Brugnara, Y., Pfister, L., and Brönnimann, S.: Zurich's Many 19th Century Meteorological Records, in: Swiss Early Instrumental Meteorological Series, edited by: Brönnimann, S., vol. G96, 183–197, Geographica Bernensia, https://doi.org/10.4480/GB2020.G96.14, 2021b. a, b, c
Brugnara, Y., Brönnimann, S., Grenon, M., Baumann, J., and Wyss, P.: Early meteorological series from Geneva, 1760–1798, in: Swiss Early Instrumental Meteorological Series, edited by: Brönnimann, S., vol. G96, Geographica Bernensia, https://doi.org/10.4480/GB2020.G96.20, 2022. a
Brunetti, M., Maugeri, M., Monti, F., and Nanni, T.: Temperature and precipitation variability in Italy in the last two centuries from homogenised instrumental time series, Int. J. Climatol. A J. Roy. Meteorol. Soc., 26, 345–381, https://doi.org/10.1002/joc.1251, 2006. a
Camuffo, D.: Key problems in early wine-spirit thermometers and the “true Réaumur” thermometer, Clim. Change, 163, 1083–1102, https://doi.org/10.1007/s10584-020-02910-3, 2020. a
Camuffo, D., della Valle, A., and Becherini, F.: From time frames to temperature bias in temperature series, Clim. Change, 165, 1–23, https://doi.org/10.1007/s10584-021-03065-5, 2021. a, b
Carrard, B.: Abhandlung von den meteorologischen Beobachtungen, Abhandlungen und Beobachtungen durch die Ökonomische Gesellschaft zu Bern gesammelt, 4, 93–169, 1763. a
Craddock, J.: Methods of comparing annual rainfall records for climatic purposes, Weather, 34, 332–346, https://doi.org/10.1002/j.1477-8696.1979.tb03465.x, 1979. a
Dobrovolnỳ, P., Moberg, A., Brázdil, R., Pfister, C., Glaser, R., Wilson, R., van Engelen, A., Limanówka, D., Kiss, A., Halíčková, M., Mackova, J., Riemann, D., Luterbacher, J., and Böhm, R.: Monthly, seasonal and annual temperature reconstructions for Central Europe derived from documentary evidence and instrumental records since AD 1500, Clim. Change, 101, 69–107, https://doi.org/10.1007/s10584-009-9724-x, 2010. a
Dove, H.: Über die nichtperiodischen Änderungen der Temperaturverteilung auf der Oberfläche der Erde, Abh. Dtsch. Koniglich Akad. Wiss. Berlin, 1, 285–415, 1839. a
Eredia, F.: La temperatura in Italia, in: Annali dell’Ufficio Centrale di Meteorologia, Serie II, vol. XXXI, Ufficio Centrale di Meteorologia, Rome, 1912. a
Escher, J. K.: Einige Nachrichten und Bemerkungen meteorologischen Inhaltes, Bürkli, Zürich, https://doi.org/10.3931/e-rara-32542, 1822. a
Flückiger, J., Burgdorf, A.-M., Brugnara, Y., and Brönnimann, S.: Two meteorological series from Bern from Trechsel, 1826–1829, and Benoit, 1837–1853, in: Swiss Early Instrumental Meteorological Series, edited by: Brönnimann, S., Vol. G96, 97–108, Geographica Bernensia, https://doi.org/10.4480/GB2020.G96.09, 2020. a
Frank, D., Büntgen, U., Böhm, R., Maugeri, M., and Esper, J.: Warmer early instrumental measurements versus colder reconstructed temperatures: shooting at a moving target, Quaternary Sci. Rev., 26, 3298–3310, https://doi.org/10.1016/j.quascirev.2007.08.002, 2007. a
Fritze, R., Brugnara, Y., and Brönnimann, S.: Four Meteorological Series from Zurich Covering 1756–1802, in: Swiss Early Instrumental Meteorological Series, edited by: Brönnimann, S., vol. G96, 139–155, Geographica Bernensia, https://doi.org/10.4480/GB2020.G96.13, 2021. a
Füllemann, C., Begert, M., Croci-Maspoli, M., and Brönnimann, S.: Digitalisieren und Homogenisieren von historischen Klimadaten des Swiss NBCN – Resultate aus DigiHom, Tech. Rep. 236, MeteoSwiss, 2011. a, b
Gimmi, U., Luterbacher, J., Pfister, C., and Wanner, H.: A method to reconstruct long precipitation series using systematic descriptive observations in weather diaries: the example of the precipitation series for Bern, Switzerland (1760–2003), Theor. Appl. Climatol., 87, 185–199, https://doi.org/10.1007/s00704-005-0193-5, 2007. a
Gubler, M., Christen, A., Remund, J., and Brönnimann, S.: Evaluation and application of a low-cost measurement network to study intra-urban temperature differences during summer 2018 in Bern, Switzerland, Urban Clim., 37, 100817, https://doi.org/10.1016/j.uclim.2021.100817, 2021. a
Hari, C.: An evaluation of meteorological observations by Samuel Studer (1807–1818), Master's thesis, University of Bern, https://occrdata.unibe.ch/students/theses/msc/343.pdf (last access: 15 October 2022), 2021. a
Hari, C., Brugnara, Y., Rohr, C., and Brönnimann, S.: Meteorological observations in Bern and vicinity: 1777–1834, in: Swiss Early Instrumental Meteorological Series, edited by: Brönnimann, S., vol. G96, 199–211, Geographica Bernensia, https://doi.org/10.4480/GB2020.G96.19, 2022. a, b, c
Hupfer, F.: Das Wetter der Nation. Meteorologie, Klimatologie und der schweizerische Bundesstaat, 1860–1914, Ph.D. thesis, Swiss Federal Institute of Technology, Zurich, https://doi.org/10.3929/ethz-b-000254661, 2017. a
K.K.-Central-Anstalt: Jelinek's Anleitung zur Ausführung meteorologischer Beobachtungen, Direction der k. k. Central-Anstalt für Meteorologie und Erdmagnetismus, Vienna, Vierte umgearbeitete Auflage edn., 1893. a
MCSNG: Schweizerische Meteorologische Beobachtungen herausgegeben von der meteorologischen Centralanstalt der schweizerischen naturforschenden Gesellschaft, vol. 4, Zürcher und Furrer, Zürich, 1867. a
Moberg, A., Bergström, H., Krigsman, J. R., and Svanered, O.: Daily Air Temperature and Pressure Series for Stockholm (1756–1998), Springer, Dordrecht, https://doi.org/10.1007/978-94-010-0371-1_7, 2002. a
Nordli, P., Alexandersson, H., Frich, P., Førland, E., Heino, R., Jonsson, T., Tuomenvirta, H., and Tveito, O.: The effect of radiation screens on Nordic time series of mean temperature, Int. J. Climatol. A J. Roy. Meteorol. Soc., 17, 1667–1681, https://doi.org/10.1002/(SICI)1097-0088(199712)17:15<1667::AID-JOC221>3.0.CO;2-D, 1997. a
Osborn, T. J., Jones, P. D., Lister, D. H., Morice, C. P., Simpson, I. R., Winn, J. P., Hogan, E., and Harris, I. C.: Land Surface Air Temperature Variations Across the Globe Updated to 2019: The CRUTEM5 Data Set, J. Geophys. Res., 126, e2019JD032352, https://doi.org/10.1029/2019JD032352, 2021. a
Pappert, D., Barriendos, M., Brugnara, Y., Imfeld, N., Jourdain, S., Przybylak, R., Rohr, C., and Brönnimann, S.: Statistical reconstruction of daily temperature and sea-level pressure in Europe for the severe winter 1788/9, Clim. Past Discuss. [preprint], https://doi.org/10.5194/cp-2022-10, in review, 2022. a
Pfister, C.: Agrarkonjunktur und Witterungsverlauf im westlichen Schweizer Mittelland 1755–1797, Geographica Bernensia, G2, 229 pp., https://doi.org/10.4480/GB2021.G2, 1975. a, b, c
Pfister, L.: Early instrumental meteorological measurements in Switzerland, Zenodo, https://doi.org/10.5281/zenodo.3066836, 2019. a
Pfister, L., Hupfer, F., Brugnara, Y., Munz, L., Villiger, L., Meyer, L., Schwander, M., Isotta, F. A., Rohr, C., and Brönnimann, S.: Early instrumental meteorological measurements in Switzerland, Clim. Past, 15, 1345–1361, https://doi.org/10.5194/cp-15-1345-2019, 2019. a, b, c
Reichen, L., Burgdorf, A.-M., Brönnimann, S., Franke, J., Hand, R., Valler, V., Samakinwa, E., Brugnara, Y., and Rutishauser, T.: A decade of cold Eurasian winters reconstructed for the early 19th century, Nat. Commun., 13, 2116, https://doi.org/10.1038/s41467-022-29677-8, 2022. a, b, c
Rennie, J. J., Lawrimore, J. H., Gleason, B. E., Thorne, P. W., Morice, C. P., Menne, M. J., Williams, C. N., de Almeida, W. G., Christy, J., Flannery, M., Ishihara, M., Kamiguchi, K., Klein-Tank, A. M. G., Mhanda, A., Lister, D. H., Razuvaev, V., Renom, M., Rusticucci, M., Tandy, J., Worley, S. J., Venema, V., Angel, W., Brunet, M., Dattore, B., Diamond, H., Lazzara, M. A., Le Blancq, F., Luterbacher, J., Mächel, H., Revadekar, J., Vose, R. S., and Yin, X.: The international surface temperature initiative global land surface databank: monthly temperature data release description and methods, Geosci. Data J., 1, 75–102, https://doi.org/10.1002/gdj3.8, 2014. a
Schüepp, M.: Klimatologie der Schweiz: Lufttemperatur, Supplement to Annalen der Schweizerische Meteorologische Zentralanstalt Vol. 97, City Druck AG, Zürich, 1961. a
Trachsel, M., Kamenik, C., Grosjean, M., McCarroll, D., Moberg, A., Brázdil, R., Büntgen, U., Dobrovolnỳ, P., Esper, J., Frank, D. C., Friedrich, M., Glaser, R., Larocque-Tobler, I., Nicolussi, K., and Riemann, D.: Multi-archive summer temperature reconstruction for the European Alps, AD 1053–1996, Quaternary Sci. Rev., 46, 66–79, https://doi.org/10.1016/j.quascirev.2012.04.021, 2012. a, b, c
Valler, V., Franke, J., Brugnara, Y., and Brönnimann, S.: An updated global atmospheric paleo-reanalysis covering the last 400 years, Geosci. Data J. https://doi.org/10.1002/gdj3.121, 2021. a, b, c
Wetter, O. and Pfister, C.: An underestimated record breaking event – why summer 1540 was likely warmer than 2003, Clim. Past, 9, 41–56, https://doi.org/10.5194/cp-9-41-2013, 2013. a
Wild, H.: Ueber die Bestimmung der Lufttemperatur, in: Mitteilungen der Naturforschenden Gesellschaft Bern, Nr. 450-454, 91–119, https://doi.org/10.5169/seals-318689, 1860. a, b, c, d
Wild, H.: Bericht über die meteorologischen Arbeiten im Kanton Bern im Jahr 1861, in: Mitteilungen der Naturforschenden Gesellschaft in Bern, Nr. 524–527, 217–237, https://doi.org/10.5169/seals-318723, 1862. a, b
WMO: Guide to climatological practices, WMO-No. 100, World Meteorological Organization, Geneva, ISBN 978-92-63-10100-6, 2018. a
Wyer, V., Brugnara, Y., and Brönnimann, S.: Meteorological series from Neuchatel, Bern, and Gurzelen from the 18th century, in: Swiss Early Instrumental Meteorological Series, edited by: Brönnimann, S., vol. G96, pp. 169–182, Geographica Bernensia, https://doi.org/10.4480/GB2020.G96.16, 2021. a, b, c
Zambri, B., Robock, A., Mills, M. J., and Schmidt, A.: Modeling the 1783–1784 Laki eruption in Iceland: 2. Climate impacts, J. Geophys. Res., 124, 6770–6790, https://doi.org/10.1029/2018JD029554, 2019. a
Zumbühl, H. J., Steiner, D., and Nussbaumer, S.: 19th century glacier representations and fluctuations in the central and western European Alps: An interdisciplinary approach, Global Planet. Change, 60, 42–57, https://doi.org/10.1016/j.gloplacha.2006.08.005, 2008. a