the Creative Commons Attribution 4.0 License.
the Creative Commons Attribution 4.0 License.
 | 04 Feb 2022
Co-evolution of the terrestrial and aquatic ecosystem in the Holocene Baltic Sea
Marcel T. J. van der Meer
Timothy I. Eglinton
The Baltic Sea experienced changes in marine input throughout the Holocene as substantial regional ice retreat led to isostatic adjustment, eustatic sea level change, and periodic isolation from the North Sea. Here, we determine the distributions and isotopic signatures of organic compounds preserved in a sediment record spanning the last ∼11 kyr to reconstruct environmental change under these dynamic conditions. Carbon and hydrogen isotope ratios of short-, mid-, and long-chain n-alkanes, along with long-chain diol and glycerol dialkyl glycerol tetraether abundances, were analyzed in sediments sampled from the Arkona Basin in the southwestern Baltic Sea. In the earlier part of the record (specifically 10–8.2 ka), hydrogen isotope values of higher plant-derived n-alkanes revealed a change in dominant water source from an ice-melt-derived to a precipitation-dominated hydrological regime. Following this shift in water source, carbon isotope values of n-alkanes suggest diversification of vegetation. Shifts in hydrology and vegetation did not coincide with established phase boundaries but instead occurred mid-phase or spanned phase transitions. For this reason, we suggest describing the Ancylus Lake in two phases: a meltwater phase (10.6 to 9.2 ka) and a precipitation phase (9.2 to 7.7 ka). Our results highlight the utility of using C and H isotope ratios in conjunction with other compound abundance proxies to better understand the complex environmental change recorded in paleoarchives.
- Article
(5921 KB) - Full-text XML
-
Supplement
(488 KB) - BibTeX
- EndNote


The Baltic Sea, located in northwestern Europe, is a semi-enclosed marine basin characterized by restricted circulation, strong terrestrial influence, and relatively low oxygen concentrations that promote enhanced sedimentary organic matter contents and diverse phytoplankton communities (e.g., Wasmund and Uhlig, 2003; Golubkov et al., 2021). The Baltic Sea existed at least as far back as the Eemian interglacial (∼130 ka, Andrén et al., 2015). Today, there is an open connection between the North Sea and the Baltic Sea via the Danish Straits in the west; however, this connection has not been permanent, causing the basin to experience substantial environmental change throughout the Holocene. The Baltic Ice Lake – the manifestation of the Baltic Sea just prior to the start of the Holocene – emerged around 15.5 ka as large portions of the Scandinavian Ice Sheet (SIS) melted and formed a meltwater lake filled with icebergs (Björck, 1995). The complex climate dynamics caused substantial shifts in the salinity of the Baltic Sea during the Holocene, reconstructed from geochemical and micropaleontological data (e.g., Alhonen, 1971; Ning et al., 2017; Ni et al., 2020; Weiss et al., 2020). Salinity changes in the Baltic Sea largely indicate periods of connection or isolation from the North Sea via the Danish Straits. The timing of different Holocene phases of the Baltic Sea is debated and appears to be divergent at different locations in the basin (Gustafsson and Westman, 2002; Moros et al., 2002). The dates used hereafter for Baltic Sea phases are from two previously studied Arkona Basin cores (Warden et al., 2016, Fig. 1). As global and regional temperatures fluctuated at the start of the Holocene, eustatic sea level rise caused an inundation of saline North Sea water causing the transition of the basin from a freshwater to a brackish lake, a phase known as the Yoldia Sea (YS) (11.2 to 10.6 ka). Melting and subsequent calving stimulated retreat of the SIS, and in turn isostatic rebound of surrounding landmass led to changes in shoreline and water levels (e.g., Moros et al., 2002). The shoreline changes caused isolation from the North Sea which led to freshening of the basin and a phase known as the Ancylus Lake (AL). The AL phase terminated at around 7.7 ka when a large marine transgression reconnected the Baltic Sea with the North Sea. The transgression reached a maximum at 7.2 ka and the prolonged inundation of saline North Sea water resulted in a second brackish phase called the Littorina Sea (LS), which lasted until 3 ka. After 3 ka, the modern Baltic phase was established (Andrén et al., 2000, 2011), with further freshening due to continued glacio-isostatic rebound. The present-day halocline in the Baltic proper sits around 60–80 m; surface salinity is around 7–8 g kg−1, and salinity below the halocline is almost double at around 12 g kg−1 (Gustafsson and Westman, 2002). The halocline in the Kattegat is at the much shallower depth of 15 m, with salinities between 15–25 g kg−1 above and 32–35 g kg−1 below (Gustafsson and Westman, 2002). It is likely that the halocline depth changed throughout time as a result of various climatic conditions (e.g., Ni et al., 2020).
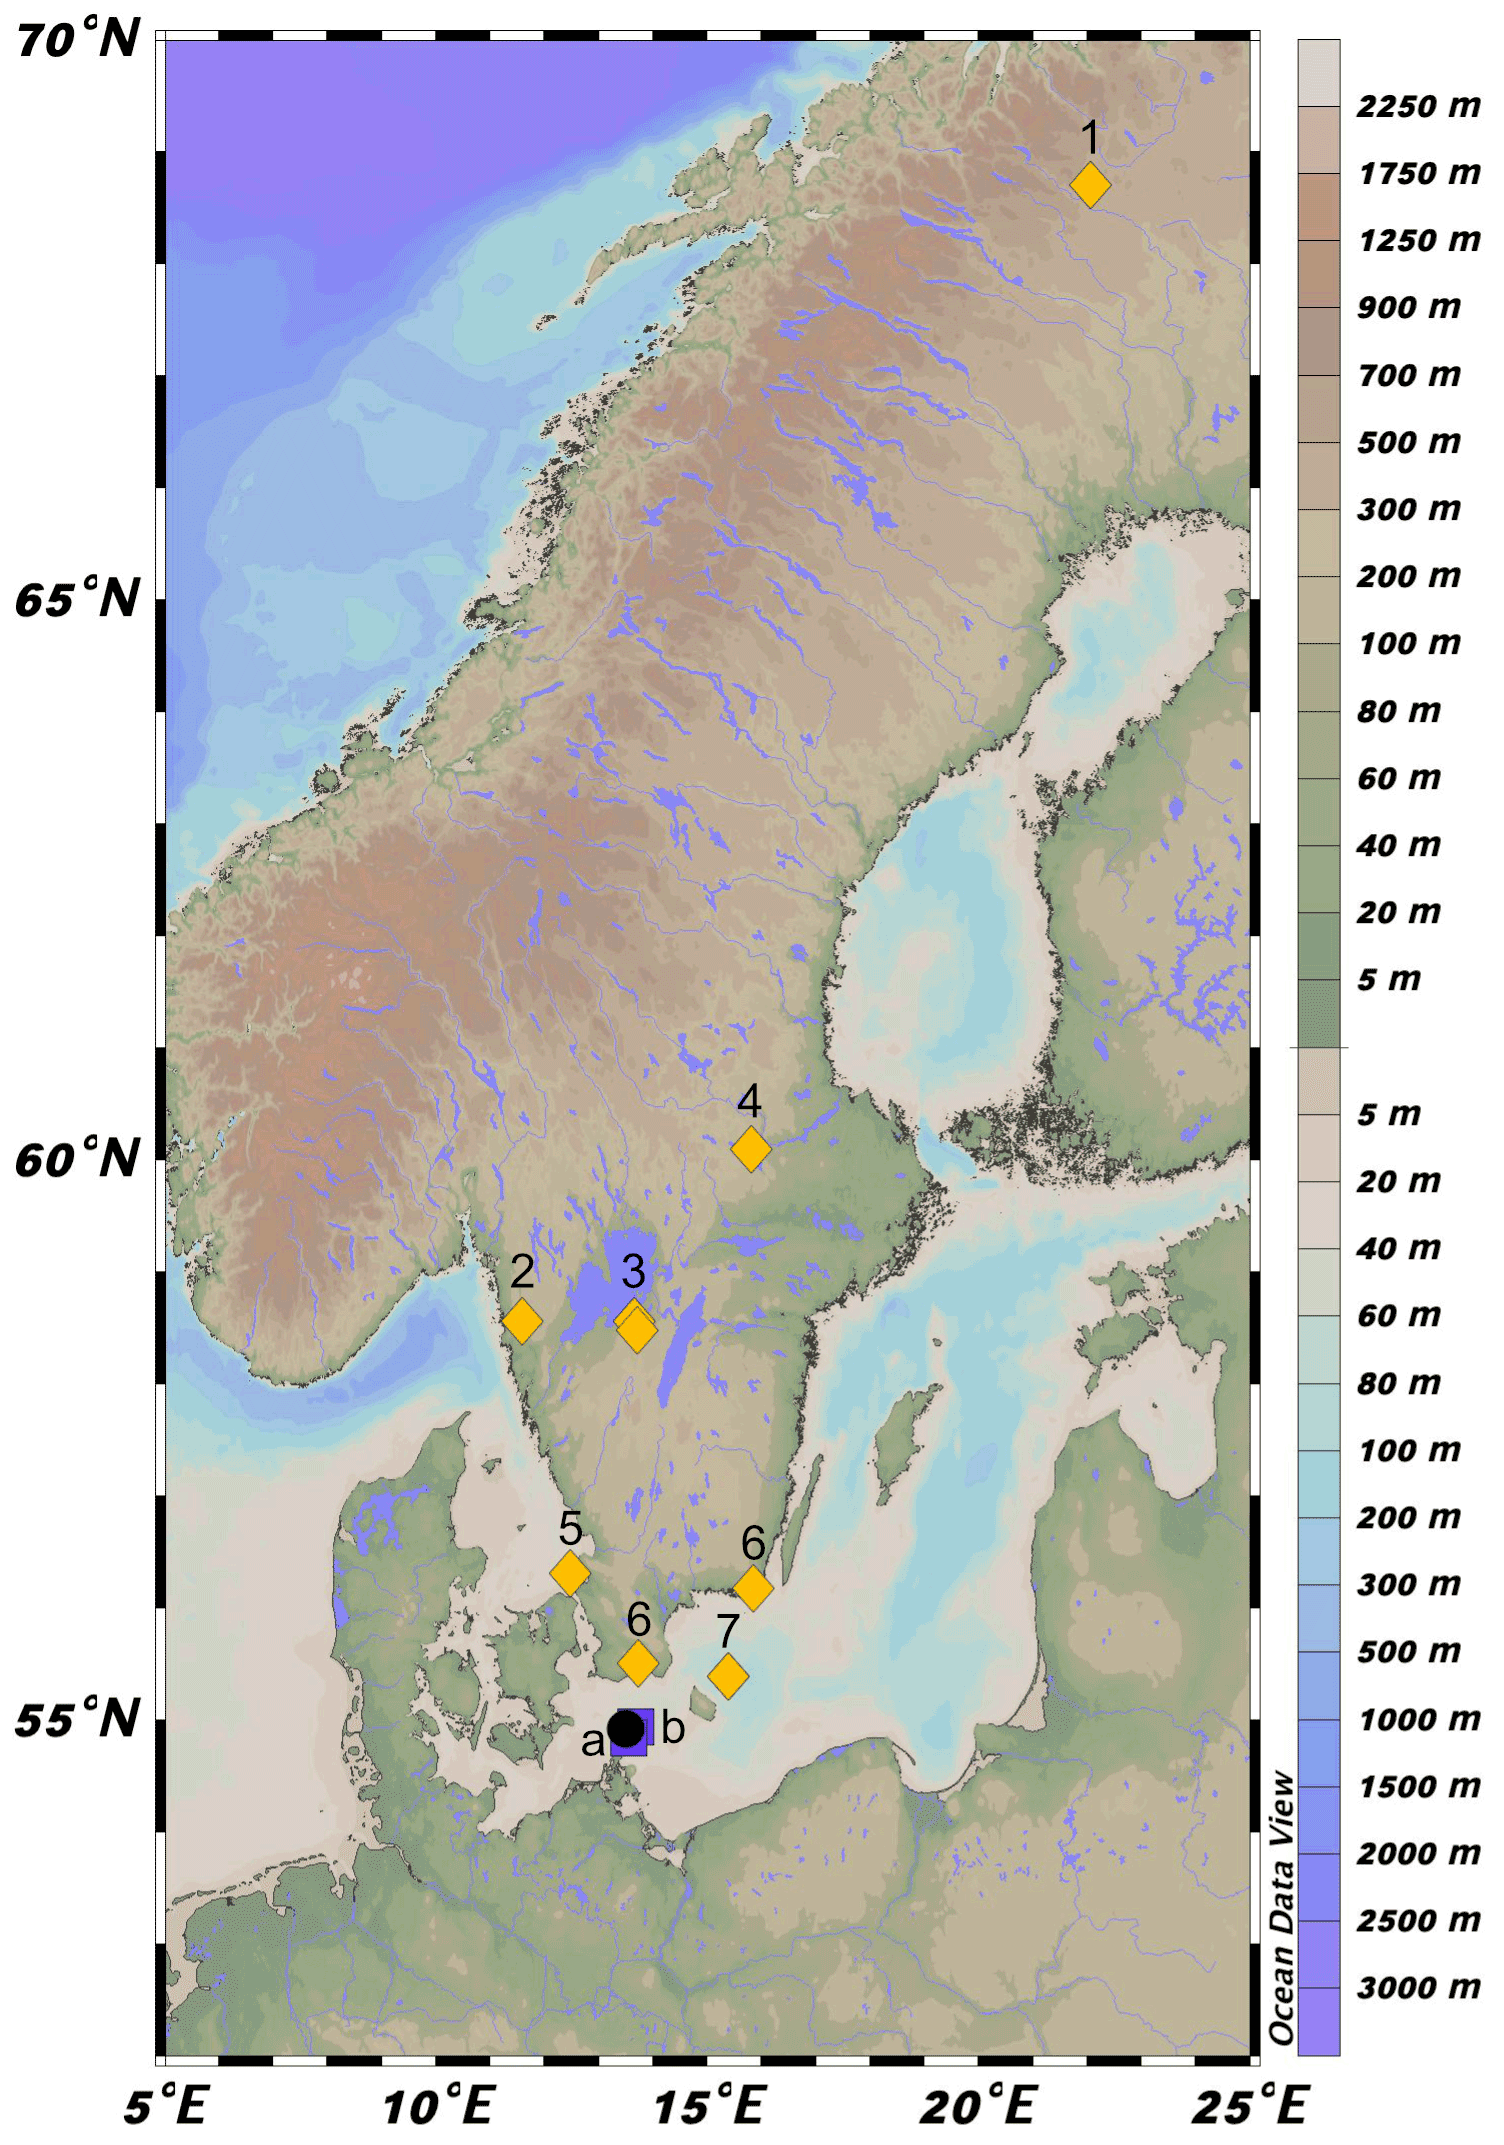
Figure 1Location of 64PE410_S7 (black circle) in the southwestern Baltic Sea near the connection with the North Sea via the Danish Straits. Map was created in Ocean Data View (Schlitzer, 2021). Squares a and b represent the location of cores from Warden et al. (2016) used to construct the age model. Yellow diamonds correspond to regional pollen records. 1: Seppä and Weckström (1999), Seppä and Birks (2001); 2: Antonsson and Seppä (2007); 3: Hammarlund et al. (2003), Seppä et al. (2005); 4: Antonsson et al. (2006); 5: Berglund et al. (2008a); 6: Berglund et al. (2008b); 7: Andrén et al. (2000).
Regional pollen records from southern Sweden (Krageholmssjön, Färskesjön, and Trehörningen lakes, Antonsson and Seppä, 2007; Berglund et al., 2008a, b, Fig. 1) and central Sweden (Lake Flarken, Seppä et al., 2005, Fig. 1) suggest an establishment of deciduous forests (first appearance of Alnus and Quercus, for example) starting ∼10–9.5 ka, while gymnosperm (especially Pinus) and Betula slowly retreated. At the same time, the northern region of Sweden and Finland showed the growth of gymnosperm forests (mainly Pinus, Lake Tsuolbmajavri, Seppä and Weckström 1999; Seppä and Birks, 2001), while Juniperus decreased (maximum at ∼9 ka). These major changes in vegetation coincide with an increase in mean annual air temperature in the region (e.g., Hammarlund et al., 2003; Antonsson et al., 2006). The mid-Holocene (9–3 ka) is characterized by a slow decrease in Pinus in the south, an overall low abundance of herbs, while in the north the vegetation remained stable (Seppä and Weckström 1999; Seppä and Birks 2001; Seppä et al., 2005; Berglund et al., 2008a, b; Antonsson and Seppä, 2007). Notable events during that period are short-lived cold events (9.2 and 8.2 kyr) that are recorded in the southern pollen records indicated by a decrease in angiosperm taxa (e.g., Alnus) and increase in Pinus – although not all lakes record these events at the same scale or exact time. The last 3 kyr are characterized by a decrease in deciduous tree taxa, an increase in herbs and Betula, and the appearance of Picea in the south, in conjunction with a general cooling (Hammarlund et al., 2003; Antonsson et al., 2006). Overall, the species richness is the lowest at around 10.5 ka followed by a gradual increase that reaches a maximum at ∼2.5 ka (Berglund et al., 2008b).
We aim to complement the terrestrial pollen records with isotopic and lipid biomarker data from an Arkona Basin sediment record spanning the Holocene. Organic compounds and their isotopic signatures can provide additional constraints on changes in hydrology not easily discernible from pollen assemblages (e.g., they allow for differentiation between ice melt and precipitation as a water source). Biomarkers, organic compounds indicative of a particular environmental process or produced exclusively by a particular group of organisms, are widely used organic geochemical tools that provide a wealth of paleoclimatic information. An overview of common proxies and the parameters they reflect can be found in Table 1. Historically, geochemists have made use of isotope measurements of bulk sediments or biomass, which present a general overview of a given system (e.g., Leng and Lewis, 2017). Compound-specific carbon isotope ratios (δ13C, the ratio of in a sample relative to a standard, Vienna Pee Dee Belemnite, a.k.a. VPDB) of organic molecules give insight into sources of organic matter (e.g., terrestrial versus marine; Meyers, 1994) and atmospheric CO2 conditions (e.g., Freeman and Hayes, 1992). Compound-specific hydrogen isotope ratios (δ2H, the ratio of in a sample relative to a standard, Vienna Standard Mean Ocean Water, a.k.a. VSMOW) of lipids permit further understanding of compound biosynthesis and environmental conditions, such as precipitation and salinity (e.g., Sachse, Billault et al., 2012). These two elemental signatures are widely applied to study past environmental change across the planet and throughout the geologic record (e.g., Tipple and Pagani, 2010; Schefuß et al., 2011; Sinninghe Damsté et al., 2011). Straight-chain hydrocarbons, such as n-alkanes, are especially resistant to degradation and alteration over geological timescales and are found as far back as the Precambrian (McKirdy and Hahn, 1982; Gordadze et al., 2017). In addition to being relatively recalcitrant, n-alkanes are ideal biomarkers for a C and H isotope approach because they contain non-exchangeable C and H and are synthesized by a variety of organisms from bacteria to higher plants (e.g., Hemingway et al., 2016). Generally, long-chain n-alkanes are found in the protective wax layer of leaves from terrestrial higher plants (Eglinton and Hamilton, 1967), and the C isotopic compositions of n-alkanes from these plants can differ by up to 20 ‰ depending on metabolism (C3, C4, crassulacean acid metabolism, a.k.a. CAM; see Diefendorf and Freimuth, 2017 for review). Mid-chain n-alkanes (C23 and C25) are mainly produced by submerged macrophytes in freshwater and marine environments (Ficken et al., 2000) and have characteristic C and H signatures indicative of their aquatic origins (Aichner et al., 2010, 2017). H isotopes of n-alkanes longer than C21 reflect plant growth water at the time of leaf formation, making them useful for paleohydrology studies (e.g., Sternberg, 1988; Sachse et al., 2012; McFarlin et al., 2019). Shorter-chain n-alkanes (<C21) are principally produced by phytoplankton and bacteria (Meyers and Ishiwatari, 1993; Zhang and Sachs, 2007), and their H isotopic composition also correlates strongly with growth water (Sachse et al., 2004). Moreover, n-alkanes can be transported to sediments as aerosolized particles that are deposited directly in coastal waters and lakes or transported by rivers (Schefuss et al., 2005). The spatial coverage of this atmospheric transfer is dependent upon climate conditions and density of vegetation, but n-alkanes are generally deposited within weeks after being aerosolized (e.g., Nelson et al., 2018), making them ideal for paleoenvironmental reconstructions.
Table 1Summary of the proxies applied in this study, how they are used as paleoclimate indicators, and their source(s).

In addition to n-alkanes, other lipid biomarkers – such as glycerol dialkyl glycerol tetraethers (GDGTs) and long-chain diols (LCDs) – can provide information about the environmental conditions under which they were produced. An abundance of branched GDGTs (brGDGTs) reflects bacterial communities – believed to be Acidobacteria – in soils (Weijers et al., 2007, 2009; Sinninghe Damsté et al., 2018) and thus should be representative of terrestrial input at aquatic sites. However, aquatic in situ production complicates the strictly terrestrial interpretation of brGDGTs (De Jonge et al., 2014, 2015). Luckily, the process is characterized by a number of indices that distinguish between allochthonous and autochthonous production (Hopmans et al., 2004; Sinninghe Damsté, 2016; Xiao et al., 2016; Martin et al., 2020). LCDs are synthesized by both marine and freshwater phototrophic organisms (Volkman et al., 1992) and have been used to trace freshwater input into coastal environments using one isomer, the C32 1,15-diol (Lattaud et al., 2017). LCDs are also used to reconstruct sea surface temperature via the long-chain diol index (LDI, Rampen et al., 2012; de Bar et al., 2020). In addition, the presence of 1,14- and 1,12-diols are characteristic of diatom abundance, more precisely of the presence of Proboscia spp. (de Bar et al., 2020; Rampen et al., 2007, 2014). The presence of Proboscia diatoms has been shown to hinder LDI temperature reconstructions due to their contribution to the pool of 1,13-diols used in the index (de Bar et al., 2020). At a minimum, pairing brGDGT with LCD data can contribute to understanding of complex riverine transport of organic matter and soil erosion in a given location (Lattaud et al., 2017) and can help reconstruct sea surface temperature in some environments.
Recently, attempts to understand the complex salinity history of the Baltic Sea using H isotope values of long-chain alkenones highlighted hydrological shifts that did not coincide with a change in the Haptophyte population in the Early Holocene (Weiss et al., 2020). Long-chain alkenones are a species-specific biomarker produced by haptophyte algae that have been widely used to discern changes in sea surface temperature and salinity (e.g., Brassell et al., 1986; Weiss et al., 2019). This observation, in conjunction with previous studies of Baltic Sea climate history, serves as the basis for the present investigation, which aims to compare information gathered from a variety of lipid biomarkers in order to delineate regional effects of large-scale hydrological changes. We compare the biomarker data generated here with pollen records from regional lakes in Sweden and Finland (Fig. 1).
Expedition 64PE410 aboard the RV Pelagia retrieved a 12 m long piston core (10 cm in diameter) from the Arkona Basin (64PE410_S7, 54∘55.208 N, 13∘29.992 E, Fig. 1) in 2016 to study the climate history of the marginal marine environment of the Baltic Sea. The Arkona Basin (water depth ∼45 m) is situated in the western part of the Baltic Sea, where saline North Sea water enters into the basin (Fig. 1). The geochemical composition of the core was analyzed by X-ray fluorescence (XRF) using an Avaatech XRF core scanner with a 100 W rhodium X-ray tube and a Rayspec cubed SiriusSD silicon drift detector. Continuous measurement of core sections was conducted at 1 cm resolution. The spectral data were processed using bAxil spectrum analysis software to determine the element intensities in counts.
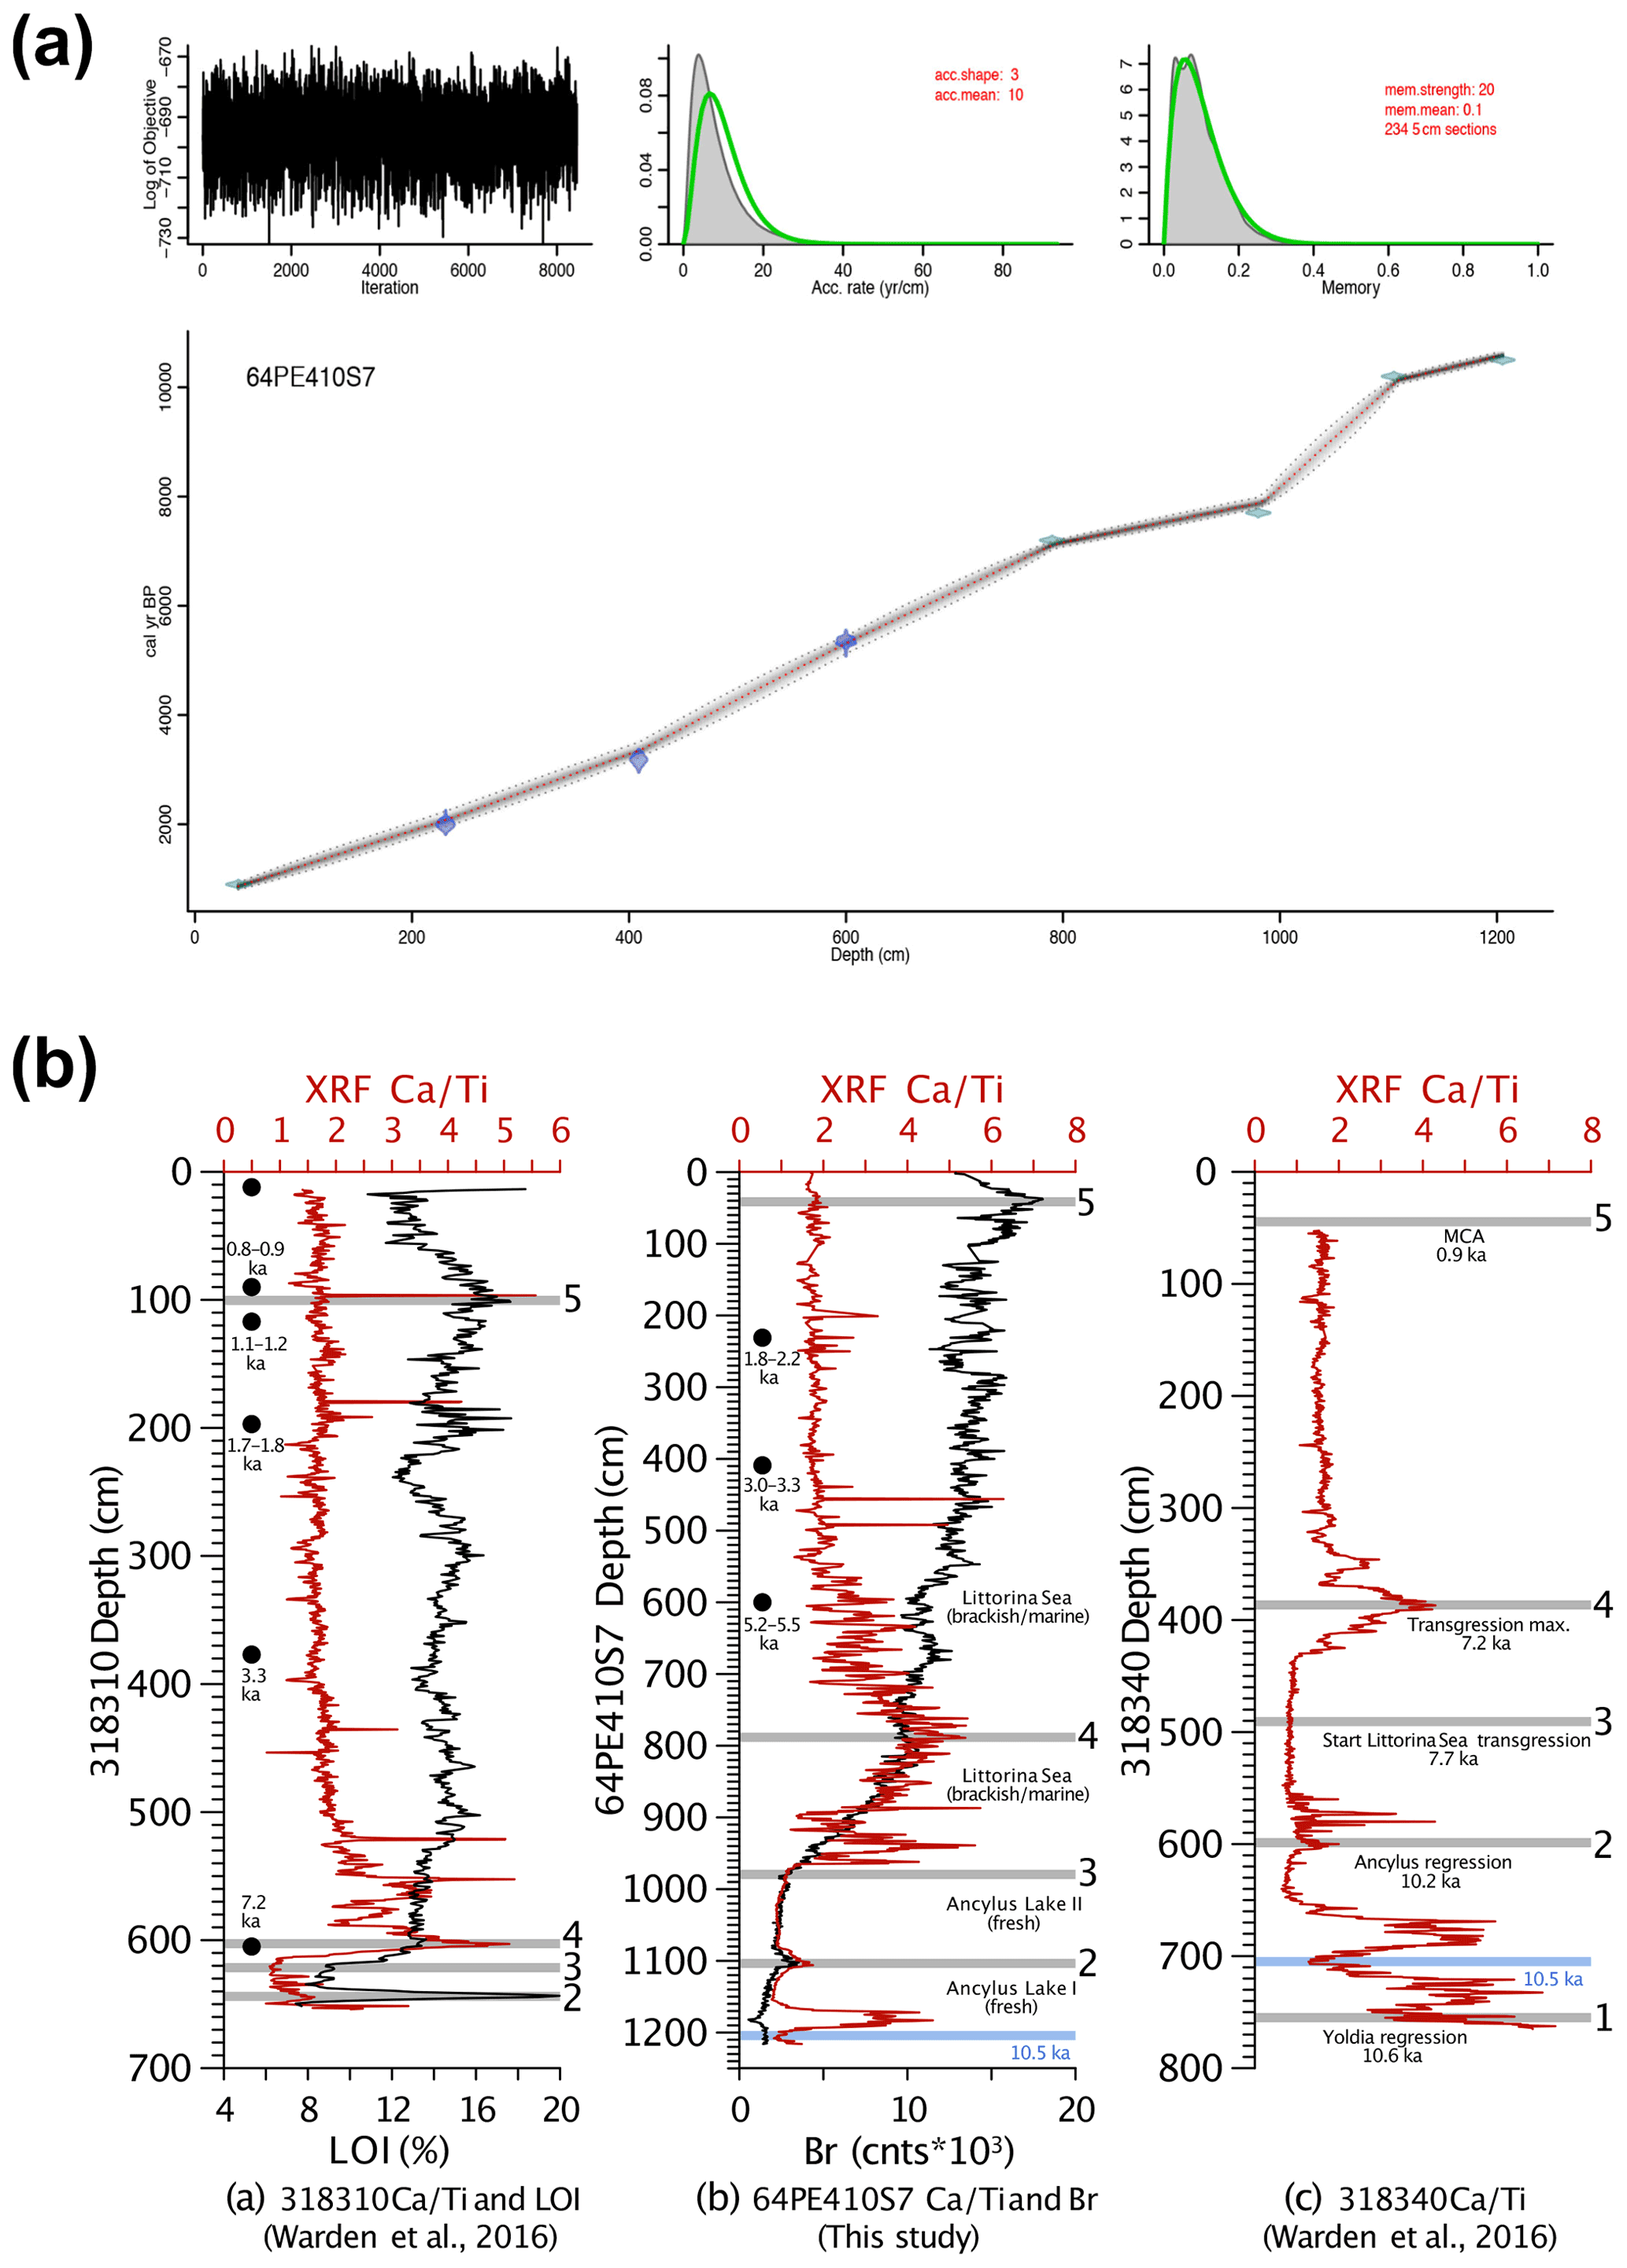
Figure 2(a) The age–depth model generated by the Bacon R package in R (Blaauw and Christen, 2011). (b) Correlation between core 64PE410-S7 and nearby cores from Warden et al. (2016) using XRF CaTi ratios and Br counts. Black dots represent 14C dates. Five tie points between the three cores are shown by the grey lines and are as follows: (1) the boundary between the Yoldia Sea and Ancylus Lake at 10.6 ka, (2) the Ancylus Lake regression at 10.2 ka, (3) the start of the marine transgression between the Ancylus Lake and Littorina Sea phases, (4) the transgression maximum at 7.2 ka, and (5) the Medieval Climate Anomaly at 0.9 ka. A minimum CaTi ratio between both 64PE410-S7 and 318 340 serves as an additional tie point between these two cores and is denoted by the blue line at 10.5 ka.
The age model (Fig. 2) was created by combining 14C ages of mollusk shells and correlation of CaTi and Br records with two nearby cores (318 310: 54∘50.34′ N, 13∘32.03′ E; 318 340: 54∘55.77′ N, 13∘41.44′ E, Warden et al., 2016, Fig. 1). Bromine, a good indicator of marine organic carbon (Ziegler et al., 2008), was correlated with the total organic carbon content determined by loss on ignition (LOI) in core 318 310 (Warden et al., 2016). Five shifts in Arkona Basin sediments are clearly distinguishable in the carbonate (CaTi) and organic matter (Br and LOI) contents of the two sediment cores from Warden et al. (2016) and described in detail in Weiss et al. (2020). Three mollusk shells were radiocarbon dated by Beta Analytic to improve age control for the interval younger than 7 ka. Radiocarbon ages were corrected for the local reservoir effects (reservoir age = 376 years, Lougheed et al., 2013) and calibrated using CALIB (Stuiver et al., 2021). The final age model for all depths was created using the Bacon software package in R (Blaauw and Christen, 2011). Error estimates for 14C ages were also used for the XRF tie points (as these are based on correlation to the nearby 14C dated cores). In Bacon, student's t-test values were set to 33 and 34 to allow for more narrow error estimates as suggested in the Bacon manual.
2.1 Bulk isotope analyses
Samples of bulk sediment were taken every 100 cm at the top of the core and every 10 cm after 930 cm and freeze-dried prior to analyses. An aliquot of 10 to 15 mg of freeze-dried sediment was sampled for total organic carbon (TOC), total nitrogen (TN), and bulk carbon (δ13C) and nitrogen (δ15N) isotope composition. Aliquots were acidified with 2M hydrochloric acid and rinsed with deionized water to remove carbonates and salts. The isotopic composition and elemental weight percentage of bulk organic matter were measured with an elemental analyzer (EA, Thermo Scientific Flash 2000) coupled to an isotope ratio mass spectrometer (Delta V IRMS, Thermo Scientific).
2.2 Lipids
Samples for lipid analyses were taken at 100 cm intervals at the top of the core and every 10 cm after 930 cm to aim for a high resolution of the marine transgression and extracted as described in Weiss et al. (2020). Briefly, freeze-dried sediment samples (11–17 g) were extracted via an accelerated solvent extractor (ASE 350, Dionex, Thermo-Scientific, Sunnyvale, CA, USA) with dichloromethane (DCM) : methanol (MeOH) 9:1 (). Internal standards – C46 GDGT (Huguet et al., 2006) C22 7,16-diol, C19 ketone, and C36 n-alkane – were added to all total lipid extracts. The extracts were dried under a stream of N2 and separated over an aluminum oxide column (activated for 3 h at 150 ∘C). An apolar fraction (containing n-alkanes) was eluted with four column volumes of hexane : DCM 9:1 (), a ketone fraction with three column volumes of hexane : DCM 1:1 (), and the polar fraction (containing glycerol dialkyl glycerol tetraethers, GDGTs, and long-chain diols, LCDs) with three column volumes of DCM : MeOH 1:1 ().
2.2.1 n-Alkanes
The n-alkanes were quantified based on a known concentration of a C36 n-alkane standard on a HP 7890A gas chromatograph (GC) equipped with a flame ionization detector (FID) and a VF-1 ms capillary column (Agilent, ). The temperature program started with a 1 min hold at 50 ∘C, followed by a 10 ramp to 320 ∘C, and held at 320 ∘C for 5 min. Reported concentrations are normalized to TOC content (ng g).
2.2.2 Long-chain diols (LCDs)
Aliquots of the polar fraction were derivatized using N,O-Bis(trimethylsilyl)trifluoroacetamide (BSTFA) and pyridine (10 µL each) at 60 ∘C for 30 min, after which ethyl acetate was added. Long-chain diols (LCDs) were analyzed following Rampen et al. (2012) by GC (Agilent 7990B GC) coupled to a mass spectrometer (Agilent 5977A MSD; GC-MS) equipped with a fused silica capillary column (Agilent CP Sil-5, ). The temperature program was as follows: started at 70 ∘C, increased to 130 ∘C at 20 , increased to 320 ∘C at 4 , held at 320 ∘C for 25 min. Flow was held constant at 2 mL min−1. The LCDs were identified via single ion monitoring (SIM) of the (C28 1,14-diol), 313.3 (C28 1,13-diol, C30 1,15-diol), 327.3 (C28 1,12-diol, C30 1,14-diol), and 341.3 (C30 1,13-diol, C32 1,15-diol) ions (Versteegh et al., 1997; Rampen et al., 2012; de Bar et al., 2020). LCDs were quantified based on a known concentration of the C22 7,16-diol.
2.2.3 Glycerol dialkyl glycerol tetraethers (GDGTs)
For GDGT analyses, a second aliquot of the polar fraction – at a concentration of 2 mg mL−1 – was dissolved in hexane : isopropanol (IPA) 99:1 () and analyzed using ultra-high-performance liquid chromatography mass spectrometry on an Agilent 1260 UHPLC coupled to a 6130 Agilent MSD following Hopmans et al. (2016). The branched and isoprenoid tetraether (BIT) index (Hopmans et al., 2004) was calculated as follows:
where roman numerals refer to the number of methyl groups attached to the 5 or 5′ positions of the alkyl chain (zero, one, and two, respectively). GDGT concentrations were calculated based on a known concentration of the C46 GDGT standard (Huguet et al., 2006).
The #ringtetra, used to assess the source of brGDGT in the marine water column, where values higher than 0.7 indicate sedimentary in situ production (Sinninghe Damsté, 2016), was also calculated. #ringtetra is defined as follows:
The roman numeral I refers to the number of methyl groups, as indicated for the BIT index. The letters “a”, “b”, and “c” refer to the number of cyclopentane moieties (zero, one, and two, respectively).
2.3 Compound-specific isotope analyses
Compound-specific carbon isotope analyses of n-alkanes (δ13Calkane) were performed in duplicate on a Thermo Trace GC (1310) coupled with a Thermo Delta V plus IRMS at the Climate Geology Department of the ETH Zurich. The GC was equipped with a RTX-200 60 m capillary column (Restek, ). The temperature program was as follows: ramp from 40 to 120 ∘C at 40 , followed by a 6 ramp to 320 ∘C, held at 320 ∘C for 12 min.
Hydrogen isotope ratios of n-alkanes (δ2Halkane) were measured at the Royal Netherlands Institute for Sea Research in duplicate by GC coupled to an IRMS via a high-temperature conversion reactor. The GC was equipped with a CP Sil-5 column (Agilent, ). The temperature program was as follows: started at 70 ∘C, increased to 130 ∘C at 20 , increased to 320 ∘C at 4 , held at 320 ∘C for 10 min. At the start of each day, the H factor was measured and corrected for (Sessions et al., 2001). H values ranged from 4.3 to 4.6. Prior to measurement of samples for both C and H isotopes, a n-alkane mixture (Mix B, supplied by Arnt Schimmelmann, Indiana University) was measured. Sample analyses were only conducted when the average difference and standard deviation between online and offline values was less than 5 ‰ for H and 0.5 ‰ for C. For both C and H isotope measurements, the reported standard error is based on duplicate analyses.
The core covers the last 10.6 kyr with average sedimentation rates between 55 and 250 cm kyr−1 (Weiss et al., 2020). The large variations in sedimentation rates for core 64PE410-S7, and the nearby cores to which it has been correlated, are likely related to changes in the connection between the North Sea and the otherwise shallow Arkona Basin (∼45 m). Bulk isotopes (δ13Cbulk and δ15Nbulk values, as well as TOC and TN content), lipid concentrations, and compound-specific n-alkane isotope analyses were conducted on 22 samples.
3.1 Bulk isotopes
TOC and TN ranged from 0.5 % to 7.2 % and 0.1 % to 0.8 %, respectively, with higher values in the most recent part of the core (Fig. S1 in the Supplement). δ13Cbulk values varied by ∼3 ‰ in the Early Holocene (before 7.7 ka) followed by a small shift after the marine transgression (Fig. S1). δ15Nbulk values were elevated at the transition from the YS to the AL (5.5 ‰ ) followed by a drop to 2.8 ‰ in the early AL phase (10.1 ka). Values reached 4 ‰ during the latter half of the AL, succeeded by a second drop at the marine transgression (2.8 ‰). Values slowly increased during the early LS phase. Values of 4±1 ‰ occurred across the modern Baltic (MB) phase (Fig. S1). Elemental C and N (CN) ratios ranged from 5.6 to 13.4, spanning common values for both marine and terrestrial ecosystems (Thornton and McManus., 1994). CN ratios are plotted against δ13Cbulk values for all samples; a mix of freshwater, marine, and terrestrial C3 plant-derived values are recorded, which are grouped according to established Baltic Sea phases (Fig. 3).
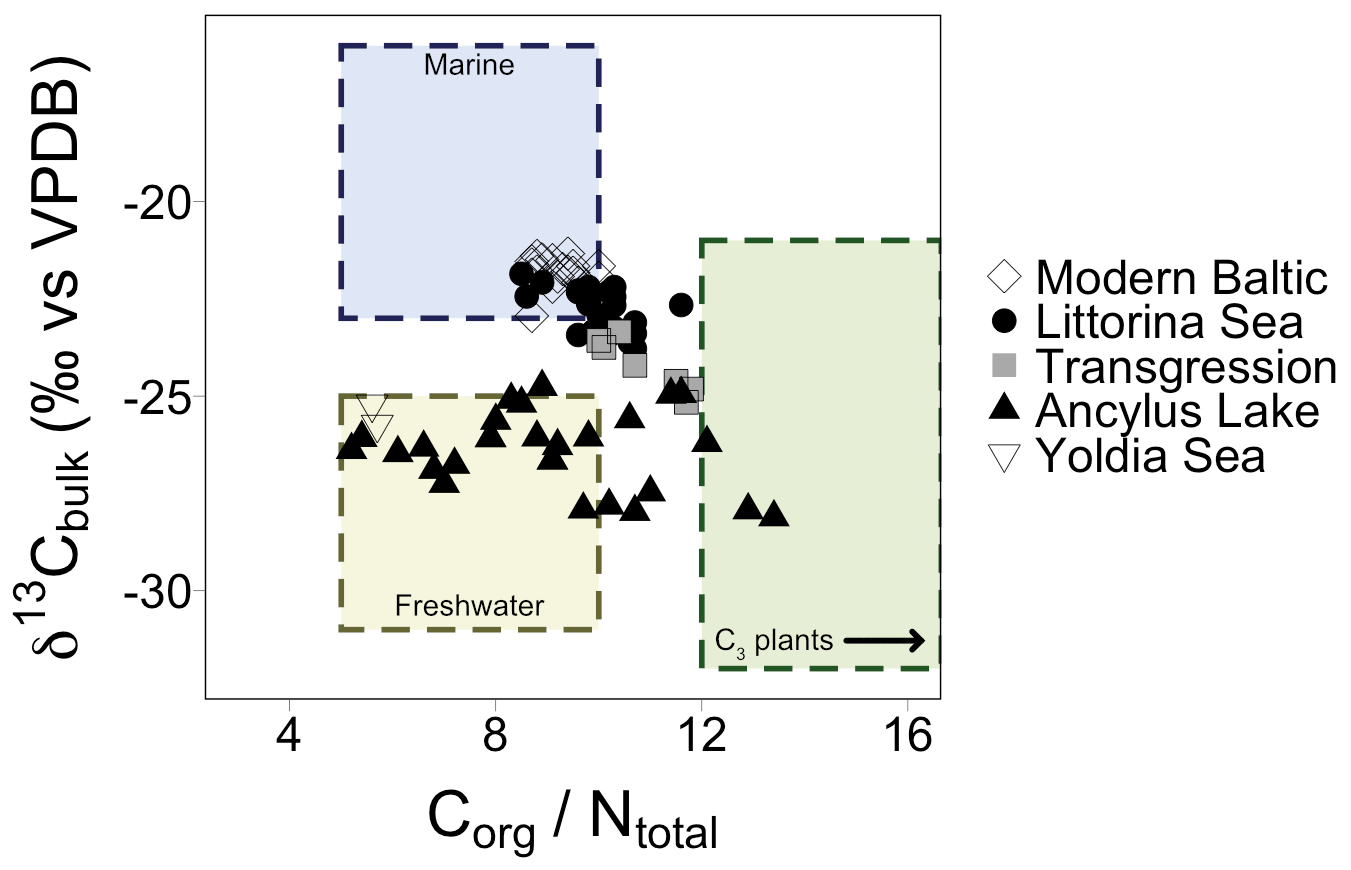
Figure 3Elemental CN ratios plotted against δ13C values of bulk sediment. Shapes correspond to different Baltic Sea phases and align with a mix of values corresponding to marine, freshwater, and C3 plant signatures. The arrow in the C3 plants box indicates that values for C3 plants encompass a wider range of values which are excluded from this plot for clarity.
3.2 n-Alkane distributions and isotopic composition
Organic carbon-normalized concentrations of n-alkanes (C21 to C35) were highest in the older part of the record (2.8 at 10.6 ka, Fig. 4), followed by a decrease until 9.4 ka (with a notably low concentration at 10.2 ka). The relative abundance of n-alkane homologues is comparatively unchanged across the remainder of the record (Fig. 4), except for a slight increase in the abundance of the C21 n-alkane following the marine transgression and absence or low abundance of the C17 n-alkane during the AL. The most abundant n-alkane is the C29 (21±4 %, n=23), followed by the C27 (19±2 %, n=23), C25 (16±3 %, n=23) and C31 (16±3 %, n=23), suggesting a primarily terrestrial signal. C and H isotope values are plotted as weighted averages of short-chain (C21), mid-chain (C23 to C25), and long-chain (C27 to C31) n-alkanes. Both δ13Calkane and δ2Halkane values captured substantial fluctuations during the early part of the record (before ca. 7.7 ka), but both show relatively stable signals following the marine transgression (Tables S2 and S3; Fig. 5a and b). XRF data for this portion of the core also suggest stable conditions. Weighted-average δ13C values of the mid- and long-chain n-alkanes were similar from 10.6 to 8 ka, after which the mid-chain n-alkanes shifted toward higher values and the long-chain n-alkanes remained similar (Fig. 5). The LEaf-Wax Isotopic Spread (LEWIS) index reflects changes in plant species diversity (Magill et al., 2019) and is calculated as follows:
Values varied from 2.0±0.7 ‰ between 11–7.7 ka to 6.7±1.4 ‰ between 7.3–1.3 ka (Fig. 5c). H isotope values of short-, mid-, and long-chain n-alkanes tracked the same trends across the record. The δ2H values of all n-alkanes were higher in the oldest part of the record (YS, prior to 10.6 ka) and recorded a rapid decrease of ∼50 ‰ at the onset of the AL phase (Fig. 5b). Subsequently, a second, considerable increase of ∼50 ‰ occurred between 10 and 9.2 ka, succeeded by a gradual decrease lasting until the marine transgression at 7.7 ka. δ2H values showed higher values across the marine transgression. Data are limited for the LS phase, but no large isotopic shifts were noted in the samples analyzed here.
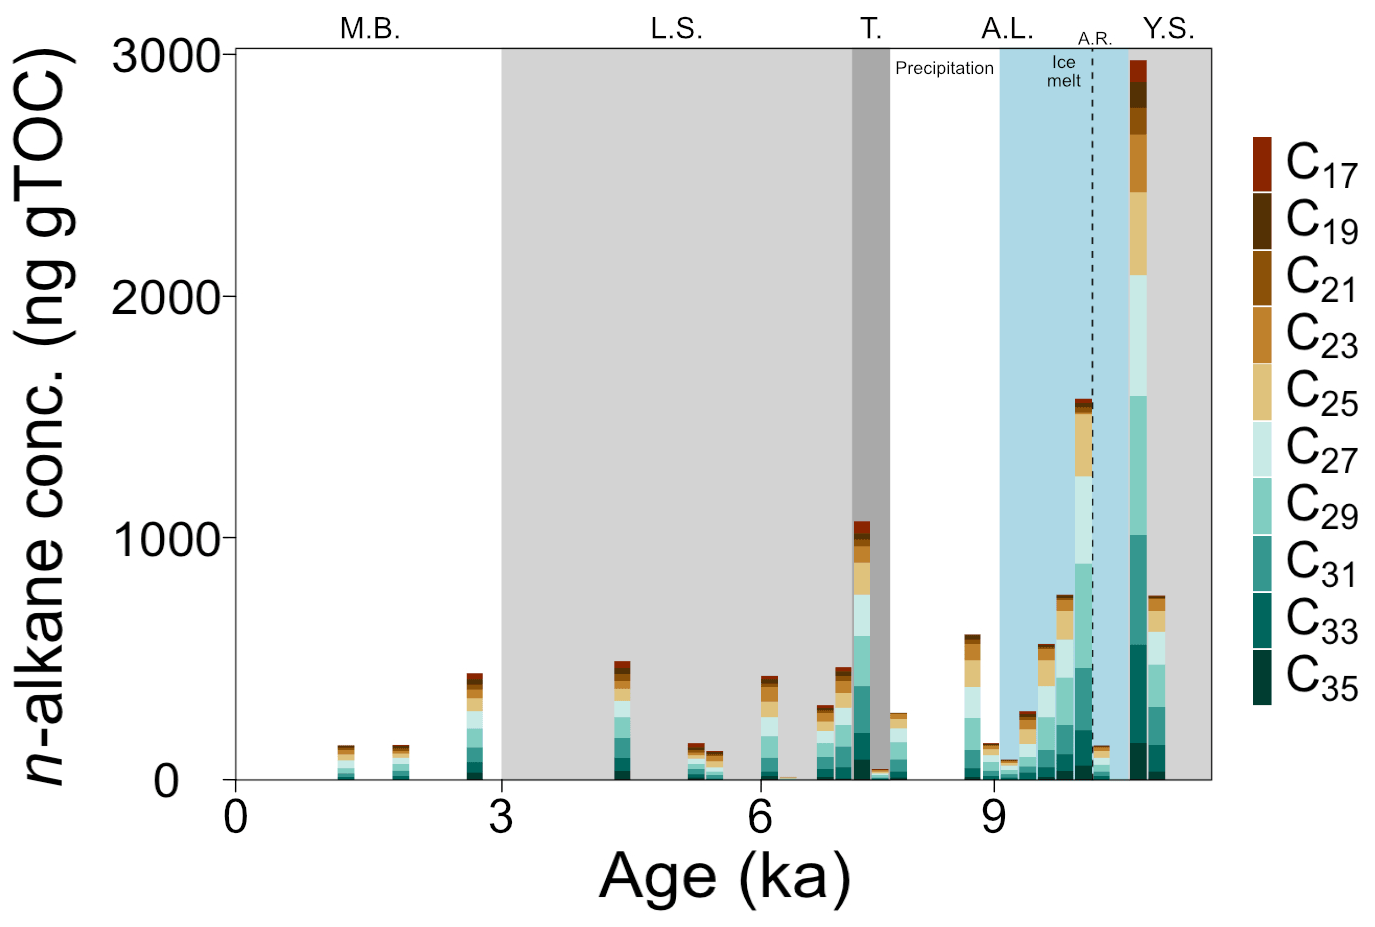
Figure 4TOC weighted concentrations of C17–C35 n-alkanes in core 64PE410_S7 (n=22). Concentrations were highest in the Yoldia Sea brackish phase and lowest in the modern Baltic. Phases are abbreviated as follows: Y.S.: Yoldia Sea, A.L.: Ancylus Lake, T.: marine transgression, L.S.: Littorina Sea, M.B.: modern Baltic, A.R.: Arkona Regression. New subdivisions for the AL phase showing the shift from ice-melt-derived to precipitation-dominated source water are shown in blue and white.
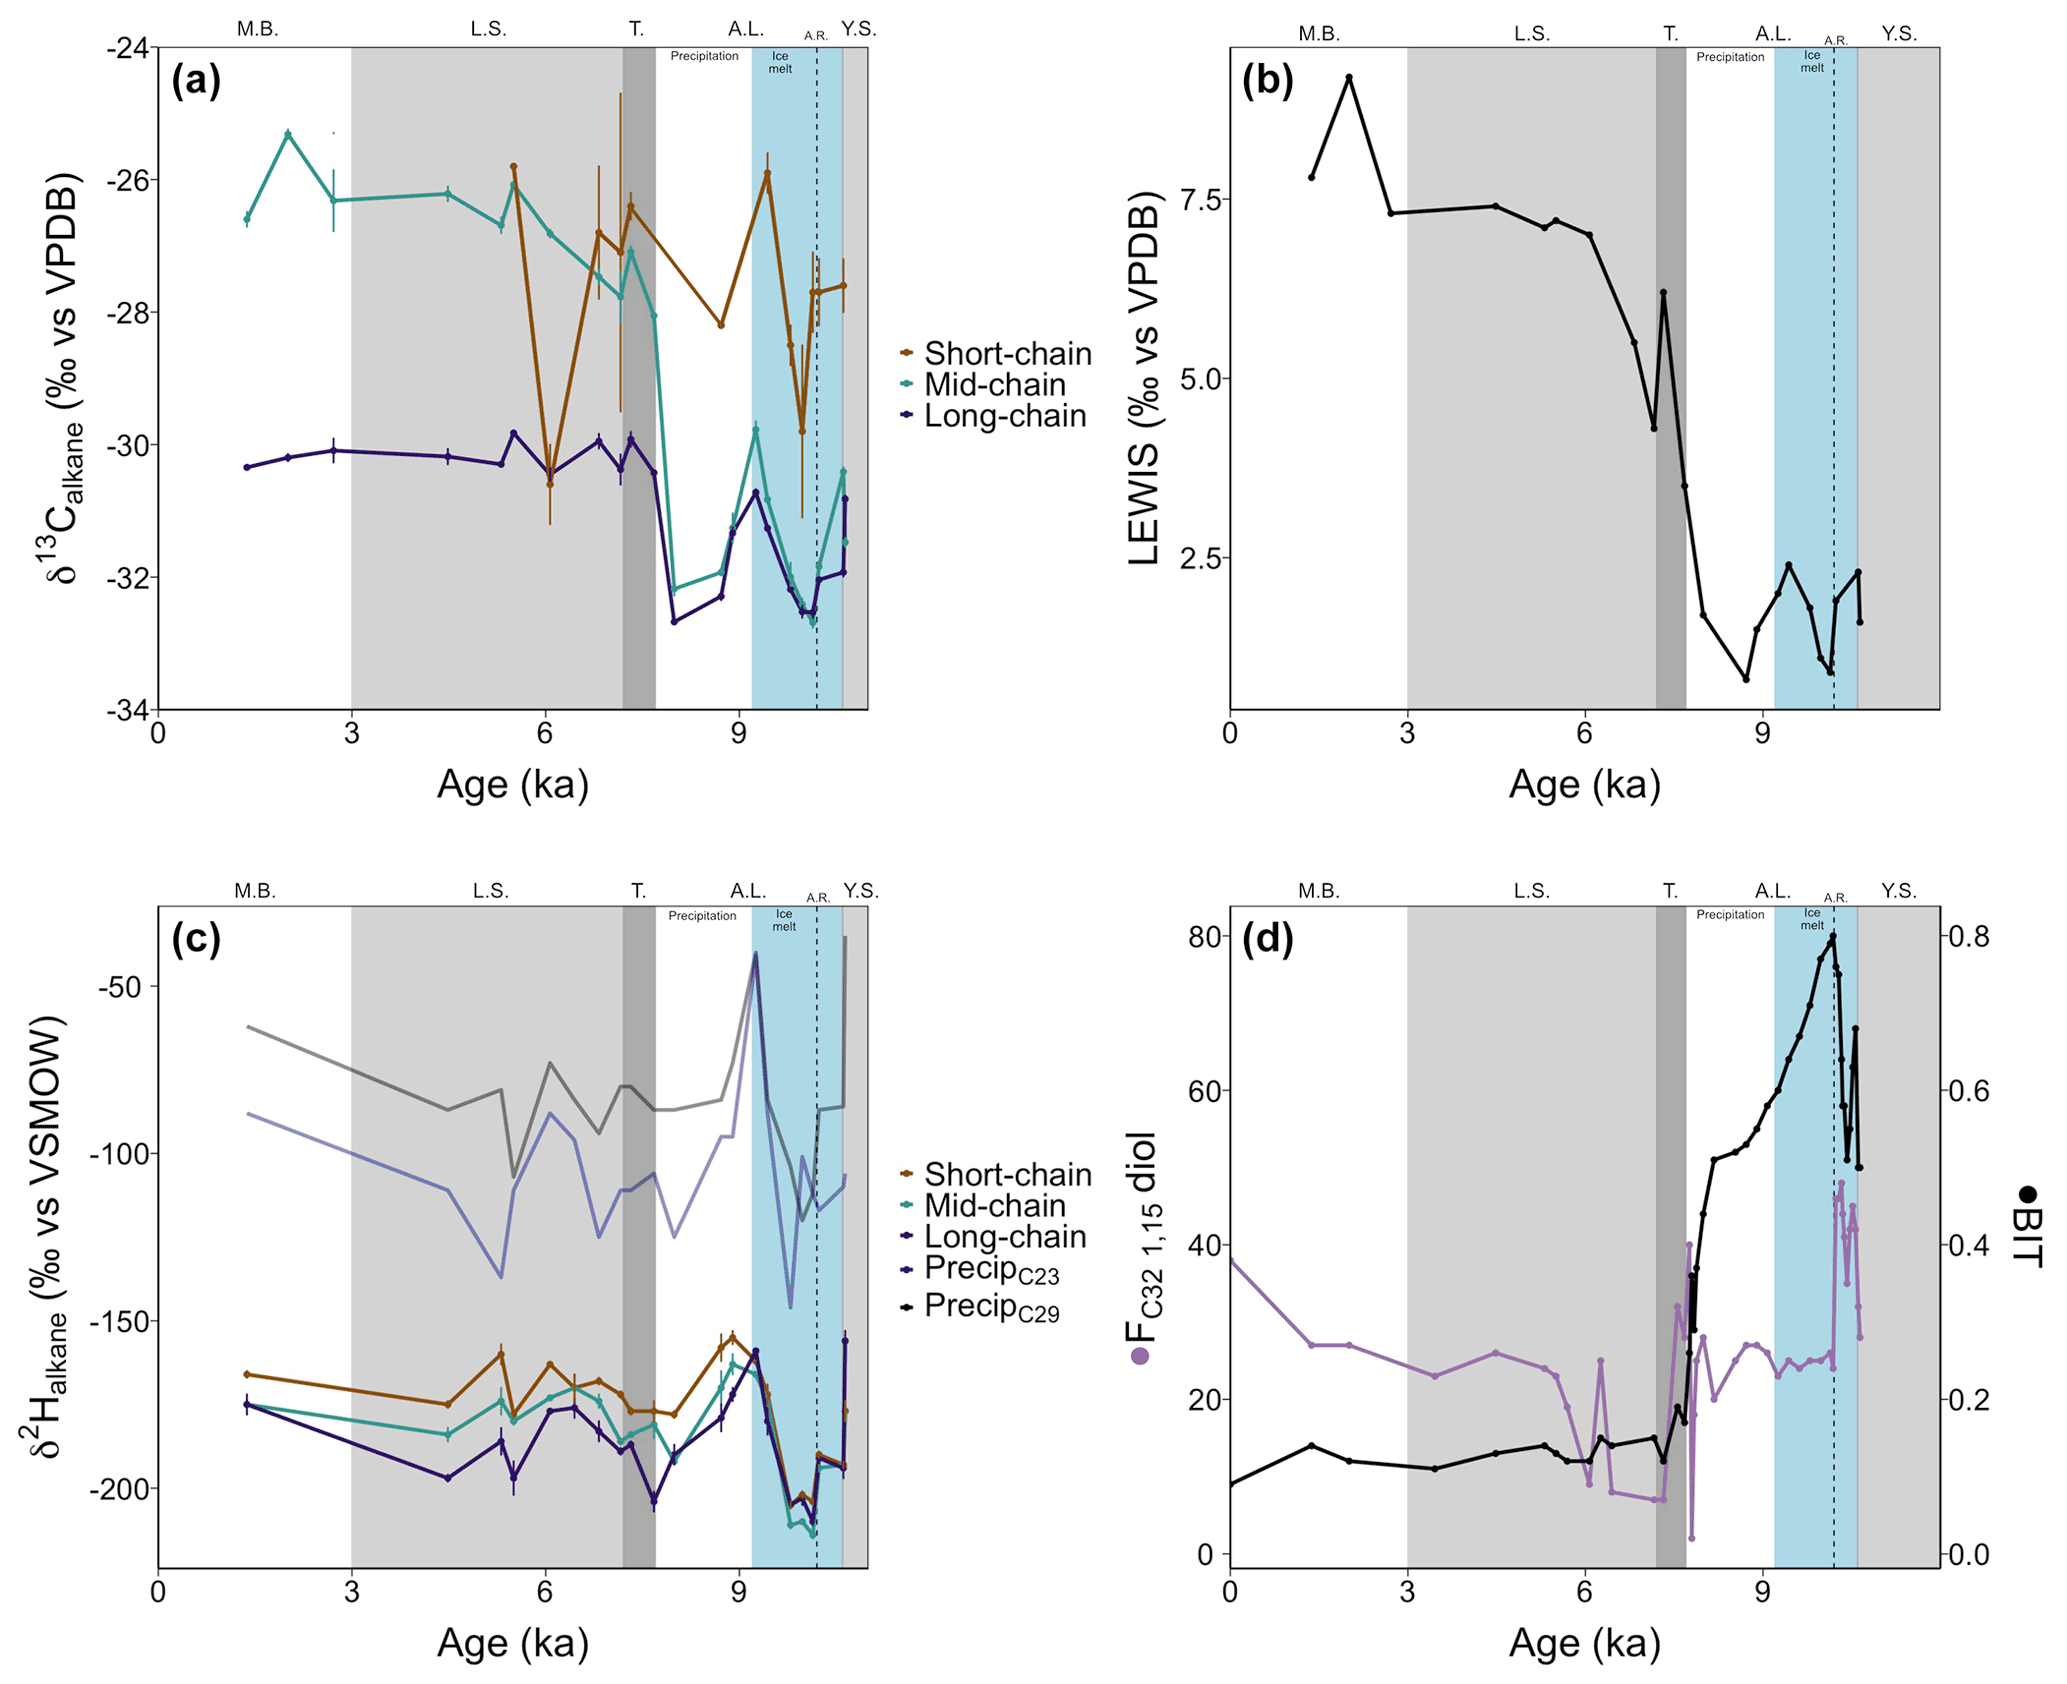
Figure 5(a) Carbon isotope ratios of short-chain (C21), mid-chain (C23–C25), and long-chain (C27–C31) n-alkanes from core 64PE410_S7. (b) Hydrogen isotope ratios of short-chain, mid-chain, and long-chain C21–C33 n-alkanes from core 64PE410_S7. Blue and black lines represent reconstructed δ2H values of precipitation from linear models of McFarlin et al. (2019) using δ2H values of C23 and C29 n-alkanes. (c) The LEaf-Wax Isotopic Spread (LEWIS) index (Magill et al., 2019) shows a marked increase from the end of the Ancylus Lake phase into the modern Baltic indicating increased species diversity in the younger half of the record. (d) Fractional abundance of C32 1,15-diol (FC32 1,15-diol, de Bar et al., 2016; Lattaud et al., 2017) and BIT index (Hopmans et al., 2004) for core 64PE410_S7, indicators of riverine and terrestrial runoff into the basin, suggest the highest terrestrial input occurred during the Ancylus Lake phase and decreased thereafter. Phase boundaries are indicated as well as a regional climate event at 10.2 ka (A.R.: Ancylus Regression) and new subdivisions for the A.L. phase are shown in blue and white.
3.3 Abundance of LCDs and BIT index
Low concentrations of LCDs were detected in a majority of samples prior to the marine transgression. Furthermore, no 1,12-diols were detected before the MB phase indicating limited input from Proboscia diatoms (de Bar et al., 2020). The C28 1,12- and C28 1,14-diols were present during the MB phase (in relatively high amounts for the C28 1,14-diol). For all other LCDs, the main change in abundance (relative to all LCDs) occurred at 7.9 ka with a drop in the fractional abundance of the C32 1,15 diol (FC32 1,15-diol, from 20 % to 1 %) and an increase in FC30 1,15-diol (from 30 % to 80 %). LDI-temperature reconstructions (Table S1 in the Supplement) were similar to those of Kotthoff et al. (2017) with relatively high temperatures during the YS (18.5±0.2 ∘C) and a decrease during the AL (11.5±2.4 ∘C). Maximum temperatures occurred during the LS phase, in agreement with the Holocene thermal maximum in Europe (21.5±1.5 ∘C, 24 ∘C at 7.2 ka). Temperatures during the MB were similar to modern summer temperatures (17.2±0.1 ∘C). The coldest period (AL) is also the period with the highest proportion of C32 1,15-diol. However, as noted by De Bar et al. (2020) and Kotthoff et al. (2017), the absolute LDI-reconstructed temperatures are likely affected by the shifts between freshwater and marine environments that impact the composition of diol-producers (e.g., an increase in diol-producing diatoms at higher salinities or freshwater diol-producers at lower salinities) and should be taken with caution. For this reason, we use the LCDs primarily as indicators of continental runoff into the basin rather than for absolute temperature reconstructions.
The distribution of brGDGTs changed drastically across phases (Fig. S2 in the Supplement) with a distribution similar to soils for all phases except the AL, which suggests mixing between lacustrine and terrestrial brGDGTs. BIT values were higher in the older part of the record (0.8 before 9.9 ka) and then continuously decreased to 0.1 by 6.5 ka. Similar BIT values were calculated for all LS samples (Fig. 5d). #ringtetra was lower than 0.7 before the transgression (0.5±0.1). A rapid increase occurred at the transgression (∼7.7 ka), and values remained consistently high afterwards (0.7±0.1, Table S2 in the Supplement). Due to the high BIT values in the older part of the record, as well as the high #ringtetra after 7.7 ka, temperature reconstructions using the TEX86 index are unreliable (Sinninghe Damsté, 2016).
Compilation of biomarker distributions with corresponding n-alkane C and H isotope compositions provide new insights into changes in the regional hydrology and vegetation in the western Baltic region throughout the Holocene. Isotope and biomarker data are discussed below by Baltic Sea phases.
4.1 Yoldia Sea (11–10.6 ka)
The record covers only a brief snapshot of the end of the YS phase, a period in Baltic Sea history thought to have higher salinity because of the presence of marine phytoplankton species (Sohlenius et al., 1996). The appearance of short-chain C17–C21 n-alkanes is suggestive of aquatic in situ production as the C17 n-alkane in particular is produced by algae (Gelpi et al., 1970; Meyers and Ishiwatari, 1993). The only LCDs present are the C30 1,13-, C30 1,15-, and the C32 1,15-diols. The C32 1,15-diol, produced by eustigmatophyte species in rivers and stagnant freshwater pools (e.g., Lattaud et al., 2017; Balzano et al., 2018), implies low salinity to freshwater conditions. LDI values suggest high SST (the warmest of the record, n=2), similar to modern summer SST, which is in agreement with previous studies (Borzenkova et al., 2015; Kotthoff et al., 2017). Corresponding δ13Cbulk values versus CN ratios for this phase fall just on the edge of values common for freshwater ecosystems (Fig. 3) and, along with the C32 1,15-diol, suggest that salinity of the basin may have already significantly declined by the end of the YS phase. This aligns with other records that divide the YS into two parts: an early marine phase followed by a freshwater phase (e.g., Sohlenius et al., 1996). The highest n-alkane concentrations of the whole record, together with highest δ2Halkane values, occur just at the phase boundary (Figs. 4 and 5b). The increase in δ2Halkane values varies from around 12 ‰ (C21 and C23 n-alkanes) to 47 ‰ (C29 n-alkane) and may be linked to regional climate conditions – like regional warming that caused ice melt and continental uplift – which drove the shift from the YS phase into the low-salinity AL phase.
4.2 Ancylus Lake (10.6–7.7 ka)
The AL phase, from 10.6 to 7.7 ka, was the most dynamic of the whole record and includes a number of large isotopic shifts. C isotope compositions of mid- and long-chain n-alkanes follow similar trends during the AL. A series of C and H isotope fluctuations were recorded during this phase which can be linked to changes in regional hydrology and vegetation discussed in detail below.
4.2.1 Hydrology
At 10.2 ka, Moros et al. (2002) suggest that a large regression occurred, a likely consequence of continental uplift that resulted in shallowing and freshening of the basin. Low concentrations of n-alkanes (∼150 ng g, Fig. 4) occurred at the AL regression, implying less continental runoff into the Arkona Basin at this time. Simultaneously, there was a 15 ‰–20 ‰ increase in δ2Halkane values (Fig. 5b). Increased δ2H values are common when evaporation exceeds precipitation (Craig and Gordon, 1965). Such evaporative conditions may have occurred when the basin was more restricted, as precipitation is thought to be low at this time (Dahl and Nesje, 1996; Seppä and Birks, 2001; Hammarlund et al., 2003). Following the Ancylus Regression, δ2Halkane values become lower, coincident with a rapid, order-of-magnitude increase in concentration of n-alkanes (Figs. 4 and 5b). The SIS was retreating at this time (Muschitiello et al., 2015; Cuzzone et al., 2016); thus it is plausible that a meltwater pulse transported a higher concentration of n-alkanes from the north into the basin just after 10.2 ka. Additionally, the availability of meltwater for plant growth during this period can explain the large change to lower δ2Halkane values. A coincident increase in the BIT index from 0.5 to 0.8 (Fig. 5d) and #ringtetra values below 0.7 (suggesting a lack of in situ production, Sinninghe Damsté, 2016) strengthen the argument for increased input of allochthonous material into the basin. The higher proportion of GDGT-III (Table S2) is indicative of combined in situ brGDGT production and permafrost or soil erosion (Russell et al., 2018; Warden et al., 2018; Kusch et al., 2019), likely the latter in this case. No major changes appear to have occurred in the water column, but progressive melting of the SIS likely transported soil (terrestrial) brGDGTs resulting in the increased BIT index values. Furthermore, a peak in FC32 1,15-diol to around 50 % signals increased freshwater runoff (or a decrease in other diols) as the C32 1,15-diol originates from the low flow area of freshwater systems (ponds and lakes; Lattaud et al., 2018; Häggi et al., 2019). The high abundance of C32 1,15-diol hinders the LDI-temperature reconstruction which results in very low SST estimates (11.5±2.4 ∘C, n=25), while pollen data indicate a steep warming in air and water temperature (Borzenkova et al., 2015). The combined increase in n-alkane concentrations, BIT index, and FC32 1,15-diol points towards increased runoff from the continent. Additional evidence for increased terrestrial input comes from a concurrent, rapid decrease in δ13Cbulk values (1.5 ‰ ) in parallel with a large increase in CN ratios (+6 %) and high TOC values (+4 %) just after the Ancylus Regression. Altogether, an increase in terrestrial-derived organic matter either from enhanced coastal erosion or riverine input, both resulting from the melting of the SIS, occurred at this time.
A significant increase in δ2Halkane values (∼50 ‰ ) began after 10 ka and peaked at 9.2 ka (Fig. 5b), precisely at the time when a similar increase in δ2H values of haptophyte-derived alkenones from the same core is noted (Weiss et al., 2020). The change in alkenone δ2H values occurred when alkenone distributions were constant, suggesting that environmental factors rather than species-related effects were the cause of the isotopic shift. The H isotope composition of terrestrial plants reflects local meteoric water signals (Sachse et al., 2012) and is thus subject to large fluctuations resulting from variations in the hydrological cycle. H isotope values of precipitation were reconstructed from C23 and C29 n-alkanes using linear models from McFarlin et al. (2019) and range from −125 ‰ to −62 ‰ (residual standard error = 14) and −107 ‰ to −36 ‰ (residual standard error = 15), respectively, across the AL phase (Fig. 5b). The lowest δ2Halkane values – and in turn the lowest δ2H values of reconstructed precipitation – occur immediately preceding the 50 ‰ increase (Fig. 5b). Reconstructed δ2H values of precipitation using the C23 n-alkane (originating from an aquatic source) are lower than those for the C29 n-alkane (originating from terrestrial vegetation), suggesting an influence from an isotopically lighter (more negative) water source affected isotopic signatures of aquatically produced n-alkanes. Model data suggest that the H isotope composition of the SIS was around −310 ‰ (De Boer et al., 2014), and modern mean annual precipitation in the region is −63 ‰ (Bowen and Revenaugh, 2003), highlighting the marked isotopic offset between the two sources. Larger volumes of meltwater from the SIS would result in significantly more negative δ2H values for aquatically derived mid-chain n-alkanes, in line with what is observed here at around 10 ka (Fig. 5b) and also recorded by haptophyte algal biomarkers from the same core (Weiss et al., 2020). The depleted n-alkane values imply that terrestrial plants may have relied more heavily on glacial meltwater as a water source during this period. After 10 ka the decreased influence of meltwater and increase in precipitation in the region (Dahl and Nesje, 1996; Seppä and Birks, 2001; Hammarlund et al., 2003) likely caused the dominant water source for aquatic and terrestrial plants to become isotopically heavier, resulting in increased n-alkane H isotope values.
Based on these interpretations, we suggest division of the AL into two parts to highlight the dynamic nature of the phase: an earlier ice melt subphase followed by a precipitation-driven subphase. The ice-melt subphase is the older portion of the AL, from 10.6 to 9.2 ka, where the SIS provided glacial meltwater as an isotopically light water source. After 9.2 ka, precipitation became the dominant, isotopically heavier water source resulting in higher H isotope values preserved in organic compounds.
4.2.2 Vegetation
The n-alkane distributions and C isotope signatures imply largely terrestrial, higher plant input during the AL, supported by the absence of the aquatically produced C17 n-alkane during most of this phase (Fig. 4). The LEWIS index values are the lowest of the record (Fig. 5c), suggesting limited or low species diversity (Magill et al., 2019). This is supported by nearby pollen records that indicate an absence of higher plant diversification, likely due to the relatively cold temperatures in northern Europe at this time (Seppä and Birks, 2001; Seppä et al., 2005; Antonssson et al., 2006; Berglund et al., 2008a, b). In contrast, the δ13C values of C21 n-alkane were higher compared with the longer-chain (>C27) n-alkanes (−29 versus −21 ‰ before 7.8 ka), suggestive of mixed terrestrial and aquatic production or increased aquatic productivity (Ficken et al., 2000).
C isotope values of all n-alkanes record a decrease at the time of the AL regression, and LEWIS index values are low, indicating particularly low species diversity. CN values of bulk sediments suggest a stronger C3 plant signal at this time implying terrestrial plants were the dominant producers of n-alkanes. Following the Ancylus Regression, there were two shifts in mid- and long-chain n-alkane C isotope signatures: an increase (+2 ‰ ) around 9.2 ka, followed by a return to lower values, and a second increase (again +2 ‰) at the onset of the marine transgression (Fig. 5a). These shifts in δ13Calkane values during the AL phase might reflect the advance and retreat of coniferous cover because conifers, such as Pinus and Juniperus, have higher δ13Calkane values compared to deciduous angiosperm trees (Diefendorf and Freimuth, 2017). Since Pinaceae produce low concentrations of n-alkanes compared to Juniperus (Diefendorf et al., 2011; Lane, 2017), the increases in C isotope values can be tentatively attributed to Juniperus shrub expansion. These isotopic shifts align with the main climatic changes recorded in Swedish and Finnish lakes and note similar vegetation changes (Seppä and Birks, 2001; Seppä et al., 2005; Antonsson and Seppä, 2007; Berglund et al., 2008a, b) but do not always find an increase in gymnosperms at 9.2 ka, which might be the result of low sampling resolution around that time period (Seppä and Birks, 2001; Seppä et al., 2005; Antonssson et al., 2006). A large increase in the angiosperm Alnus (which tends to have lower δ13Calkane values) was observed at 8.7 ka at the time of a decrease in Juniperus cover north of the Baltic Sea (Antonsson and Seppä, 2007), paralleling the return to lower δ13C values before the second C isotope increase.
The low variability in n-alkanes C isotope values suggests limited sources of vegetation until the Marine Transgression. However, the data presented here suggest that expansion of Juniperus began to occur at around 9.2 ka when we detect a shift to a precipitation-dominated hydrological regime. Thus, the meltwater-dominated portion of the AL is characterized by low species diversity and the shift to a precipitation-controlled climate coincided with the start of a transformation in regional vegetation.
4.3 Marine transgression (7.7–7.2 ka)
A large marine transgression re-established the connection between the Baltic Sea and the North Sea at around 7.7 ka. At the onset of the transgression (which lasted from 7.7 to 7.2 ka, Warden et al., 2016), long-chain n-alkane (>C27) concentrations increased and shorter-chain n-alkanes are detected (<C19, Fig. 4), indicating greater input from both terrestrial and algal sources. Regional warming that began prior to the Holocene and caused the SIS to melt (Seppä and Birks, 2001; Seppä et al., 2005; Antonsson and Seppä, 2007) promoted the growth and diversification of terrestrial and aquatic plants. At the start of the transgression, mid- and long-chain n-alkane C isotope values began to diverge (LEWIS index increases, Fig. 5c), with the mid-chain n-alkanes becoming more positive by about 4 ‰ (Fig. 5a). The δ13Calkane values of long-chain n-alkanes showed a C3 higher plant signal ( ‰ ), while the mid-chain n-alkanes were higher ( ‰ ), characteristic of submerged aquatic plants (Ficken et al., 2000). The C21 n-alkane, produced by submerged aquatic plants as well as freshwater and marine phytoplankton, had the highest δ13C values prior to the transgression and decreased by ∼5 ‰ across the transgression, despite the fact that large volumes of saline water entered the basin and the δ13Cbulk values showed increased values. Terrestrial vegetation and freshwater organisms generally have lower C isotope signatures than marine organisms (Fig. 3), so the more negative values noted for the C21 n-alkane might indicate an increase in the abundance of submerged aquatic plants and freshwater phytoplankton rather than the influx of saline water. The organisms producing the C21 n-alkane during this period may have been growing in freshwater pools in the catchment rather than in the Arkona Basin itself. Alternatively, salinity stratification may have occurred during the transgression allowing freshwater phytoplankton to thrive in a less saline surface water layer. An increase in δ2Halkane values also occurred across the transgression (except the δ2H values of the C23 n-alkane, which decreased). The C23 n-alkane is produced by Sphagnum species (Baas et al., 2000; Vonk and Gustafsson, 2009) and thus may be reflecting a different water source than the rest of the n-alkanes. An alternative water source for Sphagnum may be stagnant meltwater ponds or peat bogs, which would have very negative H isotope values. TOC and δ13Cbulk values increased, while CN ratios decreased, likely due to enhanced phytoplankton production (cyanobacterial blooms in particular, Bianchi et al., 2000) and amplified input of organic matter into the sediments from increased erosion and primary production (Sohlenius et al., 2001). The BIT index continued to decrease (Fig. 5d), while #ringtetra increased (>0.7) suggesting a change in the main brGDGT producers from (freshwater) lacustrine production towards (marine) sedimentary pore-water production. The decrease in BIT values at the transgression may be the result of a shift in freshwater versus marine producers rather than a decrease in soil input. A rapid decrease in FC32 1,15-diol occurred from the end of the AL phase into the marine transgression (8.0 to 7.3 ka; Fig. 5d) and is likely linked to a change in the LCD-producing population from freshwater to mixed brackish and marine LCD-producing species – which synthesize the C32 1,15 diol in lower amounts – caused by increased salinity in the basin.
4.4 Littorina Sea and modern Baltic phases (7.2 ka–present)
The marine transgression is followed by the brackish Littorina Sea (LS) phase. The early part of the LS is characterized by variable δ2Halkane and δ13Calkane values (Fig. 5a and b). Multiple studies (e.g., Hammarlund et al., 2003; Seppä et al., 2005; Antonssson et al., 2006; Antonsson and Seppä, 2007) indicate that the period between 8.0 and 4.2 ka was warm, dry, and stable, followed by a period of rapid hydrological changes. This is supported by the LDI-reconstructed summer sea surface temperatures (Table S1), indicating an optimum between 7.3 and 5.3 ka (LS average of 21.5±1.5 ∘C). During the LS, values are comparable with pollen records from southern Sweden (e.g., Seppä et al., 2005) and the LDI record of Kotthoff et al. (2017). In addition, stable #ringtetra, BIT, and FC32 1,15-diol suggest relatively unchanged bacterial communities and river inflow. However, the C and H isotope data indicate instability and diversification in the catchment from the marine transgression until the middle of the LS phase. We note, however, that the rapid hydrological changes evidenced in other records and the variation suggested by isotopic data discussed here likely do not capture the nuances of the time period as a result of low sampling resolution. At the transition from the LS into the modern Baltic phase, the C28 1,14- and C28 1,12-diols, characteristic of Proboscia diatoms (Rampen et al., 2007), are present. This aligns with data from Andrén et al. (2000), which indicated that freshwater diatoms were low throughout the LS phase but were more prominent during the modern Baltic phase. During the MB, LDI-reconstructed SST is lower than during the LS (17.2±0.1 ∘C, n=2) following the regional trend in mean annual air temperature (Berglund et al., 2008a, b; Kotthoff et al., 2017). However, diols from surface sediments analyzed in De Bar et al. (2020) and close by the core analyzed here (54∘53.50′, 13∘24.62′) result in a reconstructed temperature of 12.87 ∘C, higher than the annual average but lower than the summer temperature (which is also seen for the other surface sediments in that study, n=5). This indicates that reconstructing temperature using LDI in the MB may be unreliable, likely due to the influence of diatoms and freshwater input, or that LDI may be reflecting a specific season (e.g., spring).
The Holocene history of the Baltic Sea consisted of variations in regional vegetation and hydrology that were connected to global climate phenomena. The melting of the Scandinavian Ice Sheet caused the Ancylus Lake phase to be particularly dynamic. This time period was characterized by fluctuations in the extent of gymnosperm cover across the newly ice-free landscape and substantial shifts in source water from a significantly light water source primarily from ice melt to an isotopically heavier precipitation-dominated source once the SIS had melted. The change in source water was also observed by a previous study focusing on phytoplankton-derived biomarkers showing that the source water shift affected aquatic microscopic organisms and terrestrial higher plants alike. We suggest that future studies of the Ancylus Lake time period divide the phase into an early ice-melt-derived source water subphase and a later precipitation-dominated subphase. The marine transgression that ended the low-salinity Ancylus Lake phase was accompanied by increased heterogeneity of the terrestrial higher plant population as well as changes in coastal aquatic ecosystems. A large hydrological change and diversification of higher plants were offset from the previously established Baltic Sea phase boundaries based on salinity and eustatic changes. Use of multiple proxies is essential to better understand the complexity of paleoenvironments, and in this case isotopic evidence provided new insights into the hydrological change that occurred during a time period where the conditions in the Baltic Sea are otherwise believed to be stable.
Data for this study can be access through the Royal Netherlands Institute for Sea Research (NIOZ) data repository at https://dataverse.nioz.nl/ (last access: 10 January 2022). The dataset can be directly accessed at the following link: https://doi.org/10.25850/nioz/7b.b.2c (Weiss et al., 2021).
The supplement related to this article is available online at: https://doi.org/10.5194/cp-18-233-2022-supplement.
GMW and JL designed the study, extracted samples, conducted isotopic analyses, and contributed equally to writing of the paper with contributions from all co-authors. MTJvdM and GMW collected the samples. GMW and JL designed the study, extracted samples, conducted isotopic analyses, and contributed equally to the writing of the paper. All authors discussed the data and interpretations presented here. MTJvDM and TIE provided guidance on interpretations and assisted with editing the paper..
The contact author has declared that neither they nor their co-authors have any competing interests.
Publisher's note: Copernicus Publications remains neutral with regard to jurisdictional claims in published maps and institutional affiliations.
We thank Jort Ossebaar and Ronald van Bommel for support with EA-IRMS, GC-MS, and GC-IRMS; Denise Dorhout is thanked for helping with UHPLC analyses. The compound-specific carbon isotope ratios were analyzed at the Climate Geology group of ETH Zurich with help from Stewart Bishop.
This research has been supported by the Nederlandse Organisatie voor Wetenschappelijk Onderzoek (grant no. 019.183EN.002).
This paper was edited by Marit-Solveig Seidenkrantz and reviewed by three anonymous referees.
Aichner, B., Herzschuh, U., and Wilkes, H.: Influence of aquatic macrophytes on the stable carbon isotopic signatures of sedimentary organic matter in lakes on the Tibetan Plateau, Org. Geochem., 41, 706–718, https://doi.org/10.1016/j.orggeochem.2010.02.002, 2010.
Aichner, B., Hilt, S., Périllon, C., Gillefalk, M., and Sachse, D.: Biosynthetic hydrogen isotopic fractionation factors during lipid synthesis in submerged aquatic macrophytes : Effect of groundwater discharge and salinity, Org. Geochem., 113, 10–16, https://doi.org/10.1016/j.orggeochem.2017.07.021, 2017.
Alhonen, P.: The stages of the Baltic Sea as indicated by the diatom stratigraphy, Societas pro Fauna et Flora Fennica, Helsinki – Helsingfors, available at: https://helda.helsinki.fi/bitstream/handle/10138/36720/299944_092_1971.pdf?sequence=1 (last access: 29 January 2022), 1971.
Andrén, E., Andrén, T., and Sohlenius, G.: The Holocene history of the southwestern Baltic Sea as reflected in a sediment core from the Bornholm Basin, Boreas, 29, 233–250, https://doi.org/10.1111/j.1502-3885.2000.tb00981.x, 2000.
Andrén, T., Björck, S., Andrén, E., Conley, D., Zillén, L., and Anjar, J.: The development of the Baltic Sea Basin during the last 130 ka, in: The Baltic Sea Basin, Springer, Berlin, Heidelberg, 75–97, https://doi.org/10.1007/978-3-642-17220-5_4, 2011.
Andrén, T., Barker Jørgensen, B., Cotterill, C., Green, S., and the IODP expedition 347 scientific party: IODP expedition 347: Baltic Sea basin paleoenvironment and biosphere, Sci. Dril., 20, 1–12, https://doi.org/10.5194/sd-20-1-2015, 2015.
Antonsson, K. and Seppä, H.: Holocene temperatures in Bohuslän, southwest Sweden: A quantitative reconstruction from fossil pollen data, Boreas, 36, 400–410, https://doi.org/10.1080/03009480701317421, 2007.
Antonssson, K., Brooks, S. J., Seppä, H., Telford, R. J., and Birks, H. J. B.: Quantitative palaeotemperature records inferred from fossil pollen and chironomid assemblages from Lake Gilltjärnen, northern central Sweden, J. Quaternary Sci., 21, 831–841, https://doi.org/10.1002/jqs.1004, 2006.
Baas, M., Pancost, R., Van Geel, B., and Damste, J. S. S.: A comparative study of lipids in Sphagnum species, Org. Geochem., 31, 535–541, 2000.
Balzano, S., Lattaud, J., Villanueva, L., Rampen, S. W., Brussaard, C. P. D., van Bleijswijk, J., Bale, N., Sinninghe Damsté, J. S., and Schouten, S.: A quest for the biological sources of long chain alkyl diols in the western tropical North Atlantic Ocean, Biogeosciences, 15, 5951–5968, https://doi.org/10.5194/bg-15-5951-2018, 2018.
de Bar, M. W., Dorhout, D. J. C., Hopmans, E. C., Rampen, S. W., Sinninghe Damsté, J. S., and Schouten, S.: Constraints on the application of long chain diol proxies in the Iberian Atlantic margin, Org. Geochem., 101, 184–195, https://doi.org/10.1016/j.orggeochem.2016.09.005, 2016.
de Bar, M. W., Weiss, G., Yildiz, C., Rampen, S. W., Lattaud, J., Bale, N. J., Mienis, F., Brummer, G. J. A., Schulz, H., Rush, D., Kim, J. H., Donner, B., Knies, J., Lückge, A., Stuut, J. B. W., Sinninghe Damsté, J. S., and Schouten, S.: Global temperature calibration of the Long chain Diol Index in marine surface sediments, Org. Geochem., 142, 103983, https://doi.org/10.1016/j.orggeochem.2020.103983, 2020.
Berglund, B. E., Gaillard, M. J., Björkman, L., and Persson, T.: Long-term changes in floristic diversity in southern Sweden: palynological richness, vegetation dynamics and land-use, Veg. Hist. Archaeobot., 17, 573–583, https://doi.org/10.1007/s00334-007-0094-x, 2008a.
Berglund, B. E., Persson, T., and Björkman, L.: Late Quaternary landscape and vegetation diversity in a North European perspective, Quatern. Int., 184, 187–194, https://doi.org/10.1016/j.quaint.2007.09.018, 2008b.
Bianchi, T. S., Engelhaupt, E., Westman, P., Andrén, T., Rolff, C., and Elmgren, R.: Cyanobacterial blooms in the Baltic Sea: Natural or human-induced?, Limnol. Oceanogr., 45, 716–726, https://doi.org/10.4319/lo.2000.45.3.0716, 2000.
Björck, S.: A review of the history of the Baltic Sea, 13.0–8.0 ka BP, Quatern. Int., 27, 19–40, https://doi.org/10.1016/1040-6182(94)00057-C, 1995.
De Boer, B., Lourens, L. J., and Van De Wal, R. S. W.: Persistent 400,000-year variability of antarctic ice volume and the carbon cycle is revealed throughout the plio-pleistocene, Nat. Commun., 5, 1–8, https://doi.org/10.1038/ncomms3999, 2014.
Blaauw, M., and Christen, J. A.: Flexible paleoclimate age-depth models using an autoregressive gamma process, Bayseian Anal., 6, 457–474, https://doi.org/10.1214/ba/1339616472, 2011.
Borzenkova, I, Zorita, E., Borisova, B., Kalniņa, L., Kisielienė, D., Koff, T., Kuznetsov, D., Lemdahl, G., Sapelko, T., Stančikaitė, M., and Subetto, D.: Climate change during the Holocene (Past 12,000 years), in: Second Assessment of Climate Change for the Baltic Sea Basin, Regional Climate Studies, edited by: The BACC II Author Team, Springer, Cham, https://doi.org/10.1007/978-3-319-16006-1_2, 2015.
Bowen, G. J. and Revenaugh, J.: Interpolating the isotopic composition of modern meteoric precipitation, Water Resour. Res., 39, 1–13, https://doi.org/10.1029/2003WR002086, 2003.
Brassell, S. C., Eglinton, G., Marlowe, I. T., Pflaumann, U., and Sarnthein, M.: Molecular stratigraphy: a new tool for climatic assessment, Nature, 320, 129–133, https://doi.org/10.1038/320129a0, 1986.
Craig, H. and Gordon, L. I.: Deuterium and oxygen 18 variations in the ocean and marine atmosphere, in: Stable isotopes in oceanographic studies and paleotemperatures, edited by: Tongiorgi, E., Spoleto, 337 pp., 1965.
Cuzzone, J. K., Clark, P. U., Carlson, A. E., Ullman, D. J., Rinterknecht, V. R., Milne, G. A., Lunkka, J. P., Wohlfarth, B., Marcott, S. A., and Caffee, M.: Final deglaciation of the Scandinavian Ice Sheet and implications for the Holocene global sea-level budget, Earth Planet. Sc. Lett., 448, 34–41, https://doi.org/10.1016/j.epsl.2016.05.019, 2016.
Dahl, S. O. and Nesje, A.: A new approach to calculating Holocene winter precipitation by combining glacier equilibrium-line altitudes and pine-tree limits: A case study from Hardangerjøkulen, central southern Norway, Holocene, 6, 381–398, https://doi.org/10.1177/095968369600600401, 1996.
De Jonge, C., Stadnitskaia, A., Hopmans, E. C., Cherkashov, G., Fedotov, A., and Sinninghe Damsté, J. S.: In situ produced branched glycerol dialkyl glycerol tetraethers in suspended particulate matter from the Yenisei River, Eastern Siberia, Geochim. Cosmochim. Ac., 125, 476–491, https://doi.org/10.1016/j.gca.2013.10.031, 2014.
De Jonge, C., Stadnitskaia, A., Fedotov, A., and Sinninghe Damsté, J. S.: Impact of riverine suspended particulate matter on the branched glycerol dialkyl glycerol tetraether composition of lakes: The outflow of the Selenga River in Lake Baikal (Russia), Org. Geochem., 83–84, 241–252, https://doi.org/10.1016/j.orggeochem.2015.04.004, 2015.
Diefendorf, A. F. and Freimuth, E. J.: Extracting the most from terrestrial plant-derived n-alkyl lipids and their carbon isotopes from the sedimentary record : A review, Org. Geochem., 103, 1–21, https://doi.org/10.1016/j.orggeochem.2016.10.016, 2017.
Diefendorf, A. F., Freeman, K. H., Wing, S. L., and Graham, H. V.: Production of n-alkyl lipids in living plants and implications for the geologic past, Geochim. Cosmochim. Ac., 75, 7472–7485, https://doi.org/10.1016/j.gca.2011.09.028, 2011.
Eglinton, G. and Hamilton, R. J.: Leaf epicuticular waxes, Science, 156, 1322–1335, 1967.
Ficken, K. J., Li, B., Swain, D. L., and Eglinton, G.: An n-alkane proxy for the sedimentary input of submerged/floating freshwater aquatic macrophytes, Org. Geochem., 31, 745–749, https://doi.org/10.1016/S0146-6380(00)00081-4, 2000.
Freeman, K. H. and Hayes, J. M.: Fractionation of carbon isotopes by phytoplankton and estimates of ancient CO2 levels, Global Biogeochem. Cy., 6, 185–198, 1992.
Freimuth, E. J., Diefendorf, A. F., and Lowell, T. V.: Hydrogen isotopes of n-alkanes and n-alkanoic acids as tracers of precipitation in a temperate forest and implications for paleorecords, Geochim. Cosmochim. Ac., 206, 166–183, https://doi.org/10.1016/j.gca.2017.02.027, 2017.
Gelpi, E., Schneider, H., Mann, J., and Oró, J.: Hydrocarbons of geochemical significance in microscopic algae, Phytochemistry, 9, 613–617, https://doi.org/10.1016/S0031-9422(00)85701-5, 1970.
Gordadze, G. N., Kerimov, V. Y., Gaiduk, A. V., Giruts, M. V., Lobusev, M. A., Serov, S. G., Kuznetsov, N. B., and Romanyuk, T. V.: Hydrocarbon biomarkers and diamondoid hydrocarbons from late Precambrian and lower Cambrian rocks of the Katanga saddle (Siberian Platform), Geochem. Int., 55, 360–366, https://doi.org/10.1134/S0016702917040024, 2017.
Golubkov, M., Nikulina, V., and Golubkov, S.: Species-level associations of phytoplankton with environmental variability in the Neva Estuary (Baltic Sea), Oceanologia, 63, 149–162, https://doi.org/10.1016/j.oceano.2020.11.002, 2021.
Gustafsson, B. G. and Westman, P.: On the causes for salinity variations in the Baltic Sea during the last 8500 years, Paleoceanography, 17, 12-1–12-14, https://doi.org/10.1029/2000PA000572, 2002.
Häggi, C., Schefuß, E., Sawakuchi, A. O., Chiessi, C. M., Mulitza, S., Bertassoli, D. J., Hefter, J., Zabel, M., Baker, P. A., and Schouten, S.: Modern and late Pleistocene particulate organic carbon transport by the Amazon River: Insights from long-chain alkyl diols, Geochim. Cosmochim. Ac., 262, 1–19, https://doi.org/10.1016/j.gca.2019.07.018, 2019.
Hammarlund, D., Björck, S., Buchardt, B., Israelson, C., and Thomsen, C. T.: Rapid hydrological changes during the Holocene revealed by stable isotope records of lacustrine carbonates from Lake Igelsjön, southern Sweden, Quaternary Sci. Rev., 22, 353–370, https://doi.org/10.1016/S0277-3791(02)00091-4, 2003.
Hemingway, J. D., Schefuß, E., Jean, B., Pryer, H., and Galy, V. V: Multiple plant-wax compounds record differential sources and ecosystem structure in large river catchments, Geochim. Cosmochim. Ac., 184, 20–40, https://doi.org/10.1016/j.gca.2016.04.003, 2016.
Hopmans, E. C., Weijers, J. W. H., Schefuß, E., Herfort, L., Sinninghe Damsté, J. S., and Schouten, S.: A novel proxy for terrestrial organic matter in sediments based on branched and isoprenoid tetraether lipids, Earth Planet. Sc. Lett., 224, 107–116, https://doi.org/10.1016/j.epsl.2004.05.012, 2004.
Hopmans, E. C., Schouten, S., and Sinninghe Damsté, J. S.: The effect of improved chromatography on GDGT-based palaeoproxies, Org. Geochem., 93, 1–6, https://doi.org/10.1016/j.orggeochem.2015.12.006, 2016.
Huguet, C., Schimmelmann, A., Thunell, R., Lourens, L. J., Damsté, J. S. S., and Schouten, S.: A study of the TEX86 paleothermometer in the water column and sediments of the Santa Barbara Basin, California, Paleoceanography, 22, 1–9, https://doi.org/10.1029/2006PA001310, 2006.
Kotthoff, U., Groeneveld, J., Ash, J. L., Fanget, A.-S., Krupinski, N. Q., Peyron, O., Stepanova, A., Warnock, J., Van Helmond, N. A. G. M., Passey, B. H., Clausen, O. R., Bennike, O., Andrén, E., Granoszewski, W., Andrén, T., Filipsson, H. L., Seidenkrantz, M.-S., Slomp, C. P., and Bauersachs, T.: Reconstructing Holocene temperature and salinity variations in the western Baltic Sea region: a multi-proxy comparison from the Little Belt (IODP Expedition 347, Site M0059), Biogeosciences, 14, 5607–5632, https://doi.org/10.5194/bg-14-5607-2017, 2017.
Kusch, S., Winterfeld, M., Mollenhauer, G., Höfle, S. T., Schirrmeister, L., Schwamborn, G., and Rethemeyer, J.: Glycerol dialkyl glycerol tetraethers (GDGTs) in high latitude Siberian permafrost: Diversity, environmental controls, and implications for proxy applications, Org. Geochem., 136, 1–15, https://doi.org/10.1016/j.orggeochem.2019.06.009, 2019.
Lane, C. S.: Modern n-alkane abundances and isotopic composition of vegetation in a gymnosperm-dominated ecosystem of the southeastern U.S. coastal plain, Org. Geochem., 105, 33–36, https://doi.org/10.1016/j.orggeochem.2016.12.003, 2017.
Lattaud, J., Kim, J., De Jonge, C., and Zell, C.: The C32 alkane-1,15-diol as a tracer for riverine input in coastal seas, Geochim. Cosmochim. Ac., 202, 146–158, https://doi.org/10.1016/j.gca.2016.12.030, 2017.
Lattaud, J., Kirkels, F., Peterse, F., Freymond, C. V., Eglinton, T. I., Hefter, J., Mollenhauer, G., Balzano, S., Villanueva, L., van der Meer, M. T. J., Hopmans, E. C., Sinninghe Damsté, J. S., and Schouten, S.: Long-chain diols in rivers: distribution and potential biological sources, Biogeosciences, 15, 4147–4161, https://doi.org/10.5194/bg-15-4147-2018, 2018.
Leng, M. J. and Lewis, J. P.: ratios and carbon isotope composition of organic matter in estuarine environments, in: Applications of Paleoenvironmental Techniques in Estuarine Studies, Springer, Dordrecht, 213–237, ISBN 978-94-024-0990-1, 2017.
Lougheed, B. C., Filipsson, H. L., and Snowball, I.: Large spatial variations in coastal 14C reservoir age – a case study from the Baltic Sea, Clim. Past, 9, 1015–1028, https://doi.org/10.5194/cp-9-1015-2013, 2013.
Magill, C. R., Eglinton, G., and Eglinton, T. I.: Isotopic variance among plant lipid homologues correlates with biodiversity patterns of their source communities, PLoS One, 14, e0212211, https://doi.org/10.1371/journal.pone.0212211, 2019.
Martin, C., Ménot, G., Thouveny, N., Peyron, O., Andrieu-Ponel, V., Montade, V., Davtian, N., Reille, M., and Bard, E.: Early Holocene Thermal Maximum recorded by branched tetraethers and pollen in Western Europe (Massif Central, France), Quaternary Sci. Rev., 228, 106109, https://doi.org/10.1016/j.quascirev.2019.106109, 2020.
McFarlin, J. M., Axford, Y., Masterson, A. L., and Osburn, M. R.: Calibration of modern sedimentary δ2H plant wax-water relationships in Greenland lakes, Quaternary Sci. Rev., 225, 105978, https://doi.org/10.1016/j.quascirev.2019.105978, 2019.
McKirdy, D. M. and Hahn, J. H.: Composition of Kerogen and Hydrocarbons in Precambrian Rocks, in: Mineral Deposits and the Evolution of the Biosphere, edited by: Holland, H. D. and Schidlowski, M., Springer, Berlin, Heidelberg, 1982.
Meyers, P. A.: Preservation of elemental and isotopic source identification of sedimentary organic matter, Chem. Geol., 114, 289–302, https://doi.org/10.1016/0009-2541(94)90059-0, 1994.
Meyers, P. A. and Ishiwatari, R.: The early diagenesis of organic matter in lacustrine sediments, in: Organic Geochemistry: Principles and Applications, edited by: Engel, M. H. and Macko, S. A., Plenum Press, New York, 185–209, 1993.
Moros, M., Lemke, W., Kuijpers, A., Endler, R., Jensen, J. B., Bennike, O., and Gingele, F.: Regressions and transgressions of the Baltic basin reflected by a new high-resolution deglacial and postglacial lithostratigraphy for Arkona Basin sediments (western Baltic Sea), Boreas, 31, 151–162, https://doi.org/10.1111/j.1502-3885.2002.tb01063.x, 2002.
M uschitiello, F., Pausata, F. S. R., Watson, J. E., Smittenberg, R. H., Salih, A. A. M., Brooks, S. J., Whitehouse, N. J., Karlatou-charalampopoulou, A., and Wohlfarth, B.: Fennoscandian freshwater control on Greenland hydroclimate shifts at the onset of the Younger, Nat. Commun., 6, 8939, https://doi.org/10.1038/ncomms9939, 2015.
Nelson, D. B., Ladd, S. N., Schubert, C. J., and Kahmen, A.: Rapid atmospheric transport and large-scale deposition of recently synthesized plant waxes, Geochim. Cosmochim. Ac., 222, 599–617, https://doi.org/10.1016/j.gca.2017.11.018, 2018.
Ni, S., Quintana Krupinski, N. B., Groeneveld, J., Fanget, A. S., Böttcher, M. E., Liu, B., Lipka, M., Knudsen, K. L., Naeraa, T., Seidenkranz, M.-S., and Filipsson, H. L.: Holocene hydrographic variation from the Baltic-North Sea transitional area (IODP site M0059), Paleoceanography and Paleoclimatology, 35, e2019PA003722, https://doi.org/10.1029/2019PA003722, 2020.
Ning, W., Andersson, P. S., Ghosh, A., Khan, M., and Filipsson, H. L.: Quantitative salinity reconstructions of the Baltic Sea during the mid-Holocene, Boreas, 46, 100–110, 2017.
Rampen, S. W., Schouten, S., Wakeham, S. G., and Sinninghe Damsté, J. S.: Seasonal and spatial variation in the sources and fluxes of long chain diols and mid-chain hydroxy methyl alkanoates in the Arabian Sea, Org. Geochem., 38, 165–179, https://doi.org/10.1016/j.orggeochem.2006.10.008, 2007.
Rampen, S. W., Willmott, V., Kim, J. H., Uliana, E., Mollenhauer, G., Schefuß, E., Sinninghe Damsté, J. S., and Schouten, S.: Long chain 1,13- and 1,15-diols as a potential proxy for palaeotemperature reconstruction, Geochim. Cosmochim. Ac., 84, 204–216, https://doi.org/10.1016/j.gca.2012.01.024, 2012.
Rampen, S. W., Datema, M., Rodrigo-Gámiz, M., Schouten, S., Reichart, G. J., and Sinninghe Damsté, J. S.: Sources and proxy potential of long chain alkyl diols in lacustrine environments, Geochim. Cosmochim. Ac., 144, 59–71, https://doi.org/10.1016/j.gca.2014.08.033, 2014.
Russell, J. M., Hopmans, E. C., Loomis, S. E., Liang, J., and Sinninghe Damsté, J. S.: Distributions of 5- and 6-methyl branched glycerol dialkyl glycerol tetraethers (brGDGTs) in East African lake sediment: Effects of temperature, pH, and new lacustrine paleotemperature calibrations, Org. Geochem., 117, 56–69, https://doi.org/10.1016/j.orggeochem.2017.12.003, 2018.
Sachse, D., Radke, J., and Gleixner, G.: Hydrogen isotope ratios of recent lacustrine sedimentary n-alkanes record modern climate variability, Geochim. Cosmochim. Ac., 68, 4877–4889, https://doi.org/10.1016/j.gca.2004.06.004, 2004.
Sachse, D., Billault, I., Bowen, G. J., Chikaraishi, Y., Dawson, T. E., Feakins, S. J., Freeman, K. H., Magill, C. R., McInerney, F. A., van der Meer, M. T. J., Polissar, P., Robins, R. J., Sachs, J. P., Schmidt, H.-L., Sessions, A. L., White, J. W. C., West, J. B., and Kahmen, A.: Molecular Paleohydrology: Interpreting the Hydrogen-Isotopic Composition of Lipid Biomarkers from Photosynthesizing Organisms, Annu. Rev. Earth Pl. Sc., 40, 221–249, https://doi.org/10.1146/annurev-earth-042711-105535, 2012.
Schefuss, E., Schouten, S., and Schneider, R. R.: Climatic controls on central African hydrology during the past 20,000 years, Nature, 437, 1003–1006, 2005.
Schefuß, E., Kulhman, H., Mollenhauer, G., Prange, M., and Pätzold, J.: Forcing of wet phases in southeast Africa over the past 17,000 years, Nature, 480, 509–512, https://doi.org/10.1038/nature10685, 2011.
Schlitzer, R.: Ocean Data View, available at: https://odv.awi.de, last access: 9 September 2021.
Seppä, H. and Weckström, J.: Holocene vegetational and limnological changes in the Fennoscandian tree-line area as documented by pollen and diatom records from Lake Tsuolbmajavari, Finland, Ecoscience, 6, 621–635, 1999.
Seppä, H. and Birks, H. J. B.: July mean temperature and annual precipitation trends during the Holocene in the Fennoscandian tree-line area: Pollen-based climate reconstructions, Holocene, 11, 527–539, https://doi.org/10.1191/095968301680223486, 2001.
Seppä, H., Hammarlund, D., and Antonsson, K.: Low-frequency and high-frequency changes in temperature and effective humidity during the Holocene in south-central Sweden: Implications for atmospheric and oceanic forcings of climate, Clim. Dynam., 25, 285–297, https://doi.org/10.1007/s00382-005-0024-5, 2005.
Sessions, A. L., Burgoyne, T. W., and Hayes, J. M.: Determination of the H3 factor in hydrogen isotope ratio monitoring mass spectrometry, Anal. Chem., 73, 200–207, https://doi.org/10.1021/ac000488m, 2001.
Sinninghe Damsté, J. S., Verschuren, D., Ossebaar, J., Blokker, J., van Houten, R., van der Meer, M. T. J., Plessen, B., and Schouten, S.: A 25,000-year record of climate-induced changes in lowland vegetation of eastern equatorial Africa revealed by the stable carbon-isotopic composition of fossil plant leaf waxes, Earth Planet. Sc. Lett., 302, 236–246, https://doi.org/10.1016/j.epsl.2010.12.025, 2011.
Sinninghe Damsté, J. S.: Spatial heterogeneity of sources of branched tetraethers in shelf systems: The geochemistry of tetraethers in the Berau River delta (Kalimantan, Indonesia), Geochim. Cosmochim. Ac., 186, 13–31, https://doi.org/10.1016/j.gca.2016.04.033, 2016.
Sinninghe Damsté, J. S., Rijpstra, W. I. C., Foesel, B. U., Huber, K. J., Overmann, J., Nakagawa, S., Kim, J. J., Dunfield, P. F., Dedysh, S. N., and Villanueva, L.: An overview of the occurrence of ether- and ester-linked iso-diabolic acid membrane lipids in microbial cultures of the Acidobacteria: Implications for brGDGT paleoproxies for temperature and pH, Org. Geochem., 124, 63–76, https://doi.org/10.1016/j.orggeochem.2018.07.006, 2018.
Sohlenius, G., Sternbeck, J., Andrén, E., and Westman, P.: Holocene history of the Baltic Sea as recorded in a sediment core from the Gotland Deep, Mar. Geol., 134, 183–201, https://doi.org/10.1016/0025-3227(96)00047-3, 1996.
Sohlenius, G., Emeis, K. C., Andrén, E., Andrén, T., and Kohly, A.: Development of anoxia during the Holocene fresh-brackish water transition in the Baltic Sea, Mar. Geol., 177, 221–242, https://doi.org/10.1016/S0025-3227(01)00174-8, 2001.
Sternberg, L.: DH ratios of environmental water recorded by DH ratios of plant lipids, Nature, 333, 18–20, 1988.
Stuiver, M., Reimer, P. J., Reimer, R. W.: CALIB 8.2 [WWW program], available at: http://calib.org, last access: 31 August 2021.
Thornton, S. F. and McManusJ.: Application of Organic Carbon and Nitrogen Stable isotope and CN ratios as source indicators of organic matter provenance in estuarine systems: Evidence from the Tay estuary, Scotland, Estuar. Coast. Shelf S., 38, 219–233, 1994.
Tipple, B. J. and Pagani, M.: A 35 Myr North American leaf-wax compound-specific carbon and hydrogen isotope record: Implications for C4 grasslands and hydrologic cycle dynamics, Earth Planet. Sc. Lett., 299, 250–262, https://doi.org/10.1016/j.epsl.2010.09.006, 2010.
Versteegh, G. J. M., Bosch, H.-J., and Leeuw, J. W. D. E.: Potential palaeoenvironmental information of C24 to C36 mid-chain diols, keto-ols and mid-chain hydroxy fatty acids: a critical review, Science, 27, 1–13, 1997.
Volkman, J. K., Barrett, S. M., Dunstan, G. A., and Jeffrey, S. W.: C30-C32 alkyl diols and unsaturated alcohols in microalgae of the class Eustigmatophyceae, Org. Geochem., 18, 131–138, https://doi.org/10.1016/0146-6380(92)90150-v, 1992.
Vonk, J. E. and Gustafsson, Ö.: Calibrating n-alkane Sphagnum proxies in sub-Arctic Scandinavia, Org. Geochem., 40, 1085–1090, https://doi.org/10.1016/j.orggeochem.2009.07.002, 2009.
Warden, L., van der Meer, M. T. J., Moros, M., and Sinninghe Damsté, J. S.: Sedimentary alkenone distributions reflect salinity changes in the Baltic Sea over the Holocene, Org. Geochem., 102, 30–44, https://doi.org/10.1016/j.orggeochem.2016.09.007, 2016.
Warden, L., Moros, M., Weber, Y., and Sinninghe Damsté, J. S.: Change in provenance of branched glycerol dialkyl glycerol tetraethers over the Holocene in the Baltic Sea and its impact on continental climate reconstruction, Org. Geochem., 121, 138–154, https://doi.org/10.1016/j.orggeochem.2018.03.007, 2018.
Wasmund, N. and Uhlig, S.: Phytoplankton trends in the Baltic Sea, ICES J. Mar. Sci., 60, 177–186, https://doi.org/10.1016/S1054-3139(02)00280-1, 2003.
Weijers, J. W. H., Schouten, S., van den Donker, J. C., Hopmans, E. C., and Damsté, J. S. S.: Environmental controls on bacterial tetraether membrane lipid distribution in soils, Geochim. Cosmochim. Ac., 71, 703–713, https://doi.org/10.1016/j.gca.2006.10.003, 2007.
Weijers, J. W. H., Panoto, E., van bleijswijk, J., Schouten, S., Rijpstra, W. I. C., Balk, M., Stams, A. J. M., and Damsté, J. S. S.: Constraints on the biological source(s) of the orphan branched tetraether membrane lipids, Geomicrobiol. J., 26, 402–414, https://doi.org/10.1080/01490450902937293, 2009.
Weiss, G. M., Schouten, S., Sinninghe Damsté, J. S., and van der Meer, M. T. J.: Constraining the application of hydrogen isotopic composition of alkenones as a salinity proxy using marine surface sediments, Geochim. Cosmochim. Ac., 250, 34–48, https://doi.org/10.1016/j.gca.2019.01.038, 2019.
Weiss, G. M., Massalska, B., Hennekam, R., Reichart, G. J., Sinninghe Damsté, J. S., Schouten, S., and van der Meer, M. T. J.: Alkenone Distributions and Hydrogen Isotope Ratios Show Changes in Haptophyte Species and Source Water in the Holocene Baltic Sea, Geochem. Geophy. Geosy., 21, 1–16, https://doi.org/10.1029/2019GC008751, 2020.
Weiss, G. M., Lattaud, J., van der Meer, M. T. J., and Eglinton, T. I.: Co-evolution of the terrestrial and aquatic ecosystem in the Holocene Baltic Sea, V2, NIOZ [data set], https://doi.org/10.25850/nioz/7b.b.2c, 2021.
Xiao, W., Wang, Y., Zhou, S., Hu, L., Yang, H., and Xu, Y.: Ubiquitous production of branched glycerol dialkyl glycerol tetraethers (brGDGTs) in global marine environments: a new source indicator for brGDGTs, Biogeosciences, 13, 5883–5894, https://doi.org/10.5194/bg-13-5883-2016, 2016.
Zhang, Z. and Sachs, J. P.: Hydrogen isotope fractionation in freshwater algae: I. Variations among lipids and species, Org. Geochem., 38, 582–608, https://doi.org/10.1016/j.orggeochem.2006.12.004, 2007.
Ziegler, M., Jilbert, T., de Lange, G. J., Lourens, L. J., and Reichart, G. J.: Bromine counts from XRF scanning as an estimate of the marine organic carbon content of sediment cores, Geochem. Geophy. Geosy., 9, Q05009, https://doi.org/10.1029/2007GC001932, 2008.