the Creative Commons Attribution 4.0 License.
the Creative Commons Attribution 4.0 License.
 | 19 Oct 2022
The 8.2 ka event in northern Spain: timing, structure and climatic impact from a multi-proxy speleothem record
Hege Kilhavn
Isabelle Couchoud
Russell N. Drysdale
Carlos Rossi
John Hellstrom
Fabien Arnaud
Henri Wong
The 8.2 ka event is regarded as the most prominent climate anomaly of the Holocene and is thought to have been triggered by a meltwater release to the North Atlantic that was of sufficient magnitude to disrupt the Atlantic Meridional Overturning Circulation (AMOC). It is most clearly captured in Greenland ice-core records, where it is reported as a cold and dry anomaly lasting ∼ 160 years, from 8.25 ± 0.05 until 8.09 ± 0.05 ka (Thomas et al., 2007). It is also recorded in several archives in the North Atlantic region; however, its interpreted timing, evolution and impacts vary significantly. This inconsistency is commonly attributed to poorly constrained chronologies and/or inadequately resolved time series. Here we present a high-resolution speleothem record of early Holocene palaeoclimate from El Soplao Cave in northern Spain, a region pertinent to studying the impacts of AMOC perturbations on south-western Europe. We explore the timing and impact of the 8.2 ka event on a decadal scale by coupling speleothem stable carbon and oxygen isotopic ratios, trace element ratios (Mg Ca and Sr Ca), and growth rate. Throughout the entire speleothem record, δ18O variability is related to changes in effective recharge. This is supported by the pattern of changes in δ13C, Mg Ca and growth rate. The 8.2 ka event is marked as a centennial-scale negative excursion in El Soplao δ18O, starting at 8.19 ± 0.06 ka and lasting until 8.05 ± 0.05 ka, suggesting increased recharge at the time. Although this is supported by the other proxies, the amplitude of the changes is minor and largely within the realm of variability over the preceding 1000 years. Further, the shift to lower δ18O leads the other proxies, which we interpret as the imprint of the change in the isotopic composition of the moisture source, associated with the meltwater flux to the North Atlantic. A comparison with other well-dated records from south-western Europe reveals that the timing of the 8.2 ka event was synchronous, with an error-weighted mean age for the onset of 8.23 ± 0.03 and 8.10 ± 0.05 ka for the end of the event. This compares favourably with the North Greenland Ice Core Project (NGRIP) record. The comparison also reveals that the El Soplao δ18O is structurally similar to the other archives in south-western Europe and the NGRIP ice-core record.
- Article
(9735 KB) - Full-text XML
-
Supplement
(1687 KB) - BibTeX
- EndNote


Compared to the Last Glacial period, with its large swings between stadial and interstadial states, the climate of the Holocene has been relatively stable (Denton and Karlén, 1973; Bond et al., 2001; Mayewski et al., 2004). Notwithstanding this, some abrupt climatic changes have occurred, notably the 8.2 ka (Alley et al., 1997) and 4.2 ka events (Weiss et al., 1993; Drysdale et al., 2006). The 8.2 ka event was short-lived (∼ 160-year) and represents the most prominent climate anomaly of the Holocene (Alley et al., 1997; Alley and Ágústsdóttir, 2005; Rohling and Pälike, 2005; Thomas et al., 2007), at least for the Northern Hemisphere. A widely accepted explanation for the event is a large outburst of freshwater from the proglacial lakes Agassiz and Ojibway during the final retreat phase of the Laurentide ice sheet (Barber et al., 1999; Li et al., 2012; Törnqvist and Hijma, 2012). An alternative cause, a freshwater outburst from the collapsing ice saddle over Hudson Bay, has also been proposed (Gregoire et al., 2012; Matero et al., 2017). Additionally, there is evidence for multiple meltwater fluxes prior to and/or during the event (Hillaire-Marcel et al., 2001; Ellison et al., 2006; Lochte et al., 2019; Brouard et al., 2021). Whilst the exact trigger is still debated, the volume and routing of freshwater entering the North Atlantic Ocean was apparently sufficient to disrupt the Atlantic Meridional Overturning Circulation (AMOC), which transports heat from the tropics to the Arctic region (Barber et al., 1999; Ellison et al., 2006).
The 8.2 ka event is most clearly captured by Greenland ice cores (Alley et al., 1997; Thomas et al., 2007). According to the most recent ice-core age model (GICC05) (Rasmussen et al., 2006) and based on oxygen isotope ratios in the ice (δ18Oice), the event started at 8.25 ± 0.05 ka and lasted until 8.09 ± 0.05 ka (thousand years before present, present being 1950 CE) (North Grip Ice Core Project Members, 2004; Thomas et al., 2007). In Greenland ice cores, the event is asymmetric in shape and preserves evidence of significant decadal variability. Its onset in the North Greenland Ice Core Project (NGRIP) record is defined by a sharp decrease in δ18Oice (of more than 1 ‰), followed by an interval of fluctuating values that are consistently below the mean of the preceding 1000 years. Within this interval are three abrupt increases at 8.23, 8.18 and 8.14 ka, defining the “central event” (a double trough) of lowest δ18Oice values, lasting from 8.23 to 8.14 ka. This is followed by a gradual recovery to pre-event δ18Oice values (North Grip Ice Core Project Members, 2004; Thomas et al., 2007).
Climate over Greenland throughout the 8.2 ka event became colder (inferred from decreased δ18Oice) and drier (inferred from a decrease in snow accumulation rate). The concomitant increase in wind-blown dust, sea salt and forest-fire soot and decrease in methane in the ice cores suggest that the event was widespread (Alley et al., 1997; Alley and Ágústsdóttir, 2005). However, event timing, duration, shape and impacts, as reconstructed from various palaeoclimate archives across Europe, vary significantly. This inconsistency is commonly attributed to poorly constrained chronologies and/or low-resolution time series. Further, the 8.2 ka event is thought to be superimposed on a longer-term anomaly related to solar variability (Bond et al., 2001; Rohling and Pälike, 2005), which complicates the correlation between high- and low-resolution archives. Nevertheless, the 8.2 ka event sensu stricto as “related to a freshwater outburst in the North Atlantic” has been recorded in numerous archives across Europe (Alley and Ágústsdóttir, 2005; Morill et al., 2013).
One of the main challenges for reconstructing palaeoclimate during the 8.2 ka event is the lack of precise and accurate high-resolution records that can be correlated with Greenland ice cores. In marine sediments, chronologies can be hampered by the uncertainties in the radiocarbon reservoir correction. The marine reservoir effect varies spatially and temporally and can be corrected using marine radiocarbon age calibration curves (e.g. Marine20), with the most recent one having uncertainties of less than 200 14C years through the Holocene (Heaton et al., 2020). In lake sediments, a lack of datable material can be a problem, although this is circumvented where varves are present, which can be used to construct chronologies of high precision and accuracy (Brauer et al., 1999; von Grafenstein et al., 1999; Andersen et al., 2017). With speleothems, it is possible to construct precise and accurate chronologies with U-series dating; where high-resolution proxy series are available, these archives can be excellent for correlating abrupt climate changes across different climatic regions. Speleothem δ18O is often used as the climate proxy that connects speleothems to other archives, such as ice cores and deep-sea sediments. However, disentangling the controlling factors of speleothem δ18O is complex, and a combination of several speleothem properties (e.g. stable isotopes, trace elements, growth rate) are often required to overcome or minimise the uncertainties of δ18O interpretation.
In south-western Europe, numerous archives record climate variability through the Holocene, some of which preserve evidence for a climate anomaly around 8.2 ka. Due to its proximity to the North Atlantic, south-western Europe is a climatologically important region for studying the impact of AMOC perturbations (Baldini et al., 2015). Several high-quality speleothem records describe the Holocene climate of this region in terms of rainfall amount and/or seasonality (Domínguez-Villar et al., 2008; Railsback et al., 2011; Smith et al., 2016; Moreno et al., 2017; Baldini et al., 2019; Benson et al., 2021). Specifically, the regional climatic impact of the 8.2 ka event has mainly been described in terms of hydrological change from these studies. The majority of regional studies report the event as a wet interval (e.g. Railsback et al., 2011; Baldini et al., 2019; Benson et al., 2021) although with conflicting interpretations of whether it was a change in total annual rainfall amount or changes in the seasonal distribution of rainfall (i.e. more winter rainfall), whilst some ambiguity remains over event timing. Additionally, in Kaite Cave (northern Spain) two δ18O anomalies, separated by ∼ 140 years, have been interpreted to trace modifications of the isotopic composition of the ocean surface in response to successive discharges of isotopically depleted meltwaters of lakes Agassiz and Ojibway (Domínguez-Villar et al., 2009). In other regional archives, such as lake records, a longer-term change in hydrology around 8.2 ka is usually reported, interpreted as a shift to wetter conditions, potentially related to summer insolation rather than to the 8.2 ka event (i.e. the outburst of freshwater) itself (Morellón et al., 2018). Taken together, it appears that detailed palaeoclimate data on spatial or seasonal impacts and connections between the North Atlantic (e.g. perturbations of the AMOC) and continental climate (e.g. precipitation) at the 8.2 ka event in south-western Europe are not yet clearly understood.
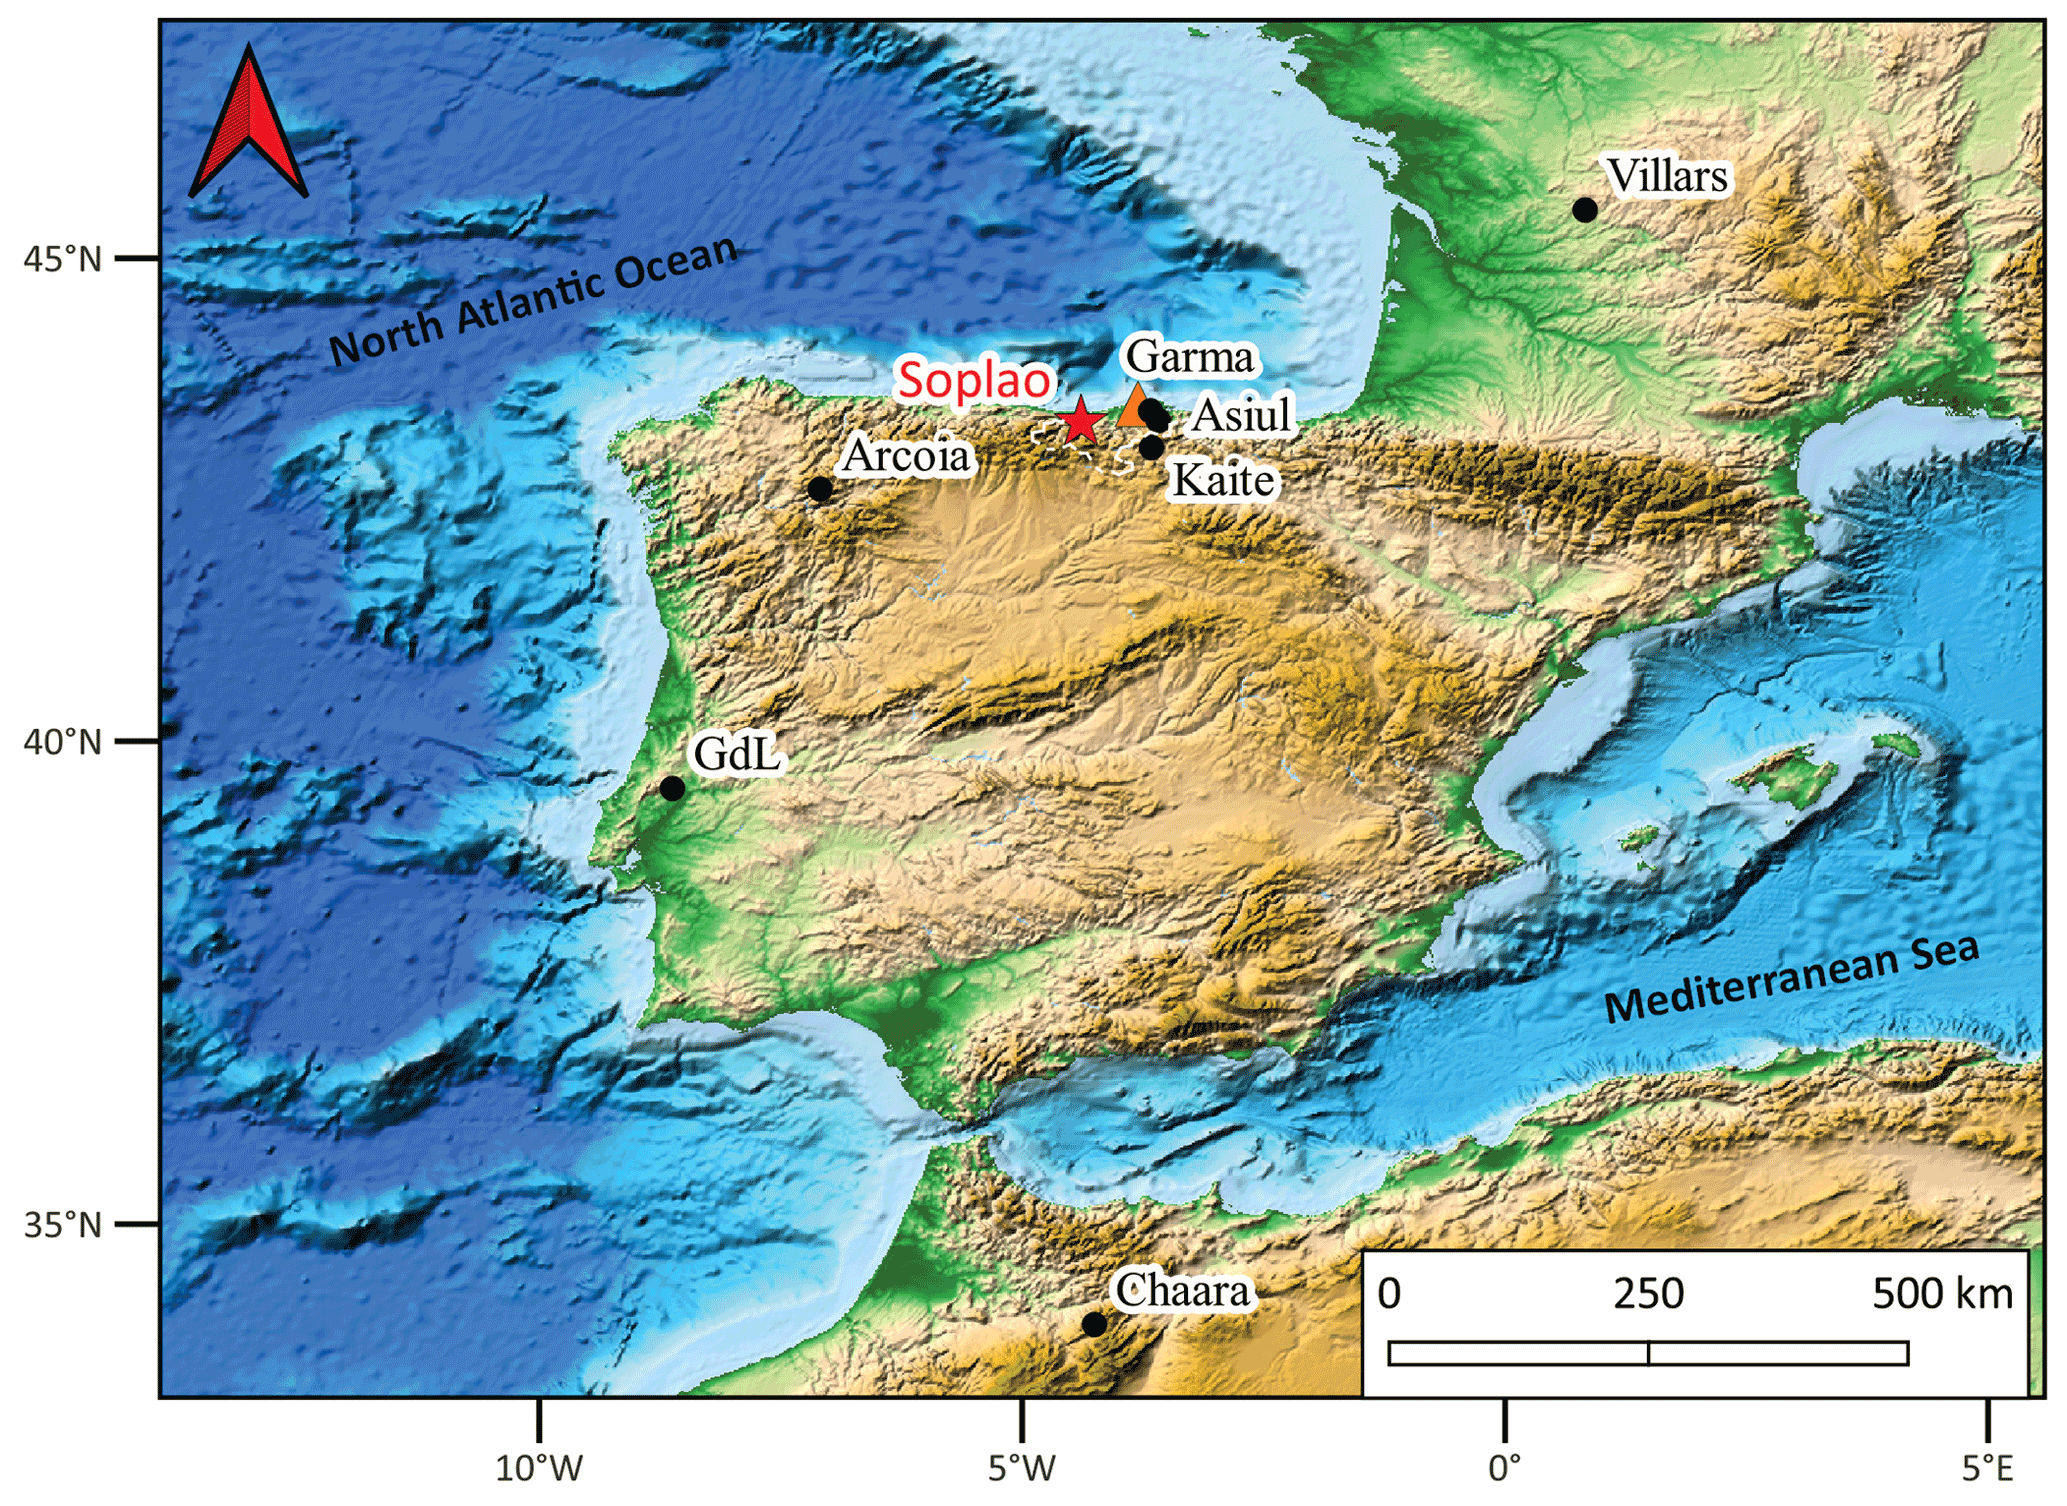
Figure 1Location of the main palaeoclimate records discussed in the text: Soplao (El Soplao Cave; this study), Garma (La Garma Cave; Baldini et al., 2019), Kaite (Kaite Cave; Domínguez-Villar et al., 2009, 2017), GdL (Galeria das Lâminas; Benson et al., 2021), Chaara (Chaara Cave; Ait Brahim et al., 2019), Asiul (Cueva de Asiul; Smith et al., 2016), Arcoia (Cova da Arcoia; Railsback et al., 2011) and Villars (Villars Cave; Ruan, 2016). Location of the Santander GNIP station is indicated by an orange triangle. Meteorological data from the Cantabrian province (Rodríguez-Arévalo et al., 2011) are measured at various sites located between 42–43∘ N and 2–6∘ W (white, stapled line). Base map (ETOPO1 1 Arc-Minute Global Relief Model) collected from NOAA National Geophysical Data Center (2009) and map created in QGIS.
To address this, we present a high-resolution, multi-proxy study of a stalagmite from El Soplao Cave in northern Spain. We explore the hydrological impacts (including the role of seasonality) of the 8.2 ka event at a decadal scale by coupling stable carbon and oxygen isotopic ratios, trace element ratios (Mg Ca and Sr Ca), and growth rate. Additionally, we compile and standardise high-quality archives from south-western Europe and northern Morocco (Fig. 1) to examine the consistency of timing, duration, shape and impact of the 8.2 ka event.
El Soplao Cave is located approximately 12 km from the coastline in the Arnero Sierra of northern Spain (Fig. 1). The cave is situated in the northern watershed of the wet-temperate Cantabrian mountains. Most of the region's rainfall originates from the North Atlantic (Ancell and Célis, 2013; Rossi et al., 2018), with an average annual amount of 1271 ± 169 mm; mean annual air temperature is 12.7 ∘C (Ancell and Célis, 2013) (data for 1981–2010 CE). At the entrance of El Soplao Cave (550 m a.s.l.), the mean annual air temperature is 11.3 ∘C (Rossi et al., 2018). Meteorological data from the nearest Global Network of Isotopes in Precipitation (GNIP) station, Santander (52 m a.s.l., ∼ 65 km from El Soplao Cave), indicate a mean annual air temperature of 14.8 ∘C and a mean annual precipitation of 1050 ± 140 mm (collection period: 2000–2015 CE; Rodríguez-Arévalo et al., 2011). Comparison between the Cantabrian province and Santander GNIP station data reveals similar seasonal patterns, with the rainiest part of the year occurring between autumn and spring, with a maximum in November (Fig. S1 in the Supplement). The Santander GNIP station also provides monthly δ18O values of precipitation, which are positively correlated with temperature and negatively correlated with precipitation (Fig. S1). However, due to the predominance of winter rainfall in the region, either or both of the temperature and rainfall amount effects may be spurious. Deconvolution of monthly rainfall δ18O, rainfall amount and mean temperature data suggest that neither of the effects have a persistent influence on rainfall δ18O but are rather transient features (Fig. S2).
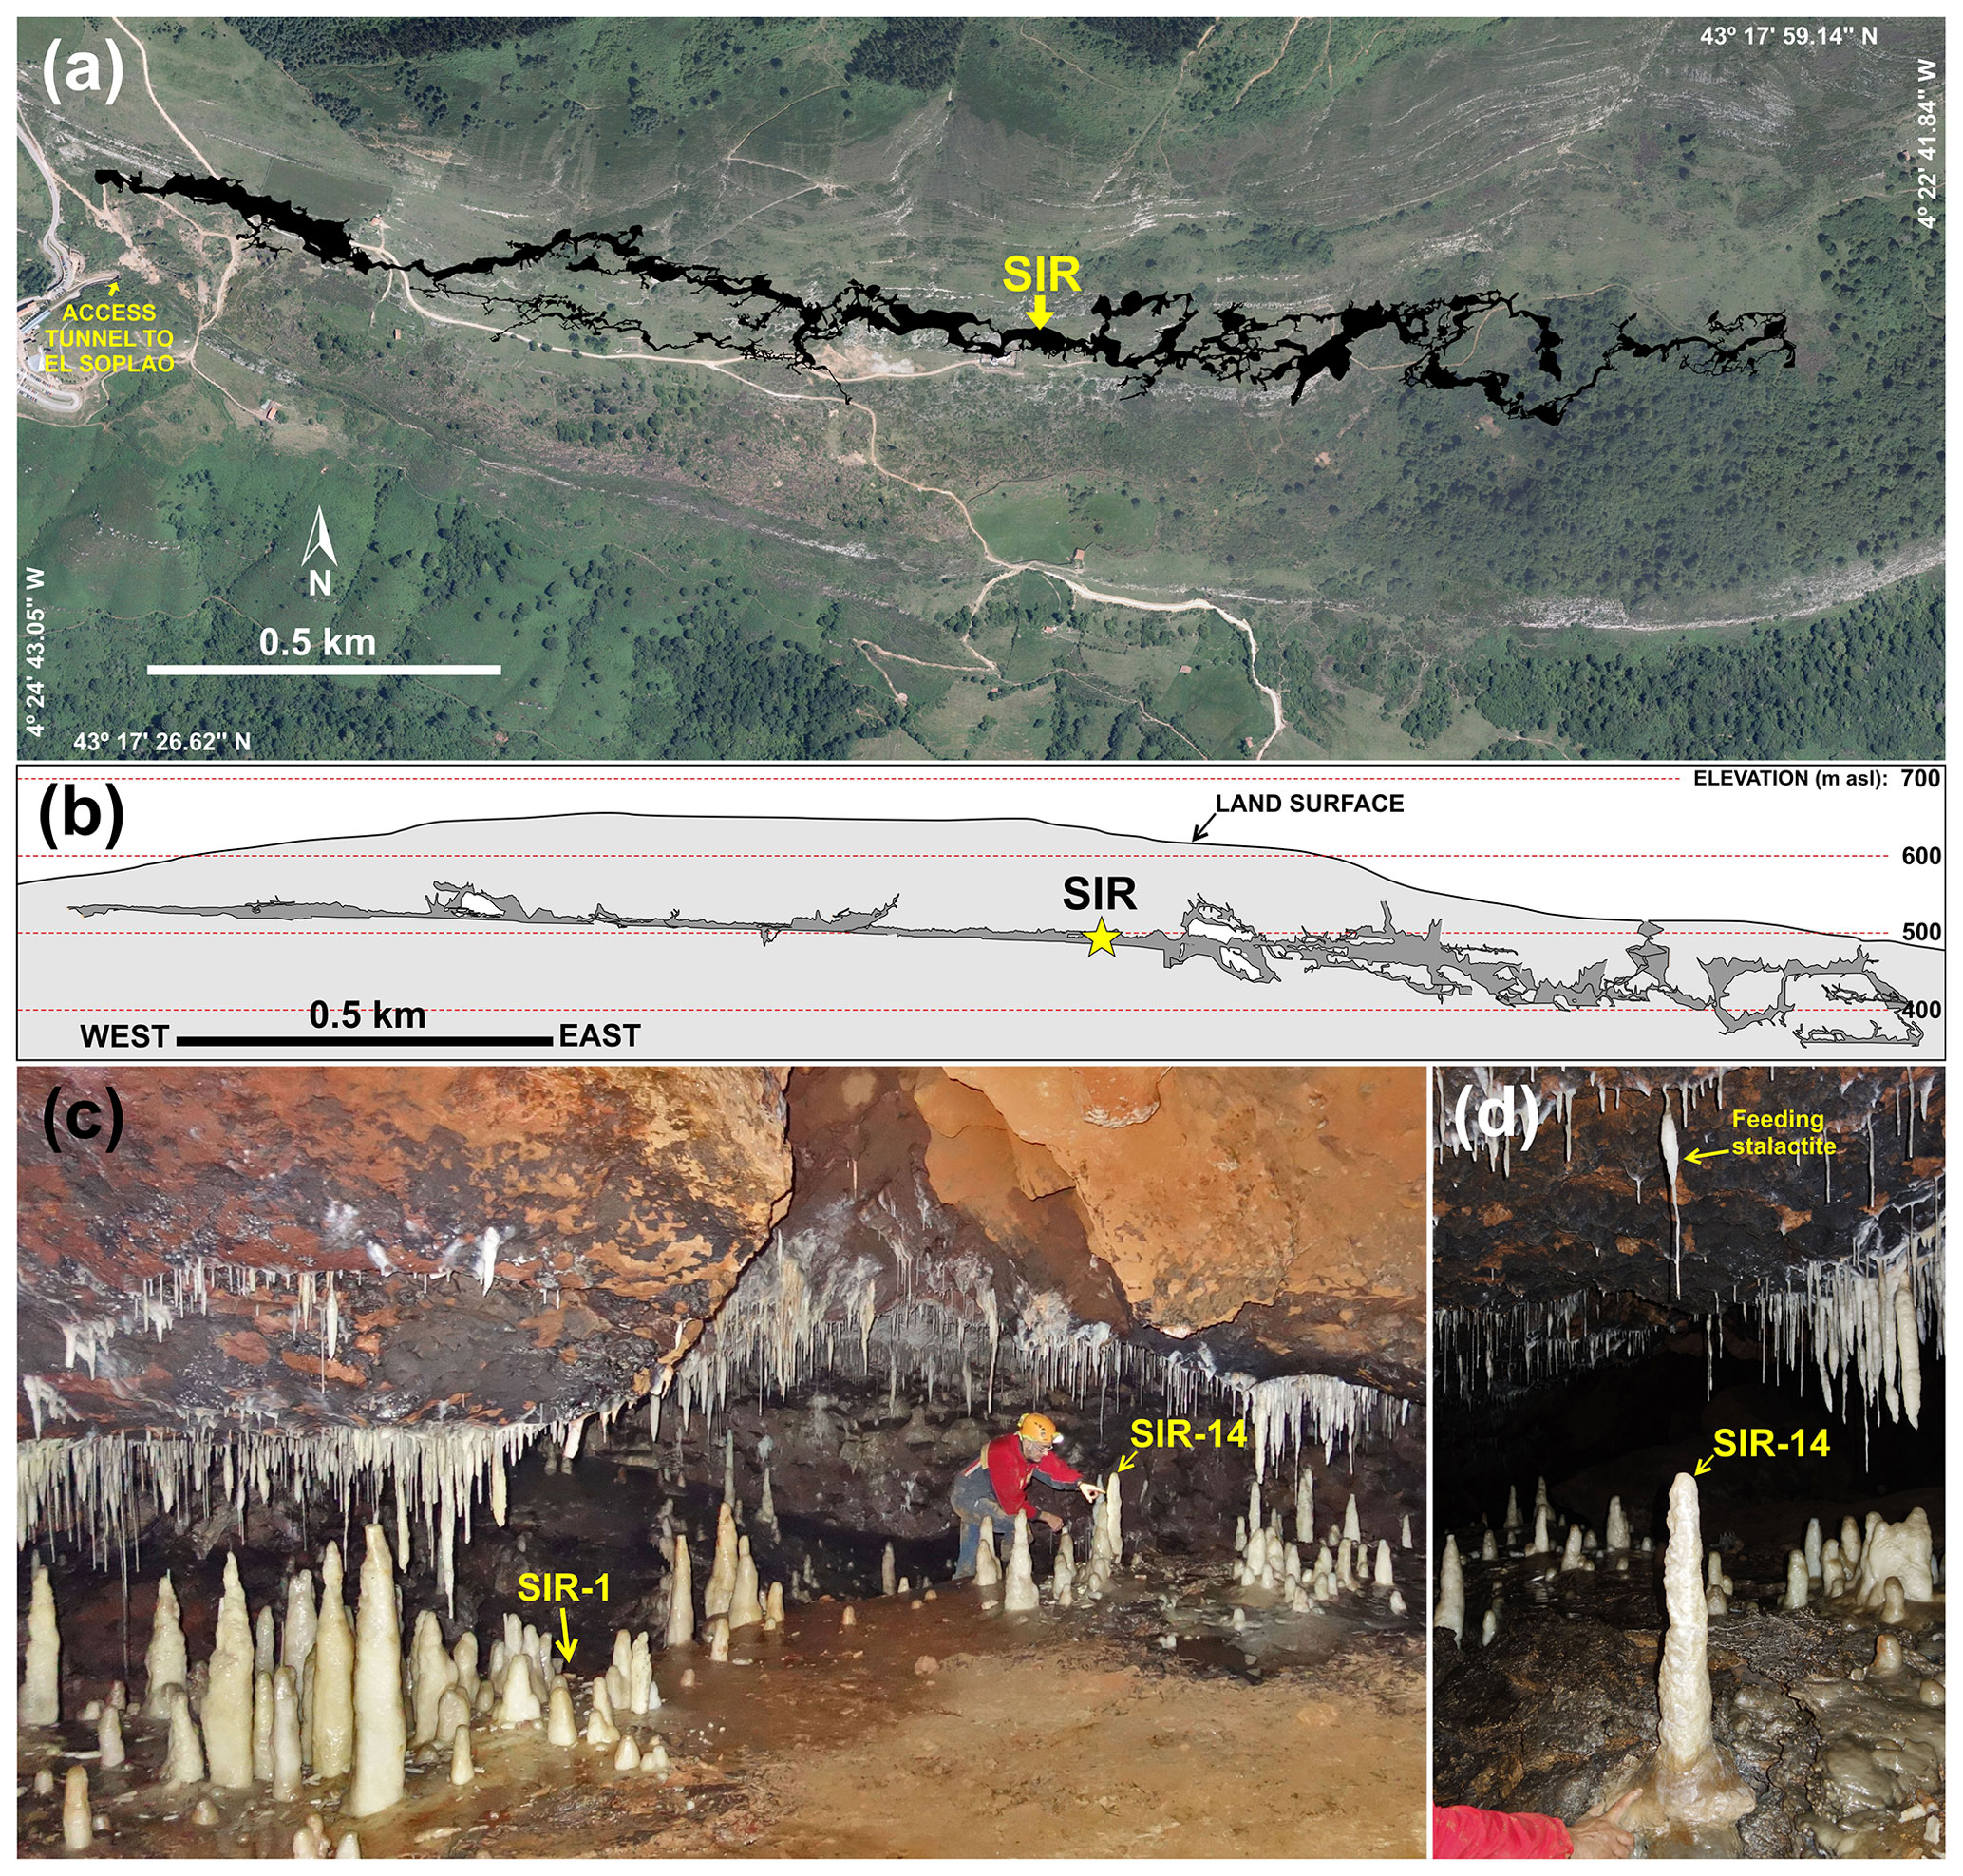
Figure 2(a) Aerial view of El Soplao Cave system superimposed over the terrain (aerial orthoimage collected from PNOA© Instituto Geográfico Nacional, 2014). (b) Cross-section of the cave system. The yellow star indicates the location of the SIR passage. (c) Photo of the gallery where stalagmites SIR-14 (this study) and SIR-1 (Rossi et al., 2018) were collected. (d) Photo of stalagmite SIR-14 in situ and the bulbous-shaped feeding stalactite. Photos: Carlos Rossi.
El Soplao Cave consists of 23 km of surveyed passages formed in dolostones that are sandwiched between limestones. A detailed description of the cave is given by Rossi and Lozano (2016) and Rossi et al. (2018). The stalagmite studied here, SIR-14, was collected from the SIR passage of the cave system located ∼ 120 m below the surface and ∼ 1 km from both of the natural cave entrances (Fig. 2). To minimise the geoheritage impact on the cave, an exact replica was emplaced in the same position in which SIR-14 grew (Baeza et al., 2018: SIR-14 is coded as “Replica Soplao-1”). The SIR-14 stalagmite is ∼ 700 mm long and was apparently inactive when collected and during the monitoring period. However, it should be noted that the drip above the stalagmite has recently been reactivated. The stalagmite grew from 73.5 until 6.3 ka, but the focus of this study is the Holocene portion (the upper ∼ 400 mm). During its growth, the stalagmite was fed by a stalactite whose morphology is a mixture of bulbous and thin soda straw (Fig. 2). The current drip height (i.e. from the tip of the stalactite to the top of the stalagmite) is 37 cm, and the total length of the stalactite is 45 cm. Currently, the water appears to flow through the central canal of the stalactite, as the outer surface is relatively dry, and the very tip of the stalactite is shaped like a drinking straw. However, the middle part of the stalactite has a bulbous shape, suggesting that, in the past, the water could have also been flowing over the outer surface of the stalactite. Stalagmite SIR-1 (Rossi et al., 2018) was located in the same passage and grew ∼ 5 m away from SIR-14 (Fig. 2). Stalagmite SIR-1 is located at a slightly lower elevation in a slope of a vadose trench which currently has an ephemeral stream at the bottom. This relative difference in elevation makes SIR-14 more protected against flooding, which can induce deposition of clay on the stalagmite surface and cause dissolution. The catchment area of the drip waters in the SIR passage mainly consists of rugged dolostone outcrops with shrubland vegetation (Rossi et al., 2018).
Rossi and Lozano (2016) studied the hydrochemistry of ∼ 50 stalagmite-precipitating drips across the cave system over a 3-year monitoring period (July 2010 to July 2013), and a summary of the relevant findings is given here. In the SIR passage, the relative humidity is close to saturation, and air temperature is 10.8 ± 0.2 ∘C throughout the year. The passage is located midway between the cave entrances, which drive summer and winter air into the cave; therefore, the cave temperature at the SIR-14 site is not significantly biased towards any season and likely reflects mean annual temperature at the surface above the cave (Rossi and Lozano, 2016). The CO2 of the cave air typically ranges between 450 and 650 ppmv, with minimum values occurring during winter (Rossi and Lozano, 2016). Drip waters in the SIR passage have a lower supersaturation with respect to calcite compared to average drip water values elsewhere in the cave (Rossi and Lozano, 2016). The average Mg Ca of stalagmite-precipitating drip waters in the SIR passage is 600 ± 20 mmol mol−1. The SIR drip waters show relatively minor seasonal Mg Ca change but vary from drip to drip (500–800 mmol mol−1), being inversely correlated with drip discharge. This implies that drip rate is a major control on the Mg Ca ratios of drip water and consequently on the Mg Ca ratios of the corresponding speleothems (Rossi and Lozano, 2016; Rossi et al., 2018). The values of δ18O in drip water in the cave system range from −7.1 ‰ to −6.3 ‰, with an average in the SIR passage of −6.8 ± 0.02 ‰. The isotopic data plot near the local meteoric water line (LMWL) derived from Santander GNIP station data (Rossi and Lozano, 2016). The proximity to the LMWL suggests minor soil evaporation, which is consistent with the wet-temperate climate. There is no significant variability between the drip water samples collected from different seasons: the values reported in Rossi and Lozano (2016) are all within measurement error (0.1 ‰). In the SIR passage, five of the six monitored drips show relatively constant discharge (coefficient of variation < 17 %), with one drip showing higher variability (57 %). Drip site GASa, located ∼ 100 m from the SIR site, also shows notable variation (coefficient of variation: 31 %) (Rossi and Lozano, 2016). The relatively constant discharge of most SIR drips indicates that a diffuse-flow component is predominant in the vadose zone above the passage. This is likely related to the presence of significant matrix porosity in the dolostone host rock. However, some drips in the SIR passage and nearby sites (GASa) show significant intra-annual and/or seasonal variations in discharge, indicating an additional fracture-flow component (Rossi and Lozano, 2016).
3.1 Material
A ∼ 1.5 cm thick slab incorporating the central growth axis was cut from SIR-14 using a diamond saw. The surface was manually grounded and incipiently polished using resin-bonded discs, avoiding abrasive powders that could penetrate into sample porosity, to reveal internal laminations, macroscopic structures and possible hiatuses and then scanned prior to any sampling. The stalagmite is ∼ 700 mm long and tapers from the base (∼ 150 mm) to the top (∼ 50 mm). In this study, only the upper ∼ 400 mm is discussed. The laminae are curved with a flattened surface in the axial part. They are thin and faint and in some places cannot be distinguished by the naked eye. The stalagmite consists of a combination of translucent-to-whitish calcite and yellowish calcite in the early Holocene section, as well as a few short sections of darker and less porous calcite. The two most prominent sections with darker calcite are shown in Fig. 3b1 and b2. The stalagmite has several millimetre-to-centimetre-scale pores or vugs in the central axis, with the majority being located in the first ∼ 300 mm from the base (i.e. the Pleistocene section). These are likely to represent primary growth features rather than products of dissolution, as shown in stalagmite SIR-1 (Rossi et al., 2018). There are no visible surfaces that could represent hiatuses in the upper section, suggesting it grew continuously through the first half of the Holocene. However, there are some shifts in growth-axis direction, which could be due to some adjustment of the substratum or the feeding drips (such as a plugged fissure or a shift in the feeding stalactite).
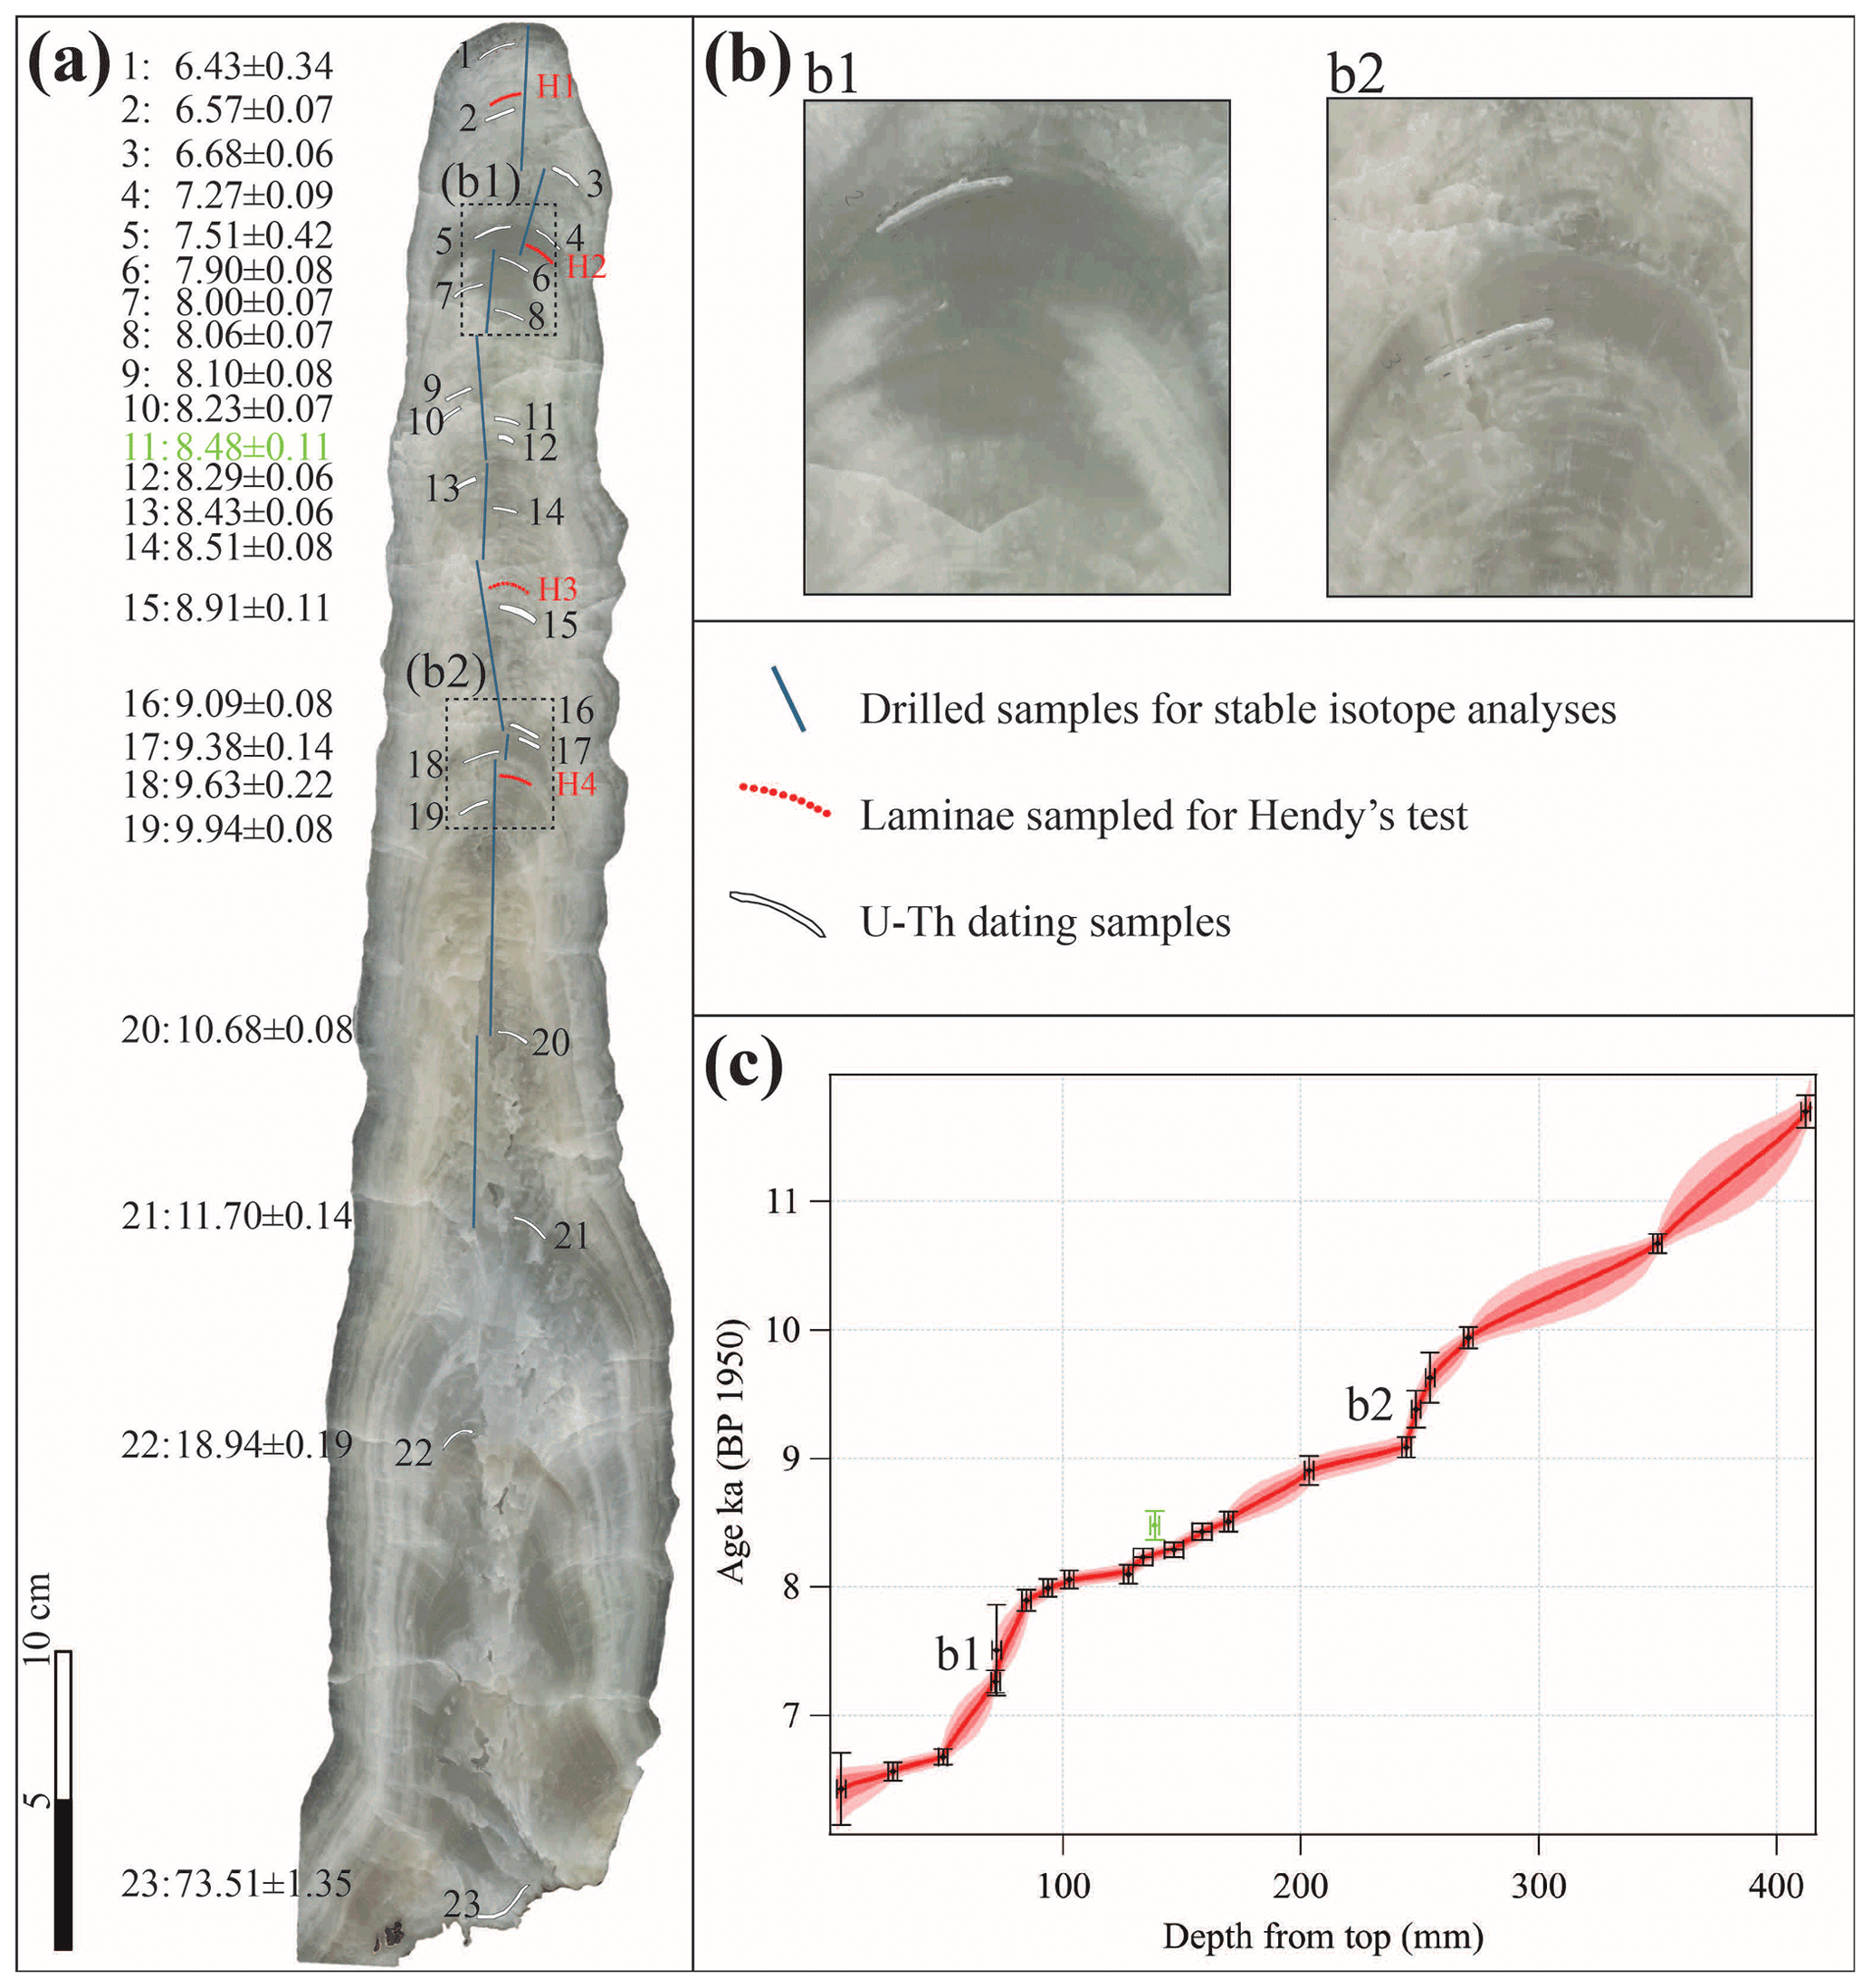
Figure 3(a) Polished section of stalagmite SIR-14. Isotopic transects are shown as blue lines, U–Th samples are indicated in white and are numbered, and corresponding ages (in ka) are indicated to the left. Location of the laminae where the Hendy tests were performed are indicated by red lines. (b) Sections b1 and b2 show two layers of dense and dark calcite where the growth rate was relatively low (between 9.9–9.1 and 7.9–6.7 ka). (c) The age–depth model for stalagmite SIR-14 created using the Finite Positive Growth Rate Model (Corrick et al., 2020). The light and dark red envelopes represent respectively the 66 % and 95 % confidence intervals. The date with a green symbol was treated as an outlier and excluded from the age modelling.
3.2 U–Th dating
The chronology of stalagmite SIR-14 was constrained by 21 U–Th dates (Table S1). Most of the U–Th samples were collected as powders using a 1 mm drill bit fitted to a micromilling instrument, and others (indicated by italics, Table S1) were collected using a handheld drill. The samples were drilled from the same slab as the stable isotopes so that their positions could be coupled directly to the depth profile of the isotope series (Fig. 3a). The U–Th samples were prepared for chemical preparation using the procedure of Hellstrom (2003). Following this, the U–Th samples were analysed and their activity ratios determined using a Nu Instruments Plasma multi-collector inductively coupled plasma mass spectrometer (MC-ICP-MS) at the University of Melbourne. Uncorrected ages were calculated using the latest decay constants (Cheng et al., 2013). Five new dating samples were also measured from stalagmite SIR-1 (Rossi et al., 2018) to improve the chronology in the early Holocene part of this speleothem. Based on these new dates, and the data from the SIR-14 stalagmite, an initial 230Th 232Th ratio of 2.7 ± 0.9 was derived for both SIR stalagmites based on modelling. This value is higher than expected for a cool, temperate setting but is consistently constrained by three samples from SIR-14 with high 232Th 238U values using the stratigraphic-constraint approach of Hellstrom (2006). The corrected ages and their standard error (95 % uncertainties) were used to create a depth–age model (Fig. 3c) using the Finite Positive Growth Rate Model, which is based on Monte-Carlo simulations (Corrick et al., 2020). The new U–Th dates for SIR-1 were combined with published ages (Rossi et al., 2018) to build a revised age model, which was used to update the anchoring points of this speleothem's floating lamina chronology (see Table S2 and Fig. S8 for further details).
3.3 Stable carbon and oxygen isotopes
Stable oxygen and carbon isotope ratios for stalagmite SIR-14 were obtained by sampling the upper ∼ 400 mm of the stalagmite continuously at 1 mm and perpendicular to the laminae (Fig. 3a). The samples were drilled at the University of Melbourne using a TAIG CNC micromilling machine fitted with a 1 mm drill bit. The δ13C and δ18O samples were measured on 0.7–0.8 mg aliquots and analysed on an Analytical Precision AP2003 continuous-flow isotope-ratio mass spectrometer at the University of Melbourne following the procedure of Drysdale et al. (2007). The stable isotope values were normalised to the Vienna Pee Dee Belemnite (VPDB) scale using an internal standard of Carrara marble (NEW1), which was previously calibrated against the international standards NBS18 and NBS19. The mean analytical precision is 0.05 ‰ for δ13C and 0.1 ‰ for δ18O. Samples were also drilled along four growth laminae in order to check if calcite precipitated at or close to isotopic equilibrium (Hendy, 1971).
3.4 Trace elements
Residual powders from the stable isotope analyses were prepared for trace element (Mg Ca and Sr Ca) measurement at the Australian Nuclear Science and Technology Organisation (ANSTO, Sydney, Australia) using inductively coupled plasma atomic emission spectroscopy (ICP-AES) (de Villiers et al., 2002). It should be noted that the trace element measurements are not at the same resolution as the stable isotope analyses (i.e. each millimetre) throughout the studied time interval. The trace element samples were selected according to the aims of the paper; i.e. from ∼ 8.3 to 7.3 ka the resolution is 1 mm, whilst during the rest of the studied period the resolution varies from every 2nd millimetre up to every 6th millimetre. Prior to analysis, the samples were dissolved in a 3 % vol vol−1 () nitric acid solution to a ratio of 1 mg per 5 mL to minimise concentration and matrix variation. A standard solution (continuous calibration verification) was run between blocks of five samples to correct for instrumental drift, with a precision of 0.2 % for Mg Ca and 0.8 % for Sr Ca. In-laboratory blanks (3 % HNO3) were also run alongside the samples to check for any contamination contribution to the samples. Additionally, a suite of mixed standards containing a similar Ca concentration to the samples, but with variable amounts of Mg and Sr, were analysed (de Villiers et al., 2002). The final ratios were manually calculated using the calibration curve of intensity ratio (Figs. A1 and A2 in de Villiers et al., 2002), in which the ratios are regressed against the Mg Ca and Sr Ca content of the standard solutions (de Villiers et al., 2002).
4.1 U–Th, age model and growth-rate results
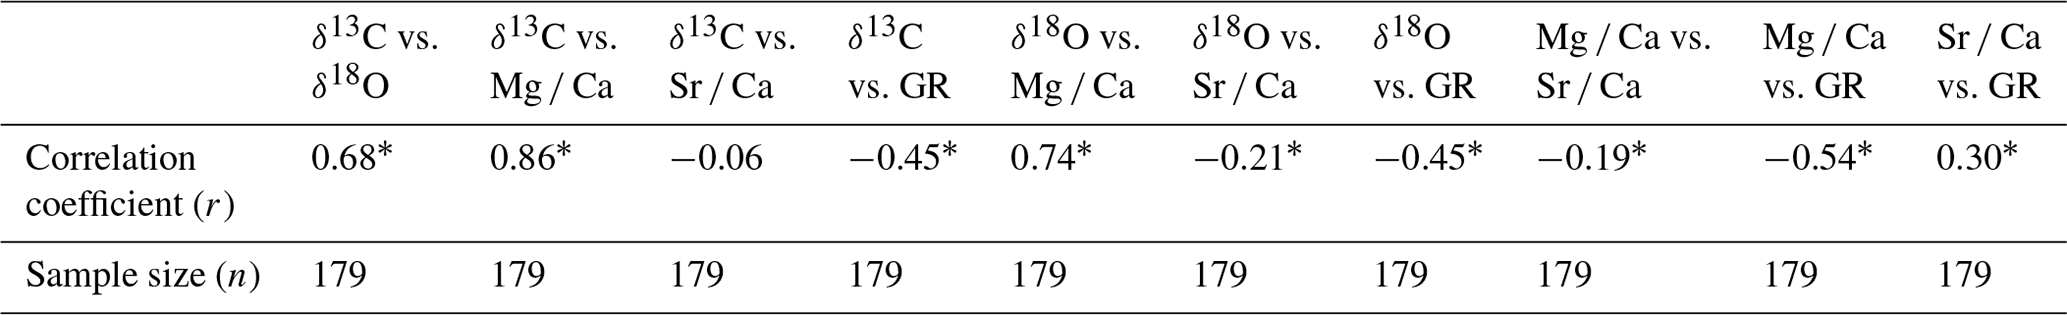
In the upper ∼ 400 mm (the Holocene period), all except one of the 21 U–Th age determinations on SIR-14 are in stratigraphic order (within uncertainties). The age profile indicates that this upper portion grew continuously between 11.7 ± 0.1 and 6.4 ± 0.3 ka. The outlier (at 138.5 mm, 8.5 ka) is not linked to any obvious petrographic alterations or any anomalously high detrital contamination. It is likely that this sample is older than expected due to localised open-system behaviour leading to U leaching (Bajo et al., 2016), as inferred for several of the samples in the SIR-1 stalagmite which grew very close to SIR-14 (Fig. 2) (Rossi et al., 2018). Uranium concentrations range between 164 and 412 ng g−1, averaging 293 ng g−1 (Table S1). The 230Th 232Th activity ratios vary from 23 to 3838, but the majority are high (average of 1142), indicating the small-to-negligible influence of detrital thorium. The initial 234U 238U activity ratios vary between 1.47 and 1.35, with the highest values occurring at 11.7 ka. There is a sharp decrease in these values towards 11 ka, after which the values remain low and stable with only minor variations through the Holocene (Table S1). The growth rate varies from 12.4 to 224.2 mm kyr−1, averaging 76.7 mm kyr−1. The lowest growth rates occur between 9.9–9.1 and 7.9–6.7 ka (less than 50 mm kyr−1); they correspond to layers of relatively dark and dense calcite (Fig. 3b1 and b2). The highest growth rates occur at 9.0, 8.3, 8.1 and 6.6 ka (> 100 mm kyr−1); the calcite is more porous and fractured here compared to the sections below and above and consists of translucent-to-whitish layers (Fig. 3a). The growth-rate peaks occur just prior to the onset of the 8.2 ka event (at 8.3 ka) and at the very end of the event (at 8.1 ka), with a lower growth rate at the beginning of the event (Fig. 4). The growth rate has a moderate, but statistically significant, negative correlation with δ18O, δ13C and Mg Ca (Table 1, Fig. S3).
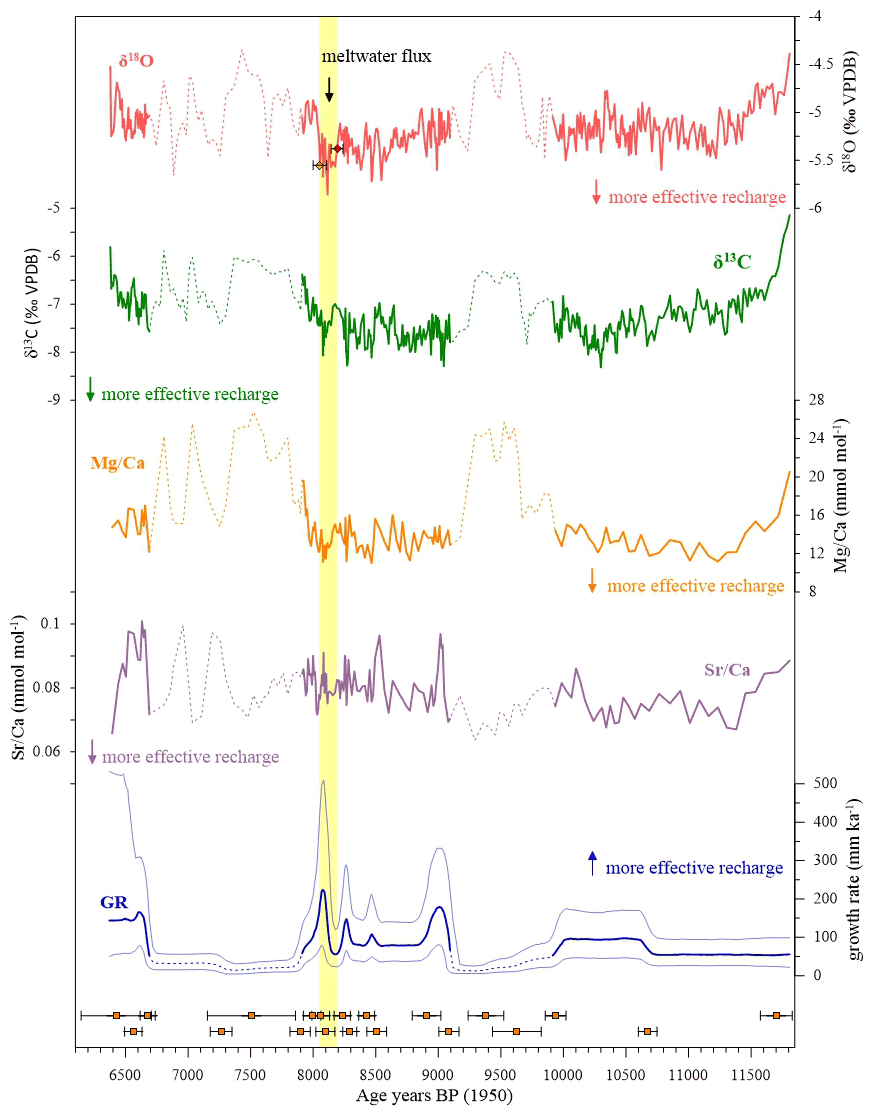
Figure 4SIR-14 proxy time series. From top: δ18O, δ13C, Mg Ca, Sr Ca, growth rate and U–Th dates (2σ uncertainties). The likely position and duration of the 8.2 ka event are determined from the excursion in the δ18O signal indicated by the yellow shading. See Sect. 5.2.1 for further explanation of the determination for onset and end of the event. The two intervals of relatively low growth rates (GRs < 50 mm kyr−1) are indicated by dotted lines. The variability through these intervals is interpreted to be related to effects specific to the drip site and unrelated to regional climate changes. The growth-rate uncertainties (1σ) are plotted as light blue lines and are derived from the uncertainties in the age model.
Table 1Correlation coefficients (r) for the different proxies (δ18O, δ13C, Mg Ca, Sr Ca and growth rate) from stalagmite SIR-14 for the period between 11.7–6.4 ka. Correlation coefficients that are statistically significant (p value < 0.05) are marked with an asterisk. See Fig. S3 for cross plots of the correlation between the various proxies.
4.2 Variations in Mg Ca and Sr Ca
The Mg Ca ratios vary from 11.0 to 29.0 mmol mol−1 with an average of 15.2 mmol mol−1; the Sr Ca ratios vary from 0.06 to 0.10 mmol mol−1 with an average of 0.08 mmol mol−1 (Fig. 4). The most outstanding feature in the Mg Ca profile is the two different ranges of values: higher values occurring during the slow growth periods between 9.9–9.1 and 7.9–6.7 ka (Fig. 3b1 and b2) and low values occurring during periods with average to higher growth rates (Fig. 4). Through the 8.2 ka interval, the Mg Ca displays a negative excursion of low amplitude, and it does not stand out compared to the rest of the record (Fig. 4). The main trends of the Mg Ca profile correlate well with the δ18O and δ13C (r = 0.74 and r = 0.86, respectively; Table 1, Fig. S3).
The Sr Ca ratio is very low, and the signal is variable across the studied period; in particular, it displays two negative excursions coinciding with the prominent peaks in the other proxies, between 9.9–9.1 and 7.9–6.7 ka (Fig. 4). Correlation between Sr Ca and the other measured proxies is generally low (r < 0.3; Table 1, Fig. S3); however, visual observation indicates a negative correlation, especially during the slow growth intervals. The Sr Ca signal is relatively noisy across the 8.2 ka interval with no clear indication of a climate event. This could be due to the relatively low Sr content in the stalagmite, with concentrations being close to the detection limits for the method. Accordingly, Sr Ca will not be discussed further in the ensuing discussion.
4.3 Variations in δ13C and δ18O
The δ18O and δ13C time series yield an average resolution of 13 ± 10 years across the Holocene, ranging from 2 to 66 years. The δ18O values vary between −5.9 ‰ and −4.3 ‰ with an average of −5.2 ± 0.2 ‰; the δ13C values vary between −8.3 ‰ and −5.1 ‰ with an average of −7.3 ± 0.5 ‰. The most negative value appears at 8.1 ka and is the lowest value in a centennial-scale negative excursion at the time of the 8.2 ka event (Fig. 4). The δ13C profile follows the same general trends as the δ18O (r = 0.68; Table 1), but the values attained at the time of the 8.2 ka event are not the lowest throughout the record, and the minimum value occurs just after the aforementioned δ18O minimum. The δ18O and δ13C signals also show two prominent peaks, between 9.9–9.1 and 7.9–6.7 ka, when the growth rates were at their lowest (Fig. 3b1 and b2).
We calculated the 30-point running correlation coefficient for the measured proxies, which highlights time intervals of stronger correlation coefficients. The highest correlation coefficient between δ18O and δ13C occurs between 10 and 9 ka and around 8 ka (r > 0.6), whilst the correlation is relatively low for the rest of the record (r < 0.6; Fig. S4). The highest correlation coefficients occur in intervals with a large change in the growth rate (Fig. 4). Between 10 and 9 ka, a period of slow growth, the growth rate has a high negative correlation with δ18O, δ13C and Mg Ca and a high positive correlation with Sr Ca (Table 1, Fig. S4). The highest negative correlation coefficient between growth rate and δ18O, δ13C and Mg Ca (r > −0.8) occurs at ∼ 8.0 ka.
4.4 Isotopic equilibrium
Kinetic effects can influence the isotopic values in speleothems (McDermott, 2004; Lachniet, 2009). Conditions of isotopic equilibrium, which are likely to be met when sufficient time is available for isotope exchange reactions to proceed, can be interrogated by applying the “Hendy test” (Hendy, 1971). This was performed on several laminae in stalagmite SIR-14. The δ18O and δ13C display moderate to negligible covariation within the laminae (Fig. S5). There is a scatter of up to 0.6 ‰ in the δ18O values within a single lamina, suggesting that sampling might have been slightly inaccurate, incorporating powder from different laminae due to the thin and faint lamination in stalagmite SIR-14. However, the enrichment is less than 0.2 ‰ in the δ18O values from the central axis towards the flanks of the stalagmite, arguing for acceptable near-equilibrium isotopic conditions during precipitation. Additionally, it has been shown that even if the test suggests kinetic fractionation along a growth lamina, isotope samples located close to the growth axis tend to be closer to equilibrium (McDermott, 2004; Lachniet, 2009). There is a relatively strong covariation (r = 0.59, p < 0.001) across the whole record between the δ18O and δ13C along the growth axis, presumably related to the fact that both isotope ratios are being shifted in the same direction by common or climate-related processes.
Another test for equilibrium conditions during calcite precipitation was performed on modern calcite in El Soplao Cave by comparing the measured fractionation with the theoretical equilibrium fractionation at the cave temperature (Rossi and Lozano, 2016). Results from this test suggest equilibrium or near-equilibrium conditions throughout the cave in the present environment, including the SIR passage (Rossi and Lozano, 2016). This is supported by moderate and stable supersaturation values (SIcalcite = 0.4 ± 0.1, n = 6) of the drip waters feeding stalagmites at this particular chamber (SIR) throughout the year (Rossi and Lozano, 2016). The modern-day calcite precipitates at or close to isotopic equilibrium, with average δ18O values of −4.8 ± 0.3 ‰ (Rossi and Lozano, 2016), whilst the average δ18O value of stalagmite SIR-14 is −5.2 ± 0.2 ‰. These values compare well, suggesting that the oxygen isotopic composition of drip water was similar to the present day during the early Holocene. Therefore, similar to the present day, the vadose aquifer probably buffered seasonal variations of drip water δ18O also during the early Holocene. Additionally, the SIR-14 δ18O and δ13C records replicate quite well with the δ18O and δ13C records of stalagmite SIR-1 (Rossi et al., 2018; Fig. S6), which is the most reliable indication that they have recorded climate variations, with kinetic or other drip-specific effects playing only a minor role.
5.1 SIR-14 proxy interpretation
In the first part of this section, we develop an interpretation of the SIR-14 proxies over the entire record and use this as a basis for interrogating the changes across the 8.2 ka event. We then compare our record of the 8.2 ka event with the timing, duration, structure and interpretation of the event in other proxy records from south-western Europe.
5.1.1 Interpretation of growth rate
Speleothem growth-rate variability is controlled by temperature, calcium-ion concentration and/or drip rate (Baker et al., 1998; Genty et al., 2001; Frisia et al., 2003; Borsato et al., 2016). Taken individually, higher levels lead to higher growth rates. Higher temperatures increase bedrock dissolution, leading to higher Ca2+ concentrations in the drip waters and culminating in increased growth rates (Baker et al., 1998; Genty et al., 2001; Frisia et al., 2003). Moisture balance above a cave controls drip rate through its influence on vadose recharge. Increased drip rates deliver more supersaturated solution to the stalagmite, thereby increasing growth rates (Genty et al., 2001; McDermott, 2004).
The growth rate of SIR-14 is relatively high (up to ∼ 220 mm kyr−1) except for two prominent periods of much slower growth (< 50 mm kyr−1) at 9.9–9.1 and 7.9–6.7 ka. Through these intervals, the δ18O, δ13C and Mg Ca ratios are higher than for the rest of the record (dotted lines in Fig. 4). This convergence of all four proxies suggests a hydrologically driven growth-rate reduction. During one of these events, growth in the SIR-1 stalagmite stopped altogether (at ∼ 7.7 ka; Rossi et al., 2018), supporting the notion that slower growth in SIR-14 at this time could have been caused by a shift to drier conditions. However, no such evidence is found in SIR-1 to support the same interpretation for the older slow-growth interval in SIR-14 (Fig. S6). This suggests that non-climatic effects specific to the drip site were responsible. The absence of contemporaneous climate changes in other regional palaeorecords during both of SIR-14's slow-growth periods implies that a localised perturbation of infiltration may have affected the two (or more) closely situated source drip points (Fig. 2). Thus, the climatic significance of the two slow-growth phases remains equivocal.
Temperature is a potential driver of growth-rate variability in stalagmite SIR-14. Results from a previous study of SIR-1 (Rossi et al., 2018) show low growth rates and high δ13C values during the Younger Dryas (YD) stadial due to a cooling-induced reduction in soil CO2 productivity. This is supported by poorly developed or absent annual fluorescence laminae during this interval, which point to a temperature-driven reduction of soil organic matter reaching the stalagmite (Rossi et al., 2018). A negative covariation between δ13C and Mg in SIR-1 at this time, however, also suggests a decrease in effective rainfall. Temperatures during the Holocene have remained relatively stable, casting doubt on whether temperature changes per se would be sufficient to drive growth-rate variations in SIR-14. The negative correlations between the growth rate and both Mg Ca and δ13C observed in SIR-14 (Table 1, Fig. S3), on the other hand, suggest hydrological control.
At El Soplao, most of the rainfall occurs during the winter (Fig. S1; Rodríguez-Arévalo et al., 2011; Ancell and Célis, 2013), and minimal evapotranspiration would accentuate vadose recharge. Three years of drip-water monitoring in the SIR passage shows relatively stable and high drip rates (> 0.01 s−1) throughout the year, in spite of the seasonal positive moisture balance (Rossi and Lozano, 2016). This suggests a strong buffering role of vadose storage, which is not surprising given the thickness of the bedrock overburden (∼ 120 m). Recent reactivation of the drip above SIR-14 indicates that secular changes in drip rate caused by longer-term shifts in the amount of effective recharge, not seen in the modern monitoring study, could explain the modest growth-rate variability in SIR-14.
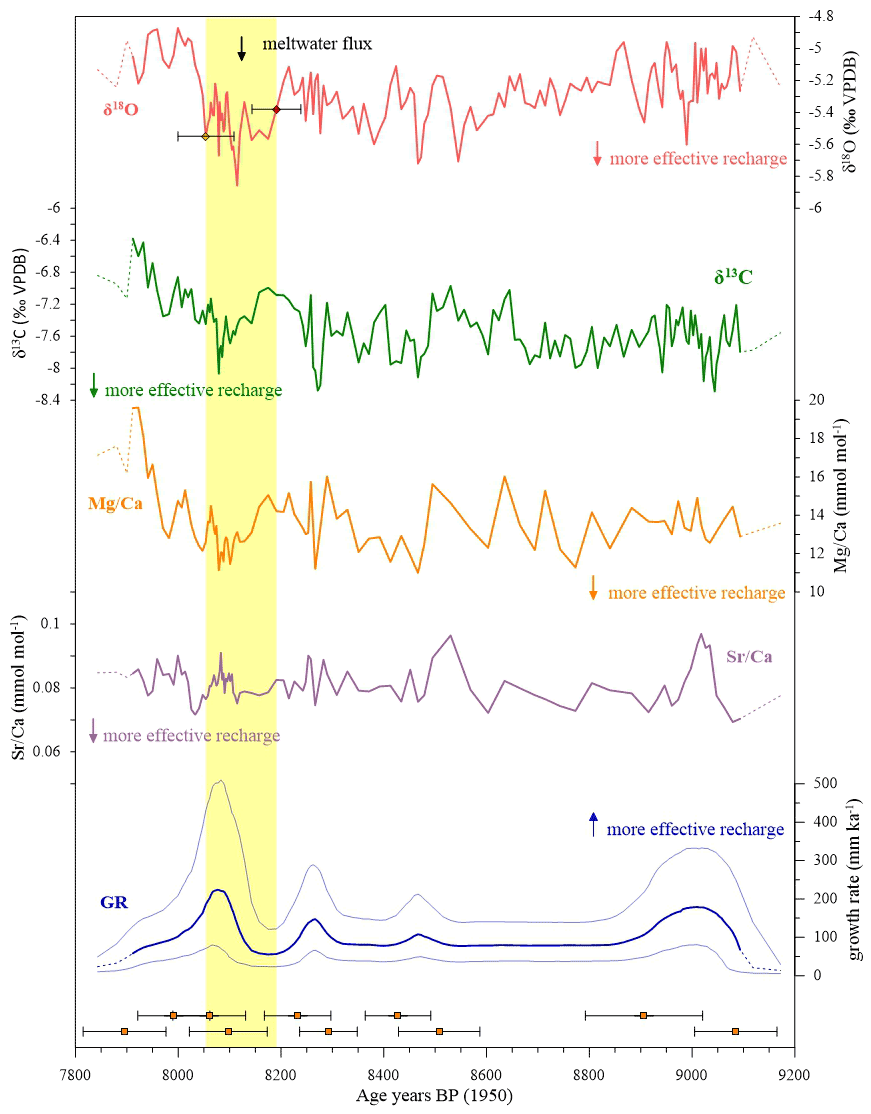
Figure 5SIR-14 proxy time series from 7.8–9.2 ka. From top: δ18O, δ13C, Mg Ca, Sr Ca, growth rate (1σ uncertainties) and U–Th dates (2σ uncertainties). The δ18O displays a negative excursion through the event, and its duration is shown by yellow shading. During this interval the δ13C and Mg Ca decrease, but this excursion does not stand out as a clear Holocene anomaly but rather represents one of several excursions of similar magnitude that occur over the preceding ∼ 1000 years. The Sr Ca does not show any variation of significance. Across the 8.2 ka event, there is a spike in the growth rate where it reaches a maximum of ∼ 220 mm kyr−1. The change in growth rate stands out against the entire record, but it is associated with large uncertainties (reflecting the age-model uncertainties).
Across the 8.2 ka event, there is a spike in SIR-14 growth rate, where it increased from ∼ 60 mm kyr−1 to a maximum of ∼ 220 mm kyr−1 and then back to ∼ 60 mm kyr−1 (Fig. 5). Notwithstanding the large 1σ growth-rate uncertainties for this period, if such an increase were driven only by temperature, it would suggest a warming trend through the 8.2 ka event. This runs counter to the proxy evidence across Europe indicating a cooling of ∼ 1 ∘C through the event (Morill et al., 2013). This strongly implicates hydrological change as the cause of the growth-rate spike in SIR-14 across the 8.2 ka event.
5.1.2 Interpretation of Mg Ca
Apart from the two prominent peaks that coincide with slow growth rates (Fig. 4), the Mg Ca signal is relatively stable with minor variations throughout the Holocene. The Mg Ca is positively correlated with δ13C and δ18O and negatively correlated with growth rate (Table 1, Fig. S3). In stalagmite SIR-1, variations in Mg concentration were related to changes in the Mg Ca ratio of the precipitating drip water, which is mainly controlled by prior calcite precipitation (PCP) and/or water–rock interaction time (Rossi and Lozano, 2016; Rossi et al., 2018). This interpretation is supported by cave monitoring data in the SIR passage, which shows that Mg Ca ratios in the drip waters are negatively correlated to discharge (Rossi and Lozano, 2016). Additionally, as with SIR-14, the Mg and δ13C records in SIR-1 are positively correlated, with high values across the YD (Moreno et al., 2010; Baldini et al., 2015; Bartolomé et al., 2015; Baldini et al., 2019) supporting the idea that both speleothem properties are affected by hydrological changes (Rossi et al., 2018). Thus, it is likely that variations in the Mg Ca record from SIR-14 are also controlled by PCP and/or water–rock interaction. Both can be attributed to variations in effective recharge linked to rainfall and temperature changes at the surface (Fairchild et al., 2000).
PCP occurs in the cave (e.g. on stalactites or straws above) or in air-filled voids upstream of the cave and removes Ca from the solution before it reaches the stalagmite. With less effective rainfall, the water residence time in the vadose zone increases, and fractures and voids become dewatered. In addition to potentially enhancing the release of Mg from the bedrock, the resulting degassing and PCP before the waters reach the stalagmite cause Mg Ca ratios to increase (Fairchild et al., 2000; Fairchild and Baker, 2012). The bulbous shape of the stalactite that is feeding SIR-14 suggests that PCP was the main control. Additionally, the Mg Ca and δ13C are positively correlated throughout the whole studied period (r > 0.8; Table 1 and Fig. S4) and negatively correlated with growth rate (r < −0.5; Table 1 and Fig. S4). Thus, during periods with less effective recharge the growth rates are low, and Mg Ca and δ13C values are high in SIR-14 (Fig. 4).
It should be noted that variations in the Mg Ca ratio could potentially also have been influenced by kinetic effects, input from exotic sources of detrital material and marine aerosols, incongruent dissolution, and temperature. Kinetic effects, linked to rapid calcite precipitation, are unlikely because of the relatively low supersaturation observed in modern SIR drip waters, the high relative humidity in the cave, and the quasi-isotopic-equilibrium conditions evident from cave monitoring (Rossi and Lozano, 2016). Changes in detrital sources can also contribute to Mg variation. This is unlikely due to the absence of visible detritus-rich laminae, the high 230Th 232Th ratios and the high background Mg contributed by the dolostone bedrock (Rossi and Lozano, 2016). Marine aerosols are unlikely to contribute to Mg variability as their influence would be overwhelmed by the high background Mg content of the bedrock and because of the distance from the shore (Rossi et al., 2018). The dolostone host rock can potentially affect the Mg concentrations in the stalagmite through incongruent dolomite dissolution. Due to the lower solubility of dolomite compared to calcite, CaCO3 is precipitated at the same time as CaMg(CO3)2 is dissolved. Incongruent dolomite dissolution can be related to increased residence time and PCP, leading to Mg Ca increases. However, incongruent dolomite dissolution is generally not thought to be a significant process in speleothem-forming environments (Fairchild et al., 2000).
Theoretically, temperature influences the partitioning of Mg into calcite (Katz, 1973; Fairchild and Treble, 2009; Drysdale et al., 2020) and could exert control on the variations in Mg Ca in SIR-14. If temperature was the main control, the DMg would decrease with lower temperatures, causing a reduction in Mg incorporation into the calcite. Based on the pattern of Mg in stalagmite SIR-1 across the end of the YD, an increase in Mg values would be expected, whereas the opposite occurs (Rossi et al., 2018), suggesting temperature has little influence.
The DMg for SIR-1 is 0.03 ± 0.016 (Rossi and Lozano, 2016; Rossi et al., 2018). The drip above SIR-14 was inactive during the monitoring period and thus only a first-order estimate of the DMg of SIR-14 can be calculated, based on the average [Mg Ca] of the drip water in the SIR passage (647.50 ± 25.00 mmol mol−1) and the average [Mg Ca] from stalagmite SIR-14 (15.22 ± 3.78 mmol mol−1). This calculation yields a DMg in SIR-14 of 0.02 ± 0.005, which is within the range of published values (Huang et al., 2001; Fairchild et al., 2010; Tremaine and Froelich, 2013). However, this value does not agree very well with the measured DMg values in modern stalagmites in El Soplao Cave, which are consistently higher than 0.02, and average 0.03. There are indications that the drip rate above SIR-14 was relatively fast, suggesting that the palaeo-drip water had a lower Mg Ca ratio, possibly around 500 mmol mol−1. This would give a DMg of 0.03, which is consistent with the DMg of modern stalagmites and SIR-1. The temperature effect on Mg Ca ratios in SIR-14 can further be discounted due to the similarity in DMg values between SIR-14, SIR-1 and modern stalagmites, as well as the fact that mean annual air temperature has not varied much across the Holocene. Assuming no major change in the partitioning of Mg into calcite across the Holocene, the Mg Ca variability in SIR-14 (10–30 mmol mol−1) suggests a Mg Ca drip water range of 300–700 mmol mol−1. This is similar to the observed variability in [Mg] in SIR-1 in the early Holocene (40–70 mmol mol−1; Rossi et al., 2018) and to the variability in the modern-day drip waters in the SIR passage (500–800 mmol mol−1; Rossi and Lozano, 2016). This supports the notion that the Mg Ca variability is controlled by drip discharge variations in response to changes in recharge.
At around 8.2 ka, there is a small decrease in Mg Ca which aligns with the growth-rate increase and is similar in amplitude to other excursions over the preceding ∼ 1000 years (Fig. 5). This would suggest that the excursion at 8.2 ka was driven by enhanced recharge of a magnitude insufficient to induce a prominent Mg Ca anomaly when viewed in the context of the whole record.
5.1.3 Interpretation of δ13C
The δ13C is variable through the Holocene section of SIR-14, with general trends similar to the Mg Ca and δ18O profiles (Fig. 4). The δ13C decreases from the end of the YD through the early Holocene and then shows only minor variations through the Holocene, with the exception of the two relatively slow growth periods noted above, which are associated with abrupt increases in the δ13C.
The variability in the δ13C signal in speleothems is the result of complex interactions that are often challenging to resolve. It can be influenced by kinetic fractionation which can be induced by rapid CO2 degassing of drip waters to the cave air or by evaporation, both causing the δ13C values to increase (McDermott, 2004). Kinetic fractionation is unlikely to significantly affect the δ13C in SIR-14 due to the high relative humidity in the cave throughout the year and the near-equilibrium isotopic conditions (Sect. 4.4). Thus, it is likely that the δ13C variations in SIR-14 are controlled more directly by external environmental influences.
In previous work on stalagmite SIR-1, the δ13C variability was linked to temperature and hydrological changes above the cave, with higher values coinciding with cold and dry intervals such as the YD (Rossi et al., 2018). In SIR-14, the δ13C is negatively correlated with growth rate and positively correlated with Mg Ca (Table 1, Fig. S3), thus invoking the possible influence of both temperature and precipitation. Lower temperatures result in reduced biogenic activity in the soil above the cave, which leads to an increase in δ13C values, and vice versa (Genty et al., 2003, 2006). However, given the carbon turnover time in the soil and the relative temperature stability through the Holocene, temperature is unlikely to be the main driver of δ13C variations in SIR-14 through the Holocene. It was established above that growth rate in SIR-14 is most likely controlled by changes in recharge rather than temperature; thus, the occurrence of low growth rates and high δ13C values is indicative of decreased drip discharge, which enhances PCP. This is supported by the pattern of proxy changes through the two intervals of slow growth.
Periods with less rainfall can lead to increased PCP, resulting in preferential outgassing of 12CO2 from the solution before it reaches the stalagmite, leading to elevated δ13C values (Dreybrodt and Scholz, 2011). The δ13C and Mg Ca ratio have a consistently high correlation over the studied period (r > 0.6; Fig. S4), arguing for a persistent influence of PCP on the δ13C variability. Additionally, monitoring reveals an intra-site correlation between δ13C of modern calcite and the associated drip water Mg Ca (Rossi and Lozano, 2016). Thus, this argues strongly for PCP, hence effective recharge, being the main control on δ13C variability in SIR-14 over the Holocene record.
Across the 8.2 ka interval, the δ13C decreases by ∼ 1 ‰ between 8.18 and 8.08 ka, followed by a reversal of similar magnitude by ∼ 8.06 ka. The timing of the excursion is consistent with the growth-rate increase and Mg Ca decrease. However, like Mg Ca, the δ13C excursion does not stand out as a clear Holocene anomaly but rather represents one of several excursions of similar magnitude that occur over the preceding ∼ 1000 years (Fig. 5). Nevertheless, the correspondence of this negative δ13C excursion with increased growth rate and decreasing Mg Ca suggests an interval of increased recharge to the cave.
5.1.4 Interpretation of δ18O
The SIR-14 δ18O through the Holocene follows the general trends of the other proxy time series (Fig. 4), being positively correlated with δ13C and Mg Ca and negatively correlated with growth rate (Table 1, Figs. S3 and S4). The δ18O decreases from the end of YD through the early Holocene, similar to the δ13C, then shows a relatively stable trend, reaching a minimum between 8.5–8.0 ka, before a gentle increasing trend until the youngest part of the record (∼ 6 ka). Two prominent increases occur during the slow-growth intervals (Sect. 5.1.1).
The main drivers of speleothem δ18O variability are cave temperature and drip water isotopic composition, provided the calcite is precipitated at or close to isotopic equilibrium (McDermott, 2004; Fairchild et al., 2006; Lachniet, 2009). The stability of mean annual air temperatures during the Holocene would lead to stable cave temperatures, which would implicate changes in drip water δ18O as the main driver of δ18O variability in stalagmite SIR-14. Drip water δ18O in temperate regions reflects the weighted mean of local rainfall δ18O (Baker et al., 2019), which can be controlled by site air temperature, seasonality, rainfall amount, air-mass trajectories and the isotopic composition of the moisture source (McDermott, 2004). Temperature generally has a direct positive relationship with rainfall δ18O in the middle to high latitudes (Dansgaard, 1964). In northern Spain, this gradient is between +0.24 ‰ ∘C−1 and +0.34 ‰ ∘C−1 (Domínguez-Villar et al., 2008). A recent study by Moreno et al. (2021) confirms this positive relationship between air temperature and rainfall δ18O at several sites in the Iberian Peninsula. Moreno et al. (2021) show that the highest correlation occurs on daily-to-monthly timescales, with a slope as high as +0.38 ‰ ∘C−1 at a station in the Pyrenees. However, this effect is counterbalanced by the temperature dependence of water–calcite isotope fractionation in the cave (−0.23 ‰ ∘C−1; Kim and O'Neil, 1997). Thus, the net effect of a 1 ∘C decrease in temperature, as purported to have occurred during the 8.2 ka event (Morill et al., 2013), is an increase in local speleothem δ18O of between 0.01 ‰ ∘C−1 and 0.15 ‰ ∘C−1, which is clearly exceeded in the SIR-14 record (Fig. 4). Other factors affecting rainfall δ18O must be more important.
Meteorological data from the nearby Santander GNIP station (2000–2015 CE) show an annual cycle in the δ18O of the rainfall, with mean summer (May–September) values of −3.71 ± 1.35 ‰ (VSMOW; Vienna Standard Mean Ocean Water) compared to −6.69 ± 1.43 ‰ (VSMOW) in winter (October–March) (Fig. S1; Rodríguez-Arévalo et al., 2011). The monthly δ18O values of rainfall are positively correlated with monthly temperatures (r = 0.6, p < 0.001, gradient of 0.28 ∘C−1) and negatively correlated with the monthly rainfall amount (r = −0.5, p < 0.001) in the region (Fig. S1). However, deconvolution of these data shows that neither the rainfall amount nor temperature exerts a persistent influence on rainfall δ18O (Fig. S2), highlighting the complexity in interpreting regional rainfall δ18O values and consequently speleothem δ18O values. Nevertheless, some trends can be observed; the data show a high correlation between δ18O and temperature when monthly rainfall is less than 100 mm. Thus, it appears that the temperature effect is potentially important when there is less precipitation (i.e. during the summer months in northern Spain). However, the maximum explanatory power of temperature in controlling δ18O variation is only 28 % (r = 0.53), suggesting that the combined effect of other factors is roughly 3 times more important.
The temperature effect on rainfall δ18O can occur via changes in the seasonal distribution of rainfall amount (Denton et al., 2005; Lachniet, 2009). A significant change in seasonality, such as a shift from winter-dominant to summer-dominant rainfall, would affect speleothem δ18O because it changes the annual amount-weighted rainfall δ18O, which is transmitted to the drip water δ18O. Monitoring of the Soplao Cave drip water δ18O shows mean values of −6.70 ± 0.20 ‰ (VSMOW) (Rossi and Lozano, 2016), which is consistent with the isotopic composition of winter rainfall in the region (Rodríguez-Arévalo et al., 2011). The δ18O values of individual drips in the cave show insignificant seasonal variations (∼ 0.1 ‰), and the range of values throughout the cave is narrow (from −7.08 ‰ to −6.27 ‰ (VSMOW); Rossi and Lozano, 2016). Additionally, no systematic variability between winter and summer drip samples is observed, suggesting that the infiltrated rainwater mainly reflects the predominant winter recharge and is homogenised in the vadose zone (Rossi and Lozano, 2016). Whilst there is no seasonal variability in the modern-day drip water composition over the short term, long-term variations in seasonal distribution of precipitation could have affected the variability in SIR-14 δ18O in the past. This effect has been suggested in a study from nearby La Garma Cave, where a rainfall model was used to extract information about seasonal shifts in rainfall and temperature in the past (Baldini et al., 2019). This model indicates that wet winters and dry summers could have occurred for 71 % of the Holocene; there were also periods that could have been dominated by dry winters and wet summers (Baldini et al., 2019).
The positive correlation between δ18O and both δ13C and Mg Ca and the negative correlation between δ18O and growth rate imply that changes in the amount of recharge reaching the cave was the main driver for δ18O variability. Whether this reflects changes in total annual rainfall amount or changes in the seasonal distribution of rainfall is difficult to unravel.
The notion that the δ18O in SIR-14 is mostly influenced by rainfall amount is supported by the present-day relationship between rainfall amount and the δ18O of rainfall in the region (Rodríguez-Arévalo et al., 2011). The variability in δ18O in SIR-1 has been interpreted to reflect changes in the rainfall amount (Rossi et al., 2018). This interpretation is supported by other stalagmites in the region (Cueva de Asiul: Smith et al., 2016; Kaite Cave: Domínguez-Villar et al., 2008). However, as alluded to above (Fig. S2) and pointed out previously (Baldini et al., 2019), the apparent causation behind the present-day relationship between rainfall δ18O and rainfall amount may be a statistical artefact. It is not possible to rule out the role of seasonality on rainfall δ18O variability. An increase in the ratio of summer-to-winter rainfall, without a net change in annual amount, would induce a higher amount-weighted mean δ18O, which would be exacerbated by higher summer evaporation, resulting in less effective recharge to the cave. This would leave its mark on (higher) δ13C and Mg Ca values and (lower) growth rate, having the same effect on the proxies as a reduction in annual rainfall amount. Thus, although changes in rainfall amount have been argued by nearby studies to be the main driver of speleothem δ18O, the role of seasonality cannot be overlooked. Thus, translating the effect of changes in recharge on drip water (and speleothem) δ18O into the climatically more meaningful terms of rainfall amount or rainfall seasonality remains a conundrum. Thus, we restrict our interpretation of SIR-14 δ18O variations more generally to effective recharge.
The correlation between δ18O and the other proxies varies through time (Fig. S4), especially between 9 and 8 ka, when the correlation is weaker. Within this time interval, the 8.2 ka event is recorded as a negative, multi-pronged excursion in δ18O (Fig. 5). This aligns broadly with the pattern of δ13C, Mg Ca and growth-rate changes, but the δ18O decrease appears to lead the other proxies. One possibility for this is a change in the isotopic composition at the moisture source or a change in the mean location of the moisture source.
At the time of the 8.2 ka event, large volumes of ice-sheet meltwaters with drastically lower δ18O values than those of the surrounding ocean entered the North Atlantic (Barber et al., 1999). In spite of ocean mixing, this resulted in a change in surface water isotopic composition (Ellison et al., 2006) which could have altered rainfall δ18O values around the North Atlantic basin. Model simulations of the event predict a ∼ 2 ‰ decrease in the δ18O of the rainfall over Greenland and a ∼ 1 ‰ decrease in δ18O of the rainfall over western Europe (Tindall and Valdes, 2011). The meltwater fluxes have been associated with a decrease in δ18O values in planktic foraminifera (e.g. Ellison et al., 2006) and a decrease in speleothem δ18O values in nearby Kaite Cave (Domínguez-Villar et al., 2009) (Fig. 1). Thus, it is likely that the negative δ18O values in SIR-14 across the 8.2 ka event are indeed recording the freshwater fluxes released to the North Atlantic during the event, causing a modification in the local isotopic composition of precipitation. The reorganisation of ocean circulation from the meltwater injections may also have displaced the mean ocean location from which moisture reaching the cave was evaporated. However, it seems unlikely that the effect of this on air-mass trajectories (and consequent isotope evolution of the air masses) through the event would outweigh the rather strong influence of changes in source-water composition.
5.1.5 Synthesis
To summarise, the SIR-14 proxies record hydrological changes through the early Holocene. In periods with more effective recharge, the δ13C and Mg Ca are low, and the growth rate is high, and vice versa when recharge is lower. The exception is for the two periods of relatively slow growth, in which drip rate decreased due to a local effect in the drip that fed SIR-14 (as discussed in Sect. 5.1.1). Understanding the variation in the δ18O signal in stalagmite SIR-14 is challenging, as this signal is probably controlled by a combination of factors. Throughout the Holocene, the δ18O was also influenced by effective recharge, but decoupling the effects of rainfall amount and/or seasonality remains elusive. Nonetheless, lower values indicate more recharge (either more annual rainfall or more winter rainfall), and vice versa for higher values. During the time interval of the 8.2 ka event, there is a multi-pronged centennial-scale negative δ18O excursion, starting at 8.19 ± 0.06 ka and lasting until 8.05 ± 0.05 ka (Fig. 5). The commencement of this excursion precedes the changes in the other proxies, implicating a source-water effect associated with the meltwater fluxes to the North Atlantic at the time. The fact that the other proxies display evidence for enhanced cave recharge suggests that part of the δ18O change during the 8.2 ka interval may be related to local water balance.
Importantly, the changes in all geochemical proxies across SIR-14 are not “stand-out” features of the entire record, unlike the case in NGRIP and some European records (e.g. Ammersee; von Grafenstein et al., 1999). Only the growth-rate change stands out against the entire record, but this is associated with large uncertainties (reflecting the age-model uncertainties). The prominence of the growth-rate change is also conditioned by the higher density of U–Th dating, which can produce short-term changes in the age–depth model. The apparent complacency of the response to the 8.2 ka event in SIR-14 suggests that the event either produced minimal impact on the climate of this part of south-western Europe or was not strong enough to induce large changes in the geochemical proxies in this particular cave system.
5.2 The 8.2 ka event in the Iberian Peninsula
5.2.1 Timing and duration
It is widely accepted that the drainage of glacial lakes Agassiz and Ojibway (LAO) caused perturbation of the AMOC and triggered the 8.2 ka event (Barber et al., 1999; Li et al., 2012; Törnqvist and Hijma, 2012). However, due to disagreement between continental and marine records, the timing, duration and number of freshwater fluxes remain debated (e.g. Carlson and Clark, 2012; Brouard et al., 2021). The most common explanation for the trigger of the event has been one large outburst of freshwater from LAO, as documented by a red marker bed in Hudson Strait sediment cores and dated to 8.47 ± 0.3 ka cal BP (Barber et al., 1999). This has been supported by several other studies of red marker beds in the region (Lajeunesse and St-Onge, 2008; Jennings et al., 2015; Lochte et al., 2019). However, several records show evidence for multiple meltwater fluxes prior to the event (e.g. Ellison et al., 2006; Hillaire-Marcel et al., 2007; Lochte et al., 2019), arguing for a more complex drainage history. A recent study proposes that the 8.2 ka event was triggered by two distinct drainage events: a subglacial drainage at 8.22 ± 0.02 ka cal BP and the final drainage of LAO at 8.16 ± 0.02 ka cal BP (Brouard et al., 2021). The timing of the first meltwater pulse is based on an annual chronology from well-defined varve records, whilst the timing of the second meltwater pulse was determined by using the minimum- and maximum-limiting 14C ages of continental records that showed clear evidence of the termination of glaciolacustrine conditions (Brouard et al., 2021). The subglacial drainage coincides with the onset of the 8.2 ka event in the δ18O in the NGRIP ice core (8.25 ± 0.05 ka; Thomas et al., 2007), and the final drainage appears in the central part of the event, coinciding with the lowest δ18O values in the NGRIP ice core (Fig. 6). However, it should be noted that the timing of the subglacial drainage is based on varve counting between two sediment units, so the final drainage may have eroded some of the varves, effectively making the age too young.
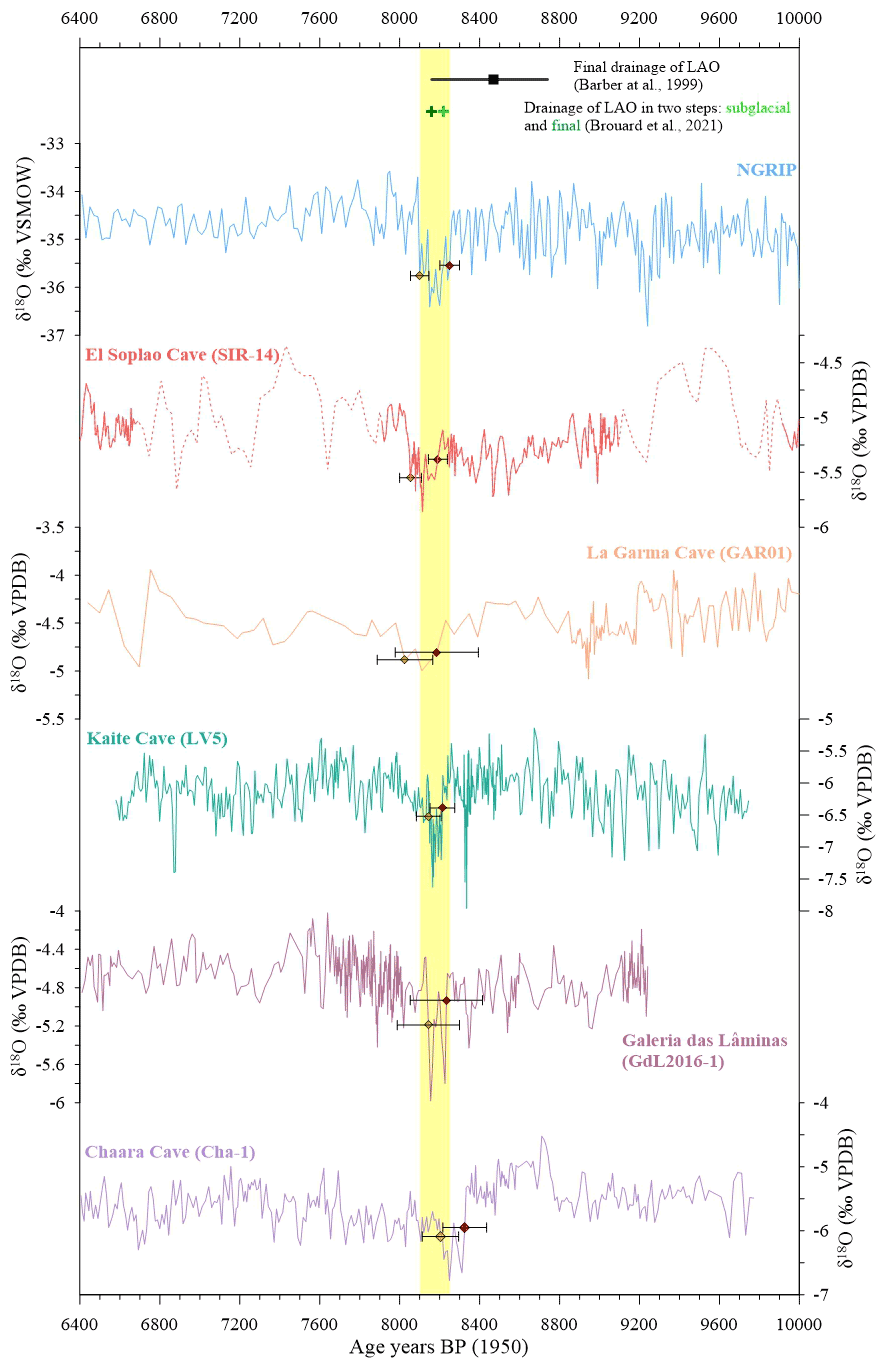
Figure 6Comparison of δ18O records across the 8.2 ka event. From top: timing of the drainage of lakes Agassiz and Ojibway (LAO) (Barber et al., 1999; Brouard et al., 2021); NGRIP ice core record (North Grip Ice Core Project Members, 2004); speleothem records of SIR-14 (this study), GARO1 (La Garma Cave; Baldini et al., 2019), LV5 (Kaite Cave; Domínguez-Villar et al., 2009), GdL2016-1 (Galeria das Lâminas; Benson et al., 2021) and Cha-1 (Chaara Cave; Ait Brahim et al., 2019). The intervals of slow growth in SIR-14 (9.9–9.1 and 7.9–6.7 ka) are shown as dotted lines, as they are representative of drip-specific effects and not regional climate variability. The duration of the event from the NGRIP record is shown by yellow shading. The onset (red) and end (yellow) of the event are indicated by coloured markers (see text for explanation for determining the onset and end of the event).
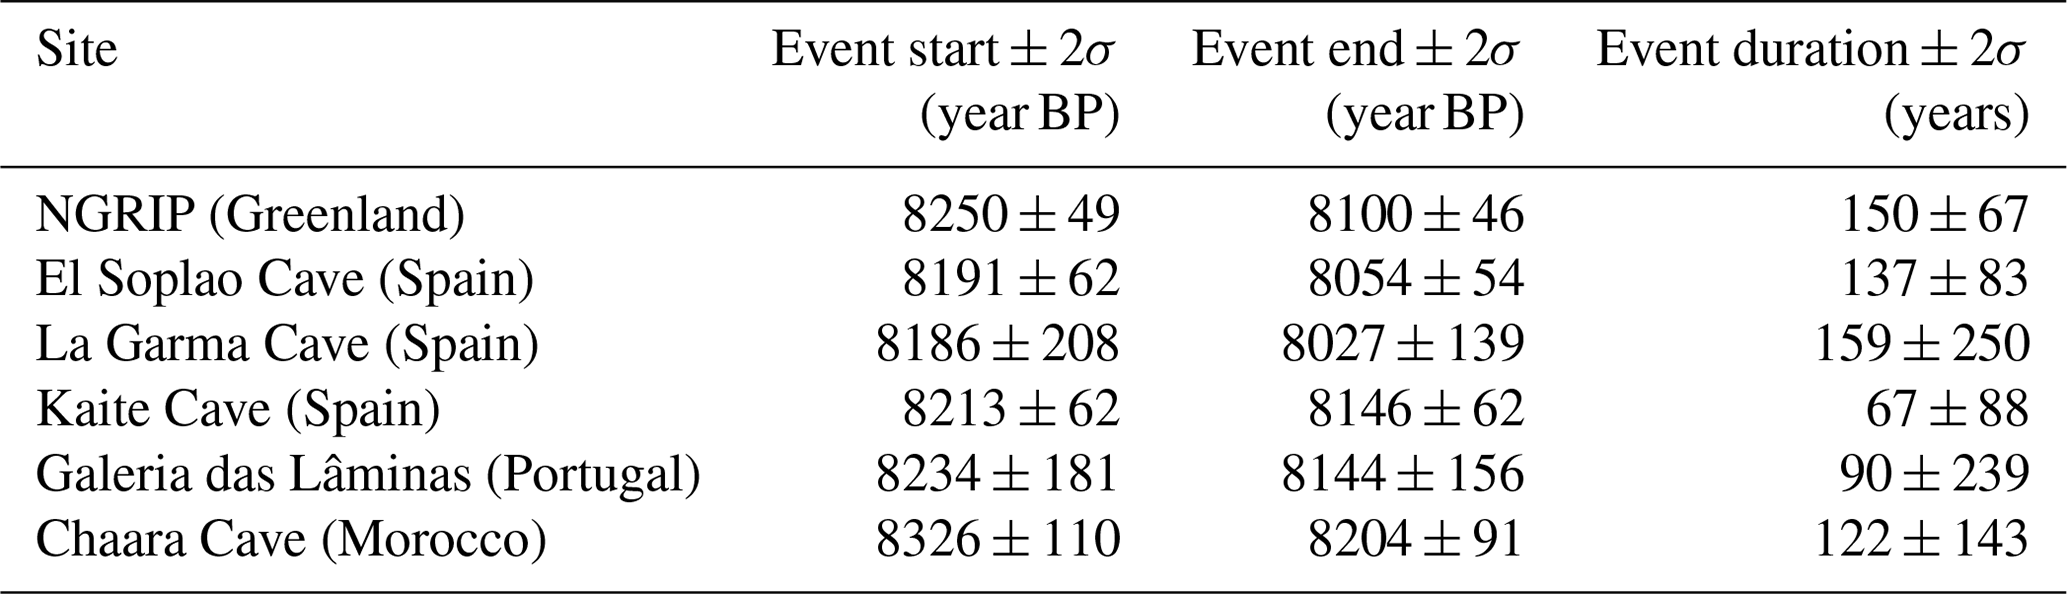
Table 2The timing of the 8.2 ka event from the selected archives discussed in this paper. See text for explanation for determining the onset and end of the event.
Since a focus of this paper is the timing and synchronicity of the event between Greenland and terrestrial archives in south-western Europe, we need to consider discrepancies in timing, which are often explained by poorly constrained chronologies and/or low-resolution time series. Thus, to circumvent this we explore the synchrony of the 8.2 ka event by selecting south-western Europe palaeorecords that meet the following criteria: (1) continuous temporal coverage across the 8.2 ka event (i.e. 8.5–7.9 ka), (2) a minimum temporal resolution of 40 years per data point between 8.5–7.9 ka, and (3) unambiguous interpretation of the proxies (as indicated by the authors). The palaeorecords have been sourced from the SISAL database (Atsawawaranunt et al., 2018; Comas-Bru et al., 2019, 2020) or through personal communication with the authors. There are several high-quality lake archives in south-western Europe. However, none has a high enough resolution or sensitivity to explore the timing of the 8.2 ka event (Morellón et al., 2018). Multiple speleothem records cover the period around 8.2 ka in south-western Europe. However, only five meet the selected criteria (Table 2, Fig. 6). For this reason, only speleothem records (and the NGRIP ice core) will be used in the comparison of the timing and synchrony. The selected records were standardised following the procedures of Corrick et al. (2020), as summarised here. First, to avoid potential biases in age–depth modelling methodology, the chronology of each time series was revised, and a new age–depth model was constructed (Fig. S8). All the ages were recalculated using the most recent estimates of the decay constants from Cheng et al. (2013). Estimates of the initial 230Th 232Th activity ratios were revised using one of several potential methods (Hellstrom, 2006), in which the most common method to correct for detrital thorium assumes a bulk Earth 230Th 232Th activity ratio of 0.82 ± 0.42. However, this value does not cover the full variability in 230Th 232Th in speleothems (Hellstrom, 2006). Where the bulk Earth value was assumed, a 230Th 232Th activity ratio of 1.5 ± 1.5 has been used instead, as it has been shown to be a better estimate given the range of values observed in speleothems (Hellstrom, 2006). In some cases, the stratigraphic constraint approach (Hellstrom, 2006) was used to refine the correction to a speleothem-specific estimate. Where lamina counts were used to construct a chronology, the published chronology was retained (e.g. the chronology of the LV5 record from Kaite Cave; Domínguez-Villar et al., 2017).
In attempting to identify the 8.2 ka event, we followed the approach of Thomas et al. (2007) for the onset and end of the event. In the Greenland ice cores, the onset (end) is defined as the first (last) isotopic data point below the baseline that precedes the event (Fig. S7). The baseline is calculated based on the mean of the preceding 1000 years (between 9.3–8.3 ka). However, when this method was followed strictly, the position of the isotopic data point of the onset and end (i.e. peak, mid-point, trough) varied between different archives due to variable resolution and signal variability. Additionally, the Holocene signal-to-noise ratio in speleothems is low and applying a statistical approach to strictly define the onset/end of the event was found to be inappropriate in some cases. Thus, to ensure that the comparison of the onset and end of the event is based on consistent positioning between the archives, it was necessary to shift some of the isotopic points to positions that are structurally similar to that of the Greenland ice core, irrespective of their timing (Fig. S7).
In the Greenland ice cores, the event started at 8.25 ± 0.05 ka and lasted until 8.09 ± 0.05 ka, giving a total duration of 160 years (Thomas et al., 2007; yellow shading in Fig. 6). In stalagmite SIR-14, the event is manifested as a negative excursion in the δ18O, starting at 8.19 ± 0.06 ka and lasting until 8.05 ± 0.05 ka. This is statistically indistinguishable from the timing of the event in Greenland (Fig. 6). The other archives also overlap with this timing within age uncertainties. This suggests that the event was indeed synchronous between Greenland and south-western Europe.
To statistically verify this claim, we performed a chi-square test (also known as the mean square weighted deviation, MSWD) implemented in Isoplot (Ludwig, 2012) for the selected archives. This test shows all ages for the onset of the event to be statistically from the same population (MSWD = 1.16, p = 0.33), yielding an error-weighted mean age of 8.23 ± 0.03 ka, suggesting that the onset of the event was synchronous. Performing the test on all the ages from the end of the event gives a low probability of fit (p = 0.04), suggesting that the pool of ages is not from the same population. The Chaara Cave (Ait Brahim et al., 2019) record has the least fitting age in the population. For this record it was deemed inappropriate to use the statistical method of Thomas et al. (2007). The position of the isotopic point for the end of the event was shifted to a structurally similar position to that of the NGRIP record (Fig. S7). However, the recovering phase of the event and the following decades are more gentle than in the other archives; hence there could be other explanations for this discrepancy as well. Nevertheless, when we exclude this age from the chi-square test for the end of the event, all ages are statistically from the same population (MSWD = 1.6, p = 0.17), resulting in an error-weighted mean age of 8.10 ± 0.05 ka, suggesting a synchronous end of the event for five of the selected records. This result is consistent with the findings of the recently published global synthesis of speleothem records that suggest a global synchrony of the 8.2 ka event (Parker and Harrison, 2022). In this study, a more objective approach was used to determine the timing, duration and magnitude of the 8.2 ka event globally, which resulted in a global median start age of 8.22 ± 0.03 and end age of 8.06 ± 0.01 ka (Parker and Harrison, 2022). The archives presented in our study have not been included in the global synthesis; thus, our study confirms the synchrony with the Iberian Peninsula records.
5.2.2 Structure
The 8.2 ka event in the Greenland ice cores is asymmetric in shape and preserves evidence of decadal variability (Thomas et al., 2007). The onset of the event is relatively abrupt, after which there is an interval of fluctuating values that are consistently below the mean of the preceding 1000 years. Within this interval there is a double trough, which includes the lowest δ18Oice values across the event. Finally, there is a multi-stage recovery to pre-event δ18Oice values, including an apparent overshoot at the end of the recovery phase (North Grip Ice Core Project Members, 2004; Thomas et al., 2007). Some models have reproduced the asymmetric shape and attributed it to a sudden weakening of the AMOC (e.g. Renssen et al., 2001), with two peaks attributed to a strengthening or temporary recovery of the AMOC ∼ 30 years after the initial freshwater perturbation (Wiersma and Renssen, 2006).

Figure 7Comparison of δ18O variability from selected archives across the 8.2 ka event. From top: NGRIP, SIR-14, GAR01, LV5, GdL2016-1 and Cha-1 (for references, see Fig. 5). The duration of the 8.2 ka event (as inferred from the NGRIP record) is highlighted by yellow shading. The double trough (central part of the event; Thomas et al., 2007) is marked with a thick grey line in the NGRIP profile. Orange shading indicates the “precursor event” identified in the Kaite Cave record. Blue shading indicates the interval where δ18O overshoots after the event in the NGRIP and SIR-14 records.
The selected speleothem records all show a decrease in δ18O values across the event and similar structures compared to the Greenland ice-core record (Fig. 7). For instance, the sharp onset, double trough and multi-stage recovery phase are visible to some degree in all the records, although there are substantial differences in detail at decadal timescales, which are difficult to reconcile owing to age–model uncertainties and the variable resolution. The double trough is marked by at least two (and sometimes more) minima in δ18O values during the event and is recognisable in all the selected records. These minima in δ18O could support the hypothesis of two or more meltwater fluxes as proposed by several authors (e.g. Godbout et al., 2019; Brouard et al., 2021).
Another often-discussed feature of the 8.2 ka event is the “precursor event”, as reported in the Kaite Cave record (Fig. 7) (Domínguez-Villar et al., 2009). This strong negative anomaly in the Kaite Cave δ18O record, centred at 8.35 ka, was interpreted as reflecting an early meltwater pulse to the North Atlantic (Domínguez-Villar et al., 2009). It has been reported in both continental and marine archives in the Hudson Bay–Labrador Strait region (Hillaire-Marcel et al., 2007; Lajeunesse and St-Onge, 2008), in the North Atlantic (Ellison et al., 2006) and in stalagmite records from the Iberian Peninsula (Garma Cave: Baldini et al., 2019; and Galeria das Lâminas: Benson et al., 2021). However, it is less obvious and of lower amplitude in these two stalagmite profiles compared to the strong anomaly in Kaite Cave. In the SIR-14 speleothem δ18O record, there is no clear indication of a precursor event, similar to the Greenland ice cores (Fig. 7).
The varve-dated Mondsee δ18O record in Austria displays higher-than-average δ18O values during the first decades after the 8.2 ka event (Andersen et al., 2017), which the authors relate to an δ18O overshoot in response to regional climate changes from the AMOC recovery. This feature can also be observed in SIR-14 (Fig. 7, blue shading) but is not clearly visible in the other selected speleothem records used in this comparison.
5.2.3 Impact
From stalagmite SIR-14, the 8.2 ka event is shown as a well-defined negative excursion in δ18O, interpreted to reflect, at least in part, a change in the isotopic composition of the ocean source water due to freshening of the North Atlantic by ice sheet meltwaters. Nevertheless, across the Holocene, changes in recharge appear to be the main control on speleothem δ18O, with either more annual rainfall and/or more winter rainfall leading to lower δ18O values, and vice versa. These observations in SIR-14 are consistent with the speleothem record from Kaite Cave, where Holocene variability is controlled mainly by variations in precipitation but where the δ18O variation during the 8.2 ka event reflects changes in North Atlantic surface water δ18O (Domínguez-Villar et al., 2008, 2009). The other proxies measured in SIR-14 also capture the event, with δ13C and Mg Ca values decreasing and growth rate increasing (Fig. 5), suggesting enhanced recharge at the time, but these changes are not outstanding in the context of the Holocene, and we suggest SIR-14 records only a minor climate impact from the 8.2 ka event.
The climatic impact across the 8.2 ka event has been interpreted as a hydrological change in several other palaeorecords from the region. For instance, the 8.2 ka event is associated with wetter conditions in Chaara Cave in northern Morocco based on two δ18O speleothem records from the same cave (Ait Brahim et al., 2019). Speleothem petrography combined with isotopic changes from Cova da Arcoia in northern Spain also points towards wetter conditions (Railsback et al., 2011). This is supported by the speleothem δ18O record from Villars Cave in France, which has been interpreted to reflect increased rainfall during the event (Ruan, 2016). In La Garma Cave, the variability in speleothem δ18O has been interpreted to be controlled by seasonal changes in temperature and rainfall via a model. The model suggests increased winter rainfall and a significant temperature decrease (1.7 ∘C lower than the early Holocene average), shown as a decrease in δ18O, in northern Spain during the 8.2 ka event (Baldini et al., 2019). In Portugal, a slightly different picture emerges: growth-rate variability over the Holocene is determined to be a proxy for winter precipitation changes, with wetter conditions associated with cold episodes and negative North Atlantic Oscillation (NAO) phases (Benson et al., 2021). The δ18O from the same record shows a clear negative excursion through the 8.2 ka event (Fig. 7), but its relationship to winter rainfall amount is unclear because there is no concurrent increase in growth-rate change at the time. Thus, it could be argued that the δ18O excursion in this stalagmite is also reflecting mostly a change in the moisture source δ18O associated with the 8.2 ka event.
Based on the region's speleothem records, there are two main conclusions from the interpretation of the δ18O excursion across the 8.2 ka event: increased winter rainfall (e.g. Baldini et al., 2019) and change in the moisture source composition associated with the discharge of freshwater into the North Atlantic Ocean by the outburst(s) of lakes Agassiz and Ojibway (Domínguez-Villar et al., 2009). The SIR-14 proxy data support these previous conclusions, albeit with some uncertainty as to the seasonality of increased recharge.
There are numerous other terrestrial palaeoarchives in south-western Europe and the western Mediterranean, although most lack the adequate resolution and age control to provide information about the timing of the 8.2 ka event. However, they do offer important information about palaeoclimate across the Holocene. Most of the other terrestrial palaeorecords contradict the inferred climate response from the speleothem records, suggesting drier conditions prevailed during the 8.2 ka event (e.g. Pèlachs et al., 2011; Fletcher et al., 2012; Pérez-Sanz et al., 2013; Morellón et al., 2018; Zielhofer et al., 2019), although some from north-western Spain point towards more humid conditions (Morellón et al., 2018). Additionally, studies of archaeological settlements suggest that drier and colder conditions explain occupational patterns and abandonment of sites in north-eastern Spain and high-altitude sites in northern Spain (González-Sampériz et al., 2009; García-Escárzaga et al., 2022). Thus, this could suggest that there was a different response to the event in the region influenced by air masses from the North Atlantic Ocean and the region influenced by the Mediterranean Sea. However, most of these records show a longer-term change in climate, typically lasting ∼ 300–400 years, and the 8.2 ka time interval in these records generally lacks the resolution and dating to adequately constrain the response through this short-lived event. Thus, these longer-term changes in climate can potentially be linked to summer insolation rather than the short-lived climate anomaly at 8.2 ka (i.e. caused by the meltwater outburst to the North Atlantic Ocean), as pointed out by other authors (e.g. Rohling and Pälike, 2005; Morellón et al., 2018).
The notion of a possible increase in recharge during the 8.2 ka event over parts of south-western Europe, as indicated by SIR-14 and other regional speleothem records mentioned above, is in contrast with the hydroclimate response during meltwater-driven cooling events of the Last Interglacial period (Tzedakis et al., 2018), for which drier conditions have been invoked. In the context of future Greenland ice-sheet melting, this highlights the need for more high-resolution, well-constrained palaeorecords from this region to improve the understanding of how climate is impacted by meltwater-driven cooling events during interglacials.
The SIR-14 stalagmite records hydrological changes through the early Holocene in northern Spain, as determined from δ18O, δ13C, Mg Ca and growth-rate properties. Variability in each is mainly driven by changes in effective recharge. Periods of enhanced recharge occur as lower δ13C, δ18O and Mg Ca values and higher growth rates, and vice versa. Whether changes in winter rainfall or annual rainfall amount drove these changes cannot be determined. During the 8.2 ka event, the δ18O is influenced by a change in the moisture source isotopic composition due to fluxes of meltwater to the North Atlantic from lakes Agassiz and Ojibway. Changes in the other proxies at the time suggest enhanced recharge as well, but they are within the range of typical variability over the preceding 1000 years, perhaps with the exception of growth rate. This suggests that the 8.2 ka event had a minor climate impact at our site.
Our results are broadly consistent with other speleothem records of the 8.2 ka event from the region, where two explanations for lower δ18O values are proposed: increased winter rainfall (as shown in the Garma Cave record; Baldini et al., 2019; and supported by the Galeria das Lâminas record; Benson et al., 2021) and a modification of the isotopic composition of the moisture source (as shown in the Kaite Cave record; Domínguez-Villars et al., 2009).
Based on the δ18O record in SIR-14, the 8.2 ka event started at 8.19 ± 0.06 ka and lasted until 8.05 ± 0.05 ka. This is slightly delayed compared to the NGRIP ice-core record but within the combined uncertainties of both records. By using a few selected high-quality and high-resolution records, we have shown that the event is statistically synchronous between Greenland, south-western Europe and northern Morocco, giving a regional error-weighted mean age for the onset of 8.23 ± 0.03 and 8.10 ± 0.05 ka for its completion. The structures of the event in the Greenland ice cores can be recognised in SIR-14, including the sharp onset, double trough, multi-stage recovery phase and the δ18O overshoot after the event. Some of these features can also be observed in the other selected archives. However, no precursor event was identified, despite its purported recognition in other regional records.
The SIR-14 dataset (proxies and U-Th data) from this study will be available through the NOAA database (https://www.ncei.noaa.gov/access/paleo-search/study/36955, last access: 14 October 2022; NOAA, 2022) and the next version of the SISAL database.
The supplement related to this article is available online at: https://doi.org/10.5194/cp-18-2321-2022-supplement.
IC and RND conceived the original study. CR conducted the field work, provided the prepared stalagmite slab and drilled the initial U–Th samples for SIR-14, as well as the additional set of U–Th samples from SIR-1. HK carried out the U–Th measurements and the carbon and oxygen isotope analyses. JH conducted all the U–Th analyses, produced the age models for SIR-14 and SIR-1, and reviewed the age–depth models of published studies. HW carried out the trace element analyses. HK conducted the initial data interpretations, created the figures and wrote the first draft of the manuscript, with input from IC, RND and FA. These were elaborated upon by the other authors. All authors reviewed and edited the final manuscript.
The contact author has declared that none of the authors has any competing interests.
Publisher’s note: Copernicus Publications remains neutral with regard to jurisdictional claims in published maps and institutional affiliations.
We wish to thank the authors who made their data available either upon request (Alexa Benson) or by uploading them to online repositories (NOAA and SISAL databases). Hege Kilhavn beneficiated from a PhD grant funded by the MOPGA (Make Our Planet Great Again) programme and USMB (Université Savoie Mont Blanc). This work was supported by the French National programme LEFE (Les Envelopes Fluides et l'Environnement). Carlos Rossi acknowledges the financial support received from project RTI2018-094155 B-100 (MCI/AEI/FEDER, UE). Petra Bajo and Ellen Corrick are thanked for assisting with U–Th dating at the University of Melbourne. Russell N. Drysdale acknowledges the financial support of the Australia Nuclear Science and Technology Organisation for the trace element analyses.
This research has been supported by the MOPGA (Make Our Planet Great Again) programme, USMB (Université Savoie Mont Blanc), the French National programme LEFE (Les Envelopes Fluides et l'Environnement), and project RTI2018-094155 B-100 (MCI/AEI/FEDER, UE).
This paper was edited by Laurie Menviel and reviewed by two anonymous referees.
Ait Brahim, Y., Wassenburg, J. A., Sha, L., Cruz, F. W., Deininger, M., Sifeddine, A., Bouchaou, L., Spötl, C., Edwards, R. L., and Cheng, H.: North Atlantic Ice-Rafting, Ocean and Atmospheric Circulation During the Holocene: Insights From Western Mediterranean Speleothems, Geophys. Res. Lett., 46, 7614–7623, https://doi.org/10.1029/2019GL082405, 2019.
Alley, R. B. and Ágústsdóttir, A. M.: The 8k event: cause and consequences of a major Holocene abrupt climate change, Quaternary Sci. Rev., 24, 1123–1149, https://doi.org/10.1016/j.quascirev.2004.12.004, 2005.
Alley, R. B., Mayewski, P. A., Sowers, T., Stuiver, M., Taylor, K. C., and Clark, P. U.: Holocene climatic instability: A prominent, widespread event 8200 yr ago, Geology, 25, 483–486, https://doi.org/10.1130/0091-7613(1997)025<0483:Hciapw>2.3.Co;2, 1997.
Ancell, R. and Célis, R.: Termopluviometría de Cantabria durante el periodo 1981–2010, Agencia Estatal de Meteorología (AEMET) 10, 1–20, https://doi.org/10.31978/281-12-014-0, 2013.
Andersen, N., Lauterbach, S., Erlenkeuser, H., Danielopol, D. L., Namiotko, T., Hüls, M., Belmecheri, S., Dulski, P., Nantke, C., Meyer, H., Chapligin, B., von Grafenstein, U., and Brauer, A.: Evidence for higher-than-average air temperatures after the 8.2 ka event provided by a Central European δ18O record, Quaternary Sci. Rev., 172, 96–108, https://doi.org/10.1016/j.quascirev.2017.08.001, 2017.
Atsawawaranunt, K., Comas-Bru, L., Amirnezhad Mozhdehi, S., Deininger, M., Harrison, S. P., Baker, A., Boyd, M., Kaushal, N., Ahmad, S. M., Ait Brahim, Y., Arienzo, M., Bajo, P., Braun, K., Burstyn, Y., Chawchai, S., Duan, W., Hatvani, I. G., Hu, J., Kern, Z., Labuhn, I., Lachniet, M., Lechleitner, F. A., Lorrey, A., Pérez-Mejías, C., Pickering, R., Scroxton, N., and SISAL Working Group Members: The SISAL database: a global resource to document oxygen and carbon isotope records from speleothems, Earth Syst. Sci. Data, 10, 1687–1713, https://doi.org/10.5194/essd-10-1687-2018, 2018.
Baeza, E., Lozano, R. P., and Rossi, C.: Replication and reinsertion of stalagmites sampled for paleoclimatic purposes, Int. J. Speleology, 47, 137–144, https://doi.org/10.5038/1827-806X.47.2.2183, 2018.
Bajo, P., Hellstrom, J., Frisia, S., Drysdale, R., Black, J., Woodhead, J., Borsato, A., Zanchetta, G., Wallace, M. W., Regattieri, E., and Haese, R.: “Cryptic” diagenesis and its implications for speleothem geochronologies, Quaternary Sci. Rev., 148, 17–28, https://doi.org/10.1016/j.quascirev.2016.06.020, 2016.
Baker, A., Genty, D., Dreybrodt, W., Barnes, W. L., Mockler, N. J., and Grapes, J.: Testing Theoretically Predicted Stalagmite Growth Rate with Recent Annually Laminated Samples: Implications for Past Stalagmite Deposition, Geochim. Cosmochim. Ac., 62, 393–404, https://doi.org/10.1016/S0016-7037(97)00343-8, 1998.
Baker, A., Hartmann, A., Duan, W., Hankin, S., Comas-Bru, L., Cuthbert, M. O., Treble, P. C., Banner, J., Genty, D., Baldini, L. M., Bartolomé, M., Moreno, A., Pérez-Mejías, C., and Werner, M.: Global analysis reveals climatic controls on the oxygen isotope composition of cave drip water, Nat. Commun., 10, 2984, https://doi.org/10.1038/s41467-019-11027-w, 2019.
Baldini, L. M., McDermott, F., Baldini, J. U. L., Arias, P., Cueto, M., Fairchild, I. J., Hoffmann, D. L., Mattey, D. P., Müller, W., Nita, D. C., Ontañón, R., Garciá-Moncó, C., and Richards, D. A.: Regional temperature, atmospheric circulation, and sea-ice variability within the Younger Dryas Event constrained using a speleothem from northern Iberia, Earth Planet. Sc. Lett., 419, 101–110, https://doi.org/10.1016/j.epsl.2015.03.015, 2015.
Baldini, L. M., Baldini, J. U. L., McDermott, F., Arias, P., Cueto, M., Fairchild, I. J., Hoffmann, D. L., Mattey, D. P., Müller, W., Nita, D. C., Ontañón, R., Garciá-Moncó, C., and Richards, D. A.: North Iberian temperature and rainfall seasonality over the Younger Dryas and Holocene, Quaternary Sci. Rev., 226, 105998, https://doi.org/10.1016/j.quascirev.2019.105998, 2019.
Barber, D. C., Dyke, A., Hillaire-Marcel, C., Jennings, A. E., Andrews, J. T., Kerwin, M. W., Bilodeau, G., McNeely, R., Southon, J., Morehead, M. D., and Gagnon, J. M.: Forcing of the cold event of 8200 years ago by catastrophic drainage of Laurentide lakes, Nature, 400, 344–348, https://doi.org/10.1038/22504, 1999.
Bartolomé, M., Moreno, A., Sancho, C., Stoll, H. M., Cacho, I., Spötl, C., Belmonte, Á., Edwards, R. L., Cheng, H., and Hellstrom, J. C.: Hydrological change in Southern Europe responding to increasing North Atlantic overturning during Greenland Stadial 1, P. Natl. Acad. Sci. USA, 112, 6568–6572, https://doi.org/10.1073/pnas.1503990112, 2015.
Benson, A., Hoffmann, D. L., Daura, J., Sanz, M., Rodrigues, F., Souto, P., and Zilhão, J.: A speleothem record from Portugal reveals phases of increased winter precipitation in western Iberia during the Holocene, Holocene, 31, 1339–1350, https://doi.org/10.1177/09596836211011666, 2021.
Bond, G., Kromer, B., Beer, J., Muscheler, R., Evans, M. N., Showers, W., Hoffmann, S., Lotti-Bond, R., Hajdas, I., and Bonani, G.: Persistent Solar Influence on North Atlantic Climate During the Holocene, Science, 294, 2130–2136, https://doi.org/10.1126/science.1065680, 2001.
Borsato, A., Johnston, V. E., Frisia, S., Miorandi, R., and Corradini, F.: Temperature and altitudinal influence on karst dripwater chemistry: Implications for regional-scale palaeoclimate reconstructions from speleothems, Geochim. Cosmochim. Ac., 177, 275–297, https://doi.org/10.1016/j.gca.2015.11.043, 2016.
Brauer, A., Endres, C., and Negendank, J. F. W.: Lateglacial calendar year chronology based on annually laminated sediments from Lake Meerfelder Maar, Germany, Quatern. Int., 61, 17–25, https://doi.org/10.1016/S1040-6182(99)00014-2, 1999.
Brouard, E., Roy, M., Godbout, P.-M., and Veillette, J. J.: A framework for the timing of the final meltwater outbursts from glacial Lake Agassiz-Ojibway, Quaternary Sci. Rev., 274, 107269, https://doi.org/10.1016/j.quascirev.2021.107269, 2021.
Carlson, A. E. and Clark, P. U.: Ice sheet sources of sea level rise and freshwater discharge during the last deglaciation, Rev. Geophys., 50, RG4007, https://doi.org/10.1029/2011RG000371, 2012.
Cheng, H., Lawrence Edwards, R., Shen, C.-C., Polyak, V. J., Asmerom, Y., Woodhead, J., Hellstrom, J., Wang, Y., Kong, X., Spötl, C., Wang, X., and Calvin Alexander, E.: Improvements in 230Th dating, 230Th and 234U half-life values, and U–Th isotopic measurements by multi-collector inductively coupled plasma mass spectrometry, Earth Planet. Sc. Lett., 371–372, 82–91, https://doi.org/10.1016/j.epsl.2013.04.006, 2013.
Comas-Bru, L., Harrison, S. P., Werner, M., Rehfeld, K., Scroxton, N., Veiga-Pires, C., and SISAL working group members: Evaluating model outputs using integrated global speleothem records of climate change since the last glacial, Clim. Past, 15, 1557–1579, https://doi.org/10.5194/cp-15-1557-2019, 2019.
Comas-Bru, L., Atsawawaranunt, K., Harrison, S., and SISAL working group members: SISAL (Speleothem Isotopes Synthesis and AnaLysis Working Group) database version 2.0, University of Reading [data set], https://doi.org/10.17864/1947.256, 2020.
Corrick, E. C., Drysdale, R. N., Hellstrom, J. C., Capron, E., Rasmussen, S. O., Zhang, X., Fleitmann, D., Couchoud, I., and Wolff, E.: Synchronous timing of abrupt climate changes during the last glacial period, Science, 369, 963–969, https://doi.org/10.1126/science.aay5538, 2020.
Dansgaard, W.: Stable isotopes in precipitation, Tellus, 16, 436–468, https://doi.org/10.3402/tellusa.v16i4.8993, 1964.
Denton, G. H. and Karlén, W.: Holocene Climatic Variations – Their Pattern and Possible Cause, Quaternary Res., 3, 155–205, https://doi.org/10.1016/0033-5894(73)90040-9, 1973.
Denton, G. H., Alley, R. B., Comer, G. C., and Broecker, W. S.: The role of seasonality in abrupt climate change, Quaternary Sci. Rev., 24, 1159–1182, https://doi.org/10.1016/j.quascirev.2004.12.002, 2005.
de Villiers, S., Greaves, M., and Elderfield, H.: An intensity ratio calibration method for the accurate determination of Mg Ca and Sr Ca of marine carbonates by ICP-AES, Geochem. Geophy. Geosy., 3, 2001GC000169, https://doi.org/10.1029/2001GC000169, 2002.
Domínguez-Villar, D., Wang, X., Cheng, H., Martín-Chivelet, J., and Lawrence, E. R.: A high-resolution late Holocene speleothem record from Kaite Cave, northern Spain: δ18O variability and possible causes, Quatern. Int., 187, 40–51, https://doi.org/10.1016/j.quaint.2007.06.010, 2008.
Domínguez-Villar, D., Fairchild, I. J., Baker, A., Wang, X., Edwards, R. L., and Cheng, H.: Oxygen isotope precipitation anomaly in the North Atlantic region during the 8.2 ka event, Geology, 37, 1095–1098, https://doi.org/10.1130/G30393A.1, 2009.
Domínguez-Villar, D., Wang, X., Krklec, K., Cheng, H., and Edwards, R. L.: The control of the tropical North Atlantic on Holocene millennial climate oscillations, Geology, 45, 303–306, https://doi.org/10.1130/G38573.1, 2017.
Dreybrodt, W. and Scholz, D.: Climatic dependence of stable carbon and oxygen isotope signals recorded in speleothems: From soil water to speleothem calcite, Geochim. Cosmochim. Ac., 75, 734–752, https://doi.org/10.1016/j.gca.2010.11.002, 2011.
Drysdale, R., Zanchetta, G., Hellstrom, J., Maas, R., Fallick, A., Pickett, M., Cartwright, I., and Piccini, L.: Late Holocene drought responsible for the collapse of Old World civilizations is recorded in an Italian cave flowstone, Geology, 34, 101–104, https://doi.org/10.1130/G22103.1, 2006.
Drysdale, R., Couchoud, I., Zanchetta, G., Isola, I., Regattieri, E., Hellstrom, J., Govin, A., Tzedakis, P. C., Ireland, T., Corrick, E., Greig, A., Wong, H., Piccini, L., Holden, P., and Woodhead, J.: Magnesium in subaqueous speleothems as a potential palaeotemperature proxy, Nat. Commun., 11, 5027, https://doi.org/10.1038/s41467-020-18083-7, 2020.
Drysdale, R. N., Zanchetta, G., Hellstrom, J. C., Fallick, A. E., and Cartwright, I.: Stalagmite evidence for the precise timing of North Atlantic cold events during the early last glacial, Geology, 35, 77–80, https://doi.org/10.1130/G23161A.1, 2007.
Ellison, C. R. W., Chapman, M. R., and Hall, I. R.: Surface and Deep Ocean Interactions During the Cold Climate Event 8200 Years Ago, Science, 312, 1929–1932, https://doi.org/10.1126/science.1127213, 2006.
Fairchild, I. J. and Baker, A.: Speleothem Science, John Wiley & Sons, Ltd, Chicherster, UK, ISBN 978-1-4443-6106-3, 2012.
Fairchild, I. J. and Treble, P. C.: Trace elements in speleothems as recorders of environmental change, Quaternary Sci. Rev., 28, 449–468, https://doi.org/10.1016/j.quascirev.2008.11.007, 2009.
Fairchild, I. J., Borsato, A., Tooth, A. F., Frisia, S., Hawkesworth, C. J., Huang, Y., McDermott, F., and Spiro, B.: Controls on trace element (Sr–Mg) compositions of carbonate cave waters: implications for speleothem climatic records, Chem. Geol., 166, 255–269, https://doi.org/10.1016/S0009-2541(99)00216-8, 2000.
Fairchild, I. J., Smith, C. L., Baker, A., Fuller, L., Spötl, C., Mattey, D., McDermott, F., and Edinburgh Ion Microprobe Facility: Modification and preservation of environmental signals in speleothems, Earth-Sci. Rev., 75, 105–153, https://doi.org/10.1016/j.earscirev.2005.08.003, 2006.
Fairchild, I. J., Spötl, C., Frisia, S., Borsato, A., Susini, J., Wynn, P. M., and Cauzid, J.: Petrology and geochemistry of annually laminated stalagmites from an Alpine cave (Obir, Austria): Seasonal cave physiology, Geol. Soc. Spec. Pub., London, 336, 295–321, https://doi.org/10.1144/SP336.16, 2010.
Fletcher, W. J., Debret, M., and Goñi, M. F. S.: Mid-Holocene emergence of a low-frequency millennial oscillation in western Mediterranean climate: Implications for past dynamics of the North Atlantic atmospheric westerlies, Holocene, 23, 153–166, https://doi.org/10.1177/0959683612460783, 2012.
Frisia, S., Borsato, A., Preto, N., and McDermott, F.: Late Holocene annual growth in three Alpine stalagmites records the influence of solar activity and the North Atlantic Oscillation on winter climate, Earth Planet. Sc. Lett., 216, 411–424, https://doi.org/10.1016/S0012-821X(03)00515-6, 2003.
García-Escárzaga, A., Gutiérrez-Zugasti, I., Marín-Arroyo, A. B., Fernandes, R., Núñez de la Fuente, S., Cuenca-Solana, D., Iriarte, E., Simões, C., Martín-Chivelet, J., González-Morales, M. R., and Roberts, P.: Human forager response to abrupt climate change at 8.2 ka on the Atlantic coast of Europe, Sci. Rep., 12, 6481, https://doi.org/10.1038/s41598-022-10135-w, 2022.
Genty, D., Baker, A., and Vokal, B.: Intra- and inter-annual growth rate of modern stalagmites, Chem. Geol., 176, 191–212, https://doi.org/10.1016/S0009-2541(00)00399-5, 2001.
Genty, D., Blamart, D., Ouahdi, R., Gilmour, M., Baker, A., Jouzel, J., and Van-Exter, S.: Precise dating of Dansgaard–Oeschger climate oscillations in western Europe from stalagmite data, Nature, 421, 833–837, https://doi.org/10.1038/nature01391, 2003.
Genty, D., Blamart, D., Ghaleb, B., Plagnes, V., Causse, C., Bakalowicz, M., Zouari, K., Chkir, N., Hellstrom, J., Wainer, K., and Bourges, F.: Timing and dynamics of the last deglaciation from European and North African δ13C stalagmite profiles – comparison with Chinese and South Hemisphere stalagmites, Quaternary Sci. Rev., 25, 2118–2142, https://doi.org/10.1016/j.quascirev.2006.01.030, 2006.
Godbout, P.-M., Roy, M., and Veillette, J. J.: High-resolution varve sequences record one major late-glacial ice readvance and two drainage events in the eastern Lake Agassiz-Ojibway basin, Quaternary Sci. Rev., 223, 105942, https://doi.org/10.1016/j.quascirev.2019.105942, 2019.
González-Sampériz, P., Utrilla, P., Mazo, C., Valero-Garcés, B., Sopena, M. C., Morellón, M., Sebastián, M., Moreno, A., and Martínez-Bea, M.: Patterns of human occupation during the early Holocene in the Central Ebro Basin (NE Spain) in response to the 8.2 ka climatic event, Quaternary Res., 71, 121–132, https://doi.org/10.1016/j.yqres.2008.10.006, 2009.
Gregoire, L. J., Payne, A. J., and Valdes, P. J.: Deglacial rapid sea level rises caused by ice-sheet saddle collapses, Nature, 487, 219–222, https://doi.org/10.1038/nature11257, 2012.
Heaton, T. J., Köhler, P., Butzin, M., Bard, E., Reimer, R. W., Austin, W. E. N., Bronk Ramsey, C., Grootes, P. M., Hughen, K. A., Kromer, B., Reimer, P. J., Adkins, J., Burke, A., Cook, M. S., Olsen, J., and Skinner, L. C.: Marine20 – The Marine Radiocarbon Age Calibration Curve (0–55 000 cal BP), Radiocarbon, 62, 779–820, https://doi.org/10.1017/RDC.2020.68, 2020.
Hellstrom, J.: U–Th dating of speleothems with high initial 230Th using stratigraphical constraint, Quat. Geochronol., 1, 289–295, https://doi.org/10.1016/j.quageo.2007.01.004, 2006.
Hellstrom, J. C.: Rapid and accurate U Th dating using parallel ion-counting multi-collector ICP-MS, J. Anal. Atom. Spectrom., 18, 1346–1351, https://doi.org/10.1039/B308781F, 2003.
Hendy, C. H.: The isotopic geochemistry of speleothems – I. The calculation of the effects of different modes of formation on the isotopic composition of speleothems and their applicability as palaeoclimatic indicators, Geochim. Cosmochim. Ac., 35, 801–824, https://doi.org/10.1016/0016-7037(71)90127-X, 1971.
Hillaire-Marcel, C., de Vernal, A., Bilodeau, G., and Weaver, A. J.: Absence of deep-water formation in the Labrador Sea during the last interglacial period, Nature, 410, 1073–1077, https://doi.org/10.1029/2007GL030396, 2001.
Hillaire-Marcel, C., de Vernal, A., and Piper, D. J. W.: Lake Agassiz Final drainage event in the northwest North Atlantic, Geophys. Res. Lett., 34, L15601, https://doi.org/10.1029/2007GL030396, 2007.
Huang, Y., Fairchild, I. J., Borsato, A., Frisia, S., Cassidy, N. J., McDermott, F., and Hawkesworth, C. J.: Seasonal variations in Sr, Mg and P in modern speleothems (Grotta di Ernesto, Italy), Chem. Geol., 175, 429–448, https://doi.org/10.1016/S0009-2541(00)00337-5, 2001.
Jennings, A., Andrews, J., Pearce, C., Wilson, L., and Ólfasdótttir, S.: Detrital carbonate peaks on the Labrador shelf, a 13–7 ka template for freshwater forcing from the Hudson Strait outlet of the Laurentide Ice Sheet into the subpolar gyre, Quaternary Sci. Rev., 107, 62–80, https://doi.org/10.1016/j.quascirev.2014.10.022, 2015.
Katz, A.: The interaction of magnesium with calcite during crystal growth at 25–90 ∘C and one atmosphere, Geochim. Cosmochim. Ac., 37, 1563–1586, https://doi.org/10.1016/0016-7037(73)90091-4, 1973.
Kim, S.-T. and O'Neil, J. R.: Equilibrium and nonequilibrium oxygen isotope effects in synthetic carbonates, Geochim. Cosmochim. Ac., 61, 3461–3475, https://doi.org/10.1016/S0016-7037(97)00169-5, 1997.
Lachniet, M. S.: Climatic and environmental controls on speleothem oxygen-isotope values, Quaternary Sci. Rev., 28, 412–432, https://doi.org/10.1016/j.quascirev.2008.10.021, 2009.
Lajeunesse, P. and St-Onge, G.: The subglacial origin of the Lake Agassiz–Ojibway final outburst flood, Nat. Geosci., 1, 184–188, https://doi.org/10.1038/ngeo130, 2008.
Li, Y.-X., Törnqvist, T. E., Nevitt, J. M., and Kohl, B.: Synchronizing a sea-level jump, final Lake Agassiz drainage, and abrupt cooling 8200 years ago, Earth Planet. Sc. Lett., 315–316, 41–50, https://doi.org/10.1016/j.epsl.2011.05.034, 2012.
Lochte, A. A., Repschläger, J., Kienast, M., Garbe-Schönberg, D., Andersen, N., Hamann, C., and Schneider, R.: Labrador Sea freshening at 8.5 ka BP caused by Hudson Bay Ice Saddle collapse, Nat. Commun., 10, 586, https://doi.org/10.1038/s41467-019-08408-6, 2019.
Ludwig, K.: User’s Manual for Isoplot 3.75. A Geochronological Toolkit for Microsoft Excel, Berkeley, CA, Berkeley Geochronological Center Special Publication No. 5, 2012.
Matero, I. S. O., Gregoire, L. J., Ivanovic, R. F., Tindall, J. C., and Haywood, A. M.: The 8.2 ka cooling event caused by Laurentide ice saddle collapse, Earth Planet. Sc. Lett., 473, 205–214, https://doi.org/10.1016/j.epsl.2017.06.011, 2017.
Mayewski, P. A., Rohling, E. E., Curt Stager, J., Karlén, W., Maasch, K. A., David Meeker, L., Meyerson, E. A., Gasse, F., van Kreveld, S., Holmgren, K., Lee-Thorp, J., Rosqvist, G., Rack, F., Staubwasser, M., Schneider, R. R., and Steig, E. J.: Holocene climate variability, Quaternary Res., 62, 243–255, https://doi.org/10.1016/j.yqres.2004.07.001, 2004.
McDermott, F.: Palaeo-climate reconstruction from stable isotope variations in speleothems: a review, Quaternary Sci. Rev., 23, 901–918, https://doi.org/10.1016/j.quascirev.2003.06.021, 2004.
Morellón, M., Aranbarri, J., Moreno, A., Gonzáalez-Sampériz, P., and Valero-Garcés, B. L.: Early Holocene humidity patterns in the Iberian Peninsula reconstructed from lake, pollen and speleothem records, Quaternary Sci. Rev., 181, 1–18, https://doi.org/10.1016/j.quascirev.2017.11.016, 2018.
Moreno, A., Stoll, H., Jiménez-Sánchez, M., Cacho, I., Valero-Garcés, B., Ito, E., and Edwards, R. L.: A speleothem record of glacial (25–11.6 kyr BP) rapid climatic changes from northern Iberian Peninsula, Global Planet. Change, 71, 218–231, https://doi.org/10.1016/j.gloplacha.2009.10.002, 2010.
Moreno, A., Pérez-Mejías, C., Bartolomé, M., Sancho, C., Cacho, I., Stoll, H., Delgado-Huertas, A., Hellstrom, J. C., Edwards, R. L., and Cheng, H.: New speleothem data from Molinos and Ejulve caves reveal Holocene hydrological variability in northeast Iberia, Quaternary Res., 88, 1–11, https://doi.org/10.1017/qua.2017.39, 2017.
Moreno, A., Iglesias, M., Azorin-Molina, C., Pérez-Mejías, C., Bartolomé, M., Sancho, C., Stoll, H., Cacho, I., Frigola, J., Osácar, C., Muñoz, A., Delgado-Huertas, A., Bladé, I., and Vimeux, F.: Measurement report: Spatial variability of northern Iberian rainfall stable isotope values – investigating atmospheric controls on daily and monthly timescales, Atmos. Chem. Phys., 21, 10159–10177, https://doi.org/10.5194/acp-21-10159-2021, 2021.
Morrill, C., Anderson, D. M., Bauer, B. A., Buckner, R., Gille, E. P., Gross, W. S., Hartman, M., and Shah, A.: Proxy benchmarks for intercomparison of 8.2 ka simulations, Clim. Past, 9, 423–432, https://doi.org/10.5194/cp-9-423-2013, 2013.
NOAA: Paleoclimatology Data, National Centers for Environmental Information, https://www.ncei.noaa.gov/access/paleo-search/, last access: 20 February 2022.
NOAA National Geophysical Data Center: ETOPO1 1 Arc-Minute Global Relief Model, NOOA National Centers for Environmental Information, https://www.ngdc.noaa.gov/ (last access: 24 February 2022), 2009.
North Grip Ice Core Project Members: High-resolution record of Northern Hemisphere climate extending into the last interglacial period, Nature, 431, 147–151, https://doi.org/10.1038/nature02805, 2004.
Parker, S. E. and Harrison, S. P.: The timing, duration and magnitude of the 8.2 ka event in global speleothem records, Sci. Rep., 12, 10542, https://doi.org/10.1038/s41598-022-14684-y, 2022.
Pèlachs, A., Julià, R., Pérez-Obiol, R., Soriano, J. M., Bal, M.-C., Cunill, R., and Catalan, J.: Potential influence of Bond events on mid-Holocene climate and vegetation in southern Pyrenees as assessed from Burg lake LOI and pollen records, Holocene, 21, 95–104, https://doi.org/10.1177/0959683610386820, 2011.
Pérez-Sanz, A., González-Sampériz, P., Moreno, A., Valero-Garcés, B., Gil-Romera, G., Rieradevall, M., Tarrats, P., Lasheras-Álvarez, L., Morellón, M., Belmonte, A., Sancho, C., Sevilla-Callejo, M., and Navas, A.: Holocene climate variability, vegetation dynamics and fire regime in the central Pyrenees: the Basa de la Mora sequence (NE Spain), Quaternary Sci. Rev., 73, 149–169, https://doi.org/10.1016/j.quascirev.2013.05.010, 2013.
PNOA© Instituto Geográfico Nacional: PNOA – Plan Nacional de Ortofotographía Aérea, Spanish Geographical Institute, https://pnoa.ign.es/ (last access: 2 February 2022), 2014.
Railsback, L. B., Liang, F., Romaní, J. R. V., Grandal-d'Anglade, A., Rodríguez, M. V., Fidalgo, L. S., Mosquera, D. F., Cheng, H., and Edwards, R. L.: Petrographic and isotopic evidence for Holocene long-term climate change and shorter-term environmental shifts from a stalagmite from the Serra do Courel of northwestern Spain, and implications for climatic history across Europe and the Mediterranean, Palaeogeogr. Palaeocl., 305, 172–184, https://doi.org/10.1016/j.palaeo.2011.02.030, 2011.
Rasmussen, S. O., Andersen, K. K., Svensson, A. M., Steffensen, J. P., Vinther, B. M., Clausen, H. B., Siggaard-Andersen, M.-L., Johnsen, S. J., Larsen, L. B., Dahl-Jensen, D., Bigler, M., Röthlisberger, R., Fischer, H., Goto-Azuma, K., Hansson, M. E., and Ruth, U.: A new Greenland ice core chronology for the last glacial termination, J. Geophys. Res.-Atmos., 111, D06102, https://doi.org/10.1029/2005JD006079, 2006.
Renssen, H., Goosse, H., Fichefet, T., and Campin, J.-M.: The 8.2 kyr BP event simulated by a Global Atmosphere – Sea-Ice–Ocean Model, Geophys. Res. Lett., 28, 1567–1570, https://doi.org/10.1029/2000GL012602, 2001.
Rodríguez-Arévalo, J., Diáz-Teijeiro, M. F., and Castaño, S.: Modelling and mapping oxygen-18 isotope composition of precipitation in Spain for hydrologic and climatic applications, in: Isotopes in Hydrology, Marine Ecosystems and Climate Change Studies (IAEA), Proceedings of an International Symposium, Monaco, 27 March–1 April 2011, 171–177, ISBN 978-92-0-135610-9, 2011.
Rohling, E. J. and Pälike, H.: Centennial-scale climate cooling with a sudden cold event around 8200 years ago, Nature, 434, 975–979, https://doi.org/10.1038/nature03421, 2005.
Rossi, C. and Lozano, R. P.: Hydrochemical controls on aragonite versus calcite precipitation in cave dripwaters, Geochim. Cosmochim. Ac., 192, 70–96, https://doi.org/10.1016/j.gca.2016.07.021, 2016.
Rossi, C., Bajo, P., Lozano, R. P., and Hellstrom, J.: Younger Dryas to Early Holocene paleoclimate in Cantabria (N Spain): Constraints from speleothem Mg, annual fluorescence banding and stable isotope records, Quaternary Sci. Rev., 192, 71–85, https://doi.org/10.1016/j.quascirev.2018.05.025, 2018.
Ruan, J. M.: Characterization of Holocene climate variability in the west of Europe and Mediterranean basin using high-resolution stalagmite records, PhD thesis, Sciences mécaniques et énergétiques, matériaux et géosciences & Météorologie, océanographie physique de l'environnement, L'Université Paris-Sud, Gif-Sur-Yvette, France, 2016SACLS223, https://www.sudoc.fr/195732987 (last access: 5 March 2022), 2016.
Smith, A. C., Wynn, P. M., Barker, P. A., Leng, M. J., Noble, S. R., and Tych, W.: North Atlantic forcing of moisture delivery to Europe throughout the Holocene, Sci. Rep., 6, 24745, https://doi.org/10.1038/srep24745, 2016.
Thomas, E. R., Wolff, E. W., Mulvaney, R., Steffensen, J. P., Johnsen, S. J., Arrowsmith, C., White, J. W. C., Vaughn, B., and Popp, T.: The 8.2 ka event from Greenland ice cores, Quaternary Sci. Rev., 26, 70–81, https://doi.org/10.1016/j.quascirev.2006.07.017, 2007.
Tindall, J. C. and Valdes, P. J.: Modeling the 8.2 ka event using a coupled atmosphere–ocean GCM, Global Planet. Change, 79, 312–321, https://doi.org/10.1016/j.gloplacha.2011.02.004, 2011.
Törnqvist, T. E. and Hijma, M. P.: Links between early Holocene ice-sheet decay, sea-level rise and abrupt climate change, Nat. Geosci., 5, 601–606, https://doi.org/10.1038/ngeo1536, 2012.
Tremaine, D. M. and Froelich, P. N.: Speleothem trace element signatures: A hydrologic geochemical study of modern cave dripwaters and farmed calcite, Geochim. Cosmochim. Ac., 121, 522–545, https://doi.org/10.1016/j.gca.2013.07.026, 2013.
Tzedakis, P. C., Drysdale, R. N., Margari, V., Skinner, L. C., Menviel, L., Rhodes, R. H., Taschetto, A. S., Hodell, D. A., Crowhurst, S. J., Hellstrom, J. C., Fallick, A. E., Grimalt, J. O., McManus, J. F., Martrat, B., Mokeddem, Z., Parrenin, F., Regattieri, E., Roe, K., and Zanchetta, G.: Enhanced climate instability in the North Atlantic and southern Europe during the Last Interglacial, Nat. Commun., 9, 4235, https://doi.org/10.1038/s41467-018-06683-3, 2018.
von Grafenstein, U., Erlenkeuser, H., Brauer, A., Jouzel, J., and Johnsen, S. J.: A Mid-European Decadal Isotope-Climate Record from 15 500 to 5000 Years B.P., Science, 284, 1654–1657, https://doi.org/10.1126/science.284.5420.1654, 1999.
Weiss, H., Courty, M.-A., Wetterstrom, W., Guichard, F., Senior, L., Meadow, R., and Curnow, A.: The Genesis and Collapse of Third Millennium North Mesopotamian Civilization, Science, 261, 995–1004, https://doi.org/10.1126/science.261.5124.995, 1993.
Wiersma, A. P. and Renssen, H.: Model–data comparison for the 8.2kaBP event: confirmation of a forcing mechanism by catastrophic drainage of Laurentide Lakes, Quaternary Sci. Rev., 25, 63–88, https://doi.org/10.1016/j.quascirev.2005.07.009, 2006.
Zielhofer, C., Köhler, A., Mischke, S., Benkaddour, A., Mikdad, A., and Fletcher, W. J.: Western Mediterranean hydro-climatic consequences of Holocene ice-rafted debris (Bond) events, Clim. Past, 15, 463–475, https://doi.org/10.5194/cp-15-463-2019, 2019.