the Creative Commons Attribution 4.0 License.
the Creative Commons Attribution 4.0 License.
 | 12 Oct 2022
Early Eocene carbon isotope excursions in a lignite-bearing succession at the southern edge of the proto-North Sea (Schöningen, Germany)
Mara Montag
Volker Wilde
Katharina Methner
Walter Riegel
Andreas Mulch
Situated at the southern edge of the proto-North Sea, the lower Eocene Schöningen Formation of the Helmstedt Lignite Mining District, Lower Saxony, Germany, is characterized by several lignite seams alternating with estuarine to brackish interbeds. Here, we present carbon isotope data for bulk organic matter (δ13CTOC), total organic carbon content (%TOC), and palynomorphs from a 98 m thick sequence of the Schöningen Formation in combination with a new robust age model, which is based on eustatic sea level changes, biostratigraphy, and a correlation with existing radiometric ages. Based on the δ13CTOC data we observe six negative carbon isotope excursions (CIEs) reflecting massive short-term carbon cycle perturbations. A strong CIE of −2.6 ‰ in δ13CTOC values in the Main Seam and the succeeding marine interbed can be related to the Paleocene–Eocene Thermal Maximum (PETM). The subsequent CIE of −1.7 ‰ in δ13CTOC values may be correlated with the Eocene Thermal Maximum 2 (ETM2) or slightly older events preceding the ETM2. High-amplitude climate fluctuations including at least four minor CIEs with a maximum negative shift of −1.3 ‰ in δ13CTOC in the upper part of the studied section are characteristic of the Early Eocene Climatic Optimum (EECO). Palynological analysis across the Main Seam proved that shifts in δ13CTOC values are correlated with changes in the peat-forming wetland vegetation, specifically the change from a mixed angiosperm and gymnosperm flora to angiosperm-dominated vegetation at the onset of the PETM. The PETM-related CIE shows a distinct rebound to higher δ13CTOC values shortly after the onset of the CIE, which is recognized here as a common feature of terrestrial and marginal marine PETM records worldwide and may reflect a stepwise injection of carbon into the atmosphere.
- Article
(5545 KB) - Full-text XML
-
Supplement
(3127 KB) - BibTeX
- EndNote


The early Paleogene was characterized by a long-term warming trend that culminated in the Early Eocene Climatic Optimum (EECO; Zachos et al., 2001) between ca. 53.3 and 49.1 Myr before present (Westerhold et al., 2018b). However, this long-term warming trend was interrupted by several short-term thermal events. These events were characterized by perturbations in the global carbon cycle, which are represented by negative carbon isotope excursions (CIEs), caused by the rapid and massive input of 13C-depleted carbon into the atmosphere–ocean system (e.g., Kennett and Stott, 1991; Dickens, 2001; Cramer et al., 2003; Lourens et al., 2005; Zachos et al., 2003, 2008, 2010; Sluijs and Dickens, 2012; Kirtland Turner et al., 2014). The most prominent of these excursions was the Paleocene–Eocene Thermal Maximum (PETM) or Eocene Thermal Maximum 1 (ETM1) at 55.93 Myr before present (e.g., Kennett and Stott, 1991; Bains et al., 2000; Röhl et al., 2000; Westerhold et al., 2017), characterized by a sudden temperature peak at the transition from the Paleocene to the Eocene that lasted for about 170 ± 30 kyr (Röhl et al., 2007; Westerhold et al., 2017; Zeebe and Lourens, 2019). During this event, the global mean surface temperature (GMST) increased from 22 to 28 ∘C in the latest Paleocene to 27 to 35 ∘C in the earliest Eocene (Inglis et al., 2020). Assuming a pre-industrial GMST of 14 ∘C, this is about 17 ∘C warmer than pre-industrial (Inglis et al., 2020). This temperature increase led to a sea level rise of 3 to 5 m (Sluijs et al., 2008), and both marine and continental ecosystems changed noticeably on a global scale (Gingerich, 2006; McInerney and Wing, 2011). However, the PETM was hardly an extinction event but rather a “kick-starting event” with regard to evolution (Speijer et al., 2012), especially among vertebrates (e.g., mammals; Gingerich, 2006; Hooker and Collinson, 2012) and plants (Wing et al., 2005; Jaramillo et al., 2010; McInerney and Wing, 2011).
Understanding the PETM is of high interest due to its potential to inform predictions of the effects of present and future global warming that can be expected due to the emission of greenhouse gases from the burning of fossil fuels (McCarren et al., 2008; Zachos et al., 2005; Zeebe et al., 2016). In particular, the long-term effects and responses of ecosystems on a millennial scale can be studied in marine as well as in terrestrial PETM records. However, there is still a need to study the impact of global warming on the respective ecosystems, especially in well-constrained high-resolution terrestrial records.
During the early Eocene the PETM was followed by a number of other short-term thermal events (see Cramer et al., 2003; Westerhold et al., 2017). Among those the ETM2 (54.05 Myr before present; Lourens et al., 2005; Sluijs et al., 2009; Westerhold et al., 2017, 2018b) and the ETM3 (X or K event; 52.85 Myr before present; Cramer et al., 2003; Röhl et al., 2005; Westerhold et al., 2017, 2018b) events are well pronounced in marine isotope records but did not reach the intensity of the PETM. However, their impact on terrestrial environments and ecosystems is yet not well understood (Abels et al., 2016).
Meanwhile, more than 25 other short-term CIEs have been recognized in marine records from the Atlantic (Sexton et al., 2011; Kirtland Turner et al., 2014) and the Pacific (Westerhold et al., 2018b) for the period between 56 and 45 Ma. At least four of them (H1, H2, I1, I2) were apparently orbitally controlled and tied to short eccentricity maxima (Abels et al., 2016). Other short-term CIEs of the lower Eocene (including the PETM) also show a striking coincidence with short and long eccentricity cycles (Westerhold et al., 2018b; Zeebe and Lourens, 2019).
The long-term warming phase of the EECO included a whole series of early Eocene CIE-related thermal events (Westerhold et al., 2018b) with its beginning placed at the J event at 53.62 Ma (Lauretano et al., 2015; Westerhold et al., 2018b). During the peak of the EECO the GMST was 10 to 16 ∘C warmer than today but did not reach the GMST of the PETM (Inglis et al., 2020). The succeeding onset of global cooling at 49.14 Ma led to a steady but slow decline in temperature until the Eocene–Oligocene boundary where the sudden shift from the Paleogene greenhouse system to the actual icehouse system occurred (Zachos et al., 2008; Westerhold et al., 2020). The middle and late Eocene cooling trend was interrupted only by a few short-term warming events (Westerhold et al., 2018b), such as the Late Lutetian Thermal Maximum (LLTM) at 41.52 Ma (Westerhold et al., 2018a) and the Middle Eocene Climatic Optimum (MECO; Bohaty and Zachos, 2003) between 40.6 and 40.0 Ma (Bohaty et al., 2009; Mulch et al., 2015; Methner et al., 2016). Compared to the other Eocene thermal events the MECO does not show a prominent CIE in most of its records (Bohaty et al., 2009; Giorgioni et al., 2019), which, together with a relatively long duration of ∼ 500 kyr, indicates that it was most probably triggered by factors other than the rapid release of (organic) carbon to the atmosphere (Giorgioni et al., 2019).
Despite high-resolution records of the short- and long-term warming events of the Paleogene greenhouse from deep oceans, the spatial effects of most of these hyperthermals are only poorly understood due to inadequate data coverage (Westerhold et al., 2018b). In particular, there are only a few records providing insight into the response of terrestrial ecosystems (e.g., Jaramillo et al., 2010; Xie et al., 2022). Long-term terrestrial carbon isotope records covering the Paleocene and the lower Eocene are only available from the Bighorn Basin, Wyoming, USA (e.g., Gingerich, 2006; Abels et al., 2012, 2016). Other isotope records are confined to the PETM, such as those from some sections in China (Nanyang Basin; Zhu et al., 2010), Colombia (Jaramillo et al., 2010), and Europe (Cobham Lignite, Great Britain; Collinson et al., 2003; Vasterival, northern France; Storme et al., 2012).

Figure 1(a) Paleogeographic map of northwestern Europe during the early and middle Eocene (adapted from Ziegler, 1990) showing the area of the Helmstedt Mining District (“H”) at the southern coast of the proto-North Sea. (b) Cross-section through the study area, showing the Helmstedt–Staßfurt salt wall and related synclines (modified after Brandes et al., 2012). (c) Generalized scheme of the Paleogene succession in the western syncline of the Helmstedt Mining District (adapted from Brandes et al., 2012; Lenz et al., 2021). The blue and red lines indicate the stratigraphic position of the studied sections.
The sedimentary succession of the former Helmstedt Lignite Mining District almost continuously covers the entire Paleogene greenhouse phase in the so-called Helmstedt Embayment at the southern edge of the proto-North Sea (Lenz, 2005; Riegel et al., 2012, 2015) (Fig. 1). This offers the rare opportunity to study Paleocene–Eocene near-coastal ecosystems which preserved the effects of long- and short-term climate perturbations across more than 10 million years.
Here, we present a new and robust stratigraphic framework for the succession of the Helmstedt Mining District at Schöningen based on biostratigraphy (dinoflagellate cysts) and comparison with the standard eustatic sea level curves. Carbon isotope analyses of bulk organic matter (δ13CTOC) and organic carbon content (%TOC) from the lower part of the Schöningen Formation now significantly extend the existing carbon isotope stratigraphy (Methner et al., 2019) and allow identifying CIEs in the record that can now be correlated with known thermal events such as the PETM and the EECO.
The Helmstedt Lignite Mining District is situated within the Paleogene Helmstedt Embayment (Fig. 1a) that represented the mouth of the Mid-German Estuary (Standke, 2008b; Standke et al., 2010) opening towards the proto-North Sea between uplifts corresponding to today's Harz Mountains in the south and the Flechtingen Rise in the north (Brandes et al., 2012). At times, the estuary reached more than 100 km inland, forming the so-called Leipzig Embayment (Blumenstengel and Krutzsch, 2008; Standke, 2008a). Due to the interplay of eustatic changes in sea level, salt withdrawal from the subsurface, and climate-related changes in runoff from the hinterland frequent changes between terrestrial and marine conditions characterized the region and are now preserved in the unique succession of lignites and interbeds in the Paleogene of the Helmstedt Lignite Mining District (Riegel et al., 2012; Wilde et al., 2021).
The Paleogene deposits of the Helmstedt Lignite Mining District are limited to two marginal synclines, which are separated by a narrow core of upper Permian (Zechstein) rocks belonging to the Helmstedt–Staßfurt salt wall (Fig. 1b; Brandes et al., 2012). A nearly 400 m thick succession in both synclines unconformably follows on Mesozoic sediments of Upper Triassic and Lower Jurassic age (e.g., Stottmeister, 2007). In the western syncline the Paleogene sequence can be subdivided into the Waseberg Formation (underlying sediments), the Schöningen Formation (Lower Seam Group), the Helmstedt Formation (Upper Seam Group), and the overlying marine strata of the Annenberg, Gehlberg, and Silberberg formations (Fig. 1c; Gramann et al., 1975; Gürs, 2005; Riegel et al., 2012). The greensand of the Emmerstedt Formation between the Schöningen and Helmstedt formations is limited to the northwestern part of the syncline but missing at the Schöningen locality. Previous age constraints for the succession were restricted to scattered biostratigraphic data from nannoplankton (Gramann et al., 1975), dinocysts (Köthe, 2003), and palynomorphs (Pflug, 1952, 1986) together with some radiometric ages and dinocyst occurrences from a core at Emmerstedt in the eastern syncline ca. 20 km north of Schöningen (Ahrendt et al., 1995). The isolated data have been applied to both synclines simply by means of lithologic correlation, suggesting a lower Eocene (Ypresian) age for the Schöningen Formation and a middle Eocene (Lutetian) age for the Helmstedt Formation (Fig. 1c).
The Schöningen Formation, as formerly exposed in the opencast mine Schöningen Südfeld (Fig. 1c) of the western syncline, has a thickness of about 150 m, including nine laterally continuous lignite seams (Main Seam to seam 9) and some additional seams of limited extent, including “Seam L” and the “Sphagnum Seam” (Riegel et al., 2012; Riegel and Wilde, 2016). The Helmstedt Formation of the western syncline at Schöningen is composed of three lignite seams, the lower seam (“Unterflöz” or Seam 9; Riegel et al., 2012), Seam Viktoria, and Seam Treue (Fig. 1c).
It has previously been argued that the lower part of the Schöningen Formation at Schöningen covers the PETM since the shallow marine deposits of Interbed 2 between Seams 1 and 2 (Fig. 1b) reveal a conspicuous peak in the abundance of dinoflagellate cysts of the genus Apectodinium (Riegel et al., 2012). Since an Apectodinium acme with abundant Apectodinium augustum (now Axiodinium augustum; Williams et al., 2015) is generally accepted as an indicator of the PETM in middle- to high-latitude marine records (e.g., Bujak and Brinkhuis, 1998; Crouch et al., 2001; Heilmann-Clausen et al., 1985; Iakovleva et al., 2001; Sluijs and Brinkhuis, 2009; Sluijs et al., 2007), the first study to locate the PETM-related CIE at Schöningen concentrated on a section from Seam 1 to Seam 2 (Methner et al., 2019). The study indeed recorded a CIE ranging from the top of Seam 1 into the base of Seam 2; however, Axiodinium augustum is missing among the Apectodinium assemblage of Interbed 2. Therefore, the CIE could not unequivocally be related to the PETM, and a down-section extension of the isotope record was needed.
3.1 Studied section
During active mining in the western syncline of the Helmstedt Lignite Mining District excellent outcrops existed until 2016 in the now-abandoned opencast mines at Schöningen. Between 2005 and 2016 a comprehensive archive of more than 2000 samples was acquired from more than 50 individual sections that is now hosted in the Senckenberg Research Institute and Natural History Museum, Frankfurt. For the present study 211 samples from the former opencast mine Schöningen Südfeld were selected for carbon isotope analyses in addition to the 121 samples of Methner et al. (2019). The isotope dataset now ranges from the base of the Main Seam to the base of Interbed 7 (Fig. 1c), thereby covering the latest Paleocene and much of the lower Eocene. Due to accessibility in the active mine, the 98 m isotope record had to be composed from seven individual sections (for a description see Sect. S1 in the Supplement); however, continuity was confirmed by lateral tracing of beds. For pollen analysis 105 samples of a section from the Main Seam in the adjacent former opencast mine Schöningen Nordfeld were studied (for description of the section see Hammer-Schiemann, 1998). Cysts of dinoflagellates have been studied in four samples from Interbed 1, eight samples from Interbed 2, and two samples from the base of Interbed 3 in the former opencast mine Schöningen Südfeld.
3.2 Carbon isotope analyses
Together with the 121 samples of Methner et al. (2019) a %TOC and δ13CTOC record of 332 samples with an average sample spacing of ∼ 29.5 cm is now available for the lower 98 m of the Schöningen Formation at Schöningen. Sample preparation included freeze-drying, grinding, removal of inorganic carbon (using 10 % HCl for 24 h at 40 ∘C), centrifugation (4× at 2800 to 3000 rpm for 4 to 8 min), and sample drying (24 h at 40 ∘C). About ∼ 0.2 mg of lignite and up to ∼ 6 mg of clastics from the marine interbeds were analyzed with a Flash EA 1112 that was coupled to a Thermo Fisher MAT 253 gas-source isotope ratio mass spectrometer at the Goethe University–Senckenberg BiK-F Joint Stable Isotope Facility (Frankfurt). An uncertainty of 0.2 ‰ was indicated for measured δ13CTOC values by analyzing USGS 24 and IAEA-CH-7 standard materials on a daily basis and replicate measurements of reference materials and samples. The total organic carbon concentrations (in %) have been calculated by relating the signal size of the samples and the averaged signal size of the daily standards (USGS 24, n = 8). A typical error of ∼ 0.5 % based on mass spectrometric analysis and maximum differences of ∼ 7 % in TOC contents of replicate measurements (including weighing uncertainties) was detected.
3.3 Palynological analyses
Palynological preparation of lignite and interbed samples followed standard procedures as described by Hammer-Schiemann (1998) including treatment with hot 30 % hydrogen peroxide (H2O2) and 10 % potassium hydroxide (KOH). Clastic interbed samples were treated with 38 % hydrofluoric acid (HF) for several days. All samples were sieved through a 10 µm mesh sieve and the residues stored in glycerine. For light microscopy permanent glycerine jelly slides were produced. Remaining sample material, residues, and slides are stored at the Senckenberg Research Institute and Natural History Museum, Frankfurt.
To obtain a representative dataset for the Main Seam, at least 300 individual grains of pollen and spores were counted per sample at 400× magnification (raw and percentage data in Tables S3–S4 in the Supplement). The palynomorphs were mainly identified based on the systematic–taxonomic studies of Thomson and Pflug (1953), Krutzsch (1970), Thiele-Pfeiffer (1988), Nickel (1996), Hammer-Schiemann (1998), and Lenz (2005). The simplified pollen diagram shows the abundance of the most important palynomorphs in percentages.
For biostratigraphy, dinoflagellate cysts have been studied qualitatively in the interbeds. Their identification is mainly based on Köthe (1990) and Gedl (2013), and stratigraphic ranges are taken from Köthe and Piesker (2007).
4.1 Age model
An accurate age model is a prerequisite for the identification of specific CIEs in the isotope record at Schöningen. Previous age assignments for the succession at Schöningen (Riegel et al., 2012; Brandes et al., 2012) were based on lithologic correlation with drill cores in the eastern syncline near Emmerstedt, ca. 20 km north of Schöningen, which were dated radiometrically and biostratigraphically (Ahrendt et al., 1995). K Ar ages of glauconites are available for the middle part of the Schöningen Formation (52.8 ± 1.4 Ma) and for its top (49.9 ± 1.2 Ma) (Ahrendt et al., 1995). Transferring the age of 46.0 ± 1.2 Ma for the base of the Emmerstedt Greensand (Emmerstedt Formation; Ahrendt et al., 1995) to the Schöningen succession is hampered by the lack of greensand in an equivalent position. However, the interbed between Seam 8 at the top of the Schöningen Formation and Seam 9 at the base of the Helmstedt Formation can most probably be regarded as age equivalent (Riegel et al., 2012).
4.1.1 Dinoflagellates
Dinoflagellate cyst assemblages from marine horizons at Emmerstedt (Ahrendt et al., 1995) indicate that the Schöningen Formation can be assigned to the lower Eocene dinoflagellate zones D5b to D9na for northwestern Germany (Costa and Manum, 1988; Köthe, 1990, 2003). Cysts of dinoflagellates have also been recorded in interbeds with marine influence at Schöningen, but their provisional assignment to dinoflagellate zones by Riegel et al. (2012) is slightly modified here.
Table 1List of identified dinoflagellate cyst taxa in Interbed 1, Interbed 2, and the base of Interbed 3 of the Schöningen Formation in the western syncline of the Helmstedt Mining District.

The three Interbeds 1, 2, and 3 from the lower part of the Schöningen Formation include dinoflagellate cyst assemblages of low diversity with the dominance of a few species (Table 1, Figs. S2–S4 in the Supplement).
Interbed 1 is characterized by an essentially monogeneric assemblage of Apectodinium species with a dominance of A. homomorphum but common occurrences of A. parvum. Only single specimens of Homotryblium sp. and Glaphyrocysta sp. have been observed. On this basis Interbed 1 can be assigned to either zone D5 or the lower part of D6 (D6na). Zone D5 has been subdivided into subzones D5na and D5nb (Köthe, 1990), whereby subzone D5na is characterized by the occurrence of Axiodinium augustum (formerly Apectodinium augustum), which is the diagnostic species for the PETM. However, since A. augustum obviously represents an open marine species it is generally missing in the more marginal marine sediments of northwestern Germany (Köthe, 1990, 2003), including those at Schöningen. Nevertheless, instead of A. augustum the PETM interval in the Paris and Dieppe–Hampshire basins contains A. parvum in high numbers. Therefore, the latter species probably represents an ecological substitute for A. augustum in marginal marine environments at the edge of the southern proto-North Sea (Iakovleva et al., 2021). Since A. parvum is common in the lower part of Interbed 1, this suggests that Interbed 1 can be assigned to zone D5na.
Interbed 2 is characterized by a distinct acme of Apectodinium species but also includes a number of other taxa, e.g., Thalassiphora pelagica, Cordosphaeridium sp., Glaphyrocysta sp., and a single specimen of the Cleistosphaeridium placacanthum/ancyreum group. Although the latter reaches the first peak in zone D7na, single specimens may appear as early as zone D5. Thus, based on the mass occurrence of Apectodinium Interbed 2 can best be assigned to zone D5 or the lower part of zone D6 (D6na). The lack of wetzelielloid cysts other than Apectodinium, i.e., Wetzeliella spp. and Dracodinium spp., which are diagnostic for zone D6, may be attributed to the estuarine environment at Schöningen, which did not include the full range of marine dinoflagellates as known from the Eocene North Sea Basin. This precludes a precise delimitation of zones D5 and D6 and a detailed comparison of the Schöningen assemblage with the Eocene North Sea dinocyst zonation of Bujak and Mudge (1994).
Compared to Interbeds 1 and 2 the base of Interbed 3 is characterized by a higher diversity of dinoflagellate cysts (Table 1, Fig. 2), mainly with long-ranging species. Some of them have their first occurrence in the Paleocene or range into the Oligocene or even Miocene (Fig. 2). The stratigraphic significance of the respective dinoflagellate cyst assemblage is therefore relatively low, and only Apectodinum homomorphum as a single representative of the genus limits the range of Interbed 3 to an interval covering zones D7na to D9na. The lack of fully marine taxa is again striking. Cysts of dinoflagellate ecogroups indicating near-coastal shallow-water areas with fluctuating salinities (Köthe, 1990) such as Thalassiphora or Homotryblium dominate. Among the wetzelielloid cysts the genera Deflandrea or Ceratiopsis, which frequently occur in lower Eocene deposits of the southern North Sea Basin except for zone D7na (Köthe, 1990), are completely missing in Interbed 3. Since our evidence of dinocyst occurrences is, thus far, largely restricted to its base, this may be a hint that at least this part of Interbed 3 is within zone D7na.
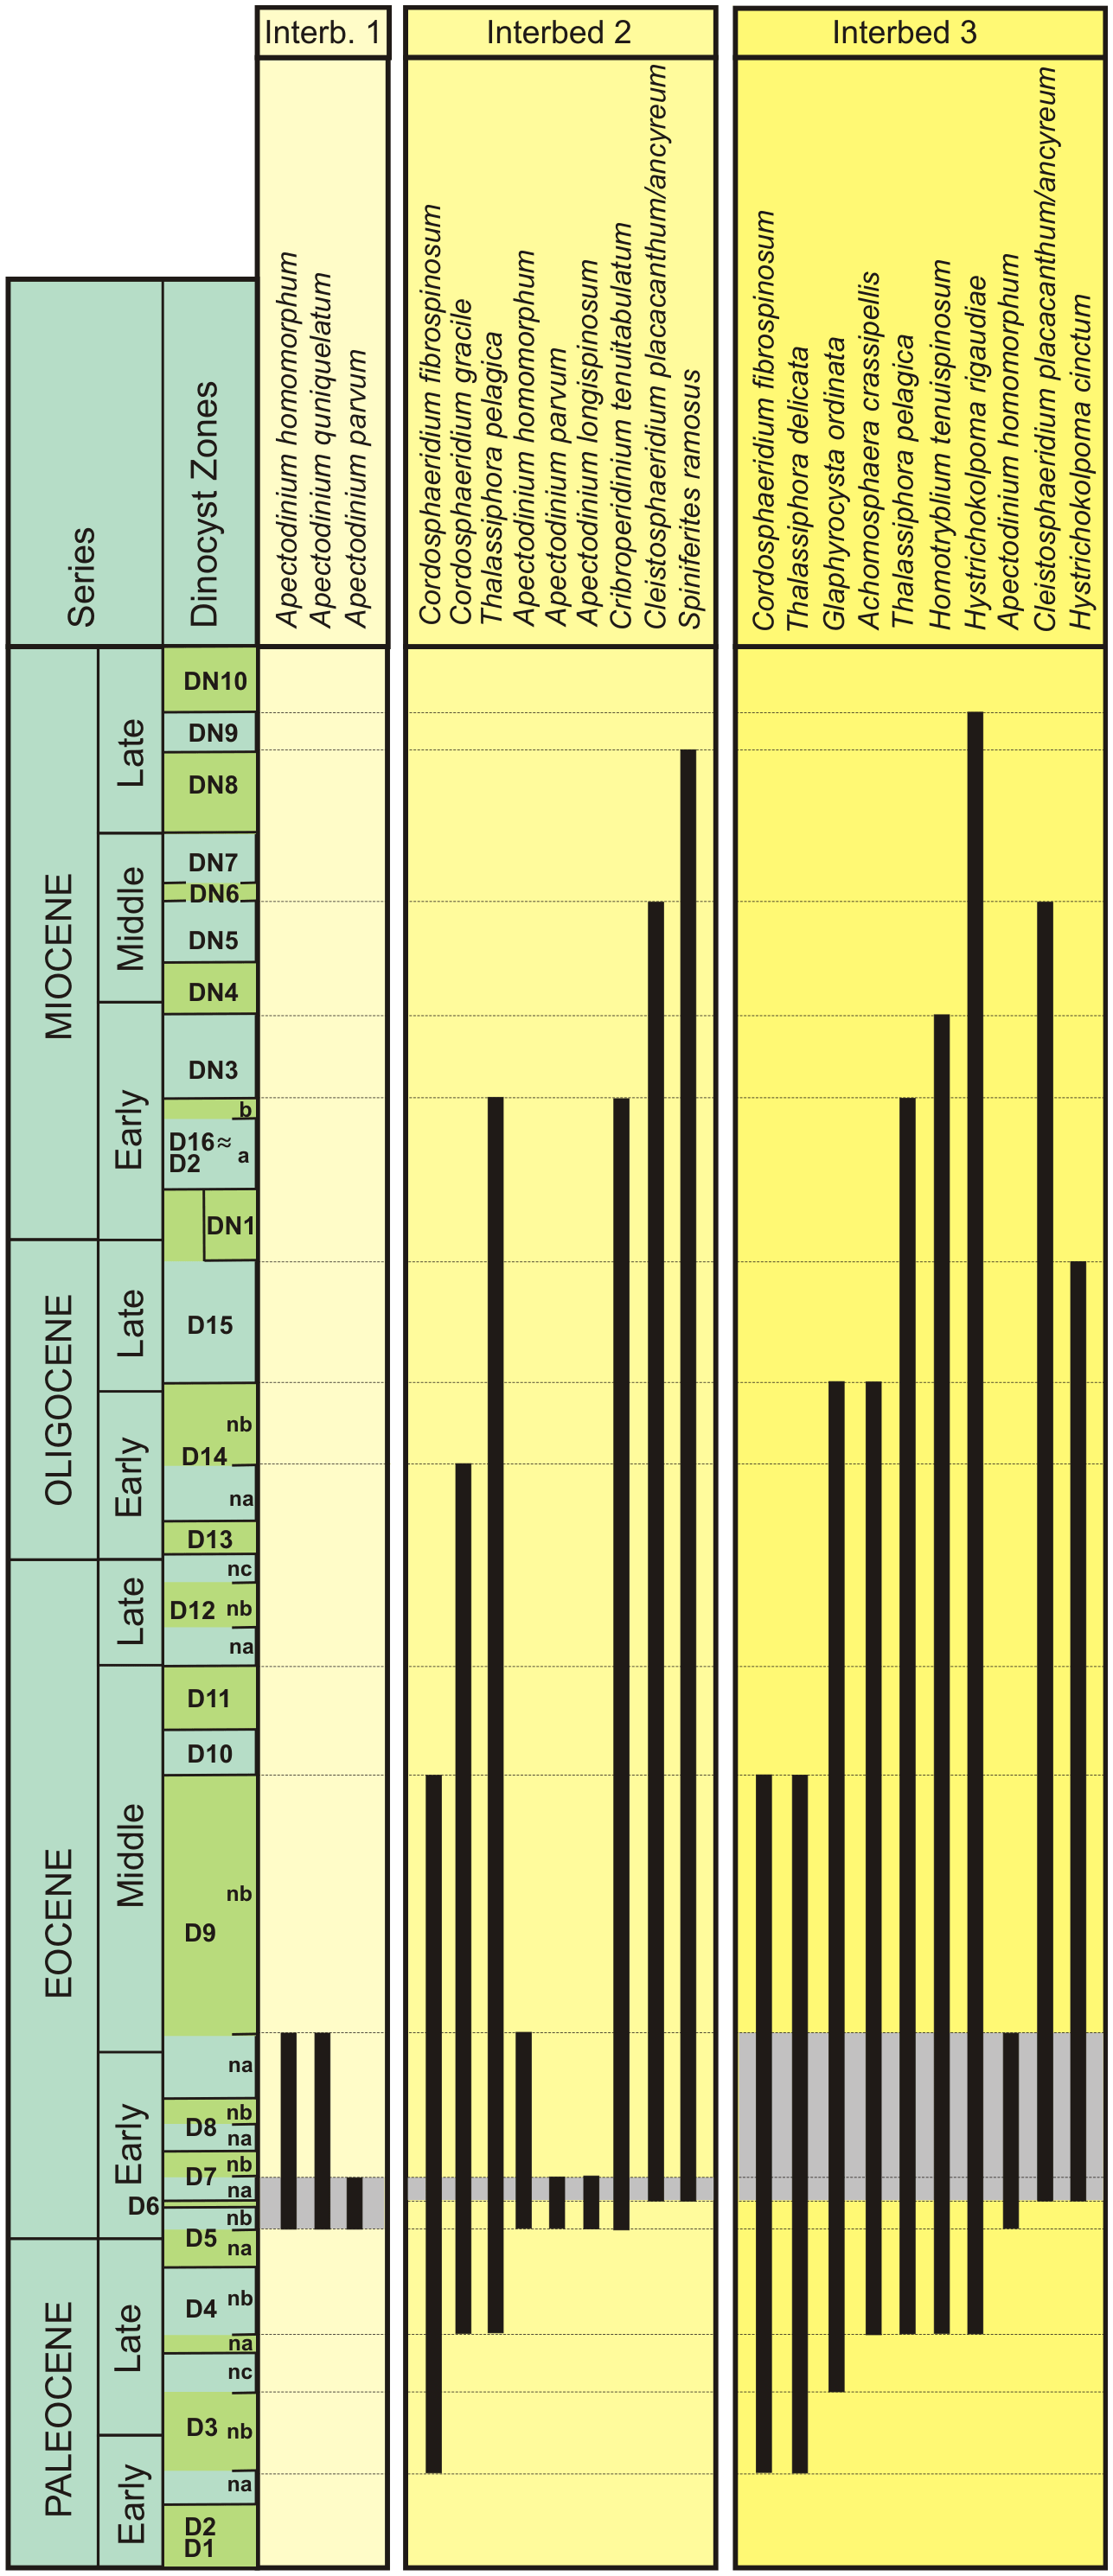
Figure 2Stratigraphic range of dinoflagellates identified in Interbed 1, Interbed 2, and at the base of Interbed 3 using the dinoflagellate zones of Köthe (2003) and Köthe and Piesker (2007).
In summary, Interbed 1 can be assigned to dinoflagellate zone D5na/nb; Interbed 2 includes zones D5nb and D6na, and Interbed 3 includes zone D7na. This clearly indicates that the lower two interbeds are of lowermost Eocene age. Since zone D5na may be identified at the base of Interbed 1 based on the common occurrence of Apectodinium parvum as an onshore substitute for Axiodinium augustum, which is otherwise diagnostic of the PETM (Iakovleva et al., 2021), the Paleocene–Eocene boundary is expected to be situated below within the Main Seam.
4.1.2 Eustatic sea level
Another approach to generate a stratigraphic framework for the Schöningen and Helmstedt formations is provided by matching the alternation of lignites and marine interbeds of the Eocene succession at Schöningen with established sea level curves (Haq et al., 1987a, b, 1988; Miller et al., 2005a; Kominz et al., 2008) for the period between 57 and 41 Ma (Fig. 3). Even if variations in global sea level were modified at Schöningen by local and regional factors such as subsurface salt withdrawal and fluctuations of sedimentary input (Wilde et al., 2021), there is still a good correspondence between times of low sea level and peat accumulation, allowing for a relatively precise age assignment of the lignite seams (Fig. 3). Furthermore, these ages fit the K Ar ages from the drill core at Emmerstedt, ca. 20 km N of Schöningen (Ahrendt et al., 1995).
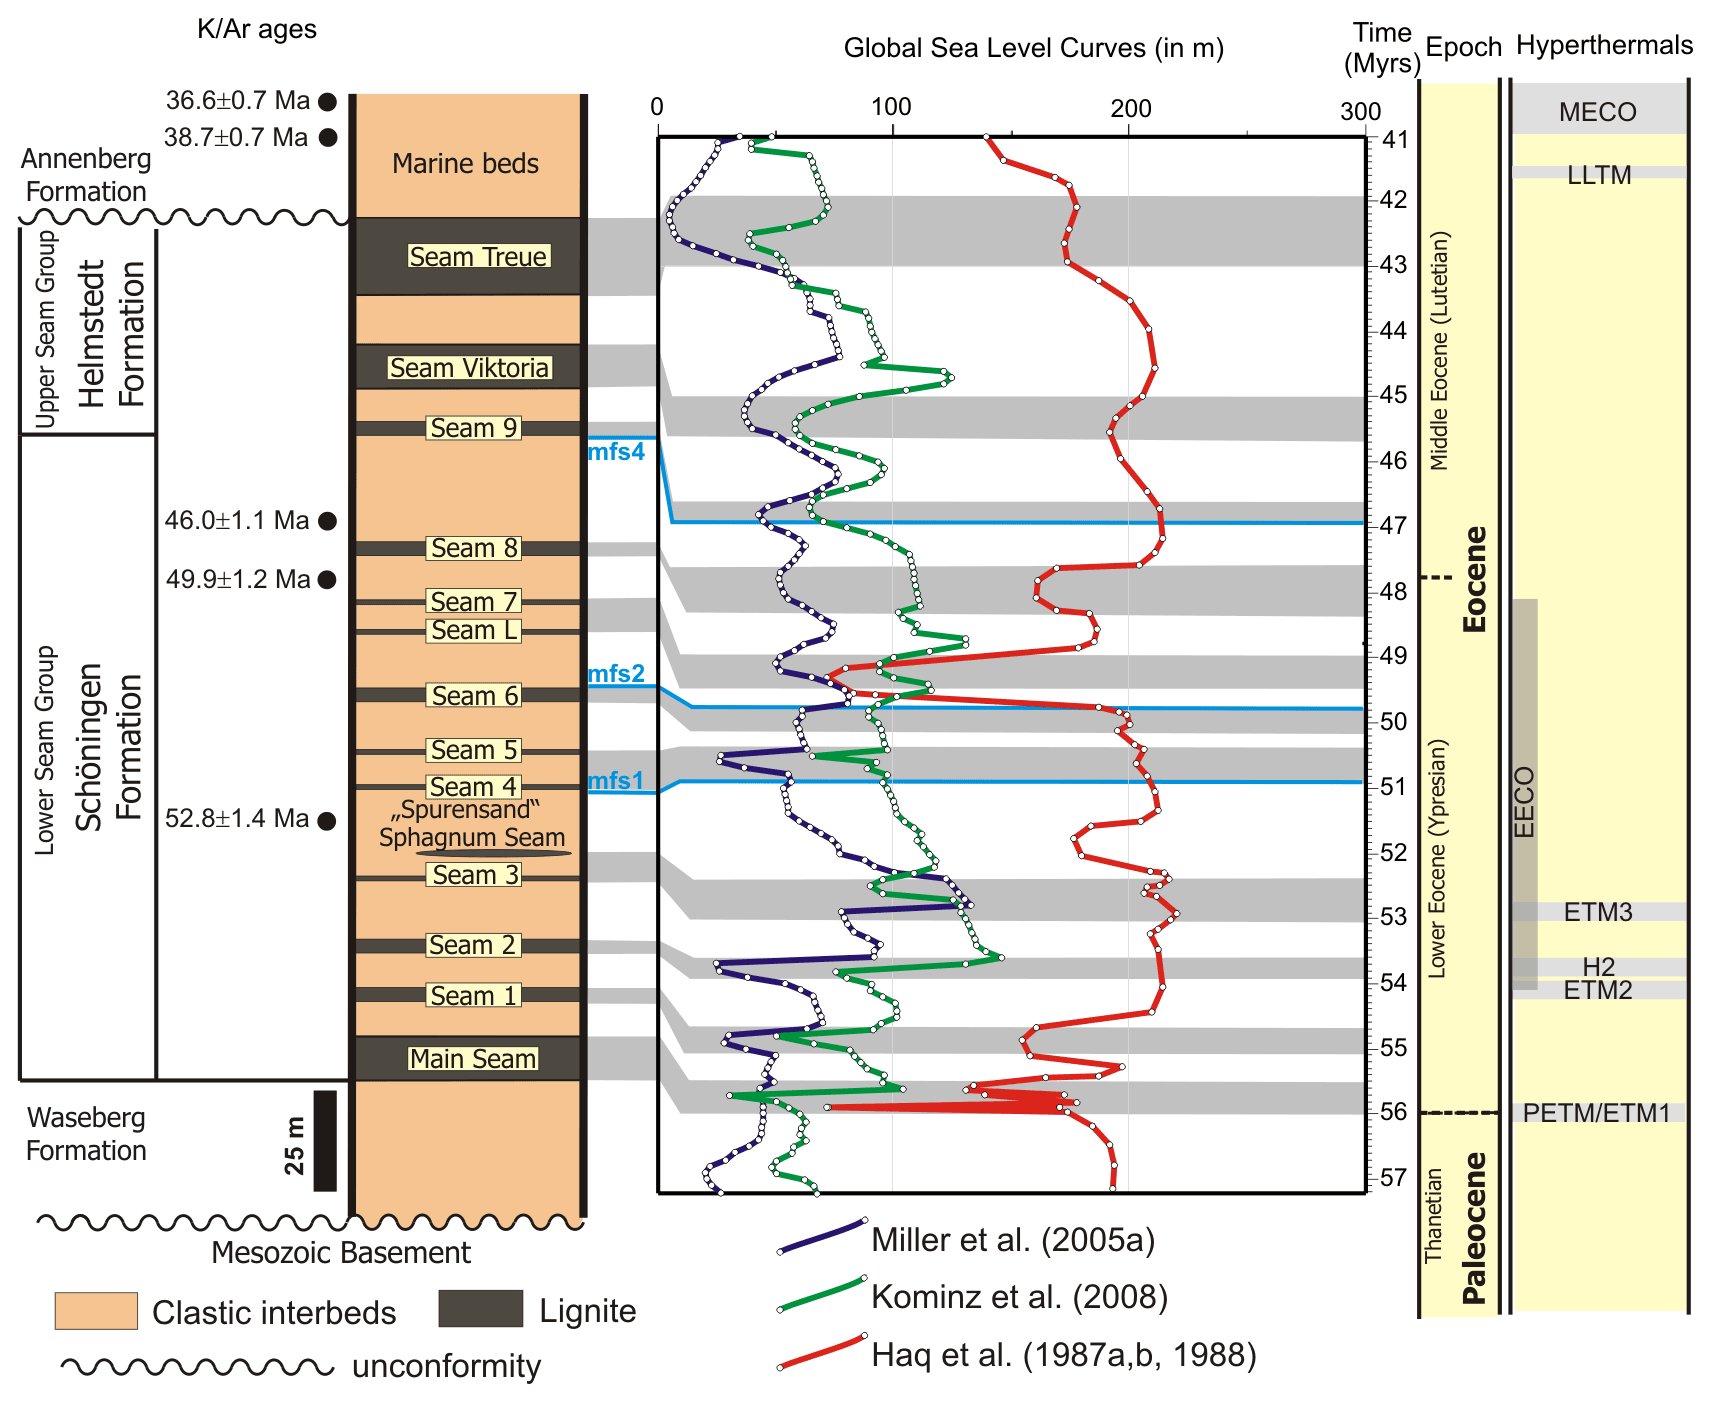
Figure 3Possible correlation of peat accumulation phases and lignite seams at Schöningen with lowstands of global sea level using the sea level curves of Haq et al. (1987a, b, 1988), Miller et al. (2005a), and Kominz et al. (2008). Ages for the Haq et al. (1987a, b, 1988) curve are taken from Miller et al. (2005a). K Ar ages have been taken from Ahrendt et al. (1995). Positions for maximum flooding surfaces (mfs 1, 2, and 4) were given by Osman et al. (2013). Mfs 3 cannot be indicated since it is related to the Emmerstedt Formation, which is missing between the Schöningen and Helmstedt formations at the Schöningen locality. Abbreviations of hyperthermals: PETM – Paleocene Eocene Thermal Maximum; ETM 1, 2, 3 – Eocene Thermal Maximum 1, 2, 3; H2 – H2 event; EECO – Early Eocene Climatic Optimum; LLTM – Late Lutetian Thermal Maximum; MECO – Middle Eocene Climatic Optimum. Hyperthermal references are given in the text.
The lower three interbeds, Interbeds 1 to 3, were deposited in an estuarine system with tidally influenced estuarine channels. An upward increase in marine influence as recorded by the increasing diversity of the dinoflagellate cyst assemblages (Fig. 2) indicates an overall deepening-upward trend representing a retrogradational system (Dalrymple and Choi, 2007; Osman et al., 2013). For the corresponding period between 56 and 53.5 Ma, all three sea level curves show a general increase in the sea level and an overall transgressive trend interrupted by short episodes of regression, which can be matched with Seams 1 and 2 at Schöningen (Fig. 3). Therefore, an age of more than 53.5 Ma can be assumed for the three lower seams, which corresponds well with the lowermost Eocene age assigned to the dinocyst zones D5nb to D7na of Interbeds 1 to 3. Therefore, an age of ∼ 56 Ma is suggested for the Main Seam, which again indicates that it most probably represents the transition from the Paleocene to the Eocene including the PETM.
For Seam 3 and the thin, locally developed Sphagnum Seam (Riegel and Wilde, 2016), there is no clear correspondence with the three sea level curves (Fig. 3). This may be due to a short-term preponderance of regional and local factors or to higher-frequency sea level changes not represented in the global records. The approximate position of this part of the succession at 53.1 to 52.4 Ma (Fig. 3) corresponds to the K Ar glauconite age of 52.8 ± 1.4 Ma (Ahrendt et al., 1995) for the equivalent of Interbed 4 at Emmerstedt.
During the deposition of Interbed 4 the system experienced a major transgression that resulted in the so-called “Spurensand”, a highly bioturbated clayey sand including occasional glauconite (Fig. 3; Lietzow and Ritzkowski, 2005; Riegel et al., 2012; Osman et al., 2013). Subsequent regression initiated peat formation of Seam 4 (Riegel et al., 2012). Although the global sea level curves generally show a high sea level during this time (Fig. 3), Miller et al. (2005a) and Kominz et al. (2008) suggest a slightly regressive tendency that could have led to a progression of the estuarine system. The transgression at the time of the Spurensand, which has been considered to corresponded to a maximum flooding surface and the end of a depositional cycle (Lietzow and Ritzkowski, 2005; Osman et al., 2013), is only pronounced in the curves of Haq et al. (1987a, b, 1988).
Various regression and transgression phases followed, which mostly led to the formation of thinner seams in the Schöningen Formation, e.g., Seam 4 (locally split into three benches), Seam 5, Seam L, and Seam 7, each only a few to several decimeters thick. Only Seam 6 is 4 m thick and matches an extended phase of low sea level (Fig. 3). According to the global sea level variations Seams 4 to 7 can be assigned to a period between 51 and 49 Ma (Fig. 3).
The lower Eocene part of the succession terminates with Seam 8. If the following Interbed 9 is regarded as equivalent to the greensand of the Emmerstedt Formation in the eastern syncline further to the NW, the K Ar glauconite age of 46.0 ± 1.1 Ma (Ahrendt et al., 1995) from Emmerstedt implies a middle Eocene age for Interbed 9. The change from the Schöningen Formation to the Emmerstedt Formation is characterized by a significant hiatus at the top of Seam 8 (Osman et al., 2013), which may be represented at Schöningen by a deep channel reaching down from slightly above Seam 8 to a level well below Seam 7. In particular, the strong transgression at 47.6 Ma as indicated in the sea level curves (Haq et al., 1987a, b, 1988) may correlate with the onset of deposition of the marine Emmerstedt Greensand and its equivalents and thus limits the age range for the deposition of Seam 8 from 48.4 to 47.6 Ma.
Three phases of a low sea level during the early middle Eocene at ∼ 46.9 to 46.6, ∼ 45.7 to 45.0, and ∼ 43.0 to 41.9 Ma obviously correlate with the three seams of the Helmstedt Formation at Schöningen (Fig. 3). The two long periods of a low sea level may especially be responsible for the formation of the 10 and 20 m thick Victoria and Treue seams, respectively, at the top of the succession in the western syncline. This implies that the Helmstedt Formation does not include the MECO (40.6 to 40.0 Ma; Bohaty and Zachos, 2003), although paleobotanical and palynological data suggest paratropical flora for the respective part of the section (Riegel et al., 1999, 2012).
Overall, the lignite-bearing terminal Paleocene to middle Eocene deposits in the western syncline have been assigned to a second-order transgressive succession (Osman et al., 2013), which is comprised of four third-order sequences and several higher-order sequences possibly related to Milankovitch cycles and characterized by stacked cycles of estuarine and marine sands capped by coals. Maximum flooding surfaces were assigned to the top of Interbed 4, the top of Seam 6, the greensand of the Emmerstedt Formation, and the top of the sediments underlying Seam 9 (Osman et al., 2013), which is in good correspondence with the global sea level curves (Fig. 3).
4.2 CIEs in the lower Schöningen Formation
Clastic interbeds and lignites are clearly separated by their total organic carbon content (Fig. 4), which is generally above 43 % in lignites, reaching more than 60 % in all seams except the thinner Seams 4, 5, and L (supplementary data, Table S1). TOC content in the brackish interbeds is generally below 10 % and often below 1 %. Only in transitions may more than 30 % TOC be reached.
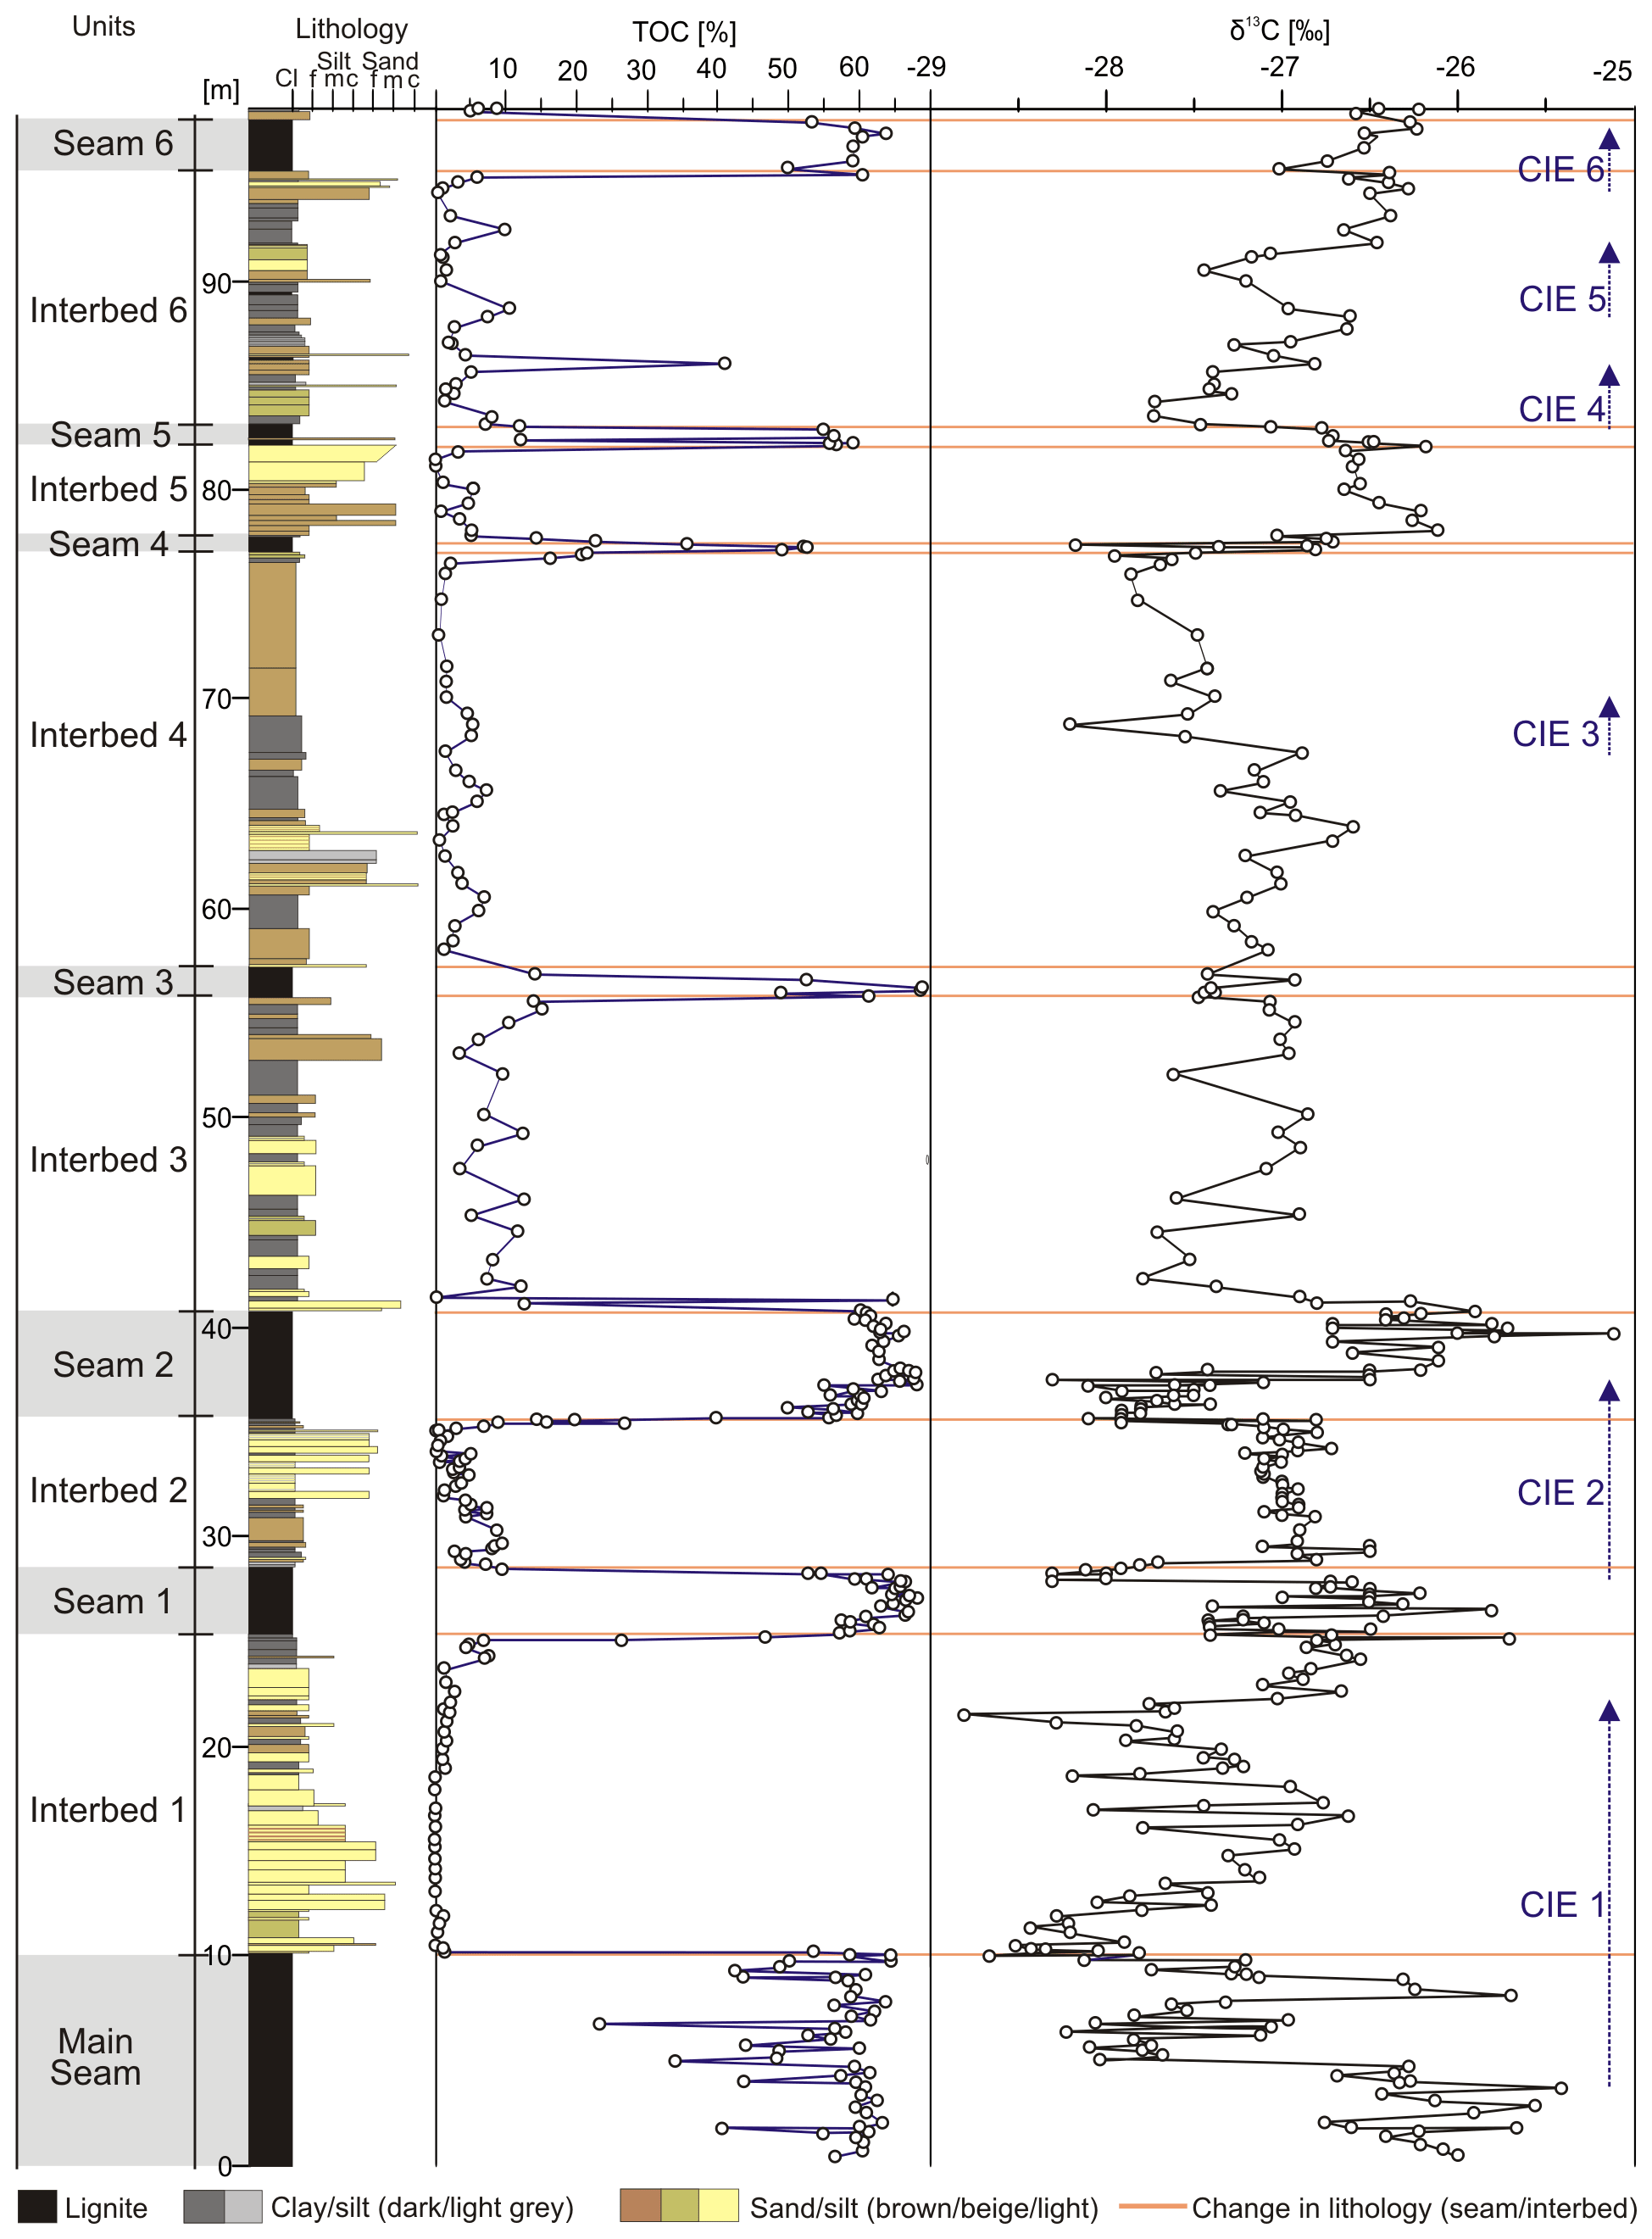
Figure 4Composite stratigraphic section of the lower part of the Schöningen Formation from the Main Seam to the base of Interbed 7 with total organic carbon (%TOC) and δ13CTOC values of bulk organic matter. Lines denote lithological changes between brackish interbeds and lignite seams. Six identified CIEs are indicated.
Throughout the studied section, carbon isotope ratios of bulk organic matter range between −25.1 ‰ and −28.8 ‰ (Fig. 4). In the Main Seam δ13CTOC varies between −25.4 ‰ and −28.7 ‰ (average δ13CTOC of −26.96 ± 0.85 ‰, n = 47), with a comparatively high standard deviation (SD) in comparison to other sections of the isotope record (see below) caused by a great range of δ13CTOC (Table 1). In the lower 3.5 m of the Main Seam, the values constantly fluctuate between −26.8 ‰ and −25.4 ‰. A strong decrease in δ13CTOC values within the succeeding 1.2 m indicates the first CIE in the record of the Schöningen Formation (onset of CIE 1). Following a short but small increase of 0.4 ‰ at 4.57 m an abrupt drop to −28.0 ‰ can be observed between 4.57 and 4.79 m, which is followed by an interval with low values. δ13CTOC values briefly rise again to −25.7 ‰, before another sharp decline to −28.7 ‰ at the top of the Main Seam occurs (9.85 m, Fig. 4, Table 2).
Table 2CIEs in the δ13CTOC dataset of the Schöningen Formation (Main Seam–Seam 6, western syncline).
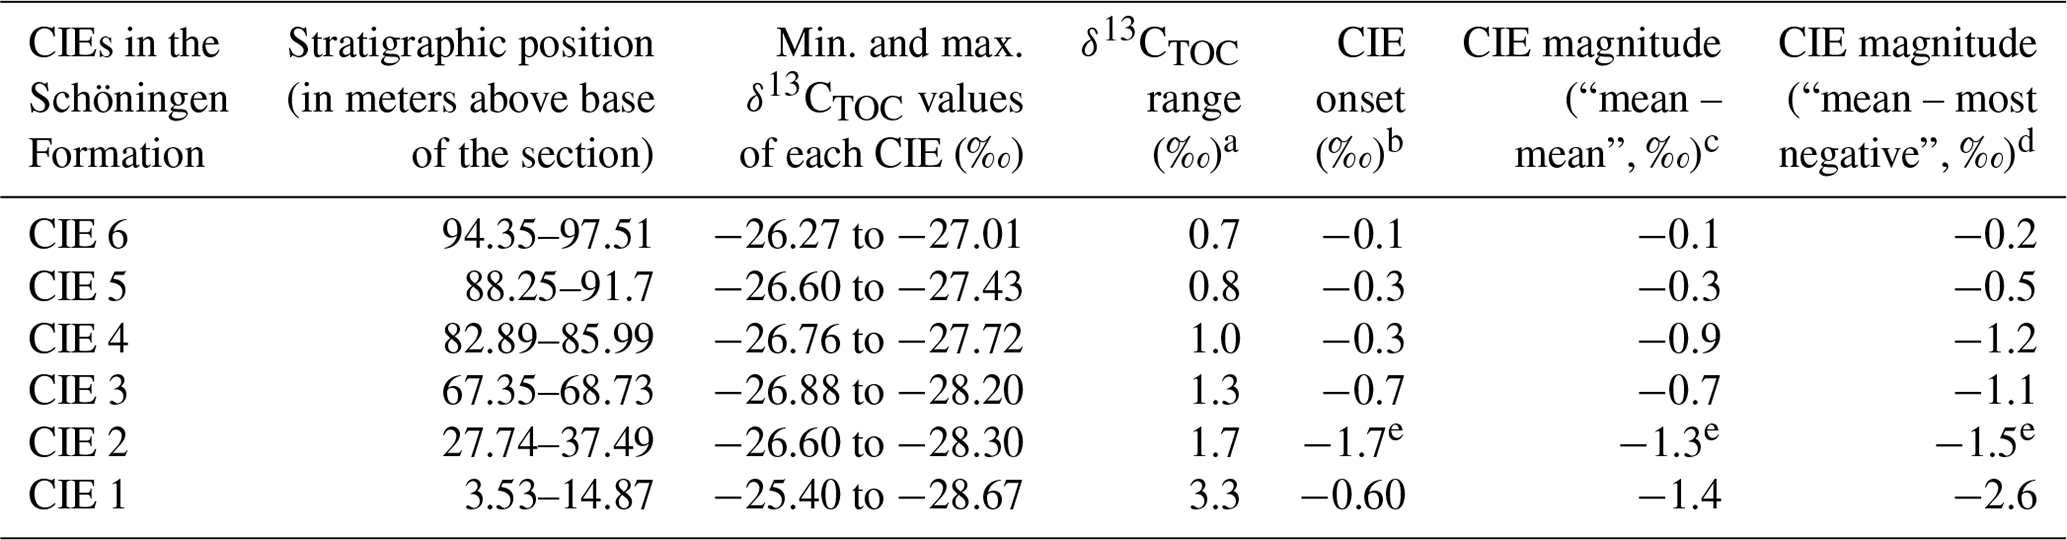
a CIE range is calculated by the difference between the minimum and maximum value in the CIE. b CIE onset is calculated as the difference between the last pre-CIE and the first CIE sample. c CIE magnitude calculated as the difference between the mean pre-CIE and the mean CIE value. d CIE magnitude calculated as the difference between the mean pre-CIE and the most negative value of the CIE (following McInerney and Wing, 2011). e Taken from Methner et al. (2019).
Following the lowest δ13CTOC value at the top of the Main Seam, the values in the lower 7 m of Interbed 1 show a continuous recovery of ∼ 2 ‰ to −26.8 ‰. Above, the δ13CTOC values decrease with strong fluctuations (Fig. 4). At 16.47 and 18.35 m from the base of the section negative spikes of δ13CTOC below −28 ‰ have been recorded, while the overall lowest value of −28.8 ‰ is reached at 21.33 m. However, all of these very low δ13CTOC values are restricted to single samples. Following the lowest value δ13CTOC strongly increases by 2.1 ‰ to −26.7 ‰ at 22.39 m, before the δ13CTOC values remain steady up to the top of Interbed 1 (Fig. 4). Including recovery, CIE 1 therefore encompasses 3.53 to 22.39 m of the studied section.
δ13CTOC values from the top of Seam 1 to the middle of Seam 2 between 27.74 and 37.49 m have been identified as a distinct CIE (here CIE 2; Methner et al., 2019). Both the abrupt decrease in δ13CTOC values at the top of Seam 1 and their gradual increase within the lower half of Seam 2 occur within lignite away from marine influence, although bracketing clastic Interbed 2 with its prominent Apectodinium acme.
Following the pronounced high in the upper half of Seam 2, δ13CTOC values decrease again to −27.8 ‰ within the lower 1.1 m of Interbed 3 and remain largely constant with only slight fluctuations up to the base of Seam 4 at 76.8 m (average δ13CTOC of −27.3 ± 0.4 ‰, n = 53). Between 67.35 and 68.73 m, however, there is a short but rapid drop in Interbed 4 by 1.3 ‰ to −28.2 ‰, which we tentatively interpret as CIE 3 (Fig. 4, Table 2).
Within Seam 4, δ13CTOC values rise to −26.8 ‰ and to −26.1 ‰ in the lower 70 cm of Interbed 5 after an abrupt drop to −28.2 ‰ at the interface between the seam and the interbed. The following values in Interbed 5 remain constantly high (average δ13CTOC of −26.4 ± 0.2 ‰, n = 9) and no major change is recorded for Seam 5 (average δ13CTOC of −26.6 ± 0.2 ‰, n = 6). In Interbed 6 and the subsequent Seam 6 further significant fluctuations in δ13CTOC values may be observed, which should be regarded as minor CIEs. CIE 4 is identified from the top of Seam 5 into the base of Interbed 6 (82.89 to 85.99 m) where δ13CTOC drops by 1.0 ‰ to −27.7 ‰ before values rise again to previous levels (Fig. 4, Table 2). Within Interbed 6 and from the top of Interbed 6 up to the top of Seam 6 two small but still pronounced excursions of 0.8 ‰ (CIE 5, between 88.25 and 91.7 m) and 0.7 ‰ (CIE 6, between 94.35 and 97.51 m) occur over several samples each (Fig. 4, Table 2). Furthermore, an overall trend towards somewhat higher δ13CTOC values can be recognized from the base of Interbed 6 to the base of Interbed 7 (Fig. 4).
4.3 Effects of changes in lithology and mixing of carbon sources on δ13CTOC values
When comparing the six observed negative shifts in δ13CTOC values with known CIEs it is necessary to differentiate between shifts occurring within seams or interbeds and shifts occurring at lithologic boundaries (Fig. 4). In the Schöningen section organic debris was commonly mixed into the brackish interbeds from adjacent peat mires and other terrestrial sources, which may have induced shifts in δ13CTOC values independent of climate perturbations. For example, the increase in δ13CTOC at the base of Interbed 2 and the decrease at its top correlate with changes in lithology (Fig. 5), while the shift to lower δ13CTOC values at the top of Seam 1 and the gradual increase back to higher values within Seam 2 both occur within a distinct lignite (Fig. 4).
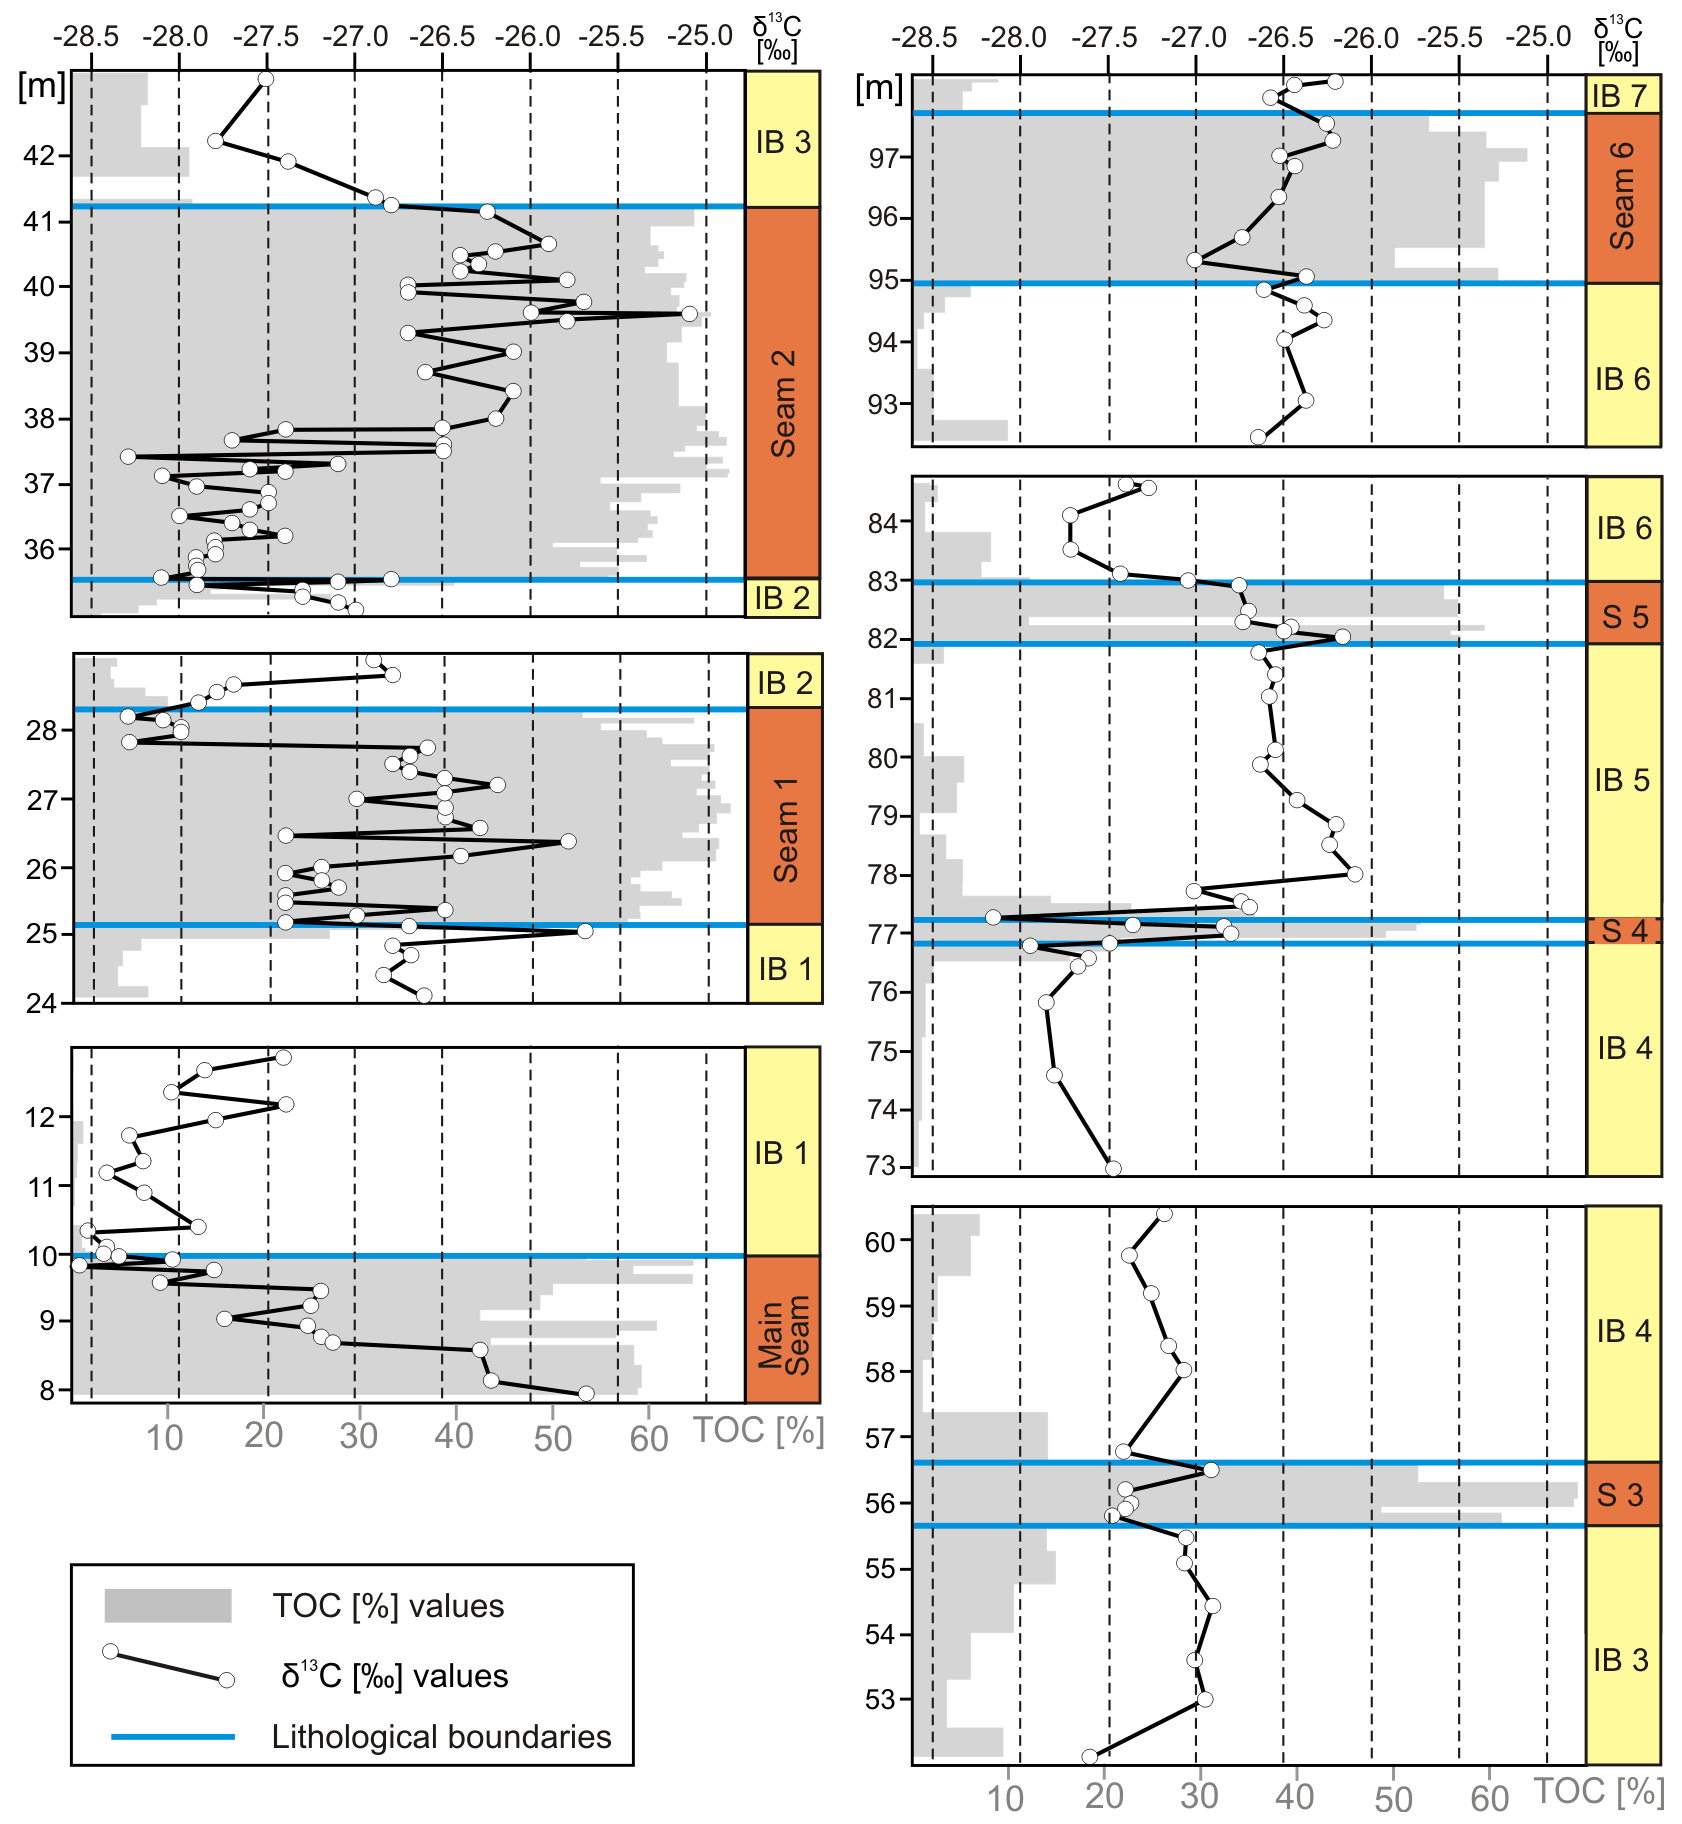
Figure 5Details of total organic carbon (%TOC) and δ13CTOC values of bulk organic matter presented in Fig. 4, illustrating variations of TOC and δ13CTOC values at lithological boundaries between terrestrial lignite and estuarine clastic interbeds in the lower part of the Schöningen Formation. S: seam, IB: interbed.
The most important decrease in δ13CTOC values starts well within the Main Seam, 6 m below the top at 3.53 m, independent of lithological changes (Fig. 4). The gradual shift to higher values in the lower part of Interbed 1 up to 16.46 m (Fig. 5) likewise takes place without a change in lithology and reflects part of the recovery phase of CIE 1. On the other hand, a similar increase at the transition from Seam 1 to Interbed 2 (Figs. 4, 5; Methner et al., 2019) may be related to the change to the estuarine environment of Interbed 2 to which, however, a significant amount of terrestrial carbon has been admixed (Riegel et al., 2012).
Since marine organic matter is more depleted in 13C compared to terrestrial organic matter (Sluijs and Dickens, 2012) mixing of 13C from marine and terrestrial sources will influence fluctuations of δ13CTOC values. By comparing the δ13C signature of isolated dinoflagellate cysts from before and throughout the PETM (Sluijs et al., 2018) to δ13CTOC values from the Schöningen Formation, it becomes clear that the δ13C composition of dinocysts covers a similar range. However, bulk organic matter, which is derived from marine sediments, has been analyzed here. It also contains organic compounds that may have been strongly depleted in 13C such as amorphous organic matter, thus shifting the δ13CTOC record to lower values (see Sluijs et al., 2018). For instance, massive driftwood and occasional rooting have been observed in the lower part of Interbed 1 (Riegel et al., 2012), while the scattered negative values in the upper half of Interbed 1 can probably be related to a higher proportion of marine TOC. Furthermore, a significant δ13CTOC increase is associated with higher TOC contents, signaling the transition to the succeeding Seam 1 (Table S1).
A general decrease in δ13CTOC values can be observed in the younger interbeds above Seam 2 (Fig. 5), which show a greater marine influence (Riegel et al., 2012; Osman et al., 2013). For instance, there is a significant decrease of more than 2 ‰ at the transition to Interbed 3 followed by fluctuating but relatively low δ13CTOC values up into the lower half of Interbed 4. That the δ13CTOC values for the intercalated Seam 3 remain within the range of the overall fluctuations may be due to the low number of samples analyzed for this seam.
Following a distinct single-sample decline to a value below −28 ‰ in the middle of Interbed 4 (CIE 3), comparatively low δ13CTOC values persist in the upper part of Interbed 4. With the return to terrestrial conditions the values increase in the succeeding Seam 4 (Fig. 5). The strong drop of the δ13CTOC values at the top of Seam 4 again may be related to the change in facies coupled to an increasing contribution of 13C-depleted marine organic matter (Fig. 5). However, in the succeeding lower 30 cm of Interbed 5 the values strongly increase, which is comparable to the situation in Interbeds 1 and 2 and may indicate that the decline of the δ13CTOC values at the transition between Seam 4 and Interbed 5 is related to changes in lithology.
At the base of Seam 5 the values are similarly high as in the underlying Interbed 5. However, a significant decrease in δ13CTOC values can be observed from the base to the top of the seam (Fig. 5) where it continues into the base of Interbed 6, which may have been enforced by the transition to marine deposits with generally lower δ13CTOC values. However, in spite of this effect, the part of the section from the base of Seam 5 into the lower part of Interbed 6 has been recognized as CIE 4 because afterwards δ13CTOC values gradually and continuously rise again. Weak CIEs of 0.8 ‰ (CIE 5) and 0.7 ‰ (CIE 6) have also been identified within Interbed 6 and Seam 6, where they are independent of lithological changes (Figs. 4, 5).
It is noteworthy that the CIEs that have been identified in the upper part of our record (CIEs 3 to 6) are characterized by a relatively small δ13CTOC range of less than 1.3 ‰. However, this is probably due to the fact that these CIEs have been identified from bulk organic matter. Baczynski et al. (2016) were able to show that CIEs observed in bulk organic matter have a smaller magnitude and are shorter in duration than those derived from δ13C of leaf-wax n-alkanes. Consequently, the CIEs that are recognized in the Schöningen Formation by carbon isotope values of bulk organic matter should be even more pronounced by using compound-specific isotope ratios.
4.4 Thermal events in the lower Eocene at Schöningen
Revision of the dinoflagellate zonation (Costa and Manum, 1988; Köthe, 1990, 2003) and comparison with eustatic sea level changes (Haq et al., 1987a, b; Miller et al., 2005a; Kominz et al., 2008) in addition to the consideration of sequence stratigraphic concepts (Osman et al., 2013) provide a robust stratigraphic framework for the interpretation of the δ13CTOC record from the lower part of the Schöningen Formation and the assignment of observed CIEs to known thermal events in the lower Eocene.
4.4.1 CIE 1 (PETM)
Methner et al. (2019) could not clearly assign the CIE between the top of Seam 1 and the lower part of Seam 2 (CIE 2 in this paper) to the PETM and already proposed that it may reflect a later early Eocene thermal event. Due to a cooler mesothermal climate that is indicated by the palynoflora with mass occurrences of Alnus pollen, Lenz et al. (2021) concluded that Seam 1 was deposited during a strong temperature decline following the PETM in the first million years of the Eocene (Wing et al., 1999; Stokke et al., 2020) and already suggested that both the PETM and the associated Paleocene–Eocene boundary should be placed below Seam 1. Our new data show a well-expressed CIE ranging from the middle of the Main Seam into Interbed 1 (CIE 1, Figs. 4, 5) with a total drop of 3.3 ‰ and 2.6 ‰ in δ13CTOC values (CIE magnitude; Table 2). This is the strongest excursion in the entire studied section. Since Interbed 1 has now been placed in the earliest Eocene dinoflagellate zone D5nb and the eustatic sea level curve suggests an age of ca. 56 Ma for the Main Seam (see above), CIE 1 most probably represents the PETM. As a consequence, we now locate the Paleocene–Eocene boundary within the Main Seam, thus confirming the earlier supposition of Lenz et al. (2021).
The termination and recovery phase of CIE 1 have been considered to be associated with a sea level rise due to thermal expansion of seawater (Sluijs et al., 2008) or melting of small ice sheets in Antarctica (Speijer and Wagner, 2002; DeConto and Pollard, 2003; Miller et al., 2005b; Hollis et al., 2009). Sluijs et al. (2008) already suggested a link between the global sea level and hyperthermal events and recognized a eustatic sea level rise for the North Sea Basin during the PETM and ETM2. In the Schöningen Formation this led to the change from peat-forming to brackish environments (Main Seam to Interbed 1). Similar transitions from terrestrial to brackish deposits in conjunction with the PETM at the southern edge of the North Sea Basin were also reported from other sites, such as Cobham in southeastern England (Collinson et al., 2003) and the Oise region in France (Cavagnetto, 2000; Nel et al., 1999; Dupuy et al., 2014). Therefore, our carbon isotope record is consistent with peat formation during the onset of the PETM and widespread inundation of coastal lowlands due to sea level rise during a later stage of the PETM (see, e.g., Denison, 2021).
The lack of the key species A. augustum within the dinoflagellate assemblage of Interbed 1 is not uncommon for PETM deposits of the southern North Sea Basin. In the French Dieppe and Paris basins the PETM-related CIEs similarly started with terrestrial and coastal deposits and continued into lagoonal and shallow marine sediments, which are also characterized by an extremely pronounced Apectodinium acme without A. augustum (Iakovleva et al., 2013). In the marginal marine to lagoonal Tienen Formation in Belgium A. augustum is only known from the lower part of the PETM interval and missing above (Steurbaut et al., 2000). Therefore, A. augustum is generally sparse and restricted to the lower part of the PETM interval in the southern North Sea Basin (Steurbaut et al., 2000). As a consequence, A. augustum cannot be expected in our section since the lower part of the PETM interval in the Schöningen Formation is included within the Main Seam. However, the frequent occurrence of A. parvum supports the idea that the base of Interbed 1 is still part of the PETM interval.
The negative shift of −3.3 ‰ in δ13C in the Main Seam is smaller than the shift of −4.7 ± 1.5 ‰ known for the PETM in other terrestrial records but larger than the shift of −2.8 ± 1.3 ‰ in marine deposits (McInerney and Wing, 2011). The recovery phase in the lower part of Interbed 1 spans a positive shift of only about 2 ‰, which is roughly within the range known from other marine records, but overall δ13CTOC values do not return to pre-CIE values attained in the lower part of the Main Seam. Most likely, admixture of marine organic matter more depleted in 13C compared to terrestrial organic matter prevented the full recovery to δ13CTOC values as high as those recorded in the purely terrestrial organic matter of the Main Seam. However, the shift from the negative peak of δ13CTOC values at the top of the Main Seam to increasing values in the interbed at or near the lithological boundary has to be treated with caution since the PETM-driven transgression in this coastal setting may have led to a hiatus at the top of the Main Seam (Denison, 2021) that obscured an even more negative shift of δ13CTOC values.
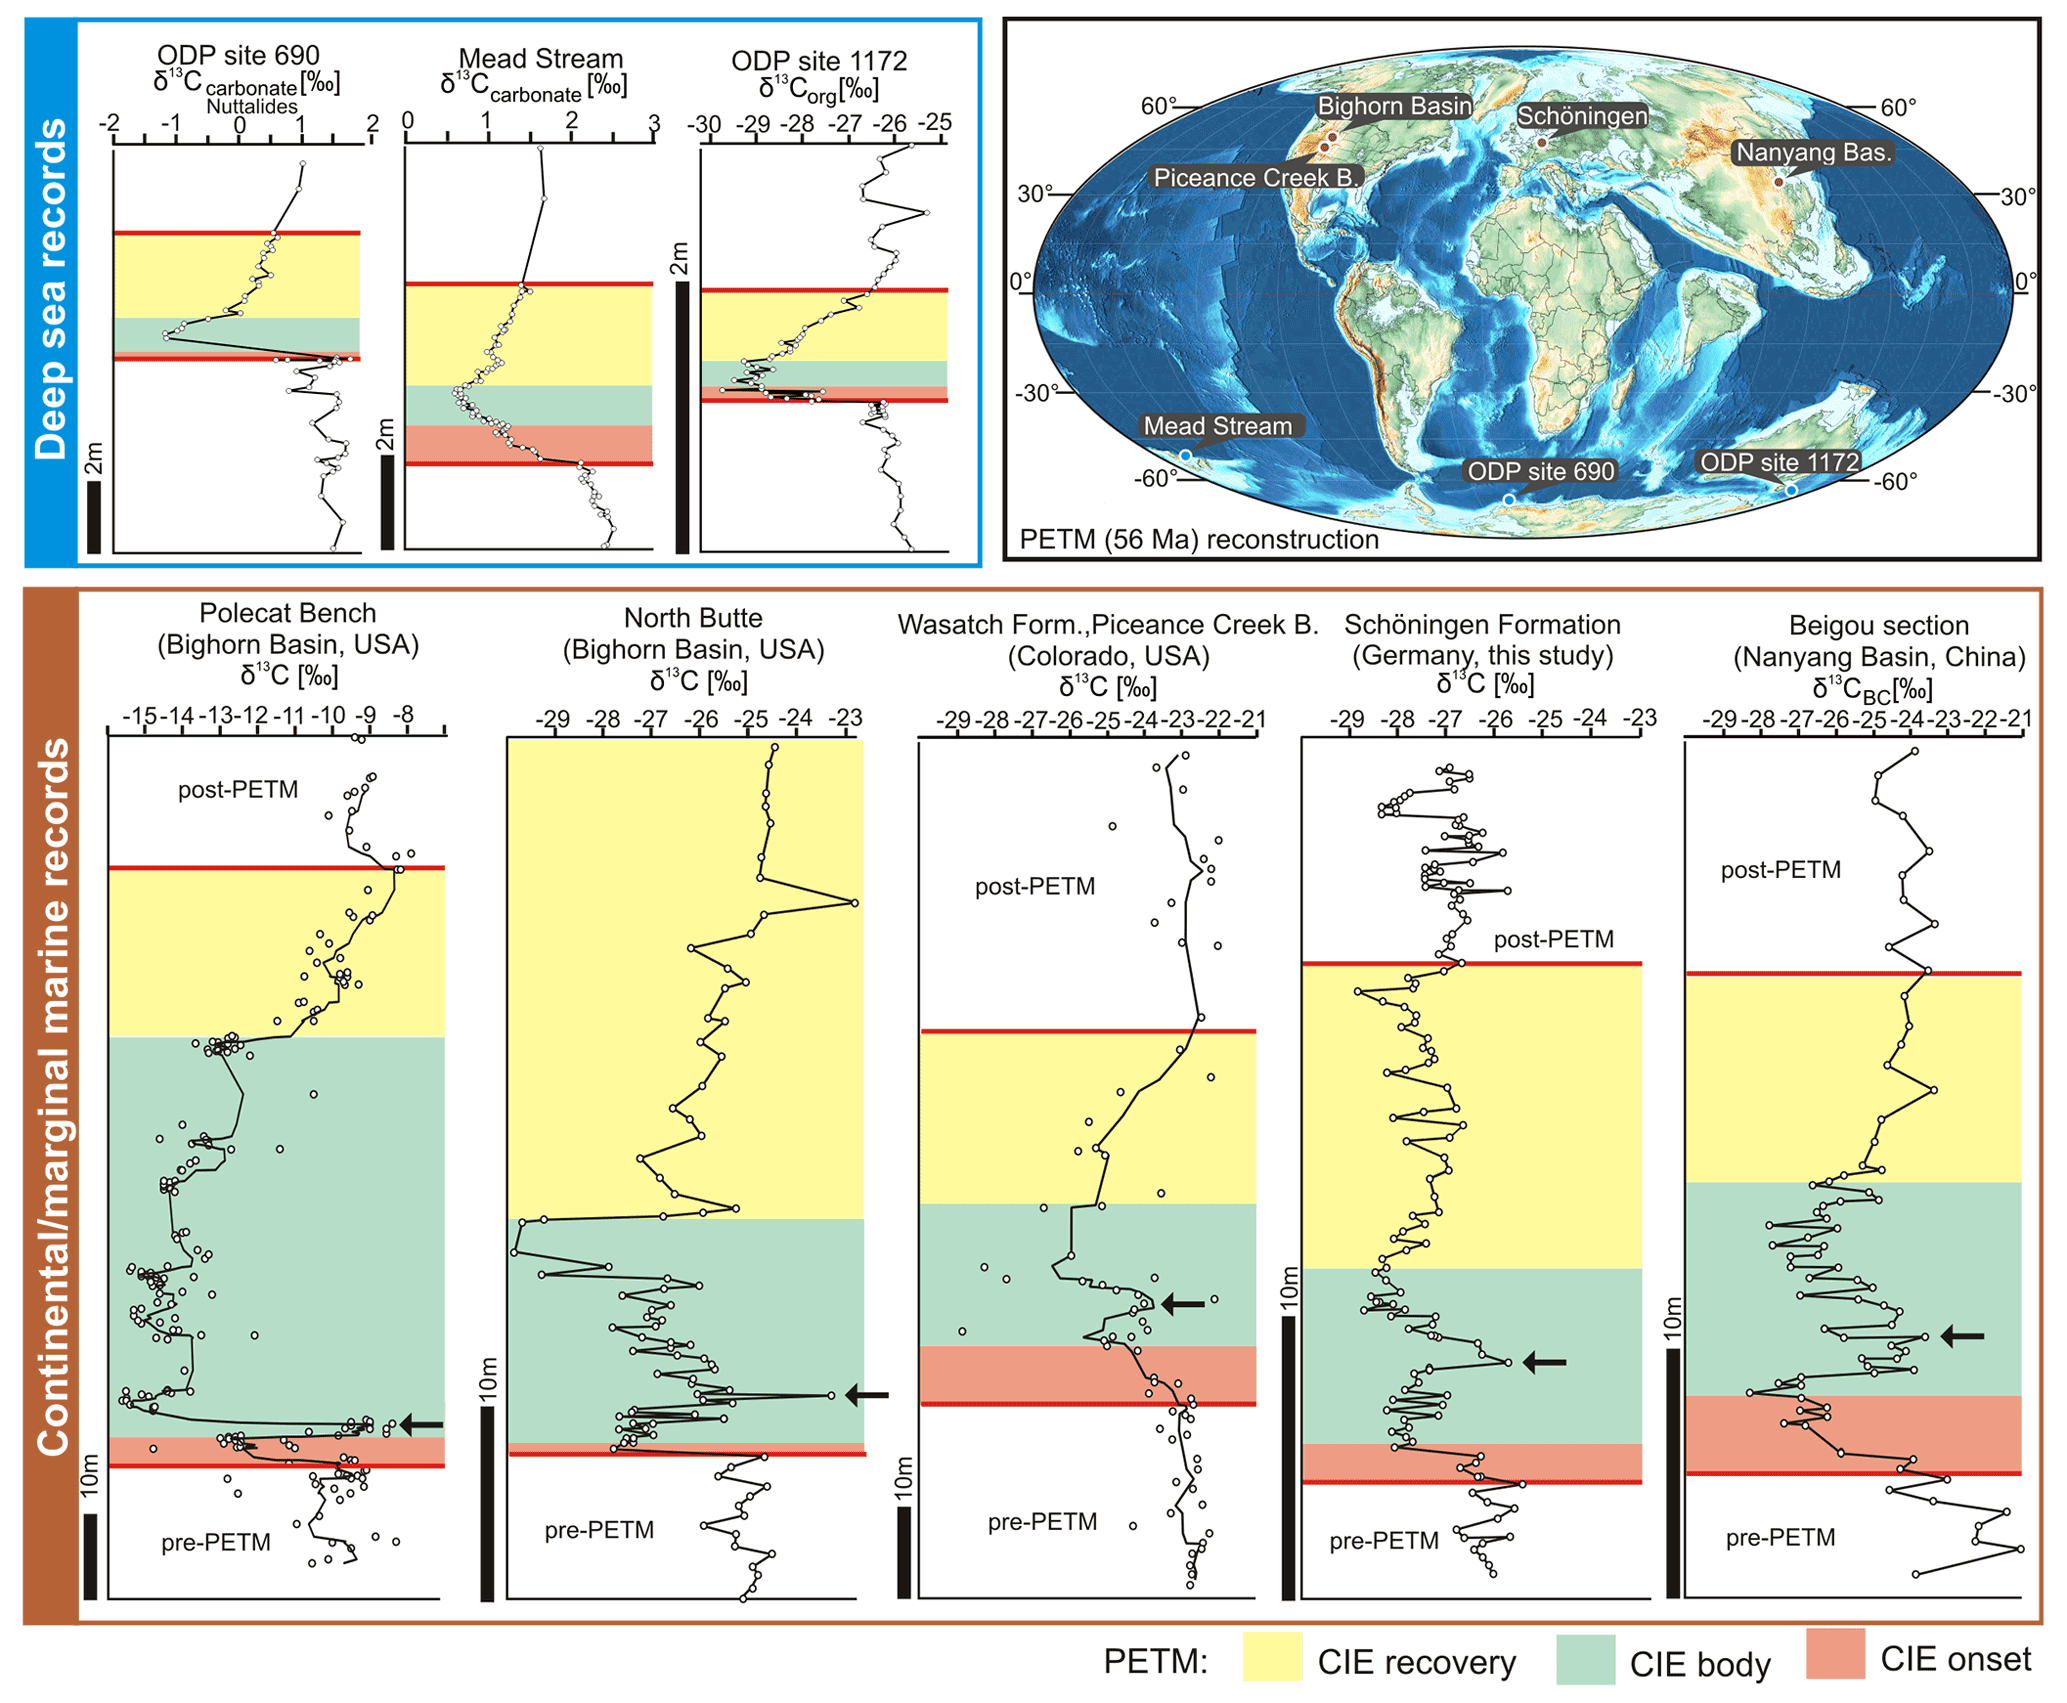
Figure 6Comparison of typical δ13C records for the Paleocene–Eocene Thermal Maximum (PETM) in deep-sea and continental to marginal marine records indicating that non-marine records commonly show a rebound to higher δ13C values during the CIE body (black arrows). Data for the marine records: ODP Site 690, Maud Rise, South Atlantic (Nunes and Norris, 2006); Mead Stream, New Zealand, South Pacific (Nicolo et al., 2010); ODP Site 1172, East Tasman Plateau, Tasman Sea (Sluijs et al., 2011). Data for continental and marginal marine records: Polecat Bench, Bighorn Basin, USA (Bowen et al., 2015) – the black line corresponds to a five-point running mean of data; North Butte, Bighorn Basin, USA (Baczynski et al., 2013); Wasatch Formation, Piceance Creek Basin, USA (Foreman et al., 2012) – the black line corresponds to a five-point running mean of data; Beigou section, Nanyang Basin, central China (Chen et al., 2014; in contrast to standard measurements of δ13C – bulk organic matter – not only carbonates were removed from the samples prior to δ13CBC measurements, but also silicates by using hydrofluoric acid). Locations of the study sites are presented on a continental reconstruction for the PETM (PALEOMAP project, Map 14; Scotese, 2014). An extension of the figure is added as Fig. S5 in the Supplement.
The onset of a CIE is generally regarded as the time between the pre-CIE carbon isotope composition and the most depleted values (McInerney and Wing, 2011). Compared to the sharp drop commonly observed in the onsets of marine records (e.g., Röhl et al., 2007; Westerhold et al., 2018b; Fig. 6), the decrease in δ13C values appears to be more gradual in the Main Seam. However, based on an average compaction rate of 3 : 1 (Widera, 2015) and an average rate of deposition for tropical peat of 3 mm yr−1 (Stach et al., 1982), 1 m of lignite in the Schöningen Formation may represent about 1 kyr. Therefore, the 6.50 m of lignite representing the onset in the Main Seam may cover ca. 6.5 kyr. This is well in accordance with a time of less than 10 kyr that has generally been estimated for the onset of the PETM-related CIE (Zachos et al., 2005).

Figure 7Comparison of mid-latitudinal lignite-related δ13C TOC records surrounding the paleo-North Sea: Cobham, UK (Collinson et al., 2003); Vasterival, France (Storme et al., 2012); Schöningen, Germany (this study); Doel borehole, northern Belgium (Steurbaut et al., 2003b). Additionally, a terrestrial δ13C TOC record of clastic sediments without lignite from the Pyrenees (Claret section, Domingo et al., 2009) is given that highlights the isotopic differences to the lignite records. Note the different stratigraphic thicknesses due to different sediment accumulation and preservation conditions in the individual depositional environments; n indicates the number of measurements.
Methner et al. (2019) initially noted close similarities between the δ13CTOC values from CIE 2 of the Schöningen section and those from other peat mires at the southern coast of the North Sea assigned to the PETM, e.g., the Cobham Lignite in the UK (Collinson et al., 2003, 2009; Pancost et al., 2007) and the Vasterival section in France (Garel et al., 2013; Storme et al., 2012). However, there are also similarities to CIE 1 (Fig. 7), i.e., a similar −3.2 ‰ shift of δ13CTOC, similar minimum δ13CTOC value of −27.5 ‰ to −28.8 ‰, and similar CIE magnitudes. Interestingly, the CIE magnitude that is calculated as the difference between the mean pre-CIE and the mean CIE values is slightly smaller than those of CIE 1 (−1.4 ‰; Table 2) in both the Cobham Lignite and the Vasterival section (−1.6 ‰ resp. −1.5 ‰). If the CIE magnitude, however, is calculated as the difference between the mean pre-CIE values and the most negative value during the CIE (McInerney and Wing, 2011) the value for the Schöningen CIE 1 (−2.6 ‰) exceeds that of the Cobham Lignite and the Vasterival section (−2.0 ‰ resp. −2.3 ‰).
The comparison of δ13CTOC values from peat mire records at the southern coast of the North Sea with a European terrestrial PETM δ13C record not including any lignite (Claret section in the Pyrenees, Domingo et al., 2009) shows that the δ13CTOC values in the Claret section are clearly higher than those from the marginal wetlands of the North Sea (Fig. 7). The only exception is the PETM record from the Doel borehole (northern Belgium) (Steurbaut et al., 2003a), which is comparable to the carbon isotope record from the Pyrenees (Fig. 7). However, the Doel section is mainly brackish with few thin lignitic layers and therefore not fully comparable to the lignite-bearing sections from Cobham, Vasterival, and Schöningen. Especially in comparison to the Vasterival section, the variability of the δ13CTOC values in the pre-, peak-, and post-CIE intervals is almost identical for CIE 1 in the Schöningen Formation. The similarity in all of the characteristics described above of δ13CTOC values that are represented in the PETM–CIE of the Cobham Lignite (Collinson et al., 2003), the PETM at Vasterival (Storme et al., 2012), and CIEs 1 and 2 in the Schöningen Formation (Methner et al., 2019, this study) supports the idea that the wetlands in mid-latitudinal European near-coastal environments reacted similarly during the latest Paleocene to early Eocene thermal events. The CIE magnitudes are dampened compared to purely terrestrial archives such as the Claret section in the Pyrenees but yield a very consistent and robust signal. Methner et al. (2019) discussed different causes for the dampened magnitude of the CIE in the lignite records such as mixing and dilution of the input signal, occurrence of local signal perturbation (e.g., due to vegetation changes), or the differential degradation and/or preservation of organic matter during the climatic perturbation.
Since within-seam carbon sources are likely to be purely terrestrial, the fluctuations of δ13CTOC values in the CIE of the Main Seam including a clear rebound to higher values as commonly observed in terrestrial records (Figs. 6 and S5) are rather striking. The PETM reflects injections of large amounts of carbon into the atmosphere–ocean system, but it is uncertain whether single or multiple episodes of carbon release occurred (Zhang et al., 2017). Generally, the PETM-related CIE shows a curve of a triangular shape with a single large decrease in δ13C values, followed by an exponential recovery as seen in several of the marine isotope curves (Fig. 6). However, in some records, δ13C values decrease in steps, indicating complex processes of carbon injection into the atmosphere (Zhang et al., 2017; Tremblin et al., 2022), suggesting multiple phases of carbon release. In a high-resolution carbon isotope record of terrestrial deposits from the Bighorn Basin (USA), Bowen et al. (2015) could show that the beginning of the PETM consists of at least two discrete intervals of decreasing carbon isotope values. The first event had a duration between 2 and 5.5 kyr, and the onsets of the two carbon release events lasted no more than 1.5 kyr (Bowen et al., 2015). In our record, the first δ13C decline was also within less than 1.5 kyr and the first excursion lasted around 4.5 kyr when assuming 1 m of lignite per thousand years (see above). Therefore, the data from the Main Seam are consistent with those reported from the Bighorn Basin.
However, the steps in a carbon isotope curve may also be related to sediment reworking or mixing of different carbon sources (e.g., Bralower, 2002). Mixing and reworking of organic matter cannot be excluded for the interbeds of the Schöningen succession, since multiple flooding and thus reworking events may have happened (Methner et al., 2019). However, within individual lignite seams no mixing of organic material should have occurred, since it formed in situ from an ombrotrophic (rain-fed) peat mire consisting mostly of mosses, ferns, and an associated hardwood mire forest (Riegel et al., 2012; Inglis et al., 2015; Lenz et al., 2021). Therefore, the isotope record of the Main Seam may indeed reflect a stepwise injection of carbon into the atmosphere.

Figure 8Simplified pollen diagram of the Main Seam, showing frequency and palynological abundance changes between the pre-PETM and peak-PETM intervals. The δ13C values of bulk organic matter (see Fig. 4 for the complete dataset) are shown for comparison. Due to the different thicknesses of the studied sections for isotopes and palynology, the isotope curve for the Main Seam has been tied to the top and base of the seam. The red line indicates the beginning of the PETM-related CIE.
However, similar to fluctuations described from the lower Eocene of the Dieppe–Hampshire Basin in northern France (Garel et al., 2020), the short-term return to pre-CIE δ13CTOC values at around 2 m below the top of the Main Seam (Fig. 4) may also be explained by environmental factors or changes in the vegetation. Especially pronounced is the change in pollen assemblages at the beginning of the CIE. The abundance of Inaperturopollenites and Nyssapollenites probably represents a Nyssa–Taxodium swamp forest in the lower part of the seam. With the change to a forest dominated by Myricaceae (Triporopollenites robustus–rhenanus) δ13CTOC values suddenly drop from around −26.8 ‰ and 25.4 ‰ to −28.0 ‰ (Fig. 8). A brief rise to 25.7 ‰ and the subsequent decrease coincide with the occurrence of Pompeckjioidaepollenites subhercynicus and Sphagnum-type spores (Fig. 8). Thus, fluctuations in δ13CTOC values are clearly correlated with vegetation change.
A comparable shift from a mixed angiosperm–conifer flora in the Paleocene to an angiosperm flora at the onset of the PETM-related CIE was already reported for the Bighorn Basin in Wyoming (Smith et al., 2007; Diefendorf et al., 2010). Diefendorf et al. (2010) thereby suggested that a 4.6 ‰ decline in δ13C values of atmospheric CO2 at the onset of the PETM can be attributed to the different carbon isotope budget of gymnosperm and angiosperm leaves. Conifers and angiosperms reacted differently in isotopic fractionation during the PETM-related CIE, resulting in different isotopic excursions of ca. 3 ‰ for conifers and 6 ‰ for angiosperms (Schouten et al., 2007). Therefore, the strong decline of δ13CTOC values at 5.20 m in the Main Seam may also be attributed to the strong increase in Myricaceae in the wetland vegetation, representing a local signal. However, at ∼ 8.20 m a further increase in angiosperm pollen (P. subhercynicus) and the simultaneous decrease in pollen from the Cupressaceae are not associated with a decrease in δ13CTOC values but with a shift to less negative values. Therefore, a local change in the vegetation altering the carbon isotope signal is unlikely to account solely for the CIE in the Main Seam.
If the δ13C signal is a purely local signal that only reflects environmental changes in the mire forest, the isotope values in Seams 1 and 2 should behave similarly. In Seam 1, however, the δ13C signal remained constant during the increase in Sphagnum spores and P. subhercynicus at the end of peat formation, and the strong decrease in δ13C values at the top of the seam was only evident after the increase in myricaceous pollen started (see Methner et al., 2019; Fig. S6). In Seam 2 the values of myricaceous pollen and P. subhercynicus are again not correlated with the isotope values (Fig. S6). Only the increase in Sphagnum spores is associated with an increase in δ13C values coinciding with the end of CIE 2 (Methner et al., 2019). Therefore, main changes in the peat-forming vegetation show a distinct correlation with the carbon isotope signal only in the Main Seam, but not in Seam 1 and Seam 2 where local processes therefore did not have a strong influence on the carbon isotope signal. Although changes in the vegetation are fundamentally controlled by regional environmental changes, the pattern of δ13C values in the Main Seam suggests that global processes such as climate change during the PETM may have played an additional role for the composition of the vegetation during deposition of the Main Seam. This is especially true for the extreme increase in myricaceous pollen in the Main Seam compared to their increase in Seams 1 and 2, thus indicating that climatic changes may have enhanced environmental changes within the peat-forming vegetation.
4.4.2 CIE 2 (ETM2?)
Methner et al. (2019) suggested that the two negative δ13CTOC excursions at the transition of Seam 1 to Interbed 2 and in the lower part of Seam 2 represent a single CIE (CIE 2 of the present paper) embracing a pronounced Apectodinium acme with mass occurrences of different species of Apectodinium in Interbed 2 and discussed a possible relation to the PETM. However, this excursion (−1.3 ‰ mean decrease in δ13CTOC, Table 2) is smaller than CIE 1 in the Main Seam and other CIEs associated with the PETM in the terrestrial realm (McInerney and Wing, 2011), thus implying another post-PETM hyperthermal (Methner et al., 2019).
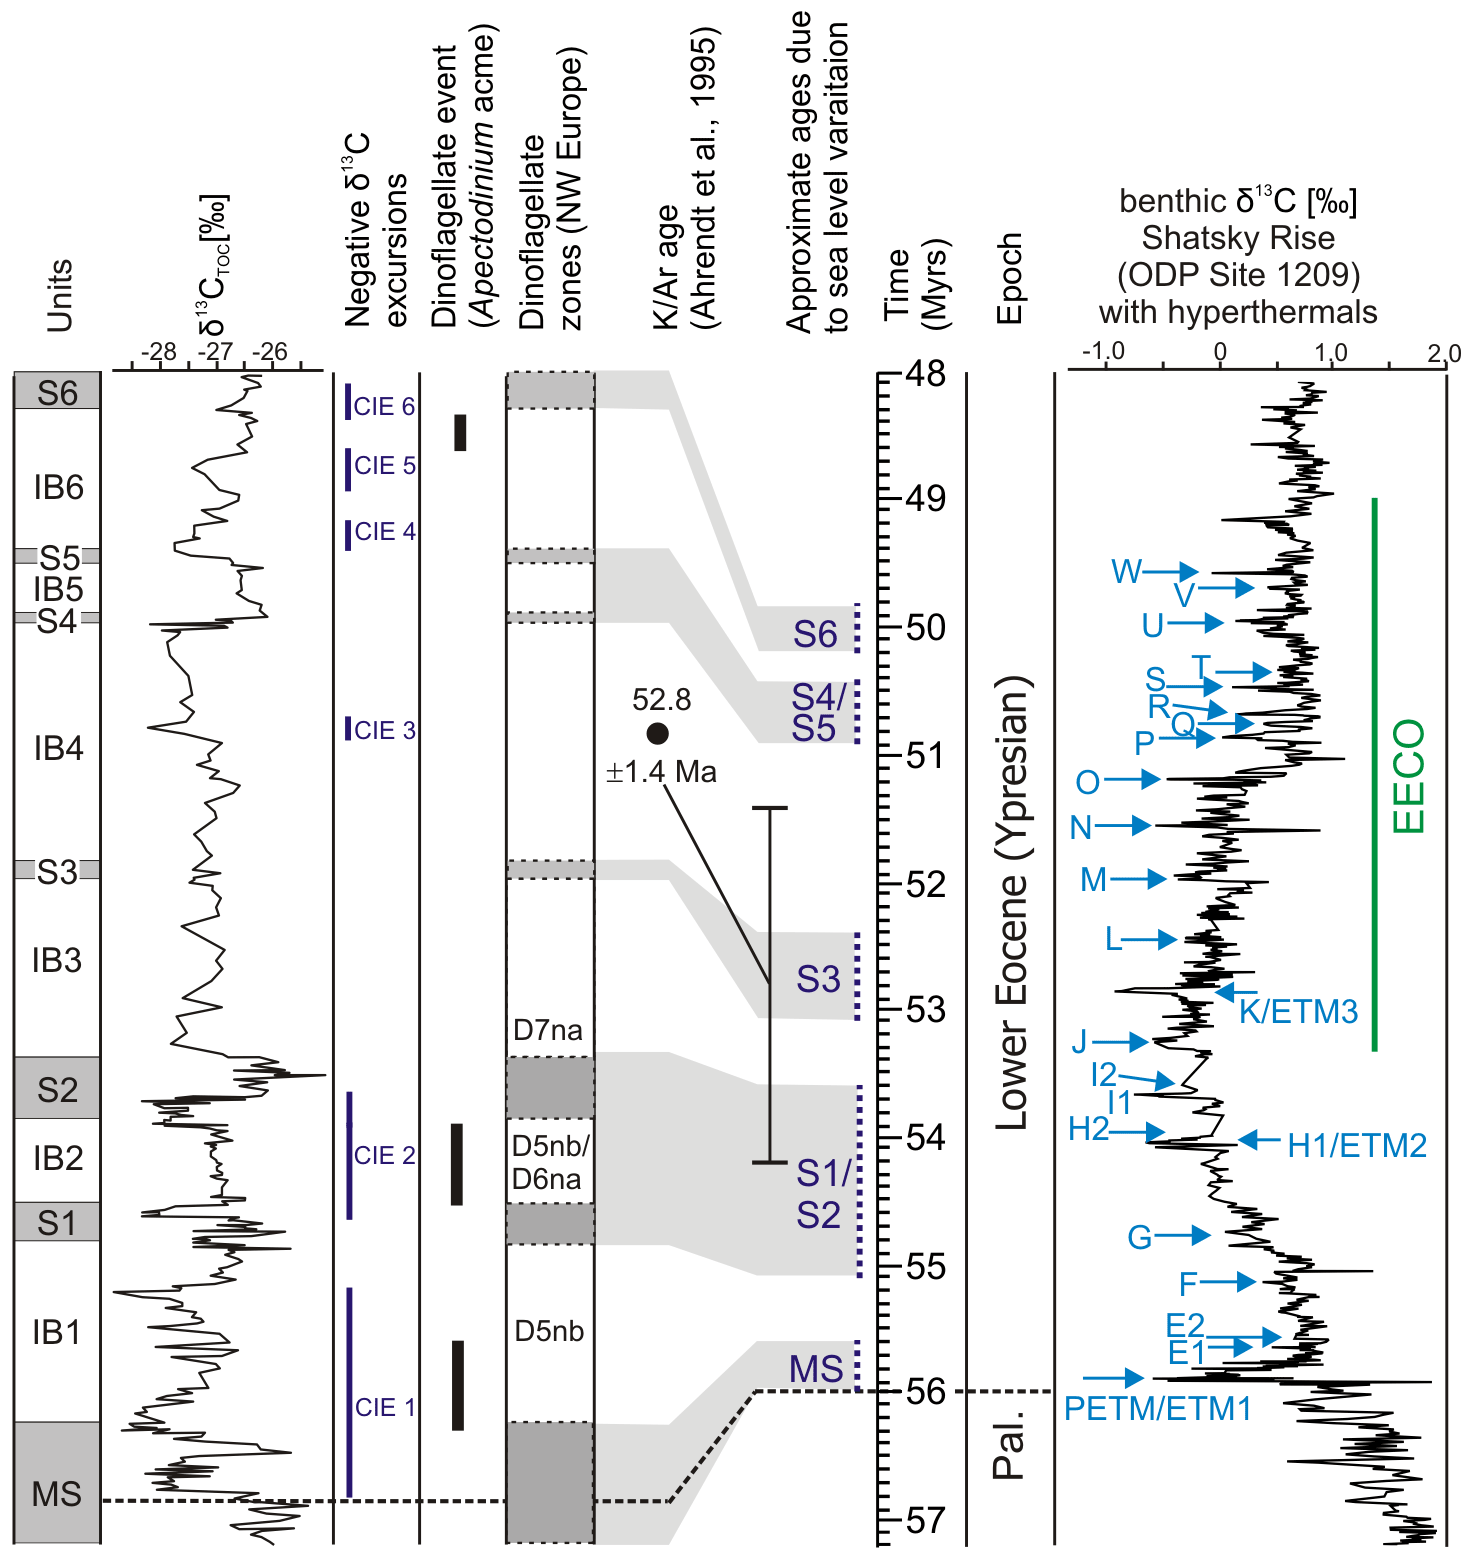
Figure 9Correlations between lignite and interbed units in the lower part of the Schöningen Formation, δ13CTOC values (this work), dinoflagellate ages (this work), K Ar age (Ahrendt et al., 1995), approximate ages of seams due to sea level fluctuations (this work), and δ13C isotopic excursion (CIE) ages (Westerhold et al., 2017, 2018b). Data for the benthic δ13C curve from the Shatsky rise (ODP site 1209, northwestern Pacific), as representing a typical deep marine isotope record for this time period, are taken from Westerhold et al. (2018b). The comparison of carbon isotope records from Schöningen and the northwestern Pacific shows that CIE 1 is in the range of the PETM, CIE 2 in the range of the H1–ETM2 and H2 events, and CIEs 3 to 6 in the range of small CIEs known from the marine record, which indicate high-amplitude climate fluctuations during the EECO. Pal.: Paleocene, S: seam, IB: interbed.
We are now able to assign Interbed 2 with the distinct Apectodinium acme (Riegel et al., 2012) to the dinocyst zones D5nb or D6 (Fig. 2). Correlation with the eustatic sea level fluctuations limits deposition of Seam 1 and Seam 2 with Interbed 2 to a time between 53.7 and 55.1 Ma (Fig. 9). This includes the ETM2 or H1 event at 54.05 Ma, which did not reach the intensity of the PETM (Westerhold et al., 2017) and is therefore a good candidate for CIE 2. According to Sluijs et al. (2008) the ETM2 was also associated with a transgression in the North Sea Basin, which could well correlate with the change from terrestrial to marine deposits at the top of Seam 1.
However, CIE 2 still cannot be unequivocally correlated (see Methner et al., 2019). According to Cramer et al. (2003) and Westerhold et al. (2017, 2018b) some minor CIEs such as the E1–E2, F, and G events can be recognized in marine records between the PETM and the ETM2 event (Fig. 9). Some negative δ13C excursions in a terrestrial to shallow marine lower Eocene section in the Dieppe–Hampshire Basin in Normandy (France) were putatively linked to these events (Garel et al., 2020). Such a comparison may also work for CIE 2 in the Schöningen Formation, especially for the F (55.17 Ma, Westerhold et al., 2017) and G (54.99 Ma, Cramer et al., 2003; Westerhold et al., 2017) events with ages approximating the age of Seam 1 (Fig. 9).
4.4.3 CIEs 3–6 (EECO)
The interval between Seam 3 and Seam 6 can be assigned to a period between 53 and 50 Ma (Fig. 9) that corresponds well to the EECO (53.26–49.14 Ma) as described from marine records (Westerhold et al., 2018b). According to the age model presented here, the terminal cooling phase of the EECO is not represented in the present dataset since it is probably situated above Seam 6.
The onset of the EECO, which is placed at the J event at 53.62 Ma (Westerhold et al., 2018b; Fig. 9), is difficult to locate in the present δ13CTOC data from the Schöningen Formation, since the values remain low in Interbed 3 and do not show significant fluctuations (Fig. 4). However, correlation with the eustatic sea level (Fig. 2) dates Seam 3 to an interval between 52.5 and 53.1 Ma, which is a negligible difference to the 53.5 Ma suggested by Brandes et al. (2012) since peat accumulation of Seam 3 in any case started after the J event.
The phase of high-amplitude isotope fluctuations between Seams 4 and 6 (Fig. 9) is characterized by highly variable δ13CTOC values including subordinate CIEs, which followed a phase of fairly stable values in Interbeds 3 and 4. However, within this interval none of the numerous minor CIEs generally characterizing the EECO (Westerhold et al., 2017; Fig. 9) can currently be assigned to any specific CIE in the Schöningen section. However, in general, the carbon isotope data from Schöningen reflect the global pattern of δ13C data for this part of the EECO. This is further supported by the tentative correlation of a K Ar age of 52.8 ± 1.4 Ma from the Emmerstedt core (Ahrendt et al., 1995) with the part of our section at Schöningen between Seam 3 and Seam 6 (Riegel et al., 2012, Fig. 9).
Bulk organic carbon isotopic data from a 98 m thick succession of alternating lignites and clastic deposits in the lower part of the Schöningen Formation at its type locality in the former Helmstedt Lignite Mining District, northern Germany, show at least six negative CIEs. New age constraints based on a biostratigraphic analysis of dinoflagellate cysts in combination with a correlation of peat accumulation phases with lowstands of global sea level allow for a robust correlation of most of the recognized CIEs with known long- and short-term hyperthermals of the early Eocene.
-
A strong CIE of −2.6 ‰ in δ13CTOC values in the upper part of the main seam (CIE 1) and the lower part of Interbed 1 can be related to the PETM. The onset of CIE 1 is restricted to the Main Seam, and the minimum in δ13CTOC values was reached within less than 10 kyr. A short recovery to pre-CIE values 4.5 kyr after the onset reflects a stepwise injection of carbon into the atmosphere at the beginning of the PETM. The sudden change from a Nyssa–Taxodium swamp forest to largely angiosperm-dominated flora in the peat-forming vegetation strictly followed changes in δ13CTOC values, suggesting that the CIE-related thermal event somehow influenced the composition of the vegetation. A sudden change marks the onset of CIE 1, which occurs within purely terrestrial deposits. The PETM-related transgression caused a change to brackish estuarine deposits. Following a possible hiatus at the lithological boundary between the seam and interbed, the recovery phase of the CIE can be identified in the lower part of Interbed 1.
-
CIE 2 has a negative shift of −1.7 ‰ in δ13CTOC. It is comparable to the PETM-related CIE in the Main Seam and Interbed 1. Similar to CIE 1 it starts in the terrestrial environment of Seam 1 but is mainly included in the marine Interbed 2 and the lower part of Seam 2. Here, a transgression related to a thermal event has flooded coastal wetlands. This CIE can be tentatively correlated with the ETM2 event, but an assignment to other post-PETM CIEs such as the F or G events preceding the ETM2 cannot be excluded.
-
Between Seam 3 and Seam 6 of the Schöningen Formation at least four minor CIEs with a maximum negative shift of −1.3 ‰ in δ13CTOC values occur. Although it is impossible to assign these CIEs to specific events that are known from the marine record, the carbon isotope trend in this part of the studied section can clearly be correlated with the gradual long-term warming of the EECO. The strongly fluctuating δ13CTOC values between Seam 4 and Seam 6 particularly point to high-amplitude climate fluctuations and unstable climate conditions as characteristic of the EECO shortly before the climate system shifted back to another cooling phase not covered by the presently studied section.
All data shown and discussed are available in the Supplement.
Samples are stored in the Senckenberg collections and are available upon request.
The supplement related to this article is available online at: https://doi.org/10.5194/cp-18-2231-2022-supplement.
OKL, VW, and AM designed the study. OKL, MM, and KM conducted the geochemical analyses and evaluated the results. WR and VW contributed field data, and WR provided palynological data from the Main Seam. WR and OKL were responsible for biostratigraphy based on dinoflagellate cysts. OKL wrote the initial draft of the paper and was responsible for the visualization of the results. All authors contributed to the interpretations and conclusions presented and edited the final version of this paper.
The contact author has declared that none of the authors has any competing interests.
Publisher's note: Copernicus Publications remains neutral with regard to jurisdictional claims in published maps and institutional affiliations.
Olaf Klaus Lenz acknowledges support through funding by the Deutsche Forschungsgemeinschaft (DFG, grants LE 2376/4-1, LE 2376/4-2). Katharina Methner acknowledges support through the Alexander von Humboldt Foundation (Feodor-Lynen Fellowship). The authors thank Karin Schmidt for valuable field support as well as Jens Fiebig and Ulrich Treffert for technical assistance. We are also grateful to the Helmstedt Revier GmbH (formerly BKB and later EoN) for access to the sections and technical support in the field. Finally, we thank the two reviewers for their comments and suggestions, which greatly helped to improve this paper.
This research has been supported by the Deutsche Forschungsgemeinschaft (grant nos. LE 2376/4-1 and LE 2376/4-2 to Olaf Klaus Lenz) and the Alexander von Humboldt Foundation (Feodor-Lynen Fellowship to Katharina Methner).
The publication of this article was funded by the Open Access Fund of the Leibniz Association.
This paper was edited by Yves Godderis and reviewed by two anonymous referees.
Abels, H. A., Clyde, W. C., Gingerich, P. D., Hilgen, F. J., Fricke, H. C., Bowen, G. J., and Lourens, L. J.: Terrestrial carbon isotope excursions and biotic change during Palaeogene hyperthermals, Nat. Geosci., 5, 326–329, https://doi.org/10.1038/ngeo1427, 2012.
Abels , H. A., Lauretano, V., van Yperen, A. E., Hopman, T., Zachos, J. C., Lourens, L. J., Gingerich, P. D., and Bowen, G. J.: Environmental impact and magnitude of paleosol carbonate carbon isotope excursions marking five early Eocene hyperthermals in the Bighorn Basin, Wyoming, Clim. Past, 12, 1151–1163, https://doi.org/10.5194/cp-12-1151-2016, 2016.
Ahrendt, H., Köthe, A., Lietzow, A., Marheine, D., and Ritzkowski, S.: Lithostratigraphie, Biostratigraphie und radiometrische Datierung des Unter-Eozäns von Helmstedt (SE-Niedersachsen), Z. dt. geol. Ges. 146, 450–457, 1995.
Baczynski, A. A., McInerney, F. A., Wing, S. L., Kraus, M. J., Bloch, J. I., Boyer, D. M., Secord, R., Morse, P. E., and Fricke, H. C.: Chemostratigraphic implications of spatial variation in the Paleocene–Eocene Thermal Maximum carbon isotope excursion, SE Bighorn Basin, Wyoming, Geochem. Geophys. Geosyst., 14, 4133–4152, https://doi.org/10.1002/ggge.20265, 2013.
Baczynski, A. A., McInerney, F. A., Wing, S. L., Kraus, M. J., Morse, P. E., Bloch, J. I., Chung, A. H., and Freeman, K. H.: Distortion of carbon isotope excursion in bulk soil organic matter during the Paleocene-Eocene thermal maximum, GSA Bulletin, 128, 1352–1366, https://doi.org/10.1130/B31389.1, 2016.
Bains, S., Norris, R. D., Corfield, R. M., and Faul, K. L.: Termination of global warmth at the Palaeocene/Eocene boundary through productivity feedback, Nature, 407, 171–174, https://doi.org/10.1038/35025035, 2000.
Blumenstengel, H. and Krutzsch, W.: Tertiär, in: Geologie von Sachsen-Anhalt, edited by: Bachmann, G. H., Ehling, B. C., Eichner, R., and Schwab M., Schweizerbart, Stuttgart, Germany, 267–273, ISBN 978-3-510-65240-2, 2008.
Bohaty, S. M. and Zachos, J. C.: Significant Southern Ocean warming event in the late middle Eocene, Geology, 31, 1017–1020, https://doi.org/10.1130/G19800.1, 2003.
Bohaty, S. M., Zachos, J. C., Florindo, F., and Delaney, M. L.: Coupled greenhouse warming and deep-sea acidification in the middle Eocene, Paleoceanography, 24, 1–16, https://doi.org/10.1029/2008PA001676, 2009.
Bowen, G., Maibauer, B., Kraus, M., Röhl, U., Westerhold, T., Steimke, A., Gingerich, P. D., Wing, S. L., and Clyde, W. C.: Two massive, rapid releases of carbon during the onset of the Palaeocene–Eocene thermal maximum, Nat. Geosci., 8, 44–47, https://doi.org/10.1038/ngeo2316, 2015.
Bralower, T. J.: Evidence of surface water oligotrophy during the Paleocene-Eocene thermal maximum: Nannofossil assemblage data from Ocean Drilling Program Site 690, Maud Rise, Weddell Sea, Paleoceanography, 17, 1023, https://doi.org/10.1029/2001pa000662, 2002.
Brandes, C., Pollok, L., Schmidt, C., Wilde, V., and Winsemann, J.: Basin modelling of a lignite-bearing salt rim syncline: insights into rim syncline evolution and salt diapirism in NW Germany, Basin Res., 24, 699–716, https://doi.org/10.1111/j.1365-2117.2012.00544.x, 2012.
Bujak, J. P. and Brinkhuis, H.: Global warming and dinocyst changes across the Paleocene/Eocene Epoch boundary, in: Late Paleocene–early Eocene climatic and biotic events in the marine and terrestrial records, edited by: Aubry, M. P., Lucas, S. G., and Berggren, W., Columbia University Press, New York, USA, 277–295, ISBN 978-0231102384, 1998.
Bujak, J. P. and Mudge, D.: A high-resolution North Sea dinocyst zonation, J. Geol. Soc. Lond., 151, 449–462, 1994.
Cavagnetto, C.: La palynoflore d'un gisement d'ambre de l'Eocène basal du Bassin Parisien (Le Quesnoy, France), Palaeontographica B, 255, 147–171, 2000.
Chen, Z., Wang, X., Hu, J., Yang, S., Zhu, M., Dong, X., Tang, Z., Peng, P., and Ding, Z.: Structure of the carbon isotope excursion in a high-resolution lacustrine Paleocene–Eocene Thermal Maximum record from central China, Earth Planet. Sc. Lett., 408, 331–340, https://doi.org/10.1016/j.epsl.2014.10.027, 2014.
Collinson, M. E., Hooker, J. J., and Gröcke, D. R.: Cobham Lignite Bed and penecontemporaneous macrofloras of southern England: A record of vegetation and fire across the Paleocene-Eocene Thermal Maximum, in: Causes and consequences of globally warm climates in the early Paleogene, edited by: Wing, S. L., Gingerich, P. D., Schmitz, B., and Thomas, E., GSA Special Paper, 369, 333–349, https://doi.org/10.1130/0-8137-2369-8.333, 2003.
Collinson, M. E., Steart, D. C., Harrington, G. J., Hooker, J. J., Scott, A. C., Allen, L. O., Glasspool, I. J., and Gibbons, S. J.: Palynological evidence of vegetation dynamics in response to palaeoenvironmental change across the onset of the Paleocene-Eocene Thermal Maximum at Cobham, Southern England, Grana, 48, 38–66, https://doi.org/10.1080/00173130802707980, 2009.
Costa, L. I. and Manum, S. B.: The distribution of the interregional zonation of the Paleogene (D1–D15) and the Miocene (D16–D20), in: The Northwest European Tertiary Basin. Results of the International Geological Correlation Programme, Project 124, edited by: Vinken, R., Geol. Jahrb. A., 100, 321–330, 1988.
Cramer, B. S., Wright, J. D., Kent, D. V., and Aubry, M. P.: Orbital climate forcing of δ13C excursions in the late Paleocene–early Eocene (chrons C24n–C25n), Paleoceanography, 18, 1097, https://doi.org/10.1029/2003PA000909, 2003.
Crouch, E. M., Heilmann-Clausen, C., Brinkhuis, H., Morgans, H. E. G., Rogers, K. M., Egger, H., and Schmitz, B.: Global dinoflagellate event associated with the late Paleocene thermal maximum, Geology, 29, 315–318, https://doi.org/10.1130/0091-7613(2001)029<0315:GDEAWT>2.0.CO;2, 2001.
Dalrymple, R. W. and Choi, K.: Morphologic and facies trends through the fluvial-marine transition in tide-dominated depositional systems: a schematic framework for environmental and sequence-stratigraphic interpretation, Earth-Sci. Rev., 81, 135–174, https://doi.org/10.1016/j.earscirev.2006.10.002, 2007.
DeConto, R. M. and Pollard, D.: A coupled climate-ice sheet modeling approach to the early Cenozoic history of the Antarctic ice sheet, Palaeogeogr. Palaeoclimatol. Palaeoecol., 198, 39–52, https://doi.org/10.1016/S0031-0182(03)00393-6, 2003.
Denison, C. N.: Stratigraphic and sedimentological aspects of the worldwide distribution of Apectodinium in Paleocene/Eocene Thermal Maximum deposits, Geol. Soc. Spec. Publ., 511, 269–308, https://doi.org/10.1144/SP511-2020-46, 2021.
Dickens, G. R.: Carbon addition and removal during the Late Palaeocene Thermal Maximum: Basic theory with a preliminary treatment of the isotope record at ODP Site 1051, Blake Nose, Geol. Soc. Spec. Publ., 183, 293–305, https://doi.org/10.1144/GSL.SP.2001.183.01.14, 2001.
Diefendorf, A. F., Mueller, K. E., Wing, S. L., Koch, P. L., and Freeman, K. H.: Global patterns in leaf 13C discrimination and implications for studies of past and future climate, P. Natl. Acad. Sci. USA, 107, 5738–5743, https://doi.org/10.1073/pnas.0910513107, 2010.
Domingo, L., López-Martínez, N., Leng, M. J., and Grimes, S. T.: The Paleocene–Eocene Thermal Maximum record in the organic matter of the Claret and Tendruy continental sections (South-central Pyrenees, Lleida, Spain), Earth Planet. Sc. Lett., 281, 226–237, https://doi.org/10.1016/j.epsl.2009.02.025, 2009.
Dupuy, C., Quesnel, F., and Baele, J.-M.: An unexpected record of the PETM in terrestrial and organic sediments of Avesnois, between the Paris and Belgian Basins, NW Europe, Climatic and Biotic Events of the Paleogene meeting: CBEP 2014, July 2014, Ferrara, Italy, 68–69, https://hal-brgm.archives-ouvertes.fr/hal-01010549 (last access: 10 October 2022), 2014.
Foreman, B. Z., Heller, P. L., and Clementz, M. T.: Fluvial response to abrupt global warming at the Palaeocene/Eocene boundary, Nature, 491, 92–95, https://doi.org/10.1038/nature11513, 2012.
Garel, S., Schnyder, J., Jacob, J., Dupuis, C., Boussafir, M., Le Milbeau C, Storme, J. Y., Iakovleva, A. I., Yans, J., Baudin, F., Fléhoc, C., and Quesnel, F.: Paleohydrological and paleoenvironmental changes recorded in terrestrial sediments of the Paleocene–Eocene boundary (Normandy, France), Palaeogeogr. Palaeoclimatol. Palaeoecol., 376, 184–199, https://doi.org/10.1016/j.palaeo.2013.02.035, 2013.
Garel, S., Dupuis, C., Quesnel, F., Jacob, J., Yans, J., Magioncalda, R., Fléhoc, C., and Schnyder J.: Multiple early Eocene carbon isotope excursions associated with environmental changes in the Dieppe-Hampshire Basin (NW Europe), BSGF – Earth Sci. Bull., 191, 33, https://doi.org/10.1051/bsgf/2020030, 2020.
Gedl, P.: Eocene dinoflagellate cysts from the Popiele beds at Koniusza (Skole Nappe, Flysch Carpathians, Poland): taxonomy, biostratigraphy, and palaeoenvironmental reconstruction of a marginal marine basin, Stud. Geol. Polon., 136, 5–197, 2013.
Gingerich, P. D.: Environment and evolution through the Paleocene–Eocene thermal maximum, Trends Ecol. Evol., 21, 246–253, https://doi.org/10.1016/j.tree.2006.03.006, 2006.
Giorgioni, M., Jovane, L., Rego, E. S., Rodelli, D., Frontalini, F., Coccioni, R., Catanzariti, R., and Öczan, E.: Carbon cycle instability and orbital forcing during the Middle Eocene Climatic Optimum, Sci. Rep., 9, 9357, https://doi.org/10.1038/s41598-019-45763-2, 2019.
Gramann, F., Harre, W., Kreuzer, H., Look, E. R., and Mattiat, B.: K-Ar ages of Eocene to Oligocene glauconitic sands from Helmstedt and Lehrte (Northwestern Germany), Newsl. Stratigr., 4, 71–86, 1975.
Gürs, K.: Das Tertiär Nordwestdeutschlands in der Stratigraphischen Tabelle von Deutschland 2002, Newsl. Stratigr., 41, 313–322, 2005.
Hammer-Schiemann, G.: Palynologische Untersuchungen zur Fazies und Ökologie der Unterflözgruppe im Tagebau Schöningen (Untereozän, Helmstedt, Bez. Braunschweig), PhD thesis, University of Göttingen, Göttingen, Germany, 107 pp., https://opac.sub.uni-goettingen.de/ (last access: 10 October 2022), 1998.
Haq, B. U., Hardenbol, J., and Vail, P. R.: Chronology of fluctuating sea levels since the Triassic, Science, 235, 1156–1167, https://doi.org/10.1126/science.235.4793.1156, 1987a.
Haq, B. U., Hardenbol, J., and Vail, P. R.: The new chronostratigraphic basis of Cenozoic and Mesozoic sea level cycles, in: Timing and depositional history of eustatic sequences: Constraints on seismic stratigraphy, edited by: Ross, C. A. and Harman, D., Cushman Foundation for Foraminiferal Research Special Publication, 24, 7–13, ISBN 978-9998453067, 1987b.
Haq, B. U., Hardenbol, J., and Vail, P. R.: Mesozoic and Cenozoic chronostratigraphy and cycles of sea-level change, in: Sea-level changes: An integrated approach, edited by: Wilgus, C. K., Hastings, B. S., Ross, C. A., Posamentier, H. W., Van Wagoner, J., and Kendall, C. G. S. C., Spec. Publ. Soc. Econ. Paleont. Miner., Tulsa, Oklahoma, USA, 42, 71–108, https://doi.org/10.2110/pec.88.01.0071, 1988.
Heilmann-Clausen, C., Nielsen, O. B., and Gersner, F.: Lithostratigraphy and depositional environments in the Upper Paleocene and Eocene of Denmark, Bull. Geol. Soc. Denm., 33, 287–323, 1985.
Hollis, C. J., Handley, L., Crouch, E. M., Morgans, H. E. G., Baker, J. A., Creech, J., Collins, K. S., Gibbs, S. J., Huber, M., Schouten, S., Zachos, J. C., and Pancost, R. D.: Tropical sea temperatures in the high-latitude South Pacific during the Eocene, Geology, 37, 99–102, https://doi.org/10.1130/G25200A.1, 2009.
Hooker, J. J. and Collinson, M.: Mammalian faunal turnover across the Paleocene-Eocene boundary in NW Europe: the roles of displacement, community evolution and environment, Austrian J. Earth Sci., 105, 17–28, 2012.
Iakovleva, A. I., Brinkhuis, H., and Cavagnetto, C.: Late Palaeocene–Early Eocene dinoflagellate cysts from the Turgay Strait, Kazakhstan; correlations across ancient seaways, Palaeogeogr. Palaeoclimatol. Palaeoecol., 172, 243–268, https://doi.org/10.1016/S0031-0182(01)00300-5, 2001.
Iakovleva, A. I., Quesnel, F., Dupuis, C., Storme, J. Y., Breillat, N., Magioncalda, R., Iacumin, P., Fléhoc, C., Roche, E., Smith, T., Baele, J. M., Yans, J., and De Coninck, J.: New integrated high resolution dinoflagellate cyst stratigraphy and litho- and chemostratigraphy from the Paris and Dieppe–Hampshire basins for the “Sparnacian”, in: STRATI 2013, edited by: Rocha, R., Pais, J., Kullberg J., and Finney S., Springer Geology, Springer, Cham, Switzerland, 107–111, https://doi.org/10.1007/978-3-319-04364-7_22, 2013.
Iakovleva, A. I., Quesnel, F., and Dupuis, C.: New insights on the Late Pale–cene – Early Eocene dinoflagellate cyst zonation for the Paris and Dieppe basins, Earth Sciences Bulletin, 192, 44, https://doi.org/10.1051/bsgf/2021035, 2021.
Inglis, G. N., Collinson, M. E., Riegel, W., Wilde, V., Robson, B. E., Lenz, O. K., and Pancost, R. D.: Ecological and biogeochemical change in an early Paleogene peat-forming environment: Linking biomarkers and palynology, Palaeogeogr., Palaeoecl., 438, 245–255, https://doi.org/10.1016/j.palaeo.2015.08.001, 2015.
Inglis, G. N., Bragg, F., Burls, N. J., Cramwinckel, M. J., Evans, D., Foster, G. L., Huber, M., Lunt, D. J., Siler, N., Steinig, S., Tierney, J. E., Wilkinson, R., Anagnostou, E., de Boer, A. M., Dunkley Jones, T., Edgar, K. M., Hollis, C. J., Hutchinson, D. K., and Pancost, R. D.: Global mean surface temperature and climate sensitivity of the early Eocene Climatic Optimum (EECO), Paleocene–Eocene Thermal Maximum (PETM), and latest Paleocene, Clim. Past, 16, 1953–1968, https://doi.org/10.5194/cp-16-1953-2020, 2020.
Jaramillo, C., Ochoa, D., Contreras, L., Pagani, M., Carvajal-Ortiz, H., Pratt, L. M., Krishnan, S., Cardona, A., Romero, M., Quiroz, L., Rodriguez, G., Rueda, M. J., de la Parra, F., Morón, S., Green, W., Bayona, G., Montes, C., Quintero, O., Ramirez, R., Mora, G., Schouten, S., Bermudez, H., Navarewtte, R., Parra, F., Alvarán, M., Osorno, J., Crowley, J. L., Valencia, V., and Vervoort, J.: Effects of rapid global warming at the Paleocene-Eocene Boundary on Neotropical Vegetation, Science, 330, 957–961, https://doi.org/10.1126/science.1193833, 2010.
Kennett, J. P. and Stott, L. D.: Abrupt deep-sea warming, palaeoceanographic changes and benthic extinctions at the end of the Palaeocene, Nature, 353, 225–229, https://doi.org/10.1038/353225a0, 1991.
Kirtland Turner, S., Sexton, P., Charles, C. D., and Norris, R. D.: Persistence of carbon release events through the peak of early Eocene global warmth, Nat. Geosci., 7, 748–751, https://doi.org/10.1038/ngeo2240, 2014.
Kominz, M. A., Browning, J. V., Miller, K. G., Sugarman, P. J., Misintzeva, S., and Scotese, C. R.: Late Cretaceous to Miocene sea-level estimates from the New Jersey and Delaware coastal plain coreholes: An error analysis, Basin Res., 20, 211–226, https://doi.org/10.1111/j.1365-2117.2008.00354.x, 2008.
Köthe, A.: Paleogene dinoflagellates from Northwest Germany, Geol. Jahrb. A, 118, 1–111, 1990.
Köthe, A.: Dinozysten-Zonierung im Tertiär Norddeutschlands, Revue Paléobiologie, 22, 895–923, 2003.
Köthe, A. and Piesker, B.: Stratigraphic distribution of Paleogene and Miocene dinocysts in Germany, Revue Paléobiologie, 26, 1–39, 2007.
Krutzsch, W.: Die stratigraphisch verwertbaren Sporen- und Pollenformen des mitteleuropäischen Alttertiärs, J. Geol., 3, 309–379, 1970.
Lauretano, V., Littler, K., Polling, M., Zachos, J. C., and Lourens, L. J.: Frequency, magnitude and character of hyperthermal events at the onset of the Early Eocene Climatic Optimum, Clim. Past, 11, 1313–1324, https://doi.org/10.5194/cp-11-1313-2015, 2015.
Lenz, O. K.: Palynologie und Paläoökologie eines Küstenmoores aus dem Mittleren Eozän Mitteleuropas – Die Wulfersdorfer Flözgruppe aus dem Tagebau Helmstedt, Niedersachsen, Palaeontogr. Abt. B, 271, 1–157, 2005.
Lenz, O. K., Riegel, W., and Wilde, V.: Greenhouse conditions in lower Eocene coastal wetlands? – Lessons from Schöningen, Northern Germany, PLoS ONE, 16, e0232861, https://doi.org/10.1371/journal.pone.0232861, 2021.
Lietzow, A. and Ritzkowski, S.: Das marine Paläogene bei Helmstedt, südöstliches Niedersachsen, in: Das Tertiär im mitteldeutschen Ästuar, Stand und aktuelle Probleme, edited by: Friedel, C. H. and Balaske, P., Exkurs. f. u. Veröfftl. Dt. Ges. Geowiss., 230, Berlin, Hannover, Germany, 20–22, 2005.
Lourens, L. J., Sluijs, A., Kroon, D., Zachos, J. C., Thomas, E., Röhl, U., Bowles, J., and Raffi, I.: Astronomical pacing of late Palaeocene to early Eocene global warming events, Nature, 235, 1083–1087, https://doi.org/10.1038/nature03814, 2005.
McCarren, H., Thomas, E., Hasegawa, T., Röhl, U., and Zachos, J. C.: Depth dependency of the Paleocene-Eocene carbon isotope excursion: Paired benthic and terrestrial biomarker records (Ocean Drilling Program Leg 208, Walvis Ridge), Geochem. Geophys. Geosyst., 9, Q10008, https://doi.org/10.1029/2008GC002116, 2008.
McInerney, F. A. and Wing, S. L.: The Paleocene-Eocene Thermal Maximum: A perturbation of carbon cycle, climate, and biosphere with implications for the future, Annu. Rev. Earth Pl. Sci., 39, 489–516, https://doi.org/10.1146/annurev-earth-040610-133431, 2011.
Methner, K., Mulch, A., Fiebig, J., Wacker, U., Gerdes, A., Graham, S. A., and Chamberlain, C. P.: Rapid Middle Eocene temperature change in western North America, Earth Planet. Sc. Lett., 450, 132–139, https://doi.org/10.1016/j.epsl.2016.05.053, 2016.
Methner, K., Lenz, O., Riegel, W., Wilde, V., and Mulch, A.: Paleoenvironmental response of midlatitudinal wetlands to Paleocene–early Eocene climate change (Schöningen lignite deposits, Germany), Clim. Past, 15, 1741–1755, https://doi.org/10.5194/cp-15-1741-2019, 2019.
Miller, K. G., Kominz, M. A., Browning, J. V., Wright, J. D., Mountain, G. S., Katz, M. E., Sugarman, P. J., Cramer, B. S., Christie-Blick, N., and Pekar, S. F.: The Phanerozoic record of global sea-level change, Science, 310, 1293–1298, https://doi.org/10.1126/science.1116412, 2005a.
Miller, K. G., Wright, J. D., and Browning J. V.: Visions of ice sheets in a greenhouse world, Mar. Geol., 217, 215–231, https://doi.org/10.1016/j.margeo.2005.02.007, 2005b.
Mulch, A., Chamberlain, C. P., Cosca, M. A., Theyssier, C., Methner, K., Hren, M. T., and Graham, S. A.: Rapid change in high-elevation precipitation patterns of western North America during the Middle Eocene Climatic Optimum (MECO), Am. J. Sci., 315, 317–336, https://doi.org/10.2475/04.2015.02, 2015.
Nel, A., de Plöeg, G., Dejax, J., Dutheil, D., Franchesci, D., Gheerbrant, E., Godinot, M., Hervet, S., Menier, J. J., Augé, M., Bignot, G., Cavagnetto, C., Duffaud, S., Gaudant, J., Hua, S., Jpssang, A., de Broin, F. L., Pozzi, J. P., Paicheler, J. C., Beuchet, F., and Rage, J. C.: Un gisement sparnacien exceptionnel à plantes, arthropodes et vertébrés (Éocène basal, MP7): Le Quesnoy (France), Comptes rendus de l'Academie des Sciences, Series IIA, Sciences de la terre et des planètes, 329, 65–72, https://doi.org/10.1016/S1251-8050(99)80229-8, 1999.
Nickel, B.: Die mitteleozäne Mikroflora von Eckfeld bei Manderscheid/Eifel, Mainzer Naturw. Archiv Beih., 18, 1–121, 1996.
Nicolo, M. J., Dickens, G. R., and Hollis, C. J.: South Pacific intermediate water oxygen depletion at the onset of the Paleocene-Eocene thermal maximum as depicted in New Zealand margin sections, Paleoceanography, 25, PA4210, https://doi.org/10.1029/2009PA001904, 2010.
Nunes, F. and Norris, R. D.: Abrupt reversal in ocean overturning during the Palaeocene/Eocene warm period, Nature, 439, 60–63, https://doi.org/10.1038/nature04386, 2006.
Osman, A., Pollok, L., Brandes, C., and Winsemann, J.: Sequence stratigraphy of a Paleogene coal bearing rim syncline: interplay of salt dynamics and sea level changes, Schöningen, Germany, Basin Res., 25, 675–708, https://doi.org/10.1111/bre.12021, 2013.
Pancost, R. D., Steart, D. S., Handley, L., Collinson, M. E., Hooker, J. J., Scott, A. C., Grassineau, N. V., Glasspool, I. J., and Pancost, R. D.: Increased terrestrial methane cycling at the Palaeocene-Eocene thermal maximum, Nature, 449, 332–336, https://doi.org/10.1038/nature06012, 2007.
Pflug, H. D.: Palynologie und Stratigraphie der eozänen Braunkohlen von Helmstedt, Paläont. Z., 26, 112–137, 1952.
Pflug, H. D.: Palyno-Stratigraphie des Eozän/Oligozän im Raum von Helmstedt, in Nordhessen und im südlichen Anschlussbereich, in: Nordwestdeutschland im Tertiär, edited by: Tobien, H., Beiträge zur Regionalen Geologie der Erde, 18: Gebrüder Borntraeger, Berlin, Stuttgart, Germany, 567–582, ISBN 978-3-443-11018-5, 1986.
Riegel, W. and Wilde, V.: An early Eocene Sphagnum bog at Schöningen, northern Germany, Int. J. Coal Geol., 159, 57–70, https://doi.org/10.1016/j.coal.2016.03.021, 2016.
Riegel, W., Bode, T., Hammer, J., Hammer-Schiemann, G., Lenz, O. K., and Wilde, V.: The paleoecology of the lower and middle Eocene at Helmstedt, northern Germany – A study in contrasts, Acta Palaeobot. Suppl, 2, 349–358, 1999.
Riegel, W., Wilde, V., and Lenz, O. K.: The early Eocene of Schöningen (N-Germany) – an interim report, Austrian J. Earth Sci., 105, 88–109, 2012.
Riegel, W., Lenz, O. K., and Wilde, V.: From open estuary to meandering river in a greenhouse world – An ecological case study from the Middle Eocene of Helmstedt, northern Germany, Palaios, 30, 304–326, https://doi.org/10.2110/palo.2014.005, 2015.
Röhl, U., Bralower, T. J., Norris, R. D., and Wefer, G.: New chronology for the late Paleocene thermal maximum and its environmental implications, Geology, 28, 927–930, https://doi.org/10.1130/0091-7613(2000)28<927:NCFTLP>2.0.CO;2, 2000.
Röhl, U., Westerhold, T., Monechi, S., Thomas, E., Zachos, J. C., and Donner, B.: The third and final Early Eocene Thermal Maximum: Characteristics, timing and mechanisms of the “X” event, in: Geological Society of America, Salt Lake City Meeting, 16–19 October 2005, Salt Lake City, USA, Abstracts with Programs, vol. 37, no. 7, p. 264, https://gsa.confex.com/gsa/2005AM/webprogram/Paper92425.html (last access: 10 October 2022), 2005.
Röhl, U., Westerhold, T., Bralower, T. J., and Zachos, J. C.: On the duration of the Paleocene-Eocene thermal maximum (PETM), Geochem. Geophys. Geosyst., 8, Q12002, https://doi.org/10.1029/2007GC001784, 2007.
Schouten, S., Woltering, M., Rijpstra, W. I. C., Sluijs, A., Brinkhuis, H., and Sinninghe Damsté, J. S.: The Paleocene–Eocene carbon isotope excursion in higher plant organic matter: Differential fractionation of angiosperms and conifers in the Arctic, Earth Planet. Sc. Lett., 258, 581–592, https://doi.org/10.1016/j.epsl.2007.04.024, 2007.
Scotese, C. R.: Atlas of Paleogene Paleogeographic Maps (Mollweide Projection), Maps 8–15, Volume 1, The Cenozoic, PALEOMAP Atlas for ArcGIS, PALEOMAP Project, Evanston, IL, USA, https://doi.org/10.13140/2.1.3417.6961, 2014.
Sexton, P. F., Norris, R. D., Wilson, P. A., Pälike, H., Westerhold, T., Röhl, U., Bolton, C. T., and Gibbs, S.: Eocene global warming events driven by ventilation of oceanic dissolved organic carbon, Nature, 471, 349–352, https://doi.org/10.1038/nature09826, 2011.
Sluijs, A. and Brinkhuis, H.: A dynamic climate and ecosystem state during the Paleocene-Eocene Thermal Maximum: inferences from dinoflagellate cyst assemblages on the New Jersey Shelf, Biogeosciences, 6, 1755–1781, https://doi.org/10.5194/bg-6-1755-2009, 2009.
Sluijs, A. and Dickens, G. R.: Assessing offsets between the δ13C of sedimentary components and the global exogenic carbon pool across early Paleogene carbon cycle perturbations, Global Biogeochem. Cy., 26, GB4005, https://doi.org/10.1029/2011GB004224, 2012.
Sluijs, A., Brinkhuis, H., Schouten, S., Bohaty, S. M., John, C. M., Zachos, J. C., Reichart, G.-J., Sinninghe Damsté, J. S., Crouch, E. M., and Dickens, G. R.: Environmental precursors to rapid light carbon injection at the Palaeocene/Eocene boundary, Nature, 450, 1218–1222, https://doi.org/10.1038/nature06400, 2007.
Sluijs, A., Brinkhuis, H., Crouch, E. M., John, C. M., Handley, L., Munsterman, D., Bohaty, S. M., Zachos, J. C., Reichart, G.-J., Schouten, S., Pancost, R. D., Sinninghe Damsté J. S., Welters, N. L. D., Lotter, A. F., and Dickens, G. R.: Eustatic variations during the Paleocene-Eocene greenhouse world, Paleoceanography, 23, PA4216, https://doi.org/10.1029/2008PA001615, 2008.
Sluijs, A., Schouten, S., Donders, T., Schoon, P. L., Röhl, U., Reichart, G.-J., Sangiorgi, F., Kim, J.-H., Sinninghe Damsté J. S., and Brinkhuis, H.: Warm and wet conditions in the Arctic region during Eocene Thermal Maximum 2, Nat. Geosci., 2, 777–780, https://doi.org/10.1038/ngeo668, 2009.
Sluijs, A., Bijl, P. K., Schouten, S., Röhl, U., Reichart, G.-J., and Brinkhuis, H.: Southern ocean warming, sea level and hydrological change during the Paleocene-Eocene thermal maximum, Clim. Past, 7, 47–61, https://doi.org/10.5194/cp-7-47-2011, 2011.
Sluijs, A., van Roij, L., Frieling, J., Laks, J., and Reichert, G.-J.: Single-species dinoflagellate cyst carbon isotope ecology across the Paleocene-Eocene Thermal Maximum, Geology, 46, 79–82, https://doi.org/10.1130/G39598.1, 2018.
Smith, F. A., Wing, S. L., and Freeman, K. H.: Magnitude of the carbon isotope excursion at the Paleocene-Eocene thermal maximum: the role of plant community change, Earth Planet. Sc. Lett., 262, 50–65, https://doi.org/10.1016/j.epsl.2007.07.021, 2007.
Speijer, R. P. and Wagner, T.: Sea-level changes and black shales associated with the late Paleocene thermal maximum: Organic geochemical and micropaleontologic evidence from the southern Tethyan margin (Egypt-Israel), in: Catastrophic events and mass extinctions: impacts and beyond, edited by: Koeberl, C. and MacLeod, K. G., Geol. Soc. Am. Spec. Pap., Boulder, Colorado, USA, 356, 533–549, https://doi.org/10.1130/0-8137-2356-6.533, 2002.
Speijer, R. P., Scheibner, C., Stassen, P., and Morsi, A. M. M.: Response of marine ecosystems to deep-time global warming: a synthesis of biotic patterns across the Paleocene-Eocene Thermal Maximum (PETM), Austrian J. Earth Sci., 105, 6–16, 2012.
Stach, E., Mackowsky, M. T., Teichmüller, M., Taylor, G. H., Chandra, D., and Teichmüller, R.: Stach's Textbook of Coal Petrology, Gebrüder Borntraeger, Berlin, Germany, ISBN 978-3-443-01018-8, 1982.
Standke, G.: Paläogeografie des älteren Tertiärs (Paleozän bis Untermiozän) im mitteldeutschen Raum, Z. Dtsch. Ges. Geowiss., 159, 81–103, 2008a.
Standke, G.: Tertiär, in: Geologie von Sachsen. Geologischer Bau und Entwicklungsgeschichte, edited by: Pälchen, W. and Walter, H., E. Schweizerbart'sche Verlagsbuchhandlung, Stuttgart, Germany, 358–419, ISBN 978-3-510-65239-6, 2008b.
Standke, G., Escher, D., Fischer, J., and Rascher, J.: Das Tertiär Nordwestsachsens. Ein geologischer Überblick, Sächsisches Landesamt für Umwelt, Landwirtschaft und Geologie, Dresden, Germany, https://publikationen.sachsen.de/bdb/artikel/12191 (last access: 10 October 2022), 2010.
Steurbaut, E., De Coninck, J., Dupuis, C., and King, C.: Dinoflagellate cyst events and depositional history of the Paleocene/Eocene boundary interval in the southern North Sea Basin, Geol. Foren. Stock. För., 122, 154–157, https://doi.org/10.1080/11035890001221154, 2000.
Steurbaut, E., Magioncalda, R., Dupuis, C., Van Simaeys, S., Roche, E., and Roche, M.: Palynology, paleoenvironments, and organic carbon isotope evolution in lagoonal Paleocene-Eocene boundary settings in North Belgium, in: Causes and consequences of globally warm climates in the early Paleogene, edited by: Wing, S. L., Gingerich, P. D., Schmitz, B., and Thomas, E., GSA Special Paper, 369, 291–317, https://doi.org/10.1130/0-8137-2369-8.291, 2003a.
Steurbaut, E., De Coninck, J., Dupuis, C., and King, C.: Supplemental material: Palynology, paleoenvironments, and organic carbon isotope evolution in lagoonal Paleocene-Eocene boundary settings in North Belgium, Geological Society of America, GSA Data Repository [data set], https://doi.org/10.1130/2003050, 2003b.
Stokke, E. W., Jones, M. T., Tierney, J. E., Svensen, H. H., and Whiteside, J. H.: Temperature changes across the Paleocene-Eocene Thermal Maximum – a new high-resolution TEX86 temperature record from the Eastern North Sea Basin, Earth Planet. Sc. Lett., 544, 116388, https://doi.org/10.1016/j.epsl.2020.116388, 2020.
Storme, J. Y., Dupuis, C., Schnyder, J., Quesnel, F., Garel, S., Iakovleva, A. I., Iacumin, P., Di Matteo, A., Sebilo, M., and Yans, J.: Cycles of humid-dry climate conditions around the P/E boundary: new stable isotope data from terrestrial organic matter in Vasterival section (NW France), Terra Nova, 24, 114–122, https://doi.org/10.1111/j.1365-3121.2011.01044.x, 2012.
Stottmeister, L.: Tertiär, in: Erläuterungen zur Geologischen Karte 1 : 25 000 von Sachsen-Anhalt (GK25) Blatt Helmstedt 3732, 2nd edition, edited by: Stottmeister, L., Jordan, H., and Röhling, H.-G., Landesamt für Geologie und Bergwesen Sachsen-Anhalt, Halle, Germany, 135–155, ISBN 3-929951-22-3, 2007.
Thiele-Pfeiffer, H.: Die Mikroflora aus dem mitteleozänen Ölschiefer von Messel bei Darmstadt, Palaeontogr. Abt. B, 211, 1–86, 1988.
Thomson, P. W. and Pflug, H.: Pollen und Sporen des mitteleuropäischen Tertiärs. Gesamtübersicht über die stratigraphisch und paläontologisch wichtigen Formen, Palaeontogr. Abt. B, 94, 1–138, 1953.
Tremblin, M., Khozyem, H., Adatte, T., Spangenberg, J. E., Fillon, C., Grauls, A., Hunger, T., Nowak, A., Läuchli, C., Lasseur, E., Roig, J.-Y., Serrano, O., Calassou, S., Guillocheau, F., and Castelltort, S.: Mercury enrichments of the Pyrenean foreland basins sediments support enhanced volcanism during the Paleocene-Eocene thermal maximum (PETM), Global Planet. Change, 212, 103794, https://doi.org/10.1016/j.gloplacha.2022.103794, 2022.
Westerhold, T., Röhl, U., Frederichs, T., Agnini, C., Raffi, I., Zachos, J. C., and Wilkens, R. H.: Astronomical calibration of the Ypresian timescale: implications for seafloor spreading rates and the chaotic behavior of the solar system?, Clim. Past, 13, 1129–1152, https://doi.org/10.5194/cp-13-1129-2017, 2017.
Westerhold, T., Röhl, U., Donner, B., Frederichs, T., Kordesch, W. E. C., Bohaty, S. M., Hodell, D.A., Laskar, J., and Zeebe, R. E.: Late Lutetian Thermal Maximum – Crossing a thermal threshold in Earth's climate system?, Geochem. Geophys. Geosyst., 19, 73–82, https://doi.org/10.1002/2017GC007240, 2018a.
Westerhold, T., Röhl, U., Donner, B., and Zachos, J. C.: Global extent of early Eocene hyperthermal events: A new Pacific benthic foraminiferal isotope record from Shatsky Rise (ODP Site 1209), Paleoceanography and Paleoclimatology, 33, 626–642, https://doi.org/10.1029/2017PA003306, 2018b.
Westerhold, T., Marwan, N., Drury, A. J., Liebrand, D., Agnini, C., Anagnostou, E., Barnet, J. S. K., Bohaty, S. M., De Vleeschouwer, D., Florindo, F., Frederichs, T., Hodell, D. A., Holbourn, A. E.., Kroon, D., Laurentano, V., Littler, K., Lourens, L. J., Lyle, M., Pälike, H., Röhl, U., Tian, J., Wilkens, R. H., Wilson, P. A., and Zachos, J. C.: An astronomically dated record of Earth's climate and its predictability over the last 66 Million Years, Science, 369, 1383–1387, https://doi.org/10.1126/science.aba6853, 2020.
Widera, M.: Compaction of lignite: a review of methods and results, Acta Geol. Pol., 65, 367–378, https://doi.org/10.1515/agp-2015-0016, 2015.
Wilde, V., Riegel, W., and Lenz, O. K.: Das Paläogen im Helmstedter Revier: Ein Forschungsthema im Geopark Harz. Braunschweiger Land. Ostfalen, in: Wechselbeziehungen zwischen Mensch und Umwelt – Vergangenheit, Gegenwart und Zukunft im Braunschweiger Land und seinem Umfeld, edited by: Wilde, V., Zellmer, H., Hillgruber, F., and Serangeli, J., Gaussiana, 1, 28–33, https://doi.org/10.23689/fidgeo-4316, 2021.
Williams, G. L., Damassa, S. P., Fensome, R. A., and Guerstein, G. R.: Wetzeliella and its allies – the “hole” story: a taxonomic revision of the Paleogene dinoflagellate subfamily Wetzelielloideae, Palynology, 39, 289–344, https://doi.org/10.1080/01916122.2014.993888, 2015.
Wing, S. L., Bao, H., and Koch, P. L.: An early Eocene cool period? Evidence for continental cooling during the warmest part of the Cenozoic, in: Warm Climates in Earth History, edited by: Huber, B. T., MacLeod, K. G., and Wing, S. L., Cambridge University Press, Cambridge, UK, 197–237, https://doi.org/10.1017/CBO9780511564512.008, 1999.
Wing, S. L., Harrington, G. J., Smith, F. A., Bloch, J. I., Boyer, D. M. and Freeman, K. H.: Transient floral change and rapid global warming at the Paleocene-Eocene boundary, Science, 310, 993–996, https://doi.org/10.1126/science.1116913, 2005.
Xie, Y., Wu, F., and Fang, X.: Abrupt collapse of a swamp ecosystem in northeast China during the Paleocene–Eocene Thermal Maximum, Palaeogeogr. Palaeocl., 595, 110975, https://doi.org/10.1016/j.palaeo.2022.110975, 2022.
Zachos, J. C., Pagani, M., Sloan, L., Thomas, E., and Billups, K.: Trends, rhythms, and aberrations in global climate 65 Ma to present, Science, 292, 686–693, https://doi.org/10.1126/science.1059412, 2001.
Zachos, J. C., Wara, M. W., Bohaty, S., Delaney, M. L., Petrizzo, M. R., Brill, A., Bralower, T. J., and Premoli-Silva, I.: A transient rise in tropical sea surface temperature during the Paleocene-Eocene thermal maximum, Science, 302, 1551–1554, https://doi.org/10.1126/science.1090110, 2003.
Zachos, J. C., Röhl, U., Schellenberg, S. A., Sluijs, A., Hodell, D. A., Kelly, D. C., Thomas, E., Raffi, I., Lourens, L. J., McCarren, H., and Kroon, D.: Rapid acidification of the ocean during the Paleocene-Eocene Thermal Maximum, Science, 308, 1611–1615, https://doi.org/10.1126/science.1109004, 2005.
Zachos, J. C., Dickens, G. R., and Zeebe, R. E.: An early Cenozoic perspective on greenhouse warming and carbon-cycle dynamics, Nature, 451, 279–283, https://doi.org/10.1038/nature06588, 2008.
Zachos, J. C., McCarren, H., Murphy, B., Röhl, U., and Westerhold, T.: Tempo and scale of late Paleocene and early Eocene carbon isotope cycles: Implications for the origin of hyperthermals, Earth Planet. Sc. Lett., 299, 242–249, https://doi.org/10.1016/j.epsl.2010.09.004, 2010.
Zeebe, R. E. and Lourens, L. J.: Solar system chaos and the Paleocene-Eocene boundary age constrained by geology and astronomy, Science, 365, 926–929, https://doi.org/10.1126/science.aax0612, 2019.
Zeebe, R. E., Ridgwell, A., and Zachos, J. C.: Anthropogenic carbon release rate unprecedented during the past 66 million years, Nat. Geosci., 9, 325–329, https://doi.org/10.1038/ngeo2681, 2016.
Zhang, Q., Wendler, I., Xu, X., Willems, H., and Ding, L.: Structure and magnitude of the carbon isotope excursion during the Paleocene-Eocene thermal maximum, Gondwana Res. 46, 114–123, https://doi.org/10.1016/j.gr.2017.02.016, 2017.
Zhu, M., Ding, Z., Wang, X., Chen, Z., Jiang, H., Dong, X., Ji, J., Tang, Z. and Luo, P.: High-resolution carbon isotope record for the Paleocene-Eocene thermal maximum from the Nanyang Basin, Central China, Chin. Sci. Bull., 55, 3606–3611, https://doi.org/10.1007/s11434-010-4092-5, 2010.
Ziegler, P.: Geological Atlas of Western and Central Europe, Shell Internationale Petroleum Maatschappij BV/Geological Society of London, Elsevier, Amsterdam, the Netherlands, ISBN 9789066441255, 1990.