the Creative Commons Attribution 4.0 License.
the Creative Commons Attribution 4.0 License.
 | 06 Sep 2022
Millennial variations in atmospheric CO2 during the early Holocene (11.7–7.4 ka)
Jinhwa Shin
Jai Chowdhry Beeman
Hun-Gyu Lee
Jaemyeong Mango Seo
Edward J. Brook
We present a new high-resolution record of atmospheric CO2 from the Siple Dome ice core, Antarctica, over the early Holocene (11.7–7.4 ka) that quantifies natural CO2 variability on millennial timescales under interglacial climate conditions. Atmospheric CO2 decreased by ∼10 ppm between 11.3 and 7.3 ka. The decrease was punctuated by local minima at 11.1, 10.1, 9.1, and 8.3 ka with an amplitude of 2–4 ppm. Although the explanations of carbon cycle mechanisms remain uncertain due to insufficient paleoclimate records and model simulations, these variations correlate with proxies for solar forcing and local climate in the southeast Atlantic polar front, eastern equatorial Pacific, and North Atlantic. Additional CO2 measurements using better-quality ice cores and carbon cycle models are needed to confirm the observation.
- Article
(2349 KB) - Full-text XML
-
Supplement
(866 KB) - BibTeX
- EndNote


Future climate and ecosystem changes due to the continual increase in atmospheric carbon dioxide concentrations caused by human activities are inevitable (IPCC, 2013). Understanding the links between the carbon cycle and climate becomes important for accurate projection of future climate change. Atmospheric CO2 is controlled by carbon exchange with ocean and land reservoirs, and increased CO2 in the future and consequent changes in the earth system will in turn impact CO2 levels via feedbacks (Friedlingstein et al., 2006). Due to the limited duration of direct measurements of atmospheric CO2, which only started in 1957 (Keeling, 1960), our understanding of the carbon cycle dynamics is limited on longer timescales. Air bubbles occluded in Antarctic ice cores allow us to reconstruct ancient air and may help us better understand the mechanisms that control atmospheric CO2 (Ahn and Brook, 2008, 2014; Bereiter et al., 2012; Higgins et al., 2015; Lüthi et al., 2008; Marcott et al., 2014; Nehrbass-Ahles et al., 2020; Petit et al., 1999).
Understanding the carbon cycle during interglacial periods is particularly useful because climate boundary conditions are similar to those of the near future. Previous work on late Holocene CO2 records shows centennial CO2 variability linked with climate, but the control mechanisms remain unclear, in part due to the potential mixture of natural and anthropogenic sources and sinks (Ahn et al., 2012; Bauska et al., 2015; Etheridge et al., 1996; Goosse, 2010; Indermühle et al., 1999; Rubino et al., 2013; Ruddiman, 2003, 2007). By contrast, CO2 records for the early Holocene (11.7 to 7.3 ka) should reflect only natural CO2 variability due to a smaller human population (Ruddiman, 2003).
The early Holocene (11.7 to 7.0 ka) is known as a relatively stable period in comparison with glacial periods. Several authors have linked centennial to millennial variability in the early Holocene to changes in solar forcing, including studies of the eastern equatorial Pacific (Marchitto et al., 2010), North Atlantic (Bond et al., 2001), and Southern Ocean (Nielsen et al., 2004), with responses in proxy records at ∼11.1, 10.1, 9.1, and 8.3 ka linked to solar variability (Bond et al., 2001; Marchitto et al., 2010). A weaker (stronger) solar activity has been linked with increased (decreased) ice-rafted debris in the North Atlantic (Bond cycle), dominant El Niño-like conditions (La Niña-like conditions) in the eastern equatorial Pacific, weaker (stronger) Asian monsoons, expansion (reduction) of sea ice in the Southern Ocean, and colder (warmer) sea surface temperature in the Southern Ocean (Bond et al., 2001; Marchitto et al., 2010; Nielsen et al., 2004; Reimer et al., 2004; Vonmoos et al., 2006). However, it is not clear what mechanisms are involved (Bond et al., 2001; Darby et al., 2012; Marchitto et al., 2010).
Atmospheric CO2 on millennial timescales is mainly controlled by exchange with oceanic reservoirs and terrestrial carbon stocks. Existing atmospheric CO2 records from EPICA Dome C (Dome C) show little variability of atmospheric CO2 on millennial timescales from 10.9 to 7.3 ka (Monnin et al., 2001, 2004). However, high-frequency signals might be muted due to gas-trapping processes at this low-accumulation site (Spahni et al., 2003).
In this study, we measured 99 samples of atmospheric CO2 with ages between 11.7 and 9.0 ka from the Siple Dome ice core. This new record complements the existing Siple Dome CO2 record for 9.0–7.3 ka (Ahn et al., 2014). With this record, we investigate the relationship between atmospheric CO2 and climate variations on centennial and millennial timescales. Siple Dome benefits from an accumulation rate 4.2 times higher than at Dome C and 1.8 times higher than at Taylor Dome (Table 1). A conservative estimate for the width of the gas age distribution in the Siple Dome record gives ∼42 years for the early Holocene (Ahn et al., 2014). Thus, the Siple Dome ice core allows high-temporal-resolution and higher-quality gas data with a more precise age scale and signals that are much less muted by the gas-trapping process. The temporal resolution on average during the early Holocene reaches ∼30 years as compared to ∼80 years in the Dome C record.

2.1 CO2 measurements
A total of 247 individual ice samples from 99 depth intervals were measured by needle cracker dry extraction and gas chromatography methods at Seoul National University (SNU) (see Fig. S1 in the Supplement). We adopted the well-established measurement methods from Oregon State University (OSU) (Ahn et al., 2009) with minor modifications including sharpening of the tips of ice-crushing pins to increase the gas extraction efficiency and use of a newer model Agilent 7890 gas chromatograph (GC).
Briefly, ice samples were cut and trimmed carefully with a band saw in a −21 °C walk-in freezer at SNU. All visible cracks were removed to eliminate potential CO2 alteration by trapping modern air. An ice sample of ∼ 8–10 g was placed in a double-walled vacuum chamber maintained at about −35 °C using cold ethanol circulation between the walls of the chamber while flowing ultra-pure N2 gas (99.9999 %) into the chamber. The ice sample was crushed in the cooled chamber by 91 steel needles moving straight up to down using a linear motion (bellows) vacuum feedthrough. The liberated air from the ice was collected for 3 min in a sample tube in a cryogenic system maintained at 11 K. The CO2 mixing ratio was determined by the Agilent 7890A GC equipped with a flame-ionization detector, using a Ni catalyst which converts CO2 to CH4 before measurement. Sample air was injected into a stainless steel sample loop, and the extracted air from each ice sample was analyzed twice. The GC system was calibrated daily with a standard air tank (293.25 ppm CO2, WMOX2007 mole fraction scale, calibrated by US National Oceanic and Atmospheric Administration, Global Monitoring Division). To examine the linearity of the GC, ice samples from five different depth intervals (CO2 concentrations of 239–251 ppm) were analyzed with two different air standards (188.9 and 293.3 ppm CO2, respectively). The average difference in the results using the different standards was 0.4±0.9 ppm (1σ) (Table S1 in the Supplement).
2.2 Age scale of the Siple Dome ice core records
The Siple Dome samples are placed on the improved Siple Dome chronology developed by Yang et al. (2017), which is aligned with the Greenland Ice Core Chronology, 2005 (GICC05) using the synchronization of CH4 and δ18Oatm time series. Abrupt CH4 changes have been shown to be synchronous within about 50 years with abrupt climate changes in Greenland during the last glacial period (Baumgartner et al., 2014; Rosen et al., 2014). Using this principle, abrupt changes in the composite Siple Dome CH4 data were aligned with abrupt changes in δ18Oice from the NGRIP ice core (North Greenland Ice Core Project members, 2004; Rasmussen et al., 2006) at the 8.2 ka event and end of the Younger Dryas (Yang et al., 2017). For the time period of 11.64–8.10 ka, ages were updated from the original chronology of Severinghaus et al. (2009) by interpolating the age offsets at the tie points (Yang et al., 2017). For the time intervals outside of 11.64–8.10 ka, the age difference was set constant with the difference at the closest tie point. The modified gas ages are younger than the Severinghaus et al. (2009) ages by less than ∼110 years.
3.1 The new high-resolution CO2 record during the early Holocene
We obtained 99 data points that cover 622.14–539.06 m at SNU, corresponding to 11.7–9.0 ka (Fig. 1). To extend the record to 7.4 ka, we made a composite data set using a previous CO2 record from the Siple Dome ice core covering 9.0–7.4 ka measured by the needle cracker system at OSU (Ahn et al., 2014) (Fig. 1). Between two and six replicates (2.6 and 2.4 on average for SNU and OSU data, respectively) from individual depth intervals were analyzed. The standard error of the mean of replicates from the same depth interval was 0.8 and 0.5 ppm on average for SNU and OSU data, respectively, ranging from 0.01 to 1.75 ppm. The sampling resolution is ∼30 years for 11.7–9.0 ka and ∼15 years for 9.0–7.3 ka.
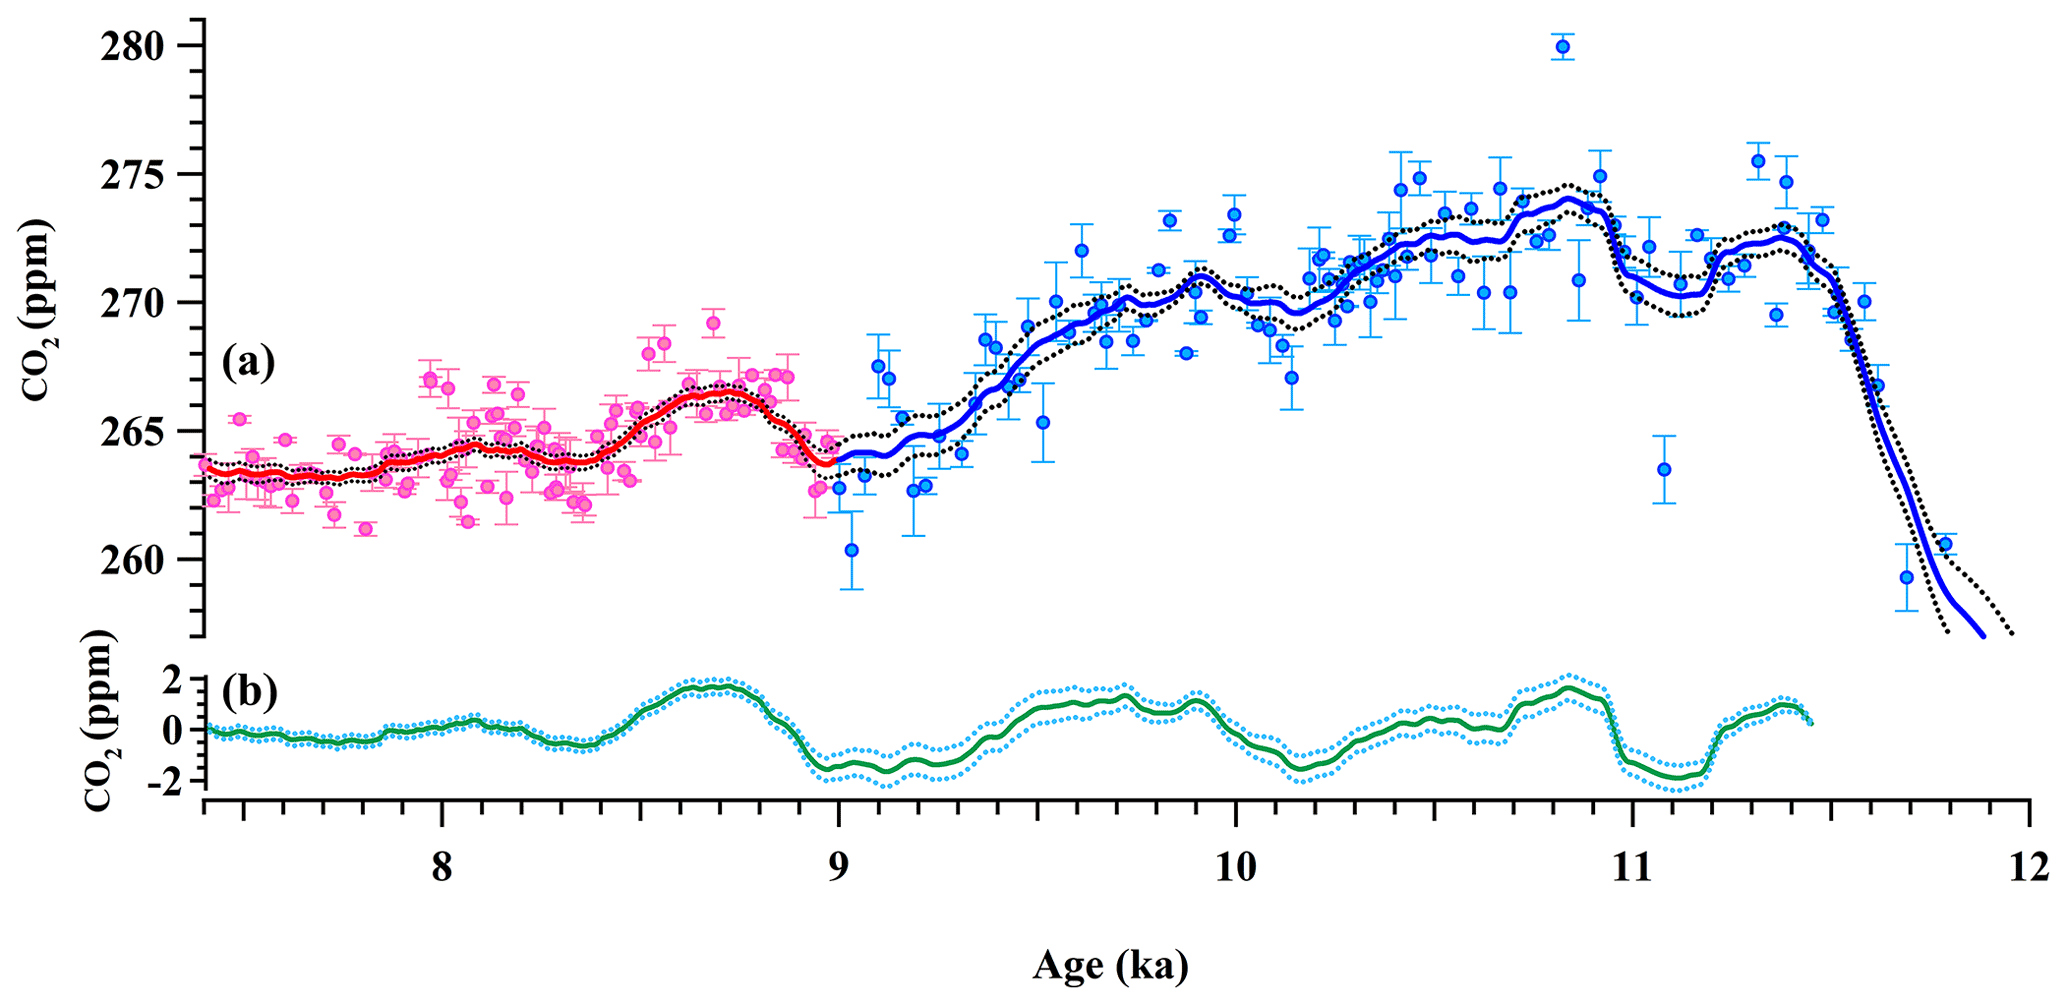
Figure 1High-resolution atmospheric CO2 records obtained from Siple Dome ice core, Antarctica, during the early Holocene. (a) Pink and blue circles are Siple Dome ice core records obtained at Oregon State University (Ahn et al., 2014) and Seoul National University (this study), respectively. Lines represent 250-year running means, and dotted lines represent 2σ uncertainties calculated from Monte Carlo simulation. For the simulation, we produced 10 000 different sets of CO2 concentrations which vary randomly with Gaussian propagation in their uncertainties. (b) The green line indicates 250-year running means of the original Siple Dome CO2 data processed by high-pass filtering at yr−1. The blue line indicates 2σ uncertainties of the 250-year mean value and cannot be used to interpret variations on shorter timescales.
To make a composite record of atmospheric CO2, we tested for bias between the two data sets. Siple Dome samples are from seven depth intervals between 538.55 and 490 m. A total of 16 samples were analyzed at both laboratories (Ahn et al., 2014). The SNU measurements were higher than the OSU measurements by 0.3±0.7 ppm (1σ) on average, indicating that the SNU and OSU results agree well (Table S2). The small offset of 0.3 ppm was added to OSU data before combining them with the SNU results.
3.2 Comparison with existing CO2 records for the early Holocene
The new atmospheric CO2 record from Siple Dome was compared to the existing CO2 data from Dome C measured using the needle cracker at University of Bern (UB) (Monnin et al., 2001, 2004) and the existing CO2 data from the WAIS Divide ice core measured by the needle cracker at OSU (Marcott et al., 2014) (Fig. 2a). On multi-millennial timescales, the baseline levels of the Siple Dome and WAIS Divide CO2 records (Marcott et al., 2014) are higher than those from the Dome C (Flückiger et al., 2002; Monnin et al., 2004) record (Fig. 2a and c). The CO2 offset between the Dome C and Siple Dome ice cores is 3–6 ppm (Fig. 2a and c).
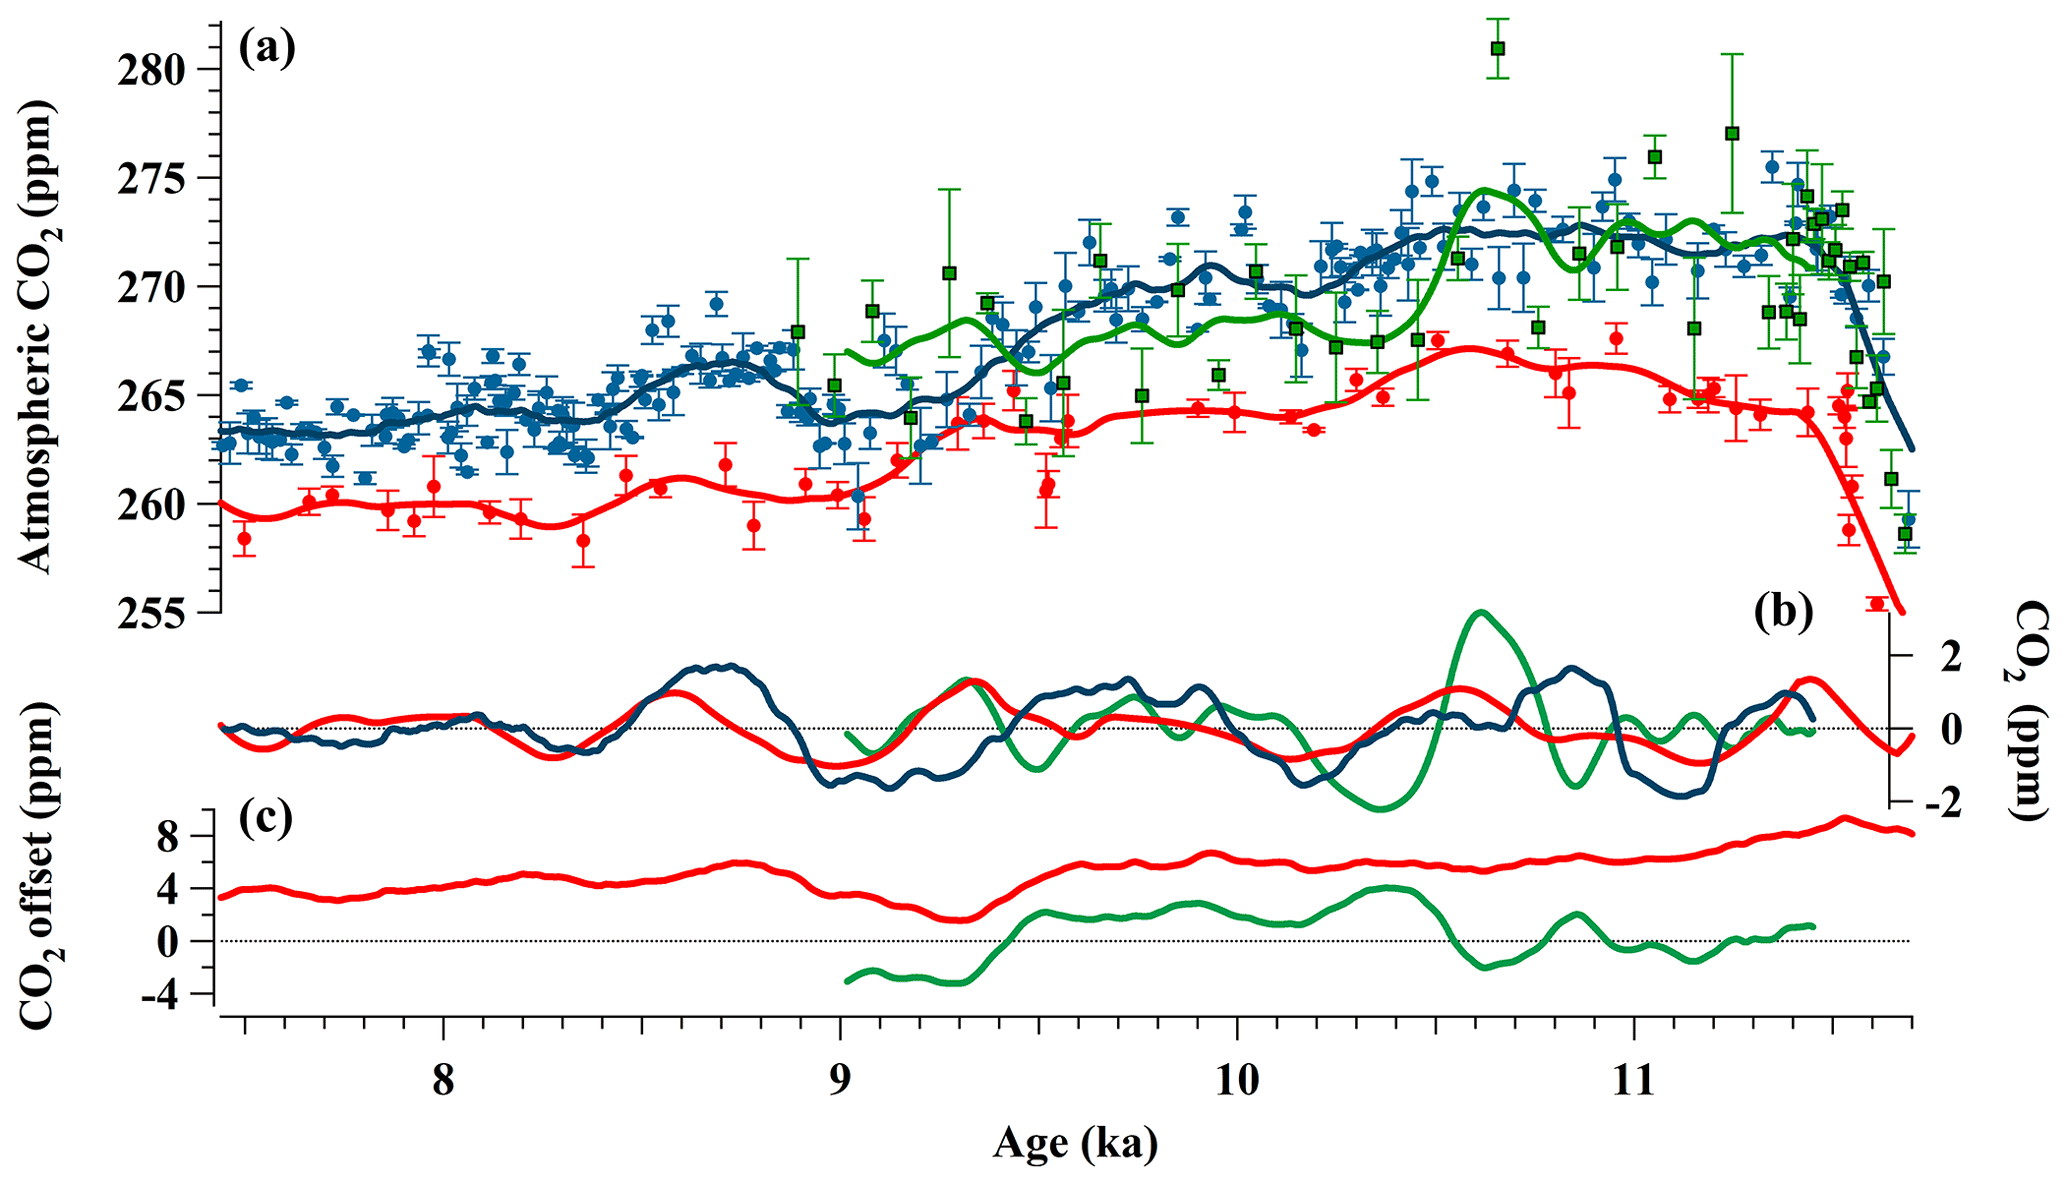
Figure 2(a) Atmospheric CO2 records. Red dots: atmospheric CO2 record from Dome C ice core. Red line: 250-year running means of atmospheric CO2 record from Dome C ice core. Blue dots: atmospheric CO2 record from Siple Dome ice core. Blue line: 250-year running means of atmospheric CO2 record from Siple Dome ice core. Green dots: atmospheric CO2 record from WAIS Divide ice core. Green line: 250-year running means of atmospheric CO2 record from WAIS Divide ice core. (b) The blue line indicates 250-year running means of the original Siple Dome CO2 data processed by high-pass filtering at yr−1. The green line indicates 250-year running means of the original WAIS Divide CO2 data processed by high-pass filtering at yr−1. The red line indicates 250-year running means of the original WAIS Divide CO2 data processed by high-pass filtering at yr−1. (c) CO2 offset between Siple Dome CO2 record and other published CO2 records. Red line: CO2 offset between Siple Dome CO2 record and Dome C CO2 record. Green line: CO2 offset between Siple Dome CO2 record and WAIS Divide CO2 record.
The offset between Siple Dome CO2 data in this study and other CO2 data sets could be related to differences in the analytical methods used to make the measurements. To examine the inter-laboratory analytical offset, several Taylor Dome ice samples were analyzed at OSU (Ahn et al., 2014). The OSU results were higher than those at UB by 1.5 ppm on average. Taking the analytical offset between OSU and SNU of 0.3±0.7 ppm (1σ) into consideration, the 3–6 ppm CO2 offset between the Siple Dome record (measured at OSU and SNU) and Dome C or Taylor Dome (measured at UB) cannot be entirely attributed to experimental offset.
To compare the new record to the existing records on millennial timescales, we calculate the Pearson correlation coefficient between Siple Dome CO2 and existing CO2 records. For this calculation, we use the Siple Dome and existing CO2 record, which were smoothed and high-pass filtered at yr−1 (see Sect. 3.3 for detailed information). The offsets between existing CO2 records and our data are also calculated (Fig. 2c). We use 250-year running means of CO2 records for this calculation.
The correlation coefficient between Siple Dome CO2 and WAIS Divide CO2 during 11.45–9.02 ka is 0.02 (p=0.28) (Fig. 2b). The CO2 offset between the WAIS Divide record and Siple Dome record is quite random (Fig. 2a and c) because of scattering in the WAIS Divide CO2 record during the early Holocene period. The WAIS Divide CO2 data during the early Holocene were reconstructed from the ice just below the bubble clathrate transition zone (BCTZ). Previous studies raised an issue about the possibility of high-frequency noise of the atmospheric CO2 record in the ice just below the BCTZ (Lüthi et al., 2010; Shackleton et al., 2019). This phenomenon might be related to the gas fractionation effect because of clathrate layering during bubble–clathrate transformation. Gas content starts to be fractionated in the BCTZ because of the differential permeation of gas species when bubbles have transformed to clathrates. CO2 concentration in the first layer of clathrates is more enriched with higher bubble-to-clathrate permeation rates. Below the BCTZ, gas content slowly homogenizes again through molecular diffusion (Bereiter et al., 2009), which can cause high-frequency noise to the ice below the BCTZ. Thus, the WAIS Divide CO2 data are not sufficient to discuss millennial variabilities of the early Holocene.
The CO2 record from Siple Dome is roughly correlated with the CO2 record from Dome C during 11.45–7.45 ka (r=0.42, p<0.001). We observe the CO2 offset of 3–8 ppm in the 250-year running means. The CO2 offset between the Dome C record and Siple Dome record decreases continuously from 11.7 to 7 ka with small variations at around 9.3 and 8.3 ka (Fig. 2). The small variations in the Dome C CO2 record (1.4 ppm, compared to 3.0 ppm for Siple Dome) can be explained by the lower sampling resolution (∼80 years for Dome C vs. ∼20 years for Siple Dome) and a stronger damping effect on CO2 concentration change at Dome C due to the slower gas-trapping process at Dome C (Spahni et al., 2003).
The millennial CO2 variations in the ice cores could be attributed to different degrees of in situ CO2 production in ice. The in situ production of CO2 is caused by carbonate–acid reactions (Anklin et al., 1997; Barnola et al., 1995; Delmas, 1993; Neftel et al., 1988; Smith et al., 1997a, b) and oxidation of organic acids (Tschumi and Stauffer, 2000). Although Antarctic ice cores have relatively low concentrations of carbonates and lower site temperatures compared to Greenlandic ice cores (Tschumi and Stauffer, 2000), it is estimated that the in situ production of CO2 for Antarctic ice cores is smaller than 1.5 ppm (Bereiter et al., 2009). If the chemical alteration is the main cause of the millennial-scale CO2 variations, we may expect to observe CO2 age offsets among different cores because of dissimilar ice age–gas age differences. However, no available data set supports this possibility.
To further evaluate the in situ CO2 production, we considered potential reactions. First, we compared the CO2 with non-sea-salt Ca (nssCa) content in the ice to check the carbonate–acid reaction in the ice. The concentration of nssCa is mainly controlled by dust delivery, but it can also be produced partially by the carbonate–acid reaction in ice. Thus, we examined the concentration of nssCa ions in the Siple Dome and Dome C ice. The nssCa records do not correlate well with the filtered millennial CO2 variations in both Siple Dome () and Dome C (r=0.15) records during the early Holocene (Figs. S2 and S3). In addition, the nssCa trends in Dome C and Siple Dome ice do not agree (Figs. S2 and S3), but millennial CO2 variations do. Second, we checked the CO2 production by oxidation of organic compounds (e.g., ) in ice (Tschumi and Stauffer, 2000). The Dome C site is located further from the ocean than Siple Dome, and we therefore expect lower organic content in the Dome C ice. Concentrations of organic compounds at our sampling depths are not available. However, the concentration of oxidant H2O2 in the top 2.5–100 m in the Siple Dome core is below the detection limit of ∼0.02 µM (McConnell, 1997), although 0.02 µM H2O2 still has the potential to produce CO2 and can increase the mixing ratio in bubbles by 5 ppm given sufficient supply of organic compounds (Ahn et al., 2004).
In summary, the existing Dome C CO2 records covering the early Holocene share similar trends in the Siple Dome CO2 record despite an offset in longer-term means of a few parts per million. We note that CO2 offsets of several parts per million among different ice cores are common features in different time intervals such as the last millennium (Ahn et al., 2012; Monnin et al., 2004; Rubino et al., 2019; Siegenthaler et al., 2005) and Marine Isotope Stage 3 (Ahn and Brook, 2008; Bereiter et al., 2012), although they share the same trends of CO2 change on multi-centennial to multi-millennial timescales. Thus, it is likely that the millennial CO2 variations during the early Holocene in the Siple Dome and Dome C cores reflect atmospheric CO2 changes.
3.3 Atmospheric CO2 variations on the millennial timescale during the early Holocene
Figure 1 shows the CO2 record from Siple Dome during the early Holocene. CO2 increased by ∼8 ppm between 11.7 and 11.3 ka and then decreased by ∼10 ppm from 10.9 to 7.3 ka. The rapid CO2 increase at 11.7–11.3 ka might be associated with abrupt warming in the North Atlantic and abrupt strengthening of Atlantic Meridional Overturning Circulation at the end of the last glacial termination (Marcott et al., 2014; Monnin et al., 2001). The long-term CO2 trend is generally similar to that of the major water isotope (δD) variations in Antarctic ice cores reflecting Antarctic temperature variations (Fig. S4).
The Siple Dome CO2 record shows millennial variability of ∼ 2–4 ppm with local minima at 11.1, 10.1, 9.1, and 8.3 ka (Fig. 1). These variations resemble variability in other paleoclimate records that has been linked to solar cycle variations on these timescales (Figs. 3 and S5).
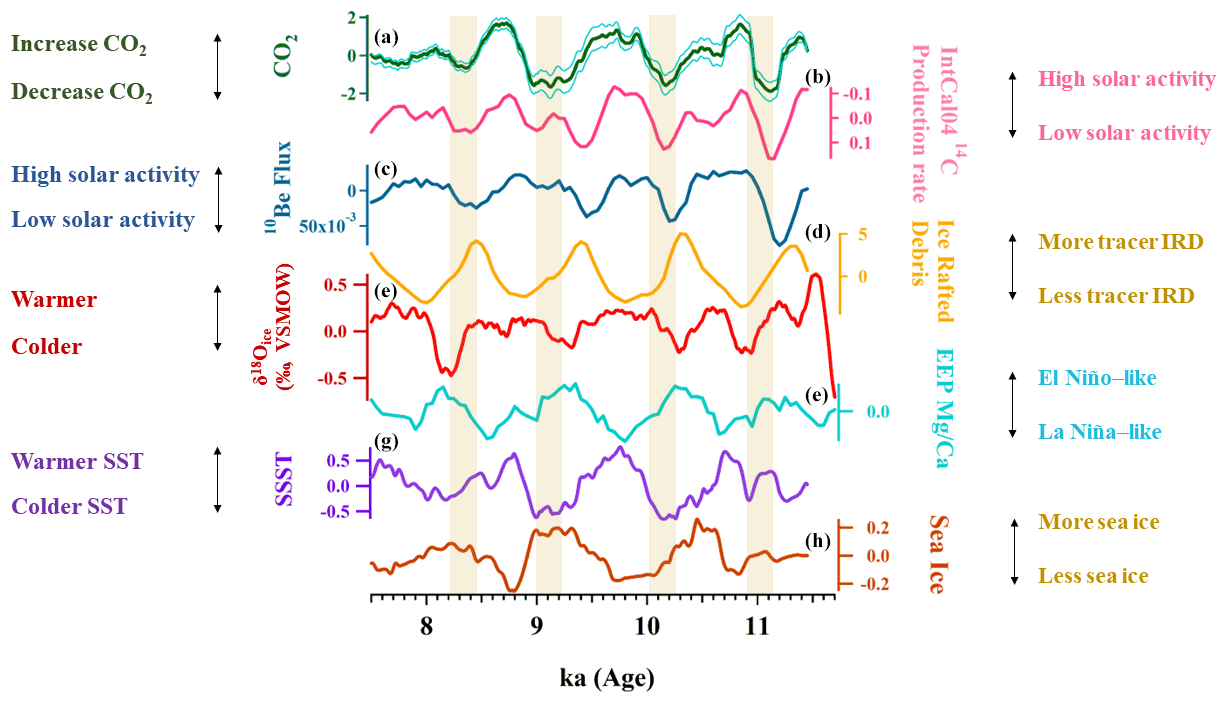
Figure 3Comparison of atmospheric CO2 with climatic proxy records over the early Holocene. The records were smoothed at ∼250 years and high-pass filtered at yr−1. (a) Atmospheric CO2 record from Siple Dome (in this study). Dotted lines show 2σ uncertainties calculated from Monte Carlo simulation. (b) 14C production rate from IntCal04 Δ14C data (Marchitto et al., 2010; Reimer et al., 2004). (c) 10Be flux record from ice core on the GICC05 timescale (Finkel and Nishiizumi, 1997; Marchitto et al., 2010; Rasmussen et al., 2006; Vonmoos et al., 2006). (d) IRD stacked records from the North Atlantic regions on an untuned calibrated 14C age model (Bond et al., 2001; Marchitto et al., 2010). (e) North Greenland Ice Core Project (NGRIP) ice core isotope ratio on the GICC05 timescale (Rasmussen et al., 2006). (f) Sea surface temperature from the eastern equatorial Pacific indicating El Niño-like or La Niña-like conditions (Marchitto et al., 2010). The data were radiocarbon dated by accelerator mass spectrometry (AMS), which was recalibrated by the Marine09 calibration curve (Reimer et al., 2009). (g) Sea surface temperature from the Polar Front of the Southern Ocean on the chronology of Mortyn et al. (2003) (Nielsen et al., 2004). (h) Sea ice presence from the Polar Front of the Southern Ocean on the chronology of Mortyn et al. (2003) (Nielsen et al., 2004).
To examine the relationship between atmospheric CO2 and the other paleoproxy data sets on millennial timescales, the Siple Dome CO2 record was smoothed and high-pass filtered at yr−1 due to two necessities. First, it is likely that high-frequency variabilities of the atmospheric CO2 record (decadal-scale variations and centennial-scale variations) are high-frequency noise of the atmospheric CO2 record. Thus, we smoothed data sets to eliminate high-frequency variability. Before making a 250-year running mean, we made a 1-year interpolation, because sample spacing between data points covering the early Holocene is not constant. Second, to eliminate multi-millennial drift of the CO2 record, the data were high-pass filtered at yr−1, following previous methods by Bond et al. (2001) and Marchitto et al. (2010). The proxy records were also processed in the same way as the CO2 record to remove high-frequency variability and long-term draft.
We evaluated uncertainties of the smoothed and high-pass filtered CO2 record using Monte Carlo simulation. Random sampling was made from a probability distribution for each measured value and its standard deviation. We repeated this series of simulations 10 000 times, which is shown as 2σ in Fig. 1 (see the Supplement for detailed information).
We calculated correlation coefficients between the filtered CO2 and climate proxy series to understand their relationship with atmospheric CO2 (Fig. 3; see the Supplement for methods). To calculate correlation coefficients between records, we selected data from 11.45 to 7.45 ka. Correlation coefficients, their significance, and maximum correlation lags are shown in Fig. 4 and Table 2. The CO2 record from Siple Dome is anti-correlated with the stacked IRD record in the North Atlantic (Bond et al., 2001) (, CO2 time lag of 120±155 years), sea surface temperature (SST) record in the eastern equatorial Pacific indicating El Niño-like or La Niña-like conditions (, CO2 time lag of 50±219 years) (Marchitto et al., 2010), and sea ice in the Southern Ocean (, CO2 time lag of 190±228 years) (Nielsen et al., 2004). On the other hand, the CO2 record is positively correlated with summer SST (SSST) in the Southern Ocean (, CO2 time lag of 52±228 years) (Nielsen et al., 2004). The results may imply a tentative link between atmospheric CO2 variations and climate change on millennial timescales. The time lags might be caused by age uncertainties of the proxy records and/or response time of atmospheric CO2 to climate change (Bauska et al., 2015; Bereiter et al., 2012; Carvalhais et al., 2014).
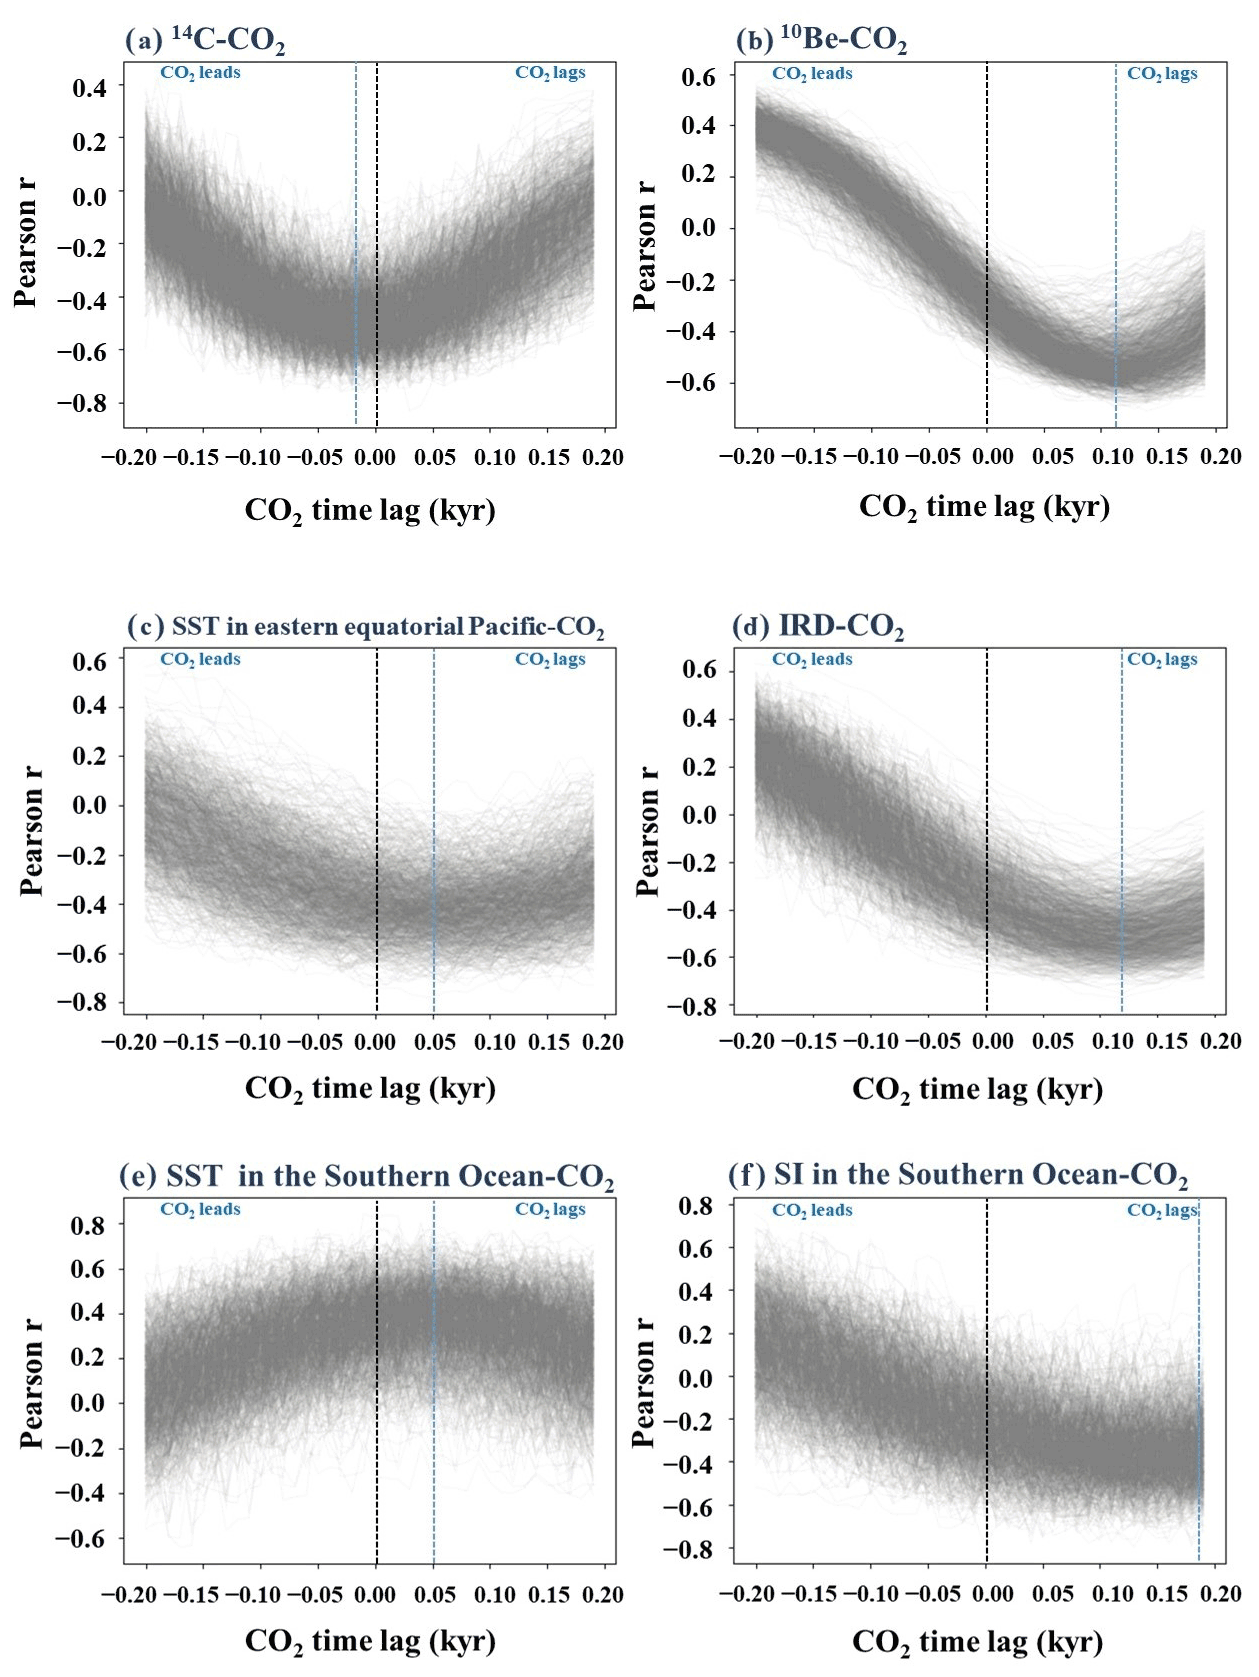
Figure 4Correlation coefficients between CO2 and proxies with CO2 time lag calculated from Monte Carlo simulation. Vertical lines in black indicate zero time lag. Vertical lines in blue indicate maximum correlation coefficients between CO2 and proxies with CO2 time lag. (a) 14C production rate and atmospheric CO2. (b) 10Be flux and atmospheric CO2. (c) SST in the eastern equatorial Pacific and atmospheric CO2. (d) IRD from the North Atlantic and atmospheric CO2. (e) SST in the eastern equatorial Pacific indicating El Niño-like or La Niña-like conditions and atmospheric CO2. (f) SI in the eastern equatorial Pacific and atmospheric CO2.
Table 2Correlation between Siple Dome CO2 record and climate proxy records. Column (a) shows correlation coefficients between CO2 and proxies with CO2 time lags. Column (b) shows correlation coefficients between CO2 and proxies without CO2 time lag. “With MC” shows mean values from the simulations taking age uncertainties into account. “Without MC” is the classic calculation of correlation, without taking age uncertainty into account. Significance of the lag correlations was assessed against 1000 repetitions of the lag correlation calculation using synthetic data stochastically generated to have the same red noise characteristics as the original series.
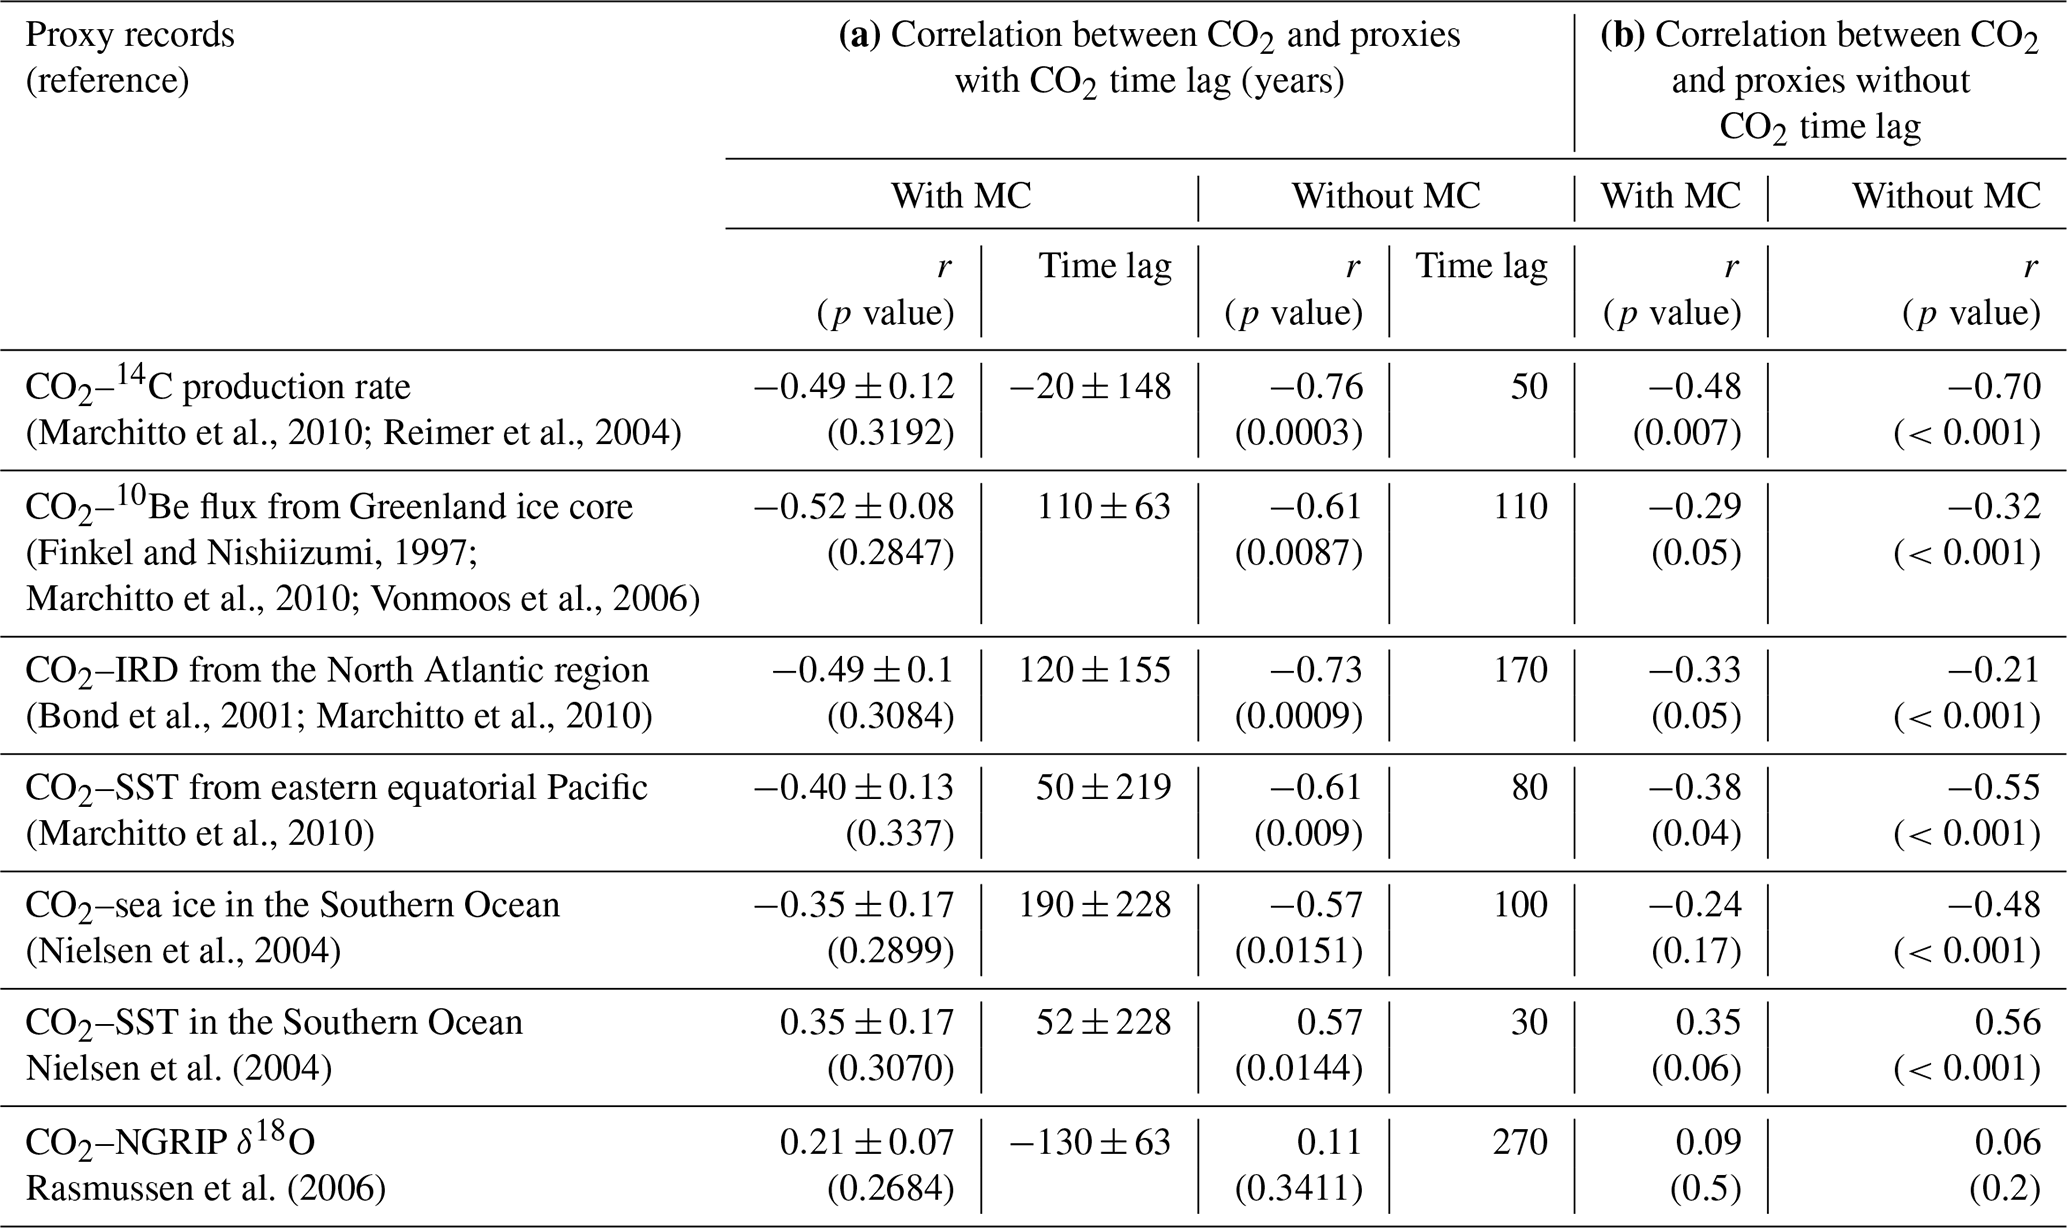
The anti-correlations we find are between the Siple Dome CO2 record and the 14C production rate (, CO2 time lag of years) and 10Be flux (, CO2 time lag of 110±63 years). This suggests that CO2 and solar activity co-vary on millennial timescales (Fig. 4 and Table 2). These observations imply that atmospheric CO2 variations might be influenced by climate change driven by solar activity on millennial timescales during the early Holocene (11.7–7.0 ka) (Fig. 4 and Table 2).
There are two outliers at ∼11.08 and 10.83 ka, which are far from the 250-year running mean (Fig. 1). Since the two outliers can enlarge the amplitude of actual CO2 change, the data were processed except for the two values (Fig. S7). The Siple Dome CO2 record, except for two data points at ∼11.08 and 10.83 ka, was smoothed and high-pass filtered at yr−1. With these processed data, we calculated correlation coefficients between the filtered CO2 and climate proxy series again (Table S3). The relationship between CO2 data except for two outliers at ∼11.08 and 10.83 ka and climate proxies is similar to the relationship between original CO2 record and climate proxies, which shows that two outliers do not highly impact our interpretation.
Possible carbon cycle control mechanisms in the early Holocene
Understanding a link between climate variations and solar activity on millennial timescales during the early Holocene is important to decipher carbon cycle mechanisms. However, the climate mechanisms have not yet been deciphered. A possible mechanism is that changes of solar activities may impact stratospheric ozone concentrations, which can change stratospheric and tropospheric circulation patterns (Meehl et al., 2009). Higher solar activity may enhance the precipitation in the Intertropical Convergence Zone (ITCZ) and South Pacific Convergence Zone (SPCZ) (Meehl et al., 2009; van Loon et al., 2007). Consequently, the intensified moisture at those areas would increase trade wind strength and upwelling in the eastern equatorial Pacific region. These conditions would lead to La Niña-like climate states on a millennial timescale (Marchitto et al., 2010). This change in the eastern equatorial Pacific might have affected the North Atlantic (Darby et al., 2012).
If the CO2 variations we observe are affected by solar variabilities via climate, a number of mechanisms could be involved, including the terrestrial or marine carbon cycles, or both. We discuss three possibilities here. First, a close relationship between CO2 and climate proxies in Antarctica (Jouzel et al., 2007) on multi-millennial timescales (Fig. S4) suggests that CO2 variations on these timescales might be principally controlled by Southern Ocean processes. Atmospheric CO2 can be controlled by temperature and salinity in the ocean (the solubility pump); solubility of CO2 is greater in cooler and fresh surface waters (Broecker, 2002; Takahashi et al., 1993). The formation of deep water occurs in polar regions with high water density, where surface waters are cold; thus, the oceanic uptake of atmospheric CO2 through this mechanism is stronger in polar regions (Sigman and Boyle, 2000). We observed a tentative link between atmospheric CO2 and summer sea surface temperature (SSST) from the polar front region of the southeast Atlantic on millennial timescales (Nielsen et al., 2004), which implies that lower SSST in the Southern Ocean might have led to the reduction of atmospheric CO2.
Increased sea ice extent might have blocked release of CO2 from CO2-rich deep water to the atmosphere, and therefore decreased atmospheric CO2 concentration as previously suggested for glacial–interglacial CO2 variations (Stephens and Keeling, 2000). Our Siple Dome CO2 record is negatively correlated with the sea ice extent in the Southern Ocean, although the sea ice extent reconstruction shown in Fig. 3 represents only the east Atlantic region of the Southern Ocean.
Oceanic processes associated with El Niño-like and La Niña-like climate variation could also impact the carbon cycle. Marine sediment cores from the eastern equatorial Pacific show that solar activity proxies are well correlated with El Niño-like and La Niña-like climate variations in the eastern equatorial Pacific SST proxy record (Marchitto et al., 2010). The eastern equatorial Pacific is the region where CO2-rich deep water upwells. Increased upwelling during La Niña-like conditions and resulting increased CO2 outgassing have been suggested for the CO2 increase during the last deglaciation (Kubota et al., 2014). Siple Dome CO2 is anti-correlated with SST in the eastern equatorial Pacific on millennial timescales (Fig. 2), which may imply that La Niña-like climate can lead to higher CO2 values.
Terrestrial carbon is involved with photosynthesis and respiration in plants, and with soil respiration (microbial and root respiration). Thus, terrestrial carbon is mostly controlled by temperature and precipitation (Davidson et al., 2000; Mielnick and Dugas, 2000). On multi-millennial timescales, when temperature in Greenland increases from 10.9 to 7.4 ka, atmospheric CO2 decreases. Expansion of vegetation in the Northern Hemisphere may partially contribute to the decrease in atmospheric CO2 (Indermühle et al., 1999).
A recent high-resolution study for the last 1200 years shows that centennial CO2 variability was mainly controlled by terrestrial carbon, most likely in the high latitudes of the Northern Hemisphere (Bauska et al., 2015). The stacked IRD from the North Atlantic may be used for an indicator of cool conditions in the North Atlantic (Bond et al., 1992, 2001). The strong relationship between IRD and atmospheric CO2 indicates that colder climate in the North Atlantic may lower atmospheric CO2 by impacting terrestrial carbon stocks during the early Holocene.
δ18Oice from the North Greenland Ice Core Project (NGRIP) ice core (Rasmussen et al., 2006) indicating temperature in Greenland also reveals millennial local minima at similar time intervals as those of CO2 (∼11.4, 10.9, 10.2, 9.3, and 8.2 ka); however, atmospheric CO2 and temperature in Greenland are mismatched at the earliest early Holocene and ∼8.2 ka. Thus, there is no significant linear relationship between CO2 and temperature in Greenland on millennial timescales, and our calculation indicates that CO2 leads temperature in Greenland on millennial timescales, though the correlation is still too small to assume any relationship (, CO2 time lag of years).
Temperature in Greenland during the early Holocene might be partially influenced by the internal climate system and/or by low-latitude solar forcing indirectly. Two main cooling events in Greenland are recorded at ∼11.4 and ∼8.2 ka (Rasmussen et al., 2007). The well-known 8.2 ka cooling event is mainly influenced by the collapse of the Laurentide ice sheet (Merz et al., 2015) rather than by solar forcing; when temperature was colder in Greenland at ∼11.4 ka, solar forcing was higher, not reaching a minimum until ∼11.2 ka. It is also elusive whether solar forcing has an influence on climate in Greenland at ∼11.4 ka (Mekhaldi et al., 2020). In short, a linkage between atmospheric CO2 and climate change during the early Holocene remains uncertain due to insufficient paleoclimate records and model simulations.
In this study, we observed that atmospheric CO2 is highly anti-correlated with the 14C production rate and 10Be flux on millennial timescales with CO2 time lag during the early Holocene (Fig. 3). The local minima of atmospheric CO2 highly match with the local maxima of the 14C production rate and 10Be flux (minima in solar activity) at ∼11.1, 10.1, and 8.3 ka. The phenomena might be related to large variations in solar activity. However, the relationship between solar forcing and atmospheric CO2 is different at ∼9.1 ka. The 14C production rate and 10Be flux are positively correlated with CO2 at ∼9.1 ka on sub-millennial timescales, indicating that atmospheric CO2 was at a local minimum at ∼9.1 ka when solar forcing was relatively high.
We also check the correlation of CO2 with solar activity during the last 2000 years on centennial timescales (Fig. S8). A positive correlation between solar forcing and atmospheric CO2 is observed during the Little Ice Age (LIA). There are two periods in which sunspots were exceedingly rare. During the Maunder sunspot minimum (1647–1715 CE), total solar irradiance (TSI) was reduced by 0.85±0.16 W m−2. Atmospheric CO2 records from Antarctic ice cores commonly show a decrease trend during this period (Ahn et al., 2012; Monnin et al., 2004; Siegenthaler et al., 2005; Rubino et al., 2019). During the Spörer Minimum (1450–1550 CE), TSI record during this period also shows a decrease trend. However, atmospheric CO2 decrease is not significant in Law Dome and EPICA Dronning Maud Land (EDML) records (Monnin et al., 2004; Siegenthaler et al., 2005; Rubino et al., 2019), while the WAIS Divide ice record shows a decrease during this period (Ahn et al., 2012) (Fig. S8). However, atmospheric CO2 decreases drastically at ∼1600 CE when TSI shows a local maximum, which is similar to the relationship between solar forcing and atmospheric CO2 at ∼9.1 ka. To conclude, it is vague how solar forcing is related with atmospheric CO2 variations on millennial timescales.
Comparing the early and late Holocene requires attention due to different boundary conditions during these two periods and anthropogenic CO2 during the late Holocene (e.g., Ruddiman, 2003, 2007). Variations in solar forcing are large on a centennial timescale during the early Holocene. Thus, the solar output effect might be enhanced since the climate system has not responded linearly (Mohtadi et al., 2016). However, due to a decrease in summer insolation and the small variation in solar forcing during 7–1 ka (Berger, 1978), solar forcing might play a less important role during the late Holocene. Further studies are needed to understand the relationship between atmospheric CO2 and solar forcing on shorter timescales during the early Holocene with more proxy records and numerical models.
In this study, we present a 30-year-resolution CO2 record during the early Holocene. Our data show that millennial atmospheric CO2 variability of 2–4 ppm correlates with several climate proxies such as IRD in the North Atlantic, sea ice extent in the Southern Ocean, and El Niño-like conditions in the eastern equatorial Pacific, all of which appear to coincidently occur with solar activity minima (Bond et al., 2001; Marchitto et al., 2010; Nielsen et al., 2004; Reimer et al., 2004; Vonmoos et al., 2006). The relationships with the proxies are consistent with changes in several different mechanisms that could impact atmospheric CO2 on millennial timescales including changing CO2 outgassing from the Southern Ocean and the eastern equatorial Pacific and changing terrestrial carbon storage in the Northern Hemisphere. Our new observations may improve our understanding of the relationship between interglacial climate and carbon cycles on millennial timescales in the absence of anthropogenic CO2 perturbations. Further study should focus on clearly deciphering the millennial CO2 control mechanisms with improved paleo proxy records and carbon cycle models.
Data are available in the Supplement. All data will be available on PANGAEA (Paleoclimatology database websites) by the end of 2022.
The supplement related to this article is available online at https://doi.org/10.5194/cp-18-2063-2022-supplement.
The research was designed by JS, JA, and EJB. The CO2 measurements were performed by JS with contributions from HGL and JA. The data analyses were led by JS and JCB with contributions from JMS and JA. JS wrote the manuscript with inputs from all authors.
The contact author has declared that none of the authors has any competing interests.
Publisher’s note: Copernicus Publications remains neutral with regard to jurisdictional claims in published maps and institutional affiliations.
Financial support was provided by the Basic Science Research Program through the National Research Foundation of Korea (NRF) (grant nos. NRF-2015R1A2A2A01003888 and NRF-2020M1A5A1110607). This research was also partly conducted under US NSF grant nos. OPP 0944764 and ATM 0602395 to Edward J. Brook. This research was partly supported by the Korea Polar Research Institute (KOPRI) grant funded by the Ministry of Oceans and Fisheries (grant no. KOPRI PE22100). Our special thanks go to Eunji Byun, Jisu Choi, Kyungmin Kim, and Jiwoong Yang for analytical assistance and Youngcheol Han for data analyses. We also thank the staff of the National Ice Core Laboratory and Michael Kalk of Oregon State University for ice core curation and processing.
This research has been supported by the National Research Foundation of Korea (grant nos. NRF-2015R1A2A2A01003888 and NRF-2020M1A5A1110607), the National Science Foundation (grant nos. OPP 0944764 and ATM 0602395), and a KOPRI grant funded by the Ministry of Oceans and Fisheries (grant no. KOPRI PE22100).
This paper was edited by Eric Wolff and reviewed by two anonymous referees.
Ahn, J. and Brook, E. J.: Atmospheric CO2 and climate on millennial time scales during the last glacial period, Science, 322, 83–85, 2008.
Ahn, J. and Brook, E. J.: Siple Dome ice reveals two modes of millennial CO2 change during the last ice age, Nat. Commun., 5, 3723, https://doi.org/10.1038/ncomms4723, 2014.
Ahn, J., Wahlen, M., Deck, B. L., Brook, E. J., Mayewski, P. A., Taylor, K. C., and White, J. W. C.: A record of atmospheric CO2 during the last 40,000 years from the Siple Dome, Antarctica ice core, J. Geophys. Res., 109, D13305, https://doi.org/10.1029/2003JD004415, 2004.
Ahn, J., Brook, E. J., and Howell, K.: A high-precision method for measurement of paleoatmospheric CO2 in small polar ice samples, J. Glaciol., 55, 499–506, 2009.
Ahn, J., Brook, E. J., Mitchell, L., Rosen, J., McConnell, J. R., Taylor, K., Etheridge, D., and Rubino, M.: Atmospheric CO2 over the last 1000 years: A high-resolution record from the West Antarctic Ice Sheet (WAIS) Divide ice core, Global Biogeochem. Cy., 26, GB2027, https://doi.org/10.1029/2011GB004247, 2012.
Ahn, J., Brook, E. J., and Buizert, C.: Response of atmospheric CO2 to the abrupt cooling event 8200 years ago, Geophys. Res. Lett., 41, 604–609, https://doi.org/10.1002/2013gl058177, 2014.
Anklin, M., Schwander, J., Stauffer, B., Tschumi, J., Fuchs, A., Barnola, J.-M., and Raynaud, D.: CO2 record between 40 and 8 kyr B.P. from the Greenland Ice Core Project ice core, J. Geophys. Res., 102, 26539–26545, 1997.
Banta, J. R., McConnell, J. R., Frey, M. M., Bales, R. C., and Taylor, K.: Spatial and temporal variability in snow accumulation at the West Antarctic Ice Sheet Divide over recent centuries, J. Geophys. Res., 113, D23102, https://doi.org/10.1029/2008JD010235, 2008.
Barnola, J.-M., Anklin, M., Porcheron, J., Raynaud, D., Schwander, J., and Stauffer, B.: CO2 evolution during the last millennium as recorded by Antarctic and Greenland ice, Tellus B, 47, 264–272, https://doi.org/10.3402/tellusb.v47i1-2.16046, 1995.
Baumgartner, M., Kindler, P., Eicher, O., Floch, G., Schilt, A., Schwander, J., Spahni, R., Capron, E., Chappellaz, J., Leuenberger, M., Fischer, H., and Stocker, T. F.: NGRIP CH4 concentration from 120 to 10 kyr before present and its relation to a δ15N temperature reconstruction from the same ice core, Clim. Past, 10, 903–920, https://doi.org/10.5194/cp-10-903-2014, 2014.
Bauska, T. K., Joos, F., Mix, A. C., Roth, R., Ahn, J., and Brook, E. J.: Links between atmospheric carbon dioxide, the land carbon reservoir and climate over the past millennium, Nat. Geosci., 8, 383–387, 2015.
Bereiter, B., Schwander, J., Lüthi, D., and Stocker, T. F.: Change in CO2 concentration and ratio in ice cores due to molecular diffusion, Geophys. Res. Lett., 36, L05703, https://doi.org/10.1029/2008GL036737, 2009.
Bereiter, B., Lüthi, D., Siegrist, M., Schüpbach, S., Stocker, T. F., and Fischer, H.: Mode change of millennial CO2 variability during the last glacial cycle associated with a bipolar marine carbon seesaw, P. Natl. Acad. Sci. USA, 109, 9755–9760, 2012.
Bond, G., Heinrich, H., Broecker, W., Labeyrie, L., McManus, J., Andrews, J., Huon, S., Jantschik, R., Clasen, S., Simet, C., Tedesco, K., Klas, M., Bonani, G., and Ivy, S.: Evidence for massive discharges of icebergs into the North Atlantic Ocean during the last glacial period, Nature, 360, 245–249, 1992.
Bond, G., Kromer, B., Beer, J., Muscheler, R., Evans, M. N., Showers, W., Hoffmann, S., Lotti-Bond, R., Hajdas, I., and Bonani, G.: Persistent solar influence on North Atlantic climate during the Holocene, Science, 294, 2130–2136, 2001.
Broecker, W.: The Glacial World According to Wally, Eldigio Press, Palisades, New York. 346 pp., 2002.
Carvalhais, N., Forkel, M., Khomik, M., Bellarby, J., Jung, M., Migliavacca, M., Mu, M., Saatchi, S., Santoro, M., Thurner, M., Weber, U., Ahrens, B., Beer, C., Cescatti, A., Randerson, J. T., and Reichstein, M.: Global covariation of carbon turnover times with climate in terrestrial ecosystems, Nature, 514, 213–217, https://doi.org/10.1038/nature13731, 2014.
Darby, D. A., Ortiz, J., Grosch, C., and Lund, S.: 1,500-year cycle in the Arctic Oscillation identified in Holocene Arctic sea-ice drift, Nat. Geosci., 5, 897–900, 2012.
Davidson, E. A., Verchot, L. V., Cattanio, J. H., Ackerman, I. L., and Carvalho, J.: Effects of soil water content on soil respiration in forests and cattle pastures of eastern Amazonia, Biogeochemistry, 48, 53–69, 2000.
Delmas, R. J.: A natural artefact in Greenland ice-core CO2 measurements, Tellus B, 45, 391–396, https://doi.org/10.3402/tellusb.v45i4.15737, 1993.
Etheridge, D. M., Steele, L., Langenfelds, R., Francey, R., Barnola, J. M., and Morgan, V.: Natural and anthropogenic changes in atmospheric CO2 over the last 1000 years from air in Antarctic ice and firn, J. Geophys. Res., 101, 4115–4128, 1996.
Finkel, R. C. and Nishiizumi, K.: Beryllium 10 concentrations in the Greenland Ice Sheet Project 2 ice core from 3–40 ka, J. Geophys. Res., 102, 26699–26706, https://doi.org/10.1029/97JC01282, 1997.
Flückiger, J., Monnin, E., Stauffer, B., Schwander, J., Stocker, T. F., Chappellaz, J., Raynaud, D., and Barnola, J. M.: High resolution Holocene N2O ice core record and its relationship with CH4 and CO2, Global Biogeochem. Cy., 16, 10-1–10-8, 2002.
Friedlingstein, P., Bopp, L., Rayner, P., Betts, R., Jones, C., von Bloh, W., Brovkin, V., Cadule, P., Doney, S., Eby, M., Weaver, A. J., Fung, I., John, J., Joos, F., Strassmann, K., Kato, T., Kawamiya, M., and Yoshikawa, C.: Climate-carbon cycle feedback analysis: results from the C4MIP model intercomparison, J. Climate, 19, 3337–3353, 2006.
Goosse, H.: Degrees of climate feedback, Nature, 463, 438–439, https://doi.org/10.1038/463438a, 2010.
Hamilton, G. S.: Mass balance and accumulation rate across Siple Dome, West Antarctica, Ann. Glaciol., 35, 102–106, 2002.
Higgins, J. A., Kurbatov, A. V., Spaulding, N. E., Brook, E., Introne, D. S., Chimiak, L. M., Yan, Y., Mayewski, P. A., and Bender, M. L.: Atmospheric composition 1 million years ago from blue ice in the Allan Hills, Antarctica, P. Natl. Acad. Sci. USA, 112, 6887–6891, https://doi.org/10.1073/pnas.1420232112, 2015.
Indermühle, A., Stocker, T. F., Joos, F., Fischer, H., Smith, H. J., Wahlen, M., Deck, B., Mastroianni, D., Tschumi, J., Blunier, T., Meyer, R., and Stauffer, B.: Holocene carbon-cycle dynamics based on CO2 trapped in ice at Taylor Dome, Antarctica, Nature, 398, 121–126, 1999.
IPCC: Climate Change 2013: The Physical Science Basis. Contribution of Working Group I to the Fifth Assessment Report of the Intergovernmental Panel on Climate Change, edited by: Stocker, T. F., Qin, D., Plattner, G. K., Tignor, M., Allen, S. K., Boschung, J., Nauels, A., Xia, Y., Bex, V., and Midgley, P. M., Cambridge University Press, Cambridge, United Kingdom and New York, NY, USA, https://doi.org/10.1017/CBO9781107415324, 2013.
Jouzel, J., Masson-Delmotte, V., Cattani, O., Dreyfus, G., Falourd, S., Hoffmann, G., Minster, B., Nouet, J., Barnola, J. M., Chappellaz, J., Fischer, H., Gallet, J. C., Johnsen, S., Leuenberger, M., Loulergue, L., Luethi, D., Oerter, H., Parrenin, F., Raisbeck, G., Raynaud, D., Schilt, A., Schwander, A., Selmo, E., Souchez, R., Spahni, R., Stauffer, B., Steffensen, J. P., Stenni, B., Stocker, T. F., Tison, J. L., Werner, M., and Wolff, E. W.: Orbital and Millennial Antarctic Climate Variability over the Past 800,000 Years, Science 317, 793–796, https://doi.org/10.1126/science.1141038, 2007.
Keeling, C. D.: The concentration and isotopic abundances of carbon dioxide in the atmosphere, Tellus, 12, 200–203, https://doi.org/10.3402/tellusa.v12i2.9366, 1960.
Kubota, K., Yokoyama, Y., Ishikawa, T., Obrochta, S., and Suzuki, A.: Larger CO2 source at the equatorial Pacific during the last deglaciation, Scientific Reports, 4, 5261, https://doi.org/10.1038/srep05261, 2014.
Lüthi, D., Le Floch, M., Bereiter, B., Blunier, T., Barnola, J.-M., Siegenthaler, U., Raynaud, D., Jouzel, J., Fischer, H., Kawamura, K., and Stocker, T. F.: High-resolution carbon dioxide concentration record 650,000–800,000 years before present, Nature, 453, 379–382, https://doi.org/10.1038/nature06949, 2008.
Lüthi, D., Bereiter, B., Stauffer, B., Winkler, R., Schwander, J., Kindler, P., Leuenberger, M., Kipfstuhl, S., Capron, E., and Landais, A.: CO2 and variations in and just below the bubble-clathrate transformation zone of Antarctic ice cores, Earth Planet. Sc. Lett., 297, 1–2, 226–233, 2010.
Marchitto, T. M., Muscheler, R., Ortiz, J. D., Carriquiry, J. D., and van Geen, A.: Dynamical response of the tropical Pacific Ocean to solar forcing during the early Holocene, Science, 330, 1378–1381, 2010.
Marcott, S. A., Bauska, T. K., Buizert, C., Steig, E. J., Rosen, J. L., Cuffey, K. M., Fudge, T. J., Severinghaus, J. P., Ahn, J., Kalk, M. L., McConnell, J. R., Sowers, T., Taylor, K. C., White, J. W. C., and Brook, E. J.: Centennial-scale changes in the global carbon cycle during the last deglaciation, Nature, 514, 616–619, 2014.
McConnell, J. R.: Investigation of the atmosphere-snow transfer process for hydrogen peroxide, PhD dissertation, The University of Arizona, Tucson, 1997.
Meehl, G. A., Arblaster, J. M., Matthes, K., Sassi, F., and van Loon, H.: Amplifying the Pacific Climate System response to a small 11-year Solar Cycle forcing, Science, 325, 1114–1118, https://doi.org/10.1126/science.1172872, 2009.
Mekhaldi, F., Czymzik, M., Adolphi, F., Sjolte, J., Björck, S., Aldahan, A., Brauer, A., Martin-Puertas, C., Possnert, G., and Muscheler, R.: Radionuclide wiggle matching reveals a nonsynchronous early Holocene climate oscillation in Greenland and western Europe around a grand solar minimum, Clim. Past, 16, 1145–1157, https://doi.org/10.5194/cp-16-1145-2020, 2020.
Merz, N., Raible, C. C., and Woollings, T.: North Atlantic Eddy-Driven Jet in Interglacial and Glacial Winter Climates, J. Climate, 28, 3977–3997, https://doi.org/10.1175/JCLI-D-14-00525.1, 2015.
Mielnick, P. C. and Dugas, W. A.: Soil CO2 flux in a tallgrass prairie, Soil Biol. Biochem., 32, 221–228, 2000.
Monnin, E., Indermuhle, A., Dallenbach, A., Fluckiger, J., Stauffer, B., Stocker, T. F., Raynaud, D., and Barnola, J.-M.: Atmospheric CO2 concentrations over the last glacial termination, Science, 291, 112–114, 2001.
Monnin, E., Steig, E. J., Siegenthaler, U., Kawamura, K., Schwander, J., Stauffer, B., Stocker, T. F., Morse, D. C., Barnola, J.-M., Bellier, B., Raynaud, D., and Fischer, H.: Evidence for substantial accumulation rate variability in Antarctica during the Holocene through synchronization of CO2 in the Taylor Dome, Dome C and DML ice cores, Earth Planet. Sc. Lett., 224, 45–54, 2004.
Morse, D., Blankenship, D., Waddington, E., and Neumann, T.: A site for deep ice coring in West Antarctica: Results from aerogeophysical surveys and thermal-kinematic modeling, Ann. Glaciol., 35, 36–44, 2002.
Mortyn, P. G., Charles, C. D., Ninnemann, U. S., Ludwig, K., and Hodell, D. A.: Deep sea sedimentary analogues for the Vostok ice core, Geochem. Geophy. Geosy., 4, 8405, https://doi.org/10.1029/2002GC000475, 2003.
Neftel, A., Oeschger, H., Staffelbach, T., and Stauffer, B.: CO2 record in the Byrd ice core 50,000–5,000 years bp, Nature, 331, 609–611, https://doi.org/10.1038/331609a0, 1988.
Nehrbass-Ahles, C., Shin, J., Schmitt, J., Bereiter, B., Joos, F., Schilt, A., Schmidely, L., Silva, L., Teste, G., Grilli, R., Chappellaz, J., Hodell, D., Fischer, H., and Stocker, T. F.: Abrupt CO2 release to the atmosphere under both glacial and early interglacial conditions, Science, 369, 1000–1005, 2020.
Nielsen, S. H. H., Koc, N., and Crosta, X.: Holocene climate in the Atlantic sector of the southern ocean: Controlled by insolation or oceanic circulation?, Geology, 32, 317–320, 2004.
North Greenland Ice Core Project members: High-resolution record of northern hemisphere climate extending into the last interglacial period, Nature, 431, 147–151, 2004.
Petit, J. R., Jouzel, J., Raynaud, D., Barkov, N. I., Barnola, J.-M., Basile, I., Bender, M., Chapellaz, J., Davis, M., Delaygue, G., Delmotte, M., Kotlyakov, V. M., Legrand, M., Lipenkov, V. Y., Lorius, C., Pepin, L., Ritz, C., Saltzmann, E., and Stievenard, M.: Climate and atmospheric history of the past 420,000 years from the Vostok ice core, Antarctica, Nature, 399, 429–436, https://doi.org/10.1038/20859, 1999.
Rasmussen, S. O., Andersen, K. K., Svensson, A. M., Steffensen, J. P., Vinther, B. M., Clausen, H. B., Siggaard-Andersen, M.-L., Johnsen, S. J., Larsen, L. B., Dahl-Jensen, D., Bigler, M., Rothlisberger, R., Fischer, H., Goto-Azuma, K., Hansson, M. E., and Ruth, U.: A new Greenland ice core chronology for the last glacial termination, J. Geophys. Res., 111, D06102, https://doi.org/10.1029/2005JD006079, 2006.
Rasmussen, S. O., Vinther, B. M., Clausen, H. B., and Andersen, K. K.: Early Holocene climate oscillations recorded in three Greenland ice cores, Quaternary Sci. Rev., 26, 1907–1914, 2007.
Reimer, P. J., Baillie, M. G, Bard, E., Beck, J. W., Buck, C. E., Blackwell, P. G., Burr, G. S., Cutler, K. B., Damon, P. E., Edwards, R. L., Fairbanks, R. G., Friedrich, M., Guilderson, T. P., Hogg, A. G., Hughen, K. A., Kromer, B., McCormac, G., Ramsey, C. B., Reimer, R. W., Remmele, S., Southon, J. R., Stuvier, M., Taylor, F. W., van der Plicht, J., and Weyhenmeyer, C. E.: IntCal04: A New Consensus Radiocarbon Calibration Dataset from 0–26 ka BP, Radiocarbon, 46, 1029–1058, 2004.
Reimer, P. J., Baillie, M. G. L., Bard, E., Bayliss, A., Beck, J. W., Blackwell, P. G., Bronk Ramsey, C., Buck, C. E., Burr, G. S., Edwards, R. L., Friedrich, M., Grootes, P. M., Guilderson, T. P., Hajdas, I., Heaton, T. J., Hogg, A. G., Hughen, K. A., Kaiser, K. F., Kromer, B., McCormac, F. G., Manning, S. W., Reimer, R. W., Richards, D. A., Southon, J. R., Talamo, S., Turney, C. S. M., van der Plicht, J., and Weyhenmeyer, C. E.: IntCal09 and Marine09 radiocarbon age calibration curves, 0–50,000 years cal BP, Radiocarbon, 51, 1111–1150, 2009.
Rosen, J. L., Brook, E. J., Severinghaus, J. P., Blunier, T., Mitchell, L. E., Lee, J. E., Edwards, J. S., and Gkinis, V.: An ice core record of near-synchronous global climate changes at the Bølling transition, Nat. Geosci., 7, 459–463, 2014.
Rubino, M., Etheridge, D. M., Trudinger, C. M., Allison, C. E., Battle, M. O., Langenfelds, R. L., Steele, L. P., Curran, M., Bender, M., White, J. W. C., Jenk, T. M., Blunier, T., and Francey, R. J.: A revised 1000 year atmospheric δ13C-CO2 record from Law Dome and South Pole, Antarctica, J. Geophys. Res., 118, 8382–8499, https://doi.org/10.1002/jgrd.50668, 2013.
Rubino, M., Etheridge, D. M., Thornton, D. P., Howden, R., Allison, C. E., Francey, R. J., Langenfelds, R. L., Steele, L. P., Trudinger, C. M., Spencer, D. A., Curran, M. A. J., van Ommen, T. D., and Smith, A. M.: Revised records of atmospheric trace gases CO2, CH4, N2O, and δ13C-CO2 over the last 2000 years from Law Dome, Antarctica, Earth Syst. Sci. Data, 11, 473–492, https://doi.org/10.5194/essd-11-473-2019, 2019.
Ruddiman, W. F.: The anthropogenic greenhouse era began thousands of years ago, Climatic Change, 61, 261–293, https://doi.org/10.1023/B:CLIM.0000004577.17928.fa, 2003.
Ruddiman, W. F.: The early anthropogenic hypothesis: challenges and responses, Rev. Geophys., 45, RG4001, https://doi.org/10.1029/2006RG000207, 2007.
Schwander, J., Jouzel, J., Hammer, C. U., Petit, J.-R., Udisti, R., and Wolff, E.: A tentative chronology for the EPICA Dome Concordia ice core, Geophys. Res. Lett., 28, 4243–4246, 2001.
Severinghaus, J. P., Grachev, A., and Battle, M.: Thermal fractionation of air in polar firn by seasonal temperature gradients, Geochem. Geophy. Geosy., 2, 1048–1024, https://doi.org/10.1029/2000GC000146, 2001.
Severinghaus, J. P., Beaudette, R., Headly, M. A., Taylor, K., and Brook, E. J.: Oxygen-18 of O2 records the impact of abrupt climate change on the terrestrial biosphere, Science, 324, 1431–1434, 2009.
Shackleton, S., Bereiter, B., Baggenstos, D., Bauska, T. K., Brook, E. J., Marcott, S. A., and Severinghaus, J. P.: Is the Noble Gas-Based Rate of Ocean Warming During the Younger Dryas Overestimated?, Geophys. Res. Lett., 46, 5928–5936, https://doi.org/10.1029/2019GL082971, 2019.
Siegenthaler, U., Monnin, E., Kawamura, K., Spahni, R., Schwander, J., Stauffer, B., Stocker, T. F., Barnola, J.-M., and Fischer, H.: Supporting evidence from the EPICA Dronning Maud Land ice core for atmospheric CO2 changes during the past millennium, Tellus B, 57, 51–57, https://doi.org/10.3402/tellusb.v57i1.16774, 2005.
Sigman, D. M. and Boyle, E. A.: Glacial/interglacial variations in atmospheric carbon dioxide, Nature, 407, 859–869, https://doi.org/10.1038/35038000, 2000.
Smith, H. J., Wahlen, M., Mastroianni, D., and Taylor, C. K.: The CO2 concentration of air trapped in GISP2 ice from the Last Glacial Maximum-Holocene transition, Geophys. Res. Lett., 24, 1–4, https://doi.org/10.1029/96GL03700, 1997a.
Smith, H. J., Wahlen, M., Mastroianni, D., Taylor, K., and Mayewski, P.: The CO2 concentration of air trapped in Greenland Ice Sheet Project 2 ice formed during periods of rapid climate change, J. Geophys. Res., 102, 26577–26582, https://doi.org/10.1029/97JC00163, 1997b.
Spahni, R., Schwander, J., Fluckinger, J., Stauffer, B., Chapellaz, J., and Raynaud, D.: The attenuation of fast atmospheric CH4 variations recorded in polar ice cores, Geophys. Res. Lett., 30, 1571, https://doi.org/10.1029/2003GL017093, 2003.
Stephens, B. B. and Keeling, R. F.: The influence of Antarctic sea ice on glacial–interglacial CO2 variations, Nature, 404, 171–174, https://doi.org/10.1038/35004556, 2000.
Tabacco, I. E., Passerini, A., Corbelli, F., and Gorman, M.: Determination of the surface and bed topography at Dome C, East Antarctica, J. Glaciol., 44, 185–191, 1998.
Takahashi, T., Olafsson, J., Goddard, J. G., Chipman, D. W., and Sutherland, S. C.: Seasonal variation of CO2 and nutrients in the high-latitude surface oceans: A comparative study, Global Biogeochem. Cy., 7, 843–878, https://doi.org/10.1029/93GB02263, 1993.
Taylor, K. C., White, J. W. C., Severinghaus, J. P., Brook, E. J., Mayewski, P. A., Alley, R. B., Steig, E. J., Spencer, M. K., Meyerson, E., Meese, D. A., Lamorey, G. W., Grachev, A., Gow, A. J., and Barnett, B. A.: Abrupt climate change around 22 ka on the Siple Coast of Antarctica, Quaternary Sci. Rev., 23, 7–15, https://doi.org/10.1016/j.quascirev.2003.09.004, 2004.
The EPICA Dome C 2001-02 Science and Drilling Teams: Extending the ice core record beyond half a million years, Eos T. Am. Geophys. Un., 83, 509–517, 2002.
Tschumi, J. and Stauffer, B.: Reconstructing past atmospheric CO2 concentration based on ice-core analyses: open questions due to in situ production of CO2 in the ice, J. Glaciol., 46, 45–53, 2000.
van Loon, H., Meehl, G. A., and Shea, D. J., Coupled air-sea response to solar forcing in the Pacific region during northern winter, J. Geophys. Res., 112, D02108, https://doi.org/10.1029/2006JD007378, 2007.
Vonmoos, M., Beer, J., and Muscheler, R.: Large variations in Holocene solar activity: Constraints from 10Be in the Greenland Ice Core Project ice core, J. Geophys. Res.-Space, 111, A10105, https://doi.org/10.1029/2005JA011500, 2006.
Waddington, E. and Morse, D. L.: Spatial variations of local climate at Taylor Dome, Antarctica: Implications for paleoclimate from ice cores, Ann. Glaciol., 20, 219–225, https://doi.org/10.3189/172756494794587014, 1994.
Yang, J.-W., Ahn, J., Brook, E. J., and Ryu, Y.: Atmospheric methane control mechanisms during the early Holocene, Clim. Past, 13, 1227–1242, https://doi.org/10.5194/cp-13-1227-2017, 2017.