the Creative Commons Attribution 4.0 License.
the Creative Commons Attribution 4.0 License.
 | 02 Feb 2022
Atmospheric CO2 estimates for the Miocene to Pleistocene based on foraminiferal δ11B at Ocean Drilling Program Sites 806 and 807 in the Western Equatorial Pacific
Maxence Guillermic
Sambuddha Misra
Robert Eagle
Aradhna Tripati
Constraints on the evolution of atmospheric CO2 levels throughout Earth's history are foundational to our understanding of past variations in climate. Despite considerable effort, records vary in their temporal and spatial coverage and estimates of past CO2 levels do not always converge, and therefore new records and proxies are valuable. Here we reconstruct atmospheric CO2 values across major climate transitions over the past 16 million years using the boron isotopic composition (δ11B) of planktic foraminifera from 89 samples obtained from two sites in the West Pacific Warm Pool, Ocean Drilling Program (ODP) Sites 806 and 807, measured using high-precision multi-collector inductively coupled plasma mass spectrometry. We compare our results to published data from ODP Site 872, also in the Western Equatorial Pacific, that goes back to 22 million years ago. These sites are in a region that today is near equilibrium with the atmosphere and are thought to have been in equilibrium with the atmosphere for the interval studied. We show that δ11B data from this region are consistent with other boron-based studies. The data show evidence for elevated pCO2 during the Middle Miocene and Early to Middle Pliocene, and reductions in pCO2 of ∼200 ppm during the Middle Miocene Climate Transition, ∼250 ppm during Pliocene Glacial Intensification and ∼50 ppm during the Mid-Pleistocene Climate Transition. During the Mid-Pleistocene Transition there is a minimum pCO2 at marine isotopic stage (MIS) 30. Our results are consistent with a coupling between pCO2, temperature and ice sheet expansion from the Miocene to the late Quaternary.
- Article
(7036 KB) - Full-text XML
-
Supplement
(1551 KB) - BibTeX
- EndNote


In this study, we reconstruct atmospheric pCO2 using δ11B data from ODP Sites 806 and 807 and compare them with ice core data. We therefore apply the same framework to older samples from these sites to create a long-term pH and pCO2 reconstruction for the past 16 million years, including recalculating pCO2 for ODP Site 872 from 17 to 22 million years ago. We find that major increases in surface water pH and decreases in atmospheric pCO2 were associated with decreased temperature in the Western Equatorial Pacific and associated with major episodes of ice sheet expansion in the high latitudes, providing more robust quantitative constraints on the past coupling between pCO2, temperature and cryosphere stability.
Due to concerns about the long-term consequences of anthropogenic emissions and associated climate change (IPCC, 2014, 2018), efforts have been made to quantify past atmospheric CO2 and examine past relationships between CO2 and temperature. Such data are not only critical for constraining Earth-system sensitivity (Lea, 2004; Lunt et al., 2010; Pagani et al., 2010; Hansen et al., 2012, 2013; Foster and Rohling, 2013; Schmittner et al., 2011; Tierney et al., 2020), but are also of broad interest for contextualizing the evolution of climate and geological systems throughout Earth's history (Tripati et al., 2011; Foster et al., 2017; Tripati and Darby, 2018). However, discrepancies between proxy reconstructions still exist, including for major climate transitions of the Cenozoic. In particular, there remains a pressing need for robust and higher-resolution atmospheric CO2 records.
High-resolution and direct determinations of atmospheric CO2 are available for the last 800 kyr through analysis of air bubbles extracted from ice cores, but these records are limited to the availability of cores (Petit et al., 1999; Siegenthaler et al., 2005; Lüthi et al., 2008; Bereiter et al., 2015). A window into older atmospheric CO2 levels comes from 1-million-year-old blue ice (Higgins et al., 2015) and from a second snapshot from 1.5 Ma (Yan et al., 2019). Most reconstructions of CO2 prior to 800 ka are based on indirect terrestrial and marine proxies. Stomata indices for fossil leaves (Van der Burgh, 1993; Royer, 2001), carbon isotope ratios (δ13C) of paleosols (Retallak, 2009), δ13C of alkenones (Pagani et al., 2005; Zhang et al., 2013), ratios of surface-dwelling foraminifera (Yu et al., 2007; Foster, 2008; Tripati et al., 2009, 2011) and boron isotope ratios (δ11B) of surface-dwelling foraminifera (e.g., Pearson and Palmer, 2000; Hönisch et al., 2009; Seki et al., 2010; Bartoli et al., 2011; Foster, 2008; Foster et al., 2012; Badger et al., 2013; Foster and Sexton, 2014; Greenop et al., 2014; Martínez-Botí et al., 2015a; Chalk et al., 2017; Sosdian et al., 2018; Dyez et al., 2018; de la Vega et al., 2020; Greenop et al., 2019; Rae et al., 2021; Raitzsch et al., 2021; Shuttleworth et al., 2021) have been used to estimate atmospheric CO2.
Each of the above proxy methods has sources of systematic errors that we do not attempt to exhaustively document as they have been discussed in-depth elsewhere (e.g., Pagani et al., 2005; Tripati et al., 2011; Guillermic et al., 2020). However, we note that significant developments in the boron-based proxies include improvements to the accuracy and precision of measurements using multi-collector inductively coupled mass spectrometry (MC-ICP-MS) compared to early work with negative thermal ionization mass spectrometry (N-TIMS), where there were large instrumental mass fractionations and challenges with laboratory intercomparison (Foster et al., 2013; Farmer et al., 2016; Aggarwal and You, 2017). There was also the realization that temperature-dependent KD and sensitivities reported from sediment trap, core-top and downcore studies (Yu et al., 2007; Foster, 2008; Tripati et al., 2009, 2011; Babila et al., 2010; Osborne et al., 2020) differ from inferences from foraminiferal culture experiments (Allen et al., 2011; Allen and Hönisch, 2012) and inorganic calcite (Mavromatis et al., 2015), which complicates the use of the proxy, although this type of discrepancy has also been observed with other elemental proxies (e.g., ). Such differences may be due to differences in growth rates (Gabitov et al., 2014), ontogenetic changes, a correlation in the field between temperature and other hydrographic variables that obscure robust statistical determination of parameter relationships, culture conditions resulting in organisms being stressed, and/or other factors.
The marine CO2 proxy that appears to be subject to the fewest systematic uncertainties, based on our current understanding, is the boron isotopic composition (δ11B) of planktic foraminifera as measured using MC-ICP-MS and N-TIMS (Hain et al., 2018). This proxy provides constraints on seawater pH, if temperature, salinity, seawater δ11B, and the appropriate mono-specific calibration between δ11Bcarbonate and δ11Bborate are constrained (Pearson and Palmer, 2000; Foster, 2008; Sosdian et al., 2018; Raitzsch et al., 2018; Guillermic et al., 2020). Seawater pH can be used to calculate seawater pCO2 if there are constraints on a second parameter of the carbonate system (e.g., alkalinity, DIC). Atmospheric pCO2 can then be constrained if the site being examined is in air–sea CO2 equilibrium or if the disequilibrium is known and stable through time.
However, there are relatively few studies generating high-precision boron-based records over major climate transitions in the Cenozoic using recent analytical methods and that incorporate our current understanding of the proxy (e.g., Greenop et al., 2014; Martínez-Botí et al., 2015a; Chalk et al., 2017; Dyez et al., 2018; Sosdian et al., 2018; de la Vega et al., 2020; Rae et al., 2021; Raitzsch et al., 2021). Furthermore, of the existing studies using boron-based proxies, an additional uncertainty frequently exists, namely the short time interval of study (e.g., emphasizing on a climate transition) (Martínez-Botí et al., 2015b; Chalk et al., 2017) and whether the study sites remain in air–sea CO2 equilibrium (Martinez-Botí et al., 2015b). Moreover, although estimation of atmospheric pCO2 from seawater pH using this proxy is relatively straightforward, reconstructions are still impacted by uncertainties, including the lack of robust constraints on a second parameter of the carbonate system and our limited understanding of secular variations in the δ11B of seawater (Tripati et al., 2011; Greenop et al., 2017; Sosdian et al., 2018; Rae et al., 2021).
Therefore, to provide additional constraints on the evolution of atmospheric pCO2 from the Miocene through the Pleistocene, we developed new records from the western tropical Pacific. We use foraminiferal δ11B and trace elements in the planktic foraminiferal species Trilobus sacculifer and Globigerinoides ruber to reconstruct past seawater pH and atmospheric CO2 at Ocean Drilling Program (ODP) Sites 806 and 807 in the Western Equatorial Pacific (WEP) over the last 16 million years (Myr). The sites are located on the western border of the tropical Pacific Ocean, the largest open-ocean region on the globe, and the warmest open-ocean region at present.
These two sites have been examined in other boron-based studies (Wara et al., 2003; Tripati et al., 2009, 2011; Shankle et al., 2021), as has the region more broadly (Pearson and Palmer, 2000; Sosdian et al., 2018), because it is understood to be in equilibrium with the atmosphere and have relative stable hydrography. The region experiences equatorial divergence but is not strongly affected by upwelling and has a current estimated annual air–sea CO2 difference of +28 ppmv (Takahashi et al., 2014). The pre-industrial air–sea CO2 difference is calculated to be +16 ppm (GLODAP database corrected from anthropogenic inputs), with a value of 298 ppm, compared to the ice core value of 282 ppm at 1.08 ka. This pCO2 difference is similar to our pCO2 uncertainty (an average of ∼17 ppm (2 SD) for the youngest samples). If trade winds were much stronger, and equatorial divergence greater, then this could have driven some disequilibrium in the past. However, a few lines of evidence suggest the region was in quasi-equilibrium in the past: (1) zonal temperatures are at a maximum in pre-industrial times and during the Pleistocene, and we are able to reconstruct atmospheric pCO2 values from the ice cores, (2) and temperature proxies indicate the region is relatively stable with respect to temperature compared to other parts of the ocean and also indicate a weak and stable zonal temperature gradient during the Miocene and Pliocene which would support air–sea stable conditions and air–sea (dis-)equilibrium conditions (e.g., Nathan and Leckie, 2009; Zhang et al., 2014; Liu et al., 2019).
Thus, this study builds on prior low-resolution reconstructions for these sites (Wara et al., 2003; Tripati et al., 2009, 2011; Shankle et al., 2021), Site 872 in the tropical Pacific (Sosdian et al., 2018), and other published boron isotope work, to provide additional data to constrain past seawater pH and pCO2 for the WEP using MC-ICP-MS, thereby providing a new perspective on reconstructing past atmospheric CO2 via marine sediment archives. We explore various constraints on the second carbonate system parameter using a number of different scenarios, following on the systematic work done by Tripati et al. (2009, 2011) for . We interpret these data using recent constraints on seawater δ11B (Lemarchand et al., 2002; Raitzsch and Hönisch, 2013; Greenop et al., 2017). For temperature estimation, we utilize a multi-variable model for correcting for salinity, pH and seawater (Gray and Evans, 2019), that builds on prior work with clumped isotopes in planktic foraminifera for Site 806 and other WEP sites, demonstrating that for the Last Glacial Maximum to recent times, salinity-corrected values are needed to yield convergent estimates of mixed-layer temperatures (Tripati et al., 2014).
Below we describe site locations, analytical methods used and principal figures. The supplemental methods section describes screening for potential contamination, equations used for calculations and error propagation.
2.1 Site locations
Samples are from three ODP holes recovered during Leg 130 in the WEP (Fig. 1, Table 1): Hole 806A (0∘19.140′ N, 159∘21.660′ E, 2520.7 m water depth), Hole 806B (0∘19.110′ N, 159∘21.660′ E, 2519.9 m water depth) and Hole 807A (3∘ 36.420′ N, 156∘ 37.500′ E, 2803.8 m water depth) (Shipboard Scientific Party, 1991). Sites 806 and 807 are not likely to have experienced major tectonic changes over the last 20 million years.
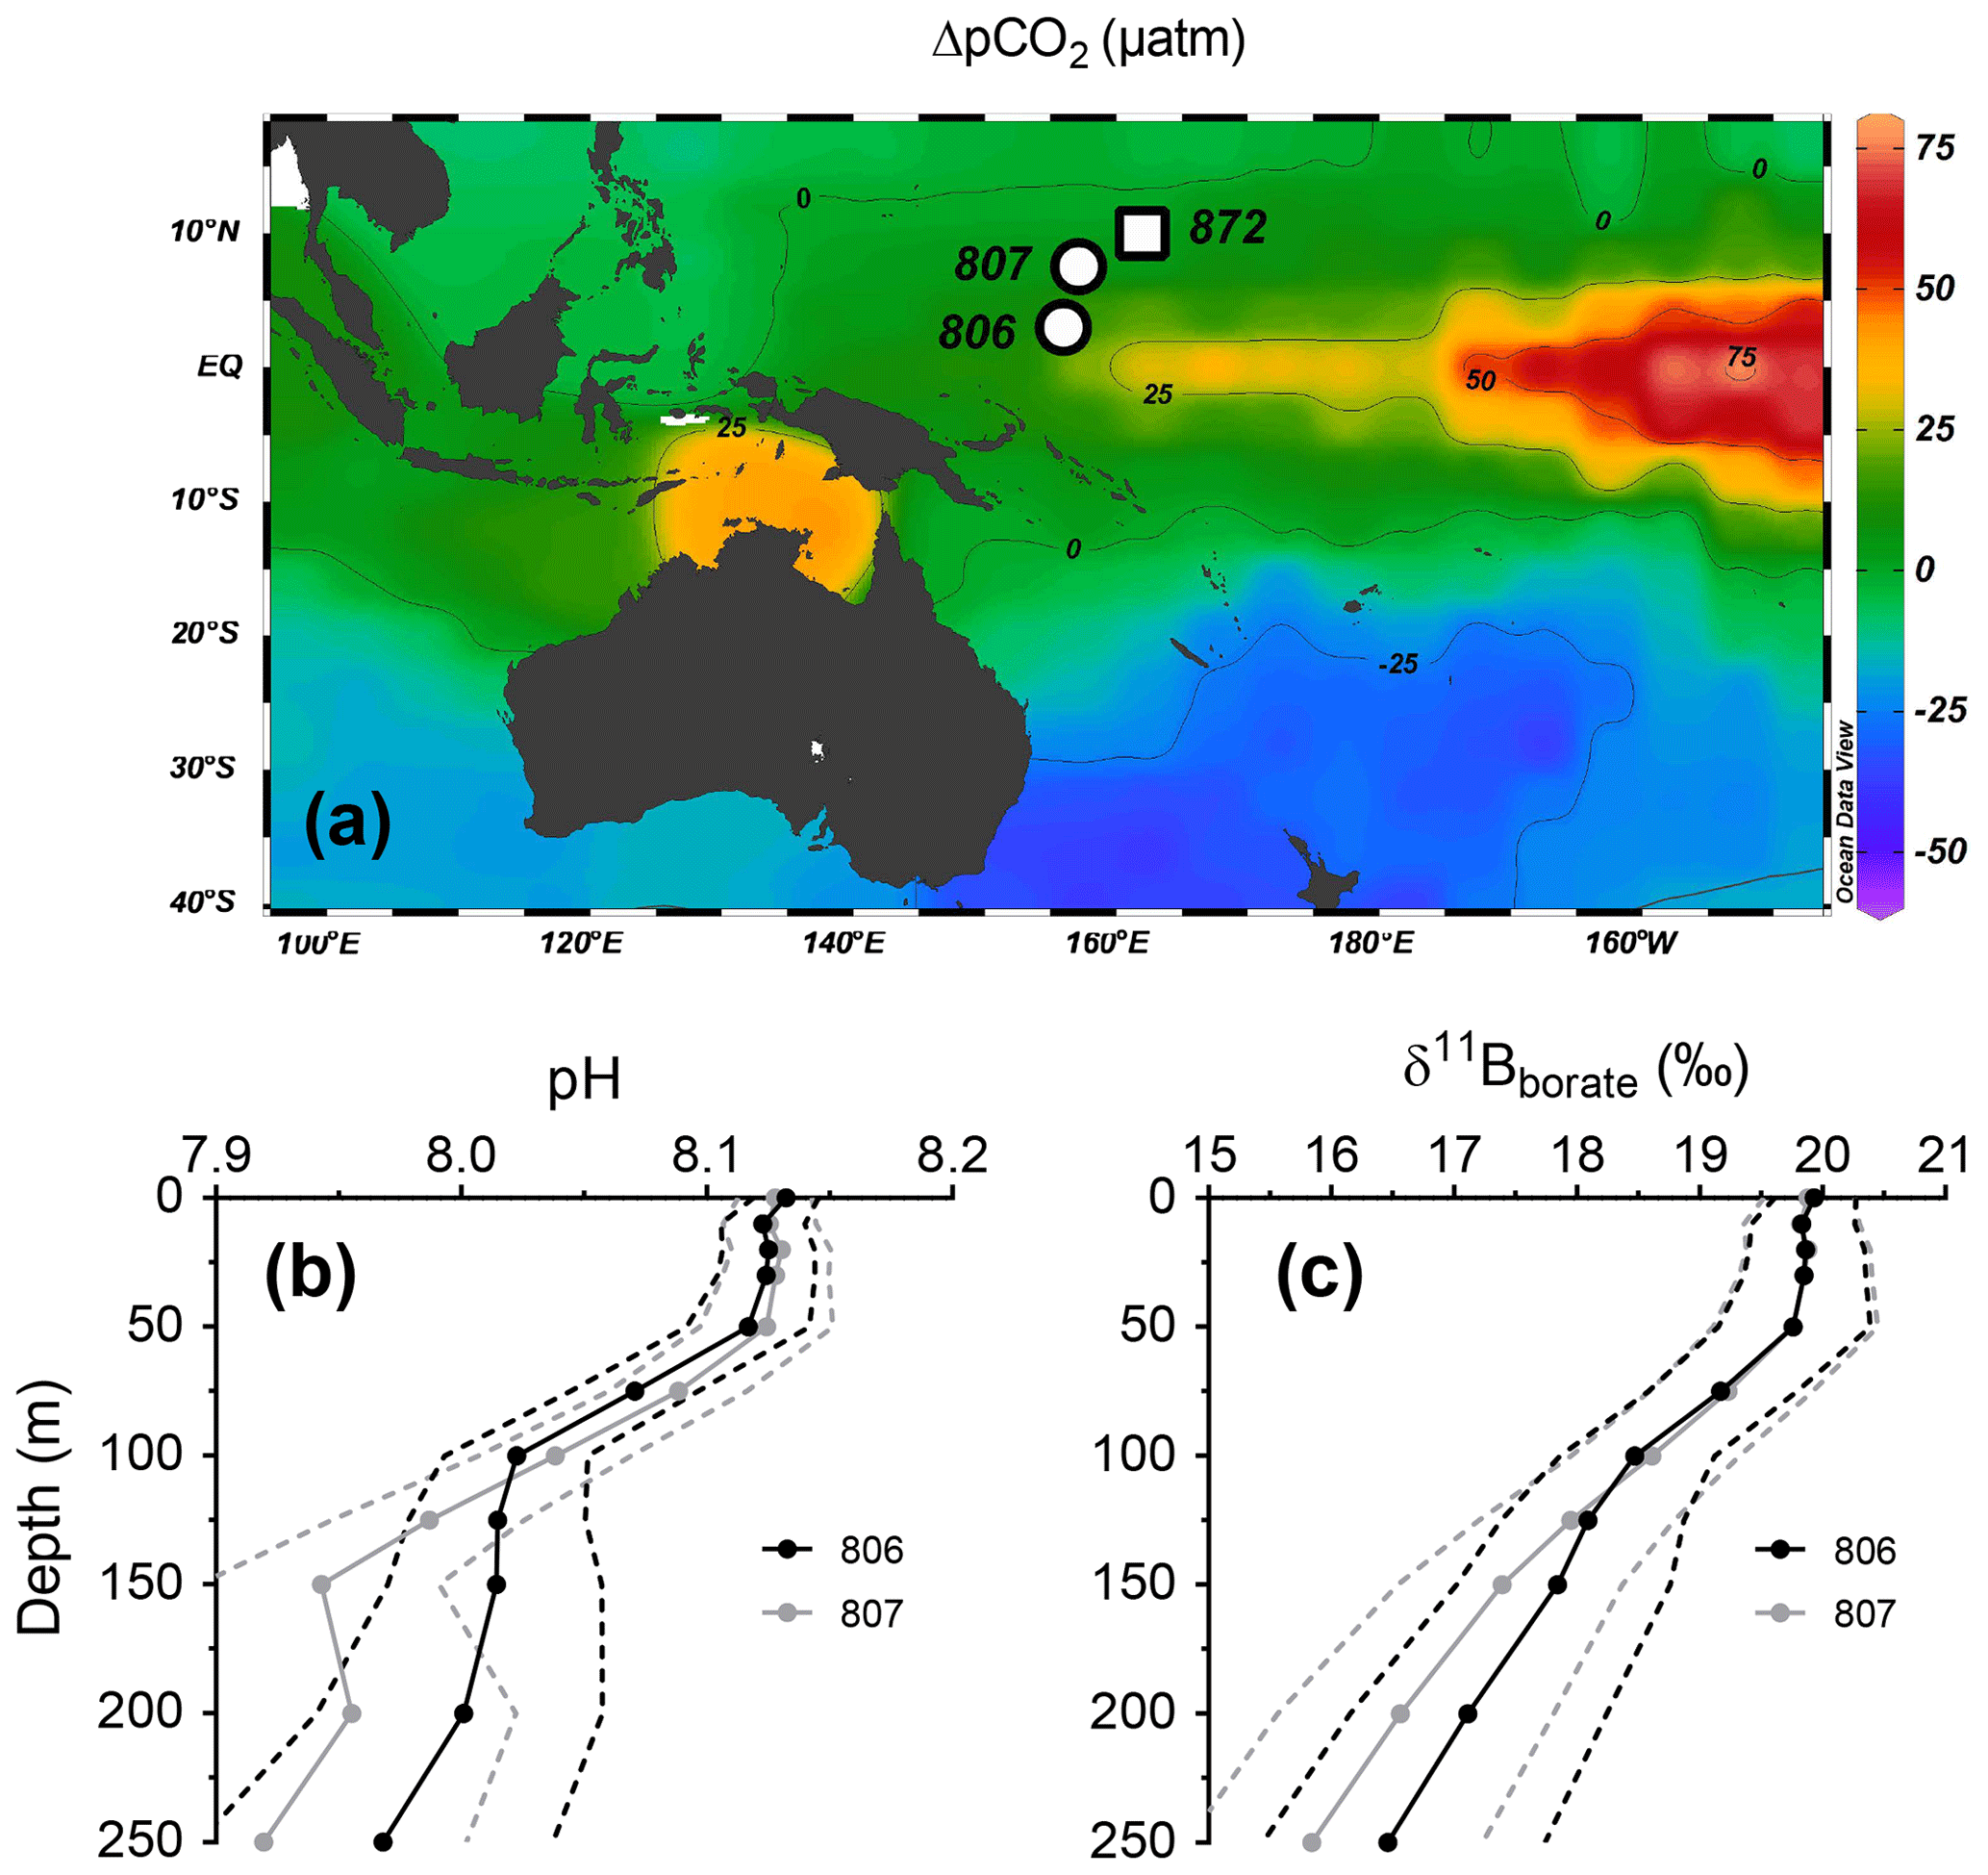
Figure 1Modern hydrography of sites. (a) Map of air–sea pCO2 (ΔpCO2, ppm, data from Takahashi et al., 2014) plotted using Ocean Data View from Schlitzer (2016) and showing the location of ODP Sites 806 and 807 (black circles) and Site 872 (black square, Shipboard Scientific Party, 1993). Depth profiles are for preindustrial parameters, (b) pH calculated from GLODAP database and corrected for anthropogenic inputs and (c) Boron isotopic composition of borate ion (δ11Bborate) with associated propagated uncertainties.

2.2 Preservation
Microfossils in sediments at these sites, as with any sedimentary sequences, have the potential to be influenced by diagenesis. Despite evidence of authigenic carbonate formation, recent modeling work concluded that the influence of dissolution and reprecipitation at Sites 806 and 807 was relatively minor (Mitnick et al., 2018). Prior work has also found minimal impacts on the ratio of Pliocene foraminifera from Site 806 (White and Ravelo, 2020) and on the ratio of Miocene Dentoglobigerina altispera shells at Site 806 (Sosdian et al., 2020). The weight-to-shell ratio is commonly used to monitor dissolution, and the only published record at Site 806 for the Pliocene does not show a trend consistent with dissolution of T. sacculifer (Wara et al., 2005). We do note that while the “coccolith size-free dissolution” index reported in Si and Rosenthal (2019) indicates higher dissolution rates in the Miocene, their records were thought to be biased from changes in foraminifera assemblages as discussed in White and Ravelo (2020).
To further assess the potential impact of dissolution in our geochemical data, the weight-to-shell ratio was examined in our samples. The weight-to-shell data used to monitor dissolution does not exhibit any trend within the interval studied consistent with dissolution. Absolute weight-to-shell is increasing in the Miocene, which is not consistent with dissolution influencing the record (Fig. 2e). Additionally, reconstructed pH and pCO2 values also exhibit reasonable correspondence with the ice core data. Downcore δ11B values from Sites 806 and 807 are similar, despite evidence for higher authigenic carbonate at Site 807 relative to Site 806 (Mitnick et al., 2018). Further, despite different sedimentation rates, our δ11B and results are consistent between Sites 806 and 807, and with data from Site 872 (Sosdian et al., 2018), which implies that diagenesis is not a primary driver of the reconstructed trends. A comparison of raw data as well as derived parameters is shown in Figs. 2 and 7.

Figure 2Foraminiferal data for Miocene to recent times. (a) Benthic foraminiferal δ18O data (blue line – stack from Lisiecki and Raymo, 2005; black line – compilation from Zachos et al., 2008; red line – compilation from Lear et al., 2015, 2020, at Site 806). (b) δ11B of T. sacculifer (blue circles) and G. ruber (blue triangles) at Sites 806 (light blue) and 807 (dark blue). Grey filled squares represent data from Site 872 located in the WEP (Sosdian et al., 2018). Open symbols are δ11B data from published studies (Hönisch and Hemming, 2009; Seki et al., 2010; Foster et al., 2012; Greenop et al., 2014; Martínez-Botí et al., 2015a; Chalk et al., 2017; Dyez et al., 2018; Sosdian et al., 2018; de la Vega et al., 2020; Raitzsch et al., 2021), grey open symbols are T. sacculifer, brown open symbols are for G. ruber. (c) ratios of T. sacculifer and G. ruber at Sites 806 and 807 and fourth-order polynomial regression from Sosdian et al. (2020) representing secular variations of sw (blue dotted line). (e) Calculated weight per shell for T. sacculifer and G. ruber. For panels (b)–(d): circles = T. sacculifer, triangles = G. ruber. Plots realized using GraphPad Prism version 7.0.0 for Windows, GraphPad Software, San Diego, California, USA.
2.3 Age models
The age model for Site 806 from 0–1.35 Ma is based on Medina-Elizalde and Lea (2005); calculated ages correspond well with ages from the Lisiecki and Raymo LR04 stack (Fig. 2a). The fourth polynomial regression-based biostratigraphy from Lear et al. (2015) was used for the rest of the record, following other work (Sosdian et al., 2020). Ages for Site 807 are based on published biostratigraphy (Berger et al., 1993) with additional constraints placed by Zhang et al. (2007) for the interval from 0–0.55 Ma. Benthic δ18O values from Sites 806 and 807 show good correspondence for the last 0.55 Myr, and the low-resolution benthic δ18O record for Site 806 (Lear et al., 2003, 2015) is consistent with the stack from Lisiecki and Raymo (2005) for the period studied (Fig. 3).
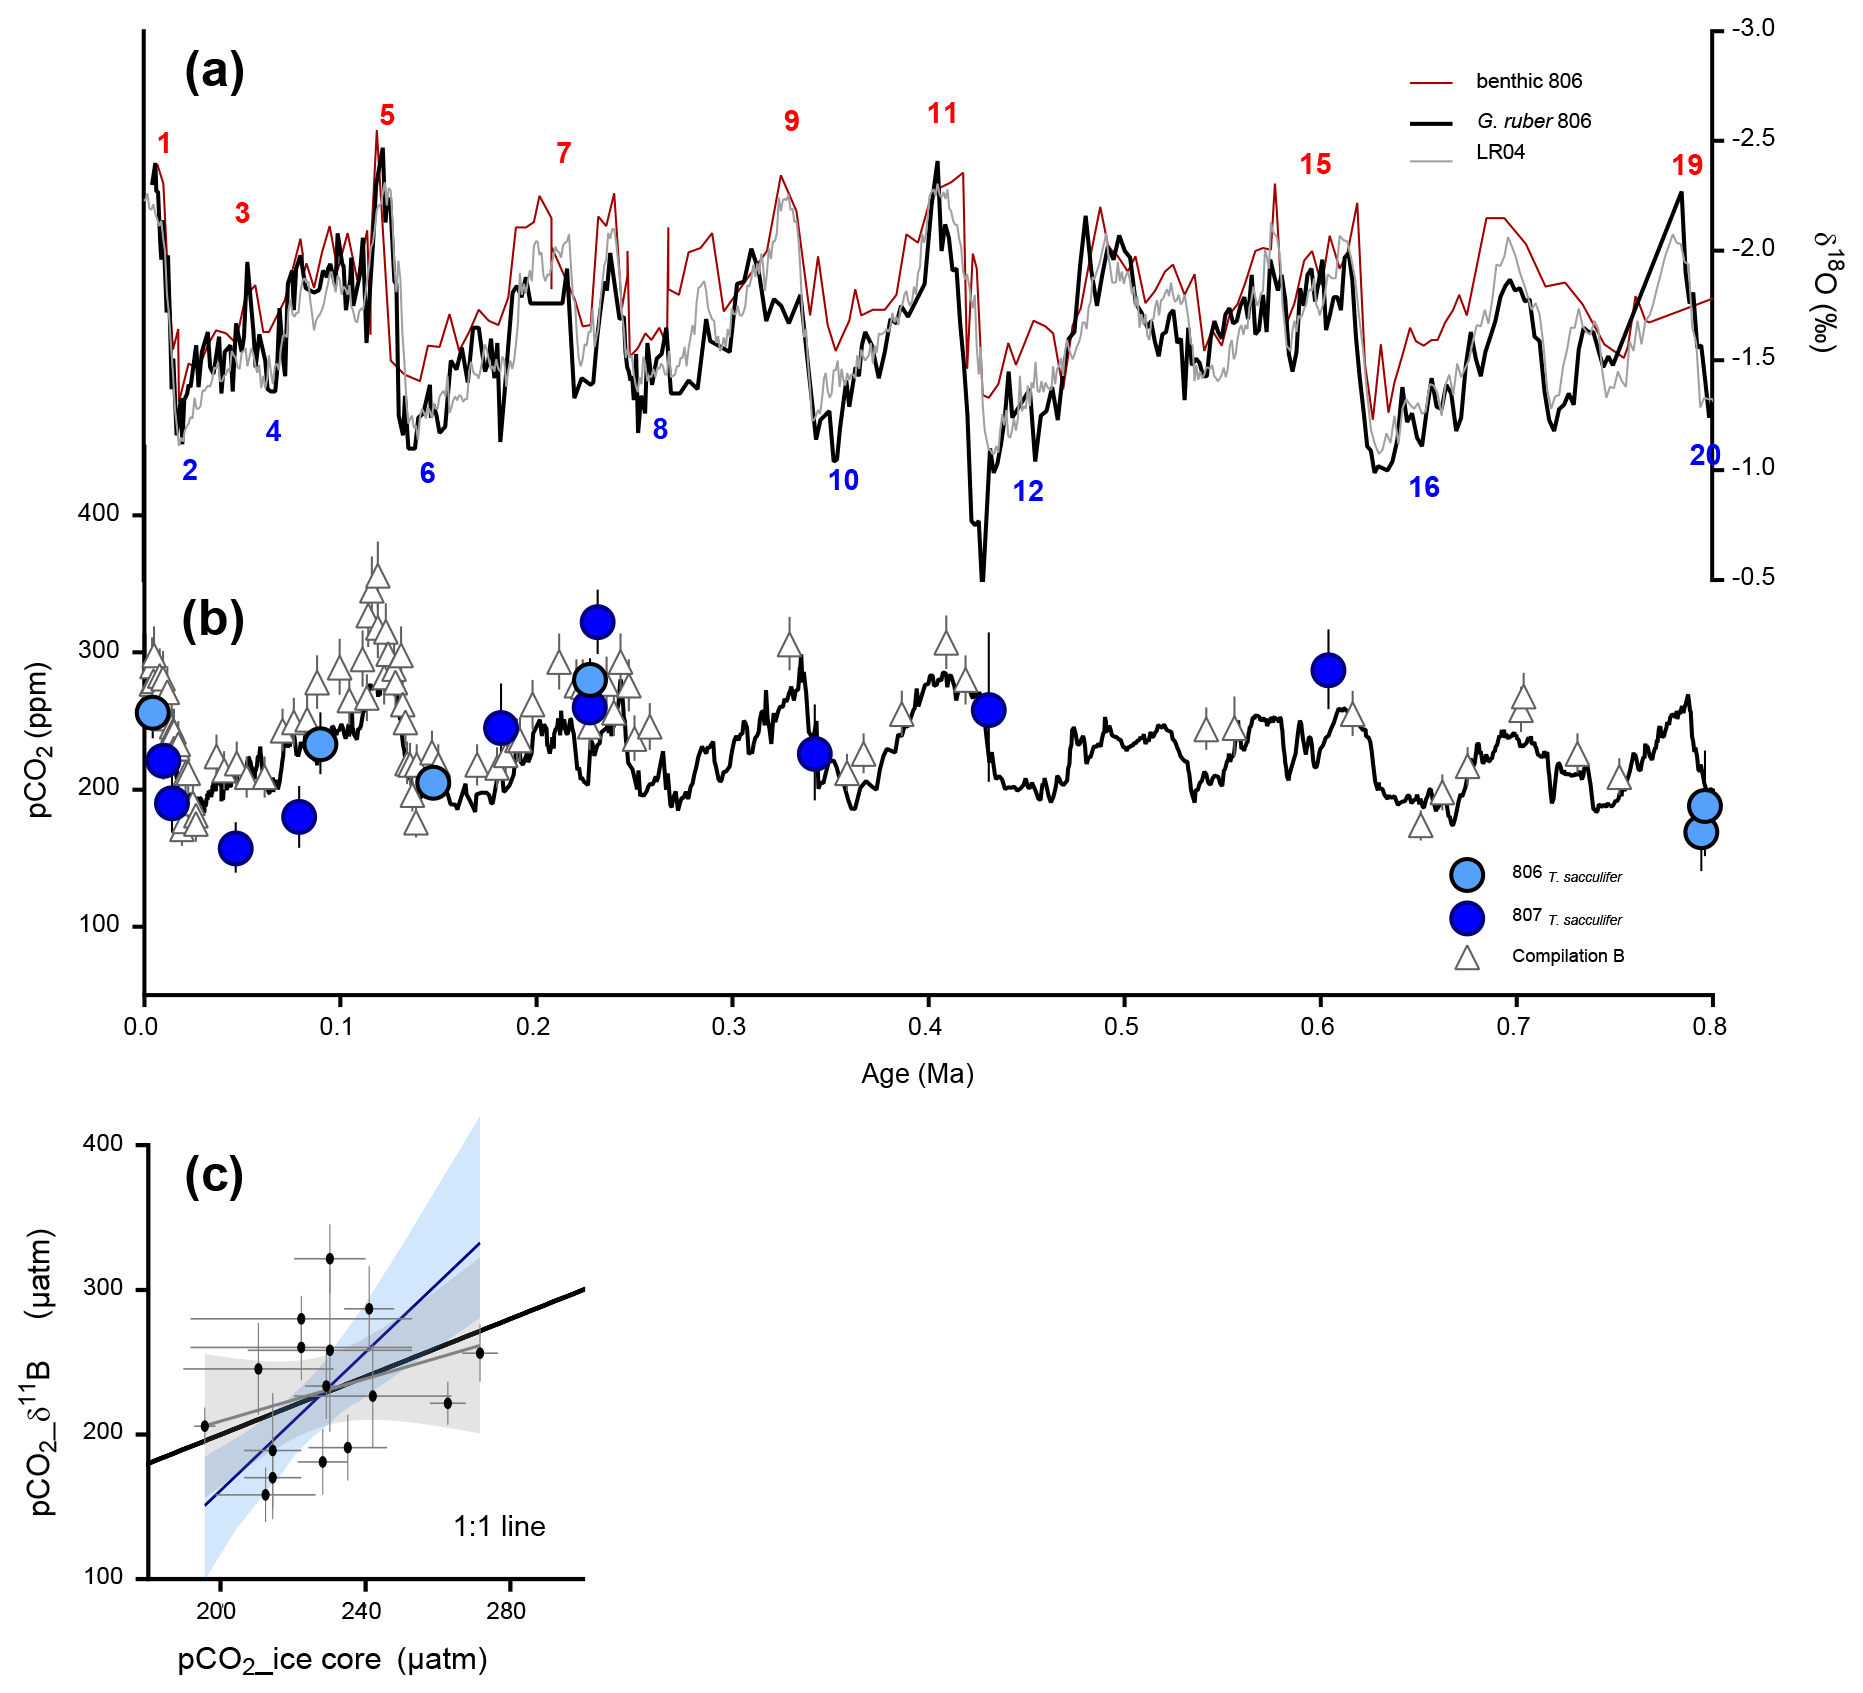
Figure 3(a) Reconstruction of surface pCO2 (ppm) for the past 0.8 Myr from T. sacculifer at ODP Sites 806 and 807 (blue symbols) using boron-based pH calculated from δ11Bseawater (Greenop et al., 2017) and alkalinity from Caves et al. (2016). Planktonic foraminiferal δ18O at site 806 with isotope stages labeled (black line – Medina-Elizalde and Lea, 2005) and benthic foraminiferal δ18O stack (grey line – Lisiecki and Raymo, 2005), benthic δ18O at Site 806 (dark red line) from Lear et al. (2003, 2015). (b) pCO2 values calculated from boron isotopes (colored symbols – this study) with data from the literature (open gray triangles – compilation B are data recalculated in Rae et al., 2021) and ice core pCO2 (black line – Petit et al., 1999; Lüthi et al., 2008; Bereiter et al., 2015). (c) Cross plot for the last 0.8 Myr of pCO from this study and pCO2 ice core (from ice core compilation, Bereiter et al., 2015), grey line is a simple linear regression (p=0.25, R2=0.09), blue line is a Deming regression taking both x and y uncertainties into account (p=0.25). Details of the regression parameters are in Table S6. Ice core CO2 error was calculated based on 2 SD of reported values, and ±1 kyr for the age of sediment samples. Boron-based pCO2 error is calculated based on error propagation described by Eq. (S17). Data compiled are from Foster (2008); Hönisch and Hemming (2009); Seki et al. (2010); Foster et al. (2012); Badger et al. (2013); Greenop et al. (2014); Martínez-Botí et al. (2015a); Chalk et al. (2017); Dyez et al. (2018); Sosdian et al. (2018); Greenop et al. (2019); de la Vega et al. (2020).
2.4 Species and trace element cleaning
Samples were picked and cleaned to remove clays at UCLA (Los Angeles, CA) and the University of Western Brittany (Plouzané, France). A total of 50–100 foraminifera shells were picked from the 300–400 µm fraction size for T. sacculifer (without sacc) and from the 250–300 µm for G. ruber (white sensu stricto). Picked foraminifera were gently crushed, clays were removed, and they were checked for coarse-grained silicates. Samples were then cleaned using a full reductive and oxidative cleaning protocol following Barker et al. (2003). A final leach step with 0.001N HCl was done prior to dissolution in 1N HCl. Boron purification used a published microdistillation protocol (see Misra et al., 2014b; Guillermic et al., 2020, for more detailed methods).
2.5 Chemical purification and geochemical analysis
Chemical separation was performed in a boron-free clean lab at the University of Cambridge (Cambridge, UK). Calcium concentrations were measured on an ICP-AES® Ultima 2 HORIBA at the Pôle Spectrometrie Océan (PSO), UMR6538 (Plouzané, France). Elemental ratios (e.g., ratios) were analyzed on a Thermo Scientific® Element XR HR-ICP-MS at the PSO, Ifremer (Plouzané, France). Boron isotopic measurements were carried out on a Thermo Scientific® Neptune+ MC-ICP-MS equipped with 1013 Ohm resistor amplifiers (Lloyd et al., 2018) at the University of Cambridge (Cambridge, UK).
2.6 Standards
Variations in B isotope ratios are expressed in conventional delta (δ) notation with δ11B values reported against the reference standard NIST SRM 951 (NIST, Gaithersburg, MD, USA):
Multiple analyses of external standards were performed to ensure data quality. For boron isotopic measurements, JCp−1 (Geological Survey of Japan, Tsukuba, Japan, Gutjahr et al., 2020) was used as a carbonate standard, and NEP, a Porites sp. coral from University of Western Australia and Australian National University was also used (McCulloch et al., 2014). A boron isotope liquid standard, ERM© AE121 (certified δ11B = 19.9 ± 0.6 ‰, SD), was used to monitor reproducibility and drift during each session (Vogl and Rosner, 2012; Foster et al., 2013; Misra et al., 2014b). For trace elements, external reproducibility was determined using the consistency standard Cam-Wuellerstorfi (University of Cambridge) (Misra et al., 2014a).
2.7 Figures of merit
2.7.1 δ11B analyses
Samples measured for boron isotopes typically ranged in concentration from 10 (∼5 ng B) to 20 ppb B samples (∼10 ng B). Sensitivity was 10 mV/ ppb B (e.g., 100 mV for 10 ppb B) in wet plasma at 50 µL/min sample aspiration rate. The intensity of 11B for a sample at 10 ppb B was typically 104 ± 15 mV (2 SD, typical session) and closely matched the 98 ± 6 mV (2 SD, typical session) of the standard. Procedural boron blanks ranged from 15 to 65 pg B (contributed to less than 1 % of the sample signal). The acid blank during analyses was measured at ≤1 mV on 11B (which also is <1 % of the sample intensity), and no memory effect was seen within and across sessions.
External reproducibility was determined by analyzing the international standard JCp−1 (Gutjahr et al., 2020) and a Porites sp. coral (NEP). The boron isotopic composition of JCp−1 was measured at 24.06 ± 0.20 ‰ (2 SD, n=6) within error of published values of 24.37 ± 0.32 ‰, 24.11 ± 0.43 ‰ and 24.42 ± 0.28 ‰ from Holcomb et al. (2015), Farmer et al. (2016) and Sutton et al. (2018), respectively. Average values are δ11BNEP = 25.72 ± 0.79 ‰ (2 SD, n=31) determined over 13 different analytical sessions, with each number representing a separately processed sample from this study. These results are within error of published values of 26.20 ± 0.88 ‰ (2 SD, n=27) and 25.80 ± 0.89 ‰ (2 SD, n=6), from Holcomb et al. (2015) and Sutton et al. (2018), respectively. Data are reported in Supplement Table S1.
2.7.2 analyses
Trace element (TE) analyses were conducted at a Ca concentration of either 10 or 30 ppm. Typical blanks for a 30 ppm Ca session were 7Li <2 %, 11B <7 %, 25Mg <0.2 % and 43Ca <0.02 %. Additionally, blanks for a 10 ppm Ca session were 7Li <2.5 %, 11B <10 %, 25Mg <0.4 % and 43Ca <0.05 %. Analytical uncertainty of a single measurement was calculated from the reproducibility of the Cam-Wuellestorfi standard: 0.6 µmol/mol for , 8 µmol/mol for and 0.02 mmol/mol for (2 SD, n=48). Data are reported in Supplement Table B.
2.8 Calculations
Detailed calculations can be found in the Supplement. Briefly, was used to reconstruct sea surface temperature (SST) using the framework from Gray and Evans (2019) correcting for influences of pH, salinity and secular variation in seawater . δ11Bcarbonate was corrected using an empirical δ11Bcarbonate weight-to-shell ratio relationship. δ11Bborate was determined using species-dependent sensitivities of δ11Bcarbonate to δ11Bborate (Guillermic et al., 2020). pH was calculated using δ11Bborate with different scenarios of secular seawater δ11B changes (Lemarchand et al., 2002; Raitzsch and Hönisch, 2013; Greenop et al., 2017). pCO2 was reconstructed using pH-based δ11Bcarbonate and different scenarios of alkalinity (Tyrrell and Zeebe, 2004; Ridgwell and Zeebe, 2005; Caves et al., 2016 and Rae et al., 2021). Further details including equations are provided in the Supplement.
3.1 Geochemical results
Geochemical data used in this study are presented in Fig. 2. data (Fig. 2c) are consistent with previously published values for Site 806 on T. sacculifer (Wara et al., 2005; Tripati et al., 2009; Nathan and Leckie, 2009). Although the record we generated does not overlap with Site 872, they are 1 Myr apart (15.7 and 16.7 Ma); there is a good correspondence between our data and the published record from T. trilobus at Site 872 (Sosdian et al., 2018). from a different species, D. altispera (Sosdian et al., 2020), is also plotted with an offset, for comparison.
Comparison with Site 872 data that are part of the compilation from Sosdian et al. (2018) shows that their δ11B data are in line with our dataset (Fig. 2b), and all sites examined in the WEP (Sites 806, 807, and 872) are above the lysocline (Shipboard Scientific Party, 1991). The δ11B data for T. sacculifer exhibit a significant increase (4.2 ‰) from the Miocene to the present. Figure 2b also compares the δ11B data used in this study with published data from other sites and shows that raw δ11B data for the WEP can be lower than values for other regions.
3.2 Reproducing pCO2 from ice cores
We sought to assess whether there is evidence for air–sea equilibrium or disequilibrium in the WEP during the large amplitude late Pleistocene glacial–interglacial cycles, in order to validate our approach. We reconstructed pCO2 for the last 800 kyr (n=16, Fig. 3). For the last 800 kyr, reconstructed pCO2 values for Sites 806 and 807 are in the range of ice cores (Fig. 3, Petit et al., 1999; Siegenthaler et al., 2005; Lüthi et al., 2008; compilation from Bereiter et al., 2015). The two critical diagnostics we used for method validation are (1) that the δ11B-based reconstruction of pCO2 is consistent with ice core atmospheric CO2 and (2) that the boron-based reconstruction empirically reproduces interglacial–glacial amplitudes from ice cores. Figure 3b shows that both of these criteria are met despite large scatter. We also created a cross plot comparing these two independent constraints on pCO2 (Fig. 3c). Two regressions between ice core pCO2 and boron-based pCO2 are shown, a simple linear regression (grey line) and a Deming regression that takes into account error in variables (blue line). Bootstrapping was used to calculate uncertainties in the regression models (n=1000, Fig. 3c, Table S6). While slopes and intercepts are not statistically different from a 1:1 line, the regressions do not reach a high significance level (p=0.25); boosting the resolution of the record could help provide better constraints for this type of comparison. No significant difference in variability was observed at either site. The age models for the sites are based on comparisons of the benthic δ18O records for both Sites 806 and 807 (Fig. 3a, Zhang et al., 2007; Lear et al., 2003, 2015) to the published isotopic stack (Lisiecki and Raymo, 2005).
We also note that reconstructed pCO2 uncertainties (both accuracy and precision) could potentially arise from -derived estimates of temperature; these uncertainties could be reduced using independent temperature proxies for the WEP such as clumped isotope thermometry (Tripati et al., 2010, 2014), a technique that is not sensitive to the same sources of error as thermometry and therefore is an area planned for future work. Other sources of uncertainty that have a larger effect on pCO2 calculations are the weight–shell correction, while the TA and seawater boron isotope composition have a minor effect over this time interval.
Between MIS 7 and 6, our reconstructions exhibit a decrease in temperature (ΔT) of 1.2 ∘C, an increase in pH (ΔpH) of 0.08 and a decrease in pCO2 (ΔpCO2) of 58 ppm. Between stage 3 and 1, we observed an increase in temperature of 2.0 ∘C, a decrease in pH of 0.13 and an increase in pCO2 of 76 ppm. We also compare results with recent reconstructions in Figs. S1 and S2 (Sosdian et al., 2018; Rae et al., 2021). These results highlight that we are able to reproduce the range of atmospheric pCO2 in the ice core record and reproduce the amplitude of changes between transitions, with uncertainties typical for this type of work (Hönisch et al., 2019).
3.3 Sea surface temperature in the WEP
data are consistent at Site 806 (Wara et al., 2005; Tripati et al., 2009, 2011; Nathan and Leckie, 2009) and Site 872 (Sosdian et al., 2018) in the WEP. The in T. sacculifer has to date not shown a pH dependency (Gray and Evans, 2019), but of G. ruber does and was therefore corrected from this effect (see Supplement). Data for both species were corrected from salinity and seawater changes. temperatures for Site 872 were reconstructed using published data and the same framework we use here and are presented in Fig. 4. Recalculated values for Site 872 are from D. altispera, with an offset applied relative to T. sacculifer, and show similar variations to our record for the Miocene Climate Optimum and Middle Miocene Climate Transition (MCO–MMCT) periods (Sosdian et al., 2020). Temperatures from Tex86 and U are plotted for comparison but those records are limited to the last 12 and 5 Myr, respectively (Zhang et al., 2014).

Figure 4Compilation of temperatures from Site 806 in the WEP. -based temperatures were derived using the same framework (see Supplement). Blue filled symbols are from Sites 806 and 807 with blue circles for T. sacculifer and triangles for G. ruber; filled gray squares are data from Site 872 (Sosdian et al., 2018). Open symbols are SST derived from at Site 806 (Wara et al., 2005; Tripati et al., 2009; Nathan and Leckie, 2009). Tex86 and U are also plotted for comparison (Zhang et al., 2014). Orange open circles are SST data calculated with our framework from the species D. altispera at ODP Site 806 (Sosdian et al., 2020) with an offset of +8 ∘C. Blue line is a smooth line (LOWESS) going through the data.
The data support high temperatures of 35.2 ± 1.3 ∘C (2 SD, n=11) for the early Miocene until the MMCT, with a relatively small (ca. 1 ∘C) change into the MCO, and larger changes out of the MCO. Similarly warm SSTs for the MCO were reconstructed in the North Atlantic at Site 608 from Tex86 (Super et al., 2018). Despite a gap in our compilation from 11.5 to 9.5 Ma, there is a SST decrease of ∼6 ∘C from the MCO to ∼7 Ma where temperatures similar to present-day values are observed. A decline in temperature during the MMCT is coincident with the timing of the constriction of the Indonesian Seaway, the pre-closure of the trans-equatorial circulation and subsequent formation of a proto-warm pool (Nathan and Leckie, 2009; Sosdian et al., 2020). From 12 to 7 Ma, the SST record diverges from Tex86 and U-based reconstructions, with higher temperatures. At the same time, a record for the North Atlantic showed a decrease of ∼10 ∘C from the MCO to ∼9 Ma (Super et al., 2018). From 7 Ma to the present, the record from multiple proxies – , Tex86 and U – in the WEP agree.
3.4 Scenarios of seawater δ11B and alkalinity used for pCO2 reconstructions
Figures 5 and 6 show the different histories of seawater δ11B and alkalinity used in our calculations, respectively. Details of calculations are provided in the Supplement methods. Following the approach of Tripati et al. (2009, 2014) and recent literature (Sosdian et al., 2018; Rae et al., 2021), we explored multiple scenarios for the evolution of seawater boron geochemistry (Fig. 5) and alkalinity for calculations of pCO2 (Figs. 6, S1 and S2). During the interval overlapping with the ice core record, we observe that the choice of model used does not make a significant difference in reconstructed values. During earlier time intervals, we see there is a greater divergence, reflecting larger uncertainties in seawater δ11B and alkalinity further back in Earth history.
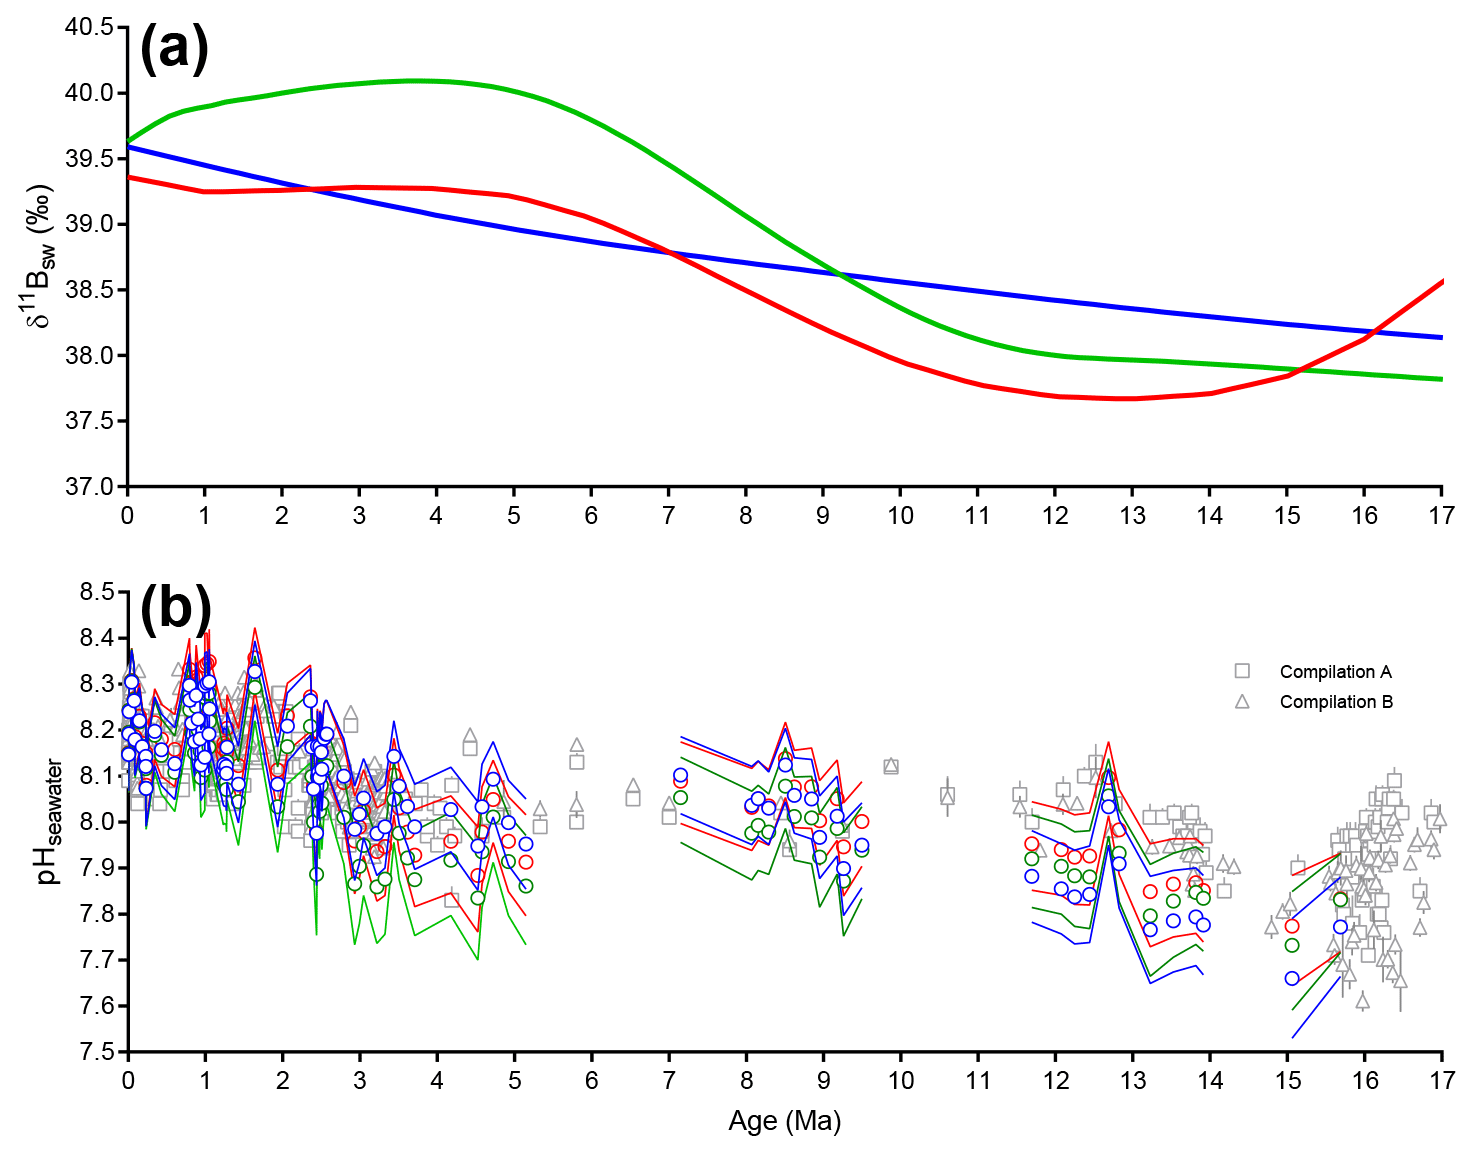
Figure 5Different models for the evolution of the boron geochemistry explored as part of this work. Due to the 1 ‰ uncertainty propagated for δ11Bseawater, all scenarios yield reconstructed seawater pH values that are within error of each other. Propagated uncertainties were calculated using Eq. (S14) (see Supplement). (a) Different models for δ11Bseawater used for the reconstruction of pCO2 in this study (blue – Lemarchand et al., 2002; green – Greenop et al., 2017; red – Raitzsch and Hönisch, 2013). (b) Reconstructed pH based on our measured δ11Bcarbonate values using different models for δ11Bseawater (blue – Lemarchand et al., 2002; green – Greenop et al., 2017; red – Raitzsch and Hönisch, 2013), compilations of pH from Sosdian et al. (2018) (compilation A – open squares) and Rae et al. (2021) (compilation B – open triangles) are also shown for comparison. Data for compilation A are from Hönisch and Hemming (2009); Seki et al. (2010); Foster et al. (2012); Badger et al. (2013); Greenop et al. (2014); Martínez-Botí et al. (2015a); Chalk et al. (2017); Sosdian et al. (2018). Data for compilation B are from Foster (2008); Hönisch and Hemming (2009); Seki et al. (2010); Foster et al. (2012); Badger et al. (2013); Greenop et al. (2014); Martínez-Botí et al. (2015a); Chalk et al. (2017); Dyez et al. (2018); Sosdian et al. (2018); Greenop et al. (2019); de la Vega et al. (2020).

Figure 6Different models for the evolution of a second carbonate (e.g., alkalinity) system parameter explored as part of this work. The propagated uncertainties were calculated using Eq. (S16) (see Supplement). (a) Different models for alkalinity used for the reconstruction of pCO2 in this study (brown – constant alkalinity of 2330 µmol/kg, blue – Ridgwell and Zeebe, 2005; green – Tyrrell and Zeebe, 2004; violet – Caves et al., 2016). Colored symbols are reconstructed pCO2 based on our measured δ11Bcarbonate values, alkalinity scenario and δ11Bseawater from Greenop et al. (2017); open squares (compilation A) are the pCO2 compilation from Sosdian et al. (2018), open triangles (compilation B) are from the compilation by Rae et al. (2021), black symbols are from site 872. (b) Reconstructed pCO2 using constant alkalinity of 2330 µmol/kg and δ11Bseawater from Greenop et al. (2017). (c) Reconstructed pCO2 using the constant alkalinity scenario from Ridgwell and Zeebe (2005) and δ11Bseawater from Greenop et al. (2017). (d) Reconstructed pCO2 using constant alkalinity scenario from Tyrrell and Zeebe (2004) and δ11Bseawater from Greenop et al. (2017). (e) Reconstructed pCO2 using constant alkalinity scenario from Caves et al. (2016) and δ11Bseawater from Greenop et al. (2017). In black are published estimates from ice core data (circles – Yan et al., 2019). Compilations of pCO2 from Sosdian et al. (2018) (compilation A – open squares) and Rae et al. (2021) (compilation B – open triangles) are also shown for comparison. Data for compilation A are from Hönisch and Hemming (2009); Seki et al. (2010); Foster et al. (2012); Badger et al. (2013); Greenop et al. (2014); Martínez-Botí et al. (2015a); Chalk et al. (2017); Sosdian et al. (2018). Data for compilation B are from Foster (2008); Hönisch and Hemming (2009); Seki et al. (2010); Foster et al. (2012); Badger et al. (2013); Greenop et al. (2014); Martínez-Botí et al. (2015a); Chalk et al. (2017); Dyez et al. (2018); Sosdian et al. (2018); Greenop et al. (2019); de la Vega et al. (2020). Stars indicate pCO2 values reconstructed from alkenones by Tanner et al. (2020) (simulation 6) at Site 1088 in the Southern Ocean.
Prior to 10 Ma and during the early Pliocene (∼4.5 to 3.5 Ma), calculations of pCO2 diverge from published values largely because of the different assumptions each study has used for past seawater δ11B (Fig. 5). However, we find that when the uncertainty in reconstructed pH is fully propagated, the differences in reconstructed pH values calculated using each of the δ11Bseawater histories is not significantly different (Figs. 5 and 6; see also Hönisch et al., 2019). In contrast to the results from Greenop et al. (2017), the record from Raitzsch and Hönisch (2013) exhibits substantial variations on shorter timescales. Such variability is a challenge to reconcile with the Li isotope record of Misra and Froelich (2012), given that Li has a shorter residence time than boron while having similar sources and sinks. For the remainder of this study, we use the δ11Bseawater history from Greenop et al. (2017) because it is in good agreement with seawater δ7Li (Misra and Froelich, 2012). The recent calculations of seawater pH (Sosdian et al., 2018; Rae et al., 2021) agree with values from our study when uncertainties are taken into account (Fig. 5).
The four alkalinity models used in this study diverge prior to 9 Ma, with a maximum difference at ∼13 Ma that is also reflected in reconstructed pCO2 values (Fig. 6). However, all four models yield pCO2 estimates that are within error of each other when the full uncertainty is considered. Uncertainty in the evolution of seawater alkalinity and seawater δ11B leads to differences in the absolute values of reconstructed pCO2 (Fig. S2), and a divergence in reconstructed pCO2 values that is largest in the Miocene. The two scenarios that produce the highest divergence in values are those calculated using constant alkalinity relative to those calculated using values from Caves et al. (2016), with a maximum difference at 15.06 Ma of up to 250 ppm CO2, and with the latter model producing lower values (Fig. 6b and e). Thus, for the MCO, alkalinity is a critical parameter in calculations of absolute pCO2 values. For the Miocene and earlier intervals, improved constraints on past secular variations of seawater δ11B and alkalinity will yield more accurate reconstructions of pCO2.
For the remainder of this paper, we use the model of Caves et al. (2016) to estimate alkalinity and δ11Bseawater determined by Greenop et al. (2017) (e.g., Fig. 6e). We note that two recent syntheses of boron isotope data have been published and compare our results to these findings (Figs. 8 and S2). Sosdian et al. (2018) report values that are in line with our results in the Miocene, but their study does not replicate results from ice cores. Rae et al. (2021) presents reconstructed values that are higher in the Miocene, due to the utilization of different scenarios of seawater δ11B and alkalinity compared to this work.
3.5 Time intervals
3.5.1 Miocene
The study of Miocene climate is thought to provide insights into drivers and impacts of global warming and melting of polar ice (Flower and Kennett, 1994). The Miocene epoch (23–5.3 Ma) is characterized by a warm interval, the Miocene Climate Optimum (∼17–14.7 Ma – MCO), and an abrupt cooling during the Middle Miocene Climate Transition (∼14–13 Ma – MMCT) that led to the expansion of ice on Antarctica and Greenland. Climate modeling supports a role for decreasing CO2 in this transition (DeConto and Pollard, 2003). However, reconstructions for the Miocene are still relatively limited (Sosdian et al., 2018; Rae et al., 2021; Raitzsch et al., 2021). Boron isotope and alkenone-based pCO2 reconstructions support higher pCO2 during the MCO and a decrease over the MMCT (Sosdian et al., 2018; Stoll et al., 2019), consistent with what was previously inferred from (Tripati et al., 2009, 2011; Sosdian et al., 2020).
We applied the same framework we used for calculations at Sites 806 and 807 to published boron isotope data from Site 872 (Sosdian et al., 2018) in order to extend the WEP record to the early Miocene (Figs. 7, 8). The Miocene data between Sites 806 and 872 do not overlap as both are low in resolution but do show excellent correspondence in their trends in δ11B and reconstructed pH. For example, the closest data points in time at the two sites are at 15.6 Ma at Site 806 with a δ11B = 14.47 ± 0.21 ‰ and at 16.7 Ma at Site 872 with a δ11B = 15.12 ± 0.25 ‰. The pH values we reconstruct are within error of published estimates from Site 872 (Sosdian et al., 2018, Figs. 7d and 8d). Collectively, these data suggest that the early Miocene WEP was characterized by a mixed-layer pH of 8.1 ± 0.1 (2 SD, n=4) between 19.4 and 21.8 Ma, which decreased to reach a minimum during the MCO of 7.7 ().
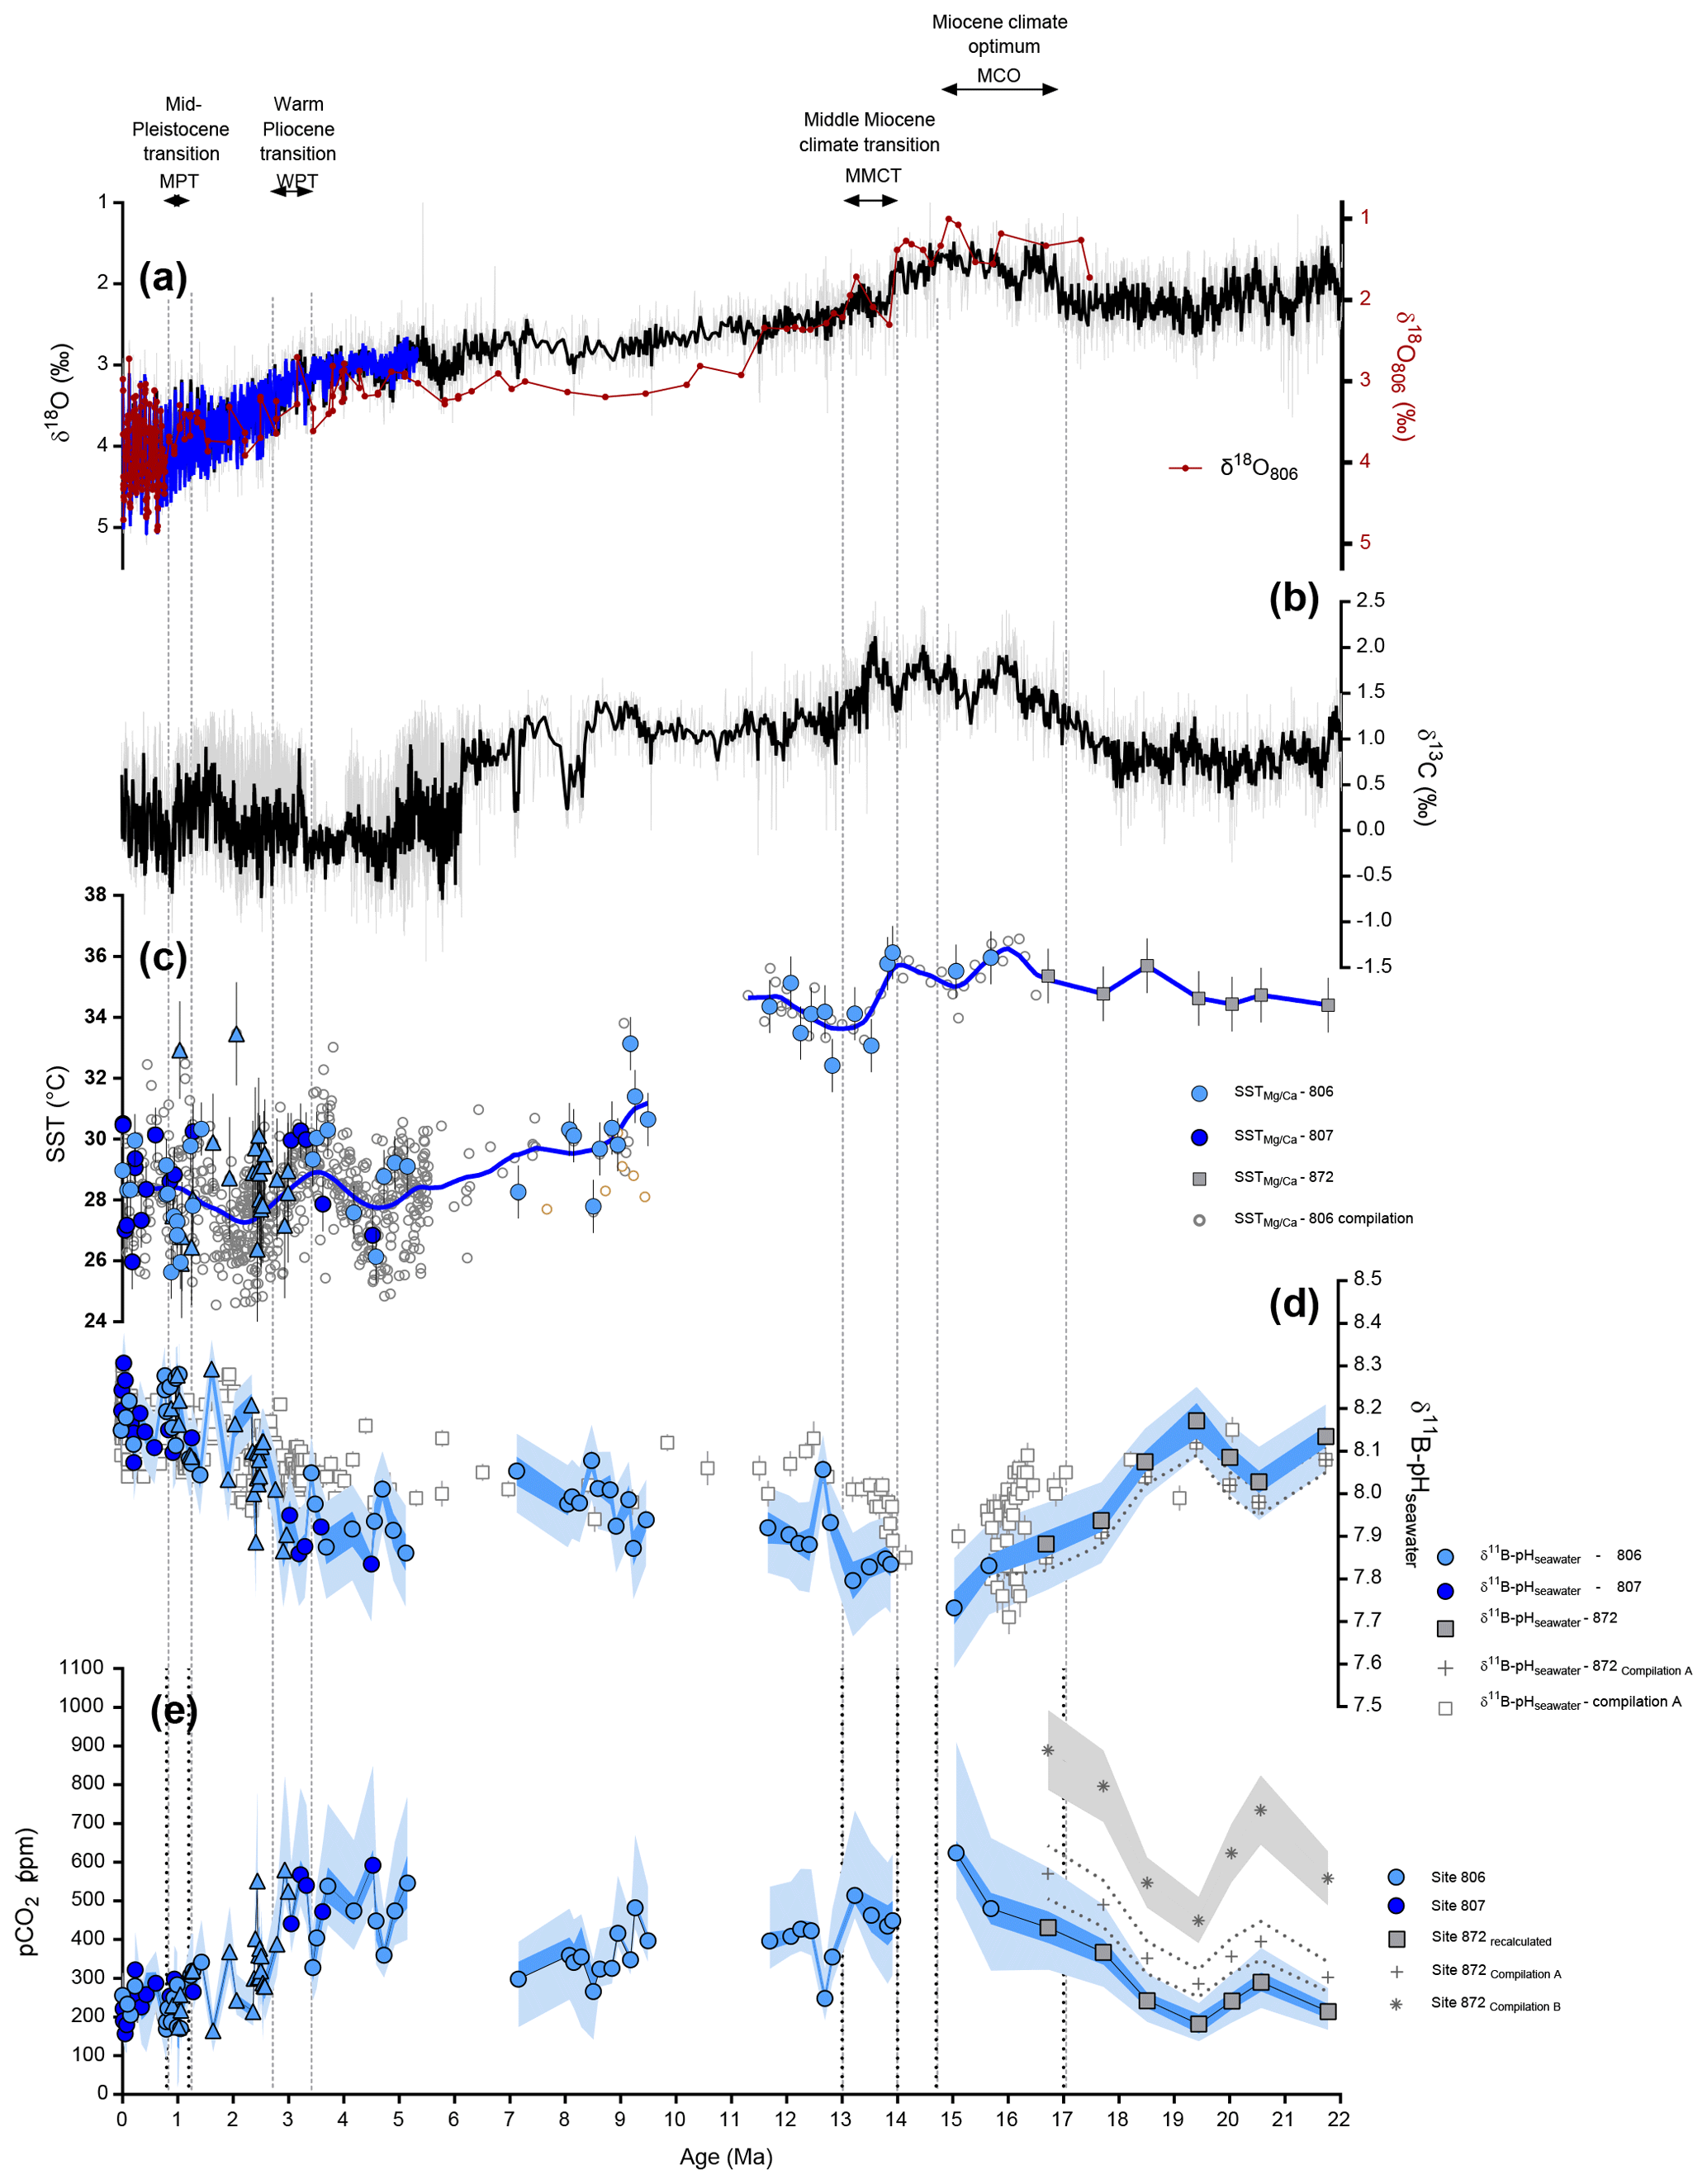
Figure 7Proxy data for the past 22 million years in the Western Equatorial Pacific compared to benthic oxygen isotope data. (a) Benthic δ18O (blue line – stack from Lisiecki and Raymo, 2005; black line – compilation from Zachos et al., 2008). (b) Benthic δ13C (black line – compilation from Zachos et al., 2008). (c)–(e) Color indicates the site (filled light blue = 806, filled dark blue = 807), symbols represent the species (circle = T. sacculifer and triangle = G. ruber), filled grey squares are recalculated data based on Sosdian et al. (2018) at site 872. (c) SST reconstructed at ODP Sites 806 and 807 using ratios (see Supplement for reconstruction details), open symbols are reconstructed temperatures based on literature at site 806 (see text or Fig. 4). (d) Seawater pH reconstructed from δ11B of T. sacculifer and G. ruber using δ11Bseawater from Greenop et al. (2017) (refer to text and Supplement for calculations, this study), open squares (compilation A) represent data from the CO2 compilation of Sosdian et al. (2018), and open triangles (compilation B) are compilation data from Rae et al. (2021). (e) Reconstructed pCO2 (ppm) using boron-based pH and alkalinity from Caves et al. (2016), data presented are from this study. Propagated uncertainties are given by Eq. (S17) for the dark blue envelope, while the light blue envelope shows the uncertainties calculated based on Eq. (S16) (taking into account uncertainty in δ11Bseawater). Crosses are original pCO2 values calculated in Sosdian et al. (2018) at Site 872; asterisks are recalculated pCO2 values at Site 872 by Rae et al. (2021).
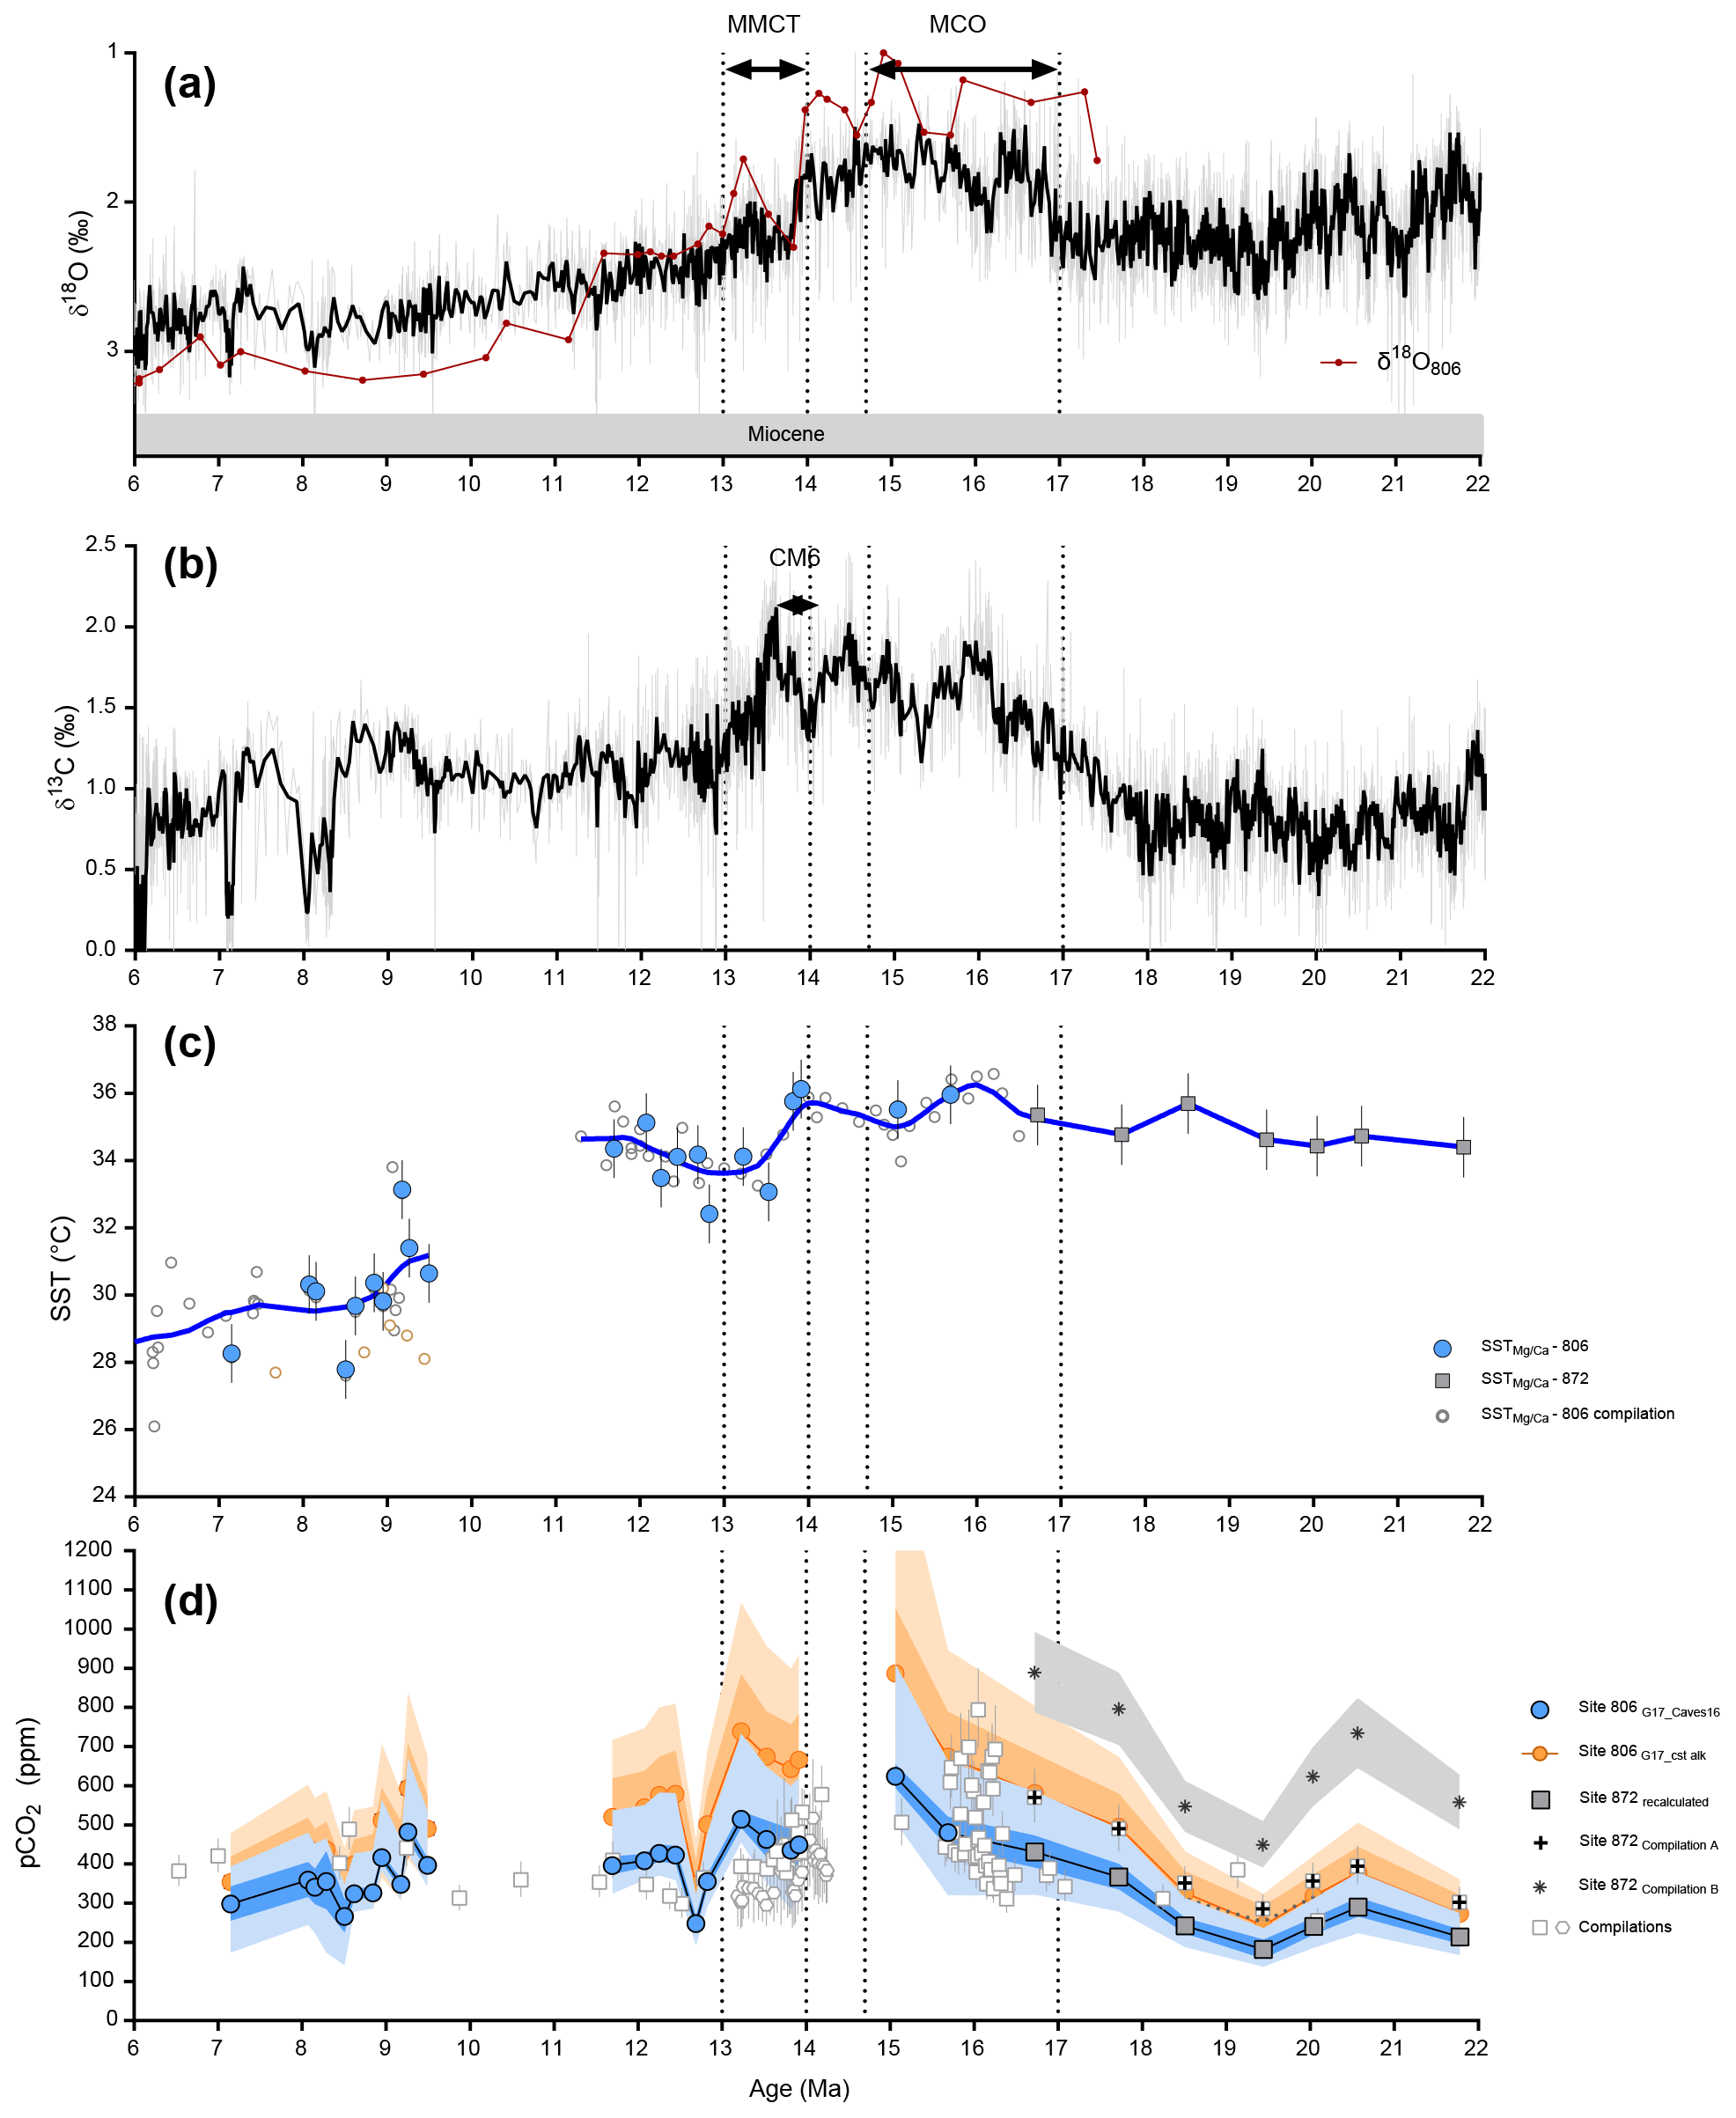
Figure 8Proxy data from 22 to 6 million years, including the Middle Miocene Climate Transition (MMCT) and Miocene Climate Optimum (MCO), in the Western Equatorial Pacific compared to benthic oxygen isotope data. (a) Benthic δ18O (black line – compilation from Zachos et al., 2008). (b) Benthic δ13C (black line – compilation from Zachos et al., 2008). (c)–(d) Color indicates the site (filled light blue = 806, filled dark blue = 807), symbols represent the species (circle = T. sacculifer and triangle = G. ruber), filled grey squares are recalculated data based on Sosdian et al. (2018) at site 872. (c) SST reconstructed at ODP Sites 806 and 807 using ratios (see Supplement for reconstruction details), open symbols are reconstructed temperatures based on literature at site 806 (see text or Fig. 4). (d) Reconstructed pCO2 (ppm) from this study (blue symbols) using boron-based pH and alkalinity from Caves et al. (2016). Propagated uncertainties are given by Eq. (S17) for the dark blue envelope, while the light blue envelope reflects the uncertainties calculated based on Eq. (S16) (taking into account uncertainty on δ11Bseawater). Orange data points and envelope are calculated pCO2 values and associated uncertainty from our study using our framework and a constant alkalinity scenario. Open squares (compilation A) are compilation data from Sosdian et al. (2018), open triangles are data from Raitzsch et al. (2021) at Site 1092. Crosses are original pCO2 calculated in Sosdian et al. (2018) at Site 872; asterisks are recalculated pCO2 at Site 872 by Rae et al. (2021); dark red triangles are from Site 1092 (Raitzsch et al., 2021). Data for compilation A are from Hönisch and Hemming (2009); Seki et al. (2010); Foster et al. (2012); Badger et al. (2013); Greenop et al. (2014); Martínez-Botí et al. (2015a); Chalk et al. (2017); Sosdian et al. (2018). Data for compilation B are from Foster (2008); Hönisch and Hemming (2009); Seki et al. (2010); Foster et al. (2012); Badger et al. (2013); Greenop et al. (2014); Martínez-Botí et al. (2015a); Chalk et al. (2017); Dyez et al. (2018); Sosdian et al. (2018); Greenop et al. (2019); de la Vega et al. (2020).
Given the sensitivity in absolute pCO2 to assumptions about the second carbonate system parameter, a few scenarios were explored for the combined 806, 807 and 872 reconstructed pH values. For all alkalinity scenarios we used, reconstructed pCO2 shows an increase from the Early Miocene to the MCO, with the highest values in the MCO. Recalculated pCO2 for Site 872 between 19.4 and 21.8 Ma is 232 ± 92 ppm (2 SD, n=4), lower but within error of the ones presented in Sosdian et al. (2018) and also within error of a constant alkalinity scenario (Fig. 8d). The main difference between our calculations and published reconstructions occurs between 19.4 and 21.8 Ma, when the same δ11B data for Site 872 from Sosdian et al. (2018) recalculated in Rae et al. (2021) yield higher pCO2, with an average value of 591 ± 238 ppm (2 SD, n=4) because of the different assumptions used in their calculations. This difference is important because the assumptions from Rae et al. (2021) would imply a relatively high and stable pCO2 from the early Miocene to MCO (Fig. S2), which would imply a decoupling between pCO2 and temperature with no pCO2 change during an interval of decreasing benthic δ18O. However, our reconstructed pCO2 data increase towards the MCO is in line with the observed benthic δ18O decrease and δ13C increase and suggest a coupling between temperature and pCO2 over this period. This highlights the critical need for the use of a common set of assumptions for studies. Assumptions may vary between studies depending on the timescales studied, but a common framework is needed. In addition, further constraints on the second carbonate system parameter and on secular changes in seawater δ11B will reduce uncertainties in reconstructed pCO2, with improved precision.
The highest pCO2 values we reconstruct are found during the MCO (Fig. 6e). For the MCO, our estimates are 511 ± 201 ppm (2 SD, n=3, Table 2). The middle Miocene values we reconstruct are in line with previous studies (Greenop et al., 2014; Sosdian et al., 2018). Published δ11B-based reconstructions also support higher pCO2 for the MCO of ∼350–400 ppm (Foster et al., 2012) or 300–500 ppm (Greenop et al., 2014) that was recalculated by Sosdian et al. (2018) to be ∼470–630 ppm depending on the model of δ11Bseawater chosen. During the MCO relative maxima in pCO2, our data support very warm sea surface temperatures in the WEP (35.6 ± 0.6 ∘C 2 SD, n=3; Fig. 8c), that merits further examination in future studies. In fact, the highest temperatures recorded in our samples occur when there is a minimum in the global composite record of δ18O of benthic foraminifera (Zachos et al., 2001, 2008; Tripati and Darby, 2018).
Table 2Comparison of reconstructed pCO2 values for key intervals in the last 16 Myr. The abbreviation “nd” stands for ”non-determined”.
At the end of the MMCT, we find evidence for changes in pCO2 and temperature in the WEP (Fig. 8). From 13.5 to 12.7 Ma, we reconstruct an increase in pH of ∼0.21 and a major decrease in pCO2 of ∼215 ppm during an interval highlighted by Flower and Kennett (1995), who observed changes in δ18O indicative of rapid East Antarctic Ice Sheet growth and enhanced organic carbon burial with a maximum δ13C reached at ∼13.6 Ma (Shevenell et al., 2004; Holbourn et al., 2007). As discussed in Sect. 3.4 the alkalinity model used for the calculations have an important impact during the Miocene which is likely responsible for the different absolute pCO2 values over the MCO. In comparison, a scenario of constant alkalinity would lead to a pCO2 during the MCO of 714 ± 313 ppm (2 SD, n=3) and a decrease of ∼540 ppm during the MMCT. Both those reconstructions could simulate the large-scale advance and retreat of Antarctic ice with such low pCO2 values (Gasson et al., 2016). At the same time, we find evidence for a decline in SST of 3.4 ∘C to minimum values of 33.3 ∘C. The synchronous shifts in the δ13C and δ18O of benthic foraminifera are consistent with increased carbon burial during colder periods, thus feeding back into decreasing atmospheric CO2 and supporting the hypothesis that the drawdown of atmospheric CO2 can in part be explained by enhanced export of organic carbon (Flower and Kennett, 1993, 1995). However, given the limited sampling of this study, we are only able to resolve a pCO2 decrease toward the end of the MMCT (∼13.5 Ma). The higher-resolution δ11B pCO2 from Site 1092 for the MMCT (Raitzsch et al., 2021) reports eccentricity-scale pCO2 variability; the authors reported that low pCO2 during eccentricity maxima was consistent with an increase in weathering due to strengthened monsoonal circulation, which would increase nutrient delivery and support higher productivity that in turn would impact carbon drawdown and burial, in line with modeling from Ma et al. (2011).
The resolution of our data during the late Miocene is low, with a data gap from 12.5 to 9.2 Ma and another gap between 6.5 and 5 Ma. We note the pCO2 peak at ∼9 Ma observed by Sosdian et al. (2018) is not seen in our record, although this is likely due to the low resolution of our dataset. Between 9.5 and 7.1 Ma we find evidence for a decrease in atmospheric CO2 of 100 ppm associated with a decrease in temperature of 1.3 ∘C. pCO2 estimates derived from alkenones for Site 1088 (Tanner et al., 2020) do not show the same trend as boron-based reconstructions from the WEP or other regions (Fig. 6), which might be due to other controls on the alkenone proxy (Badger et al., 2019). A recent publication from Raitzsch et al. (2021) reports a δ11B reconstruction of pCO2 that is within error of other δ11B isotope data from the Southern Ocean (Sosdian et al., 2018), although not for the same period as Tanner et al. (2020). pCO2 differences between our reconstruction and that of Sosdian et al. (2018) and Raitzsch et al. (2021) (Fig. 8) likely reflect assumptions made for calculations (of δ11B, TA) and the specific mono-specific calibrations used for each study, as well as potential geographic differences in air–sea pCO2. These differences do not invalidate the boron isotope proxy but illustrate the impact that specific seawater parameters and calibrations can have on reconstructed pCO2 values, as well as potential inferences of air–sea disequilibrium.
3.5.2 Pliocene
Oxygen isotope data from a global benthic foraminiferal stack show that the Pliocene epoch (5.3–2.6 Ma) was initially characterized by warm conditions followed by the intensification of glaciation that occurred in several steps, including during MIS M2 (3.312–3.264 Ma), followed by the Middle Pliocene Warm Period (Lisiecki and Raymo, 2005). The Middle Pliocene Warm Period (mPWP – 3.29–2.97 Ma) is considered a relevant geological analogue for future climate change, given ∼3 ∘C warmer global temperatures and sea levels that were ∼20 m higher than today (Dutton et al., 2015; Haywood et al., 2016), and is a target for model intercomparison projects, for which accurate paleo-atmospheric pCO2 estimates are critical (Haywood et al., 2016).
We calculate high pCO2 values of 419 ± 119 ppm (2 SD, n=3, Table 2) between 4.7 to 4.5 Ma during the Early Pliocene warm interval (Fig. 9). The pCO2 data we report provide a higher data density for the Early Pliocene and exhibit a trend that is in line with the reconstruction from Rae et al. (2021). Our data support values of 530 ± 110 ppm over the mPWP (2 SD, n=4), higher than previously published data (Figs. 9, S2 and Table 2), although we acknowledge our low data density may not fully sample variability over this period. The similarity between our reconstructed values and those published for Site 871 in the Indian Ocean (Sosdian et al., 2018) suggests that changes in Indonesian through-flow do not induce substantial changes in air–sea exchange in the WEP.

Figure 9Proxy data from 7 to 1 million years, including the Warm Pliocene Transition (WPT), in the Western Equatorial Pacific compared to benthic oxygen isotope data. (a) Benthic δ18O (black line – compilation from Zachos et al., 2008). (b) Benthic δ13C (black line – compilation from Zachos et al., 2008). (c)–(d) Color indicates the site (filled light blue = 806, filled dark blue = 807), symbols represent the species (circle = T. sacculifer and triangle = G. ruber), filled grey squares are recalculated data based on Sosdian et al. (2018) at ODP Site 872. (c) SST reconstructed at ODP Sites 806 and 807 using ratios (see Supplement for reconstruction details), open symbols are reconstructed temperatures based on literature at site 806 (see text or Fig. 4). (d) Reconstructed pCO2 (ppm) from this study (blue symbols) using boron-based pH and alkalinity from Caves et al. (2016). Propagated uncertainties are given by Eq. (S17) for the dark blue envelope, while the light blue envelope reflects the uncertainties calculated based on Eq. (S16) (taking into account uncertainty on δ11Bseawater). Open squares (compilation A) are pCO2 compilation from Sosdian et al. (2018), open triangles (compilation B) are from the compilation by Rae et al. (2021). Data for compilation A are from Hönisch and Hemming (2009); Seki et al. (2010); Foster et al. (2012); Badger et al. (2013); Greenop et al. (2014); Martínez-Botí et al. (2015a); Chalk et al. (2017); Sosdian et al. (2018). Data for compilation B are from Foster (2008); Hönisch and Hemming (2009); Seki et al. (2010); Foster et al. (2012); Badger et al. (2013); Greenop et al. (2014); Martínez-Botí et al. (2015a); Chalk et al. (2017); Dyez et al. (2018); Sosdian et al. (2018); Greenop et al. (2019); de la Vega et al. (2020). In black are published estimates from ice core data (circles – Yan et al., 2019).
The warmth and local pCO2 maxima of the mPWP (mid-Pliocene Warm Period) was followed by a strong decrease in temperature in upwelling and high-latitude regions from 3.3 to 2.7 Ma, coincident with glacial intensification in the Northern Hemisphere. This climate transition was hypothesized to be driven by the closure of the Panama seaway the opening of the high latitudes and subsequent modifications of oceanic circulation (Haug and Tiedemann, 1998). However, modeling from Lunt et al. (2008) supports an additional major role for CO2 in the glaciation. pCO2 thresholds have been proposed to explain the intensification of Northern Hemisphere Glaciation, with values proposed ranging from 280 ppm (DeConto et al., 2008) to 200–400 ppm (Koenig et al., 2011).
The pCO2 concentrations that we calculate indicate a reduction to 350 ppm by 2.7 Ma, ∼280 ppm by 2.6 Ma, and ∼210 ppm by 2.4 Ma, in several steps. These results support roughly a halving of CO2 values when compared to values of ∼530 ppm at 3.3 Ma. These values are consistent with the pCO2 thresholds proposed by both DeConto et al. (2008) and Koenig et al. (2011) for the intensification of Northern Hemisphere glaciation and the low atmospheric CO2 (280 ppmv) scenario from Lunt et al. (2008). SSTs decline from 30 to 26 ∘C, supporting an Earth-system sensitivity of ∼4 ∘C and doubling of CO2 over this range, although given uncertainties, higher values of ∼6 ∘C and doubling of CO2 that have recently been proposed (Tierney et al., 2020) cannot be excluded.
We speculate that at 4.42, 3.45 and 2.67 Ma, it is possible that the declines in CO2 and ice growth, associated with Pliocene glacial intensification, in turn drove substantial changes in pole-to-Equator temperature gradients and winds, that in turn may have impacted iron cycling (Watson et al., 2000; Robinson et al., 2005; Martínez-Garcia et al., 2011), stratification (Toggweiler, 1999; Sigman et al., 2010) and other feedbacks that impact the amplitude of glacial–interglacial cycles and have been implicated as factors that could have contributed to Pliocene glacial intensification. Specifically, as the mean climate state of the planet became cooler, and glacial–interglacial cycles became larger in amplitude, enhanced windiness and dust transport and upwelling during glacials (Martínez-Botí et al., 2015b) may have enhanced iron fertilization and subsequent carbon export (Martínez-Garcia et al., 2011). While data resolution is limited, we speculate this could explain why glacial–interglacial amplitudes in WEP pCO2 values decrease from the mPWP towards the Pleistocene, whereas variations in δ18O are increasing – a speculation that could be tested with increased data resolution.
3.5.3 Pleistocene
During the Pleistocene (2.58–0.01 Ma), the climate system experienced a transition in glacial–interglacial (G/IG) variability from low-amplitude, higher-frequency and obliquity-dominated oscillations (i.e., ∼41 kyr) of the late Pliocene to the high-amplitude, lower-frequency (∼100 kyr) cycles of the last 800 kyr. This transition is termed the Middle Pleistocene Transition (1.2–0.8 Ma – MPT). Questions have been raised about the role of atmospheric CO2 during this transition, including using boron-based proxies (Hönisch et al., 2009; Tripati et al., 2011; Chalk et al., 2017). Previous boron isotope studies for ODP Sites 668 and 999 in the tropical Atlantic Ocean have suggested that a decline in atmospheric CO2 did occur during glacial periods in the MPT, but not during interglacials (Hönisch et al., 2009; Chalk et al., 2017; Dyez et al., 2018).
Our pCO2 concentrations for Sites 806/807 reported here are in good agreement with those determined from ice cores from the early Pleistocene (Yan et al., 2019, Figs. 9 and 10), and with the boron-derived pCO2 from a recent compilation (Rae et al., 2021). Results for the MPT are broadly in the range of values reported by Hönisch et al. (2009) and Chalk et al. (2017). Although our data are relatively limited, we note they have greater resolution for the middle and later part of the transition than prior publications that have drawn conclusions about the MPT (Hönisch et al., 2009; Chalk et al., 2017; Dyez et al., 2018) (Fig. 10d), and therefore we explore their implications.
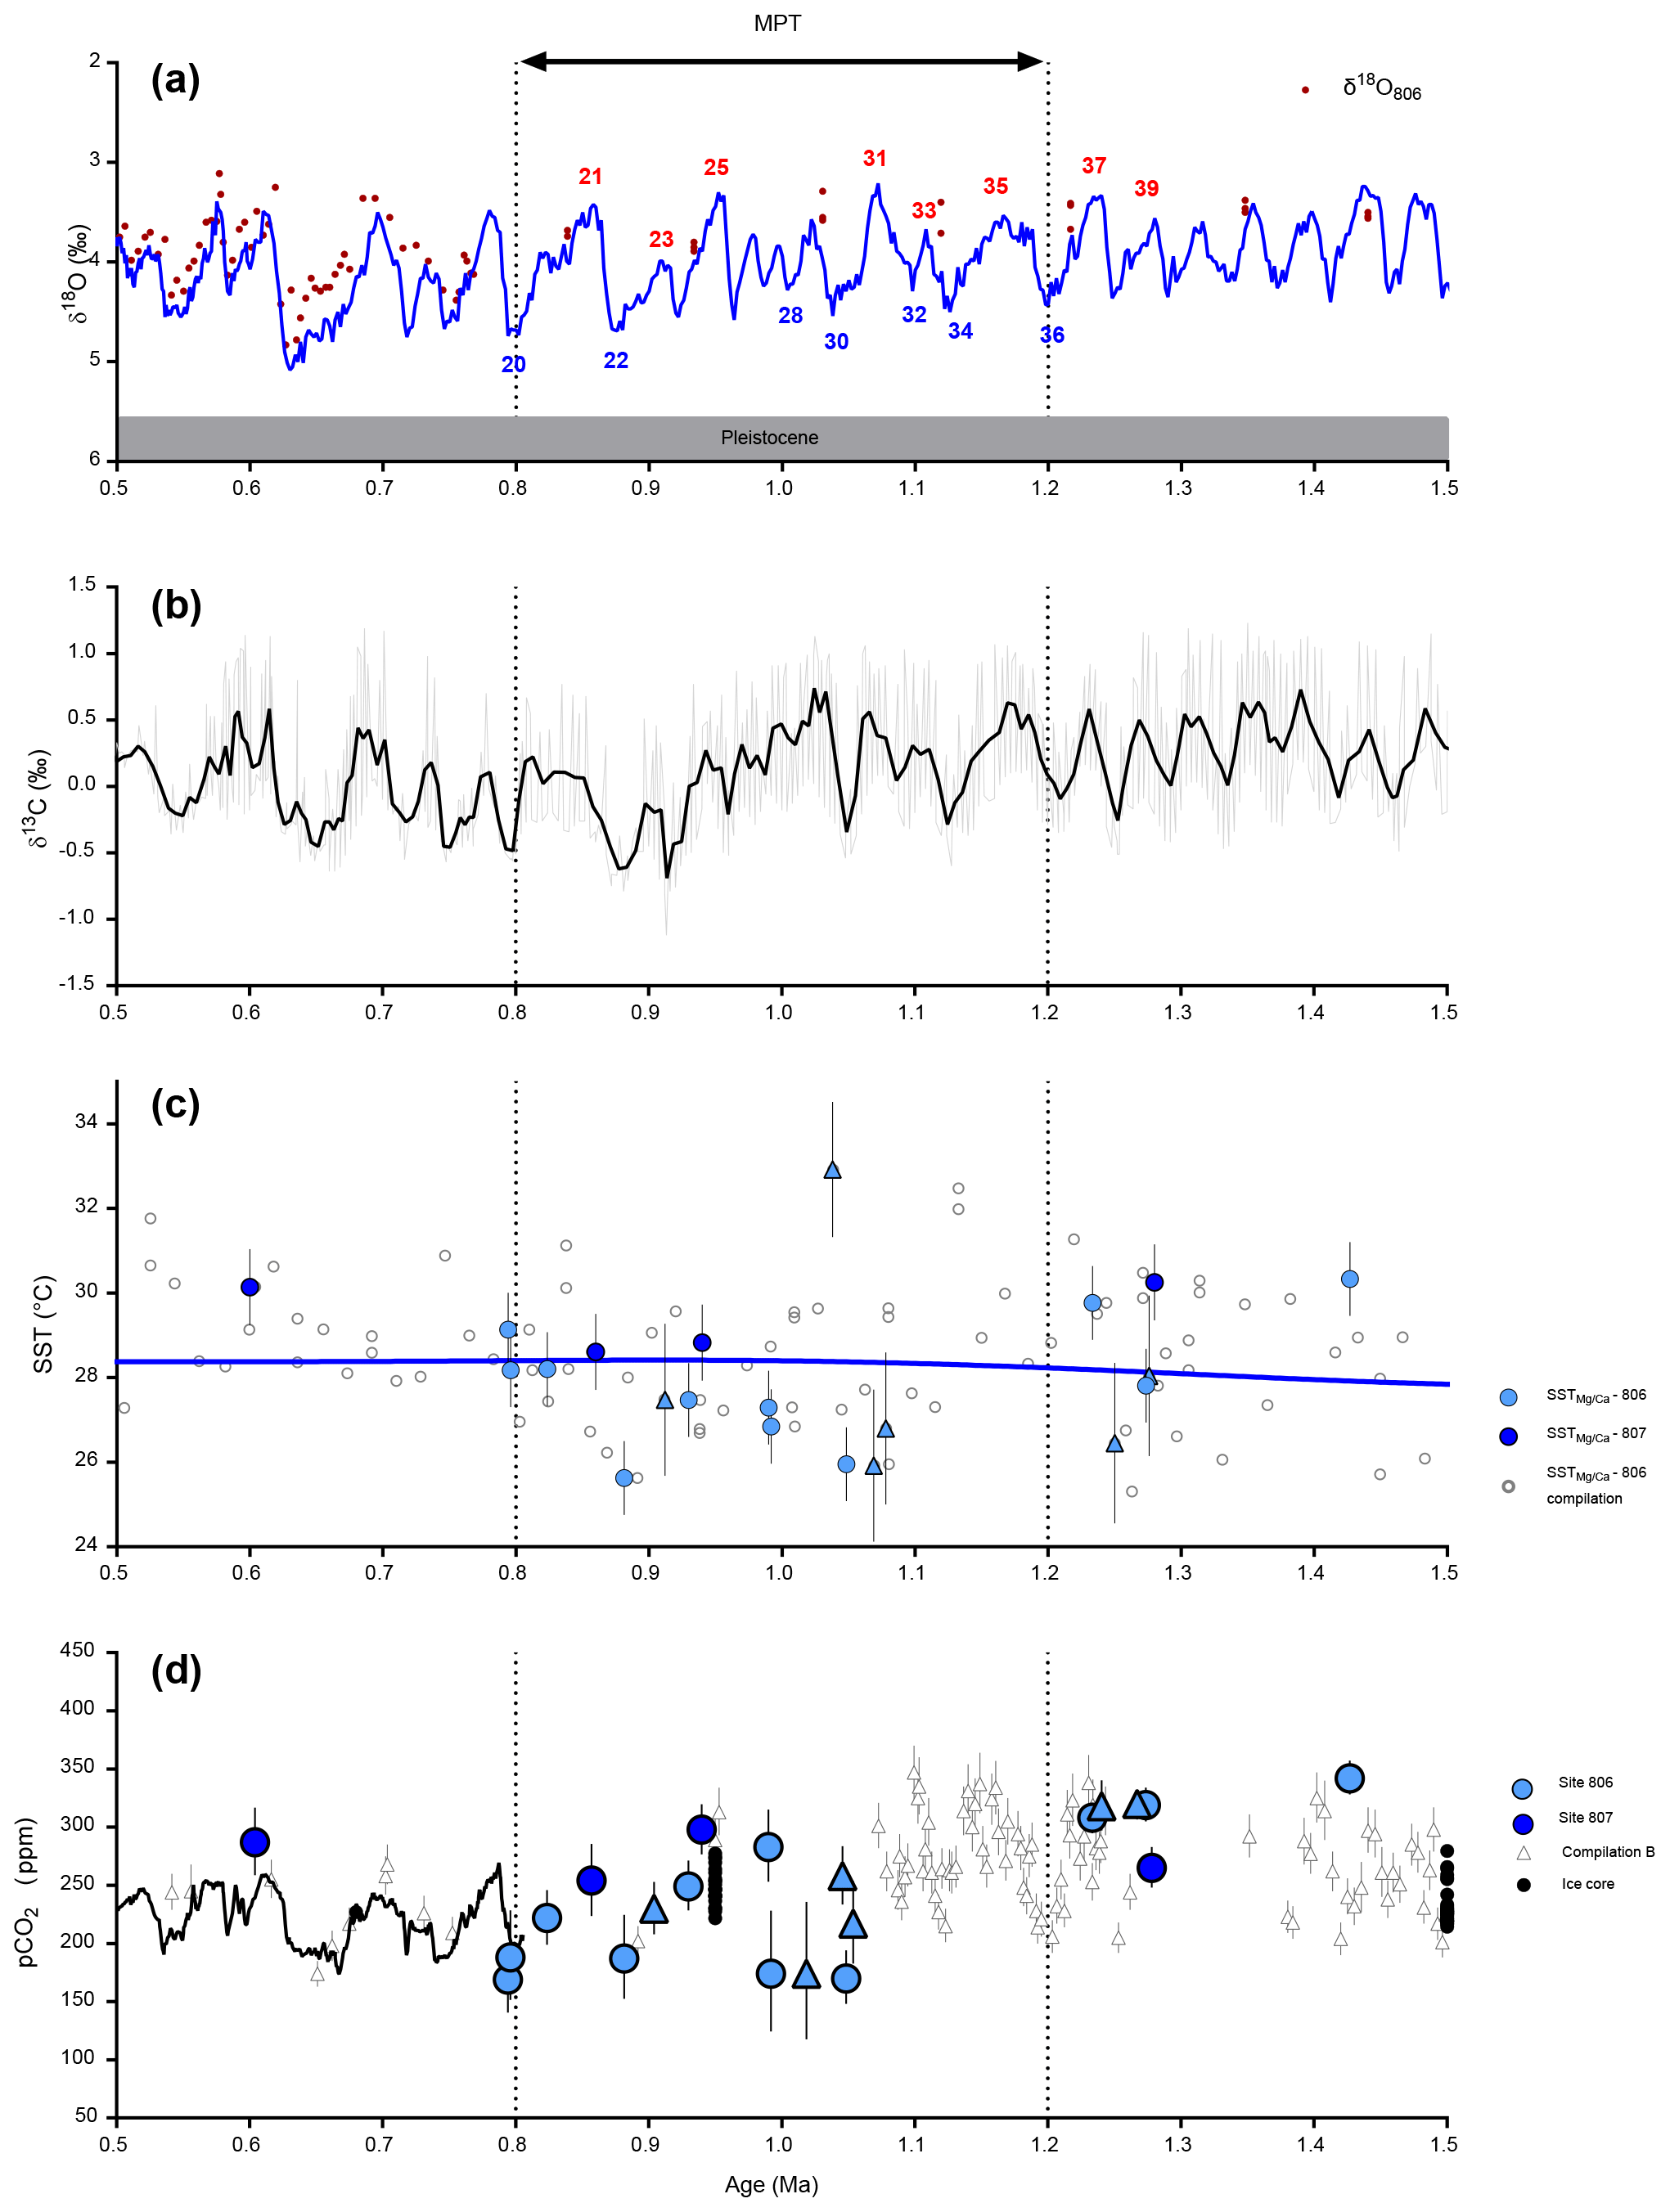
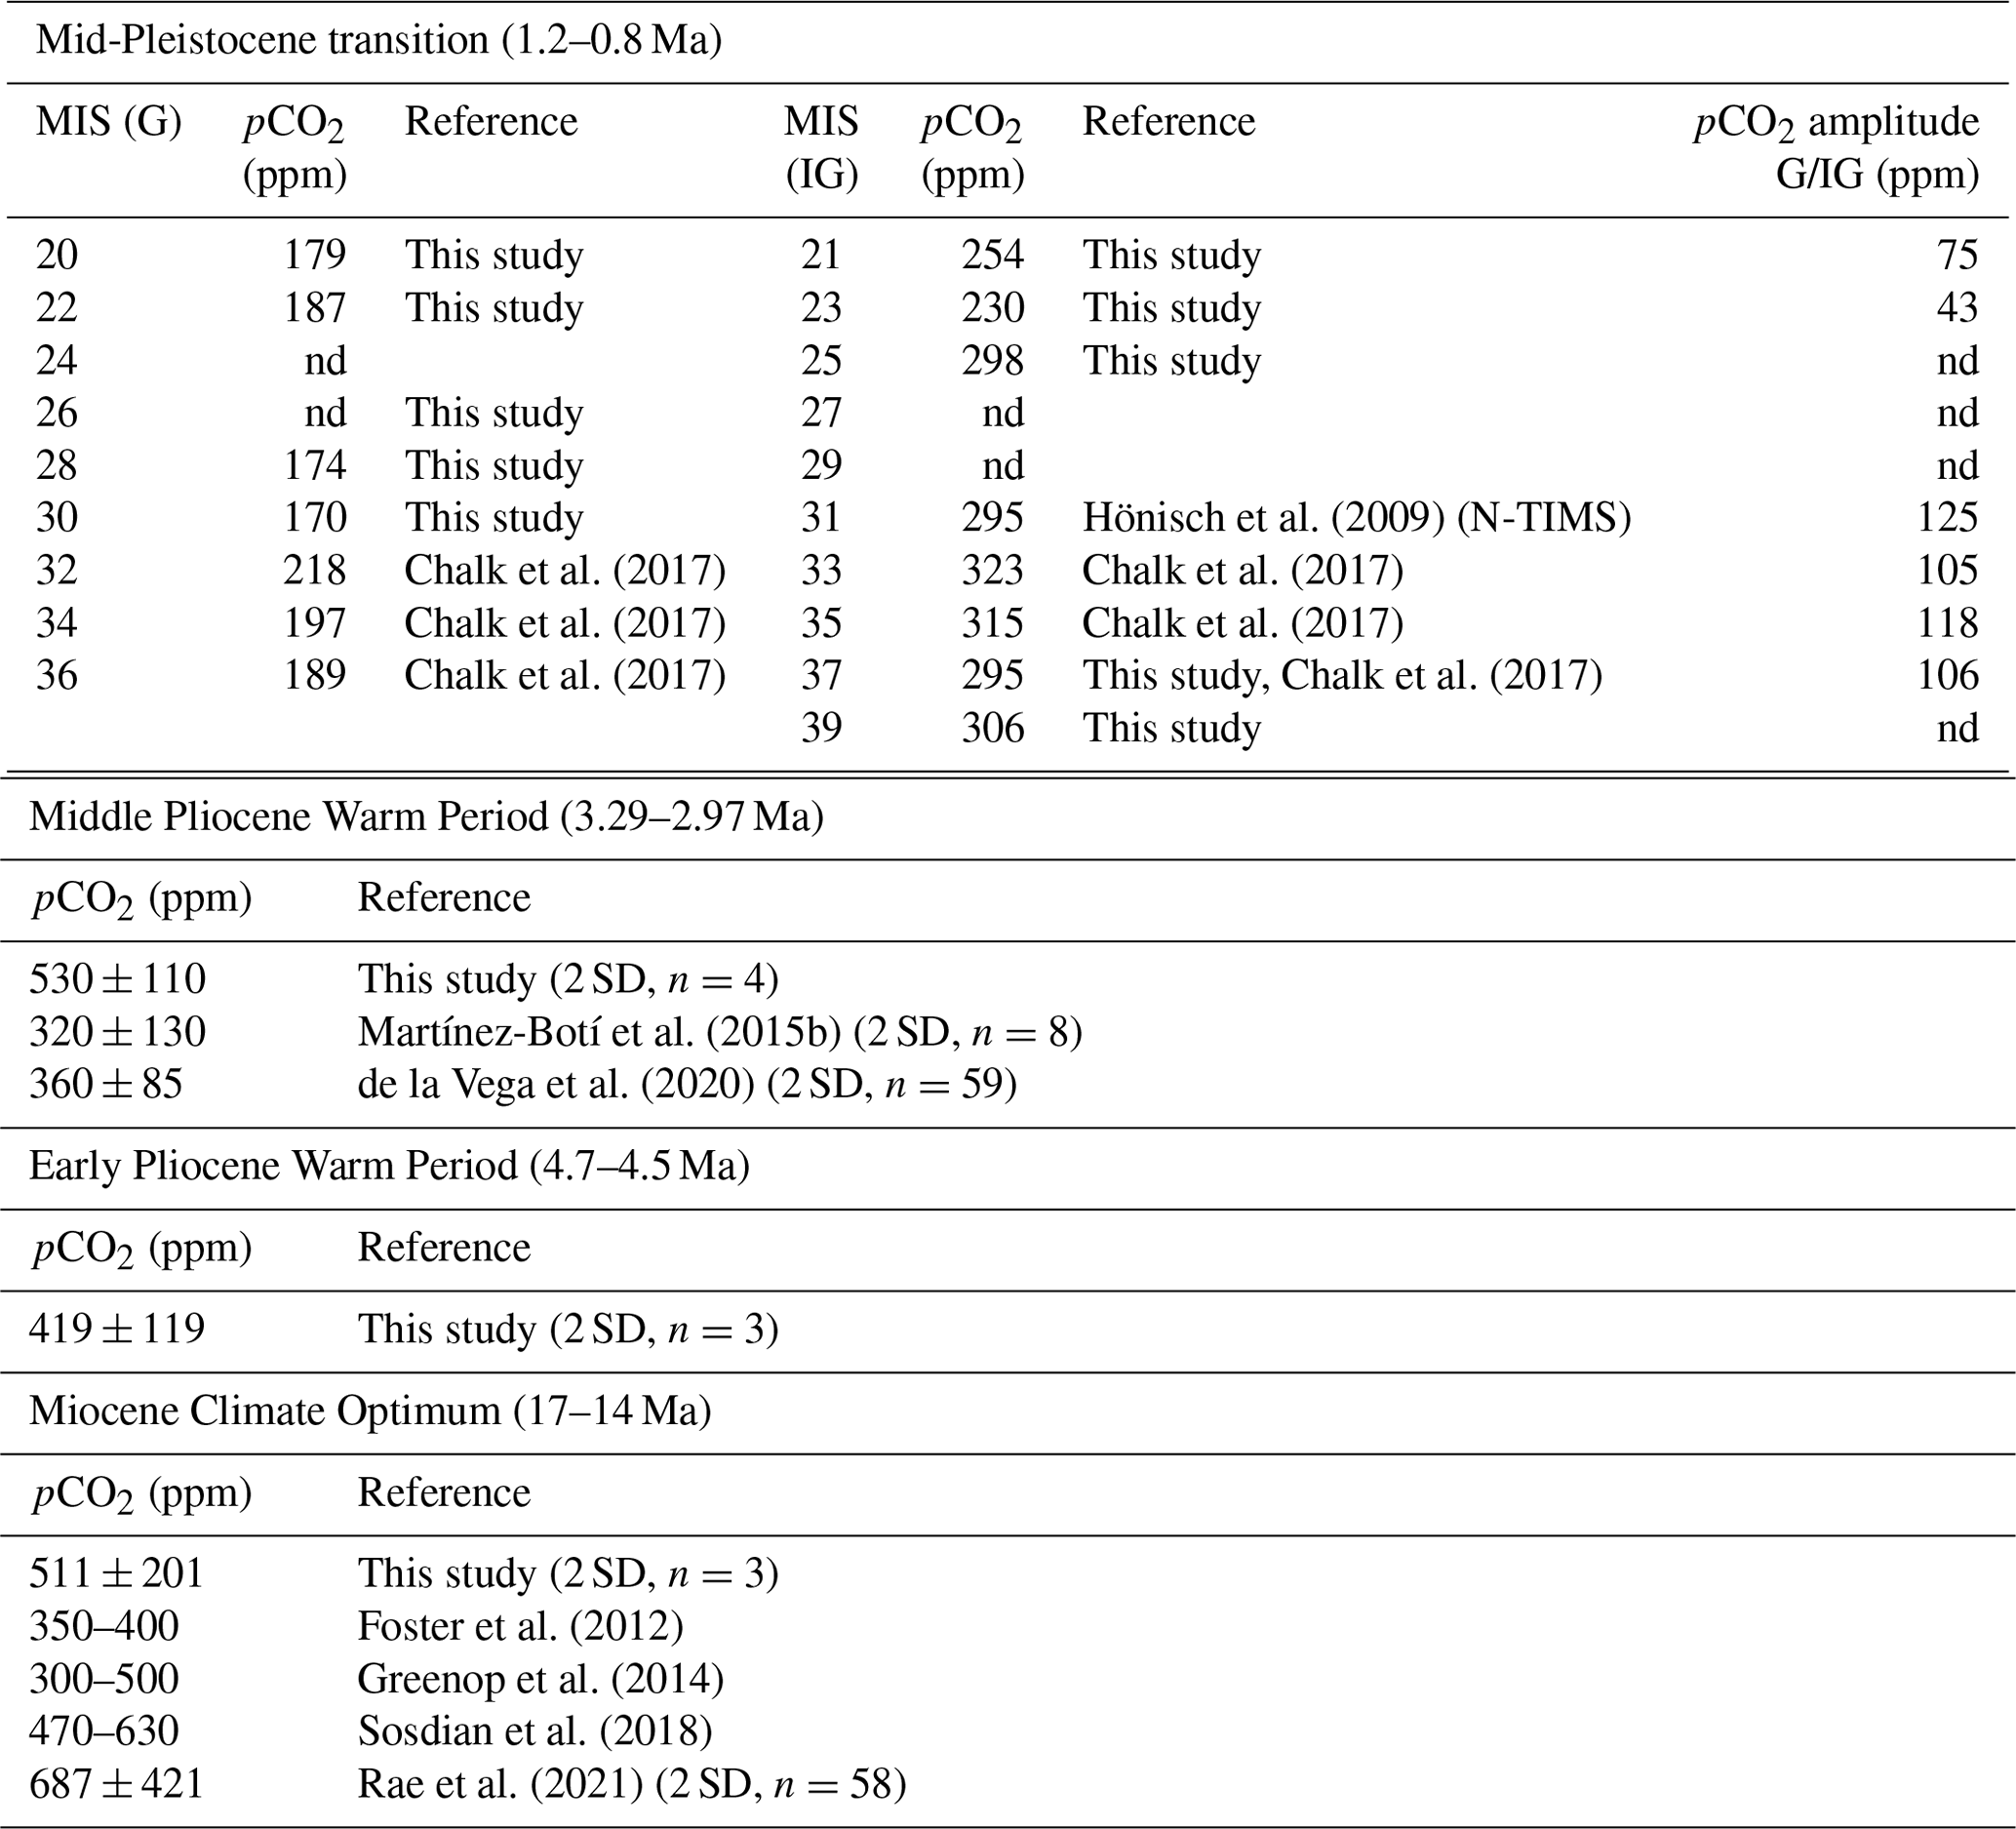
Figure 10Proxy data from 1.5 to 0.5 million years, including the Middle Pleistocene Transition (MPT), in the Western Equatorial Pacific compared to benthic oxygen isotope data. (a) Benthic δ18O (blue line – stack from Lisiecki and Raymo, 2005). (b) Benthic δ13C (black line – compilation from Zachos et al., 2008). (c)–(d) Color indicates the site (filled light blue = 806, filled dark blue = 807), symbols represent the species (circle = T. sacculifer and triangle = G. ruber), filled grey squares (compilation A) are recalculated data based on Sosdian et al. (2018) at site 872. (c) SST reconstructed at ODP Sites 806 and 807 using ratios (see Supplement for reconstruction details), open symbols are reconstructed temperatures based on literature at site 806 (see text or Fig. 4). (d) Reconstructed pCO2 (ppm) from this study (blue symbols) using boron-based pH and alkalinity from Caves et al. (2016). Propagated uncertainties are given by Eq. (S17). In black are published estimates from ice core data (line – Bereiter et al., 2015; black circles – Yan et al., 2019). Open triangles (compilation B) are from the compilation by Rae et al. (2021). Data for compilation B are from Foster (2008); Hönisch and Hemming (2009); Seki et al. (2010); Foster et al. (2012); Badger et al. (2013); Greenop et al. (2014); Martínez-Botí et al. (2015a); Chalk et al. (2017); Dyez et al. (2018); Sosdian et al. (2018); Greenop et al. (2019); de la Vega et al. (2020).
Taken alone, or when combined with the published data from Chalk et al. (2017) (that are also based on MC-ICP-MS), our results support a possible reduction of both glacial and interglacial pCO2 values. We also find evidence that during the MPT, glacial pCO2 declined rapidly from 189 ± 30 ppm at MIS 36 (Chalk et al., 2017) to reach a minimum of 170 () ppm during MIS 30. We note that pCO2 concentrations are within error when uncertainty is fully propagated and then remained relatively stable until the end of the MPT, whereas interglacial pCO2 values decrease gradually to reach post-MPT values.
In our record for the last 16 Myr, the lowest pCO2 is recorded at MIS 30 during the MPT, with values of 164 () ppm, which supports an atmospheric CO2 threshold that leads to large sheet generation. During this transition, the pCO2 threshold needed to build sufficiently large ice sheets that were able to survive the critical orbital phase of rising obliquity to ultimately switch to a 100 kyr world was likely reached at MIS 30, but a higher pCO2 resolution of the MPT is needed for confirmation. The multiple feedbacks resulting from stable ice sheets (iron fertilization, productivity, changes in albedo, changes in deep water formation) might have sustained larger mean global ice volumes over the subsequent 800 kyr. An asymmetrical decrease between pCO2 values during interglacials relative to glacials, with glacials exhibiting the largest change across the MPT, would have led to increased sequestration of carbon during glacials in the 100 kyr world, as discussed by Chalk et al. (2017), with increased glacial dust input and iron fertilization.
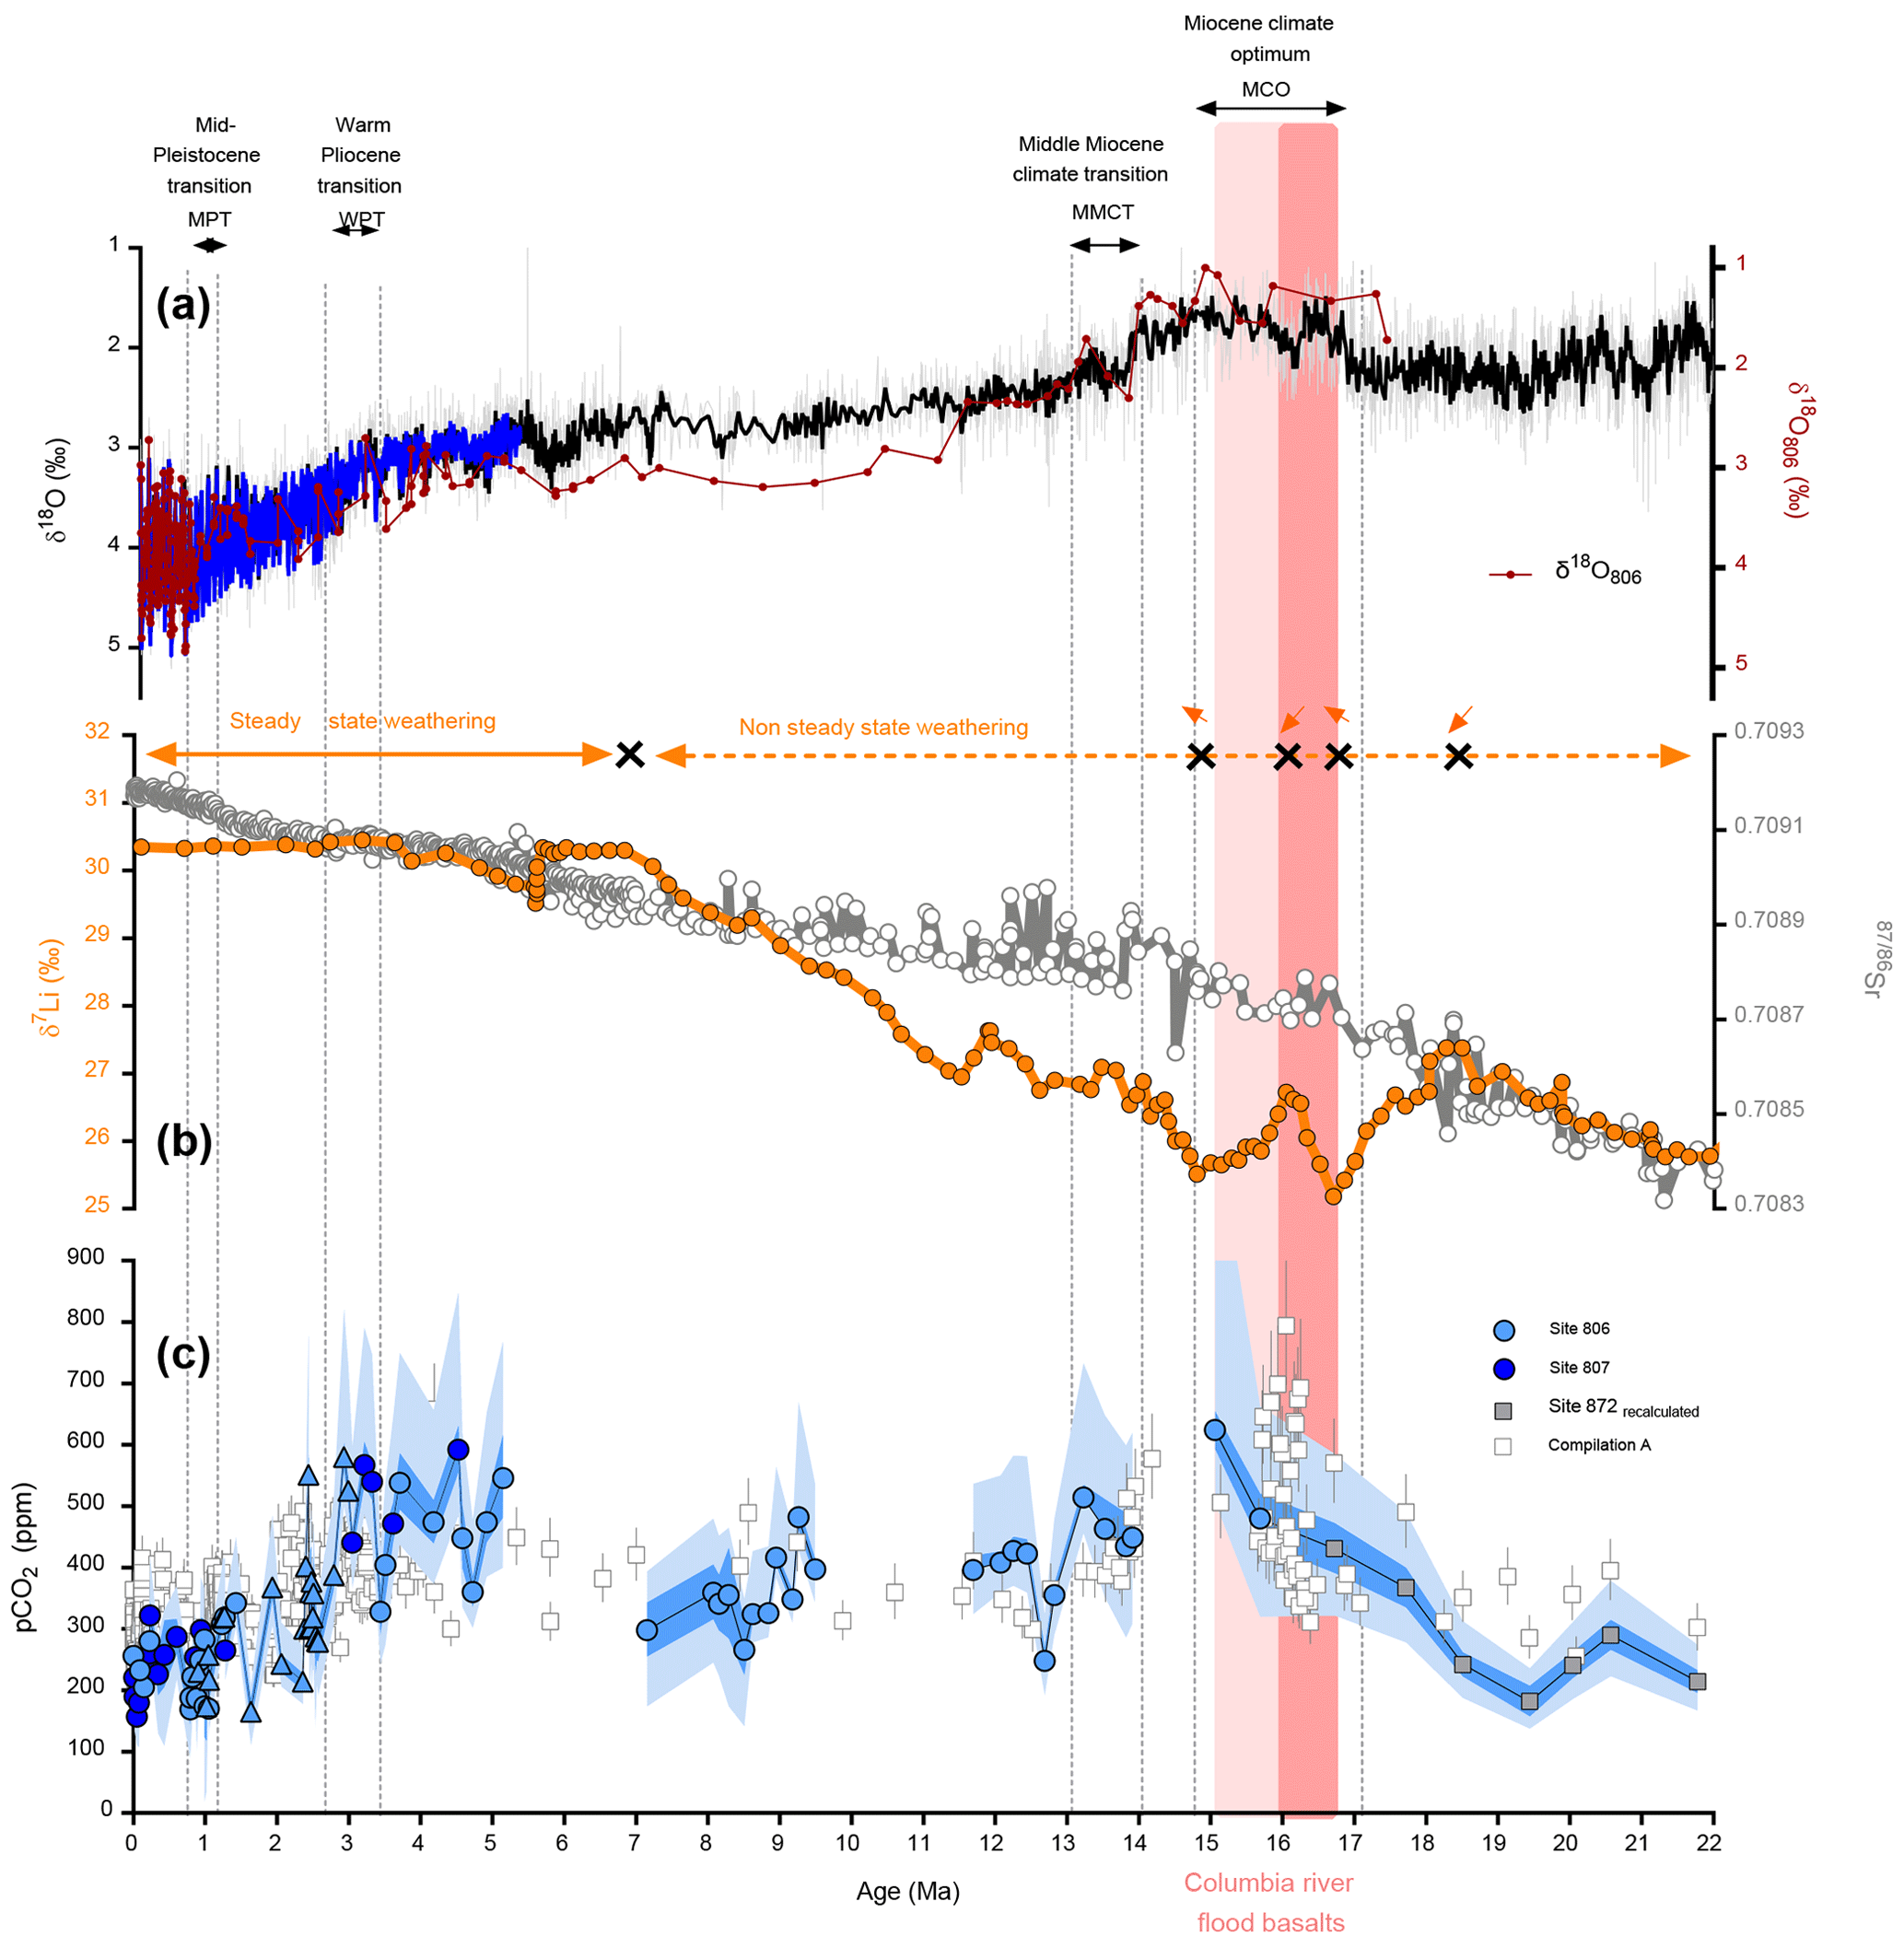
Figure 11Proxy data from 1.5 to 0.5 million years, including the Middle Pleistocene Transition (MPT), in the Western Equatorial Pacific compared to benthic oxygen isotope composites. (a) Benthic δ18O (blue line – compilation from Lisiecki and Raymo, 2005, black line – compilation from Zachos et al., 2008). (b) Records from lithium isotopes (δ7Li, orange, Misra and Froelich, 2012) and strontium isotopes (Sr, grey, Hodell and Warnke, 1991; Farrel et al., 1995; Martin et al., 1999; Martin and Scher, 2004), both proxies for silicate weathering. Orange arrows represent the different weathering regimes as indicated by the δ7Li, black crosses indicates when changes in weathering regime occur. (c) Reconstructed pCO2 (ppm) using boron-based pH and alkalinity from Caves et al. (2016), color indicates the site (filled light blue = 806, filled dark blue = 807), symbols represent the species (circle = T. sacculifer and triangle = G. ruber), filled grey squares (compilation A) are recalculated data based on Sosdian et al. (2018) at site 872. Data for compilation A are from Hönisch and Hemming (2009); Seki et al. (2010); Foster et al. (2012); Badger et al. (2013); Greenop et al. (2014); Martínez-Botí et al. (2015a); Chalk et al. (2017); Sosdian et al. (2018). Propagated uncertainties are given by Eq. (S17) for the dark blue envelope, while the light blue envelope are the uncertainties calculated based on Eq. (S16) (taking into account uncertainty on δ11Bseawater). Also shown is the timing of major events. The rose band and dark rose band indicate the eruption of the Columbia River flood basalts (Hooper et al., 2002) and time of maximum eruption (Kasbohm and Schoene, 2018), respectively.
3.6 Changes in volcanic activity and silicate weathering, and long-term pCO2
On million-year timescales, atmospheric CO2 is controlled by its input through mantle degassing in the form of sub-aerial and sub-aqueous volcanic activity and its removal by chemical weathering of continental silicate rocks. Over the last 16 Myr, two relative maxima in atmospheric pCO2 are observed in our record, one during the MCO (at 15.67 Ma) and a second around the late Miocene–early Pliocene (beginning at 4.7 and 4.5 Ma) (Fig. 11), though the timing for the latter is not precise. The strong pCO2 increase from the early Miocene to MCO occurs when there is increasing volcanic activity associated with the eruption of the Columbia River Flood Basalts (Hooper et al., 2002; Foster al., 2012; Kasbohm and Schoene, 2018), with recent geochronological evidence published supporting higher eruption activity between 16.7 and 15.9 Ma (Kasbohm and Schoene, 2018), reinforcing the idea of an episodic pCO2 increase during the MCO due to volcanic activity. Underestimation of net CO2 outgassing from specific continental flood basalt eruption is possible, as both sub-aqueous and sub-aerial flood basalts, under right climatic conditions, are prone to enhanced chemical weathering. For example, the 4 ‰–5 ‰ drop in δ7Li record at the Cretaceous–Paleogene (K-Pg) boundary (Misra and Froelich, 2012) is attributed to rapid quasi-congruent weathering of the Deccan Traps (Renne et al., 2015) during their eruption. Courtillot and Renne (2003) estimate that about 50 % of emitted CO2, roughly equivalent to the amount emitted by the eruption of a million cubic kilometers of Deccan Traps, may be missing due to chemical and physical weathering. Additionally, the early Eocene (at ∼50 Ma) 3 ‰–4 ‰ rise in seawater δ7Li at a time where there is not significant uplift of the Himalayas (Misra and Froelich, 2012) is also attributed to incongruent weathering of previously erupted Deccan Trap basalts as the Indian subcontinent moved from arid mid-latitudes to the wet low latitudes (Kent and Muttoni, 2008). Thus, a significant part of the outgassed CO2 can be consumed by chemical weathering of freshly erupted hot basalts (Courtillot and Renne, 2003). However, the congruency of chemical weathering of basalts, depending on regional climatic conditions (warm–wet vs. cold–arid), will determine the shape and position of inflection points in the seawater δ7Li record. The possible quantification of increased rates of silicate weathering inferred from δ7Li (mentioned below) can be utilized to determine total eruptive volume (missing + existing) and volatile emissions from the Columbia River Flood Basalts. At the same time as continental flood basalt emissions, enhanced seafloor production could also be a second possible source of CO2; however, we note there is evidence that the rate of seafloor production has remained virtually invariant over the last 60 million years (Rowley, 2002; Müller et al., 2016).
The second CO2 peak can possibly be caused either by the observed increase in global volcanism during the early–middle Pliocene (Kennett and Thunell, 1977) and/or by a change in silicate weathering regime. Strontium and lithium isotopes (Sr and δ7Li) have been used as proxies for silicate weathering flux and congruency. Although the strontium isotope record exhibits a monotonous increase, lithium isotope data (Misra and Froelich, 2012) are more variable, with a transition from a period of increasing seawater δ7Li (e.g., non-steady state weathering) to stable seawater δ7Li (e.g., steady state weathering) beginning at roughly 6.8 Ma (Fig. 11).
It is interesting to note that the rise in δ7Li (Fig. 11b) from the early Miocene to the MCO is synchronous with the rise in pCO2. Before 18.5 Ma, the pCO2 is relatively stable, and δ7Li is increasing, suggesting the non-steady-state and incongruent nature of continental chemical weathering. From 18.6 to 16.7 Ma, the δ7Li record decreases by ∼2 ‰, consistent with decreasing weathering rates and an associated increase in pCO2. Between 16.7 and 15.9 Ma, when the eruption of the Columbia River Flood Basalts is at a maximum, δ7Li increases, in line with higher weathering rates that could arise from higher atmospheric CO2 and the presence of fresh basalts. The δ7Li record then decreases again until the end of the MCO at ∼14.7 Ma, in line with a decrease in the eruption rate, sustaining high atmospheric CO2. A constant increase in δ7Li is then observed, until the early Pliocene, where there is evidence for a shift to a steady-state weathering regime. This increase in δ7Li is also consistent with the decrease in pCO2 observed until the early Pliocene.
3.7 Conclusions
We developed a reconstruction of atmospheric pCO2 based on δ11B of planktic foraminifera from ODP Sites 806 and 807 located in the Western Equatorial Pacific for the past 16 million years and extended the record to 22 Ma by reprocessing data from Site 872 (Sosdian et al., 2018). We build on past efforts to reconstruct atmospheric pCO2 using different proxies from this region, including from carbon isotopes in marine organic matter (Rayno and Horowitz, 1996) and alkenones (Pagani et al., 2010), as well as foraminiferal ratios (Tripati et al., 2009, 2011), all of which have been shown to have a number of complexities and potential sources of systematic error (e.g., Tripati et al., 2011). It also builds on efforts to use boron isotopes in other regions using MC-ICP-MS (Seki et al., 2010; Foster et al., 2012, 2014; Greenop et al., 2014; Martínez-Botí et al., 2015b; Stap et al., 2016; Chalk et al., 2017; Dyez et al., 2018; de la Vega et al., 2020), and our recent work constraining fractionation factors and measuring small samples of foraminifera (Guillermic et al., 2020).
Our study contributes a new long-term reconstruction of atmospheric pCO2 for the Neogene derived from boron isotopes from the tropical Pacific Ocean. Although the record is not continuous, with variable resolution, it captures both long-term and short-term variability associated with several key transitions and demonstrates the utility of examining sites in the Western Equatorial Pacific for future higher-resolution studies. Results for Sites 806 and 807 in the Western Equatorial Pacific reproduce the amplitude of late Pleistocene glacial–interglacial cycles in pCO2. These observations are consistent with the sites being in equilibrium with the atmosphere, although further work would be useful to explore sources of uncertainty and differences relative to ice core pCO2.
pCO2 values increase from the early Miocene to the MCO with estimated MCO pCO2 values of 511 ± 201 ppm (2 SD, n=3). These elevated values are potentially linked to the eruption of the Columbia River Flood Basalts, with values declining into the early Pliocene, including during Pliocene glacial intensification. The changes in pCO2 we observed are in line with changes in δ7Li, a proxy of silicate weathering, and future modeling of multiple proxy records should be insightful. Early Pliocene data for ∼4.7–4.5 Ma support high pCO2 of 419 ± 119 ppm, and elevated values during the mid-Pliocene Warm Period of 530 ± 110 ppm for the time interval ∼3.3–3.0 Ma. These data are low in resolution, thereby not fully sampling orbital and millennial-scale variability. The higher-resolution record for the Pliocene glacial intensification supports a reduction in pCO2 during several steps, with values at 2.7 Ma of 350 ppm, 2.6 Ma of ∼ 280 ppm and 2.4 Ma of ∼210 ppm. We find support for a larger reduction in glacial pCO2 during the Mid-Pleistocene Transition compared to interglacial pCO2, and a minimum in pCO2 during glacial MIS 30. These findings confirm a role for CO2 in the transition from a 41 to a 100 kyr world.
Higher-resolution boron isotope records from the WEP would allow for further resolution of these changes. Additional constraints on temperature, such as from clumped isotopes (Tripati et al., 2010) in the WEP (Tripati et al., 2014), could allow for uncertainties in pCO2 estimates from boron isotopes to be reduced and for new constraints on Earth climate sensitivity. Future constraints on the vertical structure of the tropical Pacific (Shankle et al., 2021) during these transitions may also potentially be illuminating.
All data are available in the Supplement. Reconstructed climate parameters and proxy data will be archived at the NOAA's NCEI World Data Service for Paleoclimatology on acceptance at https://www.ncei.noaa.gov/products/paleoclimatology (NOAA, 2021).
The supplement related to this article is available online at: https://doi.org/10.5194/cp-18-183-2022-supplement.
AT developed the project and wrote the proposals that funded the work. All authors contributed to the experimental design. MG performed the measurements with assistance from SM. MG conducted data analysis with input from AT. MG drafted the paper, which was edited by all authors. Interpretation was led by MG and AT, with input from SM and RE.
The contact author has declared that neither they nor their co-authors have any competing interests
Publisher’s note: Copernicus Publications remains neutral with regard to jurisdictional claims in published maps and institutional affiliations.
The authors wish to thank the Tripati Lab, including Lea Bonnin and Alexandra Villa, for assistance with picking samples; the IODP core repository for provision of samples; Mervyn Greaves for technical support and use of laboratory space at the University of Cambridge; and Yoan Germain, Emmanuel Ponzevera, Céline Liorzou and Oanez Lebeau for technical support and use of laboratory space at IUEM and Ifremer (Plouzané, France). We thank Thomas Chalk, another anonymous reviewer and Hubertus Fischer for their helpful comments on the paper, and Mathis Hain for discussion of this work.
This research has been supported by the Department of Energy, Labor and Economic Growth (DOE BES grant no. DE-FG02-13ER16402 to Aradhna Tripati), the International Research Chair Program that is funded by the French government (LabexMer ANR-10-LABX-19-01 to Aradhna Tripati and Robert Eagle), and IAGC student research grant 2017.
This paper was edited by Hubertus Fischer and reviewed by Thomas Chalk and one anonymous referee.
Aggarwal, S. K., and You, C. F.: A review on the determination of isotope ratios of boron with mass spectrometry, Mass Spectrom. Rev., 36, 499–519, 2017.
Allen, K. A. and Hönisch, B.: The planktic foraminiferal proxy for seawater carbonate chemistry, A critical evaluation, Earth Planet. Sc. Lett., 345–348, 203–211, 2012.
Allen, K. A., Hönisch, B., Eggins, S. M., Yu, J., Spero, H. J., and Elderfield, H.: Controls on boron incorporation in cultured tests of the planktic foraminifer Orbulina universa, Earth Planet. Sc. Lett., 309, 291–301, 2011.
Babila, T., Huang, K. F., Rosenthal, Y., Conte, M. H., and Lin, H. L.: Development of as a seawater pH proxy using sediment trap time series, abstract, available at: https://acswebcontent.acs.org/prfar/2010/nugget/11019/11019.pdf (last access: 10 December 2021), 2010.
Badger, M. P. S., Lear, C. H., Pancost, R. D., Foster, G. L., Bailey, T. R., Leng, M. J., and Abels, H. A.: CO2 drawdown following the middle Miocene expansion of the Antarctic Ice Sheet, Paleoceanography, 28, 42–53, 2013.
Badger, M. P. S., Chalk, T. B., Foster, G. L., Bown, P. R., Gibbs, S. J., Sexton, P. F., Schmidt, D. N., Pälike, H., Mackensen, A., and Pancost, R. D.: Insensitivity of alkenone carbon isotopes to atmospheric CO2 at low to moderate CO2 levels, Clim. Past, 15, 539–554, https://doi.org/10.5194/cp-15-539-2019, 2019.
Barker, S., Greaves, M., and Elderfield, H.: A study of cleaning procedures used for foraminiferal paleothermometry, Geochem. Geophy. Geosy., 4, 8407, https://doi.org/10.1029/2003GC000559, 2003.
Bartoli, G., Hönisch, B., and Zeebe, R. E.: Atmospheric CO2 decline during the Pliocene intensification of Northern Hemisphere glaciations, Paleoceanography, 26, PA4213, https://doi.org/10.1029/2010PA002055, 2011.
Bereiter, B., Eggleston, S., Schmitt, J., Nehrbass-Ahles, C., Stocker, T. F., Fischer, H., Kipfstuhl, S., and Chappellaz, J.: Revision of the EPICA Dome C CO2 record from 800 to 600 kyr before present, Geophys. Res. Lett., 42, 542–549, https://doi.org/10.1002/2014GL061957, 2015.
Berger, W. H., Kroenke, J. W., and Mayer, L. A.: Scientific Results, Ontong Java Plateau: Proceedings of the Ocean Drilling Program, v. 130, exas A&M University, College Station, Texas, 867 pp., 1993.
Caves, J. K., Jost, A. B., Lau, K. V., and Maher, K.: Cenozoic carbon cycle imbalances and a variable weathering feedback, Earth Planet. Sc. Lett., 450, 152–163, 2016.
Chalk, T. B., Hain, M. P., Foster, G. L., Rohling, E. J., Sexton, P. F., Badger, M. P. S., Cherry, S. G., Hasenfratz, A. P., Haug, G. H., Jaccard, S. L., Martínez-García, A., Pälike, H., Pancost, R. D., and Wilson, P. A.: Causes of ice age intensification across the Mid-Pleistocene Transition, P. Natl. Acad. Sci. USA, 114, 13114–13119, https://doi.org/10.1073/pnas.1702143114, 2017.
Courtillot, V. E. and Renne, P. R.: On the ages of flood basalt events, C. R. Geosci., 335, 113–140, https://doi.org/10.1016/S1631-0713(03)00006-3, 2003.
DeConto, R. M. and Pollard, D.: Rapid Cenozoic glaciation of Antarctica induced by declining atmospheric CO2, Nature, 421, 245–249, 2003.
DeConto, R. M., Pollard, D., Wilson, P. A., Pälike, H., Lear, C. H., and Pagani, M.: Thresholds for Cenozoic bipolar glaciation, Nature, 455, 652–656, 2008.
de la Vega, E., Chalk, T. B., Wilson, P. A., Bysani, R. P., and Foster, G. L.: Atmospheric CO2 during the Mid-Piacenzian Warm Period and the M2 glaciation, Sci. Rep., 10, 11002, https://doi.org/10.1038/s41598-020-67154-8, 2020.
Dutton, A., Carlson, A. E., Long, A. J., Milne, G. A., Clark, P. U., DeConto, R., Horton, B. P., Rahmstorf, S., and Raymo, M. E.: Sea-level rise due to polar ice-sheet mass loss during past warm periods, Science, 349, aaa4019, https://doi.org/10.1126/science.aaa4019, 2015.
Dyez, K. A., Hönisch, B., and Schmidt, G. A.: Early Pleistocene obliquity-scale pCO2 variability at ∼1.5 million years ago, Paleoceanography and Paleoclimatology, 33, 1270–1291, 2018.
Farmer, J. R., Hönisch, B., and Uchikawa, J.: Single laboratory comparison of MC-ICP-MS and N-TIMS boron isotope analyses in marine carbonates, Chem. Geol., 447, 173–182, 2016.
Farrell, J. W., Raffi, I., Janecek, T., Murray, D. W., Levitan, M., Dadey, K. A., Emeis, K. C., Lyle, M., Flores, J. A., and Hovan, S: Late Neogene sedimentation patterns in the eastern Equatorial Pacific Ocean, in: Proceedings of the Ocean Drilling Program, edited by: Pisias, N. G., Mayer, L. A., Janecek, T. R., Palmer-Julson, A., and van Andel, T. H., Scientific Results, vol. 138, Ocean Drilling Program, College Station, TX, 5–24, 1995.
Flower, B. P., and Kennett, J. P.: Middle Miocene ocean-climate transition: High-resolution oxygen and carbon isotopic records from Deep Sea Drilling Project Site 588A, southwest Pacific, Paleoceanography, 8, 811–843, 1993.
Flower, B. P. and Kennett, J. P.: The middle Miocene climatic transition: East Antarctic ice sheet development, deep ocean circulation and global carbon cycling, Palaeogeogr. Palaeoclimatol. Palaeoecol., 108, 537–555, 1994.
Flower, B. P. and Kennett, J. P.: Middle Miocene deepwater paleoceanography in the southwest Pacific: relations with East Antarctic Ice Sheet development, Paleoceanography, 10, 1095–1112, https://doi.org/10.1029/95PA02022, 1995.
Foster, G. L.: Seawater pH, pCO2 and [CO] variations in the Caribbean Sea over the last 130 kyr: A boron isotope and study of planktic foraminifera, Earth Planet. Sc. Lett., 271, 254–266, 2008.
Foster, G. L. and Rohling, E. J.: Relationship between sea level and climate forcing by CO2 on geological timescales, P. Natl. Acad. Sci. USA, 110, 1209–1214, 2013.
Foster, G. L. and Sexton, P. F.: Enhanced carbon dioxide outgassing from the eastern equatorial Atlantic during the last glacial, Geology, 42, 1003–1006, 2014.
Foster, G. L., Lear, C. H., and Rae, J. W. B.: The evolution of pCO2, ice volume and climate during the middle Miocene, Earth Planet. Sc. Lett. 341–344, 243–254, 2012.
Foster, G. L., Hönisch, B., Paris, G., Dwyer, G. S., Rae, J. W., Elliott, T., Gaillardet, J., Hemming, N. G., Louvat, P., and Vengosh, A.: Interlaboratory comparison of boron isotope analyses of boric acid, seawater and marine CaCO3 by MC-ICPMS and NTIMS, Chem. Geol., 358, 1–14, 2013.
Foster, G. L., Royer, D. L., and Lunt, D. J.: Future climate forcing potentially without precedent in the last 420 million years, Nat. Commun., 8, 14845, https://doi.org/10.1038/ncomms14845, 2017.
Gabitov, R. I., Rollion-Bard, C., Tripati, A., and Sadekov, A.: In situ study of boron partitioning between calcite and fluid at different crystal growth rates, Geochim. Cosmochim. Ac., 137, 81–92, 2014.
Gasson, E., DeConto, R. M., Pollard, D., and Levy, R. H.: Dynamic Antarctic ice sheet during the early to mid-Miocene, P. Natl. Acad. Sci. USA, 113, 3459–3464, 2016.
GraphPad Software: GraphPad Prism version 7.00 for Windows, GraphPad Software, La Jolla California USA, available at: http://www.graphpad.com (last access: November 2021), 2022.
Gray, W. R., and Evans, D.: Nonthermal influences on in planktonic foraminifera: a review of culture studies and application to the Last Glacial Maximum, Paleoceanography and Paleoclimatology, 34, 306–315, 2019.
Greenop, R., Foster, G. L., Wilson, P. A., and Lear, C. H.: Middle Miocene climate instability associated with high-amplitude CO2 variability, Paleoceanography, 29, 845–853, 2014.
Greenop, R., Hain, M. P., Sosdian, S. M., Oliver, K. I. C., Goodwin, P., Chalk, T. B., Lear, C. H., Wilson, P. A., and Foster, G. L.: A record of Neogene seawater δ11B reconstructed from paired δ11B analyses on benthic and planktic foraminifera, Clim. Past, 13, 149–170, https://doi.org/10.5194/cp-13-149-2017, 2017.
Greenop, R., Sosdian, S. M., Henehan, M. J., Wilson, P. A., Lear, C. H., and Foster, G. L.: Orbital forcing, ice volume, and CO2 across the Oligocene‐Miocene transition, Paleoceanography and Paleoclimatology, 34, 316–328, 2019.
Guillermic, M., Misra, S., Eagle, R., Villa, A., Chang, F., and Tripati, A.: Seawater pH reconstruction using boron isotopes in multiple planktonic foraminifera species with different depth habitats and their potential to constrain pH and pCO2 gradients, Biogeosciences, 17, 3487–3510, https://doi.org/10.5194/bg-17-3487-2020, 2020.
Gutjahr, M., Bordier, L., Douville, E., Farmer, J., Foster, G. L., Hathorne, E. C., J., Foster, G. L., Hathorne, E., Hönish, B., Lemarchand, D., Louvat, P., McCulloch, M., Noireaux, J., Pallavicini, N., Rodushkin, I., Roux, P., Stewart, J., Thil, F., and You, C. F.: Sub-permil interlaboratory consistency for solution-based boron isotope analyses on marine carbonates, Geostand. Geoanal. Res., 45, 59–75, https://doi.org/10.1111/ggr.12364, 2020.
Hain, M. P., Foster, G. L., and Chalk, T.: Robust constraints on past CO2 climate forcing from the boron isotope proxy, Paleoceanography and Paleoclimatology, 33, 1099–1115, 2018.
Hansen, J., Sato, M., and Ruedy, R.: Perception of climate change, P. Natl. Acad. Sci. USA, 109, E2415–E2423, https://doi.org/10.1073/pnas.1205276109, 2012.
Hansen, J., Sato, M., Russell, G., and Kharecha, P.: Climate sensitivity, sea level and atmospheric carbon dioxide, Philos. T. R. Soc. A, 371, 20120294, https://doi.org/10.1098/rsta.2012.0294, 2013.
Haug, G. H. and Tiedemann, R.: Effect of the formation of the Isthmus of Panama on Atlantic Ocean thermohaline circulation, Nature, 393, 673–676, 1998.
Haywood, A. M., Dowsett, H. J., and Dolan, A. M.: Integrating geological archives and climate models for the mid-Pliocene warm period, Nat. Commun., 7, 10646, https://doi.org/10.1038/ncomms10646, 2016.
Higgins, J. A., Kurbatov, A. V, Spaulding, N. E., Brook, E., Introne, D. S., Chimiak, L. M., Yan, Y., Mayewski, P. A., and Bender, M. L.: Atmospheric composition 1 million years ago from blue ice in the Allan Hills, Antarctica, P. Natl. Acad. Sci. USA, 112, 6887–6891, 2015.
Hodell, D. A. and Warnke, D. A.: Climatic evolution of the Southern Ocean during the Pliocene epoch from 4.8 to 2.6 million years ago, Quaternary Sci. Rev., 10, 205–214, 1991.
Holbourn, A., Kuhnt, W., Schulz, M., Flores, J. A., and Andersen, N.: Orbitally-paced climate evolution during the middle Miocene “Monterey” carbon-isotope excursion, Earth Planet. Sc. Lett., 261, 534–550, 2007.
Holcomb, M., DeCarlo, T. M., Schoepf, V., Dissard, D., Tanaka, K., and McCulloch, M.: Cleaning and pre-treatment procedures for biogenic and synthetic calcium carbonate powders for determination of elemental and boron isotopic compositions, Chem. Geol., 398, 11–21, 2015.
Hönisch, B. and Hemming, N. G.: Ground-truthing the boron isotope-paleo-pH proxy in planktonic foraminifera shells: Partial dissolution and shell size effects, Paleoceanography, 19, PA4010, https://doi.org/10.1029/2004PA001026, 2004.
Hönisch, B., Hemming, N. G., Archer, D., Siddall, M., and McManus, J. F.: Atmospheric carbon dioxide concentration across the mid-pleistocene transition, Science, 324, 1551–1554, 2009.
Hönisch, B., Eggins, S. M., Haynes, L. L., Allen, K. A., Holland, K. D., and Lorbacher, K.: Boron Proxies in Paleoceanography and Paleoclimatology, John Wiley & Sons, https://doi.org/10.1002/9781119010678, 2019.
Hooper, P. R., Binger, G. B., and Lees, K. R.: Ages of the Steens and Columbia River flood basalts and their relationship to extension-related calc-alkalic volcanism in eastern Oregon, Geol. Soc. Am. Bull., 114, 43–50, 2002.
IPCC: Climate Change 2013 – The Physical Science Basis, edited by: Intergovernmental Panel on Climate Change, Ed., Cambridge University Press, Cambridge, UK, ISBN 9781107415324, https://doi.org/10.1017/CBO9781107415324, 2014.
IPCC: Global Warming of 1.5 ∘C. An IPCC Special Report on the impacts of global warming of 1.5 ∘C above pre-industrial levels and related global greenhouse gas emission pathways, in the context of strengthening the global response to the threat of climate change, sustainable development, and efforts to eradicate poverty, edited by: Masson-Delmotte, V., Zhai, P., Pörtner, H.-O., Roberts, D., Skea, J., Shukla, P. R., Pirani, A., Moufouma-Okia, W., Péan, C., Pidcock, R., Connors, S., Matthews, J. B. R., Chen, Y., Zhou, X., Gomis, M. I., Lonnoy, E., Maycock, T., Tignor, M., and Waterfield, T., in press, 2018.
Kasbohm, J. and Schoene, B.: Rapid eruption of the Columbia River flood basalt and correlation with the mid-Miocene climate optimum, Science Advances, 4, eaat8223, https://doi.org/10.1126/sciadv.aat8223, 2018.
Kennett, J. P. and Thunell, R. C.: On explosive Cenozoic volcanism and climatic implications, Science, 196, 1231–1234, 1977.
Kent, D. V. and Muttoni, G.: Equatorial convergence of India and early Cenozoic climate trends, P. Natl. Acad. Sci. USA, 105, 16065–16070, 2008.
Koenig, S. J., DeConto, R. M., and Pollard, D.: Late Pliocene to Pleistocene sensitivity of the Greenland Ice Sheet in response to external forcing and internal feedbacks, Clim. Dynam., 37, 1247–1268, 2011.
Lea, D. W.: The 100 000-yr cycle in tropical SST, greenhouse forcing, and climate sensitivity, J. Climate, 17, 2170–2179, 2004.
Lear, C. H., Rosenthal, Y., and Wright, J. D.: The closing of a seaway: ocean water masses and global climate change, Earth Planet. Sc. Lett., 210, 425–436, 2003.
Lear, C. H., Coxall, H. K., Foster, G. L., Lunt, D. J., Mawbey, E. M., Rosenthal, Y., Sosdian, S. M., Thomas, E., and Wilson, P. A.: Neogene ice volume and ocean temperatures: Insights from infaunal foraminiferal paleothermometry, Paleoceanography, 30, 1437–1454, 2015.
Lemarchand, D., Gaillardet, J., Lewin, E., and Allegre, C. J.: Boron isotope systematics in large rivers: implications for the marine boron budget and paleo-pH reconstruction over the Cenozoic, Chem. Geol., 190, 123–140, 2002.
Lisiecki L. E. and Raymo M. E.: A Pliocene-Pleistocene stack of 57 globally distributed benthic δ18O records, Paleoceanography, 20, PA1003, https://doi.org/10.1029/2004PA001071, 2005.
Liu, J., Tian, J., Liu, Z., Herbert, T. D., Fedorov, A. V., and Lyle, M.: Eastern equatorial Pacific cold tongue evolution since the late Miocene linked to extratropical climate, Science advances, 5, eaau6060, https://doi.org/10.1126/sciadv.aau6060, 2019.
Lloyd, N. S., Sadekov, A. Y., and Misra, S.: Application of 1013 ohm Faraday cup current amplifiers for boron isotopic analyses by solution mode and laser ablation multicollector inductively coupled plasma mass spectrometry, Rapid Commun. Mass Sp., 32, 9–18, 2018.
Lunt, D. J., Foster, G. L., Haywood, A. M., and Stone, E. J.: Late Pliocene Greenland glaciation controlled by a decline in atmospheric CO2 levels, Nature, 454, 1102–1105, 2008.
Lunt, D. J., Haywood, A. M., Schmidt, G. A., Salzmann, U., Valdes, P. J., and Dowsett, H. J.: Earth system sensitivity inferred from Pliocene modelling and data, Nat. Geosci., 3, 60–64, 2010.
Lüthi, D., Le Floch, M., Bereiter, B., Blunier, T., Barnola, J. M., Siegenthaler, U., Raynaud, D., Jouzel, J., Fischer, H., Kawamura, K., and Stocker, T. F.: High-resolution carbon dioxide concentration record 650,000–800,000 years before present, Nature, 453, 379–382, 2008.
Ma, W., Tian, J., Li, Q., and Wang, P.: Simulation of long eccentricity (400-kyr) cycle in ocean carbon reservoir during Miocene Climate Optimum: Weathering and nutrient response to orbital change, Geophys. Res. Lett., 38, L10701, https://doi.org/10.1029/2011GL047680, 2011.
Martin, E. E. and Scher, H. D.: Preservation of seawater Sr and Nd isotopes in fossil fish teeth: bad news and good news, Earth Planet. Sc. Lett., 220, 25–39, 2004.
Martin, E. E., Shackleton, N. J., Zachos, J. C., and Flower, B. P.: Orbitally‐tuned Sr isotope chemostratigraphy for the late middle to late Miocene, Paleoceanography, 14, 74–83, 1999.
Martínez-Botí, M. A., Foster, G. L., Chalk, T. B., Rohling, E. J., Sexton, P. F., Lunt, D. J., Pancost, R. D., Badger, M. P. S., and Schmidt, D. N.: Plio-Pleistocene climate sensitivity evaluated using high-resolution CO2 records, Nature, 518, 49–54, https://doi.org/10.1038/nature14145, 2015a.
Martínez-Botí, M. A., Marino, G., Foster, G. L., Ziveri, P., Henehan, M. J., Rae, J. W. B., Mortyn, P. G., and Vance, D.: Boron isotope evidence for oceanic carbon dioxide leakage during the last deglaciation, Nature, 518, 219–222, 2015b.
Martínez-Garcia, A., Rosell-Melé, A., Jaccard, S. L., Geibert, W., Sigman, D. M., and Haug, G. H.: Southern Ocean dust–climate coupling over the past four million years, Nature, 476, 312–315, 2011.
Mavromatis, V., Montouillout, V., Noireaux, J., Gaillardet, J., and Schott, J.: Characterization of boron incorporation and speciation in calcite and aragonite from co-precipitation experiments under controlled pH, temperature and precipitation rate, Geochim. Cosmochim. Ac., 150, 299–313, 2015.
McCulloch, M. T., Holcomb, M., Rankenburg, K., and Trotter, J. A.: Rapid, high-precision measurements of boron isotopic compositions in marine carbonates, Rapid Commun. Mass Sp., 28, 2704–2712, 2014.
Medina-Elizalde, M. and Lea, D. W.: The mid-pleistocene transition in the tropical pacific, Science, 310, 1009–1012, 2005.
Misra, S. and Froelich, P. N.: Lithium isotope history of cenozoic seawater: Changes in silicate weathering and reverse weathering, Science, 335, 818–823, https://doi.org/10.1126/science.1214697, 2012.
Misra, S., Greaves, M., Owen, R., Kerr, J., Elmore, A. C., and Elderfield, H.: Determination of of natural carbonates by HR-ICP-MS, Geochem. Geophy. Geosy., 15, 1617–1628, 2014a.
Misra, S., Owen, R., Kerr, J., Greaves, M., and Elderfield, H.: Determination of δ11B by HR-ICP-MS from mass limited samples: Application to natural carbonates and water samples, Geochim. Cosmochim. Ac., 140, 531–552, 2014b.
Mitnick, E. H., Lammers, L. N., Zhang, S., Zaretskiy, Y., and DePaolo, D. J.: Authigenic carbonate formation rates in marine sediments and implications for the marine δ13C record, Earth Planet. Sc. Lett., 495, 135–145, 2018.
Müller, R. D., Seton, M., Zahirovic, S., Williams, S. E., Matthews, K. J., Wright, N. M., Shephard, G., Maloney, K. T., Barnett-Moore, N., Hosseinpour, M., Bower, D., and Cannon, J.: Ocean basin evolution and global-scale plate reorganization events since Pangea breakup, Annu. Rev. Earth Pl. Sc., 44, 107–138, 2016.
Nathan, S. A. and Leckie, R. M.: Palaeogeogr. Palaeocl., 274, 140–159, 2009.
National Oceanic and Atmospheric Administration (NOAA): Paleoclimatology, NOAA [data set], available at: https://www.ncei.noaa.gov/products/paleoclimatology, last access: December 2021.
Osborne, E. B., Umling, N. E., Bizimis, M., Buckley, W., Sadekov, A., Tappa, E., Marshall, B., R. Sautter, L., and Thunell, R. C.: A Sediment Trap Evaluation of as a Carbonate System Proxy in Asymbiotic and Nondinoflagellate Hosting Planktonic Foraminifera, Paleoceanography and Paleoclimatology, 35, e2019PA003682, https://doi.org/10.1029/2019PA003682, 2020.
Pagani, M., Zachos, J. C., Freeman, K. H., Tipple, B., and Bohaty, S.: Atmospheric science: Marked decline in atmospheric carbon dioxide concentrations during the Paleogene, Science, 309, 600–603, 2005.
Pagani, M., Liu, Z., Lariviere, J., and Ravelo, A. C.: High Earth-system climate sensitivity determined from Pliocene carbon dioxide concentrations, Nat. Geosci., 3, 27–30, 2010.
Pearson, P. N. and Palmer, M. R.: Atmospheric carbon dioxide concentrations over the past 60 million years, Nature, 406, 695–699, 2000.
Petit, J. R., Jouzel, J., Raynaud, D., Barkov, N. I., Barnola, J. M., Basile, I., Bender, M., Chappellaz, J., Davis, M., Delaygue, G., Delmotte, M., Kotiyakov, V. M., Legrand, M., Lipenkov, V. Y., Lorius, C., Pépin, L., Ritz, C., Saltzman, E., and Stievenard, M.: Climate and atmospheric history of the past 420,000 years from the Vostok ice core, Antarctica, Nature, 399, 429–436, 1999.
Rae, J. W., Zhang, Y. G., Liu, X., Foster, G. L., Stoll, H. M., and Whiteford, R. D.: Atmospheric CO2 over the Past 66 Million Years from Marine Archives, Annu. Rev. Earth Pl. Sc., 49, 609–641, https://doi.org/10.1146/annurev-earth-082420-063026, 2021.
Raitzsch, M. and Hönisch, B.: Cenozoic boron isotope variations in benthic foraminifers, Geology, 41, 591–594, 2013.
Raitzsch, M., Bijma, J., Benthien, A., Richter, K. U., Steinhoefel, G., and Kučera, M.: Boron isotope-based seasonal paleo-pH reconstruction for the Southeast Atlantic – A multispecies approach using habitat preference of planktonic foraminifera, Earth Planet. Sc. Lett., 487, 138–150, 2018.
Raitzsch, M., Bijma, J., Bickert, T., Schulz, M., Holbourn, A., and Kučera, M.: Atmospheric carbon dioxide variations across the middle Miocene climate transition, Clim. Past, 17, 703–719, https://doi.org/10.5194/cp-17-703-2021, 2021.
Renne, P. R., Sprain, C. J., Richards, M. A., Self, S., Vanderkluysen, L., and Pande, K.: State shift in Deccan volcanism at the Cretaceous-Paleogene boundary, possibly induced by impact, Science, 350, 76–78, 2015.
Ridgwell, A. and Zeebe, R. E.: The role of the global carbonate cycle in the regulation and evolution of the Earth system, Earth Planet. Sc. Lett., 234, 299–315, 2005.
Robinson, R. S., Sigman, D. M., DiFiore, P. J., Rohde, M. M., Mashiotta, T. A., and Lea, D. W.: Diatom‐bound : New support for enhanced nutrient consumption in the ice age subantarctic, Paleoceanography, 20, PA3003, https://doi.org/10.1029/2004PA001114, 2005.
Rowley, D. B.: Rate of plate creation and destruction: 180 Ma to present, Geol. Soc. Am. Bull., 114, 927–933, 2002.
Royer D. L.: Stomatal density and stomatal index as indicators of paleoatmospheric CO2 concentration, Rev. Palaeobot. Palynol., 114, 1–28, https://doi.org/10.1016/S0034-6667(00)00074-9, 2001.
Schmittner, A., Urban, N. M., Shakun, J. D., Mahowald, N. M., Clark, P. U., Bartlein, P. J., Mix A. C., and Rosell-Melé, A.: Climate sensitivity estimated from temperature reconstructions of the Last Glacial Maximum, Science, 334, 1385–1388, 2011.
Seki, O., Foster, G. L., Schmidt, D. N., Mackensen, A., Kawamura, K., and Pancost, R. D.: Alkenone and boron-based Pliocene pCO2 records, Earth Planet. Sc. Lett., 292, 201–211, 2010.
Shankle, M. G., Burls, N. J., Fedorov, A. V., Thomas, M. D., Liu, W., Penman, D. E., Ford, H. L., Jacobs, P. H., Planavsky, N. J., and Hull, P. M.: Pliocene decoupling of equatorial Pacific temperature and pH gradients, Nature, 598, 457–461 https://doi.org/10.1038/s41586-021-03884-7, 2021.
Shevenell, A. E., Kennett, J. P., and Lea, D. W.: Middle Miocene southern ocean cooling and Antarctic cryosphere expansion, Science, 305, 1766–1770, 2004.
Shipboard Scientific Party: Site 806, in: Kroenke, L. W., Berger, W. H., Janecek, T. R., et al., Proc. ODP, Init. Repts., 130, College Station, TX (Ocean Drilling Program), 291–367, https://doi.org/10.2973/odp.proc.ir.130.108.1991, 1991.
Shipboard Scientific Party: Site 872, in: Premoli Silva, I., Haggerty, J., Rack, F., et al., Proc. ODP, Init. Repts., 144, College Station, TX (Ocean Drilling Program), 105–144, https://doi.org/10.2973/odp.proc.ir.144.105.1993, 1993.
Shuttleworth, R., Bostock, H. C., Chalk, T. B., Calvo, E., Jaccard, S. L., Pelejero, C., Martínez-Garcia, A., and Foster, G. L.: Early deglacial CO2 release from the Sub-Antarctic Atlantic and Pacific oceans, Earth Planet. Sc. Lett., 554, 116649, https://doi.org/10.1016/j.epsl.2020.116649, 2021.
Schlitzer, R.: Ocean Data View, available at: https://odv.awi.de (last access: November 2021), 2016.
Si, W. and Rosenthal, Y.: Reduced continental weathering and marine calcification linked to late Neogene decline in atmospheric CO2, Nat. Geosci., 12, 833–838, 2019.
Siegenthaler, U., Stocker, T. F., Monnin, E., Lüthi, D., Schwander, J., Stauffer, B, Raynaud, D., Barnola, J.-M., Fischer, H., Masson-Delmotte, V., and Jouzel, J.: Stable carbon cycle–climate relationship during the late Pleistocene, Science, 310, 1313–1317, 2005.
Sigman, D. M., Hain, M. P., and Haug, G. H.: The polar ocean and glacial cycles in atmospheric CO2 concentration, Nature, 466, 47–55, 2010.
Sosdian, S. M., Greenop R., Hain, M. P., Foster, G. L., Pearson, P. N., and Lear, C. H.: Constraining the evolution of Neogene ocean carbonate chemistry using the boron isotope pH proxy, Earth Planet. Sc. Lett., 498, 362–376, 2018.
Sosdian, S. M., Babila, T. L., Greenop, R., Foster, G. L., and Lear, C. H.: Ocean carbon storage across the middle Miocene: A new interpretation for the Monterey Event, Nat. Commun., 11, 134, https://doi.org/10.1038/s41467-019-13792-0, 2020.
Stap, L. B., de Boer, B., Ziegler, M., Bintanja, R., Lourens, L. J., and van de Wal, R. S. W.: CO2 over the past 5 million years: Continuous simulation and new δ11B-based proxy data, Earth Planet. Sc. Lett., 439, 1–10, https://doi.org/10.1016/j.epsl.2016.01.022, 2016.
Stoll, H. M., Guitian, J., Hernandez-Almeida, I., Mejia, L. M., Phelps, S., Polissar, P., Rosenthal, Y., Zhang, H., and Ziveri, P.: Upregulation of phytoplankton carbon concentrating mechanisms during low CO2 glacial periods and implications for the phytoplankton pCO2 proxy, Quaternary Sci. Rev., 208, 1–20, https://doi.org/10.1016/j.quascirev.2019.01.012, 2019.
Super, J. R., Thomas, E., Pagani, M., Huber, M., O'Brien, C., and Hull, P. M.: North Atlantic temperature and pCO2 coupling in the early-middle Miocene, Geology, 46, 519–522, 2018.
Super, J. R., Thomas, E., Pagani, M., Huber, M., O'Brien, C. L., and Hull, P. M.: Miocene Evolution of North Atlantic Sea Surface Temperature, Paleoceanography and Paleoclimatology, 35, e2019PA003748, https://doi.org/10.1029/2019PA003748, 2020.
Sutton, J. N., Liu, Y.-W., Ries, J. B., Guillermic, M., Ponzevera, E., and Eagle, R. A.: δ11B as monitor of calcification site pH in divergent marine calcifying organisms, Biogeosciences, 15, 1447–1467, https://doi.org/10.5194/bg-15-1447-2018, 2018.
Takahashi, T., Sutherland, S. C., Chipman, D. W., Goddard, J. G., and Ho, C.: Climatological distributions of pH, pCO2, total CO2, alkalinity, and CaCO3 saturation in the global surface ocean, and temporal changes at selected locations, Mar. Chem, 164, 95–125, 2014.
Tanner, T., Hernández-Almeida, I., Drury, A. J., Guitián, J., and Stoll, H.: Decreasing atmospheric CO2 during the late Miocene Cooling, Paleoceanography and Paleoclimatology, 35, e2020PA003925, https://doi.org/10.1029/2020PA003925, 2020.
Tierney, J. E., Zhu, J., King, J., Malevich, S. B., Hakim, G. J., and Poulsen, C. J.: Glacial cooling and climate sensitivity revisited, Nature, 584, 569–573, 2020.
Toggweiler, J. R.: Variation of atmospheric CO2 by ventilation of the ocean's deepest water, Paleoceanography, 14, 571–588, 1999.
Tripati, A. and Darby, D.: Evidence for ephemeral middle Eocene to early Oligocene Greenland glacial ice and pan-Arctic sea ice, Nat. Commun., 9, 1038, https://doi.org/10.1038/s41467-018-03180-5, 2018.
Tripati, A., Eagle, R., Eiler, J., and Beaufort, L.: Glacial ocean temperatures from “clumped isotope” thermometry in foraminifera and coccoliths, Geochim. Cosmochim. Ac., 74, A1057, https://doi.org/10.1016/j.gca.2010.04.046, 2010.
Tripati, A. K., Roberts, C. D., and Eagle, R. A.: Coupling of CO2 and Ice sheet stability over major climate transitions of the last 20 million years, Science, 326, 1394–1397, https://doi.org/10.1126/science.1178296, 2009.
Tripati, A. K., Roberts, C. D., Eagle, R. A., and Li, G.: A 20 million year record of planktic foraminiferal ratios: Systematics and uncertainties in pCO2reconstructions, Geochim. Cosmochim. Ac., 75, 2582–2610, https://doi.org/10.1016/j.gca.2011.01.018, 2011.
Tripati, A. K., Sahany, S., Pittman, D., Eagle, R. A., Neelin, J. D., Mitchell, J. L., and Beaufort, L.: Modern and glacial tropical snowlines controlled by sea surface temperature and atmospheric mixing, Nat. Geosci., 7, 205–209, 2014.
Tyrrell, T. and Zeebe, R. E.: History of carbonate ion concentration over the last 100 million years, Geochim. Cosmochim. Ac., 68, 3521–3530, 2004.
Van Der Burgh, J., Visscher, H., Dilcher, D. L., and Kürschner, W. M.: Paleoatmospheric signatures in Neogene fossil leaves, Science, 260, 1788–1790, 1993.
Vogl, J. and Rosner, M.: Production and Certification of a Unique Set of Isotope and Delta Reference Materials for Boron Isotope Determination in Geochemical, Environmental and Industrial Materials, Geostand. Geoanal. Res. 36, 161–175, 2012.
Wara, M. W., Delaney, M. L., Bullen, T. D., and Ravelo, A. C.: Possible roles of pH, temperature, and partial dissolution in determining boron concentration and isotopic composition in planktonic foraminifera, Paleoceanography, 18, 1100, https://doi.org/10.1029/2002PA000797, 2003.
Wara, M. W., Ravelo, A. C., and Delaney, M. L.: Climate change: Permanent El Niño-like conditions during the Pliocene warm period, Science, 309, 758–761, 2005.
Watson, A. J., Bakker, D. C. E., Ridgwell, A. J., Boyd, P. W., and Law, C. S.: Effect of iron supply on Southern Ocean CO2 uptake and implications for glacial atmospheric CO2, Nature, 407, 730–733, https://doi.org/10.1038/35037561, 2000.
White, S. M. and Ravelo, A. C.: The benthic record at Site 806: new constraints on the temperature of the West Pacific Warm Pool and the “El Padre” state in the Pliocene, Paleoceanography and Paleoclimatology, 35, e2019PA003812, https://doi.org/10.1029/2019PA003812, 2020.
Yan, Y., Bender, M. L., Brook, E. J., Clifford, H. M., Kemeny, P. C., Kurbatov, A. V., Mackay, S., Mayewski, P.A., Ng, J., Severinghaus, J. P., and Higgins, J. A.: Two-million-year-old snapshots of atmospheric gases from Antarctic ice, Nature, 574, 663–666, 2019.
Yu, J., Elderfield, H., and Hönisch, B.: in planktonic foraminifera as a proxy for surface seawater pH, Paleoceanography, 22, PA2202, https://doi.org/10.1029/2006PA001347, 2007.
Zachos, J., Pagani, M., Sloan, L., Thomas, E., and Billups, K.: Trends, rhythms, and aberrations in global climate 65 Ma to present, Science, 292, 686–693, 2001.
Zachos, J. C., Dickens, G. R., and Zeebe, R. E.: An early Cenozoic perspective on greenhouse warming and carbon-cycle dynamics, Nature, 451, 279–283, 2008.
Zhang, J., Wang, P., Li, Q., Cheng, X., Jin, H., and Zhang, S.: Western equatorial Pacific productivity and carbonate dissolution over the last 550 kyr: Foraminiferal and nannofossil evidence from ODP Hole 807A, Mar. Micropaleontol., 64, 121–140, 2007.
Zhang, Y. G., Pagani, M., Liu, Z., Bohaty, S. M., and Deconto, R.: A 40-million-year history of atmospheric CO2, Philos. T. R. Soc. A., 371, 20130096, https://doi.org/10.1098/rsta.2013.0096, 2013.
Zhang, Y. G., Pagani, M., and Liu, Z.: A 12-million-year temperature history of the tropical Pacific Ocean, Science, 344, 84–87, 2014.