the Creative Commons Attribution 4.0 License.
the Creative Commons Attribution 4.0 License.
 | 03 Aug 2022
Extreme historical droughts and floods in the Hanjiang River Basin, China, since 1426
Xiaodan Zhang
Guoyu Ren
Yuda Yang
He Bing
Zhixin Hao
Panfeng Zhang
The major droughts and floods in the Hanjiang River Basin, central China, have a significant impact on flood prevention and control in the middle reaches of the Yangtze River and water resources management in the areas of the South–North Water Diversion Middle Line Project. However, there is a lack of understanding of the multi-decadal to centennial-scale patterns of extreme droughts and floods in the area. Applying the yearly drought and flood records from historical documents and precipitation data in the period of instrumental measurements, this study constructs a time series of extreme droughts and floods in the Hanjiang River Basin from 1426–2017 and analyzes the temporal and spatial characteristics of the extreme drought and flood event variations. The results show that there were a total of 45 extreme droughts and 52 extreme floods in the basin over the past 592 years. Extreme droughts and floods were highly variable on a multi-decadal to centennial scale, and the frequencies were higher in the first and last 100 years or so of the study period and lower in between. Spatially, the frequencies of extreme droughts and floods were generally higher in the middle and lower reaches than in the upper reaches. It was also found that there is a good correlation of drought and flood frequencies between the upper Hanjiang River Basin and North China. These results are informative for the study of mechanisms and predictability of multi-decadal to centennial-scale variability of extreme hydroclimatic events in the river basin.
- Article
(7118 KB) - Full-text XML
-
Supplement
(2263 KB) - BibTeX
- EndNote


Extreme droughts and floods often severely impact agricultural production, people's livelihoods, and socioeconomic development. Throughout the history of human development, there have been “almost no years without disaster” (Deng, 2011). In the historical records of natural disasters in China, droughts and floods dominate in particular, showing their tremendous impact on society and the economy.
Global climate warming has been affirmed in academic circles, and the global surface temperature increase in the 21st century will probably exceed 1.5–2.5 ∘C (IPCC, 2014). The climate warming not only directly affects changes in temperature extremes but also lead to changes in the frequency of regional droughts and floods (Goswami et al., 2006; Krysanova et al., 2008; Dai, 2013; Aiken and Rauscher, 2019). The IPCC Sixth Assessment Report (AR6) states that 3–4 billion people globally would face physical water scarcity under 2.0 and 4.0 ∘C warming scenarios (IPCC, 2022). Furthermore, the risk of floods will double when the globe warms between 1.5 and 3.0 ∘C, and economic, agricultural, and potential hydropower losses will increase as warming increases further (IPCC, 2022). Observational studies have shown an increasing trend in precipitation over much of the middle to high latitudes during 1901–2010. However, decreasing trends of precipitation have been observed in other regions including northern Africa, the Mediterranean, southern Africa, and much of eastern and southern Asia (IPCC, 2014). In China, since the late 1970s, the eastern region has shown a pattern of “south floods and north droughts” (Sun and Chen, 2003; Hsu et al., 2014), with precipitation in North China, southwestern China, and southern northeast China decreasing. In contrast, precipitation and heavy rainfall in the Yangtze River Basin and southeast coastal areas have increased (R. Zhang et al., 2008; Chen et al., 2012; Wang and Fan, 2013). However, since the beginning of the 21st century, the precipitation pattern in the eastern part has shown a reversal trend, with the precipitation in the Yangtze River Basin decreasing significantly, that in North China and southwestern northeast China beginning to increase, and the drought in southwestern China intensifying (Ren et al., 2015a; Ding et al., 2020).
An essential scientific question currently facing the academic community is how extreme precipitation, droughts, and floods will change in East Asia in the future under global climate warming and what the differences are in future extreme precipitation events in different large river basins in eastern China's monsoon region. Climate model simulations and observational studies based on historical series of precipitation, drought, and flood data are the primary means for understanding the patterns and mechanisms of decadal- to century-scale variability in precipitation as well as droughts and floods. Meanwhile, understanding the patterns and mechanisms of past precipitation variability is a prerequisite for predicting future precipitation and extreme precipitation. In particular, long series of climate data can be used to study patterns of historical precipitation as well as drought and flood variation, and they are also essential for testing the climate models used for projecting future climate. Therefore, long-term observations or proxy data of the past hundred to several hundred years at different spatial scales are first required to meet the demand of studies.
In most parts of the world, including eastern China's monsoon region, however, the duration of instrumental meteorological data is less than 100 years. Furthermore, instrumental observations are extremely scarce in the early 20th and late 19th centuries, and only sporadic climatic records before the mid-19th century were available, making it impossible to satisfy studies of historical precipitation as well as drought and flood variability. Therefore, using long-term high-resolution historical drought and flood records to reconstruct the sequence of extreme precipitation, drought, and flood events at basin and regional scales is scientifically essential for studying the patterns and mechanisms of climate variation in historical periods (Mikami, 2008; Cook et al., 2010; Machado et al., 2011; IPCC, 2012, 2014; Fenby and Gergis, 2013; Shi et al., 2018, 2019).
China has a wealth of continuous historical documents that provide precious material for studying climate change in historical periods, with the greatest wealth of records for historical droughts and floods (Zheng et al., 1993). Since the 1970s, Chinese scholars have used historical data on droughts and floods to reconstruct time series of the past climate and extreme climate, achieving fruitful research results (e.g., Zhao and Wang, 1979; Zhang and Gong, 1979; Central Meteorological Bureau, 1981; Zhang, 1989; Hao et al., 2010; Zheng et al., 2020). These studies laid a good foundation for further investigating the multi-decadal to centennial-scale variability of historical droughts and floods in the country. However, most of the above studies only examined characteristics of precipitation or drought and flood variations from a large spatial perspective. There are few studies using historical drought and flood records to explore the extreme precipitation patterns and mechanisms at a regional level, particularly in a medium- to small-scale river basin (e.g., Chen, 1987; Zhang et al., 2004; Ren et al., 2015b). Due to the comprehensive influence of multiple factors such as topography and geomorphology, long-term precipitation variation characteristics in different regions and basins are usually not similar. Even within a medium- to small-scale basin, there are big spatial differences in precipitation as well as drought and flood events in historical periods. In the climatic transition zones, the spatial characteristics of climate change and variability are more complex (Zheng et al., 1993; Liu et al., 2010; Wan et al., 2018; Mei et al., 2019).
The Hanjiang River is one of the major tributaries of the Yangtze River. Located in the northern subtropical climate zone to the south of the Qinling Mountains and in the transition zone between China's northern and southern climates, the Hanjiang River Basin (HRB) is sensitive to climate and environmental change (Zhu, 1958; Miao et al., 2009). On the other hand, drought and flood control as well as water supply in the basin are of great importance in national socioeconomic development and ecological restoration. As the water source area of the South–North Water Diversion Middle Line Project and a key river basin for flood control in the middle reaches of the Yangtze River, the Hanjiang River has a wide range of socioeconomic impacts in terms of precipitation as well as drought and flood variability (Liu et al., 2018; Wang et al., 2021). Therefore, there is an urgent need for research on precipitation as well as drought and flood variability at multi-decadal to centennial scales in the HRB.
There were a few of previous studies on the HRB's historical precipitation, but most of them were focused on the upper Hanjiang River region (Yin et al., 2010, 2013; Huang et al., 2013; Peng et al., 2013; Zhou et al., 2014, 2016; Yin, 2015; Mao et al., 2016; Tan et al., 2018); there were relatively few relevant studies on the entire basin (Zhou et al., 2006; Ding and Zheng, 2020). An in-depth understanding of the multi-decadal to centennial-scale variability of historical droughts and floods is thus lacking. Therefore, research on the reconstruction of the high-resolution drought and flood series as well as their variation patterns in the HRB's historical period still needs deepening and refinement.
This paper reports a reconstruction and analysis of high-resolution historical extreme drought and flood time series over the HRB from 1426 to 2017. The results presented in the paper could be helpful for understanding the multi-decadal to centennial variability of extreme precipitation as well as drought and flood events in the important branch of the Yangtze River.
2.1 Research area
The study area is the HRB (Fig. 1). The Hanjiang River originates at the southern foot of the Qinling Mountains. It flows through Shaanxi, Henan, and Hubei provinces before merging into the Yangtze River at Wuhan, with a total length of 1577 km, a basin area of 159 000 km2, and an average annual precipitation of 700–1300 mm (1960–2010) (Yin, 2015). HRB has a humid subtropical monsoon climate with a pronounced spatial difference of precipitation. The annual precipitation increases from northwest to southeast and is mainly concentrated in summer and autumn, with the summer precipitation usually accounting for more than 50 % of the annual total (Institute of Geography of Chinese Academy of Sciences, 1957). Droughts and floods are both severe in the HRB, mainly because the river's upper reaches (above the Danjiangkou Dam) are mountainous, with narrow, deep, meandering channels and fast currents. Flash floods and prolonged droughts can cause severe impacts. In the middle and lower reaches (Danjiangkou to Zhongxiang is the midstream and below Zhongxiang is the downstream) of the Hanjiang River, the slow current flow due to the low slope of the Jianghan Plain leads to unstable channels and inadequate discharge capacity, resulting in frequent floods (Institute of Geography of Chinese Academy of Sciences, 1957). Since the early 1990s, the HRB as a whole has tended towards more frequent droughts, which severely impacts the ecological environment, the rational allocation of water resources, and the water supply in the basin (Chen et al., 2006; Wang and Guo, 2010; Yin, 2015).
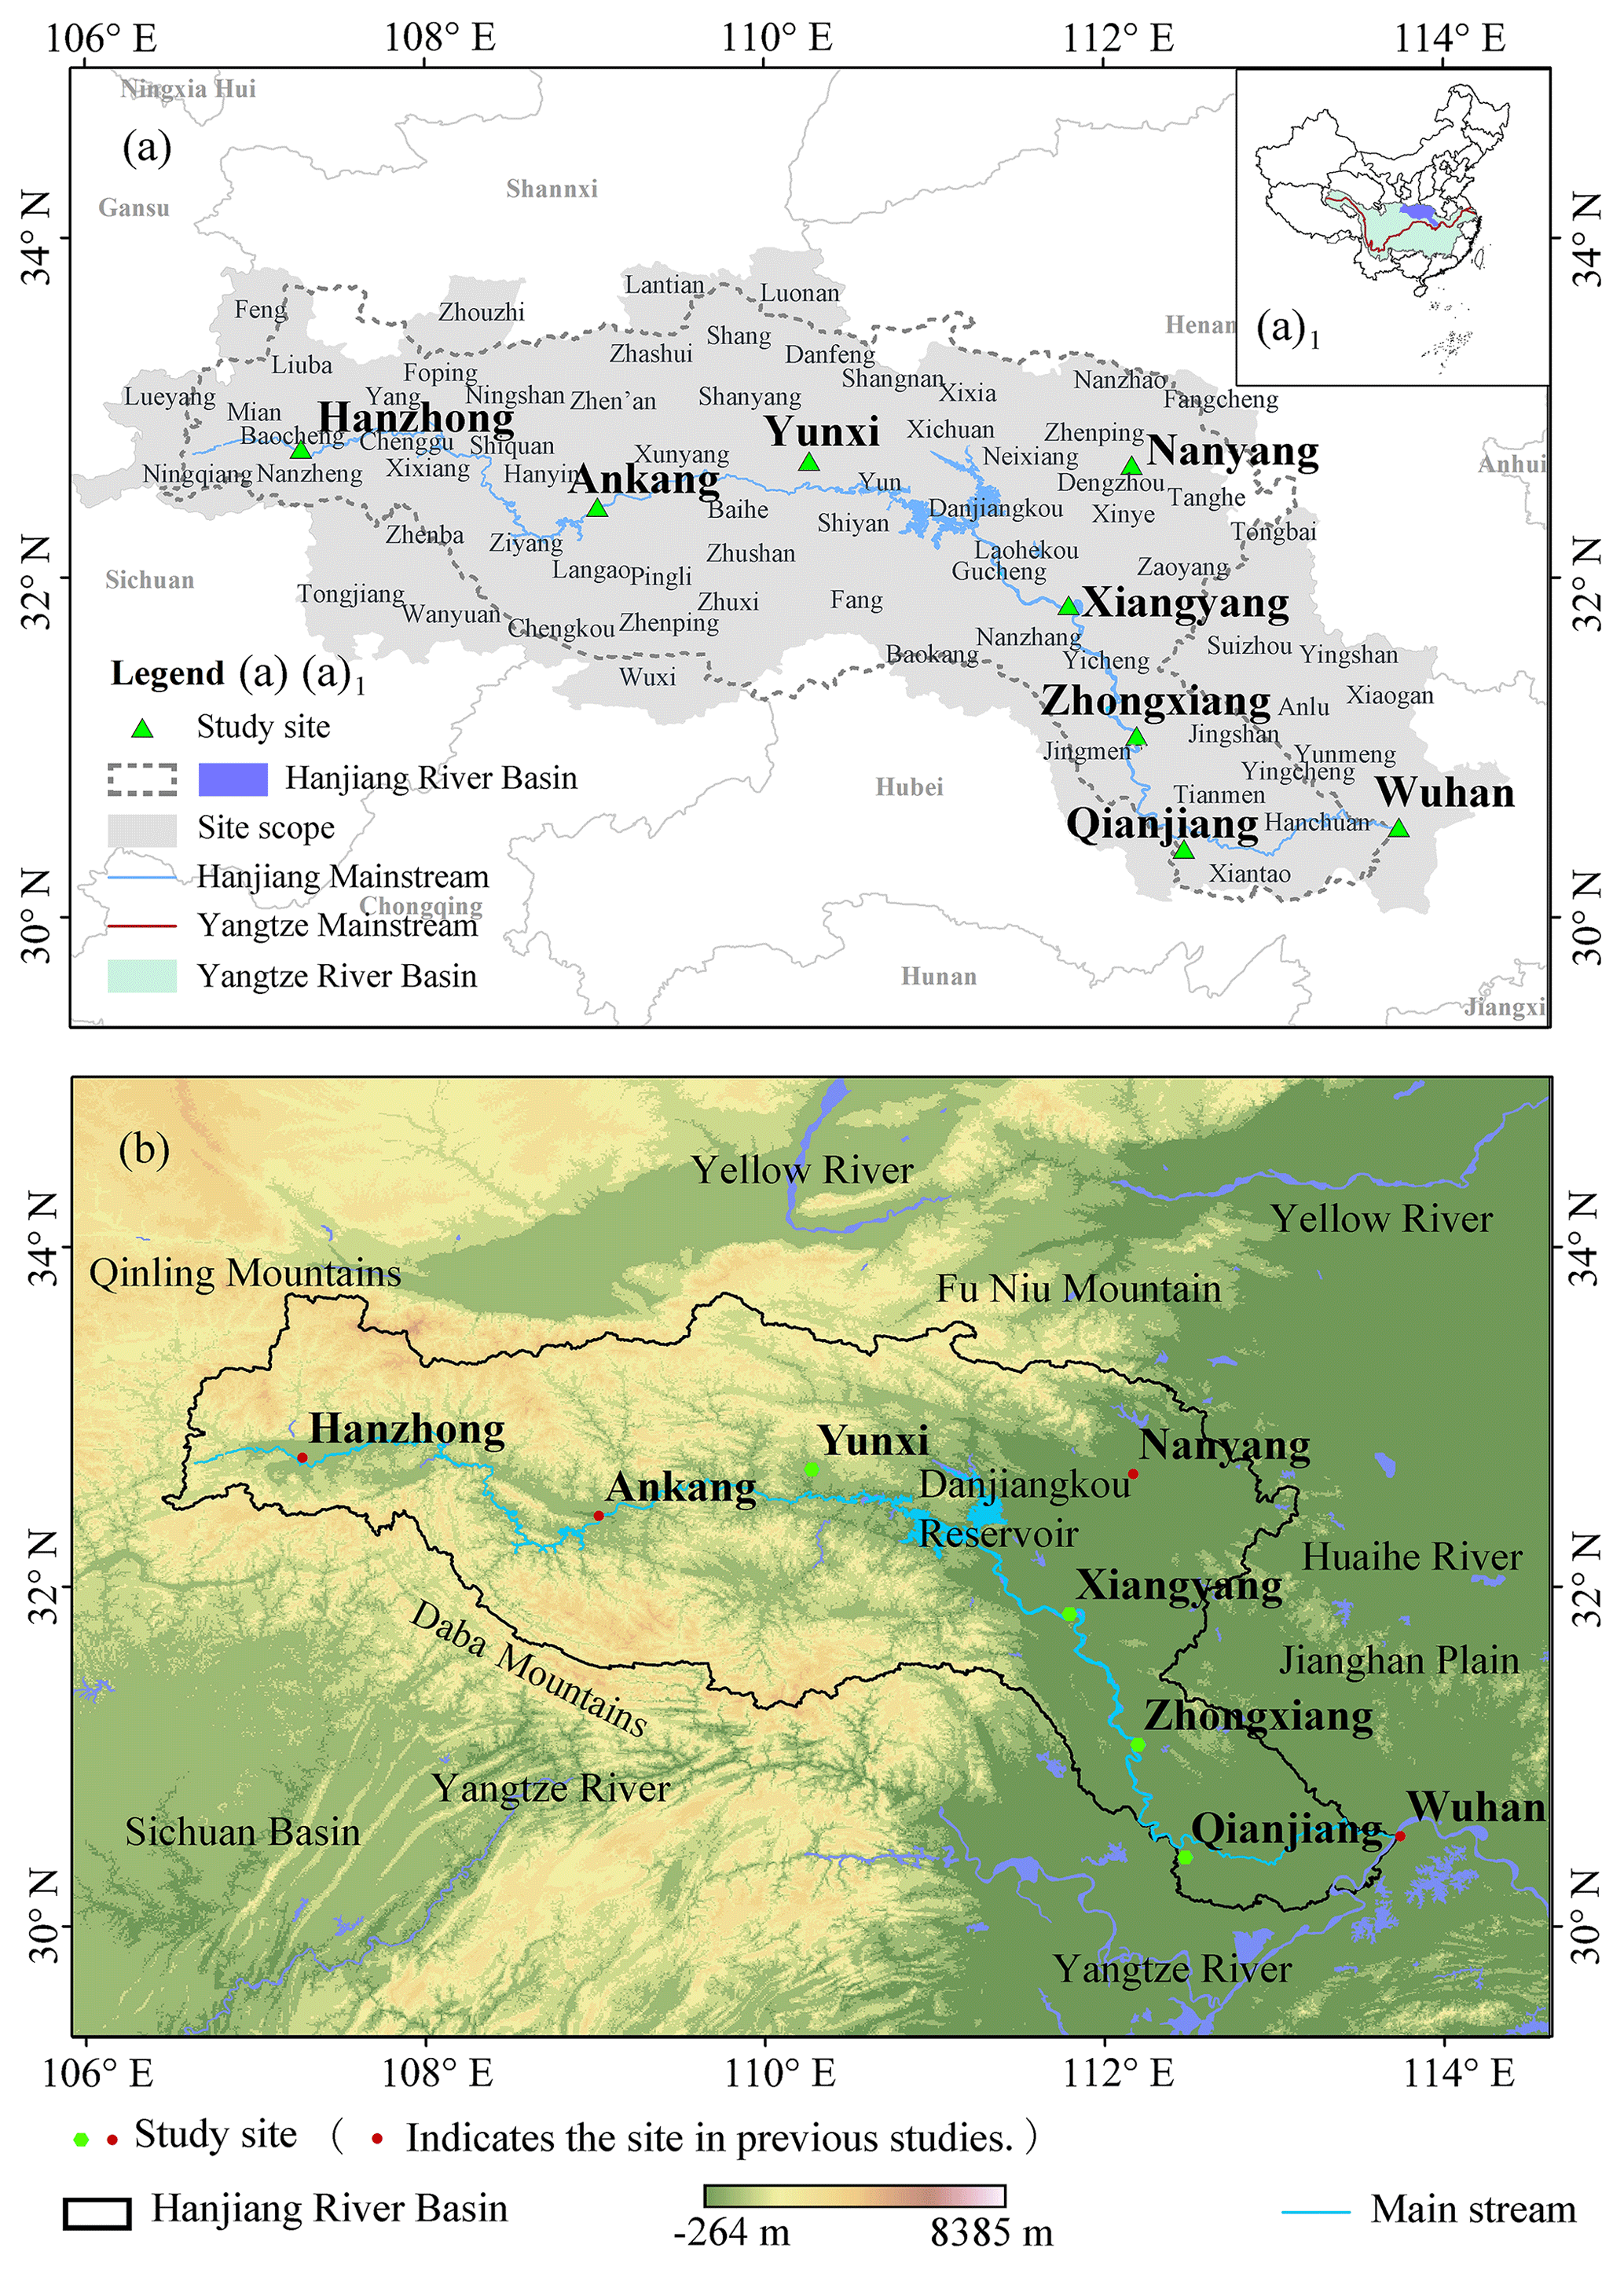
Figure 1Study area and locations of the eight prefecture capitals used for reconstruction of droughts and floods (a, a1, b). The green points in (b) represent the sites first reconstructed in this study, and study sites in previous work (Central Meteorological Bureau, 1981) are marked as red points in (b). The inset (a1) in (a) indicates the relative location of the study area in China.
2.2 Data
Four datasets were used in this work. These include the historical drought and flood records of the HRB (this study), the drought and flood index series in North China (the Yellow River and the North China Plain, 1470–2000), the Asian monsoon index series, and the chronologies of strong El Niño–Southern Oscillation (ENSO) events.
2.2.1 Historical drought and flood data series and documentation
The information used in this study to reconstruct the drought and flood sequences was divided into two parts: historical data and instrumental data. Sources of historical data included local chronicles and Qing Dynasty archives (memorials, Shangyu). The primary historical data source included A Compendium of Chinese Meteorological Records of the Last 3000 Years (Zhang, 2004). This collection of materials systematically compiles various kinds of written records on weather and climate in China for more than 3000 years from the 13th century BCE to 1911 CE. In addition, other datasets were also collected and used, including The Historical Documents on Flood and Waterlogging of Southwest International Rivers in the Yangtze River Basin in Qing Dynasty (1636–1912 CE) (Yang and Guo, 1991), The Disaster Annals in Modern China, The Continuation of Disaster Annals in Modern China (1919–1949) (Li, 1990, 1993), Zaixu Xingshuijinjain: Yangtze River Volume (Wu and Zhao, 2004), and Compilation of the Memorials to the Throne in Qing Dynasty: Agriculture ⋅ Environment (Ge, 2005). The data were mainly derived from official documents, notes, letters, local chronicles, inscriptions, newspapers, magazines, and river worker file transcripts of the Qing Dynasty. Moreover, drought and flood records from 1911 to 1949 CE in The China Meteorological Disaster Dictionary (Shaanxi Volume, Henan Volume, Hubei Volume; Wen, 2005b, a, 2007) were also collected and used as supplementary data.
In terms of the overall distribution of information, the records of droughts and floods in the local chronicles are more continuous and complete. They can also reflect information on the extent of disasters and disaster relief in each prefecture and county, effectively showing a disaster's spatial distribution and temporal change. The archival information is of the highest credibility (Ge and Zhang, 1990). It provides a primary basin-wide picture of droughts and floods with a clearer spatial and temporal resolution accurate to the county level.
The instrumental data (started in 1951) come from the monthly China National Ground Meteorological Station Homogenized Precipitation Data Set (V1.0) (Yang and Li, 2014). This set of precipitation observations was quality-controlled, tested, and adjusted for inhomogeneity caused by non-climatic factors such as the relocation of stations and instrumentation. This study uses precipitation data from eight meteorological stations (Hanzhong, Ankang, Yunxi, Nanyang, Xiangyang, Zhongxiang, Qianjiang, and Wuhan) in the HRB (Fig. 1).
2.2.2 Other historical data series
Drought and flood index series in North China (the Yellow River and the North China Plain, 1470–2000) were used to compare the result of this analysis with those of other regions. The data are from The Atlas of Drought and Flood Distribution in China in the Last 500 Years (hereafter referred to as the Atlas; Central Meteorological Bureau, 1981), and the drought and flood grades of North China were read out from the Atlas.
Asian monsoon index. The East Asian summer monsoon index dataset (1426–1949) reconstructed by P. Zhang et al. (2008a) was used in this study. They conducted a climate reconstruction of East Asian summer monsoon strength based on accurate dating by using high-resolution stalagmite δ18O series of Wanxiang Cave in Wudu (33∘ N, 104∘ E), Gansu province. Moreover, the South Asian summer monsoon index dataset (1426–2000) by Shi et al. (2014a) was also used. This dataset is based on a reconstruction of 15 tree-ring chronologies of the South Asian summer monsoon index for the last millennium.
ENSO sequence chronology (1525–2002). The El Niño and La Niña events in the historical ENSO chronology reconstructed by Gergis and Fowler (2009a) from tree rings, ice cores, coral records, and historical documents were used. These El Niño and La Niña events were divided into five grades as extreme (E), very strong (VS), strong (S), medium (M), and weak (W). This study selected VS and E grades as strong ENSO events. There were 45 strong El Niño and 56 strong La Niña events identified during 1525–2002.
2.3 Methods
2.3.1 Reconstruction method of historical drought and flood grade
Based on the criteria provided in the Atlas, single-station and regional drought and flood series were established using the grading method. The degree of drought and flood or precipitation was divided into five grades: grade 1 – flood, grade 2 – mild flood, grade 3 – normal, grade 4 – mild drought, grade 5 – drought. The drought and flood grades at each site indicated the degree of regional precipitation anomalies within a specific administrative range (i.e., including several counties and cities) represented by that site. Historical drought and flood grades were mainly based on historical records. In assessing the drought and flood grades for a region based on several drought and flood records for a given year, the primary considerations were the precipitation conditions in spring, summer, and autumn, as well as the timing, extent, and severity of their occurrence. If droughts and floods occurred successively at the same site in the same year, for instance spring droughts and summer floods or summer droughts and autumn floods, the summer condition was considered prevailing. If there were droughts and floods within the representative area (i.e., the site), the judgment would be based on most counties' or cities' situations. If a site has a gap in records of less than 3 years, it is considered to have no drought or flood and was graded 3; a site with a gap in records of more than 3 years was not graded.
In order to take into account the frequency of occurrence of each grade, the ideal frequency criteria of 10 % (grade 1 – flood; grade 5 – drought), 20 %–30 % (grade 2 – mild flood; grade 4 – mild drought), and 30 %–40 % (grade 3 – normal) (Central Meteorological Bureau, 1981) were used to adjust the classification of drought and flood grades in the HRB throughout the study period. Moreover, when precipitation records were available, the May–September precipitation for the area where the site is located was used to be consistent with the frequency of drought and flood grades obtained from historical data (Central Meteorological Bureau, 1981). Table 1 shows the division criteria in the HRB into various grades and their typical descriptions in historical sources (the criteria for judging the historical sources according to the Atlas) as well as the criteria for grading precipitation (Central Meteorological Bureau, 1981).
Table 1Criteria for classifying droughts and floods in the HRB and their typical descriptions in historical sources as well as criteria for grading precipitation in modern time.
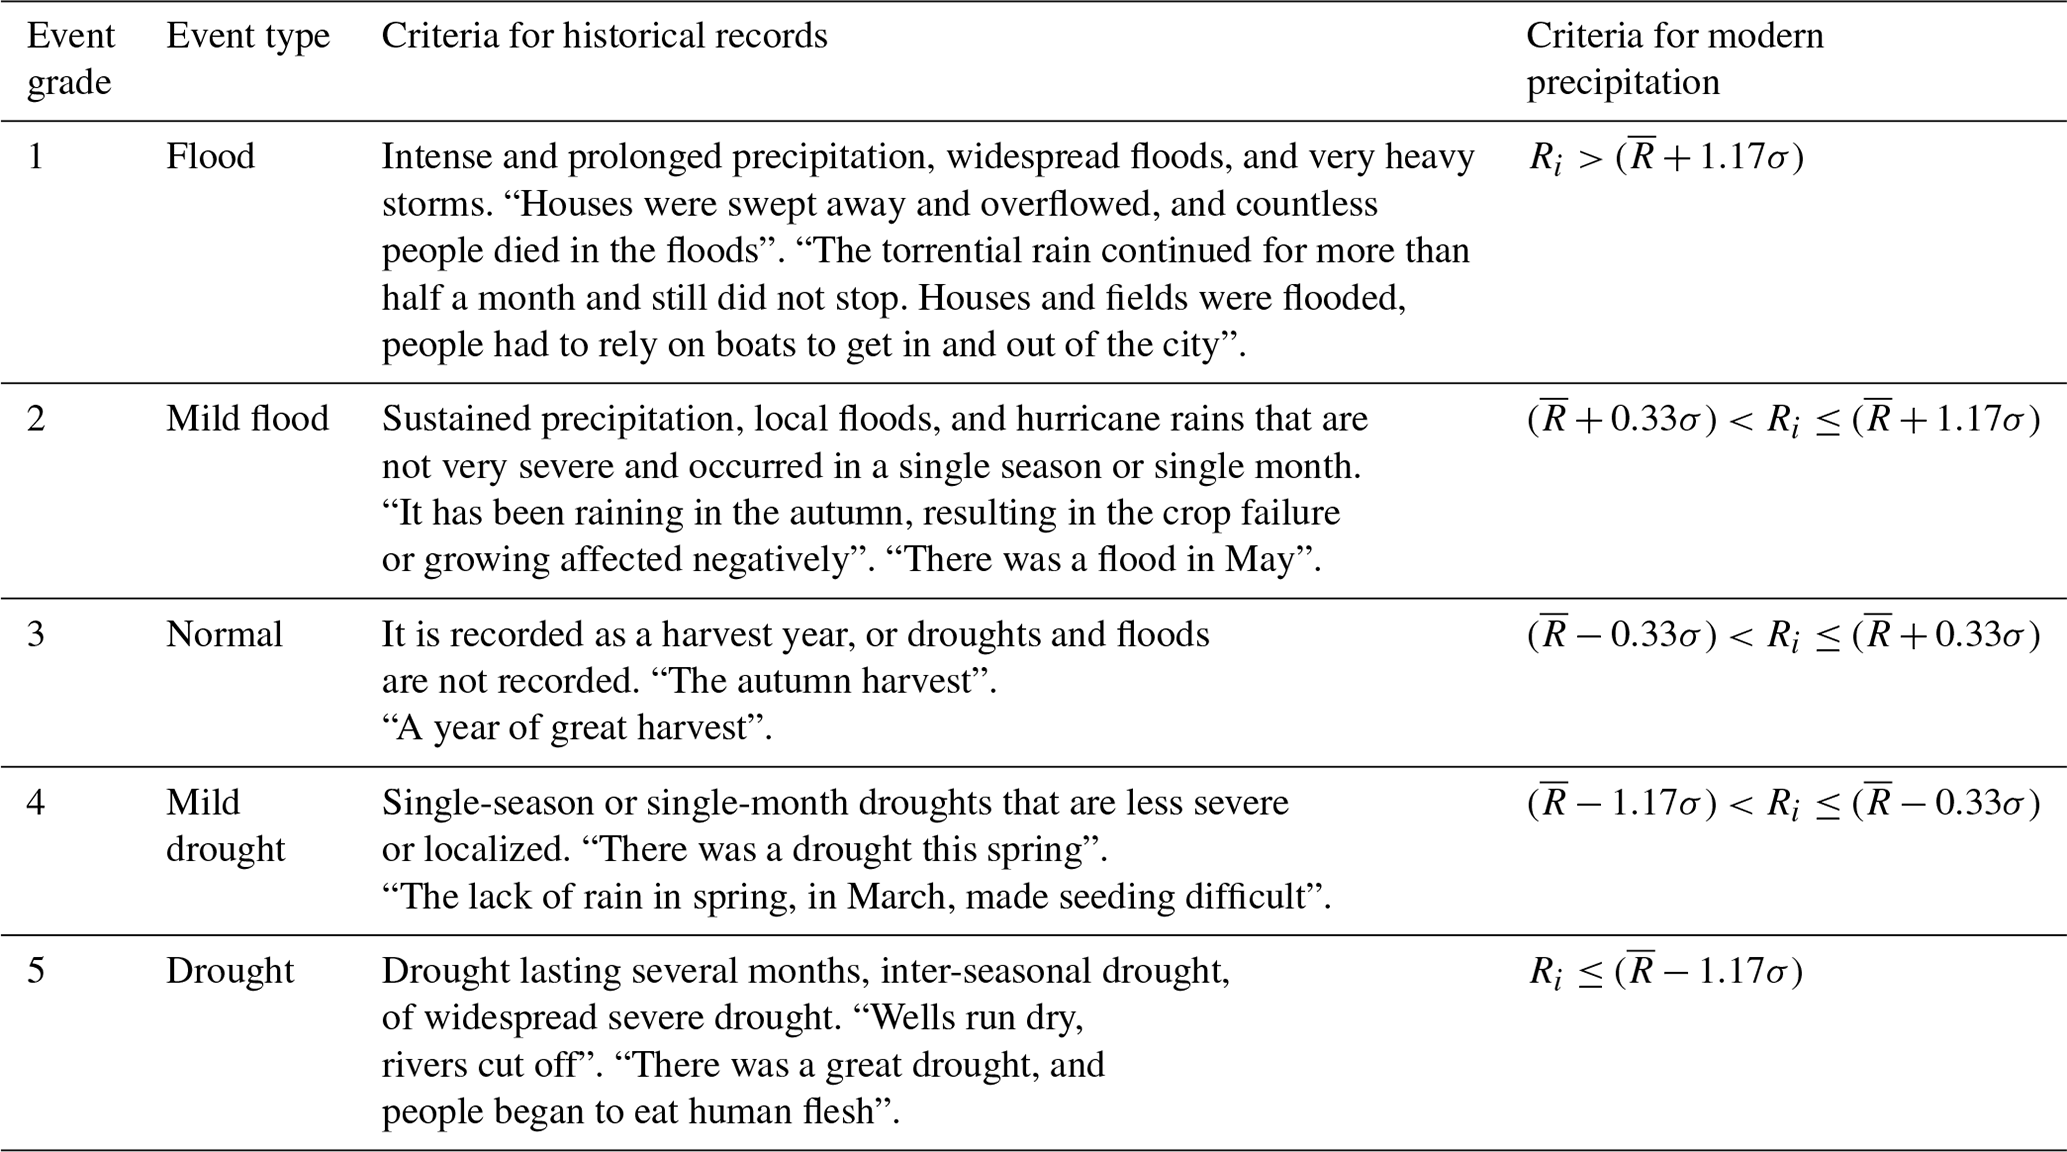
Ri means May–September precipitation in a year, means May–September average precipitation in a reference period, and σ means standard deviation.
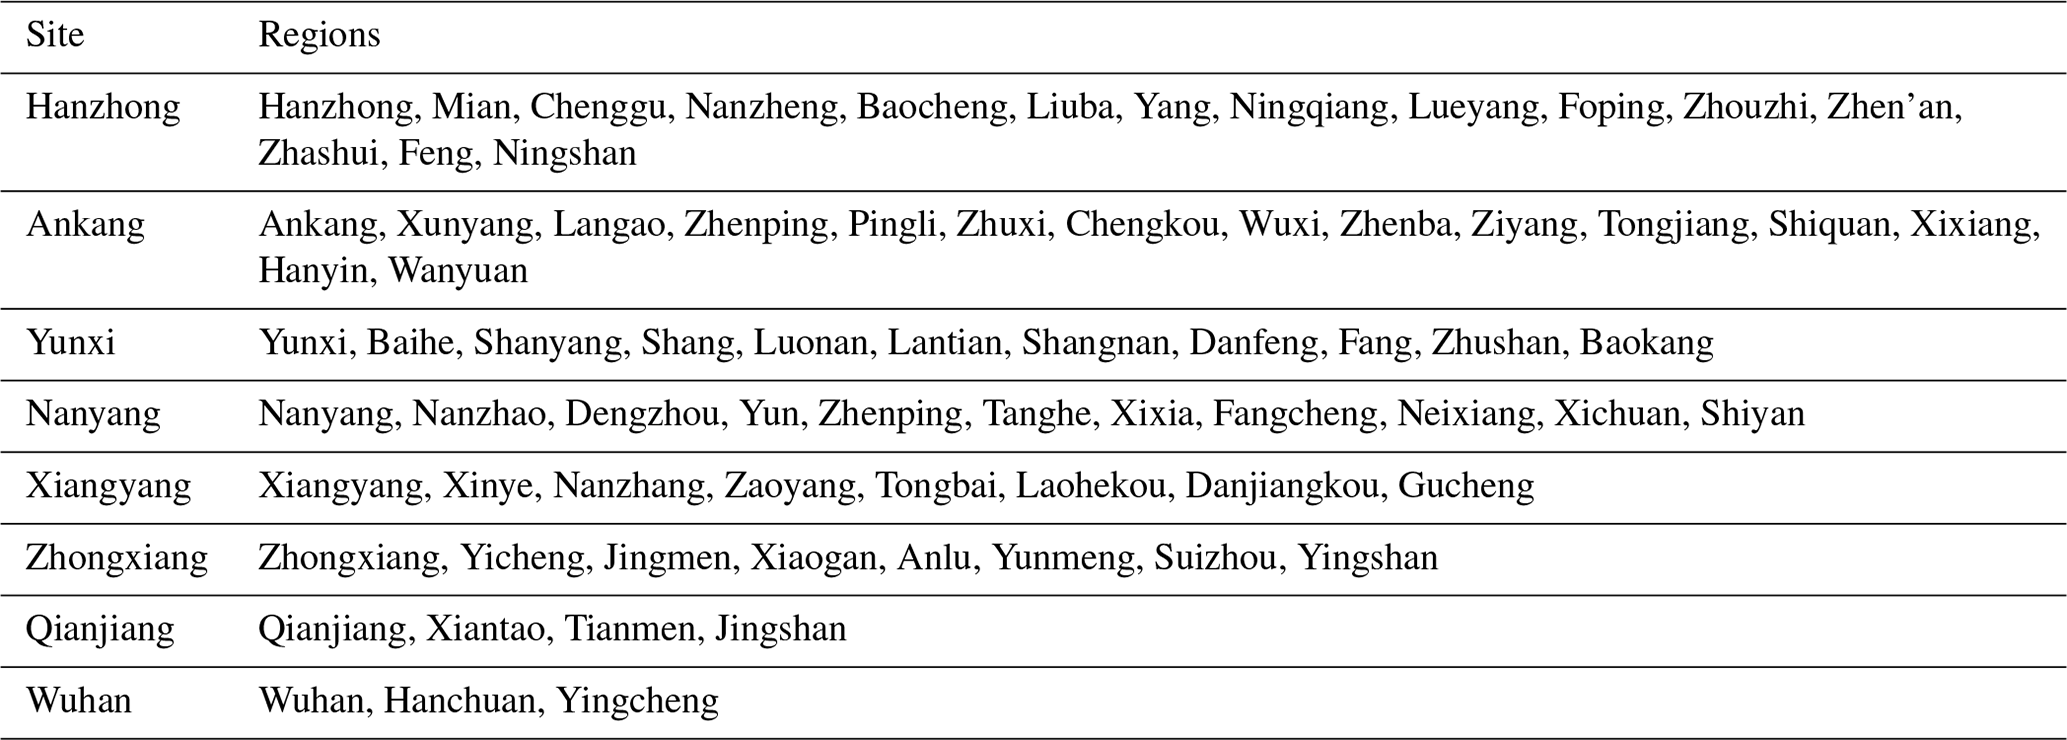
Based on the above methods and the characteristics of the spatial and temporal distribution of drought and flood historical data in HRB, and following the principle of uniform spatial distribution and the abundance of historical data, a total of eight sites were determined for constructing drought and flood grade series. These sites are Hanzhong, Ankang, Yunxi, Nanyang, Xiangyang, Zhongxiang, Qianjiang, and Wuhan, which also possess stations for modern meteorological observations within the HRB (Fig. 1). Among them, four were used in the Atlas, but the data have been renewed with additional records from the documents. The grade data for the four new sites were completely developed in this study. The name of each site is the name of the county and municipality. However, the droughts and floods the site represents were not limited to the administrative area to which its name refers and encompassed a particular geographical area around it (Table 2).
Table 2Eight sites of drought and flood grade sequence and the spatial ranges (regions) they represented in the HRB during 1426–1950.
A total of 4328 records of droughts and floods in the HRB from 1426–1950 were collected from the abovementioned historical documents. Historical documents have the common feature of “the closer to the present day, the more detailed and richer the record; the further from the present day, the less documented” (Zheng et al., 2014). Simultaneously, there are also sudden jumps in the number of records, which were mainly due to dynastic changes and technological progresses.
In order to evaluate and correct the nonuniformity of the number of records over time, we counted the number of local chronicles and archives before 1951 in the study area with reference to the method reported in Yang and Han (2014). On this basis, a homogeneity test of the number of available data at 95 % confidence level was performed to determine whether there were systematic biases in the available records. It was revealed that there was a significant abrupt change in the number of records in 1812, indicating a significant increase in the number of local records and archival materials in the 1810s. Furthermore, after 1951, with the construction and development of the modern meteorological observation network, the number of meteorological observation stations in the HRB increased significantly, and precipitation observation began to enter the period of instrumental measurement, which represents a radical change in data category. Therefore, 1812 and 1951 were regarded as the time nodes of discontinuity in the temporal distribution of the data. The whole period of 1426–2017 was thus divided into three time stages: 1426–1812, 1813–1950, and 1951–2017. The eight sites' average recording rates during these three time periods were 61.11 %, 91.28 %, and 100 %, respectively (Fig. 2).
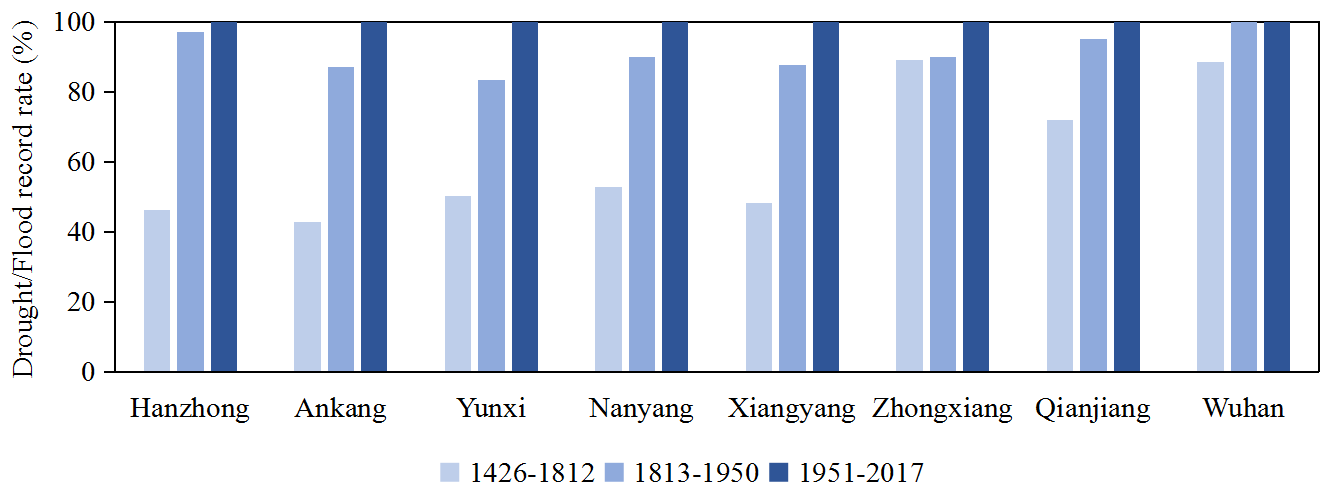
The key to this method is a phased evaluation approach, which constructs a platform for comparison between historical periods and historical as well as instrumental data. That is, because of the nature of “concerning only disasters but not normal conditions” in the historical documents (Zheng et al., 2014), the average recording rates suggest that a significant proportion of drought and flood events were recorded in the HRB from 1426–1950. Even in the period when the average rate of data recording at a single site was lowest (42.6 % for Ankang during 1426–1812), it was greater than 20 % (i.e., the ideal frequency of extreme droughts and floods) and therefore still met the needs of the study.
Precipitation anomaly percentages were calculated for May–September of 1951–2017. The method is annual May–September precipitation minus average May–September precipitation divided by average May–September precipitation (both annual and average May–September precipitation is calculated based on precipitation data for each site from May–September for 1951–2017, and average May–September precipitation is the mean of annual May–September accumulated precipitation in the whole period). The precipitation anomaly percentages at the eight sites were then averaged to give the basin-averaged precipitation anomaly percentages for the HRB. Figure 3 shows a comparison of the drought and flood grades established in this study and the precipitation anomaly percentages during the period of 1951–2017. The drought and flood grades and the precipitation anomaly percentages were highly consistent in interannual to decadal-scale variability, and their correlation passed the 0.01 significance test. Therefore, the drought and flood grades of the instrumental measurement period calculated using the method in the Atlas are able to indicate the precipitation change well, and they can be directly connected with the drought and flood grades of the historical period for use in the following analysis. The applicability of the procedure was also confirmed in previous studies (Wang and Zhao, 1979; Fang et al., 2014).
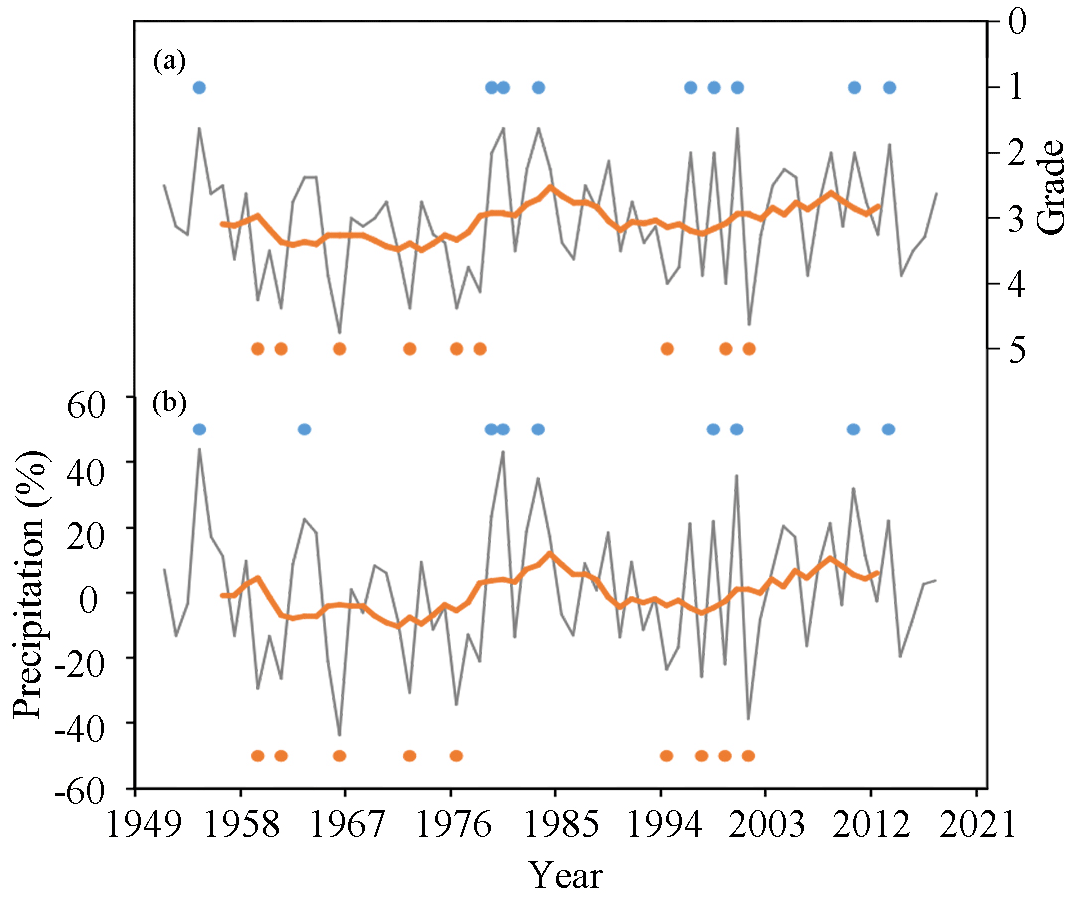
Figure 3The comparison of drought and flood grades (a) and precipitation anomaly percentage (b) in the HRB during 1951–2017. Blue dots indicate extreme flood years, and orange dots indicate extreme drought years.
In addition, there were missing data records at each site in historical periods; the more documented periods usually have richer records of droughts and floods and vice versa. However, the lack of data would not significantly impact the proportion of droughts and floods in the available drought and flood records. Therefore, the following standards were used to identify extreme drought and flood events in the basin (Hao et al., 2010): firstly, the number of sites with a drought or flood grade of 3 (i.e., a normal year) out of the total number of sites recorded in the same year does not exceed 25 % of the total number of sites recorded. Secondly, among the sites with records of droughts and floods (i.e., except for sites with a drought or flood grade of 3), at least 75 % of the sites have droughts or floods at the same time; meanwhile, at least two of these adjacent sites were experiencing either severe drought (i.e., grade 5 drought) or severe flood (i.e., grade 1 flood) at the same time. If the above two conditions were met, the year could be identified as a year of extreme drought or flood in the basin.
2.3.2 Inverse distance weighted (IDW)
The inverse distance weighted (IDW) method creates a weighted average using the distance between the interpolation point and the sample point as a parameter. The closer the sample point to the interpolation point, the greater the weight given. Xie et al. (2018) used four spatial interpolation methods with the upper Sangamon basin and analyzed the accuracy of the interpolation results separately. They found that IDW had the highest interpolation accuracy when the study area was small and the number of meteorological observation stations was relatively small (nine sites of observational stations in their analysis; Xie et al., 2018). In this study, we used ArcGIS10.6 with the IDW built in to map the data for the study sites and to visualize the spatial variability of the drought and flood grades (Vicente-Serrano et al., 2003; Xie et al., 2018).
Table 3Statistics on historical extreme droughts and floods per century for 1426–2017.
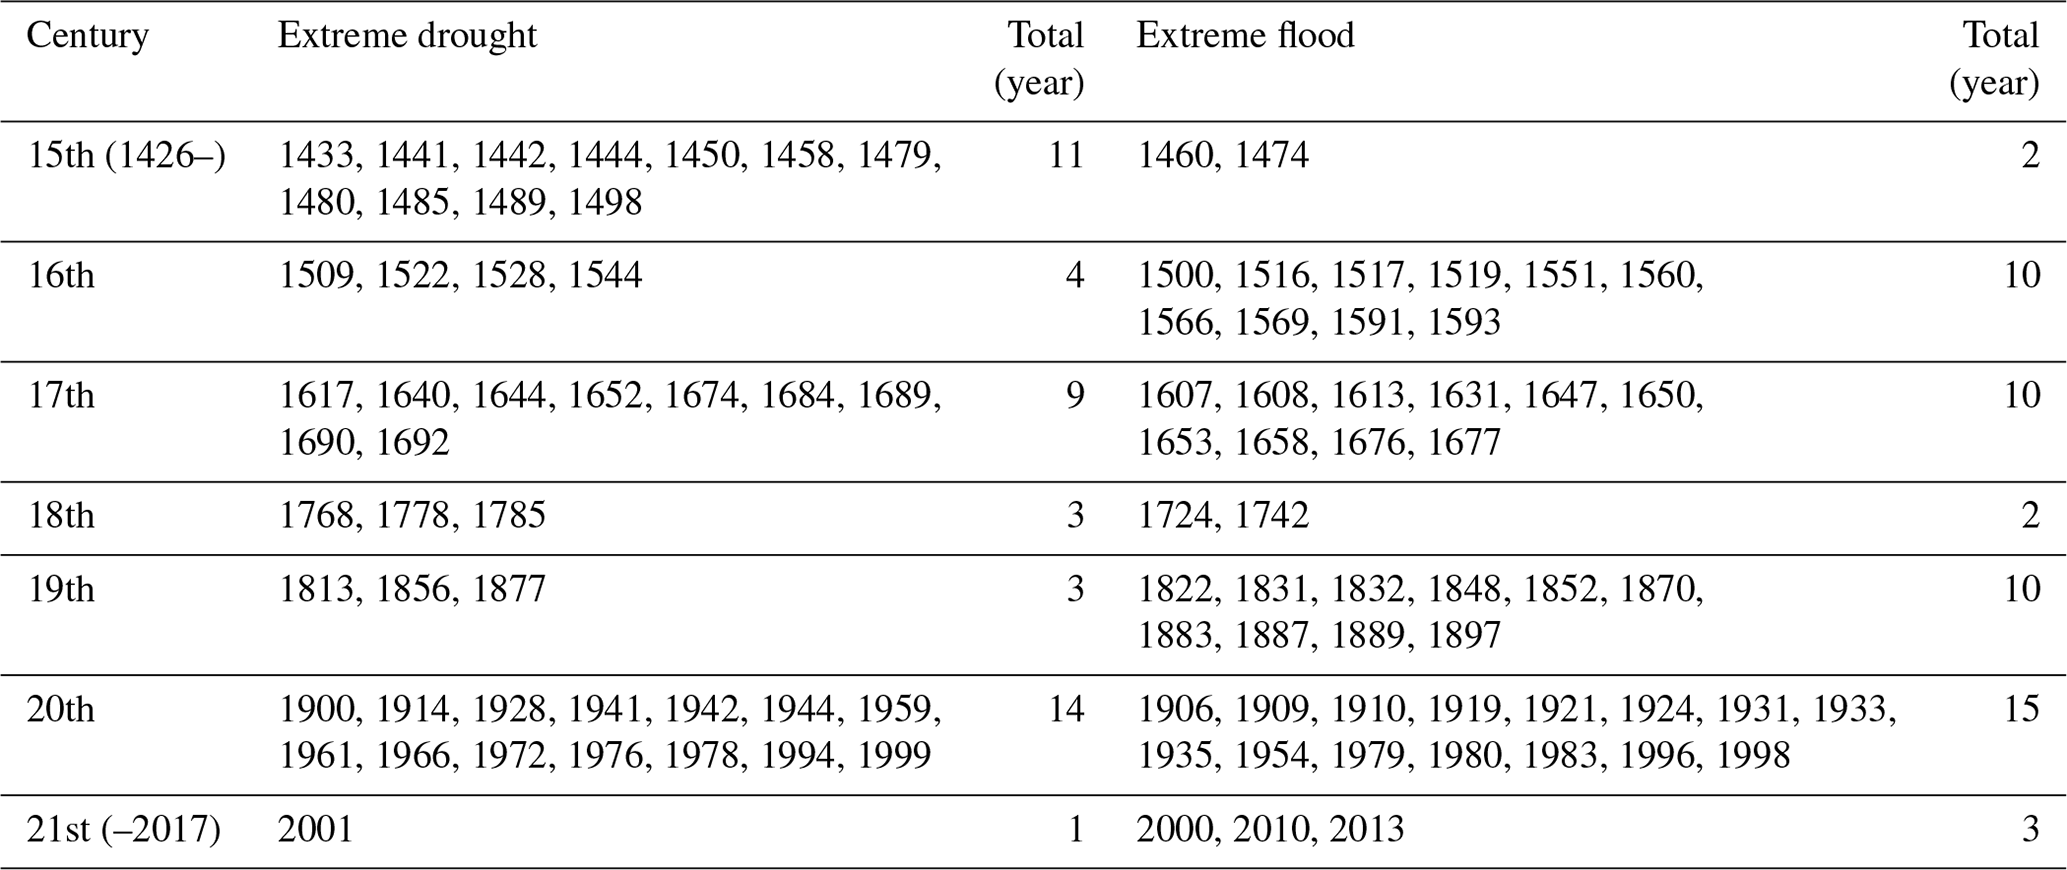
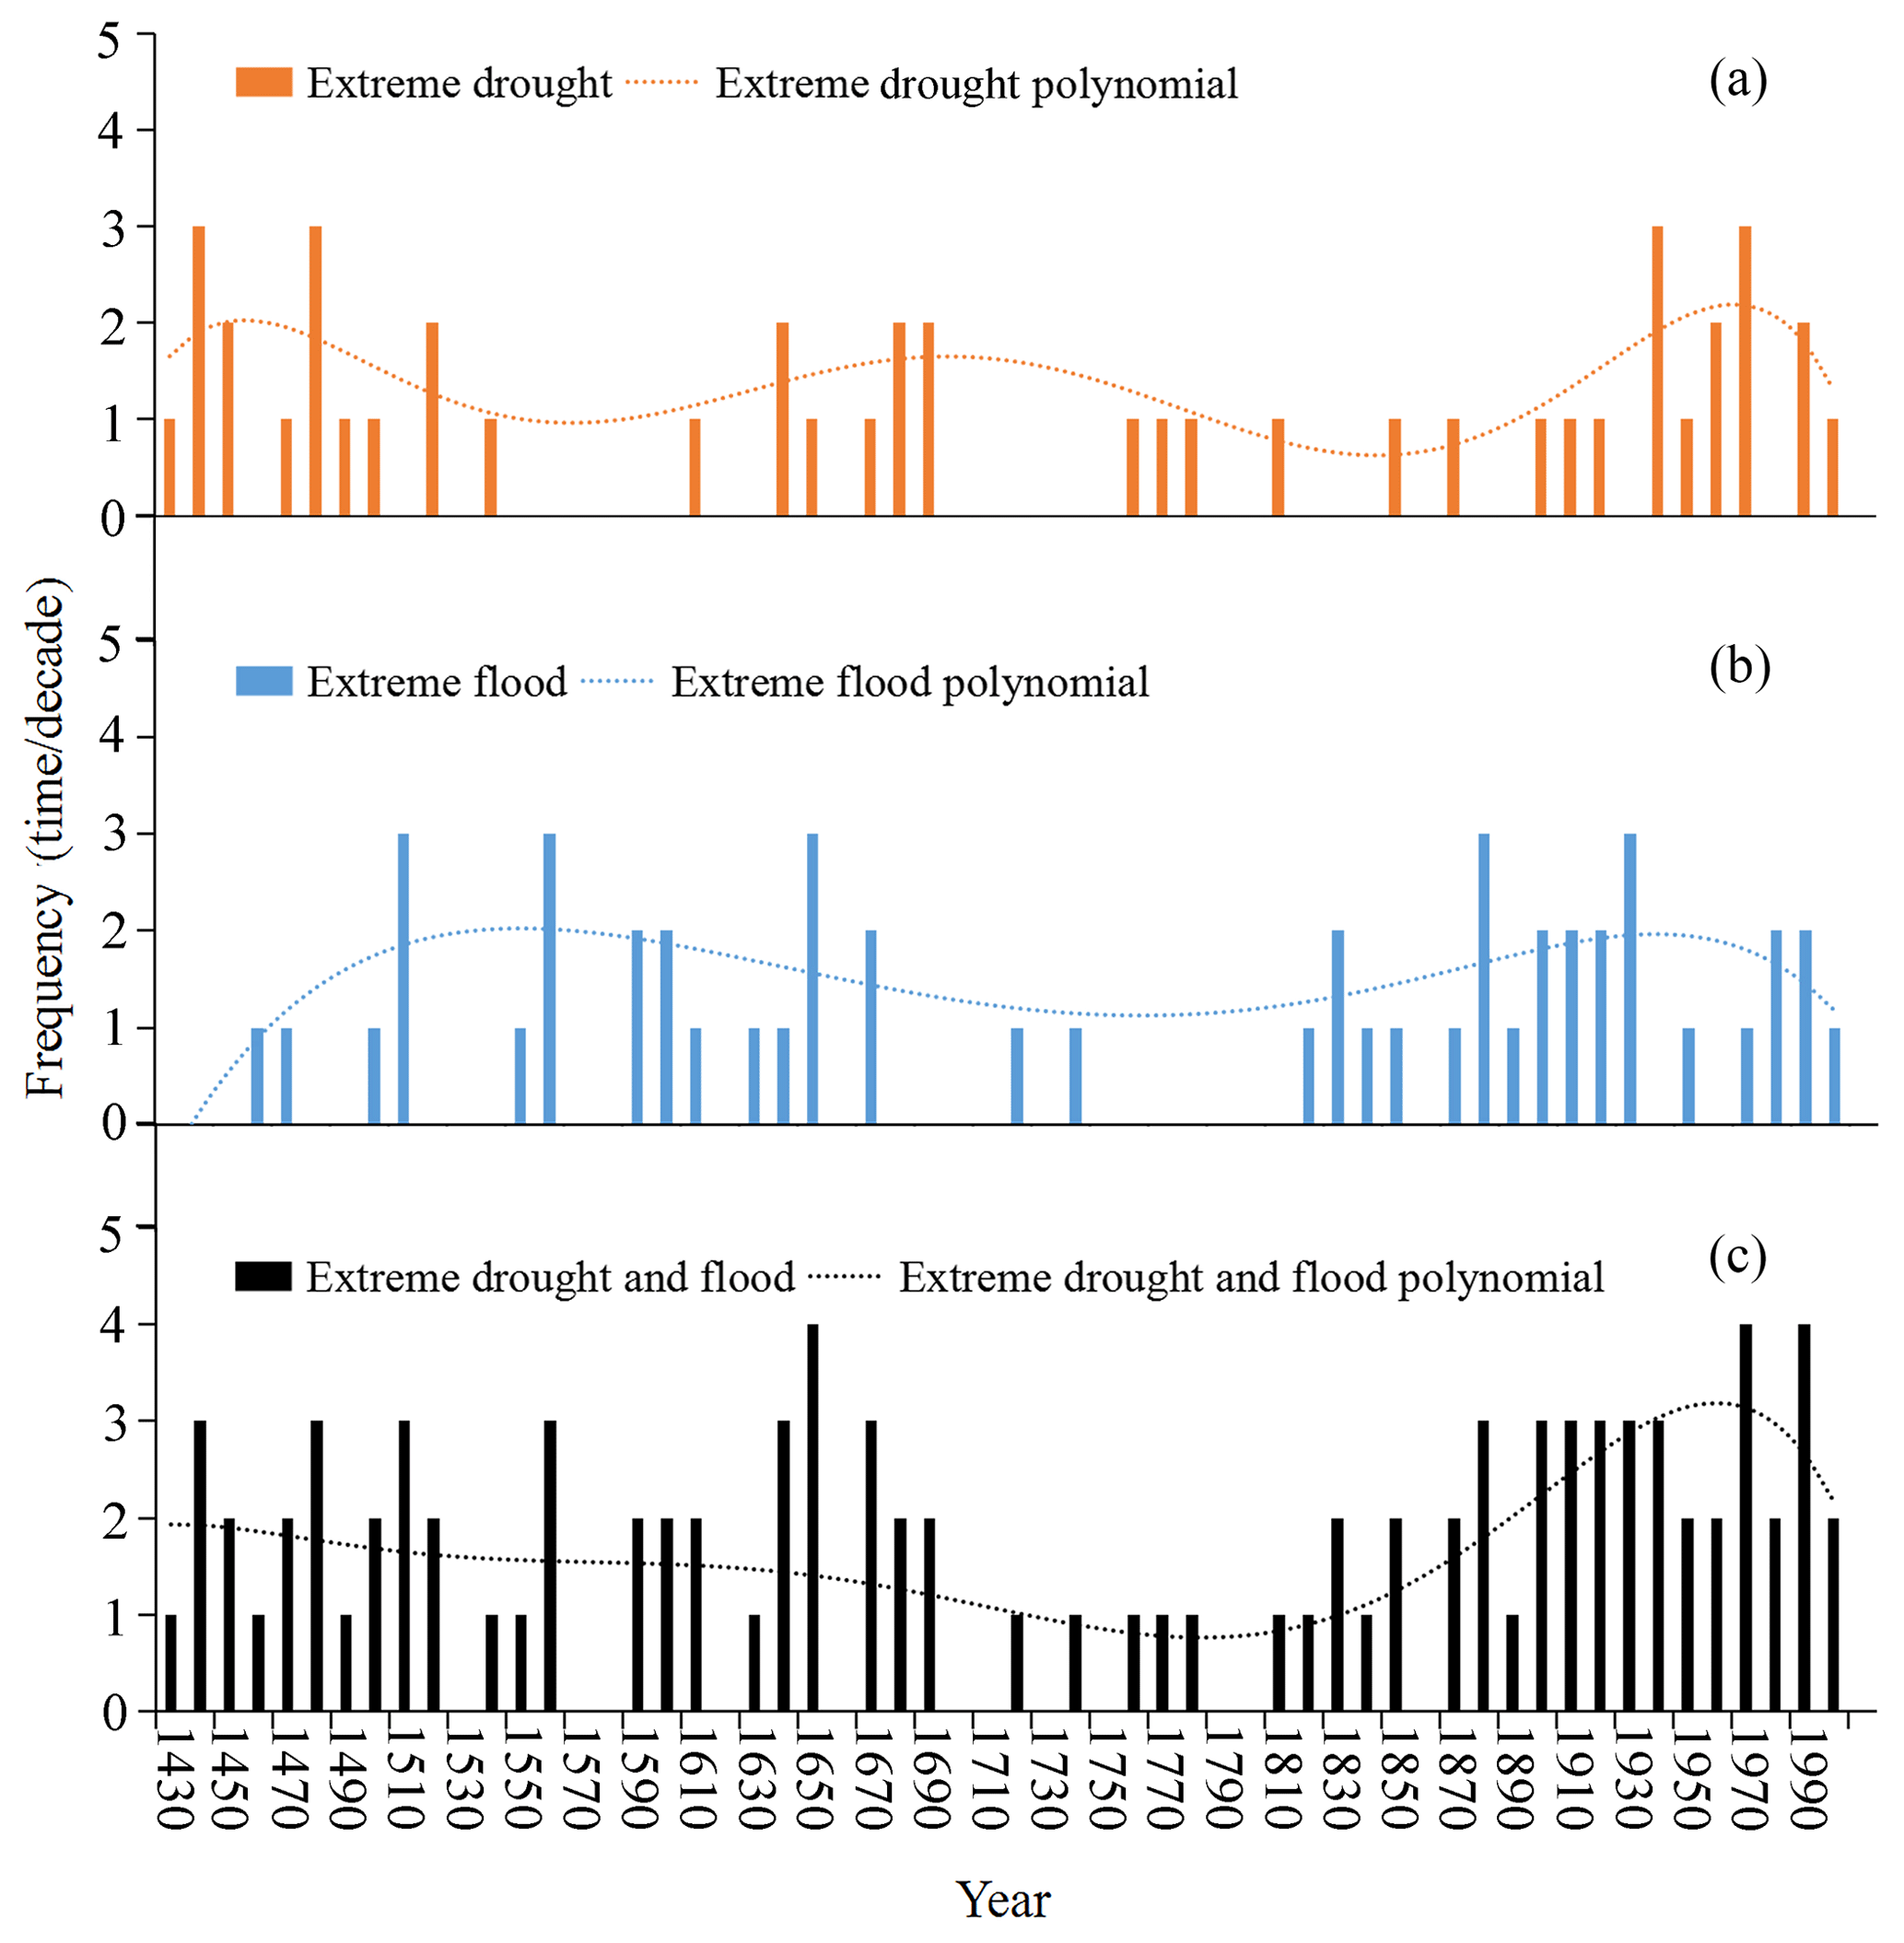
Figure 4Change in the frequency of extreme droughts and floods during 1430–2009 (times per decade). (a) Years of extreme droughts; (b) years of extreme floods; (c) years of extreme droughts and floods. The dotted line is the sixth-order polynomial fit curve.
3.1 Variation characteristics of extreme drought and flood events
There were 45 extreme drought events and 52 extreme flood events identified in the period 1426–2017 (Table 3). They account for 7.6 % and 8.8 % of the total number of years, respectively, equivalent to an extreme drought event every 13 years and an extreme flood event every 11 years. The occurrence probability of extreme flood years is marginally higher than that of extreme drought years. During this period, extreme drought and flood events had prominent phased and clustering characteristics of occurrences. Figure 4 shows the statistical results (frequency) of the extreme drought and flood events per decade (1430–2009), and the following features can be generalized.
-
High-incidence periods of extreme drought events occurred in the 15th to early 16th, 17th, and 20th centuries and lasted around 100 years. Previous studies showed that the frequency of drought disasters in the HRB was highest in the 1480s and 1630s (Wang and Guo, 2010); 1628–1641 and 1900–1970 were the two periods with a high occurrence of mega-drought disasters in the upper HRB, occurring once every 1.67 and 3.33 years, respectively, on average (Yin, 2015). Furthermore, 1441–1442, 1479–1480, 1689–1690, and 1941–1942 were consecutive years of extreme droughts. These continuous extreme events had a more severe impact on agricultural and social life. For example, during 1941–1942, the HRB suffered extremely rare successive years of summer and autumn drought without any soaking rain, and the seedlings withered without harvest. This tremendous northern drought, centered on Henan province (Dong et al., 2014), not only led to crop failures and food shortages but also caused millions of refugees to die as a result of famine (Li, 2019).
The 20th century saw the highest incidence of extreme drought events, occurring about once every 7 years. There was a severe drought in eastern northwest China in 1928, with annual precipitation comparable to that during the Ming Chongzhen drought (the extreme drought that occurred from 1637–1643 affected more than 20 provinces in northern China; Tan, 2003). There are many records in the HRB regarding the drought in 1928. “The sun is harsh in the summer, and the rivers are parched” (Shaanxi Volume; Wen, 2005b). “The victims had eaten all the bark and grass within hundreds of miles and recently had to dig the soil in the mountains to eat, causing many of them to die from dry stools” (Henan Volume; Wen, 2005a). “Last year (1928), a severe drought affected a vast area within a thousand li (ancient Chinese length unit, equivalent to 0.5 km) radius from spring to summer” (Hubei Volume; Wen, 2007). The upper reaches of the Danjiangkou Reservoir (completed in 1973, and it is now the water source of the South–North Water Diversion Middle Line Project) was in drought for years during the late 20th century, especially since the mid-1990s, and the average annual precipitation in the 1990s was 11.6 % less than the climatological mean (Chen et al., 2006); in 1997, the HRB was in continuous drought in summer and autumn, and the annual precipitation was only 605 mm (Wang and Guo, 2010).
However, there were no extreme drought events in some of the historical periods. These years included the 1460s, 1510s, 1530s, 1550–1600s, 1620–1630s, 1660s, 1700–1750s, 1790–1800s, 1820–1840s, 1860s, 1880–1890s, 1930s, and 1980s. In these periods, the HRB experienced relatively normal climate conditions or extreme rainstorms and floods.
-
The high-incidence periods of extreme flood events occurred in the 16th to 17th centuries and the 19th to 20th centuries and lasted around 200 years. The 19th to 20th centuries saw the highest incidence of extreme flood events, occurring once every 8 years. The recently more frequent extreme floods have been reported in previous studies. Yin and Huang (2012) showed that severe floods with flow rates greater than 15 000 m3 s−1 occurred 20 times in the Ankang area only from 1960 to 2010. They also found that the highest frequency of floods occurred in the 1980s, when there were eight severe floods in Ankang, with the maximum flood flow reaching 31 000 m3 s−1. In particular, the worst flood in the last 100 years (once in 130 years) occurred in Ankang in July 1983, which caused the inundation of the entire city of Ankang, and nearly 1000 people died (Shaanxi province local history codification committee, 2000). From 1822 to 1955, there were 130 breaches of the mainstream embankments during 73 years in the middle and lower reaches of the HRB, with an average of about one breach in 2 years (Guo et al., 2020). In 1870, the most enormous flood in the Yangtze River Basin in more than 800 years occurred (Yao, 1991), flooding 30 000 km2 of the Jianghan Plain (Shi et al., 2004), including the downstream areas of the HRB. In the extreme flood of 1931, Hankou (Wuhan) registered a record (1840–2000) high water level (28.3 m), with a peak flow of 50 000 m3 s−1 at Danjiangkou and 145 000 deaths across the Yangtze River Basin (Shi et al., 2004).
During the first high-incidence period of extreme floods, extreme rainstorms and flood events occurred once every 10 years, which is a little bit less frequent than those in the second period of extreme floods, but still more frequent than other historical periods. Previous studies showed that, after 1550, the climate in the Yangtze River Basin was very wet, and there were many severe floods in the following 70 years (Ge, 2011). For example, in 1560, there was a basin-wide extreme flood in the Yangtze River Basin second only to 1870 (Ge, 2011). The HRB was seriously affected, and there were many records of this flood. “There was a severe flood and access to the city was only possible by boat from August onwards, a situation that lasted until winter” (Zhang, 2004). “There was a severe flood and many people and livestock were drowned” (Zhang, 2004). During the Northern Wei Dynasty (386–534), Lake Taibai (currently located in Xiantao, Hubei province) was formed by the convergence of tributaries of the Hanjiang River and became the largest lake in the Jianghan Plain in the 16–17th centuries. However, it soon began to be silted up, probably mainly due to the Yangtze and Hanjiang rivers frequently flooding as well as human activities, which led to a sharp increase in sediment, finally becoming a low-lying swamp by the end of the 19th century (Yao, 1991).
There were consecutive years of extreme floods in history, which led to more severe disasters in the basin. These include the years 1516–1517, 1607–1608, 1676–1677, 1831–1832, 1909–1910, and 1979–1980. However, there were no extreme flood events in the years 1430s–1450s, 1480–1490s, 1520–1540s, 1570–1580s, 1620s, 1660s, 1680–1710s, 1730s, 1750–1810s, 1860s, 1940s, and 1960s.
-
The 18th century was a period of relatively few extreme drought or flood events, with three extreme drought events, two extreme flood events, and approximately one extreme drought or flood event every 2 decades. The sparsity of extreme droughts and floods in this century was reported in a previous study applying historical documents (Wang and Guo, 2010). The stalagmite records from central China and the hydrographic stone inscription from the Three Gorges area of the Yangtze River also suggest fewer droughts and floods in the 18th century (Qin et al., 2020). Liu et al. (2011) applied high-resolution stalagmite δ18O and high-precision 230Th dating data from Wanxiang Cave, Wudu county (33∘ N, 104∘ E), combined with historical drought and flood index series from the surrounding area to examine the precipitation variation of the last 500 years at the fringe belt of the summer monsoon. They found that 1701–1780 was a stable period for precipitation, with above-average precipitation and no extreme drought or flood events. Qin et al. (2020) analyzed the frequency of severe drought events in the Yangtze River's upper reaches through the hydrographic stone inscriptions of Baiheliang stonefish in the Three Gorges Reservoir area (31∘ N, 109∘ E) of the Yangtze River. They found that there were significantly fewer records of extreme drought events in the 18th century. Studies combining ice cores, tree rings, lake sediments, and historical climate records indicate that the 18th century was a relatively warm period during the Little Ice Age, when annual mean temperatures in China began to rise slightly and climatic conditions improved significantly relative to the previous period (Yang et al., 2002).
-
The 20th century was a common period of highly frequent extreme drought and flood events, with 14 extreme droughts and 15 extreme floods occurring, as well as approximately 1 extreme drought or flood event every 3–4 years. Previous studies showed that annual precipitation in the Hanjiang River Basin has decreased since 1960, and drought disasters have increased. At the same time, flood disasters became more frequent because precipitation was more concentrated in the summer, and interannual fluctuations in precipitation also increased significantly (Yin et al., 2010). For example, floods occurred in the Tangbai River Basin, a tributary of the HRB, in 1919 and 1953, but the floods were followed by 2 months of no rain and then a severe drought (Institute of Geography of Chinese Academy of Sciences, 1957). Tree-ring reconstruction studies (Liang et al., 2003; Zhang et al., 2005) indicated that the monsoon precipitation variability in northern China over the last 100 years has been high, with significant wet and dry changes and widespread extreme drought events. Ding et al. (2007) and Ren et al. (2010) pointed out that in the context of global warming, the frequency and intensity of extreme precipitation events and the extent of drought in China increased during the 20th century; especially in the past half-century, extreme precipitation in northwestern and central China has increased significantly. However, the drought events in northern, northeastern, and southwestern China have also increased significantly in frequency and severity. The analysis results of this study are in good agreement with the previous research conclusions but at the same time show the uniqueness of the 20th extreme precipitation change in the history of the last centuries.
-
The frequency of extreme droughts was relatively high in the 20th century, especially after the 1930s. Historically, however, the frequency of extreme drought in the 20th century did not appear to be the highest, with a similar frequency of extreme drought events also occurring in the mid-15th century. The decline in the frequency of extreme droughts during the 18th–19th centuries amid the Little Ice Age is equally evident in Fig. 4. The extreme flood frequency appears to have been higher in the 20th century and significantly more frequent than in the 17th and 19th centuries when the HRB also underwent a high frequency of extreme flood events.
3.2 Spatial characteristics of historical extreme droughts and floods
The frequency of grade 1 floods and grade 5 droughts at each site is shown in Table 4, and the distributions of frequency are plotted as a scatterplot using ArcGIS 10.6 in Fig. 5. The spatial patterns of the frequency of the extreme droughts and floods in the HRB varied significantly. The high-frequency centers of extreme floods and extreme droughts are both distributed in the middle and lower reaches of the HRB. The Zhongxiang site in the middle reaches of the HRB had a total of 60 extreme droughts, while those at the Nanyang site are relatively less frequent, with a total of 30. The Qianjiang site in the lower reaches of the HRB had a total of 67 extreme floods, and the Ankang site, which is in the upper reaches, experienced relatively fewer extreme floods (40). The frequency of both extreme floods and extreme droughts is generally higher in the middle and lower reaches than that in the upper reaches.
Table 4The counts of extreme (grade 5) droughts and extreme (grade 1) floods at each site in the HRB during 1426–2017.
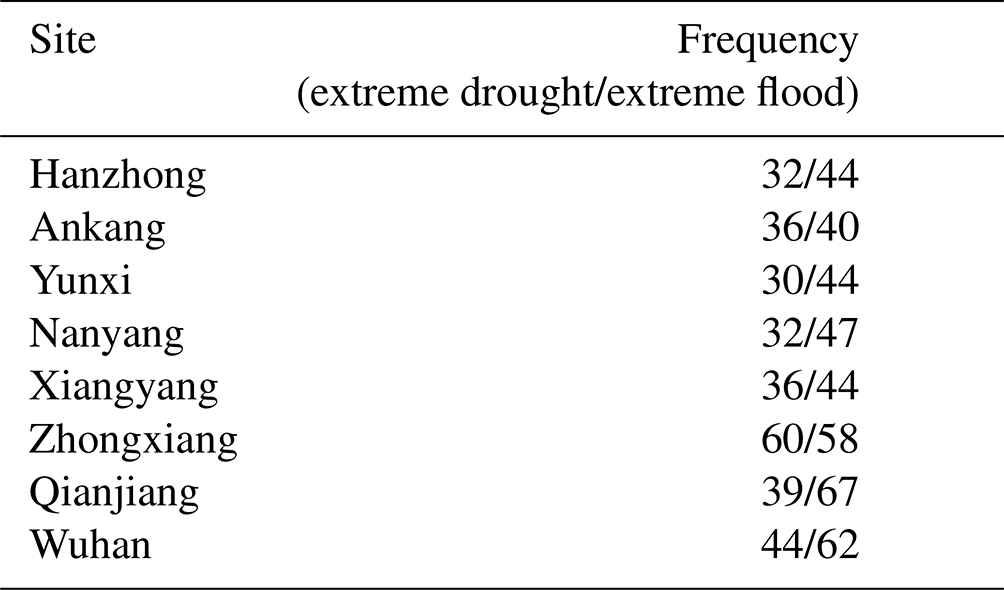
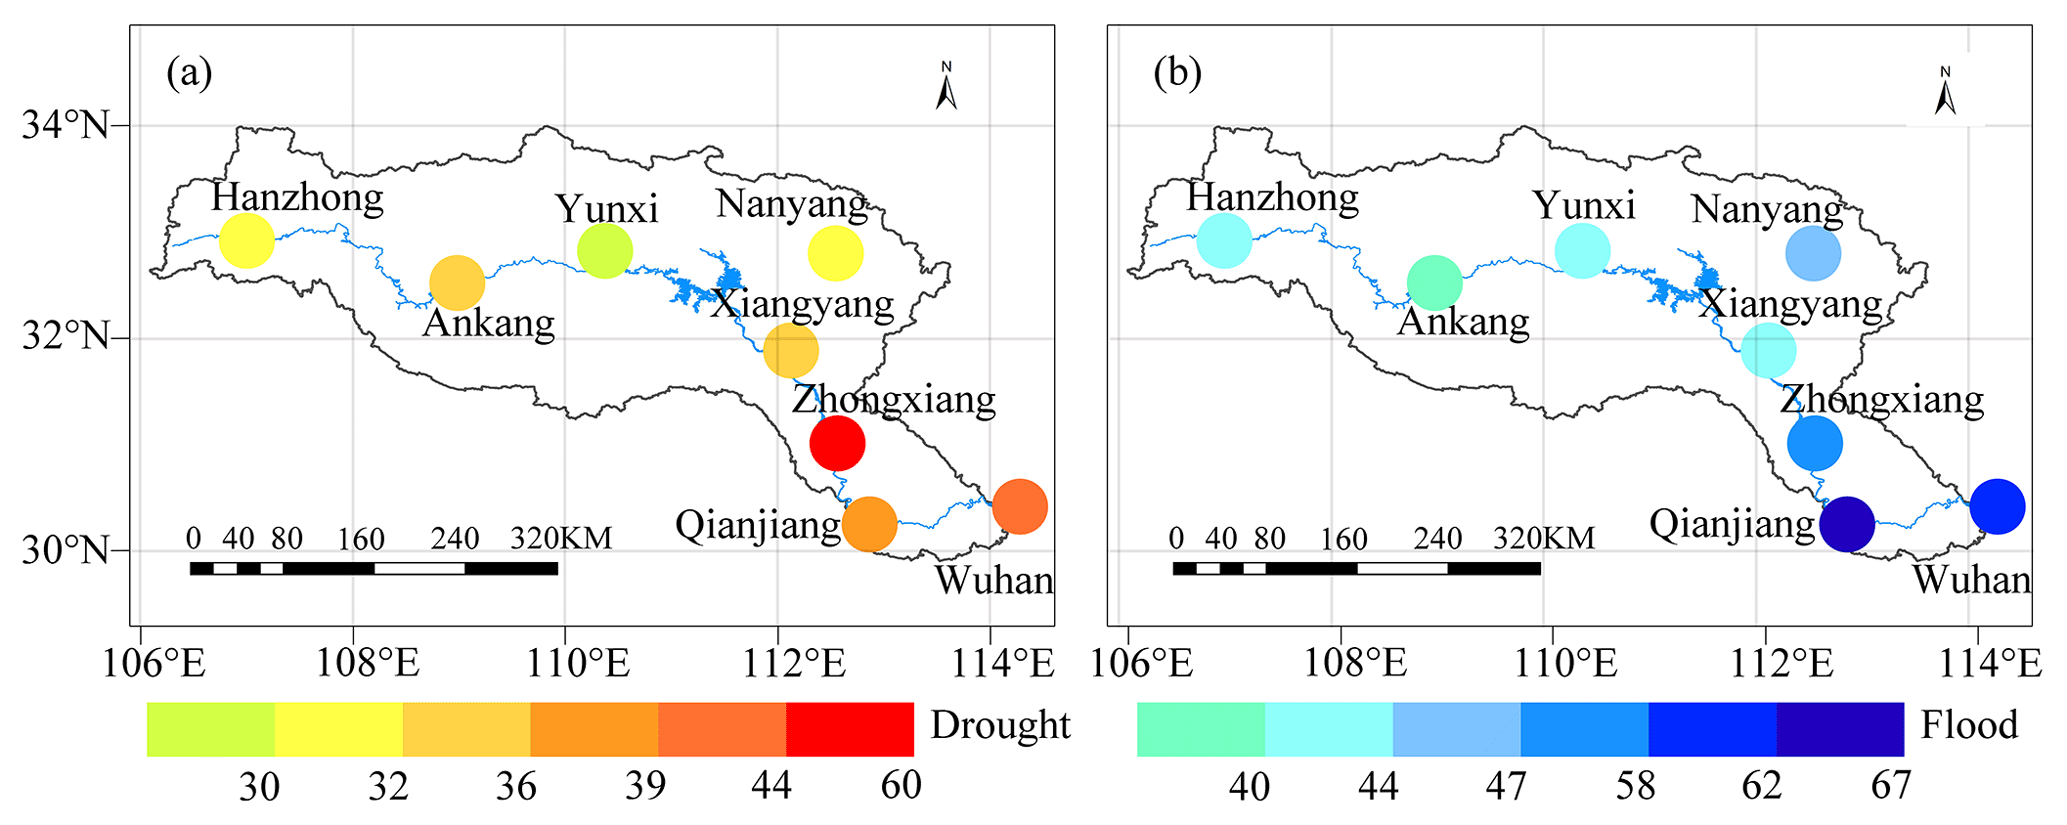
Figure 5Spatial distribution of the total years of extreme (grade 5) droughts (a) and extreme (grade 1) floods (b) in the HRB during 1426–2017.
According to previous studies (Institute of Geography of Chinese Academy of Sciences, 1957; Water Resources Commission of the Ministry of Water Resources, 2002), the upper reaches of the HRB are more water-scarce and relatively less resistant to drought than the middle and lower reaches. However, the frequency of drought is the highest in the hilly and mountainous areas in the middle reaches of the HRB. That is because the hilly and mountainous areas in the middle reaches have highly arable land but a relatively low ground water table and river flow and also fewer springs, so in the event of drought, the damage is more serious (Institute of Geography of Chinese Academy of Sciences, 1957). That may be the reason why the drought near the Zhongxiang site in the historical period is relatively more abundantly documented. From Fig. 5, it can also be seen that the frequency of droughts and floods is higher in the middle and lower HRB and plain areas and lower in the mountainous areas in the upper HRB. This is probably because the middle and lower reaches of the HRB were economically developed earlier, with a more concentrated population and more arable land than in the upper reaches. During the Ming and Qing dynasties (1368–1912), the middle reaches of the Yangtze River Plain (including the Jianghan Plain) centered on Hubei province and Hunan province were developed into a national commodity grain supply base. The central government paid a lot of attention to these areas (Zhu, 2018; Lu, 2019), so the lower reaches of the HRB have documental records in more quantity and detail during the historical period relative to the upper reaches (Fig. 2), which may have an influence on the statistical results (Zheng et al., 2014).
Furthermore, the sensitivity of different regions to droughts and floods cannot be ignored. The years of the severest drought and floods were identified for each of the centuries from the 15th–20th centuries (1426–1999). The years of the severest floods in each century are 1474, 1516, 1647, 1742, 1889, and 1931; the years of the severest droughts in each century are 1433, 1528, 1690, 1768, 1877, and 1928. The average drought and flood grades for each site in the above years were calculated separately and spatially interpolated using the IDW. Each site's drought and flood grades were then plotted using ArcGIS10.6 (i.e., Figs. 6 and 7). From the two figures, it was found that the sites of Ankang, Nanyang, and Qianjiang were relatively more likely to be affected by severe drought, while those of Ankang, Xiangyang, and Zhongxiang were relatively more likely to suffer from severe flood. In particular, the sensitivity of Ankang to both droughts and floods is high. Previous studies have shown that the Ankang region is one of the most frequently flooded regions in the northwest (Department of Geography, Shaanxi Normal University, 1986; Ankang City Local History Compilation Committee, 2004), with a highly uneven distribution of precipitation over four seasons. After 1950, although the overall upper HRB was drought-prone and the frequency of floods tended to decrease, the frequency of large floods increased significantly, among which flood events with peak flows exceeding 19 000 m3 s−1 occurred in 1965, 1968, 1974, 1983, 1984, 1987, and 2005 in Ankang (Yin et al., 2010). In comparison, although droughts in the Ankang area are less frequent than floods, they often last longer and have a huge impact on agriculture, making it the most vulnerable area for agricultural droughts in Shaanxi province (Zhang and Yin, 2012; Xu, 2016).
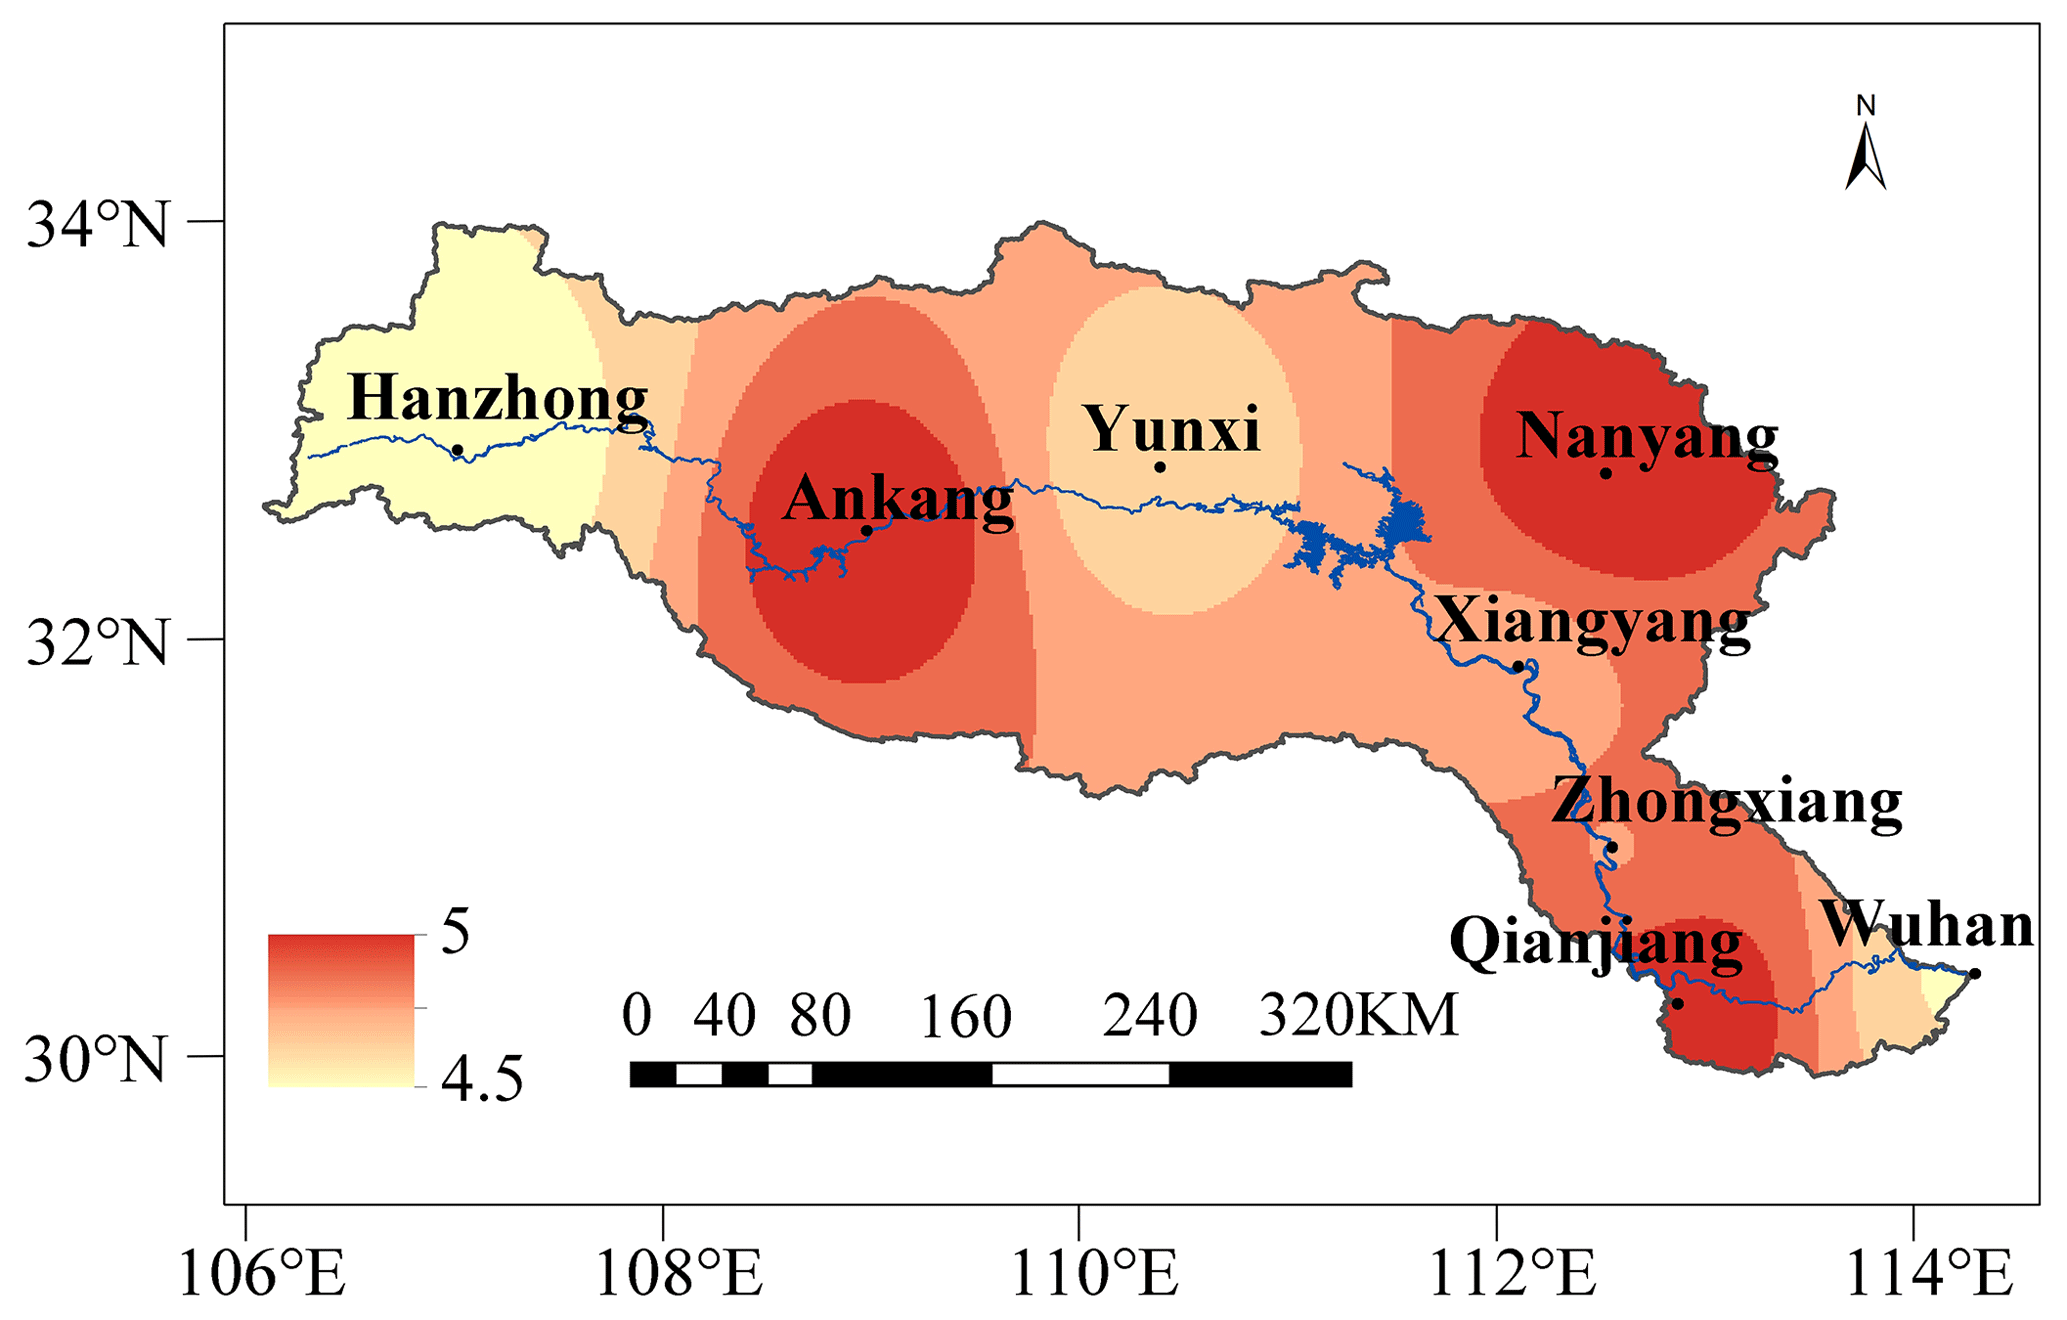
Figure 6Distribution of average drought grades for each site corresponding to the severest drought years in each century. The color bar indicates the grade of drought and flood.
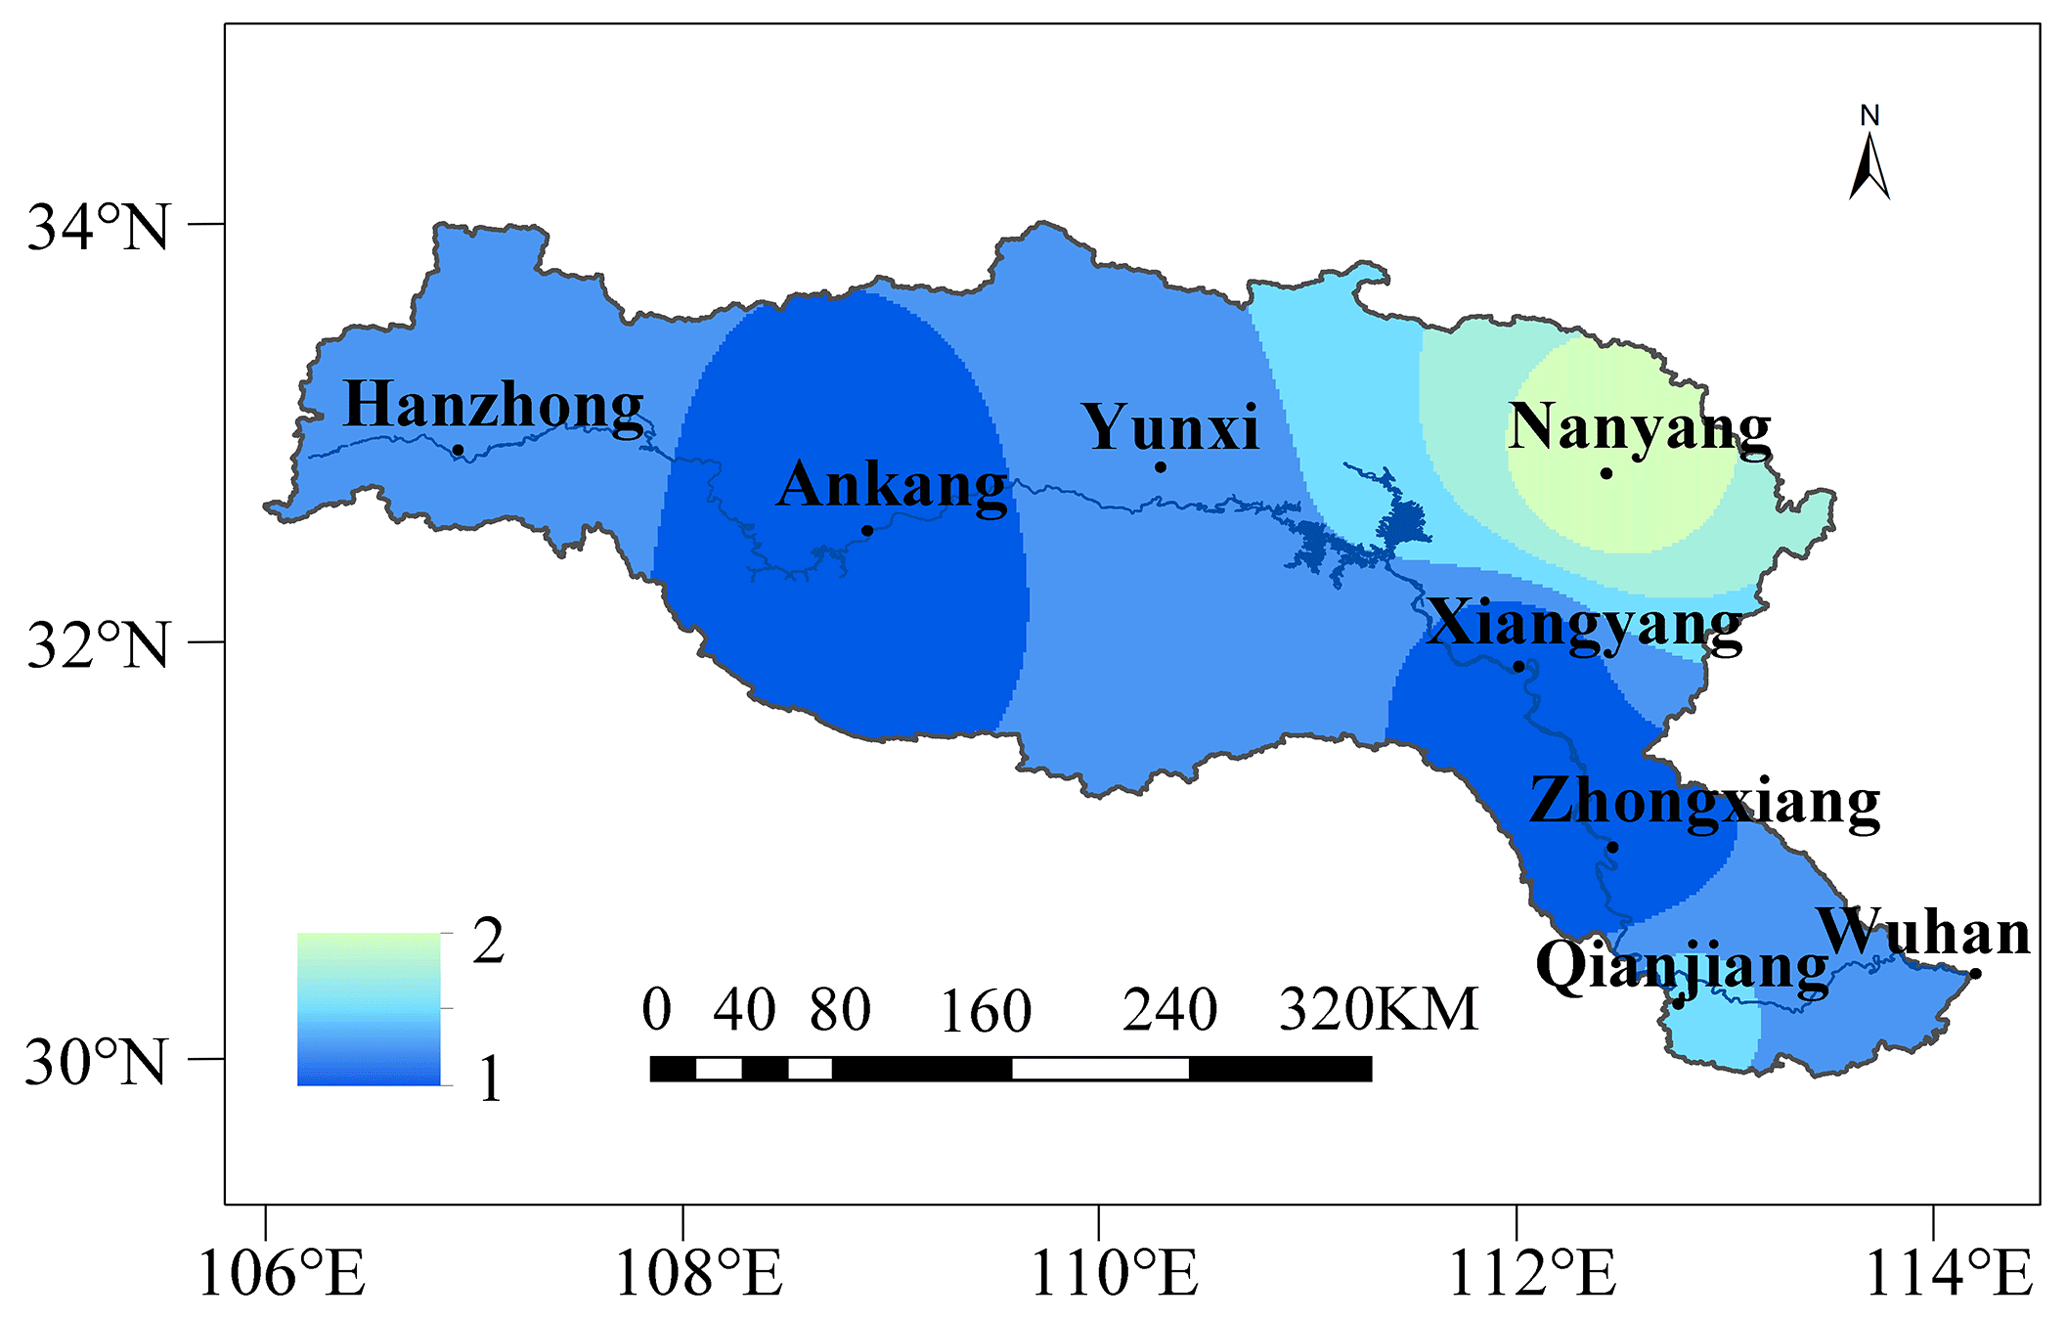
Figure 7Distribution of average flood grades for each site corresponding to the severest flood years in each century. The color bar indicates the grade of drought and flood.
In order to examine the association of the droughts and floods of the HRB with the severe droughts and floods in other regions, we made a compound analysis of drought and flood grades in the HRB when severe droughts occurred in North China (including the lower reaches of the Yellow River and the North China Plain) and severe floods occurred in the Yangtze River. Figure 8 show the results for five representative severe droughts of North China (1637–1643, 1689–1692, 1877–1878, 1928–1930, and 1942–1943 were selected based on Tan, 2003; and Qu et al., 2018) and five representative severe floods in the Yangtze River (1788, 1849, 1935, 1954, and 1998 were selected based on Tao et al., 1998; Luo, 2006; Yang and Zheng, 2008; and Li and Zhou, 2020). It was found that the middle and lower HRB was more sensitive to floods in the Yangtze River Basin, while the upper HRB was more correlated with droughts in North China. In order to verify the correlation between the HRB and North China, the drought and flood grades of the eight sites in the HRB were correlated with the average grade series of North China (Fig. 9; Central Meteorological Bureau, 1981). Significant positive correlations can be seen for each of the eight sites in Fig. 9. Among them, seven sites have significant correlations at the p<0.01 level, and one site (Wuhan) has a significant correlation at the p<0.05 level. The higher positive correlations of drought and flood grades with those of North China as a whole are in the upper reaches of the HRB, and the lower reaches of the river see a lower correlation.

Figure 8The spatial distribution of average drought and flood grades in the HRB during severe droughts in North China (1637–1643, 1689–1692, 1877–1878, 1928–1930, and 1942–1943) and severe floods in the Yangtze River Basin (1788, 1849, 1935, 1954, and 1998). The color bar indicates the grade of drought and flood.
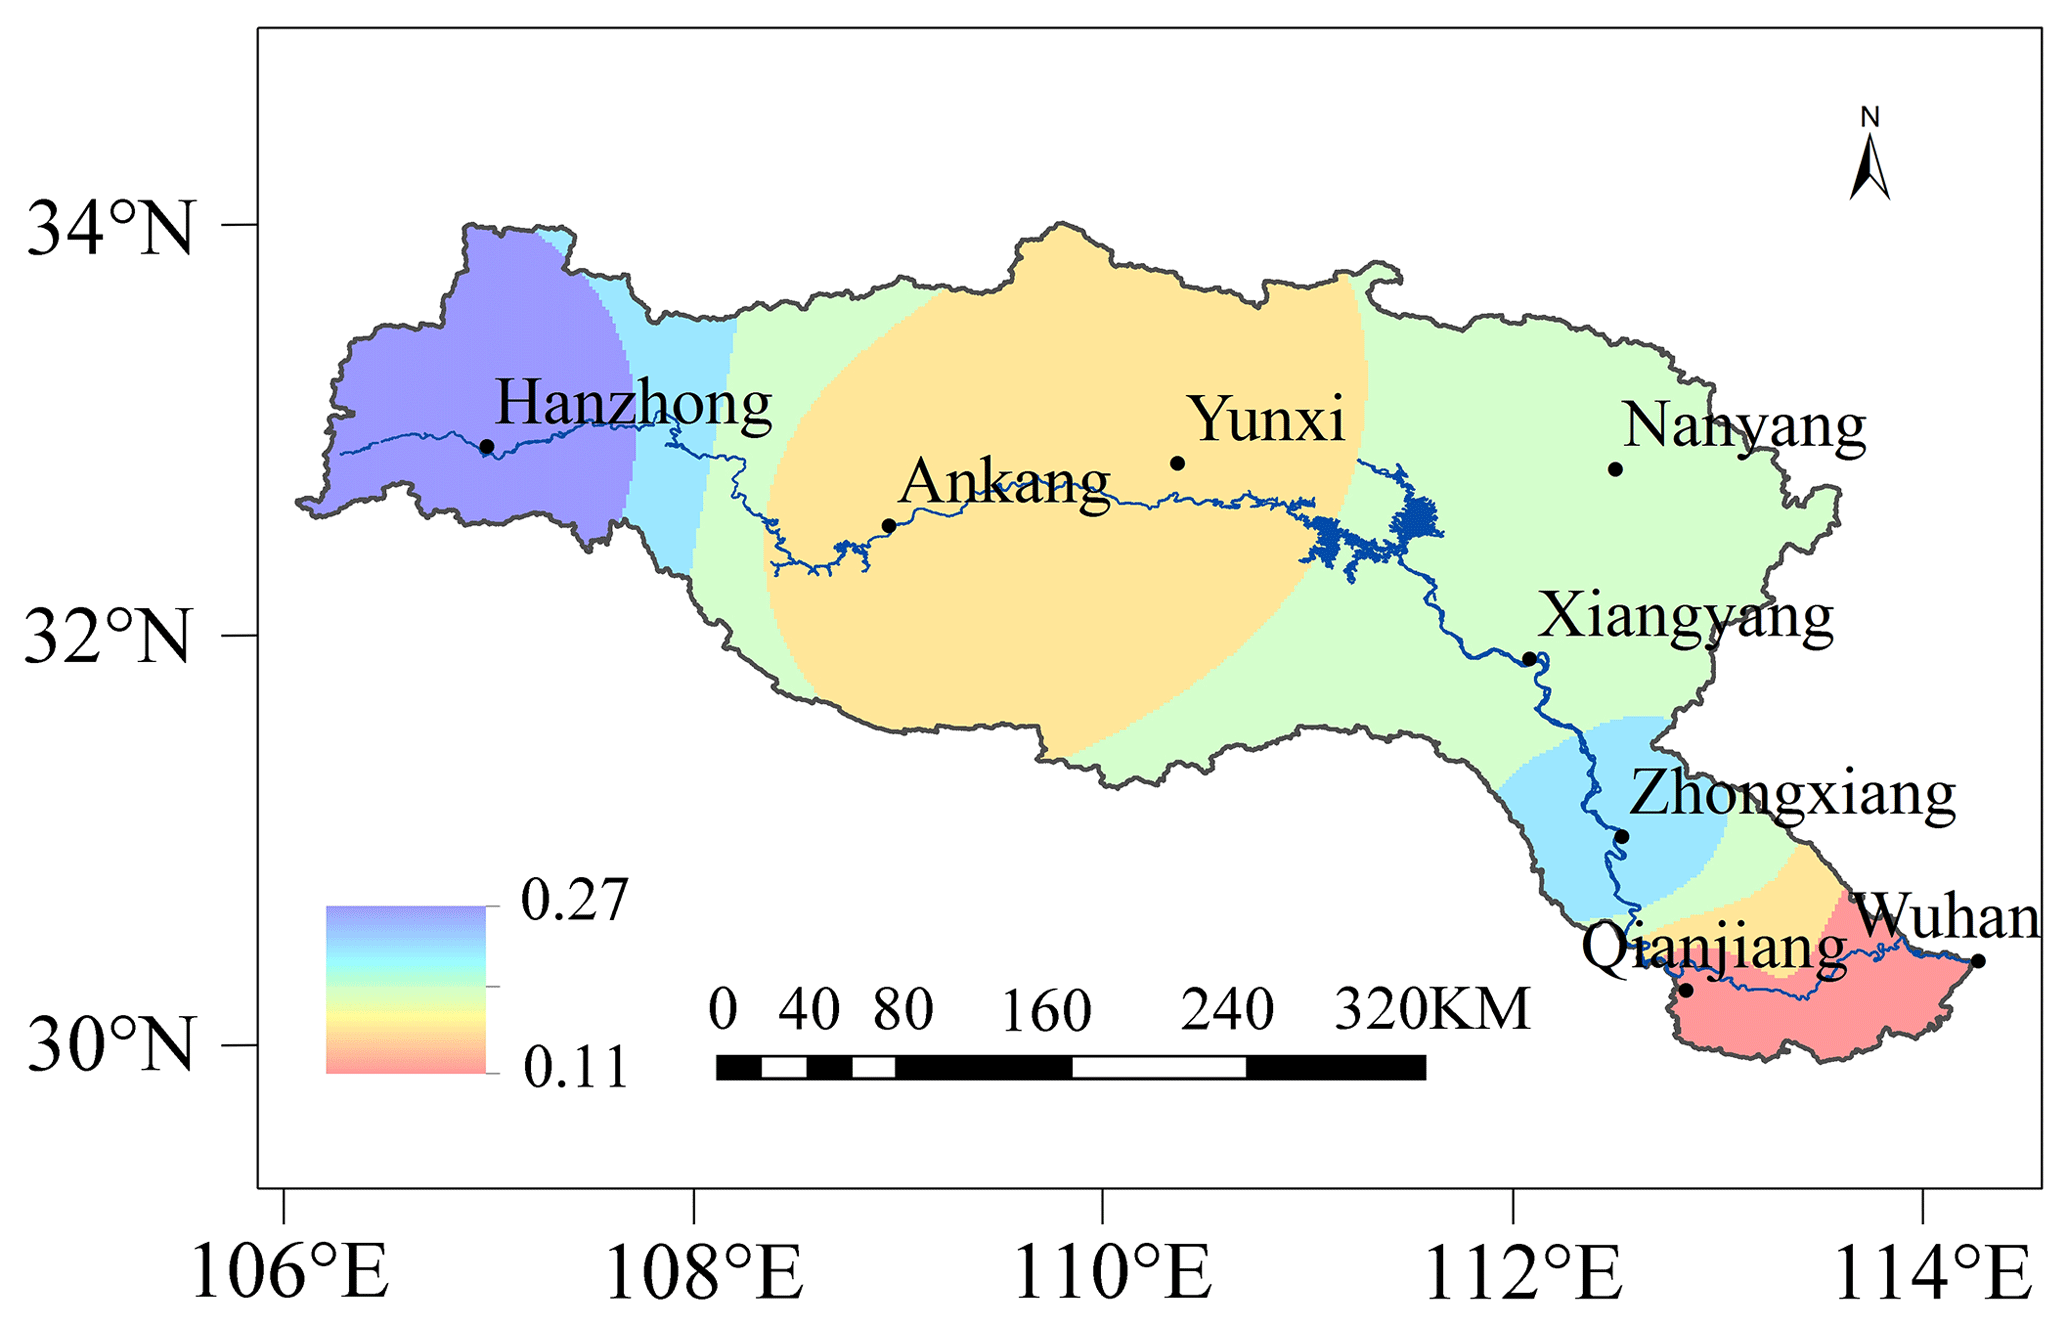
Figure 9Spatial distribution of Pearson's correlation coefficients of drought and flood grades between eight sites of the HRB and North China on average (1470–2000). The correlation coefficients for Hanzhong, Ankang, Yuxi, Nanyang, Xiangyang, Zhongxiang, and Qianjiang are significant at the 0.01 level, and that for Wuhan is significant at the 0.05 level.
The South–North Water Diversion Middle-Route Project, which transfers water from the Danjiangkou Reservoir in the upper HRB to the North China Plain, is a huge hydro-project for supporting North China's sustainable development. Therefore, the synchronous probability of rich–poor precipitation between the water source area in the upper HRB and the water-receiving area in the North China Plain is an important issue for inter-basin water resources deployment, which is directly related to the operability and benefit of the South–North Water Diversion Project (Chen et al., 2007; Gu et al., 2012). Since the mid-20th century, unfortunately, the probability of co-drought in each basin of the South-to-North Water Diversion Middle-Route Project's water source and recipient areas has been at a historical high, and the water transfer from the Danjiangkou Reservoir to the North China Plain has been under great pressure (Ren et al., 2011; Qin et al., 2021).
Previous studies have also shown that the frequency of the synchronous occurrence of droughts between the water source and the water-receiving area is the highest in the non-flood season (Yan et al., 2007). However, the precipitation in the water source area in the non-flood season is much smaller than the precipitation in the flood season, so the amount of dry-season water that can be transferred north is minimal (Yan et al., 2007). On an annual scale, when the most desirable water-transfer scenarios were taken as a premise, the synchronous probability of rich–poor precipitation in the North China Plain and the upper HRB was only 24 % (Zheng and Liu, 2000). In addition, the probability of co-drought events in the upper HRB and the Haihe River Basin (The largest water system in North China) shows an increasing trend throughout the year under two future climate change scenarios of RCP4.5 and RCP8.5. In particular, the probability of experiencing co-drought in the flood season and co-severe drought in the non-flood season may increase significantly (Yu et al., 2018).
However, most previous studies were focused on analyses of instrumental precipitation data, and a comparative study of more than 100 years between the HRB and North China was needed. This study shows that drought conditions in the upper HRB and North China also have a positive correlation over a long time period of nearly 600 years. Therefore, it is urgent and necessary to take measures for scientific regulation and reasonable configuration of the South–North Water Diversion Middle Line Project so that the unfavorable impact of the synchronous probability of rich–poor precipitation between the water source and the water-receiving area could be reduced as much as possible.
4.1 Factors influencing the variability of extreme droughts and floods
It is generally accepted that the amount of precipitation over most of China is clearly influenced by the variability of the Asian monsoon (especially the Asian summer monsoon, i.e., East Asian summer monsoon and South Asian summer monsoon) and by ENSO (i.e., El Niño and La Niña) events (Zhu, 1934; Niu et al., 2004; Hao et al., 2008; Gao et al., 2017; Wang et al., 2020). In terms of monsoon influence, because the HRB is located at the junction of central, northern, and northwestern China, it may be affected by both the East Asian and South Asian summer monsoon (Su, 1981; Yin, 2015).
Figure 10 shows a comparison of extreme drought and flood events every 30 years in the HRB (the first time period is 1426–1429 and the last is 2000–2017) with the East Asian summer monsoon index and the South Asian summer monsoon index (i.e., Asian summer monsoon index). From the multi-decadal to century scale, the following correspondence can be found.
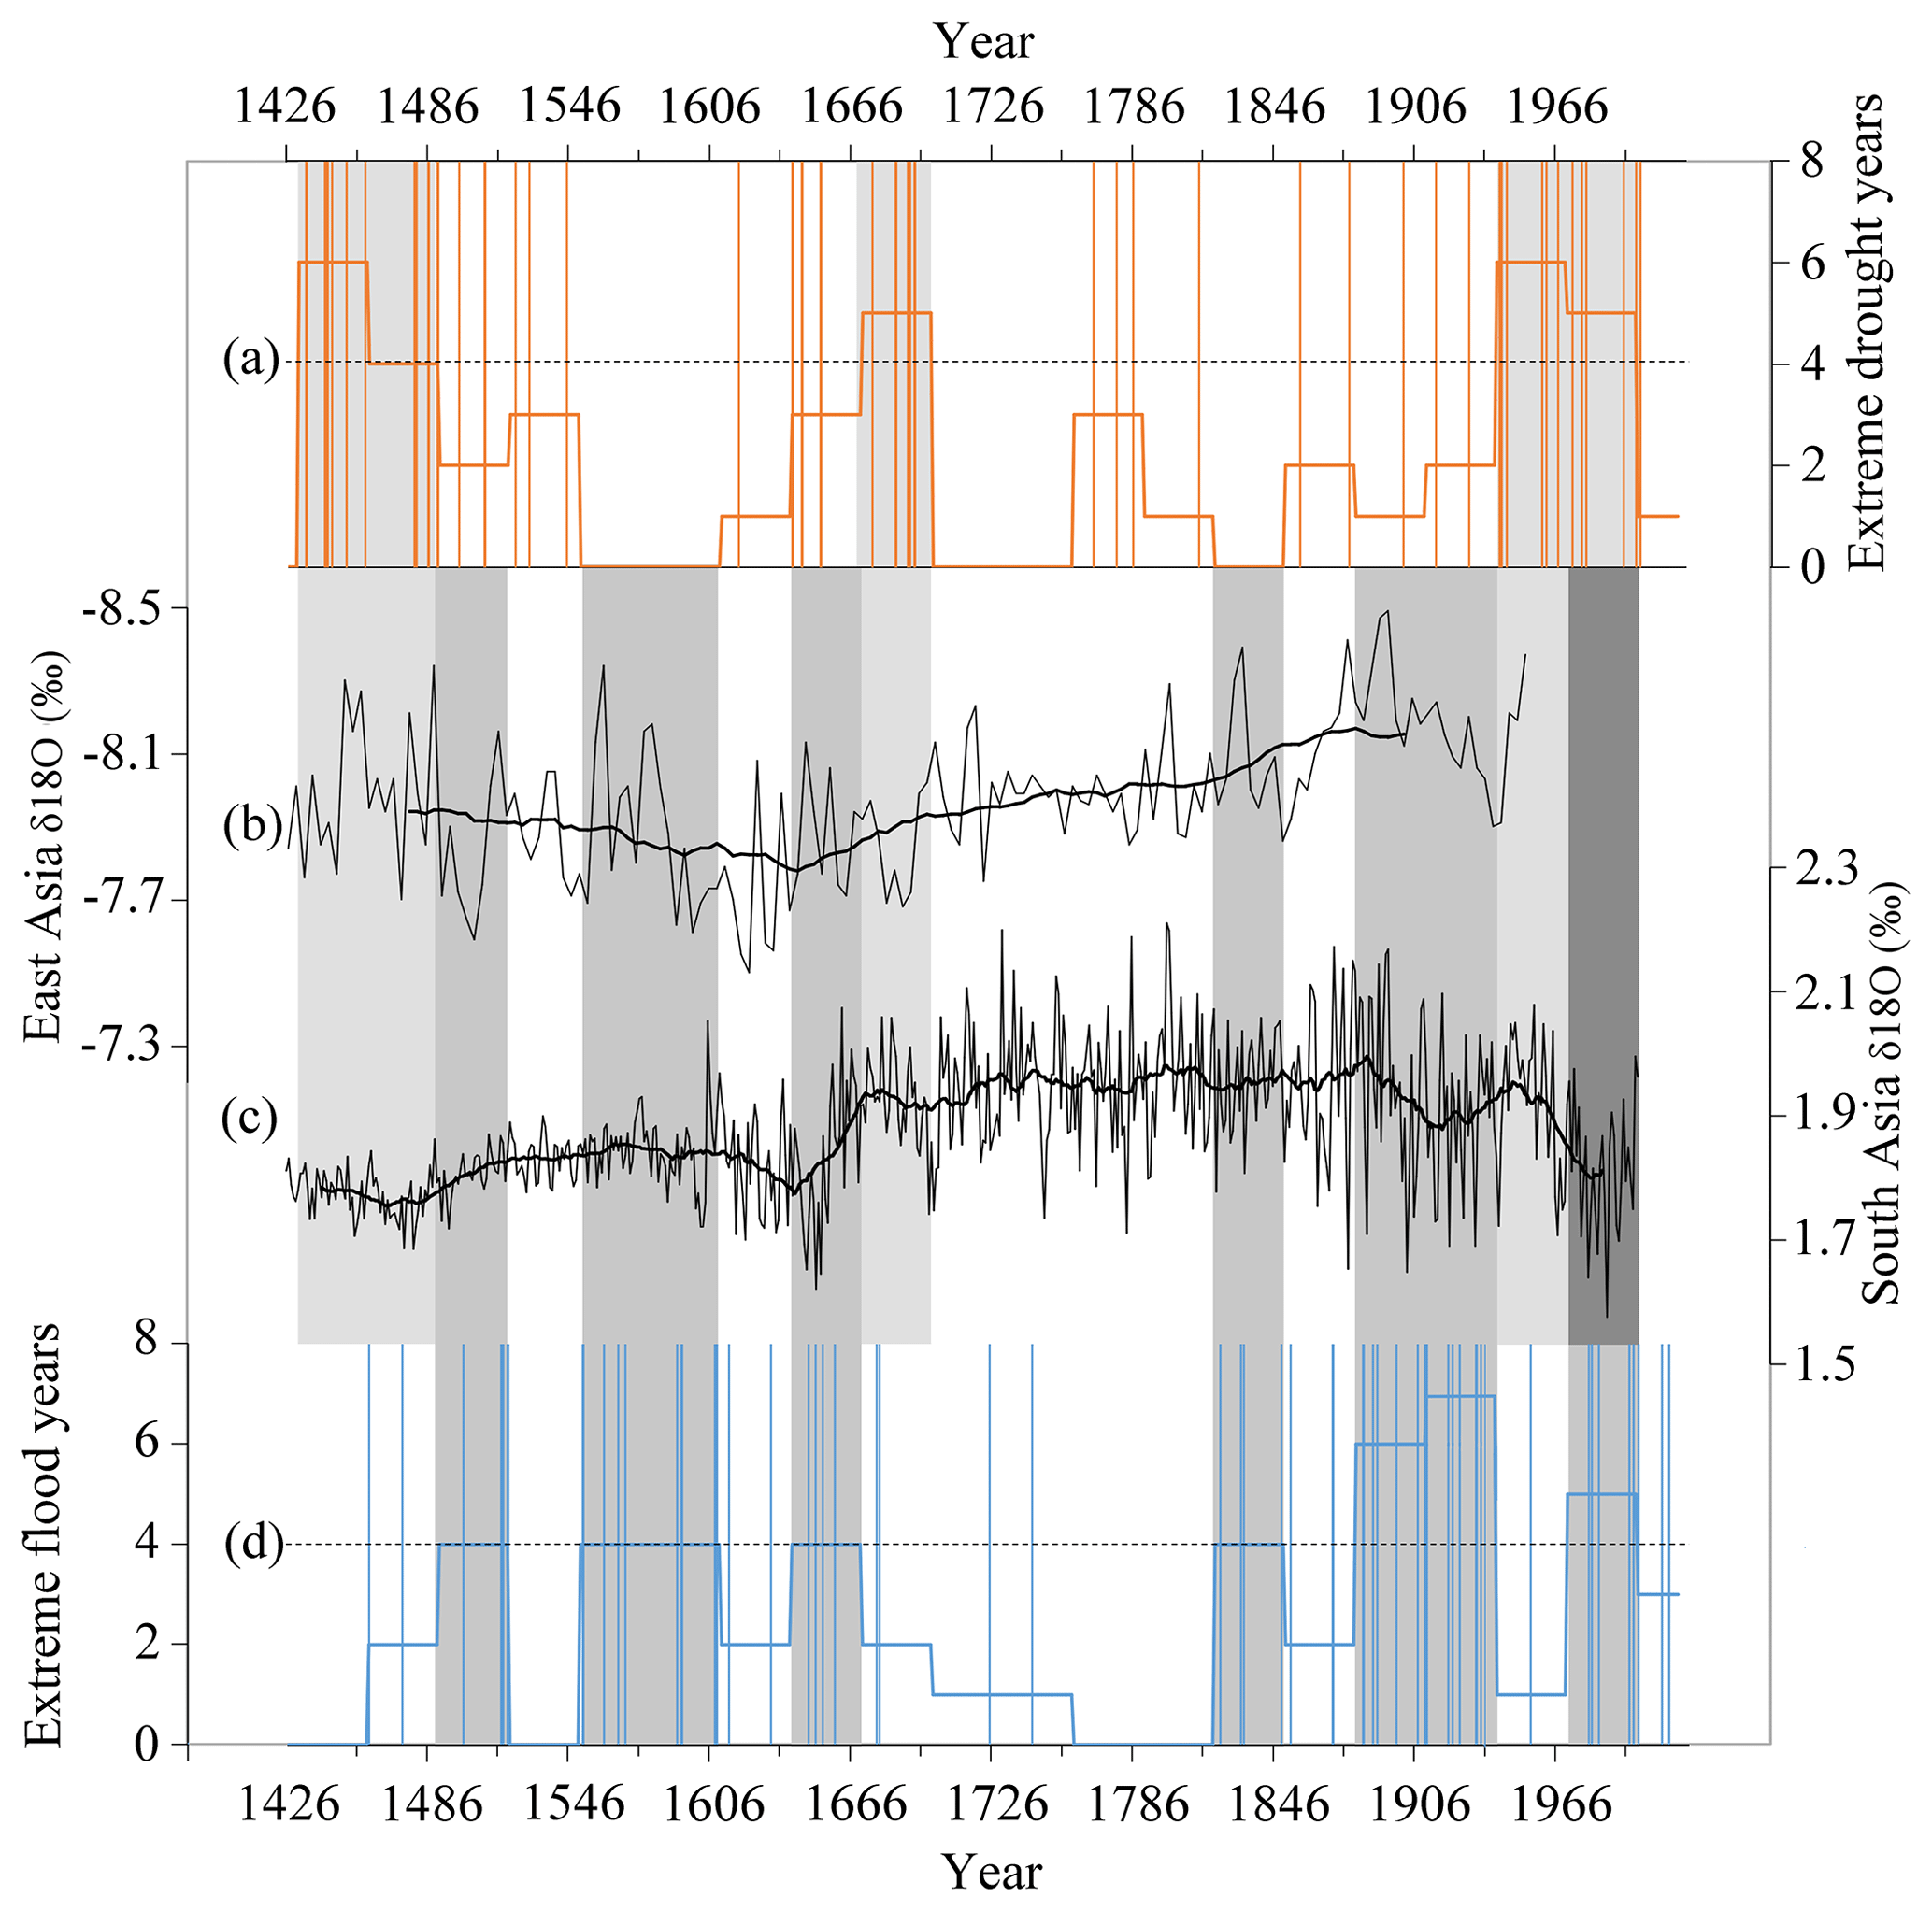
Figure 10Comparison of the HRB extreme drought and flood years with the East Asian summer monsoon index and South Asian summer monsoon index as indicated by δ18O records (‰). The light grey areas represent periods of high frequency of extreme drought, the medium grey areas represent periods of high frequency of extreme floods, and the dark grey areas represent periods of high co-occurrence of extreme droughts and floods. (a) Extreme drought years. The vertical line shows the individual extreme drought years, and the ladder is the number of extreme drought years every 30 years. (b) East Asian summer monsoon index, 1426–1949 (P. Zhang et al., 2008a). The thick black line indicates the 30-year sliding average. (c) South Asian summer monsoon index, 1426–2000 (Shi et al., 2014a). The thick black line indicates the 30-year sliding average. (d) Extreme flood years. The vertical line shows the individual extreme flood years, and the ladder is the number of extreme flood years every 30 years.
(1) In the 15–17th century, when the Asian summer monsoon was generally weak, there were 24 extreme drought events and 22 extreme flood events in the HRB, and extreme drought events were relatively more likely to occur. The weak Asian monsoon seems to be in favor of extreme drought occurrence on multi-century to century scales.
(2) In the 18–19th century, when the Asian summer monsoon gradually strengthened, there were 6 extreme drought events and 12 extreme flood events in the HRB, which were generally lower than those in the previous period in terms of the occurrence of extreme drought and flood events. Specifically, there were relatively few extreme events in the 18th century and an increase in extreme events in the 19th century, with 10 extreme floods and 3 extreme droughts in the 19th century, which is more than 3 times as many extreme floods as extreme droughts. This sharp contrast between extreme droughts and extreme floods may illustrate that the increased Asian summer monsoon on multi-century to century scales was conductive to more rainstorms and floods in the HRB. However, the correspondence of the stronger summer monsoon and the low occurrence of both extreme droughts and floods in the 18th century may indicate the complexity of the mechanisms by which the extreme drought and flood events in the basin occur.
(3) The second half of the 19th century and the 20th century saw a significant strengthening until the early 20th century, and then a slight weakening afterward, of the Asian summer monsoon and a marked increase in extreme drought and flood events, with 16 extreme drought events and 21 extreme flood events occurring in the study region. Interestingly, in the strengthening stage of the monsoon, the extreme floods increased more obviously, and in the weakening stage of the monsoon, the extreme droughts came more, indicating once more that a strengthened monsoon was generally favorable for more rainstorms and floods, and a weakened monsoon could possibly cause more extreme droughts. Other studies (Huang et al., 1999; Lu, 2002; Niu et al., 2004) showed that, in the second half of the 20th century, abrupt changes in Asian atmospheric circulation and a weakening of the summer monsoon led to an increase in drought events in northern China. Ye and Zhao (1995) found that extreme droughts and floods in the 20th century have broadly evolved through a process of major floods followed by a shift to more droughts, which is also consistent with the results of this analysis.
The correlation between the average of extreme drought and flood grades in the HRB and the average of Asian summer monsoon indices (i.e., the average of the East Asian summer monsoon index and South Asian summer monsoon index) at a 30-year time window was analyzed. There was a significant negative correlation between them (p<0.01). This once again suggests that the multi-decadal variations in the frequency of extreme drought and flood events of the HRB are influenced to some extent by changes in the strength of the Asian summer monsoon, with relatively more extreme drought events when the monsoon is weak and more extreme flood events when the monsoon is strong.
The correlation coefficients between the frequencies of strong ENSO events (every 30 years) as well as extreme droughts and floods (every 30 years) in the HRB were also calculated for the period of 1530–1979. We found that extreme floods are significantly positively correlated with strong El Niño events at a multi-decadal scale, and the correlation passed the significance test (p<0.05) (Fig. 11). Extreme droughts and strong El Niño or La Niña events as well as extreme floods and strong La Niña events also showed positive correlations, but they did not pass the significance test (p<0.05). This suggests that, on a multi-decadal scale, strong ENSO events probably have some influence on annual and summer precipitation in the HRB, and strong El Niño events have a greater impact on extreme floods than extreme droughts in the river basin as a whole.
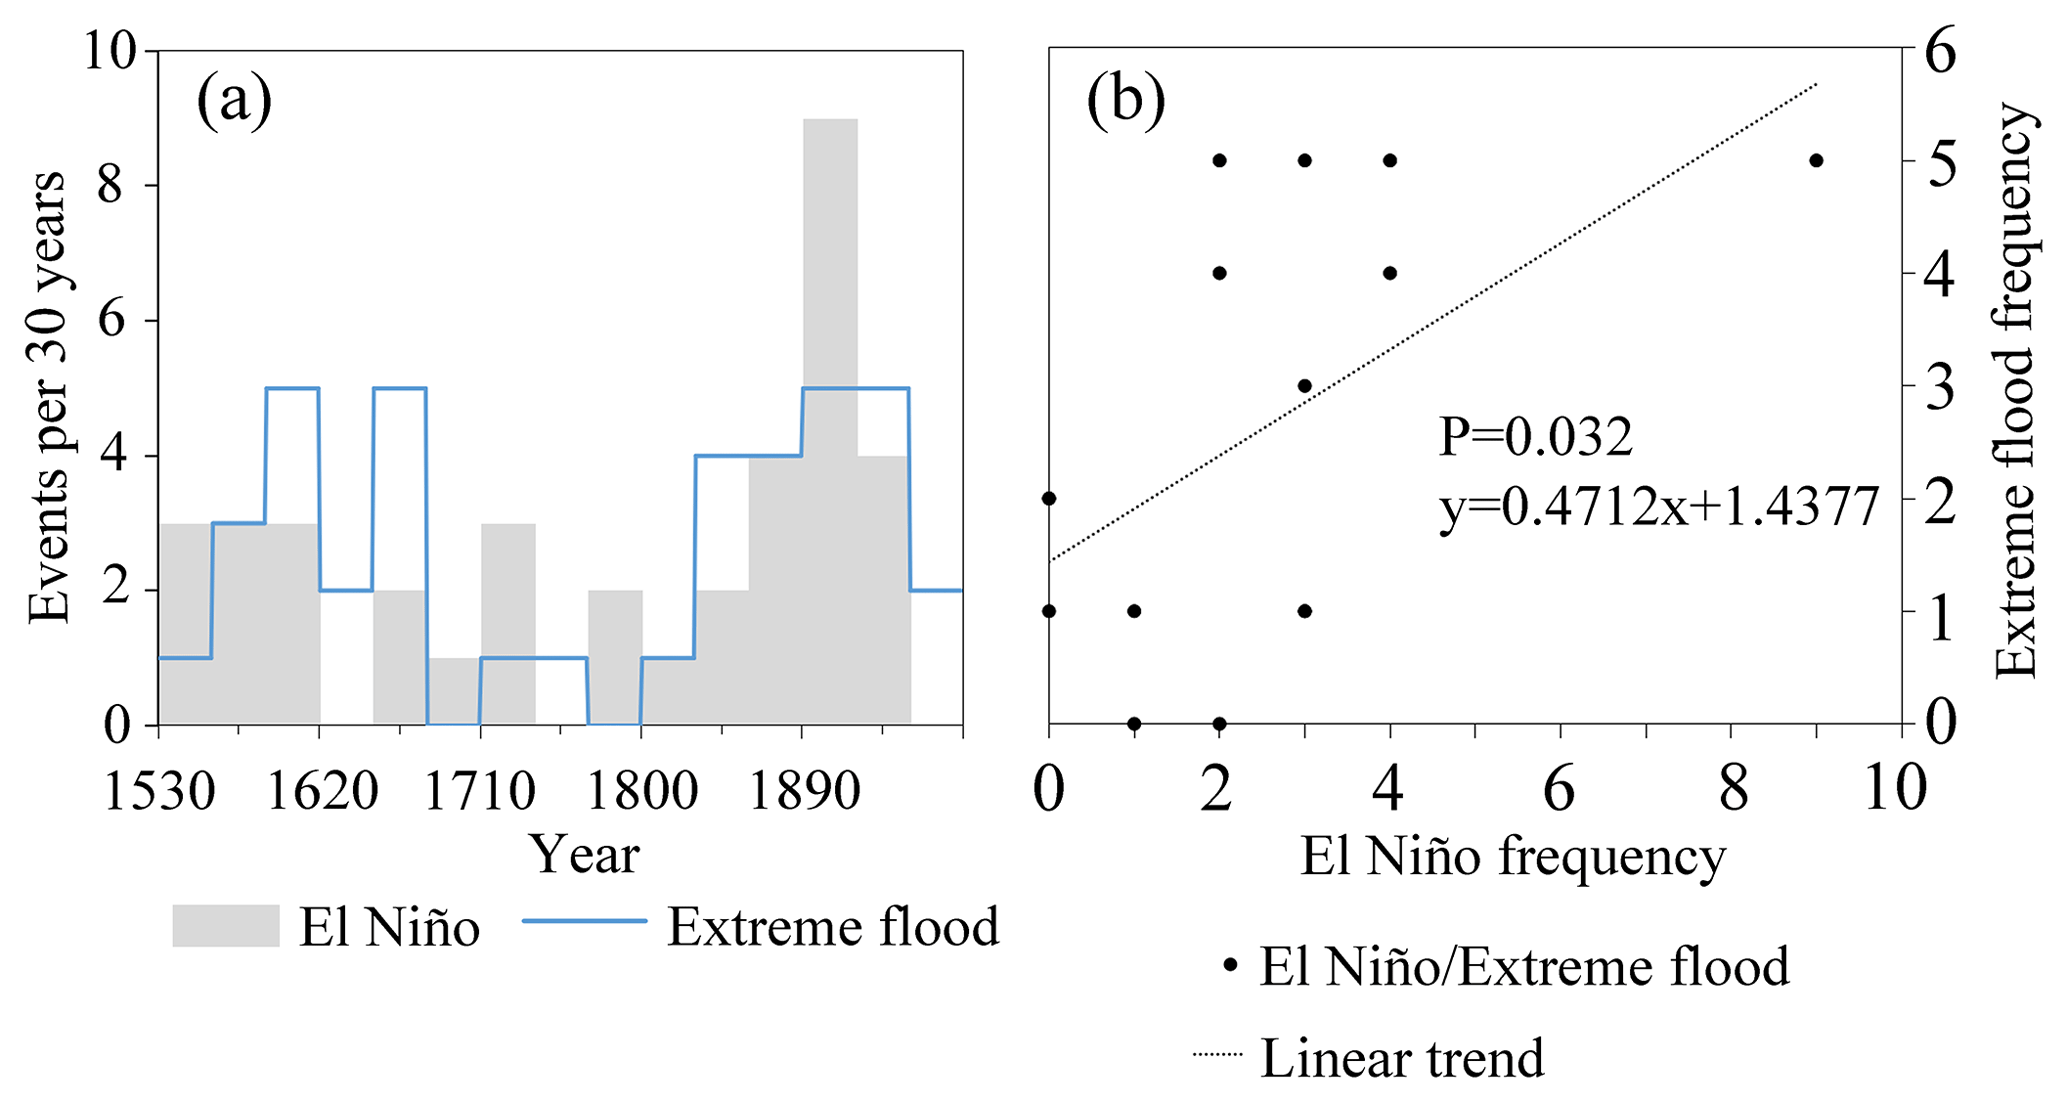
Figure 11Correlation of extreme floods in the HRB and strong El Niño frequency (every 30 years) during 1530–1979. (a) Frequency distribution of extreme floods in the HRB and strong El Niño events; (b) correlation between frequencies of extreme floods and strong El Niño events.
Yin (2015) found that the upper Hanjiang River was more prone to flood disasters in years with stronger El Niño at the end of the previous year or at the beginning of the same year and in years when El Niño was switched to La Niña. They also found that, during the weak Asian summer monsoon, the rain belt hovers over the Yangtze River and its south, and drought is more likely to occur in the HRB, especially in the upper reach. Conversely, during the strong Asian summer monsoon, the upper HRB is prone to heavy rainfall, even floods, in summer and continuous rain or floods in autumn (Yin, 2015).
Therefore, as a transitional zone between northern and southern China and between the subtropical and warm temperate zones, to a certain extent, the HRB is influenced by the variability of Asian monsoon strength. In addition, as one of the strong signals of interannual variability in sea–air interactions, ENSO events strongly influence the strength of the Asian summer monsoon (Wang et al., 2020), leading to an abnormal pattern of the HRB summer rainfall. However, precipitation as well as extreme droughts and floods are also affected by other environmental factors and the complex interactions among the different factors, such as volcanic eruptions, AMO, and PDO. The association of the Asian monsoon and ENSO as well as the HRB extreme drought and flood events in history is not straightforward. This may be the reason why the correspondence between precipitation and monsoon is still controversial in proxy data and modeling studies (e.g., Lu et al., 2019; Shi et al., 2021). It is also worth indicating that, due to space limitations, this study provides only a very preliminary discussion of the relationship of extreme droughts and floods in the HRB with the Asian summer monsoon and ENSO. There may also be a difference in the monsoon's impact on precipitation between the upper and lower reaches of the Hanjiang River. Therefore, the relationship of historical basin-wide extreme droughts and floods in the HRB with the Asian monsoon index and ENSO events on decadal to multi-decadal scales obviously needs to be further investigated in the future.
4.2 Limitations of the methods used
Although great effort has been made to collect historical documents and reconstruct the extreme droughts and floods of approximately the last 6 centuries in the HRB, the methods used in this study to reconstruct the historical drought and flood grade series has the following two limitations.
First of all, the reconstruction method of the Atlas is to take the year as a unit, combine the drought and flood disasters in spring, summer, and autumn within that year, and base the grading on the most severe disasters recorded. When both droughts and floods occur in a given year, the disaster situation in summer tends to be selected for our statistics. Most of China, including the HRB, is influenced by the Asian summer monsoon, which is more prone to droughts and floods with the relatively high and variable precipitation in summer. Meanwhile, summer is also a critical season for planting and growing crops in the HRB, which affects people more severely in the event of droughts and floods (Chen, 2020). Therefore, the definition used in this study is overall suitable for the reconstruction of historical droughts and floods in the HRB. However, droughts and floods are also frequent in the HRB in other seasons (Ding and Zheng, 2020), which result in the neglect of climate abnormality in other seasons. Meanwhile, not all drought and flood disasters in historical documents clearly indicate the time of occurrence (season, month, etc.), so it is possible that certain extreme events in spring and autumn were wrongly assigned as disasters occurring in summer (Chen, 2020).
Secondly, the method of dividing time points according to the amount of historical period material also suffers from the unavoidable uncertainty of using proxy data for reconstruction work. In this study, the uncertainties are mainly in the subjective description of historical information, which is unavoidable in grading. Because historical materials include a variety of information, there are complex relationships between different carriers and different records, which may lead to subjectivity and ambiguity. This cannot be avoided entirely even if we do not base the grading on the linguistic descriptions of historical materials alone when selecting the available historical materials (Yang and Han, 2014).
This study investigated the multi-decade to centennial-scale variation of extreme drought and flood over the HRB based on the eight-site precipitation grade reconstruction for 1426–2017. The main conclusions are as follows.
-
A total of 45 extreme drought events and 52 extreme flood events occurred from 1426–2017, equivalent to an extreme drought event every 13 years and an extreme flood event every 11 years. Extreme flood events occurred slightly more frequently than extreme drought events.
-
Relatively more frequent extreme drought events occurred in the 15th century to the early 16th century, the 17th century, and the 20th century. The highest frequency of extreme drought events occurred in the 20th century, while the 18th century saw the lowest frequency of extreme drought events.
-
More frequent extreme flood events occurred in the 16th to 17th centuries and the 19th to 20th centuries. The highest frequency of extreme flood events was in the 19th and 20th centuries, while the 18th century underwent the lowest frequency of extreme flood events.
-
The frequency of both extreme drought and flood events was low in the 18th century, when there was probably a more favorable climate in the HRB compared to other periods. However, the 20th century saw a high frequency and increased risk of both extreme drought and flood events in the HRB.
-
The historical high-frequency extreme droughts are centered in the middle reaches of the HRB, and the high-frequency extreme floods are centered in the lower reaches. The frequency of extreme droughts and floods was higher in the middle and lower reaches than in the upper reaches.
-
The occurrence of extreme droughts and floods in the upper HRB are more strongly positively correlated with those in North China.
All reconstructed data for the identification of extreme drought and flood events used in this study are available in the Supplement. Datasets for the East Asian summer monsoon are available at https://doi.org/10.25921/y7c4-7062 (P. Zhang et al., 2008b) and for the South Asian summer monsoon are available at https://doi.org/10.25921/7w9j-b030 (Shi et al., 2014b). The chronology of El Niño and La Niña events is available at https://doi.org/10.25921/ebpz-a913 (Gergis and Fowler, 2009b). The China National Ground Meteorological Station Homogenized Precipitation Data Set (V1.0) is non-public.
The supplement related to this article is available online at: https://doi.org/10.5194/cp-18-1775-2022-supplement.
GR and BH designed the research and guided the writing; YY and ZH guided the development of the methods; XZ conducted the analysis, and PZ guided the technical part; XZ reconstructed the drought and flood grade series, analyzed the data, drew the figures, and drafted the paper.
The contact author has declared that none of the authors has any competing interests.
Publisher's note: Copernicus Publications remains neutral with regard to jurisdictional claims in published maps and institutional affiliations.
This study was supported by the National Key R&D Program of China (2018YFA0605603). Thanks are due to Xiuqi Fang for his instructive advice. The authors also thank Guowei Yang, Qin Yun, and Jiajun He for their technical assistance in drafting the paper.
This research has been supported by the Ministry of Science and Technology of the People's Republic of China (grant no. 2018YFA0605603).
This paper was edited by Chantal Camenisch and reviewed by three anonymous referees.
Aiken, E. K. and Rauscher, S. A.: Evaluation of the climate extremes index over the United States using 20th and mid-21st century North American Regional Climate Change Assessment Program data, Int. J. Climatol., 40, 1542–1560, https://doi.org/10.1002/joc.6286, 2019.
Ankang City Local History Compilation Committee: Ankang Regional Journal, Shaanxi People's Press, Shaanxi, China, 7224070122, 2004 (in Chinese).
Central Meteorological Bureau: The Atlas of Drought and Flood Distribution in China in the Last 500 Years, Map publisher, Beijing, China, 120141086, 1981 (in Chinese).
Chen, H., Guo, S., Guo, H., Xu, G., and Xu, D.: Analysis of spatial and temporal trends of precipitation and temperature in the Hanjiang River basin from 1951 to 2003, Resour. Environ. Yangtze Basin, 3, 340–345, https://doi.org/10.3969/j.issn.1004-8227.2006.03.014, 2006 (in Chinese).
Chen, H., Guo, S., Xu, C., and Singh, V.: Historical temporal trends of hydro-climatic variables and runoff response to climate variability and their relevance in water resource management in the Hanjiang basin, J. Hydrol., 344, 171–184, https://doi.org/10.1016/j.jhydrol.2007.06.034, 2007.
Chen, J.: Viewing historical climate information processing from historical data on droughts and floods in the Taihu Lake Basin, Acta Geogr. Sin., 3, 231–242, https://doi.org/10.11821/xb198703005, 1987 (in Chinese).
Chen, Y.: A Review of the quantitative classification of flood and drought disaster data in historical period: Taking the Atlas of drought and dlood distribution in China in the last 500 years as an example, Journal of Shanghai Jiaotong University, 28, 107–115, https://doi.org/10.13806/j.cnki.issn1008-7095.2020.01.014, 2020 (in Chinese).
Chen, Y., Yin, Y. X., Chen, X. W., and Xu, W. C.: Change and future pattern of provincial flood affected areas in China: possible relationship with climate change, Disaster Adv., 5, 321–326, 2012.
Cook, E. R., Seager, R., Heim, R. R., Vose, R. S., Herweijer, C., and Woodhouse, C.: Megadroughts in North America: Placing IPCC projections of hydroclimatic change in a long-term palaeoclimate context, J. Quaternary Sci., 25, 48–61, https://doi.org/10.1002/jqs.1303, 2010.
Dai, A.: Increasing drought under global warming in observations and models, Nat. Clim. Change, 3, 52–58, https://doi.org/10.1038/NCLIMATE1633, 2013.
Deng, Y.: The History of Chinese Salvation, The Commercial Press, Beijing, China, 9787100084468, 2011 (in Chinese).
Department of Geography, Shaanxi Normal University: Geography of the Ankang Region, Beijing, People's Education Press, 12094.44, 1986 (in Chinese).
Ding, L. and Zheng, J.: Reconstruction and characteristic analysis of seasonal drought and flood grade series in hanjiang river Basin from 1735 to 1911, Geogr. Res., 3, 721–734, 2020 (in Chinese).
Ding, Y., Ren, G., Shi, G., Gong, P., Zheng, X., Zhai, P., Zhang, D., Zhao, Z., Wang, S., Wang, H., Luo, Y., Chen, D., Gao, X., and Dai, X.: China's National Assessment Report on Climate Change (I): climate change in China and the future trend, Climate Change Research, 3, 1–5, https://doi.org/10.1016/0360-1285(76)90008-3, 2007.
Ding, Y., Liu, Y., and Song, Y.: The East Asian summer monsoon water vapor conveyor belt and its impact on China's heavy rainstorms and waterlogging disasters, Adv. Water Sci., 5, 629–643, https://doi.org/10.14042/j.cnki.32.1309.2020.05.001, 2020 (in Chinese).
Dong, A., Li, Y., and Zhang, Y.: The Causes of the Drought in Eight Provinces and Cities in North China in 1942, Scientia Geographica Sinica, 2, 205–210, https://doi.org/10.13249/j.cnki.sgs.2014.01.004, 2014 (in Chinese).
Fang, X., Su, Y., Yi, J., Wei, Z., and Zheng, J.: Exploring the method of reconstructing socio-economic hierarchical series in historical climate change impact studies, Quat. Sci., 34, 1204–1214, http://www.cnki.com.cn/Article/CJFDTotal-DSJJ201406009.htm (last access: 2 August 2022), 2014 (in Chinese).
Fenby, C. and Gergis, J.: Rainfall variations in south-eastern Australia part 1: consolidating evidence from pre-instrumental documentary sources, Int. J. Climatol., 33, 2956–2972, https://doi.org/10.1002/joc.3640, 2013.
Gao, T., Wang, H. J., and Zhou, T: Changes of extreme precipitation and nonlinear influence of climate variables over monsoon region in China, Atmos. Res., 197, 379–389, https://doi.org/10.1016/j.atmosres.2017.07.017, 2017.
Ge, Q.: Compilation of the Memorials to the Throne in Qing Dynasty: Agriculture ⋅ Environment, Commercial Press, Beijing, China, ISBN 9787100036627, 2005 (in Chinese).
Ge, Q.: Climate Change in China through the Dynasties, Science Press, Beijing, China, ISBN 9787030297532 , 2011 (in Chinese).
Ge, Q. and Zhang, P.: Evaluation of Climate Information in Historical Documents, Acta Geogr. Sin., 1, 22–30, CNKI:SUN:DLXB.0.1990-01-002, 1990 (in Chinese).
Gergis, J. L. and Fowler, A. M.: A history of ENSO events since AD 1525: implications for future climate change, Climatic Change, 92, 343–387, 2009a.
Gergis, J. and Fowler, A. M.: NOAA/WDS Paleoclimatology - Gergis and Fowler 2009 Multiproxy ENSO Event Reconstructions, NOAA National Centers for Environmental Information [data set], https://doi.org/10.25921/ebpz-a913, 2009b.
Goswami, B. N., Venugopal, V., and Sengupta, D.: Increasing trend of extreme rain events over India in a warming environment, Science, 314, 1442–1445, https://doi.org/10.1126/science.1132027, 2006.
Gu, W., Shao, D., and Jiang, Y.: Risk Evaluation of Water Shortage in Source Area of Middle Route Project for South-to-North Water Transfer in China, Int. Ser. Prog. Waters, 26, 3479–3493, https://doi.org/10.1007/s11269-012-0086-1, 2012.
Guo, S., Tian, J., Yang, G., Duan, W., and Deng, L.: Hydrological simulation and forecasting in the Hanjiang River basin and optimal scheduling and allocation of reservoir water resources, China Water Conservancy and Hydropower Publishing House, Beijing, China,ISBN 9787517089575, 2020 (in Chinese).
Hao, Z., Zheng, J., and Ge, Q.: Precipitation cycles in the middle and lower reaches of the Yellow River (1736–2000), J. Geogr. Sci., 18, 17–25, 2008.
Hao, Z., Ge, Q., and Zheng, J.: Changes in extreme drought and flood events in eastern China in the past 2000 years, Climatic and Environmental Research, 4, 388–394, https://doi.org/10.3878/j.issn.1006-9585.2010.04.06, 2010 (in Chinese).
Hsu, H. H., Zhou, T., and Matsumoto, J.: East Asian, Indochina and Western North Pacific Summer Monsoon – An update, Asia-Pac. J. Atmos. Sci., 50, 45–68, https://doi.org/10.1007/s13143-014-0027-4, 2014.
Huang, C., Pang, J., Zha, X., Zhou, Y., Yin, S., Su, H., Zhou, L., and Yang, J.: Extraordinary hydro-climatic events during the period AD 200–300 recorded by slackwater deposits in the upper Hanjiang River valley, China, Palaeogeogr. Palaeocl., 374, 274–283, https://doi.org/10.1016/j.palaeo.2013.02.001, 2013.
Huang, R., Xu, Y., and Zhou, L.: The interdecadal variation of summer precipitation in China and the trend of aridification in North China, Plateau Meteorology, 4, 465–476, https://doi.org/10.3321/j.issn:1000-0534.1999.04.001, 1999 (in Chinese).
Institute of Geography of Chinese Academy of Sciences: Geographical Survey Report on Hanjiang River Basin, Science Publishing House, Beijing, China, 12031.6, 1957 (in Chinese).
IPCC: Managing the Risks of Extreme Events and Disasters to Advance Climate Change Adaptation, A Special Report of Working Groups I and II of the Intergovernmental Panel on Climate Change, edited by: Field, C. B., Barros, V., Stocker, T. F., Qin, D., Dokken, D. J., Ebi, K. L., Mastrandrea, M. D., Mach, K. J., Plattner, G.-K., Allen, S. K., Tignor, M., and Midgley, P. M., Cambridge University Press, Cambridge, UK and New York, USA, 582 pp., ISBN 9781107025066, 2012.
IPCC: Climate Change 2013: The Physical Science Basis, Working Group I Contribution to the Fifth Assessment Report of the Intergovernmental Panel on Climate Change, edited by: Stocker, T. F., Qin, D., Plattner, G.-K., Tignor, M., Allen, S. K., Boschung, J., Nauels, A., Xia, Y., Bex, V., and Midgley, P. M., Cambridge University Press, Cambridge, UK and New York, USA, 1535 pp., ISBN 9781107057999, 2014.
IPCC: Climate Change 2022: Impacts, Adaptation, and Vulnerability. Contribution of Working Group II to the Sixth Assessment Report of the Intergovernmental Panel on Climate Change, edited by: Pörtner, H.-O., Roberts, D. C., Tignor, M., Poloczanska, E. S., Mintenbeck, K., Alegría, A., Craig, M., Langsdorf, S., Löschke, S., Möller, V., Okem, A., and Rama, B., Cambridge University Press, https://www.ipcc.ch/report/ar6/wg2/about/how-to-cite-this-report (last access: 27 February 2022), In Press, 2022.
Krysanova, V., Buiteveld, H., Haase, D., Hattermann, F., van Niekerk, K., Roest, K., Martinez-Santos, P., and Schluter, M.: Practices and Lessons Learned in Coping with Climatic Hazards at the River-Basin Scale: Floods and Droughts, Ecol. Soc., 13, 32–58, https://doi.org/10.5751/ES-02345-130232, 2008.
Li, W.: The Disaster Annals in Modern China, Hunan Education Press, Hunan, China, ISBN 7535510833, 1990 (in Chinese).
Li, W.: The Continuation of Disaster Annals in Modern China (1919–1949), Hunan Education Press, Hunan, China, ISBN 9787535516756, 1993 (in Chinese).
Li, W.: Ten Famines in Modern China, People's Publishing House, Beijing, China, ISBN 9787010217208, 2019 (in Chinese).
Li, W. and Zhou, Y.: Disaster and famine: 1840–1919, People's Publishing House, Beijing, China, ISBN 9787010216973, 2020 (in Chinese).
Liang, E., Shao, X., Kong, Z., and Lin, J.: The extreme drought in the 1920s and its effect on tree growth deduced from tree ring analysis: a case study in North China, Ann. Forest Sci., 60, 145–152, https://doi.org/10.1051/forest:2003007, 2003.
Liu, D., Guo, S., Shao, Q., Liu, P., Xiong, L., Wang, L., Hong, X., Xu, Y., and Wang, Z.: Assessing the effects of adaptation measures on optimal water resources allocation under varied water availability conditions, J. Hydrol., 556, 759–774, https://doi.org/10.1016/j.jhydrol.2017.12.002, 2018.
Liu, J., Zhang, P., Meng, C., Zhang, D., and Yang, X.: Characteristics of Precipitation Changes at the Edge of Monsoon Region in the Past 500 Year, Scientia Geographica Sinica, 4, 401–407, https://doi.org/10.13249/j.cnki.sgs.2011.04.014, 2011 (in Chinese).
Liu, Y., Sun, J., Song, H., Cai, Q., Bao, G., and Li, X.: Tree-ring hydrologic reconstructions for the Heihe River watershed, western China since AD 1430, Water Res., 44, 2781–2792, https://doi.org/10.1016/j.watres.2010.02.013, 2010.
Lu, F., Ma, C., Zhu, C., Lu, H., Zhang, X., Huang, K., Guo, T., Li, K., Li, L., Li, B., and Zhang, W.: Variability of East Asian summer monsoon precipitation during the Holocene and possible forcing mechanisms, Clim. Dynam., 52, 1–2, https://doi.org/10.1007/s00382-018-4175-6, 2019.
Lu, R.: Separation of Interdecadal and Interannual Scales in Rainfall Changes in North China during the Rainy Season, Chinese Journal of Atmospheric Sciences, 5, 611–624, https://doi.org/10.3878/j.issn.1006-9895.2002.05.03, 2002 (in Chinese).
Luo, C.: Great Flood of Chinese History, Chinese Bookstore, Beijing, China, ISBN 9787806633847, 2006 (in Chinese).
Lu, X.: Regional historical geography research: objects and methods, A case study of the Hanjiang River Basin (revised version), Social Science Literature Press, Beijing, China, ISBN 9787520126786, 2019 (in Chinese).
Machado, M. J., Benito, G., Barriendos, M., and Rodrigo, F. S.: 500 Years of rainfall variability and extreme hydrological events in southeastern Spain drylands, J. Arid Environ., 75, 1244–1253, https://doi.org/10.1016/j.jaridenv.2011.02.002, 2011.
Mao, P., Pang, J., Huang, C., Zha, X., Zhou, Y., Guo, Y., and Zhou, L.: A multi-index analysis of the extraordinary paleoflood events recorded by slackwater deposits in the Yunxi Reach of the upper Hanjiang River, China, Catena, 145, 1–14, https://doi.org/10.1016/j.catena.2016.05.016, 2016.
Mei, R., Song, H., Liu, Y., Payomrat, P., Cai, Q., Sun, C., and Fang, C.: Tree-ring width-based precipitation reconstruction in Zhaogaoguan, China since 1805 AD, Quatern. Int., 510, 44–51, https://doi.org/10.1016/j.quaint.2018.12.015, 2019.
Miao, Q., Ding, Y., and Wang, Y.: The impact of climate warming on the northern boundary of China's subtropical zone, Geogr. Res., 3, 634–642, https://doi.org/10.3321/j.issn:1000-0585.2009.03.008, 2009 (in Chinese).
Mikami, T.: Climatic variations in Japan reconstructed from historical documents, Weather, 63, 190–103, https://doi.org/10.1002/wea.281, 2008.
Niu, T., Chen, L., and Zhou, Z.: The characteristics of climate change over the Tibetan Plateau in the last 40 years and the detection of climatic jumps, Adv. Atmos. Sci., 21, 193–203, https://doi.org/10.1007/BF02915705, 2004.
Peng, W., Yin, S., Zhu, Y., Bao, X., and Ren, L.: Study of floods in the upper Hanjiang River since the historical period, Bull. Soil Water Conserv., 33, 289–294, https://doi.org/10.13961/j.cnki.stbctb.2013.04.011, 2013 (in Chinese).
Qin, D., Ding, Y., Zhai, P., Song, L., and Jiang, K.: Climate and Ecological Evolution in China: 2021, Science Publishing House, Beijing, ISBN 9787030697820, 2021 (in Chinese).
Qin, J., Shi, A., Ren, G., Chen, Z., Yang, Y., Zou, X., and Zhang, P.: Severe Historical Droughts Carved on Rock in the Yangtze, B. Am. Meteorol. Soc., 101, 905–916, https://doi.org/10.1175/BAMS-D-19-0126.1, 2020.
Qu, Y., Lv, J., Zhang, W., Su, Z., and Li, Z.: Advances in the study of historical extreme droughts in China, Adv. Water Sci., 29, 283–292, https://doi.org/10.14042/j.cnki.32.1309.2018.02.016, 2018 (in Chinese).
Ren, G., Feng, G., and Yan, Z.: Retrospect and prospect of observational research on extreme climate change in China, Climatic and Environmental Research, 4, 337–353, https://doi.org/10.3878/j.issn.1006-9585.2010.04.01, 2010 (in Chinese).
Ren, G., Liu, H., Chu, Z., Zhang, L., Li, X., Li, W., Chen, Y., Gao, G., and Zhang, Y.: Climate change over eastern China and implications for South-North Water Diversion Project, J. Hydrometeorol., 12, 600–617, https://doi.org/10.1175/2011JHM1321.1, 2011.
Ren, G., Ren, Y., Zhan, Y., Sun, X., Liu, Y., Chen, Y., and Wang, T.: Temporal and Spatial Variation of Precipitation in Mainland China II. Modern Trends, Advances in Science and Technology of Water Resources, 4, 451–465, https://doi.org/10.14042/j.cnki.32.1309.2015.04.001, 2015a (in Chinese).
Ren, G., Wang, T., Guo, J., Hao, Z., and Zhan, Y.: Several characteristics of precipitation changes in the Haihe River Basin in modern times, Adv. Sci. Tech. Water Resources, 35, 103–111, https://www.cnki.com.cn/Article/CJFDTotal-SLSD201505016.htm (last access: 2 August 2022), 2015b (in Chinese).
Shaanxi Province local history codification committee: Shaanxi Provincial Fangzhi – Geography Volume, Shaanxi People's Publishing House, Xi'an, China, ISBN 7224051152, 2000 (in Chinese).
Shi, F., Li, J., and Wilson R.: A tree-ring reconstruction of the South Asian summer monsoon index over the past millennium, Sci. Rep., 4, 6739, PMID 25338702, https://doi.org/10.1038/srep06739, 2014a.
Shi, F., Li, J., and Wilson, R. J. S.: NOAA/WDS Paleoclimatology - South Asian Summer Monsoon Index 1000 Year Reconstruction, NOAA National Centers for Environmental Information [data set], https://doi.org/10.25921/7w9j-b030, 2014b.
Shi, H., Wang, B., Cook, E. R., Liu, J., and Liu, F.: Asian summer precipitation over the past 544 years reconstructed by merging tree rings and historical documentary records, J. Climate, 31, 7845–7861, https://doi.org/10.1175/JCLI-D-18-0003.1, 2018.
Shi, H., Wang, B., Liu, J., and Liu, F.: Decadal-multidecadal variations of Asian summer rainfall from the Little Ice Age to the present, J. Climate, 32, 7663–7674, https://doi.org/10.1175/JCLI-D-18-0743.1, 2019.
Shi, Y., Jiang, T., Su, B., Chen, J., and Qin, N.: A preliminary study on the relationship between the evolution of the Yangtze River floods and climate change since 1840, Journal of Lake Sciences, 4, 289–297, https://doi.org/10.18307/2004.0401, 2004 (in Chinese).
Shi, Z., Zhou, P., Li, X., Cheng, H., Sha, Y., Xie, X., Liu, H., Wu, J., and Liu, X.: Distinct Holocene precipitation trends over arid Central Asia and linkages to westerlies and Asian monsoon, Quaternary Sci. Rev., 266, 107055, https://doi.org/10.1016/j.quascirev.2021.107055, 2021.
Su, L.: The Causes of Hanjiang Flood and Its Appearance Law, Yangze River, 4, 82–87, https://doi.org/10.16232/j.cnki.1001-4179.1981.04.013, 1981 (in Chinese).
Sun, L. and Chen X.: Chronological characteristics and forming conditions of flood in the south and drought in the north, Journal of Applied Meteorological Science, 6, 641–647, https://doi.org/10.3969/j.issn.1001-7313.2003.06.001, 2003 (in Chinese).
Tan, L., Cai, Y., Cheng, H., Edwards, L. R., Gao, Y., Xu, H., Zhang, H., An, Z., and Gao, Y.: Centennial- to decadal-scale monsoon precipitation variations in the upper Hanjiang River region, China over the past 6650 years, Earth Planet. Sc. Lett., 482, 580–590, https://doi.org/10.1016/j.epsl.2017.11.044, 2018.
Tan, X.: Research on the Catastrophic Drought in China in the Past 500 Years, Journal of Disaster Prevention and Mitigation Engineering, 2, 77–83, https://doi.org/10.3969/j.issn.1672-2132.2003.02.011, 2003 (in Chinese).
Tao, S., Zhang, Q., and Zhang, S.: Climatic background and large-scale circulation conditions of the 1998 Yangtze River basin floods, Climatic and Environmental Research, 4, 290–299, https://doi.org/10.3878/j.issn.1006-9585.1998.04.01, 1998 (in Chinese).
Vicente-Serrano, S., Saz-Sanchez, M., and Cuadrat, J.: Comparative analysis of interpolation methods in the middle Ebro Valley (Spain): application to annual precipitation and temperature, Clim. Res., 24, 161–180, https://doi.org/10.3354/cr024161, 2003.
Wan, H., Song, H., Zhu, C., Zhang, B., and Zhang, M.: Spatiotemporal evolution of drought and flood disaster chains in Baoji area from 1368 to 1911, J. Geogr. Sci., 28, 337–350, https://doi.org/10.1007/s11442-018-1476-y, 2018.
Wang, H. and Fan, K.: Main features of the East Asian monsoon changes in recent decades, Chinese Journal of Atmospheric Sciences, 2, 313–318, https://doi.org/10.3878/j.issn.1006-9895.2012.12301, 2013 (in Chinese).
Wang, J. and Guo, S.: South-to-North Water Transfer Project Water Source Area: Research and Application of Key Technologies for Hydrological and Water Resources Analysis of Hanjiang River, China Water Conservancy and Hydropower Publishing House, Beijing, China, ISBN 9787508482729, 2010 (in Chinese).
Wang, L., Yang, Z., Gu, X., and Li, J.: Linkages Between Tropical Cyclones and Extreme Precipitation over China and the Role of ENSO, Int. J. Disast. Risk Sc., 11, 538–553, https://doi.org/10.1007/s13753-020-00285-8, 2020.
Wang, L., Zhang, J., Elmahdi, A., Shu, Z., Wu, Y., and Wang, G.: Evolution characteristics and relationship of meteorological and hydrological droughts from 1961 to 2018 in Hanjiang River Basin, China, J. Water Clim. Change, 13, 224–246, https://doi.org/10.2166/wcc.2021.267, 2021.
Wang, S. and Zhao, Z.: Analysis of the historical data of droughts and floods in China in the last 500 years, J. Geogr. Sci., 4, 329–341, https://doi.org/10.11821/xb197904005, 1979 (in Chinese).
Water Resources Commission of the Ministry of Water Resources: Floods and Droughts in the Yangtze River Basin, China Water Conservancy and Hydropower Press, Beijing, China, ISBN 9787508405582, 2002 (in Chinese).
Wen, K.: The China Meteorological Disaster Dictionary-Henan Volume, Meteorological Press, Beijing, China, ISBN 9787502940133, 2005a (in Chinese).
Wen, K.: The China Meteorological Disaster Dictionary-Shaanxi Volume, Meteorological Press, Beijing, China, ISBN 7502939407, 2005b (in Chinese).
Wen, K.: The China Meteorological Disaster Dictionary-Hubei Volume, Meteorological Press, Beijing, China, ISBN 9787502943158, 2007 (in Chinese).
Wu, T. and Zhao, S.: Zaixu Xingshuijinjain-Yangtze River, Hubei People's Press, Hubei, China, Volume 1–2, ISBN 9787216039659, 2004 (in Chinese).
Xie, H., Zhang, S., Hou, S., and Zheng, X.: A comparative study of spatial interpolation methods of precipitation in a small sample area, Research of Soil and Water Conservation, 25, 117–121, https://doi.org/10.13869/j.cnki.rswc.2018.03.017, 2018 (in Chinese).
Xu, H.: Application of improved TOPSIS model in agricultural drought vulnerability zoning in Shaanxi Province, Agricultural Research in the Arid Areas, 34, 251–258, https://doi.org/10.7606/j.issn.1000-7601.2016.04.38, 2016 (in Chinese).
Yan, B., Guo, S., and Xiao, Y.: Study on the encounter between precipitation abundance and depletion in the water source and receiving areas of the South-North Water Transfer Central Line, J. Hydraul. Eng., 10, 1178–1185, https://doi.org/10.3321/j.issn:0559-9350.2007.10.005, 2007 (in Chinese).
Yang, B., Braeuning, A., Johnson, K. R., and Shi, Y.: General characteristics of temperature variation in China during the last two millennia, Geophys. Res. Lett., 29, 38-1–38-4, https://doi.org/10.1029/2001GL014485, 2002.
Yang, G. and Guo, S.: The historical documents on flood and waterlogging of southwest international rivers in the Yangtze River basin in Qing Dynasty, Zhonghua Book Company, Beijing, China, ISBN 9787101006681, 1991 (in Chinese).
Yang, S. and Li, Q.: Methodology for homogeneity analysis of precipitation series in China and improvement of dataset update, Climate Change Research, 4, 276–281, https://doi.org/10.3969/j.issn.1673-1719.2014.04.008, 2014 (in Chinese).
Yang, Y. and Han, J.: A study of screening methods for extreme climatic events in historical periods – an example of extreme drought sequences in the northwest millennium, Historical Geography, 30, 10–29, http://www.cnki.com.cn/Article/CJFDTotal-LSDL201402002.htm (last access: 23 July 2022), 2014 (in Chinese).
Yang, Y. and Zheng, W.: Spatial and temporal distribution and weather and climate characteristics of the 1849 floods in the middle and lower reaches of the Yangtze River, Journal of Palaeogeography (Chinese Edition), 6, 657–664, https://doi.org/10.7605/gdlxb.2008.06.010, 2008 (in Chinese).
Yao, L.: The 19th century was a period of extreme rainstorms and floods in China, Journal of Catastrophology, 3, 25–30, http://www.cnki.com.cn/Article/CJFDTotal-ZHXU199103004.htm (last access: 23 July 2022), 1991 (in Chinese).
Ye, Y. and Zhao, W.: Changes of drought and flood in the middle reaches of the Yangtze River in recent 100 years, J. Trop. Meteorol., 11, 181–186, http://www.cnki.com.cn/Article/CJFDTotal-RDQX502.010.htm (last access: 23 July 2022), 1995 (in Chinese).
Yin, S.: Research on extreme climate and hydrological events and their social impacts in the Upper Hanjiang River since historical periods, Science Press, Beijing, China, ISBN 9787030443267, 2015 (in Chinese).
Yin, S. and Huang, C.: Precipitation changes and the occurrence pattern of heavy rainfall and floods in the upper reaches of the Hanjiang River over the past 50 years, Bull. Soil Water Conserv., 32, 19–25, https://doi.org/10.13961/j.cnki.stbctb.2012.01.006, 2012 (in Chinese).
Yin, S., Wang, H., Wang, D., and Huang, C.: Historical flood disasters and climate change in the upper Hanjiang River, southern Shaanxi, Arid Zone Res., 27, 522–528, https://doi.org/10.13866/j.azr.2010.04.011, 2010 (in Chinese).
Yin, S., Meng, C., and Huang, C.: A comparative study of historical great floods in the upper Hanjiang River and the Jin-Shaan Valley of the Yellow River, J. Arid Land Resour. Environ., 27, 96–101, https://doi.org/10.13448/j.cnki.jalre.2013.07.032, 2013 (in Chinese).
Yu, J., Xia, J., She, D., Zhou, L., and Li, T.: The analysis of encounter probability of drought between the water source area and the Hai River water receiving area in the middle route of the South-to-North Water Transfer Project in China, South-to-North Water Transfers and Water Science & Technology, 16, 63–68, https://doi.org/10.13476/j.cnki.nsbdqk.20180010, 2018 (in Chinese).
Zhang, D.: A compendium of Chinese meteorological records of the last 3000 years, Jiangsu Education Press, Nanjing, China, ISBN 7806434682, 2004 (in Chinese).
Zhang, P. and Gong, G.: Several characteristics of climate change in China since the 16th century, Acta Geogr. Sin., 3, 238–247, https://doi.org/10.3321/j.issn:0375-5444.1979.03.005, 1979 (in Chinese).
Zhang, P., Cheng, H., Edwards, R. L., Chen, F., Wang, Y., Yang, X., Liu, J., Tan, M., Wang, X., Liu, J., An, C., Dai, Z., Zhou, J., Zhang, D., Jia, J., Jin, L., and Johnson, K. P.: A Test of Climate, Sun, and Culture Relationships from an 1810-Year Chinese Cave Record, Science, 322, 940–942, https://doi.org/10.1126/science.1163965, 2008.
Zhang, P., Cheng, H., Edwards, R. L., Chen, F.-H., Wang, Y., Yang, X., Liu, J., Tan, M., and Wang, X.: NOAA/WDS Paleoclimatology - Zhang et al. 2008 Wanxiang Cave, China Stalagmite d18O Data, NOAA National Centers for Environmental Information [data set], https://doi.org/10.25921/y7c4-7062, 2018.
Zhang, Q., Jiang, T., Liu, C., and Cheng, J.: Climate change and flood disasters in Haian area in the past 1000 years, J. Nat. Disaster, 3, 127–132, https://doi.org/10.3969/j.issn.1004-4574.2004.03.023, 2004 (in Chinese).
Zhang, R., Wu, B., Zhao, P., and Han, J.: Interdecadal transition of summer climate in eastern China in the late 1980s and its possible causes, Acta Meteorol. Sin., 5, 697–706, https://doi.org/10.3321/j.issn:0577-6619.2008.05.004, 2008 (in Chinese).
Zhang, Y. and Yin, S.: Study on flood and drought disasters and urban relocation and reconstruction in Ankang area during the historical period, Research of Soil and Water Conservation, 32, 19–25, https://doi.org/10.13961/j.cnki.stbctb.2012.01.006, 2012 (in Chinese).
Zhang, Y., Gou, X., Hu, W., Peng, J., and Liu, P.: Drought events in the Helan Mountains recorded by tree rings in the past 100 years, Acta Ecologica Sinica, 8, 2121–2126, https://doi.org/10.3321/j.issn:1000-0933.2005.08.042, 2005 (in Chinese).
Zhao, Z. and Wang, S.: The periodicity of drought and flood evolution in China in the past century, Meteorological Monthly, 1, 19–22, https://www.cnki.com.cn/Article/CJFDTotal-QXXX197901006.htm (last access: 23 July 2022), 1979 (in Chinese).
Zheng, H. and Liu, C.: Analysis of precipitation abundance encounter in different hydrological zones of South-North Water Transfer East and Central Lines, J. Geogr. Sci., 5, 523–532, https://doi.org/10.11821/xb200005002, 2000 (in Chinese).
Zheng, J., Zhang, P., and Zhou, Y.: Experiment on Establishing Drought and Flood Index Sequence in Historical Period by Using the Times of Drought and Flood Counties, Geogr. Res., 3, 1–9, http://www.dlyj.ac.cn/CN/10.11821/yj1993030001 (last access: 23 July 2022), 1993 (in Chinese).
Zheng, J., Ge, Q., Hao, Z., Liu, H., Man, Z., Hou, Y., and Fang, X.: Meteorological records in historical documents and quantitative reconstruction methods of climate change, Quat. Sci., 6, 1186–1196, https://doi.org/10.3969/j.issn.1001-7410.2014.06.07, 2014 (in Chinese).
Zheng, J., Zhang, X., Liu, Y., and Hao, Z.: Assessment of the characteristics of multi-scale changes in dryness and wetness in different regions of China in the past millennium, Acta Geogr. Sin., 7, 1432–1450, https://doi.org/10.11821/dlxb202007008, 2020 (in Chinese).
Zhou, L., Huang, C., Zhou, Y., Pang, J., Cha, X., Mao, P., and Zhang, Y.: Optical luminescence dating of paleo-flood events in Yunxi Yunxian section of the upper Hanjiang River and its response to climate change, Geogr. Res., 6, 1178–1192, https://doi.org/10.11821/dlyj201406017, 2014 (in Chinese).
Zhou, L., Huang, C., Zhou, Y., Pang, J., Zha, X., Xu, J., Zhang, Y., and Guo, Y.: Late Pleistocene and Holocene extreme hydrological event records from slackwater flood deposits of the Ankang east reach in the upper Hanjiang River valley, China, Boreas, 45, 673–687, https://doi.org/10.1111/bor.12181, 2016.
Zhou, Y., Wang, H., and Gao, X.: A preliminary study on the changes of water resources in the upper and middle reaches of the Yangtze River and Hanjiang River basin in the Past 531, Plateau Meteorology, 4, 744–749, https://doi.org/10.3321/j.issn:1000-0534.2006.04.025, 2006 (in Chinese).
Zhu, K.: Southeast monsoon and rainfall in China, Acta Geogr. Sin., 1, 1–27, https://doi.org/10.11821/xb193401001, 1934.
Zhu, K.: Subtropics of China, Chinese Sci. Bull., 17, 524–528, http://www.cnki.com.cn/Article/CJFDTotal-KXTB195817003.htm (last access: 23 July 2022), 1958 (in Chinese).
Zhu, K.: The way of heaven and humanity, Beijing Publishing House, Beijing, China, ISBN 9787200086812, 2018 (in Chinese).