the Creative Commons Attribution 4.0 License.
the Creative Commons Attribution 4.0 License.
 | 29 Jun 2022
The 852/3 CE Mount Churchill eruption: examining the potential climatic and societal impacts and the timing of the Medieval Climate Anomaly in the North Atlantic region
Gill Plunkett
Britta J. L. Jensen
Thomas J. Aubry
Christophe Corona
Woon Mi Kim
Matthew Toohey
Michael Sigl
Markus Stoffel
Kevin J. Anchukaitis
Christoph Raible
Matthew S. M. Bolton
Joseph G. Manning
Timothy P. Newfield
Nicola Di Cosmo
Francis Ludlow
Conor Kostick
Zhen Yang
Lisa Coyle McClung
Matthew Amesbury
Alistair Monteath
Paul D. M. Hughes
Pete G. Langdon
Dan Charman
Robert Booth
Kimberley L. Davies
Antony Blundell
Graeme T. Swindles
The 852/3 CE eruption of Mount Churchill, Alaska, was one of the largest first-millennium volcanic events, with a magnitude of 6.7 (VEI 6) and a tephra volume of 39.4–61.9 km3 (95 % confidence). The spatial extent of the ash fallout from this event is considerable and the cryptotephra (White River Ash east; WRAe) extends as far as Finland and Poland. Proximal ecosystem and societal disturbances have been linked with this eruption; however, wider eruption impacts on climate and society are unknown. Greenland ice core records show that the eruption occurred in winter 852/3 ± 1 CE and that the eruption is associated with a relatively moderate sulfate aerosol loading but large abundances of volcanic ash and chlorine. Here we assess the potential broader impact of this eruption using palaeoenvironmental reconstructions, historical records and climate model simulations. We also use the fortuitous timing of the 852/3 CE Churchill eruption and its extensively widespread tephra deposition of the White River Ash (east) (WRAe) to examine the climatic expression of the warm Medieval Climate Anomaly period (MCA; ca. 950–1250 CE) from precisely linked peatlands in the North Atlantic region.
The reconstructed climate forcing potential of the 852/3 CE Churchill eruption is moderate compared with the eruption magnitude, but tree-ring-inferred temperatures report a significant atmospheric cooling of 0.8 ∘C in summer 853 CE. Modelled climate scenarios also show a cooling in 853 CE, although the average magnitude of cooling is smaller (0.3 ∘C). The simulated spatial patterns of cooling are generally similar to those generated using the tree-ring-inferred temperature reconstructions. Tree-ring-inferred cooling begins prior to the date of the eruption suggesting that natural internal climate variability may have increased the climate system's susceptibility to further cooling. The magnitude of the reconstructed cooling could also suggest that the climate forcing potential of this eruption may be underestimated, thereby highlighting the need for greater insight into, and consideration of, the role of halogens and volcanic ash when estimating eruption climate forcing potential.
Precise comparisons of palaeoenvironmental records from peatlands across North America and Europe, facilitated by the presence of the WRAe isochron, reveal no consistent MCA signal. These findings contribute to the growing body of evidence that characterises the MCA hydroclimate as time-transgressive and heterogeneous rather than a well-defined climatic period. The presence of the WRAe isochron also demonstrates that no long-term (multidecadal) climatic or societal impacts from the 852/3 CE Churchill eruption were identified beyond areas proximal to the eruption. Historical evidence in Europe for subsistence crises demonstrate a degree of temporal correspondence on interannual timescales, but similar events were reported outside of the eruption period and were common in the 9th century. The 852/3 CE Churchill eruption exemplifies the difficulties of identifying and confirming volcanic impacts for a single eruption, even when the eruption has a small age uncertainty.
- Article
(12844 KB) - Full-text XML
- BibTeX
- EndNote


The 852/3 CE eruption of Mount Churchill in the Wrangell volcanic field, southeast Alaska, was one of the largest first-millennium volcanic events, with a roughly estimated eruptive volume of 47 km3 and top plume height of ca. 40–45 km (Lerbekmo, 2008). The considerable ash fallout from this Volcanic Explosivity Index (VEI) 6 Plinian eruption extended eastwards: visible horizons of the ash, termed White River Ash east (WRAe), have been identified >1300 km from the source (e.g. Lerbekmo, 2008; Patterson et al., 2017), and WRAe cryptotephra (non-visible volcanic ash) deposits have been detected in northeastern North America (Pyne O'Donnell et al., 2012; Mackay et al., 2016; Jensen et al., 2021; Fig. 1a–c). Furthermore, the correlation of the WRAe with the “AD860B” tephra first identified in Ireland (Pilcher et al., 1996) has extended the known spatial distribution of the cryptotephra to Greenland (NGRIP (North Greenland Ice Core Project) and NEEM (North Eemian) ice cores) and western and eastern Europe (e.g. Coulter et al., 2012; Jensen et al., 2014; Watson et al., 2017a, b; Kinder et al., 2020).
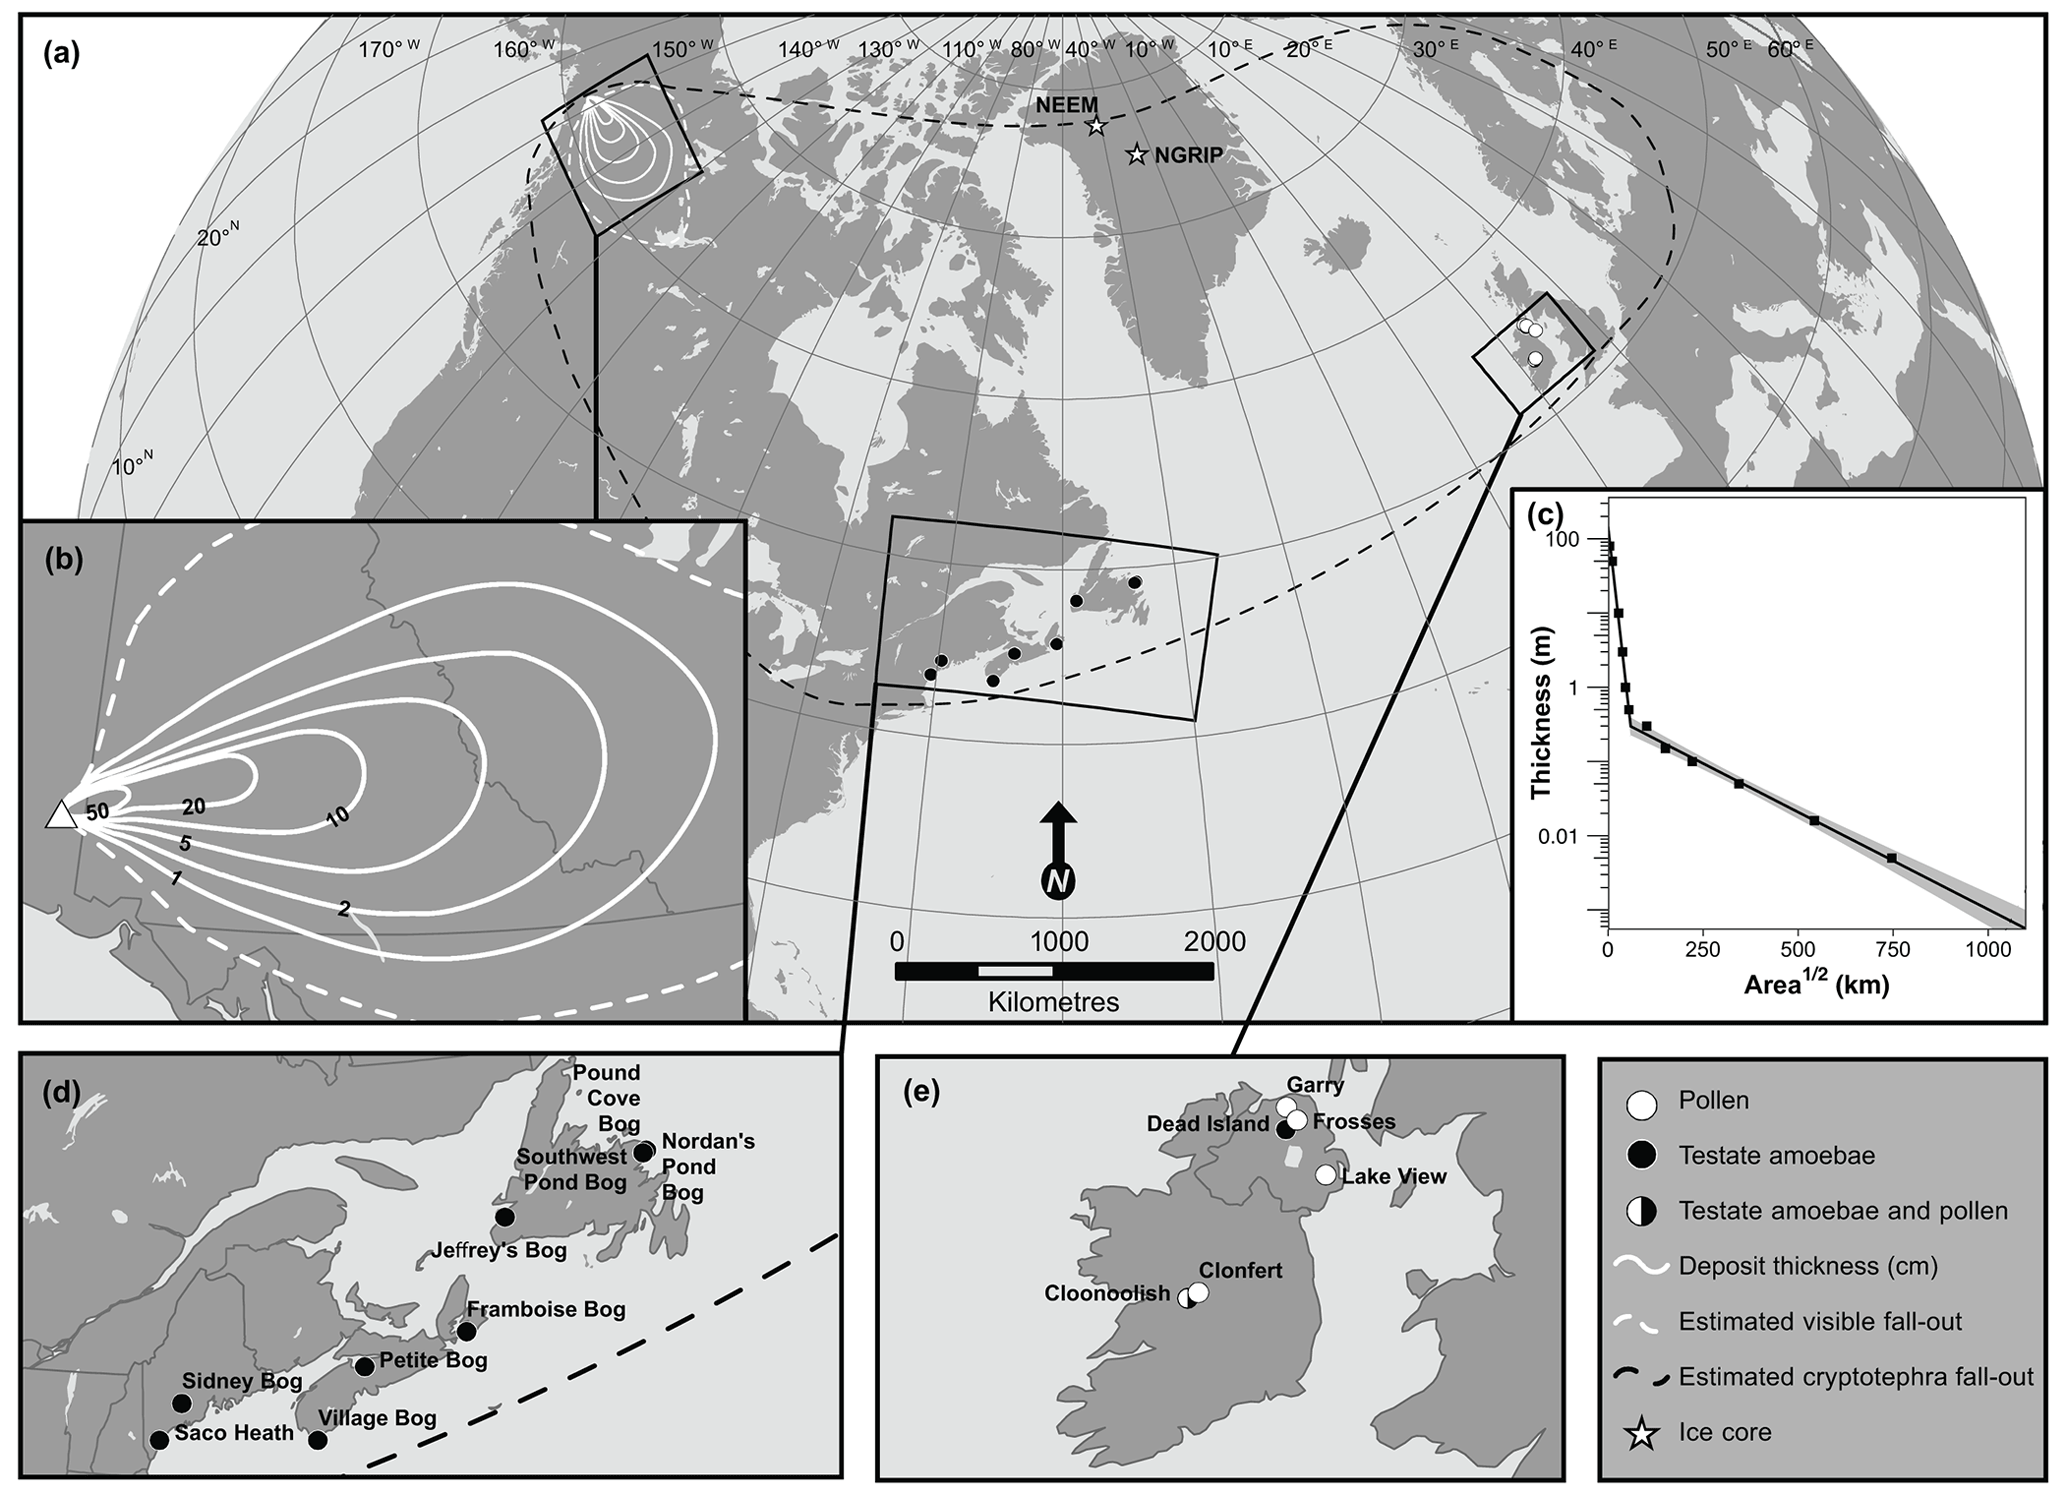
Figure 1Site and White River Ash east distribution map with thickness data for volume estimate. (a) Location map, highlighting Greenland ice core sites (NEEM: North Eemian; NGRIP: North Greenland Ice Core Project), estimated cryptotephra fallout area and inset map extents. (b) Isopach map synthesised from distal and proximal isopachs (Lerbekmo, 1975, 2008). (c) Plot of deposit thickness (on a log scale) against square root area of isopachs ≥0.5 cm and two-piece exponential fit (black line). The grey shaded area represents the 95 % confidence interval of the fitted function. (d) Inset map highlighting testate amoebae sites from northeastern North America. (e) Inset map highlighting testate amoebae and pollen sites from Ireland.
The ash produced from this eruption caused considerable and long-lasting environmental disturbances in regions proximal to Mount Churchill. For example, the eruption has been linked with changes in vegetation that persisted for ca. 50–150 years in Yukon (Rainville, 2016), multi-centennial changes in peatland ecology in southeast Alaska (Payne and Blackford, 2008) and decreases in aquatic productivity lasting ca. 100 years in southwest Yukon (Bunbury and Gajewski, 2013). These spatial patterns in proximal environmental responses to the 852/3 CE Churchill eruption are diverse. The eruption and its environmental impacts are also suggested to have driven societal changes in the region (Kristensen et al., 2020), notably a decline in indigenous occupancy in the southern Yukon (Hare et al., 2004). In addition, the event may have triggered the southward migration of people, who brought their culture and Athapaskan language to the US Great Basin and the American southwest (Mullen, 2012). Several studies have therefore characterised the proximal impacts of this 852/3 CE Churchill eruption, but less is known about the wide-scale Northern Hemisphere (NH) or global impacts of this large eruption.
Several lines of evidence suggest that the 852/3 CE Churchill eruption occurred in winter, including the stratigraphic context of the tephra in proximal locations (West and Donaldson, 2000), the ash cloud trajectory (Muhs and Budahn, 2006) and the timing of ash deposition in Greenland. Cryptotephra from the eruption was identified in the NGRIP and NEEM-2011-S1 ice cores from northern Greenland in ice then dating to 847 CE based on the Greenland Ice Core 2005 (GICC05 chronology; Coulter et al., 2012; Jensen et al., 2014). Based on the revised NS1-2011 chronology (Sigl et al., 2015), the event is now dated to the winter of 852/3 CE (Fig. 2) and is likely to have occurred between September 852 CE and January 853 CE, with sulfate deposition peaking in early 853 CE (Fig. 2e, f). The eruption also produced large quantities of ash and chlorine, the peak deposits of which are detected a few months prior to the sulfate peak in Greenland (Fig. 2). The NS1-2011 chronology is precise to the calendar year in 775 and 939 CE (Sigl et al., 2015), and it is therefore well-constrained over the time period of interest for this Churchill eruption. The resultant conservative age uncertainty associated with the 852/853 CE Churchill eruption is winter 852/853 CE ± 1 calendar year.
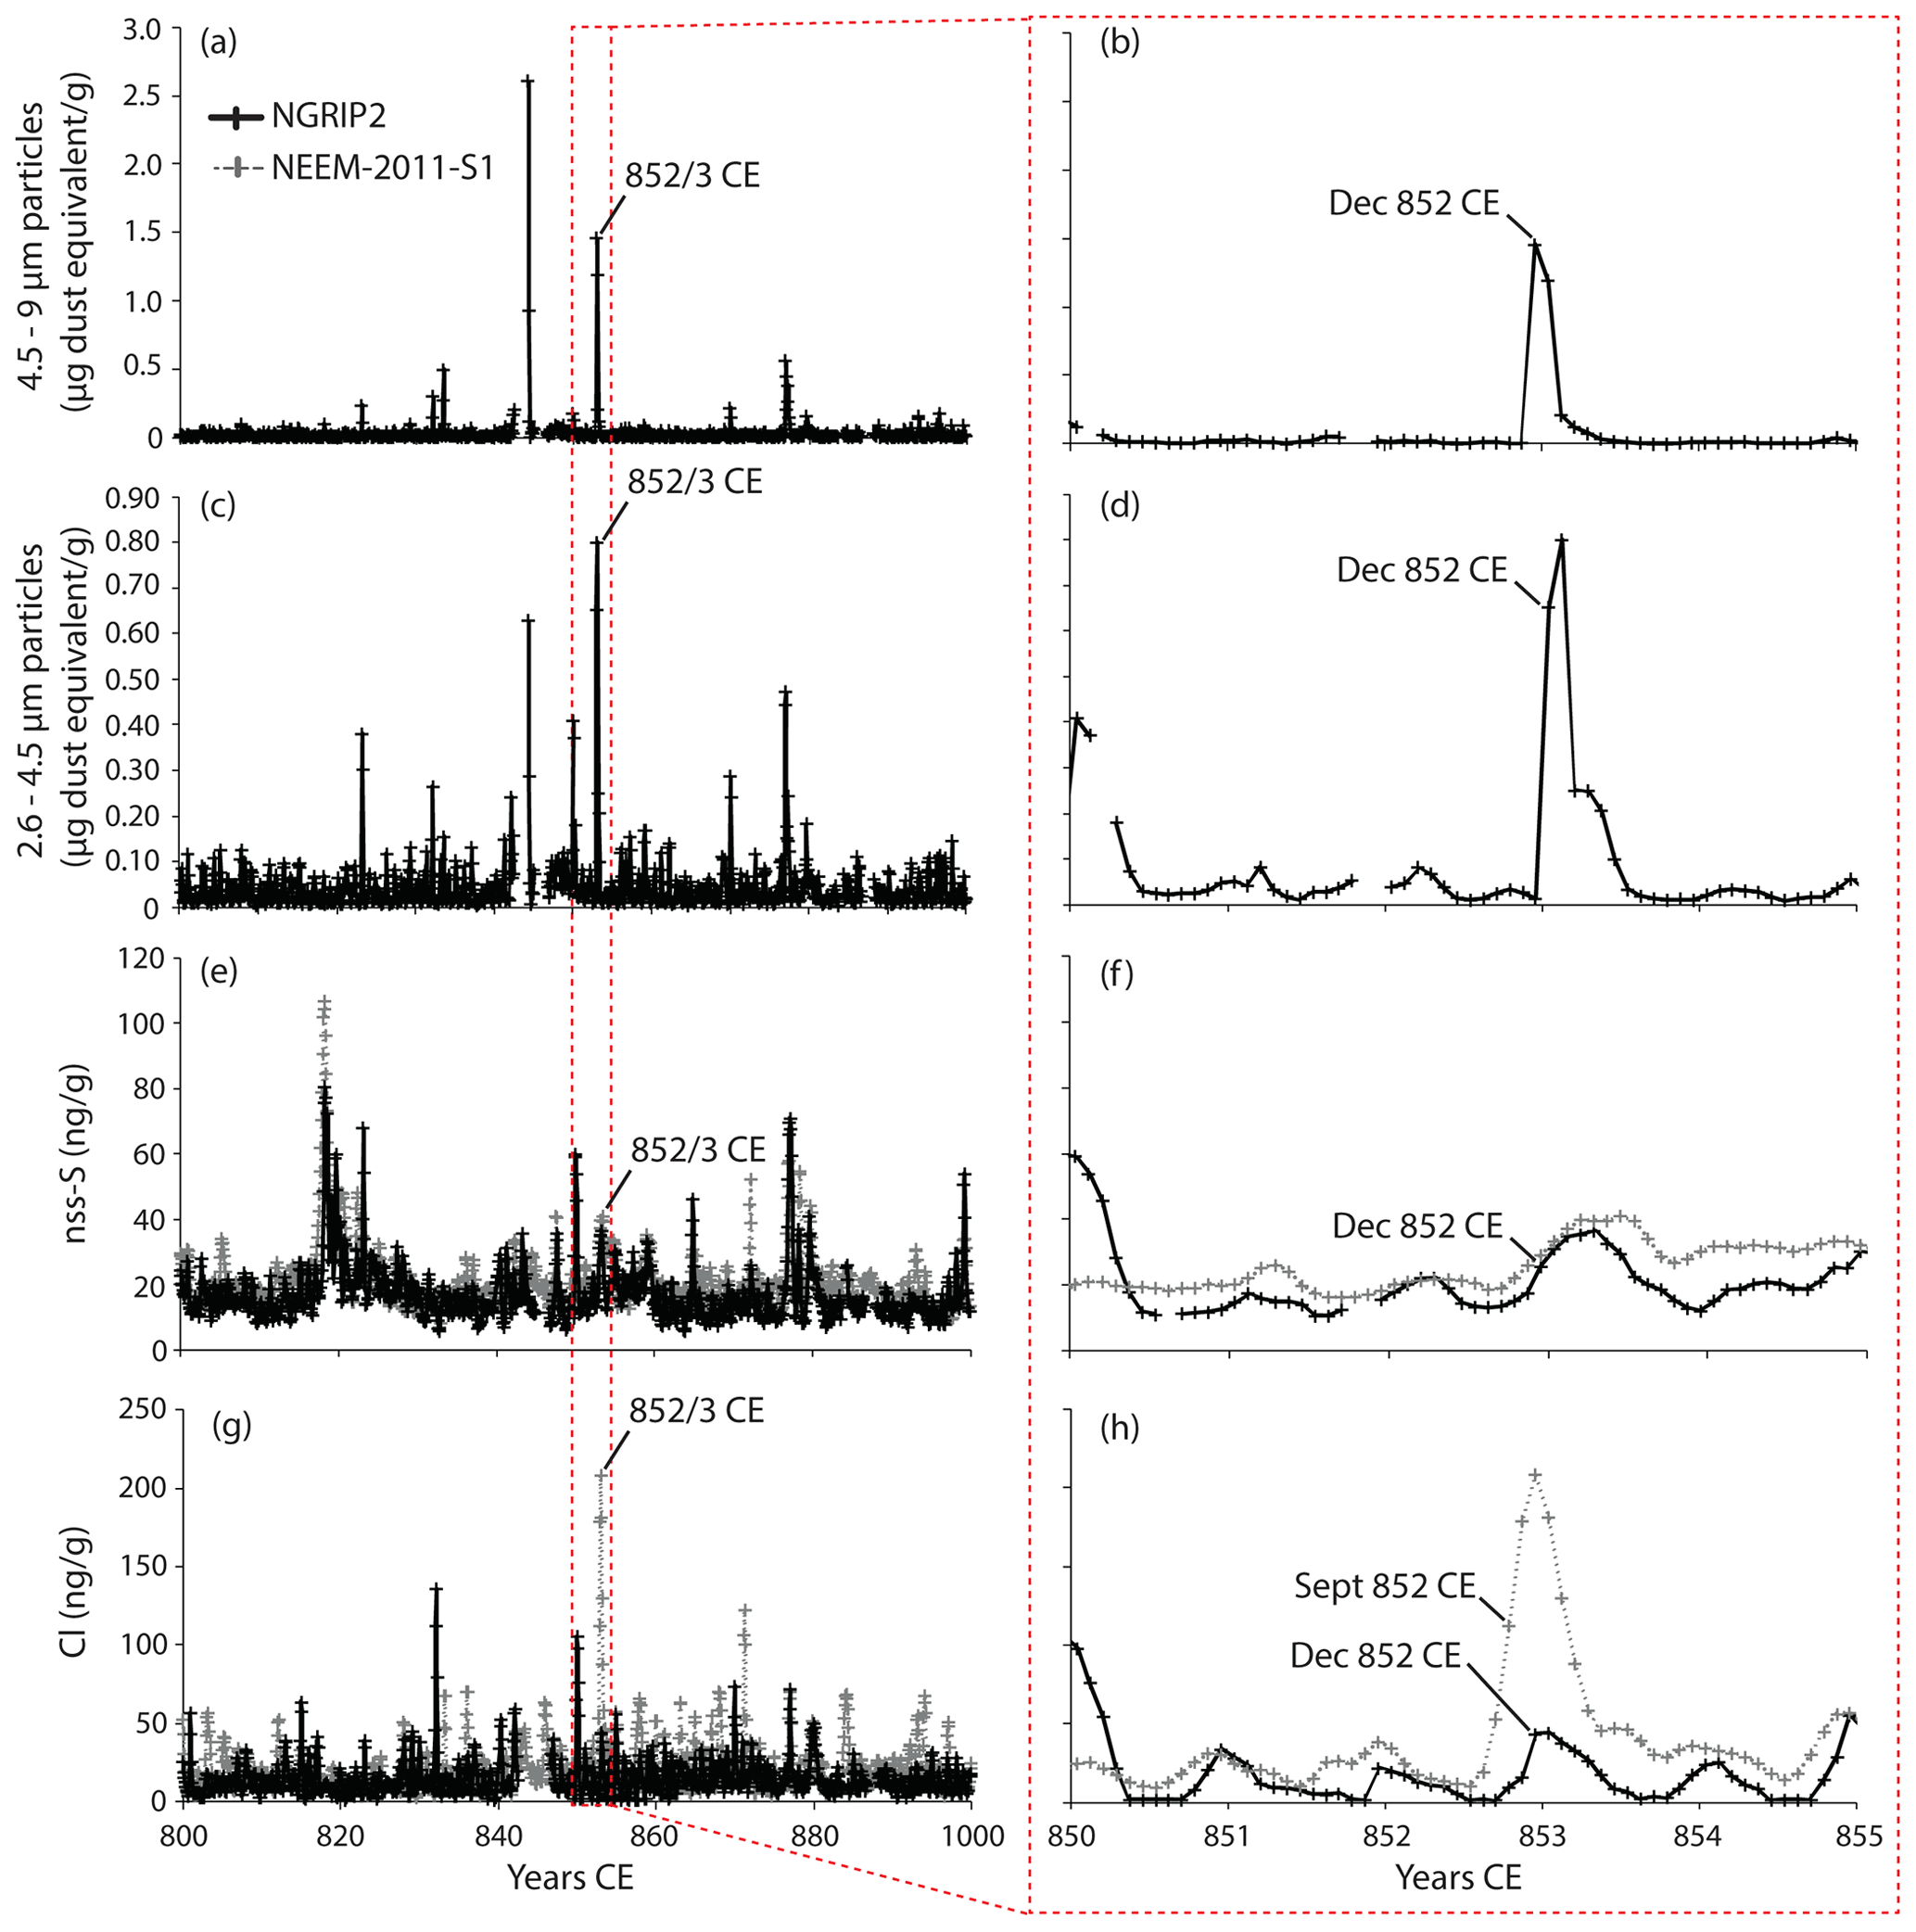
Figure 2Geochemical characteristics of the 852/3 CE Churchill eruption based on concentrations of (a, b) ash inferred from 4.5–9 µm particles, (c, d) ash inferred from 2.6–4.5 µm particles, (e, f) non-sea salt sulfate (nss-S) and (g, h) chlorine (Cl), from Greenland ice cores NGRIP2 and NEEM-2011 S1 (Jensen et al., 2014) on the NS1-2011 chronology (Sigl et al., 2015).
Large volcanic eruptions have been implicated in global to hemispheric climate change and societal impacts (e.g. Sigl et al., 2015; Stoffel et al., 2015; Büntgen et al., 2016, 2020; Oppenheimer et al., 2018; McConnell et al., 2020) and raise the question of whether the Churchill eruption – amongst the largest-magnitude eruptions of the Common Era – also had a far-reaching impact. While extratropical eruptions are often thought to have less impact on climate than tropical eruptions, recent modelling experiments have shown that large extratropical eruptions with injection heights above ∼17 km can have a significant hemispheric climate impact (Toohey et al., 2019). The Churchill eruption certainly reached stratospheric heights, but it appears to be associated with only limited sulfate deposition in Greenland ice cores (Fig. 2e), on the basis of which it is estimated to have produced 2.5 Tg of sulfur (ca. 5 Tg SO2; Toohey and Sigl, 2017). This sulfate production estimate of the 852/3 CE Churchill eruption is an order of magnitude less than the Alaskan 43 BCE eruption of Okmok (McConnell et al., 2020), which was one of the three largest eruptions, in terms of estimated aerosol forcing, of the last 2500 years (Sigl et al., 2015) and is around one-third of the amount of sulfate produced during the 1991 eruption of Mount Pinatubo (Guo et al., 2004). The 852/3 Churchill eruption therefore provides a test case for investigating whether the event had the potential to impact climate and society on the basis of the moderate estimated volcanic emissions and the degree to which palaeoclimate reconstructions and historical records demonstrate environmental changes that might be regarded as consequences of the eruption.
Given the extent of the Churchill WRAe isochron in glacial and terrestrial environments spanning North America and western Eurasia, our study serves dual purposes. Our first aim is to examine potential NH impacts of the 852/3 CE Churchill eruption on climate, terrestrial environments and societies, using modelled forcing data, climate simulations, palaeoenvironmental reconstructions and historical records. Our second aim is to use the WRAe tephra isochron as a pinning point between intercontinental palaeoenvironmental records to characterise and compare regional expressions of climate change near the outset of the Medieval Climate Anomaly (MCA), a period of increased temperatures ca. 950–1250 CE (Mann et al., 2008, 2009). The WRAe isochron from the 852/3 CE Churchill eruption is therefore aptly placed to identify leads and lags in MCA climate responses and improve characterisations of the spatial and temporal extent of this warm period. We similarly use the tephra isochron to critique the timing of land-use practices, inferred from pollen records, during a period of known societal reorganisation, to determine the extent to which climate change played a role in socio-economic transformation.
2.1 Revised eruption volume estimate and magnitude
Despite the considerable magnitude of the eruption that deposited WRAe, there has not been a spatially consistent estimate of its volume or magnitude using established methods (e.g. two-piece exponential function, Pyle, 1989; Weibull function, Bonadonna and Costa, 2012). The most recent volume estimate for WRAe (Lerbekmo, 2008) used disparate isopach maps for the proximal and distal regions of the deposit and the uncertainty assessment was limited. Here we construct an updated isopach map for WRAe using a GIS-based synthesis of Lerbekmo's distal and proximal isopachs ≥0.5 cm (Lerbekmo, 1975, 2008; Fig. 1a, b). We then calculate an updated tephra volume estimate by assuming deposit thinning follows a two-piece exponential function (Pyle, 1989; Fierstein and Nathenson, 1992). Dense rock equivalent (DRE) is calculated assuming a representative deposit density of 1.19 kg m−3 and a dense rock density of 2.5 kg m−3 (following Lerbekmo, 2008). These estimates of WRAe volume are the first to assess function-fitting confidence, allowing the mathematical model to account for the uncertainty of the deposit volume, especially <0.5 cm.
2.2 Reconstructed forcing potential: stratospheric aerosol optical depth and radiative forcing
We develop a primary forcing reconstruction for the 852/3 CE Churchill eruption using the EVA(eVolv2k) 550 nm stratospheric aerosol optical depth (SAOD) reconstruction (Toohey and Sigl, 2017). Detailed explanations of the model selection and set-up are provided in Appendix A. We also generate a second SAOD reconstruction using the EVA_H model, which is an extension of the Easy Volcanic Aerosol Model (EVA; Toohey et al., 2016), which accounts for the SO2 injection latitude and altitude and is calibrated using a more extensive observational dataset than EVA (Aubry et al., 2020). The EVA_H reconstruction uses the same SO2 mass as EVA, the latitude of Churchill (61.38∘ N) and an injection altitude of 31.5 km. The injection altitude is based on the isopleth-derived top height estimate of 40–45 km from Lerbekmo (2008) corrected by a factor of 0.725 to be representative of the altitude of the spreading umbrella cloud instead of the cloud top (Carey and Sparks, 1986). We also provide a 95 % confidence interval on EVA_H prediction that accounts for uncertainties in the model parameters (Aubry et al., 2020), the SO2 mass uncertainty (5±3.3 Tg SO2, Toohey and Sigl, 2017) and an assumed uncertainty of 30 % on the injection height.
2.3 Climate model simulation
Climate conditions were simulated using the Community Earth System Model version 1.2.2 (CESM; Hurrell et al., 2013). The ensemble simulation consists of 20 ensemble members performed to study the impacts of the 852/853 CE Churchill eruption on climate. To generate the ensemble members, initially a seamless transient simulation is run from 1501 BCE (Kim et al., 2021a) with time-varying orbital parameters (Berger, 1978), total solar irradiance (Vieira et al., 2011; Usoskin et al., 2014, 2016), greenhouse gases (Joos and Spahni, 2008; Bereiter et al., 2015) and volcanic forcing from the HolVol v.1.0 (Sigl et al., 2021) and eVolv2k (Toohey and Sigl, 2017) databases. The necessary prescribed spatio-temporal distribution of volcanic sulfate aerosol for the simulations is generated using the EVA model (Toohey et al., 2016) and follows the same procedure employed by Zhong et al. (2018) and Kim et al. (2021a). Each ensemble member is branched off at 845 CE with a small perturbation in the atmosphere introduced at the first time step. Then, the simulations are seamlessly run until 859 CE. The simulations used for the analysis have the spatial resolutions of approximately for the atmosphere and land and for the ocean and sea ice. The vertical grids use 30 levels for the atmosphere, 60 levels for the ocean and 15 levels for the land. The output data are provided at a monthly resolution. More details of the simulations investigating the impact of the 852/3 CE Churchill eruption on climate are provided in Appendix B.
The anomalies of temperature and precipitation are calculated by subtracting the 845–859 CE multi-year monthly means from the values at each grid point for the initial condition ensemble simulation. From these anomalies, the seasonal means of each individual ensemble simulation are computed as well the ensemble means of 20 member simulations. NH summer conditions reported here refer to climate conditions of June–July–August (JJA), and winter conditions refer to December (of the previous year)–January–February (of the reported calendar year) (DJF).
To test the statistical significance of changes in temperature and precipitation after the 852/3 CE Churchill eruption, we use the Mann–Whitney U test (for an example, refer to Kim et al., 2021a), which compares the distributions of two variables between the pre-eruption period (845–852 CE) and each individual after-eruption year (853, 854 and 855 CE). More details of the procedure for the significance tests are provided in Appendix B. In addition, the variability of the spatially averaged ensemble means of temperature and precipitation is compared with the pre-eruption ensemble by assessing whether the variability falls within the range of 2 standard deviations from the means of the pre-eruption period.
2.4 Northern Hemisphere (NH) tree-ring summer temperature and drought reconstructions
NH summer (JJA) temperatures in the 850s were reconstructed using 13 NH tree-ring width and 12 maximum latewood density chronologies from the NVOLC v2 dataset (Guillet et al., 2017, 2020). Full details of the nested principal component regression (PCR) used to reconstruct NH JJA temperature anomalies (with respect to 1961–1990) and the model calibration are provided in Appendix C. To place the summer temperature anomalies within the context of climate variability at the time of major volcanic eruptions, we removed longer timescale variations by filtering the final reconstruction, which involved calculating the difference between the raw time series and the 31-year running mean. Further investigation of volcanic-forced cooling was facilitated by filtering the original reconstructions using a 3-year running mean to filter out high-frequency noise. To estimate the spatial variability of summer cooling induced by the winter 852/3 CE eruption, we also developed a 500–2000 CE gridded reconstruction of extratropical NH summer temperatures (more details are provided in Appendix C).
Estimated soil moisture anomalies for the 9th century are extracted from tree-ring reconstructions of the gridded summer (JJA) Palmer Drought Severity Index (PDSI) over North America, Europe and the Mediterranean (Cook et al., 2010, 2015). The PDSI metric integrates the influence of both precipitation, evapotranspiration and storage on soil moisture balance throughout the year and is normalised so that values can be compared across regions with a range of hydroclimate conditions. Positive values indicate anomalously wet conditions, while negative values are anomalously dry for that location, and normal conditions are set to zero. Tree-ring PDSI reconstructions in North American and Euro-Mediterranean drought atlases are developed using the point-by-point regression approach described by Cook et al. (1999).
2.5 Testate amoebae peatland water table depth (i.e. summer effective precipitation) reconstructions
Testate amoebae are a well-established palaeoenvironmental proxy used to reconstruct past hydroclimatic variability in ombrotrophic (rain-fed) peatlands because species assemblages predominantly respond to changes in peatland surface moisture during summer months, and tests are preserved in the anoxic peat strata (e.g. Woodland et al., 1998; Mitchell et al., 2008). For this study, testate amoeba analysis was completed on cores obtained from 11 ombrotrophic peatlands located in Maine (n=2), Nova Scotia (n=3), Newfoundland (n=4) and Ireland (n=2) (Fig. 1d, e), in which the presence of the WRAe has been confirmed by electron probe microanalysis of the volcanic glass (Swindles et al., 2010; Pyne O'Donnell, 2012; Mackay et al., 2016; Monteath et al., 2019; Jensen et al., 2021; Plunkett, unpublished; Appendix D). The peatland sampling approaches used here are outlined in Mackay et al. (2021), and testate amoeba analysis was completed using standard protocols (Hendon and Charman, 1997; Booth et al., 2010) across all cores at a multidecadal resolution (approximately 40 years), equating to 2 to 4 cm intervals. Testate amoebae were extracted from 1 cm3 subsamples following standard procedures (Hendon and Charman, 1997; Booth et al., 2010). At least 100 individual tests were identified per sample (Payne and Mitchell, 2009) using the taxonomy of Charman et al. (2000) and Booth (2008). Testate amoebae water table depth (WTD) reconstructions were obtained using the tolerance-downweighted weighted averaging model with inverse deshrinking (WA-Tol inv) from the North American transfer function of Amesbury et al. (2018). Reconstructed WTD values were normalised for comparative purposes (Swindles et al., 2015; Amesbury et al., 2016). Two WTD reconstructions exist from different coring locations on Sidney Bog, Maine (Clifford and Booth, 2013; Mackay et al., 2021); therefore, a composite record was constructed based on interpolated average WTD values (Appendix E). Two WTD reconstructions also exist from different coring locations on Saco Heath (Clifford and Booth, 2013; Mackay et al., 2021); however, a composite record was not created for this site since one record contains a pronounced hiatus below the WRAe horizon, relating to a burning event (Clifford and Booth, 2013). The Saco record presented within this study contains no evidence of a hiatus until later in the record, ca. 1000 CE, when the accumulation rate decreases (Appendix D). Core chronologies were developed using Bayesian analysis within the R package “BACON” (Blaauw and Christen, 2011) based on 14C dates and tephrochronologies (Appendix D). Radiocarbon dates were calibrated using the NH IntCal20 calibration curve (Reimer et al., 2020) and are reported as Common Era dates.
2.6 Pollen vegetation reconstructions
The 9th century in Ireland was a time of significant socio-economic reorganisation and possibly population decline (Kerr et al., 2009; McLaughlin et al., 2018; McLaughlin, 2020). To investigate the extent to which these events may have been driven by the effects of either the 852/3 CE eruption or the transition to the MCA, we compiled land-use proxy data from five pollen records (Fig. 2e) that included the Churchill (AD860B) tephra as a chronological tie-point (Hall, 2005; Coyle McClung, 2012; Plunkett, unpublished data). Raw data were re-categorised by biotope, with a specific focus on the ratio of arboreal pollen (AP) to non-arboreal pollen (NAP) and the representation (percentage of total dryland pollen) of taxa associated with pastoral or arable farming. Age models were constructed for each site based on tephrochronological and 14C dates in the same manner used for the testate amoebae records (Sect. 2.5).
2.7 Historical records
A wide range of written sources were examined to collate the extant historical record of climate, weather and societal stresses for the period 850–856 CE. This survey focused on Europe – northwestern insular Europe (Irish and Anglo-Saxon annals) and continental Europe (annals and histories covering Byzantine, Carolingian and Umayyad lands) – southwest Asia, North Africa (Abbasid and Byzantine texts), and Tang-era eastern China. To place the 852/3 CE eruption in a wider context where effects of the eruption are apparent, we also employ evidence for large subsistence crises (“famines”) and seemingly more circumscribed crises (“lesser food shortages”) spanning 800–900 CE reported in Carolingian sources, which comprise one of the densest records of subsistence crises extant for the 9th century anywhere (Newfield, 2013; Devroey, 2019).
3.1 Volume estimate and magnitude
WRAe deposit bulk tephra volume was modelled as a mean value of 49.3 km3, with an estimated 95 % confidence interval (CI) of 39.4–61.9 km3. The deposit constituted a mean dense rock equivalent (DRE) volume of 23.6 km3 (95 % CI, 18.8–29.6 km3) and weighed about 48.7 Gt (95 % CI, 38.9–61.2 Gt). Such volumes and masses indicate the eruption that deposited WRAe was of Volcanic Explosivity Index (VEI) 6 and a magnitude (M) of around 6.7 (95 % CI, 6.6–6.8).
3.2 Climatic forcing potential of the 852/3 CE Churchill eruption
The EVA(eVolv2k) reconstructed SAOD at 550 nm for the 852/3 CE eruption is relatively moderate, with a peak aerosol optical depth perturbation of 0.049 (95 % confidence interval 0.021–0.085) in terms of global monthly mean and 0.078 in terms of NH monthly mean (Fig. 3a, b). In comparison, the global mean SAOD following the Pinatubo 1991 eruption was 2–3 times larger (Thomason et al., 2018) and the reconstructed global mean SAOD for the largest eruptions of the Common Era (Fig. 3a) reaches 0.3–0.6 (e.g. 0.56 for the Samalas 1257 CE eruption). For the 9th century alone, four volcanic events have a peak global mean SAOD exceeding that of the 852/3CE Churchill eruption. The EVA_H reconstruction (Fig. 3b), which accounts for the SO2 injection latitude and altitude, suggests an even smaller global monthly mean SAOD perturbation of 0.033 (95 % confidence interval 0.012–0.053). In terms of the latitudinal distribution of the SAOD perturbation, both the EVA (Fig. 3c) and EVA_H (not shown) reconstructions produce an SAOD perturbation that is much stronger in the NH but propagates to the tropics and Southern Hemisphere. Based on the EVA(eVolv2k) SAOD estimate and using volcanic forcing efficiency from Marshall et al. (2020) (Appendix A), the global monthly mean radiative forcing peaked at −0.92 W m−2 (Fig. 2b), a value roughly one-third that for the Mount Pinatubo 1991 eruption (e.g. Schmidt et al., 2018). The upper-end SAOD estimate from EVA(eVolv2k), obtained from a winter eruption (which would maximise the forcing efficiency; Marshall et al., 2019), has a global monthly mean radiative forcing peak of −1.7 W m−2. Conversely, the lower-end SAOD estimate from EVA_H, obtained from a summer eruption, has a mean peak forcing of −0.33 W m−2.

Figure 3Stratospheric aerosol optical depth (SAOD, 550 nm) reconstructed for the Churchill 852/3 eruption. (a) The 500 BCE–1900 CE EVA(eVolv2k) reconstructed global mean SAOD, with the inset showing details for the 803–903 period and both the global mean and North Hemisphere (NH) mean SAOD. (b) The same time series for the 852–859 CE period, during which the Churchill 852/3 eruption is clearly seen. This panel also shows the global mean radiative forcing reconstructed from the EVA(eVolv2k) SAOD and an alternative SAOD reconstruction using the EVA_H model, an extension of EVA that accounts for the SO2 injection altitude and latitude for reconstructing global mean SAOD. Shadings show 95 % confidence intervals on the EVA and EVA_H SAOD reconstructions. (c) Time–latitude evolution of SAOD as reconstructed with EVA(eVolv2k).
3.3 Annually resolved climate reconstructions
3.3.1 NH tree-ring-based climate reconstructions
NH summer temperature reconstructions based on tree-ring records reveal long-term decadal-scale temperature fluctuations between 500–2000 CE (Fig. 4a). All tree-ring-based NH JJA reconstructions contain a short-lived decreasing temperature trend from 851 CE that peaks in 853 CE, with temperature anomalies (relative to 1961–1990) reaching −0.8 ∘C in the filtered reconstruction (Fig. 4b). The 1961–1990 reference period used for the tree-ring reconstructions was 0.1 ∘C warmer than the modelled climate simulation reference period (845–852 CE). Cold temperatures persist in 854 CE (with −0.65 and −0.5 ∘C in the filtered and unfiltered reconstructions, respectively) before attaining pre-eruption levels in 855 CE (Fig. 4b). The cold temperature anomaly observed in 853 CE is significant and among the 5th percentile of coldest values in the filtered and unfiltered reconstructions and very close to the 1st percentile of the coldest values in the distribution of the filtered reconstruction (Appendix F). Over the period 500–2000 CE, 853 CE ranks as the 28th and 18th coldest event in the unfiltered and filtered reconstructions, respectively (Fig. 4a). Further investigation of volcanically forced cooling as examined using a 3-year running mean places 853–856 CE as the 11th coldest 3-year period between 500 and 2000 CE (Appendix G). An examination of the 30 coldest 3-year periods from the filtered time series highlights that all such periods are preceded by an eruption or a group of eruptions, and 19 of these eruptions occur within 2 years before the ranked cold periods (Appendix G).
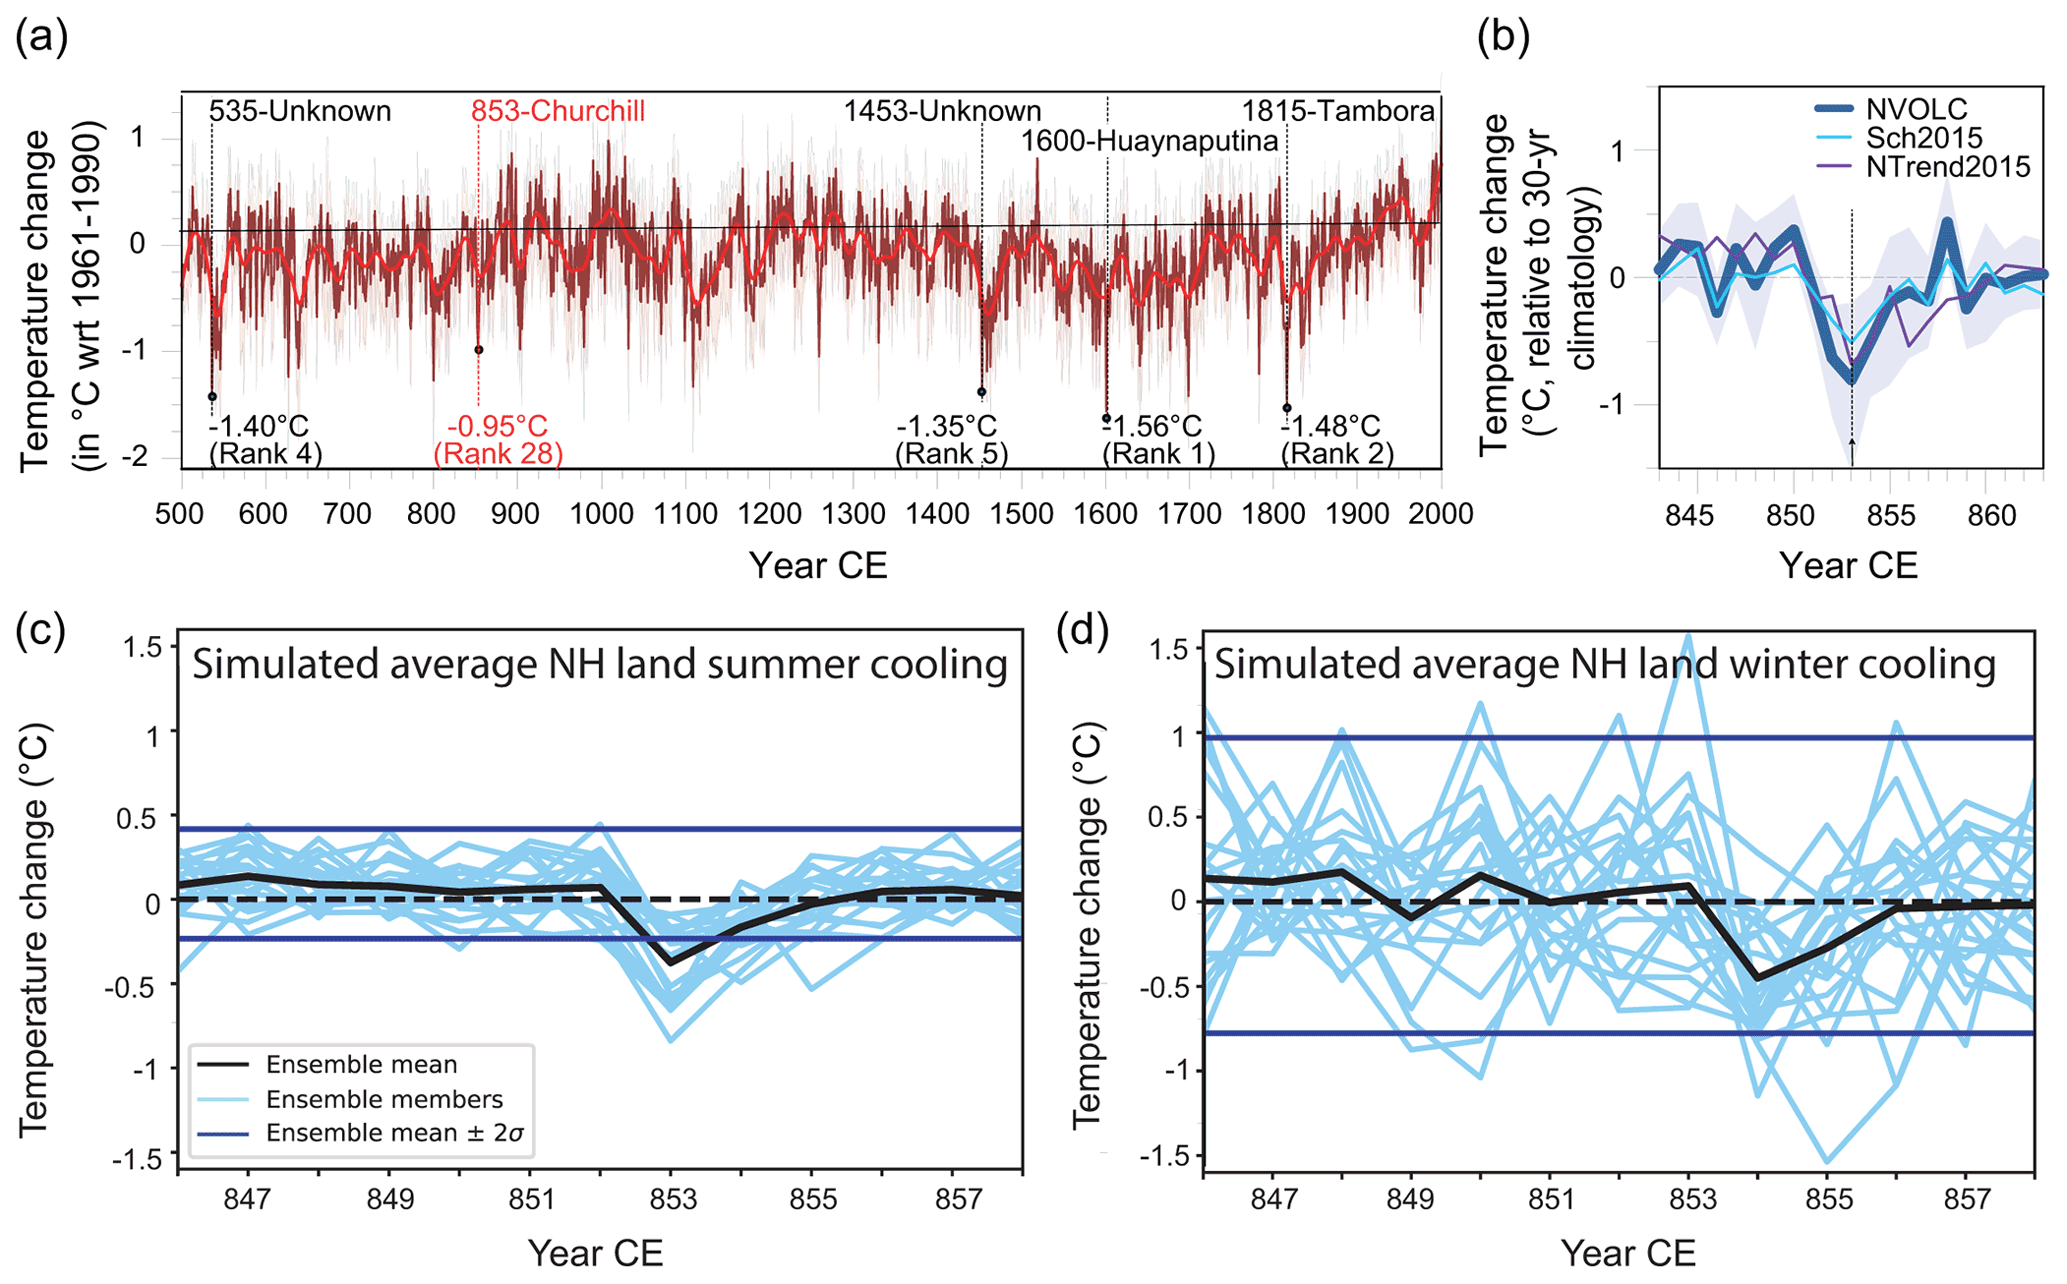
Figure 4(a, b) Tree-ring-derived temperature reconstructions around the time of the 852/3 CE Churchill eruption: (a) unfiltered NH extra-tropical land (40–90∘ N) summer temperature anomalies (with respect to the period 1961–1990) since 500 CE. The red lines represent the interannual temperature anomaly variations, and the grey lines represent the 95 % bootstrap limits. (b) Comparison of the cooling induced by the winter 852/3 CE eruption in the NVOLC v2 reconstruction filtered with a 31-year running mean and the Sch2015 (Schneider et al., 2015) and N-TREND2015 (Wilson et al., 2016) NH reconstructions. Grey shaded area represents the uncertainty associated with the NVOLC temperature anomaly reconstruction. (c, d) Simulated NH climate before and after the 852/3 Churchill eruption: 846–858 CE time series of spatially averaged NH extratropical (15–90∘ N latitudes) land temperature anomalies from 20 ensemble simulations for (c) summer (JJA) and (d) winter (DJF) in light blue lines. The thick black lines indicate the ensemble means, and the horizontal blue lines represent 2 standard deviations from the ensemble means of the 845–852 CE pre-eruption period. For comparative purposes, the 1961–1990 reference period used for the tree-ring reconstructions (a, b) was 0.1 ∘C warmer than the modelled climate simulation reference period (c, d) of 845–852 CE.
Spatial patterns of the hemisphere-wide JJA cooling in the early 850s are complex (Fig. 5a): generally cold conditions prevailed over western and central Europe as well as Scandinavia (anomalies exceeding −0.8 ∘C with respect to the 1961–1990 mean) – and to a lesser extent Alaska (with peak cooling in 854 CE) – between 851 and 854 CE. The peak cooling in the NH in 853 and 854 CE seen in Fig. 4b is explained by the strong cooling of Central Asia and vast parts of Siberia in the same years (Fig. 5a). While clear warming is evident in central and western Europe and Scandinavia in 855 CE, low temperatures persist in Central Asia in 855 CE.
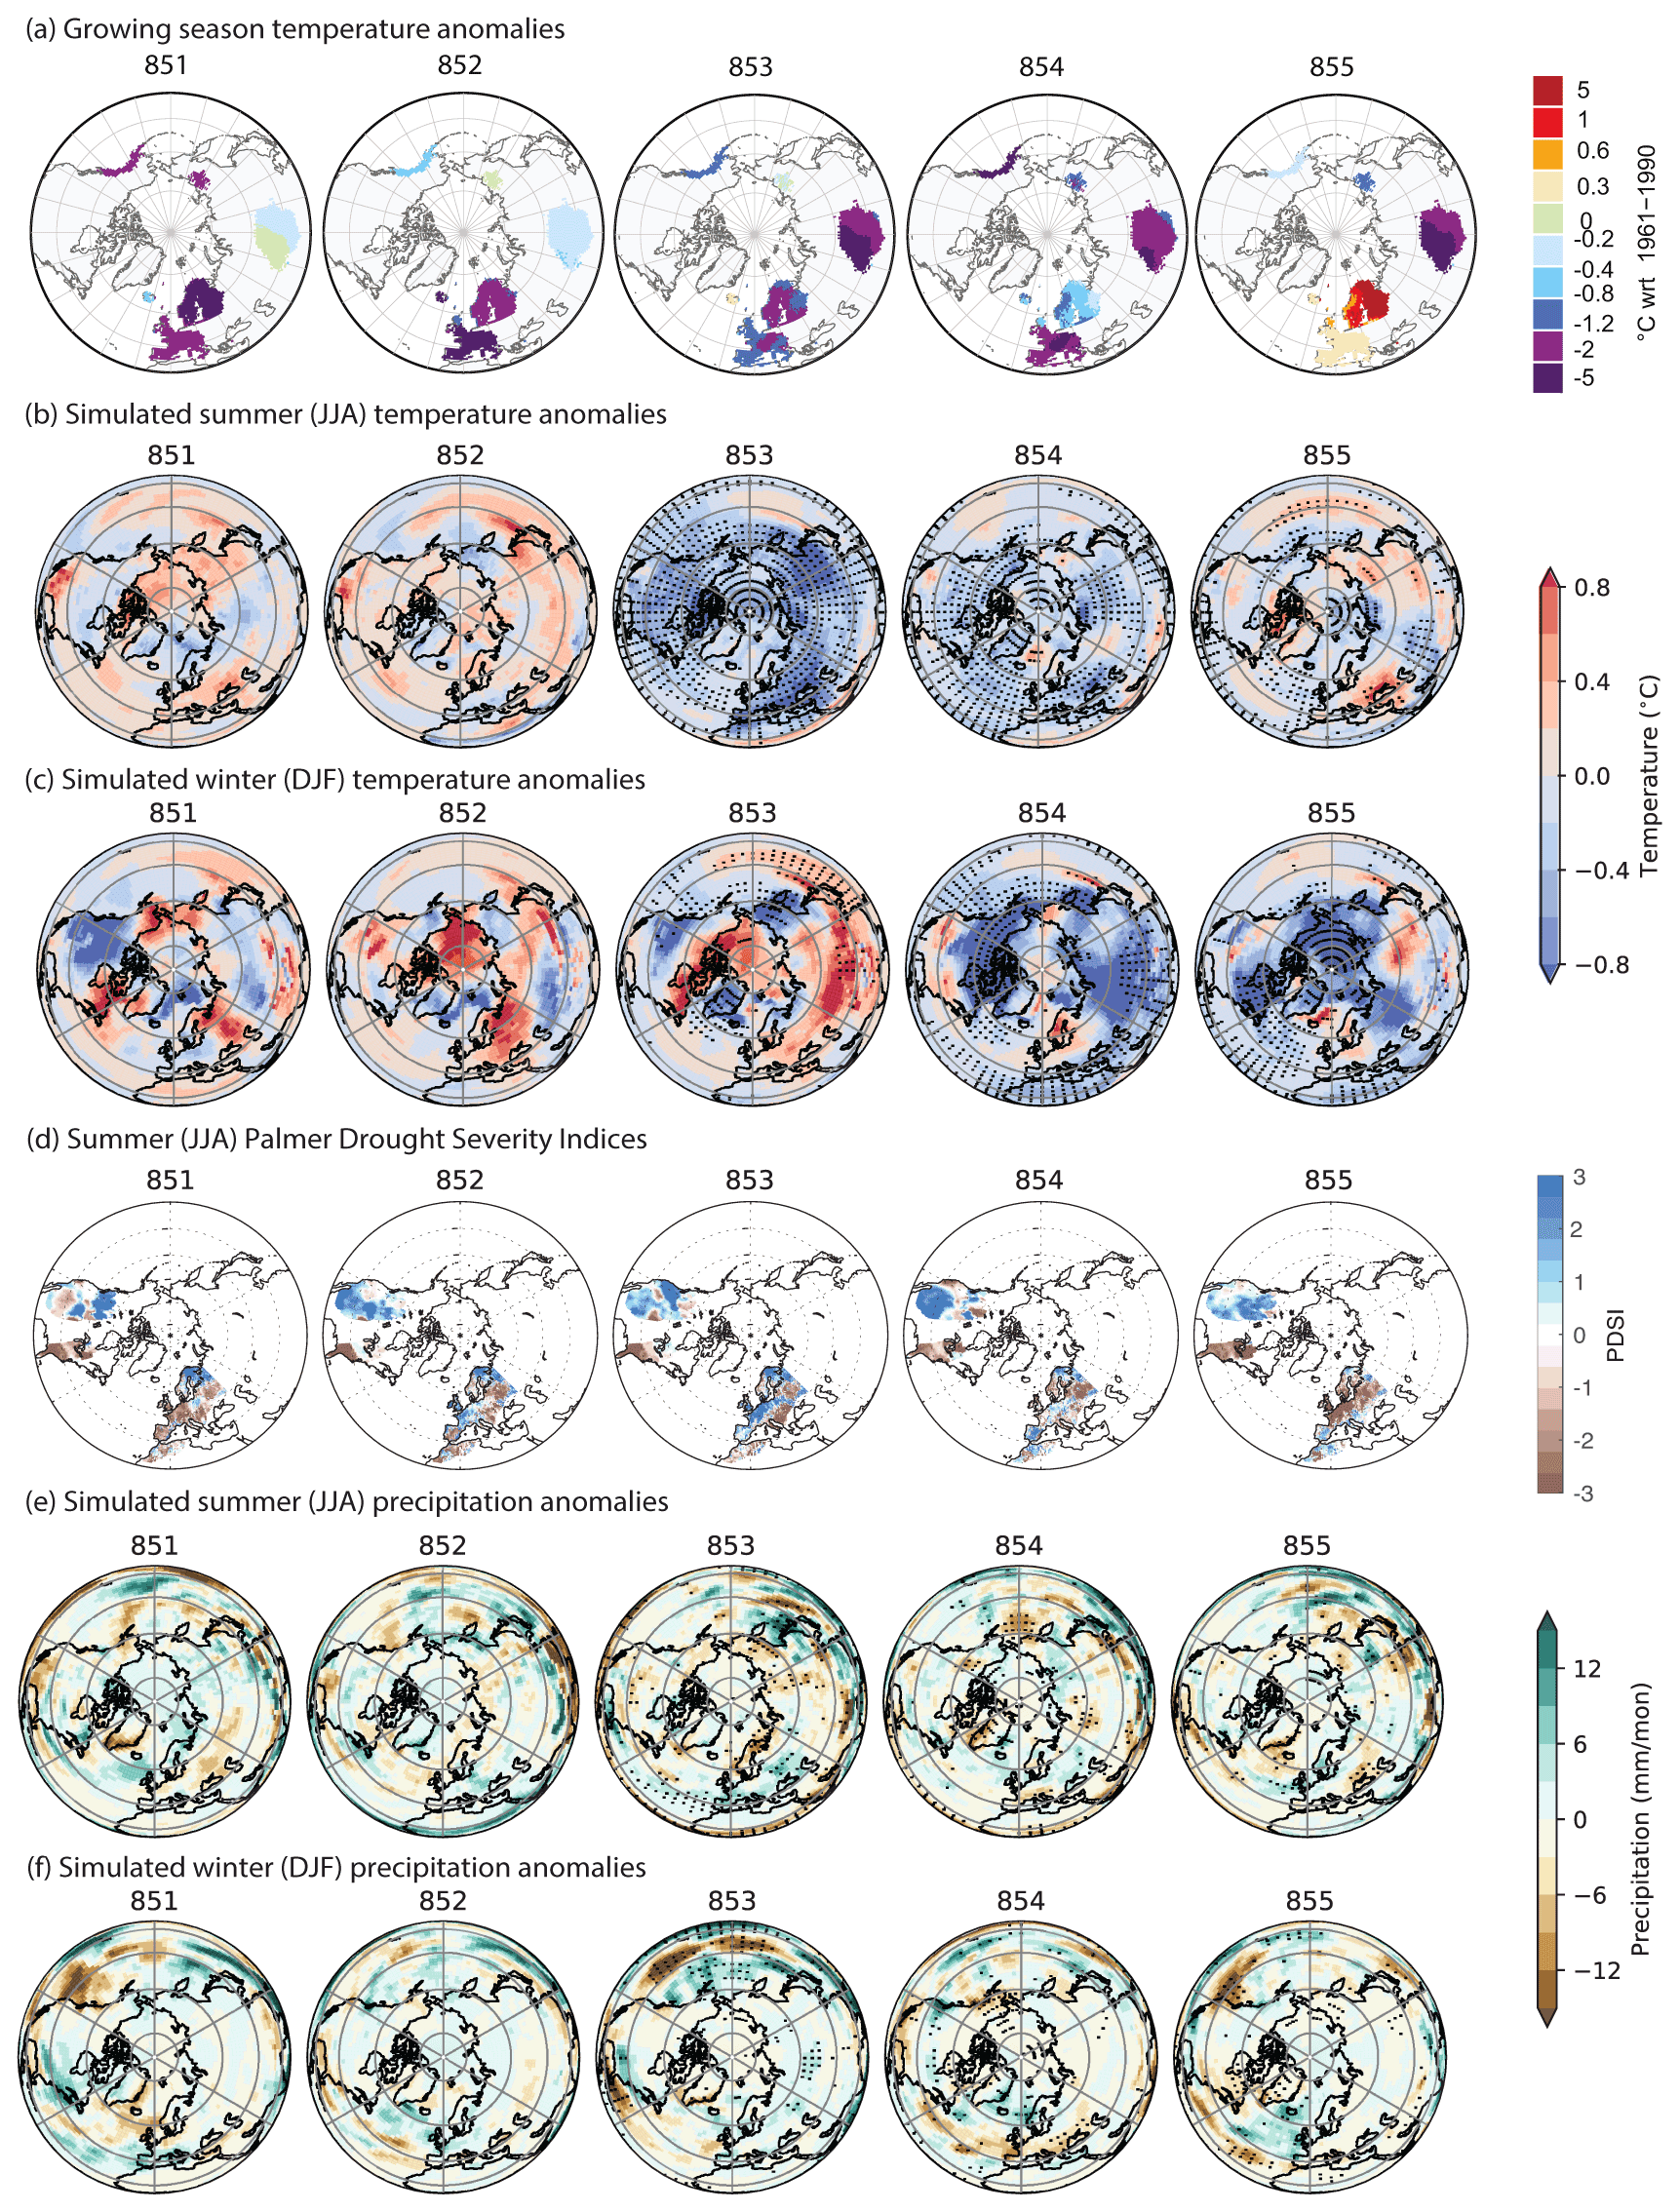
Figure 5Reconstructed and simulated NH spatial patterns of temperature and precipitation anomalies. (a) Growing season gridded (1∘ latitude × longitude) temperature anomalies reconstructed over the NH (40–90∘ N) between 851 and 855 CE based on tree-ring reconstructions. Scale extends from red, representing a temperature increase, to purple, representing a temperature decrease. Annually averaged ensemble means of simulated temperature anomalies for (b) summer and (c) winter. (d) Spatial patterns of boreal summer (June–August) Palmer Drought Severity Index (PDSI) anomalies (Cook et al., 2010, 2015). The PDSI scale extends from blue, representing wetter than normal conditions at that location, to brown, representing drier than normal conditions. Annually averaged ensemble means of simulated precipitation anomalies for (e) summer and (f) winter. Dotted regions in (b, c, e, f) indicate where the changes are statistically significant (based on the Mann–Whitney U test) compared to the pre-eruption period.
Summer PDSI reconstructions based on tree-ring records reveal a shift from wet to drier conditions in parts of western Europe in 854 CE, which persists into 855 CE (Fig. 5d). Wetter conditions in 853 CE in northern Europe and dry anomalies in North Africa and parts of the Mediterranean are potentially indicative of a positive phase of the North Atlantic Oscillation. By 855 CE, dry conditions in northern and western Europe and in 855 CE in the eastern United States are more similar to the pattern expected during a negative phase of the North Atlantic Oscillation (Anchukaitis et al., 2019). Eastern North American tree-ring moisture reconstructions however are also consistently dry from 852 through 855 CE. Tree-ring records in the western half of the continent reveal a mixed PDSI anomaly, generally indicating wetter conditions to the southwest and drier in the northwest, reminiscent of the moisture anomalies during an El Niño event in the tropical Pacific (Fig. 5d).
3.3.2 NH modelled climate scenarios
Simulated summer (JJA) temperature anomalies derived from the CESM reveal a widespread cooling in the NH extratropical regions in 853 CE that reaches an ensemble mean value of approximately −0.29 ∘C (Fig. 4c). In many extratropical regions, the decrease in summer temperature is statistically different to the pre-eruption period at a 5 % confidence level (Fig. 5b) and the ensemble means of the temperature anomalies in summer 853 CE are greater than 2 standard deviations from the 845–852 CE pre-eruption period mean, placing it among the 2nd percentile of the coldest simulated temperatures. Cool conditions mainly persist into 854 CE, albeit with smaller temperature anomalies (NH land average cooling of −0.15 ∘C; Fig. 4c), but by 855 CE, warm temperature anomalies return, for example, to parts of southeast Europe, northeast Canada and the North Pacific. Modelled winter (DJF) temperature anomalies reveal a hemispheric ensemble mean cooling anomaly that peaks at approximately −0.32 ∘C in 854 CE and recovers by 856 CE (Fig. 4d). The ensemble mean winter cooling in 854 CE is more spatially variable than the 853 CE summer cooling, with warm temperature anomalies persisting in parts of Scandinavia, central Europe and western North America during the winter months (Fig. 5c). The variability among the ensemble members during the after-eruption period (853–855 CE) is high, with the NH land surface temperature means ranging from −0.84 to 0.25 ∘C in summer and −1.54 to 1.57 ∘C in winter.
The modelled summer (JJA) and winter (DJF) precipitation anomalies vary spatially and temporally between 851–855 CE (Fig. 5e, f), although the post-eruption variability of precipitation is statistically indistinguishable from that of the pre-eruption period. Parts of western Europe show slightly drier conditions in winter 853 CE, with wetter conditions prevalent in western Scandinavia. The summer of 853 CE is characterised by slightly wetter conditions in parts of western Europe (Fig. 5e). The spatially averaged ensemble mean of precipitation indicates that all variation occurs within 1 standard deviation of the pre-eruption period means (Appendix H); there is therefore no obvious statistical differences between modelled summer and winter precipitation patterns associated with the 852/853 CE Churchill eruption in the NH.
3.4 Multidecadal-scale palaeoenvironmental reconstructions
3.4.1 Peatland hydrological change associated with WRAe deposition
The compilation of WTD data in peatlands indicates no consistent response at the time of the WRAe deposition (Fig. 6). Both Irish peatlands record wet conditions relative to the preceding decades at the time of WRAe deposition, but the Dead Island record indicates a subsequent long-term drying whilst Cloonoolish records a temporary drying before a shift to wetter conditions. Two of the three peatlands in eastern Newfoundland record wetter conditions following the WRAe deposition. Jeffrey's Bog in southwestern Newfoundland and the peatlands in Nova Scotia become drier following the eruption but the duration and magnitude of the water table lowering vary between peatlands. For example, the longer-term drying trends in Jeffrey's Bog, Framboise Bog and Villagedale Bog persist over approximately 200 years, whilst the drying in Petite Bog is less pronounced and shorter-lived (ca. 50 years). The peatlands in Maine register a temporary shift to wet conditions following the WRAe deposition.
Although most of the sites reflect centennial-scale trends in WTD, the higher temporal resolution of Petite and Cloonoolish bogs (11 and 12.5 years, respectively) allow decadal-scale responses of the peatlands following the eruption to be considered. Each bog experienced a short-term change towards drier conditions before returning to the prior trend to wetter conditions, but the scale of each hydrological shift lies within the levels of variability of the WTD records.
3.4.2 Peatland hydrological change during the Medieval Climate Anomaly
We find no consistent MCA signal registered in the peatland WTD reconstructions (Fig. 6). Our peatland WTD records indicate that the medieval period was characterised by variable hydrological conditions. The onset of changes towards drier conditions, which may signal the warm Medieval Climate Anomaly, varies temporally and spatially. The earliest dry shift starts ca. 900 CE in northern Nova Scotia (Framboise Bog) and some records from Newfoundland (Jeffrey's Bog and Nordan's Pond bog), whilst this hydroclimatic change is registered ca. 100 years later in records from southern and central Nova Scotia (Villagedale Bog, Petite Bog), Maine (Sidney Bog) and Ireland (Cloonoolish). All records in this study register temporary wet shifts at approximately 850 and 1050–1150 CE, although the extent and durations of the wet shifts vary. The presence of the WRAe isochron conclusively demonstrates that the onset of the wet shift ca. 850 CE is not synchronous. There is also a high degree of spatial variability between records from sites proximal to one another, with some recording contradictory hydrological conditions, such as Saco Heath and Sidney Bog in Maine and Nordan's Pond bog, Pound Cove bog and Southwest Pond bog in Newfoundland.

Figure 6Available moisture reconstructions from terrestrial and glacial archives containing the WRAe from the North Atlantic region. Records have been developed using δ18O isotopes from NGRIP1 (Vinther et al., 2006), where the black line represents decadal-scale moving average and data are plotted on NS1-2011 chronology (Sigl et al., 2015; for detailed 9th-century NGRIP1 δ18O isotopes see Appendix I), and peatland water table depths inferred from testate amoebae. Dashed vertical line represents the WRAe and the pink shaded box represents the MCA time period based on the Mann et al. (2009) timings (950–1250 CE). Sites have been arranged clockwise with Irish records (Dead Island and Cloonoolish) located on the top right of the diagram followed by North American sites from northeast to southwest with records from Newfoundland (Nordan's Pond bog, Pound Cove bog, Southwest Pond and Jeffrey's Bog), Nova Scotia (Framboise Bog, Petite Bog, Villagedale Bog) and Maine (Saco Heath and Sidney Bog) and finally the Greenland NGRIP1 record (top of the diagram).
3.4.3 Vegetation reconstructions
Pollen records from Ireland show considerable variability in the intensity and extent of farming (Fig. 7). The WRAe deposition from the 852/3 CE eruption coincides with the pinnacle of land clearance (reduced arboreal pollen) in central Ireland (Clonfert and Cloonoolish bogs), after which pastoral and arable indicators start to decline as woodland expands. Sites in the northeast of Ireland show less coherent trends than those in central Ireland. At Garry Bog, arable weeds temporarily dip at the time of the eruption, although cereals are still evident. In contrast, evidence for farming is very limited at nearby Frosses Bog, highlighting the localised nature of land use in the vicinity of Garry. At Lake View, moderate levels of farming are recorded, and these increase slightly following the eruption before a decline in activity begins later in the century. The spatial diversity in the pollen records (even within a single region) demonstrates that changes in land use in the 9th century cannot be attributed to any one environmental trigger and very likely reflect differences in local-to-regional economic organisation and demographic pressures.
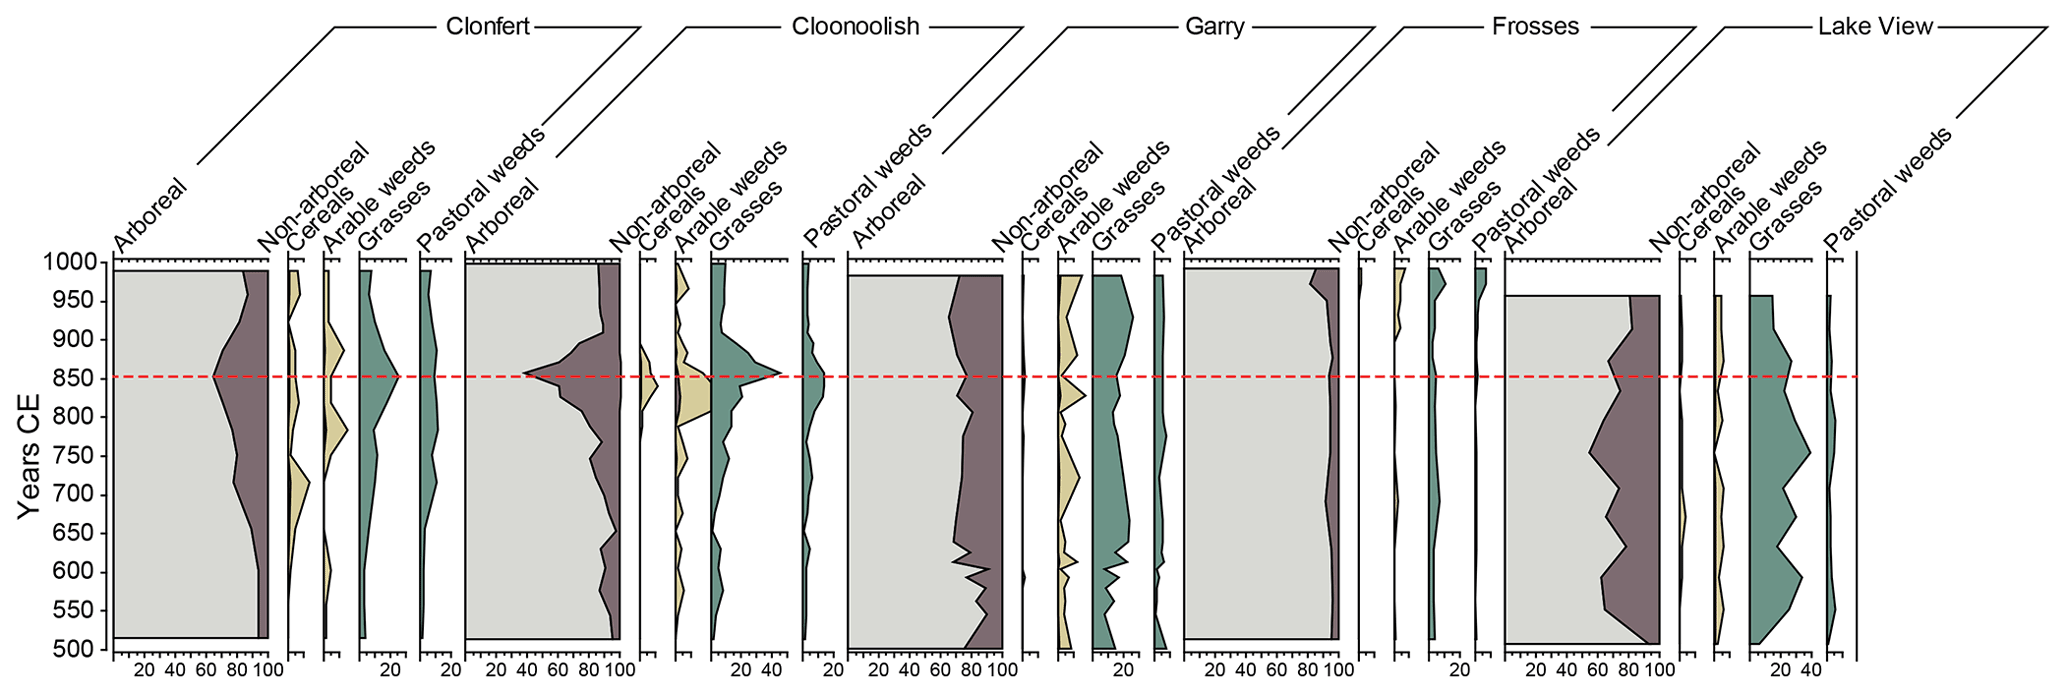
Figure 7Summary pollen records from five sites in Ireland, showing the ratio of arboreal to non-arboreal (dryland) taxa and indicators of arable and pastoral environments. Cereal and arable weed curves are shown with a 10-fold exaggeration. The red dashed line indicates WRAe.
3.5 Historical records
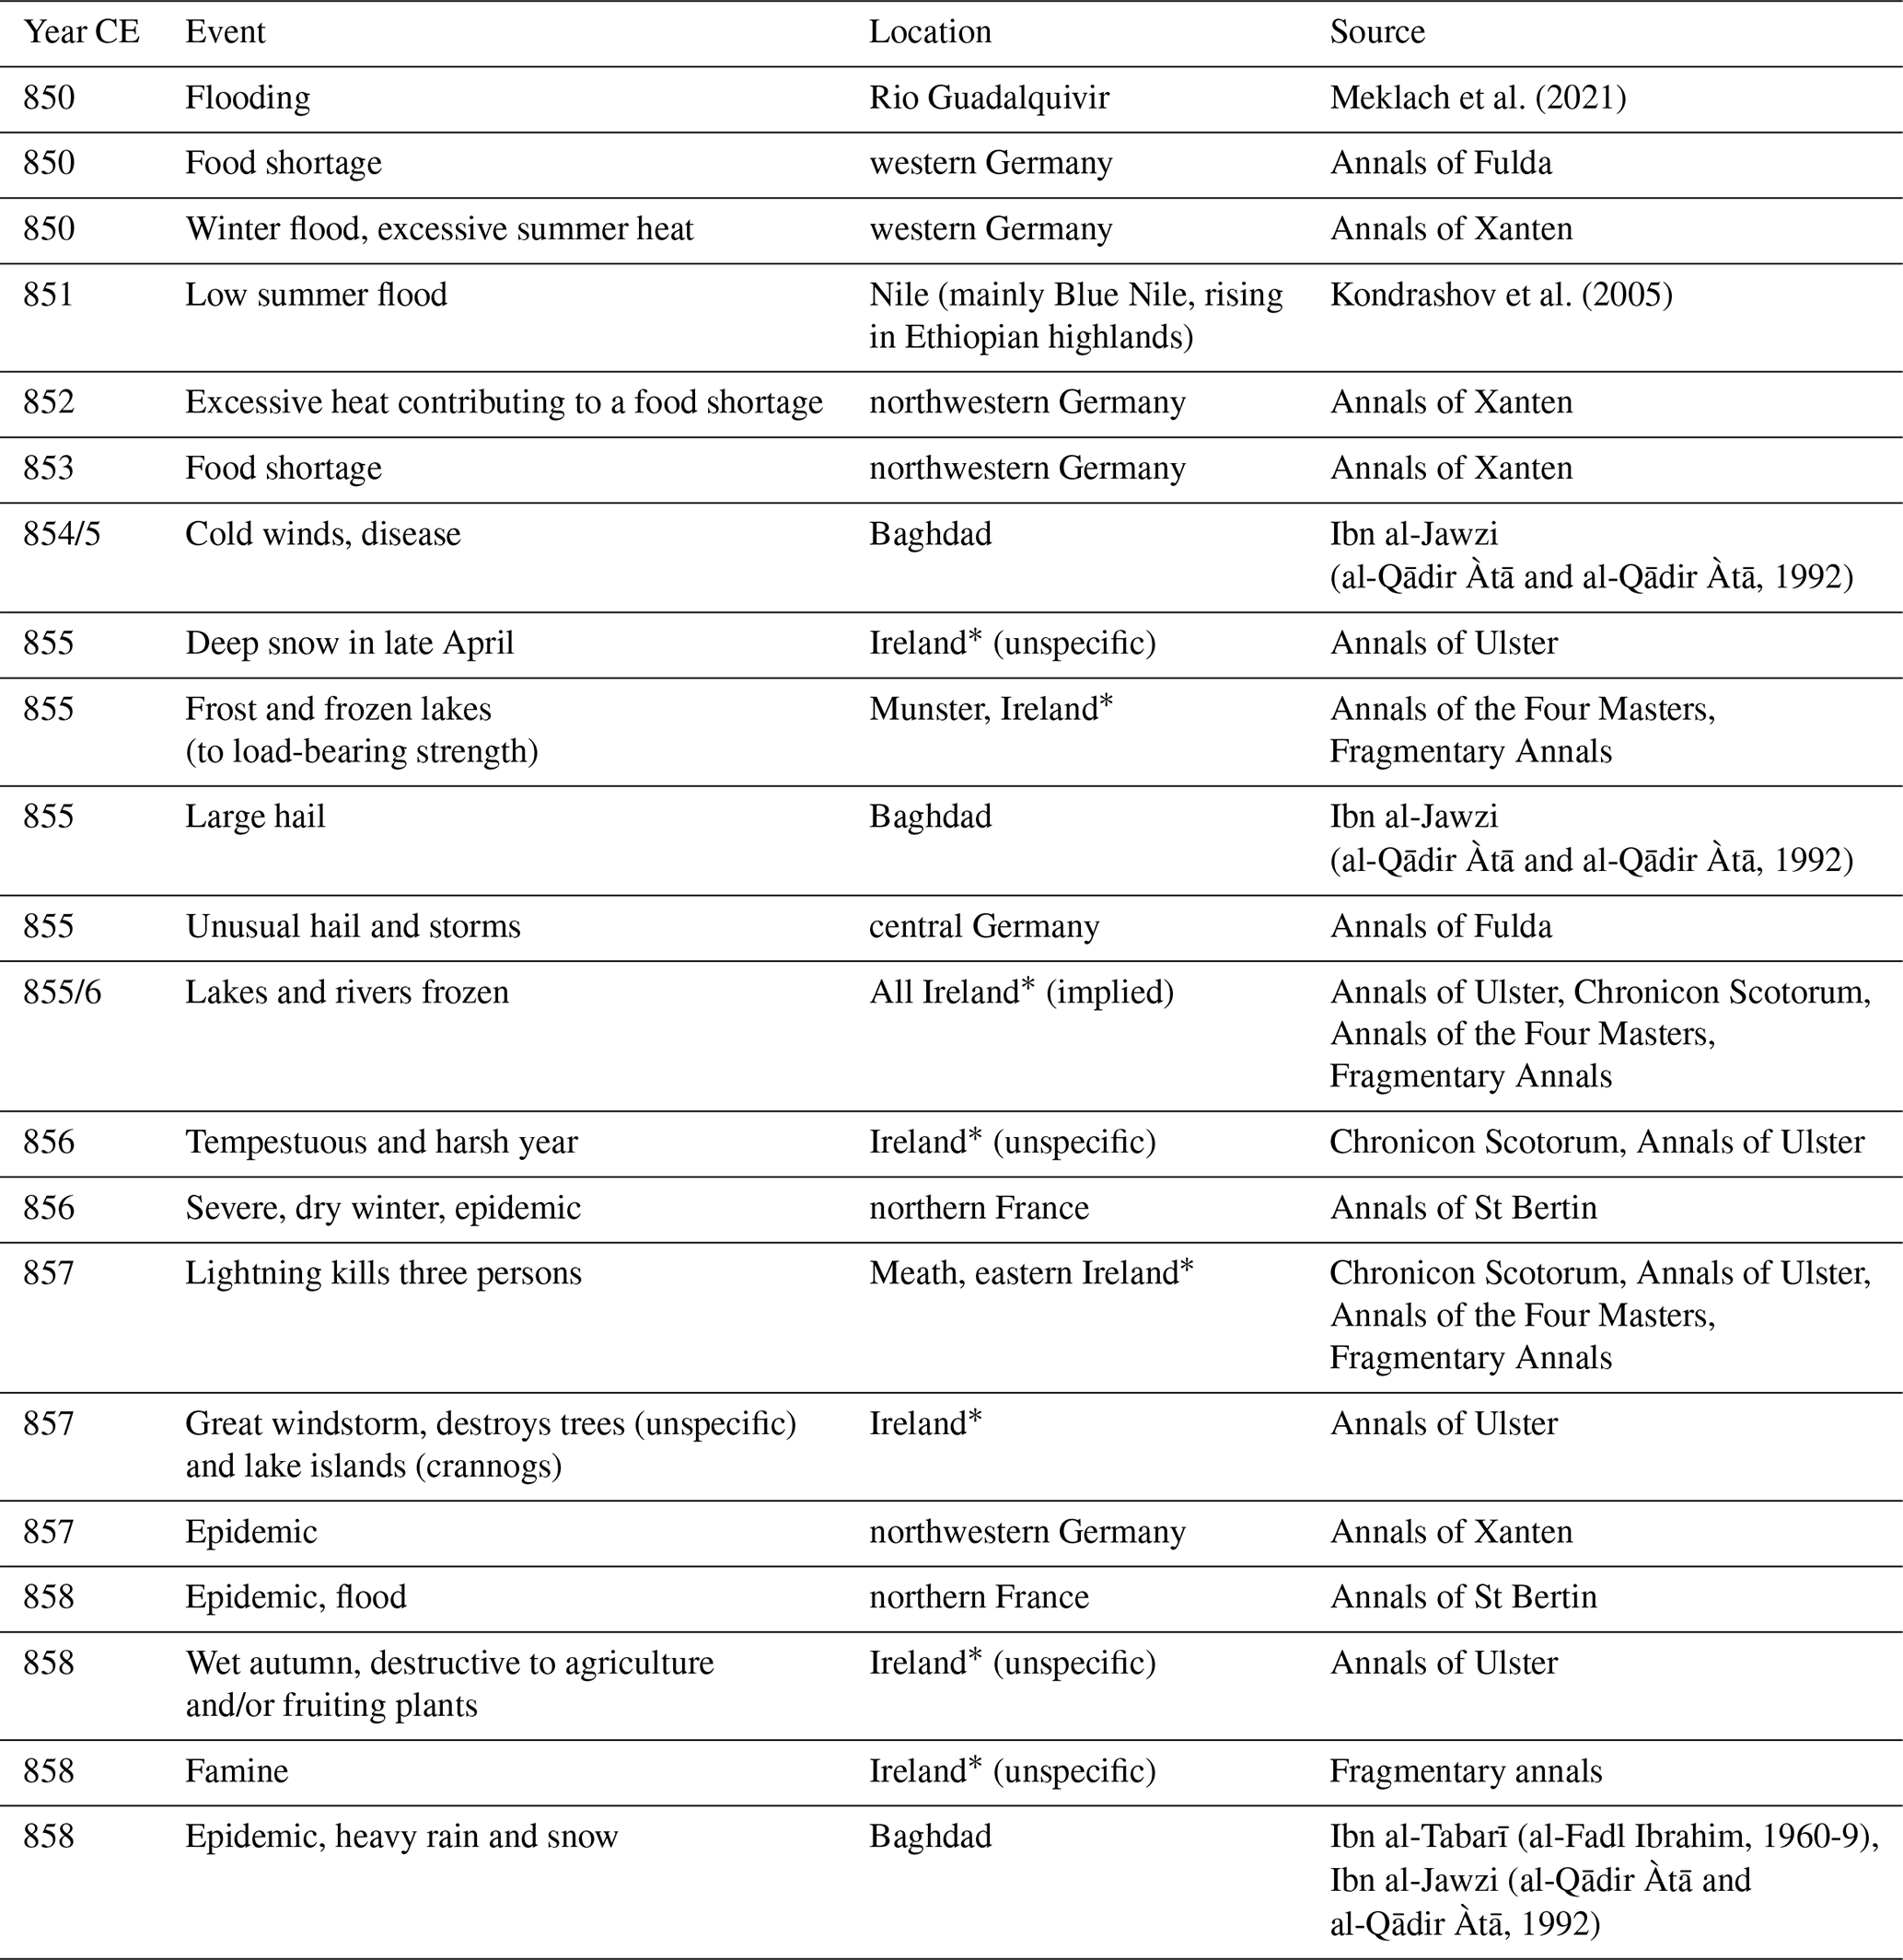
Historical records from Europe characterise the 850s CE as time of apparent climate instability, at least as indicated by the multiple documented weather extremes and related hazards (Table 1). Carolingian sources observe severe winter flooding in western Germany in 849–850 CE, and severe summer heat, drought and a fames (food shortage) in 852 CE (Newfield, 2010; Haldon et al., 2018). Immediately following the 852/3 CE eruption, there is contemporary evidence for a severe famine – such that horse flesh was eaten – which the Annals of Xanten specify took place in Saxony in 853 CE, though beginning possibly in 852 CE (Newfield, 2010; Haldon et al., 2018). The probable eyewitness annalist of the Annals of Fulda (central Germany) noted that in 855 CE, “unusually changeable weather brought loss to many through whirlwinds, storms and hailstorms”. The Annals of St Bertin (northern France) describe the winter of 856 CE as severe and dry, being also accompanied by a severe epidemic, “which consumed a great part of humanity” (Newfield, 2010). Heavy snowfall is reported in Ireland for 23 April 855 CE (Julian Calendar), and extreme cold is implied by frost and load-bearing ice reported across the winter of 855/6 CE, with 856 CE also being deemed a tempestuous and harsh year in Ireland (Ludlow et al., 2013). A severe windstorm occurred in 857 CE, and the autumn weather in 858 CE is characterised (in the Annals of Ulster) as wet and destructive to agriculture in Ireland. A potentially less reliable source (the Fragmentary Annals of Ireland) also reported a famine for the autumn of 858 CE (Ludlow, 2010). The Xanten annalist recorded a great epidemic in 857 CE in northwest Germany, causing “swelling bladders” (or “swelling tumours”) and “festering sores” that putrefied limbs (Newfield, 2010). While disputable, this epidemic has long been identified as one of ergotism (Hirsch, 1885; Duby, 1974), which is caused by ingestion of the ergot fungus of rye and other grains and is more common in cold and wet growing seasons (Kodisch et al., 2020). The St Bertin annalist reported the epidemic in 858 CE. That year too, in May, such a heavy rain fell that the river Meuse burst its banks, flooding Liège (present-day Belgium) and tearing down buildings (Table 1).
Table 1Climate and climate-related events recorded in Irish, Carolingian, Anglo-Saxon, Byzantine, Italian, Iberian, Abbasid and Egyptian sources between 850 and 858 CE. Locations given reflect where the texts were likely compiled at the time, though the phenomena recorded could have been more widespread. Cases were the phenomena locations are instead given are denoted by an asterisk (*). Inventories of all sources from Ireland are provided in Ludlow (2010). Inventories of all sources from Germany and France are provided in Newfield (2010).
A wider chronological consideration of the Carolingian evidence reveals that food shortages occurred in several other decades of the 9th century in Carolingian Europe (Fig. 8). This observation reinforces the point that a correspondence (or near-correspondence) between the dating of the Churchill eruption and the documented events of the 850s CE does not confirm a causal linkage. Some food crises of the 9th century were also apparently more vast and longer lasting than those (reliably) documented here for the 850s, with the Carolingian sources also observing widespread crises associated with climate anomalies in the 820s, 860s and 870s (Newfield, 2013; Haldon et al., 2018; Devroey, 2019). One mid-10th-century source does observe a hiemps gravissima (“gravest winter”) preceding a 5-year fames intolerabilis (“intolerable food shortage”) vaguely datable to the early 850s and possibly located in and beyond northern France and Belgium (Newfield, 2013). This evidence must be treated with caution given its non-contemporaneity, insecure dating of events and dramatised tone. It can, however, be noted that the written record of food shortages is incomplete for this period of European history, such that some events of the 850s may have gone undocumented. We may also posit that if extreme weather did not occur at the specific times of year when grain growth and harvests could be impacted sufficiently to trigger a serious subsistence crisis, or because society in these years happened to prove particularly resilient (e.g. in possessing adequate stored food reserves), it may have been deemed less relevant for recording.
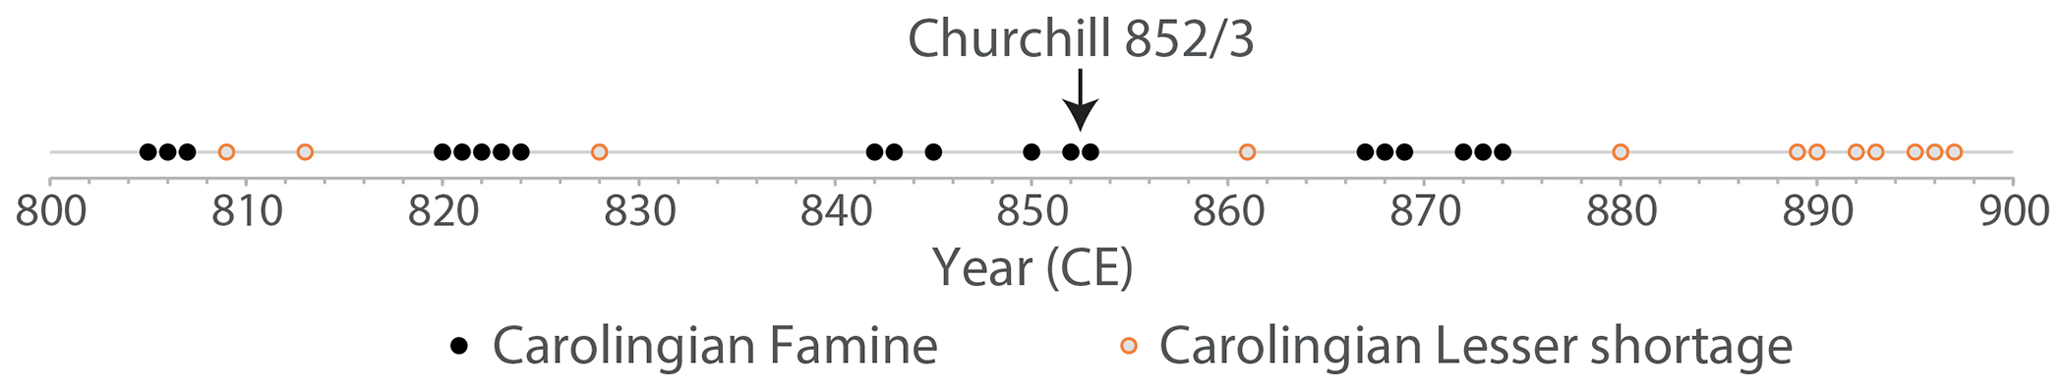
Figure 8Ninth-century reports of large subsistence crises (“famines”, black) and seemingly more circumscribed crises (“lesser food shortages”, orange) recorded in Carolingian sources (Newfield, 2013). Note again that the record of food shortages is imperfect: some crises may not have been recorded and the extent and severity of several recorded crises are difficult to determine.
Elsewhere, in Iberia, we read only of significant flooding along the Rio Guadalquivir in 849 and 850 CE (Meklach et al., 2021), while there are no known reports in Anglo-Saxon, Byzantine, Italian or Iberian sources of anomalous weather ∼853 CE or potentially related societal events that might suggest climate perturbations then. Further east, however, the scholar Ibn al-Jawzi (writing in the 12th century, but with access to contemporary sources for our period) wrote that for the year 240 (854/5 CE), a cold wind “came out from the land of the Turks and many died from having a cold … the winds continued to Iraq and the people of Samarra and Baghdad suffered from fever and cough and cold” (al-Qādir Àtā and al-Qādir Àtā, 1992). Then, in March 855 CE, “massive hail” fell in Baghdad, “sized larger than nuts, along with heavy rainfall”. In the year 244 (858/9 CE) the eyewitness scholar, al-Tabarī, recorded that in Syria, “pestilence broke out (and the reason for that was) that the air was cold and full of dew, the rainfall heavy … prices rose and there was snow”. When al-Jawzi later wrote up this report in his own history, he added that the snow lasted more than 2 months (Table 1).
A suppression of the East African Monsoon has been noted after some large extratropical NH eruptions, with the consequence being a reduction of the agriculturally critical Nile summer flood that is primarily driven by summer monsoon rainfall in the Ethiopian highlands, including the Blue Nile and Atbara river watersheds (e.g. Oman et al., 2006; Melesse et al., 2011; Iles and Hegerl, 2015; Manning et al., 2017; Atwood et al., 2020; Singh et al., 2022). The extant historical sources do not, however, allow us to identify such a happening around the time of the Churchill eruption. Egyptian historical records appear silent, with no known incidences of food crises or other societal instability that might follow unusually low Nile summer flooding (e.g. Hassan, 2007; Ludlow and Manning, 2016, 2021). We are also unaware of sources from the Nubian Nile that might suggest hydroclimatic anomalies or related societal reactions for our period of interest (Adam Laitar and Giovanni Ruffini, personal communication, 2021).
The Islamic Nilometer record, measured for our period on Roda Island near Cairo, provides the maximum height reached by each year's summer flood (Hassan, 1981; Hassan and Stucki, 1987; Said, 1993; Kondrashov et al., 2005; Hassan, 2007; Manning et al., 2017). This is an important source, but one that presents a complex story for our years of interest. A notably poor summer flood (the fifth lowest maximum of the 9th century, using the Nilometer data as processed by Kondrashov et al., 2005) is recorded for 851 CE, following on from the 15th lowest value for the year previous. Given that this extreme for 851 CE would have largely been the product of rainfall in the summer of that year over the Ethiopian highlands, it is too early to be credibly linked to the Churchill eruption, even when allowing the ±1-year uncertainty that could date the eruption as early as winter 851 CE. The following year also, however, exhibits a below average maximum, having the 17th lowest of the 9th century. While the maxima for the following 5 years (853–857 CE) recover somewhat, they are only marginally above average. For example, of the 60 years with above-mean maxima in this century, 853 and 854 CE are the 6th and 7th lowest, respectively, and both are below the median.
Chinese historical sources register local and regional weather anomalies and impacts in (primarily) eastern China in the years following the Churchill eruption. Of particular note is a drought in the summer of 852 CE, affecting the Huainan Circuit, comprising some 12 prefectures and 53 counties and situated between the Huai and the Yangzi rivers. Famine is associated with the drought-induced migration, with people resorting to wild foods (Zhang, 2004; as per the New Book of Tang). There is also a record of drought (precise location and dating within the year ambiguous) in the Old Book of Tang for 854 CE, with a further report (from the same source) of drought conditions affecting the Huainan Circuit in 855 CE. This latter drought was associated with famine conditions that caused the government to enact relief measures consisting of tax reductions and the distribution of free food in July of that year (Chen, 1986; Zhang, 2004). A devastating flood then occurred in 858 CE and engulfed a large area, including several prefectures along the Grand Canal, in the Hebei, Henan and Huainan circuits, in which the water rose several feet, causing massive loss of life (Somers, 1979; Chen, 1986; Zhang, 2004). The reporting of drought in 852 CE (Huainan) and 854 CE (uncertain location) falls within the ±1-year uncertainty of the eruption date and is potentially consistent with expectations of a suppression of East Asian summer monsoon rainfall following extratropical northern hemispheric eruptions, even if quite variable in potential severity and extent (e.g. Zhuo et al., 2014; Iles and Hegerl, 2015), However, given its immense geographical area, natural disasters were frequent on at least local scales across the Chinese landmass, which, coupled with human disruptions, such as banditism and government neglect, often had calamitous social and economic effects. We can therefore note again that the documented events of the 850s CE cannot be uncritically linked to the climatic impacts of the Churchill eruption.
4.1 Climatic impact of the 852/3 CE Churchill eruption
The VEI 6 eruption of Churchill in the winter of 852/3 ± 1 CE was amongst the largest eruptions of the Common Era and dispersed ash eastwards over a distance of 7000 km. Despite its large magnitude, on the basis of sulfate deposition in Greenland ice cores, the eruption appears to have had only moderate climate forcing potential: the SAOD perturbation is concentrated in the NH and there are four other volcanic events in the 9th century that have larger global mean SAOD. The 852/3 CE Churchill eruption therefore contributes to the known examples of large magnitude Common Era eruptions that are associated with moderate atmospheric sulfate burdens as reconstructed from ice cores (Sigl et al., 2013, 2014, 2015), such as Taupo 232 ± 10 CE (Hogg et al., 2012, 2019), Changbaishan 946 CE (Sun et al., 2014; Oppenheimer et al., 2017) and Long Island 1661 ± 10 CE (Blong et al., 2018).
Despite the moderate climate forcing potential of the 852/3 CE Churchill eruption estimated from ice core sulfate records, there is evidence for a strong NH cooling around the time of the eruption. Tree-ring temperature reconstructions show temperature declines centred on summer 853 CE with a peak magnitude of around −0.8 ∘C. In terms of the 3-year mean NH summer temperature, the 853–856 CE period is the 11th coldest period between 500 and 2000 CE (Appendix G). Climate model simulations using estimates of the stratospheric sulfate aerosol forcing based on ice core records produce ensemble mean NH summer land temperature anomalies of around −0.3 ∘C, while individual ensemble members display cooling as large as −0.8 ∘C, comparable to the tree-ring-based estimates. The model simulations thus suggest that the tree-ring-derived cooling is explainable as a result of the combined effects of internal climate variability and volcanic aerosol forced cooling. Another possibility, which would relax the requirement for a rather strong contribution of natural variability, would be that the volcanic aerosol forcing was in reality stronger than that used here. With the upper-end reconstructed EVA(eVolv2k) SAOD estimate being 66 % higher than the best estimate used in our model simulations, the forced model response could be even higher (Fig. 3b). Furthermore, a stronger restriction of aerosols to the NH, not simulated in the simple SAOD reconstruction methods but compatible with interactive stratospheric aerosol model simulations (e.g. Toohey et al., 2019), may also contribute to stronger aerosol forcing over the NH than used here. The spatial patterns of the summer temperature decrease generally agree with the tree-ring-based reconstructions and the ensemble model simulations. For example, the growing season cooling registered in the NH tree-ring records is initially pronounced in western and central Europe and Scandinavia, with colder conditions in Alaska, which generally aligns with the spatial patterns of cooling found in the ensemble means of climate simulations. The peak summer cooling in the tree-ring records in 853 CE is influenced by a shift to cold conditions in central Asia and Siberia. The cooling in these regions is also expressed in the model simulations in the summers of 853 and 854 CE, although with reduced amplitudes of temperature variability compared with the tree-ring temperature records. Strong cooling in central Asia and Siberia has been reconstructed from tree rings in the years following many other large eruptions in the Common Era, such as the assumed Mount Asama eruption and unidentified volcanic eruptions in 1109 CE (Guillet et al., 2020), the Mount Samalas eruption in 1257 CE (Guillet et al., 2017), an unidentified eruption in 1453 CE (Stoffel et al., 2015; Abbott et al., 2021), and the Huaynaputina eruption in 1601 CE (White et al., 2022).
In some respects, however, the spatial patterns differ between the climate model simulations and the tree-ring reconstructions. In particular, the persistent cool conditions in central Asia and Siberia in 855 CE are only found in the tree-ring-based reconstructions. These deviations (changes in temperature amplitudes and in spatial patterns) are expected as the ensemble means of the simulations focus on the signal of the volcanic eruption by reducing internal climate system variability. In contrast the tree-ring-based reconstruction contains both internal variability and the potential forcing signal of the eruption and/or other external drivers. Therefore, the reconstructed cooling in Asia and Siberia in 855 CE is potentially related to internal variability of the climate, such as changes in the large-scale atmospheric circulation rather than being externally forced by the Churchill eruption.
The reconstructed climatic cooling peak in 853 CE aligns with the eruption date of the winter 852/3 CE Churchill eruption but the timing of the start of this tree-ring-inferred cooling trend begins in summer of 851 CE, thereby predating the eruption (and its associated age uncertainty). However, the magnitude of the temperature decline in summer 851 CE is within the range of natural temperature variability, and it is not until the summers of 852 and 853 CE when temperatures exceed the range of natural variability. The modelled climate scenario cooling occurs later in 853 CE, with widespread cooling present in summer 854 CE and winter 854 CE. The results from the tree-ring-based temperature reconstructions preclude the attribution of the climatic cooling solely to the Churchill eruption, but the eruption timing clearly corresponds to cooling as registered in both reconstructed and simulated approaches. These findings therefore suggest that the winter 852/3 CE Churchill eruption exacerbated a naturally occurring cold period. This is supported by the decadal-scale step changes in temperatures recorded in the tree-ring-based reconstructions (Fig. 4a) and NGRIP1 δ18O reconstructions (Fig. 6, Appendix I) prior to and after 852/853 CE.
Hydroclimate changes driven by volcanic eruptions are less clearly defined than those of temperature, partly due to the higher degree of variability in precipitation and the small changes in atmospheric moisture associated with the magnitude of temperature change often associated with volcanic cooling. In principle, two possible processes might lead to precipitation changes after an eruption: thermodynamic or dynamic affects. The direct thermodynamics effect is related to the Clausius–Clapeyron relationship, which predicts that the water-holding capacity of the atmosphere decreases by approximately 7 % for every 1 ∘C cooling (Held and Soden, 2006). Therefore, moisture changes associated with the 852/3 CE Churchill eruption would be expected to be in the order of ca. <5 %. Some observational and modelling studies have, however, reported a reduction in global precipitation following explosive volcanic eruptions (e.g. Robock and Liu, 1994; Iles and Hegerl, 2014, 2015). Beyond the thermodynamic effects, volcanic eruptions may also generate hydroclimate anomalies through changes in large-scale ocean–atmosphere circulation, including shifts in the latitudinal position of the Intertropical Convergence Zone (ITCZ; Haywood et al., 2013; Colose et al., 2016), an anomalously positive North Atlantic Oscillation (NAO) or Northern Annular Mode (e.g. Christiansen, 2008; Stenchikov et al., 2006; Raible et al., 2016), a poleward jet shift (Barnes et al., 2016), and/or a narrowing of the Hadley Circulation (Ménégoz et al., 2018). The potential hydroclimate response to a high-latitude eruption is therefore complex, reflecting the multiple, combined and interacting effects of direct radiative forcing, feedbacks through changes in ocean–atmosphere circulation and internal stochastic variability. Evidence to support a change in precipitation driven by the 852/3 CE Churchill eruption is lacking: no widespread statistical changes were detected in NH precipitation variability during the 853 CE eruption period in this study and spatial patterns of precipitation reconstructed from climate modelling and tree rings are inconsistent, suggesting that internal climate system variability dominates. There is also no evidence from the palaeoenvironmental reconstructions to support hydrological changes on multidecadal timescales as changes in the peatland water depths differ spatially and temporarily and most records present longer centennial-scale changes that do not correspond to the eruption date.
The climate forcing of the 852/3 CE Churchill eruption derived from existing ice core records and used in the climate model simulations is the current best estimate. Uncertainty in the stratospheric aerosol forcing (as shown in Fig. 3b) is not incorporated into the model simulations as, e.g., was undertaken by Timmreck et al. (2021). Furthermore, additional forcing factors have not been explicitly taken into account. In particular, this explosive eruption is characterised by high chlorine concentrations in the ice cores (Fig. 2) and a very extensive ash cloud across the NH midlatitudes to high latitudes, suggesting large atmospheric loadings. Emissions of halogens and ash have the potential to influence climate, but their climate forcing potential is poorly constrained and so they remain unaccounted for in the EVA and EVA_H forcing time series as well as in the CESM simulations. The injection of a large quantity of halogens along with sulfur by the 852/3 CE eruption may have modulated the impact on surface temperatures: some model studies suggest that the co-emission of halogens may intensify or prolong the volcanic cooling (Wade et al., 2020; Staunton-Sykes et al., 2021), although contrasting model results suggest the effect may be model or event dependent (Brenna et al., 2020). The influence of ash on radiative forcing is currently unclear. For example, recent observations for the Kelud 2014 eruption suggest that ash exerted a radiative forcing of −0.08 W m−2 3 months after the eruption (Vernier et al., 2016), even though the volcano erupted only kg of ash (Maeno et al., 2019; Aubry et al., 2021). In comparison, we found that the Churchill eruption erupted 4.9×10¹³ kg (3.9–6.1 ×10¹³ kg) of ash, which might suggest a potentially strong radiative forcing from ash that is unaccounted for in our modelling. However, the short lifetime of ash in the atmosphere makes it questionable whether the associated forcing would persist long enough to significantly affect surface temperature and tree-ring growth. Furthermore, the co-injection of ash with sulfur could likely reduce the radiative forcing associated with sulfate aerosol since ash particles take up sulfur dioxide, thereby reducing its lifetime (Zhu et al., 2020).
4.2 Climatic–Societal impacts of the 852/3 CE Churchill eruption
The White River Ash east (WRAe) deposit from the 852/3 CE Churchill eruption has reported thicknesses of 50–80 m proximal to Mount Churchill and visibly extends in an easterly direction >1300 km from the source (e.g. Richter et al., 1995; Lerbekmo, 2008; Patterson et al., 2017). The considerable ash fallout synonymous with this eruption had lasting environmental and societal consequences for regions proximal to the source, driven primarily by the physical and chemical impacts of emissions from the eruption. Known impacts include changes in vegetation and wetland ecology (e.g. Rainville, 2016; Payne and Blackford, 2008; Bunbury and Gajewski, 2013) and displacement of local human populations (e.g. Kristensen et al., 2020; Hare et al., 2004; Mullen, 2012).
Historical records gleaned from a wide range of sources across Europe, Africa and Asia provide an opportunity to (i) assess the extent to which the 852/3 CE Churchill eruption had distal societal consequences, (ii) corroborate or critique results from the modelled and tree-ring-based climate scenarios around the time of the Churchill eruption and (iii) identify any evidence of extreme weather conditions that is not registered in the palaeoenvironmental reconstructions based on natural archives, such as severe winters. European historical records spanning the 850s document some anomalous conditions, albeit fewer extreme weather events and associated crises than in other decades of the 9th century (Fig. 8). Food shortages and extreme weather were reported shortly before and after the 852/3 CE eruption in western Germany; a severe subsistence crisis may also have occurred in nearby northern France and Belgium that set in during the eruption year or shortly thereafter. Tree-ring reconstructions show that the growing season in 852 CE (falling within the current ±1-year uncertainty estimate for the eruption date) was particularly cold in Europe, with temperature declines of −2 ∘C or more in northwest Europe, and temperatures remained cool until 854 CE. Simulated temperatures show a decline that occurs in summer 853 CE, albeit to a lesser magnitude (ca. −0.2 ∘C). The cause of the crisis in Germany in 853 CE is not detailed in the sources, nor are weather extremes observed that would corroborate the inferred temperature anomaly. An extreme winter is identified as the cause of a food shortage reported in northern France and Belgium in the early 850s, but the dates of the winter and the food shortage are not certain. It is notable that a particularly sustained effort to record natural phenomena (including extreme weather) was undertaken in Irish monasteries in the ninth and adjacent centuries (McCarthy and Breen, 1997; McCarthy, 2008), perhaps making it more likely that unusual weather would be recorded here even in the absence of major societal impacts. Moreover, a survey of 1219 years of reporting of severe cold (mainly in winter) in Irish annals has revealed a repeated link with explosive volcanism as registered in elevated Greenland sulfate, such that the medieval Irish may have been particularly acute observers of volcanic winter-season impacts (Ludlow et al., 2013). However, there are no reported extreme weather events in Ireland in the early 850s. Repeated reports of extreme cold occur from April 855 CE to winter 855/6 CE for Ireland amidst a return to average climatic conditions in the tree-ring reconstructions and modelled climate scenarios for western Europe. Elsewhere, in China, various historical descriptions report or imply societally impactful droughts in 852, 854 and 855 CE in a manner (geography and seasonality) that is potentially consistent with the expected impacts of high-latitude northern hemispheric volcanic eruptions on the East Asian summer monsoon (e.g. Zhuo et al., 2014; Iles and Hegerl, 2015). The drought in the Huainan Circuit in 855 CE corresponds to the southern margins of a larger area of dry summer conditions produced by the CESM for both 854 and 855 CE (Fig. 5e). There is, however, no consistent evidence from the available Nile flood records to support a suppressed East African Monsoon around the time of the Churchill eruption. Overall, there is some agreement between the historical records and reconstructed and modelled climate but not uniformly so between 851–855 CE.
The pollen records are insufficiently resolved to identify sub-decadal anomalies or extreme weather events, but they provide a useful longer-term perspective on societal adaptation to climate variability. Precise comparisons of the pollen assemblages between sites are facilitated by the presence of WRAe, which dispels any chronological uncertainty with respect to the timing of changes in land use. The pollen records clearly show spatially complex patterns in the extent and intensity of land use, implying that changes in human activity around this time were not driven merely by responses to changing environmental conditions. Rather, it would seem that any observed cultural shifts around this time reflect an interplay of social, economic and political factors.
4.3 Transatlantic comparisons of terrestrial hydroclimate change in the medieval period
The MCA is commonly characterised as a warm period ca. 950–1250 CE (Mann et al., 2009), with dry conditions in Europe and North America (e.g. Büntgen and Tegel, 2011; Ladd et al., 2018; Marlon et al., 2017). There is, however, considerable spatial variability in the timings of the MCA onset and peak warmth (e.g. Neukom et al., 2019) as well as hydroclimatic expressions (e.g. Shuman et al., 2018). In order to assess regional variability in terrestrial MCA hydroclimate across northeastern North America and western Europe, this study provides chronologically precise hydroclimatic comparisons facilitated by the detection of the WRAe isochron in our peatland archives as well as the NGRIP1 ice core, which acts as a chronological tie point between the palaeoenvironmental reconstructions. Comparisons of our 11 peatland records show that there is no consistent multidecadal-scale hydrological response associated with the MCA; rather hydrological conditions are variable both within and between records. There are also no clear temperature trends associated with the MCA detected in the NGRIP1 δ18O record (Fig. 6): temperatures are elevated in central Greenland during the 10th century, but these are not sustained during the remainder of the medieval period, which is generally characterised by cooler, fluctuating temperatures. These findings suggest that there is no clear climatic expression of the MCA in the North Atlantic region.
The environmental reconstructions presented in this study highlight the heterogeneous and time-transgressive nature of the reconstructed MCA hydroclimate change. For example, a dry shift, which may be typical of an MCA climate response, began ca. 900 CE in northern Nova Scotia and some records in Newfoundland and corresponds to a change to warmer conditions in central Greenland. However, the onset of drier conditions is delayed by ca. 100 years in more southwesterly sites in Nova Scotia and Maine as well as on the east coast of the North Atlantic in Ireland. In addition, all peatland records contain temporary wet shifts that occur prior to the MCA ca. 700–850 CE, which corresponds to a period of generally colder temperatures in central Greenland as reconstructed from the NGRIP1 δ18O. The timings and extent of the wet shifts vary, however, between peatland records with no clear spatial patterns to provide insight into the climate forcing mechanism driving this change. NGRIP1 records another more abrupt and pronounced temperature decrease ca. 1000–1050 CE, the time of which corresponds to a temporary wet shift in several peatland records from Ireland, Newfoundland, Nova Scotia and Maine. However, once again the timing and extent of these wet shifts vary between reconstructions. The chronological precision afforded by the presence of the WRAe isochron in the climate reconstructions presented in this study therefore conclusively demonstrates that the differences in the timings of hydroclimatic change between records reflect a true difference in peatland responses to environmental conditions and are not a feature of chronological uncertainty generated from the age–depth modelling process.
Here we have reported the dominant peatland hydroclimatic patterns that are supported by multiple regional peatland records; however, some differences exist between proximal reconstructions, such as the clusters of three peatland records developed within ca. 10 km in eastern Newfoundland and two records within ca. 110 km in Maine. The differences in hydroclimate at such local levels in Newfoundland may reflect the degree of spatial hydroclimate variability during this period but may also be exacerbated by autogenically driven peatland responses such as enhanced peat accumulation under warmer MCA climates that would drive an apparent lowering of the water table (e.g. Swindles et al., 2012). The divergence between the hydroclimate reconstructions obtained from the Maine peatlands is likely influenced by a fire disturbance event at one of the sites, Saco Heath, which created a substantial hiatus in peat accumulation in some areas of the site (Clifford and Booth, 2013). Whilst the Saco Heath record presented here appears less impacted by the fire, there is a high degree of uncertainty in the hydroclimate reconstruction between ca. 1000–1250 CE when the accumulation rate slows, which may reflect a temporary hiatus (Fig. 6; Appendix D). The development of more palaeoenvironmental reconstructions from sites containing the WRAe, particularly in locations such as Maine and western Europe, will be useful to investigate further MCA trends further.
The winter 852/3 ± 1 CE Churchill eruption was one of the largest-magnitude volcanic events of the first millennium. Tree-ring temperature reconstructions show a NH summer temperature anomaly of around −0.8 ∘C in 853 CE, and the corresponding 3-year mean temperature anomaly ranks as the 11th coldest over the 500–2000 CE period (Appendix G). On the other hand, the reconstructed climate forcing potential (i.e. atmospheric sulfate burden) of this eruption derived from ice core records is moderate, smaller than that associated with the 1991 Pinatubo eruption. This apparent mismatch between forcing and response is, we find, explainable as resulting from the combined impact of natural climate variability and volcanic aerosol forcing. Climate model simulations driven by reconstructed aerosol forcing show an ensemble mean response of −0.3 ∘C, but individual ensemble members show cooling of up to −0.8 ∘C comparable to the tree-ring reconstructions. Support for the correspondence of the eruption with a naturally occurring cool period is provided by the timings of the cooling trend reconstructed by the tree rings, which begins in summer 851 CE and therefore predates the winter 851/2 to winter 853/4 CE age uncertainty of the eruption, and the seasonal-scale NGRIP1 temperature reconstruction (Appendix I). The simulated temperature response of the eruption may also be underestimated because the forcing potential models do not account for the potential role of halogens or volcanic ash, both of which show high atmospheric abundances after the eruption. Further research in combined sulfur, halogen and ash modelling and better ice core constraints about their atmospheric loadings are therefore required to provide more holistic understandings of potential ash-rich volcanic impacts on climate and society.
Areas proximal to Mount Churchill experienced widespread and prolonged ecological, environmental and societal changes attributed to the eruption emissions, but there is no evidence of multidecadal-scale climatic response preserved in distal palaeohydrological records from the North Atlantic region that are precisely temporally linked by the 853 CE Churchill WRAe isochron. Pollen records of vegetation change and human activity from Ireland linked by the WRAe isochron also provide no evidence to support long-lasting societal responses in Ireland associated with the eruption. Evidence of short-term societal impacts in Europe from the 852/3 CE Churchill eruption remains equivocal: some historical records from Ireland and Germany, and possibly northern France and Belgium, report harsh winter conditions and food shortages within the age uncertainties of the eruption, but similar events were reported outside of the eruption period and were not unknown in the 9th century. The 852/3 CE Churchill eruption therefore exemplifies the difficulties of identifying and confirming volcanic impacts on society even when only a small eruption age uncertainty exists.
The presence of the WRAe isochron in peatlands in northeastern North America and western Europe assists with comparisons of hydroclimatic reconstructions during the Medieval Climatic Anomaly, often defined as a period of globally increased temperatures between 950 and 1250 CE (Mann et al., 2009). Reconstructed hydroclimate conditions in 853 CE vary, highlighting leads and lags in the terrestrial responses to environmental change that may otherwise be considered contemporaneous without the temporal precision provided by the WRAe. This study shows a lack of a consistent terrestrial response to MCA climate change in the North Atlantic region; rather the MCA time period is characterised by time-transgressive and heterogeneous hydroclimatic conditions. These findings contribute to a growing body of research that cautions against the application of the globally defined MCA characteristics when interpreting individual records of palaeoenvironmental change and ultimately questions the detectability of a coherent MCA climate signature.
The EVA (eVolv2k) reconstruction (Toohey and Sigl, 2017) is the recommended volcanic forcing dataset for climate model simulations of Phase 4 of the Paleoclimate Modeling Intercomparison Project (PMIP, Jungclaus et al., 2017; Kageyama et al., 2018). The EVA reconstruction uses volcanic stratospheric sulfur injection estimates derived from sulfate deposition from an extensive bipolar array of ice cores (Sigl et al., 2015), which are then converted into an SAOD time series using the idealised, scaling-based aerosol model Easy Volcanic Aerosol (EVA, Toohey et al., 2016). The global mean radiative forcing (RF) time series is estimated from the SAOD using the following relationship from Marshall et al. (2020):
where RF is in W m−2. The scaling pre-factor may vary between −20.9 and −17.4 W m−2 depending on the eruption season.
An initial condition ensemble was created using the Community Earth System Model version 1.2.2 (CESM), consisting of 20 ensemble members. CESM is a state-of-the-art fully coupled Earth system model composed of atmosphere, land, ocean and sea ice components. To generate the ensemble members, initially a seamless transient simulation was run from 1501 BCE (Kim et al., 2021a) with time-varying orbital parameters (Berger, 1978), total solar irradiance (TSI) (Vieira et al., 2011; Usoskin et al., 2014, 2016), greenhouse gas (GHG) (Joos and Spahni, 2008; Bereiter et al., 2015), and volcanic forcing from the HolVol v.1.0 (Sigl et al., 2021) and eVolv2k (Toohey and Sigl, 2017) databases. CESM1.2.2 uses a prescribed monthly mean sulfate aerosol mass on a predefined latitudinal and vertical grid as an input volcanic forcing. Optical properties are estimated within the model assuming that the aerosol mass is comprised of 75 % sulfuric acid and 25 % water and has a constant log-normal size distribution with a constant effective radius and following Neely et al. (2016). The necessary prescribed spatial–temporal distribution of volcanic sulfate aerosol for the simulation is generated using the Easy Volcanic Aerosol Model (Toohey et al., 2016) and following the same procedure employed by Zhong et al. (2018) and Kim et al. (2021a). In the procedure, the EVA-generated spatio-temporal distribution of sulfate was first converted to volcanic aerosol mass to be readable by CESM. This distribution of volcanic aerosol mass in CESM was scaled up by 1.49 to reconcile CESM and EVA atmospheric responses to the 1991 Pinatubo eruption. The scaling value is derived based on some sensitivity experiments for the Pinatubo eruption using the EVA-generated forcing and the available CESM forcing (Ammann et al., 2003) and after comparing the atmospheric responses related to the vertical and surface mean temperatures and radiative balances. Then, the transient simulation was branched off at 845 CE and a small perturbation was introduced at the first time step in the atmosphere. The 20 ensemble members were run from this point until 859 CE. During this 14-year period, no other volcanic eruptions were included except the 852/853 CE Churchill eruption. An eruption occurring in the Southern Hemisphere in 853 CE is excluded in the simulations.
Mann–Whitney U tests were used to test the statistical significance of changes in temperature and precipitation after the Churchill eruption. The null hypothesis of a Mann–Whitney U test states that the two datasets share the same statistical distribution derived from the same population. In this study, the distributions of the temperature and precipitation anomalies after the Churchill eruption (853, 854 and 855 CE individually) derived from all ensemble members were compared to those of the 845–852 CE pre-eruption period ensemble. We assume that changes in temperature and precipitation after the eruption are statistically significant if the null hypothesis of the Mann–Whitney U test is rejected at a 5 % confidence level.
We employed a PCR to reconstruct NH JJA temperature anomalies (with respect to 1961–1990) from tree-ring records. We coupled this PCR with a bootstrap random sampling approach to quantify the robustness of our reconstruction and to estimate confidence intervals of reconstructed JJA temperatures. To account for the decreasing number of records available back in time, we combined the PCR with a nested approach. In total, our reconstruction is based on 23 subsets of tree-ring chronologies or nests. The earliest and most recent nests span the periods 500–551 and 1992–2000 CE, respectively. The most replicated nest (1230–1972 CE) includes 25 chronologies. For each nest, we reduced the proxy predictors matrix to principal components (PCs) using a principal component analysis (PCA). PCs with eigenvalues >1 were included as predictors in multiple linear regression models calibrated on JJA temperature (1805–1972 CE) extracted from the Berkeley Earth Surface (BEST) dataset (http://berkeleyearth.org/data/, last access: 5 June 2021). We assessed the robustness of each model using a split calibration–verification procedure using a bootstrap approach repeated 1000 times. We computed the final reconstruction of each nest as the median of the 1000 realisations. The final 500–2000 CE reconstruction combines the 23 nests with their mean and variance adjusted to be identical to the 1230–1972 CE most replicated one. To place the summer temperature anomalies within the context of climate variability at the time of major volcanic eruptions, we removed longer timescale variations by filtering the final reconstruction, which involved calculating the difference between the raw time series and the 31-year running mean.
The target field (predictand) used for the reconstruction is the BEST JJA gridded temperature dataset ( latitude–longitude grid). We divided the NH into 11 subregions defined according to the spatial distribution of the 25 tree-ring records and their correlation. Chronologies were grouped in the same subregion when their correlation coefficients over their overlapping period exceeded 0.3. Only one chronology was included in the Quebec, western and central Europe, Siberia – Taymir, Siberia – Yakutia, and China – Qilian Mountains subregions. In these clusters, we used an ordinary least square regression to reconstruct JJA temperatures. In the other subregions such as western and central Europe – which includes five tree-ring width and maximum late-wood density records – we used the nested PCR approach (see above) to reconstruct gridded summer temperature anomalies. Based on this approach, we reconstructed robust temperature anomalies back to 500 CE for 3486 NH grid points.
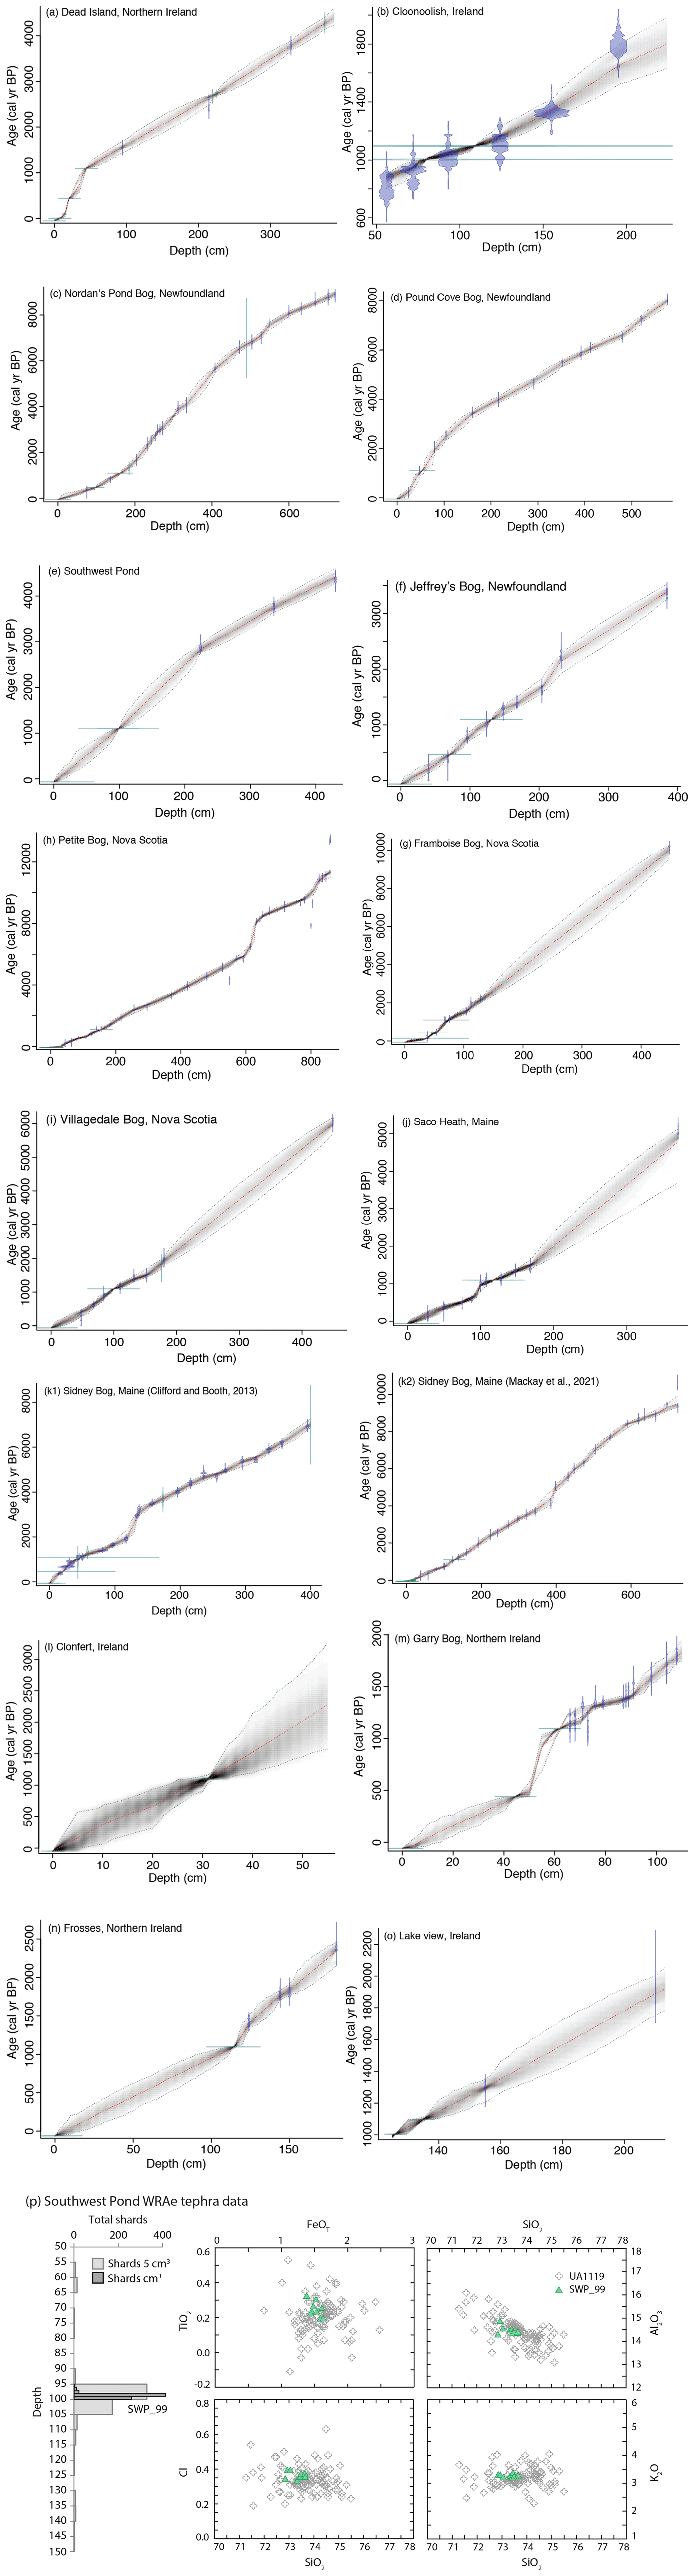
Figure D1(a–o) Core chronologies (Fig. S1a–o) were developed using Bayesian analysis within the R package “BACON” (Blaauw and Christen, 2011) based on 14C dates (calibrated using NH IntCal20 calibration curve; Reimer et al., 2020) and tephrochronologies. (p) Shard counts and major–minor element glass compositions for the WRAe in Southwest Pond bog. Comparative glass electron probe microanalysis data (UA1119) are taken from Jensen et al. (2014).
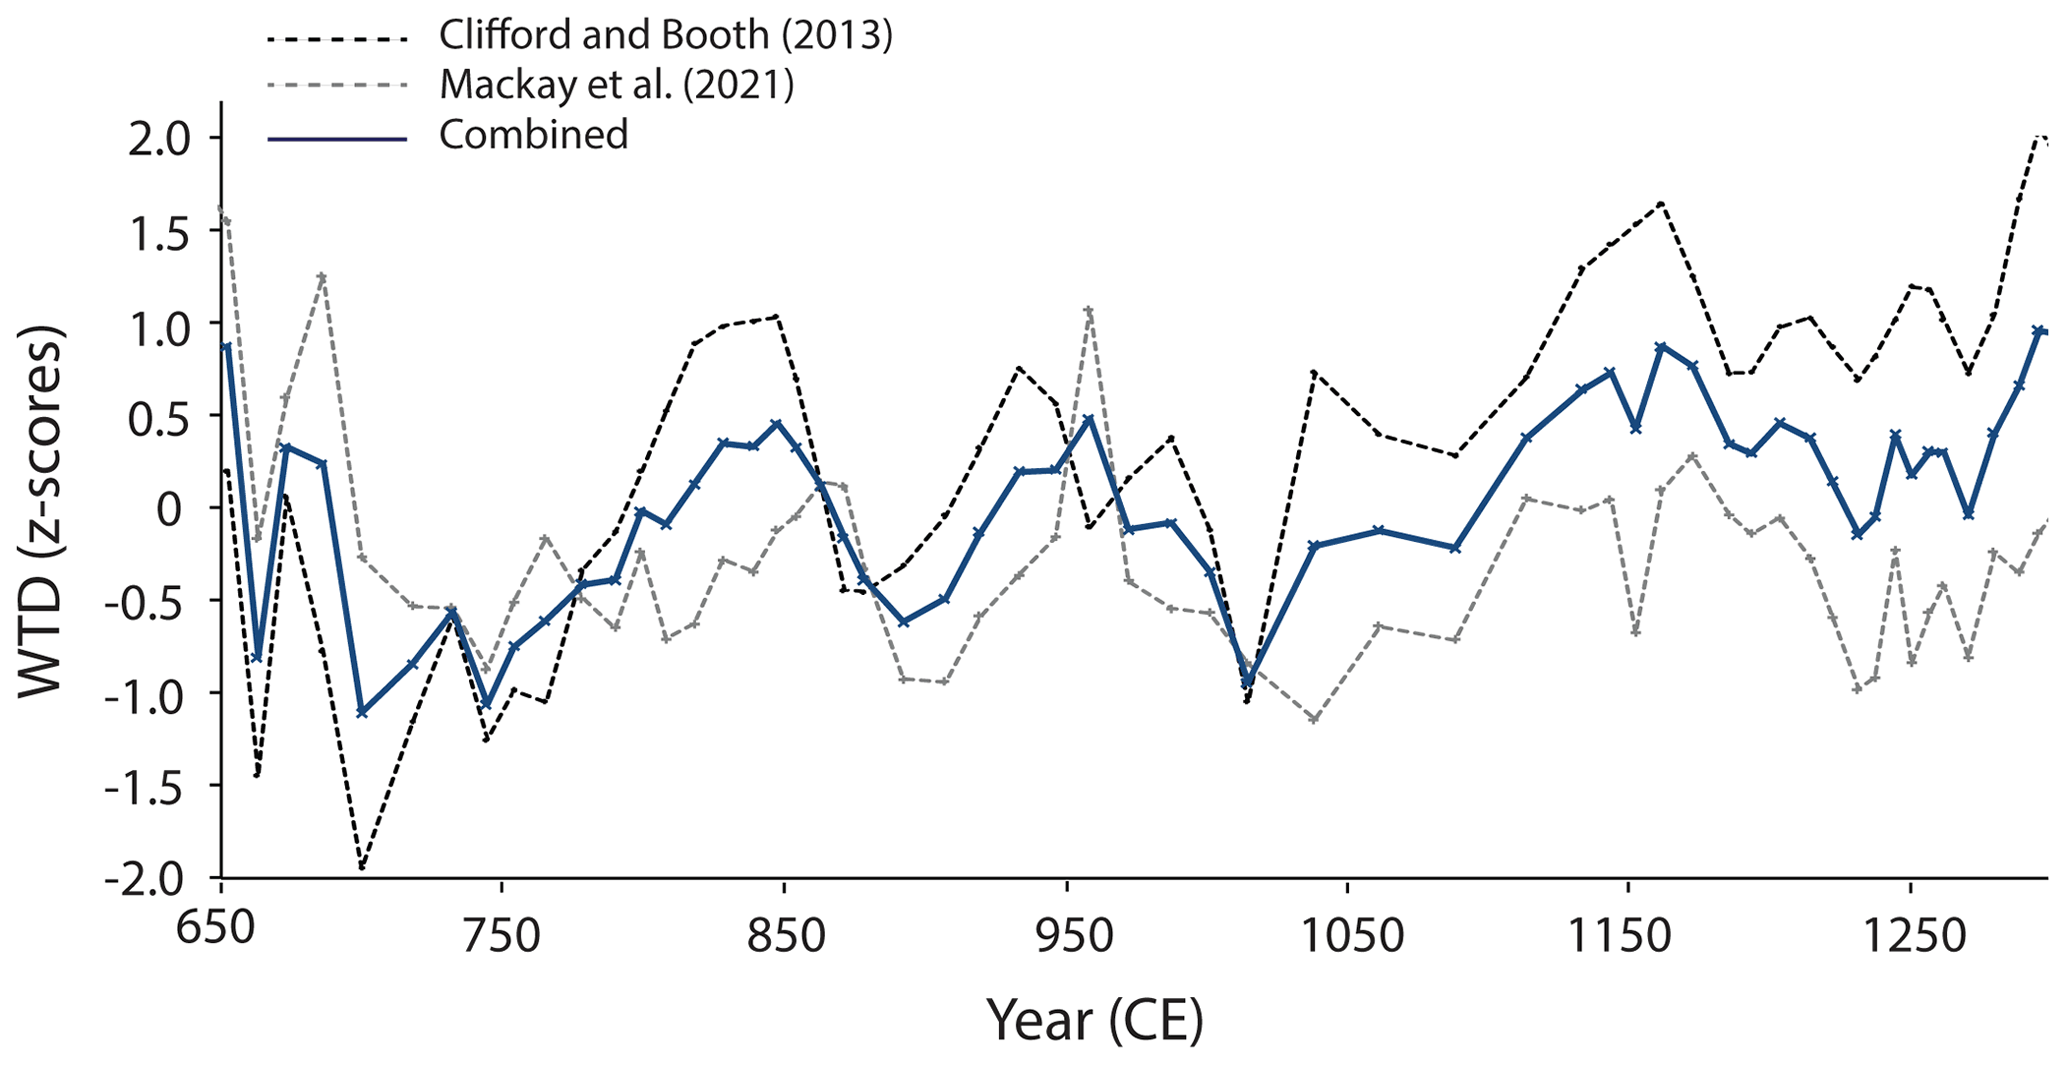
Figure E1Composite water table depth (WTD) record for Sidney Bog, Maine, USA, based on testate amoebae assemblage data obtained from two cores obtained from different coring locations on the peatland (Clifford and Booth, 2013; Mackay et al., 2021). Testate amoebae WTD reconstructions were obtained using the tolerance-downweighted weighted averaging model with inverse deshrinking (WA-Tol inv) from the North American transfer function of Amesbury et al. (2018). To produce the composite record, the chronological resolution of the Clifford and Booth (2013) WTD record has been reduced to the same resolution as the Mackay et al. (2021) record using linear interpolation between chronologically adjacent WTD values. The composite record then presents the average WTD of the interpolated Clifford and Booth (2013) and the Mackay et al. (2021) reconstructions.
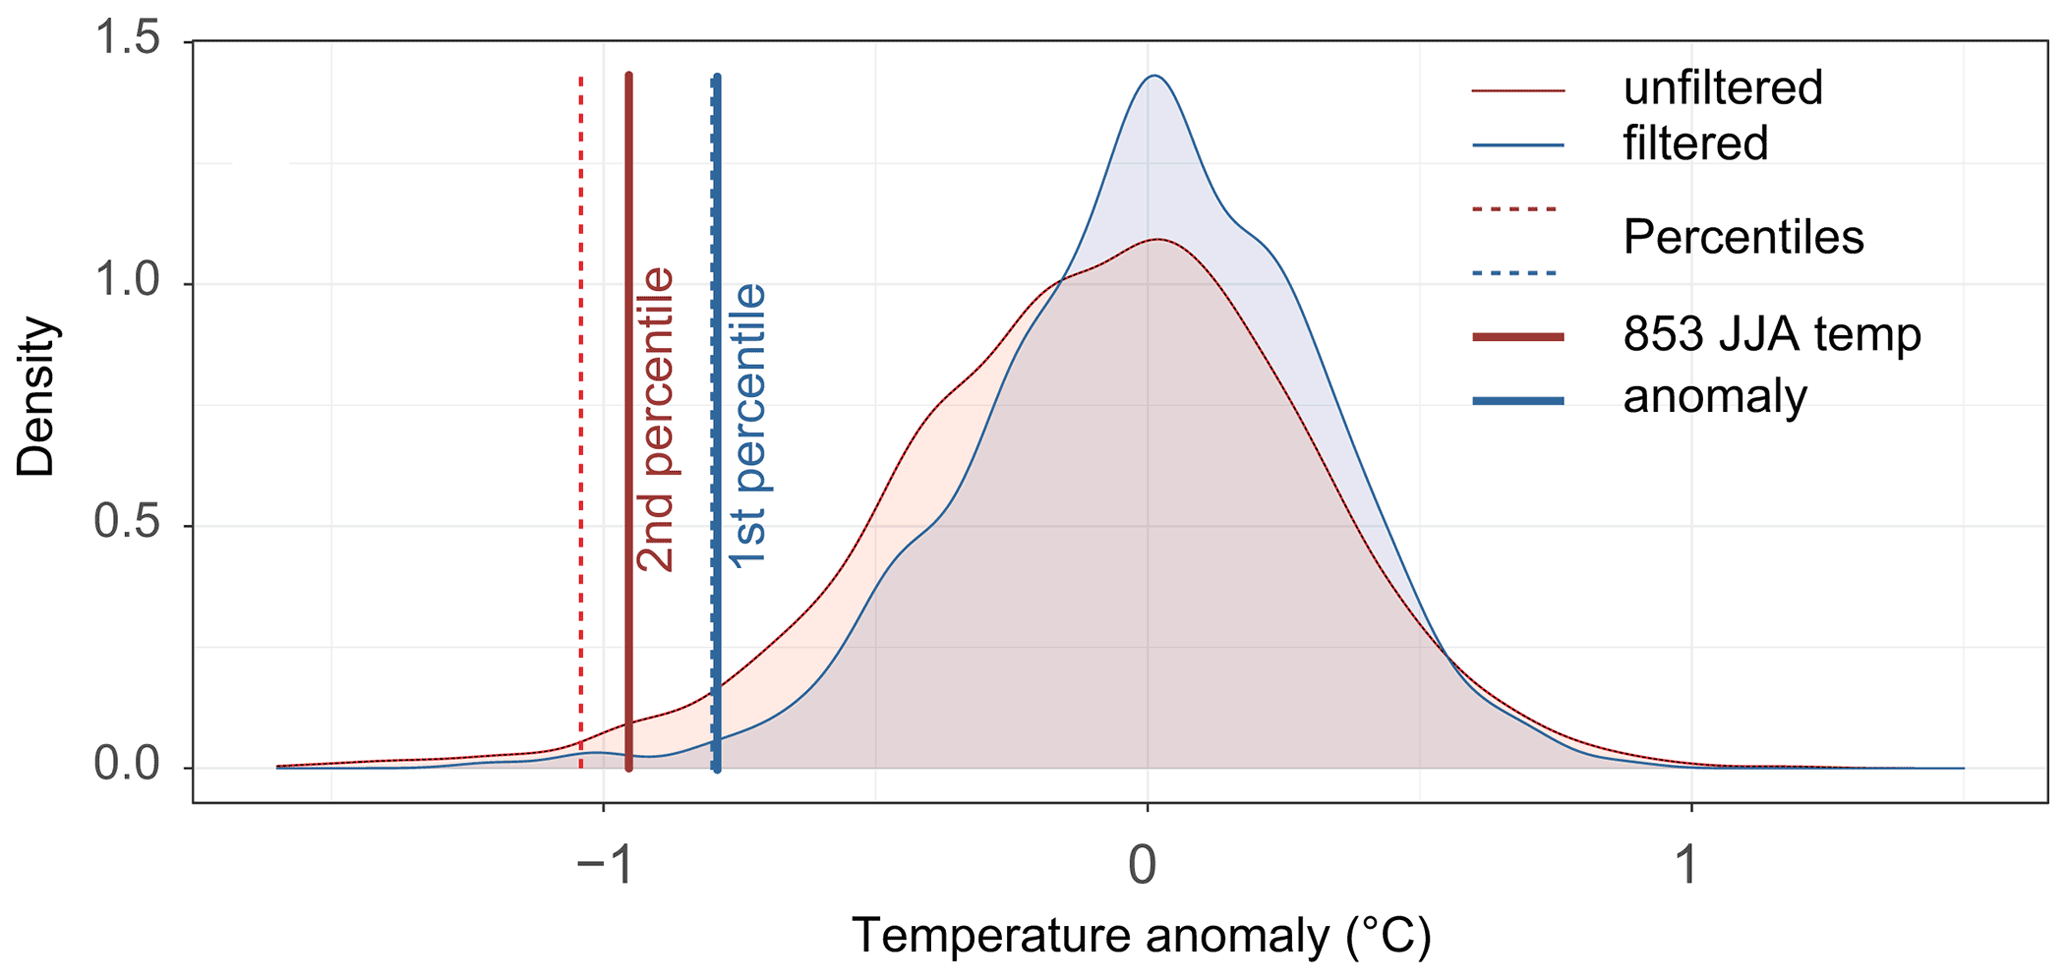
Figure F1Distributions of JJA temperature anomalies in the unfiltered (red) and filtered (blue, 31-year moving average filter) 500–2000 CE NH reconstructions. Blue and red vertical dotted bars indicate the 1st percentile of the filtered and the 2nd percentile of the unfiltered reconstructions, respectively. Blue and red bold vertical lines show the cooling observed in 853 CE in the filtered and unfiltered reconstructions, respectively.
Table G1Top 30 coldest years during the period of 500–2000 CE based on tree-ring temperature anomalies filtered using a 3-year mean and corresponding eruption information for proximal calendar years. Eruption dates and volcanic stratospheric sulfate injection (VSSI) estimates taken from the eVolv2k reconstruction (Toohey and Sigl, 2017), representing the most immediate preceding eruption in the dataset. Roman font: eruption occurred within 2 years of the coldest reported year; italic font: eruption occurred more than 2 years before the coldest reported year. Unidentified eruption: UE.
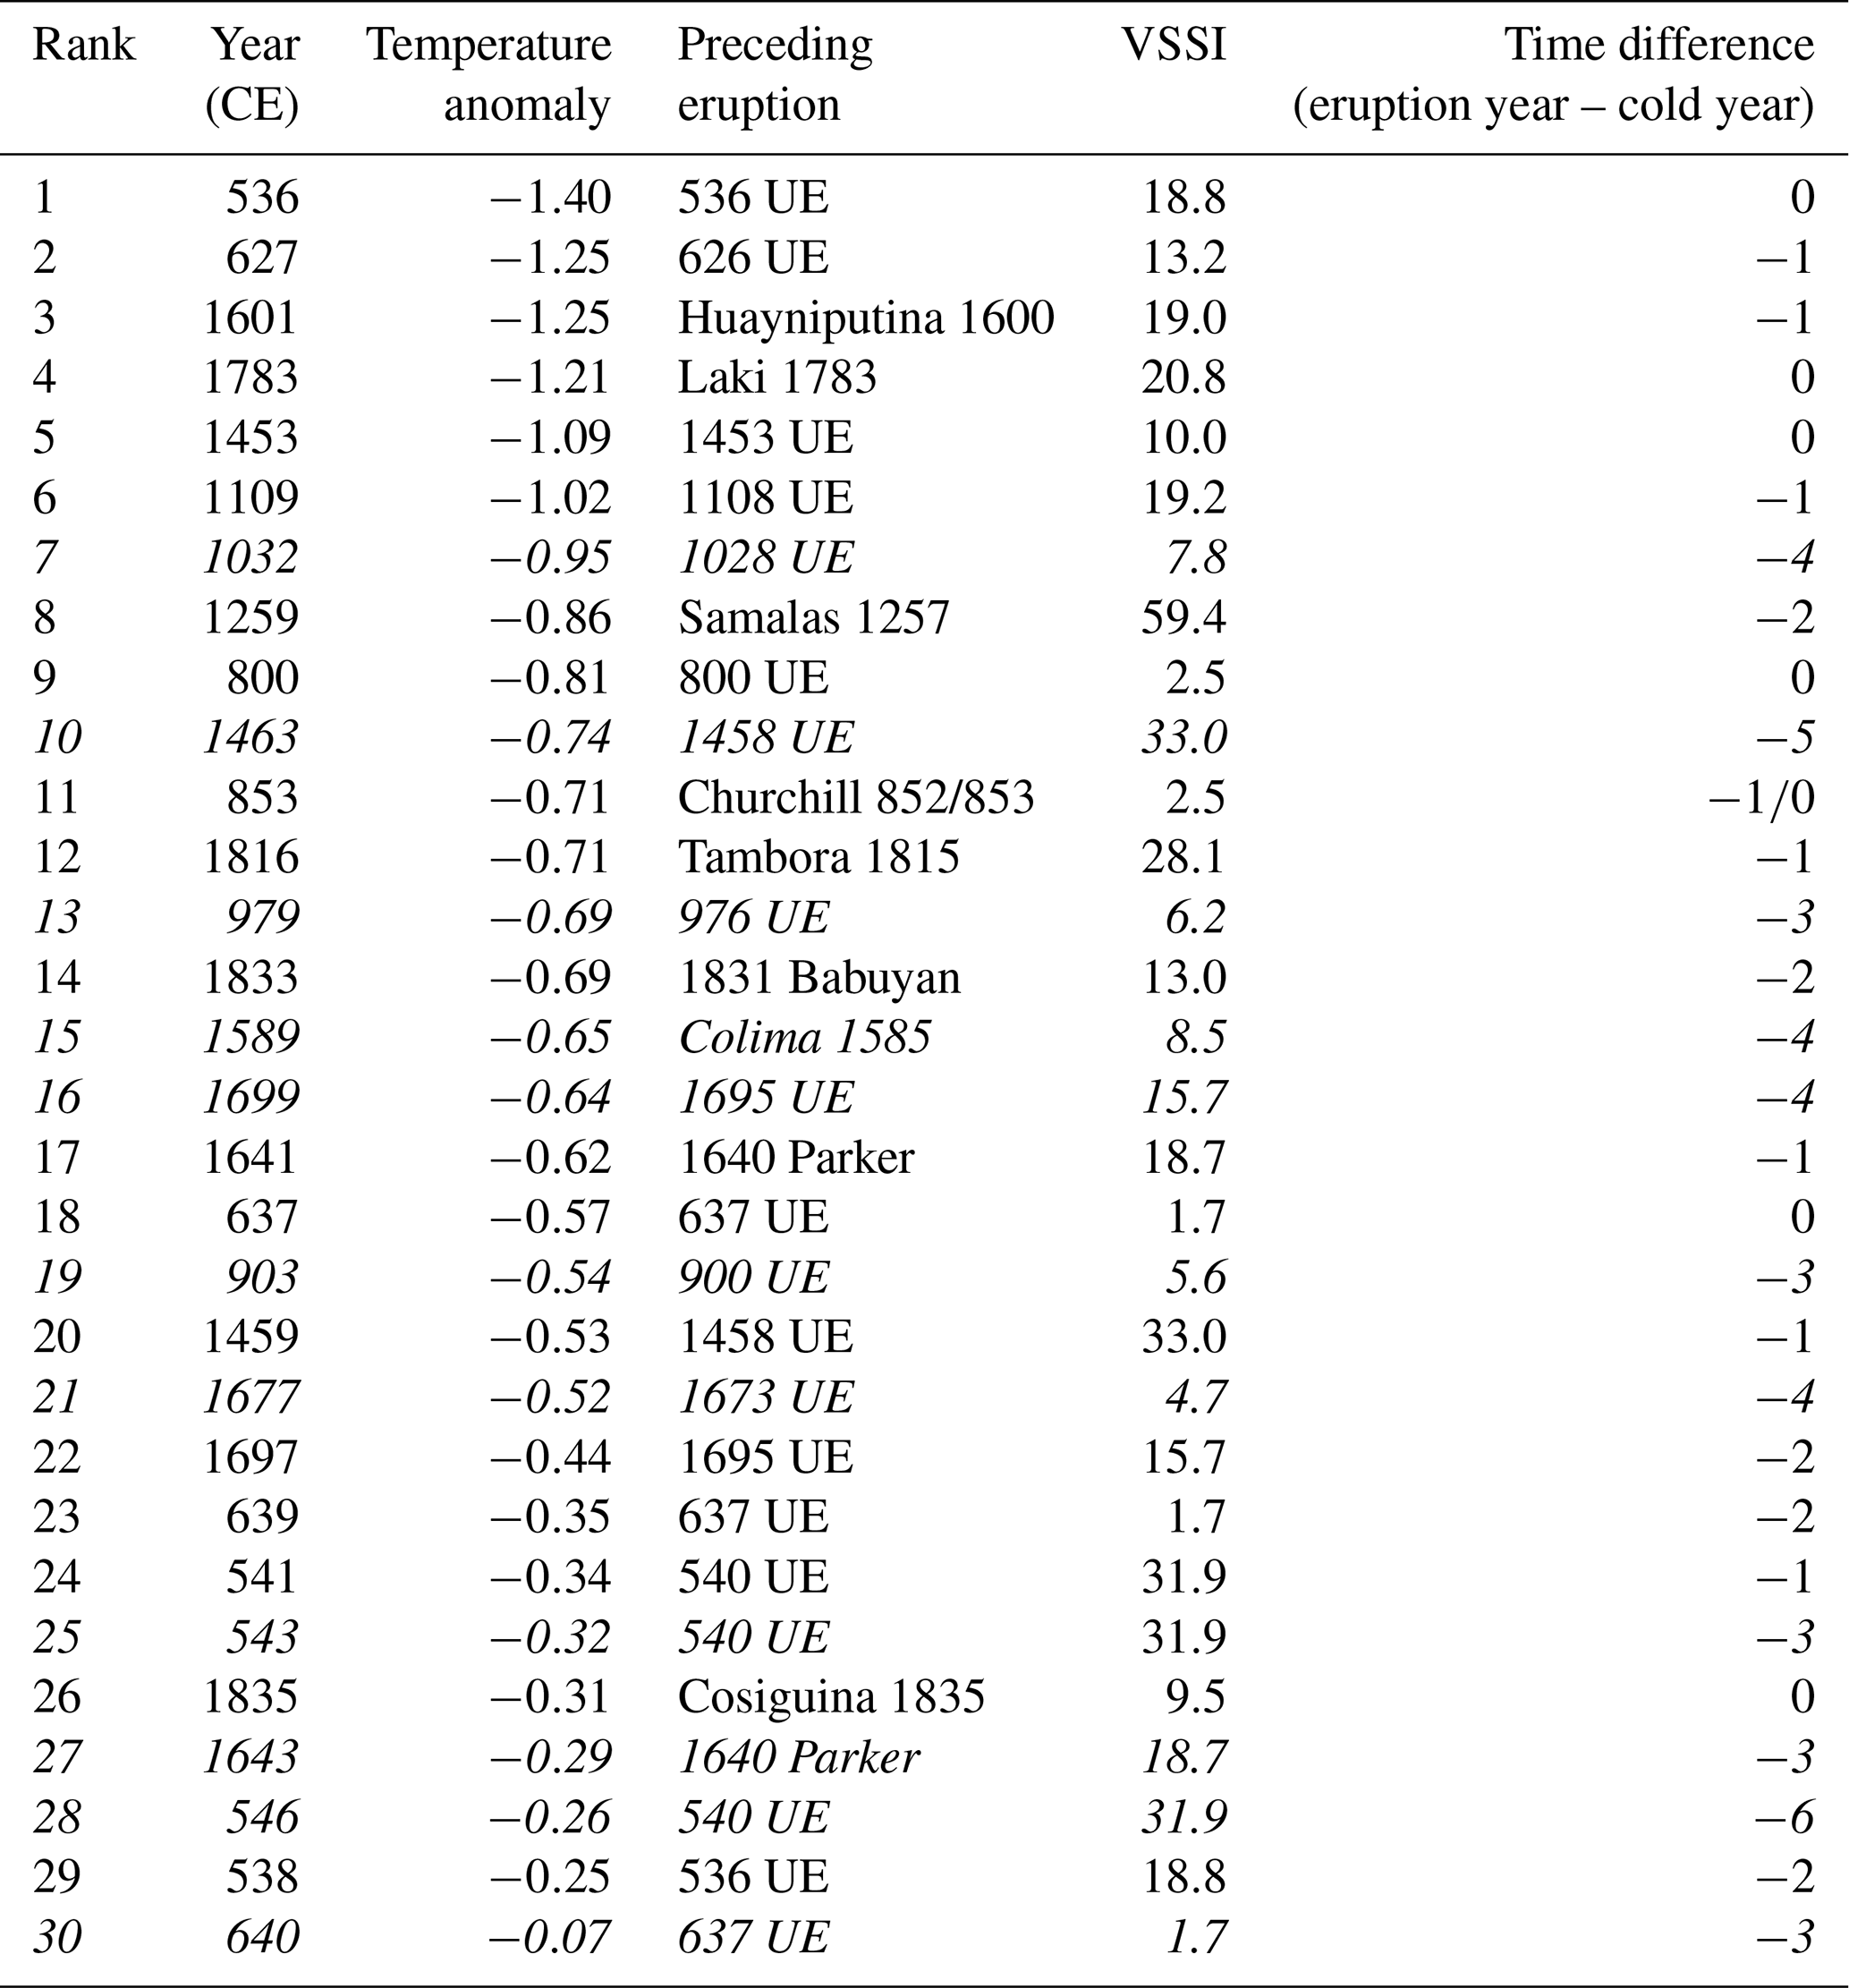

Figure H1The spatially averaged NH extratropical (15–90∘ N latitudes) precipitation anomalies from 20 ensemble simulations for summer (JJA) and winter (DJF) in light blue lines. The thick black lines indicate the ensemble means and the horizontal blue lines represent 1 standard deviation from the ensemble means of the 845–852 CE pre-eruption period.

Figure I1NGRIP1 δ18O isotopes temperature reconstruction (Vinther et al., 2006), plotted on NS1-2011 chronology (Sigl et al., 2015). Warmer (colder) temperatures are represented by higher (lower) δ18O values. The eruption age estimate for the 852/3 CE Churchill eruption is denoted.
The EVA code is publicly available on GitHub: https://github.com/thomasaubry/EVA_H (Aubry, 2022).
The volcanic forcing data are accessible online: https://doi.org/10.5281/zenodo.5725495 (Kim et al., 2021b). The Community Earth System Model Ensemble Simulation data are accessible online: https://doi.org/10.5281/zenodo.6545625 (Kim and Raible, 2022) Testate amoeba data are available on NEOTOMA: https://apps.neotomadb.org/explorer/ (last access: 12 May 2022; https://doi.org/10.21233/B7SC-4515, Mackay et al., 2022a; https://doi.org/10.21233/VBAE-XM49, Mackay et al., 2022b; https://doi.org/10.21233/0FNY-EP27, Mackay et al., 2022c; https://doi.org/10.21233/P27F-GH47, Mackay et al., 2022d; https://doi.org/10.21233/RCPG-WB72, Mackay et al., 2022e; https://doi.org/10.21233/12S2-FD03, Mackay et al., 2022f). The pollen data will be available when the extended records are published. Other data are from existing publications (as cited in text).
HM, GP and BJ were responsible for the conceptualisation and design of the project. HM, MA, AM, AB and GS conducted the testate amoebae analyses as well as the associated data analysis and interpretation. HM and MA conducted the testate amoebae analyses as part of projects supervised by PDMH, PGL and DC. RB and HM created the Sidney Bog composite testate amoebae record. GP and LCM designed and conducted the Irish pollen and tephra analysis for the Irish sites (exception of Dead Island record, tephrochronology by GS). TA and MT designed the forcing potential analyses, which were conducted by TA. MiS analysed the ice core chronologies and associated data. BJ and MB designed the eruption volume estimate and magnitude analyses, which were conducted by MB. WK and CR designed the climate model simulation analyses, which were conducted by WK. CC and MaS designed the tree-ring temperature reconstruction analyses, which were conducted by CC. KJA designed and analysed the tree-ring drought reconstructions. JM, TPN, NDC, FL, CK and ZY analysed the historical records. HM, KLD, TA, WK, CC, AM, KA and MB designed and produced the visualisations. HM prepared the original draft of the paper and all co-authors were involved in the writing review and editing process.
The contact author has declared that neither they nor their co-authors have any competing interests.
Publisher’s note: Copernicus Publications remains neutral with regard to jurisdictional claims in published maps and institutional affiliations.
This article is part of the special issue “Interdisciplinary studies of volcanic impacts on climate and society”. It is not associated with a conference.
This paper benefitted from discussion at events of the Past Global Changes (PAGES) working group “Volcanic Impacts on Climate and Society” (VICS) as well as with Angus M. Duncan and Richard J. Payne. PAGES is supported by the Chinese Academy of Sciences (CAS) and the Swiss Academy of Sciences (SCNAT). Helen Mackay and Matthew Amesbury were supported by the UK Natural Environment Research Council (PRECIP project grants NE/G019851/1, NE/G020272/1, NE/G019673/1 and NE/G02006X/1 and MILLIPEAT project grant NE/1012915/1). A Quaternary Research Association New Research Workers award was granted to Helen Mackay and the NERC Radiocarbon Facility NRCF010001 (allocation numbers 1744.1013 and 1789.0414). Christophe Corona and Markus Stoffel were supported by the Swiss National Science Foundation Sinergia project CALDERA (grant agreement no. CRSII5_183571). Woon Mi Kim and Christoph Raible are supported by the Swiss National Science Foundation (SNSF, grant nos. 200020_172745 and 200020_200492). The climate mode simulations were performed at the Swiss National Super Computing Centre (CSCS). Michael Sigl acknowledges funding from the European Research Council (ERC) under the European Union's Horizon 2020 research and innovation programme (grant agreement 820047). Francis Ludlow and Conor Kostick were supported by an Irish Research Council Laureate Award (CLICAB, IRCLA/2017/303). Joseph G. Manning and Francis Ludlow acknowledge support from US National Science Foundation Award no. 1824770. Francis Ludlow and Zhen Yang acknowledge additional support from an ERC Synergy Grant (4-OCEANS; grant agreement 951649). Thomas J. Aubry acknowledges support from the European Union's Horizon 2020 research and innovation programme under the Marie Skłodowska-Curie grant agreement no. 835939 and from Sidney Sussex College through a Junior Research Fellowship. We are grateful to all reviewers for their constructive comments and valuable suggestions.
This research has been supported by the Natural Environment Research Council (grant nos. NE/G019851/1, NE/G020272/1, NE/G019673/1, NE/G02006X/1 and NE/1012915/1), the Schweizerischer Nationalfonds zur Förderung der Wissenschaftlichen Forschung (grant nos. CR-SII5_183571, 200020_172745 and 200020_200492), the National Science Foundation (grant no. 1824770), the Irish Research Council (grant no. IRCLA/2017/303) and the H2020 European Research Council (grant nos. 820047, 835939 and 951649).
This paper was edited by Allegra N. LeGrande and reviewed by Mukund Palat Rao and one anonymous referee.
Abbott, P. M., Plunkett, G., Corona, C., Chellman, N. J., McConnell, J. R., Pilcher, J. R., Stoffel, M., and Sigl, M.: Cryptotephra from the Icelandic Veiðivötn 1477 CE eruption in a Greenland ice core: confirming the dating of volcanic events in the 1450s CE and assessing the eruption's climatic impact, Clim. Past, 17, 565–585, https://doi.org/10.5194/cp-17-565-2021, 2021.
Al-Fadl Ibrahim, M. A. (Ed.): al-Tabarī, Ta'rīkh al-rusul wa'l-mulūk, 10 (Cairo: Dar al-Ma'arif, 1960–1969), 9, 270–322.
Al-Qādir Àtā, M. À. and al-Qādir Àtā, M. À. (Eds.):, Ibn al-Jawzi, al-Muntaẓam fī ta’rīkh al-umam wa'l-mulūk, 19, Beruit: Dār al-Kutub al ‘Ilmiyya, 11, 270-1, 1992.
Amesbury, M. J., Swindles, G. T., Bobrov, A., Charman, D. J., Holden, J., Lamentowicz, M., Mallon, G., Mazei, Y., Mitchell, E. A., Payne, R. J., and Roland, T. P.: Development of a new pan-European testate amoeba transfer function for reconstructing peatland palaeohydrology, Quaternary Sci. Rev., 152, 132–151, https://doi.org/10.1016/j.quascirev.2016.09.024, 2016.
Amesbury, M. J., Booth, R. K., Roland, T. P., Bunbury, J., Clifford, M. J., Charman, D. J., Elliot, S., Finkelstein, S., Garneau, M., Hughes, P. D., and Lamarre, A.: Towards a Holarctic synthesis of peatland testate amoeba ecology: Development of a new continental-scale palaeohydrological transfer function for North America and comparison to European data, Quaternary Sci. Rev., 201, 483–500, https://doi.org/10.1016/j.quascirev.2018.10.034, 2018.
Ammann, C. M., Meehl, G. A., Washington, W. M., and Zender, C. S.: A monthly and latitudinally varying volcanic forcing dataset in simulations of 20th century climate, Geophys. Res. Lett., 30, 1657, https://doi.org/10.1029/2003GL016875, 2003.
Anchukaitis, K. J., Cook, E. R., Cook, B. I., Pearl, J., D'Arrigo, R., and Wilson, R.: Coupled modes of North Atlantic ocean atmosphere variability and the onset of the Little Ice Age, Geophys. Res. Lett., 46, 12417–12426, https://doi.org/10.1029/2019GL084350, 2019.
Atwood, A. R., Donohoe, A., Battisti, D. S., Liu, X., and Pausata, F. S. R.: Robust longitudinally variable responses of the ITCZ to a myriad of climate forcings, Geophys. Res. Lett., 47, e2020GL088833, https://doi.org/10.1029/2020GL088833, 2020.
Aubry, T.: EVA_H, GitHub [code], last access: 12 May 2022.
Aubry, T. J., Toohey, M., Marshall, L., Schmidt, A., and Jellinek, A. M.: A new volcanic stratospheric sulfate aerosol forcing emulator (EVA_H): Comparison with interactive stratospheric aerosol models, J. Geophys. Res.-Atmos., 125, e2019JD031303, https://doi.org/10.1029/2019JD031303, 2020.
Aubry, T. J., Engwell, S., Bonadonna, C., Carazzo, G., Scollo, S., Van Eaton, A. R., Taylor, I. A., Jessop, D., Eychenne, J., Gouhier, M., Mastin, L. G., Wallace, K. L., Biass, S., Bursik, M., Grainger, R. G., Jellinek, A. M., and Schmidt, A.: The Independent Volcanic Eruption Source Parameter Archive (IVESPA, version 1.0): A new observational database to support explosive eruptive column model validation and development, J. Volcanol. Geoth. Res., 417, 107295, https://doi.org/10.1016/j.jvolgeores.2021.107295, 2021.
Barnes, E. A., Solomon, S., and Polvani, L. M.: Robust wind and precipitation responses to the Mount Pinatubo eruption, as simulated in the CMIP5 models, J. Climate, 29, 4763–4778, https://doi.org/10.1175/JCLI-D-15-0658.1, 2016.
Bereiter, B., Eggleston, S., Schmitt, J., Nehrbass-Ahles, C., Stocker, T. F., Fischer, H., Kipfstuhl, S., and Chappellaz, J.: Revision of the EPICA Dome C CO2 record from 800 to 600 kyr before present, Geophys. Res. Lett., 42, 542–549, https://doi.org/10.1002/2014GL061957, 2015.
Berger, A.: Long-term variations of daily insolation and Quaternary climatic changes, J. Atmos. Sci., 35, 2362–2367, https://doi.org/10.1175/1520-0469(1978)035<2362:LTVODI>2.0.CO;2, 1978.
Blaauw, M. and Christen, J. A.: Flexible paleoclimate age-depth models using an autoregressive gamma process, Bayesian Anal., 6, 457–474, https://doi.org/10.1214/11-BA618, 2011.
Blong, R., Fallon, S., Wood, R., McKee, C., Chen, K. P., Magill, C., and Barter, P.: Significance and timing of the mid-17th-century eruption of Long Island, Papua New Guinea, Holocene, 28, 529–544, https://doi.org/10.1177/0959683617735589, 2018.
Bonadonna, C. and Costa, A.: Estimating the volume of tephra deposits: a new simple strategy, Geology, 40, 415–418, https://doi.org/10.1130/G32769.1, 2012.
Booth, R. K.: Testate amoebae as proxies for mean annual water-table depth in Sphagnum-dominated peatlands of North America, J. Quaternary Sci., 23, 43–57, https://doi.org/10.1002/jqs.1114, 2008.
Booth, R. K., Lamentowicz, M., and Charman, D. J.: Preparation and analysis of testate amoebae in peatland palaeoenvironmental studies, Mires and Peat, 7, 1–7, 2010.
Brenna, H., Kutterolf, S., Mills, M. J., and Krüger, K.: The potential impacts of a sulfur- and halogen-rich supereruption such as Los Chocoyos on the atmosphere and climate, Atmos. Chem. Phys., 20, 6521–6539, https://doi.org/10.5194/acp-20-6521-2020, 2020.
Bunbury, J. and Gajewski, K.: Effects of the White River Ash event on aquatic environments, southwest Yukon, Canada, Arctic, 66, 17–31, https://www.jstor.org/stable/23594603 (last access: 1 December 2021), 2013.
Büntgen, U. and Tegel, W.: European tree-ring data and the Medieval Climate Anomaly, PAGES news, 19, 14–15, 2011.
Büntgen, U., Myglan, C., and Ljungqvist, F.: Cooling and societal change during the Late Antique Little Ice Age from 526 to around 660 AD, Nat. Geosci., 9, 231–236, https://doi.org/10.1038/ngeo2652, 2016.
Büntgen, U., Asrenault, D., Boucher, E., Churakova (Sidorova), O. V., Gennaretti, F., Crivellaro, A., Hugher, M. K., Kirdvanov, A. V., Klippel, L., Krusic, P. J., Linerholm, H. W., Ljungjjvist, F. D., Ludescher, J., McCormick, M., Sigl, M., Vaganov, E. A., and Esper, J.: Prominent role of volcanism in Common Era climate variability and human history, Dendrochronologia, 65, 125757, https://doi.org/10.1016/j.dendro.2020.125757, 2020.
Carey, S. and Sparks, R. S. J.: Quantitative models of the fallout and dispersal of tephra from volcanic eruption columns, B. Volcanol., 48, 109–125, https://doi.org/10.1007/BF01046546, 1986.
Charman, D. J., Hendon, D., and Woodland, W. A.: The identification of testate amoebae (Protozoa: Rhizopoda) in peats, Quaternary Research Association, London, QRA Technical Guide No. 9, 147 pp., 2000.
Chen, G. (Ed.): Zhongguo lidai tianzai renhuo biao (Shanghai 1986), Jinan University Press, 1, 652–652, Shanghai, 1986.
Christiansen, B.: Volcanic Eruptions, Large-Scale Modes in the Northern Hemisphere, and the El Niño-Southern Oscillation, J. Climate, 21, 910–922, https://doi.org/10.1175/2007JCLI1657.1, 2008.
Clifford, M. J. and Booth, R. K.: Increased probability of fire during late Holocene droughts in northern New England, Clim. Change, 119, 693–704, https://doi.org/10.1016/j.quaint.2011.05.027, 2013.
Colose, C. M., LeGrande, A. N., and Vuille, M.: The influence of volcanic eruptions on the climate of tropical South America during the last millennium in an isotope-enabled general circulation model, Clim. Past, 12, 961–979, https://doi.org/10.5194/cp-12-961-2016, 2016.
Cook, E. R., Meko, D. M., Stahle, D. W., and Cleaveland, M. K.: Drought reconstructions for the continental United States, J. Climate, 12, 1145–1162, https://doi.org/10.1175/1520-0442(1999)012<1145:DRFTCU>2.0.CO;2, 1999.
Cook, E. R., Seager, R., Heim Jr., R. R., Vose, R. S., Herweijer, C., and Woodhouse, C.: Megadroughts in North America: placing IPCC projections of hydroclimatic change in a long-term palaeoclimate context, J. Quaternary Sci., 25, 48–61, https://doi.org/10.1002/jqs.1303, 2010.
Cook, E. R., Seager, R., Kushnir, Y., Briffa, K. R., Büntgen, U., Frank, D., Krusic, P. J., Tegel, W., van der Schrier, G., Andreu-Hayles, L., Baillie, M., Baittinger, C., Bleicher, N., Bonde, N., Brown, D., Carrer, M., Cooper, R., Cufar, K., Dittmar, C., Esper, J., Griggs, C., Gunnarson, B., Gunther, B., Gutierrez, E., Haneca, K., Helama, S., Herzig, F., Heussner, K.-U., Hofmann, J., Janda, P., Kontic, R., Kose, N., Kyncl, T., Levanic, T., Linderholm, H., Manning, S., Melvin, T. M., Miles, D., Neuwirth, B., Nicolussi, K., Nola, P., Panayotov, M., Popa, I., Rothe, A., Seftigen, K., Seim, A., Svarva, H., Svoboda, M., Thun, T., Timonen, M., Touchan, R., Trotsiuk, V., Trouet, V., Walder, F., Wazny, T., Wilson, R., and Zang, C.: Old World megadroughts and pluvials during the Common Era, Sci. Adv., 1, e1500561, https://doi.org/10.1126/sciadv.1500561, 2015.
Coulter, S. E., Pilcher, J. R., Plunkett, G., Baillie, M., Hall, V. A., Steffensen, J. P., Vinther, B. M., Clausen, H. B., and Johnsen, S. J.: Holocene tephras highlight complexity of volcanic signals in Greenland ice cores, J. Geophys. Res., 117, D21303, https://doi.org/10.1029/2012JD017698, 2012.
Coyle McClung, L.: A palynological investigation of land-use patterns in first millennium AD Ireland, unpublished PhD thesis, Queen's University Belfast, https://ethos.bl.uk/OrderDetails.do?uin=uk.bl.ethos.601121 (last access: 12 May 2022), 2012.
Devroey, J.-P.: La Nature et le Roi: Environment, Pouvoir et Société à l'Âge de Charlemagne (740–820), Albin Michel, Paris, ISBN-10: 2226439404, 2019.
Duby, G.: The early growth of the European economy: Warriors and peasants from the seventh to the twelfth century, translated by: Clarke, H. B., Cornell Universty Press, Ithaca,ISBN-13: 9780801491696, 1974.
Fierstein, J. and Nathenson, M.: Another look at the calculation of fallout tephra volumes, B. Volcanol., 54, 156–167, https://doi.org/10.1007/BF00278005, 1992.
Guillet, S., Corona, C., Stoffel, M., Khodri, M., Lavigne, F., Ortega, P., Eckert, N., Selenniou, P., Daux, V., Churakova (Sidorova), O., Davi, N., Edouard, J. L., Yong, Z., Luckman, B. H., Myglan, V. S., Guiot, J., Beniston, M., Masson-Delmotte, V., and Oppenheimer, C.: Climate response to the Samalas volcanic eruption in 1257 revealed by proxy records, Nat. Geosci., 10, 123–128, https://doi.org/10.1038/ngeo2875, 2017.
Guillet, S., Corona, C., Ludlow, F., Oppenheimer, C., and Stoffel, M.: Climatic and societal impacts of a “forgotten” cluster of volcanic eruptions in 1108-1110 CE, Sci. Rep., 10, 6715, https://doi.org/10.1038/s41598-020-63339-3, 2020.
Guo, S., Bluth, G. J. S., Rose, W. I., Watson, M., and Prata, A. J.: Re-evaluation of SO2 release of the 15 June 1991 Pinatubo eruption using ultraviolet and infrared sensors, Geochem., Geophy., Geosy., 5, 4 , https://doi.org/10.1029/2003GC000654, 2004.
Haldon, J., Mordechai, L., Newfield, T. P., Chase, A. F., Izdebski, A., Guzowski, P., Labuhn, I., and Roberts, N.: History meets palaeoscience: Consilience and collaboration in studying past societal responses to environmental change, P. Natl. Acad. Sci. USA, 115, 3210–3218, https://doi.org/10.1073/pnas.1716912115, 2018.
Hall, V. A.: The vegetation history of monastic and secular sites in the midlands of Ireland over the last two millennia, Veg. Hist. Archaeobot., 15, 1–12, https://doi.org/10.1007/s00334-005-0072-0, 2005.
Hare, P. G., Greer, S., Gotthardt, R., Farnell, R., Bowyer, V., Schweger, C., and Strand, D.: Ethnographic and archaeological investigations of alpine ice patches in southwest Yukon, Canada, Arctic, 57, 260–272, https://www.jstor.org/stable/40512063 (last access: 5 May 2022), 2004.
Hassan, F. A.: Historical Nile floods and their implications for climatic change, Science, 212, 1142–1145, 1981.
Hassan, F. A.: Extreme Nile floods and famines in Medieval Egypt (AD 930–1500) and their climatic implications, Quatern. Int., 173–174, 101–112, https://doi.org/10.1016/j.quaint.2007.06.001, 2007.
Hassan, F. A. and Stucki, B. R.: Nile floods and climatic change, in: Climate: history, periodicity, and predictability, edited by: Rampino, M. R., Sanders, J. E., Newman, W. S., and Königsson, L. K., Van Nostrand & Reinhold, Amsterdam, 37–46, ISBN: 0-442-27866-7, 1987.
Haywood, J., Jones, A., Bellouin, N., and Stephenson, D.: Asymmetric forcing from stratospheric aerosols impacts Sahelian rainfall, Nat. Clim. Change, 3, 660–665, https://doi.org/10.1038/nclimate1857, 2013.
Hirsch, A.: Handbook of geographical and historical pathology, vol. 2: Chronic infective, toxic, parasitic, septic and constitutional diseases, translated by: Creighton, C., New Sydenham Society, London, OCLC: 6607841, 1885.
Held, I. M. and Soden, B. J.: Robust responses of the hydrological cycle to global warming, J. Climate, 19, 5686–5699, https://doi.org/10.1175/JCLI3990.1, 2006.
Hendon, D. and Charman, D. J.: The preparation of testate amoebae (Protozoa: Rhizopoda) samples from peat, Holocene, 7, 199–205, https://doi.org/10.1177/095968369700700207, 1997.
Hogg, A., Lowe, D. J., Palmer, J., Boswijk, G., and Ramsey, C. B.: Revised calendar date for the Taupo eruption derived by 14C wiggle-matching using a New Zealand kauri 14C calibration data set, Holocene, 22, 439–449, https://doi.org/10.1177/0959683611425551, 2012.
Hogg, A. G., Wilson, C. J. N., Lowe, D. J., Turney, C. S. M., White, P., Lorrey, A. M., Manning, S. W., Palmer, J. G., Bury, S., Brown, J., Southon, J., and Petchey, F.: Wiggle-match radiocarbon dating of the Taupo eruption, Nat. Commun., 10, 4669, https://doi.org/10.1038/s41467-019-12532-8, 2019.
Hurrell, J. W., Holland, M. M., Gent, P. R., Ghan, S., Kay, J. E., Kushner, P. J., Lamarque, J. F., Large, W. G., Lawrence, D., Lindsay, K., and Lipscomb, W. H.: The community earth system model: a framework for collaborative research, B. Am. Meteorol. Soc., 94, 1339–1360, https://doi.org/10.1175/BAMS-D-12-00121.1, 2013.
Iles, C. E. and Hegerl, G. C.: The global precipitation response to volcanic eruptions in the CMIP5 models, Environ. Res. Lett., 9, 104012, https://doi.org/10.1088/1748-9326/9/10/104012, 2014.
Iles, C. E. and Hegerl, G. C.: Systematic change in global patterns of streamflow following volcanic eruptions, Nat. Geosci., 8, 838–842, https://doi.org/10.1038/ngeo2545, 2015.
Jensen, B. J. L., Pyne-O'Donnell, S., Plunkett, G., Froese, D. G., Hughes, P. D., Sigl, M., McConnell, J. R., Amesbury, M. J., Blackwell, P. G., van den Bogaard, C., Buck, C. E., Charman, D.J., Clague, J. J., Hall, V. A., Koch, J., Mackay, H., Mallon, G., McColl, L., and Pilcher, J. R.: Transatlantic distribution of the Alaskan White River Ash, Geology 42, https://doi.org/10.1130/G35945.1, 875–878, 2014.
Jensen, B. J. L., Davies, L. D., Nolan, C., Pyne-O'Donnell, S., Monteath, A. J., Ponomareva, V., Portnyagin, M., Booth, R., Bursik, M., Cook, E., Plunkett, G., Vallance, J. W., Luo, Y., Cwynar, L. C., Hughes, P., and Pearson, G. D.: A latest Pleistocene and Holocene composite tephrostratigraphic framework for northeastern North America, Quaternary Sci. Rev., 272, 107242, https://doi.org/10.1016/j.quascirev.2021.107242, 2021.
Joos, F. and Spahni, R.: Rates of change in natural and anthropogenic radiative forcing over the past 20,000 years, P. Natl. Acad. Sci. USA, 105, 1425–1430, https://doi.org/10.1073/pnas.0707386105, 2008.
Jungclaus, J. H., Bard, E., Baroni, M., Braconnot, P., Cao, J., Chini, L. P., Egorova, T., Evans, M., González-Rouco, J. F., Goosse, H., Hurtt, G. C., Joos, F., Kaplan, J. O., Khodri, M., Klein Goldewijk, K., Krivova, N., LeGrande, A. N., Lorenz, S. J., Luterbacher, J., Man, W., Maycock, A. C., Meinshausen, M., Moberg, A., Muscheler, R., Nehrbass-Ahles, C., Otto-Bliesner, B. I., Phipps, S. J., Pongratz, J., Rozanov, E., Schmidt, G. A., Schmidt, H., Schmutz, W., Schurer, A., Shapiro, A. I., Sigl, M., Smerdon, J. E., Solanki, S. K., Timmreck, C., Toohey, M., Usoskin, I. G., Wagner, S., Wu, C.-J., Yeo, K. L., Zanchettin, D., Zhang, Q., and Zorita, E.: The PMIP4 contribution to CMIP6 – Part 3: The last millennium, scientific objective, and experimental design for the PMIP4 past1000 simulations, Geosci. Model Dev., 10, 4005–4033, https://doi.org/10.5194/gmd-10-4005-2017, 2017.
Kageyama, M., Braconnot, P., Harrison, S. P., Haywood, A. M., Jungclaus, J. H., Otto-Bliesner, B. L., Peterschmitt, J.-Y., Abe-Ouchi, A., Albani, S., Bartlein, P. J., Brierley, C., Crucifix, M., Dolan, A., Fernandez-Donado, L., Fischer, H., Hopcroft, P. O., Ivanovic, R. F., Lambert, F., Lunt, D. J., Mahowald, N. M., Peltier, W. R., Phipps, S. J., Roche, D. M., Schmidt, G. A., Tarasov, L., Valdes, P. J., Zhang, Q., and Zhou, T.: The PMIP4 contribution to CMIP6 – Part 1: Overview and over-arching analysis plan, Geosci. Model Dev., 11, 1033–1057, https://doi.org/10.5194/gmd-11-1033-2018, 2018.
Kerr, T. R., Swindles, G. T., and Plunkett, G.: Making hay while the sun shines? Socio-economic change, cereal production and climatic deterioration in early medieval Ireland, J. Archaeol. Sci., 36, 2868–2874, https://doi.org/10.1016/j.jas.2009.09.015, 2009.
Kim, W. M. and Raible, C. C.: The Community Earth System Model (CESM1.2.2) Ensemble Simulation (845–859 CE) for publication Mackay et al., 2022, Zenodo [data set], https://doi.org/10.5281/zenodo.6545625, 2022.
Kim, W. M., Blender, R., Sigl, M., Messmer, M., and Raible, C. C.: Statistical characteristics of extreme daily precipitation during 1501 BCE–1849 CE in the Community Earth System Model, Clim. Past, 17, 2031–2053, https://doi.org/10.5194/cp-17-2031-2021, 2021a.
Kim, W. M., Blender, R., Sigl, M., Messmer, M., and Raible, C. C.: Data for publication “Statistical characteristics of extreme daily precipitation during 1501 BCE–1849 CE in the Community Earth System Model”, Zenodo [data set], https://doi.org/10.5281/zenodo.5725495, 2021b.
Kinder, M., Wulf, S., Appelt, O., Hardiman, M., Żarczyński, M., and Tylmann, W.: Late-Holocene ultra-distal cryptotephra discoveries in varved sediments of Lake Żabińskie, NE Poland, J. Volcanol. Geoth. Res., 402, 106988, https://doi.org/10.1016/j.jvolgeores.2020.106988, 2020.
Kodisch, A., Wilde, P., Schmiedchen, B., Fromme, F.-J., Rodemann, B., Tratwal, A., oberforster, M., Wieser, F., Schiermann, A., Jorgensen, L. N., and Miedaner, T.: Ergot infection in winter rye hybrids shows differential contribution of male and female genotypes and environment, Euphytica, 216, 65, https://doi.org/10.1007/s10681-020-02600-2, 2020.
Kondrashov, D., Feliks, Y., and Ghil, M.: Oscillatory modes of extended Nile River records (A.D. 622–1922), Geophys. Res. Lett., 32, L10702, https://doi.org/10.1029/2004GL022156, 2005.
Kristensen, T. J., Beaudoin, A. B., and Ives, J. W.: Environmental and Hunter-Gatherer Responses to the White River Ash East Volcanic Eruption in the Late Holocene Canadian Subarctic, Arctic, 73, 153–186, 2020.
Ladd, M., Viau, A. E., Way, R. G., Gajewski, K., and Sawada, M. C.: Variations in precipitation in North America during the past 2000 years, The Holocene, 28, 667–675, https://doi.org/10.1177/0959683617735583, 2018.
Lerbekmo, J. F., Westgate, J. A., Smith, D. G. W., and Denton, G. H.: New data on the character and history of the White River volcanic eruption, Alaska, in: Quaternary studies, edited by: Suggate, R. P. and Cresswell, M. M., Royal Society of New Zealand, Wellington, 203–209, 1975.
Lerbekmo, J. F.: The White river ash: largest Holocene Plinian tephra, Can. J. Earth Sci., 45, 693–700, https://doi.org/10.1139/E08-023, 2008.
Ludlow, F.: The utility of the Irish Annals as a source for the reconstruction of the climate, unpublished PhD thesis, Trinity College Dublin, 2010.
Ludlow, F. and Manning, J. G.: Revolts under the Ptolemies: A paleoclimatic perspective, in: Revolt and resistance in the ancient classical world and the Near East: The crucible of empire, edited by: Collins, J. J. and Manning, J.G., Brill, Leiden, 154–171, ISBN: 978-90-04-33018-4, 2016.
Ludlow, F. and Manning, J. G.: Volcanic eruptions, veiled suns, and Nile failure in Egyptian history: Integrating hydroclimate into understandings of historical change, in: Climate change and ancient societies in Europe and the Near East: Diversity in collapse and resilience, edited by: Erdkamp, P., Manning, J. G., and Verboven K., Palgrave Macmillan, London, 301–320, ISBN: 978-3-030-81103-7, 2021.
Ludlow, F., Stine, A. R., Leahy, P., Murphy, E., Mayewski, P. A., Taylor, D., Killen, J., Baillie, M. G. L., Hennessy, M., and Kiely, G.: Medieval Irish chronicles reveal persistent volcanic forcing of severe winter cold events, 431–1649 CE, Environ. Res. Lett., 8, 024035, https://doi.org/10.1088/1748-9326/8/2/024035, 2013
Mackay, H., Hughes, P. D. M., Jensen, B. J. L., Langdon, P. G., Pyne-O'Donnell, S., Plunkett, G., Froese, D. G., and Coulter, S.: The foundations of a late Holocene tephrostratigraphic framework for eastern North America, Quaternary Sci. Rev. 132, 101–113, https://doi.org/10.1016/j.quascirev.2015.11.011, 2016.
Mackay, H., Amesbury, M. J., Langdon, P. G., Charman, D. J., Magnan, G., van Bellen, S., Garneau, M., Bainbridge, R., and Hughes, P. D.: Spatial variation of hydroclimate in north-eastern North America during the last millennium, Quaternary Sci. Rev., 256, 106813, https://doi.org/10.1016/j.quascirev.2021.106813, 2021.
Mackay, H., Amesbury, M. J., Langdon, P. G., Charman, D. J., Magnan, G., van Bellen, S., Garneau, M., Bainbridge, R., and Hughes, P. D.: Neotoma Dataset 51434, Framboise Bog, Testate amoebae Dataset – Neotoma Testate Amoebae Database [data set], https://doi.org/10.21233/B7SC-4515, 2022a.
Mackay, H., Amesbury, M. J., Langdon, P. G., Charman, D. J., Magnan, G., van Bellen, S., Garneau, M., Bainbridge, R., and Hughes, P. D.: Neotoma Dataset 51436, Jefferys Bog, Testate amoebae Dataset – Neotoma Testate Amoebae Database [data set], https://doi.org/10.21233/VBAE-XM49, 2022b.
Mackay, H., Amesbury, M. J., Langdon, P. G., Charman, D. J., Magnan, G., van Bellen, S., Garneau, M., Bainbridge, R., and Hughes, P. D.: Neotoma Dataset 51438, Petite Bog, Testate amoebae Dataset – Neotoma Testate Amoebae Database [data set], https://doi.org/10.21233/0FNY-EP27, 2022c.
Mackay, H., Amesbury, M. J., Langdon, P. G., Charman, D. J., Magnan, G., van Bellen, S., Garneau, M., Bainbridge, R., and Hughes, P. D.: Neotoma Dataset 51758, Villagedale, Testate amoebae Dataset – Neotoma Testate Amoebae Database [data set], https://doi.org/10.21233/P27F-GH47, 2022d.
Mackay, H., Amesbury, M. J., Langdon, P. G., Charman, D. J., Magnan, G., van Bellen, S., Garneau, M., Bainbridge, R., and Hughes, P. D.: Neotoma Dataset 51756, Sidney Bog, Testate amoebae Dataset – Neotoma Testate Amoebae Database [data set], https://doi.org/10.21233/RCPG-WB72, 2022e.
Mackay, H., Amesbury, M. J., Langdon, P. G., Charman, D. J., Magnan, G., van Bellen, S., Garneau, M., Bainbridge, R., and Hughes, P. D.: Neotoma Dataset 51725, Saco Bog, Testate amoebae Dataset – Neotoma Testate Amoebae Database [data set], https://doi.org/10.21233/12S2-FD03, 2022f.
Maeno, F., Nakada, S., Yoshimoto, M., Shimano, T., Hokanishi, N., Zaennudin, A., and Iguchi, M.: A sequence of a plinian eruption preceded by dome destruction at Kelud volcano, Indonesia, on February 13, 2014, revealed from tephra fallout and pyroclastic density current deposits, J. Volcanol. Geoth. Res., 382, 24–41, https://doi.org/10.1016/j.jvolgeores.2017.03.002, 2019.
Mann, M. E., Zhang, Z., Hughes, M. K., Bradley, R. S., Miller, S. K., Rutherford, S., and Ni, F.: Proxy-based reconstructions of hemispheric and global surface temperature variations over the past two millennia, P. Natl. Acad. Sci. USA, 105, 13252–13257, https://doi.org/10.1073/pnas.0805721105, 2008.
Mann, M. E., Zhang, Z., Rutherford, S., Bradley, R. S., Hughes, M. K., Shindell, D., Ammann, C., Faluvegi, G., and Ni, F.: Global signatures and dynamical origins of the Little Ice Age and Medieval Climate Anomaly, Science, 326, 1256–1260, https://doi.org/10.1126/science.1177303, 2009.
Manning, J. G., Ludlow, F., Stine, A. R., Boos, W. R., Sigl, M., and Marlon, J. R.: Volcanic suppression of Nile summer flooding triggers revolt and constrains interstate conflict in ancient Egypt, Nat. Commun., 8, 900, https://doi.org/10.1038/s41467-017-00957-y, 2017.
Marlon, J. R., Pederson, N., Nolan, C., Goring, S., Shuman, B., Robertson, A., Booth, R., Bartlein, P. J., Berke, M. A., Clifford, M., Cook, E., Dieffenbacher-Krall, A., Dietze, M. C., Hessl, A., Hubeny, J. B., Jackson, S. T., Marsicek, J., McLachlan, J., Mock, C. J., Moore, D. J. P., Nichols, J., Peteet, D., Schaefer, K., Trouet, V., Umbanhowar, C., Williams, J. W., and Yu, Z.: Climatic history of the northeastern United States during the past 3000 years, Clim. Past, 13, 1355–1379, https://doi.org/10.5194/cp-13-1355-2017, 2017.
Marshall, L., Johnson, J. S., Mann, G. W., Lee, L., Dhomse, S. S., Regayre, L., Yoshioka, M., Carslaw, K. S., and Schmidt, A.: Exploring how eruption source parameters affect volcanic radiative forcing using statistical emulation, J. Geophys. Res.-Atmos., 124, 964–985, https://doi.org/10.1029/2018JD028675, 2019.
Marshall, L. R., Smith, C. J., Forster, P. M., Aubry, T. J., Andrews, T., and Schmidt, A.: Large variations in volcanic aerosol forcing efficiency due to eruption source parameters and rapid adjustments, Geophys. Res. Lett., 47, e2020GL090241, https://doi.org/10.1029/2020GL090241, 2020.
McCarthy, D.: The Irish Annals: their genesis, evolution and history, Four Courts Press, Dublin, https://doi.org/10.1017/S0021121400005940, 2008.
McCarthy, D. and Breen, A.: An evaluation of astronomical observations in the Irish annals, Vistas Astron., 41, 117–138, https://doi.org/10.1016/S0083-6656(96)00052-9, 1997.
McConnell, J. R., Sigl, M., Plunkett, G., Burke, A., Kim, W. M., Raible, C. C., Wilson, A. I., Manning, J. G., Ludlow, F., Chellman, N. J., and Innes, H. M.: Extreme climate after massive eruption of Alaska's Okmok volcano in 43 BCE and effects on the late Roman Republic and Ptolemaic Kingdom, P. Natl. Acad. Sci. USA, 117, 15443–15449, https://doi.org/10.1073/pnas.2002722117, 2020.
McLaughlin, R., Hannah, E., and Coyle-McClung, L.: Frequency analyses of historical and archaeological datasets reveal the same pattern of declining sociocultural activity in 9th to 10th century CE Ireland, Cliodynamics, 9, 1–24, https://doi.org/10.21237/C7clio9136654, 2018.
McLaughlin, T. R.: An archaeology of Ireland for the Information Age, Emania, 25, 7–29, 2020.
Meklach Y., Camenisch C., Merzouki A., and García-Herrera R.: Potential of Arabic documentary sources for reconstructing past climate in the western Mediterranean region from AD 680 to 1815, The Holocene, 31, 1662–1669, https://doi.org/10.1177/09596836211033202, 2021.
Melesse, A. M. (Ed.), Bekele, S., and McCornick, P.: Hydrology of the Niles in the face of land-use and climate dynamics, in Nile River Basin: Hydrology, Climate and Water Use, Springer Nature, Heidelberg, vii–xvii, ISBN: 9789400706880, 2011.
Ménégoz, M., Cassou, C., Swingedouw, D., Ruprich-Robert, Y., Bretonnière, P. A., and Doblas-Reyes, F.: Role of the Atlantic Multidecadal Variability in modulating the climate response to a Pinatubo-like volcanic eruption, Clim. Dynam., 51, 1863–1883, https://doi.org/10.1007/s00382-017-3986-1, 2018.
Mitchell, E. A., Charman, D. J., and Warner, B. G.: Testate amoebae analysis in ecological and paleoecological studies of wetlands: past, present and future, Biodivers. Conserv., 17, 2115–2137, https://doi.org/10.1007/s10531-007-9221-3, 2008.
Monteath, A. J., Teuten, A. E., Hughes, P. D. M., and Wastegård, S.: The effects of the peat acid digestion protocol on geochemically and morphologically diverse tephra deposits, J. Quaternary Sci. 34, 269–274, https://doi.org/10.1002/jqs.3104, 2019.
Muhs, D. R. and Budahn, J. R.: Geochemical evidence for the origin of late Quaternary loess in central Alaska, Can. J. Earth Sci., 43, 323–337, https://doi.org/10.1139/e05-115, 2006.
Mullen, P. O.: An archaeological test of the effects of the White River Ash eruptions, Arctic Anthropol., 49, 35–44, https://doi.org/10.1353/arc.2012.0013, 2012.
Neely III, R. R., Conley, A. J., Vitt, F., and Lamarque, J.-F.: A consistent prescription of stratospheric aerosol for both radiation and chemistry in the Community Earth System Model (CESM1), Geosci. Model Dev., 9, 2459–2470, https://doi.org/10.5194/gmd-9-2459-2016, 2016.
Neukom, R., Steiger, N., Gómez-Navarro, J. J., Wang, J., and Werner, J. P.: No evidence for globally coherent warm and cold periods over the preindustrial Common Era, Nature, 571, 550–554, https://doi.org/10.1038/s41586-019-1401-2, 2019.
Newfield, T.: The contours of disease and hunger in Carolingian and early Ottonian Europe (c.750-c.950 CE), unpublished PhD thesis, McGill University, 2010.
Newfield, T.: The contours, frequency and causation of subsistence crises in Carolingian Europe (750–950), in: Crisis alimentarias en la Edad Media: Modelos, explicaciones y representaciones, edited by: Benito i Monclús, P., Milenio, Lleida, 117–172, 2013.
Oman, L., Robock, A., Stenchikov, G. L., and Thordarson, T.: High-latitude eruptions cast shadow over the African monsoon and the flow of the Nile, Geophys. Res. Lett., 33, L18711, https://doi.org/10.1029/2006GL027665, 2006.
Oppenheimer, C., Wacker, L., Xu, J., Galvan, J. D., Stoffel, M., Guillet, S., Corona, C., Sigl, M., Di Cosmo, N., Hajdas, I., Pan, B., Breuker, R., Schneider, L., Esper, J., Fei, J., Hammond, J. O. S., and Büntgen, U.: Multi-proxy dating the “Millennium Eruption” of Changbaishan to late 946 CE, Quaternary Sci. Rev., 158, 164–171, https://doi.org/10.1016/j.quascirev.2016.12.024, 2017.
Oppenheimer, C., Orchard, A., Stoffel, M., Newfield, T. P., Guillet, S., Corona, C., Sigl, M., Di Cosmo, N., and Büntgen, U.: The Eldgjá eruption: timing, long-range impacts and influence on the Christianisation of Iceland, Climatic Change, 147, 369–381, https://doi.org/10.1007/s10584-018-2171-9, 2018.
Patterson, R. T., Crann, C. A., Cutts, J. A., Mustaphi, C. J. C., Nasser, N. A., Macumber, A. L., Galloway, J. M., Swindles, G. T., and Falck, H.: New occurrences of the White River Ash (east lobe) in Subarctic Canada and utility for estimating freshwater reservoir effect in lake sediment archives, Palaeogeogr. Palaeocl., 477, 1–9, https://doi.org/10.1016/j.palaeo.2017.03.031, 2017.
Payne, R. and Blackford, J.: Distal volcanic impacts on peatlands: palaeoecological evidence from Alaska, Quaternary Sci. Rev., 27, 2012–2030, https://doi.org/10.1016/j.quascirev.2008.08.002, 2008.
Payne, R. J. and Mitchell, E. A.: How many is enough? Determining optimal count totals for ecological and palaeoecological studies of testate amoebae, J. Paleolimnol., 42, 483–495, https://doi.org/10.1007/s10933-008-9299-y, 2009.
Pilcher, J. R., Hall, V. A., and McCormac, F. G.: An outline tephrochronology for the Holocene of the north of Ireland, J. Quaternary Sci., 11, 485–494 https://doi.org/10.1002/(SICI)1099-1417(199611/12)11:6<485::AID-JQS266>3.0.CO;2-T, 1996.
Pyle, D. M.: The thickness, volume and grainsize of tephra fall deposits, B. Volcanol., 51, 1–15, https://doi.org/10.1007/BF01086757, 1989.
Pyne O'Donnell, S. D. F., Hughes, P. D. M., Froese, D. G., Jensen, B. J. L., Kuehn, S. C., Mallon, G., Amesbury, M. J., Charman, D. J., Daley, T. J., Loader, N. J., Mauquoy, D., Street-Perrott, F.A., and Woodman-Ralph, J.: High-precision ultra-distal Holocene tephrochronology in North America, Quaternary Sci. Rev., 52, 6–11, https://doi.org/10.1016/j.quascirev.2012.07.024, 2012.
Raible, C. C., Broennimann, S., Auchmann, R., Brohan, P., Froelicher, T. L., Graf, H. F., Jones, P., Luterbacher, J., Muthers, S., Neukom, R., Robock, A., Self, S., Sudrajat, A., Timmreck, C., and Wegmann, M.: Tambora 1815 as a test case for high impact volcanic eruptions: Earth system effects, WIREs Clim Change, 7, 569–589, https://doi.org/10.1002/wcc.407, 2016.
Rainville, R. A.: Effects of the White River and Mazama tephras on terrestrial and aquatic palaeoenvironments in western Subarctic Canada, and implications for past human populations, PhD dissertation, University of Calgary, http://hdl.handle.net/11023/2740 (last access: 12 May 2022), 2016.
Reimer, P. J., Austin, W. E. N., Bard, E., Bayliss, A., Blackwell, P. G., Bronk Ramsey, C., Butzin, M., Cheng, H., Edwards, R. L., Friedrich, M., Grootes, P. M., Guilderson, T. P., Hajdas, I., Heaton, T. J., Hogg, A. G., Hughen, K. A., Kromer, B., Manning, S. W., Muscheler, R., Palmer, J. G., Pearson, C., van der Plicht, J., Reimer, R. W., Richards, D. A., Scott, E. M., Southon, J. R., Turnery, C. S. M., Wacker, L., Adolphi, F., Büntgen, U., Capano, M., Fahrni, S. M., Fogtmann-Schulz, A., Friedrich, R., Kohler, P., Kudsk, S., Miyake, F., Olsen, J., Reinig, F., Sakamoto, M., Sookdeo, A., and Talamo, S.: The IntCal20 northern hemisphere radiocarbon age calibration curve (0–55 cal kBP), Radiocarbon, 62, 725–757, https://doi.org/10.1017/RDC.2020.41, 2020.
Richter, D. H., Preece, S. J., McGimsey, R. G., and Westgate, J. A.: Mount Churchill, Alaska: The source of the late Holocene White River Ash, Can. J. Earth Sci., 32, 741–748, https://doi.org/10.1139/e95-063, 1995.
Robock, A. and Liu, Y.: The volcanic signal in Goddard Institute for Space Studies three-dimensional model simulations, J. Climate, 7, 44–55, https://doi.org/10.1175/1520-0442(1994)007<0044:TVSIGI>2.0.CO;2, 1994.
Said, R.: The River Nile: Geology, Hydrology and Utilization, Oxford, https://doi.org/10.1002/(SICI)1099-1646(199611)12:6<633::AID-RRR383>3.0.CO;2-D, 1993.
Schmidt, A., Mills, M. J., Ghan, S., Gregory, J. M., Allan, R. P., Andrews, T., Bardeen, C. G., Conley, A., Forster, P. M., Gettelman, A., and Portmann, R. W.: Volcanic radiative forcing from 1979 to 2015, J. Geophys. Res.-Atmos., 123, 12491–12508, https://doi.org/10.1029/2018JD028776, 2018.
Schneider, T., Bischoff, T., and Płotka, H.: Physics of changes in synoptic midlatitude temperature variability, J. Climate, 28, 2312–2331, https://doi.org/10.1175/JCLI-D-14-00632.1, 2015.
Shuman, B. N., Routson, C., McKay, N., Fritz, S., Kaufman, D., Kirby, M. E., Nolan, C., Pederson, G. T., and St-Jacques, J.-M.: Placing the Common Era in a Holocene context: millennial to centennial patterns and trends in the hydroclimate of North America over the past 2000 years, Clim. Past, 14, 665–686, https://doi.org/10.5194/cp-14-665-2018, 2018.
Sigl, M., McConnell, J. R., Layman, L., Maselli, O., McGwire, K., Pasteris, D., Dahl-Jensen, D., Steffensen, J. P., Vinther, B., Edwards, R., and Mulvaney, R.: A new bipolar ice core record of volcanism from WAIS Divide and NEEM and implications for climate forcing of the last 2000 years, J. Geophys. Res.-Atmos., 118, 1151–1169, https://doi.org/10.1029/2012JD018603, 2013.
Sigl, M., McConnell, J. R., Toohey, M., Curran, M., Das, S. B., Edwards, R., Isaksson, E., Kawamura, K., Kipfstuhl, S., Kruger, K., Layman, L., Maselli, O. J., Motizuki, Y., Motoyama, H., Pasteris, D. R., and Severi, M.: Insights from Antarctica on volcanic forcing during the Common Era, Nat. Clim. Change, 4, 693–697, https://doi.org/10.1038/nclimate2293, 2014.
Sigl, M., Winstrup, M., McConnell, J. R., Welten, K. C., Plunkett, G., Ludlow, F., Büntgen, U., Caffee, M., Chellman, N., Dahl-Jensen, D., Fischer, H., Kipfstuhl, S., Kostick, C., Maselli, O. J., Mekhaldi, F., Mulvaney, R., Muscheler, R., Pasteris, D. R., Pilcher, J. R., Salzer, M., Schupbach, S., Steffensen, J. P., Vinther, B. M., and Woodruff, T. E.: Timing and climate forcing of volcanic eruptions for the past 2,500 years, Nature, 523, 543–549, https://doi.org/10.1038/nature14565, 2015.
Sigl, M., Toohey, M., McConnell, J. R., Cole-Dai, J., and Severi, M.: HolVol: Reconstructed volcanic stratospheric sulfur injections and aerosol optical depth for the Holocene (9500 BCE to 1900 CE), PANGAEA [data set], https://doi.org/10.1594/PANGAEA.928646, 2021.
Singh, R., Tsigaridis, K., LeGrande, A. N., Ludlow, F., and Manning, J. G.: Investigating hydroclimatic impacts of the 168–158 BCE volcanic quartet and their relevance to the Nile River basin and Egyptian history, Clim. Past Discuss. [preprint], https://doi.org/10.5194/cp-2022-25, in review, 2022.
Somers, R. M.: The End of the T’ang, in: The Cambridge History of China, edited by: Twitchett, D., Cambridge University Press, Cambridge, 682–789, 1979.
Staunton-Sykes, J., Aubry, T. J., Shin, Y. M., Weber, J., Marshall, L. R., Luke Abraham, N., Archibald, A., and Schmidt, A.: Co-emission of volcanic sulfur and halogens amplifies volcanic effective radiative forcing, Atmos. Chem. Phys., 21, 9009–9029, https://doi.org/10.5194/acp-21-9009-2021, 2021.
Stenchikov, G., Hamilton, K., Stouffer, R., Robock, A., Ramaswamy, V., Santer, B., and Graf, H.: Arctic oscillation response to volcanic eruptions in the IPCC AR4 climate models, J. Geophys. Res, 111, D07107, https://doi.org/10.1029/2005JD006286, 2006.
Stoffel, M., Khodri, M., Corona, C., Guillet, S., Poulain, V., Bekki, S., Guiot, J., Luckman, B.H., Oppenheimer, C., Lebas, N., Beniston, M., and Masson-Delmotte, V.: Estimates of volcanic-induced cooling in the Northern Hemisphere over the past 1,500 years, Nat. Geosci., 8, 784–788, https://doi.org/10.1038/ngeo2526, 2015.
Sun, C., Plunkett, G., Liu, J., Zhao, H., Sigl, M., McConnell, J. R., Pilcher, J. R., Vinther, B., Steffensen, J. P., and Hall, V.: Ash from Changbaishan Millennium eruption recorded in Greenland ice: Implications for determining the eruption's timing and impact, Geophys. Res. Lett., 41, 694–701, https://doi.org/10.1002/2013GL058642, 2014.
Swindles, G. T., Blundell, A., Roe, H. M., and Hall, V. A.: A 4500-year proxy climate record from peatlands in the North of Ireland: the identification of widespread summer `drought phases'?, Quaternary Sci. Rev., 29, 13–14, https://doi.org/10.1016/j.quascirev.2009.01.003, 2010.
Swindles, G. T., Morris, P. J., Baird, A. J., Blaauw, M., and Plunkett, G.: Ecohydrological feedbacks confound peat-based climate reconstructions, Geophys. Res. Lett., 39, L11401, https://doi.org/10.1029/2012GL051500, 2012.
Swindles, G. T., Holden, J., Raby, C. L., Turner, T. E., Blundell, A., Charman, D. J., Menberu, M. W., and Kløve, B.: Testing peatland water-table depth transfer functions using high-resolution hydrological monitoring data, Quaternary Sci. Rev., 120, 107–117, https://doi.org/10.1016/j.quascirev.2015.04.019, 2015.
Thomason, L. W., Ernest, N., Millán, L., Rieger, L., Bourassa, A., Vernier, J.-P., Manney, G., Luo, B., Arfeuille, F., and Peter, T.: A global space-based stratospheric aerosol climatology: 1979–2016, Earth Syst. Sci. Data, 10, 469–492, https://doi.org/10.5194/essd-10-469-2018, 2018.
Timmreck, C., Toohey, M., Zanchettin, D., Brönnimann, S., Lundstad, E., and Wilson, R.: The unidentified eruption of 1809: a climatic cold case, Clim. Past, 17, 1455–1482, https://doi.org/10.5194/cp-17-1455-2021, 2021.
Toohey, M. and Sigl, M.: Volcanic stratospheric sulfur injections and aerosol optical depth from 500 BCE to 1900 CE, Earth Syst. Sci. Data, 9, 809–831, https://doi.org/10.5194/essd-9-809-2017, 2017.
Toohey, M., Stevens, B., Schmidt, H., and Timmreck, C.: Easy Volcanic Aerosol (EVA v1.0): an idealized forcing generator for climate simulations, Geosci. Model Dev., 9, 4049–4070, https://doi.org/10.5194/gmd-9-4049-2016, 2016.
Toohey, M., Krüger, K., Schmidt, H., Timmreck, C., Sigl, M., Stoffel, M., and Wilson, R.: Disproportionately strong climate forcing from extratropical explosive volcanic eruptions, Nat. Geosci., 12, 100–107, https://doi.org/10.1594/WDCC/eVolv2k_v2, 2019.
Usoskin, I. G., Hulot, G., Gallet, Y., Roth, R., Licht, A., Joos, F., Kovaltsov, G. A., Thébault, E., and Khokhlov, A.: Evidence for distinct modes of solar activity, Astron. Astrophys., 562, L10, https://doi.org/10.1051/0004-6361/201423391, 2014.
Usoskin, I. G., Gallet, Y., Lopes, F., Kovaltsov, G. A., and Hulot, G.: Solar activity during the Holocene: the Hallstatt cycle and its consequence for grand minima and maxima, Astron. Astrophys., 587, A150, https://doi.org/10.1051/0004-6361/201527295, 2016.
Vernier, J.-P., Fairlie, T. D., Deshler, T., Natarajan, M., Knepp, T., Foster, K., Wienhold, F. G., Bedka, K. M., Thomason, L., and Trepte, C.: In situ and space-based observations of the Kelud volcanic plume: The persistence of ash in the lower stratosphere, J. Geophys. Res.-Atmos., 121, 11104–11118, https://doi.org/10.1002/2016JD025344, 2016.
Vieira, L. E. A., Solanki, S. K., Krivova, N. A., and Usoskin, I.: Evolution of the solar irradiance during the Holocene, Astron. Astrophys., 531, A6, https://doi.org/10.1051/0004-6361/201015843, 2011.
Vinther, B. M., Clausen, H. B., Johnsen, S. J., Rasmussen, S. O., Andersen, K. K., Buchardt, S. L., Dahl-Jensen, D., Seierstad, I. K., Siggaard-Andersen, M.-L., Steffensen, J. P., Svensson, A., Olsen, J., and Heinemeier, J.: A synchronized dating of three Greenland ice cores throughout the Holocene, J. Geophys. Res., 111, D13102, https://doi.org/10.1029/2005JD006921, 2006.
Wade, D. C., Vidal, C. M., Abraham, N. L., Dhomse, S., Griffiths, P. T., Keeble, J., Mann, G., Marshall, L., Schmidt, A., and Archibald, A. T.: Reconciling the climate and ozone response to the 1257 CE Mount Samalas eruption, P. Natl. Acad. Sci. USA, 117, 26651–26659, https://doi.org/10.1073/pnas.1919807117, 2020.
Watson, E. J., Kołaczek, P., Słowiński, M., Swindles, G. T., Marcisz, K., Gałka, M., and Lamentowicz, M.: First discovery of Holocene Alaskan and Icelandic tephra in Polish peatlands, J. Quaternary Sci. 32, 457–462, https://doi.org/10.1002/jqs.2945, 2017a.
Watson, E. J., Swindles, G. T., Lawson, I. T., Savov, I. P., and Wastegård, S.: The presence of Holocene cryptotephra in Wales and southern England, J. Quaternary Sci., 32, 493–500, https://doi.org/10.1002/jqs.2942, 2017b.
West, K. D. and Donaldson, J. A.: Evidence for winter eruption of the White River Ash (eastern lobe), Yukon Territory, Canada, 29 May–2 June 2000, Geocanada 2000 – The Millennium Geoscience Summit, Conference CD, 2000.
White, S., Moreno-Chamarro, E., Zanchettin, D., Huhtamaa, H., Degroot, D., Stoffel, M., and Corona, C.: The 1600 CE Huaynaputina eruption as a possible trigger for persistent cooling in the North Atlantic region, Clim. Past, 18, 739–757, https://doi.org/10.5194/cp-18-739-2022, 2022.
Wilson, R., Anchukaitis, K., Briffa, K. R., Büntgen, U., Cook, E., D'Arrigo, R., Davi, N., Esper, J., Frank, D., Gunnarson, B., Hegerl, G., Helama, D., Klesse, S., Krusic, P. J., Linderholm, H. W., Myglan, V., Osborn, T. J., Rydval, M., Schneider, L., Schurer, A., Wiles, G., Zhang, P., and Zorita, E.: Last millennium northern hemisphere summer temperatures from tree rings: Part 1: The long term context, Quaternary Sci. Rev., 138, 1–18, https://doi.org/10.1016/j.quascirev.2015.12.005, 2016.
Woodland, W. A., Charman, D. J., and Sims, P. C.: Quantitative estimates of water tables and soil moisture in Holocene peatlands from testate amoebae, Holocene, 8, 261–273, https://doi.org/10.1191/095968398667004497, 1998.
Zhang, D.: Zhongguo san qian nian qi xiang ji lu zong ji (Nanjing 2004), 1, Nanjing Shi, 363–364, ISBN: 7806434682, 2004.
Zhong, Y., Jahn, A., Miller, G. H., and Geirsdottir, A.: Asymmetric Cooling of the Atlantic and Pacific Arctic During the Past Two Millennia: A Dual Observation-Modeling Study, Geophys. Res. Lett., 45, 12497–12505, https://doi.org/10.1029/2018GL079447, 2018.
Zhu, Y., Toon, O. B., Jensen, E. J., Bardeen, C. G., Mills, M. J., Tolbert, M. A., Yu, P., and Woods, S.: Persisting volcanic ash particles impact stratospheric SO2 lifetime and aerosol optical properties, Nat. Commun., 11, 4526, https://doi.org/10.1038/s41467-020-18352-5, 2020.
Zhuo, Z., Gao, C., and Pan, Y.: Proxy evidence for China's monsoon precipitation response to volcanic aerosols over the past seven centuries, J. Geophys. Res.-Atmos., 119, 6638–6652, https://doi.org/10.1002/2013JD021061, 2014.
- Abstract
- Introduction
- Methods
- Results
- Discussion
- Conclusions
- Appendix A: Additional methodological information to support the forcing potential reconstructions (Sect. 2.2)
- Appendix B: Additional methodological information to support the climate model simulations (Sect. 2.3)
- Appendix C: Additional methodological information to support the NH tree-ring summer temperature reconstructions (Sect. 2.4)
- Appendix D: Peatland chronologies
- Appendix E: Composite testate amoebae-inferred peatland water table record from Sidney Bog, Maine
- Appendix F: Tree-ring-inferred NH summer temperature anomalies
- Appendix G: Eruption information for tree-ring-inferred coldest years between 500 and 2000 CE
- Appendix H: Climate model simulations of NH summer and winter precipitation anomalies between 856–858 CE
- Appendix I: NGRIP1 δ18O isotopes temperature reconstruction (9th century)
- Code availability
- Data availability
- Author contributions
- Competing interests
- Disclaimer
- Special issue statement
- Acknowledgements
- Financial support
- Review statement
- References