the Creative Commons Attribution 4.0 License.
the Creative Commons Attribution 4.0 License.
 | 27 Jun 2022
A 334-year coral record of surface temperature and salinity variability in the greater Agulhas Current region
Takaaki K. Watanabe
Siren Rühs
Miriam Pfeiffer
Stefan Grab
Dieter Garbe-Schönberg
Arne Biastoch
The Agulhas Current (AC) off the southern tip of Africa is one of the strongest western boundary currents and a crucial choke point of inter-ocean heat and salt exchange between the Indian Ocean and the southern Atlantic Ocean. However, large uncertainties remain concerning the sea surface temperature (SST) and salinity (SSS) variability in the AC region and their driving mechanisms over longer timescales, due to only short observational datasets being available and the highly dynamic nature of the region. Here, we present an annual coral skeletal composite record paired with an established composite oxygen isotope record from Ifaty and Tulear reefs in southwestern Madagascar to obtain a 334-year (1661–1995) reconstruction of δ18Oseawater changes related to surface salinity variability in the wider Agulhas Current region. Our new annual δ18Oseawater composite record from Ifaty traces surface salinity of the southern Mozambique Channel and AC core region from the SODA reanalysis between 1958 and 1995. δ18Oseawater appears to be mainly driven by large-scale wind forcing in the southern Indian Ocean on interannual to decadal timescales. The δ18Oseawater and SST at Ifaty show characteristic interannual variability of between 2 and 4 years and interdecadal variability of 8 to 16 years, coherent with El Niño–Southern Oscillation (ENSO) records. Lagged correlations with the multivariate ENSO index reveals a 1–2-year lag of δ18Oseawater and salinity at Ifaty and the AC region, suggesting that propagation of anomalies by ocean Rossby waves may contribute to salinity changes in the wider southwestern Indian Ocean. The δ18Oseawater and SST reconstructions at Ifaty reveal the highest interannual variability during the Little Ice Age, especially around 1700 CE, which is in agreement with other Indo-Pacific coral studies. Our study demonstrates the huge potential to unlock past interannual and decadal changes in surface ocean hydrology and ocean transport dynamics from coral δ18Oseawater beyond the short instrumental record.
- Article
(12289 KB) - Full-text XML
-
Supplement
(5970 KB) - BibTeX
- EndNote


The greater Agulhas Current (AC) system off the southern tip of Africa is a crucial choke point of the global thermohaline circulation through inter-ocean heat and salt exchange between the Indian Ocean and the southern Atlantic Ocean via the so-called Agulhas Leakage (AL), thereby influencing the variability of the Atlantic meridional overturning circulation (hereafter AMOC; Peeters et al., 2004; Beal et al., 2011; Biastoch et al., 2009, 2015). Paleoclimate studies have pointed to the importance of the AL on glacial–interglacial timescales and suggested a vital role of the AL in steering the AMOC variability on millennial timescales (Peeters et al., 2004; Simon et al., 2013). The inter-ocean exchange of heat and salt via the AL is dynamically excited through the mean flow and vigorous mesoscale ocean eddies and filaments, which are shed into the southern Atlantic at the Agulhas Retroflection (AR; Fig. 1; Biastoch et al., 2015). The sea surface temperature (SST) and salinity (SSS) variability in the AC, which feeds the AL, are suggested to be related to upstream wind and current variability in the southern Indian Ocean (Backeberg and Reason, 2010; Biastoch et al., 2008, 2009, 2015; Rouault et al., 2009). There is evidence from satellite altimetry observations that mesoscale variability upstream of the AC has strengthened since 1993, resulting in accelerated eddy propagation into the AC and AR regions (Backeberg et al., 2012). This is related to enhanced ocean current transport in response to an increase in wind stress curl in the southern Indian Ocean trade winds (Backeberg et al., 2012). AC and southern Mozambique Channel historical SST have increased since the early 1980s, even though sensible and latent heat flux from the ocean to the atmosphere also increased and consequently should have cooled the surface ocean (McClanahan et al., 2008; Rouault et al., 2009). High-resolution regional ocean modeling, paired with observational estimates, suggest that increased oceanic heat advection by large-scale currents in the southern Indian Ocean has contributed to the increase in SST of the AC, thereby largely offsetting the turbulent heat flux (Rouault et al., 2009). Recently, it has been suggested that current rapid Indian Ocean warming can play a role in sustaining the AMOC through remote impacts on the Walker circulation, thereby affecting surface salinity in the tropical Atlantic (Hu and Fedorov, 2019). Indian Ocean warming and strengthening of the AMOC are shown to also operate in models driven by future greenhouse gas (CO2) emission increases (Hu and Fedorov, 2019). However, large uncertainties remain concerning the role of large-scale atmospheric circulation (wind and sea level pressure) on SST and SSS over longer timescales and their influence on AC SST and SSS variability due to the short length of available observational datasets and the highly dynamic nature of the region (Rouault et al., 2009; Backeberg and Reason, 2010).
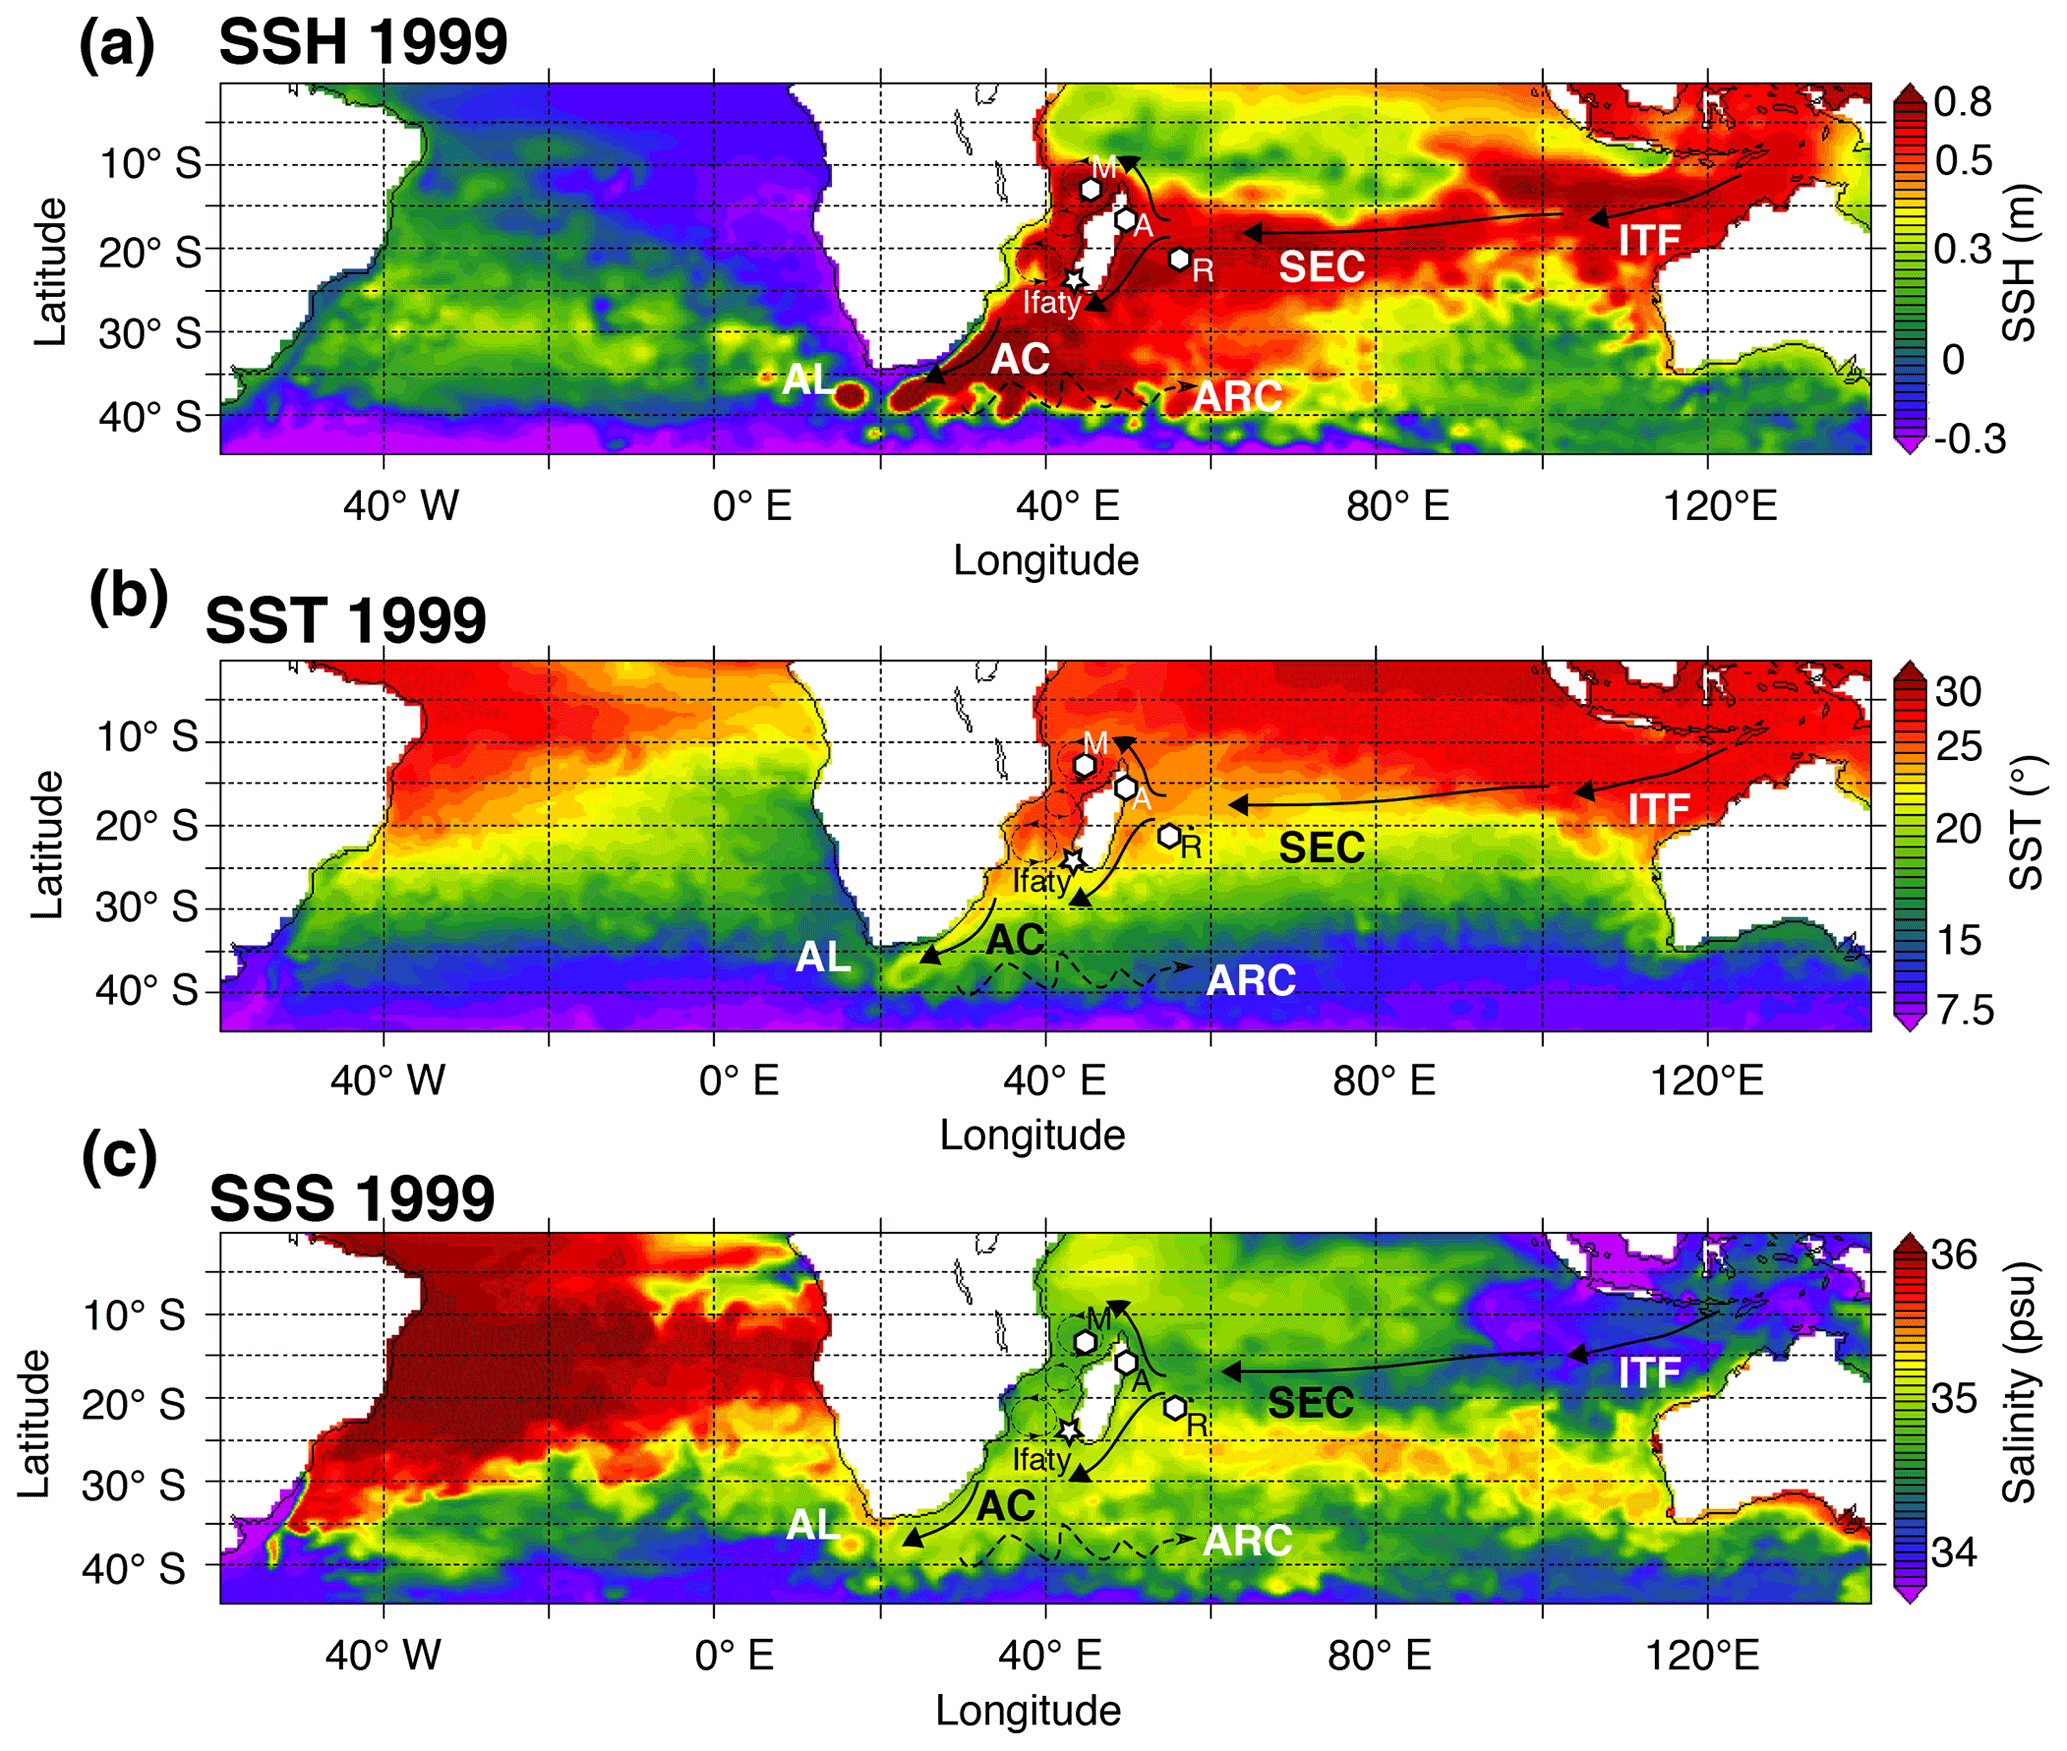
Figure 1Surface ocean connectivity between southwestern Madagascar and the Agulhas Current. (a) Sea surface height (SSH), (b) temperature (SST) and (c) salinity (SSS) across the southern Indian Ocean and Atlantic Ocean from SODA reanalysis for August 1999 (Giese and Ray, 2011). The star marks the location of our study location at the Ifaty and Tulear coral reefs. White polygons indicate the locations of coral records used in comparison to the Ifaty–Tulear reconstruction: M is Mayotte, A is Antongil Bay, and R is La Réunion. AC stands for Agulhas Current, AL stands for Agulhas Leakage, ARC stands for Agulhas Return Current, SEC stands for South Equatorial Current, and ITF stands for Indonesian Throughflow. Mozambique Channel mesoscale eddies are indicated by dashed circles.
On interannual timescales, the AC and AL region is apparently sensitive to the El Niño–Southern Oscillation (ENSO), with a 24-month lag (Putrasahan et al., 2016; Elipot and Beal, 2018; Paris and Subrahmanyam, 2018; Trott et al., 2021). Anomalous wind stress curl in the southern Indian Ocean in response to ENSO excites the westward propagating oceanic Rossby waves (Feng and Myers, 2003; Palastanga et al., 2006; Grunseich et al., 2011). These Rossby waves in turn modulate the transport of heat and salinity anomalies across a tropical (12∘ S) and subtropical (25∘ S) pathway (Putrasahan et al., 2016). Concomitant El Niño and positive Indian Ocean dipole (IOD) events lead to freshening in the equatorial Indian Ocean and saltier anomalies off Sumatra and vice versa for La Niña and negative IOD events (Grunseich et al., 2011). Although Grunseich et al. (2011) argue that freshening during El Niño and positive IOD may reach the far reaches of the southwestern Indian Ocean, their study used salinity from SODA reanalysis since 1870, which is currently not validated against other salinity products or paleoclimate reconstructions (Giese and Ray, 2011). Rainfall variability over southwestern Madagascar, including Toliara (near the coral reef location), showed strong negative correlations with ENSO (, 99 % significant; Randriamahefasoa and Reason, 2017). Between 1970 and 2000 rainfall was below average in five out of seven El Niño events for Toliara while four out of six La Niña events received average or above average rainfall. Correlations of Toliara rainfall with global SST revealed an ENSO-like spatial pattern across the Indo-Pacific and a subtropical Indian Ocean Dipole SST pattern east of Madagascar (warm SST south–southeast of Madagascar, cold northeast of Madagascar and central Indian Ocean SST; Randriamahefasoa and Reason, 2017). El Niño events lead to thermal stress in the southern Mozambique Channel with coral bleaching in coral reefs of Ifaty and Toliara inferred for 1998 (not reported) and observed in 2016 (Zinke et al., 2004; McClanahan et al., 2009; Harris et al., 2010; Obura et al., 2017). Thus, ENSO appears to have a significant influence on temperature and rainfall variability in the southern Mozambique Channel.
Paleoclimate reconstructions based on a 334-year, annually resolved coral proxy record from Ifaty reef off southwestern Madagascar in the southern Mozambique Channel (MC) also point to significant interdecadal SST variations in the greater AC core region, with tight teleconnections to the midlatitude southern Atlantic Ocean and southern Indian Ocean SSTs (Zinke et al., 2004, 2014; Bruggemann et al., 2012). Numerical modeling exhibited that this coral-derived SST record was representative of the AC's wider core region since 1958 on interannual to decadal timescales (Zinke et al., 2014). This coral SST record revealed a strong relationship between local southern MC SST and ENSO (when ENSO variability was strong) and suggests a link with the Pacific decadal oscillation (Zinke et al., 2004; Crueger et al., 2009). However, the coral-based reconstruction solely revealed the SST variability of the AC core region, while long-term salinity reconstructions at high temporal resolution are lacking. SSS has emerged as an excellent indicator for the global hydrological cycle and its distribution across the oceans by currents (Hegerl et al., 2015; Skliris et al., 2014). This is because salinity provides an integrative measure of ocean advection, precipitation–evaporation (P–E), and ocean density changes (Skliris et al., 2014). Measurements of the δ18O in seawater (hereafter δ18Oseawater), which is strongly related to P–E, as well as horizontal and vertical ocean transport processes affecting salinity, allow for assessing large-scale and regional hydrological changes driven by climate variability (LeGrande and Schmidt, 2006). However, salinity and δ18Oseawater data are still scarce in many parts of our oceans, including the AC and AR region, and salinity measurements with global coverage only recently began in 2010 using satellites (Boutin et al., 2021). Salinity variability can be estimated from reanalysis products such as SODA (Giese and Ray, 2011) or observation-based products such as the EN4 (Good et al., 2013) back to 1958, yet their suitability has not been tested over long time periods. This hampers a full understanding of thermohaline circulation variability transmitted via the AC system from the preindustrial period into the current warm period.
Here, we present an annually resolved coral skeletal composite record paired with an established composite oxygen isotope record from Ifaty and Tulear reefs in the southern MC southwest of Madagascar, to obtain a 334-year-long reconstruction of δ18Oseawater changes related to surface salinity variability in the wider southern MC and the AC core region.
We compare the coral and δ18Oseawater records with reanalysis and observation-based products of SST (ERSST5 and HadISST1; Huang et al., 2017; Rayner et al., 2003) and SSS (SODA 2.1.6; Giese and Ray, 2011) to show that the coral records trace the local interannual to decadal SST and SSS variability. Furthermore, we use these reanalysis and observation-based products, as well as a hindcast (1958–2018) simulation with the ocean–sea-ice model configuration INALT20 at mesoscale eddy-rich resolution (Schwarzkopf et al., 2019), to assess the relationship of temperature and salinity variability at the coral site with that of the greater AC region. From this, in combination with historical wind stress observations from ICOADS (Woodruff et al., 2011) and coral records from other sites in the Indian Ocean, we show that it is possible to infer relationships of the regional SST and SSS variability with large-scale Indian Ocean variability, which ultimately may influence the surface thermohaline circulation (Rahmstorf et al., 2015).
2.1 Coral core collection and sampling
Coral cores from massive Porites sp. at Ifaty and Tulear reefs were collected in October 1995 during the European Union TESTREEF program from the Ifaty-Ranobé lagoon and the Great Barrier of Tulear (southwestern Madagascar; Zinke et al., 2004). The Ifaty and Tulear coral reef sites are described in detail in Zinke et al. (2004). The cores Ifaty-4 (4.06 m length), Ifaty-1 (1.93 m length), and Tulear-3 (1.80 m length) were obtained from a depth of 1.1, 1.8, and 0.6 m below mean tide level, respectively. The average growth rate of core Ifaty-4 was 0.99±0.15 cm yr−1, Ifaty-1 averaged 1.28±0.24 cm, and Tulear-3 averaged 1.54±0.25 cm yr−1.
All cores were sectioned to a thickness of 7 mm, and slabs were cleaned in 10 % hydrogen peroxide for 48 h to remove organic matter at GEOMAR Kiel. Slabs were subsequently rinsed several times with demineralized water and dried with compressed air. For complete removal of any moisture within the coral skeleton, the sample was placed in an oven for 24 h at 40 ∘C. Finally, the slabs were X-rayed to reveal annual density banding (Zinke et al., 2004).
A high-resolution profile for stable isotope analysis on core Ifaty-4 was drilled using a computer-controlled drilling device along the growth axis as observed in X-ray-radiograph-positive prints (Zinke et al., 2004). Subsamples were drilled at a distance of 1 mm for the years 1995–1920 and 2 mm for the older part of the core; the drilling depth was 3 mm using a 0.5 mm dental drill at 1000 rpm. The 1 to 2 mm sample spacing provides approximately monthly or bi-monthly resolution for δ18O ( for several multidecadal periods; see Zinke et al., 2004), respectively. We resampled the Ifaty-4 core at annual resolution for , except for multidecadal periods subsampled previously at bimonthly resolution (Zinke et al., 2004) following the established and precise age model of the high-resolution δ18O sampling from austral summer to summer in any given annual cycle (Table S1 in the Supplement). Cores Ifaty-1 and Tular-3 were sampled at annual resolution along the major growth axis following the density pattern from summer to summer in any given annual cycle, established from X-ray-radiograph-positive prints.
2.2 Analytical procedures of δ18O and
The high-resolution samples of core Ifaty-4 were reacted with 100 % H3PO4 at 75 ∘C in an automated carbonate reaction device (Kiel Device) connected to a Finnigan MAT 252 mass spectrometer (University of Erlangen). The average precision based on duplicate sample analysis and on multiple analyses of NBS 19 is ±0.07 ‰ for δ18O (1σ). The annual samples for cores Ifaty-1 and Tular-3 were reacted with 100 % H3PO4 at 75 ∘C in an automated carbonate reaction device (Kiel Device) connected to a Finnigan MAT 252 mass spectrometer at the VU Amsterdam. The average precision based on duplicate sample analysis and on multiple analyses of NBS 19 is ±0.08 ‰ for δ18O (1σ).
ratios were measured at the University of Kiel with a simultaneous inductively coupled plasma optical emission spectrometer (ICP-OES, Spectro Ciros CCD SOP), following a combination of the techniques described by Schrag (1999) and de Villiers et al. (2002). Sr and Ca were measured at their 421 and 317 nm emission lines, respectively. A total of 175±25 µg of coral powder was dissolved in 1 mL nitric acid (HNO3 2 %). Prior to analysis, this solution was further diluted with 4 mL HNO3 2 % to a final concentration of approximately 8 ppm. An analogously prepared in-house standard (Mayotte coral) was measured after each sample batch of six samples to correct for drift effects. The international reference material JCp-1 (coral powder) was analyzed at the beginning and end of every measurement run. Internal analytical precision based on replicate measurements was 0.008 mmol mol−1 (1σ) or 0.08 %. The average value of the JCp-1 standard from multiple measurements on the same day and on consecutive days was 8.831 mmol mol−1 with 0.085 % relative standard deviation (RSD). Comparison to the certified value of 8.838 mmol mol−79 with an expanded uncertainty of 0.089 mmol mol−1 indicates a high external precision of <0.08 %.
2.3 Age model uncertainty
We used the already published (bi)monthly resolved Ifaty-4 coral δ18O time series from 1660 to 1994 (Zinke et al., 2004). The high-resolution Ifaty-4 coral δ18O record enabled us to compute a precise coral δ18O annual chronology, averaged between March and February. We used the Ifaty-4 core as our best-dated reference time series to ensure that the yearly sampled chronologies of Ifaty-1 and Tulear-3 aligned well.
We have estimated the uncertainty in annual mean , δ18O, and δ18Osw due to potential sampling errors with a pseudo-proxy approach (Figs. S1–S2). The pseudo-annual means were calculated from “year's start” to “year's end”. The year's start and end were randomly selected from December to May (March ± 2–3 months) and from December to May (February ± 2–3 months). We looped this estimate 20 000 times and took the median of the looped results as the pseudo-annual mean. The pseudo-annual mean was compared with the true mean value (mean from March to February). The difference in between the “true” and “pseudo” values is 0.003±0.007 mmol mol−1 (1σ) (i.e., about ±0.1 ∘C), while the difference in δ18O is 0.02±0.014 ‰. Because of SST-related seasonality, and δ18O may have a bias towards positive values (lower SST); however, this bias is low. The δ18Osw estimated from paired coral δ18O and measurements (see Sect. 2.4 for methodology) is not significantly affected by the age model error (0.00±0.03 ‰ between true and pseudo values).
2.4 SST and δ18Oseawwater reconstruction
The composite SST and δ18Oseawater (hereafter δ18Osw) records and their uncertainty envelopes were estimated from medians and percentiles of their simulated distributions using a Monte Carlo approach developed by Watanabe and Pfeiffer (2022). The method was expanded to include the intercolonial differences of coral δ18O and in the uncertainty estimates. In a first step, SST records were estimated from and coral δ18O using the centering method of Cahyarini et al. (2008). Variations in SST and δ18Osw (hereafter SSTcenteri; δ18Osw−centeri) are estimated from coral and δ18O (hereafter δ18Oc) centered to their 1961–1990 mean, based on the assumption that coral is solely a function of SST and that coral δ18O is a function of both SST and oxygen isotopic composition of the seawater (δ18Osw). Effects of δ18Osw on coral δ18O are separated from thermal effects by subtracting the temperature component derived from from the δ18O in the coral skeleton.
where and δ18Oc−center are centered records of and δ18Oc by removing the 1961–1990 mean and β and b are the calibration slopes of SST and δ18OSST SST, respectively.
These equations were rewritten for centered records ( and δ18Oc−center, removing the 1961–1990 mean) and their uncertainties. The latter include intercolonial differences of and δ18Oc ( and ), the analytical uncertainties of the proxy analyses ( and ) and the slope uncertainties of the proxy SST relationships (Eβi and Ebi). The equations are as follows:
We calculated SSTcenteri and δ18Osw−centeri in a loop 20 000 times by adding random values following the normal distributions derived from 1σ of slope errors and analytical errors. Uncertainties deriving from intercolonial differences ( and ) are estimated from the standard deviation observed between the three cores covering 1994 to 1905 (±0.04 mmol mol−1, 1σ; ±0.10 ‰VPDB). For the time period covered by only a single core (1881–1661 CE), and were added as random values (from a normal distribution with a mean of 0) on and δ18Oc−center to indicate potential uncertainties arising from intercolonial differences. The analytical uncertainty of δ18Osw () in this study is 0.103 ‰ for bimonthly values, which reduces to 0.058 ‰ for annual means computed from bimonthly data according to the formula (Bevington, 2003). The SST slope and its uncertainty (β±Eβi) is mmol mol−1 ∘C−1 (1σ, Corrège, 2006), and the δ18O SST slope and its uncertainty (b±Ebi) is ‰ ∘C−1 (1σ, Lough, 2004; Thompson et al., 2011).
The calculation of composite SST and δ18Osw uncertainty (beyond analytical uncertainty) consists of the following steps: (1) all proxy records are centered by removing the 1961–1990 mean; (2) a pair of and δ18O is randomly selected in each year from the three coral core datasets; (3) Monte Carlo parameters are calculated by adding random values on the proxy SST slopes, , and δ18O (random values are normally distributed numbers in the 1σ range of slope errors and analytical errors, respectively); (4) δ18Osw is calculated using the Monte Carlo parameters; (5) step 2 to 4 are repeated in a loop 20 000 times; and (6) the median and percentiles are estimated from the resulting distributions. Uncertainty envelopes for the single record (1881–1661 CE) were calculated using the same procedures used for the composite record, omitting the second step. Anomalies of SST and δ18Osw from all annual coral records (March to February) were reported as centered records relative to the 1961–1990 mean.
2.5 Observational data and simulation with the ocean–sea-ice model configuration INALT20
To show that the SSS and SST variability at Ifaty are representative for the wider AC region, we compared different reanalysis- and observation-based products, as well as our coral data, and analyzed the interannual to decadal temperature and salinity variability in a mesoscale eddy-rich ocean model simulation. For SST, we selected ERSSTv5 (1854–1995; Huang et al., 2017) and HadISST1 (1870–1995; Rayner et al., 2003), both grounded on the ICOADS dataset (Woodruff et al., 2011). Gridded SST products may suffer from high uncertainties pre-1970, when observational coverage decreases and uncertainties become large (Fig. S3). Nevertheless, the ERSSTv5 and HadISST1 data provide an estimate for likely SST change since the 19th century. For salinity, we utilized Simple Ocean Data Assimilation (SODA 2.1.6, 1958–2008; Giese and Ray, 2011). Salinity from the EN4 dataset (Version 4.2; Good et al., 2013) was not used because subtropical Indian Ocean locations showed limited data coverage and no significant correlation with SODA salinity (Table S2). The employed model simulation is a hindcast (1958–2018, experiment identifier INALT20.L46-KFS10X, here referred to as INALT20-JRA) with the global ocean–sea-ice model configuration INALT20, which is part of the INALT family introduced in Schwarzkopf et al. (2019). INALT20 has a global resolution of ∘ that is regionally (63∘ S–10∘ N and 70∘ W–70∘ E) refined to ∘ to resolve the intricate mesoscale circulation features in the extended AC region and their impact on the South Atlantic. Note that the employed hindcast simulation differs from the one described in Schwarzkopf et al. (2019), as detailed in Schmidt et al. (2021) and Biastoch et al. (2021). In particular, it was run under the novel JRA55-do atmospheric forcing (Tsujino et al., 2018), which is available at higher resolution and for a longer time period than the previously employed COREv2 dataset (Large and Yeager, 2009). From the model simulation, instead of SST and SSS, we used near-surface salinity (NSS) and near-surface temperature (NST) taken at the vertical model level 3 (16.36 m) to avoid a direct restriction on the surface forcing (see Biastoch et al., 2015 for the rationale). Salinity and temperature time series were extracted from observation-based products and simulations for Ifaty (43∘ E and 23∘ S) and a representative location within the AC (30∘ E and 32∘ S). Correlations were calculated using annual means (January–December for comparison with the model, March–February for comparisons with the coral). All figures show annual anomalies relative to the 1961 to 1990 mean.
We utilize historical observations from ICOADS wind stress (1850–2010; Freeman et al., 2017) to infer large-scale variability in the atmospheric circulation over the Indian Ocean (10–40∘ S, 50–100∘ E) and its potential relation to ocean heat (SST) and salt (δ18Oseawater) zonal advective transport and their relationship to large-scale (10–40∘ S, 50–100∘ E) Indian Ocean variability. The 20th-century reanalysis data for the precipitation–evaporation (P–E) balance were employed to assess long-term relationships with freshwater flux over oceanic areas (Giese et al., 2016). The Multivariate El Niño-Southern Oscillation (ENSO) Index (MEI) was used to assess interannual variability (Wolter and Timlin, 1998, 2011). All gridded datasets for the study area were extracted as annual anomalies relative to the 1961–1990 mean using the KNMI Climate Explorer (Trouet and Van Oldenborgh, 2013).
3.1 Validation of reconstructed SST and δ18Oseawater at Ifaty
The new δ18Oseawater reconstruction is based on three paired Porites ratios and coral oxygen isotope (δ18O) records at annual resolution from Ifaty and Tulear coral reefs off southwestern Madagascar (43∘ E, 23∘ S) covering the past 334 years (Fig. 2; Zinke et al., 2014). The composite annual chronology extends from 1661 to 1994, with cores Ifaty-4, Ifaty-1, and Tulear-3 covering the years 1661–1994, 1890–1994, and 1905–1994, respectively. The uncertainty estimates in δ18O and were derived from the replicated time period (Fig. 2d, see Sect. 2).

Figure 2Sea surface temperature and δ18Oseawater reconstruction for the greater Agulhas Current region. (a) Coral composite annual SST anomaly reconstruction (red) for southwestern Madagascar (red shading shows 68 % to 95 % confidence intervals) based on (red) compared to Agulhas Current (AC) core region data from ERSSTv5 (black); panel (b) is the same as panel (a) but for coral composite δ18O SST anomaly reconstruction (blue with shading showing 68 % to 95 % confidence intervals). (c) Coral composite δ18Oseawater anomaly reconstruction (blue with shading showing 68 % to 95 % confidence intervals) for southwestern Madagascar compared to the Agulhas Current core region SODA reanalysis salinity data (black). (d) Uncertainties in reconstructed SST (centered; red) and δ18Oseawater (centered; blue) based on Monte Carlo simulation. (e) Time coverage of individual coral core records. All anomalies are computed relative to the 1961 to 1990 period.
Our new mean annual SST record largely covaries with the established δ18O SST record but shows a higher amplitude variability (Figs. 2a, b and S1). However, especially in the 18th and 19th centuries, lower mean SST in SST than δ18O SST results in lower δ18Oseawater anomalies and vice versa for cooler mean SST in SST. Between 1661 and 1995, SST records a linear warming trend of 0.94±0.26 ∘C, while δ18O SST indicates an increase of 0.83±0.21 ∘C, both statistically significant at p<0.001 (Zinke et al., 2004). Detrended annual coral δ18O SST and SST are significantly correlated with detrended annual mean (March to February) SST of instrumental records at Ifaty (Table S2). The new δ18Oseawater reconstruction displays no linear trend and is dominated by multidecadal to centennial variability throughout the 334-year record and punctuated by strong interdecadal and interannual variability (Fig. 2c). Large-amplitude interannual and decadal variability in δ18Oseawater is observed during the Late Maunder Minimum (hereafter LMM; 1670–1710). The late 18th century, most of the 19th century, and individual years during the LMM show the lowest δ18Oseawater anomalies, i.e., low-salinity surface water conditions. The most saline conditions are observed for several years during the LMM and the late 19th century. The early to mid-20th century (1910–1940) is characterized by high-salinity surface waters, and a freshening is recorded over the period 1958 to 1995.
We validated the mean annual Ifaty–Tulear coral δ18Oseawater reconstruction with surface salinity data from SODA 2.1.6, which are available from 1958 onwards (Giese and Ray, 2011, Table 1; Fig. 2c), and by using 1∘ gridded HadISST (Rayner et al., 2003) and 2∘ gridded ERSST5 instead of to reconstruct δ18Oseawater since 1854 (Huang et al., 2017; Figs. 3 and S5). Salinity data from SODA reanalysis from a grid near Ifaty reef (43∘ E, 23∘ S) were used. Our detrended δ18Oseawater record based on shows statistically significant correlations with Ifaty SODA salinity (r=0.50, p<0.05, N=36; Table 1; Fig. 3a–d), assuming 18 degrees of freedom (taking into account autocorrelation in SSS data). The best line of fit between annual mean δ18Oseawater and SODA salinity has a slope of 0.58±0.06 ‰ psu−1, close the observed mean slopes of subtropical waters between 0.4 and 0.6 ‰ psu−1 (LeGrande and Schmidt, 2006, 2011). A freshening trend is observed in both SODA salinity ( psu per decade; p=0.001) and δ18Oseawater ( ‰ per decade; p<0.001) in the overlapping period of both records between 1958 and 1995. SODA salinity suggests a switch to more saline conditions after 2000 (Figs. 2c and 3a). The δ18Oseawater reconstructed from HadISST and ERSST5 co-varies with -based δ18Oseawater between 1854 and 1995, both showing the lowest-salinity conditions on record in the late 19th century and between 1958 and 1995 (Fig. S5). The salinity from SODA over the wider Indian Ocean along the path of the South Equatorial Current and through the Mozambique Channel largely covaries with salinity at Ifaty since 1958 (Fig. S6). Ifaty–Tulear δ18Oseawater anomalies and SODA salinity, together with SST anomalies and observed ERSST5 at Ifaty, indicate a warming and freshening tendency between 1970 and 2000 (Fig. S7). For the record between 1854 and 1995, it appears as if decreasing (increasing) Ifaty–Tulear δ18Oseawater, i.e., freshening (salinification), coincides with decreasing (increasing) SST and ERSST5, i.e., cooling (warming). However, the relationship is weak, and interannual to decadal variability is not statistically significantly correlated. Hence, no robust correlation or causality could be established between the temporal evolution of regional temperature and salinity.
Table 1Linear least-squares correlation between annual mean salinity from SODA 2.1.6 and Ifaty–Tulear δ18Oseawater (from coral and δ18O) between 1958 and 1995 (March to February) for detrended and non-detrended data (p values are in brackets, CI is the 95 % confidence interval, N is the number of observations, and DoF indicates degrees of freedom, taking into account autocorrelation in SODA salinity data).
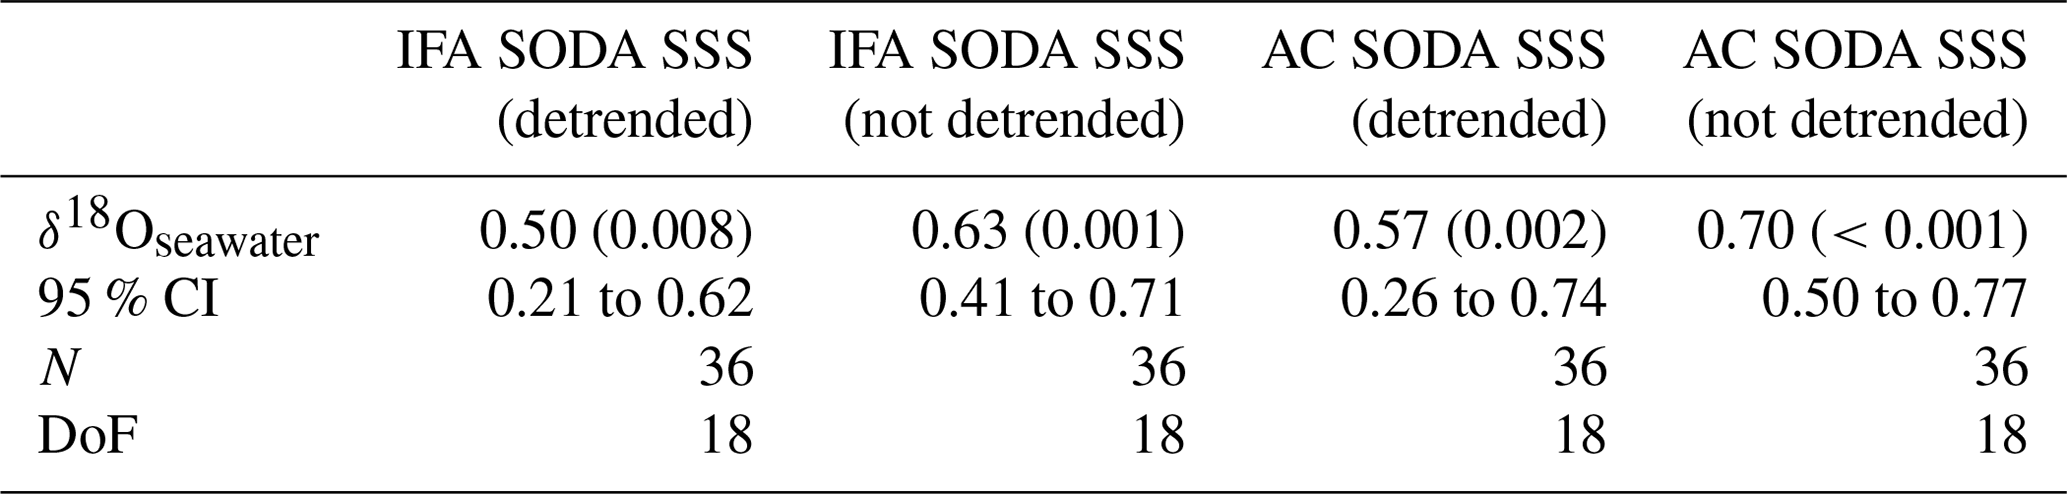
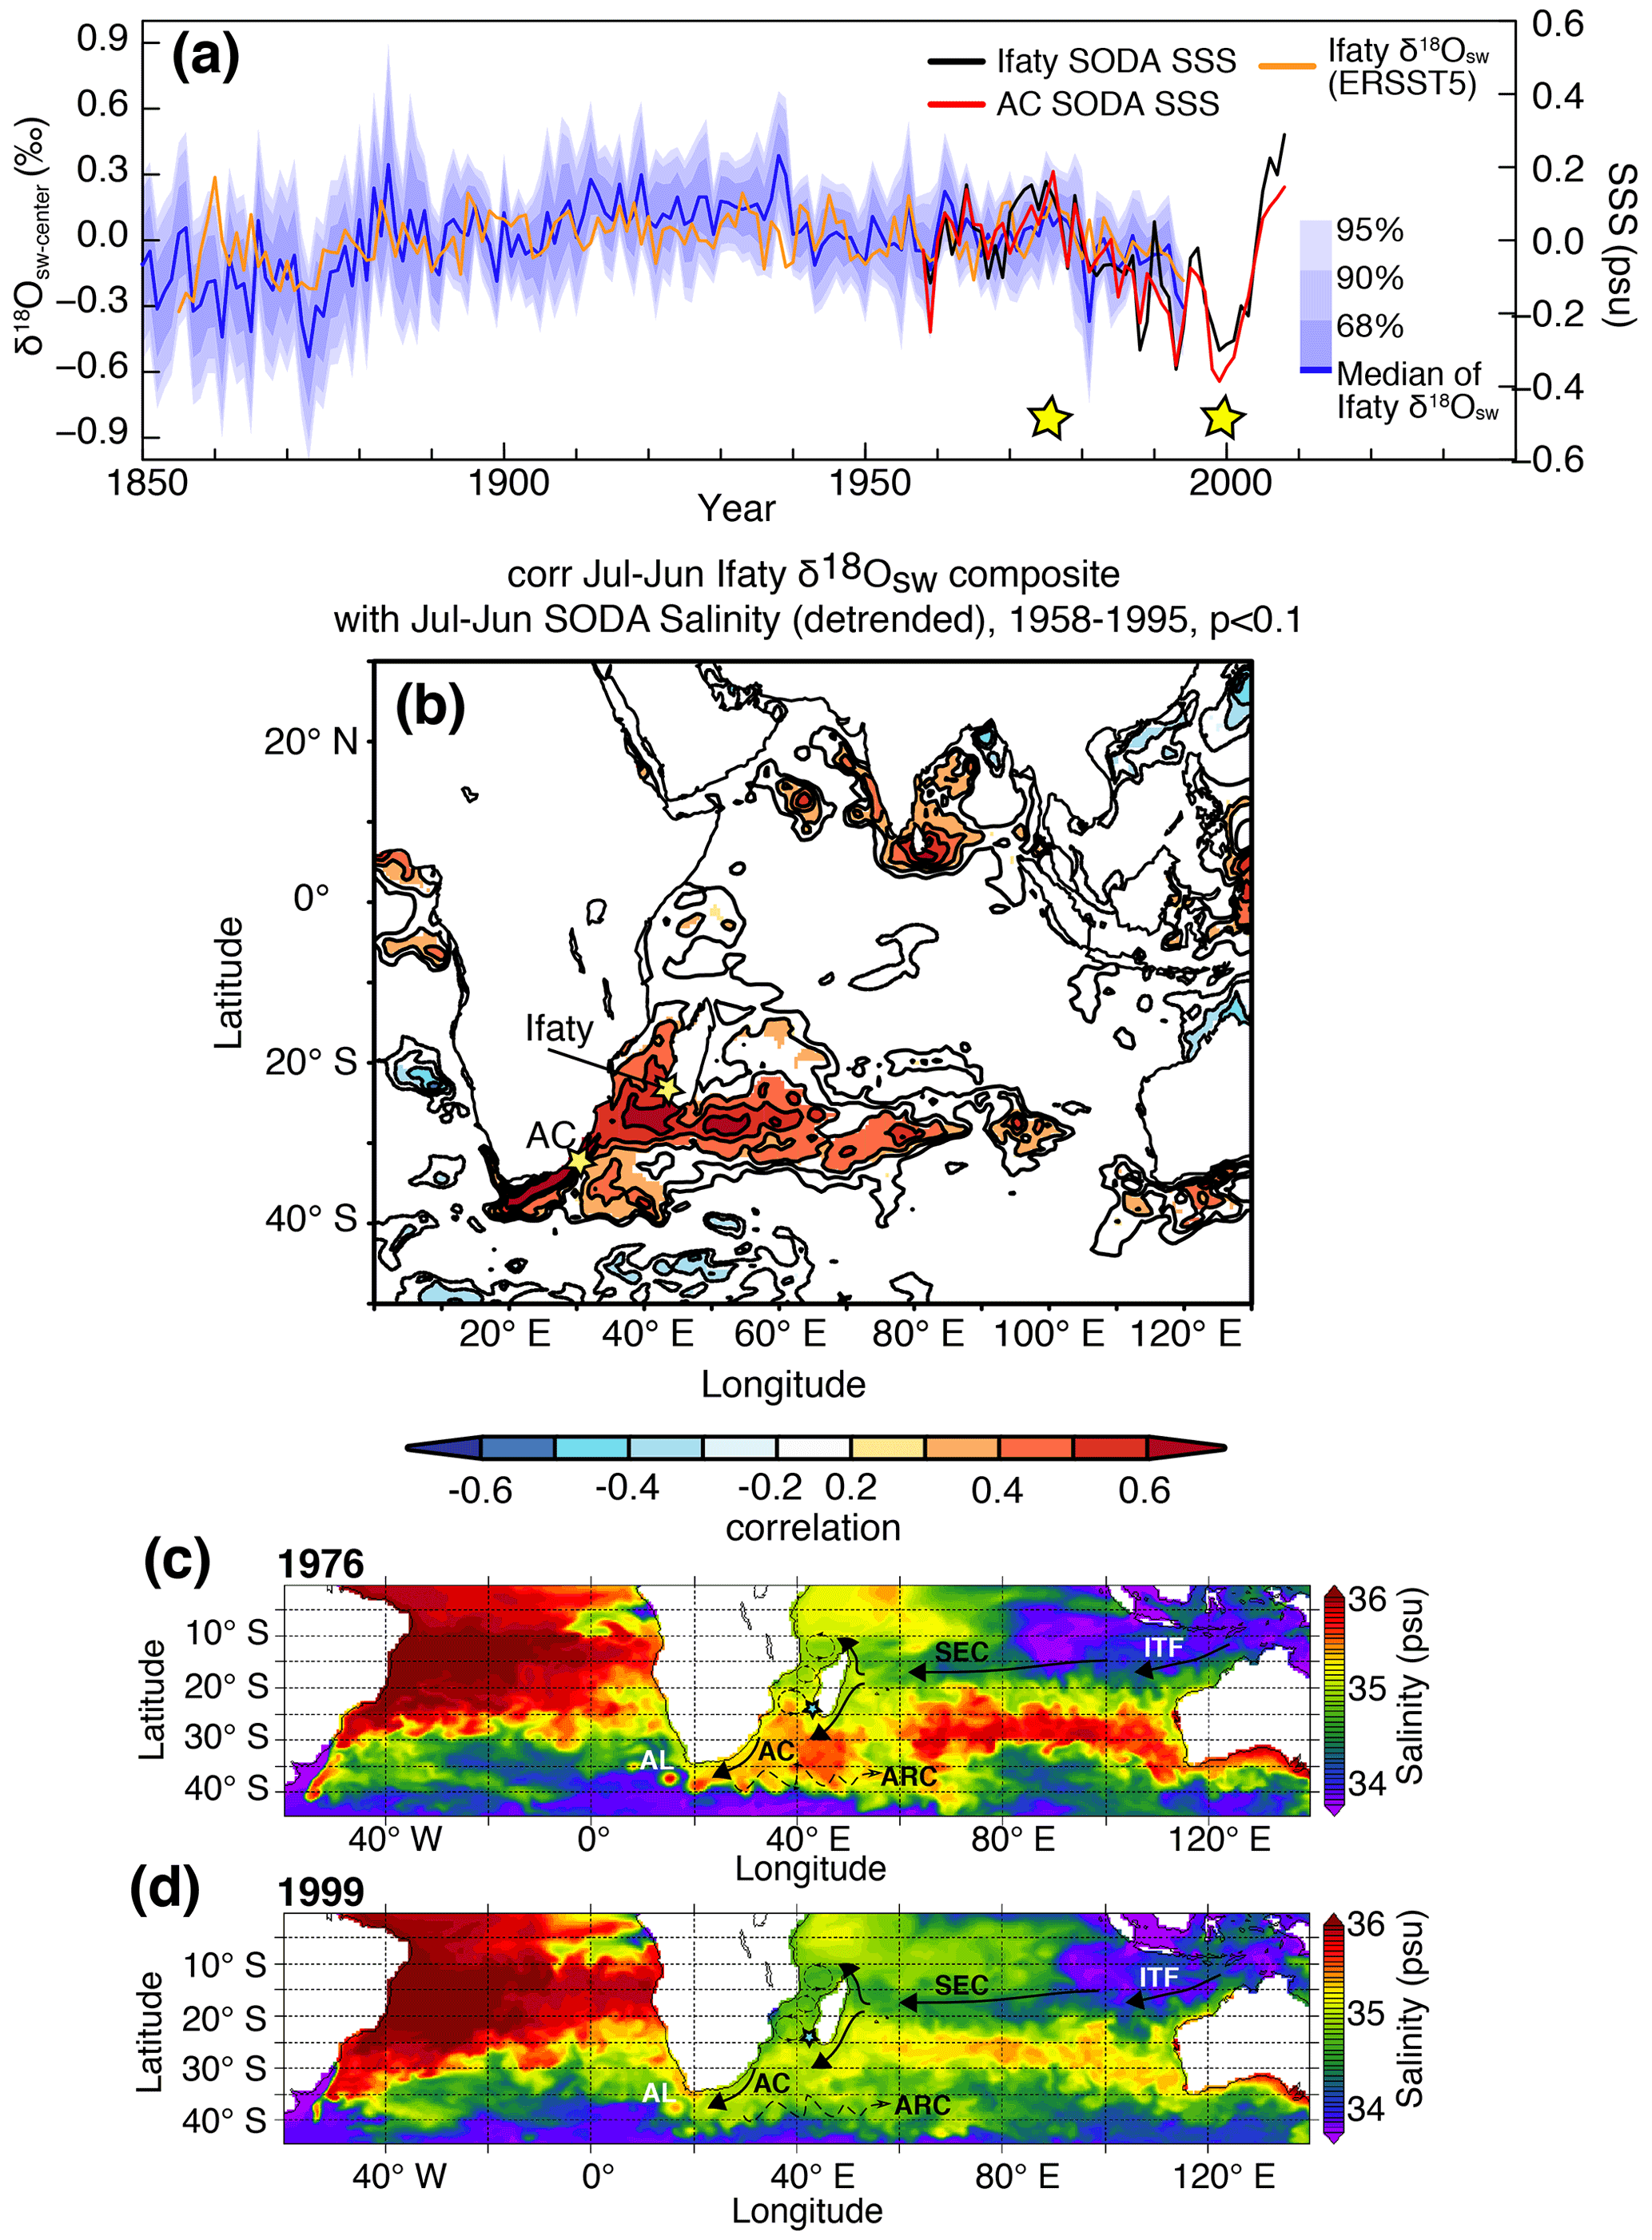
Figure 3Sea surface salinity data from SODA reanalysis in the greater Agulhas Current and the Ifaty–Tulear region. (a) Time series of salinity (March to February) for the grid box surrounding Ifaty and Tulear reef (black) and the Agulhas Current core region (red) and the reconstructed δ18Oseawater from Ifaty and Tulear corals (blue, with orange indicating δ18Oseawater using ERSSTv5 instead of SST) with blue shading indicating the 68 % to 95 % confidence intervals. The yellow stars mark a high-salinity period in August 1976 and a low-salinity period in August 1999 in the greater Agulhas Current (AC) region that are depicted in panel (c) and (d), respectively. (b) Spatial correlation of detrended Ifaty–Tulear δ18Oseawater with SODA salinity. Spatial correlation, computed with KNMI climate explorer (Trouet and Van Oldenborgh, 2013). (c, d) The blue star marks the location of the coral core site. Note the accumulation of high-salinity anomalies in the southwestern Indian Ocean off the southeastern coast of South Africa in 1976 (c) and vice versa for 1999 (d).
The (detrended) year-to-year NST–SST variability at Ifaty in the hindcast simulation with the mesoscale eddy-rich ocean–sea-ice model configuration INALT20 (Schwarzkopf et al., 2019) is significantly correlated (95 % confidence level, t test with effective degrees of freedom determined via e-folding scale of autocorrelation function) with ERSST5 (r=0.62, p<0.001; Fig. 4a–c) and HadISST (1958–2018, r=0.37, p<0.001). Detrended NST and SST are not significantly correlated between the simulation and the coral SST record (r=0.24, p=0.16; Fig. 4a). The (detrended) year-to-year NSS and SSS variability at Ifaty in the hindcast simulation are not significantly correlated with SODA (r=0.04, p=0.45, Fig. 4d–f) but are correlated with EN4 (r=0.45, p=0.045, not shown) at Ifaty. Detrended NSS and SSS at Ifaty in the hindcast simulation are also not significantly correlated with the reconstructed coral δ18Oseawater record (Fig. 4d–f). The model simulation further reveals no clear, direct relationship between NST and NSS and net surface heat or freshwater fluxes at Ifaty (Fig. S8)
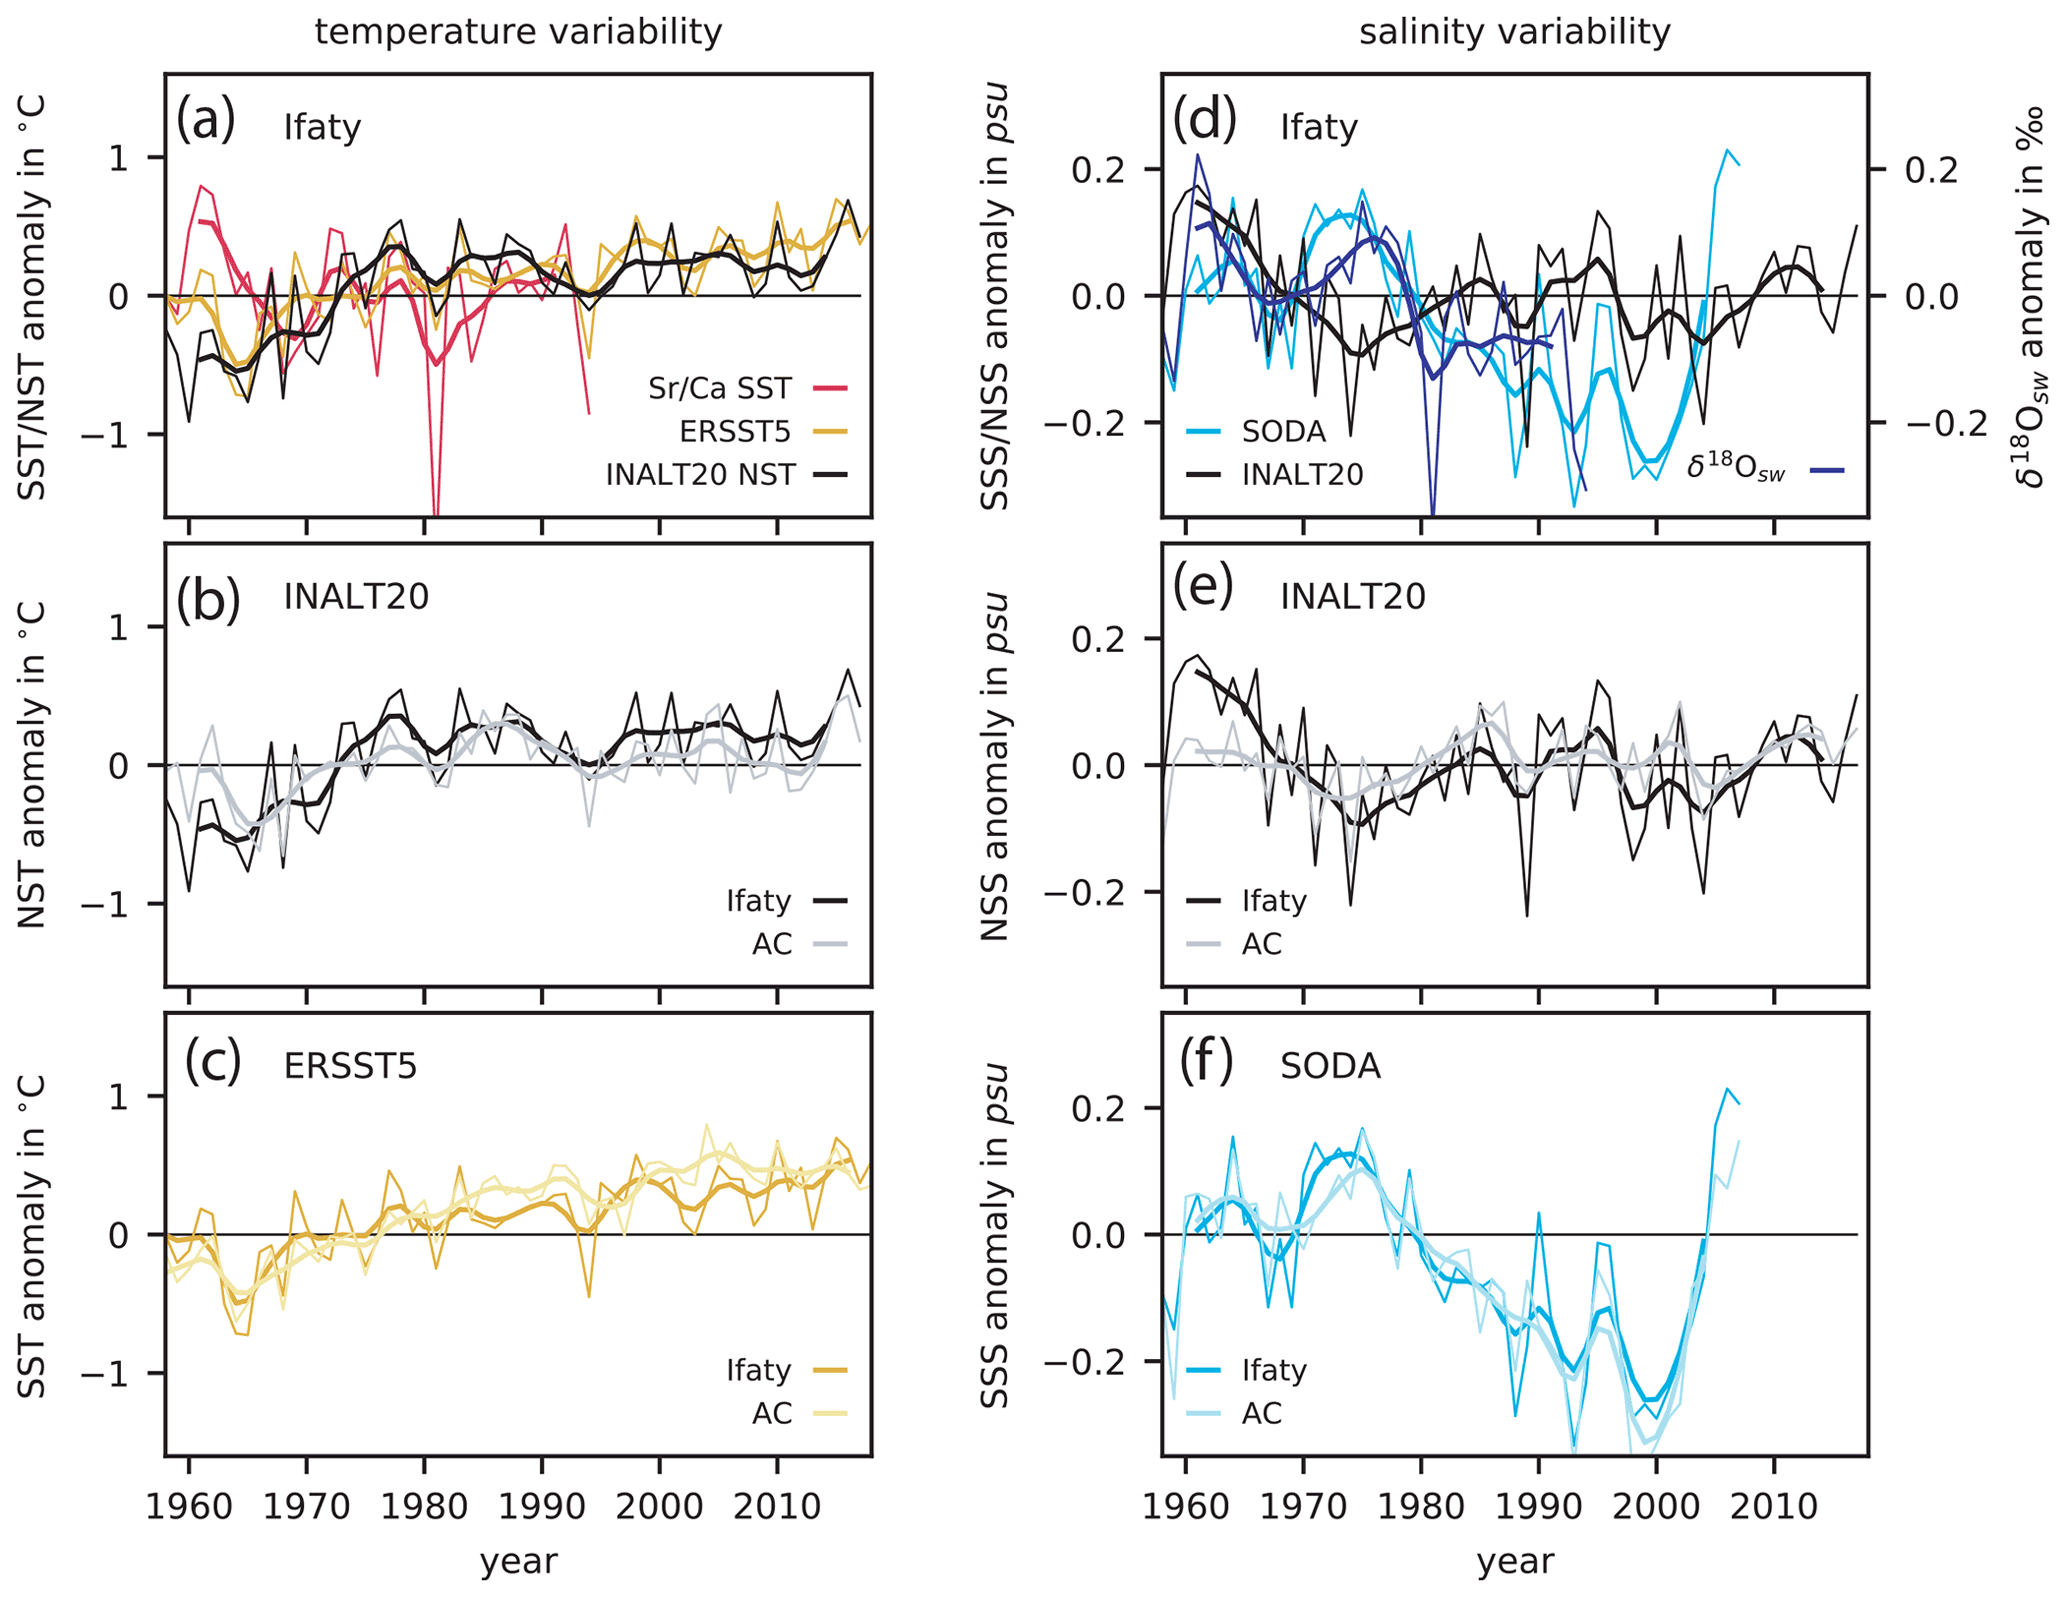
Figure 4Reconstructed and simulated co-variability of temperature and salinity in the Ifaty–Tulear and AC core regions. (a) SST at Ifaty reconstructed from coral (red), (b) simulated with INALT20 (black), and (c) obtained from ERSST5 (dark yellow). (b) NST in the AC core region simulated with INALT20 (grey) and obtained from ERSST5 (light yellow). (d) SSS at Ifaty reconstructed from coral δ18Osw (blue), (e) simulated with INALT20 (black), and (f) obtained from SODA (dark cyan). (e) NSS in the AC core region simulated with INALT20 (grey) and obtained from SODA (light cyan). Shown are annual mean (thin lines) and sub-decadally filtered (7-year Hamming filter) anomalies (referenced to 1961–1990 mean), whereby annual means in ocean model and instrumental data are calculated as March to February averages for better comparison with the coral record.
3.2 Representativeness of SST and SSS variability at Ifaty for variability in the wider Agulhas Current region
To further validate our hypothesis that the and δ18Oseawater records from the Ifaty–Tulear reef complex are representative for temperature and salinity in the wider AC region, we analyzed the relationship between the temporal evolution of annual mean salinity and temperature at Ifaty (centered at 43∘ E, 23∘ S) and within the AC core region (centered at 30∘ E, 32∘ S) in observations (ERSST5 and HadISST; Rayner et al., 2003; Huang et al., 2017), in a hindcast simulation with the mesoscale eddy-rich ocean–sea-ice model configuration INALT20 (Schwarzkopf et al., 2019), and in SODA reanalysis-based products (Giese and Ray, 2011).
Detrended Ifaty ERSST5 (and HadISST1) are significantly correlated with AC ERSST5 (1870–1995; r=0.74, p<0.001). Detrended annual coral δ18O SST and SST are significantly correlated with detrended annual mean (March to February) SST of instrumental records within the AC core region (Table S2). Our detrended δ18Oseawater record based on shows statistically significant correlations with AC core region salinity (r=0.57, p<0.001, N=36; Table 1), assuming 18 degrees of freedom (taking into account autocorrelation in SSS data). Spatial correlations between Ifaty–Tulear detrended δ18Oseawater and SODA SSS reveal a significant relationship across the greater Agulhas region (Fig. 3b). For the hindcast simulation and for all data products individually, the interannual to decadal variability of NST–SST and NSS–SSS at Ifaty indeed seem representative for NST–SST and NSS–SSS differences at the chosen location in the AC (Fig. 4), as well as for that of the wider AC region (not shown), even though the exact year-to-year SSS–NSS variability between the individual records differs (Fig. 4). The (detrended) year-to-year NST–SST variability between Ifaty and the AC are significantly correlated (95 % confidence level, t test with effective degrees of freedom determined via e-folding scale of autocorrelation function) in the simulation (1958–2018, r=0.60, p<0.001, Fig. 4b) and with HadISST (1958–2018, r=0.72, p<0.001, Fig. 4c) and SODA (1958–2008, r=0.66, p=0.005, not shown).
Detrended Ifaty and AC SODA SSS are significantly correlated (1958–1995; r=0.82, p=0.003) However, the (detrended) year-to-year NSS–SSS variability between Ifaty and the AC (1958–present) are significantly correlated in the simulation (r=0.75, p<0.001, Fig. 4e), but are not significant with the coral δ18Oseawater record. The latter may be a result of the shorter time series (the here-considered overlapping time period of the simulation and data products with the coral record is 1958–1994). Even though the relationship between AC and Ifaty salinity variability is robust in the simulation, there is no agreement on the actual temporal evolution of salinity since 1958 (Fig. 4d). There is no considerable correlation of (detrended) year-to-year NSS–SSS variability between the simulation and data products, among the data products, or between the simulation or data products and the coral δ18Oseawater record (Fig. 4d). The only exception is SODA salinity, which shows a temporal evolution that agrees well with that of the coral δ18Oseawater record.
The model simulation further reveals no clear, direct relationship between NST and NSS and between net surface heat and freshwater fluxes at IFA and AC regions (Fig. S8), and hence it supports the idea that NST–NSS variability at IFA and in the wider Agulhas region is dominated by oceanic processes such as advective heat and freshwater and salt transports.
3.3 Large-scale drivers of reconstructed δ18Oseawater
The question arises as to what is driving long-term changes and interannual to decadal variability in oceanic heat and freshwater and salt transport in the greater AC core region. First, we assessed if regional rainfall or freshwater discharge from land is driving salinity anomalies at Ifaty and Tulear reefs. We utilized rainfall station data from a weather station at Tulear in southwestern Madagascar dating back to 1951 (containing several gaps in the 1990s; Fig. S9). Rainfall and salinity or δ18Oseawater should be negatively correlated when rainfall or freshwater runoff influences the signal. Tulear rainfall reveals a positive correlation with both Ifaty and AC salinity data and reconstructed δ18Oseawater between 1951 and 1994. Thus, rainfall over adjacent land along the latitudinal band of the 23∘ S in Madagascar is weakly positively correlated with salinity and δ18Oseawater. This implies that regional rainfall on land is not a driver of ocean salinity.
We utilized historical observations from ICOADS (Freeman et al., 2017) wind stress to infer changes in the large-scale atmospheric circulation over the Indian Ocean and their potential impact on oceanic heat and salt transport. Negative anomalies in zonal wind stress translate into a strengthening of easterly anomalies across the southern Indian Ocean along the South Equatorial Current (SEC), which would invigorate zonal ocean transport of SST and salinity anomalies. ICOADS zonal wind stress averaged over the southern Indian Ocean (10–40∘ S, 50–100∘ E) east of Madagascar is available since 1855, with significant data gaps between 1880 and the 1940s. It indicates a trend to more negative anomalies since 1947, where data are complete (Fig. 5). Historical wind data from ICOADS (Freeman et al., 2017) indicate that this trend might have been part of a long-term decrease since the mid-19th century. ERA 20th-century reanalysis data also indicate a trend to more negative zonal wind stress anomalies between 1900 and the present (not shown). ICOADS zonal wind stress averaged over the southern Indian Ocean (10–40∘ S, 50–100∘ E) shows a positive correlation (r=0.73, p<0.001, N=81) with zonal wind stress south of Madagascar in the greater AC region (20–40∘ S, 30–45∘ E), which also holds after detrending (r=0.60, p<0.001). Our reconstructed annual δ18Oseawater record indicates a positive correlation (r=0.55, p<0.001) with southern Indian Ocean (10–40∘ S, 50–100∘ E) ICOADS zonal wind stress, which also holds after detrending (r=0.41, p=0.001; Fig. 5). We low-pass filtered (5-year LOESS filter) the ICOADS wind stress data and our δ18Oseawater reconstruction to assess potential relationships also on sub-decadal timescales. Our low-pass-filtered reconstructed δ18Oseawater record indicates a positive correlation (r=0.67, p=0.0063) with the southern Indian Ocean (10–40∘ S, 50–100∘ E) ICOADS zonal wind stress, pointing to easterly wind anomalies driving ocean advection of the salinity signal across the southern Indian Ocean.
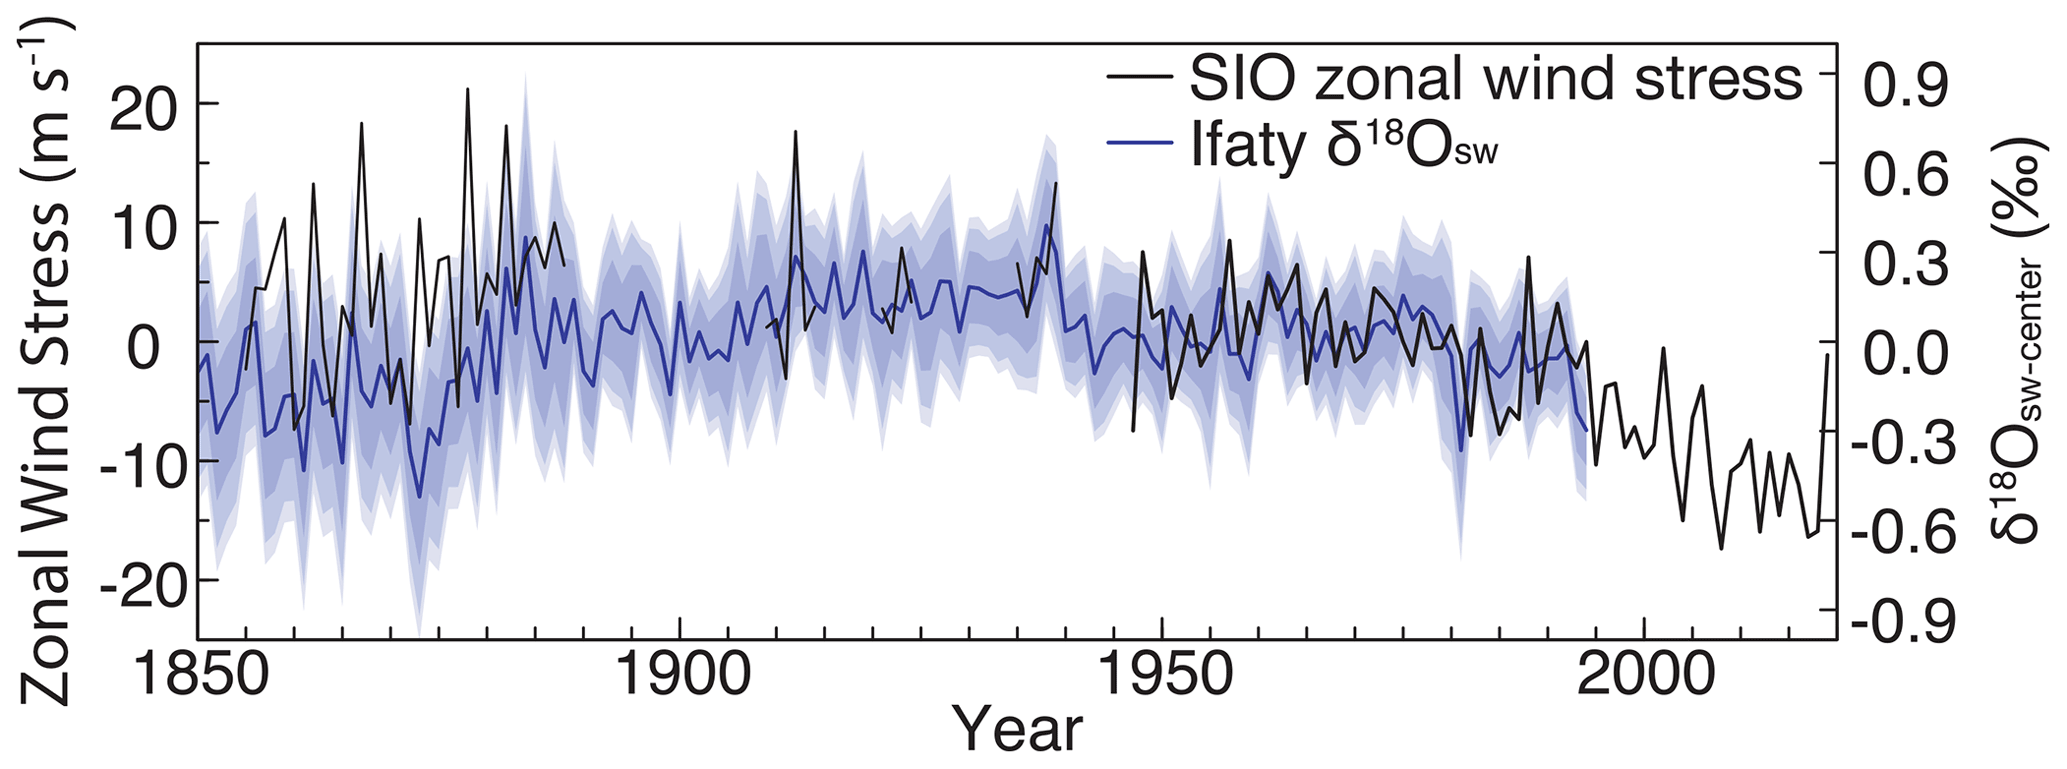
Figure 5Large-scale atmospheric forcing across the southern Indian Ocean trade wind belt driving zonal advection of ocean circulation. Zonal wind stress averaged over the southern Indian Ocean (10–40∘ S, 50–100∘ E) from ICOADS (black) compared to our coral composite δ18Oseawater anomaly reconstruction (blue with shading for confidence intervals) between 1855 and the present (1995). Note that the trend towards more easterly wind stress between 1947 and 2008 is largely mirrored by our δ18Oseawater reconstruction.
Furthermore, spatial correlations with 20th-century reanalysis data (Giese et al., 2016) for the P–E balance were chosen to assess long-term relationships with freshwater flux over oceanic areas (Fig. 6). Our results reveal that Ifaty salinity and reconstructed δ18Oseawater is related to P–E over the southern Indian Ocean, stretching meridionally from the northwest to southeast (east of Madagascar) and the northern Mozambique Channel (MC; Fig. 6a, b). Lagged correlations indicate that the P–E anomalies are propagated via Rossby waves into the MC and the AC region within 2 years after the initial P–E anomaly east of Madagascar (Fig. 6c). Since variability in the propagation of salinity anomalies is known to be driven by ENSO (Putrasahan et al., 2016), we assessed lagged correlations between the MEI index with the AC region 20th-century reanalysis P–E record, SODA salinity, and Ifaty reconstructed δ18Oseawater between 1950 and 2016 and 1950 and 1994, respectively (Figs. 6c–d; S10). Lagged correlations indicate a freshening of surface waters 12 to 18 months after El Niño and salinification after La Niña (Figs. 6c–f; S10). Results were similar using the observational and paleo-Niño3.4 indices instead of the MEI index between 1880 and 1994 and 1750 to 1994 (Figs. 6g–h). The southern MC P–E balance, in contrast, is negatively correlated at 6- to 12-month lag with the MEI, implying lower precipitation over the ocean following El Niño (Fig. 6c). Thus, lower (higher) salinity in the southern MC following El Niño (La Niña) implies a larger role of ocean Rossby wave propagation over the regional P–E balance in interannual salinity variability.
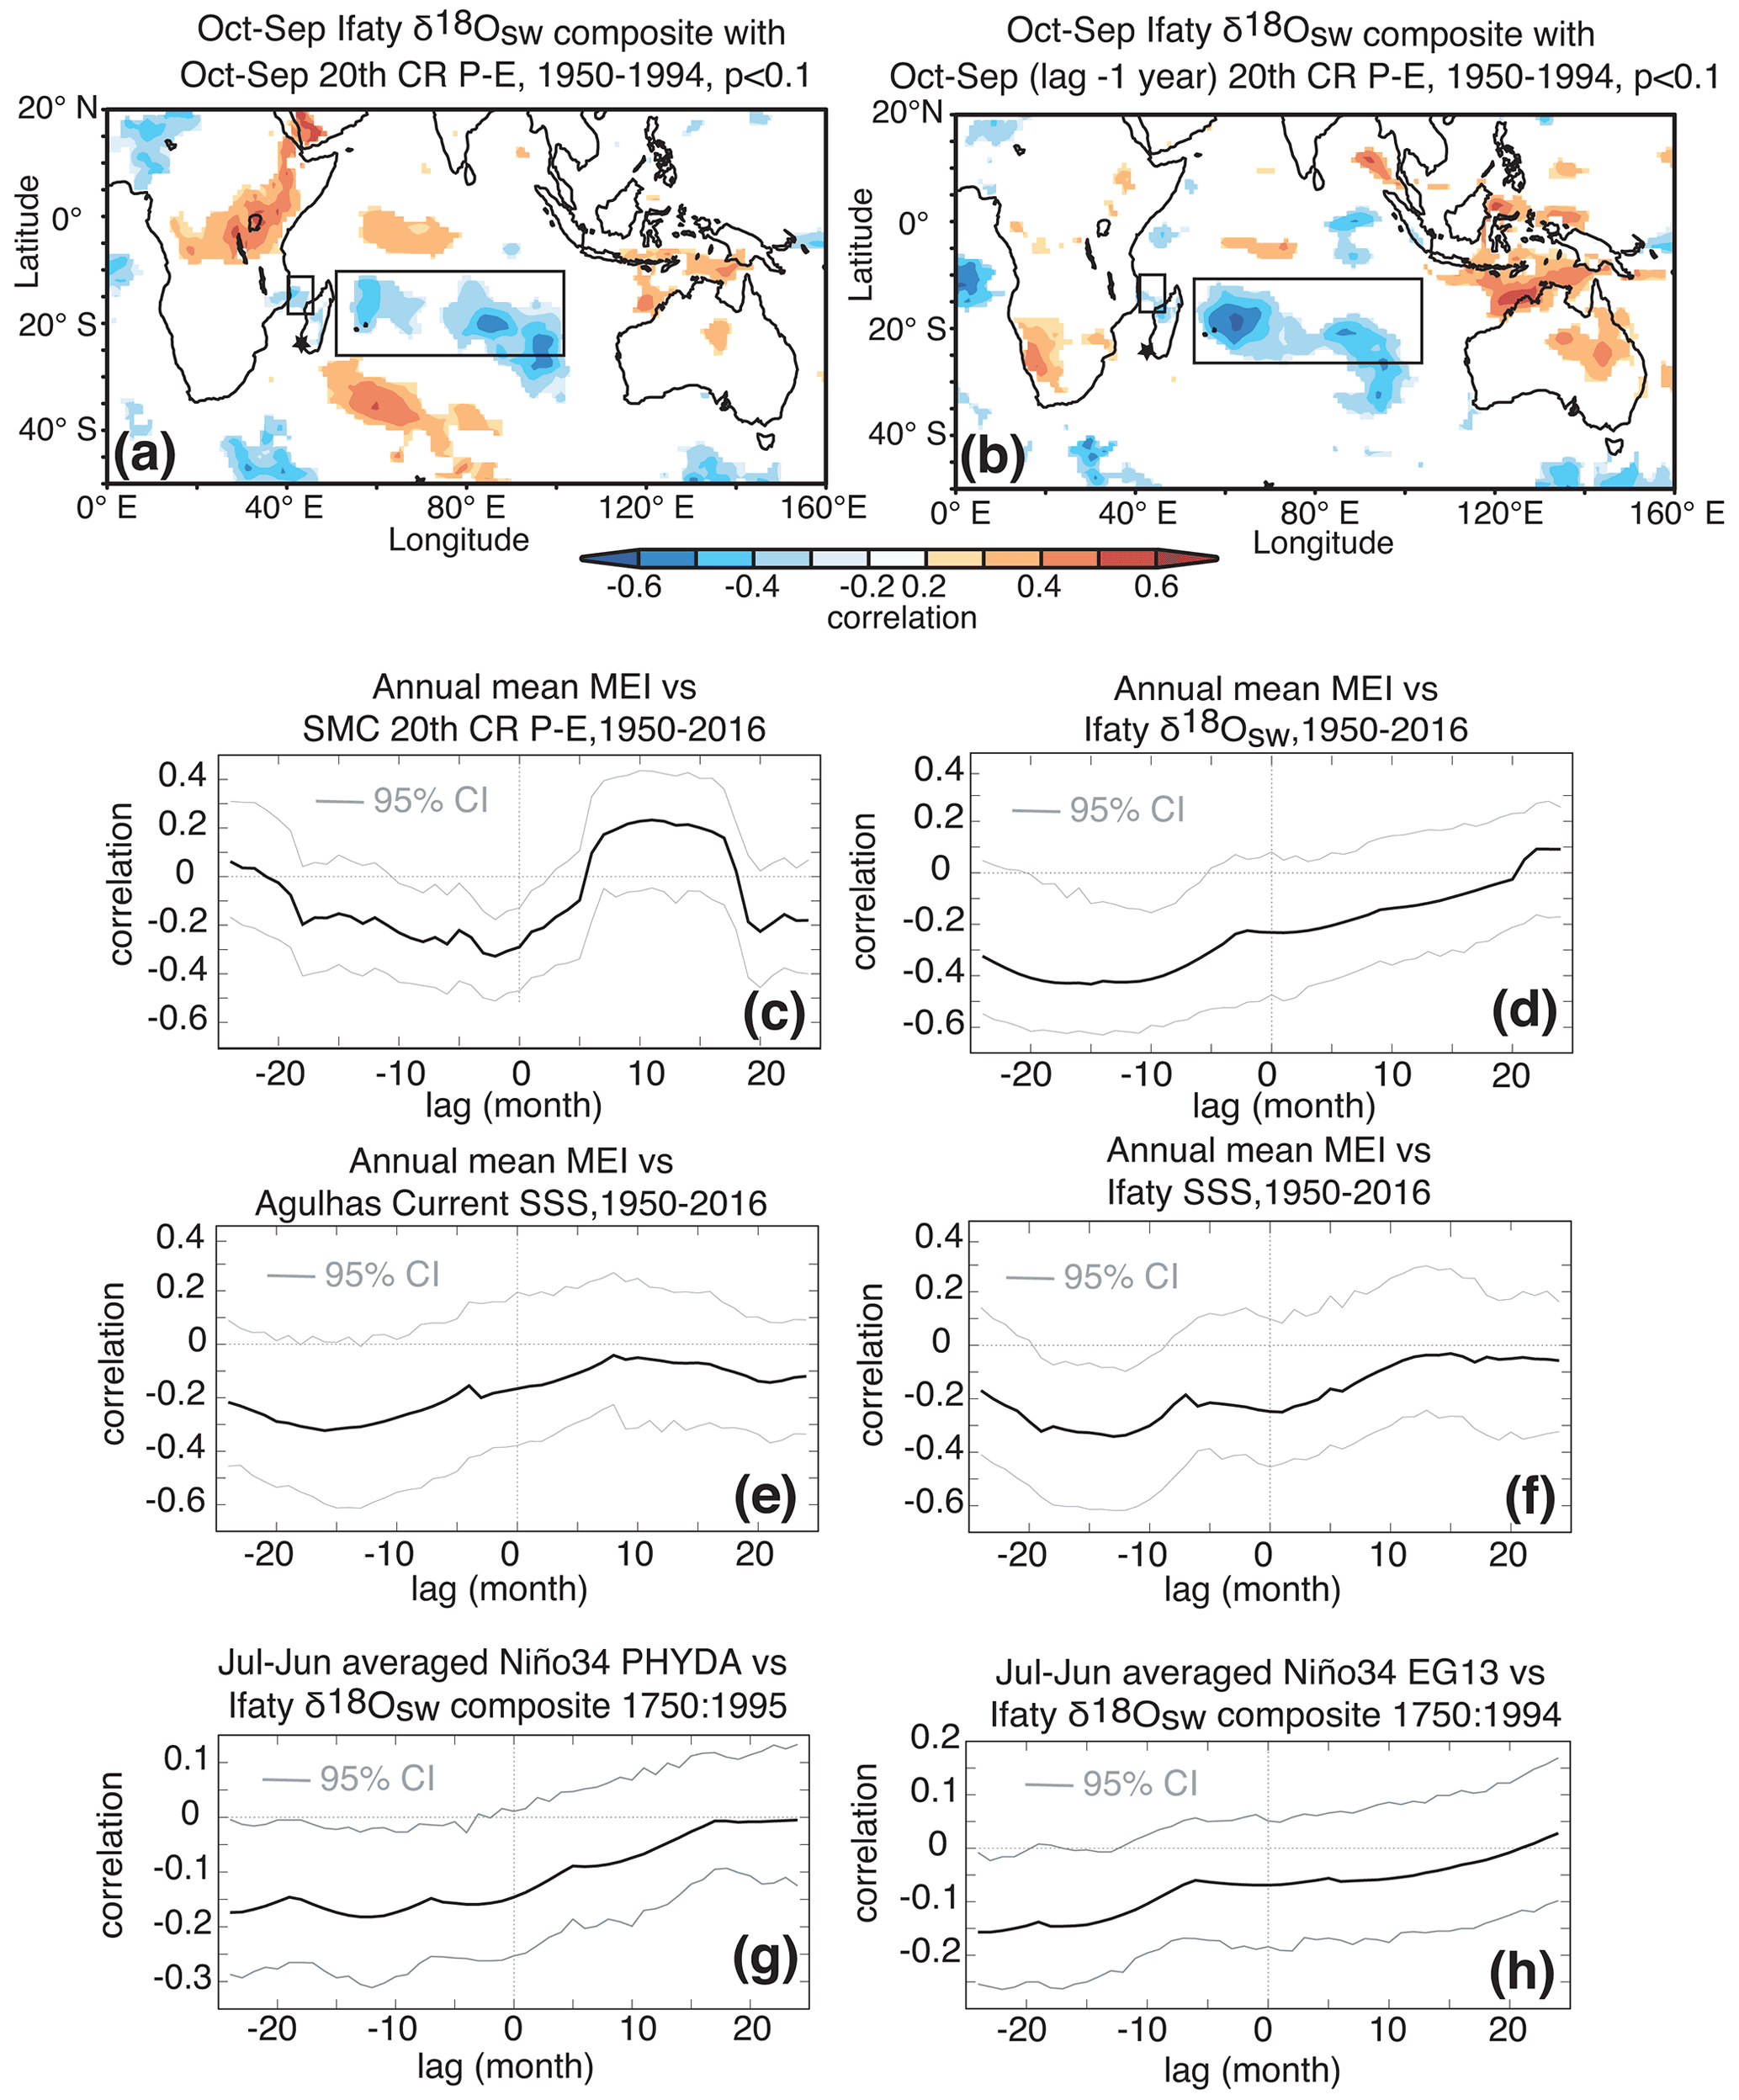
Figure 6Large-scale precipitation–evaporation balance across the southern Indian Ocean. Spatial correlation of mean annual Ifaty–Tulear coral composite δ18Oseawater computed with the KNMI climate explorer (Trouet and Van Oldenborgh, 2013) with (a) P–E from 20th-century reanalysis (Giese et al., 2016) and (b) using the same data set but with a 12-month lag. Rectangular boxes in panels (a) and (b) indicate regions with negative correlations. Only correlations significant at 90 % level are colored. Lagged correlations between the multivariate ENSO index (MEI) with (c) P–E from 20th-century reanalysis averaged over 20–25∘ S, 41–44∘ E, (d) Ifaty coral composite δ18Oseawater, (e) Agulhas Current (32∘ S, 32∘ E) salinity from SODA reanalysis (Giese and Ray, 2011), and (f) Ifaty salinity from SODA reanalysis (Giese and Ray, 2011). Note the 6- to 12-month lag between the MEI and regional hydrology. Negative lag indicates that MEI is leading. The 95 % confidence intervals are also indicated (grey lines in c to h). (g–h) Lagged correlation between annual mean Ifaty–Tulear δ18Oseawater composite with the Niño3.4 index between 1750 and 1995 from (g) Steiger et al. (2018; PHYDA) and (h) Emile-Geay et al. (2013; EG13). For this period, correlations are significant at 90 % level or higher. Beyond 1750, the 15–24-month lagged correlation is no longer significant.
We applied spectral analysis to test for the presence of interannual frequency bands and the 2-year timescale associated with propagation of Rossby waves identified by our lagged correlation analysis. Spectral analysis with the multitaper method revealed that interannual variability in reconstructed SST and δ18Oseawater is dominated by frequencies ranging from 2 to 4 years (Fig. S11). Similar frequencies were also found in observed ERSST5 and SODA SSS data for Ifaty and the AC region (Fig. S12). Such timescales of variability are typical for ENSO interannual frequency bands. Both the 2- and 4-year frequencies were of the highest magnitude between 1661 and 1900 and generally lower in the 20th century. The mid-20th-century and late 20th-century data both indicate higher interannual variability than in the early 20th century (Fig. 7). We also assessed the variability in reconstructed SST and δ18Oseawater through moving 30-year standard deviations, stepped by 5 years, following Abram et al. (2020). This analysis also reveals the highest variability in reconstructed SST and δ18Oseawater between 1661 and 1900 and diminished variability thereafter (Fig. 7). Blackman–Tukey spectral coherence analysis suggests that Ifaty–Tulear SST and δ18Oseawater is coherent with paleo-ENSO reconstructions of Emile-Geay et al., (2013; EG13) and Steiger et al. (2018; PHYDA) at frequencies between 2 and 4 years, as well as decadal bands ranging between 8–16 years and >30 years (Fig. S13). Cross-wavelet coherence analysis (Torrence and Compo, 1998) revealed the strongest coherence in the 2–4-year frequency band with EG13 between 1650 and 1850, around 1900, and from the 1940s onwards Fig. 7b). The PHYDA ENSO reconstruction indicates coherence in the 2- to 4-year frequency band with Ifaty–Tulear δ18Oseawater similar to EG13 between 1850 and 1995 but weaker in the 18th century (Fig. 7c). The 8–16-year frequency band shows high coherence between Ifaty–Tulear δ18Oseawater and all ENSO records in the 20th century, between 1780 and 1870, and between 1650 to 1710 (Fig. 7b–d). Wavelet coherence between Ifaty–Tulear SST and ENSO revealed largely similar coherent periods to δ18Oseawater (Fig. S14). We bandpass filtered the δ18Oseawater reconstruction and paleo-ENSO reconstructions for interannual to multi-decadal periodicities and computed running correlations to further assess long-term relationships (Figs. 8; S15; Emile-Geay et al., 2013; Steiger et al., 2018). The paleo-ENSO reconstructions do not agree with each other for large parts of the record since 1661 in various frequency bands (Fig. 8). The best agreement is found for the period where both ENSO reconstructions were calibrated with instrumental data (1870–1995) for the 3.3- to 4-year frequency band (Fig. 8). Consequently, our bandpass-filtered δ18Oseawater record shows various levels of agreement and disagreement (or phase lags) with individual ENSO reconstructions. However, these results support the results from cross-wavelet coherence analysis, indicating varying phase lags between ENSO records and Ifaty–Tulear δ18Oseawater on decadal to interdecadal frequencies (Fig. 8). Running (31-year) correlations reveal a highly non-stationary relationship between Ifaty δ18Oseawater and ENSO, switching between negative and positive correlations (Fig. S15).
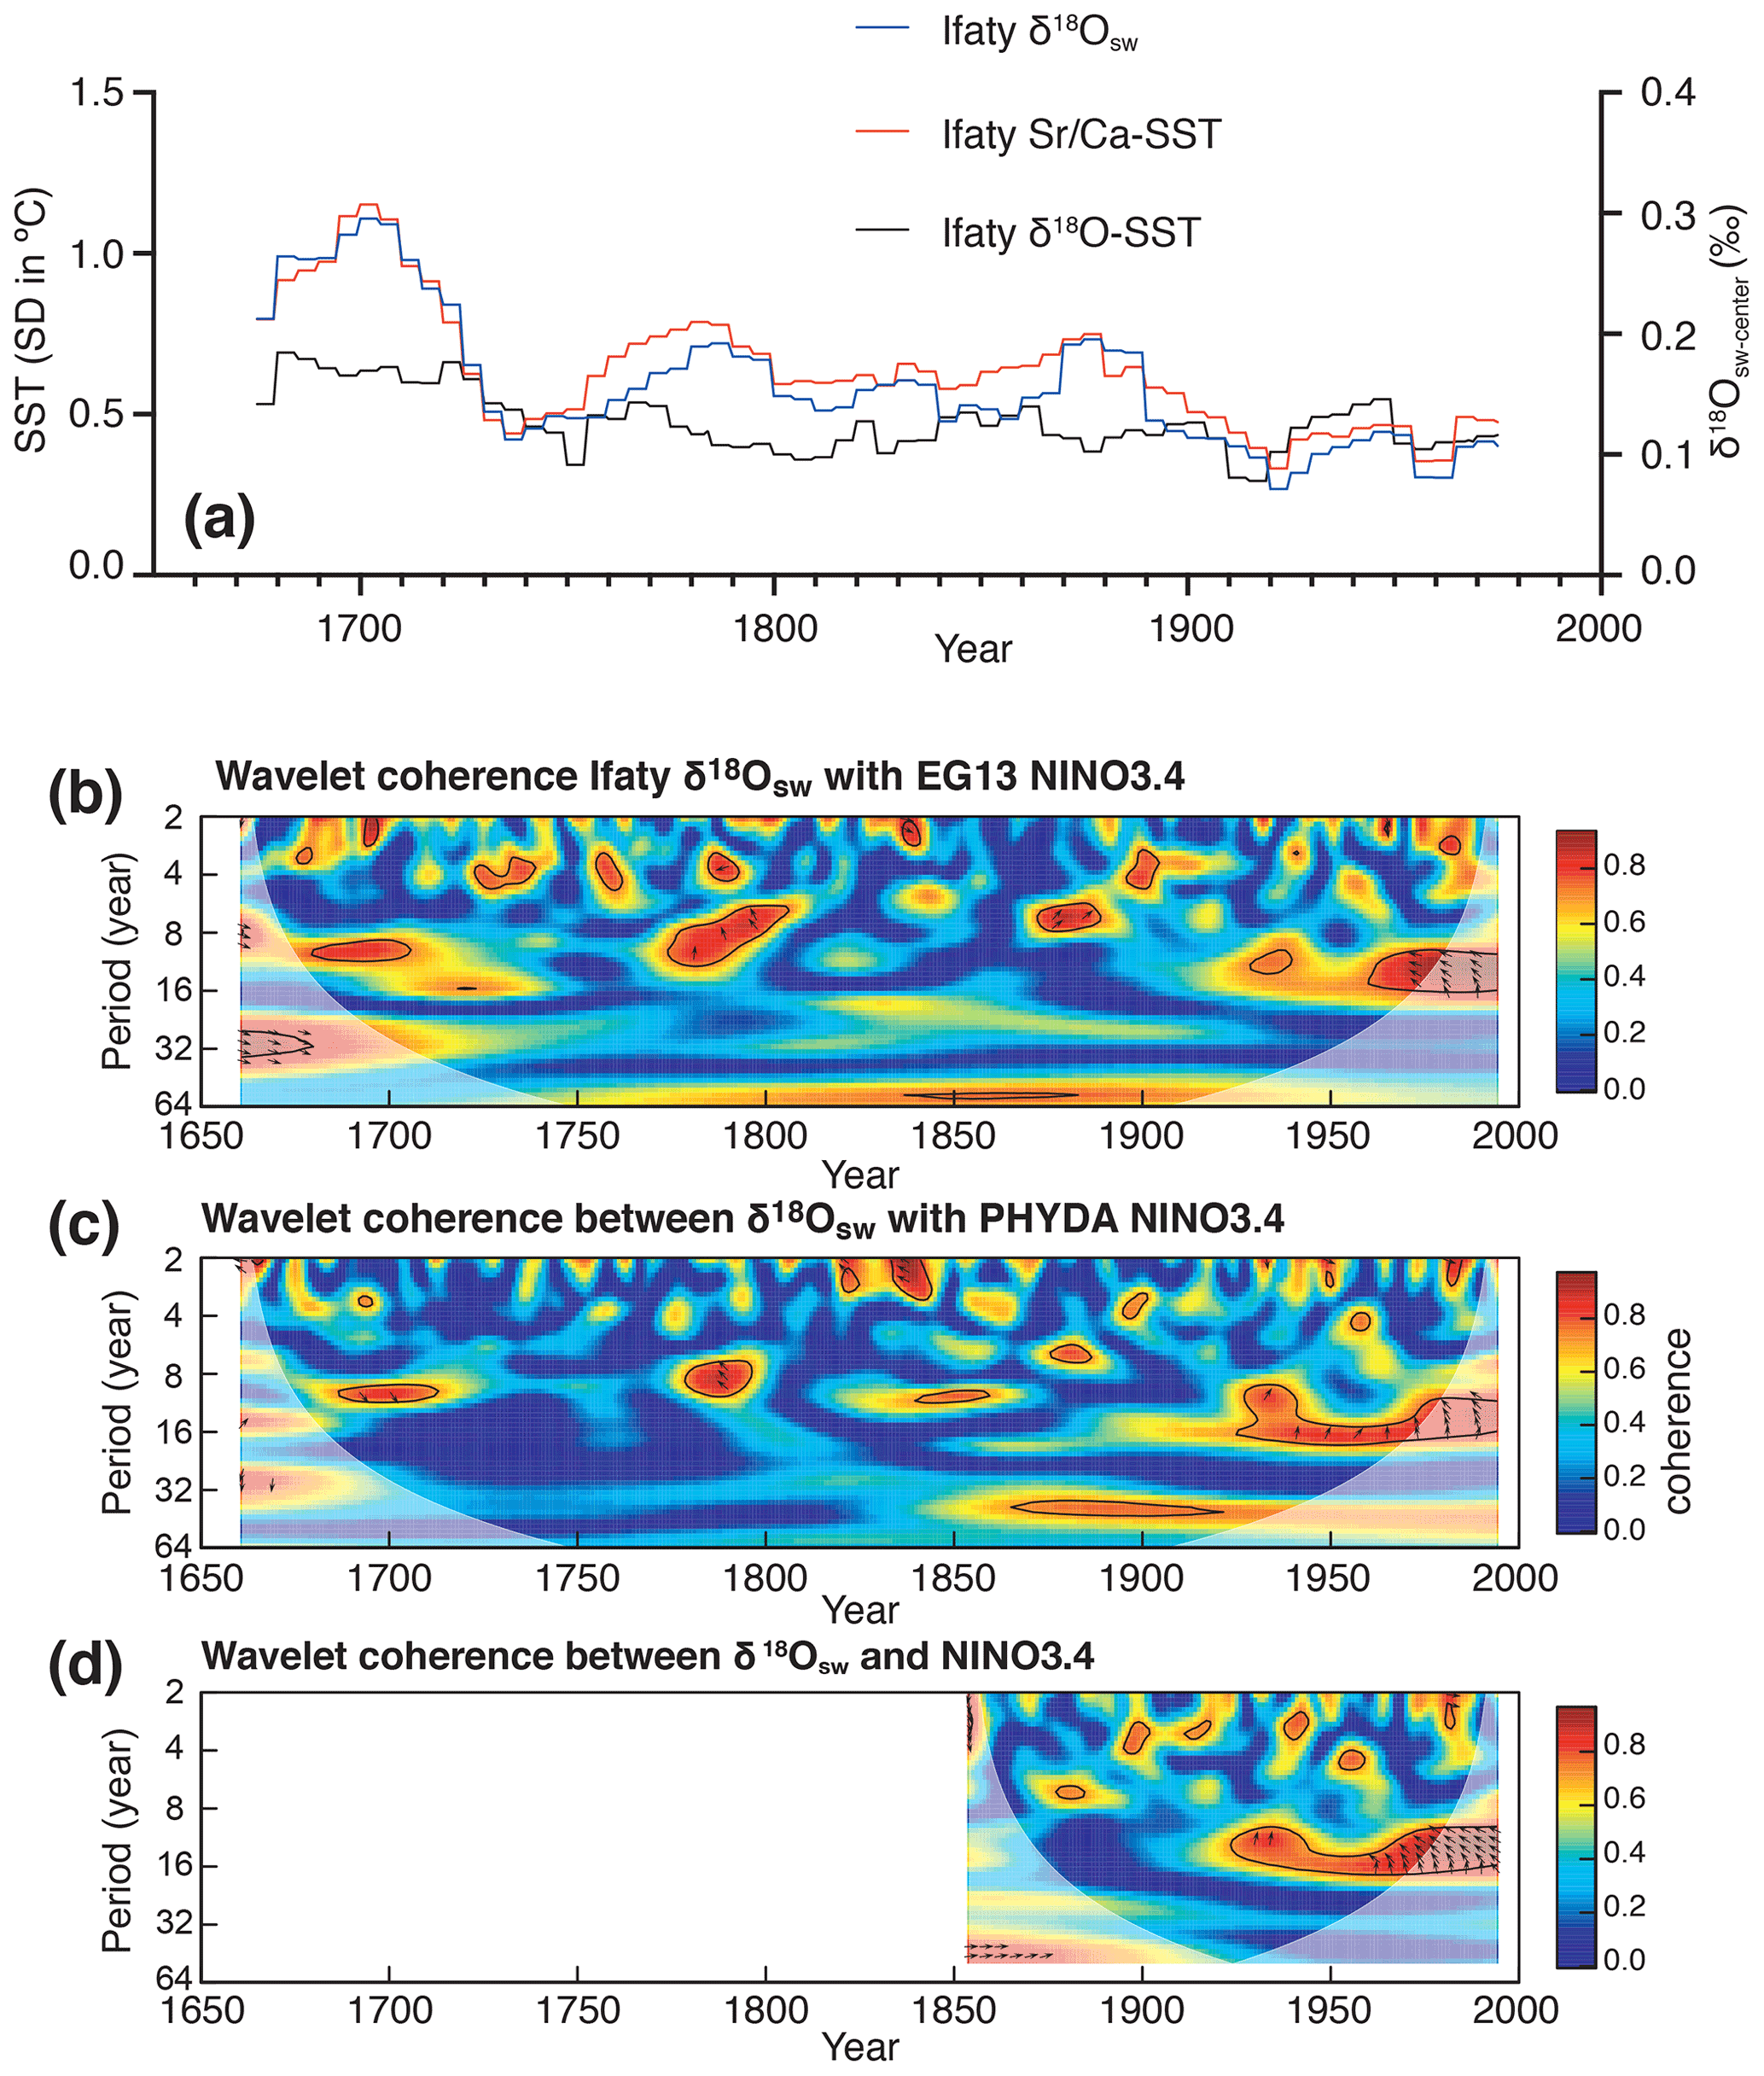
Figure 7(a) Moving 30-year standard deviations, stepped by 5 years, of reconstructed Ifaty δ18Oseawater composite (blue), Ifaty SST composite records (red) and Ifaty δ18O SST composite records (black). (b–d) Cross-wavelet coherence (Torrence and Compo, 1998) between Ifaty–Tulear δ18Oseawater composite with Niño3.4 reconstructions of (b) Emile-Geay et al. (2013; EG13), (c) Steiger et al. (2018; PHYDA), and (d) the observed Niño3.4 index based on ERSSTv5 between 1661 and 1995. Coherent frequency bands above the 95 % significance level are encircled by black lines and filled in red. The phase of coherence is indicated by arrows.
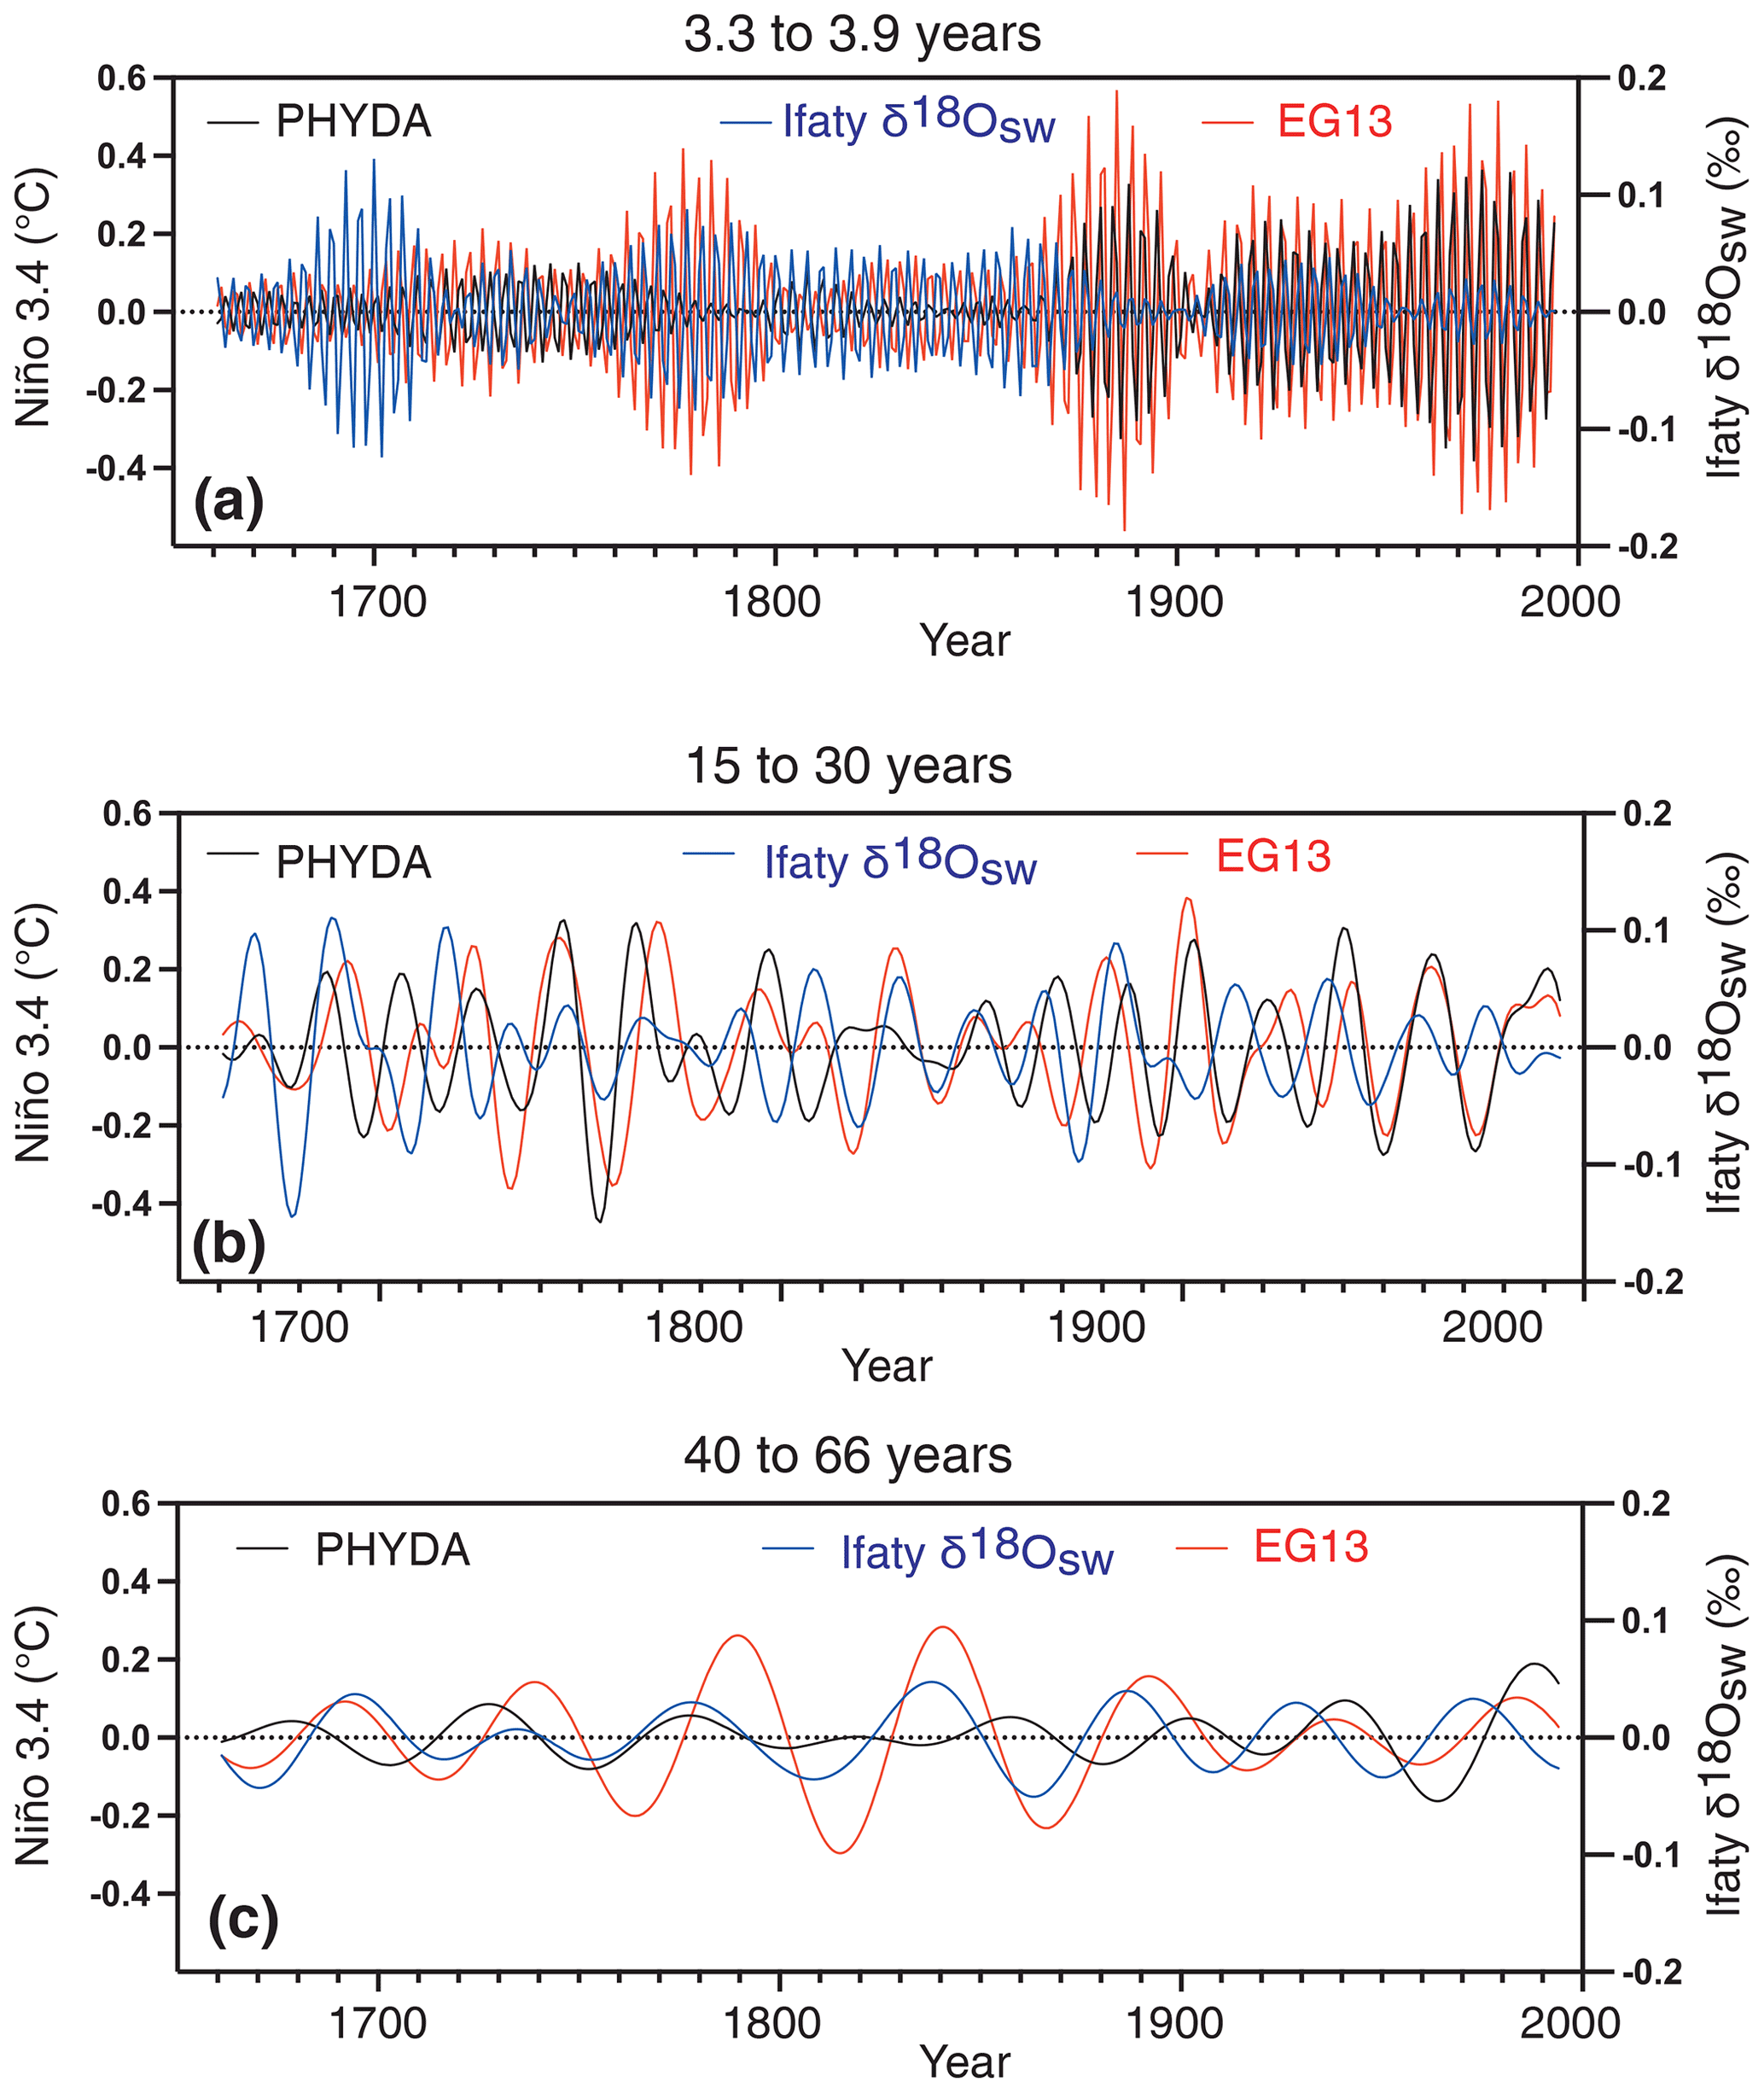
Figure 8Bandpass-filtered data for Ifaty–Tulear δ18Oseawater (blue), the Niño3.4 index from Emile-Geay et al. (2013; EG13; red), and the Niño3.4 index from Steiger et al. (2018; black; PHYDA) for (a) interannual (3.3–3.9 years), (b) interdecadal (15–30 years), and (c) multidecadal (40–66 years) frequency bands.
The aforementioned analyses suggest that the δ18Oseawater record at Ifaty may be connected with salinity variability upstream in the southwestern Indian Ocean through propagation of ocean Rossby waves, potentially steered by interannual variability climate modes. We thus compared reconstructed Ifaty δ18Oseawater with southwestern Indian Ocean coral-derived δ18Oseawater records, mainly following the South Equatorial Current pathway (Fig. 9). The interannual atmospheric and oceanic anomalies intrinsic to each coral reef may differ due to local wind, evaporation, and/or rainfall variations. This is confirmed by northern Madagascar, Mayotte, and La Réunion SODA salinity data, indicating year-to-year differences in mean salinities between sites since 1958 (Fig. S6). Interestingly, southwestern Indian Ocean coral-derived δ18Oseawater records largely covary with local rainfall or rainfall over adjacent land areas (Fig. S16). Not surprisingly, tracking δ18Oseawater records across thousands of kilometers shows varying leads or lags, preventing us from establishing robust statistical relationships (Figs. 9a–d; S17–S18). All western Indian Ocean δ18Oseawater records show no linear trend towards more or less saline conditions yet are dominated by interannual to multidecadal variability. The closest coral record to Ifaty is derived from Mayotte in the northern Mozambique Channel at a distance of 1180 km (Zinke et al., 2008), dating back to 1882. Remarkably, Mayotte and Ifaty δ18Oseawater largely agree in terms of decadal and long-term variations between 1882 and 1994, with a lower agreement in the early 20th century (Fig. 9a). In particular, the low δ18Oseawater in Mayotte in the early 1970s was not pronounced at Ifaty. A composite δ18Oseawater record from Antongil Bay (northeastern Madagascar; approximately 2400 km from Ifaty) covaried with the Mayotte data between 1965 and 1994 (r=0.66, p<0.0001), and its decadal variability range overlaps with Ifaty δ18Oseawater (Fig. 9b). A record from La Réunion δ18Oseawater directly within the flow path of the SEC (2900 km from Ifaty) also largely overlaps with decadal variability and long-term trends in Ifaty δ18Oseawater changes between 1914 and 1994 (Fig. 9c). However, the regime shift in the 1950s in the La Réunion δ18Oseawater record is not as pronounced at Ifaty. Despite the vast spatial differences between all sites, we find overall comparable decadal changes and trends. We computed the absolute differences between Ifaty δ18Oseawater and the records from Mayotte, Antongil Bay, and La Réunion taking into account the full uncertainties of individual reconstructions (Fig. S18). This analysis reveals that the absolute difference is smaller than the individual uncertainties, and thus the δ18Oseawater ranges for all western Indian Ocean sites fully overlap and are indistinguishable. We propose that δ18Oseawater is modified by site-specific atmospheric (P–E) and oceanic variability and likely involves temporal lags in agreement with salinity data (Fig. S6).
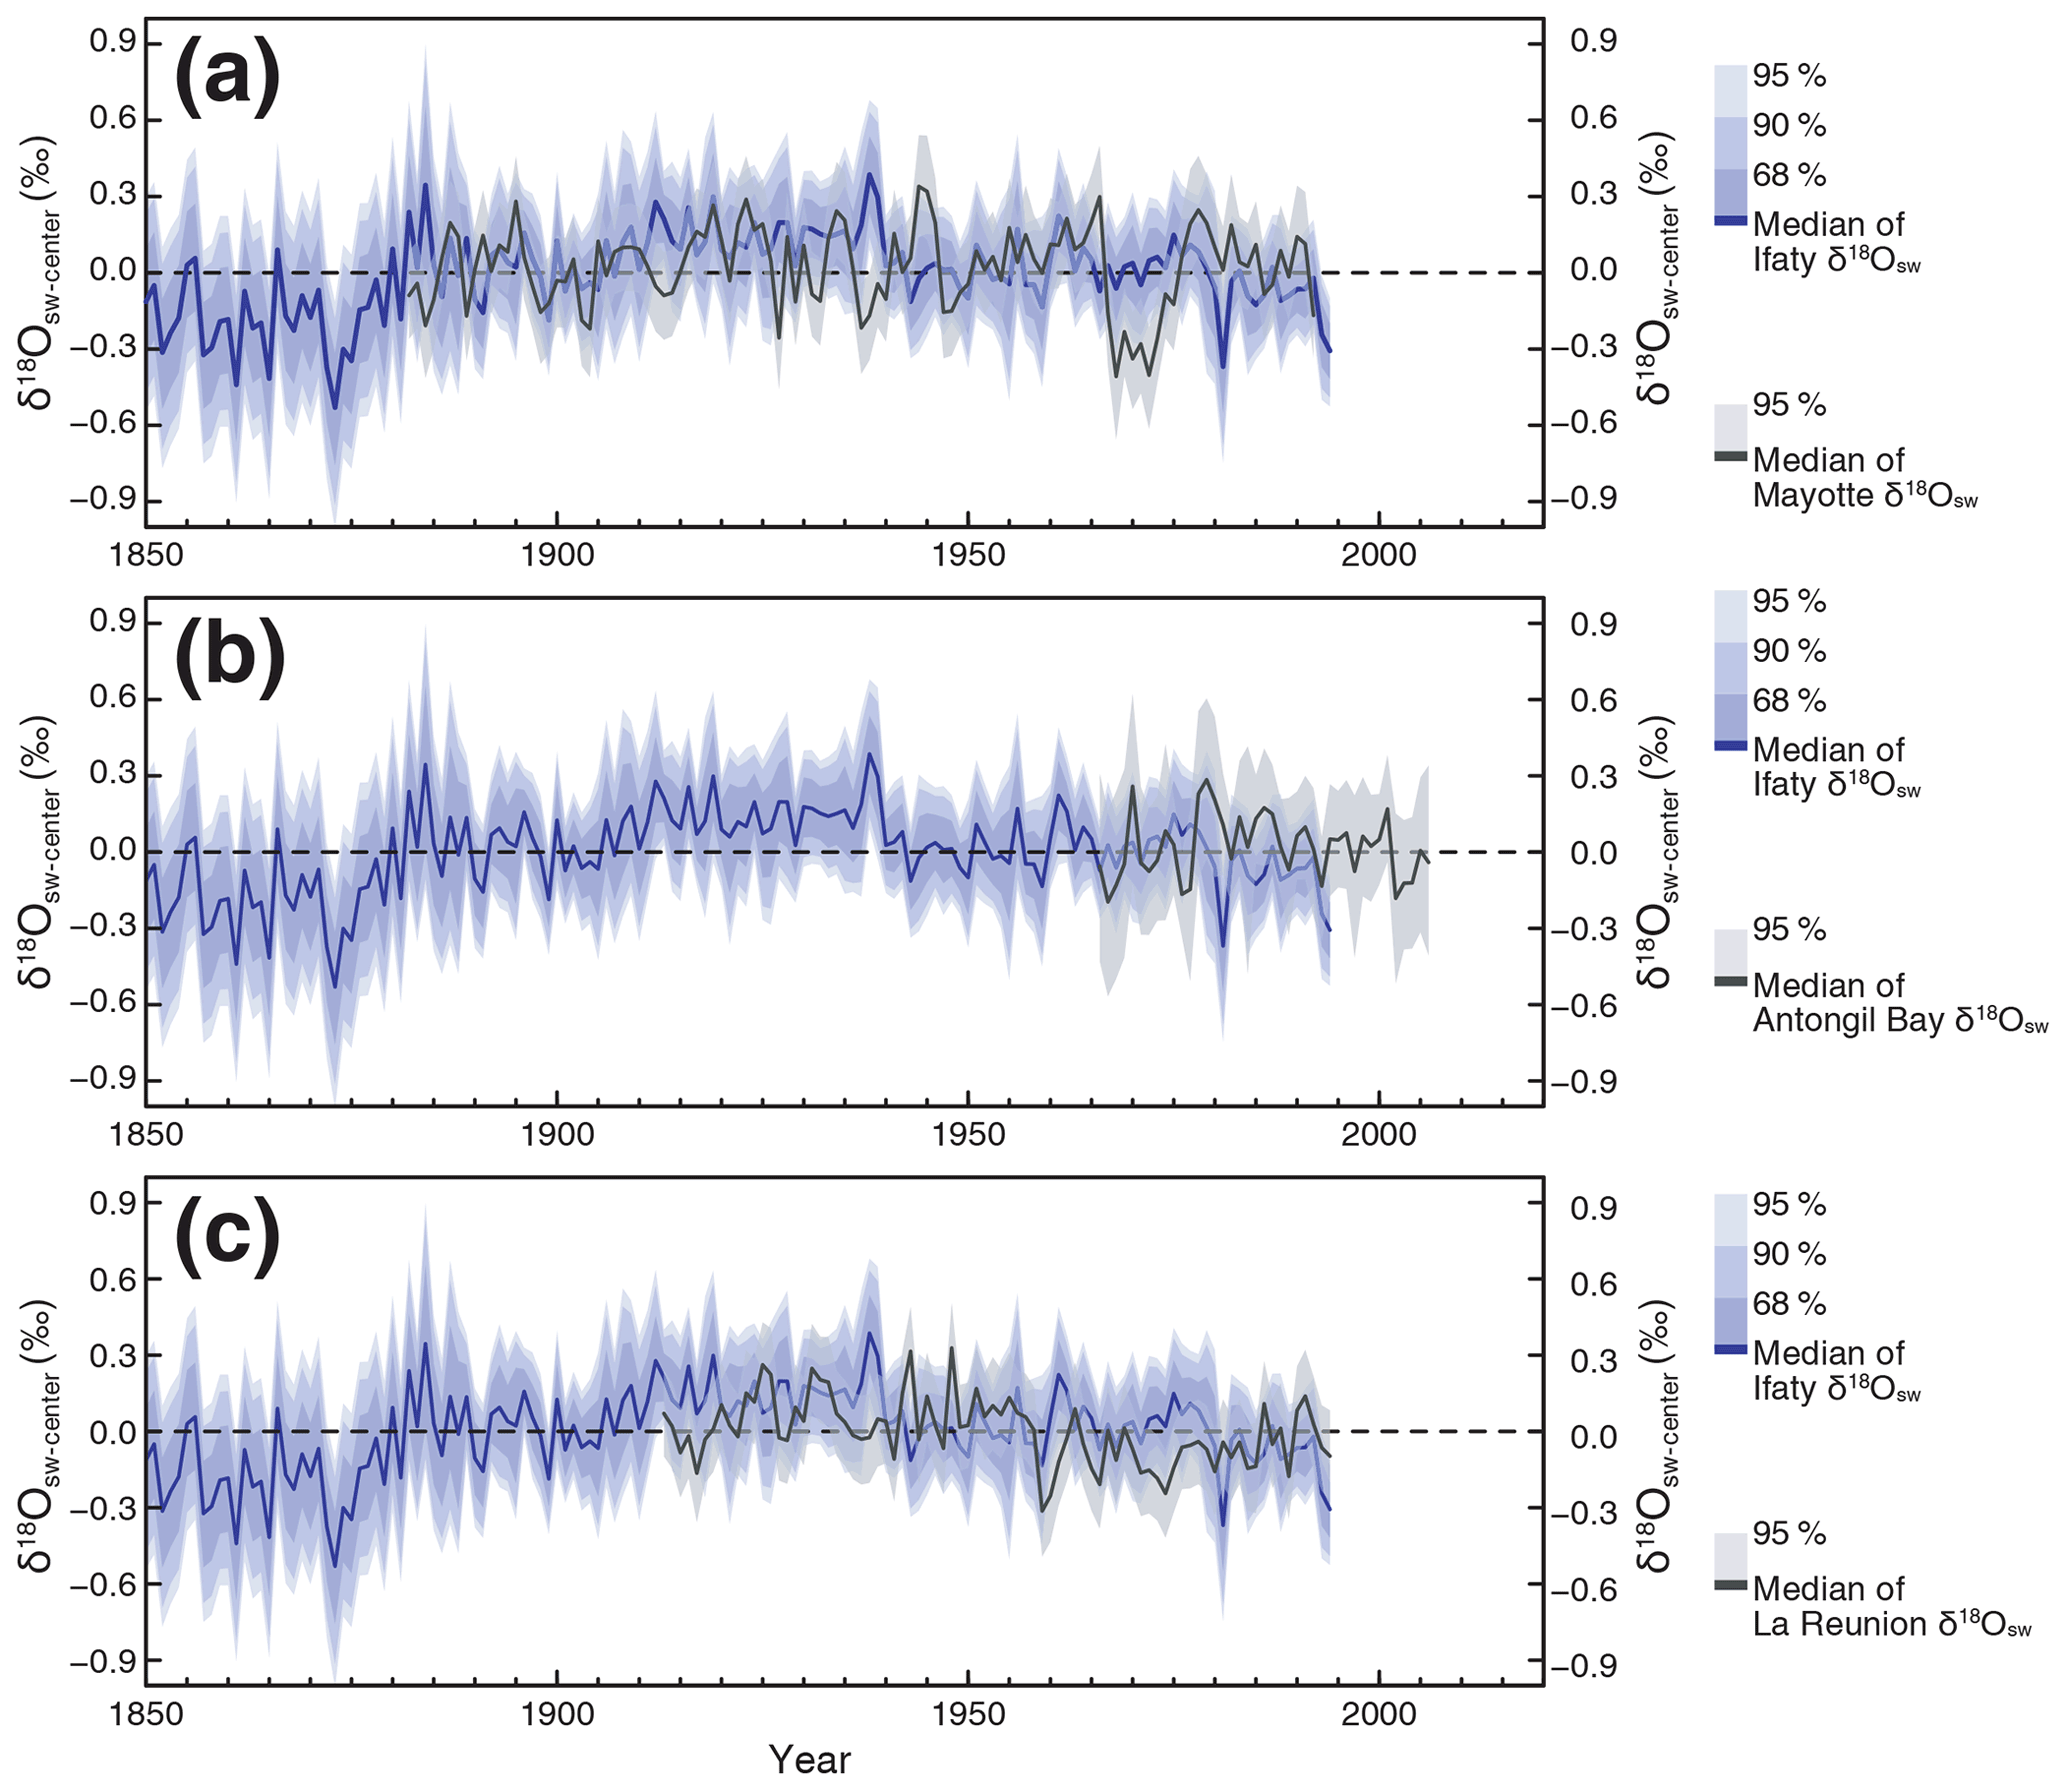
Figure 9Comparison of Ifaty δ18Oseawater (blue) using a 68 % to 95 % confidence interval (light blue) for western Indian Ocean δ18Oseawater reconstructions (a) with reconstructed δ18Oseawater for Mayotte (Comoro Archipelago; black; Zinke et al., 2008), (b) with reconstructed δ18Oseawater for Antongil Bay (northeastern Madagascar; black; Grove et al., 2012), (c) with reconstructed δ18Oseawater for La Réunion (black; Pfeiffer et al., 2019). Blue (grey) shading indicates the 68 % to 95 % confidence intervals of Ifaty (Mayotte, Antongil Bay, and La Réunion, respectively) δ18Oseawater. Only the correlation between Mayotte and Antongil Bay reconstructed δ18Oseawater is statistically significant.
4.1 Fidelity of reconstructed SST and δ18Oseawater
This study set out to characterize SST and SSS variability in the greater AC region since the Little Ice Age beyond current observational capabilities through coral δ18Oseawater and SST reconstructions. Although SST shows statistically significant correlations with the observational SST data at Ifaty and within the AC core region, those for coral δ18O SST with observational SST data were overall higher (Tab. S1). Ifaty composite coral δ18O SST was previously shown to be highly correlated with large-scale SST in the southern Indian and Atlantic oceans (Zinke et al., 2014). However, note that δ18O SST is measured on coral δ18O, centered and converted to SST units, i.e., it includes both SST and δ18Oseawater. The lower correlations of SST with observational data may be related to SST recording reef-scale SST at individual sites (Ifaty and Tulear reef) while coral δ18O bears an imprint from larger-scale processes in the region (SST, P–E, ocean advection). This may have in turn resulted in overall higher correlations of coral δ18O SST with instrumental SST. Furthermore, the mean annual SST record is largely based on yearly sampled growth increments, with the exception of multidecadal periods previously analyzed bimonthly (Zinke et al., 2004). δ18O in the Ifaty-4 core, which spans the period beyond overlap with Ifaty-1 and Tulear-3 cores, was sampled bimonthly throughout. Thus, the overall higher sample resolution in Ifaty-4 and the regionally more homogeneous coral δ18O signals between cores may have improved the overall agreement with instrumental SST. Furthermore, the standard deviation of mean annual SST at Ifaty is only 0.25 ∘C, which leads to a lower signal to noise ratio in annual SST estimates. With SST having an analytical uncertainty of ±0.15 ∘C, the correlation between ERSSTv5 and coral SST should range between 0.3 and 0.4 following the method of Smerdon et al. (2016), which is exactly what we obtained in this study (Figs. S1 and S2). However, the mean annual SST reconstruction compares favorably with previous results, both of which show lower SST in the 19th and 18th century than δ18O SST in multidecadal periods with bimonthly data in core Ifaty-4 (Zinke et al., 2004). Furthermore, the δ18Oseawater reconstruction, based on SST and ERSST5 (or HadISST), do not differ substantially between 1870 and 1995 (Figs. 3 and S5). We are thus confident that the SST provides a robust SST record for the δ18Oseawater reconstruction.
The hindcast (1958–2018) simulation with the ocean–sea-ice model configuration INALT20 at ∘ horizontal resolution (Schwarzkopf et al., 2019) supports our hypothesis that the temporal variability of SST and salinity at Ifaty–Tulear (in simulation and observations) is representative for SST and salinity in the wider AC region on interannual to sub-decadal timescales. However, salinity variability in the greater AC region appears to be highly uncertain from an observational and modeling perspective, with little agreement between salinity products. This may point to uncertainties in atmospheric reanalysis products used in the simulations and/or the scarcity of historical salinity observations in the region that feeds the salinity database (Giese and Ray, 2011). A comparison between SODA (Giese and Ray, 2011) and EN4 (Good et al., 2013) salinity data from the tropical and subtropical Indian Ocean reveals a better agreement in the tropics (Table S3). The latter may point to higher variability in salinity in the subtropics along the Rossby wave track, including the southern Mozambique Channel and greater AC region, due to more vigorous eddy activity and strong air–sea interactions paired with horizontal and vertical advection (Schott et al., 2009). However, a comprehensive assessment of the strength and weaknesses of salinity products for the southwestern Indian Ocean is beyond the scope of this paper. The model simulation further confirms our coral δ18Oseawater reconstruction findings that there is no clear, direct relationship between salinity and net surface heat and freshwater fluxes at Ifaty–Tulear and the AC region (Fig. S8). Coral δ18Oseawater and salinity values imply that upstream rainfall in the northern Mozambique Channel and east of Madagascar is introducing negative salinity anomalies that are transported into the southern Mozambique Channel by Rossby waves and eddy transport (Fig. 6). Hence, these findings support the idea that SST and salinity variability at Ifaty–Tulear and in the wider AC region is dominated by oceanic heat and freshwater and salt anomaly propagation by Rossby waves.
4.2 Large-scale drivers of AC core region SST and salinity
In this study, we showed that reconstructed δ18Oseawater, after applying a 5-year low-pass filter, agree with the results from salinity observations and reveal a positive correlation (detrended: r=0.67, p=0.0063) with the southern Indian Ocean (10–40∘ S, 50–100∘ E) ICOADS zonal wind stress. This relationship implies that negative anomalies in zonal wind stress translate into a strengthening of easterly anomalies across the southern Indian Ocean along the South Equatorial Current (SEC) route driven by the trade winds, thus resulting in lowered salinity levels (lowered δ18Oseawater). The 1-year lagged correlation between δ18Oseawater and Indian Ocean P–E anomalies indicates a negative correlation with the southern Indian Ocean (Mascarene Islands) and northern MC (Fig. 6). This relationship implies that low salinity anomalies in the Ifaty–Tulear and AC region may be derived from ocean advection by the South Equatorial Current. This result is in agreement with studies based on instrumental data and model simulations for AC transport and SST (Schouten et al., 2002; de Ruijter et al., 2005; Backeberg and Reason, 2010; Biastoch et al., 2009; Rouault et al., 2009; Loveday et al., 2014; Beal and Elipot, 2016). These studies found that large-scale variability upstream of the AC is related to southern Indian Ocean wind stress curl in the trade wind belt (Backeberg et al., 2012). Our analysis of lagged correlations with the multivariate ENSO index reveals a 12- to 18-month lag of δ18Oseawater and salinity at Ifaty and the AC region. These results agree with the 2-year lag found for the Agulhas leakage region, which is further downstream from our coral sites and implies a role for ENSO in interannual timescales of ocean connectivity (Potemra, 2001; Schouten et al., 2002; Wijffels and Meyers, 2004; de Ruijter et al., 2005; Palastanga et al., 2006; Putrahasan et al., 2016; Paris and Subrahmanyam, 2018). Salinity studies in the Agulhas leakage region have revealed a 20- to 26-month lag to ENSO forcing, whereby a fresh anomaly is replaced 2 years later by a saline anomaly following El Niño (and vice versa for La Niña) (Paris and Subrahmanyam, 2018; Trott et al., 2021). The lagged relationship between ENSO and δ18Oseawater is robust up to 1750 based on analysis with two paleo-ENSO reconstructions. In summary, δ18Oseawater, together with observational data and ocean model simulations, imply a lagged response to large-scale wind forcing in response to southern Indian Ocean trade wind changes. However, ENSO alone only explains a small fraction of the AC region SST and salinity variability (Elipot and Beal, 2018). Extratropical atmospheric and local stochastic variability are also likely important factors affecting such SST and salinity fluctuations (Putrasahan et al., 2016). According to Elipot and Beal (2018), ENSO explains 11.5 % of AC transport and 20 %–30 % of sea surface height variability, while other Southern Hemisphere atmospheric modes explain 29 % of such variance. This highlights the complex atmospheric and oceanic dynamics within the AC region and the southern Indian Ocean.
Having established that wind forcing is a likely candidate for driving large-scale ocean advection in the AC region, we now discuss the trends and variability in coral-derived SST and δ18Oseawater reconstructions. The new δ18Oseawater reconstruction is dominated by multidecadal to centennial variability throughout the 334-year record, punctuated by strong interannual and interdecadal variability. Similar to SST, δ18Oseawater shows the largest interannual variability during the Late Maunder Minimum (LMM; 1670–1715) when solar activity was low, which is in agreement with previous studies based on Ifaty-4 coral δ18O (Zinke et al., 2004, 2014). Multitaper spectral analysis and moving 30-year standard deviations for both reconstructed mean annual SST and δ18Oseawater confirm higher interannual variability during the so-called Little Ice Age (1661–1900) than the 20th century (Figs. 7, S11). Nevertheless, part of the higher interannual variability between 1661 and 1900 may stem from the use of a single coral core and overall higher magnitude of variability in SST compared to δ18O SST (Fig. 2). Spectral coherence analysis suggests that Ifaty–Tulear SST and δ18Oseawater is coherent with paleo-ENSO reconstructions at frequencies between 2 and 4 years and at decadal bands ranging between 8 and 30 years (Figs. 7; S13–S14). However, the bandpass-filtered δ18Oseawater reconstruction and paleo-ENSO reconstructions for interannual to multi-decadal periodicities showed various levels of agreement and disagreement with individual ENSO reconstructions. Wavelet coherence analysis indicated a high level of agreement in the 20th century in the 8–16-year frequency band but showed a phase lag of between 90 and 180∘. The 8–16-year frequency is present in all ENSO records and both Ifaty–Tulear δ18Oseawater and SST, and thus it appears to be an important timescale of variability in the greater Agulhas region. The latter was also identified in instrumental SST records and coral-derived SST reconstructions at Ifaty (Zinke et al., 2004, 2009, 2014). Running (31-year) correlations revealed a highly non-stationary relationship between Ifaty δ18Oseawater and ENSO, switching between negative and positive correlations (Fig. S15). A non-stationary ENSO relationship was also found by Zinke et al. (2004) for the high-resolution Ifaty-4 δ18O record between 1870 and 1995. The latter was attributed to a non-stationary relationship between Ifaty SST with ENSO.
Indian Ocean coral records from the southeast and southwest also indicate a period of larger interannual and decadal variability around the turn of the 17th century (Damassa et al., 2006; Abram et al., 2020; Leupold et al., 2021). The larger interannual variability is ascribed to higher ENSO and IOD variability at this time, as confirmed by the eastern and western Indian Ocean (Damassa et al., 2006; Abram et al., 2020; Leupold et al., 2021) and central Pacific Ocean (Cobb et al., 2013) coral reconstructions. A (bi)monthly coral δ18O record from Ifaty indicated a stronger relationship with ENSO when ENSO variability was high during the observational period (Zinke et al., 2004). The dominant interannual frequency band in coral δ18O was 3.9 years, which is typical for ENSO variability. The bandpass-filtered (4-year) bimonthly coral δ18O record revealed substantial amplitudinal variations between 1680–1720, 1760–1790, 1870–1920, 1930–1940, and 1960–1995, which were ascribed to ENSO (Zinke et al., 2004). The larger interannual swings in mean annual reconstructed Ifaty SST and δ18Oseawater presented here may therefore be partly ascribed to ENSO. ENSO excites oceanic Rossby waves, leading to warming during El Niño and cooling with La Niña in the southwestern Indian Ocean (East and North of Madagascar), usually one season after ENSO has peaked (Schott et al., 2009). The observational SST record has also revealed a 1- to 2-year lag between ENSO and AC and AL SST, respectively (Putrasahan et al., 2016). Salinity in the AC region also apparently lags El Niño and La Niña events for up to 2 years (Trott et al., 2021). The ENSO-related SST signal develops faster than salinity, which is most probably related to ENSO's influence on atmospheric processes in the southern Indian Ocean (Putrasahan et al., 2016). The mean annual δ18Oseawater record agrees with these previous findings of a 12- to 18-month lag with the multivariate ENSO and paleo-ENSO indices. In summary, these findings raise the possibility that interannual δ18Oseawater variability may be steered at least partly by ENSO.
Decadal variability in the southwestern Indian Ocean SST is said to be related to ENSO-like decadal variability driven by sea-level pressure and wind fields (Reason, 2001; Schott et al., 2009). To this end, coral δ18O records from Ifaty–Tulear and La Réunion indicate strong spatial and temporal covariance with ENSO-like decadal variability and the Pacific decadal oscillation (PDO) in SST and sea level pressure (SLP) fields (Crueger et al., 2009). Furthermore, multitaper spectral analysis indicates a 57-year (42- to 68-year band) multidecadal frequency in Ifaty δ18Oseawater and a 33-year (27- to 42-year band) frequency in SST (Figs. 8; S11). Both multidecadal variations indicate higher amplitudes during the Little Ice Age compared to the 20th century (Figs. 8; S11). Furthermore, the decadal to interdecadal variability for Ifaty–Tulear δ18Oseawater and SST is coherent with paleo-ENSO indices in the 8–16-year frequency band (and is partly coherent in the 30-year band), as shown above, and indicates higher power between 1650 and 1850 (Figs. 7; S13–S14). A coral SST record from Rodrigues island in the Mascarene Island chain and a coral luminescence record from Antongil Bay (northeastern Madagascar) also demonstrate a link between the PDO and Indian Ocean SST and rainfall, respectively (Grove et al., 2013; Zinke et al., 2016). Similarly, Damassa et al. (2006) found enhanced multidecadal variability in a 17th-century coral δ18O record from Mafia Island (Tanzania) partly ascribed to ENSO-like decadal variability. A coral δ18Oseawater reconstruction from Mayotte (northern MC) is characterized by interdecadal variability in the 18- to 25-year band, while the Ifaty-4 coral δ18O record has such variability centered around 16–18 years (Zinke et al., 2004, 2008, 2009). While the La Réunion coral δ18O indicates coherence with ENSO-like decadal variability, the synthesis of tropical and subtropical western Indian Ocean coral δ18O records also show pronounced decadal variability that is not necessarily connected to ENSO (Pfeiffer et al., 2004; Zinke et al., 2009). Thus, similar to ENSO, Pacific decadal variability appears to steer decadal variability in the wider southwestern Indian Ocean and AC core region, as observed in instrumental data (Reason, 2001; Reason and Rouault, 2002; Schott et al., 2009). However, regional modes of variability acting on interannual to decadal timescales in the subtropical and midlatitude Indian Ocean may interact with ENSO-like decadal variability and mask clear relationships (Elipot and Beal, 2018).
We consider published δ18Oseawater reconstructions from La Réunion (Mascarene Islands; Pfeiffer et al., 2004, 2019), Antongil Bay (northeastern Madagascar; Grove et al., 2012), and Mayotte (Comoro Islands; Zinke et al., 2008), obtained along the South Equatorial Current pathway in the southern Indian Ocean, to assess whether these records share variability with our new Ifaty δ18Oseawater reconstruction (Figs. 9; S17–S18). Considering the uncertainties in δ18Oseawater reconstructions, we find overall comparable trends across the southern Indian Ocean locations and regional nuances. This implies that regional processes (e.g., P–E balance, horizontal and vertical advection, ocean eddies) strongly modify surface salinity and therefore δ18Oseawater while being advected across the southern Indian Ocean. SODA salinity data confirm the latter (Fig. S6). For instance, at Mayotte δ18Oseawater is strongly related to local rainfall station data between 1950 and 1995 (Zinke et al., 2008). The Mayotte coral record was obtained from a relatively shallow lagoonal site that is probably more sensitive to local rainfall or the P–E balance affecting δ18Oseawater (Fig. S16). The Antongil Bay site in northeastern Madagascar is under the influence of several smaller river catchments that drain into the enclosed bay area (Grove et al., 2012). Thus, salinity and δ18Oseawater may be strongly affected by both regional rainfall and river freshwater discharge (Fig. S16). The La Réunion coral record was obtained from the leeward side of the island where the flow of the South Equatorial Current is diverted around the island (Pfeiffer et al., 2004, 2019). The high topographic relief of La Réunion (>3000 m) blocks rainfall derived from the east–southeast from reaching the leeward island. Thus, salinity and therefore δ18Oseawater mid-20th-century freshening may not be a prime South Equatorial Current signature. Local freshwater discharge by rivers or groundwater from the high mountainous terrain of La Réunion may also contribute to local δ18Oseawater variability. However, La Réunion δ18Oseawater shows a negative correlation with rainfall on the eastern coast of Madagascar, with both regions being under the influence of the trade winds transporting moisture to Madagascar (Fig. S16). Nevertheless, the regional comparison between δ18Oseawater records suggests that such reconstructions bear huge potential to unlock past interannual and decadal changes in regional surface ocean hydrology and ocean transport dynamics across the southern Indian Ocean beyond the short instrumental record.
The aim of this study was to unravel SSS variability in the AC region since the Little Ice Age. This is done based on paired coral and δ18O records obtained from the Ifaty–Tulear reef southwest of Madagascar. Our new 334-year (1661–1995) annual δ18Oseawater composite record from Ifaty–Tulear traces surface salinity of the southern MC and AC core region from SODA since 1958. A high-resolution ocean model confirms that our study site is optimally located to trace AC region SSS and SST variability. Although the interannual changes in ocean model salinity only partly agree with observations and coral δ18Oseawater, it demonstrates the huge potential of combining high-resolution ocean model studies with paleoclimate reconstructions to improve upon the mechanistic understanding of ocean dynamics at the scale of coral reefs and beyond. Ifaty–Tulear δ18Oseawater and AC salinity appear to not be driven by regional precipitation–evaporation changes but are instead driven by upstream changes. We show that δ18Oseawater variability is likely driven by changes in the large-scale wind forcing (zonal wind stress) in the southern Indian Ocean on interannual to decadal timescales, as has been suggested based on short observational studies. The δ18Oseawater at Ifaty co-varies with the southwestern Indian Ocean coral-derived δ18Oseawater records along the path of the South Equatorial Current, suggesting that ocean advection may significantly contribute to salinity changes in the wider southwestern Indian Ocean. Ocean advection may be assisted by the wind stress changes along the South Equatorial Current pathway in the southwestern Indian Ocean, modulated by ENSO or IOD. Both δ18Oseawater and SST at Ifaty show characteristic interannual variability of between 2 and 4 years that is most likely driven by ENSO. ENSO changes are shown to lead Ifaty and AC salinity and δ18Oseawater by 12 to 18 months, in agreement with previous studies on Agulhas leakage salinity and SST. The δ18Oseawater at Ifaty and SST reconstructions reveal the highest interannual variability during the Little Ice Age, between 1700 and 1900, highest during the 1670–1710 period. Interdecadal variability is also coherent between δ18Oseawater and SST and ENSO reconstructions and was also enhanced during the 1670–1710 period. Other Indo-Pacific coral studies have also indicated a high variability in Indian Ocean Dipole and ENSO variability at the turn of the 16th to 17th century. Our study demonstrates that surface ocean salinity, derived from coral δ18Oseawater in the AC region underwent strong interannual and decadal changes since 1661, clearly showing the highly dynamic nature of this particular oceanic region. The interdecadal 8–16-year frequency band appears as a prominent timescale of variability in the greater Agulhas region surface ocean with strong links to ENSO-like decadal variability. A wider network of coral δ18Oseawater and SST reconstructions spanning the AC region and the Mozambique Channel would be instrumental in ground truthing the role of ocean advection in driving surface salinity and SST variations in the southern Indian Ocean. Ultimately, such long records may help assess the variability of Agulhas leakage salinity and SST over multidecadal to centennial timescales, as well as the resulting potential modulations of the AMOC. Thus, developing paired coral sand δ18O time series for such key regions of ocean dynamics may improve our understanding of extreme events, their impacts on ecosystems and societies, and their drivers.
Data generated for this publication are provided as Tables S3 and S4 in the Supplement. Data will be stored publicly at https://www.ncei.noaa.gov/products/paleoclimatology (last access: 7 June 2022; NOAA NCEI, 2022) once this article has been published.
The supplement related to this article is available online at: https://doi.org/10.5194/cp-18-1453-2022-supplement.
JZ conceived the study, obtained financial support, conducted the analysis of coral proxy and observational data, and drafted the paper. SR and AB analyzed the ocean model data, interpreted the data, provided figures, and contributed ideas. TKW developed the seawater oxygen isotope Monte Carlo simulation. DGS and MP provided the ICP-OES laboratory at Kiel University and checked the quality of all trace element data. MP and SG provided corrections to the manuscript. All co-authors commented on the manuscript and applied corrections.
The contact author has declared that neither they nor their co-authors have any competing interests.
Publisher's note: Copernicus Publications remains neutral with regard to jurisdictional claims in published maps and institutional affiliations.
A Royal Society Wolfson Fellowship (grant no. RSWF-FT-180000) and an Honorary Fellowship at the University of Witwatersrand supported Jens Zinke. This work was supported as part of the SINDOCOM grant under the Dutch NWO program “Climate Variability” (grant no. 854.00034/035). Additional support was provided by the NWO ALW project CLIMATCH (grant no. 820.01.009) and the Western Indian Ocean Marine Science Association through the Marine Science for Management programme (grant no. MASMA/CC/2010/02) led by Chris Reason and Jens Zinke. We thank the VU Amsterdam (the Netherlands), and especially Suzan Verdegaal, for assistance with stable isotope analysis. We thank Wolf-Christian Dullo and Georg Heiss from GEOMAR Helmholtz Centre for Ocean Research Kiel and the Free University of Berlin, respectively, and the EU TESTREEF party for sampling the coral cores in 1995.
A Royal Society Wolfson Fellowship (grant no. RSWF-FT-180000) and an Honorary Fellowship at the University of Witwatersrand supported Jens Zinke. This work was supported as part of the SINDOCOM grant under the Dutch NWO program “Climate Variability” (grant no. 854.00034/035). Additional support was provided by the NWO ALW project CLIMATCH (grant no. 820.01.009) and the Western Indian Ocean Marine Science Association through the Marine Science for Management programme (grant no. MASMA/CC/2010/02) led by Chris Reason and Jens Zinke.
This paper was edited by Nerilie Abram and reviewed by two anonymous referees.
Abram, N. J., Wright, N. M., Ellis, B., Dixon, B. C., Wurtzel, J. B., England, M. H., Ummenhofer, C. C., Philibosian, B., Cahyarini, S. Y., Yu, T. L., Shen, C. C., Cheng, H., Edwards, R. L., and Heslop, D.: Coupling of Indo-Pacific climate variability over the last millennium, Nature, 579, 385–392, 2020.
Backeberg, B. C. and Reason, C. J. C.: A connection between the South Equatorial Current north of Madagascar and Mozambique Channel eddies, Geophys. Res. Lett., 37, L04604, https://doi.org/10.1029/2009GL041950, 2010.
Backeberg, B. C., Penven, P., and Rouault, M.: Impact of intensified Indian Ocean winds on mesoscale variability in the Agulhas system, Nat. Clim. Change, 2, 608–612, 2012.
Beal, L. M. and Elipot, S.: Broadening not strengthening of the Agulhas Current since the early 1990s, Nature, 540, 570–573, 2016.
Beal, L. M., De Ruijter, W. P. M., Biastoch, A., Zahn, R., Cronin, M., Hermes, J., Lutjeharms, J., Quartly, G., Tozuka, T., Baker-Yeboah, S., Bornman, T., Cipollini, P., Dijkstra, H., Hall, I., Park, W., Peeters, F., Penven, P., Ridderinkhof, H., and Zinke, J.: On the role of the Agulhas system in ocean circulation and climate, Nature, 472, 429–436, 2011.
Bevington, P. R.: Data reduction and error analysis for the physical sciences, chapter 4: Propagation of error, Mc Graw-Hill Book Co., New York, San Francisco, St. Louis, Toronto, London, Sydney, 56–65, ISBN 0-07-247227-8, 2003.
Biastoch, A., Boening, C. W., Schwarzkopf, U., and Lutjeharms, J. R. E.: Increase in Agulhas leakage due to poleward shift of the Southern Hemisphere westerlies, Nature, 462, 495–498, 2009.
Biastoch, A., Durgadoo, J. V., Morrison, A. K., van Sebille, E., Weijer, W., and Griffies, S. M.: Atlantic multi-decadal oscillation covaries with Agulhas leakage, Nat. Commun., 6, 10082, https://doi.org/10.1038/ncomms10082, 2015.
Biastoch, A., Schwarzkopf, F. U., Getzlaff, K., Rühs, S., Martin, T., Scheinert, M., Schulzki, T., Handmann, P., Hummels, R., and Böning, C. W.: Regional imprints of changes in the Atlantic Meridional Overturning Circulation in the eddy-rich ocean model VIKING20X, Ocean Sci., 17, 1177–1211, https://doi.org/10.5194/os-17-1177-2021, 2021.
Bruggemann, H., Rodier, M., Guillaume, M. M., Andréfouët, S., Arfi, R., Cinner, J., Pichon, M., Ramahatratra, F., Rasoamanendrika, F., Zinke, J., and McClanahan, T.: Social-ecological problems forcing unprecedented change on the latitudinal margins of coral reefs: the case of southwest Madagascar, Ecol. Soc., 17, 47, https://doi.org/10.5751/ES-05300-170447, 2012.
Boutin, J., Reul, N., Koehler, J., Martin, A., Catany, R., Guimbard, S., Rouffi, F., Vergely, J. L., Arias, M., Chakroun, M., Corato, G., Estella-Perez, V., Hasson, A., Josey, S., Khvorostyanov, D., Kolodziejczyk, N., Mignot, J., Olivier, L., Reverdin, G., Stammer, D., Supply, A., Thouvenin-Masson, C., Turiel, A., Vialard, J., Cipollini, P., Donlon, C., Sabia, R., and Mecklenburg, S..: Satellite-based sea surface salinity designed for ocean and climate studies, J. Geophys. Res.-Oceans, 126, e2021JC017676, https://doi.org/10.1029/2021JC017676, 2021.
Cahyarini, S. Y., Pfeiffer, M., Timm, O., Dullo, W.-C., and Schönberg, D. G.: Reconstructing seawater δ18O from paired coral δ18O and ratios: Methods, error analysis and problems, with examples from Tahiti (French Polynesia) and Timor (Indonesia), Geochim. Cosmochim. Ac., 72, 2841–2853, 2008.
Cobb, K. M., Westphal, N., Sayani, H. R., Watson, J. T., Di Lorenzo, E., Cheng, H., and Charles, C. D.: Highly variable El Niño–Southern Oscillation throughout the Holocene, Science, 339, 67–70, 2013.
Corrège, T.: Sea surface temperature and salinity reconstruction from coral geochemical tracers, Palaeogeogr. Palaeocl. Palaeoecol., 232, 408–428, 2006.
Crueger, T., Zinke, J., and Pfeiffer, M.: Patterns of Pacific decadal variability recorded by Indian Ocean corals, Int. J. Earth Sci., 98, 41–52, 2009.
Damassa, T. D., Cole, J. E., Barnett, H. R., Ault, T. R., and McClanahan, T. R.: Enhanced multidecadal climate variability in the seventeenth century from coral isotope records in the western Indian Ocean, Paleoceanography, 21, PA2016, https://doi.org/10.1029/2005PA001217, 2006.
de Ruijter, W. P. M., Ridderinkhof, H., and Schouten, M. W.: Variability of the southwest Indian Ocean. Philos. T. Roy. Soc. A, 363, 63–76, 2005.
de Villiers, S., Greaves, M., and Elderfield, H.: An intensity ratio calibration method for the accurate determination of and of marine carbonates by ICP-AES, Geochem. Geophys. Geosy., 3, 1001, https://doi.org/10.1029/2001GC000169, 2002.
Elipot, S. and Beal, L. M.: Observed Agulhas Current Sensitivity to Interannual and Long-Term Trend Atmospheric Forcings, J. Climate, 31, 3077–3098, 2018.
Emile-Geay, J., Cobb, K. M., Mann, M. E., Wittenberg, A. T. Estimating tropical Pacific SST variability over the past millennium. Part 2: Reconstructions and uncertainties, J. Climate, 26, 2329–2352, 2013.
Feng, M. and Meyers, G.: Interannual variability in the tropical Indian Ocean: A two-year time-scale of Indian Ocean dipole, Deep-Sea Res. Pt. II, 50, 2263–2284, 2003.
Freeman, E., Woodruff, S. D., Worley, S. J., Lubker, S. J., Kent, E. C., Angel, W. E., Berry, D. I., Brohan, P., Eastman, R., Gates, L., Gloeden, W., Ji, Z., Lawrimore, J., Rayner, N. A., Rosenhagen, G., and Smith, S. R.: ICOADS Release 3.0: A major update to the historical marine climate record, Int. J. Climatol., 37, 2211–2237, 2017.
Giese, B. S. and Ray S.: El Niño variability in simple ocean data assimilation (SODA), 1871–2008, J. Geophys. Res., 116, C02024, https://doi.org/10.1029/2010JC006695, 2011.
Giese, B. S., Seidel, H. F., Compo, G. P., and Sardeshmukh, P. D.: An ensemble of ocean reanalyses for 1815–2013 with sparse observational input, J. Geophys. Res.-Oceans, 121, 6891–6910, 2016.
Good, S. A., Martin, M. J., and Rayner, N. A.: EN4: Quality controlled ocean temperature and salinity profiles and monthly objective analyses with uncertainty estimates, J. Geophys. Res.-Oceans, 118, 6704–6716, 2013.
Grove, C. A., Zinke, J., Scheufen, T., Maina, J., Epping, E., Boer, W., Randriamanantsoa, B., and Brummer, G.-J. A.: Spatial linkages between coral proxies of terrestrial runoff across a large embayment in Madagascar, Biogeosciences, 9, 3063–3081, https://doi.org/10.5194/bg-9-3063-2012, 2012.
Grove, C. A., Zinke, J., Peeters, F., Park, W., Scheufen, T., Kasper, S., Randriamanantsoa, B., McCulloch, M. T., and Brummer, G.-J. A.: Madagascar corals reveal a multidecadal signature of rainfall and river runoff since 1708, Clim. Past, 9, 641–656, https://doi.org/10.5194/cp-9-641-2013, 2013.
Grunseich, G., Subrahmanyam, B., Murty, V. S. N., and Giese, B. S.: Sea surface salinity variability during the Indian Ocean Dipole and ENSO events in the tropical Indian Ocean, J. Geophys. Res., 116, C11013, https://doi.org/10.1029/2011JC007456, 2011.
Harris, A., Manahira, G., Sheppard, A., Gouch, C., and Sheppard, C.: Demise of Madagascar's once great barrier reef: changes in coral reef conditions over 40 years, Atoll Research Bulletin, 574, 16, https://doi.org/10.5479/si.00775630.574.16, 2010.
Hegerl, G. C., Black, E., Allan, R. P., Ingram, W. J., Polson, D., Trenberth, K. E., Chadwick, R. S., Arkin, P. A., Sarojini, B. B., Becker, A., Dai, A., Durack, P. J., Easterling, D., Fowler, H. J., Kendon, E. J., Huffman, G. J., Liu, C., Marsh, R., New, M., Osborn, T. J., Skliris, N., Stott, P. A., Vidale, P., Wijffels, S. E., Wilcox, L. J., Willett, K. M., and Zhang, X.: Challenges in quantifying changes in the global water cycle, B. Am. Meteorol. Soc., 96, 1097–1115, 2015.
Hu, S. and Fedorov, A. A.: Indian Ocean warmng can strengthen the Atlantic meridional overturning circulation, Nat. Clim. Change, 9, 747–751, 2019.
Huang, B., Thorne, P. W., Banzon, V. F., Boyer, T., Cherupin, G., Lawrimore, J. H., Menne, M. J., Smith, T. M., Vose, R. S., and Zhang, H. M.: Extended Reconstructed Sea Surface Temperature, Version 5 (ERSSTv5): Upgrades, Validations, and Intercomparisons, J. Climate, 30, 8179–8205, 2017.
Large, W. G. and Yeager, S.: The global climatology of an interannually varying air-sea flux data set, Clim. Dynam., 33, 341–364, 2009.
LeGrande, A. N. and Schmidt, G. A.: Global gridded data set of the oxygen isotopic composition in seawater, Geophys. Res. Lett., 33, L12604, https://doi.org/10.1029/2006GL026011, 2006.
LeGrande, A. N. and Schmidt, G. A.: Water isotopologues as a quantitative paleosalinity proxy, Paleoceanography, 26, PA3225, https://doi.org/10.1029/2010PA002043, 2011.
Leupold, M., Pfeiffer, M., Watanabe, T. K., Reuning, L., Garbe-Schönberg, D., Shen, C.-C., and Brummer, G.-J. A.: El Niño–Southern Oscillation and internal sea surface temperature variability in the tropical Indian Ocean since 1675, Clim. Past, 17, 151–170, https://doi.org/10.5194/cp-17-151-2021, 2021.
Lough, J. M.: A strategy to improve the contribution of coral data to high-resolution paleoclimatology, Palaeogeogr. Palaeoclimatol. Palaeoecol., 204, 115–143, 2004.
Loveday, B. R., Durgadoo, J. V., Reason, C. J. C., Biastoch, A., and Penven, P.: Decoupling of the Agulhas Current from the Agulhas Leakage, J. Phys. Oceanogr., 44, 1776–1797, 2014.
McClanahan, T. R., Ateweberhan, M., Omukoto, J., and Pearson, L.: Recent seawater temperature histories, status, and predictions for Madagascar's coral reefs, Mar. Ecol. Prog. Ser., 380, 117–128, 2008.
McClanahan, T. R., Ateweberhan, M., Omukoto, J., and Pearson, L.: Recent seawater temperature histories, status, and predictions for Madagascar’s coral reefs, Mar. Ecol. Prog. Ser., 380, 117–128, 2009.
NOAA NCEI (National Centers for Environmental Information): Paleo Data, NOAA NCEI [data set], https://www.ncei.noaa.gov/products/paleoclimatology, last access: 7 June 2022.
Palastanga, V., van Leeuwen, P. J., and de Ruijter, W. P. M.: A link between low-frequency mesoscale eddy variability around Madagascar and the large-scale Indian Ocean variability, J. Geophys. Res., 111, C09029, https://doi.org/10.1029/2005JC003081, 2006.
Paris, M. L. and Subrahmanyam, B.: Role of El Niño Southern Oscillation (ENSO) Events on Temperature and Salinity Variability in the Agulhas Leakage Region, Remote Sens., 10, 127, https://doi.org/10.3390/rs10010127, 2018.
Peeters, F. J. C., Acheson, R., Brummer, G.-J. A., de Ruijter, W. P. M., Schneider, R. R., Ganssen, G. M., Ufkes, E., and Kroon, D.: Vigorous exchange between the Indian and Atlantic oceans at the end of the past five glacial periods, Nature, 430, 661–665, 2004.
Pfeiffer, M., Timm, O., and Dullo, W.-C.: Oceanic forcing of interannual and multidecadal climate variability in the southwestern Indian Ocean: evidence from a 160 year coral isotopic record (La Reunion, 50∘ E, 21∘ S), Paleoceanography, 19, PA4006, https://doi.org/10.1029/2003PA000964, 2004.
Pfeiffer, M., Reuning, L., Zinke, J., Garbe-Schönberg, D., Leupold, M., and Dullo, W.-C.: 20th Century δ18O Seawater and Salinity Variations Reconstructed From Paired δ18O and Measurements of a La Reunion Coral, Paleoceanography and Paleoclimatology, 34, 2183–2200, https://doi.org/10.1029/2019PA003770, 2019.
Potemra, J. T.: Contribution of equatorial Pacific winds to southern tropical Indian Ocean Rossby waves, J. Geophys. Res., 106, 2407–2422, 2001.
Putrasahan, D., Kirtman, B. P., and Beal, L. M.: Modulation of SST interannual variability in the Agulhas leakage region associated with ENSO, J. Climate, 29, 7089–7102, 2016.
Rahmstorf, S., Box, J. E., Feulner, G., Mann, M. E., Robinson, A., Rutherford, S., and Schaffernicht, E. J.: Exceptional twentieth-century slowdown in Atlantic Ocean overturning circulation, Nat. Clim. Change, 5, 475–480, 2015.
Randriamahefasoa, T. S. M. and Reason, C. J. C.: Interannual variability of rainfall characteristics over southwestern Madagascar, Theor. Appl. Climatol., 128, 421–437, 2017.
Rayner, N. A., Parker, D. E., Horton, E. B., Folland, C. K., Alexander, L. V., Rowell, D. P., Kent, E. C., and Kaplan, A.: Global analyses of sea surface temperature, sea ice, and night marine air temperature since the late nineteenth century, J. Geophys. Res., 108, 4407, https://doi.org/10.1029/2002JD002670, 2003.
Reason, C. J. C.: Subtropical Indian Ocean SST dipole events and southern African rainfall, Geophys. Res. Lett., 28, 2225–2227, 2001.
Reason, C. J. C. and Rouault, M.: ENSO-like decadal variability and South African rainfall, Geophys. Res. Lett., 29, 16-1–16-4, https://doi.org/10.1029/2002GL014663, 2002.
Rouault, M., Penven, P., and Pohl, B.: Warming in the Agulhas system since the 1980's, Geophys. Res. Lett., 36, L12602, https://doi.org/10.1029/2009GL037987, 2009.
Schmidt, C., Schwarzkopf, F. U., Rühs, S., and Biastoch, A.: Characteristics and robustness of Agulhas leakage estimates: an inter-comparison study of Lagrangian methods, Ocean Sci., 17, 1067–1080, https://doi.org/10.5194/os-17-1067-2021, 2021.
Schott, F. A., Xie, S. P., and McCreary Jr, J. P.: Indian Ocean Circulation and Climate Variability, Rev. Geophys., 47, 1–46, 2009.
Schouten, M. W., de Ruijter, W. P. M., van Leeuwen, P. J., and Dijkstra, H. A.: An oceanic teleconnection between the equatorial and southern Indian Ocean, Geophys. Res. Lett., 29, 591–594, 2002.
Schwarzkopf, F. U., Biastoch, A., Böning, C. W., Chanut, J., Durgadoo, J. V., Getzlaff, K., Harlaß, J., Rieck, J. K., Roth, C., Scheinert, M. M., and Schubert, R.: The INALT family – a set of high-resolution nests for the Agulhas Current system within global NEMO ocean/sea-ice configurations, Geosci. Model Dev., 12, 3329–3355, https://doi.org/10.5194/gmd-12-3329-2019, 2019.
Schrag, D. P.: Rapid analyses of high-precision ratios in corals and other marine carbonates, Paleoceanography, 14, 97–102, 1999.
Simon, M. H., Arthur, K. L., Hall, I. R., Peeters, F. J. C., Loveday, B. R., Barker, S., Ziegler, M., and Zahn, R.: Millennial-scale Agulhas Current variability and its implications for salt-leakage through the Indian–Atlantic Ocean Gateway, Earth Planet. Sc. Lett., 383, 101–112, 2013.
Skliris, N., Marsh, R., Josey, S. A., Good, S. A., Liu, C., and Allan, R. P.: Salinity changes in the World Ocean since 1950 in relation to changing surface freshwater fluxes, Clim. Dynam., 43, 709–736, https://doi.org/10.1007/s00382-014-2131-7, 2014.
Smerdon, J. E., Luterbacker, J., and Phipps, S. J.: Hydro2k: Integrating proxy data and models for insights into past and future hydroclimate, Past Global Changes Magazine 24, 45, https://doi.org/10.22498/pages.24.1.45, 2016.
Steiger, N. J., Smerdon, J. E., Cook, E. R., and Cook, B. I.: Data Descriptor: A reconstruction of global hydroclimate and dynamical variables over the Common Era. Sci. Data, 5, 180086, https://doi.org/10.1038/sdata.2018.86, 2018.
Thompson, D. M., Ault, T. R., Evans, M. N., Cole, J. E., and Emile-Geay, J.: Comparison of observed and simulated tropical climate trends using a forward model of coral δ18O, Geophys. Res. Lett., 38, L14706, https://doi.org/10.01029/2011GL048224, 2011.
Torrence, C. and Compo, G. P.: A practical guide to wavelet analysis, B. Am. Meteorol. Soc., 79, 61–78, 1998.
Trott, C. B., Subrahmanyam, B., and Washburn, C. E.: Investigating the response of temperature and salinity in the Agulhas Current region to ENSO events, Remote Sens., 13, 1829, https://doi.org/10.3390/rs13091829, 2021.
Trouet, V. and Van Oldenborgh, G. J.: KNMI Climate Explorer: A Web-Based Research Tool for High-Resolution Paleoclimatology, Tree-Ring Res., 69, 3–13, 2013.
Tsujino, H., Urakawa, S., Nakano, H., Small, R. J., Kim, W. M., Yeager, S. G., Danabasoglu, G., Suzuki, T., Bamber, J. L., Bentsen, M., Böning, C. W., Bozec, A., Chassignet, E. P., Curchitser, E., Boeira Dias, F., Durack, P. J. Griffies, S. M., Harada, Y., Ilicak, M., Josey, S., A., Kobayashi, C., Kobayashi, S., Komuro, Y., Large, W. G., Le Sommer, J., Marsland, S. J., Masina, S., Scheinert, M., Tomita, H., Valdivieso, M., and Yamazaki, D.: JRA-55 based surface dataset for driving ocean–sea-ice models (JRA55-do), Ocean Model., 130, 79–139, 2018.
Watanabe, T. K. and Pfeiffer, M.: A simple Monte Carlo approach to estimate the uncertainties of SST and δ18Osw inferred from coral proxies, Geochem. Geophy. Geosy., 23, e2021GC009813, https://doi.org/10.1029/2021GC009813, 2022
Wijffels, S. and Meyers, G.: An intersection of oceanic waveguides: Variability in the Indonesian Throughflow region, J. Phys. Oceanogr., 34, 1232–1253, 2004.
Wolter, K. and Timlin, M. S.: Measuring the strength of ENSO events – how does 1997/98 rank?, Weather, 53, 315–324, 1998.
Wolter, K. and Timlin, M. S.: El Niño/Southern Oscillation behaviour since 1871 as diagnosed in an extended multivariate ENSO index (MEI.ext), Int. J. Climatol., 31, 1074–1087, 2011.
Woodruff, S. D., Worley, S. J., Lubker, S. J., Ji, Z., Freeman, J. E., Berry, D. I., Brohan, P., Kent, E. C., Reynolds, R. W., Smith, S. R., and Wilkinson, C.: ICOADS Release 2.5: Extensions and enhancements to the surface marine meteorological archive, Int. J. Climatol., 31, 951–967, 2011.
Zinke, J., Dullo, W.-C., Heiss, G. A., and Eisenhauer, A.: ENSO and Indian Ocean subtropical dipole variability is recorded in a coral record off southwest Madagascar for the period 1659–1995, Earth Planet. Sc. Lett., 228, 177–194, 2004.
Zinke, J., Timm, O., Pfeiffer, M., Dullo, W.-Ch., Kroon, D., and Thomassin, B. A.: Mayotte coral reveales hydrological changes in the western Indian between 1865 to 1994, Geophys. Res. Lett., 35, L23707, https://doi.org/10.1029/2008GL035634, 2008.
Zinke, J., Pfeiffer, M., Timm, O., Dullo, W.-Ch., and Brummer, G. J. A.: Western Indian Ocean marine and terrestrial records of climate variability: a review and new concepts on land-ocean interaction since A.D. 1660, Int. J. Earth Sci., 98, 115–133, 2009.
Zinke, J., Loveday, B., Reason, C., Dullo, W.-C., and Kroon, D.: Madagascar corals track sea surface temperature variability in the Agulhas Current core region over the past 334 years, Scientific Reports 4, 4393, https://doi.org/10.1038/srep04393, 2014.
Zinke, J., Reuning, L., Pfeiffer, M., Wassenburg, J. A., Hardman, E., Jhangeer-Khan, R., Davies, G. R., Ng, C. K. C., and Kroon, D.: A sea surface temperature reconstruction for the southern Indian Ocean trade wind belt from corals in Rodrigues Island (19∘ S, 63∘ E), Biogeosciences, 13, 5827–5847, https://doi.org/10.5194/bg-13-5827-2016, 2016.