the Creative Commons Attribution 4.0 License.
the Creative Commons Attribution 4.0 License.
 | 27 Jun 2022
Impact of terrestrial biosphere on the atmospheric CO2 concentration across Termination V
María F. Sánchez Goñi
Nathaelle Bouttes
Among the 100 kyr climatic cycles of the Late Pleistocene, Termination V (TV, ∼ 433–404 kyr BP), the fifth last deglaciation, stands out for its minimum in astronomical forcing associated paradoxically with maxima in sea level, Antarctic temperature and atmospheric CO2 concentration. However, the driving mechanisms explaining TV remain only partially understood. For instance, climate models cannot fully represent the atmospheric CO2 variation observed in paleoclimate data. Aside from essential oceanic circulation processes, there is increasing evidence that terrestrial biosphere may have played a key role in the global carbon cycle. This study proposes a three-step integrated approach, combining regional and global vegetation records with modelling results, to unveil the evolution of terrestrial biosphere and its contribution to the carbon cycle during TV. First, we provide a new high-resolution (∼ 700 years) deep-sea pollen record from the Gulf of Cádiz (site U1386, 36∘49.680′ N; 7∘45.320′ W) for TV, which shows a moderate expansion of the Mediterranean forest. We then construct the first global forest pollen database for this period. Our compilation features distinct evolutions for different types of forest, highlighting a strong development of temperate and boreal forest which might have delayed the atmospheric CO2 increase during TV. Finally, the direct comparison of global simulated forests (iLOVECLIM model) to our pollen database reveals overall consistent temperate and boreal forest evolutions despite model biases, thereby supporting the hypothesis of a significant CO2 sequestration by middle and high-latitude forests of the Northern Hemisphere shortly after the onset of TV.
- Article
(7686 KB) - Full-text XML
-
Supplement
(652 KB) - BibTeX
- EndNote


Among the five major short-term carbon reservoirs of the climate system (ocean, atmosphere, terrestrial biosphere, surface sediments, permafrost), terrestrial biosphere (including vegetation and soils) is regarded as an essential component of current anthropogenic climate change mitigation strategies (Harris et al., 2021; Shukla et al., 2019). Yet, natural land sinks are also marked by large internal climate variability resulting in uncertainties in the global carbon budget (Loughran et al., 2021). In this respect, the study of past climate changes and associated terrestrial biosphere responses remains crucial to reduce uncertainty related to Earth's sensitivity to climate forcings (Overpeck et al., 2003; Masson-Delmotte et al., 2021). Paleoenvironmental data also allow us to investigate terrestrial biosphere feedbacks on climate at multi-millennial timescales (Overpeck et al., 2003). However, while extensive studies cover the last glacial cycle (Hoogakker et al., 2016; Prentice et al., 2011) and the Holocene (Bartlein et al., 2010), there are only few global descriptions of terrestrial biosphere for older periods of the Quaternary which are marked by different climatic boundary conditions (e.g. Kleinen et al., 2014).
Termination V (TV, ∼ 433–404 kyr BP), the fifth last deglaciation, is defined as the period between the highest and the lowest values of the benthic foraminifera oxygen isotope ratio (δ18Ob) following seminal work by Broecker and van Donk (1970) and by Broecker (1984). TV begins during glacial Marine Isotopic Stage (MIS) 12 and extends to MIS11, thus covering the longest deglaciation period (∼ 29 kyr) in the last 650 kyr (Sarnthein and Tiedemann, 1990) while orbital precession is at the lowest. Indeed, Berger and Wefer (2003) refer to the “Stage-11 Paradox” in the following terms: “The amplitude of climate variation is at maximum in the vicinity of Stage 11, at the very time when astronomical forcing is at minimum.” Such a conflicting observation suggests that the deglaciation process embodied complex multi-scale mechanisms and emphasises the necessity of addressing the problem within the framework of the entire climate system (cryosphere, ocean, atmosphere, biosphere) together with the Milankovitch theory (Berger and Wefer, 2003). It also highlights the relevance of MIS 11 as an astronomical analogue to the present Holocene interglacial (MIS1) featuring low eccentricity (Loutre and Berger, 2003; Berger and Wefer, 2003; Candy et al., 2014).
Parallel to the Stage-11 Paradox, TV marks a change within the carbon cycle of the 100 kyr climate cycles. As of MIS11, younger interglacials are characterised by higher atmospheric CO2 concentrations (by about 40 ppm; Lüthi et al., 2008) and temperatures (Jouzel et al., 2007) compared to older ones. This climatic transition is known as the Mid-Brunhes Event (MBE, ∼ 430 kyr BP). First model simulations by Köhler and Fischer (2006) have shown that low surface temperature in the Southern Ocean together with a reduction in the Atlantic Meridional Overturning Circulation (AMOC) accounted for low atmospheric CO2 concentrations during pre-MBE interglacials. Simulation experiments also indicate that the pre-MBE period is marked by intense Antarctic Bottom Water (AABW) formation and significant ventilation of the Southern Ocean contributing to carbon storage in the ocean (Yin, 2013). However, recent simulations including a representation of the carbon cycle reveal that the Southern Ocean contribution is too weak to fully explain the carbon uptake during pre-MBE interglacials (Bouttes et al., 2018, 2020). This result suggests a misrepresentation of the magnitude of oceanic processes and/or a lack of crucial mechanisms involved in the carbon cycle such as permafrost or biosphere feedbacks (Bouttes et al., 2018; Barth et al., 2018). Antarctic ice core measurements also indicate that an increase in atmospheric δ18O during the MBE cannot be fully explained by ocean ventilation (Landais et al., 2010), calling for other explaining mechanisms such as a change in biosphere productivity. Yet, a recent study by Brandon et al. (2020) demonstrates that the ocean primary productivity is much weaker than the terrestrial one during TV. Additionally, the observed strong increase in carbonate production is not associated with an increase in atmospheric CO2 as expected but rather with a dampened signal suggesting a compensating process (Brandon et al., 2020).
Terrestrial biosphere interacts with the global climate through the photosynthesis–respiration feedback involving CO2 exchanges. So far, the hypothesis of terrestrial biosphere contribution to the varying atmospheric CO2 across the MBE through changes in productivity or geographical distribution remains open. Brandon et al. (2020) suggest that terrestrial biosphere productivity (a major carbon flux component) could have delayed the atmospheric CO2 increase through photosynthesis-driven carbon fixation during the 425–415 kyr BP period. Several modelling studies already address the question of climate–carbon–vegetation feedbacks over MIS11 using either time slice (Kleinen et al., 2014; Rachmayani et al., 2016) or transient experiments (Kleinen et al., 2016; Ganopolski and Brovkin, 2017). However, these studies either do not fully cover TV or use simple models leaving room for a global model assessment of climate–vegetation interactions during the whole deglaciation period. Additional regional and global observations of paleo-biosphere evolution (Brandon et al., 2020) together with a better representation of biosphere in the coupled climate–vegetation models (Bouttes et al., 2018) are required to identify the impact of the terrestrial biosphere on atmospheric CO2 concentration across TV. The present study is a first step to fill in this gap, laying the groundwork for future evaluation of the full carbon cycle. It follows a three-step data–model integrated approach from a regional pollen record analysis to a global assessment of forest evolutions.
First, we analyse a new pollen record (U1386) from the Iberian margin to clarify the vegetation evolution during TV in southern Iberia. This region is a key location in terms of climate because it is affected by low- and high-latitude processes.
We then establish the first global pollen database for TV in order to understand terrestrial biosphere evolution at a global scale. The pollen records (including U1386) are analysed in a bioclimatic framework, therefore allowing us to capture the spatial variations in terrestrial biosphere evolution across TV.
Finally, we run transient simulations over TV to evaluate the quality of terrestrial biosphere representation by comparison to the database and to improve our understanding of the role of terrestrial biosphere in the carbon cycle.
2.1 Pollen analysis of IODP site U1386
2.1.1 Regional setting
The Integrated Ocean Drilling Program (IODP) site U1386 (36∘49.685′ N, 7∘45.321′ W; 561 m water depth) was drilled in 2011 during the Mediterranean Outflow Expedition no 339. The site is located in the Faro Drift (Fig. 1), on the upper slope of the Iberian margin (Gulf of Cádiz). As of today, no full record of TV exists for southwestern Iberia. While site MD01-2447 only describes temperate forests in northern Iberia (Desprat et al., 2005), southern Iberian Mediterranean forest evolution remains partially unknown because of a sedimentary hiatus at site U1385 (Oliveira et al., 2016). The U1386 sequence covers a quasi-continuous period from the late Miocene to Holocene (Stow et al., 2013), crossing hemipelagite, turbidite and contourite depositional systems. The core section of interest for TV (Unit IA) is embedded in a unique contourite structure shaped by the historical variations in the Mediterranean Outflow Water (MOW) originating from the Strait of Gibraltar. The local lithology is composed of nannofossil muds, calcareous silty muds and silty bioclastic sands with a dominance of silty muds (Stow et al., 2013; Moal-Darrigade et al., 2022a) and is overall homogeneous across TV. The size of pollen grains (10–100 µm) falls within the silt fraction and a recent study has shown that fine sediment fraction, including pollen, found at site U1386 essentially originates from the Guadalquivir and the Guadiana rivers (Alonso et al., 2016; Moal-Darrigade et al., 2022b). Moreover, modern pollen samples from the southern Iberian margin deep-sea floor have proven to accurately represent the vegetation of the adjacent continent (Naughton et al., 2007; Morales-Molino et al., 2020). Therefore, the pollen record from site U1386 reflects the regional vegetation evolution of southwestern Iberia. This vegetation presently belongs to the thermo-Mediterranean and meso-Mediterranean bioclimatic stages across the Guadalquivir and the Guadiana catchments (Rivas-Martinez, 1987). Deciduous oaks are found at middle elevation while evergreen oaks, olive trees, Pistacia, Phillyrea and rockroses (Cistus) dominate the lower elevations (Castro et al., 1997). The present-day climate of the southern Iberian Peninsula is directly controlled by the North Atlantic pressure systems dominated by cyclonic cells modulated by the North Atlantic Oscillation (NAO) in winter and by the Azores subtropical high during summer (Lionello et al., 2006). These strong seasonal atmospheric patterns result in mild winters and hot and dry summers (Peinado-Lorca and Martínez-Parras, 1987).

Figure 1Study area featuring main ocean currents (arrows), vegetation (shading) and sediment cores (dots). Atlantic currents are shown in blue (North Atlantic Current: NAC; Atlantic Current: AC; Portuguese Current: PC) and the Mediterranean Outflow Water (MOW) in red. Colour shading indicates the modern vegetation distribution in western and central Europe. The present pollen record originates from site U1386 (purple dot). The Guadalquivir catchment is delimited by a dotted black line. Courtesy of Vincent Hanquiez.
2.1.2 Experimental setup
A total of 42 pollen samples from site U1386, spanning about 7 m between 145 and 138 corrected metre composite depth (cmcd), were analysed. The composite core was sampled approximately every 12 cm between 143.39 and 139.81 cmcd and more loosely at the edges of the sequence (∼ 50 cm). Sample volumes ranged from 2.5 to 5 mL with an average value of 4.1 mL. Each sample was prepared for pollen analysis following the standard palynological procedure for marine samples in use at UMR EPOC, University of Bordeaux (https://ludovicdevaux.wixsite.com/ephe-paleoclimat/about-the-lab, last access: 23 June 2022). First, a coarse sieving (150 µm mesh) allowed the separation of the very coarse fraction of the sediment from the finer elements including pollen, spores and dinoflagellates. The resulting fraction was treated with gradually increasing concentrations of HCl and HF to remove carbonates and silicates respectively and then sieved through a finer mesh (10 µm). Known quantities of Lycopodium spores were added to the residue to allow reconstruction of absolute pollen concentrations. Finally, the sample was mounted on a glass slide in glycerol, a mobile medium enabling pollen grain rotation during observation. Pollen identification was performed at 400× and 1000× magnifications with a Zeiss AXIO Imager A1 microscope.
In order to obtain a reliable representation of the sample compositions at site U1386, we observe both a quantity and a diversity criterion following the methodology by Janssen (1981) and Mc Andrews and King (1976). For each sample, at least 100 terrestrial pollen excluding Pinus, aquatics and spores were counted (except for one sample with only 93 pollen counts). Thus, the main pollen sum including Pinus ranges from 128 to 770. Additionally, the majority of samples is composed of at least 20 different pollen morphotypes to accurately depict the floristic diversity of the source vegetation (Mc Andrews and King, 1976). Rull (1987) shows that a pollen sum of 200 grains, including Pinus, is sufficient to produce reliable estimates. Indeed, for higher values there are no significant variations in the confidence interval width. It is further argued that the pollen percentages derived from 100 grain counts (excluding the dominant taxon – Pinus here) yield a reliable picture of the considered sample, within the 0.95 confidence limits (Maher, 1981). Pollen concentrations range between ∼ 2500 and 52 000 grains cm−3 (Fig. S2 in the Supplement), which are typical values for deep-sea sedimentary sequences (1–2 orders of magnitude lower than for lacustrine sequences) and remain above the reliability threshold (∼ 2500 grains cm−3) for pollen assemblages containing deteriorated grains (Hall, 1981). We observe both strong pollen concentration and MOW (reflected by a high ratio and high sortable silt values) at the end of TV but low pollen concentration and high MOW during MIS11, suggesting that pollen concentration is relatively independent from MOW strength (Fig. S2). Counting results are expressed as pollen percentages calculated against the main sum (which discards Pinus) for terrestrial taxa, against the main sum plus Pinus for the Pinus taxon, and against the total sum (pollen + spores + indeterminables + unknowns) for the aquatic pollen and spores. Such a distinction avoids flattening of the pollen signal by the overrepresented Pinus in marine sediments (Heusser and Balsam, 1977).
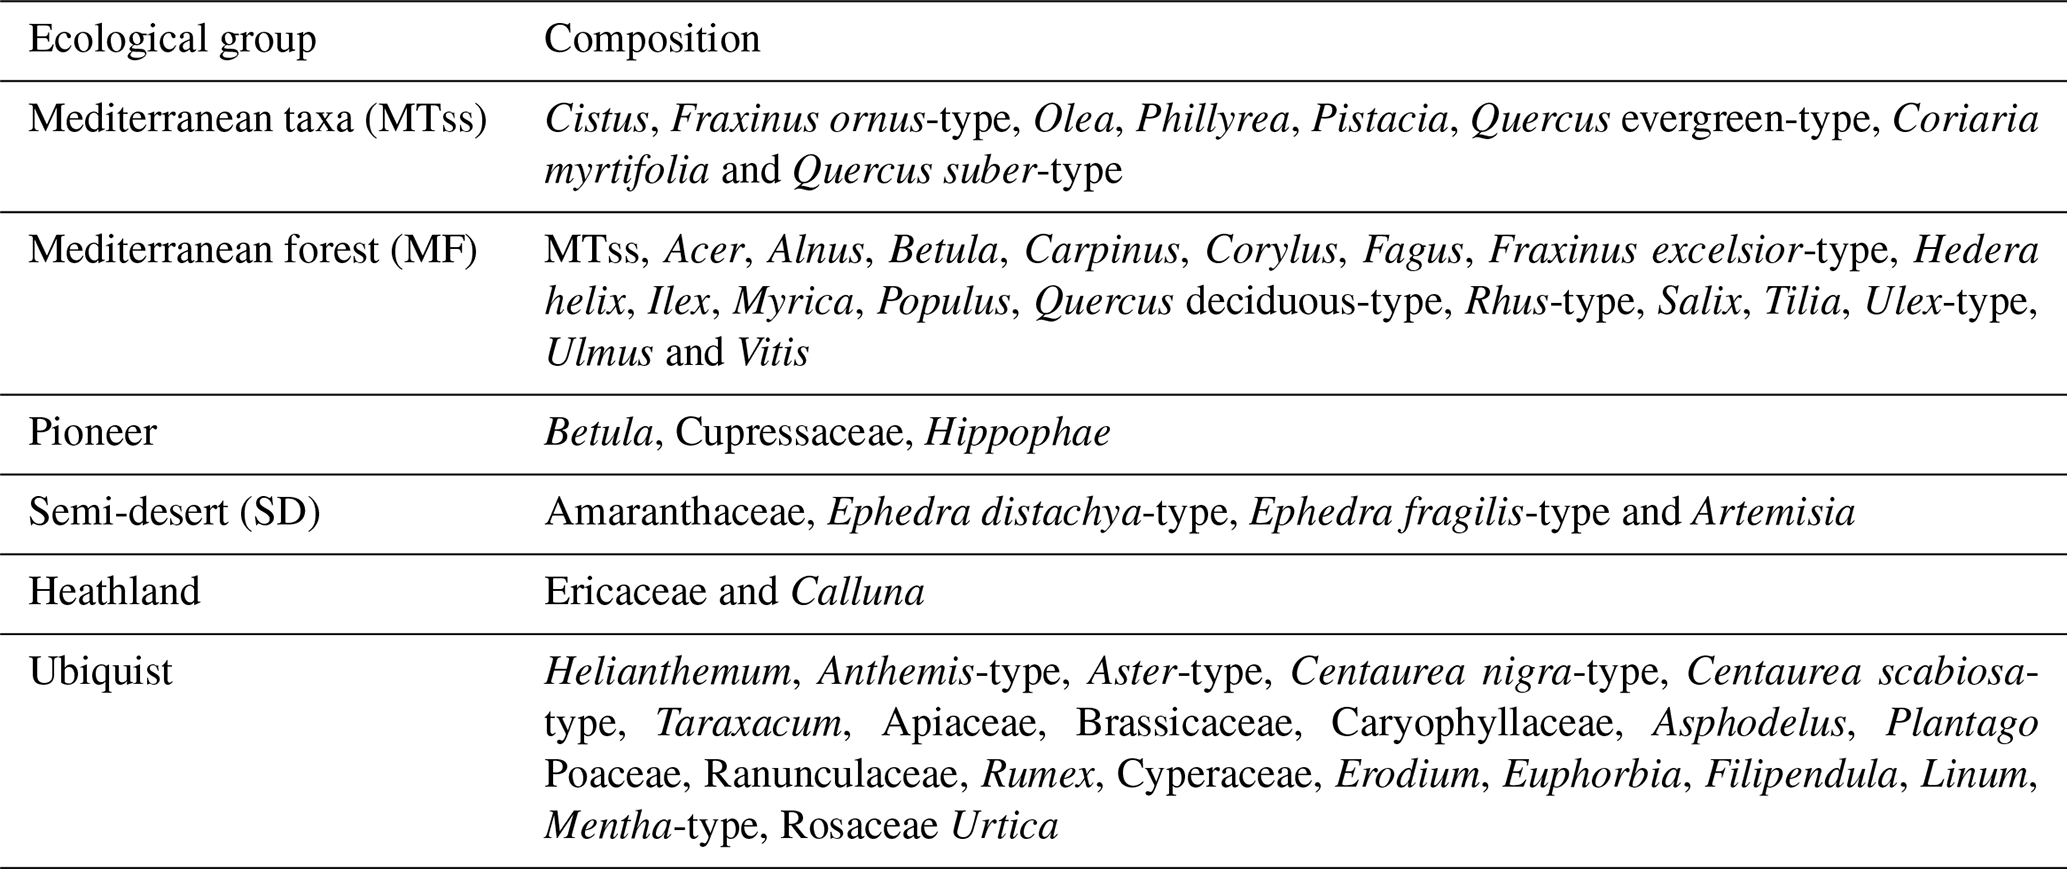
Each taxon was assigned to an ecological group representative of specific climate conditions. In Table 1, we define six ecological groups which are relevant for the Iberian vegetation following previous studies on European vegetation (Polunin and Walters, 1985; Suc, 1984). The Mediterranean taxa group (MTss) is defined by typical sclerophyllous Mediterranean taxa. This group indicates a seasonal climate with cool and wet winters and hot and dry summers (Polunin and Walters, 1985; Van Campo, 1984). The Mediterranean forest (MF) is a broader group including the Mediterranean taxa group together with all temperate and moisture-loving tree (Populus and Salix are included here following Polunin and Walters, 1985 and Castro et al., 1997) and shrub taxa excluding Pinus, Cedrus, Hippophae, Helianthemum and Cupressaceae. The pioneer group encompasses all plant species able to rapidly colonise an ecosystem with moderate increase in temperature and precipitation and poor-nutrient soils. The semi-desert (SD) group is composed of shrubs developing in arid conditions (Amaranthaceae, Ephedra distachya-type, Ephedra fragilis-type and Artemisia), following Van Campo (1984), while Ericaceae and Calluna, typical of annual wet climate, form the heathland group (Polunin and Walters, 1985). Finally, taxa which can be found in multiple climates fall in the ubiquist group.
2.1.3 From pollen assemblage to vegetation and climate reconstruction
In order to associate the depth of our composite core with a timescale, we use an improved version of the age model by Kaboth et al. (2017). The age correspondence is based on direct visual correlation between the δ18Ob record at site U1386 and the global mean benthic isotope stack LR04 (Lisiecki and Raymo, 2005), for which the chronology is well established. We construct our age model by linear interpolation based on the calibration points (Table S1 in the Supplement) of Kaboth et al. (2017) and taking into account the splice correction of Moal-Darrigade et al. (2022a) (+0.17 m on specific cmcd points). The sequence covers a total of about 28 kyr assuming a constant sedimentation rate of 0.2 m kyr−1 (Kaboth et al., 2017) and features a highest resolution of approximately 500 years (Fig. S1). We estimate the uncertainty on the chronology to be ∼ 1.2 kyr by computing the quadratic sum of the different age error sources (pollen record resolution, δ18O record resolution) following the methodology by Govin et al. (2012).
The onset of Termination V, as other Middle and Late Pleistocene terminations, is defined by a drop in the δ18Ob below the 3.5‰ threshold (McManus et al., 1999). Averaging over the highest and lowest δ18Ob (Skinner and Shackleton, 2005; Shackleton et al., 2003) allows positioning the transition 12/11 (i.e. the end of MIS12 glacial period and the beginning of MIS11 interglacial period) at ∼ 428 kyr BP, which falls in the range of Termination V midpoint values found by Raymo (1997). The same method applied to local δ18Ob minima and maxima defines the onset of the substages MIS11d at ∼ 422 kyr BP and 11c at ∼ 418 kyr BP.
For the cluster analysis, the pollen diagram computed with Psimpoll software (Bennett, 2000) was divided into a subset of pollen zones defined by the variation in the percentages of at least two pollen taxa with different ecological affinities (Birks and Birks, 1980). This visual interpretation is supported by a hierarchical clustering analysis based on the minimisation of the Euclidean distance and constrained by the number of sample depths (chclust in R environment, Juggins, 2009). The resulting dendrogram defines six pollen zones across TV.
2.2 Global pollen database
2.2.1 Pollen record selection
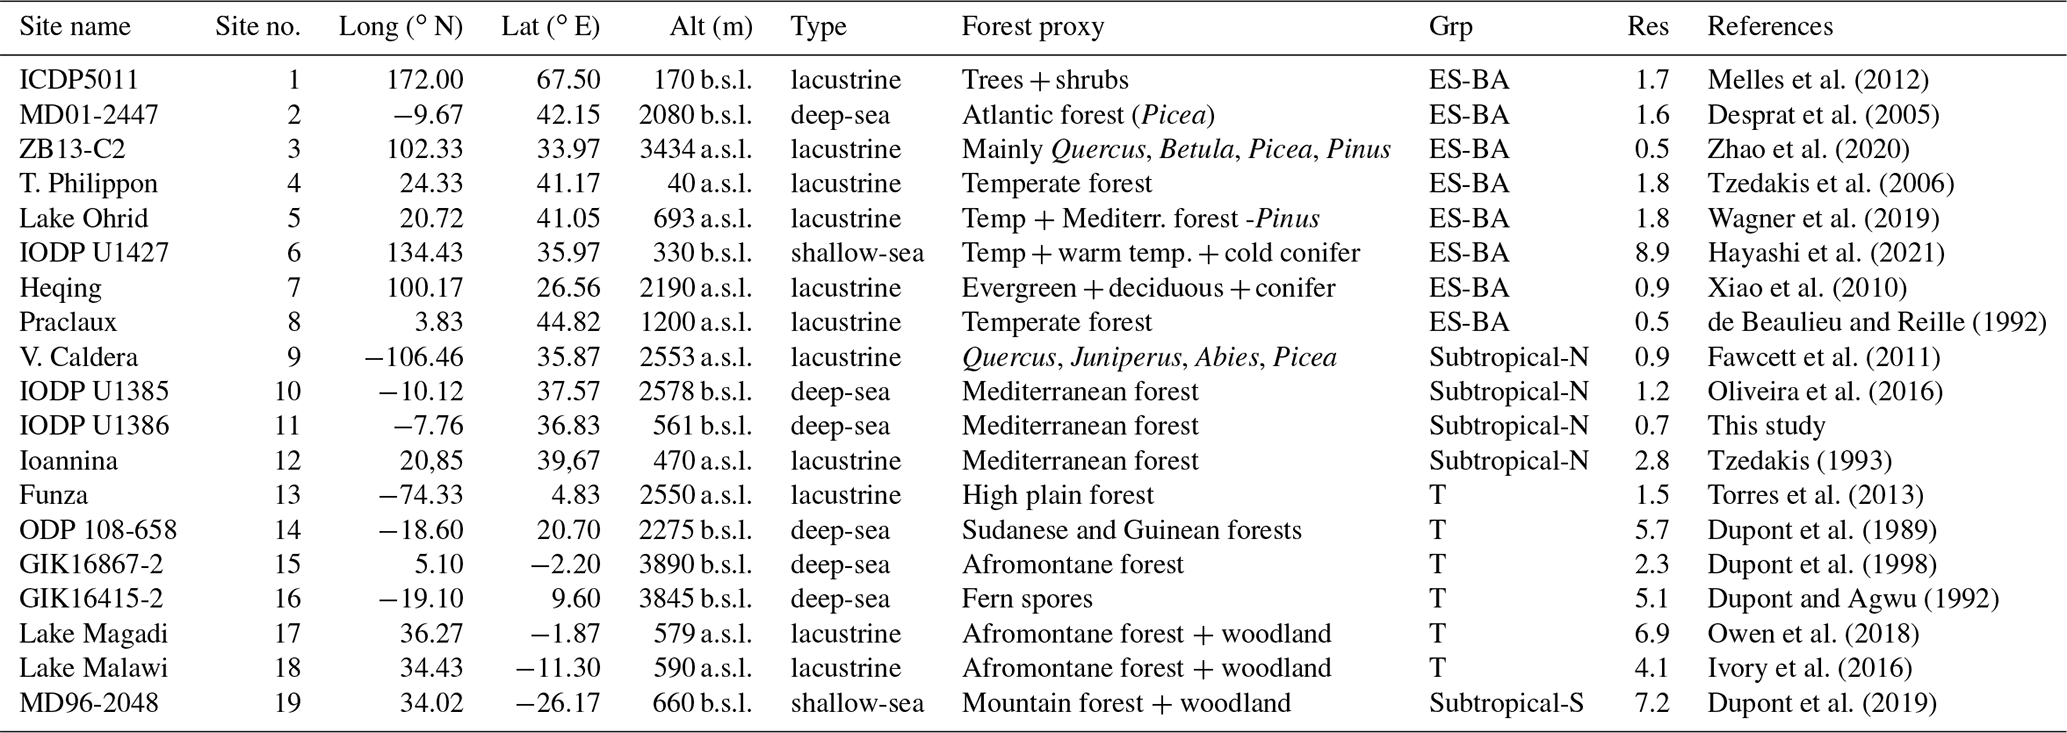
We conducted an extensive literature review to compile the available marine and lacustrine pollen records covering TV. Only records spanning at least the 423–405 kyr BP period were selected. At a global scale, a total of 19 pollen records (including the present U1386 record) with variable resolution were made available by the scientific community (Pangaea database, European pollen database, Neotoma database). However, we note the existence of a few more pollen records covering TV that are not included in this work due to a lack of data accessibility (Prokopenko et al., 2002; Tarasov et al., 2011; Litt et al., 2014; Cheng et al., 2018) or the use of different metrics such as pollen concentration instead of pollen percentages (de Vernal and Hillaire-Marcel, 2008). The deep-sea pollen sequence located off Greenland (de Vernal and Hillaire-Marcel, 2008) only provides pollen concentration values that cannot be taken into account for the construction of the composite pollen percentage records. As each pollen record featured different pollen assemblages according to their location, we extracted (or defined and computed when it was lacking) the arboreal pollen percentage from each pollen assemblage (“Forest proxy” column, Table 2) in order to build the most representative metric for forest evolution globally. In the specific case of site GIK16415-2 record, we use fern spores as a forest proxy, for their percentage accurately reflects the forest development (Dupont and Agwu, 1992). As marine and large lacustrine sites collect sediments from surrounding watersheds, each pollen record depicts the regional vegetation setting (Bradshaw and Webb III, 1985; Morales-Molino et al., 2020). Table 2 summarises essential information for each pollen record.
Table 2Database summary table. Pollen record altitudes (Alt) are given in metres below sea level (b.s.l.) or above sea level (a.s.l.). Pollen selected to build the arboreal pollen percentage are described in the Forest proxy column. Each pollen record is allocated to a group (Grp column): ES-BA (euro-Siberian–boreo-American), Subtropical-N (Subtropical Northern Hemisphere), T (Tropical) or Subtropical-S (Subtropical Southern Hemisphere). The penultimate column (Res) features the mean temporal resolution (kyr) of the sequence. The location of pollen records is displayed in Fig. 5a.
2.2.2 Data analysis
Each pollen record is resampled with a 2 kyr time step in order to build consistent composites. The time step value was chosen in order to optimise the database resolution and minimise oversampling of coarse-resolution records (the majority of pollen records features a mean resolution below 2 kyr, Table 2). Pollen records are classified into four forest groups defined according to their main bioclimatic specificity. The euro-Siberian–boreo-American group (ES-BA), as defined by Braun-Blanquet (1930), covers boreal and temperate forests. Therefore, both Tibetan Plateau pollen records (Heqing and ZB13-C2) are counted in the ES-BA group, the high altitude compensating for their relatively low latitudes. Although Tenaghi Philippon and Lake Ohrid records are on the geographical boundary with the Mediterranean region, they are also classified as the ES-BA group for they reflect a temperate forest cover. The Northern Hemisphere Subtropical group (Subtropical-N) encompasses warm temperate forests of the Northern Hemisphere and therefore extends beyond the geographical boundaries of the Mediterranean region (Mediterranean sensu lato). The Tropical group (T) refers to tropical and Afromontane forests. Finally, the Southern Hemisphere Subtropical group (Subtropical-S) only includes the MD96-2048 record, which is at the limit between tropical and subtropical forests (Table 2). Forest pollen composites are then obtained by averaging the forest pollen percentage for each group. It should be noted that all groups (i) are made of very few records and (ii) do not contain the same number of records. As a consequence, it is difficult to compare the composites between them and to estimate a statistical robustness of their signal. However, a sensitivity analysis (not shown) performed on the composites for varying resampling time step values (between 1 and 4 kyr) revealed no significant change. Besides, as each record has its own chronology (and associated uncertainty), the present analysis only allows us to compare long-term trends in the forest pollen signal.
2.3 Model and experimental setup
2.3.1 Model description
We use the three-dimensional Earth system model of intermediate complexity iLOVECLIM, a newer version of the LOVECLIM version 1.2 (Goosse et al., 2010) resolving the carbon cycle (Bouttes et al., 2015). iLOVECLIM includes an ocean module (3∘ × 3∘ horizontal grid, 20 vertical levels), a simplified atmospheric module (∼ 5.6∘ × 5.6∘ horizontal grid, on three vertical layers), a biogeochemical module (Bouttes et al., 2015, 2020) and a terrestrial biosphere module (VECODE; Brovkin et al., 1997). For each terrestrial grid point, the vegetation module computes two main plant functional types (PFTs), herbaceous (g) and trees (t), and a desert fraction (d) such that their sum equals 1 (i.e. ). For example, an ice sheet grid point will feature null tree and herbaceous fractions and a desert fraction of 1 (Roche et al., 2007). We estimate the terrestrial biosphere carbon stock as the sum of above- and below-ground carbon (e.g. green biomass + structural biomass + slow soil organic matter (SOM) + fast organic matter SOM) derived from the net productivity computed for each continental grid following Brovkin et al. (2002).
2.3.2 Model simulations
Using iLOVECLIM, we run a long-time experiment covering TV (Degla-V, 436–404 kyr). While the present study focuses on TV, we also run a simulation of TI (Degla-I, 21–0 kyr) to check consistency with previous studies of the last deglaciation (Fig. S6, Roche et al., 2011; Shakun et al., 2012). In order to obtain stable initial conditions, a spin-up (stationary) simulation is run over 5 kyr for each experiment (∼ 3 kyr are required to reach an equilibrium in the deep ocean) by fixing the orbital parameters (Berger, 1978), the greenhouse gases (CO2 and CH4) and an ice sheet model output (Ganopolski and Calov, 2011) at the time of maximum ice sheet (436 kyr BP for Degla-V and 21 kyr BP for Degla-I). The two transient simulations are then run with the forcings (orbital parameters, greenhouse gases and ice sheet), now varying with time.
3.1 Pollen record and inferred southwestern Iberia vegetation and climate
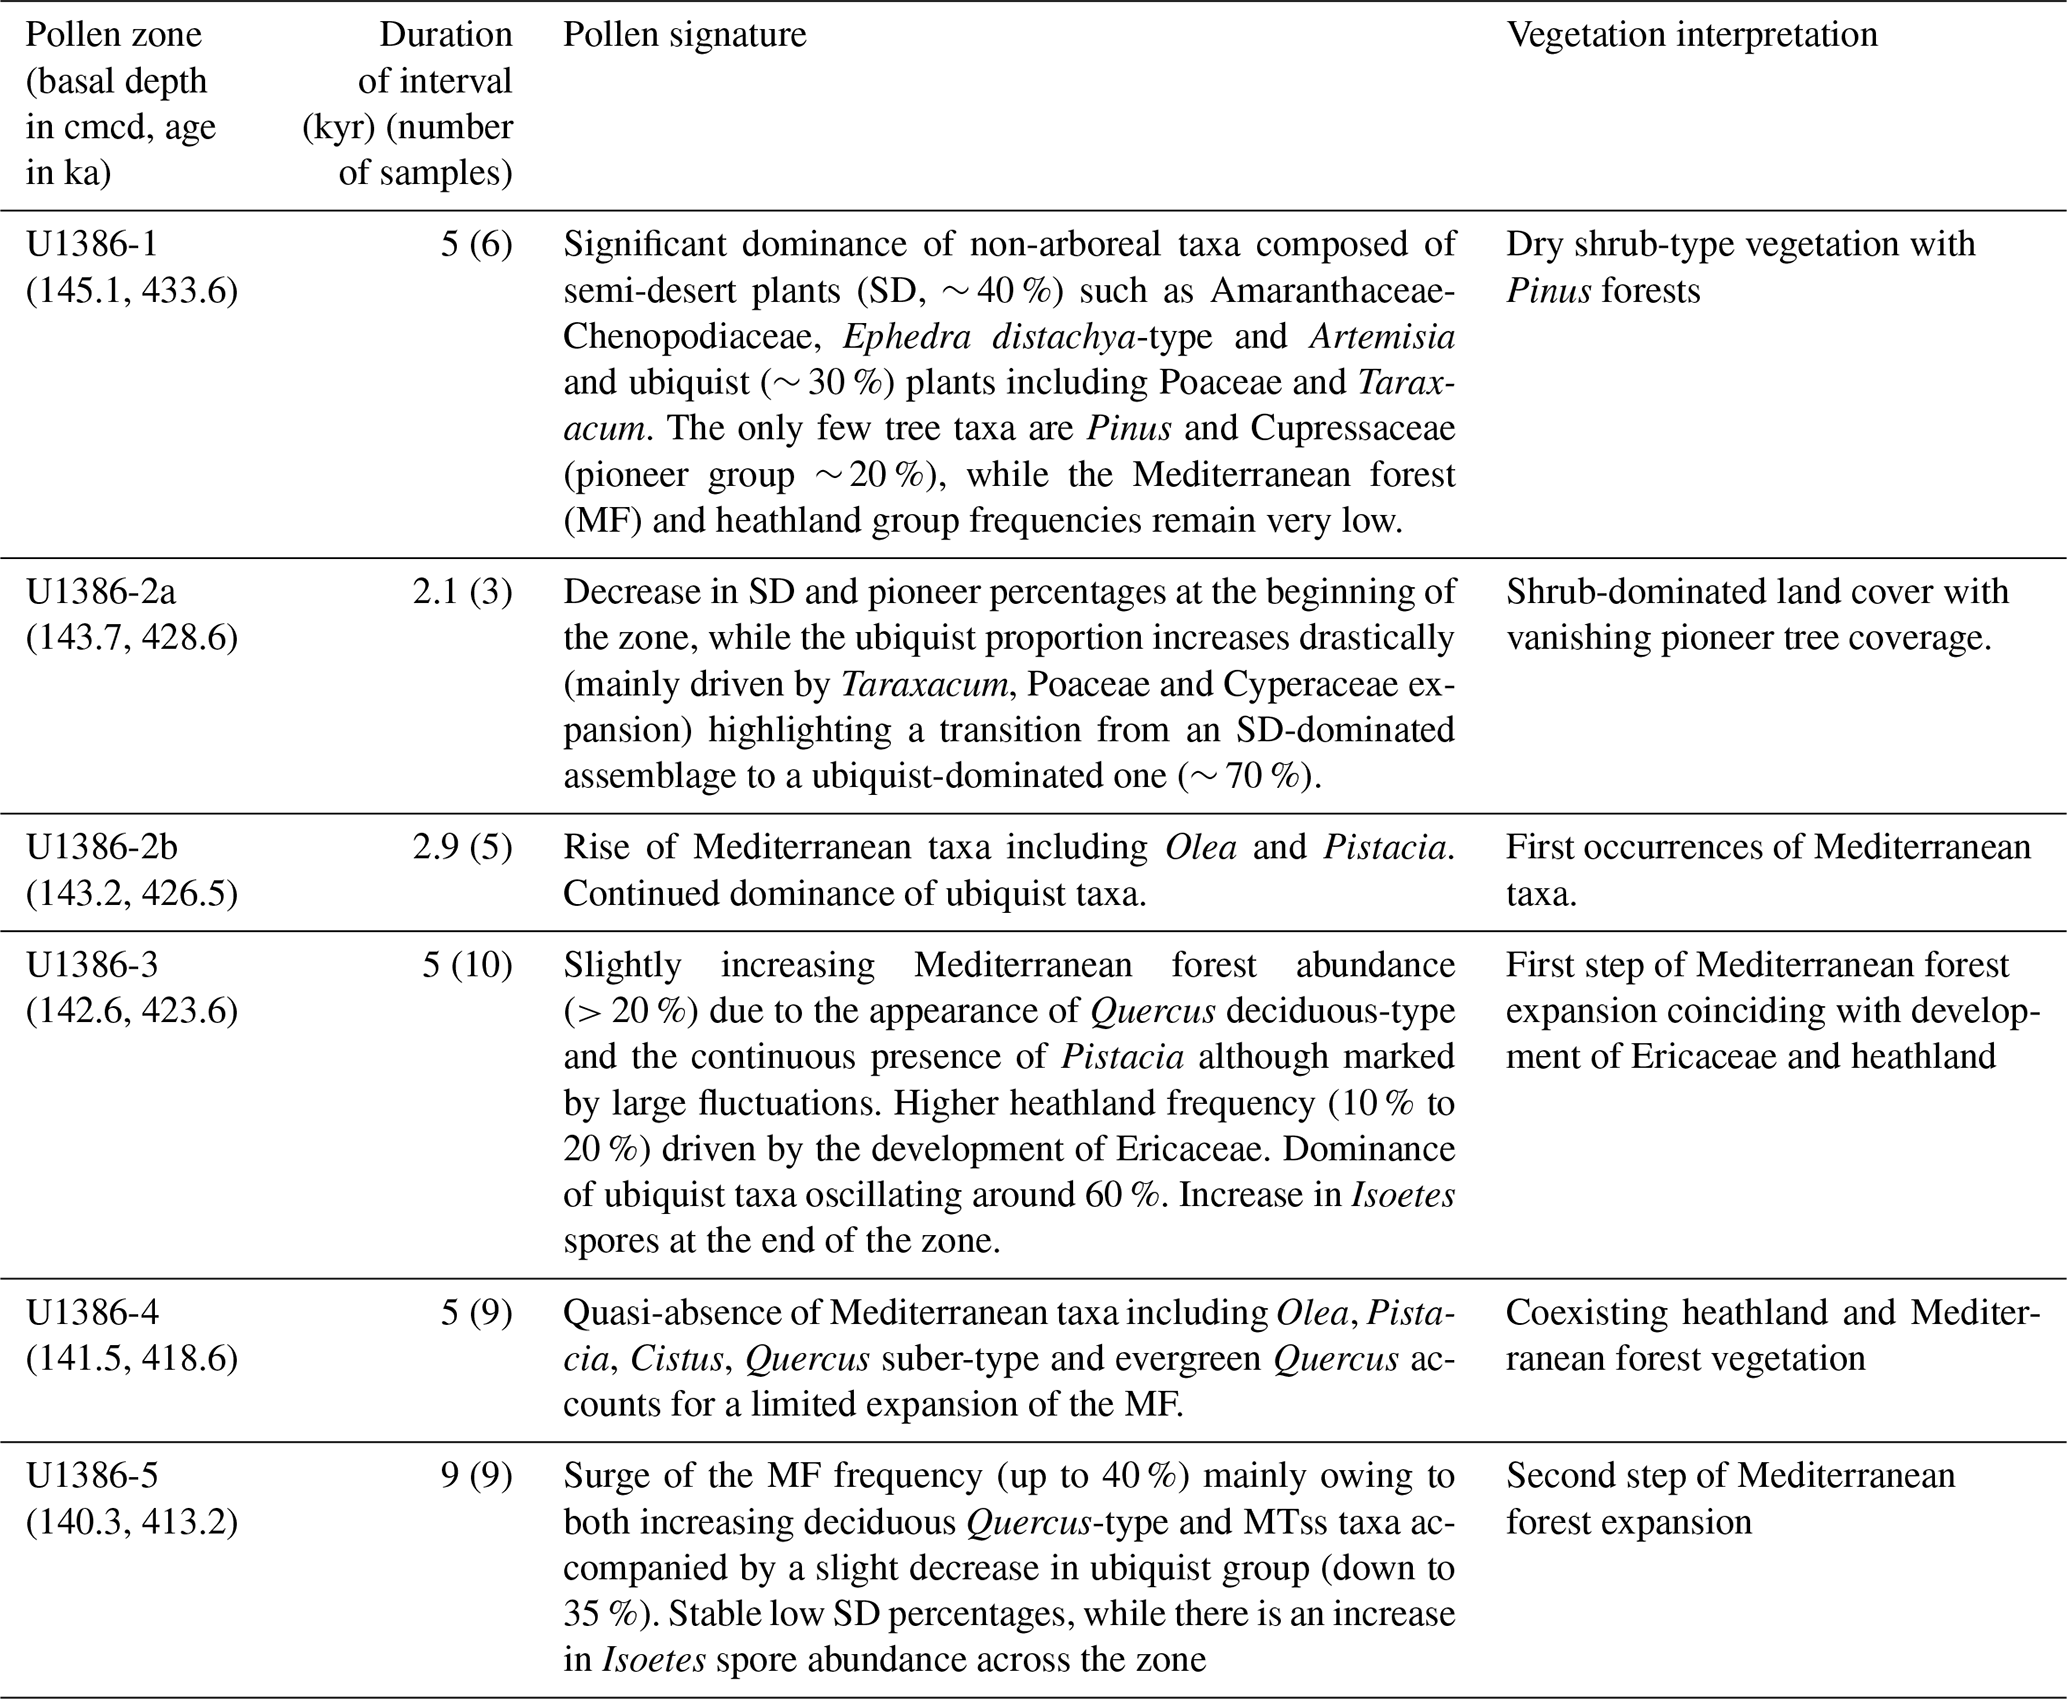
We identify five major pollen zones corresponding to major shifts in vegetation cover and composition (Fig. 2). A summary of the following vegetation description for each pollen zone is provided in Table 3.
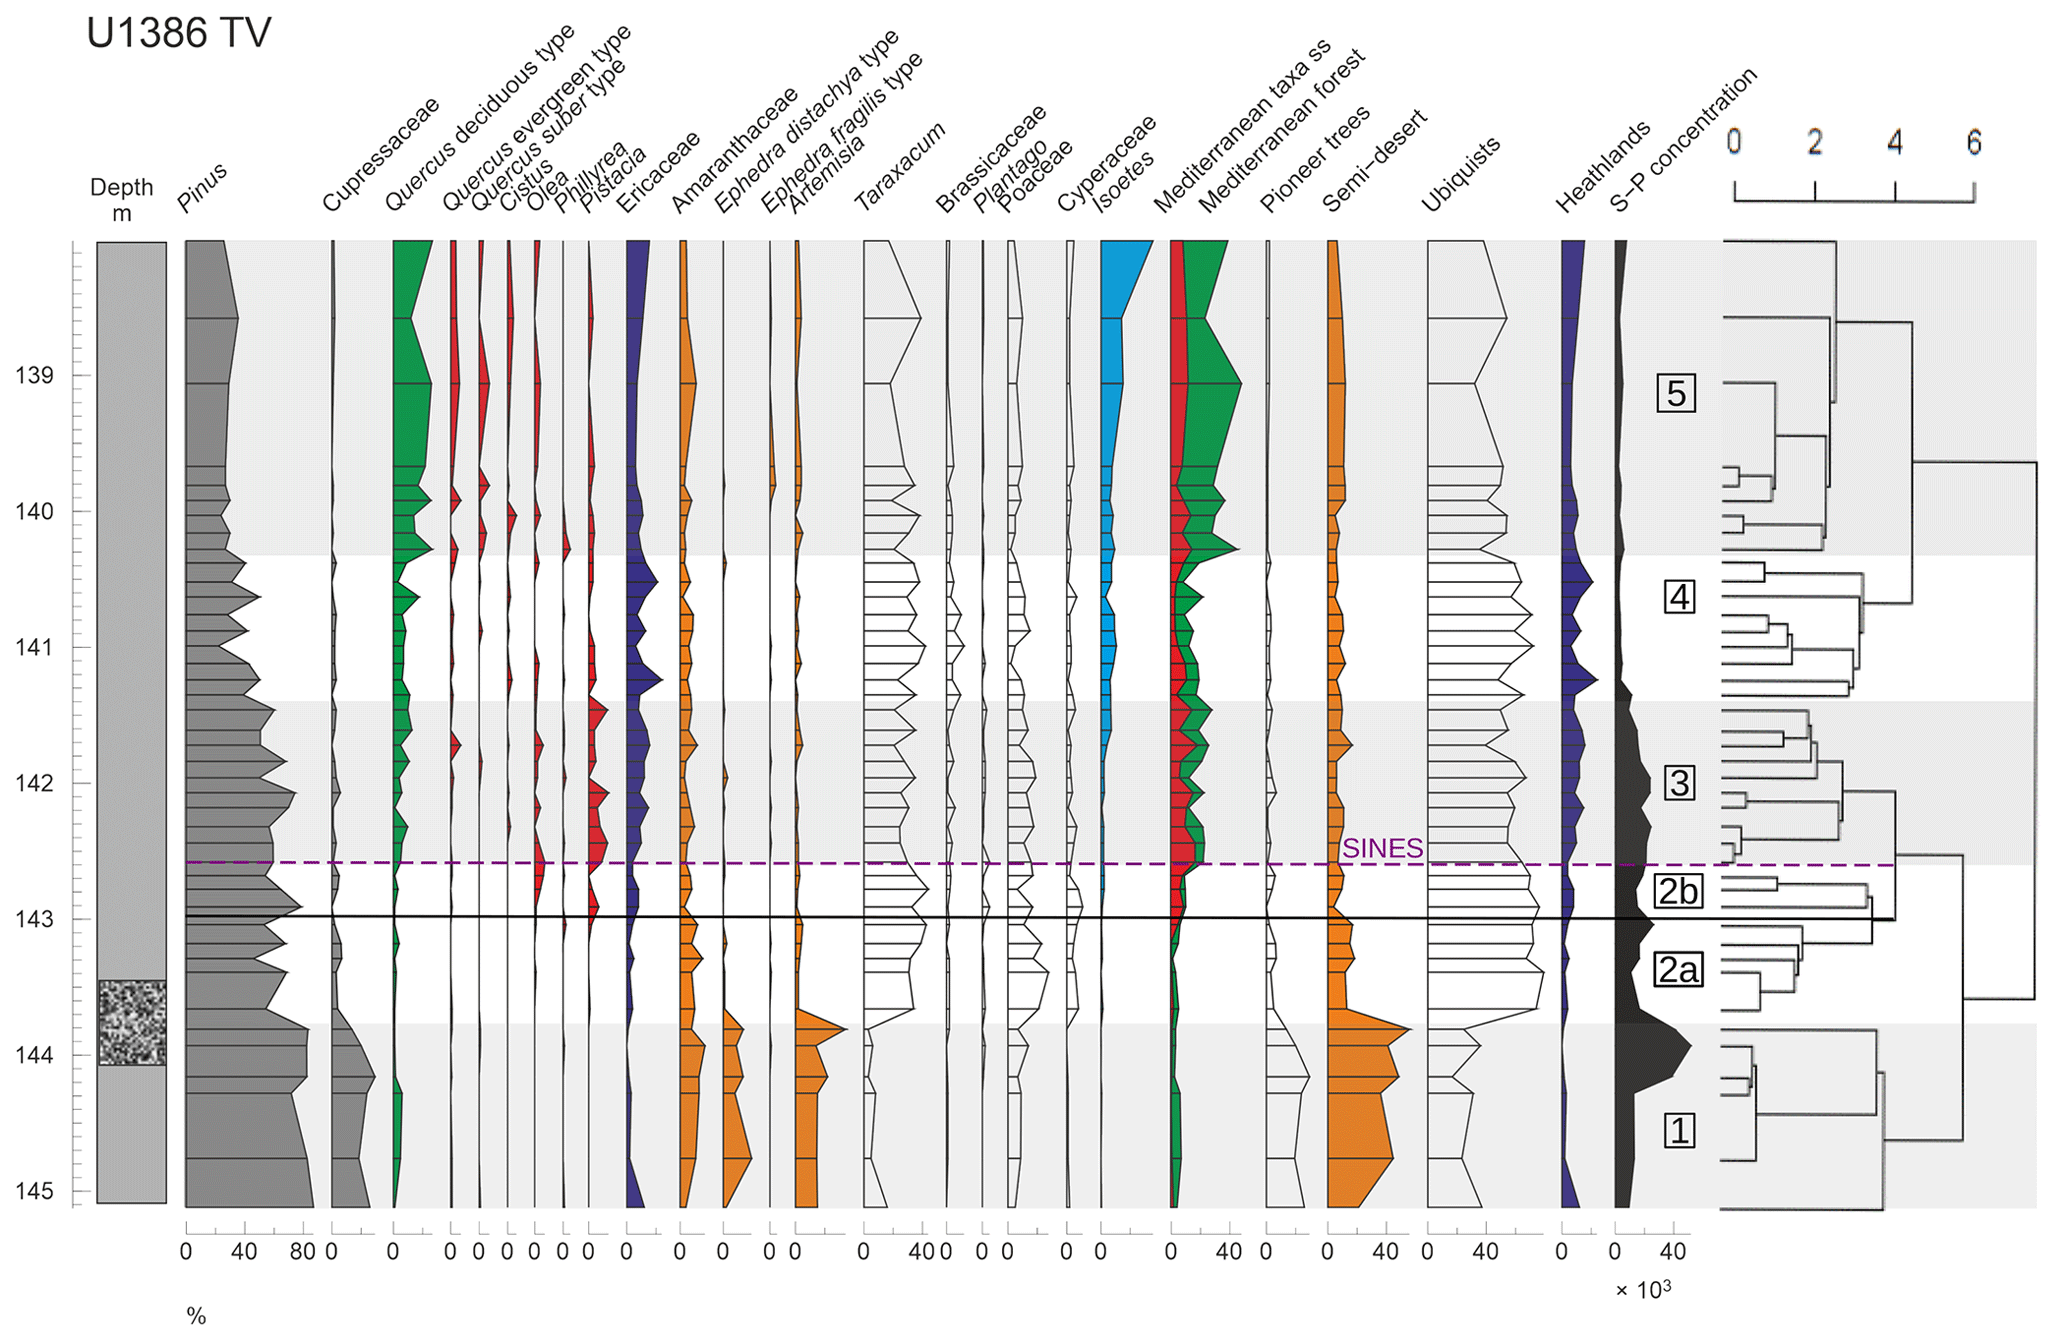
Figure 2Pollen percentage diagram of selected morphotypes and ecological groups (described in Table 1) at site U1386 versus depth (cmcd). Lithology (full grey: muddy clay; dotted black: clayey silt; from Moal-Darrigade et al., 2022a) and sporo-pollen (S-P) concentrations (grains cm3−3) are displayed on both sides of the diagram (left and right respectively). Alternating grey and white shading with corresponding numbers indicates pollen zones, and the black line sets the limit between sub-zones U1386-2a and U1386-2b. The dendrogram showing the results from the hierarchical clustering analysis is represented on the right. The purple dashed line indicates the onset of the SINES regional terrestrial interglacial. The same colours are used for the ecological groups and the main morphotype components thereof.
Table 3Description and interpretation of the TV pollen record at site U1386 by pollen zones.
The first major zone U1386-1 (∼ 145.1–143.7 cmcd) is dominated by ubiquists (∼ 30 %), SD (∼ 40 %) and pioneer taxa (∼ 20 %), while the MF remains low (<10 %). The important presence of SD such as Amaranthaceae, Ephedra and Artemisia suggests a dry and cold climate consistent with the MIS12 glacial period. The large proportion of pioneer taxa (mainly Cupressaceae) and low MF further confirms that climate conditions were too harsh for large temperate trees to grow, leaving a shrub-dominated land cover. The end of zone U1386-1 is characterised by a decrease in SD and pioneer percentages, while the ubiquist proportion increases drastically mainly driven by Taraxacum and Poaceae expansion. Interestingly, this rapid shift occurs immediately after an extremely high pollen concentration peak (> 50 000 pollen cm−3, Fig. S2 in the Supplement) highlighting a significant increase in the ubiquist pollen number and a real transition from an SD-dominated assemblage to a ubiquist-dominated one. Such an important pollen concentration change can be caused by a wide range of factors including changes in pollen productivity and dispersability, in the source area and in the distance to the sampling site but also in the rate of sediment deposition associated with sea level rise.
The second major zone U1386-2 (∼ 143.7–142.6 cmcd) is characterised by a dominance of ubiquists (∼ 70 %) mainly represented by Taraxacum and Poaceae. The SD and pioneer groups are much weaker than in zone U1386-1 (∼ 15 % and <10 % respectively), while the heathland group grows up to 10 % across the zone providing evidence for increasing humidity. The beginning of a continuous Isoetes spore record – albeit its weak intensity – also describes a moist environment. However, the dominance of Taraxacum indicates a limited moisture availability. In modern pollen assemblages, the highest Taraxacum percentages are found in Greece and Morocco, where mean annual temperatures span from 12 to 17 ∘C and precipitation from 0 to 250 mm (Leroy, 1997). We divide zone U1386-2 into two sub-zones (U1386-2a and U1386-2b), considering the emergence of MF taxa (mainly Olea and Pistacia) at around 143 cmcd. Sub-zone U1386-2a corresponds to a relatively humid climate, but it is still too mild to bear forest development. Conversely, sub-zone U1386-2b is both humid and warm enough to allow a first development of the Mediterranean forest. The overrun of the 20 % threshold in MF at the limit between U1386-2b and U1386-3 determines the onset of the regional southern Iberian terrestrial interglacial (Sánchez Goñi et al., 1999; Shackleton et al., 2003) – the SINES forest phase previously defined by Oliveira et al. (2016). This settled and developing Mediterranean forest indicates atmospheric warmth and moisture availability but also a seasonal climate (Sánchez Goñi et al., 2016).
The MF (mainly Quercus deciduous and Pistacia) and the ubiquist groups are still present throughout Zone U1386-3 (∼ 142.6–141.4 cmcd), oscillating around 20 % and 50 % respectively, indicating continuous development of forested area. Zone U1386-3 is also characterised by a higher development of heathlands (10 % to 20 %) than in zone U1386-2 mainly driven by increased Ericaceae proportions. Moreover, the significant rise of Isoetes spores (∼ 10 %) starting around 142 cmcd is a strong signal for deglaciation. In fact, Isoetes grows in marshlands, which gradually expand during an increase in precipitation associated with the transition between glacial and interglacial climates (Sánchez Goñi et al., 1999). The end of Zone U1386-3 is marked by a strong drop in pollen concentration, which could be caused by the abrupt and concomitant sea level rise (Fig. S2), which increases the distance between site U1386 and land, therefore providing further evidence for ice sheet collapse during the transition between Zone U1386-3 and U1386-4. The beginning of Zone U1386-4 (∼ 141.4–140.3 cmcd) is defined by a strong decrease in the heathland group (down to less than 10 %) mainly owing to a decline in Ericaceae. Yet, Zone U1386-4 features one of the highest Ericaceae percentages of the whole sequence.
The onset of U1386-4 is also marked by an increase in the ubiquist group (up to 70 %), while the SD group remains at relatively low levels (∼ 10 %), changes which could be attributed to a wetter or warmer climate. However, the MF also decreases and remains low (mostly below 20 %) throughout the period while Isoetes spores grow over 10 %. These variations describe a decreasing atmospheric temperature and still wet conditions. Moreover, the very stable pollen concentration (∼ 4000 pollen cm−3, Fig. S2) reflects an absence of major changes in deposition factors, which are mainly related to sea level and oceanic currents. Therefore, we hypothesise that atmospheric temperature decrease is the major environmental change influencing vegetation in Zone U1386-4.
The transition to Zone U1386-5 (140.3–138 cmcd) is characterised by a surge of the MF group (up to 40 % mainly owing to increasing deciduous Quercus) and a decrease in the ubiquist group (down to 35 %), while the SD group and Isoetes spores remain relatively constant and MTss pollen percentages increase. As pollen concentrations do not vary much over this period, we can infer a strong expansion of the Mediterranean forest. In Zone U1386-5, the MF and ubiquist group percentages follow opposed variations while the other groups remain relatively stable, depicting variations in the percentage of forested and open vegetation land cover. A second MF peak is reached around 139 cmcd, suggesting a stable development of the Mediterranean forest that indicates the warmest climate of the considered interval and wet winter conditions.
3.2 Southern Iberian terrestrial biosphere evolution across TV
We now interpret the U1386 pollen record in a temporal framework by comparing reconstructed vegetation to other climate indices (Fig. 3). Given that all proxies originate from the same sediment core, a direct comparison is possible without chronology issues.
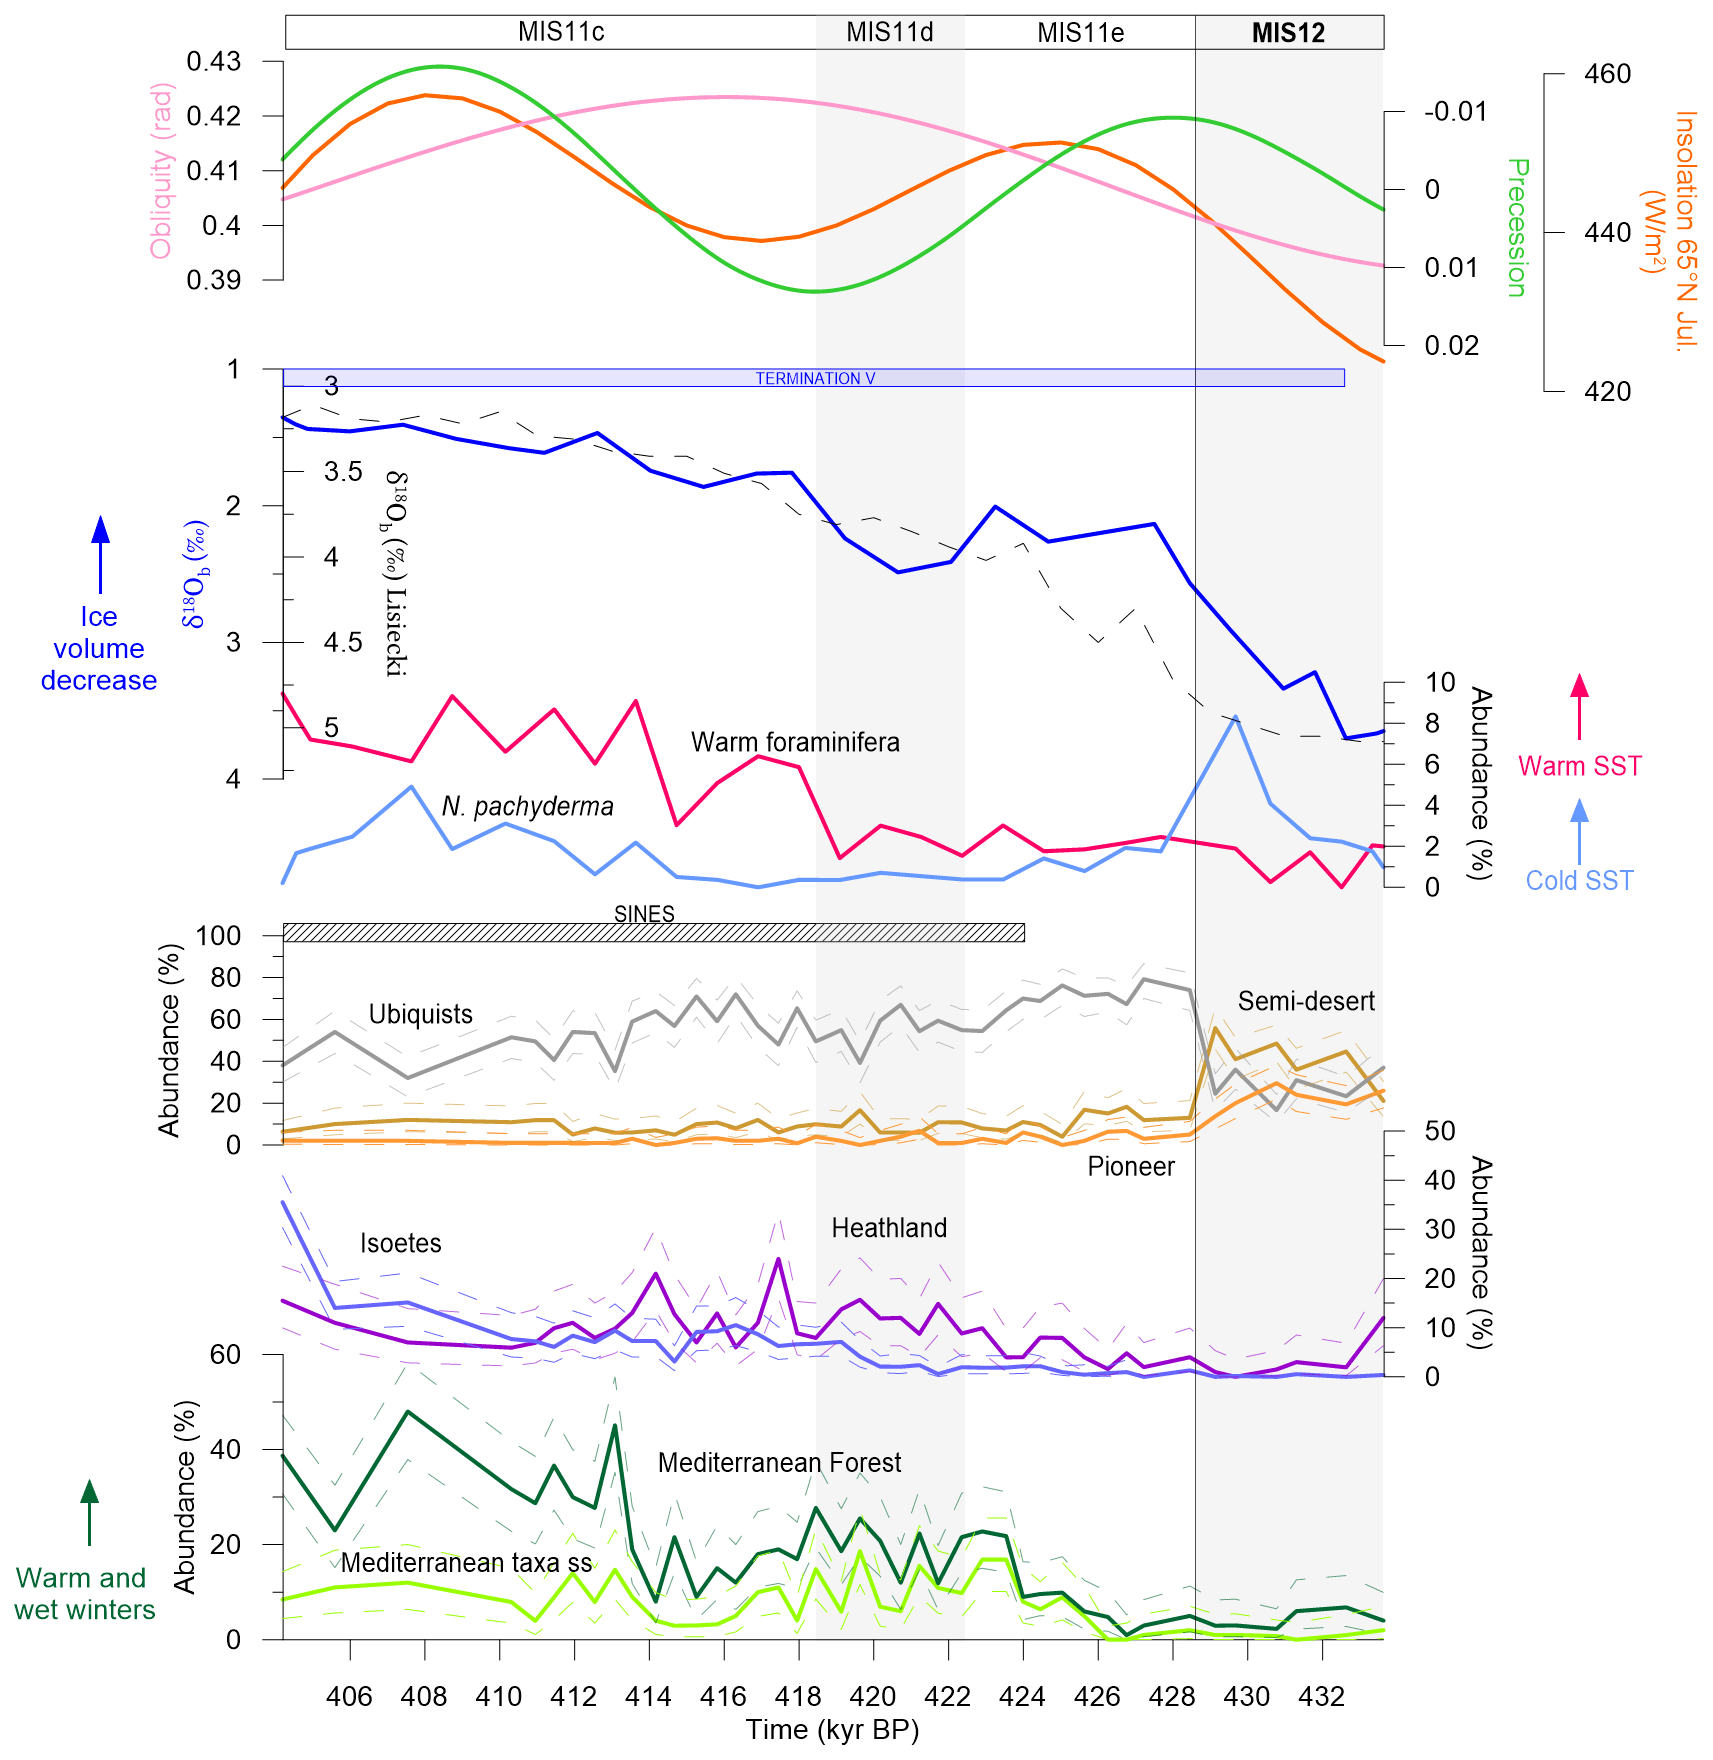
Figure 3U1386-retrieved environmental indicators. From bottom to top: pollen percentages (this study), warm and cold foraminifera abundance (Moal-Darrigade et al., 2022a), δ18Ob (from U1386 in blue line (Kaboth et al., 2017) and global in black dashed line (Lisiecki and Raymo, 2005)) and astronomical parameters (source: http://vo.imcce.fr/insola/earth/online/earth/online/index.php, last access: 23 June 2022). The dashed lines represent the 95 % confidence intervals for MF, heathland and SD (computed with the “exactci” package, R). TV period defined by δ18Ob variations is represented by the blue box, and the SINES regional terrestrial interglacial is indicated by the black hatched box.
The first important result is that the SINES regional terrestrial interglacial (∼ 424 kyr BP, > 20 % MF) begins ∼ 4000 years after the marine isotopic interglacial (∼ 428 kyr BP, δ18Ob). The onset of MIS11e is characterised by a minimum of precession and increasing insolation at 65 ∘N responsible for a significant decrease in the ice volume visible in the drop in δ18Ob. This important melting period is also supported by records from nearby cores (Fig. S3). The increase in the values from site U1308 in the central North Atlantic (Fig. 1) indicates the presence of ice-rafted debris (IRD) carried by icebergs originating from the North American ice caps, while the increase in C37:4 values from an Iberian margin core (MD03-2699) located slightly north of site U1386 (39∘ N, Fig. 1) depicts freshwater pulses in the southwestern Iberian margin at the end of MIS 12 (Fig. S3). Such a cold water input in the northern North Atlantic from the end of MIS12 until the beginning of MIS11e results in a weakening of AMOC highlighted by low δ13C values, a decrease in sea surface temperature supported by the high abundance of Neogloboquadrina pachyderma (s), and cold and dry conditions in southwestern Iberia revealed by the SD taxa expansion. The onset of MIS11e coincides with a severe drop in SD taxa and a rise in ubiquists. These opposite evolutions suggest an increase in atmospheric humidity. However, the MF only develops several millennia later, towards the end of MIS11e. This first moderate forest development is driven by the growth in sclerophyllous Mediterranean taxa (MTss) particularly adapted to the low-precession-induced high seasonality. A decoupling between the evolution of ice volume and the Iberian vegetation is observed during TV similarly to the MIS 5e and the Eemian terrestrial interglacial (Sánchez Goñi et al., 2013). The present U1386 high-resolution pollen record allows repositioning the beginning of the regional terrestrial interglacial at ∼ 424 kyr BP, about 4 kyr after the onset of the marine interglacial (MIS11).
TV further stands out owing to a two-step forest development, absent from more recent terminations (see Fig. 5 in Sánchez Goñi et al., 2018). The first increase in Mediterranean forest (∼ 424 kyr BP) is relatively limited (∼ 20 %) compared to the second (∼ 40 %), which is more representative of a true forest expansion in the southern Iberian Peninsula. The reduced Mediterranean forest develops across MIS11d synchronously with heavier δ18Ob, suggesting a temporary ice sheet growth. The increasing obliquity causes enhanced insolation seasonality with higher precipitation in winter while high precession results in increased summer precipitation over the Iberian region (Bosmans et al., 2015), accounting for the growth of heathland taxa which require year-round precipitation. The second forest development starting around 414 kyr BP occurs with slightly different orbital parameter settings: high obliquity but decreasing precession such that the highest MF expansion coincides with the insolation maximum. A combination of low precession and high obliquity is known to be even more favourable to winter precipitation (Bosmans et al., 2015). Moreover, the high abundance of warm-loving foraminifera indicates a warmer ocean than at the beginning of the SINES interglacial. This warming is supported by the reconstructed atmospheric temperature featuring a difference of about 2 ∘C between 424 and 414 kyr BP (Fig. S4). Such environmental conditions are consistent with a larger growth of the Mediterranean forest. Finally, we observe an abnormal contraction of the MF at the beginning of MIS11d (∼ 418 kyr BP), which can be explained by the combination of maximum obliquity and precession accounting for low seasonality. This relatively mild and humid climate is however adapted for the development of Ericaceae, which are responsible for the peaks in heathland taxa. Overall, even the highest Mediterranean forest pollen percentages of MIS11 are relatively low in regard to recent interglacials such as MIS1 and MIS5e (see Fig. 5 in Sánchez Goñi et al., 2018), suggesting a moderate development of the terrestrial biosphere in southern Iberia during TV.

Figure 4Comparison of Mediterranean forest (%) from sites U1386 (our study) and U1385 (by Oliveira et al., 2016), see map.
Our new high-resolution pollen record (U1386) sheds light on the southern Iberian terrestrial vegetation across TV, a poorly documented period owing to a sedimentary hiatus in the previous IODP site U1385 pollen record (Oliveira et al., 2016). A comparison of U1386 and U1385 records in Fig. 4 reveals a more complex Mediterranean forest evolution than previously thought. While the overall trend of both series is consistent, we observe a slight shift between U1385 and U1386 over the last part of the sequence (U1385 leading U1386 by about 2 kyr, with a maximum at 415 and 413 kyr respectively (Fig. 4)), which we attribute to differing age models. The U1386 record allows us to define a more precise onset of the Mediterranean forest at ∼ 424 kyr BP. As previously mentioned, the U1386 record unveils a two-step forest development absent from the U1385 record, with a first moderate expansion between 424 and 418 kyr BP (onset of the SINES Mediterranean forest phase) and a second larger expansion starting at 414 kyr BP (Fig. 4). Finally, both U1386 and U1385 feature a maximum Mediterranean forest percentage of ∼ 50 %, therefore agreeing on a moderate Mediterranean forest development during the SINES forest phase.
3.3 Global terrestrial biosphere evolution across TV
3.3.1 Global pollen composite records
In this section, we take a step back from our regional analysis to investigate the evolution of the terrestrial biosphere at a global scale owing to the new pollen database. Altogether, forest ecosystems represent the largest biomass reservoir during the preindustrial Holocene period (Prentice et al., 2011) and the Last Glacial Maximum (Crowley, 1995; Prentice et al., 2011). Additionally, the carbon uptake by modern forests accounts for the large majority of the terrestrial carbon sink (Pan et al., 2011). In this respect, forests are reliable proxies for the terrestrial biosphere. Therefore, we postulate that the evolution of the pollen-based forest percentage is representative of terrestrial biosphere evolution (Brandon et al., 2020). Figure 5a features the pollen record database locations and Fig. 5b the corresponding forest pollen percentages across TV. At first sight one notices a large percentage difference between pollen records (see also Fig. S5), some records averaging around 10 % (e.g. ODP 108-658) and others rising over 90 % (e.g. Tenaghi Philippon). This reveals a strong diversity of environments between the sampled regions. Building composites allows comparing records in presumably similar global climatic conditions to extract information concerning the long-term evolution of forests in a specific location.
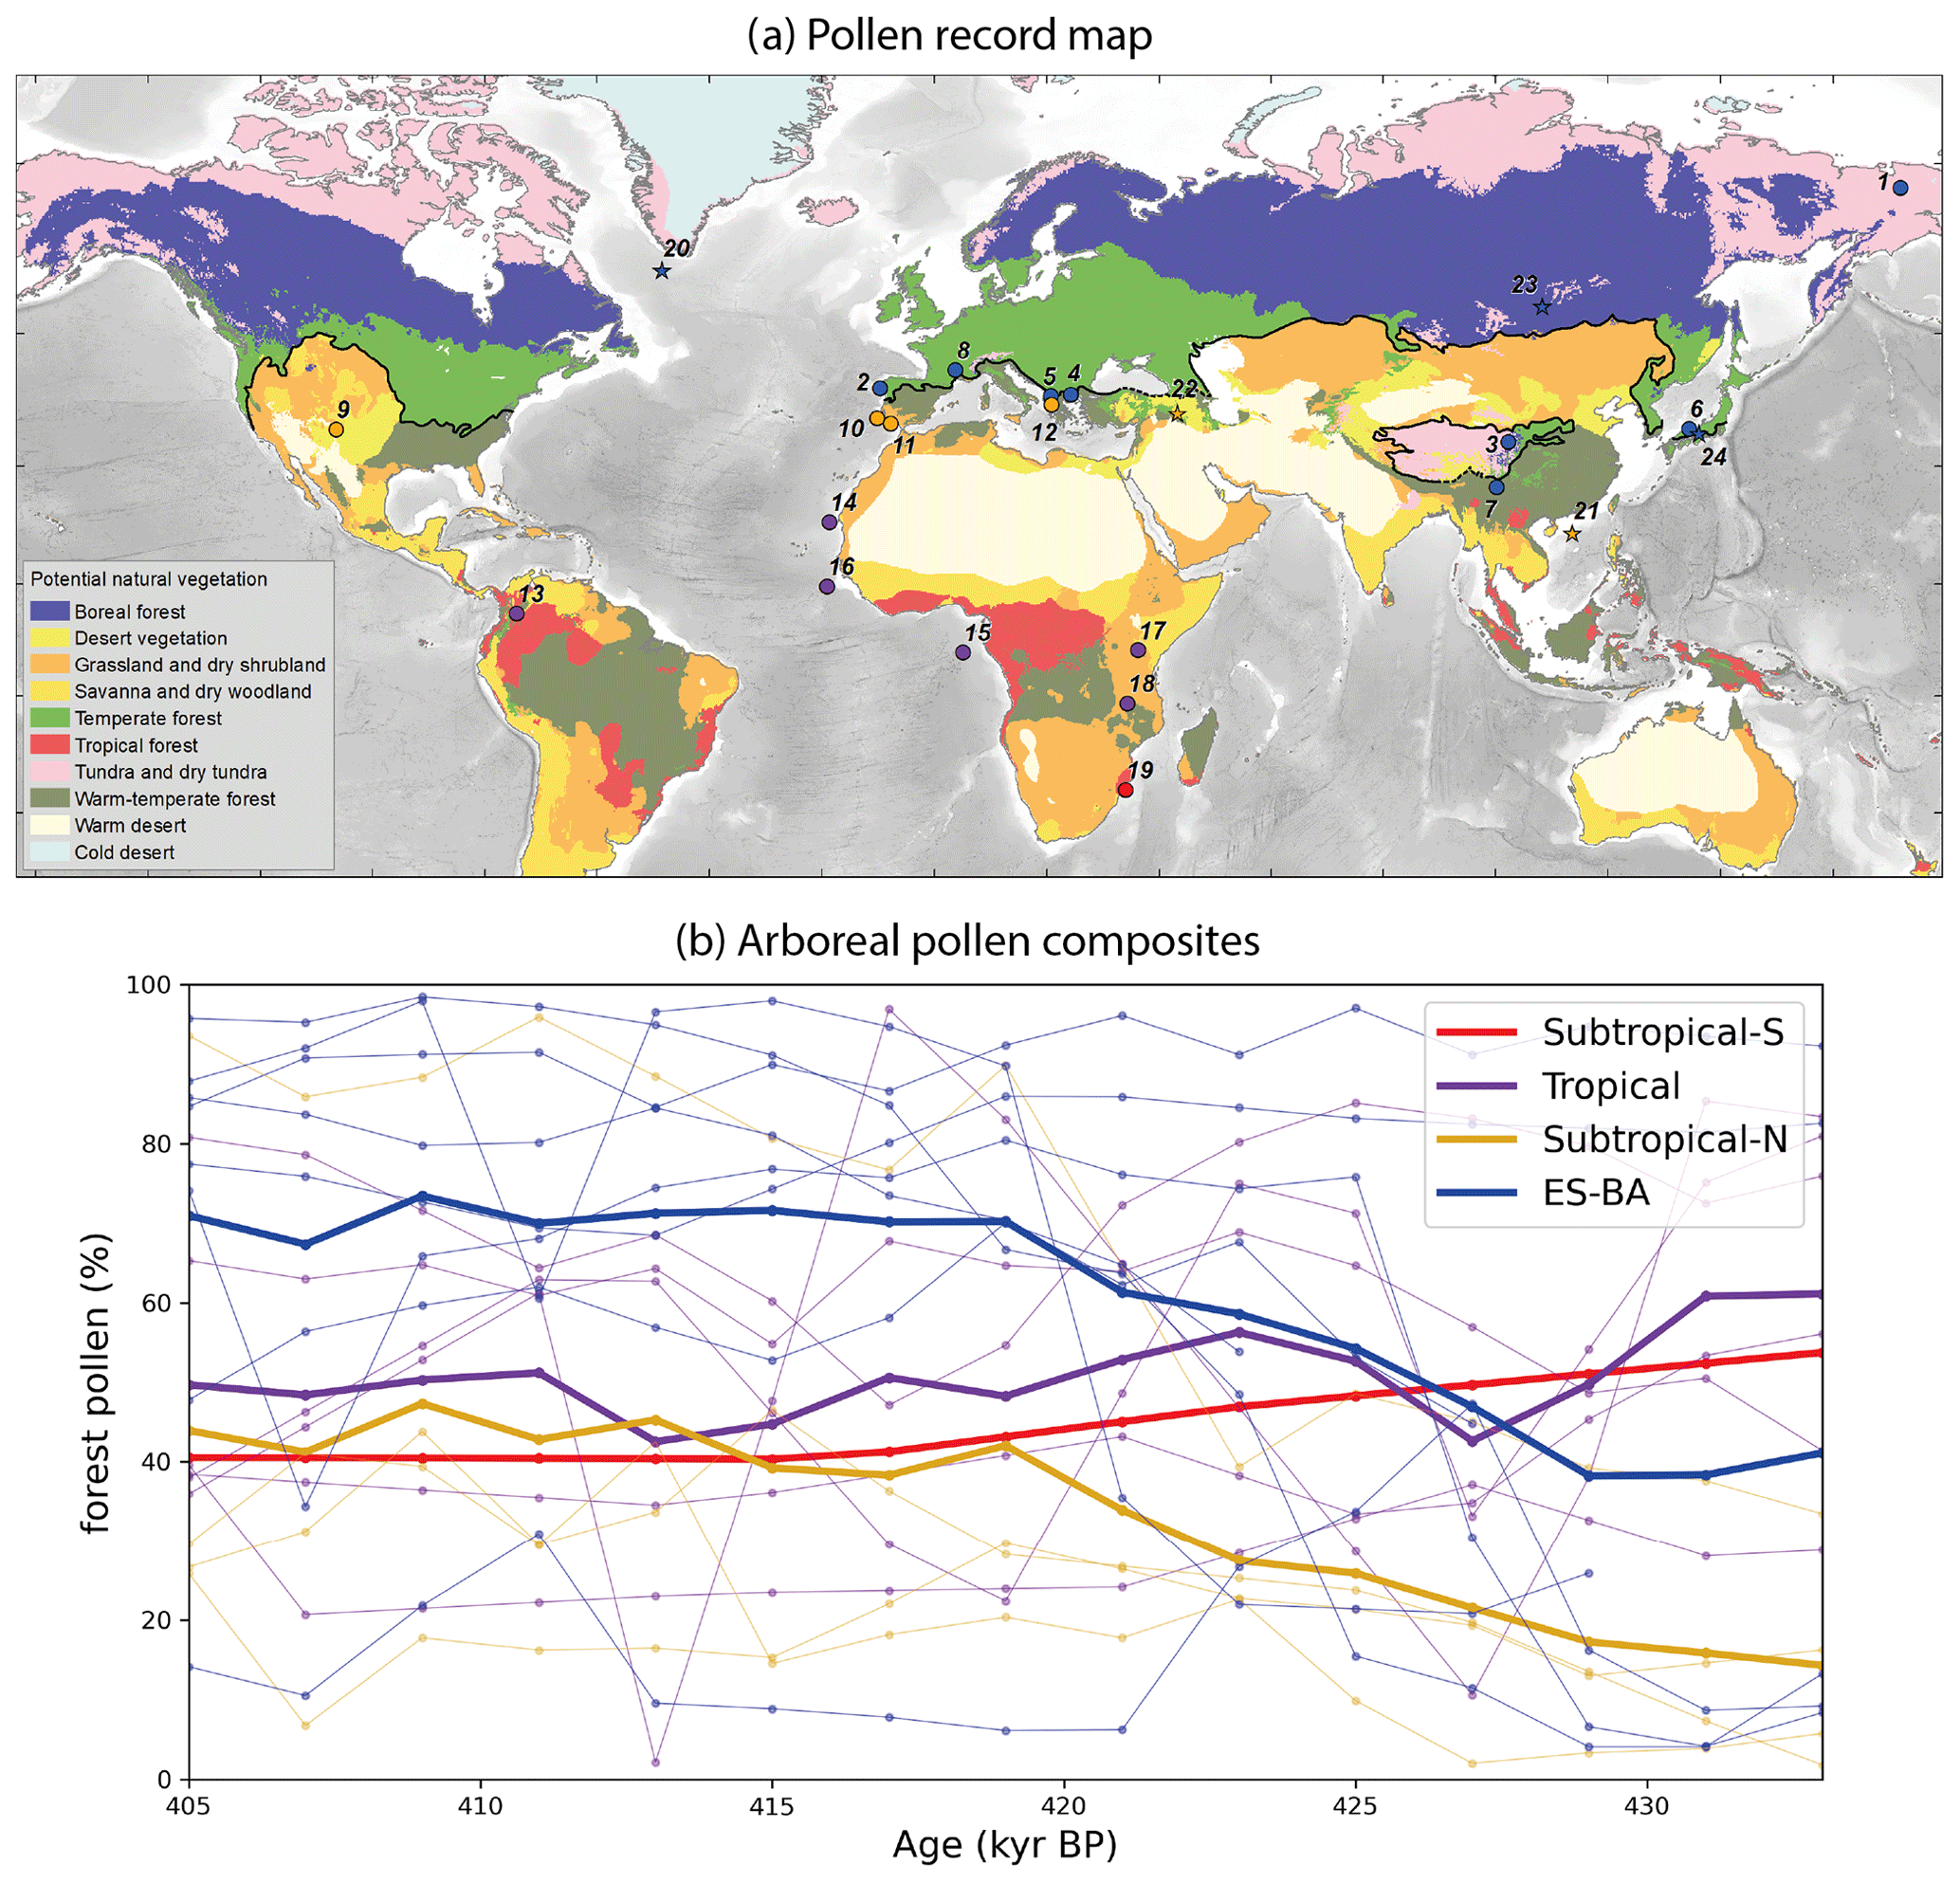
Figure 5(a) Forest pollen record locations (dots, numbering refers to Table 2) classified into four bioclimatic groups defined in the text (red: Subtropical-S; purple: Tropical; yellow: Subtropical-N; blue: euro-Siberian–boreo-American, ES-BA). Stars refer to the pollen records covering TV and unavailable at the time of the study: numbers 20 to 24 correspond to sites ODP646 (de Vernal and Hillaire-Marcel, 2008), GeoB16602 (Cheng et al., 2018), Lake Van (Litt et al., 2014), Lake Baikal (Prokopenko et al., 2002) and Lake Biwa (Tarasov et al., 2011) respectively. Colour shading represents the modern biome distribution modelled by multinomial logistic regression (from Levavasseur et al., 2012) on the BIOME 6000 database (Prentice et al., 1996; Pickett et al., 2004) and the black line delineates the ES-BA megabiome southern boundary (courtesy of Vincent Hanquiez). (b) Record time series with colours referring to the same bioclimatic groups as in (a). Pale lines represent the individual forest pollen records and bold lines the forest pollen composite for each group.
The Tropical composite features a relatively constant forest pollen percentage (between ∼ 40 and ∼ 65 %) across Termination V. However, this constant envelope is marked by variations such as a large drop between 432 and 427 kyr BP followed by an increase until 423 kyr BP and a smoother trough centred at 413 kyr BP. The Suptropical-N composite is characterised by an increasing trend in forest pollen percentages from 14 % at 433 kyr BP to 42 % around 419 kyr BP, mainly accounted for by the limited but rapid rise in the Valles Caldera pollen percentages around 425 kyr BP and later on by the pollen surge in the Ioannina record from 423 to 419 kyr BP. The Subtropical-N forests then develop relatively slowly, reaching a peak of 47 % towards the end of the termination at 409 kyr BP. Two additional pollen records support this Subtropical-N forest pattern. Lake Van pollen sequence (Litt et al., 2014), located on the eastern Anatolian high plateau (no. 22 on map Fig. 5a), depicts a progressive and moderate forest development reaching a ∼ 45 % maximum around 415 kyr BP. Similarly, the southeastern China sea record (no. 21, Fig. 5a, Cheng et al., 2018) features a reduced warm temperate forest development peaking around 410–400 kyr BP. The ES-BA group includes records from very different locations (Tibetan Plateau, Siberia, continental Europe, Japan). The resulting composite is first marked by a sharp and substantial increase in pollen percentages from 38 % at 429 kyr BP to 70 % at 419 kyr BP and then by a stagnating period (419–409 kyr BP), while the last part of the sequence features a slight drop at 407 kyr BP. The ES-BA composite increase is mostly driven by the strong development of Praclaux, Tenaghi Philipon and Lake Ohrid temperate forests and then by the growing Siberian forest (ICDP5011). Finally, the Subtropical-S forest pollen percentages decrease by over 13 % across TV. Overall, the present composite analysis highlights two interesting features. The warm temperate forests (Subtropical-N) continuously develop across the termination and reach a maximum around 409 kyr BP, while the temperate and boreal forests (ES-BA) feature a strong expansion over a short period (only ∼ 10 kyr) starting early in the termination (∼ 429 kyr BP). However, the limited number of pollen records also calls for both more observational data and for climate–vegetation simulations to gain further insight into the global terrestrial biosphere evolution.
3.3.2 Model–data comparison
The iLOVECLIM climate simulation of TV (Degla-V) provides a complementary view to that of the pollen composites, allowing a better evaluation of the forest development and its possible impact on atmospheric CO2 changes recorded during TV. Figure 6 features the simulated tree fraction (Degla-V) and the forest pollen records at 433 kyr BP (glacial period, Fig. 6a) and 405 kyr BP (end of deglaciation, Fig. 6b). Based on numerous studies on the present-day pollen–vegetation relationships (Huntley, 1983, 1990; Zanon et al., 2018; Morales-Molino et al., 2020), we adopt pollen forest percentage as an indicator of the tree fraction.
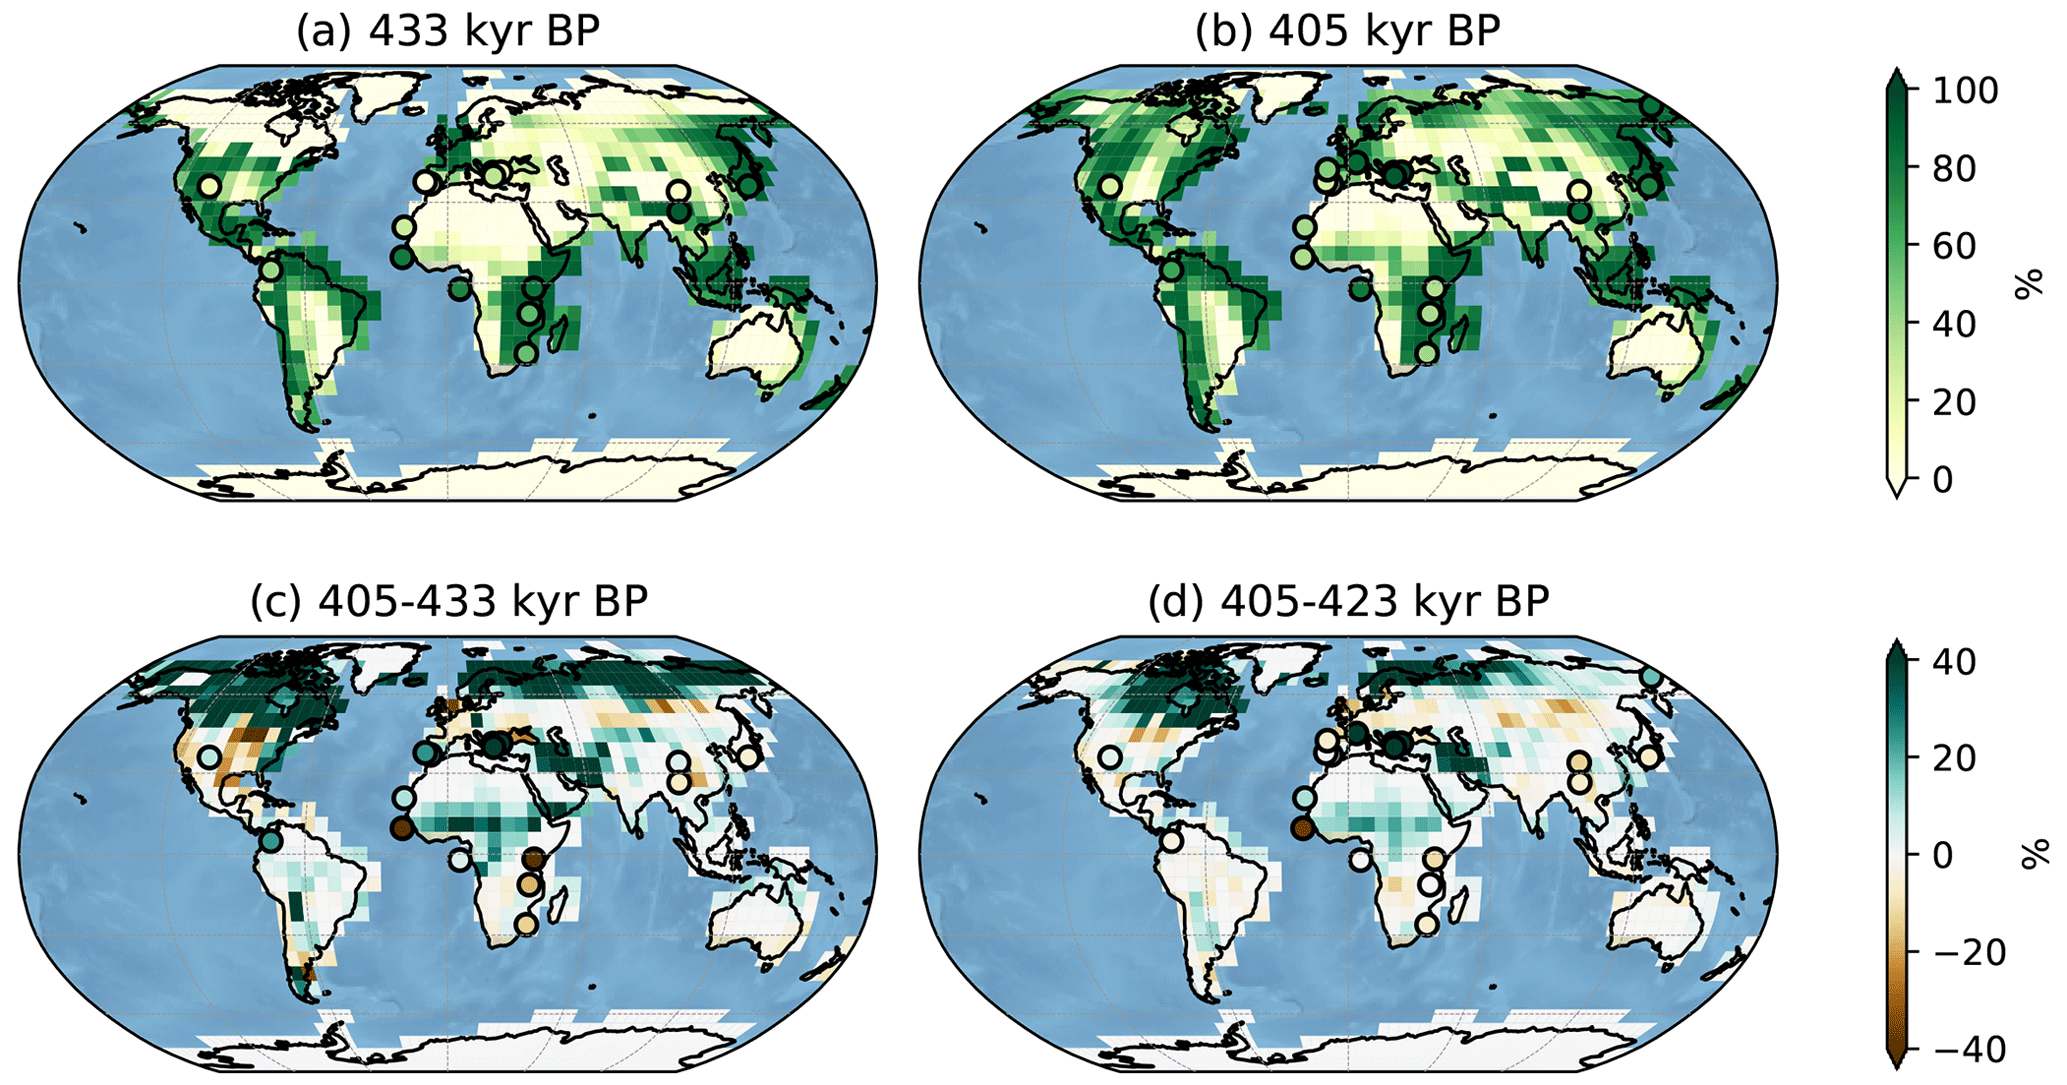
Figure 6Global comparison of simulated tree fraction (square patches, %) and forest pollen from records (circles, %) at 433 kyr BP (a) and at 405 kyr BP (b). Panels (c) and (d) feature the tree fraction difference between 405 and 433 kyr BP and 405 and 423 kyr BP respectively. Pollen record percentages should be compared to the simulated tree fractions of the closest adjacent land.
The absence of simulated trees at high latitudes (> 60∘ N) at 433 kyr in Fig. 6a is consistent with the presence of a large ice sheet over North America, Greenland and Siberia during MIS12 (Batchelor et al., 2019). As expected, the high simulated tree fractions are located at lower latitudes and specifically around the Equator. However, there are two important and known model biases concerning simulated tree fractions (Goosse et al., 2010). The model features high Amazon forest along the eastern, northern and western South American coastline, while there is no reason why trees should be absent from inland regions of northern South America. This can be explained by a tube-like modelled Amazon river hindering moisture fluxes from the river to the atmosphere and resulting in a desert environment in the tropics. On the African continent, equatorial forest is shifted to the east with desert-like sub-Saharan regions. This anomaly derives from a poorly resolved African monsoon (Goosse et al., 2010).
The forest pollen observations overall support the simulated tree fraction while they also underline the aforementioned model biases both at the onset and the end of TV (Fig. 6a and b respectively). The northward gradient of simulated forest fraction over the Iberian Peninsula at 405 kyr BP (Fig. 6a) is consistent with lower forest pollen percentages in southern Iberia compared to northern Iberia supporting the idea that temperate forest is more developed than Mediterranean forest at the end of TV. At 433 kyr BP the simulated tree fraction over the Balkan region (<20 %) agrees with the low pollen percentages, and the simulated latitudinal forest gradient over the eastern Tibetan Plateau is in line with the two pollen records (Heqing and ZB13-C2). The northernmost African record (ODP 108-658) featuring a nearly absent Saharan forest is also well captured by the model both at 433 and 405 kyr BP. However, the model and observations disagree at 433kyr BP over equatorial Africa where the records describe a strongly rooted forest (forest pollen > 80 %), while the simulated tree fraction is very low, and over southern Africa where the model overestimates the forest proportions (for both 433 and 405 kyr BP), thus highlighting the aforementioned model biases. Finally, Japanese, Siberian and Amazonian simulated forests are relatively consistent with the corresponding pollen percentages.
In Fig. 6c we compute the difference between maps (b) and (a) in order to cancel out the systematic model biases and to illustrate the forest expansion/retreat over the whole deglaciation (405–433 kyr BP). As two pollen records (ICDP5011 and MD01-2447) do not cover the whole Termination, a second difference map (Fig. 6d, 405–423 kyr BP) complementary to Fig. 6c and including all sequences is proposed, although we mainly focus on Fig. 6c to reveal the full deglaciation forest trends. The impact of ice sheet melt is marked by strong forest development north of 60∘ N in Siberia, surrounding the Bering Strait (confirmed by ICDP5011 record on a shorter timescale, Fig. 6d), and at 50∘ N over the northwestern American continent. Model and pollen data agree over the eastern Tibetan Plateau and over Japan where the forest remains relatively stable. The simulation underestimates the forest expansion in the Iberian, the western Europe, the Balkan and the Amazonian regions and the forest retreat in southern Africa. Finally, we observe contrasting results over tropical Africa. The increasing simulated forest is in line with two west African deep-sea records (ODP 108-658 and GIK16867-2) but disagrees with recorded forest decline on the western (GIK16415-2) and the eastern (Lake Magadi) adjacent landmasses.
Our integrated research approach from regional pollen record analysis to global climate simulation opens multiple discussion levels for both the observation and the modelling communities.
4.1 Assessing regional forest development across Termination V
In this section, we use th4e Degla-V simulation (in addition to the sparse, yet essential pollen records) to provide a finer temporal analysis of forest developments for selected regions of the world (Fig. 7). We choose eight regions based on special features emerging from Fig. 6c: either regional uniform trends (e.g. Siberia) or regional heterogeneous trends (e.g. central Asia). Because the selected regions are much larger than the catchment areas represented by marine and lacustrine records, the associated simulated forest features smoother variations than the pollen records. Therefore, it is more relevant to compare the simulated forest to the record mean when there is more than one record by region. For each region, we focus on the forest expansion trend and timing of the maximum. As already noticed for pollen composites (Fig. 4), we also observe regional discrepancies in the simulated tree fraction.
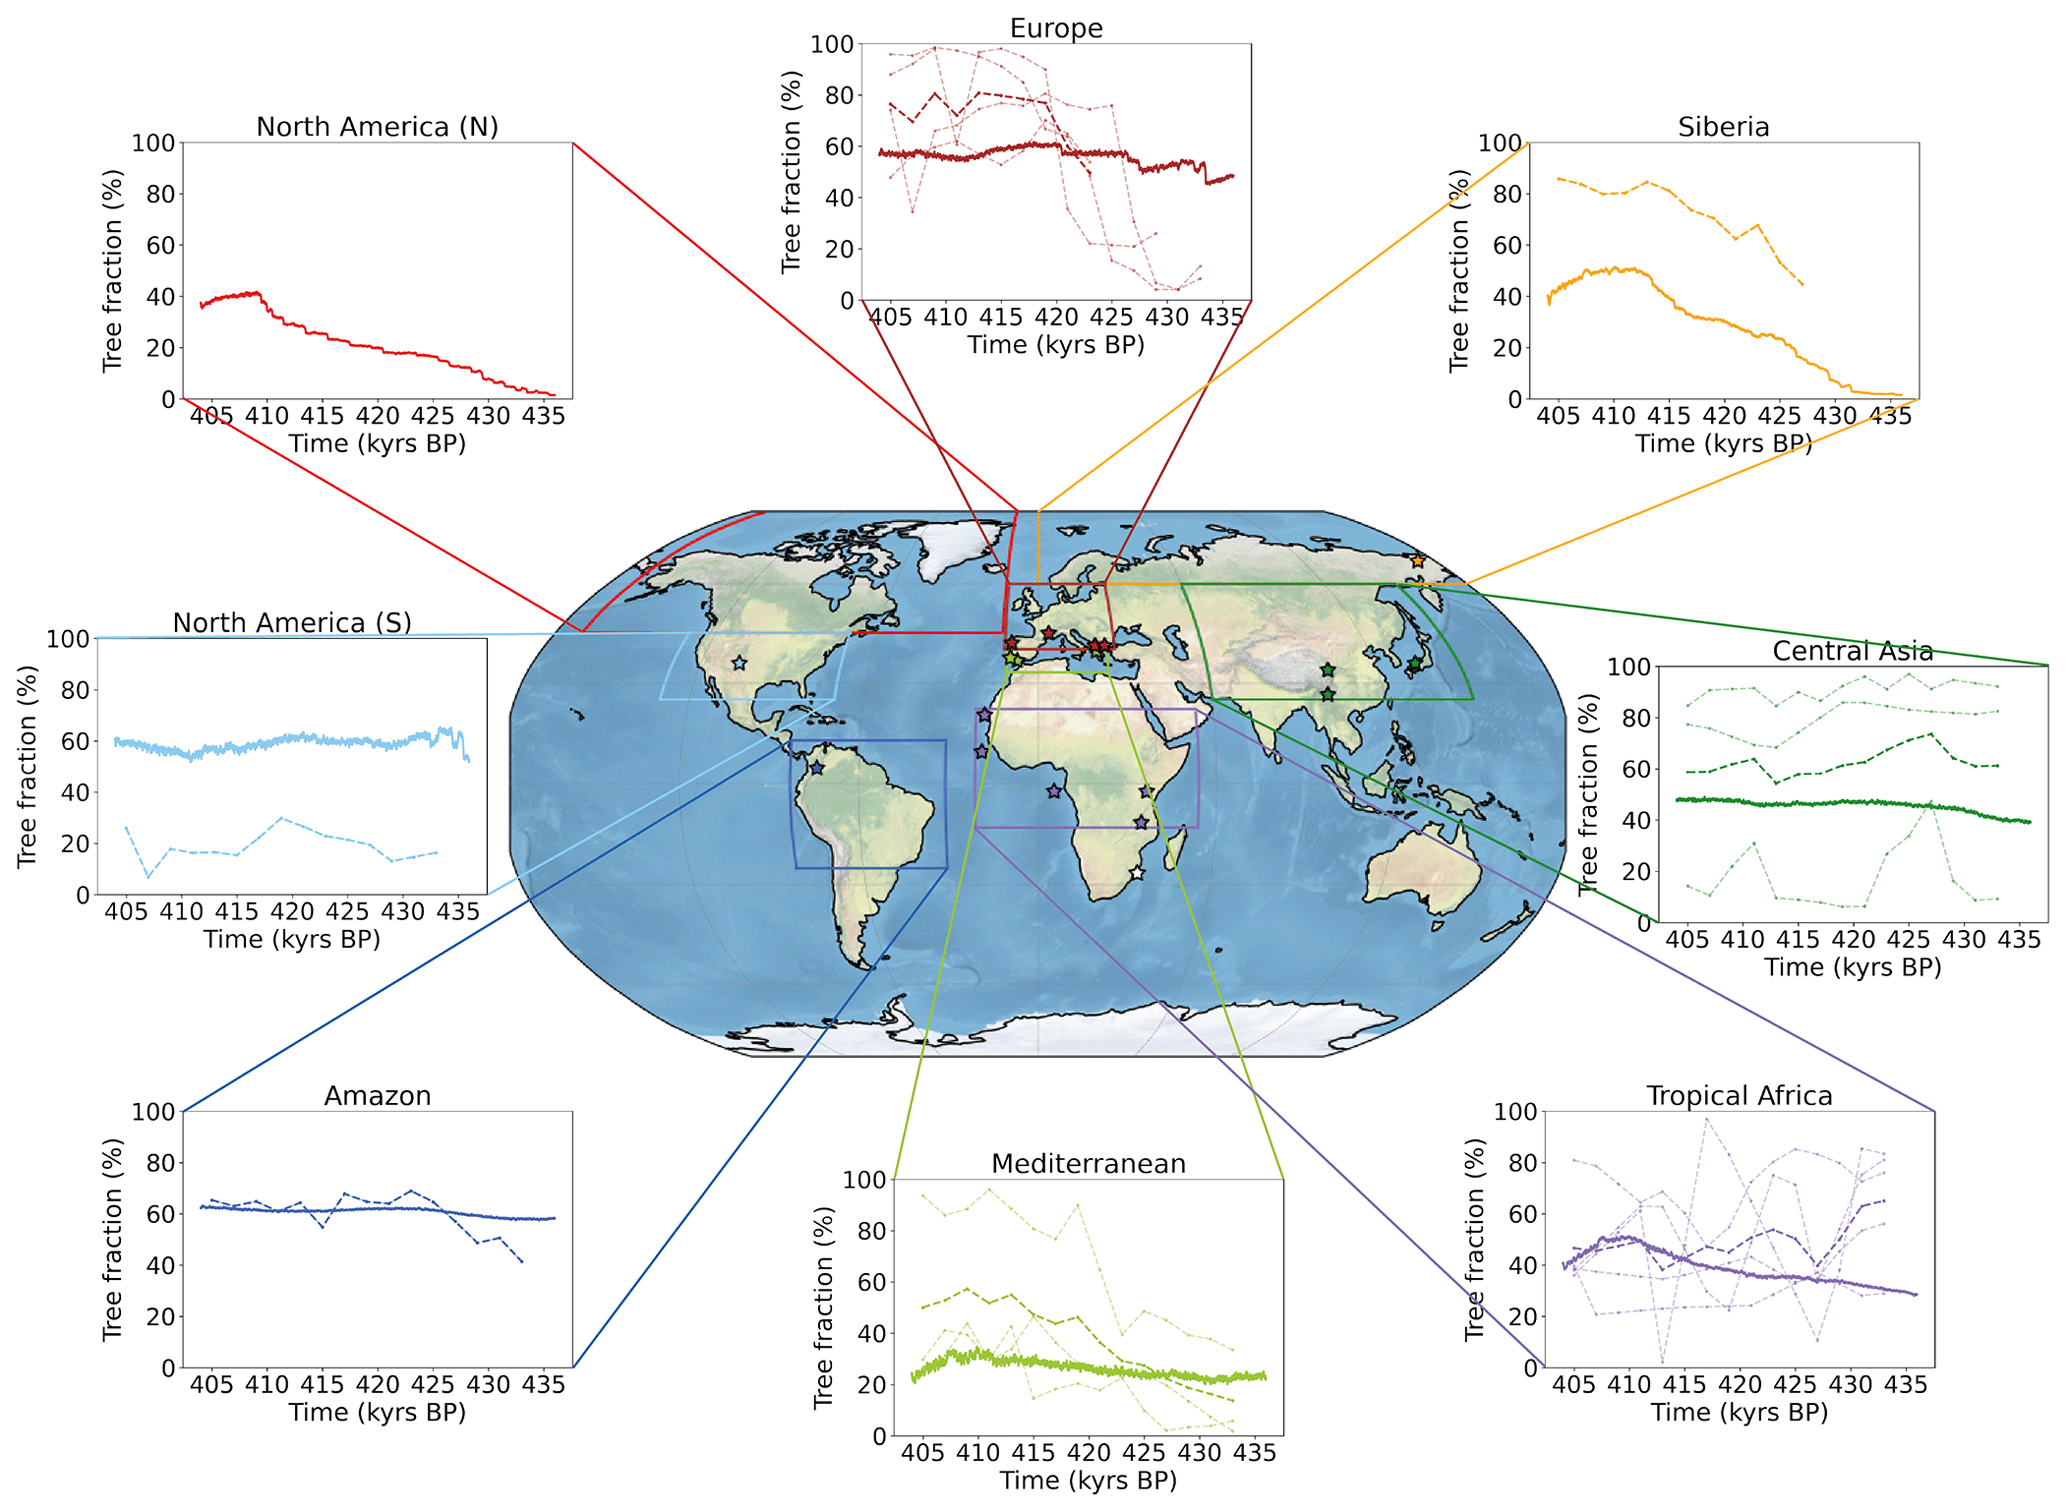
Figure 7Comparison of simulated tree fraction and forest pollen percentage by region across TV. Each plot shows the simulated tree fraction average (%, solid line) over the corresponding regional box (coloured contours) and associated forest pollen record (%, pale dotted line) and record average (%, bold dotted line) when available. Locations of pollen records are marked by coloured stars.
The simulated Amazon tree fraction is relatively constant (∼ 60 %) and overall in line with the single record (Funza), although it does not reproduce the significant forest increase observed from 433 to 423 kyr BP. In tropical Africa, we observe a constant simulated forest growth across TV reaching a maximum of nearly 50 % at 411 kyr BP before decreasing. This region is characterised by contrasting pollen record signals. Although the record average follows a decreasing trend contradicting the simulated trend, it features a local forest expansion peak synchronous with the simulated one. Aside from a temporary development at 435 kyr BP, the North America (S) simulated tree fraction remains stable across the termination with increasing trends (east coast) compensating for decreasing trends (central North America, see Fig. 6c). The latter is confirmed by the pollen sequence of Valles Caldera in SW North America, which shows a relatively low development of forest cover with a decreasing forest trend from 420 to 405 kyr BP. The small Mediterranean region features an increasing forest trend both for the simulation and record average; however, this is much weaker in the simulation which can partly be explained by the null contribution of the northern Sahara in the model. Forest expansion reaches a maximum at ∼ 410 kyr BP both for the model and the data before shrinking at the end of the sequence for the modelled forest. Europe is characterised by a very weak increase in simulated forest coverage following a step-like pattern at ∼ 433, ∼ 427 and ∼ 420 kyr BP. The simulated tree fraction is relatively consistent with the pollen record average over the second part of the deglaciation (although it is ∼ 15 points below) in the sense that both reach a plateau around ∼ 420 kyr BP. However, they strongly differ at the beginning of the sequence. We propose two complementary explanations for this discrepancy. First, the observed strong temperate forest development at the onset of TV originates from southern Europe records only, yet Koutsodendris et al. (2010) argue that the central European forest expanded from ∼ 415 kyr BP only (based on the Dethlingen pollen record). Therefore, the record average is not fully representative of the European forest dynamics. Second, given the low horizontal resolution of the atmospheric module, we suspect that precipitation inaccuracies might account for a misrepresentation of growing conditions and an associated underestimation of simulated forest growth over Europe. For central Asia, the simulated tree fraction features a smooth and weak increase over TV with a slightly stronger trend from 435 to 430 kyr BP, consistent with the strong rise in the record average at 430 kyr BP. Finally, the two northernmost regions (North America (N) and Siberia) are totally unforested during the MIS12 glacial stage and both highlight a pronounced two-stage simulated forest development during the deglaciation. A first local maximum is reached at ∼ 423 kyr BP in both regions and a second and final peak arrives at ∼ 409 kyr BP in the North American (N) region and at ∼ 413 kyr BP in the Siberian region. Despite the lack of a precise pollen record to constrain the simulated forest evolution over North America (N), de Vernal and Hillaire-Marcel (2008) show, in a deep-sea sedimentary sequence collected off Greenland, that the highest pollen concentrations of Picea over the last 1 Myr occur between 410 and 390 kyr BP, thus supporting the idea of a strong forest expansion in the North American (N) region during TV. Concerning Siberia, the only available record (ICDP5011) features two maxima (∼ 423 and ∼ 413 kyr BP) consistent with the simulated development stages and a similar trend, although 20 to 30 points above the simulated one. We explain such a difference by the variable influence of ice retreat on forests depending on the latitude. The northernmost grid points of the region experience widespread growth (similarly to the ICDP5011 record) because of a net increase in available land, whereas southernmost grid points are mostly affected by changes in atmospheric temperatures, CO2 concentrations and precipitation, resulting in lower forest expansion (see Fig. 6c).
This regional comparison of simulated forests and pollen record averages suggests different forest dynamics across TV. Over tropical Africa, the Amazon and North America (S), we find no evidence for clear forest trends. The Mediterranean region shows a significant forest growth mainly after ∼ 425 kyr BP and reaching a peak at ∼ 410 kyr BP. Finally, Europe, central Asia, North America (N) and Siberia share similar features. The forest expansion begins early (from ∼ 435 kyr BP) and reaches a first maximum around 425 kyr BP. The forest growth is particularly strong for the North American (N) and the Siberian regions (+40 % to +50 % over TV), supporting the argument for a massive boreal and temperate forest development. Such a significant forest development suggests a strong warming across TV and during MIS11 consistent with the reconstructed high temperatures, the reason for which Melles et al. (2012) refer to this period as a “superinterglacial”.
4.2 The potential role of boreal and temperate forests on atmospheric CO2 levelling during TV
At a global scale, both pollen observations (ES-BA composite in Fig. 5b) and model simulations (North American (N) and Siberian tree fraction in Fig. 7) outline that TV is characterised by a strong increase in boreal and temperate forest between ∼ 429 and ∼ 423 kyr BP. We suggest that this result can support recent findings by Brandon et al. (2020). Brandon et al. (2020) show an abrupt increase in the global biosphere productivity from ∼ 429 and ∼ 427 kyr BP resulting in anomalously high values of productivity (10 % to 30 % higher than preindustrial), which would explain the atmospheric CO2 levelling from ∼ 425 to ∼ 415 kyr BP (Fig. 8). This global biosphere productivity extreme is unique among the last five interglacials, and it is mainly attributed to terrestrial biosphere (Brandon et al., 2020). With forests as terrestrial productivity indicators, we seek to specify the geographical origin of such important carbon dioxide stabilisation. Among the four pollen composites, the Subtropical-N and the ES-BA feature the most important forest expansion (i.e. the strongest increasing trend, Fig. 8). However, the Subtropical-N composite features a lower trend than the ES-BA, which is also concomitant with the surge in the productivity signal (429–425 kyr BP). Moreover, it is important to note that the ES-BA composite represents a broader area than the Subtropical-N because it is composed of seven pollen records (versus four for Subtropical-N) covering a larger diversity of regions. The model simulations also confirm that the ES-BA pattern is present over the Siberian and North American (N) regions and the European and central Asian regions to a smaller extent (Fig. 7). Additionally, this significant development is synchronous with the surge in the productivity signal (429–425 kyr BP). Therefore, we propose that the temperate and boreal forests of the Northern Hemisphere are the major drivers of the high terrestrial biosphere productivity signal and the moderate atmospheric CO2 values at the beginning of MIS11, while the contribution of the warm temperate forests of the Northern Hemisphere is weaker and arrives later (from ∼ 420 kyr BP).
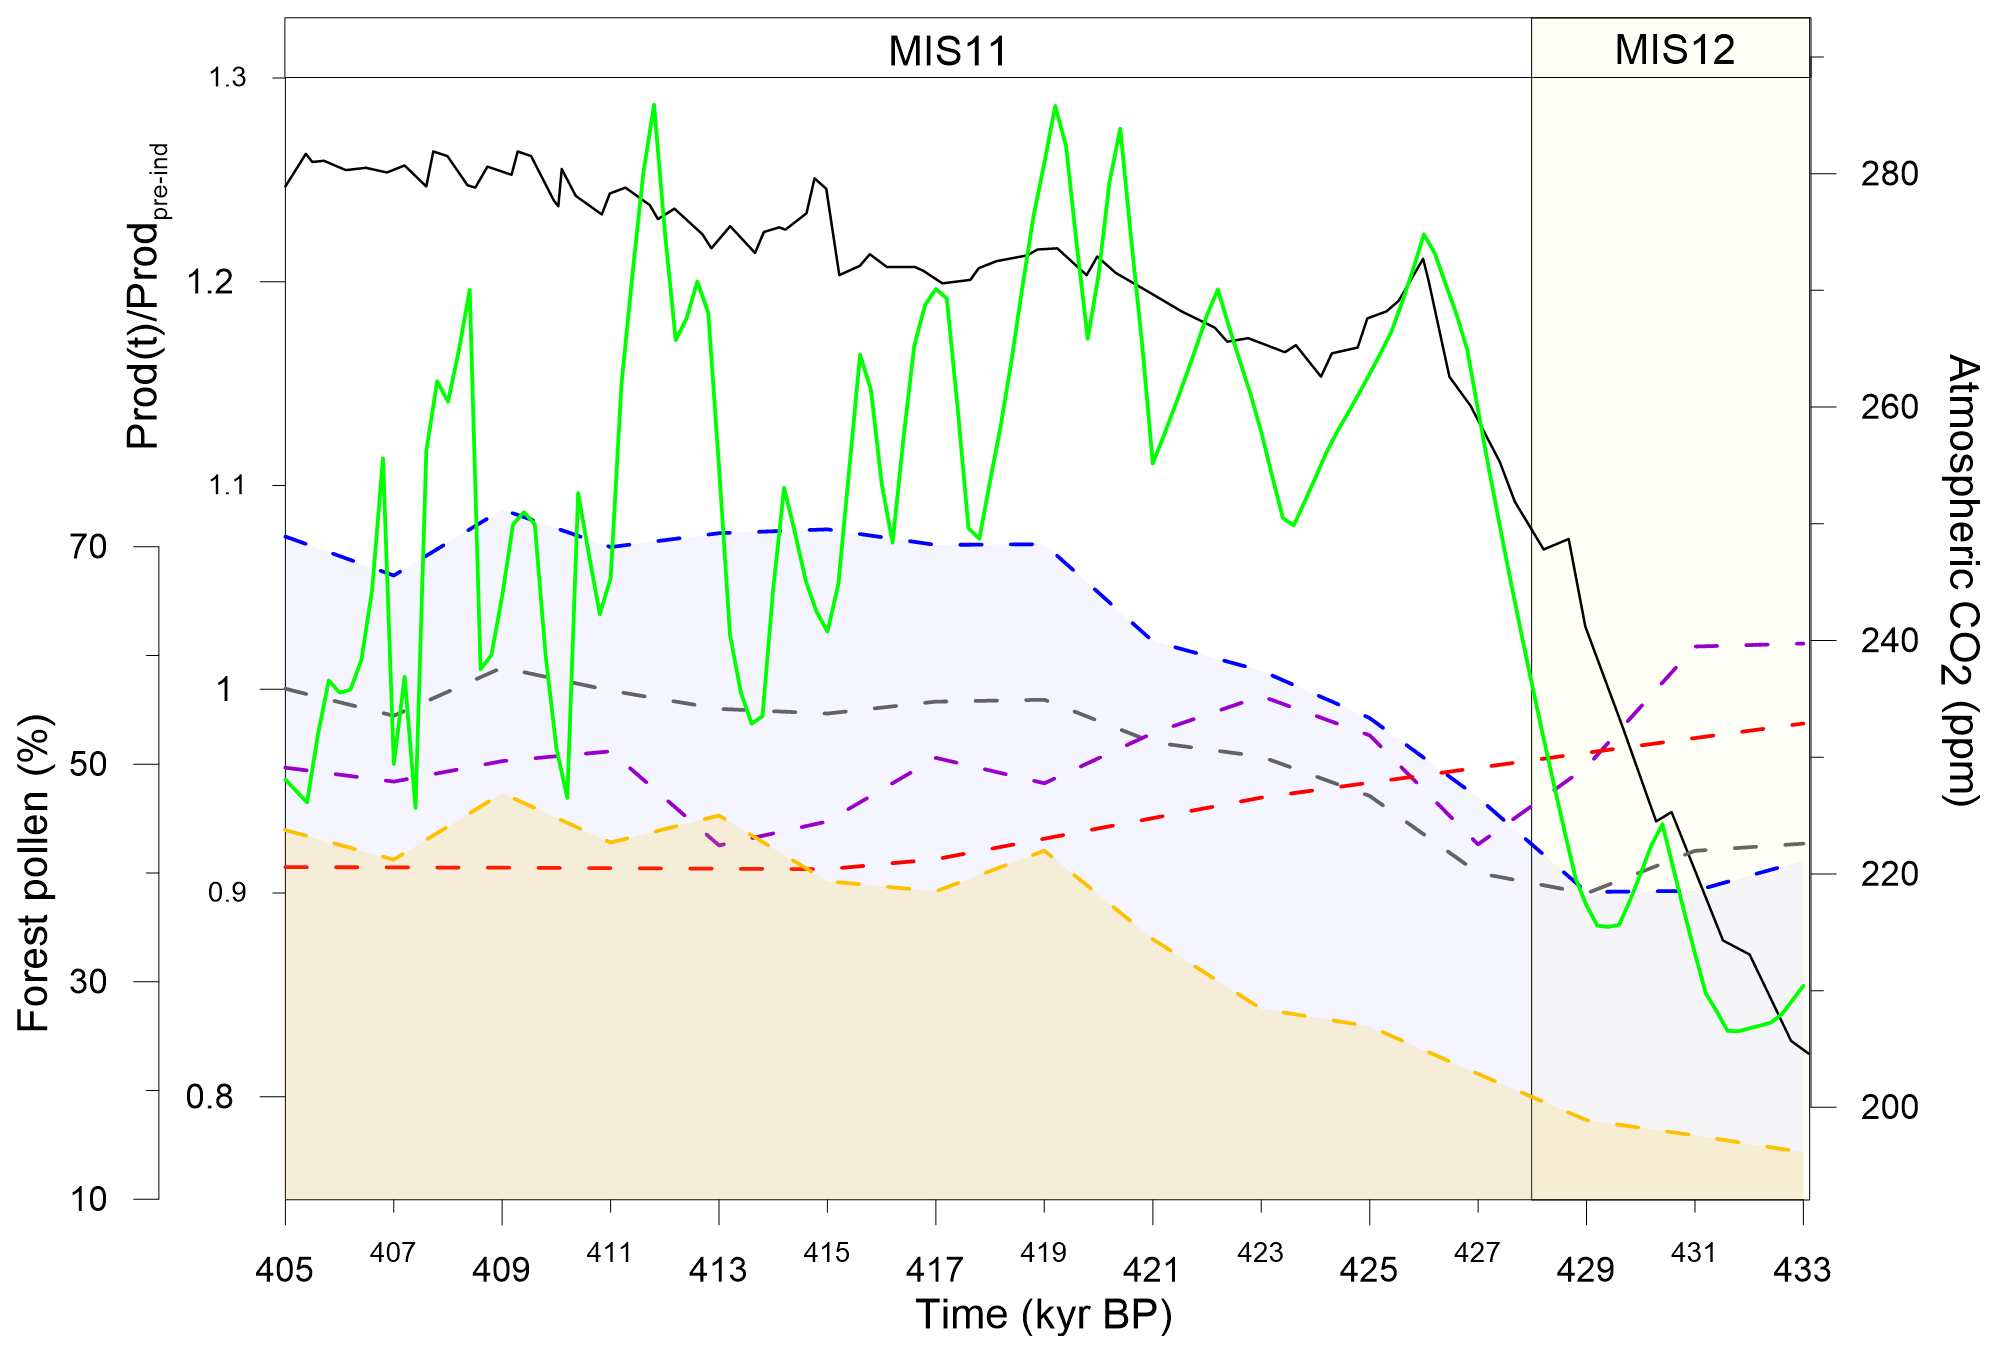
Figure 8Comparison of forest pollen composites and observed global biosphere productivity (inferred from Δ17O of O2, solid green line, Brandon et al., 2020) and CO2 (solid black line, Nehrbass-Ahles et al., 2020) over TV. Forest pollen composites from Fig. 5 are shown in dashed blue (ES-BA), yellow (Subtropical-N), purple (Tropical), red (Subtropical-S) and grey (record average) lines.
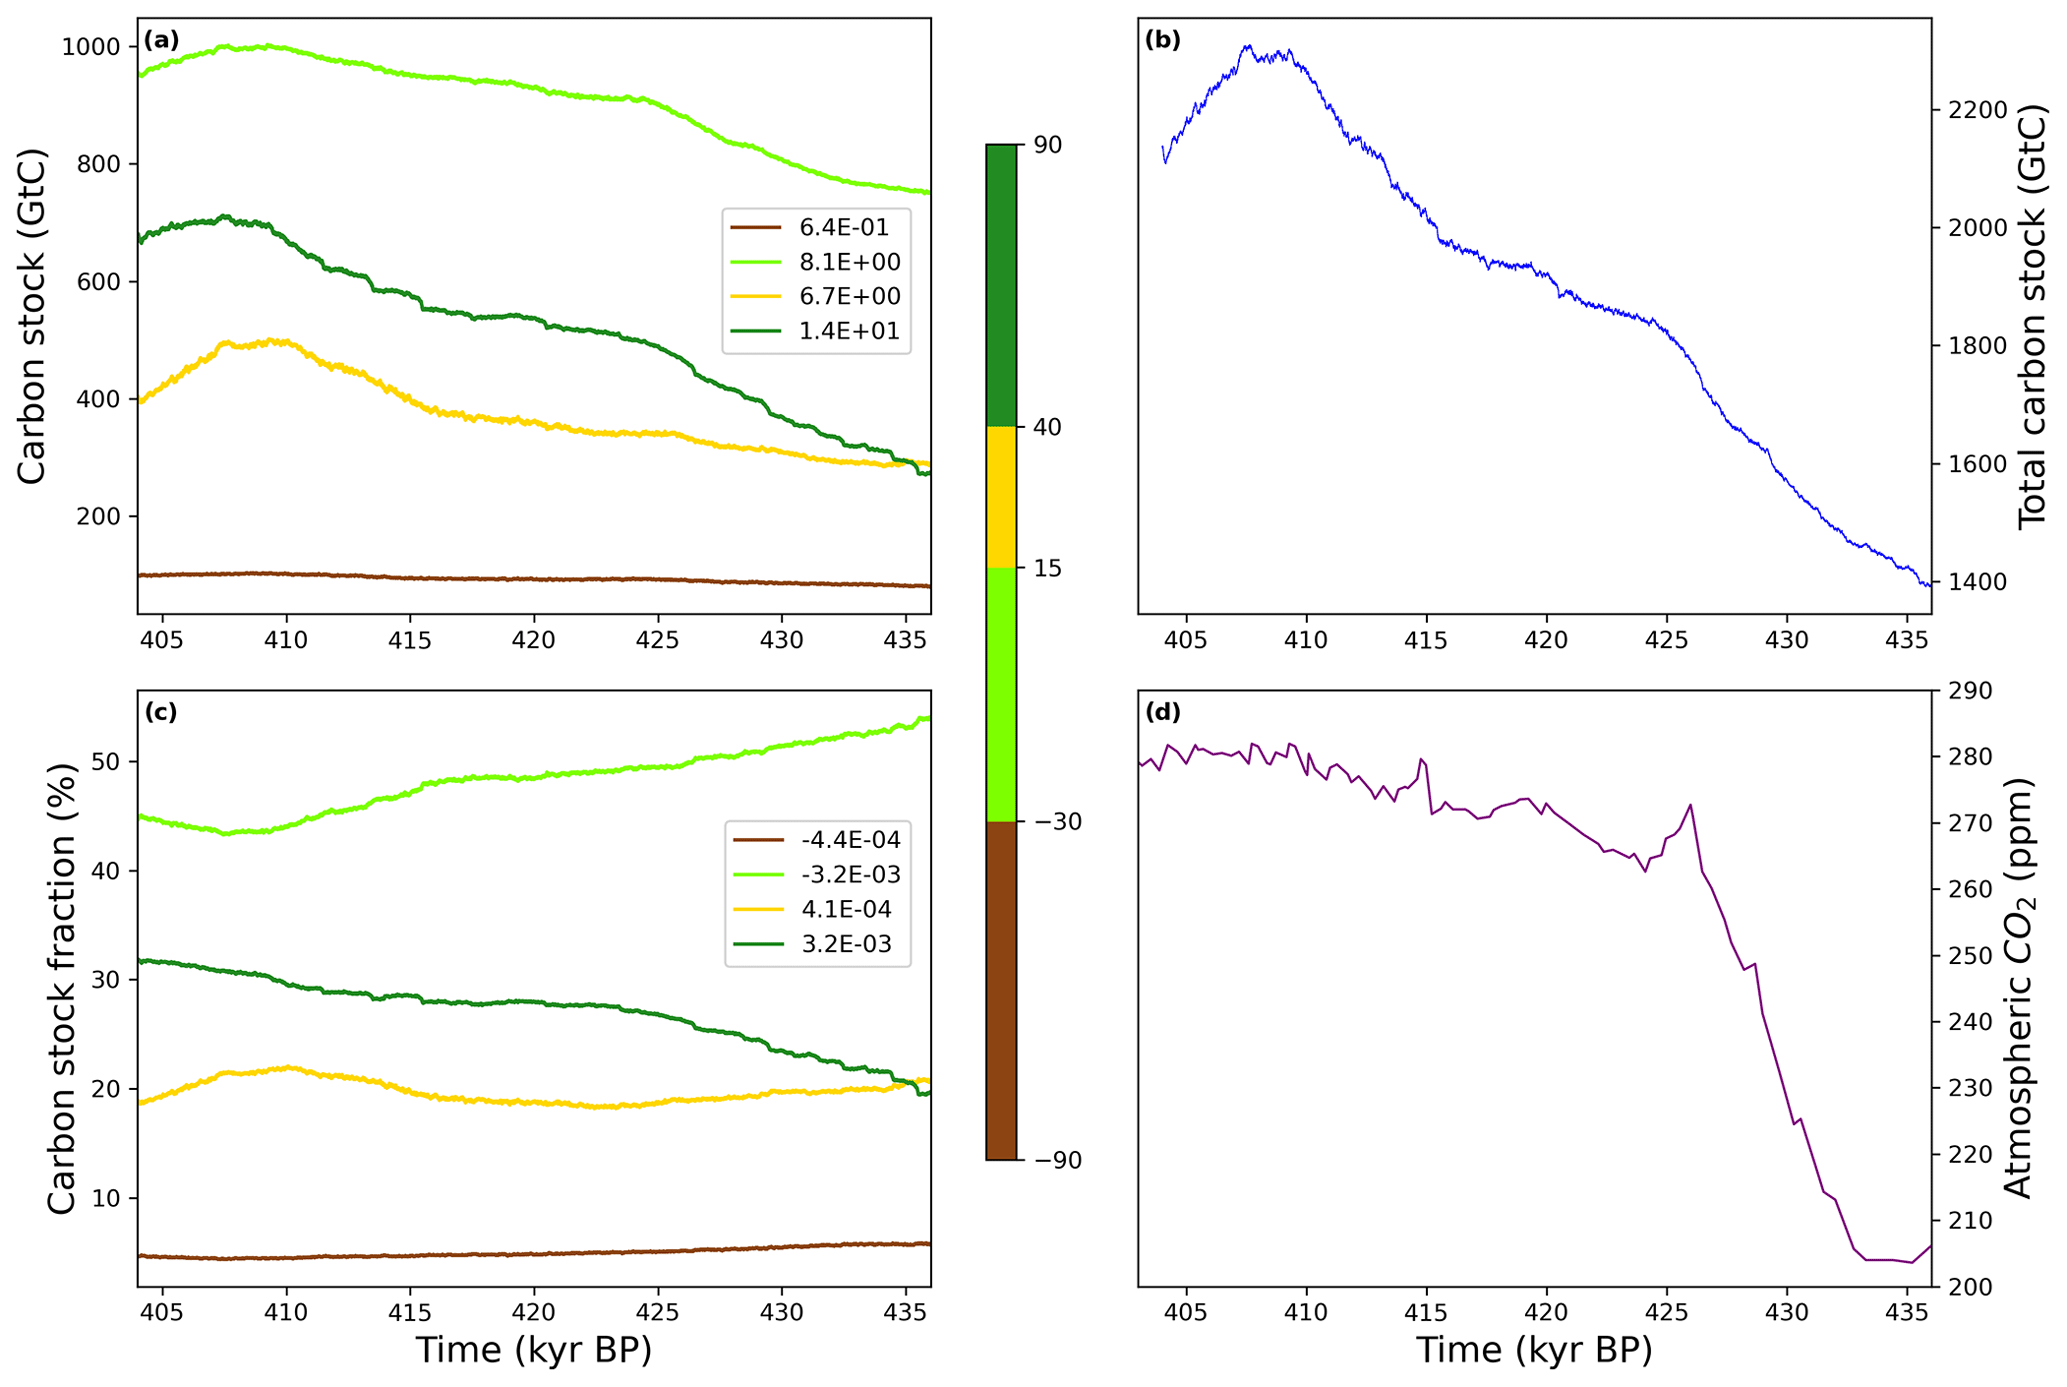
Figure 9Zonal averages of simulated terrestrial biosphere (a) carbon stock (Gt C) and (c) fraction of total carbon stocks (%) across TV. Panel (b) features the total carbon stock of the simulated terrestrial biosphere and (d) the atmospheric CO2 concentration from Nehrbass-Ahles et al. (2020). The simulated carbon stock is derived from the net productivity computed over each continental grid (Brovkin et al., 2002; see Sect. 2.3.1). The linear regression coefficient (Gt C kyr−1) is provided for each zonally averaged time series (a and b). Panel (c) presents the total simulated terrestrial biosphere carbon stock (Gt C) across TV.
To further assess the carbon sink potential of temperate and boreal forests we analyse the variation in the simulated total carbon stock (i.e. carbon fluxes between the atmosphere and the vegetation + soil system), both a proxy for terrestrial biosphere productivity and a direct measure of atmospheric CO2 removal (Fig. 9). Overall, the simulated total carbon stock (Fig. 9b) increases across TV, peaking around 410 kyr consistently with the average pollen-based forest maximum (grey line, Fig. 8) and in line with the simulated vegetation carbon maximum by Kleinen et al. (2016). Figure 9a represents the total simulated terrestrial carbon stock for four different zonally averaged vegetation types following the preindustrial Holocene biomes simulated by Prentice et al. (2011): temperate parkland and sclerophyll woodland ([−90, −30]∘ N), tropical forest ([−30, 15]∘ N), warm-temperate forest and sclerophyll woodland ([15, 40]∘ N), and high-latitude boreal and temperate forest ([40, 90]∘ N). The southern forest group features very low and slightly growing carbon stocks (brown, Fig. 9a). By contrast, the Tropical forest is the largest terrestrial carbon stock, accounting for approximately 50 % of the total carbon stock (dark green, Fig. 9c) throughout the termination. The relatively strong increasing trend in carbon stocks (∼ 8.1 Gt C kyr−1, Fig. 9a) is segmented into two parts: a steep carbon stock rise at the onset of MIS11 from 436 to 425 kyr BP and a smoother rise from 425 to 410 kyr BP. The midlatitude temperate forest represents around 20 % of the total carbon stock (yellow, Fig. 9c). The slowly increasing stock becomes very sharp at 416 kyr BP and peaks at 500 Gt C around 411 kyr BP (Fig. 9a). Finally, the high-latitude boreal and temperate forest features the strongest mean increase in carbon stock (+13.7 Gt C kyr−1, light green, Fig. 9a) among all regions. We observe a two-stage pattern (similarly to the North American (N) and the Siberian tree fractions, Fig. 7), with a steep rise until 425 kyr BP, along with the Tropical forest, giving way to a smoother trend. A second strong increase from 416 kyr BP leads to a peak value of 700 Gt C at 409 kyr BP. The first carbon stock maximum is synchronous with the biosphere productivity surge (Fig. 8).
While the total carbon stock increases by ∼ 900 Gt C until 410 kyr BP (Fig. 9c), Fig. 9b shows a redistribution of the carbon sinks mainly from the Tropical forests (∼ 54 % of total carbon stock at 436 kyr BP to ∼ 45 % at 404 kyr BP) to the high-latitude boreal and temperate forest ([40, 90]∘ N) over the 436–420 kyr BP period (∼ 20 % of total carbon stock at 436 kyr BP to ∼ 28 % at 420 kyr BP) and to the larger area above 15 ∘N over the 405–415 kyr BP period, indicating a northward increase in carbon fluxes. Therefore, we suggest that the high-latitude boreal and temperate forests account for the overall biosphere productivity increase leading to atmospheric CO2 sequestration between 425 and 415 kyr BP. The warm temperate forests and sclerophyll woodlands, which include the Mediterranean forest, contribute more to the biosphere productivity over the 405–415 kyr BP period. The specific role of tropical forests remains unclear: the decrease in tropical forest percentages – mainly driven by GIK16415-2, Lake Malawi and Lake Magadi records – near 430 kyr BP leading to a local minimum around 428 kyr BP (Fig. 5) suggests that shrinking tropical forests could have temporarily contributed to the increase in CO2 at 430 kyr BP, but we do not have any confirmation in the carbon stock analysis (Fig. 9).
Finally, the Tropical forest, the midlatitude temperate forest, and the high-latitude boreal and temperate forest are marked by a decreasing carbon stock from ∼ 408 kyr BP resulting in a total carbon loss of 200 Gt C in 404 kyr BP (Fig. 9b). This carbon stock decline is both consistent with the shrinking simulated forest in the North American (N) and Siberian regions (Fig. 7) and with the forest simulations by Kleinen et al. (2014). Additionally, we observe a similar decreasing trend in the biosphere productivity starting ∼ 3 kyr earlier (Fig. 7) concomitant with increasing atmospheric CO2 concentrations.
Our new high-resolution pollen record (IODP U1386) allows us to resolve millennial-scale changes in southern Iberian vegetation cover over TV. This sequence shows a moderate Mediterranean forest expansion during TV (maximum MF pollen percentage of ∼ 50 %) in line with seminal work by Oliveira et al. (2016) and also unveils short timescale forest variations at the onset of the interglacial. TV is characterised by a two-step Mediterranean forest growth beginning at ∼ 424 kyr BP lagging behind the marine isotopic interglacial (defined by the global ice volume decrease) by approximately 4 kyr.
At a global scale, we assemble the first pollen record database for TV. Despite sparse pollen data, we observe different forest developments varying with latitude and highlighting the strong increase in temperate and boreal forests across the termination. We expect this new pollen database to open the way for extensive knowledge of terrestrial biosphere–climate interactions during TV. Yet, model–data comparisons remain fundamental to improve simulated forest accuracy in order to achieve a global cover. Here we observe that iLOVECLIM simulated forests feature overall similar but weaker trends than the pollen-based ones. This first assessment of global forest evolution during TV points out different driving mechanisms: a strong impact of ice sheet retreat on forests is observed at high latitudes, while lower latitude forests are probably more influenced by precipitation and temperature changes (Yin and Berger, 2012).
Based on the presented global pollen-based vegetation records and simulation analysis we suggest the following scenario:
-
The strong warming at the onset of MIS11 results both in a strong increase in high-latitude terrestrial biosphere productivity and in a rise in atmospheric CO2 concentration probably driven by ocean physical and chemical degassing processes.
-
Because of the exceptionally high ice sheet melt characterising MIS11 (Dutton et al., 2015), forests can develop northwards. This strong expansion, mainly observed in the temperate and boreal forests, would allow carbon removal by terrestrial biosphere to partially compensate for the oceanic carbon losses, resulting in a long and unique CO2 plateau from ∼ 425 to ∼ 415 kyr BP. Although the warm temperate forests of the Northern Hemisphere subtropical regions also respond to this warming, they might only play a significant role in the carbon cycle change around 410 kyr BP.
While there are yet too few data to depict the full impact of vegetation on the carbon cycle, we expect the aforementioned conclusions to be regarded as a first benchmark case for further assessment of global terrestrial biosphere during TV.
In that respect, we identify three major future research perspectives. First, a necessary step in order to achieve an accurate picture of terrestrial biosphere evolution during TV is to increase the pollen record coverage, especially in poorly documented regions such as the American continent, Siberia, and central and southern Asia (tropical forests). Second, an integrated understanding of the carbon cycle during TV will require both improving terrestrial biosphere simulations and taking into account the permafrost. Increasing the number of PFTs and applying spatial downscaling methods should be considered to get precise terrestrial biosphere representations. Similarly, investigating vegetation changes in terms of forest biomes will allow an understanding of forest replacement processes. Finally, comparative studies of terrestrial biosphere–climate interactions over contrasted terminations such as Termination II (TII) may be successful in determining the specificity of TV. In this view, cooperation between the modelling and observation communities remains essential.
The IODP U1386 pollen record documented here is available on the PANGAEA data repository at https://doi.org/10.1594/PANGAEA.939160 (Hes et al., 2021). Similarly, the global pollen database across Termination V and the iLOVECLIM simulation output variables (tree fraction and carbon stocks) presented here are accessible at https://doi.org/10.5281/zenodo.6611054 (Hes, 2022) and https://doi.org/10.5281/zenodo.5592751 (Hes and Bouttes, 2021) respectively.
The supplement related to this article is available online at: https://doi.org/10.5194/cp-18-1429-2022-supplement.
GH and MFSG conceptualised the study with help from NB. Pollen counting and analysis were performed by GH with the help of MFSG. The U1386 core samples were provided by MFSG. NB provided the expertise on the iLOVECLIM model and co-designed the model simulations with GH. GH ran the model simulations, conducted the model–data analysis and wrote the paper with input from all co-authors.
The contact author has declared that neither they nor their co-authors have any competing interests.
Publisher's note: Copernicus Publications remains neutral with regard to jurisdictional claims in published maps and institutional affiliations.
The present research used samples and data collected by the Integrated Ocean Drilling Program (IODP). We gratefully thank Déborah d'Olier and Ludovic Devaux for their valuable contribution to U1386 pollen record analysis and Paul Moal-Darrigade for shedding light on the local depositional setting of U1386. We are also grateful to Josué M. Polanco-Martínez for his technical advice in statistics. Similarly we appreciate Aurélien Quicquet and Didier Roche's help in manipulating the iLOVECLIM model. Special thanks to Amaelle Landais for her wise suggestions during result presentations. Finally we thank all cited authors for sharing their pollen data and warmly encourage more open-data resources.
This research has been supported by the Agence Nationale de la Recherche (grant no. CE27-0011-01).
This paper was edited by Nathalie Combourieu Nebout and reviewed by Suzanne Leroy and two anonymous referees.
Alonso, B., Ercilla, G., Casas, D., Stow, D. A. V., Rodríguez-Tovar, F. J., Dorador, J., and Hernández-Molina, F.-J.: Contourite vs gravity-flow deposits of the Pleistocene Faro Drift (Gulf of Cadiz): Sedimentological and mineralogical approaches, Mar. Geol., 377, 77–94, https://doi.org/10.1016/j.margeo.2015.12.016, 2016.
Barth, A. M., Clark, P. U., Bill, N. S., He, F., and Pisias, N. G.: Climate evolution across the Mid-Brunhes Transition, Clim. Past, 14, 2071–2087, https://doi.org/10.5194/cp-14-2071-2018, 2018.
Bartlein, P. J., Harrison, S. P., Brewer, S., Connor, S., Davis, B. A. S., Gajewski, K., Guiot, J., Harrison-Prentice, T. I., Henderson, A., Peyron, O., Prentice, I. C., Scholze, M., Seppä, H., Shuman, B., Sugita, S., Thompson, R. S., Viau, A. E., Williams, J., and Wu, H.: Pollen-based continental climate reconstructions at 6 and 21 ka: a global synthesis, Clim. Dynam., 37, 775–802, https://doi.org/10.1007/s00382-010-0904-1, 2010.
Batchelor, C. L., Margold, M., Krapp, M., Murton, D. K., Dalton, A. S., Gibbard, P. L., Stokes, C. R., Murton, J. B., and Manica, A.: The configuration of Northern Hemisphere ice sheets through the Quaternary, Nat. Commun., 10, 1–10, https://doi.org/10.1038/s41467-019-11601-2, 2019.
Bennett, K. D.: Psimpoll and pscomb: computer programs for data plotting and analysis, Upps. Swed. Quat. Geol. Earth Sci. Upps. Univ. Softw., https://chrono.qub.ac.uk/psimpoll/psimpoll.html (last access: 24 June 2022), 2000.
Berger, A. L.: Long-Term Variations of Daily Insolation and Quaternary Climatic Changes, J. Atmos. Sci., 35, 2362–2367, https://doi.org/10.1175/1520-0469(1978)035<2362:ltvodi>2.0.co;2, 1978.
Berger, W. H. and Wefer, G.: On the dynamics of the ice ages: Stage-11 paradox, mid-Brunhes climate shift, and 100-ky cycle, Geophys. Monogr.-Am. Geophys. UNION, 137, 41–60, 2003.
Birks, H. J. B. and Birks, H. H.: Quaternary paleoecology, Edw. Arnold, London, 8, 289–289, ISBN 0713127813, 1980.
Bosmans, J. H. C., Drijfhout, S. S., Tuenter, E., Hilgen, F. J., Lourens, L. J., and Rohling, E. J.: Precession and obliquity forcing of the freshwater budget over the Mediterranean, Quaternary Sci. Rev., 123, 16–30, 2015.
Bouttes, N., Roche, D. M., Mariotti, V., and Bopp, L.: Including an ocean carbon cycle model into iLOVECLIM (v1.0), Geosci. Model Dev., 8, 1563–1576, https://doi.org/10.5194/gmd-8-1563-2015, 2015.
Bouttes, N., Swingedouw, D., Roche, D. M., Sanchez-Goni, M. F., and Crosta, X.: Response of the carbon cycle in an intermediate complexity model to the different climate configurations of the last nine interglacials, Clim. Past, 14, 239–253, https://doi.org/10.5194/cp-14-239-2018, 2018.
Bouttes, N., Vazquez Riveiros, N., Govin, A., Swingedouw, D., Sanchez-Goni, M. F., Crosta, X., and Roche, D. M.: Carbon 13 isotopes reveal limited ocean circulation changes between interglacials of the last 800 ka, Paleoceanogr. Paleoclimatology, 35, e2019PA003776, https://doi.org/10.1029/2019PA003776, 2020.
Bradshaw, R. H. W. and Webb III, T.: Relationships between contemporary pollen and vegetation data from Wisconsin and Michigan, USA, Ecology, 66, 721–737, 1985.
Brandon, M., Landais, A., Duchamp-Alphonse, S., Favre, V., Schmitz, L., Abrial, H., Prié, F., Extier, T., and Blunier, T.: Exceptionally high biosphere productivity at the beginning of Marine Isotopic Stage 11, Nat. Commun., 11, 1–10, 2020.
Braun-Blanquet, J.: L'origine et le développement des Flores dans le massif central de France avec aperçu sur les migrations des Flores dans l'Europe sud-occidentale, Publ. Société Linn. Lyon, 75, 1–73, 1930.
Broecker, W. S.: Terminations, in: Milankovitch and climate, Springer, 687–698, https://doi.org/10.1007/978-94-017-4841-4_14, 1984.
Broecker, W. S. and van Donk, J.: Insolation changes, ice volumes, and the O18 record in deep-sea cores, Rev. Geophys., 8, 169–169, https://doi.org/10.1029/rg008i001p00169, 1970.
Brovkin, V., Ganopolski, A., and Svirezhev, Y.: A continuous climate-vegetation classification for use in climate-biosphere studies, Ecol. Model., 101, 251–261, 1997.
Brovkin, V., Bendtsen, J., Claussen, M., Ganopolski, A., Kubatzki, C., Petoukhov, V., and Andreev, A.: Carbon cycle, vegetation, and climate dynamics in the Holocene: Experiments with the CLIMBER-2 model, Global Biogeochem. Cy., 16, 1139, https://doi.org/10.1029/2001GB001662, 2002.
Candy, I., Schreve, D. C., Sherriff, J., and Tye, G. J.: Marine Isotope Stage 11: Palaeoclimates, palaeoenvironments and its role as an analogue for the current interglacial, Earth-Sci. Rev., 128, 18–51, https://doi.org/10.1016/j.earscirev.2013.09.006, 2014.
Castro, E. B., González, M. A. C., Tenorio, M. C., Bombìn, R. E., Antón, M. G., Fuster, M. G., Manzaneque, F. G., Sáis, J. C. M., Juaristi, C. M., Pajares, P. R., and H. Sfiiz Ollero: Los Bosques Ibéricos, Barcelona, ISBN 9788408058205, 1997.
Cheng, Z., Weng, C., Steinke, S., and Mohtadi, M.: Anthropogenic modification of vegetated landscapes in southern China from 6,000 years ago, Nat. Geosci., 11, 939–943, https://doi.org/10.1038/s41561-018-0250-1, 2018.
Crowley, T. J.: Ice Age terrestrial carbon changes revisited, Global Biogeochem. Cy., 9, 377–389, https://doi.org/10.1029/95gb01107, 1995.
de Beaulieu, J.-L. and Reille, M.: Long Pleistocene pollen sequences from the Velay Plateau (Massif Central, France), Veg. Hist. Archaeobotany, 1, 233–242, https://doi.org/10.1007/BF00189500, 1992.
Desprat, S., Goñi, M. F. S., Turon, J.-L., McManus, J. F., Loutre, M.-F., Duprat, J., Malaize, B., Peyron, O., and Peypouquet, J.-P.: Is vegetation responsible for glacial inception during periods of muted insolation changes?, Quaternary Sci. Rev., 24, 1361–1374, 2005.
de Vernal, A. and Hillaire-Marcel, C.: Natural Variability of Greenland Climate, Vegetation, and Ice Volume During the Past Million Years, Science, 320, 1622–1625, https://doi.org/10.1126/science.1153929, 2008.
Dupont, L. M. and Agwu, C. O. C.: Latitudinal shifts of forest and savanna in NW Africa during the Brunhes chron: further marine palynological results from site M 16415 (9∘; N 19∘ W), Veg. Hist. Archaeobotany, 1, 163–175, 1992.
Dupont, L. M., Beug, H. J., Stalling, H., and Tiedemann, R.: First palynological results from Site 658 at 21∘ N off Northwest Africa: Pollen as climate indicators, in: Proceedings Ocean Drilling Program Scientific Results, edited by: Ruddiman, W., Sarnthein, M., Heath, G. R., and Baldauf, J., 93–112, https://doi.org/10.2973/odp.proc.sr.108.174.1989, 1989.
Dupont, L. M., Marret, F., and Winn, K.: Land-sea correlation by means of terrestrial and marine palynomorphs from the equatorial East Atlantic: phasing of SE trade winds and the oceanic productivity, Palaeogeogr. Palaeoclimatol. Palaeoecol., 142, 51–84, 1998.
Dupont, L. M., Caley, T., and Castañeda, I. S.: Effects of atmospheric CO2 variability of the past 800 kyr on the biomes of southeast Africa, Clim. Past, 15, 1083–1097, https://doi.org/10.5194/cp-15-1083-2019, 2019.
Dutton, A., Carlson, A. E., Long, A. J., Milne, G. A., Clark, P. U., DeConto, R., Horton, B. P., Rahmstorf, S., and Raymo, M. E.: Sea-level rise due to polar ice-sheet mass loss during past warm periods, Science, 349, aaa4019, https://doi.org/10.1126/science.aaa4019, 2015.
Fawcett, P. J., Werne, J. P., Anderson, R. S., Heikoop, J. M., Brown, E. T., Berke, M. A., Smith, S. J., Goff, F., Donohoo-Hurley, L., Cisneros-Dozal, L. M., Schouten, S., Sinninghe Damsté, J. S., Huang, Y., Toney, J., Fessenden, J., WoldeGabriel, G., Atudorei, V., Geissman, J. W., and Allen, C. D.: Extended megadroughts in the southwestern United States during Pleistocene interglacials, Nature, 470, 518–521, 2011.
Ganopolski, A. and Calov, R.: The role of orbital forcing, carbon dioxide and regolith in 100 kyr glacial cycles, Clim. Past, 7, 1415–1425, https://doi.org/10.5194/cp-7-1415-2011, 2011.
Ganopolski, A. and Calov, R.: The role of orbital forcing, carbon dioxide and regolith in 100 kyr glacial cycles, Clim. Past, 7, 1415–1425, https://doi.org/10.5194/cp-7-1415-2011, 2011.
Ganopolski, A. and Brovkin, V.: Simulation of climate, ice sheets and CO2 evolution during the last four glacial cycles with an Earth system model of intermediate complexity, Clim. Past, 13, 1695–1716, https://doi.org/10.5194/cp-13-1695-2017, 2017.
Goosse, H., Brovkin, V., Fichefet, T., Haarsma, R., Huybrechts, P., Jongma, J., Mouchet, A., Selten, F., Barriat, P.-Y., Campin, J.-M., Deleersnijder, E., Driesschaert, E., Goelzer, H., Janssens, I., Loutre, M.-F., Morales Maqueda, M. A., Opsteegh, T., Mathieu, P.-P., Munhoven, G., Pettersson, E. J., Renssen, H., Roche, D. M., Schaeffer, M., Tartinville, B., Timmermann, A., and Weber, S. L.: Description of the Earth system model of intermediate complexity LOVECLIM version 1.2, Geosci. Model Dev., 3, 603–633, https://doi.org/10.5194/gmd-3-603-2010, 2010.
Govin, A., Braconnot, P., Capron, E., Cortijo, E., Duplessy, J.-C., Jansen, E., Labeyrie, L., Landais, A., Marti, O., Michel, E., Mosquet, E., Risebrobakken, B., Swingedouw, D., and Waelbroeck, C.: Persistent influence of ice sheet melting on high northern latitude climate during the early Last Interglacial, Clim. Past, 8, 483–507, https://doi.org/10.5194/cp-8-483-2012, 2012.
Hall, S. A.: Deteriorated pollen grains and the interpretation of quaternary pollen diagrams, Rev. Palaeobot. Palynol., 32, 193–206, https://doi.org/10.1016/0034-6667(81)90003-8, 1981.
Harris, N. L., Gibbs, D. A., Baccini, A., Birdsey, R. A., De Bruin, S., Farina, M., Fatoyinbo, L., Hansen, M. C., Herold, M., Houghton, R. A., and Tyukavina, A.: Global maps of twenty-first century forest carbon fluxes, Nat. Clim. Change, 11, 234-240-234–240, 2021.
Hayashi, R., Sagawa, T., Irino, T., and Tada, R.: Orbital-scale vegetation-ocean-atmosphere linkages in western Japan during the last 550 ka based on a pollen record from the IODP site U1427 in the Japan Sea, Quaternary Sci. Rev., 267, 107103–107103, 2021.
Hes, G.: Global arboreal pollen database for Termination V (404–433 kyr BP), in: Climate of the Past, Zenodo [data set], https://doi.org/10.5281/zenodo.6611054, 2022.
Hes, G. and Bouttes, N.: Simulated terrestrial biosphere variables across Termination V, (iLOVECLIM model), Zenodo [data set], https://doi.org/10.5281/zenodo.5592751, 2021.
Hes, G., d'Olier, D., and Sanchez Goñi, M. F.: Pollen counts of IODP Site 339-U1386 across Termination V (404–433 kyr BP), PANGAEA [data set], https://doi.org/10.1594/PANGAEA.939160, 2021.
Heusser, L. and Balsam, W. L.: Pollen distribution in the northeast Pacific Ocean, Quat. Res., 7, 45-62-45–62, 1977.
Hoogakker, B. A. A., Smith, R. S., Singarayer, J. S., Marchant, R., Prentice, I. C., Allen, J. R. M., Anderson, R. S., Bhagwat, S. A., Behling, H., Borisova, O., Bush, M., Correa-Metrio, A., de Vernal, A., Finch, J. M., Fréchette, B., Lozano-Garcia, S., Gosling, W. D., Granoszewski, W., Grimm, E. C., Grüger, E., Hanselman, J., Harrison, S. P., Hill, T. R., Huntley, B., Jiménez-Moreno, G., Kershaw, P., Ledru, M.-P., Magri, D., McKenzie, M., Müller, U., Nakagawa, T., Novenko, E., Penny, D., Sadori, L., Scott, L., Stevenson, J., Valdes, P. J., Vandergoes, M., Velichko, A., Whitlock, C., and Tzedakis, C.: Terrestrial biosphere changes over the last 120 kyr, Clim. Past, 12, 51–73, https://doi.org/10.5194/cp-12-51-2016, 2016.
Huntley, B.: An atlas of past and present pollen maps for Europe, 0-13,000 years ago, Cambridge University Press, 1983.
Huntley, B.: European vegetation history: Palaeovegetation maps from pollen data – 13 000 yr BP to present, J. Quat. Sci., 5, 103–122, https://doi.org/10.1002/jqs.3390050203, 1990.
Ivory, S. J., Blome, M. W., King, J. W., McGlue, M. M., Cole, J. E., and Cohen, A. S.: Environmental change explains cichlid adaptive radiation at Lake Malawi over the past 1.2 million years, P. Natl. Acad. Sci. USA, 113, 11895–11900, https://doi.org/10.1073/pnas.1611028113, 2016.
Janssen, C. R.: On the reconstruction of past vegetation by pollen analysis: a review, Proc. K. Ned. Akad. Van Wet., 84, 197–210, 1981.
Jouzel, J., Masson-Delmotte, V., Cattani, O., Dreyfus, G., Falourd, S., Hoffmann, G., Minster, B., Nouet, J., Barnola, J.-M., Chappellaz, J., and Wolff, E. W.: Orbital and millennial Antarctic climate variability over the past 800,000 years, Science, 317, 793–796, 2007.
Juggins, S.: Package “rioja”–analysis of quaternary science data, Compr. R Arch. Netw., https://cran.r-project.org/web/packages/rioja/index.html (last access: 24 June 2022), 2009.
Kaboth, S., de Boer, B., Bahr, A., Zeeden, C., and Lourens, L. J.: Mediterranean Outflow Water dynamics during the past 570 kyr: Regional and global implications, Paleoceanography, 32, 634–647, 2017.
Kleinen, T., Hildebrandt, S., Prange, M., Rachmayani, R., Müller, S., Bezrukova, E., Brovkin, V., and Tarasov, P. E.: The climate and vegetation of Marine Isotope Stage 11 – Model results and proxy-based reconstructions at global and regional scale, Quaternary Int., 348, 247–265, https://doi.org/10.1016/j.quaint.2013.12.028, 2014.
Kleinen, T., Brovkin, V., and Munhoven, G.: Modelled interglacial carbon cycle dynamics during the Holocene, the Eemian and Marine Isotope Stage (MIS) 11, Clim. Past, 12, 2145–2160, https://doi.org/10.5194/cp-12-2145-2016, 2016.
Köhler, P. and Fischer, H.: Simulating low frequency changes in atmospheric CO2 during the last 740 000 years, Clim. Past, 2, 57–78, https://doi.org/10.5194/cp-2-57-2006, 2006.
Koutsodendris, A., Müller, U. C., Pross, J., Brauer, A., Kotthoff, U., and Lotter, A. F.: Vegetation dynamics and climate variability during the Holsteinian interglacial based on a pollen record from Dethlingen (northern Germany), Quaternary Sci. Rev., 29, 3298–3307, 2010.
Landais, A., Dreyfus, G., Capron, E., Masson-Delmotte, V., Sanchez-Goñi, M. F., Desprat, S., Hoffmann, G., Jouzel, J., Leuenberger, M., and Johnsen, S.: What drives the millennial and orbital variations of δ18Oatm?, Quaternary Sci. Rev., 29, 235–246, 2010.
Leroy, S. A. G.: Climatic and non-climatic lake-level changes inferred from a Plio-Pleistocene lacustrine complex of Catalonia (Spain): palynology of the Tres Pins sequences, J. Paleolimnol., 17, 347–367, https://doi.org/10.1023/A:1007929213952, 1997.
Levavasseur, G., Vrac, M., Roche, D. M., and Paillard, D.: Statistical modelling of a new global potential vegetation distribution, Environ. Res. Lett., 7, 044019, https://doi.org/10.1088/1748-9326/7/4/044019, 2012.
Lionello, P., Malanotte-Rizzoli, P., Boscolo, R., Alpert, P., Artale, V., Li, L., Luterbacher, J., May, W., Trigo, R., Tsimplis, M., and Xoplaki, E.: The Mediterranean climate: an overview of the main characteristics and issues, Developments in earth and environmental sciences, 4, 1–26, https://doi.org/10.1016/S1571-9197(06)80003-0, 2006.
Lisiecki, L. E. and Raymo, M. E.: A Pliocene-Pleistocene stack of 57 globally distributed benthic δ18O records, Paleoceanography, 20, PA1003, https://doi.org/10.1029/2004PA001071, 2005.
Litt, T., Pickarski, N., Heumann, G., Stockhecke, M., and Tzedakis, P. C.: A 600,000 year long continental pollen record from Lake Van, eastern Anatolia (Turkey), Quaternary Sci. Rev., 104, 30–41, https://doi.org/10.1016/j.quascirev.2014.03.017, 2014.
Loughran, T., Boysen, L., Bastos, A., Hartung, K., Havermann, F., Li, H., Nabel, J. E. M. S., Obermeier, W. A., and Pongratz, J.: Past and future climate variability uncertainties in the global carbon budget using the MPI Grand Ensemble, Glob. Biogeochem. Cy., 35, e2021GB007019, https://doi.org/10.1029/2021GB007019, 2021.
Loutre, M.-F. and Berger, A.: Marine Isotope Stage 11 as an analogue for the present interglacial, Global Planet. Change, 36, 209–217, 2003.
Lüthi, D., Le Floch, M., Bereiter, B., Blunier, T., Barnola, J.-M., Siegenthaler, U., Raynaud, D., Jouzel, J., Fischer, H., Kawamura, K., and Stocker, T. F.: High-resolution carbon dioxide concentration record 650,000–800,000 years before present, Nature, 453, 379–382, 2008.
Maher Jr., L. J.: Statistics for microfossil concentration measurements employing samples spiked with marker grains, Rev. Palaeobot. Palynol., 32, 153–191, 1981.
Masson-Delmotte, V., Zhai, P., Pirani, A., Connors, S. L., Péan, C., Berger, S., Caud, N., Chen, Y., Goldfarb, L., and Gomis, M. I.: Climate Change 2021: The Physical Science Basis. Contribution of Working Group I to the Sixth Assessment Report of the Intergovernmental Panel on Climate Change, IPCC Geneva, Switzerland, https://www.ipcc.ch/report/ar6/wg1/ (last access: 24 June 2022), 2021.
Mc Andrews, J. H. and King, J. E.: Pollen of the North American Quaternary: the top twenty, Geosci. Man, 15, 41–49, 1976.
McManus, J. F., Oppo, D. W., and Cullen, J. L.: A 0.5-million-year record of millennial-scale climate variability in the North Atlantic, Science, 283, 971–975, 1999.
Melles, M., Brigham-Grette, J., Minyuk, P. S., Nowaczyk, N. R., Wennrich, V., DeConto, R. M., Anderson, P. M., Andreev, A. A., Coletti, A., Cook, T. L., and Wagner, B.: 2.8 million years of Arctic climate change from Lake El'gygytgyn, NE Russia, Science, 337, 315–320, 2012.
Moal-Darrigade, P., Ducassou, E., Giraudeau, J., Bahr, A., Kaboth-Bahr, S., Hanquiez, V., and Perello, M.-C.: MOW strengthening and contourite development over two analog climate cycles (MIS 12–11 and MIS 2–1) in the Gulf of Cadíz: An impact on North Atlantic climate during deglaciation V and MIS 11?, Global Planet. Change, 208, 103721, https://doi.org/10.1016/j.gloplacha.2021.103721, 2022a.
Moal-Darrigade, P., Ducassou, E., Bout-Roumazeilles, V., Hanquiez, V., Perello, M.-C., Mulder, T., and Giraudeau, J.: Source-to-sink pathways of clay minerals in the cadiz contourite system over the last 25 kyrs: The segregational role of mediterranean outflow water, Mar. Geol., 443, 106697, https://doi.org/10.1016/j.margeo.2021.106697, 2022b.
Morales-Molino, C., Devaux, L., Georget, M., Hanquiez, V., and Goñi, M. F. S.: Modern pollen representation of the vegetation of the Tagus Basin (central Iberian Peninsula), Rev. Palaeobot. Palynol., 276, 104193–104193, 2020.
Naughton, F., Goñi, M. F. S., Desprat, S., Turon, J.-L., Duprat, J., Malaizé, B., Joli, C., Cortijo, E., Drago, T., and Freitas, M. C.: Present-day and past (last 25 000 years) marine pollen signal off western Iberia, Mar. Micropaleontol., 62, 91–114, 2007.
Nehrbass-Ahles, C., Shin, J., Schmitt, J., Bereiter, B., Joos, F., Schilt, A., Schmidely, L., Silva, L., Teste, G., Grilli, R., Chappellaz, J., Hodell, D., Fischer, H., and Stocker, T. F.: Abrupt CO2 release to the atmosphere under glacial and early interglacial climate conditions, Science, 369, 1000–1005, https://doi.org/10.1126/science.aay8178, 2020.
Oliveira, D., Desprat, S., Rodrigues, T., Naughton, F., Hodell, D., Trigo, R., Rufino, M., Lopes, C., Abrantes, F., and Goni, M. F. S.: The complexity of millennial-scale variability in southwestern Europe during MIS 11, Quaternary Res., 86, 373–387, 2016.
Overpeck, J., Whitlock, C., and Huntley, B.: Terrestrial biosphere dynamics in the climate system: past and future, in: Paleoclimate, global change and the future, Springer, 81–103, https://doi.org/10.1007/978-3-642-55828-3_5, 2003.
Owen, R. B., Muiruri, V. M., Lowenstein, T. K., Renaut, R. W., Rabideaux, N., Luo, S., Deino, A. L., Sier, M. J., Dupont-Nivet, G., McNulty, E. P., Leet, K., Cohen, A., Campisano, C., Deocampo, D., Shen, C.-C., Billingsley, A., and Mbuthia, A.: Progressive aridification in East Africa over the last half million years and implications for human evolution, P. Natl. Acad. Sci. USA, 115, 11174–11179, https://doi.org/10.1073/pnas.1801357115, 2018.
Pan, Y., Birdsey, R. A., Fang, J., Houghton, R., Kauppi, P. E., Kurz, W. A., Phillips, O. L., Shvidenko, A., Lewis, S. L., Canadell, J. G., Ciais, P., Jackson, R. B., Pacala, S. W., McGuire, A. D., Piao, S., Rautiainen, A., Sitch, S., and Hayes, D.: A Large and Persistent Carbon Sink in the World's Forests, Science, 333, 988–993, https://doi.org/10.1126/science.1201609, 2011.
Peinado-Lorca, M. and Martínez-Parras, J. M.: Castilla-La Mancha, La vegetación de España, Servicio de Publicaciones, Universidad de Alcalá de Henares, 3, 163–196, 1987.
Pickett, E. J., Harrison, S. P., Hope, G., Harle, K., Dodson, J. R., Peter Kershaw, A., Colin Prentice, I., Backhouse, J., Colhoun, E. A., D'Costa, D., Flenley, J., Grindrod, J., Haberle, S., Hassell, C., Kenyon, C., Macphail, M., Martin, H., Martin, A. H., McKenzie, M., Newsome, J. C., Penny, D., Powell, J., Ian Raine, J., Southern, W., Stevenson, J., Sutra, J.-P., Thomas, I., van der Kaars, S., and Ward, J.: Pollen-based reconstructions of biome distributions for Australia, Southeast Asia and the Pacific (SEAPAC region) at 0, 6000 and 18,000 14C yr BP, J. Biogeogr., 31, 1381–1444, https://doi.org/10.1111/j.1365-2699.2004.01001.x, 2004.
Polunin, O. and Walters, M.: Guide to the Vegetation of Britain and Europe, Oxford University Press, ISBN 978-0192177131, 1985.
Prentice, C., Guiot, J., Huntley, B., Jolly, D., and Cheddadi, R.: Reconstructing biomes from palaeoecological data: a general method and its application to European pollen data at 0 and 6 ka, Clim. Dynam., 12, 185–194, https://doi.org/10.1007/BF00211617, 1996.
Prentice, I. C., Harrison, S. P., and Bartlein, P. J.: Global vegetation and terrestrial carbon cycle changes after the last ice age, New Phytol., 189, 988–998, https://doi.org/10.1111/j.1469-8137.2010.03620.x, 2011.
Prokopenko, A. A., Williams, D. F., Kuzmin, M. I., Karabanov, E. B., Khursevich, G. K., and Peck, J. A.: Muted climate variations in continental Siberia during the mid-Pleistocene epoch, Nature, 418, 65–68, https://doi.org/10.1038/nature00886, 2002.
Rachmayani, R., Prange, M., and Schulz, M.: Intra-interglacial climate variability: model simulations of Marine Isotope Stages 1, 5, 11, 13, and 15, Clim. Past, 12, 677–695, https://doi.org/10.5194/cp-12-677-2016, 2016.
Raymo, M. E.: The timing of major climate terminations, Paleoceanography, 12, 577–585, https://doi.org/10.1029/97pa01169, 1997.
Rivas-Martinez, S.: Nociones sobre fitosociologia, biogeografia y bioclimatologia, Veg. Espana, 17–45, ISBN 978-8460051466, 1987.
Roche, D. M., Dokken, T. M., Goosse, H., Renssen, H., and Weber, S. L.: Climate of the Last Glacial Maximum: sensitivity studies and model-data comparison with the LOVECLIM coupled model, Clim. Past, 3, 205–224, https://doi.org/10.5194/cp-3-205-2007, 2007.
Roche, D. M., Renssen, H., Paillard, D., and Levavasseur, G.: Deciphering the spatio-temporal complexity of climate change of the last deglaciation: a model analysis, Clim. Past, 7, 591–602, https://doi.org/10.5194/cp-7-591-2011, 2011.
Rull, V.: A note on pollen counting in palaeoecology, Pollen et spores, 29, 471–480, 1987.
Sánchez Goñi, M. F., Eynaud, F., Turon, J.-L., and Shackleton, N. J.: High resolution palynological record off the Iberian margin: direct land-sea correlation for the Last Interglacial complex, Earth Planet. Sci. Lett., 171, 123–137, 1999.
Sánchez Goñi, M. F., Bard, E., Landais, A., Rossignol, L., and d'Errico, F.: Air–sea temperature decoupling in western Europe during the last interglacial–glacial transition, Nat. Geosci., 6, 837–841, https://doi.org/10.1038/ngeo1924, 2013.
Sánchez Goñi, M. F., Llave, E., Oliveira, D., Naughton, F., Desprat, S., Ducassou, E., Hodell, D. A., and Hernandez-Molina, F. J.: Climate changes in south western Iberia and Mediterranean Outflow variations during two contrasting cycles of the last 1 Myrs: MIS 31–MIS 30 and MIS 12–MIS 11, Global Planet. Change, 136, 18–29, 2016.
Sánchez Goñi, M. F., Desprat, S., Fletcher, W. J., Morales-Molino, C., Naughton, F., Oliveira, D., Urrego, D. H., and Zorzi, C.: Pollen from the deep-sea: A breakthrough in the mystery of the Ice Ages, Front. Plant Sci., 9, 38–38, 2018.
Sarnthein, M. and Tiedemann, R.: Younger Dryas-Style Cooling Events at Glacial Terminations I-VI at ODP Site 658: Associated benthic δ13C anomalies constrain meltwater hypothesis, Paleoceanography, 5, 1041–1055, https://doi.org/10.1029/pa005i006p01041, 1990.
Shackleton, N. J., Sánchez-Goñi, M. F., Pailler, D., and Lancelot, Y.: Marine isotope substage 5e and the Eemian interglacial, Global Planet. Change, 36, 151–155, 2003.
Shakun, J. D., Clark, P. U., He, F., Marcott, S. A., Mix, A. C., Liu, Z., Otto-Bliesner, B., Schmittner, A., and Bard, E.: Global warming preceded by increasing carbon dioxide concentrations during the last deglaciation, Nature, 484, 49–54, https://doi.org/10.1038/nature10915, 2012.
Shukla, P. R., Skea, J., Calvo Buendia, E., Masson-Delmotte, V., Pörtner, H. O., Roberts, D. C., Zhai, P., Slade, R., Connors, S., Van Diemen, R., and Malley, J. E.: IPCC, 2019: Climate Change and Land: an IPCC special report on climate change, desertification, land degradation, sustainable land management, food security, and greenhouse gas fluxes in terrestrial ecosystems, https://www.ipcc.ch/site/assets/uploads/sites/4/2021/07/05_Chapter-2-V6.pdf (last access: 24 June 2022), 2019.
Skinner, L. C. and Shackleton, N. J.: An Atlantic lead over Pacific deep-water change across Termination I: implications for the application of the marine isotope stage stratigraphy, Quaternary Sci. Rev., 24, 571–580, 2005.
Stow, D. A. V., Hernández-Molina, F. J., Alvarez-Zarikian, C., and Scientists, E.: Expedition 339 summary, Proc. Ocean Drill. Prog., 339, 10–11, https://doi.org/10.2204/iodp.proc.339.101.2013, 2013.
Suc, J.-P.: Origin and evolution of the Mediterranean vegetation and climate in Europe, Nature, 307, 429–432, https://doi.org/10.1038/307429a0, 1984.
Tarasov, P. E., Nakagawa, T., Demske, D., Österle, H., Igarashi, Y., Kitagawa, J., Mokhova, L., Bazarova, V., Okuda, M., Gotanda, K., Miyoshi, N., Fujiki, T., Takemura, K., Yonenobu, H., and Fleck, A.: Progress in the reconstruction of Quaternary climate dynamics in the Northwest Pacific: A new modern analogue reference dataset and its application to the 430-kyr pollen record from Lake Biwa, Earth-Sci. Rev., 108, 64–79, https://doi.org/10.1016/j.earscirev.2011.06.002, 2011.
Torres, V., Hooghiemstra, H., Lourens, L., and Tzedakis, P. C.: Astronomical tuning of long pollen records reveals the dynamic history of montane biomes and lake levels in the tropical high Andes during the Quaternary, Quaternary Sci. Rev., 63, 59–72, 2013.
Tzedakis, P. C.: Long-term tree populations in northwest Greece through multiple Quaternary climatic cycles, Nature, 364, 437–440, https://doi.org/10.1038/364437a0, 1993.
Tzedakis, P. C., Hooghiemstra, H., and Pälike, H.: The last 1.35 million years at Tenaghi Philippon: revised chronostratigraphy and long-term vegetation trends, Quaternary Sci. Rev., 25, 3416–3430, 2006.
Van Campo, M.: Relations entre la végétation de l'Europe et les températures de surface océaniques après le dernier maximum glaciaire, Pollen Spores, 26, 497–518, 1984.
Wagner, B., Vogel, H., Francke, A., Friedrich, T., Donders, T., Lacey, J. H., Leng, M. J., Regattieri, E., Sadori, L., Wilke, T., and Zhang, X.: Mediterranean winter rainfall in phase with African monsoons during the past 1.36 million years, Nature, 573, 256–260, 2019.
Xiao, X. Y., Shen, J., Wang, S. M., Xiao, H. F., and Tong, G. B.: The variation of the southwest monsoon from the high resolution pollen record in Heqing Basin, Yunnan Province, China for the last 2.78 Ma, Palaeogeogr. Palaeoclimatol. Palaeoecol., 287, 45–57, https://doi.org/10.1016/j.palaeo.2010.01.013, 2010.
Yin, Q.: Insolation-induced mid-Brunhes transition in Southern Ocean ventilation and deep-ocean temperature, Nature, 494, 222–225, 2013.
Yin, Q. Z. and Berger, A.: Individual contribution of insolation and CO2 to the interglacial climates of the past 800 000 years, Clim. Dynam., 38, 709–724, 2012.
Zanon, M., Davis, B. A. S., Marquer, L., Brewer, S., and Kaplan, J. O.: European Forest Cover During the Past 12,000 Years: A Palynological Reconstruction Based on Modern Analogs and Remote Sensing, Front. Plant Sci., 9, 253, https://doi.org/10.3389/fpls.2018.00253, 2018.
Zhao, Y., Tzedakis, P. C., Li, Q., Qin, F., Cui, Q., Liang, C., Birks, H. J. B., Liu, Y., Zhang, Z., Ge, J., Zhao, H., Felde, V.A., Deng, C., Cai, M., Li, H., Ren, W., Wei, H., Yang, H., Zhang, J., Yu, Z., and Guoand, Z.: Evolution of vegetation and climate variability on the Tibetan Plateau over the past 1.74 million years, Sci. Adv., 6, eaay6193, https://doi.org/10.1126/sciadv.aay6193, 2020.