the Creative Commons Attribution 4.0 License.
the Creative Commons Attribution 4.0 License.
 | 24 Jun 2022
A global inventory of quantitative documentary evidence related to climate since the 15th century
Angela-Maria Burgdorf
Climatic variations have impacted societies since the very beginning of human history. In order to keep track of climatic changes over time, humans have thus often closely monitored the weather and natural phenomena influencing everyday life. Resulting documentary evidence from archives of societies enables invaluable insights into the past climate beyond the timescale of instrumental and early instrumental measurements. This information complements other proxies from archives of nature, such as tree rings in climate reconstructions, as documentary evidence often covers seasons (e.g., winter) and regions (e.g., Africa, eastern Russia, Siberia, China) that are not well covered with natural proxies. While a mature body of research on detecting climate signals from historical documents exists, the large majority of studies is confined to a local or regional scale and thus lacks a global perspective. Moreover, many studies from before the 1980s have not made the transition into the digital age and hence are essentially forgotten. Here, I attempt to compile the first-ever systematic global inventory of quantitative documentary evidence related to climate extending back to the Late Medieval Period. It combines information on past climate from all around the world, retrieved from many studies of documentary (i.e., written) sources. Historical evidence ranges from personal diaries, chronicles, and administrative and clerical documents to ship logbooks and newspaper articles. They include records of many sorts, e.g., tithe records, rogation ceremonies, extreme events like droughts and floods, and weather and phenological observations. The inventory, published as an electronic Supplement, is comprised of detailed event chronologies, time series, proxy indices, and calibrated reconstructions, with the majority of the documentary records providing indications on past temperature and precipitation anomalies. The overall focus is on document-based time series with significant potential for climate reconstruction. For each of the almost 700 records, extensive meta-information and directions to the data (if available) are given. To highlight the potential of documentary data for climate science, three case studies are presented and evaluated with different global reanalysis products.
This comprehensive inventory promotes the first ever global perspective on quantitative documentary climate records and thus lays the foundation for incorporating documentary evidence into climate reconstruction on a global scale, complementing (early) instrumental measurements and natural climate proxies.
- Article
(6421 KB) - Full-text XML
-
Supplement
(280 KB) - BibTeX
- EndNote


To reconstruct past climate and its variability, we rely on information from multiple archives. While weather, climatic variations, and extreme events have been observed and documented since the classical epoch, it was not until the 19th century that meteorological instrumental measurement networks were established on a national level all over the world (Brönnimann, 2015). Before that, early instrumental measurements from individuals and meteorological networks by private initiatives recorded information on weather and climate and allow insights into climate variations on a daily to decadal scale as far back as 1658 CE for Paris (Rousseau, 2015), and 1659 CE for central England (Manley, 1974; Parker et al., 1992). See Brönnimann et al. (2019) for a comprehensive inventory of metadata on globally available early instrumental data before 1850 CE. Going further back in time, climate information with annual or seasonal resolution can be deduced from either natural proxies, such as tree rings, ice cores, corals, and varve sediments, or from documentary evidence from the archives of societies. Climate reconstruction based on natural proxies is a well-established and widely accepted approach, compellingly presented in many studies (e.g., Rutherford et al., 2005; Mann et al., 2008; Phipps et al., 2013). Alternatively, climate information can be deduced from documentary evidence. Since the very beginning of human history, climatic variations have affected societies across the globe. Humans in all different cultural settings have thus often closely monitored and documented the weather and natural phenomena influencing everyday life. These documentary records stored in archives of societies represent records of climate variability over time and can provide important complementary information for climate reconstruction as they often cover seasons and regions that are not well represented with natural proxies. Tree-ring proxies, for example, are restricted to annual signals of temperature or precipitation during the growing season. Documentary ice freeze-up and break-up records allow for very precisely dated temperature signals for winter and spring. Nevertheless, documentary proxies also depend on interpretation and are thus to be used mindfully.
The fact that accurate seasonal and even monthly signals can be extracted from documentary evidence from all continents make them particularly valuable when it comes to reconstructing the climate on a large scale. In their review of the climate since 1500 CE, Bradley and Jones (1995) evaluate available paleoclimatic data for climate reconstruction and ascribe particular potential to documentary records and tree-ring records. Pfister et al. (2009) discuss the role of documentary evidence for climate reconstruction in detail, addressing its potential and caveats. The “Palgrave Handbook of Climate History” provides a comprehensive overview of the state of the field for weather and climate of the past (White et al., 2018). Besides describing relevant methods, techniques, and sources and discussing major findings of the field of historical climate reconstruction, a thorough overview of existing documentary sources through time and from all continents is presented in the above work.
To advance the role of historical climatology in paleoclimate reconstructions and to coordinate the global effort to establish best practices for climate reconstruction from the archives of societies, the PAGES CRIAS (Climate Reconstruction and Impacts from the Archives of Societies) working group was formed in 2018. Unlike in natural proxy communities where global networks exist (e.g., the tree-ring community), documentary evidence has rarely been viewed in a large-scale context because cultural barriers have long made it difficult to facilitate a global view. To some extent this still holds true, but it is part of the CRIAS working group's agenda to work towards overcoming this cultural gap. An overview of the current state of the field and the most recent accomplishments in this direction are published in the PAGES Global Change Magazine (Camenisch et al., 2020).
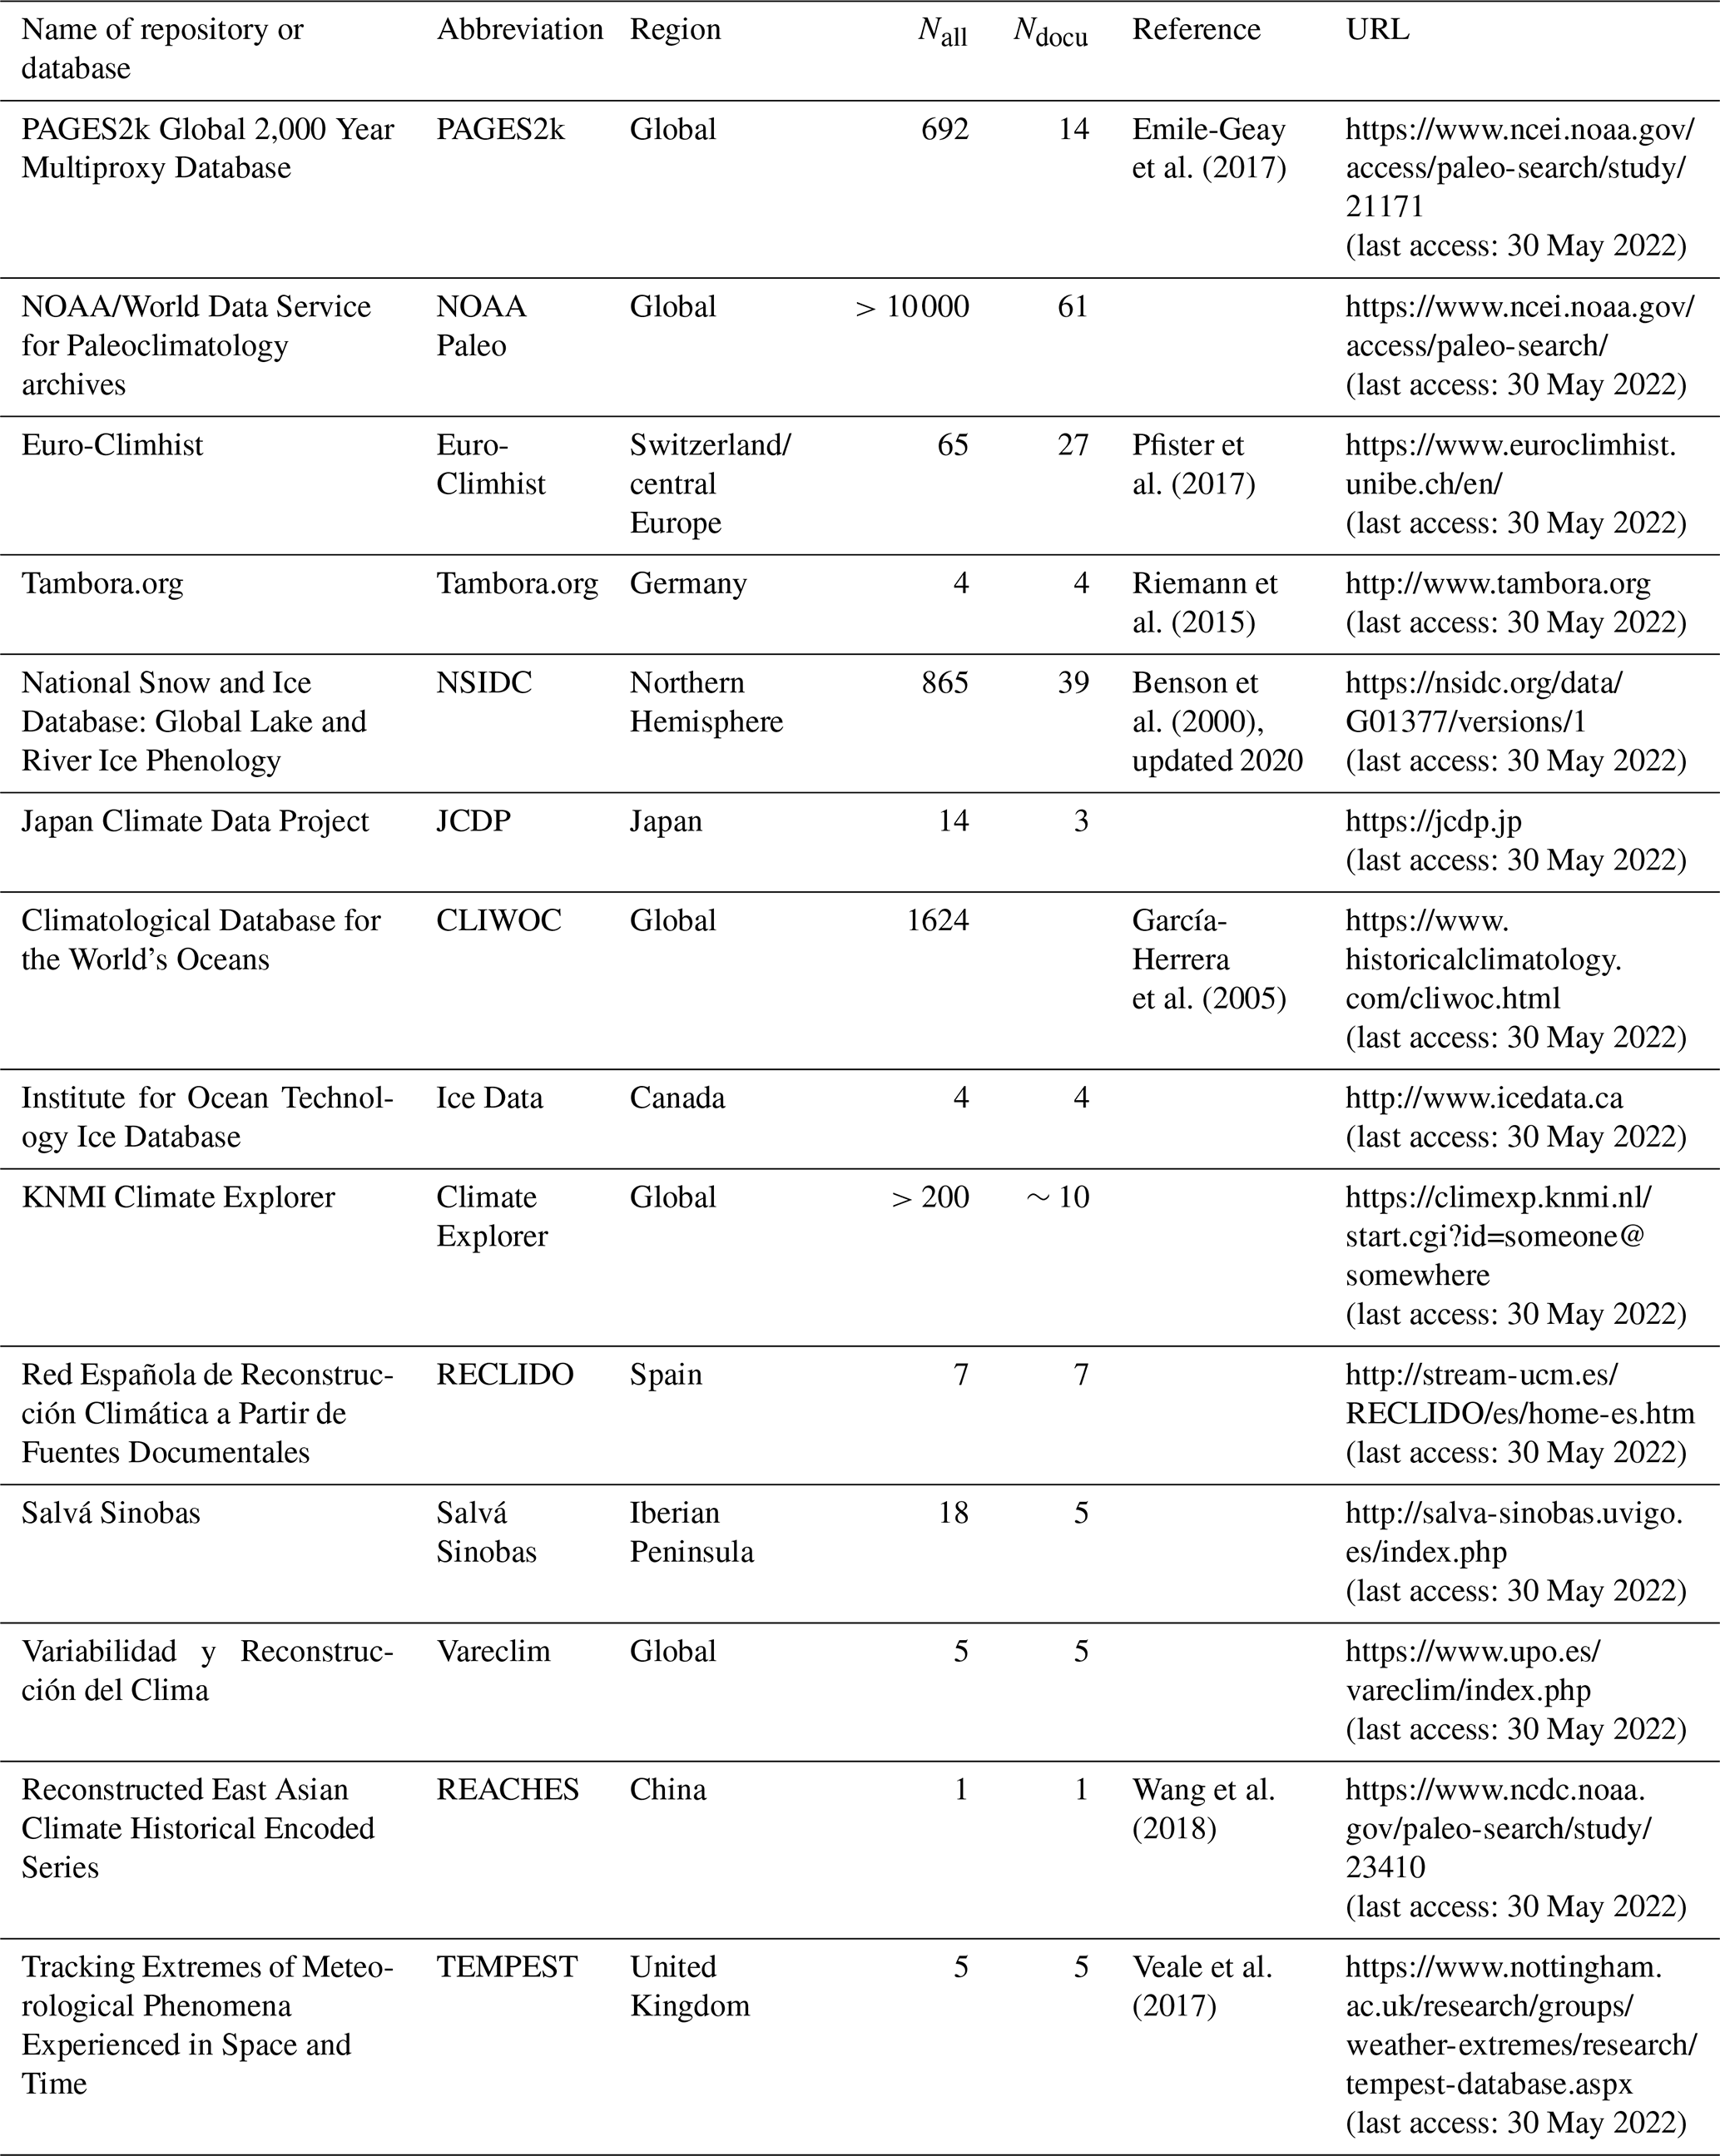
While a mature body of research for detecting climate signals from historical documents exists, the large majority of studies and their analyses and application to climate reconstructions are confined to a local or regional scale and thus lack a global perspective. On the one hand, this is due to the fact that documentary evidence is predominantly collected and evaluated with local or regional foci. On the other hand, global-scale paleo-reconstructions mainly rely on natural proxies such as tree rings, corals, and ice cores, which are available for long timescales and for many parts of the world. A prominent example is the PAGES2k initiative. In a global effort, the PAGES2k Consortium has compiled temperature-sensitive proxy records for the Common Era into the PAGES2k temperature paleo-record database (Emile-Geay et al., 2017). Out of the 692 records included, only 14 are documentary evidence, which goes to show their secondary role in the field of climate reconstructions. A possible explanation for this might simply be the fact that (despite existing) historical data are not readily available since the data are often not published. However, in recent years research groups from all around the globe have made a considerable effort to publish documentary records related to climate. Many different databases and repositories exist online and provide access to documentary evidence of climatic parameters such as temperature, precipitation, droughts and floods, and storms. Table 1 gives an overview of the most relevant compilations, focusing on different regions and topics. Based on the available data they contain, databases and repositories can be divided into two categories: those that predominantly are comprised of raw documentary evidence (primary sources) related to climate (e.g., Tambora.org, Euro-Climhist, REACHES, TEMPEST, CLIWOC) and those that provide (interpreted) documentary-based time series of climatic parameters (e.g., PAGES2k, NOAA Paleo, NSIDC, JCDP, RECLIDO, Salvá Sinobas, Vareclim).
Table 1Overview of available global and national repositories and databases containing documentary evidence. Nall is the total number of series available on the platform, and Ndocu is the number of series or databases based on documentary evidence available prior to 1880 CE.
As is apparent from Table 1, documentary data related to climate are available online but are distributed on many different platforms. Furthermore, these only represent a small fraction of the existing records. The goal of this work is to compile a comprehensive, global, multi-variable inventory, including relevant metadata, corresponding references, and directions to where to find the data (if available). It shows the potential of documentary data for climate science and aims to facilitate the work of scholars and scientists studying climate-related topics.
When it comes to global reviews of documentary evidence related to climate, so far only very few exist. Brázdil et al. (2018) took on the task of compiling a global overview of studies on past droughts based on documentary evidence. Besides discussing available source types and methods of documentary-based drought reconstructions, they provide an extensive compilation of available documentary drought proxies from all continents. Similarly valuable is the global overview on climate indices in climate reconstructions from archives of societies from Nash et al. (2021) that summarizes studies using climate indices to reconstruct climate. They present a concise review of the many different derivation and verification practices for climate indices based on qualitative documentary evidence and thus for the creation of quantitative proxy data. In terms of marine data, the climatological database of the world's oceans (CLIWOC) compiles documentary evidence from European ship logbooks (García-Herrera et al., 2005). Aside from temperature and air pressure measurements, it contains direct weather observations (e.g., wind direction, wind force, present weather, sea conditions) from voyages for the pre-industrial period (1750–1854 CE) from all over the world. The non-instrumental observations can be transformed into quantitative data and are thus available for climate reconstruction.
While documentary records relevant for climate reconstruction are available from all continents, continental-scale perspectives remain sparse, and no global-scale overview exists (Burgdorf, 2020). This article presents the first ever comprehensive inventory of globally available quantitative documentary evidence related to past climate and thus promotes a global perspective on documentary climate records. Strong focus is put upon records that contain significant potential for global-scale climate reconstructions. Therefore, predominantly document-based climate time series are included. Many of the records included in this inventory are published in existing repositories. For these examples, directions as to where to find the data are given.
The paper is structured as follows. In Sect. 2, structure, composition, and generation of the inventory are explained, and short descriptions of the datasets used to evaluate documentary data in the discussed case studies are given. In Sect. 3, I present the actual inventory and provide insights into the temporal and spatial availability of the records. To demonstrate the potential of documentary evidence for climate reconstructions, three case studies from different periods are presented and compared with other datasets in Sect. 4. This is followed by some concluding remarks and perspectives upon future possibilities of documentary evidence for global climate reconstructions in Sect. 5.
2.1 Criteria for data collection
There is a great abundance of documentary evidence related to climate available from archives of societies and a considerable number of studies analyzing this evidence. It was thus essential to define clear criteria before inventorying the data. First and foremost, only written historical evidence of quantitative (numerically interpreted) type are considered in this inventory. Other historical evidence, such as early instrumental measurements, are excluded since they are measured observations. Second, only records published in predominantly English peer-reviewed journals, university theses, and official reports are included. Raw historical material is excluded to ensure that the records included in the inventory underwent thorough analysis and are interpreted in some way by qualified scholars. Third, the period 1400–1880 CE is defined as the period of interest. Here, a balance is sought between data availability and reliability, and the possibility of calibration with instrumental data series is also sought. The chosen period marks a novel era in Western (European) history. The early modern period, following the Middle Ages, witnessed a break from medieval scholasticism and a surge of interest in Classical ideologies and values. These profound intellectual, social, and political transformations went hand in hand with continuous scientific evolution (e.g., the invention of the printing press in Europe in the 1450s CE) and European overseas expansion. This period is also characterized by novel approaches to observing and recording environment processes including the weather. As an effect, a great wealth of documentary material, in the form of both unpublished manuscripts and early printed evidence, exists in archives and libraries (Pfister et al., 2018). Moreover, an increasing number of (early) instrumental measurements essential for calibration are available from the 17th century onwards. However, with the continuous refinement of instrumental measurement practices and the establishment of national meteorological networks in the 18th and 19th centuries (Brönnimann et al., 2019), documentary evidence related to climate gradually became less relevant in many countries. Particularly after the launch of many national weather services around 1850 CE and the establishment of international measurement standards (Brönnimann et al., 2019), a marked decline in the research interest in non-instrumental climate records can be observed. Since this transition from non-instrumental to instrumental records did not occur simultaneously across the continents, 1850 CE would be too early to use as a cutoff year for some regions. Therefore, 1880 CE is chosen as the endpoint of this inventory. Another reason why the inventory focuses on the period 1400–1880 CE is because many of the inventoried series are assimilated in a novel climate reconstruction that starts in 1421 CE and solely includes instrumental measurements after 1880 CE. Fourth, only climate information on temperature, precipitation, and wind is considered. Marine data from ship logbooks are generally excluded unless a time series for temperature, precipitation, or wind is derived from them. A further criterion is the length of the data series. Here, I only include data with a minimum record length of 30 years (necessary for statistical analyses, e.g., allowing meaningful standardization), and of those years a minimum of 20 years need to be before 1880 CE (otherwise the value is questionable given the availability of instrumental measurement-based datasets from that period onward). On top of these conditions, I started inventorying from the premise that the evidence at hand must show significant potential for climate reconstructions.
2.2 Structure
In the following, the structure of the inventory is presented. For each inventory entry, comprehensive information is available for the documentary evidence and the climate data that can be deduced from it. The information ranges from details on the historical sources, detailed meta-information, climate predictors, and calibration and quantification of the data to information on the authors, corresponding references, and an indication as to whether the data are available. If the data are available, directions where one can find them are given. Table 2 provides an overview of the kind of information that is available for each entry.
Table 2Overview of all the meta-information that is available for every entry in the inventory.

2.3 Datasets used for comparison
2.3.1 EKF400v2.0
EKF400 v2.0 (Valler et al., 2021) is a global, monthly, and three-dimensional reconstruction based on an offline assimilation of early instrumental data, documentary data, and proxies (tree-ring width, latewood density) into an initial condition ensemble of 30 global model simulations using an ensemble Kalman filter assimilation technique (Bhend et al., 2012). The dataset is given at a resolution of 2∘ and covers the period 1603–2004 CE. The model is constrained, among other forcings, with annual sea surface temperature reconstructions from Mann et al. (2008) to which interannual, El Niño–Southern Oscillation (ENSO)-related variability is added (see Bhend et al., 2012, for a method description). The dataset is described in detail in Valler et al. (2021).
2.3.2 20CRv3
The 20CRv3 is the latest version of the Twentieth Century Reanalysis (20CR) Project and covers the period 1836–2015 CE (Slivinski et al., 2019). The atmospheric reanalysis dataset is based on the assimilation of surface pressure measurements from the International Surface Pressure Databank (ISPD) version 4.7 (Compo et al., 2019) into the National Centers for Environmental Prediction (NCEP) Global Forecast System (GFS) model, version 14.0.1, using an 80-member ensemble Kalman filter. The NCEP GFS model is run at T245 spectral truncation (corresponding to a horizontal resolution of ) and consists of 64 levels in the vertical. Two sea surface temperature (SST) products are used as boundary conditions: for the early period 1836–1980 CE, the Simple Ocean Data Assimilation with sparse input, version 3 (SODAsi.3), is used (Giese et al., 2016), and for 1981–2015 CE, the Hadley Centre Sea Ice and Sea Surface Temperature dataset, version 2.2 (HadISST2.2), is used. In addition to these products, the following forcings are prescribed: the solar forcing is based on the total solar irradiance (TSI) reconstruction by Coddington et al. (2016), volcanic aerosols are based on Crowley and Unterman (2013), stratospheric ozone is based on Cionni et al. (2011), and atmospheric CO2 levels are based on Saha et al. (2010).
3.1 Global overview
In the following, I present the inventory itself and highlight a selection of particularly relevant records. The inventory is available online as an electronic Supplement and contains almost 700 documentary-based record time series.
Data series included in the inventory can be categorized by the way they are calibrated. About half of the entries are time series of all different sorts (e.g., break-up and freeze-up dates, flowering and harvest dates, rain season lengths, rogation ceremony frequencies, flood and drought frequencies, voyage duration), followed by 36 % indices (temperature, precipitation, monsoon, dryness–wetness, wine quality, streamflow, ice severity or extent, etc.). Further categories are calibrated reconstructions (11 %), detailed event chronologies (2 %), and a very small amount of multiproxy reconstructions (<1 %).
Primary sources containing documentary evidence related to climate include annals and chronicles, administrative legal and clerical documents, memoirs, personal diaries, travel reports, ship logbooks, epigraphic evidence, scientific writings, weather compilations, and newspaper articles. They can be divided into direct observations and indirect (proxy) data (Pfister et al., 1999). Direct observations include narrative reports on daily weather, climate anomalies, weather-induced hazards, and non-weather-related events such as famines and epidemics. Indirect data are principally organic (plant phenology, information related to crop harvests) or non-organic (ice and snow phenology, information on water levels) in nature, but this category also includes cultural evidence (rogation ceremonies). A total of 36 % of the documentary-based time series included in this inventory are based on direct observations, 38 % are based on indirect inorganic (ice phenology), 6 % are based on indirect organic (plant phenology) proxy data, 2 % are based on cultural proxies (rogation ceremonies), and 18 % are based on a combination of these sources. A small number of series are multi-proxy reconstructions, combining documentary evidence with instrumental measurements and natural proxies. It is important to note that direct observations are not necessarily more accurate than indirect proxy data: records of late flowering of cherry blossoms or delayed dates of river ice break-up can be much more precise than, for example, a record of someone noting a “cold winter”.
In the inventory, a particular emphasis is given to ice and snow phenology due to its unique potential for reconstructing winter and spring temperatures. While the Global Lake and River Ice Phenology database (Magnuson et al., 2000; Benson et al., 2000, updated 2020) includes freeze-up and break-up records from 865 lakes and rivers, only 39 of them are available before 1880 CE and have records longer than 30 years. Most of these records start around 1850 CE, while only 11 records extend as far back as 1830 CE, and only 5 go beyond 1800 CE. However, many more series exist and are now cataloged in this inventory. Particularly rich sources of information are two Russian publications dating back to the period of the Russian Empire (Rykachev, 1886; Shostakovich, 1909). These novel discoveries contain freeze-up and break-up records of over 1000 rivers and lakes from across the Russian Empire, many of which remained hitherto undiscovered by western scholars. The vast majority of these records are short, but 78 records feature a minimum length of 30 years prior to 1880 CE and are thus included in the inventory. A total of 21 of these records go beyond 1800 CE. In addition to these data from the Russian Empire, several novel river ice phenology records from the northeastern United States and Canada are included, e.g., Connecticut River (Barrat, 1840), Kennebec River (Gardiner, 1858), Mississippi River (Shipman, 1938), Hudson River (New York (State), Department of Agriculture, 1894), and multiple locations in Hudson Bay (Catchpole et al., 1976; Magne, 1981; Ball, 1995), as well as many series from Europe, e.g., ice duration in the Haarlem–Leiden Channel (the Netherlands) (de Vries, 1977), the first and last day of snowfall in Annecy (France) (Mougin, 1912), river phenology from the Danube in Budapest (Hungary) (Takács et al., 2018), and data from Lake Mälaren (Sweden) (Hildebrandsson, 1915; Eklund, 1999). Furthermore, the inventory contains several sea ice records from the Baltic Sea (Koslowski and Glaser, 1999; Jevrejeva, 2001; Seinä and Palosuo, 2006), Iceland (Ogilvie, 1984; Ogilvie and Jónsdóttir, 2000), the Hudson Bay area (Catchpole, 1995), the Hudson Strait (Catchpole and Faurer, 1983), the coast of Greenland (Schmith and Hansen, 2003), Newfoundland (Hill and Jones, 1990), and the Labrador Sea (Teillet, 1988; Ouellet-Bernier and de Vernal, 2020). Many of these newly discovered ice phenology time series, together with well-known ice and plant phenology records, have recently been used to successfully reconstruct cold season temperatures of the northern midlatitudes for the period 1701–1905 (Reichen et al., 2022).
Documentary evidence is available across all World Meteorological Organization (WMO) regions; however, it is unevenly distributed in space. While about half of all the time series stem from Europe (47 %), an approximately even amount of evidence exists for Asia (18 %), Africa (16 %), and North America (16 %). South America and the southwestern Pacific are sparsely covered (2 % and 1 %, respectively) (Fig. 1). For Europe and Asia, especially China, documentary series exist for both temperature and precipitation. For Africa and South America, on the other hand, almost all of the available records provide information on precipitation rather than temperature. The majority of records in the inventory are proxies for temperature (61 %) (Fig. 1a) and precipitation (36 %) (Fig. 1b), while only very few data series are available for wind (3 %) (Fig. 1c).
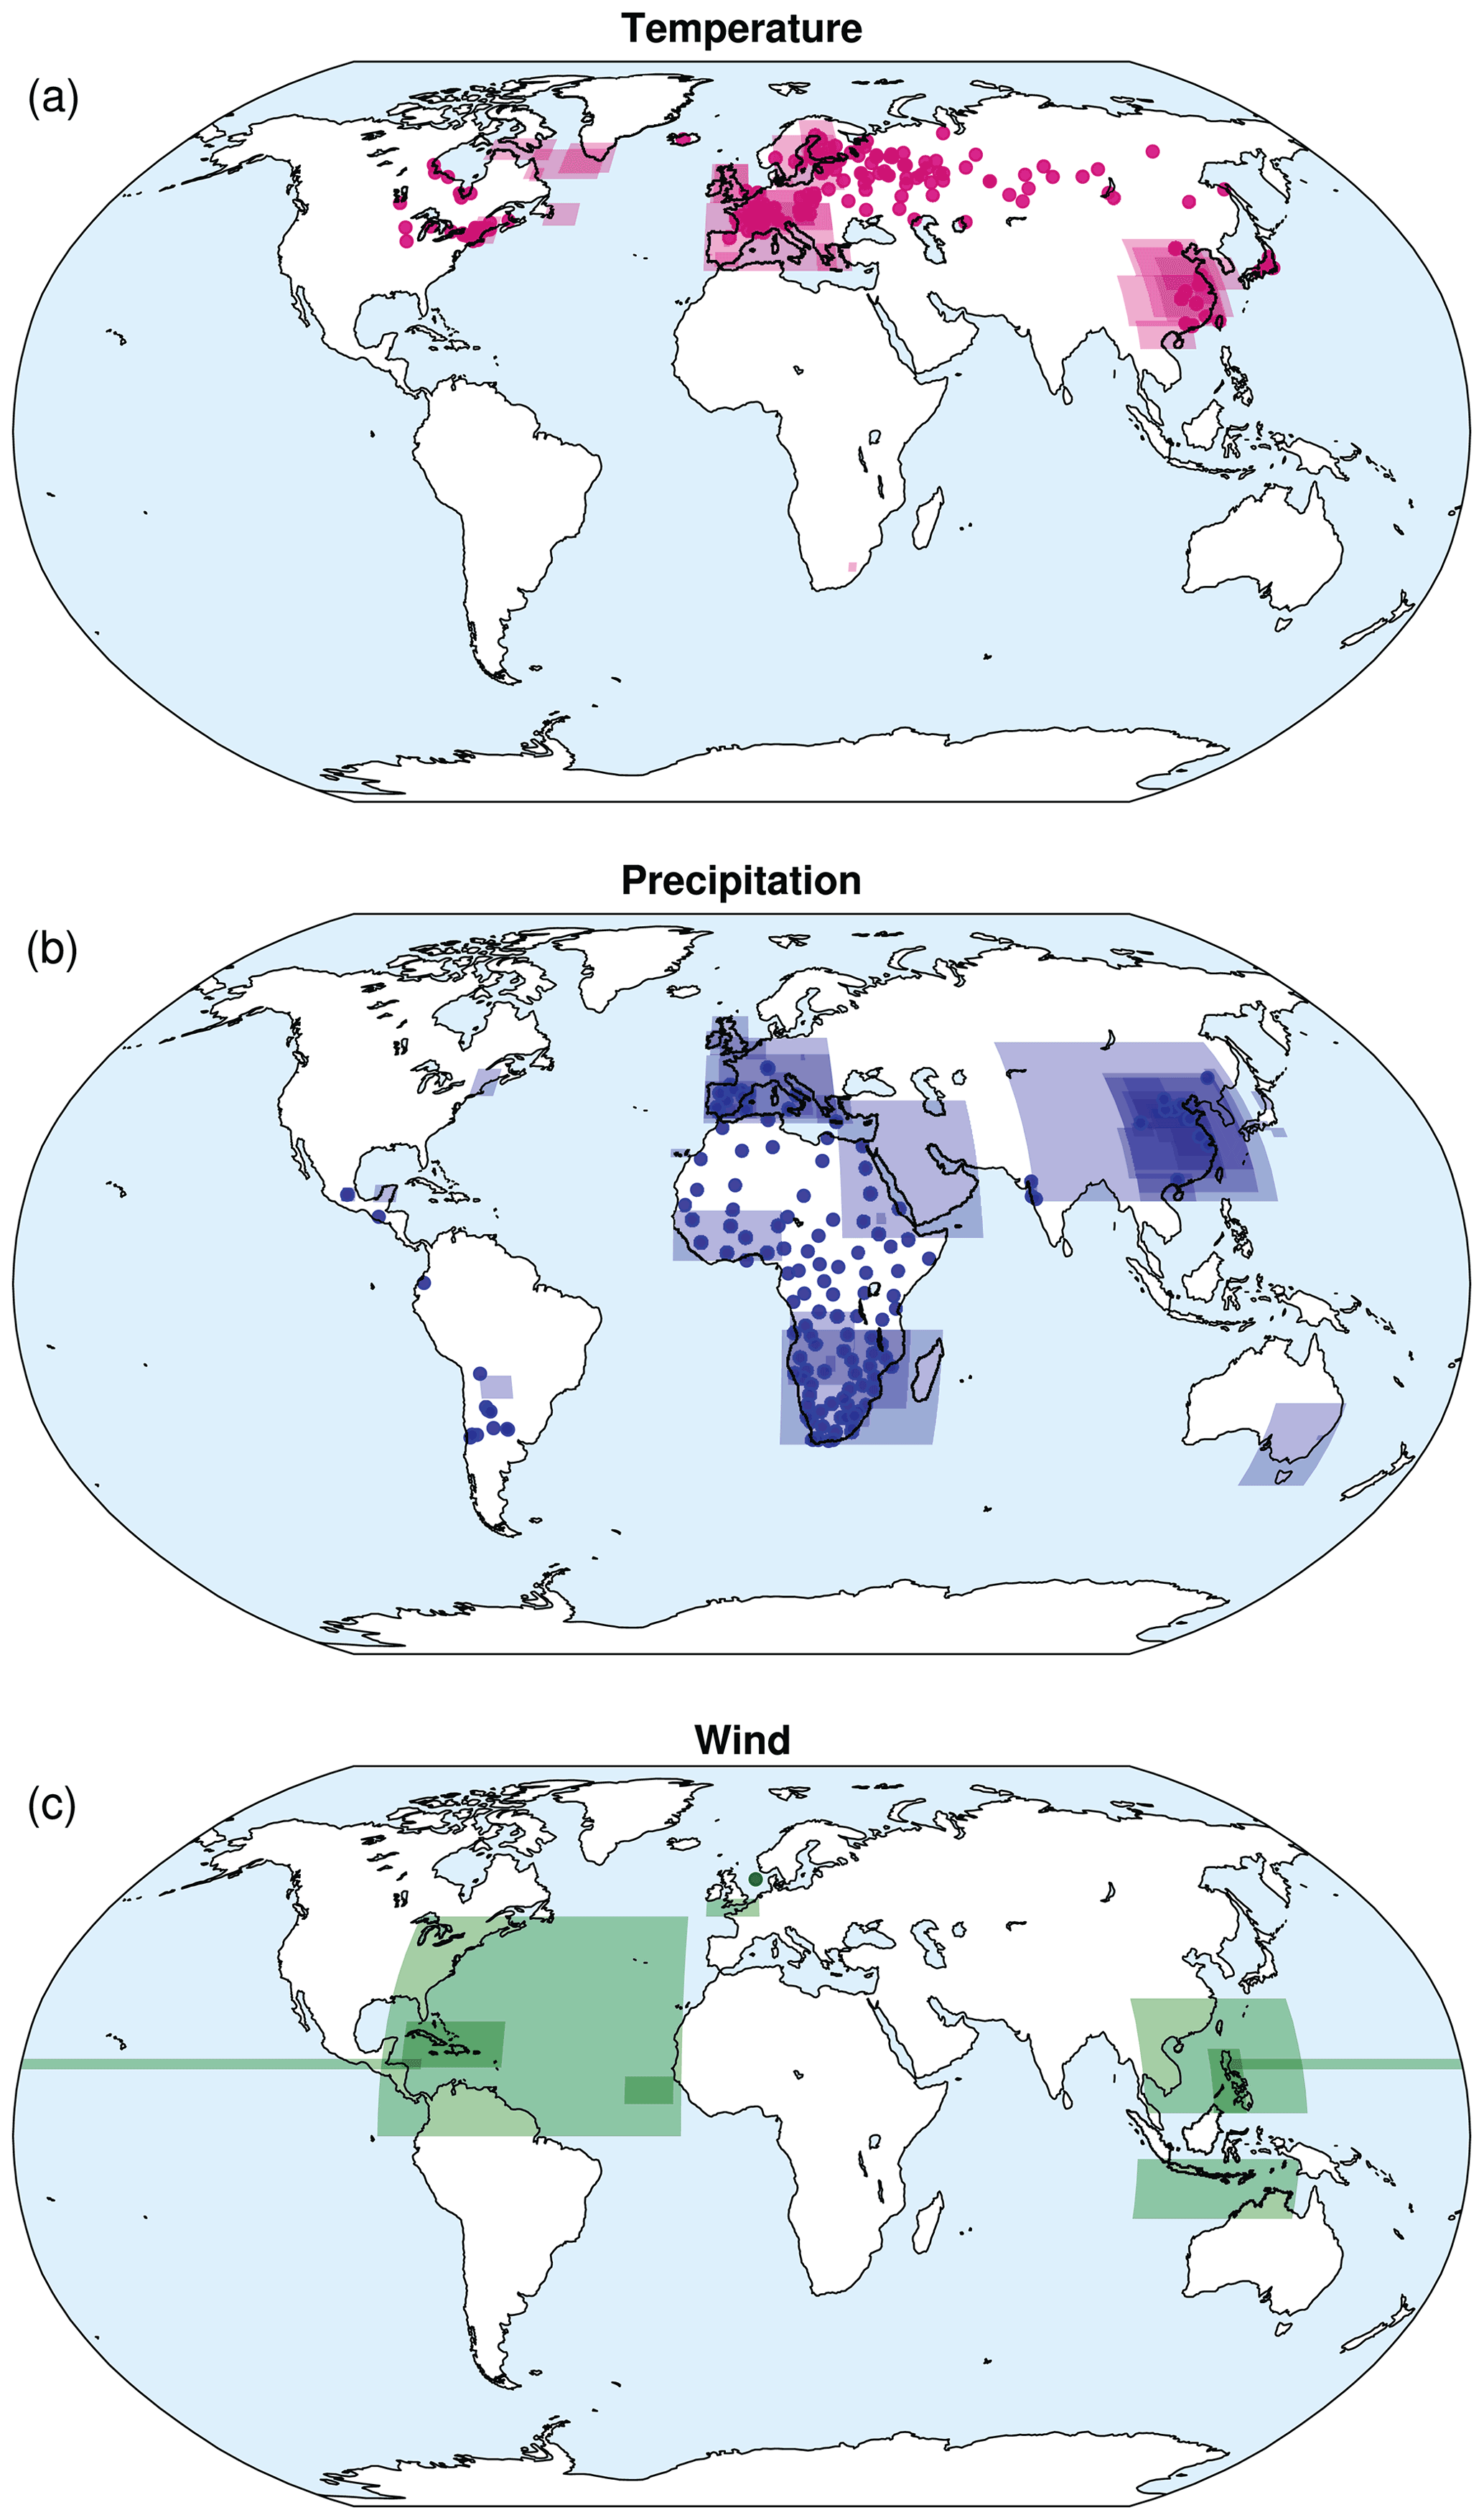
Figure 1Spatial distribution of available documentary series on climate from the global inventory for (a) temperature, (b) precipitation, and (c) wind. Dots indicate records assigned to a specific location, and rectangles mark relevant domains for which climate information is found by a record.
While some documentary series extend further into the past, beyond the Late Medieval Period, the focus here is on evidence from the early and late modern period. Figure 2 depicts the temporal evolution of the available data series included in the inventory grouped into regions (WMO regions). Only about 10 % of the data series are available for the 15th century, with most of the data being from Europe and Asia. The number of inventoried data series steadily increases throughout the 16th, 17th, and 18th centuries across all regions and peak around the mid-19th century. This peak can be explained by the choice to not include any series starting later than 1860 CE. For the year 1849 CE, a total of 578 documentary-based series are included in the inventory; 45 % of these are series from Europe, 18 % are from Africa, 19 % are from Asia, and 16 % are from North America and Central America and the Caribbean. As for the entire time period, very few records are available for South America and the southwestern Pacific region, adding up to about 2 %. The majority of data series for Africa stem from a semi-quantitative precipitation dataset covering 90 regions in Africa from 1801 to 1900 CE (Nicholson, 2001). The number of documentary series gradually decrease in the second half of the 19th century and into the 20th century for all regions. This is partly simply because no new series are included after 1860 CE. The reason for this is again the fact that many of the compiled series are used in a global climate reconstruction that after 1880 CE is solely based on instrumental measurements. More importantly, however, the gradual drop in numbers after 1850 CE correlates with the exponential development and expansion of instrumental measurement networks across the globe and a diminishing interest in non-instrumental records as a consequence thereof. The sharp drop in numbers for Europe around 1880 CE can be traced back to the availability of the ice phenology records from the Russian Empire published by Rykachev (1886). Out of these 119 record time series, 103 are, as far as we know, not extended beyond Rykachev's publication from 1886 CE. The large majority of these break-up and freeze-up series refer to rivers located west of the Ural Mountains and are thus regarded as European series. They account for 85 % of the European series ending between 1878 and 1882 CE and explain the sharp drop. A total of 14 records from west of the Ural Mountains initially published by Rykachev (1886) are extended to the 1900s in the publication of Shostakovich (1909). The latter publication includes 15 additional series from eastern Russia (regarded as Asian series) that also end in the 1900s. These records contribute to the visible drop in the available numbers of Asian series at the beginning of the 20th century. A further reason for this drop is the fall of the Qing dynasty, China's last imperial dynasty, in 1911 as many Chinese documentary-based record series are based on the vast collection of institutional records from the imperial dynasties. There is an additional marked drop in the overall number of records in the 20th century that coincides with the start of the Cold War in 1947. The gradual decline in numbers in the late 19th century and into the 20th century can potentially cause complications since the overlap with instrumental series (needed for calibration) is often limited as a result.
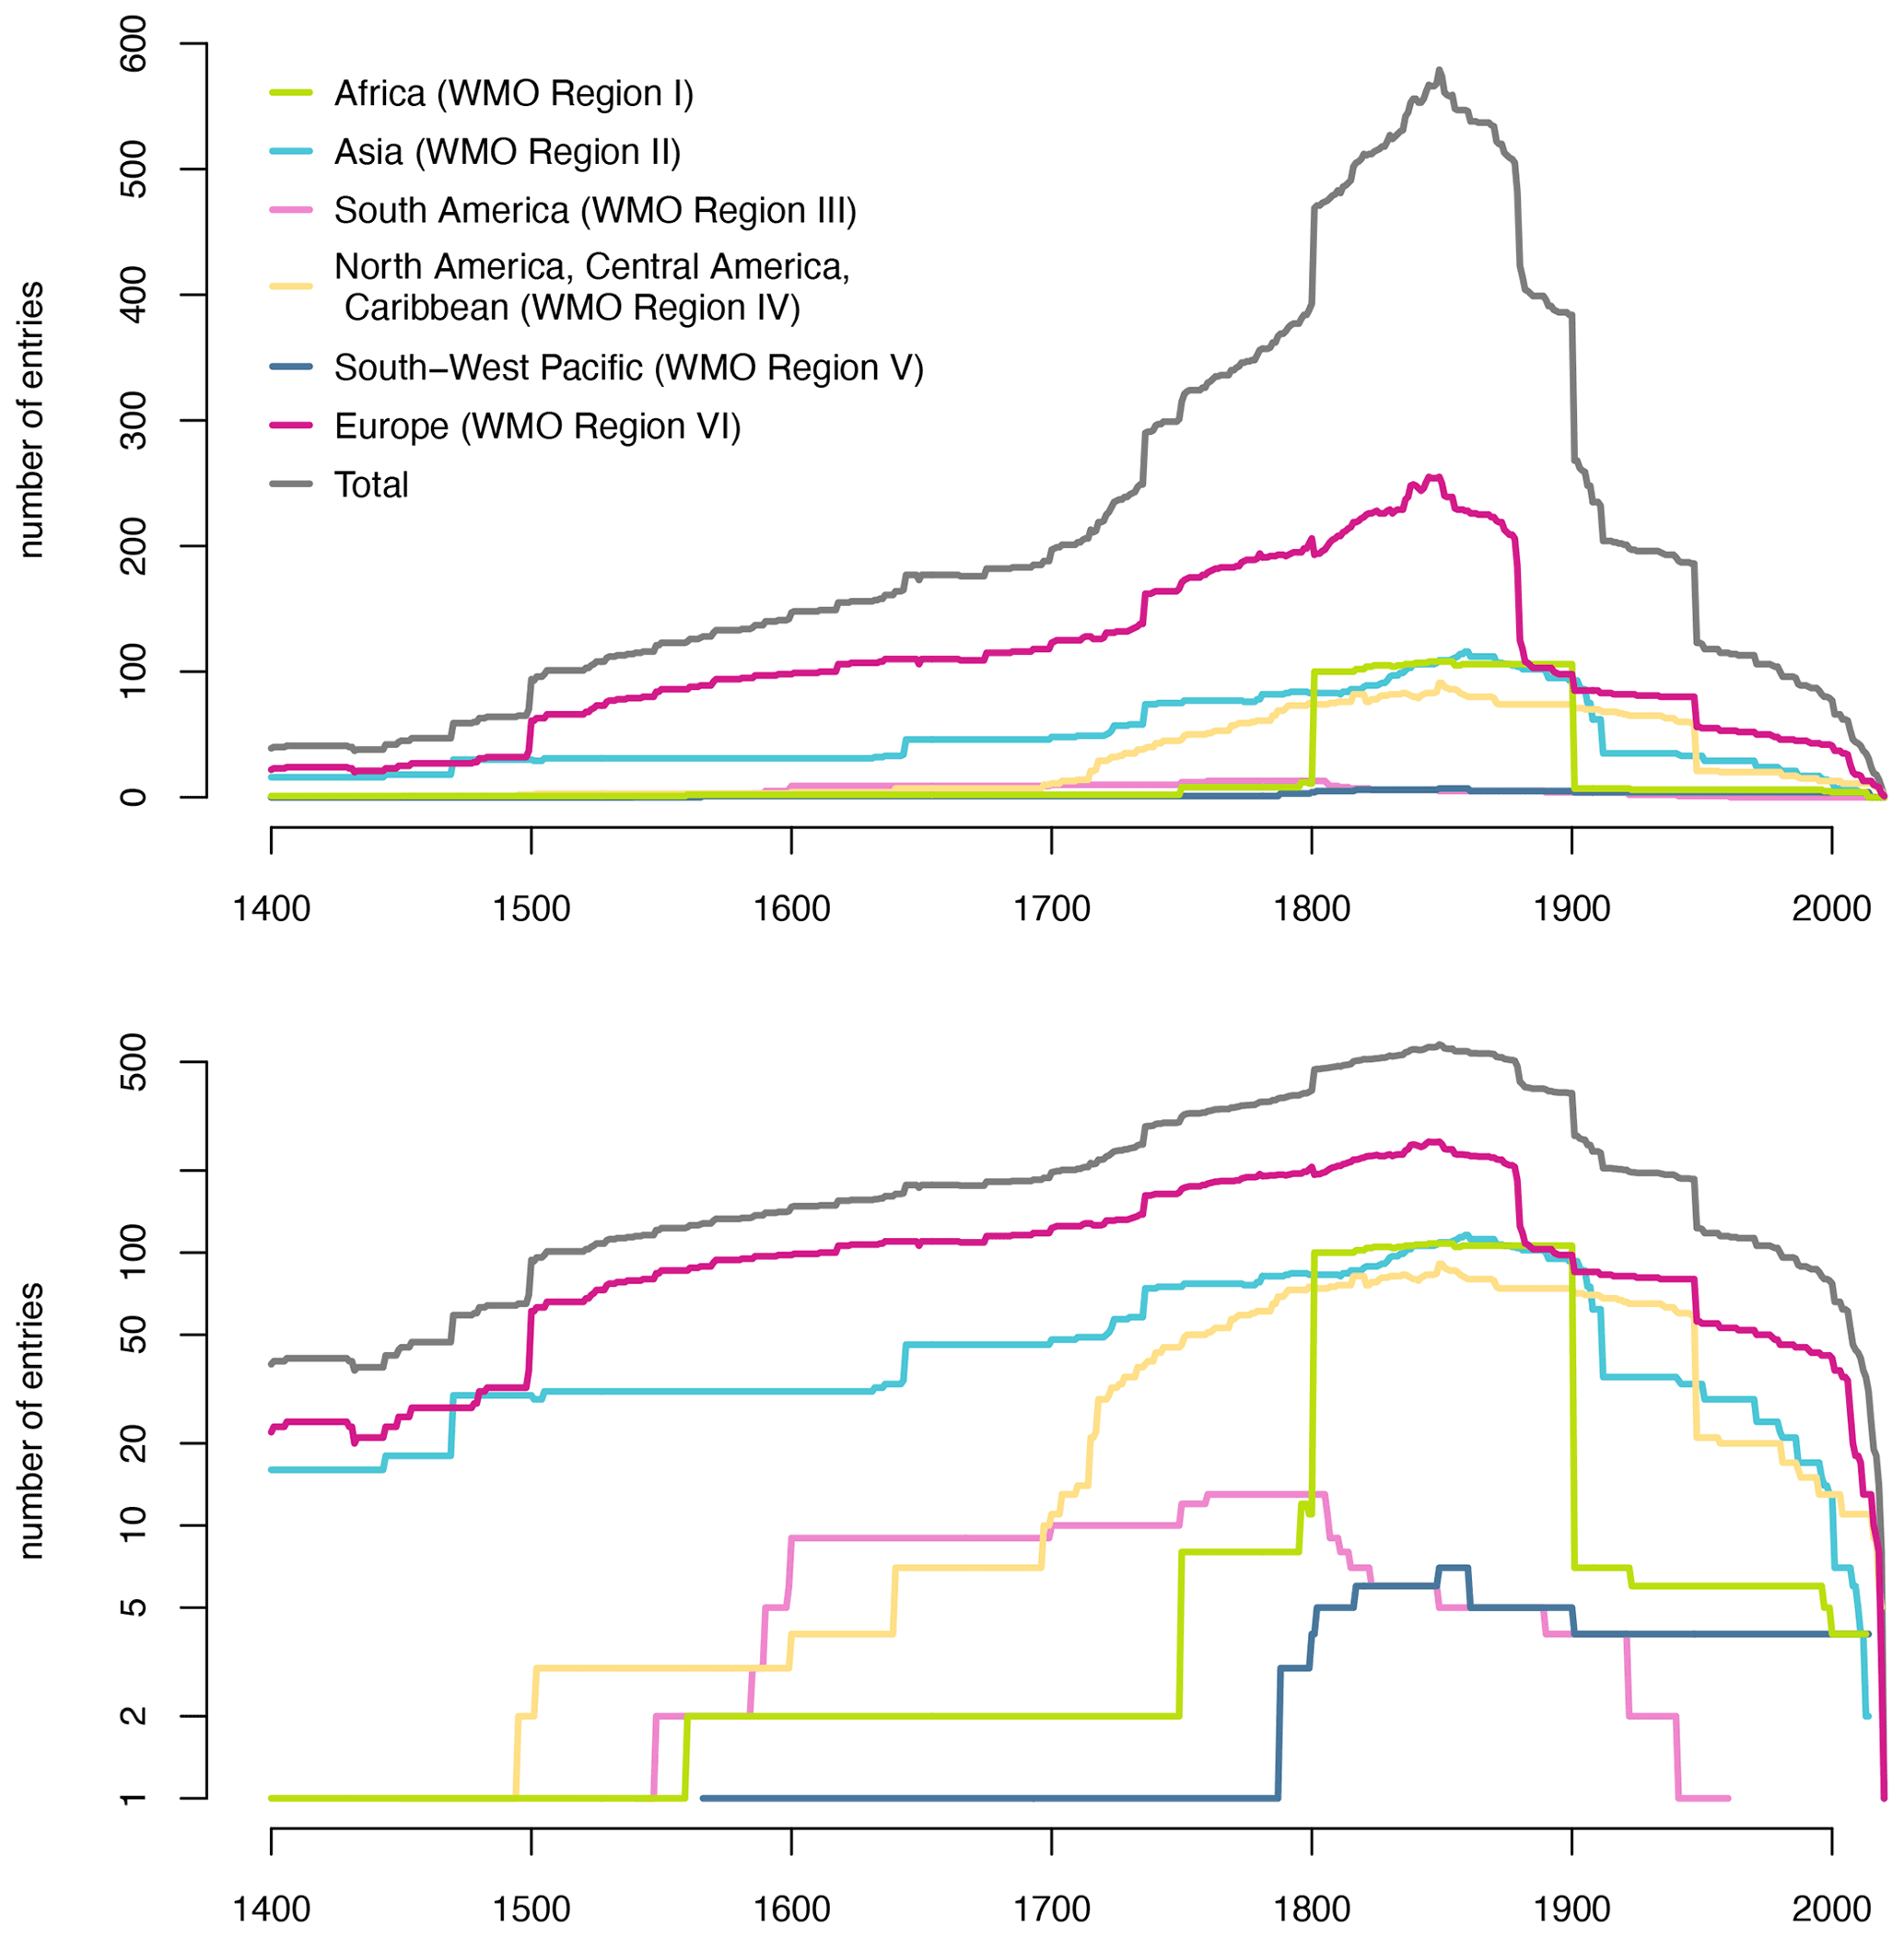
Figure 2Number of available documentary series related to climate as a function of time and region. The bottom panel depicts available series with logarithmic scaling of the y axis.
3.2 Selection of relevant studies included in the inventory
In the following, a selection of relevant studies on documentary evidence related to climate from all WMO regions is presented. The focus lies on studies with a large-scale or at least regional perspective. For a detailed overview of historical documents related to climate, see the Palgrave Handbook of Climate History (White et al., 2018). It must be noted that continental-scale overviews of documentary evidence with a global perspective remain sparse. Nonetheless, meta-information is available from all continents.
3.2.1 Africa (WMO Region 1)
Most of the available African historical documents related to climate originated from a colonial context and largely consist of geographical studies, (meteorological) diaries, travel journals, and missionary reports. Thus, climate information from archives of societies is essentially limited to the 19th century. One prominent exception is the Nile River flood series covering the period 622–1922 CE (Popper, 1951). Nicholson (2001) and Nicholson et al. (2012) provide a semi-quantitative, regional precipitation dataset combining documentary evidence and precipitation gauge data into a seven-point scale index record for 90 geographical regions. This dataset, covering the 19th century, uniquely allows for an analysis of past rainfall variability for the African continent as a whole. On a regional and subcontinental scale, few overviews with a particular focus on seasonal rainfall variability are available, especially for southern Africa (e.g., Neukom et al., 2014; Nash et al., 2016, 2019).
3.2.2 Asia (WMO Region 2)
There exists an enormous abundance of documentary evidence for China spanning back many centuries. Various Chinese imperial dynasties ruled the vast country, and the many regional records, both administrative and personal, about past climate and weather are well preserved (Ge et al., 2018). Maybe the most important historical record from China is the Compendium of Chinese Meteorological Records of the Last 3000 Years edited by Zhang (with the first edition published in 2004 and a revised and expanded second edition published in 2013). It covers a period starting in the 16th century BCE and ending in 1911 CE and can be considered the world's most extensive compilation of written historical records related to climate (Wang et al., 2018). Further significant direct observed records are the Yearly Charts of Dryness and Wetness in China for 1470–1950 CE (Chinese Meteorological Administration, 1981), as well as the Qing Yu Lu (Clear and Rain Records), providing daily records about the state of the sky and the wind and detailed information on precipitation events for 1724–1904 CE (e.g., Wang and Zhang, 1988). In terms of indirect proxy evidence, the Yu–Xue–Fen–Cun records of rainfall (i.e., Yu) infiltration and snowfall (i.e., Xue) during the Qing Dynasty (1644–1911 CE) merit special emphasis. These quantitative records consist of measurements of soil infiltration depth and snow depth on the surface after a precipitation event in the Chinese length units of Fen and Cun (e.g., Ge et al., 2005). These records, though technically measured (not observed), are included in this inventory as they are considered documentary evidence rather than instrumental measurements.
Due to the wealth of documentary evidence, it is possible to analyze the past climate for large geographical areas far back in time, and thus many large-scale studies reconstructing the past climate of China exist. Temperature and precipitation reconstructions at various spatial and temporal resolutions are available for several regions across China (e.g., Zhang, 1996; Wang et al., 1998, 2018; Song, 2000; Ge et al., 2005, 2010). Furthermore, there are many studies of particular regions, i.e., for eastern China, (e.g., Wang and Wang, 1990; Zheng and Zheng, 1993; Zhou et al., 1994; Wang and Gong., 2000; Zheng et al., 2001, 2006; Ge et al., 2005, 2008; Shen et al., 2008; Hao et al., 2012, 2016), southern China (e.g., Zhang, 1980; Zheng et al., 2012), and northern China (e.g., Zheng et al., 2005; Ge et al., 2011; Qian et al., 2012). Documentary data from eastern China are also used to reconstruct large-scale teleconnection patterns like the Arctic oscillation (Chu et al., 2008), as well as the Pacific decadal oscillation (PDO) (Shen et al., 2006).
While many wide-reaching studies exist for China, very little are available for the rest of Asia, where historical climatology remains in its infancy. Some documentary evidence is available for Korea, but no documentary records related to climate were found for Thailand, Vietnam, Cambodia, Laos, or Myanmar. For the Indian subcontinent, historical sources related to climate predominantly become available with European colonialism. Studies of monsoon variability tap into documentary evidence but are limited to western India (Adamson and Nash, 2013, 2014). Japan, on the other hand, possesses written evidence of the past climate extending back to the pre-Christian era. They are especially rich in ice and plant phenology proxy data that allow for a reconstruction of climate variability in Japan (Mikami, 2008). While individual proxy series are investigated in great depth, e.g., the spring flowering of cherry trees in Kyoto (Aono and Omoto, 1994; Aono and Kazui, 2008; Aono and Saito, 2010), few studies combine their information and analyze past climate in a larger geographical context.
3.2.3 South America (WMO Region 3)
Continental-scale compilations of documentary evidence are provided by Neukom et al. (2009) and Prieto and García Herrera (2009). These compilations mainly contain documentary proxy data on precipitation from Argentina, Chile, Peru, Bolivia, and Ecuador extending back to the mid-16th century. Furthermore, the two-volume collection of García Acosta (1996, 1997) assembles case studies covering 2000 years of Latin American climate history. While documentary evidence related to climate for Latin America exists beyond the European colonization of the Americas, the vast majority of written evidence stems from colonial times. A particularly large amount of evidence was left by the Spanish Empire, covering the entire period of their colonial presence in Latin America from the late 15th to the early 19th centuries (Prieto and Rojas, 2018).
3.2.4 North America, Central America, and the Caribbean (WMO Region 4)
Historical climatology of North America is still in its early stages, overshadowed by the well-established field of climate reconstruction based on proxies from archives of nature. Nevertheless, some noteworthy sources and studies of evidence from the archives of societies exist. Their availability, both spatially and temporally, is strongly linked to colonial settlement and thus predominantly limited to the eastern coast and the Gulf of Mexico until the 18th century. See the concise review of White (2018) for an overview of the field. To date, North American historical climatology has predominantly focused on reviewing primary sources and individual records and extracting the available data. Only to a lesser degree has documentary evidence been utilized for reconstructing past climate on a larger scale. Some climate studies on a more regional scale rather than local scale exist for the Hudson Bay area (Ball, 1995) and New England (Baron et al., 1984; Baron, 1995; Baron and Smith, 1996). Furthermore, some sea ice severity reconstructions in Canadian waterways based on Hudson's Bay Company records are worth mentioning in this context (Catchpole et al., 1976; Catchpole and Faurer, 1983; Teillet, 1988; Catchpole and Hanuta, 1989; Catchpole, 1995).
In terms of Central America and the Caribbean, only few historical climatic records are scientifically evaluated. Besides large-scale studies focusing on Atlantic storm reconstructions (e.g., Chenoweth, 2006), some drought reconstructions for Mexico (e.g., Mendoza et al., 2005, 2006) and a precipitation reconstruction for the Pacific coast of Central America (Guatemala) (Guevara-Murua et al., 2018) also exist.
3.2.5 South-West Pacific (WMO Region 5)
Australian climate history is largely limited to European settlement starting in 1788 CE and is confined to the geographical area of southeastern Australia (SEA) in the early period of colonization (Gergis et al., 2018). Fenby and Gergis (2013) gathered the available documentary evidence and derived a dry–wet year chronology for the SEA region. This documentary chronology lays the foundation for the subsequently developed rainfall index that combines documentary evidence with early instrumental records (Gergis and Ashcroft, 2013; Ashcroft et al., 2014). The only documentary record for the southwestern Pacific region included in the inventory apart from Australia exists for the Philippines, reconstructing the frequency of landfalling typhoons from the mid-16th century onwards (García-Herrera et al., 2007; Ribera et al., 2008).
3.2.6 Europe (WMO Region 6)
European historical climatology has a long tradition of exploiting the great wealth of diverse documentary evidence. For an extensive overview, see Pfister et al. (2018) and Rohr et al. (2018). Depending on the geographical region, different kinds of records are utilized. Cultural evidence (rogation ceremonies) is predominantly available in the Mediterranean, plant phenology records are predominant in western and eastern Europe (especially France, Switzerland, and the Czech Republic), and ice phenology is predominant in northeastern Europe. Direct observed evidence (descriptions of daily weather and climatic and related environmental conditions, e.g., extreme events, famines, crop failures) is available in abundance in central Europe. The plurality of the European studies have local or regional foci. Studies on a larger geographical scale exist for the larger Mediterranean region (Camuffo et al., 2010), the eastern Mediterranean and Middle East (Telelis, 2008; Xoplaki et al., 2018), the meridional Balkans (Xoplaki et al., 2001), central Europe (Glaser and Riemann, 2009; Dobrovolný et al., 2010), the Carpathian Basin (Bartholy et al., 2004), and the Iberian Peninsula (Bullón, 2008; Rodrigo and Barriendos, 2008). While large-scale Europe-wide studies do exist, they are for the most part multi-proxy reconstructions (e.g., Luterbacher et al., 2004, 2016; Xoplaki et al., 2005; Pauling et al., 2006; Brázdil et al., 2010) that include a few documentary series. Since the historical written information incorporated in these studies is only secondary, they are not included in the inventory. Despite the great wealth of documentary records available for Europe, no study to date has tried to combine these and analyze European climate on a continental scale based solely on documentary evidence.
Although many historical sources describing past climate and weather exist for the Russian Federation, historical climatology remains largely marginalized, and reconstructions capitalizing on documentary evidence are scarce. The discipline is predominantly confined to Russian scholars. Borisenkov (1995) provides a review of relevant studies, mainly from the former Soviet Union west of the Ural Mountains. While not yet analyzed over a large scale, there are extensive compilations of ice phenology of water bodies from the Russian Empire dating back to 1530 CE (Daugava River, Riga). Some of the included ice break-up series like those from the Tornio River (Loader et al., 2011) or the Aura River (Norrgård and Helama, 2019) are well known and well investigated. However, most of them are entirely novel discoveries with great potential for future research (Rykachev, 1886; Shostakovich, 1909).
The majority of the documentary-based record series included in this inventory are based on research since the 1990s. However, utilizing documentary evidence as a climate predictor is not a new discipline in climate science. Many studies stem from the 20th century and even the late 19th century and have since been forgotten, possibly because they missed the leap into the digital age (e.g., Brückner, 1890; Mougin, 1912; Shipman, 1938; Catchpole et al., 1976; de Vries, 1977).
4.1 Temperature anomalies after the Serua eruption (1693 CE) and an unknown eruption in 1695 CE
To demonstrate the value of documentary evidence for climate reconstructions, temperature anomalies for the unusually cold decade of the 1690s are analyzed. This particularly cold decade during the Little Ice Age was presumably forced by a series of volcanic eruptions, including the two significant tropical eruptions of Mount Serua (Indonesia) in 1693 CE (Arfeuille et al., 2014) and the even more potent unknown eruption in 1695 CE (Sigl et al., 2015; Toohey and Sigl, 2017). According to Sigl et al. (2015), the post-volcanic cooling in their aftermath gave rise to the ninth coldest decade (1692–1701 CE) in Europe in the past 2000 years. It was of near-hemispheric scale and especially pronounced during the Northern Hemisphere (NH) summer months (Wilson et al., 2016). If this cooling is captured by natural proxies such as ice cores (e.g., Sigl et al., 2015) and tree rings (e.g., Wilson et al., 2016; D'Arrigo et al., 2020), one can assume that it must also have been documented in archives of societies. Especially relevant in this context are records related to harvest, which would have been impacted by cooling of this scale during the growing season. To investigate a potential cooling signal in the NH following the 1693 and 1695 CE volcanic eruptions, standardized temperature signals from 52 available documentary records covering this time span are analyzed. The temperature signal during the anomalous period 1693–1697 CE (5 years) is expressed relative to the combined average of the 10 years prior (1683–1692 CE) and 10 years after (1698–1707 CE). Each documentary series represents a temperature signal for a particular season or month. To compare these temperature composites, they are grouped into signals for spring (March–April), the growing season (April–August), fall (October), and winter (December–March), in addition to an annual signal.
As shown in Fig. 3a and b, 44 of the 52 documentary series show negative temperature anomalies ( standard deviations) for the years after the volcanic eruptions in 1693 and 1695 CE. The signal is particularly homogenous over Europe, where the growing season during 1693–1697 CE was notably cooler than during the reference period. All but one of the European growing season proxies exhibit negative anomalies. They consist of temperature proxies based on various phenological parameters, e.g., grape and grain harvest dates, freezing of water bodies, duration of snow cover, and direct observations of the weather such as reports on temperature-related features (e.g., extreme frost periods). The most prominent anomaly can be seen over the Carpathian Basin, a proxy based on documentary evidence from Hungarian sources (Bartholy et al., 2004). In addition, spring proxies in Europe (ice break-up on the Tornio River; Loader et al., 2011) and Japan (dates of the cherry blossom bloom in Kyoto and Tokyo; Aono and Omoto, 1994; Aono and Kazui, 2008; Aono and Saito, 2010) indicate cooler-than-normal conditions. For winter and fall, less evidence is available and no clear signal emerges. The sole source for North America shows a strong negative anomaly based on the annual proxy in New England (Baron, 1995). This potentially indicates that colder-than-average temperatures following the volcanic eruptions might not be restricted to the warm seasons but were instead a multi-annual event. The historical evidence relating to summer temperatures for China is based on the REACHES Climate Database (Wang et al., 2018), and the signal varies regionally.
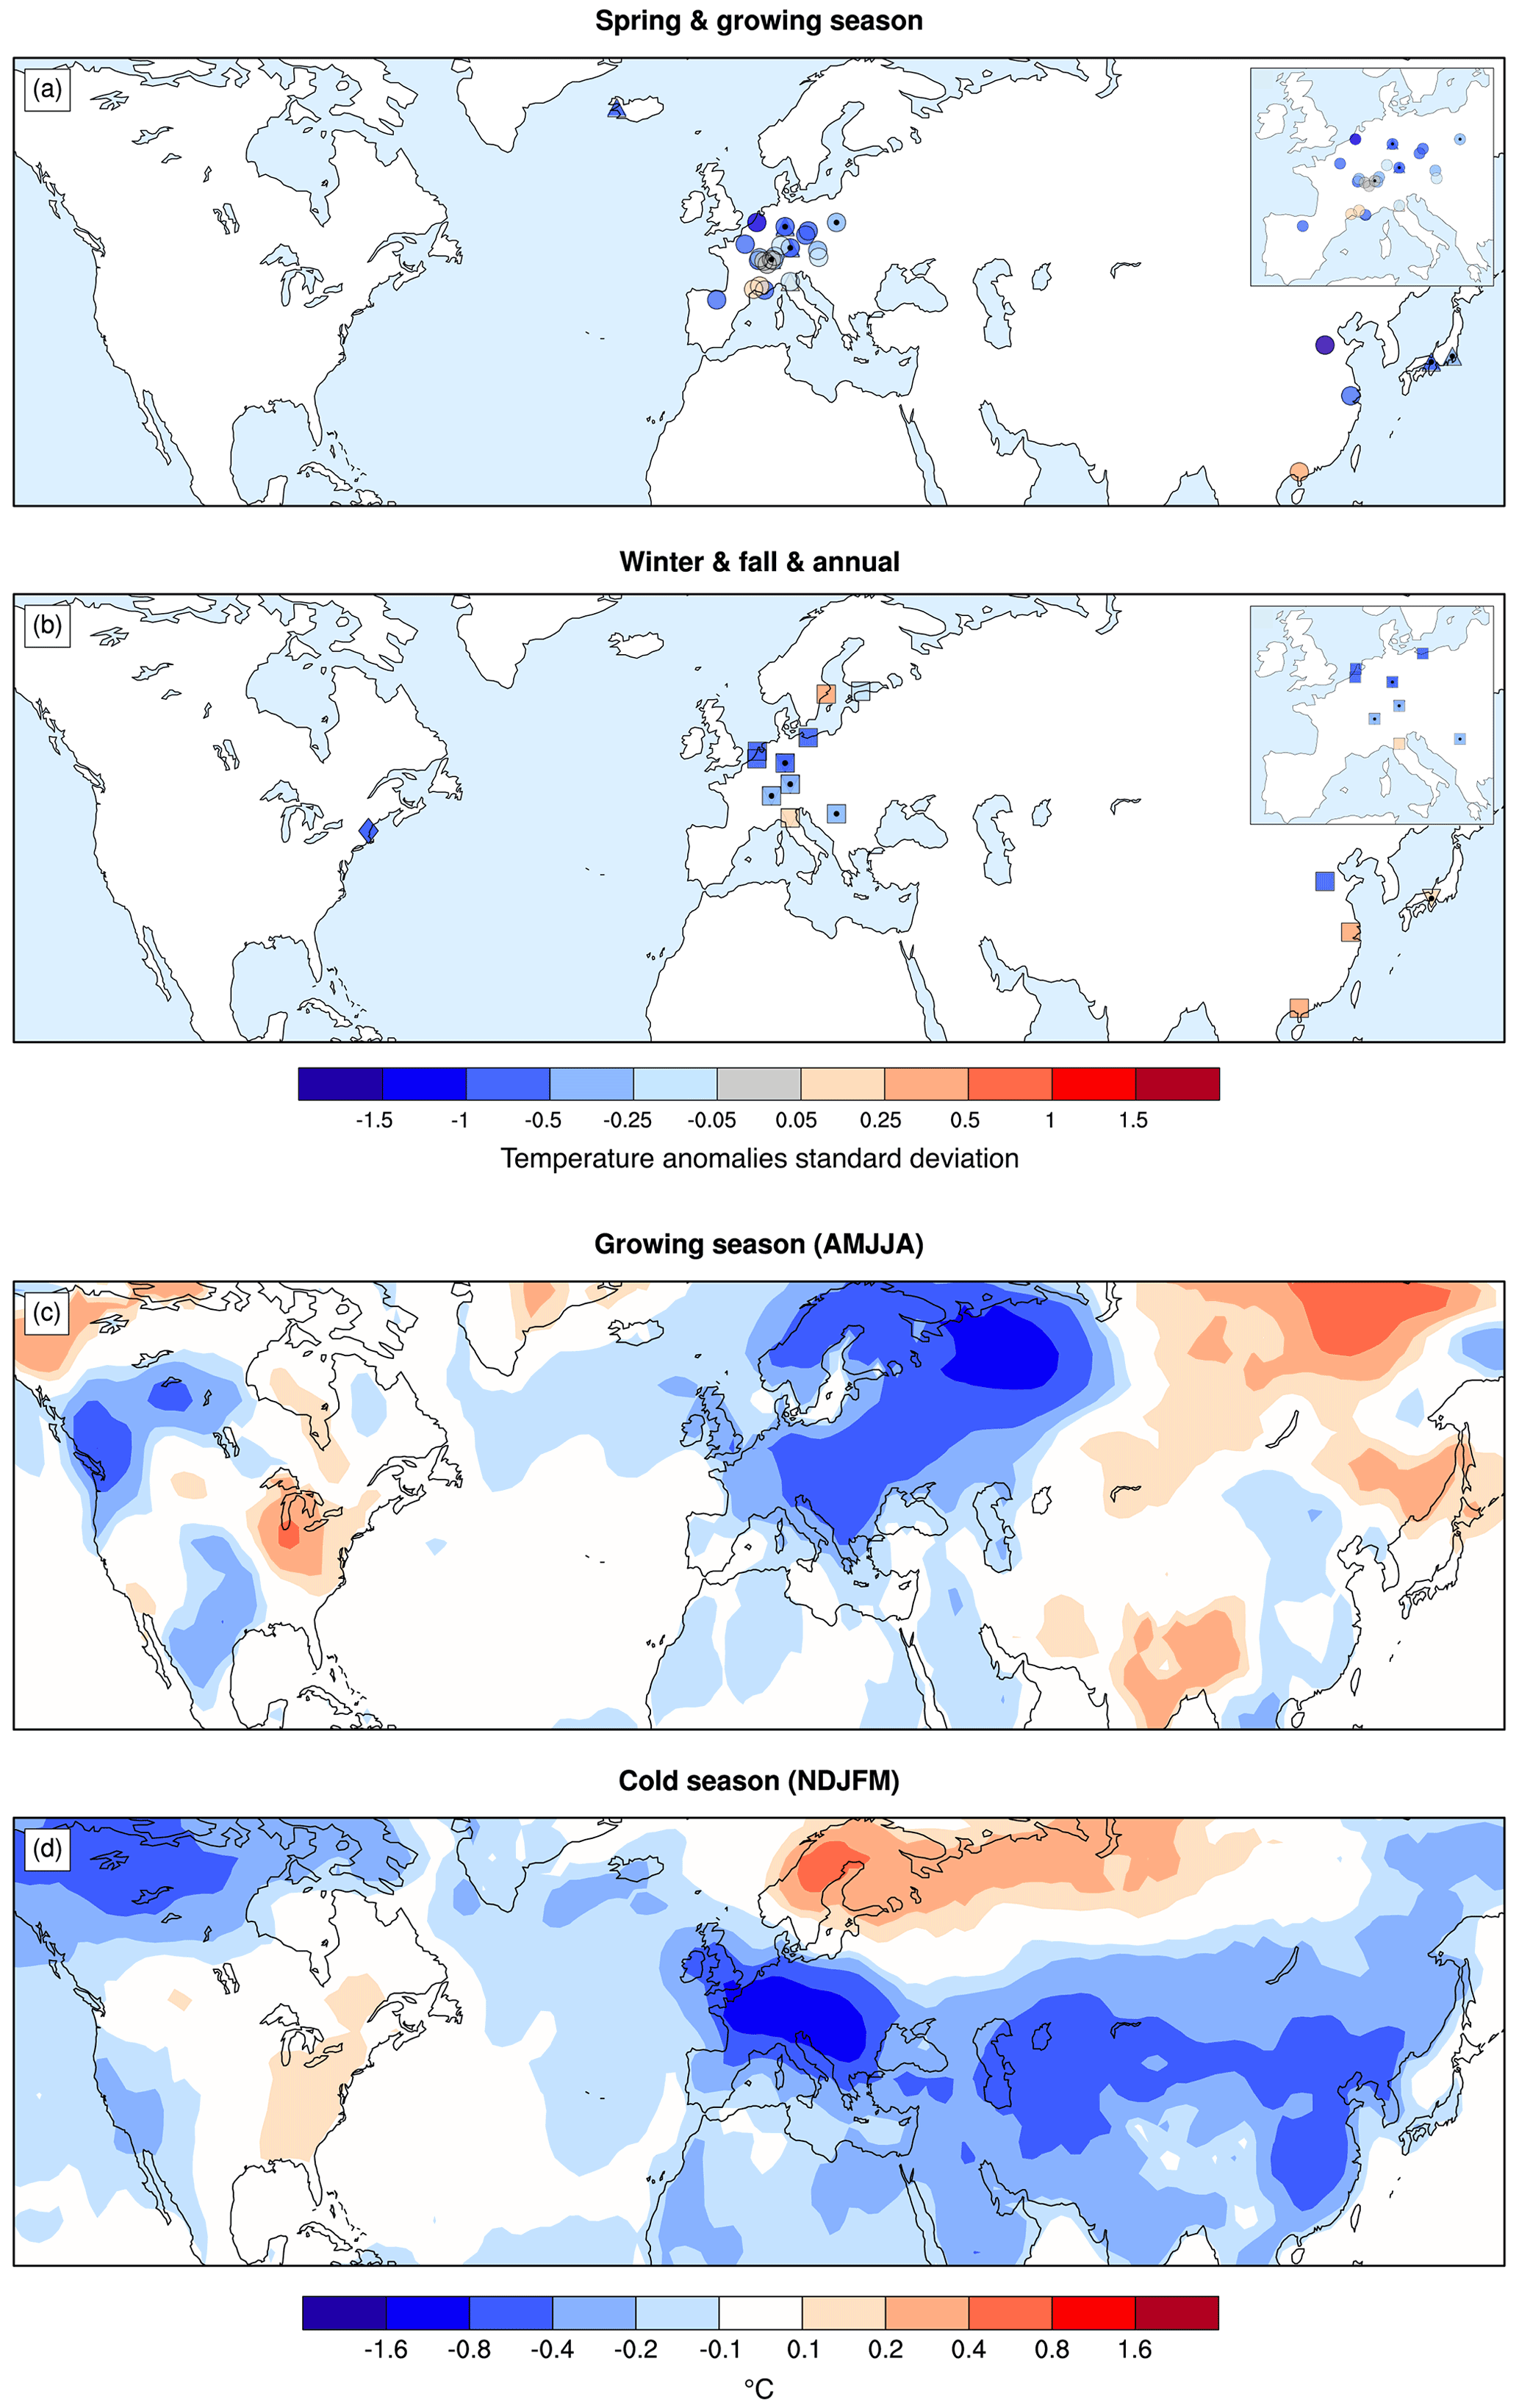
Figure 3Temperature composites of documentary series for the 1693 and 1695 CE volcanic eruptions. Proxy series are categorized into seasonal groups: (a) shows spring and growing season proxies, whereas (b) comprises fall, winter, and annual proxies. Panels (c) and (d) show composites of 2 m surface air temperature during the growing season (April–August) and cold season (November–March), respectively, based on the EKF400v2.0 reanalysis. Documentary proxies assimilated in the EKF400v2 are indicated by a black dot in (a) and (b).
These findings based on documentary evidence correspond well with the temperature composites from the EKF400v2.0 reanalysis (Valler et al., 2021) for spring and the growing season (April–August) (Fig. 3c), as well as the cold season (Fig. 3d). One must note that 17 of the documentary series shown are assimilated in the EKF400v2.0 reanalysis (indicated with black dots), and thus a good agreement is expected. The global reconstruction shows very strong negative anomalies over Europe and indicates that the post-volcanic cooling after the 1693 and 1695 CE eruptions was especially strong over Europe. The temperature signal over Asia and North America is more ambiguous, particularly for the cold season. It should be noted that the cold season in the EKF400v2.0 reanalysis generally has little skill since it is predominately based on sea surface temperatures (SSTs) and volcanic forcing.
4.2 Temperature anomalies after Laki eruption: June 1783–February 1784 CE
While for the late 17th century only relatively few documentary records are available, a more comprehensive picture can be drawn in terms of the temperature response to the Laki eruption in southern Iceland 1783–1784 CE. While the Serua eruption in 1693 CE was a highly explosive, tropical eruption, the Laki eruption took place at a high latitude (64∘ N) and was much less explosive. However, the basaltic flood lava eruption lasted for 8 months (8 June 1783 to 7 February 1784 CE), and its consecutive eruptions maintained high atmospheric sulfur concentrations, resulting in a persistent sulfuric aerosol cloud that progressively covered large parts of the Northern Hemisphere for many months. The widespread pall of volcanic haze gave rise to considerable environmental implications and atmospheric effects (e.g., Sigurdsson, 1982; Brayshay and Grattan, 1999; Highwood and Stevenson, 2003; Thordarson and Self, 2003). For the period covering the Laki eruption, 90 documentary proxy time series are available. Due to their variety, the temperature response to the volcanic eruption can be analyzed on a seasonal resolution. Based on the available proxy series and the month they represent, seasons are defined as follows: spring (February–May), growing season (April–August), fall (October–December), and winter (December–March). Instrumental temperature records from 29 stations in Europe and North America show that the annual mean temperature in the 3 years following the Laki eruption was significantly colder relative to the 1768–1798 CE climatology (Thordarson and Self, 2003). The summer of 1783 CE, on the other hand, was largely dominated by above-normal temperatures in northern and central Europe. To correctly capture the effect of the eruption lasting from June 1783 until February 1784 CE, temperature composites are calculated individually for each season. Anomalies are defined as the growing season of the year 1783 CE, the fall seasons of the years 1783–1784 CE, and the winter and spring seasons of the years 1784–1785 CE. Similar to the 1690s CE, temperature responses during the relevant seasons are expressed relative to a reference period, defined as a combined average of the 10 years prior and 10 years after. Composites are based on standardized values and are only formed if there are at least 16 reference years available in the documentary proxy series.
Firstly, we can recognize that the seasonal signals among the documentary records agree rather well, particularly for the growing, winter, and spring seasons (Fig. 4a, c, d). The growing season of 1783 CE was abnormally warm. The proxies over Europe unanimously show a prominent warming signal (Fig. 4a). The positive anomalies decrease towards the Mediterranean Sea, which is in very good agreement with instrumental records (Thordarson and Self, 2003). Particularly strong anomalies are found for the Low Countries (Shabalova and van Engelen, 2003). The strong warming signal over central Europe is also captured by the EKF400v2.0 reanalysis (Fig. 4e). That is not surprising since EKF400v2.0 assimilates some of the documentary proxy series (indicated by the black dots). However, according to Zambri et al. (2019) the anomalously warm summer of 1783 CE was the result of a prominent atmospheric blocking over northern Europe unrelated to the eruption rather than being caused by positive radiative forcing due to high SO2 emissions, as was previously believed (Wood, 1992; Rampino et al., 1995; Grattan and Sadler, 1999). As volcanic aerosol spread through the atmosphere, its secondary and more wide-ranging cooling effect did establish itself over the course of the fall season of 1783 CE. Fall documentary proxies show mixed signals, suggesting that it was colder than average during 1783–1784 CE over North America but rather warm in northeastern Europe and Russia (Fig. 4b). Advancing into the winter and spring seasons, documentary proxies show very cold anomalies over central and northern Europe and North America (Fig. 4c, d). A total of 8 of the 18 proxies in Europe exhibit negative anomalies exceeding 1.5 standard deviations.
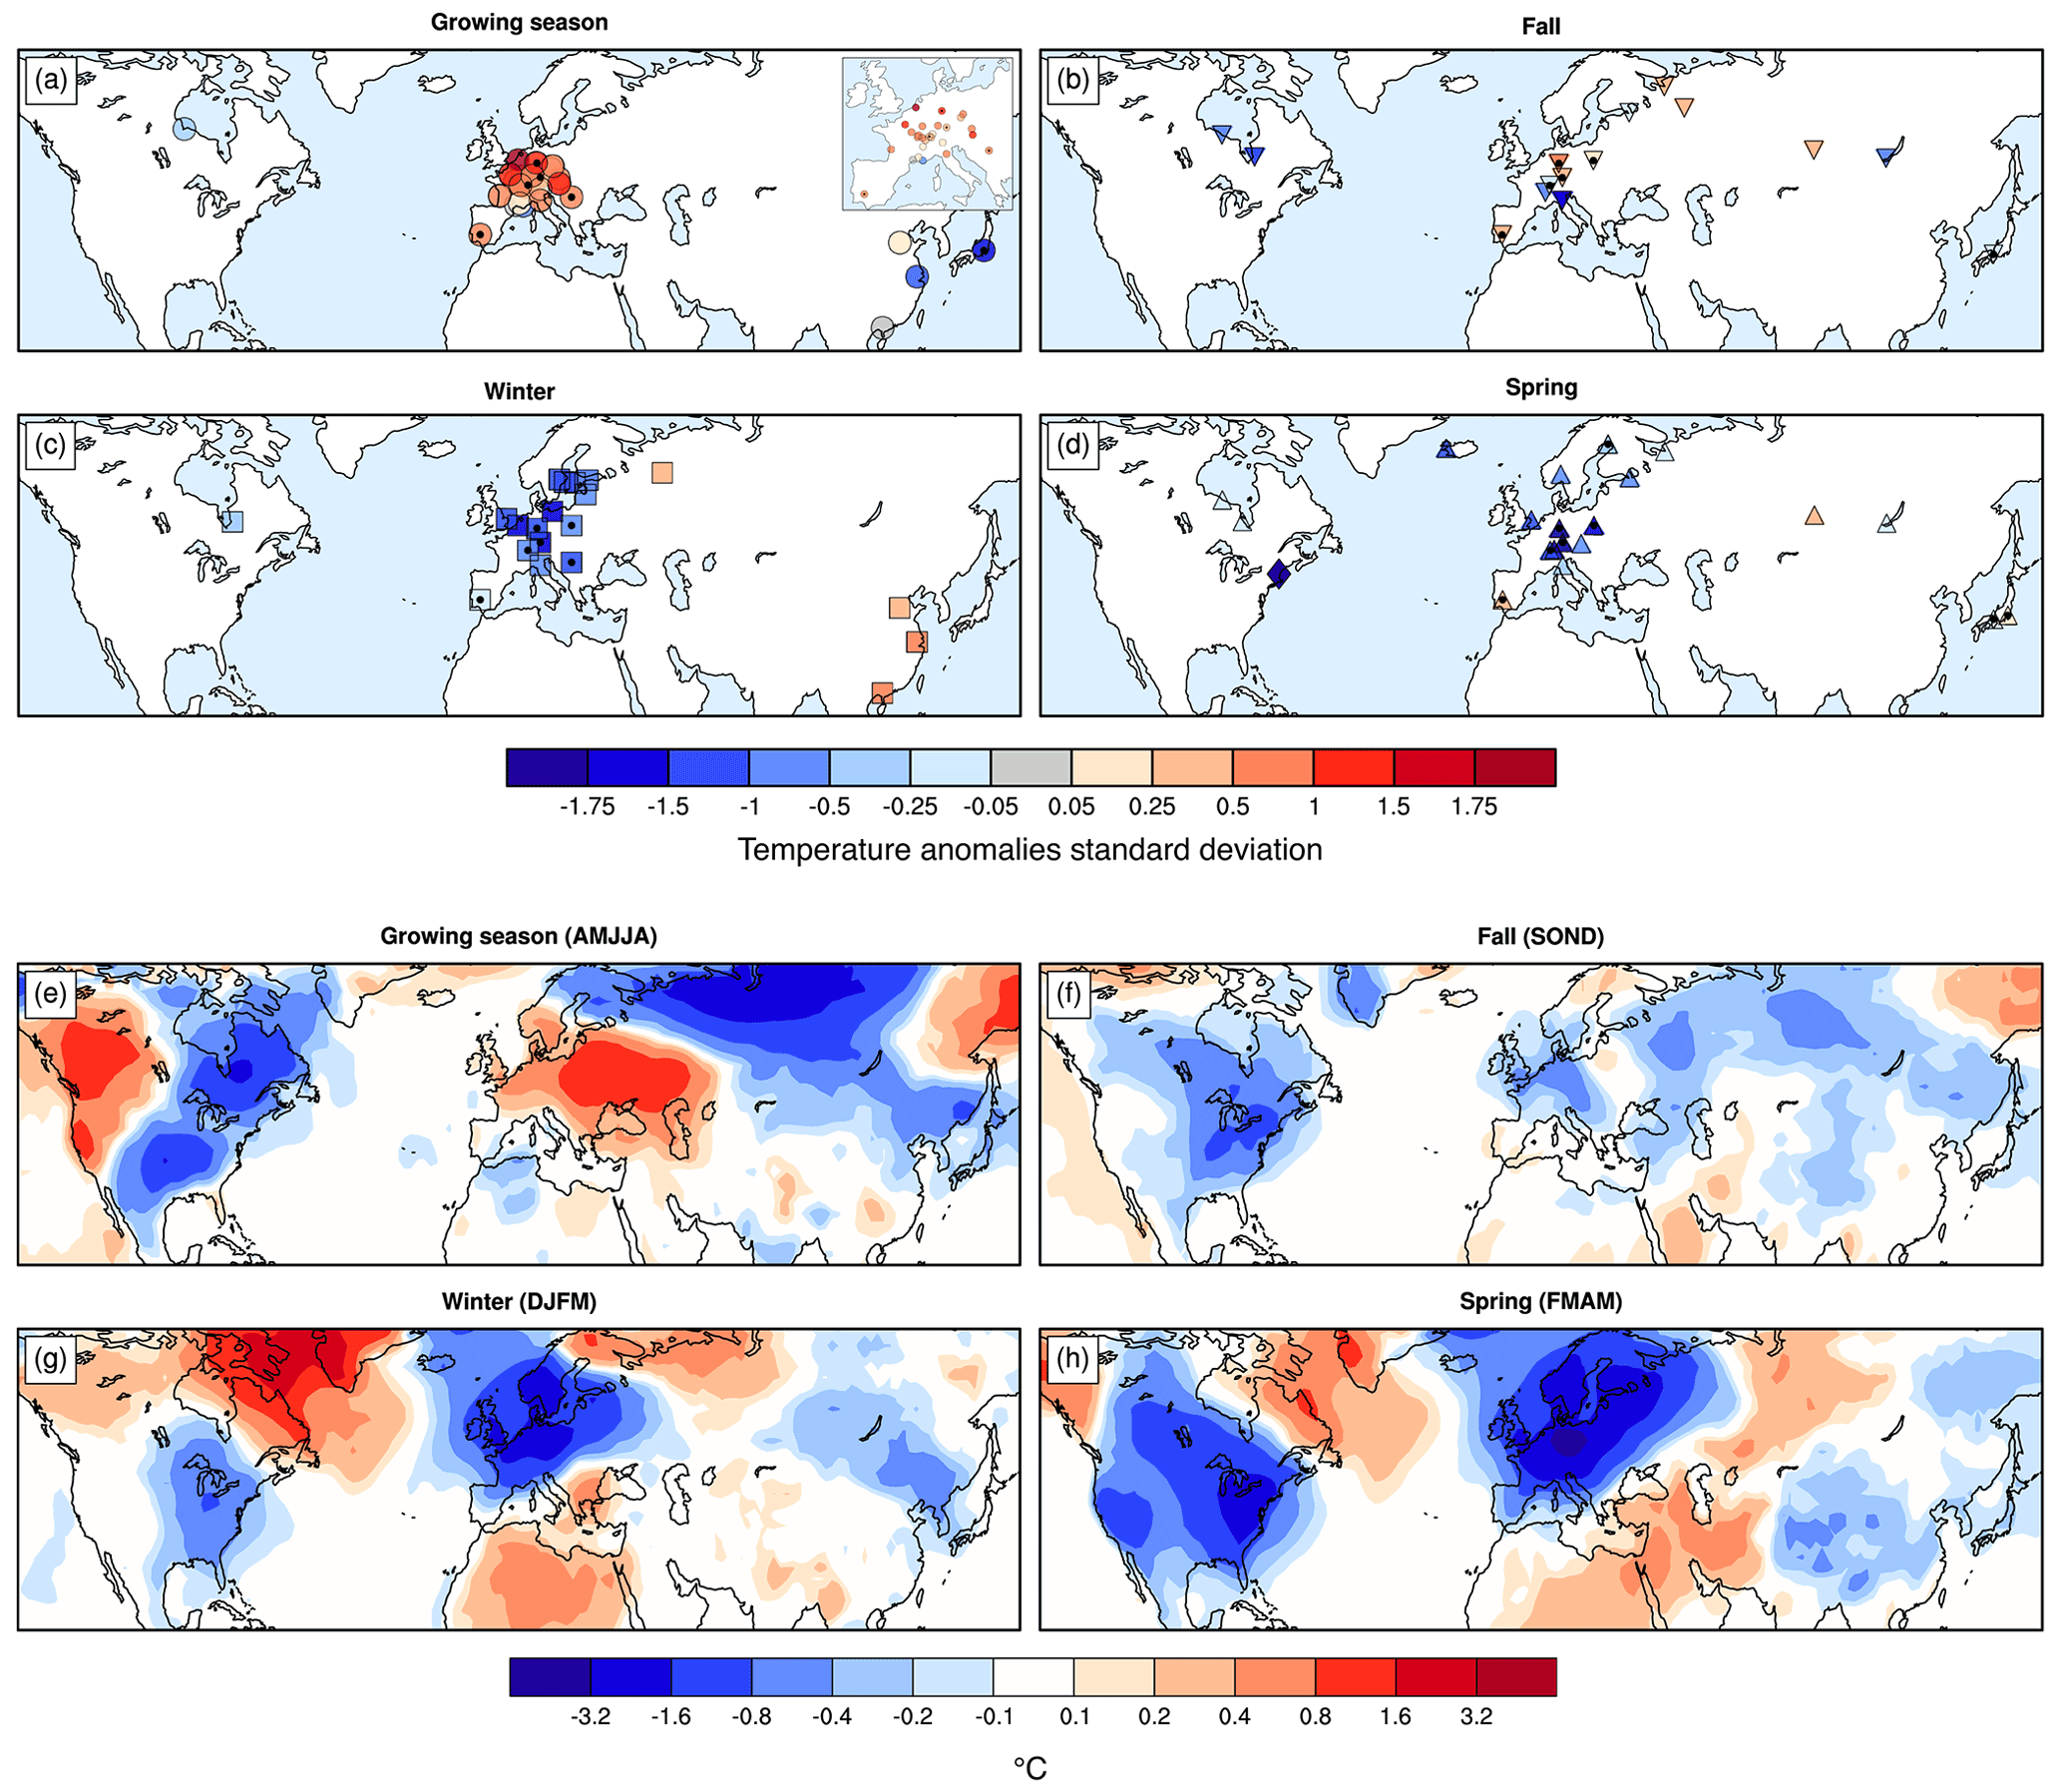
Figure 4Temperature composites of documentary series for the Laki eruption 1783–1784 CE. Proxy series are categorized seasonally: (a) growing season proxies for 1783 CE, (b) fall proxies for 1783–1784 CE, (c) winter proxies for 1784–1785 CE, and (d) spring proxies for 1784–1785 CE. Composites that are very close to 0 are colored grey (regardless of their sign). Panels (e) through (h) show composites of 2 m surface air temperature during the corresponding seasons based on the EKF400v2.0 reanalysis. Documentary proxies assimilated in the EKF400v2 are indicated by a black dot in (a) through (d).
EKF400v2.0 agrees very well with these findings, confirming the strong negative anomalies over central and northern Europe and eastern North America (Fig. 4g, h). Documentary proxies indicate that strong negative temperatures anomalies continue into spring all across the Northern Hemisphere. In general, we see a good agreement between the documentary proxies and EKF400v2.0, especially over Europe and North America. For China, both documentary data and EKF400v2.0 are rather uncertain, and we do not know if we can trust either. The signal in spring and fall over northeastern Europe and Russia differs from EKF400v2.0, often showing opposite values.
4.3 Precipitation anomalies during global drought 1877–1878 CE
In the previous two case studies, two applications of documentary temperature proxies are presented. Besides temperature, documentary evidence on dryness and wetness are equally (if not more) important and provide invaluable insight into regions of the world where precipitation rather than temperature is the limiting factor for harvests or general wellbeing. Here, I present a precipitation case study for Africa during the particularly dry period 1877–1878 CE, sometimes referred to as the Global Drought (Brönnimann, 2015) or the Late Victorian Great Drought (Davis, 2001). During this period, concurring prolonged droughts in South Asia and East Asia, Africa, South America, and the Mediterranean region caused substantial crop failures, catalyzing some of the most extreme and widespread famines in modern times (Davis, 2001; Cook et al., 2010; Singh et al., 2018). It is widely acknowledged that the record-breaking El Niño event of 1877–1878 CE is the driving force behind these extraordinary drought conditions, affecting much of the tropics (Kripalani and Kulkarni, 1997; Aceituno et al., 2009; Brönnimann, 2015). However, Singh et al. (2018) suggest that an extraordinary combination of preceding cool tropical Pacific conditions in 1870–1876 CE, a record strong Indian Ocean Dipole (IOD) in 1877 CE, a record warm northern Atlantic Ocean in 1878 CE, and the strong El Niño event in 1877–1878 CE led to these extreme drought events and the so-called Global Famine.
On the African continent, northeastern and southern Africa were particularly affected by drought conditions. This is also captured by documentary evidence. Figure 5a displays composites of precipitation proxies for the years 1877–1878 CE relative to a reference period defined as the combined average of the 10 years prior and 10 years after the event. The majority of the data points are based on the semi-quantitative precipitation dataset from Nicholson (2001) and are annually resolved (rhombi). Another annual proxy is the Nile River flood series from Cairo (Popper, 1951). In addition to these data, five summer rainfall zone (SRZ) proxies (October–April) for Namibia (Grab and Zumthurm, 2018); Lesotho (Nash and Grab, 2010); and the South African regions of Kalahari (Nash and Endfield, 2002, 2008), KwaZulu-Natal (Nash et al., 2016), and Eastern Cape (Vogel, 1989) are depicted with squares. Furthermore, circles indicate winter rainfall zone (WRZ) (April–September) proxies for Namaqualand (Kelso and Vogel, 2007) and the Eastern Cape and Southern Cape regions(Vogel, 1989).
The documentary proxies indicate strong to extreme drought signals for northeastern Africa, particularly Egypt and Sudan. The Nile River, for example, shows below normal water levels (Popper, 1951). For equatorial East Africa, on the other hand, documentary proxies indicate wetter than normal conditions. Strong positive precipitation anomalies in this region, particularly for the short rain season (September–November), are often associated with a warm ENSO episode, especially when coinciding with a positive IOD event (Black, 2005). An abundance of rain in East Africa is contrasted by severe drought conditions affecting much of the SRZ in southern Africa. The most extreme drought signals are found for both the SRZ and WRZ in Eastern Cape (Vogel, 1989). This dipole in precipitation is found to be associated with a positive IOD event occurring along with the developing El Niño (Goddard and Graham, 1999). The Southern Cape region, where precipitation is dominated by austral winter rainfall, is characterized by predominantly positive anomalies, with the Namaqualand WRZ precipitation index showing the strongest anomaly (Kelso and Vogel, 2007). That suggests that drought conditions were particularly severe during the austral summer months for southern Africa, and thus the regions in the SRZ were affected the most.
The precipitation anomalies based on the two reanalyses EKF400v2.0 (Fig. 5b) and 20CRv3 (Fig. 5c) agree well on the annual drought signal in southeastern Africa; however, they mostly miss the positive anomaly in the southwest. Both EKF400v2.0 and 20CRv3 are predominantly driven by SSTs, and thus a good agreement is expected. It is important to note that none of the presented documentary records are assimilated in EKF400v2.0 or 20CRv3. When looking into the seasonal differences between austral summer and winter precipitation, EKF400v2.0 somewhat captures the positive signal for the winter months, whereas 20CRv3 shows positive anomalies on the eastern side of the Cape of Good Hope. While the rainfall deficits in the south are generally captured, both the positive anomalies in equatorial East Africa and negative anomalies in the northeast of the continent are poorly represented. EKF400v2.0 shows the opposite signal for most of equatorial East Africa, and 20CRv3 misses out on the negative anomalies in northeastern Africa. It must be noted that precipitation oftentimes cannot be trusted in reanalysis products due to its large variability. Nevertheless, some large-scale features are captured. It becomes evident, however, that documentary evidence contains invaluable information that might help improve such products in the future.
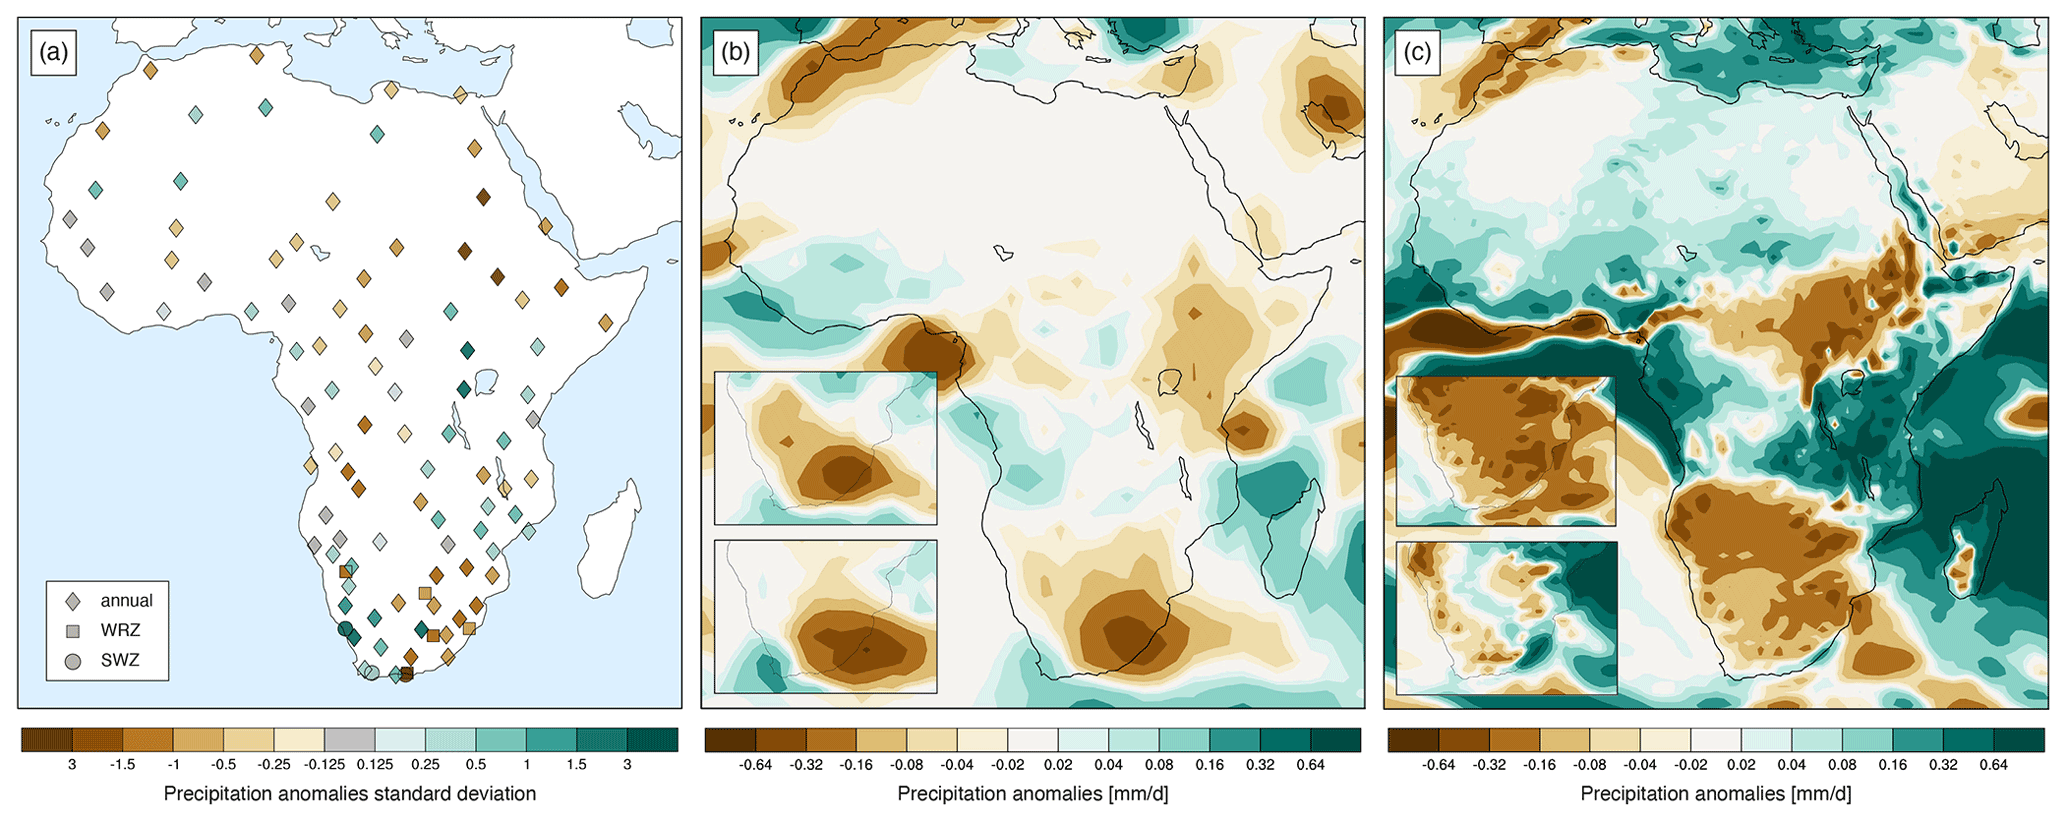
Figure 5Precipitation composites of documentary records for the Global Drought 1877–1878 CE (a). Composites that are very close to 0 are colored grey (regardless of their sign). Composites of annual accumulated precipitation are shown for EKF400v2.0 (b) and 20CRv3 (c). The superimposed graphs indicate composites for the SRZ (top) and the WRZ (bottom).
This study presents the first ever global inventory of quantitative documentary evidence related to climate and puts them in a large-scale context. It systematically compiles predominantly English research that has been, for the most part, published in peer-reviewed journals and focuses on deriving climate information from documentary sources from archives of societies. The inventory includes almost 700 document-based climate time series with significant potential for large-scale climate reconstructions. The majority of series included are based on research since the 1990s. However, the inventory also contains numerous records from previous times that did not make the transition into the digital age and had to be rediscovered. Documentary evidence has largely been overlooked so far and has not received the appropriate consideration in the field of climate reconstruction. On the one hand, this might be because historical data are not readily available on a common platform or are not published altogether. On the other hand, these data have never been considered in a global context until now. Although there is relatively little documentary evidence available compared to natural proxies or instrumental measurements, the historical information can be highly accurate and thus is of great significance. In contrast to natural proxies that are mainly annually resolved, they generally exhibit a higher temporal resolution (often seasonal or even monthly). This makes them particularly valuable when reconstructing the boreal cold season, which is poorly represented by natural proxies. European, Russian, Asian, and North American ice and plant phenology records play an essential role in this regard as they facilitate high-resolution temperature information for October through May. Not only is there a great wealth of documentary time series data enabling temperature reconstructions, but there are also a considerable number of records available that serve as precipitation proxies through dry–wet indices. These might be of particular interest in arid subtropical regions (e.g., in the Mediterranean, China, and Africa) where other sources of information are sparse.
The presented case studies effectively demonstrate the significant potential that documentary proxies have for reconstructing past temperature and precipitation variability on a continental and even hemispherical scale. The inventory presented in this study contains a comprehensive set of highly relevant quantitative document-based climate time series from all continents and puts them into a large-scale perspective. In this way, it creates the foundation for incorporating documentary evidence into climate reconstructions on a global scale. While it certainly does not provide a complete survey of all available quantitative records related to climate, it may serve as a starting point for further research and potentially stimulate a community effort to, e.g., compile a full inventory of documentary evidence, including qualitative archival records.
EKF400v2.0 is available from https://doi.org/10.26050/WDCC/EKF400_v2.0 (Franke et al., 2020). 20CRv3 is available from the following link: https://portal.nersc.gov/project/20C_Reanalysis/ (Slivinski et al., 2019). Documentary series used in this study are either located on different platforms indicated in Table 1 and accessible through the given URL, or (if not yet published) they will be included in a separate publication on the documentary dataset itself. Information about this dataset will be updated here.
The supplement related to this article is available online at: https://doi.org/10.5194/cp-18-1407-2022-supplement.
The author has declared that there are no competing interests.
Publisher's note: Copernicus Publications remains neutral with regard to jurisdictional claims in published maps and institutional affiliations.
This article is part of the special issue “International methods and comparisons in climate reconstruction and impacts from archives of societies”. It is not associated with a conference.
This work was supported by the European Commission (ERC PALAEO-RA, grant no. 787574). Support for the Twentieth Century Reanalysis Project version 3 dataset is provided by the U.S. Department of Energy, Office of Science Biological and Environmental Research (BER), the National Oceanic and Atmospheric Administration Climate Program Office, and the NOAA Physical Sciences Laboratory. I want to thank the reviewers for their constructive criticism and suggestions that improved the quality of this paper. I also want to thank Elaine Kuan-Hui, Yasuyuki Aono, Øyvind Nordli, and This Rutishauser for sharing their unpublished documentary-based time series used in the case studies. Furthermore, I thank Stefan Brönniman and This Rutishauser for their continuous support and encouragement throughout the entire process of creating this inventory, Sam White for his help with semantics, and Andrey Martinov for his great help with the Russian publications.
This research has been supported by the European Commission, European Research Council (PALAEO-RA grant no. 787574).
This paper was edited by Martin Bauch and reviewed by two anonymous referees.
Academy of Meteorological Science of China Central Meteorological Administration: Yearly Charts of Dryness/Wetness in China for the Last 500 Years, Cartographic Publishing House, Beijing, 1981.
Aceituno, P., Prieto, M. del R., Solari, M. E., Martínez, A., Poveda, G., and Falvey, M.: The 1877–1878 El Niño episode: associated impacts in South America, Clim. Change, 92, 389–416, https://doi.org/10.1007/s10584-008-9470-5, 2009.
Adamson, G. C. D. and Nash, D. J.: Long-term variability in the date of monsoon onset over western India, Clim. Dyn., 40, 2589–2603, https://doi.org/10.1007/s00382-012-1494-x, 2013.
Adamson, G. C. D. and Nash, D. J.: Documentary reconstruction of monsoon rainfall variability over western India, 1781–1860, Clim. Dyn., 42, 749–769, https://doi.org/10.1007/s00382-013-1825-6, 2014.
Aono, Y. and Kazui, K.: Phenological data series of cherry tree flowering in Kyoto, Japan, and its application to reconstruction of springtime temperatures since the 9th century, Int. J. Climatol., 28, 905–914, https://doi.org/10.1002/joc.1594, 2008.
Aono, Y. and Omoto, Y.: Estimation of temperature at kyoto since the 11th century. Using flowering data of cherry trees in old documents, J. Agric. Meteorol., 49, 263–272, https://doi.org/10.2480/agrmet.49.263, 1994.
Aono, Y. and Saito, S.: Clarifying springtime temperature reconstructions of the medieval period by gap-filling the cherry blossom phenological data series at Kyoto, Japan, Int. J. Biometeorol., 54, 211–219, https://doi.org/10.1007/s00484-009-0272-x, 2010.
Arfeuille, F., Weisenstein, D., Mack, H., Rozanov, E., Peter, T., and Brönnimann, S.: Volcanic forcing for climate modeling: a new microphysics-based data set covering years 1600–present, Clim. Past, 10, 359–375, https://doi.org/10.5194/cp-10-359-2014, 2014.
Ashcroft, L., Gergis, J. L., and Karoly, D. J.: A historical climate dataset for southeastern Australia, 1788–1859, Geosci. Data J., 1, 158–178, https://doi.org/10.1002/gdj3.19, 2014.
Ball, T. F.: Historical and instrumental evidence of climate: western Hudson Bay, Canada, 1714–1850, in: Climate since the A.D. 1500, 1st edn., edited by: Bradley, R. S. and Jones, P. D., Routledge, London, 40–73, https://doi.org/10.4324/9780203430996, 1995.
Baron, W. R.: Historical climate records from the northeastern United States, 1640 to 1900, in: Climate since the A.D. 1500, 1st edn., edited by: Bradley, R. S. and Jones, P. D., 74–91, Routledge, London, https://doi.org/10.4324/9780203430996, 1995.
Baron, W. R. and Smith, D. C.: Growing Season Parameter Reconstructions for New England Using Killing Frost Records, 1697–1947, Maine Agric. For. Exp. Stn. Bull., 846, 1–76, 1996.
Baron, W. R., Gordon, G. A., Borns, H. W., and Smith, D. C.: Frost-Free Record Reconstruction for Eastern Massachusetts, 1733–1980, J. Clim. Appl. Meteorol., 23, 317–319, https://doi.org/10.1175/1520-0450(1984)023<0317:FFRRFE>2.0.CO;2, 1984.
Barrat, J. M. D.: First Appearance of Ice, the Closing and the time of Opening of the Connecticut River at Middletown, Am. J. Sci. arts., 39, 88–90, https://www.biodiversitylibrary.org/item/97098#page/110/mode/2up (last access: 30 May 2022), 1840.
Bartholy, J., Pongrácz, R., and Molnár, Z.: Classification and analysis of past climate information based on historical documentary sources for the Carpathian basin, Int. J. Climatol., 24, 1759–1776, https://doi.org/10.1002/joc.1106, 2004.
Benson, B., Magnuson, J., and Sharma, S.: Global Lake and River Ice Phenology Database, Version 1, NSIDC Natl. Snow Ice Data Center [data set], https://doi.org/10.7265/N5W66HP8, 2000.
Bhend, J., Franke, J., Folini, D., Wild, M., and Brönnimann, S.: An ensemble-based approach to climate reconstructions, Clim. Past, 8, 963–976, https://doi.org/10.5194/cp-8-963-2012, 2012.
Black, E.: The relationship between Indian Ocean sea–surface temperature and East African rainfall, Philos. Trans. R. Soc. A Math. Phys. Eng. Sci., 363, 43–47, https://doi.org/10.1098/rsta.2004.1474, 2005.
Borisenkov, Y. P.: Documentary evidence from the U.S.S.R, in: Climate since the A.D. 1500, 1st edn., edited by: Bradley, R. S. and Jones, P. D., Routledge, 171–183, https://doi.org/10.4324/9780203430996, 1995.
Bradley, R. S. and Jones, P. D.: Climate since A.D. 1500, 1st edn., Routledge, London, https://doi.org/10.4324/9780203430996, 1995.
Brayshay, M. and Grattan, J.: Environmental and social responses in Europe to the 1783 eruption of the Laki fissure volcano in Iceland: a consideration of contemporary documentary evidence, Geol. Soc. London Spec. Publ., 161, 173–187, https://doi.org/10.1144/GSL.SP.1999.161.01.12, 1999.
Brázdil, R., Dobrovolný, P., Luterbacher, J., Moberg, A., Pfister, C., Wheeler, D., and Zorita, E.: European climate of the past 500 years: New challenges for historical climatology, Clim. Change, 101, 7–40, https://doi.org/10.1007/s10584-009-9783-z, 2010.
Brázdil, R., Kiss, A., Luterbacher, J., Nash, D. J., and Řezníčková, L.: Documentary data and the study of past droughts: a global state of the art, Clim. Past, 14, 1915–1960, https://doi.org/10.5194/cp-14-1915-2018, 2018.
Brönnimann, S.: Climatic Changes Since 1700, in: Advances in Global Change Research, 1st edn., 55, Springer International Publishing, Cham, 167–321, https://doi.org/10.1007/978-3-319-19042-6, 2015.
Brönnimann, S., Allan, R., Ashcroft, L., Baer, S., Barriendos, M., Brázdil, R., Brugnara, Y., Brunet, M., Brunetti, M., Chimani, B., Cornes, R., Domínguez-Castro, F., Filipiak, J., Founda, D., Herrera, R. G., Gergis, J., Grab, S., Hannak, L., Huhtamaa, H., Jacobsen, K. S., Jones, P., Jourdain, S., Kiss, A., Lin, K. E., Lorrey, A., Lundstad, E., Luterbacher, J., Mauelshagen, F., Maugeri, M., Maughan, N., Moberg, A., Neukom, R., Nicholson, S. E., Noone, S., Nordli, Ø., Ólafsdóttir, K. B., Pearce, P. R., Pfister, L., Pribyl, K., Przybylak, R., Pudmenzky, C., Rasol, D., Reichenbach, D., Řezníčková, L., Rodrigo, F. S., Rohr, C., Skrynyk, O., Slonosky, V., Thorne, P., Valente, M. A., Vaquero, J. M., Westcottt, N. E., Williamson, F., and Wyszyński, P.: Unlocking Pre-1850 Instrumental Meteorological Records: A Global Inventory, Bull. Am. Meteorol. Soc., 100, ES389–ES413, https://doi.org/10.1175/BAMS-D-19-0040.1, 2019.
Brückner, E.: Klimaschwankungen seit 1700, 1st edn., Hölzel, Wien, Olmütz, 1890.
Bullón, T.: Winter temperatures in the second half of the sixteenth century in the central area of the Iberian Peninsula, Clim. Past, 4, 357–367, https://doi.org/10.5194/cp-4-357-2008, 2008.
Burgdorf, A.-M.: A preliminary global inventory of historical documentary evidence related to climate since the 14th century, Past Glob. Chang. Mag., 28, 58–59, https://doi.org/10.22498/pages.28.2.58, 2020.
Camenisch, C., White, S., Pei, Q., Huhtamaa, H., and Eggleston, S.: Climate Reconstruction and Impacts from the Archives of Societies, Past Glob. Chang. Mag., 28, 33-68, https://doi.org/10.22498/pages.28.2, 2020.
Camuffo, D., Bertolin, C., Barriendos Vallvé, M., Domínguez-Castro, F., Cocheo, C., Enzi, S., Sghedoni, M., della Valle, A., Garnier, E., Alcoforado, M. J., Xoplaki, E., Luterbacher, J., Diodato, N., Maugeri, M., Nunes, M. F., and Rodriguez, R.: 500 Year temperature reconstruction in the Mediterranean Basin by means of documentary data and instrumental observations, Clim. Change, 101, 169–199, https://doi.org/10.1007/s10584-010-9815-8, 2010.
Catchpole, A. J. W.: Hudson's Bay Company ships' log-books as sources of sea ice data, 1751–1870, in: Climate since the A.D. 1500, 1st edn., edited by: Bradley, R. S. and Jones, P. D., Routledge, London, 17–39, https://doi.org/10.4324/9780203430996, 1995.
Catchpole, A. J. W. and Faurer, M.-A.: Summer sea ice severity in Hudson Strait, 1751–1870, Clim. Change, 5, 115–139, https://doi.org/10.1007/BF00141266, 1983.
Catchpole, A. J. W. and Hanuta, I.: Severe summer ice in Hudson Strait and Hudson Bay following major volcanic eruptions, 1751 to 1889 A.D., Clim. Change, 14, 61–79, https://doi.org/10.1007/BF00140175, 1989.
Catchpole, A. J. W., Moodie, D. W., and Milton, D.: Freeze-Up and Break-Up of Estuaries on Hudson Bay in the Eighteenth and Nineteenth Centuries, Can. Geogr. Géographe Can., 20, 279–297, https://doi.org/10.1111/j.1541-0064.1976.tb00238.x, 1976.
Chenoweth, M.: A reassessment of historical Atlantic basin tropical cyclone activity, 1700–1855, Clim. Change, 76, 169–240, https://doi.org/10.1007/s10584-005-9005-2, 2006.
Chu, G., Sun, Q., Wang, X. and Sun, J.: Snow anomaly events from historical documents in eastern China during the past two millennia and implication for low-frequency variability of AO/NAO and PDO, Geophys. Res. Lett., 35, L14806, https://doi.org/10.1029/2008GL034475, 2008.
Cionni, I., Eyring, V., Lamarque, J. F., Randel, W. J., Stevenson, D. S., Wu, F., Bodeker, G. E., Shepherd, T. G., Shindell, D. T., and Waugh, D. W.: Ozone database in support of CMIP5 simulations: results and corresponding radiative forcing, Atmos. Chem. Phys., 11, 11267–11292, https://doi.org/10.5194/acp-11-11267-2011, 2011.
Coddington, O., Lean, J. L., Pilewskie, P., Snow, M., and Lindholm, D.: A Solar Irradiance Climate Data Record, Bull. Am. Meteorol. Soc., 97, 1265–1282, https://doi.org/10.1175/BAMS-D-14-00265.1, 2016.
Compo, G. P., Slivinski, L. C., Whitaker, J. S., Sardeshmukh, P. D., McColl, C., Brohan, P., Allan, R., Yin, X., Vose, R., Spencer, L. J., Ashcroft, L., Brönnimann, S., Brunet, M., Camuffo, D., Cornes, R., Cram, T. A., Crouthamel, R., and Dominguez-Castro, F. P.: The International Surface Pressure Databank version 4, Res. Data Arch. Natl. Cent. Atmos. Res. Comput. Inf. Syst. Lab. [data set], https://psl.noaa.gov/data/gridded/data.20thC_ReanV3.html (last access: 30 May 2022), 2019.
Cook, E. R., Anchukaitis, K. J., Buckley, B. M., D'Arrigo, R. D., Jacoby, G. C., and Wright, W. E.: Asian monsoon failure and megadrought during the last millennium, Science, 328, 486–489, https://doi.org/10.1126/science.1185188, 2010.
Crowley, T. J. and Unterman, M. B.: Technical details concerning development of a 1200 yr proxy index for global volcanism, Earth Syst. Sci. Data, 5, 187–197, https://doi.org/10.5194/essd-5-187-2013, 2013.
D'Arrigo, R., Klinger, P., Newfield, T., Rydval, M., and Wilson, R.: Complexity in crisis: The volcanic cold pulse of the 1690s and the consequences of Scotland's failure to cope, J. Volcanol. Geotherm. Res., 389, 106746, https://doi.org/10.1016/j.jvolgeores.2019.106746, 2020.
Davis, M.: Late Victorian Holocausts: El Niño Famines and the Making of the Third World, 1st edn., Verso, London, ISBN 1-85984-382-4, 2001.
de Vries, J.: Histoire du climat et économie: des faits nouveaux, une interprétation différente, Ann. Hist. Sci. Soc., 32, 198–226, https://doi.org/10.3406/ahess.1977.293810, 1977.
Dobrovolný, P., Moberg, A., Brázdil, R., Pfister, C., Glaser, R., Wilson, R., van Engelen, A., Limanówka, D., Kiss, A., Halíčková, M., Macková, J., Riemann, D., Luterbacher, J., and Böhm, R.: Monthly, seasonal and annual temperature reconstructions for Central Europe derived from documentary evidence and instrumental records since AD 1500, Clim. Change, 101, 69–107, https://doi.org/10.1007/s10584-009-9724-x, 2010.
Eklund, A.: Isläggning och islossning i svenska sjöar (Long observation series of ice freeze and break up dates in swedish lakes), SMHI Hydrol., 81, 1–24, 1999.
Emile-Geay, J., McKay, N. P., Kaufman, D. S., von Gunten, L., Wang, J., Anchukaitis, K. J., Abram, N. J., Addison, J. A., Curran, M. A. J., Evans, M. N., Henley, B. J., Hao, Z., Martrat, B., McGregor, H. V, Neukom, R., Pederson, G. T., Stenni, B., Thirumalai, K., Werner, J. P., Xu, C., Divine, D. V, Dixon, B. C., Gergis, J., Mundo, I. A., Nakatsuka, T., Phipps, S. J., Routson, C. C., Steig, E. J., Tierney, J. E., Tyler, J. J., Allen, K. J., Bertler, N. A. N., Björklund, J., Chase, B. M., Chen, M.-T., Cook, E., de Jong, R., DeLong, K. L., Dixon, D. A., Ekaykin, A. A., Ersek, V., Filipsson, H. L., Francus, P., Freund, M. B., Frezzotti, M., Gaire, N. P., Gajewski, K., Ge, Q., Goosse, H., Gornostaeva, A., Grosjean, M., Horiuchi, K., Hormes, A., Husum, K., Isaksson, E., Kandasamy, S., Kawamura, K., Kilbourne, K. H., Koç, N., Leduc, G., Linderholm, H. W., Lorrey, A. M., Mikhalenko, V., Mortyn, P. G., Motoyama, H., Moy, A. D., Mulvaney, R., Munz, P. M., Nash, D. J., Oerter, H., Opel, T., Orsi, A. J., Ovchinnikov, D. V, Porter, T. J., Roop, H. A., Saenger, C., Sano, M., Sauchyn, D., Saunders, K. M., Seidenkrantz, M.-S., Severi, M., Shao, X., Sicre, M.-A., Sigl, M., Sinclair, K., St. George, S., St. Jacques, J.-M., Thamban, M., Kuwar Thapa, U., Thomas, E. R., Turney, C., Uemura, R., Viau, A. E., Vladimirova, D. O., Wahl, E. R., White, J. W. C., Yu, Z., Zinke, J., and Consortium, P.: A global multiproxy database for temperature reconstructions of the Common Era, Sci. Data, 4, 170088, https://doi.org/10.1038/sdata.2017.88, 2017.
Fenby, C. and Gergis, J. L.: Rainfall variations in south-eastern Australia part 1: Consolidating evidence from pre-instrumental documentary sources, 1788–1860, Int. J. Climatol., 33, 2956–2972, https://doi.org/10.1002/joc.3640, 2013.
Franke, J., Valler, V., Brugnara, Y., and Brönnimann, S.: Ensemble Kalman Fitting Paleo-Reanalysis Version 2 (EKF400_v2), WDC Climate [data set], https://doi.org/10.26050/WDCC/EKF400_v2.0, 2020.
García Acosta, V.: Historia y Desastres en América Latina (Volumen I), La RED/CIESAS-ITDG, Panama, https://www.desenredando.org/public/libros/1996/hydv1/HistoriaYDesastresVol_I-1.0.0.pdf (last access: 30 May 2022), 1996.
García Acosta, V.: Historia y Desastres en América Latina (Volumen II), La RED/CIESAS-ITDG, Panama, http://cidbimena.desastres.hn/docum/lared/libros/hydv2-todo_sep-09-2002.pdf (last access: 30 May 2022), 1997.
García-Herrera, R., Können, G. P., Wheeler, D. A., Prieto, M. R., Jones, P. D., and Koek, F. B.: CLIWOC: A Climatological Database for the World's Oceans 1750–1854, Clim. Change, 73, 1–12, https://doi.org/10.1007/s10584-005-6952-6, 2005.
García-Herrera, R., Ribera, P., Hernandez, E. M., and Gimero, L.: Northwest Pacific typhoons documented by the Philippine Jesuits, 1566–1900, J. Geophys. Res. Atmos., 112, 1–12, https://doi.org/10.1029/2006JD007370, 2007.
Gardiner, R. H.: Obervations on the Opening and Closing of Kennebec River, Maine, Annual report of the Board of Regents of the Smithsonian Institution, 434–436, https://library.si.edu/digital-library/book/annualreportofbo1858smit (last access: 30 May 2022), 1858.
Ge, Q. S., Zheng, J.-Y., Hao, Z.-X., Zhang, P.-Y., and Wang, W.-C.: Reconstruction of Historical Climate in China: High-Resolution Precipitation Data from Qing Dynasty Archives, Bull. Am. Meteorol. Soc., 86, 671–680, https://doi.org/10.1175/BAMS-86-5-671, 2005.
Ge, Q. S., Guo, X., Zheng, J., and Hao, Z. X.: Meiyu in the middle and lower reaches of the Yangtze River since 1736, Chinese Sci. Bull., 53, 107–114, https://doi.org/10.1007/s11434-007-0440-5, 2008.
Ge, Q. S., Zheng, J., Hao, Z. X., Shao, X. M., Wang, W. C., and Luterbacher, J.: Temperature variation through 2000 years in China: An uncertainty analysis of reconstruction and regional difference, Geophys. Res. Lett., 37, L03703, https://doi.org/10.1029/2009GL041281, 2010.
Ge, Q. S., Hao, Z. X., Tian, Y., He, F., and Zheng, J.: The rainy season in the Northwestern part of the East Asian Summer Monsoon in the 18th and 19th centuries, Quat. Int., 229, 16–23, https://doi.org/10.1016/j.quaint.2010.02.025, 2011.
Ge, Q. S., Hao, Z., Zheng, J., and Liu, Y.: China: 2000 years of climate reconstruction from historical documents, in: The palgrave handbook of climate history, 1st edn., edited by: White, S., Pfister, C., and Mauelshagen, F., Palgrave Macmillan, 189–201, https://doi.org/10.1057/978-1-137-43020-5_17, 2018.
Gergis, J. L. and Ashcroft, L.: Rainfall variations in south-eastern Australia part 2: A comparison of documentary, early instrumental and palaeoclimate records, 1788–2008, Int. J. Climatol., 33, 2973–2987, https://doi.org/10.1002/joc.3639, 2013.
Gergis, J. L., Ashcroft, L., and Garden, D.: Recent Developments in Australian Climate History, in: The Palgrave Handbook of Climate History, Palgrave Macmillan, 1st edn., edited by: White, S., Pfister, C., and Mauelshagen, F., UK, London, 237–245, https://doi.org/10.1057/978-1-137-43020-5_21, 2018.
Giese, B. S., Seidel, H. F., Compo, G. P., and Sardeshmukh, P. D.: An ensemble of ocean reanalyses for 1815–2013 with sparse observational input, J. Geophys. Res. Ocean., 121, 6891–6910, https://doi.org/10.1002/2016JC012079, 2016.
Glaser, R. and Riemann, D.: A thousand-year record of temperature variations for Germany and Central Europe based on documentary data, J. Quat. Sci., 24, 437–449, https://doi.org/10.1002/jqs.1302, 2009.
Goddard, L. and Graham, N. E.: Importance of the Indian Ocean for simulating rainfall anomalies over eastern and southern Africa, J. Geophys. Res.-Atmos., 104, 19099–19116, https://doi.org/10.1029/1999JD900326, 1999.
Grab, S. and Zumthurm, T.: The land and its climate knows no transition, no middle ground, everywhere too much or too little: a documentary-based climate chronology for central Namibia, 1845–1900, Int. J. Climatol., 38, e643–e659, https://doi.org/10.1002/joc.5397, 2018.
Grattan, J. and Sadler, J.: Regional warming of the lower atmosphere in the wake of volcanic eruptions: the role of the Laki fissure eruption in the hot summer of 1783, Geol. Soc. London Spec. Publ., 161, 161–171, https://doi.org/10.1144/GSL.SP.1999.161.01.11, 1999.
Guevara-Murua, A., Williams, C. A., Hendy, E. J., and Imbach, P.: 300 years of hydrological records and societal responses to droughts and floods on the Pacific coast of Central America, Clim. Past, 14, 175–191, https://doi.org/10.5194/cp-14-175-2018, 2018.
Hao, Z.-X., Zheng, J.-Y., Ge, Q.-S., and Wang, W.-C.: Winter temperature variations over the middle and lower reaches of the Yangtze River since 1736 AD, Clim. Past, 8, 1023–1030, https://doi.org/10.5194/cp-8-1023-2012, 2012.
Hao, Z. X., Zheng, J. Y., Zhang, X., Liu, H., Li, M., and Ge, Q. S.: Spatial patterns of precipitation anomalies in eastern China during centennial cold and warm periods of the past 2000 years, Int. J. Climatol., 36, 467–475, https://doi.org/10.1002/joc.4367, 2016.
Highwood, E.-J. and Stevenson, D. S.: Atmospheric impact of the 1783–1784 Laki Eruption: Part II Climatic effect of sulphate aerosol, Atmos. Chem. Phys., 3, 1177–1189, https://doi.org/10.5194/acp-3-1177-2003, 2003.
Hildebrandsson, H. H.: Sur le prétendu changement du climat européen en temps historiques, Nov. acta Regiae Soc. Sci. Ups., 4, 5, 1915.
Hill, B. T. and Jones, S. J.: The Newfoundland ice extent and the solar cycle from 1860 to 1988, J. Geophys. Res., 95, 5385, https://doi.org/10.1029/JC095iC04p05385, 1990.
Jevrejeva, S.: Severity of winter seasons in the northern Baltic Sea between 1529 to 1990: Reconstruction and analysis, Clim. Res., 17, 55–62, https://doi.org/10.3354/cr017055, 2001.
Kelso, C. and Vogel, C. H.: The climate of Namaqualand in the nineteenth century, Clim. Change, 83, 357–380, https://doi.org/10.1007/s10584-007-9264-1, 2007.
Koslowski, G. and Glaser, R.: Variations in reconstructed ice winter severity in the Western Baltic from 1501 to 1995, and their implications for the North Atlantic oscillation, Clim. Change, 41, 175–191, https://doi.org/10.1023/A:1005466226797, 1999.
Kripalani, R. H. and Kulkarni, A.: Climatic impact of El Niño/La Niña on the Indian monsoon: A new perspective, Weather, 52, 39–46, https://doi.org/10.1002/j.1477-8696.1997.tb06267.x, 1997.
Loader, N. J., Jalkanen, R., Mccarroll, D., and Moberg, A.: Spring temperature variability in northern Fennoscandia AD 1693-2011, J. Quat. Sci., 26, 566–570, https://doi.org/10.1002/jqs.1528, 2011.
Luterbacher, J., Dietrich, D., Xoplaki, E., Grosjean, M., and Wanner, H.: European Seasonal and Annual Temperature Variability, Trends, and Extremes since 1500, Science, 303, 1499–1503, https://doi.org/10.1126/science.1093877, 2004.
Luterbacher, J., Werner, J. P., Smerdon, J. E., Fernández-Donado, L., González-Rouco, F. J., Barriopedro, D., Ljungqvist, F. C., Büntgen, U., Zorita, E., Wagner, S., Esper, J., McCarroll, D., Toreti, A., Frank, D., Jungclaus, J. H., Barriendos, M., Bertolin, C., Bothe, O., Brázdil, R., Camuffo, D., Dobrovolný, P., Gagen, M., García-Bustamante, E., Ge, Q. S., Gómez-Navarro, J. J., Guiot, J., Hao, Z. X., Hegerl, G. C., Holmgren, K., Klimenko, V. V, Martín-Chivelet, J., Pfister, C., Roberts, N., Schindler, A., Schurer, A., Solomina, O., von Gunten, L., Wahl, E., Wanner, H., Wetter, O., Xoplaki, E., Yuan, N., Zanchettin, D., Zhang, H., and Zerefos, C.: European summer temperatures since Roman times, Environ. Res. Lett., 11, 024001, https://doi.org/10.1088/1748-9326/11/2/024001, 2016.
Magne, M. A.: Two Centuries of River Ice Dates in Hudson Bay Region from Historical Sources, MS thesis, University of Manitoba, https://mspace.lib.umanitoba.ca/xmlui/handle/1993/6660 (last access: 30 May 2022), 1981.
Magnuson, J. J., Robertson, D. M., Benson, B. J., Wynne, R. H., Livingstone, D. M., Arai, T., Assel, R. A., Barry, R. G., Card, V., Kuusisto, E., Granin, N. G., Prowse, T. D., Stewart, K. M., and Vuglinski, V. S.: Historical trends in lake and river ice cover in the Northern Hemisphere, Science, 289, 1743–1746, https://doi.org/10.1126/science.289.5485.1743, 2000.
Manley, G.: Central England temperatures: Monthly means 1659 to 1973, Q. J. R. Meteorol. Soc., 100, 389–405, https://doi.org/10.1002/qj.49710042511, 1974.
Mann, M. E., Zhang, Z., Hughes, M. K., Bradley, R. S., Miller, S. K., Rutherford, S., and Ni, F.: Proxy-based reconstructions of hemispheric and global surface temperature variations over the past two millennia, Proc. Natl. Acad. Sci., 105, 13252–13257, https://doi.org/10.1073/pnas.0805721105, 2008.
Mendoza, B., Jáuregui, E., Diaz-Sandoval, R., García-Acosta, V., Velasco, V., and Cordero, G.: Historical droughts in central Mexico and their relation with El Niño, J. Appl. Meteorol., 44, 709–716, https://doi.org/10.1175/JAM2210.1, 2005.
Mendoza, B., Velasco, V., and Jáuregui, E.: A Study of Historical Droughts in Southeastern Mexico, J. Clim., 19, 2916–2934, https://doi.org/10.1175/JCLI3726.1, 2006.
Mikami, T.: Climatic variations in Japan reconstructed from historical documents, Weather, 63, 190–193, https://doi.org/10.1002/wea.281, 2008.
Mougin, M.: Etudes glaciologiques en Savoie, in: Études Glaciologiques, 3, Imprimerie nationale, Savoie, Pyrénées, 1–113, https://www.persee.fr/doc/etgla_0983-6500_1912_num_3_1_852 (last access: 30 May 2022), 1912.
Nash, D. J. and Endfield, G. H.: A 19th century climate chronology for the Kalahari region of central southern Africa derived from missionary correspondence, Int. J. Climatol., 22, 821–841, https://doi.org/10.1002/joc.753, 2002.
Nash, D. J. and Endfield, G. H.: “Splendid rains have fallen”: Links between El Niño and rainfall variability in the Kalahari, 1840–1900, Clim. Change, 86, 257–290, https://doi.org/10.1007/s10584-007-9274-z, 2008.
Nash, D. J. and Grab, S. W.: “A sky of brass and burning winds”: Documentary evidence of rainfall variability in the Kingdom of Lesotho, Southern Africa, 1824–1900, Clim. Change, 101, 617–653, https://doi.org/10.1007/s10584-009-9707-y, 2010.
Nash, D. J., Pribyl, K., Klein, J., Neukom, R., Endfield, G. H., Adamson, G. C. D., and Kniveton, D. R.: Seasonal rainfall variability in southeast Africa during the nineteenth century reconstructed from documentary sources, Clim. Change, 134, 605–619, https://doi.org/10.1007/s10584-015-1550-8, 2016.
Nash, D. J., Klein, J., Endfield, G. H., Pribyl, K., Adamson, G. C. D., and Grab, S. W.: Narratives of nineteenth century drought in southern Africa in different historical source types, Clim. Change, 152, 467–485, https://doi.org/10.1007/s10584-018-2352-6, 2019.
Nash, D. J., Adamson, G. C. D., Ashcroft, L., Bauch, M., Camenisch, C., Degroot, D., Gergis, J., Jusopović, A., Labbé, T., Lin, K.-H. E., Nicholson, S. D., Pei, Q., del Rosario Prieto, M., Rack, U., Rojas, F., and White, S.: Climate indices in historical climate reconstructions: a global state of the art, Clim. Past, 17, 1273–1314, https://doi.org/10.5194/cp-17-1273-2021, 2021.
Neukom, R., Prieto, M. D. R., Moyano, R., Luterbacher, J., Pfister, C., Villalba, R., Jones, P. D., and Wanner, H.: An extended network of documentary data from South America and its potential for quantitative precipitation reconstructions back to the 16th century, Geophys. Res. Lett., 36, 1–5, https://doi.org/10.1029/2009GL038351, 2009.
Neukom, R., Nash, D. J., Endfield, G. H., Grab, S. W., Grove, C. A., Kelso, C., Vogel, C. H., and Zinke, J.: Multi-proxy summer and winter precipitation reconstruction for southern Africa over the last 200 years, Clim. Dyn., 42, 2713–2726, https://doi.org/10.1007/s00382-013-1886-6, 2014.
New York (State), Department of Agriculture: Dates of Opening and Closing of Navigation in the Hudson River at Albany, in: Fifth annual report of the meteorological bureau and weather service of the state of New York, New York (State). Department of Agriculture. Albany, 405, https://books.google.ch/books?id=WAYTAAAAYAAJ&pg=PA405&dq=Dates+of+Opening+and+Closing+of+Navigation+in+the+Hudson+River+at+Albany,&hl=en&sa=X&ved=2ahUKEwjv28ejior4AhWAg_0HHeprAmEQ6AF6BAgDEAI#v=onepage&q=Dates%20of%20Opening%20and%20Closing%20of%20Navigation%20in%20the%20Hudson%20River%20at%20Albany%2C&f=false, (last access: 30 May 2022), 1894.
Nicholson, S. E.: A semi-quantitative, regional precipitation data set for studying African climates of the nineteenth century, part I. Overview of the data set, Clim. Change, 50, 317–353, https://doi.org/10.1023/A:1010674724320, 2001.
Nicholson, S. E., Klotter, D., and Dezfuli, A. K.: Spatial reconstruction of semi-quantitative precipitation fields over Africa during the nineteenth century from documentary evidence and gauge data, Quat. Res. USA, 78, 13–23, https://doi.org/10.1016/j.yqres.2012.03.012, 2012.
Norrgård, S. and Helama, S.: Historical trends in spring ice breakup for the Aura River in Southwest Finland, AD 1749–2018, Holocene, 29, 953–963, https://doi.org/10.1177/0959683619831429, 2019.
Ogilvie, A. E. J.: The past climate and sea-ice record from Iceland, Part 1: Data to A.D. 1780, Clim. Change, 6, 131–152, https://doi.org/10.1007/BF00144609, 1984.
Ogilvie, A. E. J. and Jónsdóttir, I.: Sea Ice, Climate, and Icelandic Fisheries in the Eighteenth and Nineteenth Centuries, Arctic, 53, 383–394, https://doi.org/10.14430/arctic869, 2000.
Ouellet-Bernier, M.-M. and de Vernal, A.: Winter freeze-up and summer break-up in Nunatsiavut, Canada, from 1770 to 1910, Past Glob. Chang. Mag., 28, 52–53, https://doi.org/10.22498/pages.28.2.52, 2020.
Parker, D. E., Legg, T. P., and Folland, C. K.: A new daily central England temperature series, 1772–1991, Int. J. Climatol., 12, 317–342, https://doi.org/10.1002/joc.3370120402, 1992.
Pauling, A., Luterbacher, J., Casty, C., and Wanner, H.: Five hundred years of gridded high-resolution precipitation reconstructions over Europe and the connection to large-scale circulation, Clim. Dyn., 26, 387–405, https://doi.org/10.1007/s00382-005-0090-8, 2006.
Pfister, C., Brázdil, R., Glaser, R., Barriendos, M., Camuffo, D., Deutsch, M., Dobrovolný, P., Enzi, S., Guidoboni, E., Kotyza, O., Militzer, S., Rácz, L., and Rodrigo, F. S.: Documentary evidence on climate in sixteenth-century Europe, Clim. Change, 43, 55–110, https://doi.org/10.1023/A:1005540707792, 1999.
Pfister, C., Luterbacher, J., Wanner, H., Wheeler, D., Brázdil, R., Ge, Q., Hao, Z., Moberg, A., Grab, S., and Rosario Del Prieto, M.: Documentary evidence as climate proxies, Proxy-specific White Paper produced from the PAGES/CLIVAR workshop, in: PAGES, Trieste, 12 June 2008, 9–11, Bern, https://www.hist.unibe.ch/e11168/e52524/e69145/e186327/e188618/19_Pfister-al-Documentary-White_Paper_09_ger.pdf (last access: 30 May 2022), 2009.
Pfister, C., Rohr, C., and Jover, A. C. C.: Euro-Climhist: eine Datenplattform der Universität Bern zur Witterungs-, Klima- und Katastrophengeschichte, Wasser Energ. Luft, 109, 45–48, https://doi.org/10.7892/boris.97013, 2017.
Pfister, C., Brázdil, R., Luterbacher, J., Ogilvie, A. E. J., and White, S.: Early Modern Europe, in: The Palgrave Handbook of Climate History, 1st edn., edited by: White, S., Pfister, C., and Mauelshagen, F., Palgrave Macmillan UK, London, 265–295, https://doi.org/10.1057/978-1-137-43020-5_23, 2018.
Phipps, S. J., McGregor, H. V., Gergis, J., Gallant, A. J. E., Neukom, R., Stevenson, S., Ackerley, D., Brown, J. R., Fischer, M. J., and van Ommen, T. D.: Paleoclimate Data–Model Comparison and the Role of Climate Forcings over the Past 1500 Years, J. Clim., 26, 6915–6936, https://doi.org/10.1175/JCLI-D-12-00108.1, 2013.
Popper, W.: The Cairo Nilometer; Studies in Ibn Taghrī Birdī's Chronicles of Egypt: I., University of California Press, Berkeley and Los Angeles, 1951.
Prieto, M. del R. and García Herrera, R.: Documentary sources from South America: Potential for climate reconstruction, Palaeogeogr. Palaeoclimatol. Palaeoecol., 281, 196–209, https://doi.org/10.1016/j.palaeo.2008.07.026, 2009.
Prieto, M. del R. and Rojas, F.: Climate History in Latin America, in: The Palgrave Handbook of Climate History, 1st edn., edited by: White, S., Pfister, C., and Mauelshagen, F., Palgrave Macmillan UK, London, 213–224, https://doi.org/10.1057/978-1-137-43020-5_19, 2018.
Qian, W., Shan, X., Chen, D., Zhu, C., and Zhu, Y.: Droughts near the northern fringe of the East Asian summer monsoon in China during 1470–2003, Clim. Change, 110, 373–383, https://doi.org/10.1007/s10584-011-0096-7, 2012.
Rampino, M. R., Thordarson, T., and Self, S.: A new volcanism/climate connection: Tropospheric SO2 greenhouse effect from the Laki (Iceland) 1783 fissure eruption, in: IUGG XXI General Assembly of the IUGG, Boulder, Colorado, 2–14 July 1995, p. 278, 1995.
Reichen, L., Burgdorf, A. M., Brönnimann, S., Franke, J., Hand, R., Valler, V., Samakinwa, E., Brugnara, Y., and Rutishauser, T.: A decade of cold Eurasian winters reconstructed for the early 19th century, Nat. Commun., 13, 1–9, https://doi.org/10.1038/s41467-022-29677-8, 2022.
Ribera, P., García-Herrera, R., and Gimeno, L.: Historical deadly typhoons in the Philippines, Weather, 63, 194–199, https://doi.org/10.1002/wea.275, 2008.
Riemann, D., Glaser, R., Kahle, M., and Vogt, S.: The CRE tambora.org – new data and tools for collaborative research in climate and environmental history, Geosci. Data J., 2, 63–77, https://doi.org/10.1002/gdj3.30, 2015.
Rodrigo, F. S. and Barriendos, M.: Reconstruction of seasonal and annual rainfall variability in the Iberian peninsula (16th–20th centuries) from documentary data, Glob. Planet. Change, 63, 243–257, https://doi.org/10.1016/j.gloplacha.2007.09.004, 2008.
Rohr, C., Camenisch, C., and Pribyl, K.: European Middle Ages, in The Palgrave Handbook of Climate History, 1st edn., edited by: White, S., Pfister, C., and Mauelshagen, F., Palgrave Macmillan UK, London, 247–263, https://doi.org/10.1057/978-1-137-43020-5_22, 2018.
Rutherford, S., Mann, M. E., Osborn, T. J., Briffa, K. R., Jones, P. D., Bradley, R. S., and Hughes, M. K.: Proxy-Based Northern Hemisphere Surface Temperature Reconstructions: Sensitivity to Method, Predictor Network, Target Season, and Target Domain, J. Clim., 18, 2308–2329, https://doi.org/10.1175/JCLI3351.1, 2005.
Rykachev, M.: Openings and freezings of rivers in the Russian Empire,  , https://elib.rgo.ru/safe-view/123456789/231623/
(last access: 30 May 2022), 1886.
, https://elib.rgo.ru/safe-view/123456789/231623/
(last access: 30 May 2022), 1886.
Saha, S., Moorthi, S., Pan, H.-L., Wu, X., Wang, J., Nadiga, S., Tripp, P., Kistler, R., Woollen, J., Behringer, D., Liu, H., Stokes, D., Grumbine, R., Gayno, G., Wang, J., Hou, Y.-T., Chuang, H., Juang, H.-M. H., Sela, J., Iredell, M., Treadon, R., Kleist, D., Van Delst, P., Keyser, D., Derber, J., Ek, M., Meng, J., Wei, H., Yang, R., Lord, S., van den Dool, H., Kumar, A., Wang, W., Long, C., Chelliah, M., Xue, Y., Huang, B., Schemm, J.-K., Ebisuzaki, W., Lin, R., Xie, P., Chen, M., Zhou, S., Higgins, W., Zou, C.-Z., Liu, Q., Chen, Y., Han, Y., Cucurull, L., Reynolds, R. W., Rutledge, G., and Goldberg, M.: The NCEP Climate Forecast System Reanalysis, Bull. Am. Meteorol. Soc., 91, 1015–1058, https://doi.org/10.1175/2010BAMS3001.1, 2010.
Schmith, T. and Hansen, C.: Fram Strait Ice Export during the Nineteenth and Twentieth Centuries Reconstructed from a Multiyear Sea Ice Index from Southwestern Greenland, J. Clim., 16, 2782–2791, https://doi.org/10.1175/1520-0442(2003)016<2782:FSIEDT>2.0.CO;2, 2003.
Seinä, A. and Palosuo, E.: The classification of the maximum annual extent of ice cover in the Baltic Sea 1720–1995, MERI-Report, Ser. Finnish Inst. Mar. Res., 27, 79–91, https://www.researchgate.net/publication/247811150_The_classification_of_the_maximum_annual_extent_of_ice_cover_in_the_Baltic_Sea_1720-1995/references (last access: 30 May 2022), 2006.
Shabalova, M. V. and van Engelen, A.: Evaluation of a reconstruction of winter and summer temperatures in the Low Countries, AD 764–1998, Clim. Change, 58, 219–242, https://doi.org/10.1023/A:1023474032539, 2003.
Shen, C., Wang, W. C., Gong, W., and Hao, Z. X.: A Pacific Decadal Oscillation record since 1470 AD reconstructed from proxy data of summer rainfall over eastern China, Geophys. Res. Lett., 33, 1–4, https://doi.org/10.1029/2005GL024804, 2006.
Shen, C., Wang, W.-C., Hao, Z., and Gong, W.: Characteristics of anomalous precipitation events over eastern China during the past five centuries, Clim. Dyn., 31, 463–476, https://doi.org/10.1007/s00382-007-0323-0, 2008.
Shipman, T. G.: Ice-conditions on the Mississippi River at Davenport, Iowa, Northwest Sci., 12, 590–594, https://doi.org/10.1029/TR019i002p00590-2, 1938.
Shostakovich, V. B.: Opening and freezing of waters of Asian Russia, ![]()
![]() , https://www.prlib.ru/en/node/686713 (last access: 30 May 2022), 1909.
, https://www.prlib.ru/en/node/686713 (last access: 30 May 2022), 1909.
Sigl, M., Winstrup, M., McConnell, J. R., Welten, K. C., Plunkett, G., Ludlow, F., Büntgen, U., Caffee, M., Chellman, N., Dahl-Jensen, D., Fischer, H., Kipfstuhl, S., Kostick, C., Maselli, O. J., Mekhaldi, F., Mulvaney, R., Muscheler, R., Pasteris, D. R., Pilcher, J. R., Salzer, M., Schüpbach, S., Steffensen, J. P., Vinther, B. M., and Woodruff, T. E.: Timing and climate forcing of volcanic eruptions for the past 2,500 years, Nature, 523, 543–549, https://doi.org/10.1038/nature14565, 2015.
Sigurdsson, H.: Volcanic pollution and climate: The 1783 Laki eruption, Eos, Trans. Am. Geophys. Union, 63, 601–602, https://doi.org/10.1029/EO063i032p00601, 1982.
Singh, D., Seager, R., Cook, B. I., Cane, M. A., Ting, M., Cook, E., and Davis, M.: Climate and the Global Famine of 1876–78, J. Clim., 31, 9445–9467, https://doi.org/10.1175/JCLI-D-18-0159.1, 2018.
Slivinski, L. C., Compo, G. P., Whitaker, J. S., Sardeshmukh, P. D., Giese, B. S., McColl, C., Allan, R., Yin, X., Vose, R., Titchner, H., Kennedy, J., Spencer, L. J., Ashcroft, L., Brönnimann, S., Brunet, M., Camuffo, D., Cornes, R., Cram, T. A., Crouthamel, R., Domínguez-Castro, F., Freeman, J. E., Gergis, J., Hawkins, E., Jones, P. D., Jourdain, S., Kaplan, A., Kubota, H., Blancq, F. Le, Lee, T. C., Lorrey, A., Luterbacher, J., Maugeri, M., Mock, C. J., Moore, G. W. K., Przybylak, R., Pudmenzky, C., Reason, C., Slonosky, V. C., Smith, C. A., Tinz, B., Trewin, B., Valente, M. A., Wang, X. L., Wilkinson, C., Wood, K., and Wyszyński, P.: Towards a more reliable historical reanalysis: Improvements for version 3 of the Twentieth Century Reanalysis system, Q. J. R. Meteorol. Soc., 145, 2876–2908, https://doi.org/10.1002/qj.3598, 2019 (data available at: https://portal.nersc.gov/project/20C_Reanalysis/, last access: 30 May 2022).
Song, J.: Changes in dryness/wetness in China during the last 529 years, Int. J. Climatol., 20, 1003–1016, https://doi.org/10.1002/1097-0088(200007)20:9<1003::AID-JOC529>3.0.CO;2-S, 2000.
Takács, K., Kern, Z., and Pásztor, L.: Long-term ice phenology records from eastern–central Europe, Earth Syst. Sci. Data, 10, 391–404, https://doi.org/10.5194/essd-10-391-2018, 2018.
Teillet, J. V.: A Reconstruction of Summer Sea lce Conditions in the Labrador Sea Using Hudson's Bay Company Ships' Log-Books, 1751 to 1870, MS thesis, University of Manitoba, https://mspace.lib.umanitoba.ca/handle/1993/7175?show=full (last access: 30 May 2022), 1988.
Telelis, I. G.: Climatic Fluctuations in the Eastern Mediterranean and the Middle East AD 300–1500 from Byzantine Documentary and Proxy Physical Paleoclimatic Evidence – A Comparison, Jahrb. der Österreichischen Byzantinistik, 58, 167–208, https://doi.org/10.1553/joeb58s167, 2008.
Thordarson, T. and Self, S.: Atmospheric and environmental effects of the 1783-1784 Laki eruption: A review and reassessment, J. Geophys. Res.-Atmos., 108, 4011, https://doi.org/10.1029/2001jd002042, 2003.
Toohey, M. and Sigl, M.: Volcanic stratospheric sulfur injections and aerosol optical depth from 500 BCE to 1900 CE, Earth Syst. Sci. Data, 9, 809–831, https://doi.org/10.5194/essd-9-809-2017, 2017.
Valler, V., Franke, J., Brugnara, Y., and Brönnimann, S.: An updated global atmospheric paleo-reanalysis covering the last 400 years, Geosci. Data J., 00, 1–19, https://doi.org/10.1002/gdj3.121, 2021.
Veale, L., Endfield, G., Davies, S., Macdonald, N., Naylor, S., Royer, M.-J., Bowen, J., Tyler-Jones, R., and Jones, C.: Dealing with the deluge of historical weather data: the example of the TEMPEST database, GEO Geogr. Environ., 4, e00039, https://doi.org/10.1002/geo2.39, 2017.
Vogel, C. H.: A documentary-derived climatic chronology for South Africa, 1820–1900, Clim. Change, 14, 291–307, https://doi.org/10.1007/BF00134967, 1989.
Wang, P. K. and Zhang, D.: An Introduction to Some Historical Governmental Weather Records of China, Bull. Am. Meteorol. Soc., 69, 753–758, https://doi.org/10.1175/1520-0477(1988)069<0753:AITSHG>2.0.CO;2, 1988.
Wang, P. K., Lin, K.-H. E., Liao, Y.-C., Liao, H.-M., Lin, Y.-S., Hsu, C.-T., Hsu, S.-M., Wan, C.-W., Lee, S.-Y., Fan, I.-C., Tan, P.-H., and Ting, T.-T.: Construction of the REACHES climate database based on historical documents of China, Sci. Data, 5, 180288, https://doi.org/10.1038/sdata.2018.288, 2018.
Wang, R. S. and Wang, S. W.: Reconstruction of Winter Temperature in Eastern China during the Past 500 Years Using Historical Documents, Acta Meteorol. Sin., 48, 180–189, 1990.
Wang, S. and Gong., D.: Climate in China during the Four Special Periods in Holocene, Prog. Nat. Sci., 10, 379–386, 2000.
Wang, S. W., Ye, J.-L., and Gong, D.-Y.: Climate in China during the Little Ice Age, Quat. Sci., 1, 54–64, 1998.
White, S.: North American Climate History (1500–1800), in: The Palgrave Handbook of Climate History, 1st edn., edited by: White, S., Pfister, C., and Mauelshagen, F., Palgrave Macmillan UK, London, 297–308, https://doi.org/10.1057/978-1-137-43020-5_24, 2018.
White, S., Pfister, C., and Mauelshagen, F. (Eds.): The Palgrave Handbook of Climate History, 1st edn., Palgrave Macmillan UK, London, https://doi.org/10.1057/978-1-137-43020-5, 2018.
Wilson, R., Anchukaitis, K., Briffa, K. R., Büntgen, U., Cook, E., D'Arrigo, R., Davi, N., Esper, J., Frank, D., Gunnarson, B., Hegerl, G., Helama, S., Klesse, S., Krusic, P. J., Linderholm, H. W., Myglan, V., Osborn, T. J., Rydval, M., Schneider, L., Schurer, A., Wiles, G., Zhang, P., and Zorita, E.: Last millennium northern hemisphere summer temperatures from tree rings: Part I: The long term context, Quat. Sci. Rev., 134, 1–18, https://doi.org/10.1016/j.quascirev.2015.12.005, 2016.
Wood, C. A.: Climatic effects of the 1783 Laki eruption, in: The Year Without a Summer? Climte in 1816, edited by: Harington, C. R., Canadian Museum of Nature, Ottawa, 58–77, https://archive.org/details/yearwithoutsumme1992hari (last access: 30 May 2022), 1992.
Xoplaki, E., Maheras, P., and Luterbacher, J.: Variability of Climate in Meridional Balkans during the Periods 1675–1715 and 1780–1830 and its Impact on Human Life, Clim. Change, 48, 581–615, https://doi.org/10.1023/A:1005616424463, 2001.
Xoplaki, E., Luterbacher, J., Paeth, H., Dietrich, D., Steiner, N., Grosjean, M., and Wanner, H.: European spring and autumn temperature variability and change of extremes over the last half millennium, Geophys. Res. Lett., 32, L15713, https://doi.org/10.1029/2005GL023424, 2005.
Xoplaki, E., Luterbacher, J., Wagner, S., Zorita, E., Fleitmann, D., Preiser-Kapeller, J., Sargent, A. M., White, S., Toreti, A., Haldon, J. F., Mordechai, L., Bozkurt, D., Akçer-Ön, S., and Izdebski, A.: Modelling Climate and Societal Resilience in the Eastern Mediterranean in the Last Millennium, Hum. Ecol., 46, 363–379, https://doi.org/10.1007/s10745-018-9995-9, 2018.
Zambri, B., Robock, A., Mills, M. J., and Schmidt, A.: Modeling the 1783–1784 Laki Eruption in Iceland: 2. Climate Impacts, J. Geophys. Res.-Atmos., 124, 6770–6790, https://doi.org/10.1029/2018JD029554, 2019.
Zhang, D.: Winter Temperature Changes during the Last 500 Years in South China, Chinese Sci. Bull., 25, 497–500, 1980.
Zhang, D.: A Compendium of Chinese Meteorological Records of the Last 3000 Years, 1st edn., Phonenix Publishing House, Nanjing, 2004.
Zhang, D.: A Compendium of Chinese Meteorological Records of the Last 3000 Years, 2nd edn., Phoenix House Ltd, Jiangsu, 2013.
Zhang, P. Y.: Climate Change in China during Historical Times, Shandong Science & Technology Press, Jinan, 1996.
Zheng, J. and Zheng, S.: An analysis on cold/warm and dry/wet in Shandong Province during historical times, Acta Geogr. Sin., 48, 348–357, 1993.
Zheng, J., Zhang, P., Ge, Q., and Man, Z.: Centennial changes of drought/flood spatial pattern in eastern China for the last 2000 years, Prog. Nat. Sci., 11, 285–287, 2001.
Zheng, J., Hao, Z. X., and Ge, Q.: Variation of precipitation for the last 300 years over the middle and lower reaches of the Yellow River, Sci. China Ser. D, 48, 2182, https://doi.org/10.1360/03yd0392, 2005.
Zheng, J., Wang, W. C., Ge, Q., Man, Z., and Zhang, P.: Precipitation variability and extreme events in eastern China during the past 1500 years, Terr. Atmos. Ocean. Sci., 17, 579–592, https://doi.org/10.3319/TAO.2006.17.3.579(A), 2006.
Zheng, J., Ding, L., Hao, Z., and Ge, Q.: Extreme cold winter events in southern China during AD 1650-2000, Boreas, 41, 1–12, https://doi.org/10.1111/j.1502-3885.2011.00225.x, 2012.
Zhou, Q., Zhang, P., and Wang, Z.: Reconstruction of annual winter mean temperature series in Hefei area during 1736–1991 AD., Acta Geogr. Sin., 49, 332–37, 1994.