the Creative Commons Attribution 4.0 License.
the Creative Commons Attribution 4.0 License.
 | 01 Jun 2022
Plio-Pleistocene Perth Basin water temperatures and Leeuwin Current dynamics (Indian Ocean) derived from oxygen and clumped-isotope paleothermometry
David De Vleeschouwer
Marion Peral
Marta Marchegiano
Angelina Füllberg
Niklas Meinicke
Heiko Pälike
Gerald Auer
Benjamin Petrick
Christophe Snoeck
Steven Goderis
Philippe Claeys
The Pliocene sedimentary record provides a window into Earth's climate dynamics under warmer-than-present boundary conditions. However, the Pliocene cannot be considered a stable warm climate that constitutes a solid baseline for middle-of-the-road future climate projections. The increasing availability of time-continuous sedimentary archives (e.g., marine sediment cores) reveals complex temporal and spatial patterns of Pliocene ocean and climate variability on astronomical timescales. The Perth Basin is particularly interesting in that respect because it remains unclear if and how the Leeuwin Current sustained the comparably wet Pliocene climate in Western Australia, as well as how it influenced Southern Hemisphere paleoclimate variability. To constrain Leeuwin Current dynamics in time and space, this project obtained eight clumped-isotope Δ47 paleotemperatures and constructed a new orbitally resolved planktonic foraminifera (Trilobatus sacculifer) stable isotope record (δ18O) for the Plio-Pleistocene (4–2 Ma) interval of International Ocean Discovery Program (IODP) Site U1459. These new data complement an existing TEX86 record from the same site and similar planktonic isotope records from the Northern Carnarvon Basin (Ocean Drilling Program (ODP) Site 763 and IODP Site U1463). The comparison of TEX86 and Δ47 paleothermometers reveals that TEX86 likely reflects sea surface temperatures (SSTs) with a seasonal warm bias (23.8–28.9 ∘C), whereas T. sacculifer Δ47 calcification temperatures probably echo mixed-layer temperatures at the studied Site U1459 (18.9–23.2 ∘C). The isotopic δ18O gradient along a 19–29∘ S latitudinal transect, between 3.9 and 2.2 Ma, displays large variability, ranging between 0.5 ‰ and 2.0 ‰. We use the latitudinal δ18O gradient as a proxy for Leeuwin Current strength, with an inverse relationship between both. The new results challenge the interpretation that suggested a tectonic event in the Indonesian Throughflow as the cause for the rapid steepening of the isotopic gradient (0.9 ‰ to 1.5 ‰) around 3.7 Ma. The tectonic interpretation appears obsolete as it is now clear that the 3.7 Ma steepening of the isotopic gradient is intermittent, with flat latitudinal gradients (∼0.5 ‰) restored in the latest Pliocene (2.9–2.6 Ma). Still, the new analysis affirms that a combination of astronomical forcing of wind patterns and eustatic sea level controlled Leeuwin Current intensity. On secular timescales, a period of relatively weak Leeuwin Current is observed between 3.7 and 3.1 Ma. Notably, this interval is marked by cooler conditions throughout the Southern Hemisphere. In conclusion, the intensity of the Leeuwin Current and the latitudinal position of the subtropical front are both long-range effects of the same forcing: heat transport through the Indonesian Throughflow (ITF) valve and its propagation through Indian Ocean poleward heat transport. The common ITF forcing explains the observed coherence of Southern Hemisphere ocean and climate records.
- Article
(9236 KB) - Full-text XML
- BibTeX
- EndNote


Arid climates reign in large portions of the Australian continent, yet along the coastlines, the habitability of the Australian continent is often facilitated by moisture transport, associated with the many boundary currents surrounding the continent. The Leeuwin Current is one of those boundary currents, flowing southward along the Northwest Shelf of Australia (NWS), across the Carnarvon and Perth basins, ultimately rounding Cape Leeuwin to flow further east into the Great Australian Bight. Leeuwin Current intensity varies throughout the year, with strongest flow in austral winter when the latitudinal steric height gradient is steepest (Fig. 1) (Cresswell and Peterson, 2009; Waite et al., 2007; Godfrey and Ridgway, 1985; Ridgway and Godfrey, 2015; Church et al., 1989; Pearce, 1991). Thereby, the Leeuwin Current causes thermocline deepening, while also acting as a moisture and heat source for the Mediterranean-like climate around Perth, characterized by wet and mild winters. Throughout the Neogene, rainfall patterns in Western Australia experienced severe regime shifts on million-year timescales. Groeneveld et al. (2017) describe an extremely arid middle Miocene based on sabkha-like sediments found on the Northwest Shelf of Australia. Tagliaro et al. (2018) corroborate this climate interpretation by proposing sea level fall and regional aridity as causes for Miocene karst in the Northern Carnarvon Basin. Throughout the late Miocene, a northward shift of the westerlies allowed for a progressive increase in precipitation in southwest Australia (Groeneveld et al., 2017). At the same time, the siliciclastic Bare Formation was deposited on the NWS in a phase of deltaic margin progradation, thus correlating with increasing humidity in the northwest Australian hinterland (Tagliaro et al., 2018). By the latest Miocene and throughout most of the Pliocene, Western Australia was entirely governed by a wet or seasonally wet climate, i.e., the so-called “Humid Interval” (Christensen et al., 2017; Karatsolis et al., 2020). The switch from an arid Miocene to a wet Pliocene is also reflected in fossil pollen records from southern Australia (Sniderman et al., 2016). Finally, in the late Pliocene and early Pleistocene, climate transitioned back towards a more arid and more seasonal precipitation regime, albeit with important glacial–interglacial variability and more humid conditions during interglacials (Stuut et al., 2019; Fujioka et al., 2009; Stuut et al., 2014; Kuhnt et al., 2015; Gallagher et al., 2014; Dodson and Macphail, 2004; Dodson and Ramrath, 2001; He and Wang, 2021). The Late Pliocene aridification of Australia promoted C4 over C3 photosynthesis and probably constitutes the underlying reason for the late C4 expansion in Australia, compared to other continents (Andrae et al., 2018).
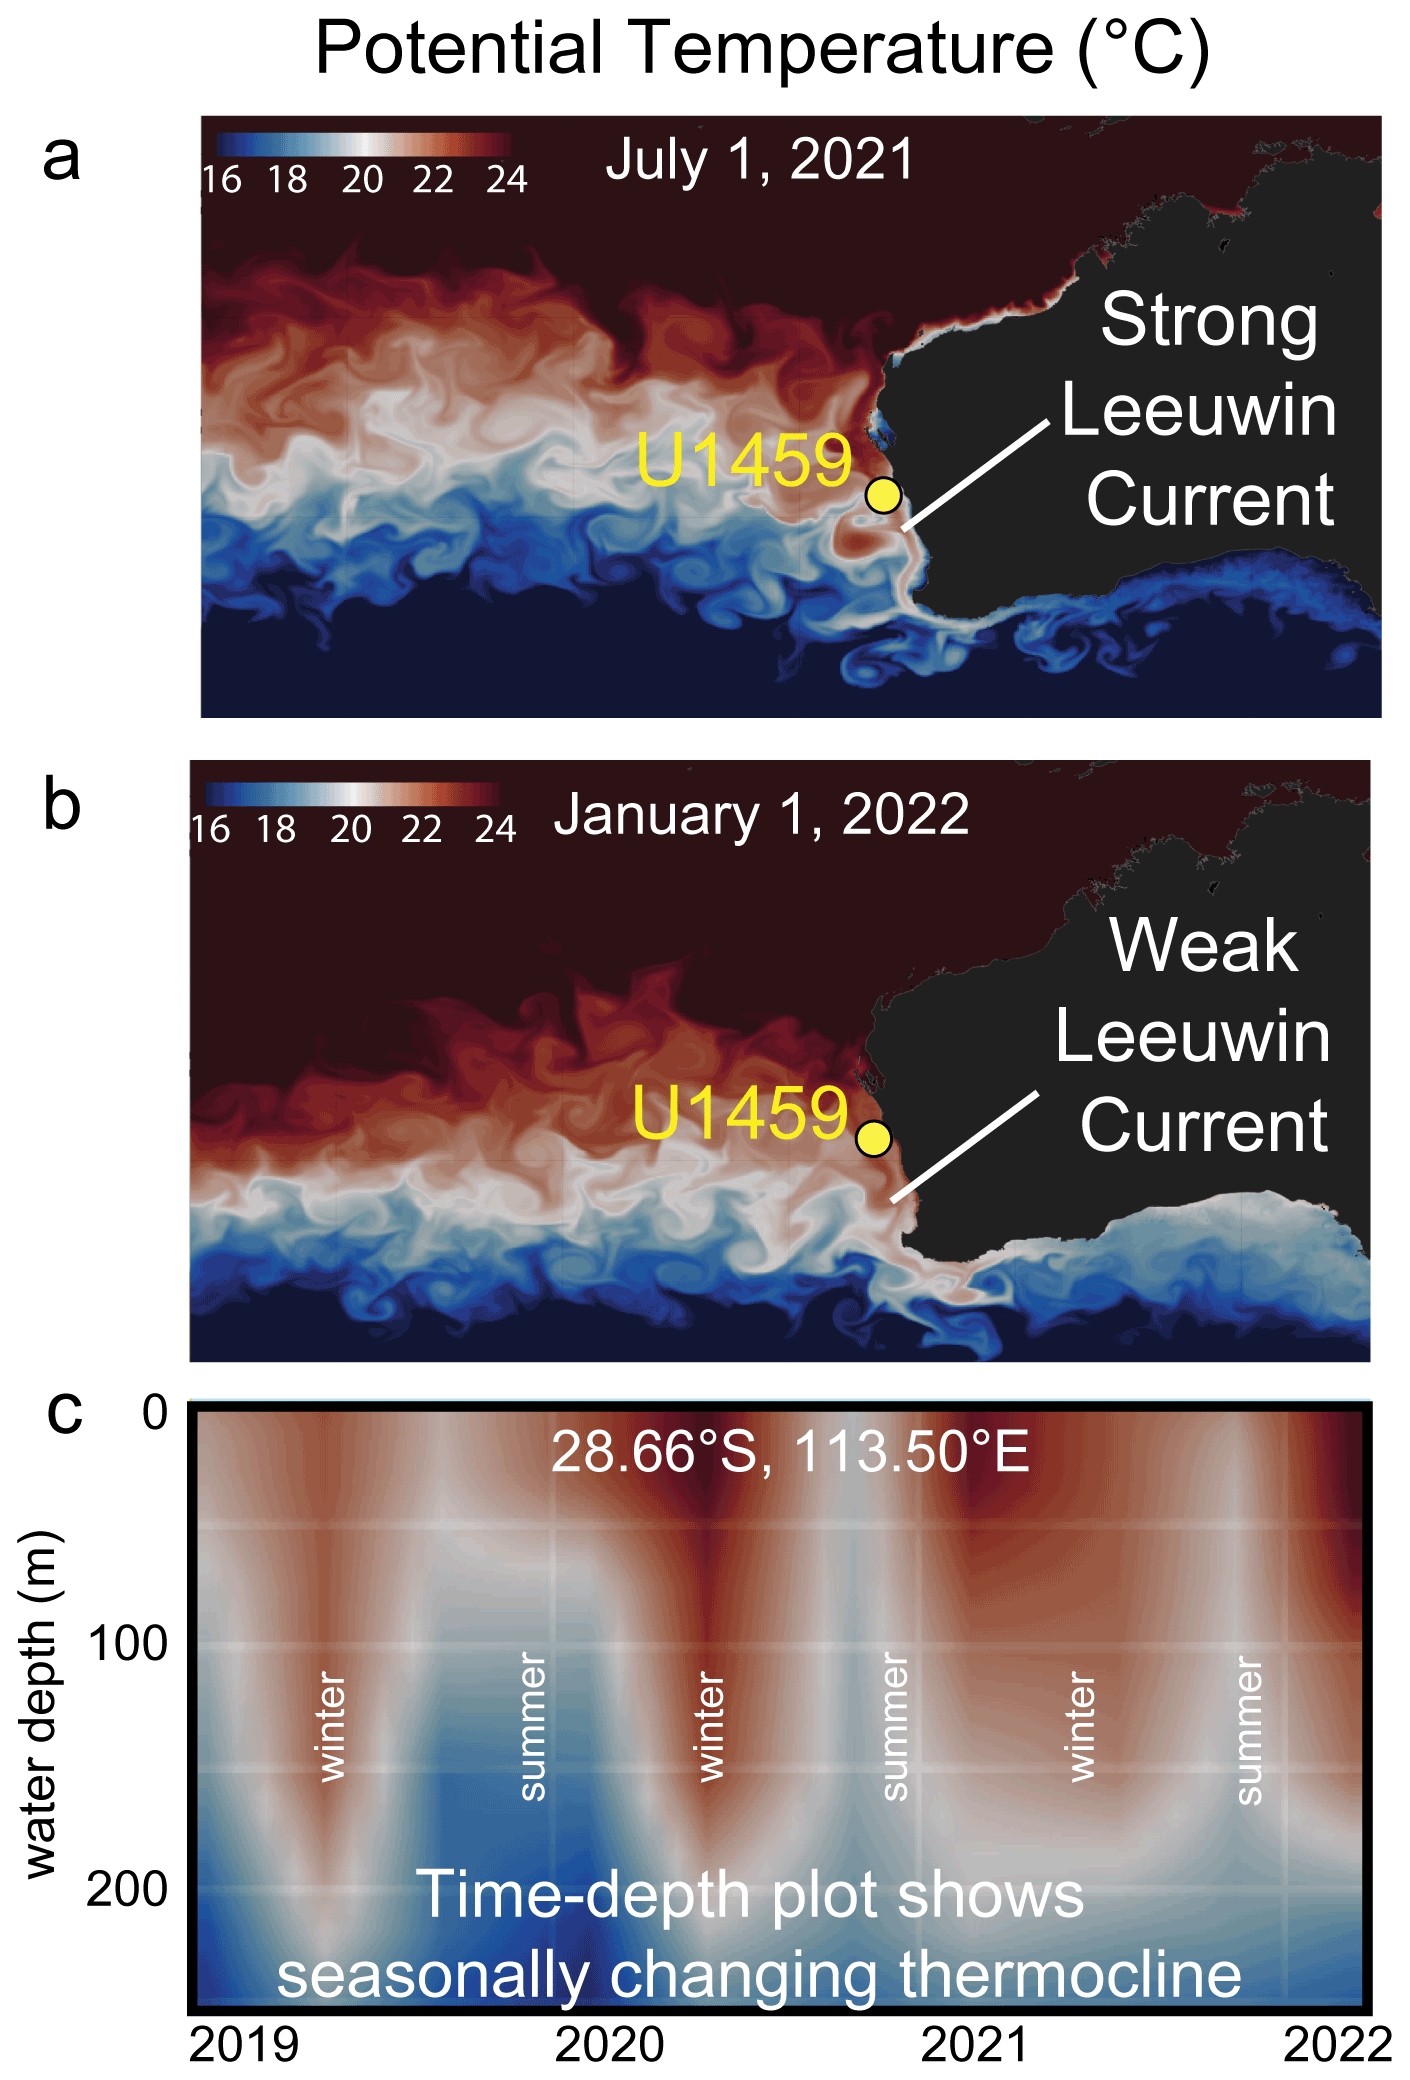
Figure 1Present-day oceanography of the eastern Indian Ocean. The southward flowing Leeuwin Current is strongest in late autumn and winter. During that season, the Leeuwin Current generates large eddies, causing significant deepening of the mixed layer (down to ∼200 m) and facilitating enhanced primary productivity (also see Fig. B1). During austral summer, the Leeuwin Current is weaker, with a corresponding thinner mixed layer and reduced productivity. (a) Sea surface temperature on 1 July 2021 (austral winter). (b) Sea surface temperature on 1 January 2022 (austral summer). (c) Time–depth potential temperature plot for the Site U1459 locality. Sea surface temperatures vary seasonally between 20 and 24 ∘C. Figures were generated using EU Copernicus Marine Service Information with data from GLOBAL_ANALYSIS_FORECAST_PHY_001_024 (Zammit-Mangion and Wikle, 2020).
While the million-year-scale Neogene hydroclimate evolution of Western Australia is relatively well constrained and substantiated by multiple lines of evidence, important open questions remain regarding the temporal and causal relationships between Australian hydroclimate evolution and Leeuwin Current dynamics. Cane and Molnar (2001) hypothesize that east African aridification at 3–4 Ma was caused by Indonesian Throughflow (ITF) restriction, assuming a switch in the source of surface flow through the Indonesian seaway from South to North Pacific waters. This publication triggered an increased research interest in the causal relationship between Indo-Pacific paleoceanography and paleoclimate change. Karas et al. (2009) supports this hypothesis but points out that the switch likely took place at the subsurface level rather than at the surface. Using a general circulation model, Krebs et al. (2011) links the end of the “Humid Interval” and the observed Late Pliocene desertification of Australia to a reduction in ITF transport. In the same year, Karas et al. (2011a) were the first to explicitly link the Late Pliocene aridification of Western Australia to Leeuwin Current weakening in response to a reduced ITF. In 2015, International Ocean Discovery Program (IODP) Expedition 356 “Indonesian Throughflow” cored seven sites along Australia's western margin and obtained long, time-continuous sediment sequences that have been used to chart Pliocene-to-recent Leeuwin Current dynamics on astronomical timescales and to link those dynamics to the climate evolution of Western Australia. Auer et al. (2019) and De Vleeschouwer et al. (2018b, 2019b) focus on Late Pliocene glacial–interglacial variability around Marine Isotope Stage M2 (MIS M2, 3.3 Ma) and suggest that Pliocene aridity is punctuated during glacials when the Leeuwin Current was relatively weak. Contrary to this, during strong interglacials, winter aridity in northwest Australia is alleviated by a more active Leeuwin Current, which acts as a moisture source. Organic geochemistry TEX86 studies reveal three important sea surface temperature (SST) cooling steps at sites under the influence of the Leeuwin Current at 3.3–3.1, 1.7–1.5, and 0.65 Ma (Smith et al., 2020; Petrick et al., 2019). These authors interpreted the cooling steps to result from a progressive weakening of the Leeuwin Current in response to ITF constriction, at least during glacial periods. This interpretation neatly accords with the gradual aridification of Western Australia during this period. Nevertheless, He et al. (2021) challenge this paradigm: they use zonal and meridional intersite temperature gradients and productivity reconstructions to postulate that the Leeuwin Current became stronger – not weaker – after the Mid-Pleistocene Transition. These authors interpret their TEX86 records as a subsurface signal though, and further work is needed to test the He et al. (2021) interpretation. First, the increasing discrepancies between and TEX86 at their studied Site U1461 over the last 1 Myr needs to be clarified, and the lack of correlation between their records and the benthic isotope stack needs to be explained.
On glacial–interglacial timescales, the Pleistocene behavior of the Leeuwin Current is comparable to that of the Pliocene, as it oscillates between two contrasting states. Interglacials were characterized by a stronger Leeuwin Current as higher eustatic sea levels allow for better connected shallow ITF pathways, for example, sourcing the Leeuwin Current over a flooded Sahul Shelf in northern Australia. Contrary, glacials were marked by shelf exposure along the coast of Western Australia, reduced ITF volume, and a stronger West Australian Current flowing opposite to the Leeuwin Current, all contributing to a weakening of the Leeuwin Current (Spooner et al., 2011; Wyrwoll et al., 2009; Petrick et al., 2019). Auer et al. (2021) refine this picture: a glacial sea level drop exceeding −45 m would expose the Sahul Shelf and cut off the Leeuwin Current from an important shallow-water source area. A weaker Leeuwin Current, in turn, would allow for the upwelling of sub-Antarctic Mode Water onto the Australian shelf and ultimately enhanced organic carbon burial. The coupling between Leeuwin Current intensity and glacial eustasy has been established by De Vleeschouwer et al. (2019b), using planktonic δ18O gradients along the Leeuwin Current pathway (19–29∘ S) as an inverse proxy for the Leeuwin Current strength: a steep latitudinal gradient is observed when the Leeuwin Current is weak during glacials, and vice versa during interglacials (De Vleeschouwer et al., 2019b). However, the modeling results displayed in Fig. 2 suggest quite the opposite. When the Pliocene glacial simulation “Large M2” (Fig. 2b; Dolan et al., 2015) is compared to the warm-orbit Pliocene simulation “PlioMax” (Fig. 2a; Prescott et al., 2018), glacial cooling in the Carnarvon Basin seems to be more severe than in the Perth Basin (Fig. 2c). This pattern implies a flatter SST gradient during glacials compared to interglacials and is thus the exact opposite of what is observed in proxy data. In this case, it is likely that these model simulations misrepresent past ocean dynamics because they do not consider the effects of shelf exposure and a sea-level-induced reduction in shallow-water ITF transport. Indeed, relative sea level plays an important role in feeding and directing the Leeuwin Current, with proxy data evidencing that Leeuwin Current intensity is sensitive to small changes in boundary conditions.

Figure 2Pliocene modeled SSTs. (a) Warm Pliocene simulation “PlioMax” for Marine Isotope Stage (MIS) K1 (3.06 Ma orbit and 405 ppm CO2; Prescott et al., 2018). (b) Cold Pliocene simulation “Large M2” for MIS M2 (3.30 Ma orbit and 280 ppm CO2; Dolan et al., 2015). (c) The SST difference between the cold and warm Pliocene simulations suggests a reduction of the latitudinal SST gradient along the Leeuwin Current (LC) pathway during glacials. This modeling result does not match proxy results. Paleoceanographic proxy data from De Vleeschouwer et al. (2019b) suggest a steeper SST gradient along the LC pathway during glacials compared to interglacials. This misrepresentation in the model likely occurs because these particular models do not consider the effects of shelf exposure and a sea-level-induced reduction in shallow-water ITF transport. Both processes are crucial in understanding climate and ocean dynamics on secular and astronomical timescales. NEC is the North Equatorial Current. SEC is the South Equatorial Current. WAC is the West Australian Current.
This paper evaluates the driving factors of Leeuwin Current intensity on astronomical timescales by extending the approach to calculate planktonic δ18O gradients along the Leeuwin Current pathway across the Plio-Pleistocene boundary. Moreover, it compares TEX86 and clumped-isotope paleothermometers at IODP Site U1459 to constrain absolute temperatures (and eventually heat transport) throughout the Plio-Pleistocene. Both paleothermometers have their pitfalls: the origin of the TEX86 signal is still debated, while the 13C18O16O isotopologue is so uncommon that clumped-isotope paleothermometry still deals with large uncertainties. Per contra, the uncertainty on clumped-isotope measurements is largely random, and therefore averaged measurements provide meaningful results, even when error bars are wide. This makes clumped-isotope paleotemperatures a useful benchmark for comparisons with proxies that potentially face systematic biases (e.g., TEX86). By comparing different ocean temperature reconstructions, our ambition is to obtain a better understanding of the links between Leeuwin Current dynamics and the climate evolution of the Southern Hemisphere.
2.1 IODP Site U1459 (Perth Basin)
IODP Site U1459 (192 m water depth) lies in the northern part of the Perth Basin and is the southernmost site drilled in the IODP Expedition 356 latitudinal transect (Figs. 1, 2). The main objective of drilling Site U1459 was to obtain insight into the pre-Quaternary history of the Houtman Abrolhos reef complex and Leeuwin Current. In this work, the portion of Site U1459 between 55.65 and 106.41 m composite depth (mcd) is studied, which corresponds to lithostratigraphic Units III and IV in Gallagher et al. (2017). Unit IV is an unlithified, cream to light brown packstone, ascribed to an outer shelf to upper bathyal area. Unit III is an alternatingly light gray – greenish-gray unlithified to partially lithified packstone to grainstone. Compared to Unit IV, Unit III is defined by a marked increase in glauconite content and bioclasts (benthic foraminifera, bivalves, echinoderms, bryozoans, and gastropods). Benthic foraminifera assemblages ascribe Unit III to a middle to outer shelf environment.
De Vleeschouwer et al. (2019b) published several proxy series for Site U1459, including X-ray fluorescence (XRF)-derived element ratios, TEX86 paleotemperatures, and planktonic δ18O and δ13C. The cyclostratigraphic age model in that paper consists of 15 age–depth tie points between 64 and 161 mcd, corresponding to 2.51 and 5.46 Ma. Here, we extend the studied interval into the early Pleistocene, which necessitates the addition of three age–depth tie points using a similar tuning approach as in De Vleeschouwer et al. (2019b). As a result, the U1459 age–depth model now extends to 51.42 mcd, equivalent to 1.93 Ma (Table A1; see also Sect. 3.1).
During IODP Expedition 356, natural gamma radiation (NGR) spectra of the recovered sediments were measured using the whole-round section logger (Gallagher et al., 2017). These spectra can be used to quantify sedimentary uranium and thorium contents through a freely available algorithm published by De Vleeschouwer et al. (2017).
2.2 IODP Site U1463 and ODP Site 763 (Northern Carnarvon Basin)
All new proxy records presented in this manuscript come from IODP Site U1459. In addition, we use previously published proxy records from IODP Site U1463 and Ocean Drilling Program (ODP) Site 763 to calculate planktonic δ18O and SST gradients along the Australian West Coast. IODP Site U1463 (145 m water depth) was cored in the Northern Carnarvon Basin (Beagle sub-basin) in 2015 and quickly became a regional reference site for reconstructing Miocene-to-recent climate, ocean, and basin dynamics (e.g., Christensen et al., 2017; De Vleeschouwer et al., 2018b; Auer et al., 2019; Smith et al., 2020; Karatsolis et al., 2020; Mccaffrey et al., 2020; Tagliaro et al., 2018; Gurnis et al., 2020; Groeneveld et al., 2021). The Pliocene interval of U1463 consists of homogeneous fine-grained mudstones with subordinate wackestone and packstone intervals, with benthic foraminifera assemblages indicative of a middle to outer shelf environment. ODP Site 763 (1367 m water depth) was also cored in the Northern Carnarvon Basin (Exmouth Plateau) in 1988 and consists of light-gray to white foraminifer–nannofossil ooze (Haq et al., 1990). The age–depth model is from Karas et al. (2011a), with a minor adjustment in the youngest part of the record (Table A2).
Both sites are located within the trajectory of the Leeuwin Current, at 18.96 and 20.58∘ S, respectively (∼595 km apart). Because of their proximity and congruous oceanographic setting, we combine proxy series from both sites to construct a “Northwest Shelf of Australia” end-member to compare the newly generated U1459 data with and to calculate paleoceanographic gradients along the Leeuwin Current pathway.
2.3 Oxygen and carbon stable isotope analyses
We present a new dataset of 238 stable (δ13C and δ18O) isotope analyses, measured on calcite tests of the shallow dwelling planktonic foraminifer Trilobatus sacculifer. The new dataset connects to the younger end of the previously published Pliocene isotope record in De Vleeschouwer et al. (2019b; N=143) and extends it into the Pleistocene. The new measurements come from the stratigraphic interval between 82.9 and 55.65 mcd, and sampling occurred at a median spatial resolution of 15 cm according to the shipboard composite depth (mcd) scale, which resulted from a color-reflectance-based correlation between holes U1459A and U1459B (Gallagher et al., 2017). Specimens were picked from the 315–355 µm-size fraction to avoid size effects in δ18O values (Elderfield et al., 2002) and to be methodologically consistent with other planktonic isotopic records in the study area (De Vleeschouwer et al., 2018b; 2019b; Karas et al., 2011a). During picking, specimens with gametogenic calcite final chambers and partly dissolved specimens were avoided. All samples were measured using a Finnigan MAT 252 gas isotope ratio mass spectrometer connected to a Kiel III automated carbonate preparation device at the Center for Marine Environmental Sciences (MARUM). Isotopic data are reported in standard delta notation vs. Vienna Pee Dee Belemnite (V-PDB). We calibrated all measurements against the in-house standard (homogenized Solnhofen limestone powder), which in turn is calibrated against the NBS-19 reference material. Over the measurement period, the standard deviations (1σ) of the in-house standard (N=90) were 0.04 ‰ for δ13C and 0.06 ‰ for δ18O.
2.4 Clumped-isotope thermometry in planktonic foraminifera
Clumped-isotope measurements were carried out using calcite tests of T. sacculifer in the 315–355 µm size fraction. Specimens from up to four adjacent samples were pooled to obtain sufficient material for clumped-isotope paleothermometry (150–350 specimens, 2–5 mg). Potential contaminants were then removed using a modified version of the cleaning protocol for foraminiferal analysis of Barker et al. (2003), without the H2O2 treatment steps (Grauel et al., 2013; Peral et al., 2018). The clumped-isotope analysis of the cleaned carbonate powders took place at the Vrije Universiteit Brussel, Belgium (AMGC-VUB lab), using a Nu Instruments Perspective-IS stable isotope ratio mass spectrometer (SIRMS) in conjunction with a Nu-Carb carbonate sample preparation system. This setup also includes a fully automated adsorptive trap purification system to remove contaminants. Between 500 and 600 µg of carbonate powder reacts for 10 min at 70 ∘C after the automated injection of 120 µL of H3PO4. The CO2 gas produced is expanded into a water trap for 5 min, held at −95 ∘C. Subsequently, the CO2 gas moves through a PoraPak™ Q-packed adsorption trap, held at −34 ∘C for 25 min, and trapped into a liquid nitrogen (LN2) cold finger. After a yield measurement utilizing a pressure transducer, the sample is transferred into the sample cold finger, for 3 min, within the inlet system of the mass spectrometer. The cold finger on the sample side of the dual inlet acts as a constant depletion volume once the gas has been expanded. This is matched by an identical depletion volume on the reference side of the dual-inlet system. This allows for a constant depletion rate of both sample and reference gas during the data acquisition. Additionally, the absorptive trap is cleaned/degassed by active vacuum pumping at 150 ∘C between sample extractions for 25 min to remove any contaminants that may have been trapped during the gas transfer. Reference and sample gases are alternatingly measured on six Faraday collectors ( 44–49) and analyzed in three “blocks” of 20 cycles each with a counting time of 20 s. Measurements sum up to 20 min of integration time per replicate. A zero (no-gas) background measurement and automatic peak centering (on 45) are performed at the start of each sample measurement. The reference gas beam is pressure balanced to the sample gas beam and depletes evenly through matched length capillaries; initial beam balance () is set to 80 nA, weakening to approximately 45 nA. The reference side of the dual inlet was refilled with reference gas every seven analyses. Total analysis time (including the reaction, PoraPak purification, and integration time) is approximately 1 h 20 min per sample. The subsequent sample starts its preparation while the mass spectrometer is still analyzing the previous sample. Possible contamination is monitored on ETH1–4 standards by scrutinizing Δ48 raw and Δ49 raw values for extraordinary deviations from the mean (Meckler et al., 2014). The ETH standards were measured following the recommendations of Kocken et al. (2019) with a sample to standard ratio of 1:1. Analyses and results are monitored in the lab using the Easotope software (John and Bowen, 2016). The raw Δ47 values of sample-derived CO2 were converted to the I-CDES 90 ∘C scale, using the most recent values for the ETH-1, ETH-2, and ETH-3 carbonate reference materials (Bernasconi et al., 2021). The raw measured Δ47 values were processed using the IUPAC isotopic parameters (Brand et al., 2010; Petersen et al., 2019; Daëron et al., 2016) within the ClumpyCrunch software (Daëron, 2021). The reported analytical uncertainties have been calculated using the “pooled” standardization method described by Daëron (2021), incorporating constraints on reproducibility available from both standard and sample analyses. A total of 307 Δ47 replicate analyses (standards and samples) have been carried out in the framework of this study, of which one replicate analysis has been rejected as an outlier because it was >4σ away within entire multi-sample population, as well as within the population of PB06 replicates.
The T. sacculifer clumped-isotope measurements from Site U1459 were converted into calcification temperatures, using three different calibration schemes, which all follow the form of Eq. (1).
The most suitable calibration for the dataset presented here is that of Meinicke et al. (2020), as recalculated in Meinicke et al. (2021), because it is the most comprehensive foraminifera-specific calibration dataset currently available. Another relevant foraminifera-specific calibration for this study is the clumped-isotope paleothermometry calibration by Peral et al. (2018), as recalculated in Peral et al. (2022). In fact, the Meinicke et al. (2020, 2021) calibration fully includes the datasets of earlier calibrations by Peral et al. (2018, 2022) and Piasecki et al. (2019). The most recent Anderson et al. (2021) and Fiebig et al. (2021) calibrations have the advantage of covering a wide range of temperatures (0.5–1100 ∘C). However, due to the ongoing debate regarding linear vs. polynomial behavior of the clumped-isotope calibration across a wide temperature range, we prefer working with the foraminifera-specific calibration that unites all data of Meinicke et al. (2020), Piasecki et al. (2019) and Peral et al. (2018). Therewith, we focus on the natural range of ocean temperatures, appropriate for the paleoceanographic purposes of this study. It is important to emphasize that the Peral et al. (2018) and Meinicke et al. (2020) regression parameters have been updated to match the new I-CDES 90 ∘C scale (Bernasconi et al., 2021). The updated version of those calibrations can be found in Peral et al. (2022) and Meinicke et al. (2021), respectively, as well as in Table 1.
Table 1Clumped-isotope paleothermometry calibration parameters for Eq. (1), using the I-CDES 90 ∘C scale. The A and B parameters of the Meinicke et al. (2020) calibration were recalculated from the CDES to the I-CDES 90 ∘C framework by Meinicke et al. (2021). The Peral et al. (2018) calibration parameters were recalculated by Peral et al. (2022). The reader is referred to Peral et al. (2022) for more information on the uncertainty on this calibration. A recalculation of the Anderson et al. (2021) calibration was not necessary, as they have been originally defined in the I-CDES 90 ∘C framework. Reported uncertainties refer to ±1 SE.

Temperature uncertainties for individual samples in this study (68 % and 95 % confidence intervals) include both analytical and calibration uncertainty, and were calculated using a Monte Carlo approach.
3.1 High-resolution oxygen isotope record and construction of the age–depth model
The new planktonic δ18O depth series (obtained from 55.65 to 82.90 mcd) smoothly connects to the previously published dataset (83.4–106.41 mcd; De Vleeschouwer et al., 2019b): the two datasets align in terms of absolute values at the transition point, and the variance and isotopic range also remain similar between the younger and older interval (Fig. 3a). The previously published dataset exhibits positive δ18O values up to 0.68 ‰ around 88 mcd, which were linked to the global MIS M2 glaciation by De Vleeschouwer et al. (2019b). A gradual trend towards more negative values characterizes the record in the few meters above this level. The new dataset starts at about the point where the gradual trend is concluded. The first ∼17 m of the new dataset (82.9–65.5 mcd) are marked by relatively negative (between 0 and −0.5 ‰) and low-variance isotope values. No distinct positive excursions occur in this interval. At 65.5 mcd, a rapid shift to more positive δ18O values occurs and this shift is accompanied by increased variability. This stratigraphic interval lies outside the range of the age–depth model that was constructed in De Vleeschouwer et al. (2019b). Hence, to convert depth to age, it was necessary to extend the available age–depth model by three additional age–depth tie points. It was not possible to use the depth series for this purpose because it has large data gaps in the upper interval (Fig. 3b). Instead, we aligned the planktonic δ18O record directly with a Southern Hemisphere eccentricity-tilt-precession (ETP) composite (Laskar et al., 2004) and the LR04 benthic stack (Lisiecki and Raymo, 2005). As we look at astronomical forcing signatures within the Site U1459 δ18O signal and in the latitudinal isotopic gradient along the western coast of Australia later in this work, we recognize that this age–depth modeling approach carries some risk for circular reasoning. However, no viable alternative technique allows the construction of a reliable age–depth model with 105-year temporal resolution (i.e., an order of magnitude greater than the biostratigraphic time resolution in this interval). Nevertheless, we minimize the potential impact of circular reasoning by limiting the alignment of the isotope record to the target curves to only two tie points (one at MIS 92 and one at MIS 87). The third tie point is a biostratigraphic tie point at 1.93 Ma and thus does not impose any circular reasoning (Fig. 3d).
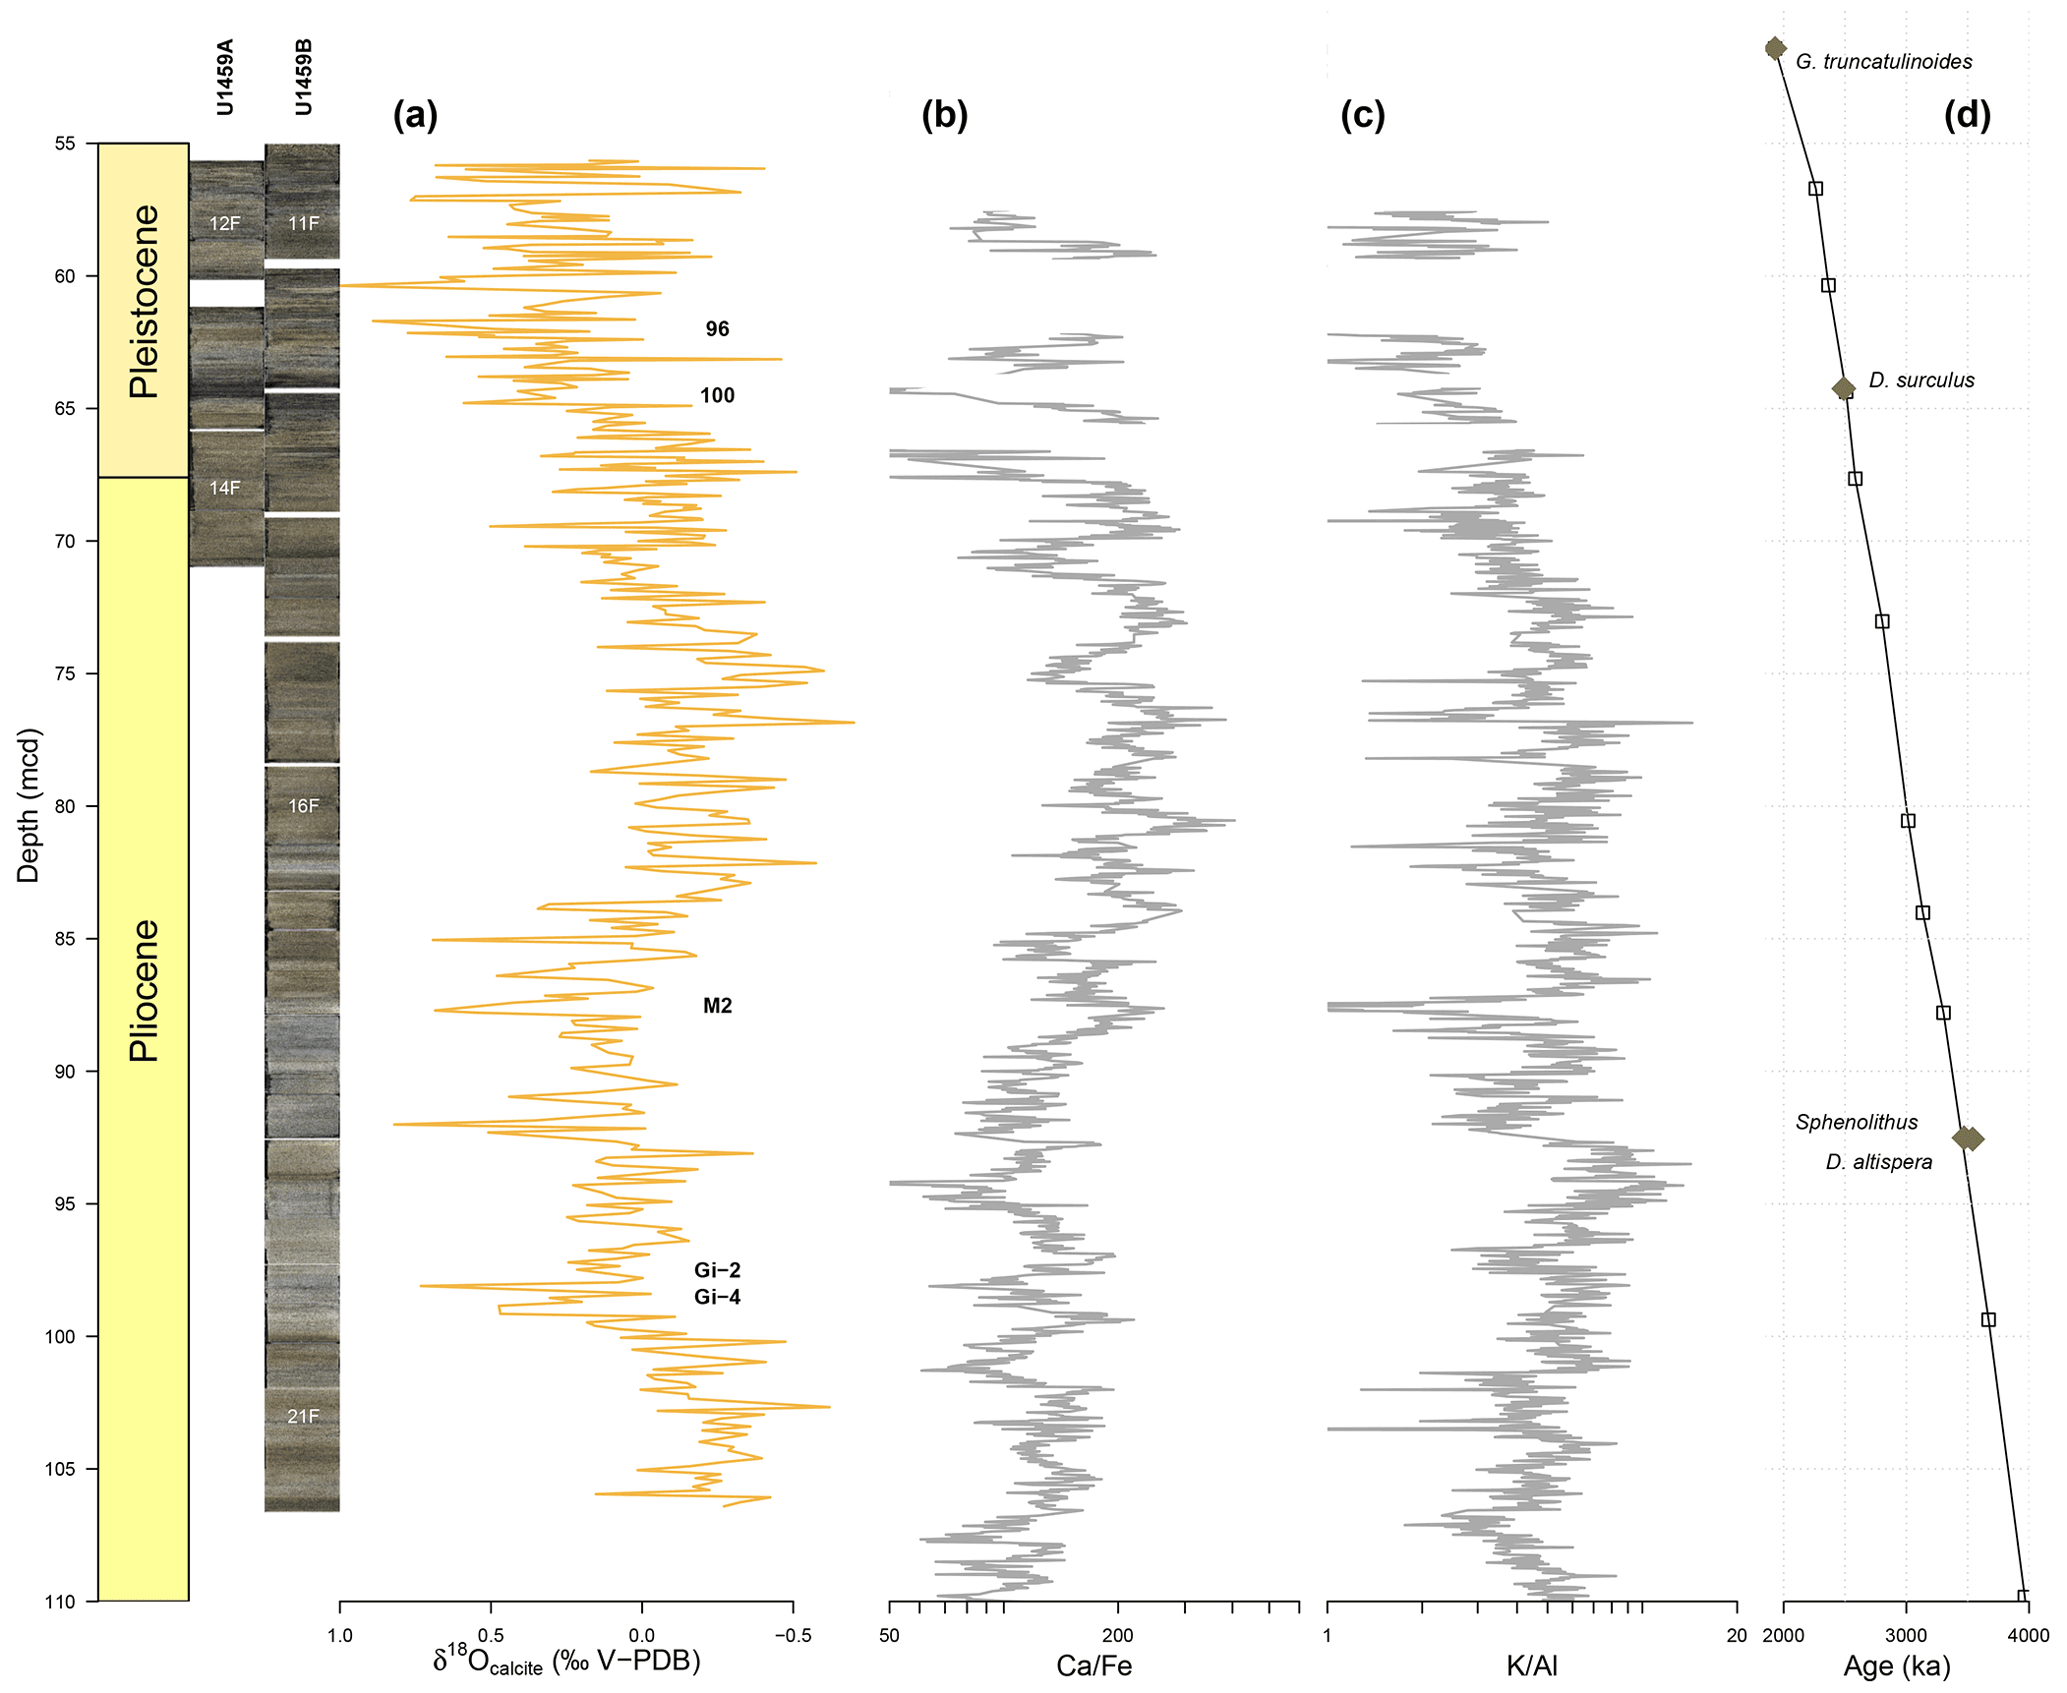
Figure 3IODP Site U1459 depth series and age–depth model. (a) Planktonic δ18Ocalcite depth series, produced by merging the measurement series in De Vleeschouwer et al. (2019b, N=143) with the new data presented here (N=238). The stratigraphic positions of marked glacial intervals (MIS 96, 100, M2, Gi-2, and Gi-4) are indicated. (b, c) XRF-derived and depth series, interpreted in De Vleeschouwer et al. (2019b) as proxies for detrital input and aeolian kaolinite flux, respectively. Both element ratios are plotted on a logarithmic scale. (d) The age–depth model by De Vleeschouwer et al. (2019b) is extended into the early Pleistocene by three additional age–depth tie points. Biostratigraphic markers are indicated by brown diamonds. Age–depth model tie points are indicated by open squares.
3.2 Clumped-isotope-based calcification temperature reconstructions
All clumped-isotope measurements (standards and samples) carried out in the framework of this study are summarized in Table 2. The ETH-1, ETH-2, and ETH-3 standards define the I-CDES 90 ∘C framework and, therefore, correspond to the values fixed by the InterCarb initiative (Bernasconi et al., 2021). The ETH-4 standard is used for quality control, as its Δ47 composition is known, but it is not used to define the I-CDES 90 ∘C isotopic framework. The measured value for the ETH-4 standard matches the expected value within error margins (±1 SE; Table 2). Throughout the studied interval of IODP Site U1459, eight samples have been measured for clumped-isotope paleothermometry (PB01 through PB08). Sample measurements resulted in Δ47 compositions that range between 0.6018 ‰ and 0.6156 ‰. The availability of sample material directly determined the number of repeated aliquot measurements carried out per sample. Sample availability remains the main limiting factor for clumped-isotope paleothermometry, as ∼500 µg of sample material is required per aliquot in the AMGC-VUB lab.
Table 2Clumped-isotope results. ETH-1, 2, and 3 define the I-CDES 90 ∘C framework. Hence their Δ47 are identical to the values reported by Bernasconi et al. (2021). The ETH-4 standard is used for monitoring measurement accuracy. The availability of sample material allowed for 6 to 12 repeated measurements (∼500 µg each). The standard error on sample measurements is calculated using the pooled standardization method described by Daëron (2021). The δ18O and δ13C sample values reported in this table were measured simultaneously with Δ47 in the AMGC-VUB lab.
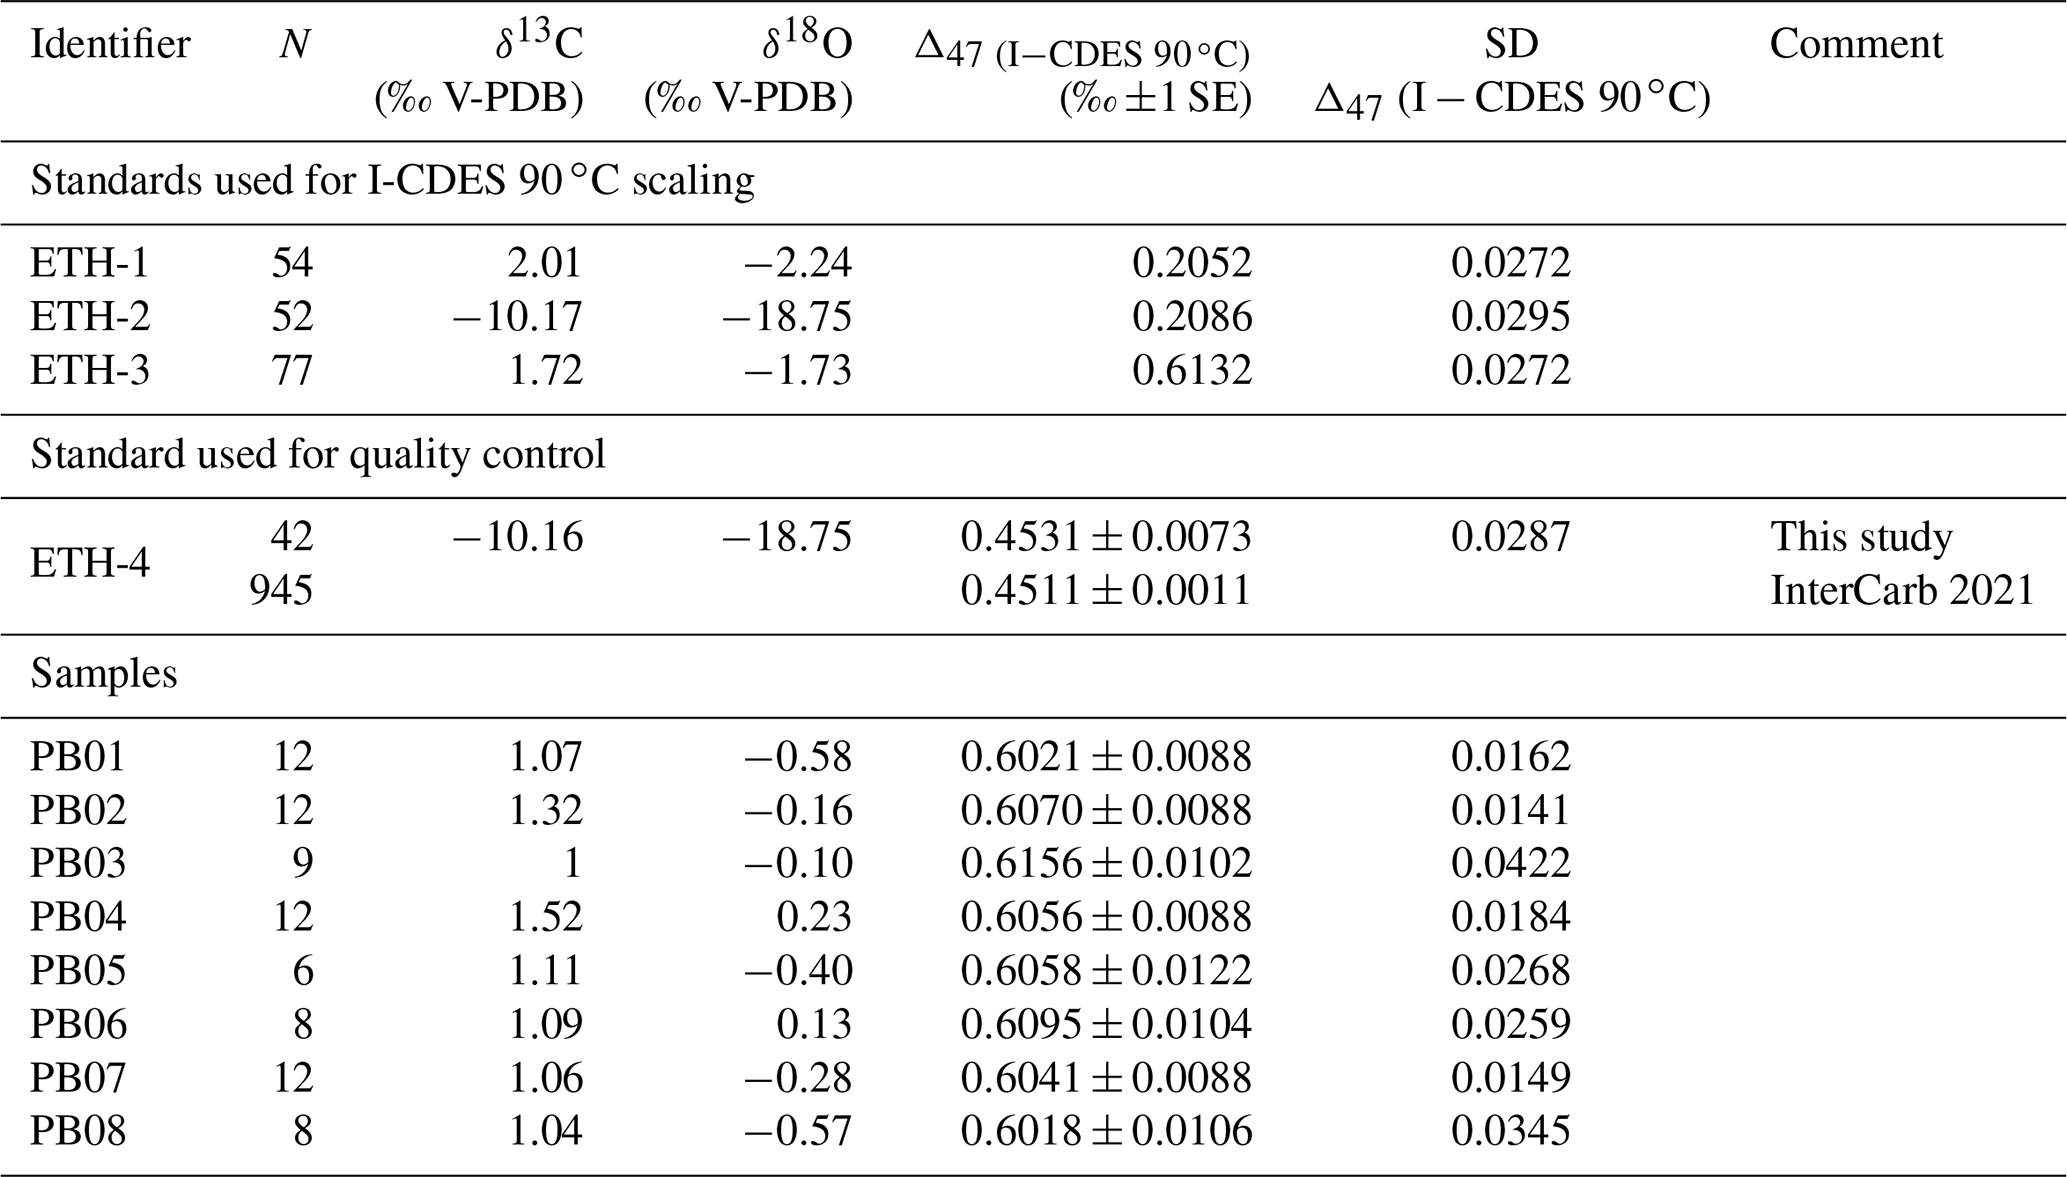
Table 3Clumped-isotope paleothermometry. Clumped isotopes reconstructed calcification temperatures according to three different calibrations. The Meinicke et al. (2020) calibration is adopted throughout this work. The δ18Osw of seawater was reconstructed by solving the Erez and Luz (1983) equation, using the clumped-isotope calcification temperature and the foraminiferal δ18O. Note that all uncertainties in this table refer to 95 % confidence intervals (CIs): in the case of calculated clumped-isotope paleotemperatures, these CIs reflect Monte Carlo propagated analytical and calibration uncertainties.
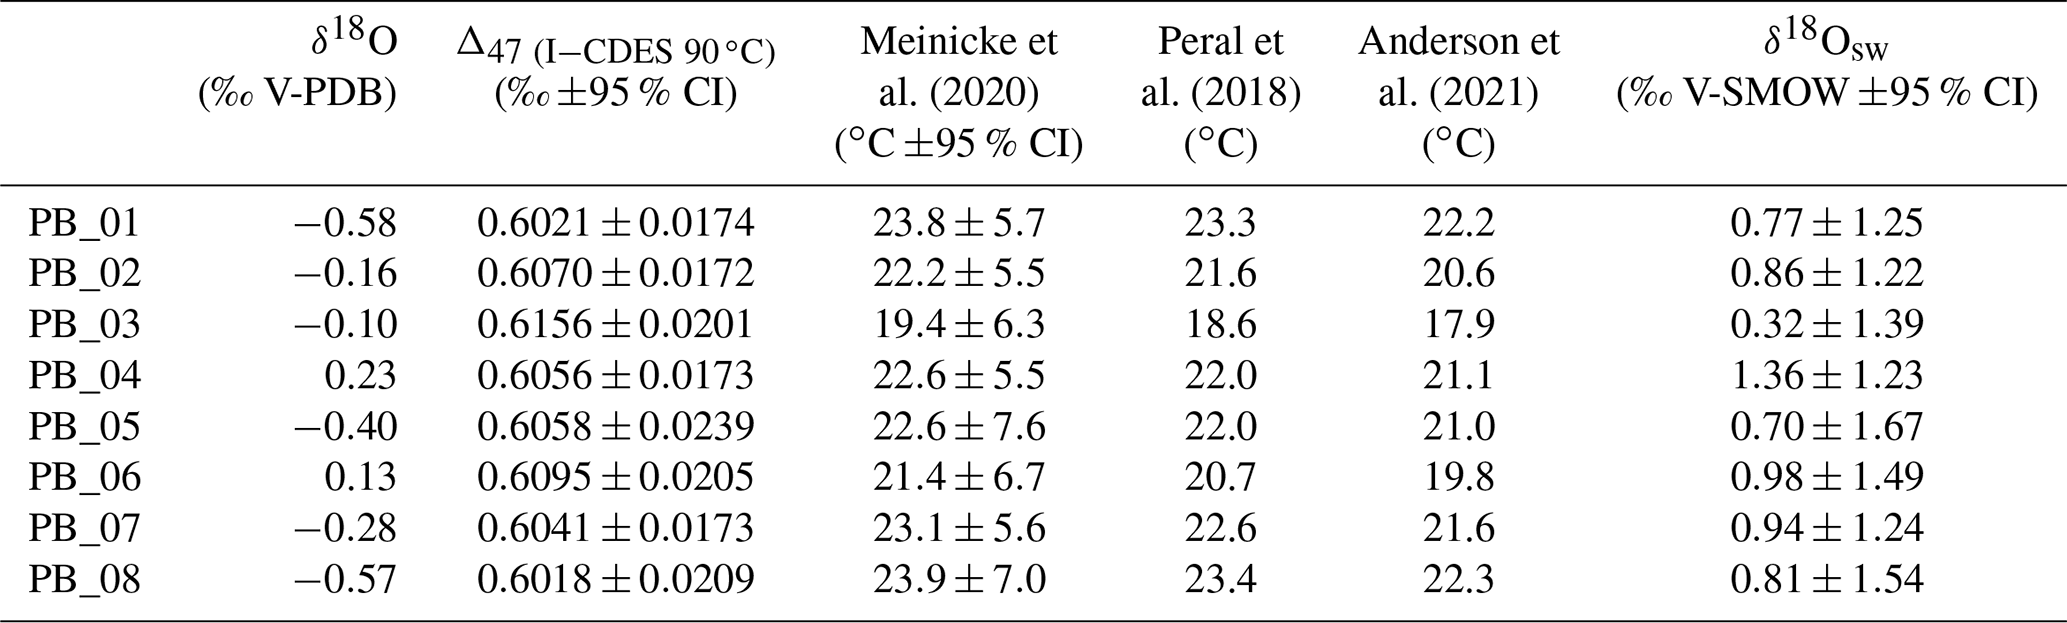
Figure 4(a) Ocean temperature reconstructions based on TEX86 (De Vleeschouwer et al., 2019b) and clumped isotopes (this study) are offset by about 3 ∘C. Clumped-isotope error bars represent ±68 % (bold lines) and 95 % confidence intervals (thin lines). (b) Comparison of U1459 clumped-isotope calcification temperatures and the planktic δ18Ocalcite time series. While clumped-isotope measurements quantify past ocean temperatures, the δ18Ocalcite time series allows for an investigation of past oceanographic variability on secular and astronomical timescales.
The Δ47 clumped-isotope compositions translate to Perth Basin calcification paleotemperatures between 18.6 and 23.9 ∘C when using the Meinicke et al. (2020) or Peral et al. (2018) calibrations. The Anderson et al. (2021) calibration produces paleotemperatures that are ∼0.7 to 1.6 ∘C cooler (Table 3). Compared to the available TEX86-based SST reconstruction for IODP Site U1459, the clumped-isotope temperatures are about 3 ∘C cooler. This result is independent of which TEX86 surface calibration is applied: BAYSPAR (Tierney and Tingley, 2014) or TEX (Kim et al., 2010) (Fig. 4a). The exact origin of the TEX86 signal remains controversial though: it could be a surface, a subsurface, or a combined signal. In the ITF and Leeuwin Current study region, most authors used TEX86 as a proxy for surface temperatures (Petrick et al., 2019; Smith et al., 2020; De Vleeschouwer et al., 2019b). However, He et al. (2021) used it as a proxy for subsurface temperatures and Meinicke et al. (2021) inferred a mixed surface–subsurface signal. In this paper, we start from the assumption that TEX86 is a proxy for surface temperatures, but we add that the BAYSPAR subsurface calibration yields temperatures that are ∼3.3 ∘C cooler compared to the surface calibration, while the Ho and Laepple (2016) subsurface calibration yields cool temperatures (13.7–15.9 ∘C) that correspond to modern-day lower thermocline temperatures. All clumped-isotope derived calcification temperatures intersect with the 5 % confidence level of the TEX86 BAYSPAR surface calibration (Fig. 4a). The clumped-isotope paleotemperatures are also compared to a foraminiferal δ18O-based SST reconstruction (Fig. 5b), using the Perth Basin seawater δ18O reconstruction presented in Fig. 5a as an assumption. The δ18Osw has been obtained by superimposing the Plio-Pleistocene glacial contribution to δ18Osw (Rohling et al., 2021) to the present-day isotopic composition of Perth Basin seawater (+0.8 ‰ Vienna Standard Mean Ocean Water (V-SMOW), dashed line in Fig. 5a). We assume local δ18Osw changes, e.g., in response to salinity changes, to be negligible in this context. This approach results in a high-resolution SST reconstruction with temperatures ranging between 16 and 24 ∘C. Therewith, the δ18O-based reconstruction aligns with the clumped-isotope temperatures and the δ18O-based temperature reconstruction intersects with the ±1 SE intervals of all eight clumped temperatures (Fig. 5b).
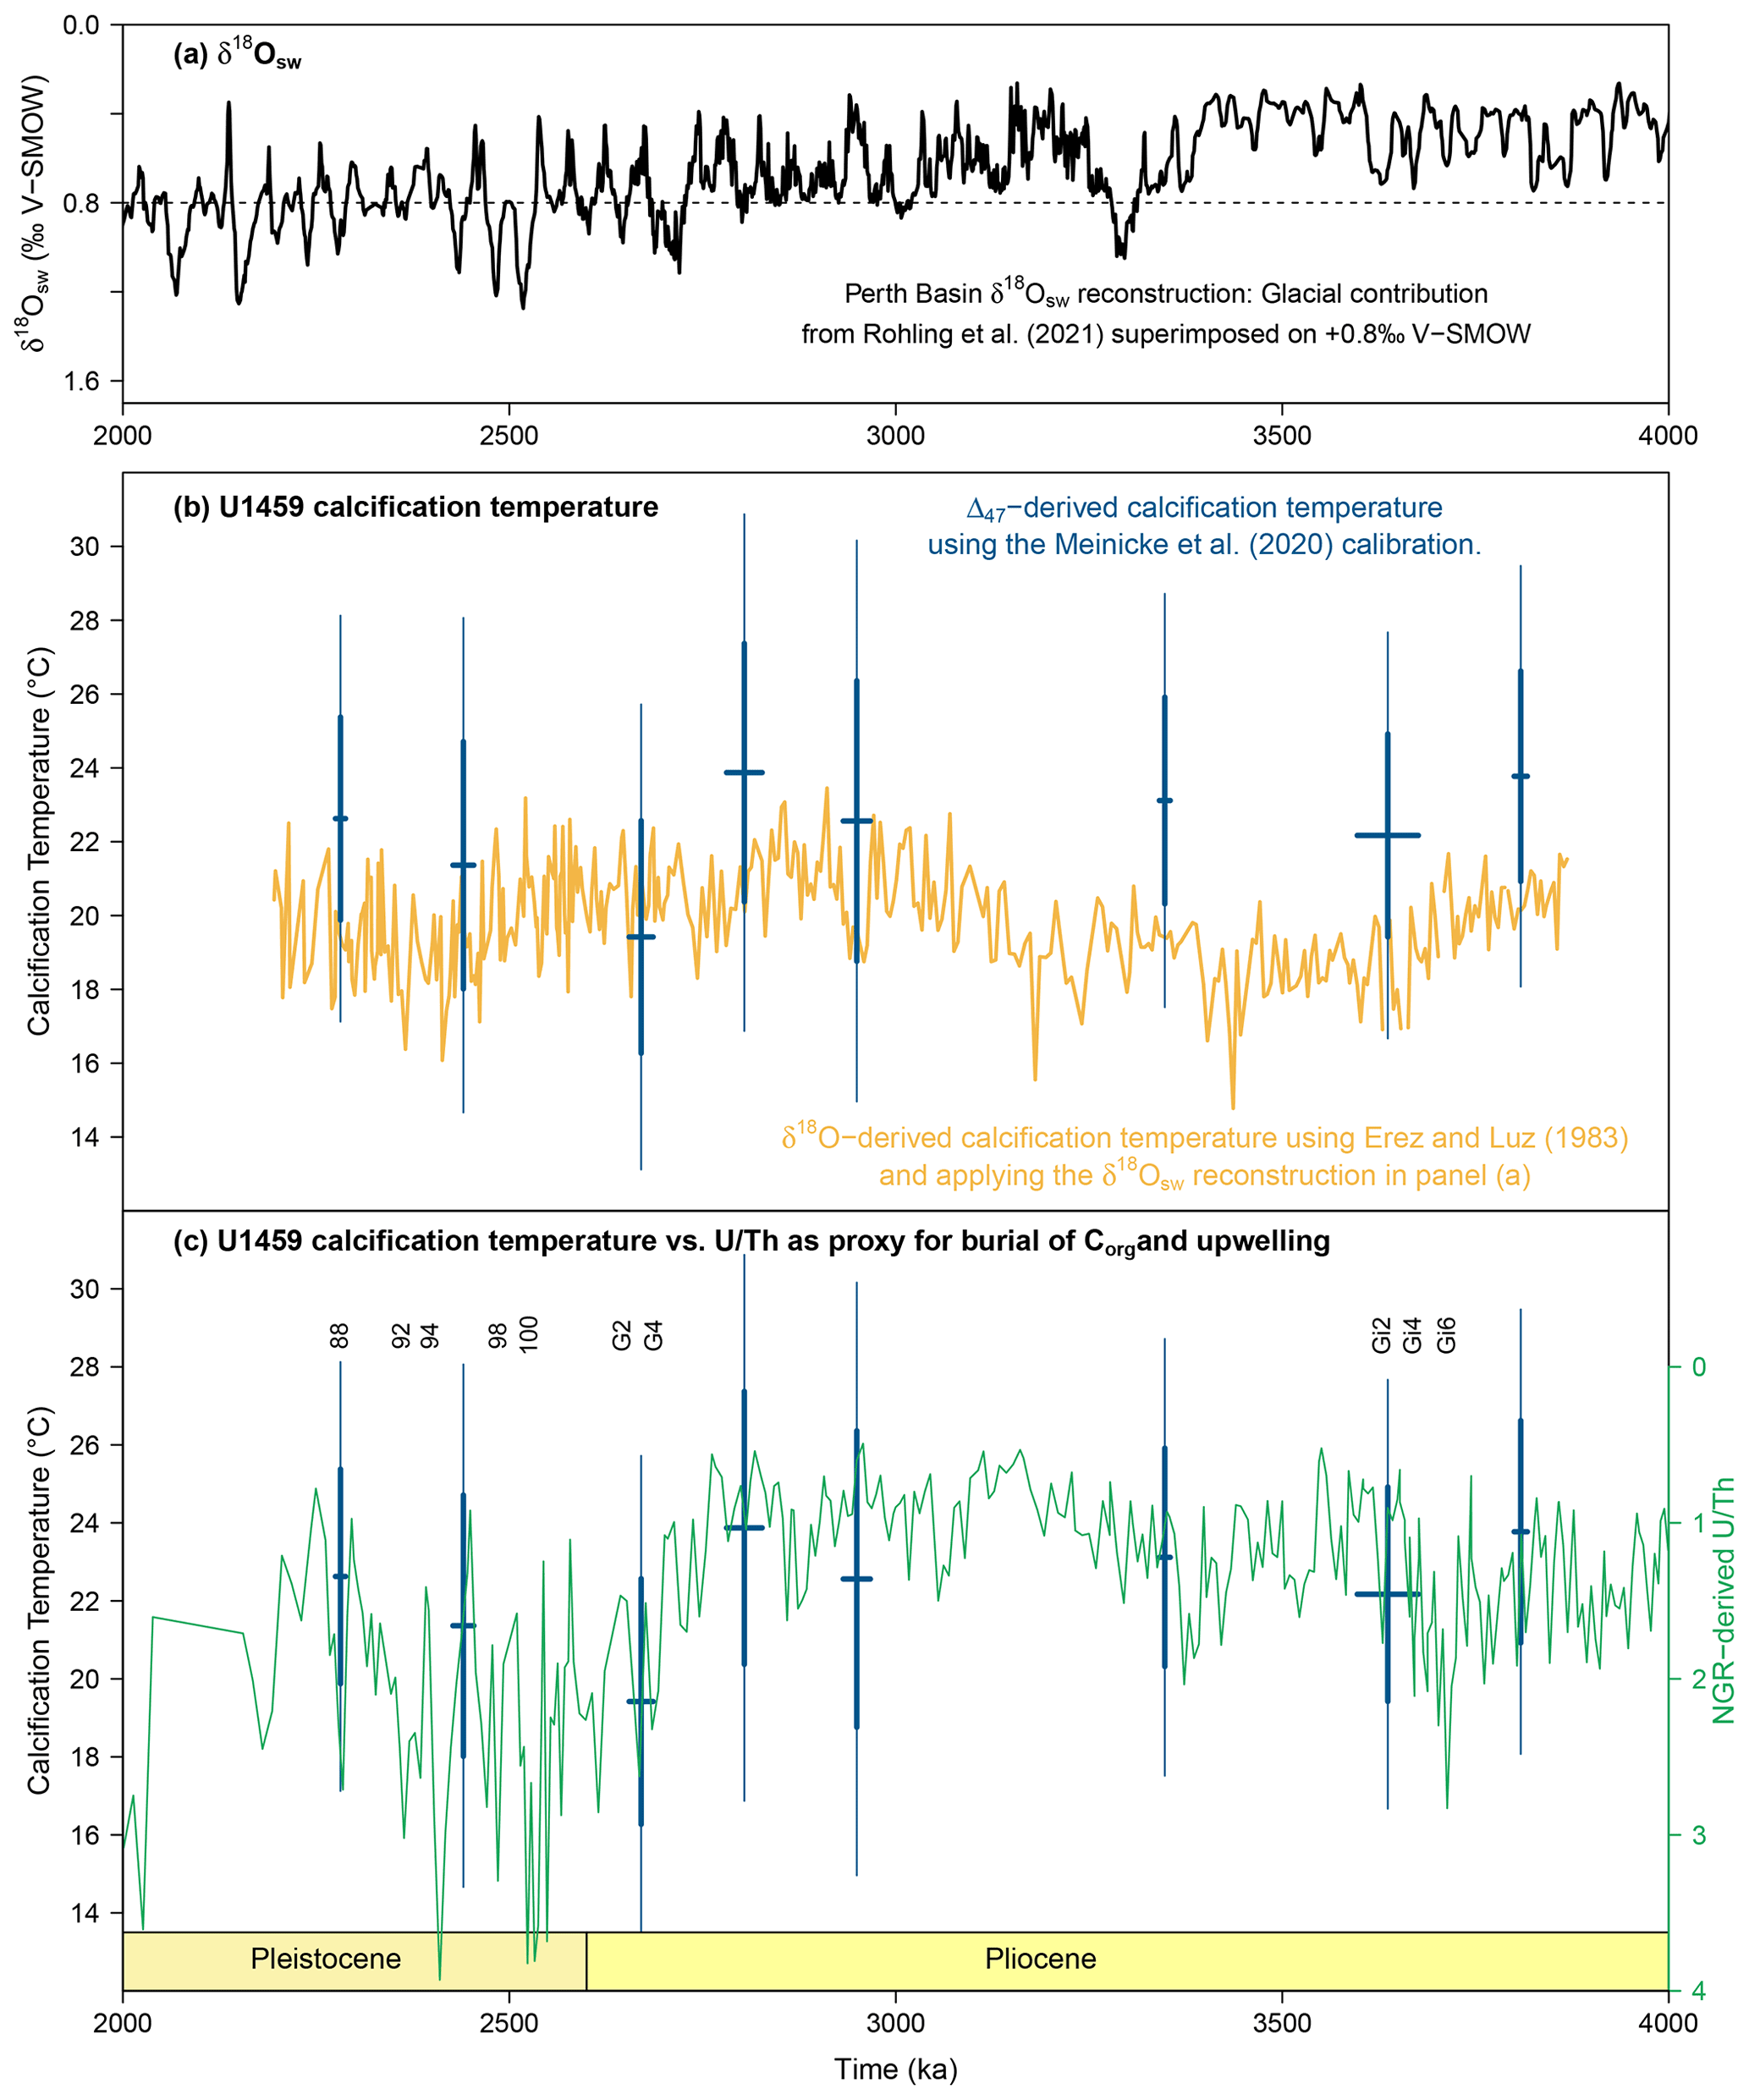
Figure 5(a) Seawater δ18Osw reconstruction for the Perth Basin, constructed by superimposing the Rohling et al. (2021) glacial contribution to δ18Osw on the present-day isotopic composition (+0.8 ‰ V-SMOW). (b) The U1459 planktic δ18O time series can be converted to a high-resolution calcification temperature time series by using the Erez and Luz (1983) equation and adopting the δ18Osw reconstruction in panel (a). The high-resolution δ18O-derived temperature series is compared to the lower-resolution Δ47-derived paleotemperatures. Clumped-isotope error bars represent ±68 % (bold lines) and 95 % confidence intervals (thin lines). (c) Δ47-derived paleotemperatures are compared to the U1459 core-based series (note the reversed y axis). We use as a proxy for Corg burial and upwelling of cold sub-Antarctic Mode Water (SAMW) under a weak Leeuwin Current regime (proxy justification in Auer et al., 2021). Enhanced upwelling at the Plio-Pleistocene boundary does not however seem to have a significant effect on clumped-isotope calcification temperatures.
4.1 Discrepancy between TEX86 sea surface and clumped-isotope calcification temperatures
The TEX86 SST reconstruction at Site U1459 is a few degrees warmer than the simulated annual average sea surface temperatures of the Pliocene climate models shown in Fig. 2a–b (20–24 ∘C). At the same time, the TEX86 surface temperatures are clearly and significantly warmer than the clumped-isotope calcification temperatures obtained by analyzing planktonic foraminifer T. sacculifer. The ∼3 ∘C temperature difference between these proxies demands a discussion of the processes that may underpin the discrepancy. The TEX86 temperature reconstruction was assessed as reliable in De Vleeschouwer et al. (2019b) because glycerol dialkyl glycerol tetraethers (GDGTs) were confirmed to be of marine origin, and all control parameters had values within the recommended range for reliable paleo-SST reconstructions based on TEX86. In this study, we adhere to this assessment. Indeed, the TEX86 reconstruction for the Plio-Pleistocene with temperatures between 23.8 and 28.9 ∘C seems reasonable compared to the present-day mean annual temperature of about 22.8 ∘C (Reynolds et al., 2002). Nonetheless, we point out at least two potential warm biases in the U1459 TEX86 SST reconstruction. First, TEX86 SST reconstructions along the Leeuwin Current pathway might suffer from a seasonal bias towards summer temperatures, although the effect of seasonality on TEX86 is poorly understood. A seasonal warm bias at Site U1459 is supported by the observation that core-top TEX86 SST are 3 ∘C warmer than modern mean annual SST at Site U1463 in the Carnarvon Basin, upstream the Leeuwin Current (Smith et al., 2020). A similar warm bias has been observed at the nearby Perth Basin Site U1460 by Benjamin Petrick (personal communication, 2019). The TEX86 seasonal warm bias along the Leeuwin Current pathway could be linked to the oligotrophic conditions that characterize surface waters off the Australian west coast during summer (when Leeuwin Current is weak and the eddy-induced nutrient flux is minimum), allowing Thaumarchaeota to dominate and thrive (Guo et al., 2021). A second potential TEX86 warm bias in the Perth Basin arises from the southward displacement of sinking particles, as Benthien and Müller (2000) proposed for the western Argentine Basin. Using a typical sinking rate of 100 m d−1, a Leeuwin Current velocity of 50 cm s−1, and a paleo-water depth of ∼500 m, we estimate the order of magnitude of possible southward displacement of particles at several hundred kilometers. This potential warm bias might not be negligible because of the rather steep latitudinal temperature gradient offshore southwestern Australia but is insufficient to explain temperature differences >1 ∘C. Moreover, the T. sacculifer clumped-isotope paleothermometer would be subject to a similar, yet smaller, effect (Takahashi and Be, 1984). Hence, we conclude that, at Site U1459, TEX86 is likely to suffer from a warm bias, mainly driven by a seasonal effect.
The clumped-isotope paleothermometer is also subject to potential overprinting and biases. Indeed, we cannot fully exclude a diagenetic impact on Δ47 and δ18O. Dolomite is recognized throughout Site U1459 and becomes a stronger influence downcore. However, we do not observe a systematic change towards more positive δ18O values with increasing core depth. On the contrary, the δ18O data behave opposite to the expected diagenetic imprint in high-carbonate settings (e.g., Stainbank et al., 2020). Another possible cold bias resides with seafloor recrystallization. While partly dissolved specimens were dismissed during picking and a cleaning protocol has been in place to remove secondary calcite prior to Δ47 analysis, this factor cannot be fully excluded. Nevertheless, our confidence in the Δ47 and δ18O data is strengthened by the preservation of the selected T. sacculifer specimens (Fig. C1), which was classified as moderate to good (Gallagher et al., 2017), the internal coherence of the δ18O and Δ47 series (Figs. 4b, 5b), and the observation that the calculated δ18Osw values (Table 3) are within the expected range for the Pliocene Perth Basin (Fig. 5a). The isotopic consonance between δ18O and Δ47 at Site U1459 constitutes an important indicator, suggesting that it is unlikely that isotopic scrambling (i.e., a reset of 13C–18O clumping) within the calcite of the analyzed foraminiferal tests occurred. A factor that might have played a role in causing the TEX86 – clumped-isotope temperature offset is a difference in determinative water depth: clumped-isotope calcification temperatures likely reflect mixed-layer water temperatures rather than true surface temperatures. The mixed layer offshore southwest Australia can be fairly deep, down to 200 m during austral winter (Fig. 1c). This assessment is underpinned by results presented by Zhang et al. (2019). In a study in the Indonesian Throughflow region, they found that T. sacculifer calcified at the bottom of the mixed layer, or even at the upper thermocline. These authors suggest that the temperature difference between T. sacculifer and Globigerinoides ruber sensu stricto, a true surface-water dweller, could be used as a proxy for mixed-layer depth in the region. Their results were largely in line with earlier work by Rippert et al. (2016), who derived a T. sacculifer calcification depth of ∼120 m in the West Pacific Warm Pool, which is at the bottom of the mixed layer or the top of the thermocline. Nevertheless, the extension of the vertical habitat of T. sacculifer into the upper thermocline remains controversial, for example, because it contradicts an earlier study off Indonesia: Mohtadi et al. (2011) calculated much shallower calcification depths (between 20 and 75 m) for T. sacculifer within the mixed layer. Therewith, the Mohtadi et al. (2011) results are in agreement with a recent clumped-isotope study by Meinicke et al. (2021), who determined the apparent calcification depth of T. sacculifer in the Western Pacific Warm Pool to be around 75 m water depth, within the lower mixed layer. Regardless of the controversy, it becomes increasingly clear that T. sacculifer has a wider vertical range than G. ruber. For example, a large-scale analysis of plankton net haul data from the subtropical eastern North Atlantic reports average living depths for T. sacculifer between 15 and 200 m (Rebotim et al., 2017), and a study in the Kuroshio Current system also found T. sacculifer down to 200 m water depth (Kuroyanagi and Kawahata, 2004). Overall, these recent planktonic foraminiferal habitat studies support the notion that T. sacculifer is a species able to adapt its temporal (lunar cycle, seasonal cycle) and spatial (water depth) habitat to local oceanographic conditions (Jonkers and Kuèera, 2015, 2017; Kretschmer et al., 2018). In addition, isotopic proxies measured on T. sacculifer calcite tests could also be affected by a cold bias through the addition of gametogenic calcite. This effect has been described by Bé (1980), who noticed that living T. sacculifer shells collected during towing were smaller than surface sediment specimens. The size difference was ascribed by Duplessy et al. (1981) to the addition of calcite (gametogenic calcification) during their descent below the euphotic zone. This crust of secondary calcite is typically formed below the thermocline and can contribute up to ∼20 % of the post-gametogenic shell. Hence, gametogenic calcification can impose a significant cold bias on the isotopically reconstructed temperatures and result in unexpectedly deep apparent calcification temperatures (Wycech et al., 2018). However, we consider this effect to be limited thanks to the stringent selection of specimens during picking and the cleaning protocol.
We thus explain the temperature discrepancy between TEX86 and clumped isotopes by a combination of two main processes: (1) T. sacculifer descending in the water column during austral winter, when the mixed layer is up to 200 m thick (Fig. 1), and (2) TEX86, reflecting sea surface temperatures with a bias towards warmer summer temperatures.
In Fig. 5c, we compare the clumped-isotope temperatures to ratios. Here, we employ the ratio as a proxy for organic carbon burial, following the proxy interpretation by Auer et al. (2021) for the mid-Pleistocene interval of nearby Site U1460. Enhanced Corg burial during intense glacial stages is linked to the upwelling of nutrient-rich sub-Antarctic Mode Water onto the Western Australian Shelf. The upwelling of those waters triggered enhanced productivity and caused a contraction of the mixed layer and a marked steepening of the thermocline. With that perspective, it is interesting to note that glacial stages MIS Gi6, Gi4, G4, G2, 100, 98, 94, 92, and 88 are marked by high (Fig. 5c). However, the upwelling of sub-Antarctic Mode Water at times of weak Leeuwin Current does not seem to have a strong effect on the clumped-isotope and δ18O-derived calcification temperatures for these glacials (Fig. 5b–c). This result indicates that T. sacculifer limited its habitat to the mixed layer, avoiding the thermocline at Site U1459 throughout the studied interval.
4.2 Isotopic gradients along the Leeuwin Current pathway as a measure for poleward heat transport
An effective way to investigate the temporal and spatial dynamics of the Leeuwin Current is by calculating proxy gradients at several localities along its pathway. In a previous paper, De Vleeschouwer et al. (2019b) utilized the δ18O gradient between the Northern Carnarvon Basin (sites U1463 and 763) and the Perth Basin (Site U1459) to reconstruct mid-to-late Pliocene (3.9–3.1 Ma) Leeuwin Current strength. He et al. (2021) adopted an analogous approach, calculating differences in TEX86-based temperatures between Site U1461 (Northern Carnarvon Basin) and Site U1459 (Perth Basin). The low-resolution reconstruction of Leeuwin Current intensity by He et al. (2021) is in good agreement with our high-resolution δ18O gradient reconstruction (Fig. D1). Both proxies are completely independent of each other, implying that the covariation of their gradients is temperature driven and constitutes a proxy for Leeuwin Current strength.

Figure 6(a) ODP Site 763 and IODP Site U1463 δ18O time series from the Northern Carnarvon Basin (purple), compared to IODP Site U1459 δ18O time series from the Perth Basin (orange). (b) Isotopic gradient between the Northern Carnarvon Basin (19∘ S) and the Perth Basin (29∘ S) along the Leeuwin Current pathway. (c–d) Forcing factors that are thought to influence Leeuwin Current intensity include eustatic sea level (dark green; Rohling et al., 2021; using the data in Westerhold et al., 2020) and the summer (21 June) intertropical insolation gradient (SITIG). They are combined with equal weights in a composite record after normalizing. (e–f) Multi-taper method power spectrum (Thomson, 1982) of the isotopic gradient and forcing composite. Their spectral signature is similar, dominated by obliquity and precession, and without a strong 100 kyr imprint. Spectral peaks in panel (e) are not strongly expressed because the underlying records have been subject to conservative astronomical tuning and age–depth modeling.
This paper extends the isotopic gradient approach across the Plio-Pleistocene boundary to 2.2 Ma (Fig. 6a, b). The extended analysis sheds new light on previous interpretations because, in the earlier work, a rapid increase in isotopic gradient (from 0.9 ‰ to 1.5 ‰, around 3.7 Ma) was interpreted as a permanent weakening of the Leeuwin Current. It was claimed that this rapid change was likely caused by a tectonic reorganization of the Indonesian Throughflow. However, the extension of the isotopic gradient analysis presented here reveals that the steepening of the isotopic gradient was not permanent. Indeed, one observes a gradual return to flat isotopic gradients throughout the Late Pliocene (3.1–2.9 Ma, Fig. 6b). By the latest Pliocene, between 2.9 and 2.6 Ma, latitudinal δ18O gradients were again as flat as 0.5 ‰ (Fig. 6b). Such flat gradient is indicative of a strong Leeuwin Current and was previously observed during the Early Pliocene, between 3.9 and 3.7 Ma. In other words, the rapid increase in isotopic gradient at 3.7 Ma and weakening of the Leeuwin Current were transient and are thus unlikely to have been caused by a tectonic reorganization in the throughflow region.
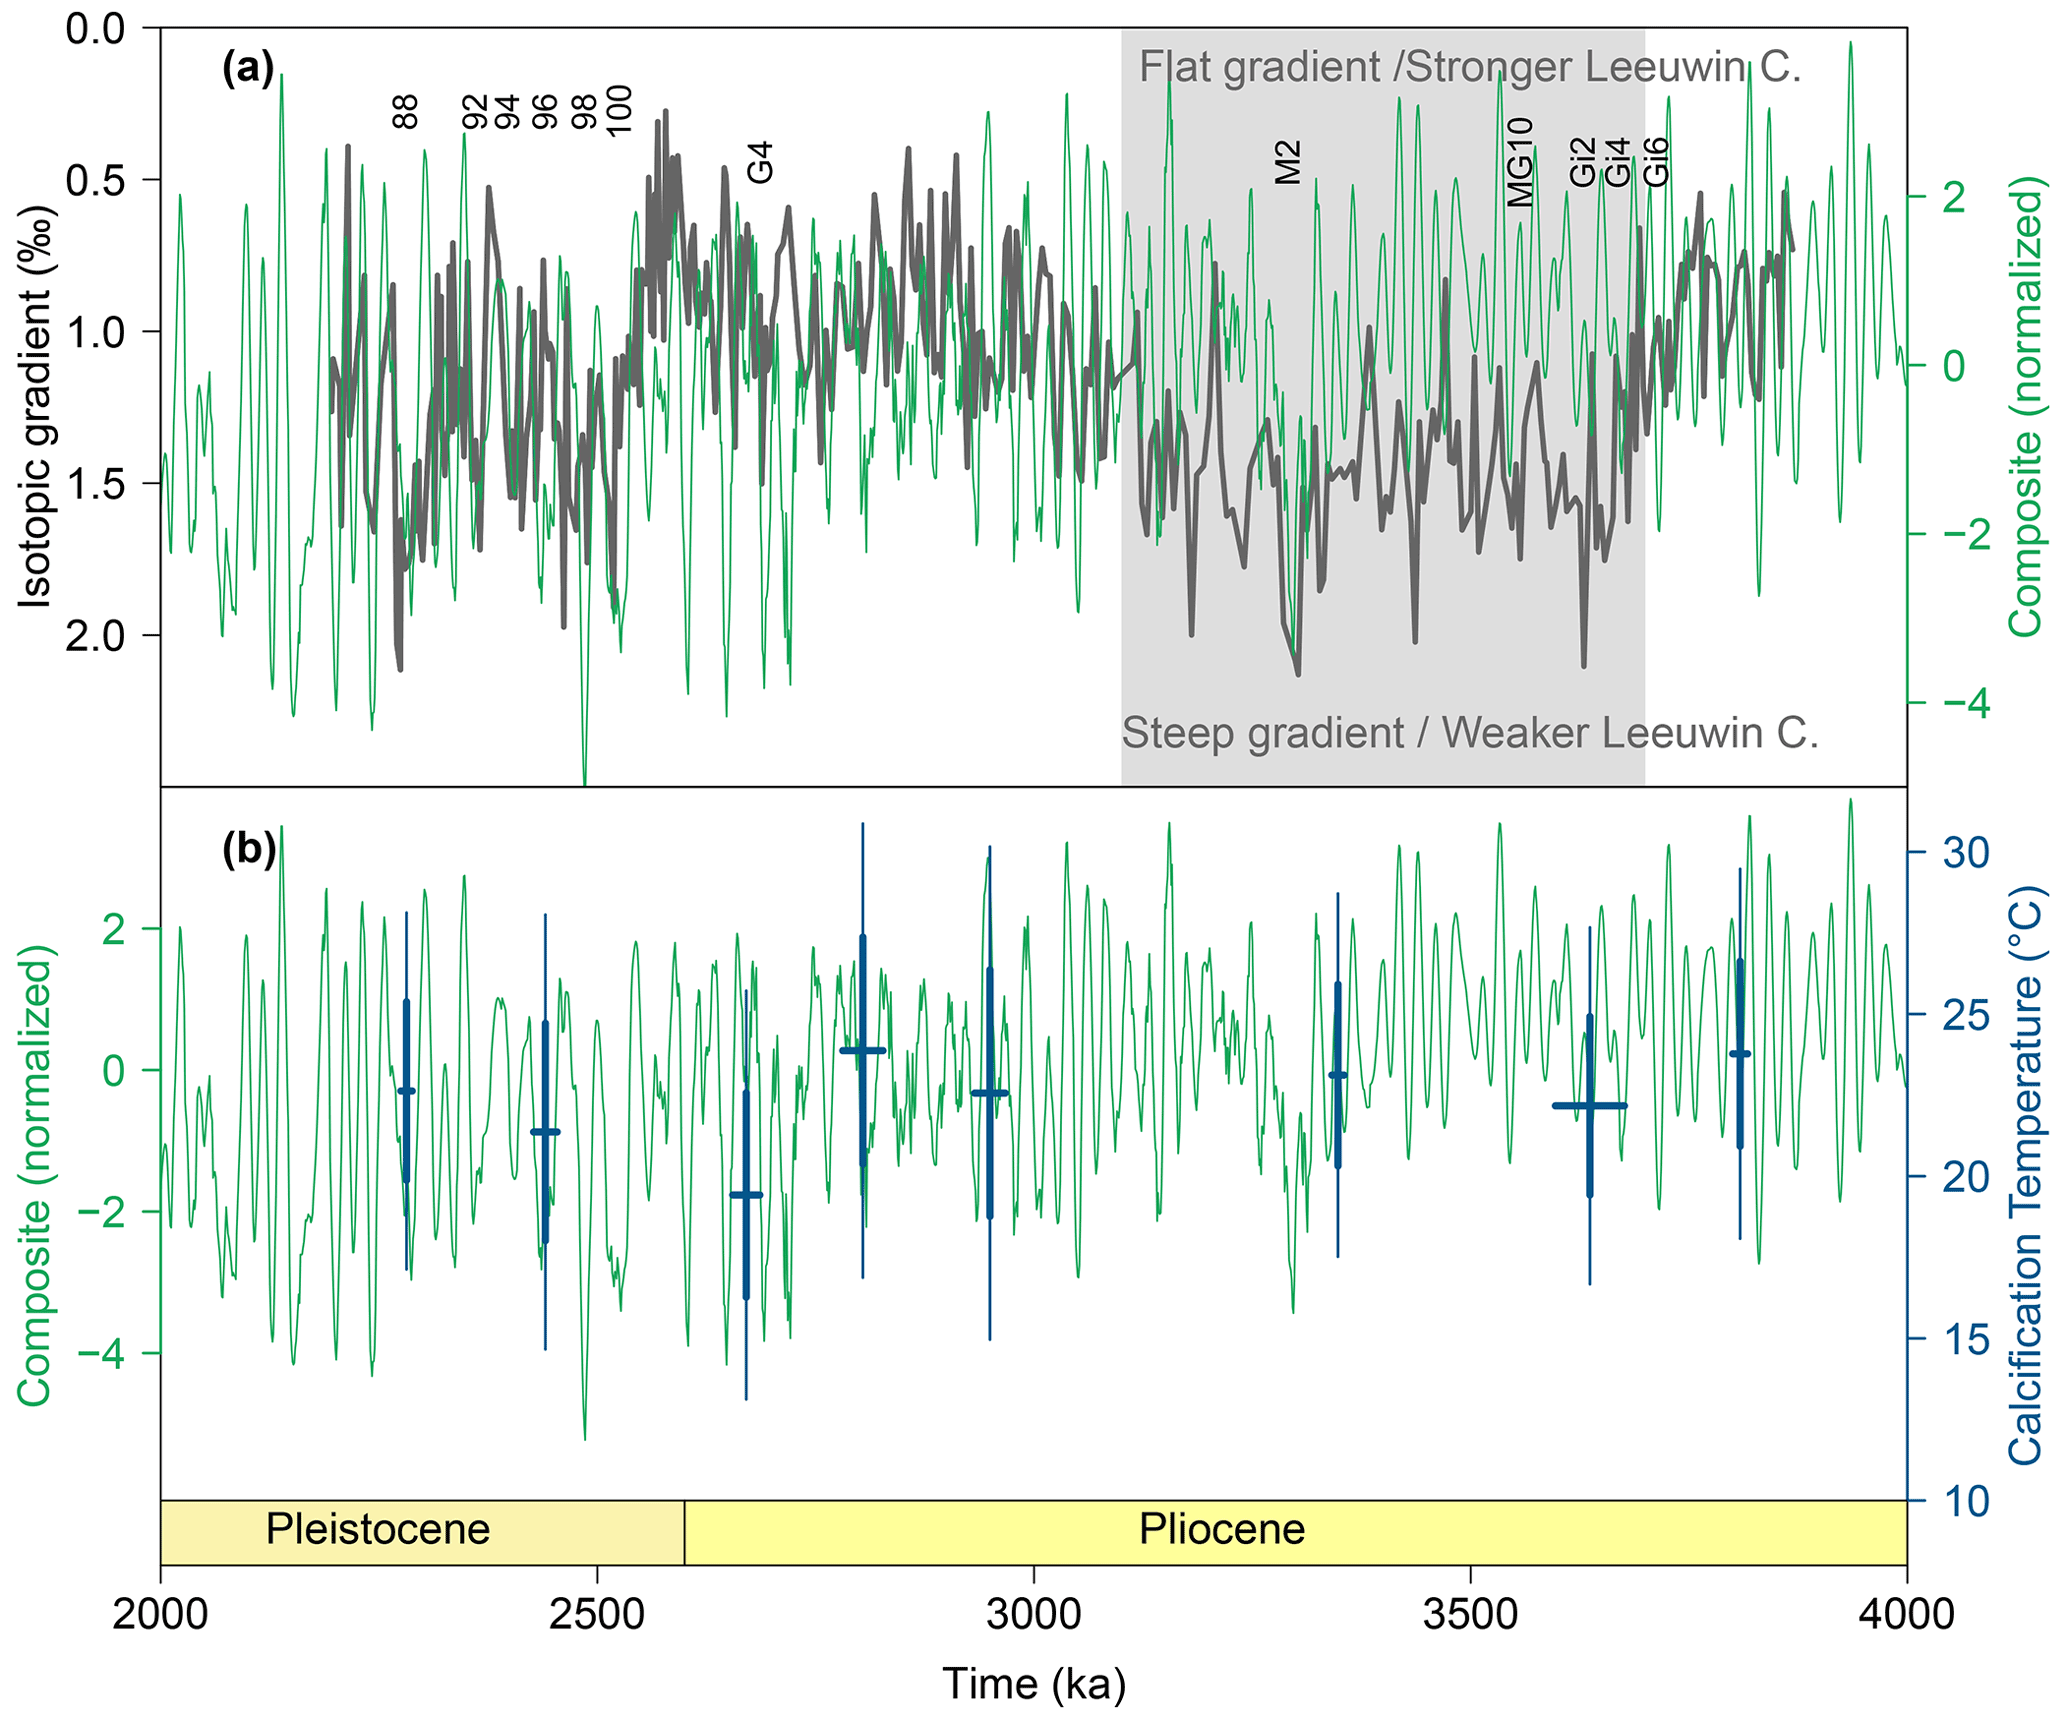
Figure 7(a) Comparison of the isotopic gradient (dark gray) and forcing composite (green) reveals covariation on astronomical timescales. On secular timescales, a period of steep isotopic gradient and thus weak Leeuwin Current is observed between 3.7 and 3.1 Ma (gray rectangle) (b) Comparison of clumped-isotope calcification temperatures (blue crosses) and forcing composite (dark gray). The absence of temperature change between different samples indicates that the Leeuwin Current remained active all throughout the studied interval, despite variability in Leeuwin Current intensity.
The new analysis corroborates other interpretations proposed in De Vleeschouwer et al. (2019b): they argue that eustatic sea level and astronomical insolation forcing of wind patterns regulate Leeuwin Current dynamics on astronomical timescales. These two forcing factors are represented in Fig. 6c by token of the eustatic sea level reconstruction by Rohling et al. (2021) and the intertropical insolation gradient on 21 June (SITIG; Bosmans et al., 2015). Eustasy plays a role because sea level lowstands weaken ITF connectivity and reduce the availability of shallow Leeuwin Current source waters. Wind patterns are important because the Leeuwin Current has to overcome strong southerly winds during austral summer but benefits from southeasterly winds blowing off the Australian continent during winter. When the SITIG index is maximum, the Hadley cell over Australia is enhanced during austral winter but weakened during summer. Both effects spur Leeuwin Current flow under maximum SITIG. The sea level and insolation series in Fig. 6c have been normalized and added with equal weights to arrive at the composite signal in Fig. 6d. We thus propose a causal relationship between the combined forcing (Fig. 6d) and the isotopic gradient (Fig. 6b). This interpretation conforms with the broadly similar spectral character of both curves (Fig. 6e–f): both spectra are dominated by obliquity and precession and do not exhibit a 100 kyr eccentricity peak. We emphasize that the obliquity and precession spectral peaks in Fig. 6e occur at the expected frequencies, even though the underlying age–depth models (sites 763, U1463, and U1459) have been constructed using conservative tuning approaches. Indeed, none of those sequences have been tuned at the level of individual precession or obliquity cycles, with individual age–depth models not exceeding one tie point every ∼100 kyr. The most compelling argument for the proposed causal connection comes from the remarkable covariation between forcing and isotopic gradient on astronomical timescales, displayed in Fig. 7. Different glacial stages are recognizable in the forcing composite series and the isotopic gradient: intervals with a low forcing are generally characterized by a steep isotopic gradient and thus a weak Leeuwin Current. Also, the relative strength of individual glacial–interglacial cycle is consistent between forcing composite and isotopic gradient.
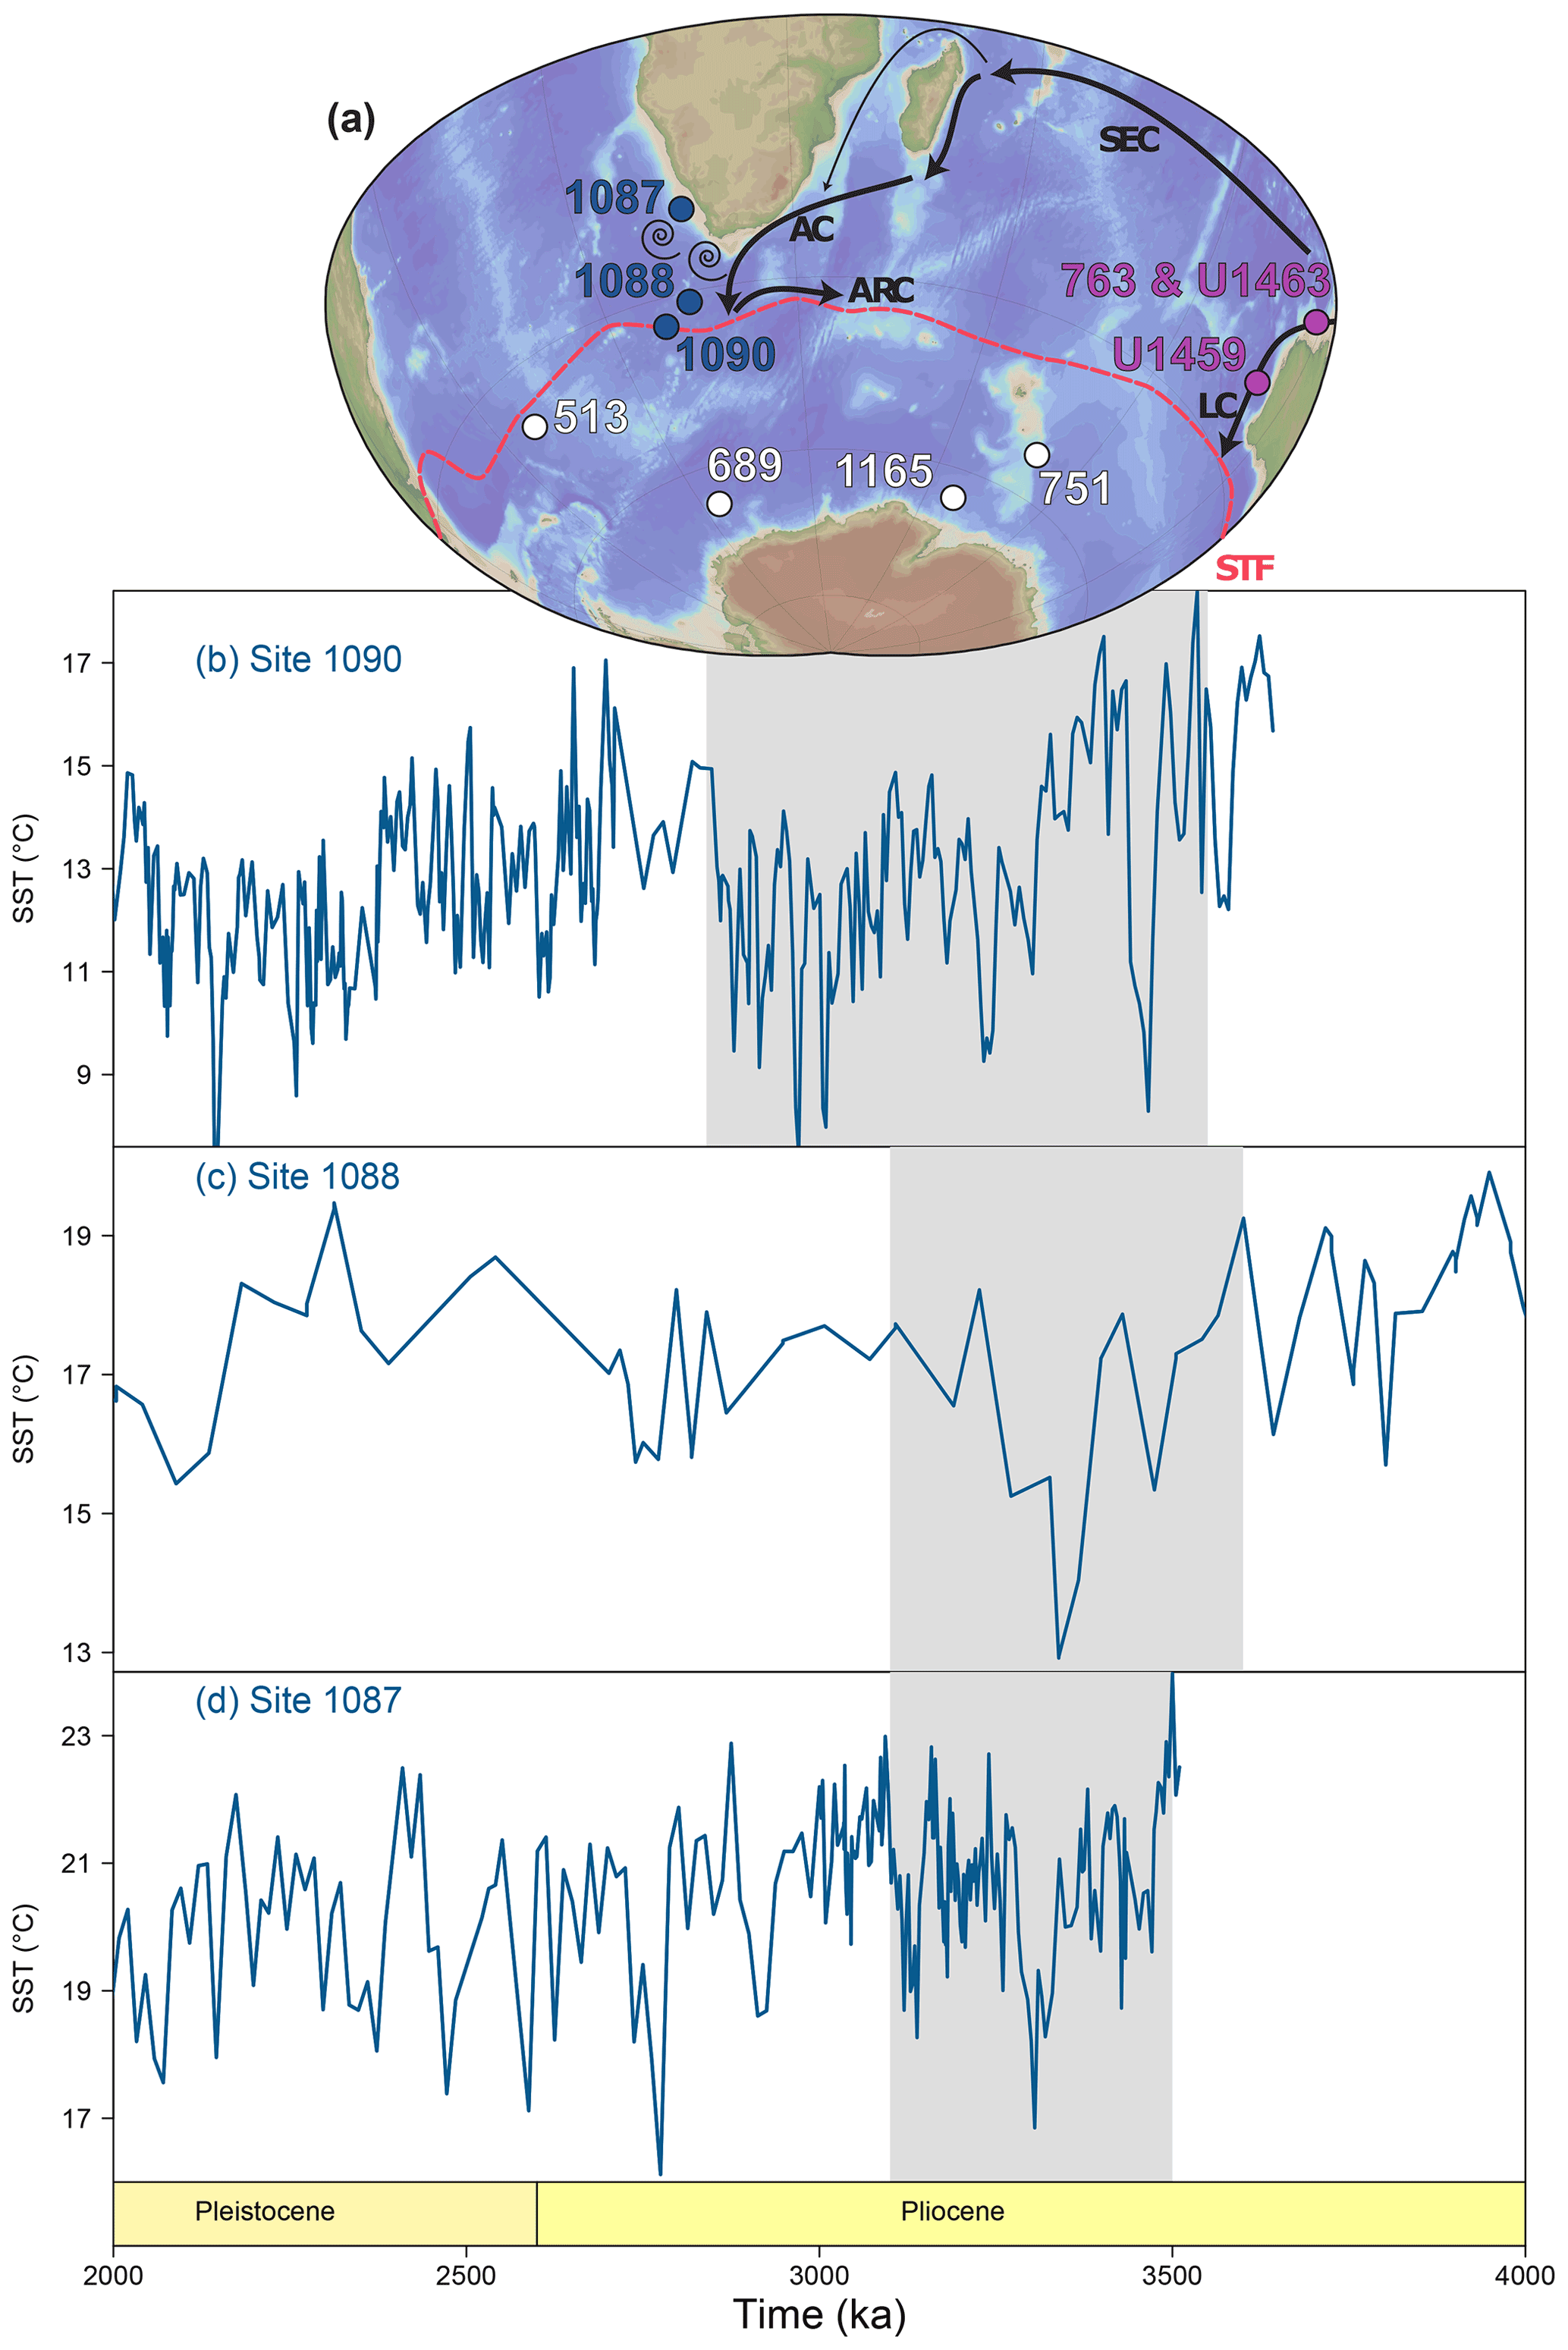
Figure 8(a) Map of the South Atlantic, Indian, and Southern oceans indicating the location of DSDP, ODP, and IODP sites discussed in this work. LC is the Leeuwin Current; SEC is the South Equatorial Current; AC is the Agulhas Current; ARC is the Agulhas Return Current. (b–d) Different alkenone-based SST reconstructions (blue) in the Agulhas/Benguela region (Site 1087 from Petrick et al., 2018; Site 1090 from Martínez-Garcia et al., 2010; Site 1088 from Herbert et al., 2016) indicate late Pliocene cooling (gray rectangle), resulting from a more northerly position of the subtropical front (STF).
On longer secular timescales, the two curves seem to be decoupled in certain parts of the studied interval. Especially, between 3.7 and 3.1 Ma, the Leeuwin Current isotopic gradient is steeper than what one would derive from the similarity between forcing and gradient in the rest of the record (Fig. 7), with relatively low amplitude changes. In fact, the 3.7–3.1 Ma interval is characterized by isotopic gradients that are equally steep as the early Pleistocene interval between 2.6 and 2.2 Ma. Based on these results, we infer a prolonged period of Leeuwin Current weakness during the late Pliocene (3.7–3.1 Ma). Its timing chiefly corresponds to a time of Southern Hemisphere cooling, marked by the oldest tills in Argentinian Patagonia (3.6 Ma; Clague et al., 2020), a period of continental aridity in the south-central Andes (3.6–3.3 Ma; Amidon et al., 2017), the absence of the Dictyocha silicoflagellate and low abundance of calcareous nannoplankton between 3.5 and 3.2 Ma at ODP Site 751 on the Kerguelen Plateau (Bohaty and Harwood, 1998), a cooling of more than 3 ∘C between 3.7 and 3.5 Ma based on warm vs. cold silicoflagellates from ODP Site 1165 on the Prydz Bay continental rise (Escutia et al., 2009), a marked decrease in sub-Antarctic zone diatoms because of surface ocean water cooling at Deep Sea Drilling Project (DSDP) Site 513 in the Atlantic sector of the Southern Ocean (3.6 Ma; Kato, 2020), and a gradual increasing trend in seasonal sea ice indicating diatoms at ODP Site 689 in the Weddell Sea (starting at 3.7 Ma; Kato, 2020) (see also Fig. 8).
The temporal evolution of the Leeuwin Current isotopic gradient also resembles alkenone-based SST reconstructions from the wider Agulhas region (South Atlantic, Fig. 8), which all show a general cooling trend between 3.7 and 3.1 Ma, followed by mostly stable and relatively warm temperatures between 3.1 Ma and the earliest Pleistocene (Site 1087 from Petrick et al., 2018; Site 1090 from Martínez-Garcia et al., 2010; Site 1088 from Herbert et al., 2016). The SST evolutions of those sites are coupled in varying degrees to latitudinal shifts in sub-Antarctic climate belts. The synchronicity between Leeuwin Current intensity and Agulhas SSTs thus suggests that there is a mechanistic link between the latitudinal position of the subpolar frontal system and Leeuwin Current intensity. This also implies that the rapid steepening of isotopic gradients at ∼3.7 Ma was probably associated with an intensified SAMW production in the Indian Ocean and possibly an equatorward shift of Southern Hemisphere climate belts rather than a tectonic event in the ITF region. Despite the covariation, open questions remain as to the exact cause and effect. It is rather unlikely that Leeuwin Current weakening would be the direct effect of an equatorward shift of the subtropical front. That is because such change would steepen the annual mean steric height gradient alongshore Western Australia, which would result in strengthening, not weakening, of the Leeuwin Current. The other way around, Karas et al. (2011a) suggested that a dwindling surface ITF has important implications for the Leeuwin Current and the poleward heat flux, possibly leading to a cooling of the Benguela upwelling system. Building on that suggestion, De Vleeschouwer et al. (2018b) described a positive feedback mechanism for Pliocene Southern Hemisphere climate change: an initial reduction in ITF heat transport leads to (sub-)Antarctic cooling, further glacio-eustatic sea level fall, and more Leeuwin Current weakening. Based on these hypotheses, it can be speculated that a reduction in poleward heat transport through the Leeuwin Current and the Agulhas (Return) Current caused the observed Southern Hemisphere cooling between 3.7 and 3.1 Ma. However, in this scenario, the question remains as to what triggered the strong cutback in poleward heat transport at ∼3.7 Ma in the first place. Possibly, the relatively large sea level drop related to the Early/Late Pliocene expansion of Northern Hemisphere ice sheets (De Schepper et al., 2014) was the trigger for the reduction in Indian Ocean (Leeuwin and Agulhas current) poleward heat transport. This initial change could have been amplified through the positive feedback mechanism in which the reduction of Indian Ocean poleward heat transport advances the thermal isolation of Antarctica (Karas et al., 2011a; De Vleeschouwer et al., 2018b), bringing the Southern Hemisphere into a long-lasting “cool state”.
On the other hand, the absolute TEX86 and clumped-isotope paleotemperatures demonstrate that the Leeuwin Current continued to operate throughout the Pliocene, even when the latitudinal isotopic gradient became steeper. These new datasets thus provide important constraints for further ocean and climate modeling that can test the remaining open questions: were Pliocene sea level eustatic lowstands capable of sufficiently reducing Indian Ocean poleward heat transport so that it could influence Southern Hemisphere climate (without completely halting the Leeuwin Current)? Or were reductions in Leeuwin Current intensity the (indirect) result of an equatorward expansion of the sub-Antarctic climate belts, despite the corresponding steepening of the alongshore steric height gradient?
We have reconstructed a Plio-Pleistocene history of Leeuwin Current dynamics and Perth Basin ocean water temperatures, using a multiproxy approach at IODP Site U1459. Clumped-isotope and TEX86-derived paleotemperatures for Site U1459 are about 3 ∘C apart, which we explain by a combination of two processes: a seasonal warm bias on TEX86 and a difference in the exact water depth represented by both proxies. Clumped isotopes measured on T. sacculifer probably mirror mixed-layer calcification temperatures, whereas TEX86 is assumed to reflect surface waters.
The Plio-Pleistocene evolution of Leeuwin Current strength is assessed by calculating δ18O differences along a 19–29∘ S latitudinal transect. Steep gradients are adopted as a proxy for weak Leeuwin Current intensities, and vice versa. This analysis confirmed the dependency of Leeuwin Current intensity on eustatic sea level and insolation forcing of wind patterns. Moreover, it indicates a “weaker than expected” Leeuwin Current between 3.7 and 3.1 Ma. This time interval chiefly corresponds to cool climate conditions across the Southern Hemisphere and a more northerly position of the subtropical front. The Leeuwin Current isotopic gradient exhibits remarkable congruity with SST records from the Southern Atlantic Ocean, supporting earlier proposed links between Leeuwin Current intensity and oceanographic change in the Agulhas/Benguela region. While this result underlines the importance of Indian Ocean poleward heat transport through the Leeuwin Current and the Agulhas (Return) Current, it remains an open question why the Leeuwin Current remained “weaker than expected” for ∼600 kyr after 3.7 Ma.
Table A1Age–depth model for the Plio-Pleistocene interval of IODP Site U1459.
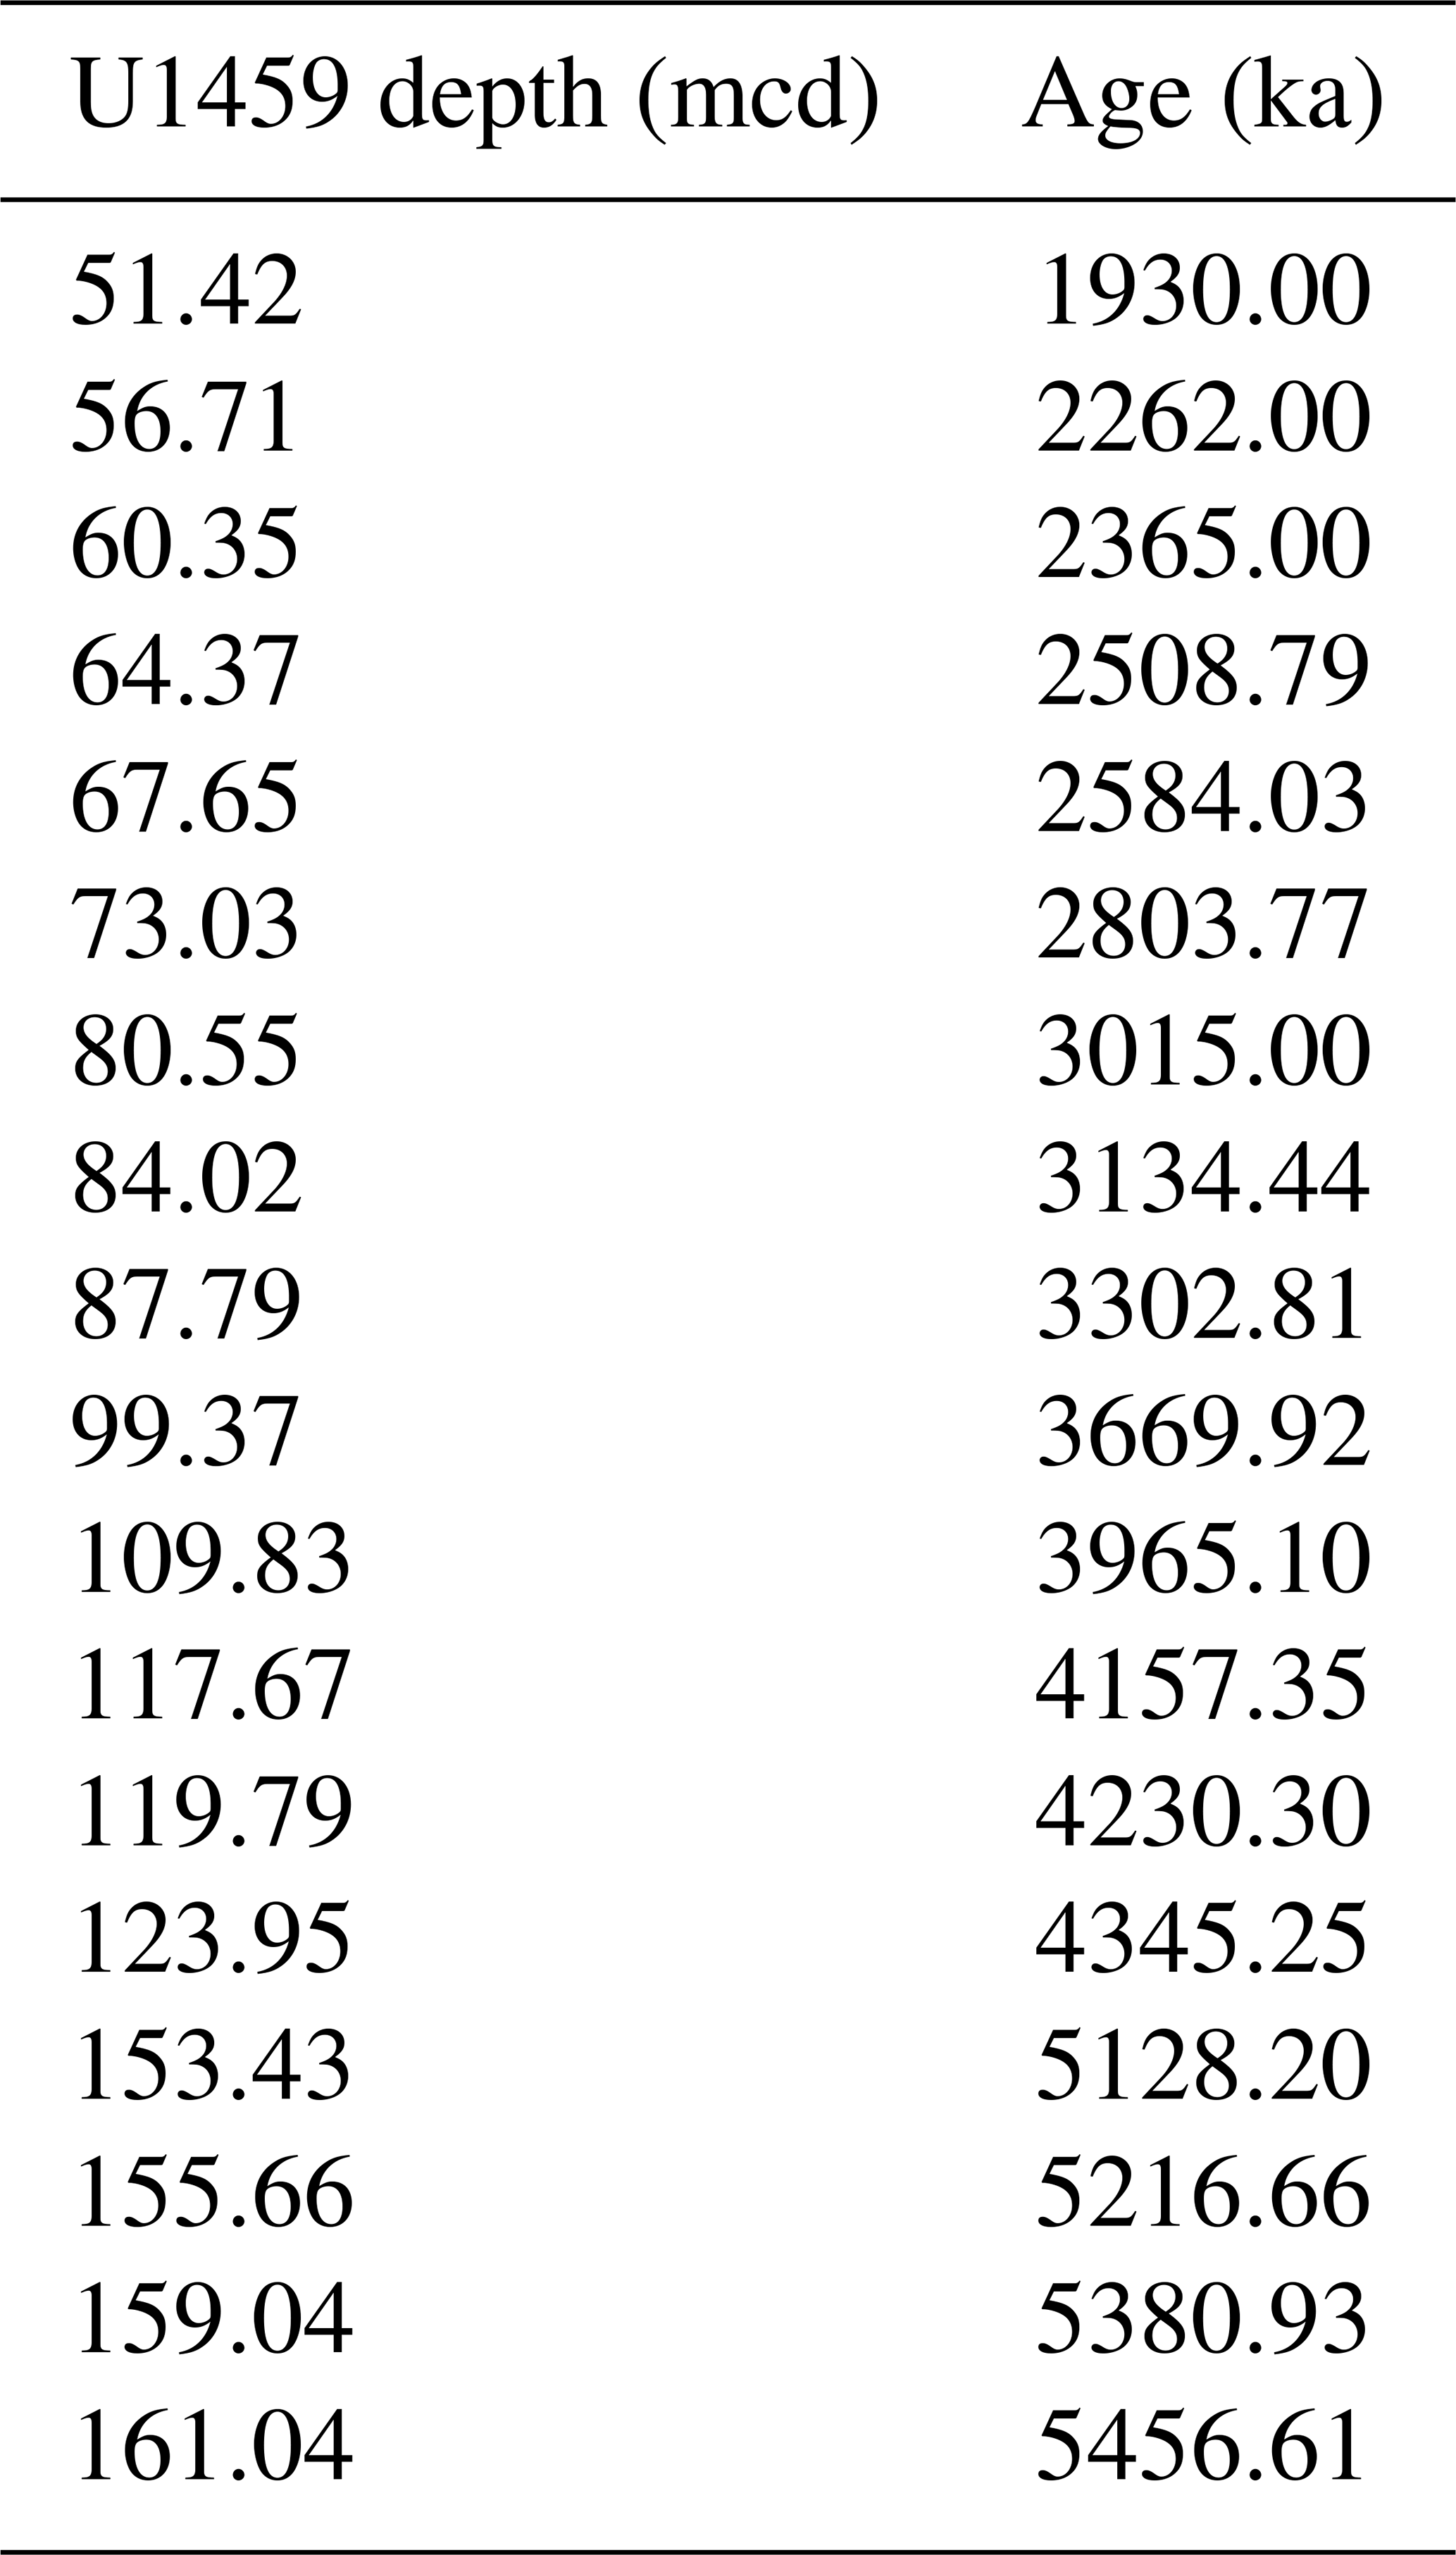
Table A2A minor chronology adjustment of Site 763 compared to Karas et al. (2011a) was needed in the youngest part of the record. This is because in the interval younger than 3.1 Ma, the Karas et al. (2011a) age–depth model is solely based on magnetic reversals. The minor chronology adjustment shown here was necessary to make sure that heavy planktonic isotope compositions correspond to glacials, and vice versa.
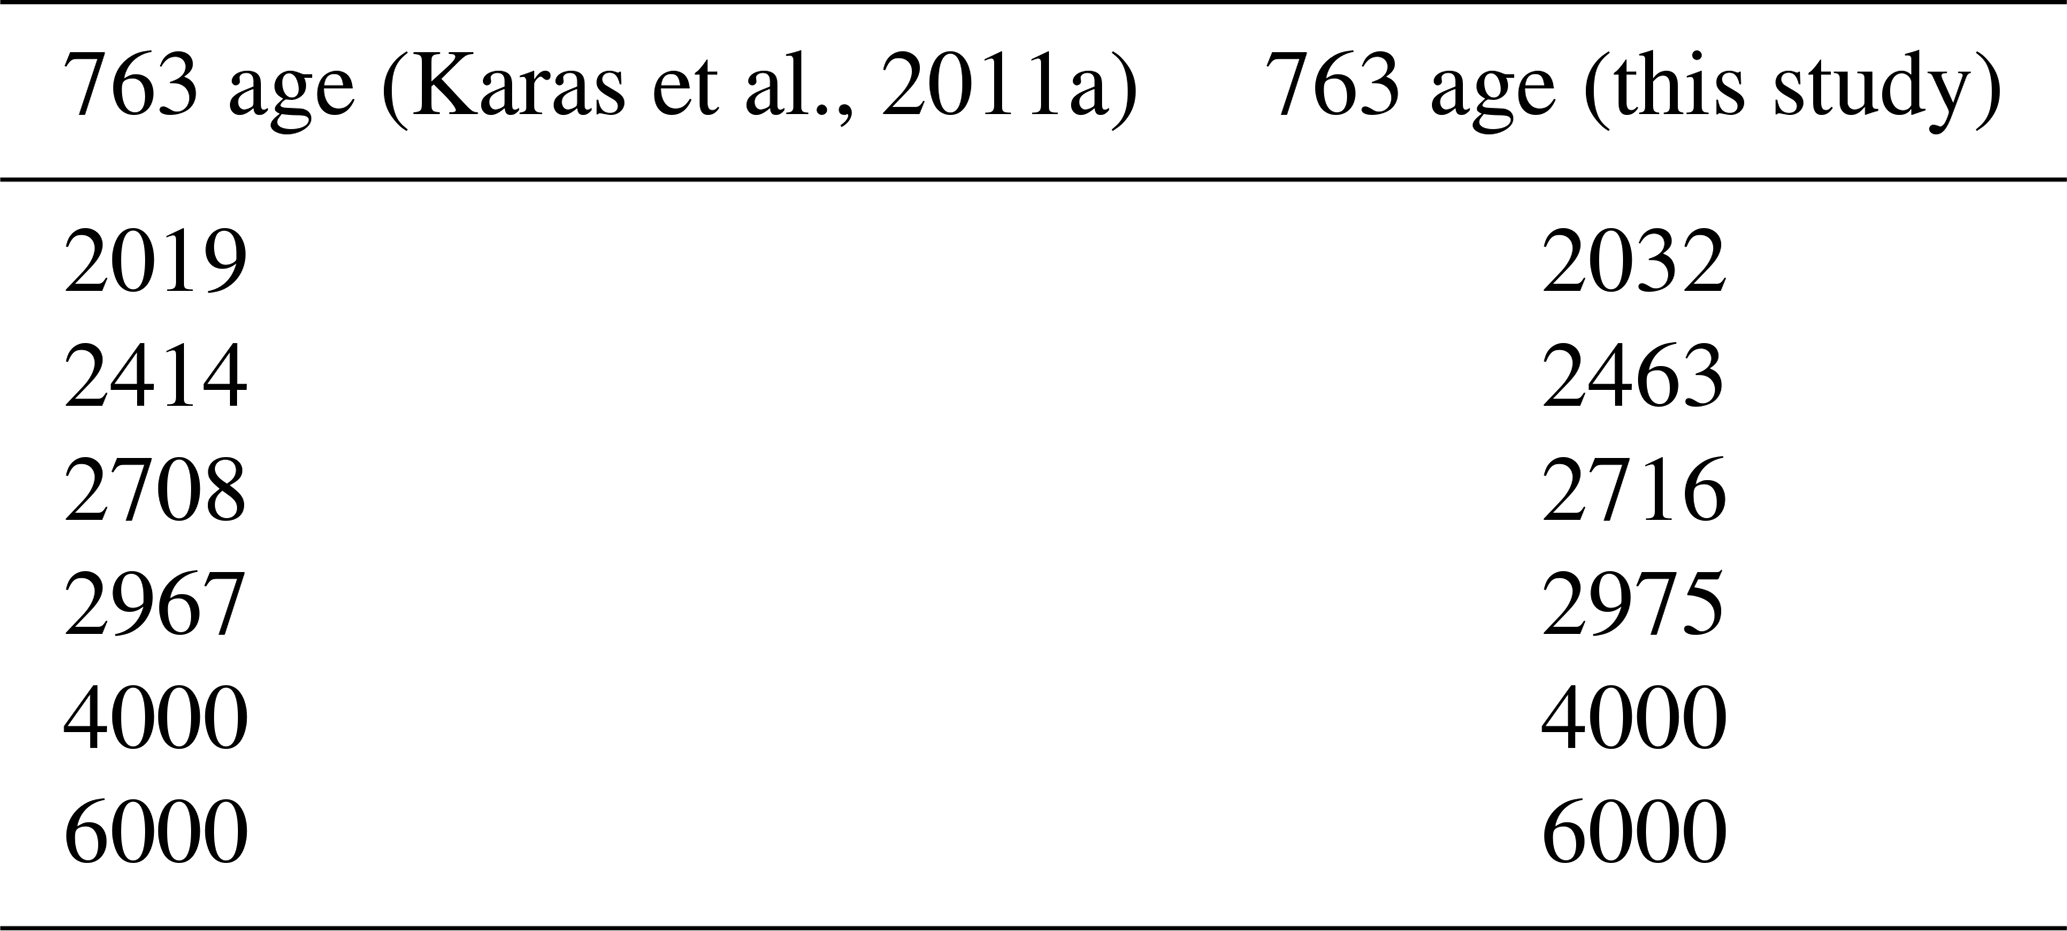
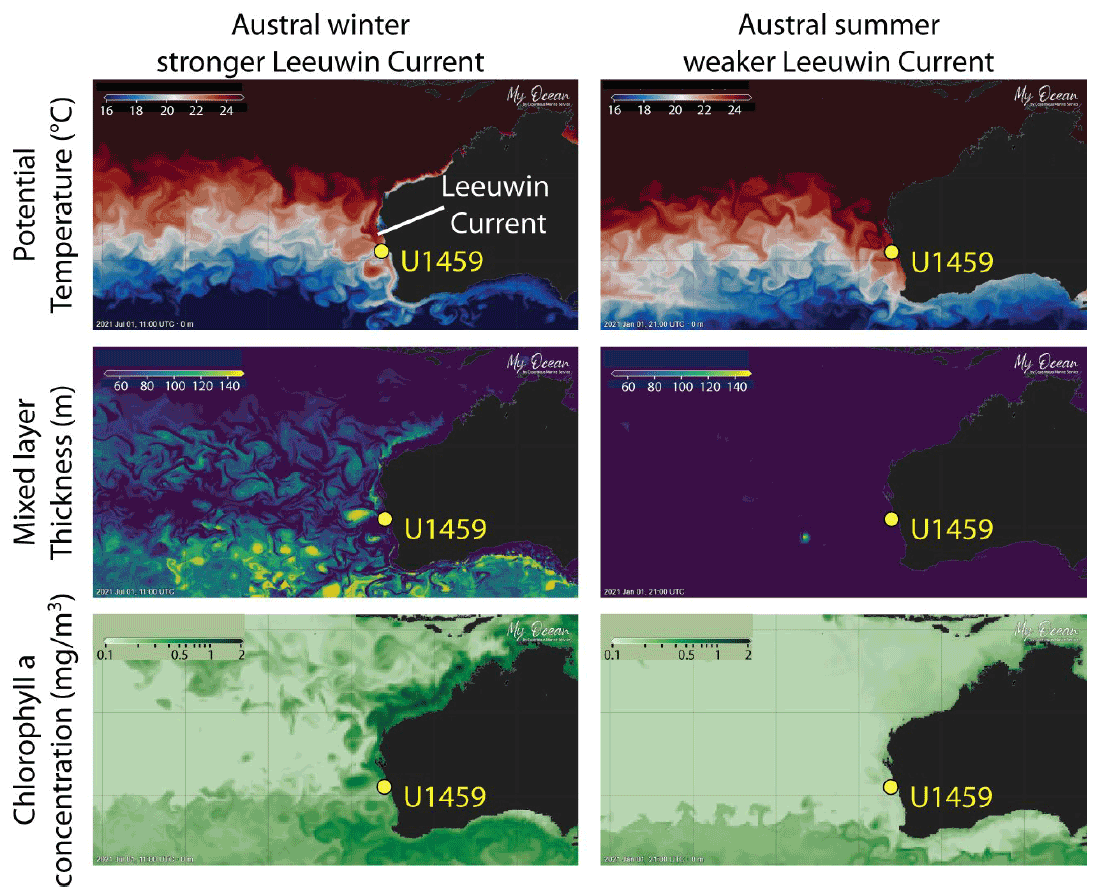
Figure B1Present-day oceanography of the southeastern Indian Ocean. The southward flowing Leeuwin Current is strongest in late autumn and winter. During that season, the Leeuwin Current forms large eddies, causing significant deepening of the mixed layer (up to ∼200 m) and facilitating enhanced primary productivity (shown here are data from 1 July 2021). During austral summer, the Leeuwin Current is weaker (shown here are data from 1 January 2021), with a thinner mixed layer and reduced productivity is reduced. Figure was generated using EU Copernicus Marine Service Information with https://resources.marine.copernicus.eu/product-detail/GLOBAL_ANALYSIS_FORECAST_PHY_001_024/INFORMATION (last access: 22 May 2022) (Zammit-Mangion and Wikle, 2020) and https://resources.marine.copernicus.eu/product-detail/GLOBAL_ANALYSIS_FORECAST_BIO_001_028/INFORMATION (last access: 22 May 2022).

Figure C1Representative SEM images of T. sacculifer in sample U1459A 9FCC 9–24 cm, illustrating their preservation (Gallagher et al., 2017).
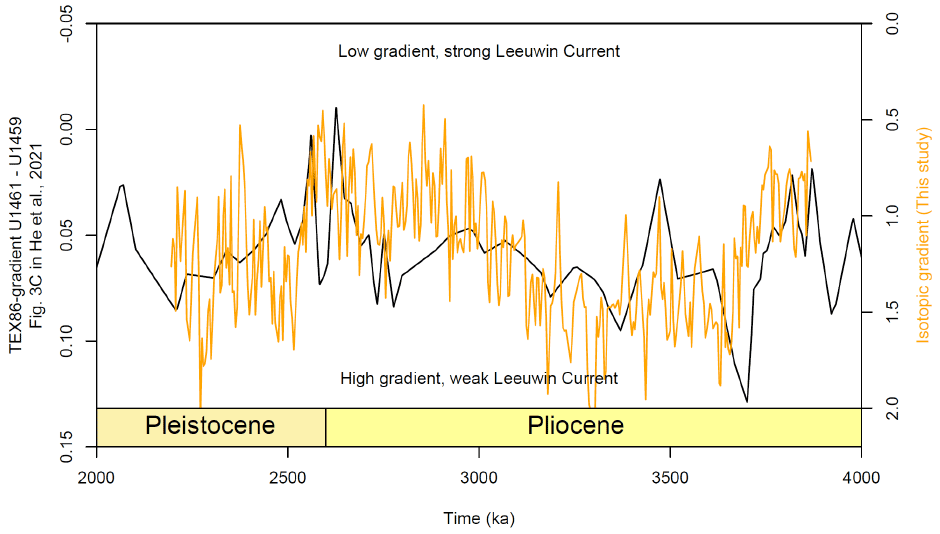
Figure D1Comparison of the TEX86 gradient between sites U1461 and U1459 (as in Fig. 3c in He et al., 2021), and the isotopic gradient from this study. Both proxies are completely independent of each other, yet show similar patterns throughout the Plio-Pleistocene, corroborating the assumption that TEX86 and isotopic gradients along the Leeuwin Current pathway are temperature driven and thus can serve as a proxy for Leeuwin Current intensity.
The R code used to produce Figs. 3 through 8 is available on Zenodo: https://doi.org/10.5281/zenodo.6380452 (De Vleeschouwer et al., 2022b).
Site U1459 clumped-isotope data are permanently archived through EarthChem https://doi.org/10.26022/IEDA/112262 (De Vleeschouwer et al., 2022a). Site U1459 δ18O and δ13C isotope data will be permanently archived through PANGAEA. Site U1459 XRF and TEX86 data are available at https://doi.org/10.1594/PANGAEA.903102 (De Vleeschouwer et al., 2019a). Site U1459 NGR-derived uranium and thorium data are available at https://doi.org/10.1594/IEDA/100668 (De Vleeschouwer, 2017). Site U1463 stable isotope dataset is available at https://doi.org/10.1594/PANGAEA.892422 (De Vleeschouwer et al., 2018a). Site 763 stable isotope dataset is available at https://www.ncei.noaa.gov/pub/data/paleo/contributions_by_author/karas2011/karas2011.txt (last access: 22 May 2022; Karas et al., 2011b).
DDV conceived and directed the study; AF washed and sieved sediment samples, and picked the foraminifera for isotopic analysis; AF and NM carried out sample preparation; MP and MM carried out clumped-isotope measurements in the VUB-AMGC lab, in consultation with SG, CS, and PC. BP carried out the TEX86 measurements at the Max Planck Institute for Chemistry in Mainz. DDV, GA, and BP were shipboard scientists on IODP Expedition 356. DDV, MP, MM, NM, GA, SG, CS, HP, and PC contributed to the interpretation and discussion of the results. DDV wrote the paper with input of all authors.
The contact author has declared that neither they nor their co-authors have any competing interests.
Publisher’s note: Copernicus Publications remains neutral with regard to jurisdictional claims in published maps and institutional affiliations.
This research used samples and data provided by the International Ocean Discovery Program (IODP). We thank all IODP Expedition 356 scientific participants and crew for making this study possible. The VOCATIO Foundation provided funding through a scholarship to David De Vleeschouwer. David De Vleeschouwer also thanks the International Association of Sedimentologists for awarding a 2019 postdoctoral research grant. Research Foundation Flanders (FWO) Hercules funding supported the purchase of the IRMS. Philippe Claeys acknowledges the VUB Strategic Research Program. The Max Plank Society provided funding through a postdoctoral grant to Benjamin Petrick. At the time of analysis, David De Vleeschouwer was a senior scientist funded through the Cluster of Excellence “The Ocean Floor – Earth's Uncharted Interface” (German Science Foundation, DFG). At the time of writing, David De Vleeschouwer is a junior professor at the University of Muenster. We thank Kara Bogus for practical support during XRF scanning, and Aisling Dolan and Caroline Prescott for providing the Pliocene HadCM3 simulations shown in Fig. 2.
This research has been supported by the German Research Foundation (DFG Grant “The Ocean Floor – Earth's Uncharted Interface”), the Research Foundation Flanders (FWO Hercules Funding), VOCATIO, the International Association of Sedimentologists (IAS Postdoctoral Research Grant) and the Max Plank Society.
The article processing charges for this open-access publication were covered by the University of Bremen.
This paper was edited by Erin McClymont and reviewed by Clara Bolton and two anonymous referees.
Amidon, W. H., Fisher, G. B., Burbank, D. W., Ciccioli, P. L., Alonso, R. N., Gorin, A. L., Silverhart, P. H., Kylander-Clark, A. R. C., and Christoffersen, M. S.: Mio-Pliocene aridity in the south-central Andes associated with Southern Hemisphere cold periods, P. Natl. Acad. Sci. USA, 114, 6474–6479, https://doi.org/10.1073/pnas.1700327114, 2017.
Anderson, N. T., Kelson, J. R., Kele, S., Daëron, M., Bonifacie, M., Horita, J., Mackey, T. J., John, C. M., Kluge, T., Petschnig, P., Jost, A. B., Huntington, K. W., Bernasconi, S. M., and Bergmann, K. D.: A Unified Clumped Isotope Thermometer Calibration (0.5–1,100 ∘C) Using Carbonate-Based Standardization, Geophys. Res. Lett., 48, e2020GL092069, https://doi.org/10.1029/2020GL092069, 2021.
Andrae, J. W., McInerney, F. A., Polissar, P. J., Sniderman, J. M. K., Howard, S., Hall, P. A., and Phelps, S. R.: Initial Expansion of C4 Vegetation in Australia During the Late Pliocene, Geophys. Res. Lett., 45, 4831–4840, https://doi.org/10.1029/2018GL077833, 2018.
Auer, G., De Vleeschouwer, D., Smith, R. A., Bogus, K., Groeneveld, J., Grunert, P., Castañeda, I. S., Petrick, B. F., Christensen, B. A., Fulthorpe, C. S., Gallagher, S. J., and Henderiks, J.: Timing and pacing of Indonesian Throughflow restriction and its connection to Late Plioceneclimate shifts, Paleoceanography and Paleoclimatology, 34, 635–657, https://doi.org/10.1029/2018PA003512, 2019.
Auer, G., Petrick, B., Yoshimura, T., Mamo, B. L., Reuning, L., Takayanagi, H., De Vleeschouwer, D., and Martinez-Garcia, A.: Intensified organic carbon burial on the Australian shelf after the Middle Pleistocene transition, Quaternary Sci. Rev., 262, 106965, https://doi.org/10.1016/j.quascirev.2021.106965, 2021.
Barker, S., Greaves, M., and Elderfield, H.: A study of cleaning procedures used for foraminiferal Mg/Ca paleothermometry, Geochem. Geophy. Geosy., 4, 8407, https://doi.org/10.1029/2003GC000559, 2003.
Bé, A. W. H.: Gametogenic calcification in a spinose planktonic foraminifer, Globigerinoides sacculifer (Brady), Mar. Micropaleontol., 5, 283–310, https://doi.org/10.1016/0377-8398(80)90014-6, 1980.
Benthien, A. and Müller, P. J.: Anomalously low alkenone temperatures caused by lateral particle and sediment transport in the Malvinas Current region, western Argentine Basin, Deep-Sea Res. Pt. I, 47, 2369–2393, https://doi.org/10.1016/S0967-0637(00)00030-3, 2000.
Bernasconi, S. M., Daëron, M., Bergmann, K. D., Bonifacie, M., Meckler, A. N., Affek, H. P., Anderson, N., Bajnai, D., Barkan, E., Beverly, E., Blamart, D., Burgener, L., Calmels, D., Chaduteau, C., Clog, M., Davidheiser-Kroll, B., Davies, A., Dux, F., Eiler, J., Elliott, B., Fetrow, A. C., Fiebig, J., Goldberg, S., Hermoso, M., Huntington, K. W., Hyland, E., Ingalls, M., Jaggi, M., John, C. M., Jost, A. B., Katz, S., Kelson, J., Kluge, T., Kocken, I. J., Laskar, A., Leutert, T. J., Liang, D., Lucarelli, J., Mackey, T. J., Mangenot, X., Meinicke, N., Modestou, S. E., Müller, I. A., Murray, S., Neary, A., Packard, N., Passey, B. H., Pelletier, E., Petersen, S., Piasecki, A., Schauer, A., Snell, K. E., Swart, P. K., Tripati, A., Upadhyay, D., Vennemann, T., Winkelstern, I., Yarian, D., Yoshida, N., Zhang, N., and Ziegler, M.: InterCarb: A Community Effort to Improve Interlaboratory Standardization of the Carbonate Clumped Isotope Thermometer Using Carbonate Standards, Geochem. Geophy. Geosy., 22, e2020GC009588, https://doi.org/10.1029/2020GC009588, 2021.
Bohaty, S. M. and Harwood, D. M.: Southern Ocean pliocene paleotemperature variation from high-resolution silicoflagellate biostratigraphy, Mar. Micropaleontol., 33, 241–272, https://doi.org/10.1016/S0377-8398(97)00037-6, 1998.
Bosmans, J. H. C., Hilgen, F. J., Tuenter, E., and Lourens, L. J.: Obliquity forcing of low-latitude climate, Clim. Past, 11, 1335–1346, https://doi.org/10.5194/cp-11-1335-2015, 2015.
Brand, W. A., Assonov, S. S., and Coplen, T. B.: Correction for the 17O interference in δ(13C) measurements when analyzing CO2 with stable isotope mass spectrometry (IUPAC Technical Report), Pure Appl. Chem., 82, 1719–1733, https://doi.org/10.1351/PAC-REP-09-01-05, 2010.
Cane, M. A. and Molnar, P.: Closing of the Indonesian seaway as a precursor to east African aridification around 3-4 million years ago, Nature, 411, 157–162, 2001.
Christensen, B. A., Renema, W., Henderiks, J., De Vleeschouwer, D., Groeneveld, J., Castañeda, I. S., Reuning, L., Bogus, K., Auer, G., Ishiwa, T., McHugh, C. M., Gallagher, S. J., Fulthorpe, C. S., and Scientists, I. E.: Indonesian Throughflow drove Australian climate from humid Pliocene to arid Pleistocene, Geophys. Res. Lett., 44, 6914–6925, https://doi.org/10.1002/2017GL072977, 2017.
Church, J. A., Cresswell, G. R., and Stuart Godfrey, J.: The Leeuwin Current, in: Poleward Flows Along Eastern Ocean Boundaries, edited by: Neshyba, S. J., Mooers, C. N. K., Smith, R. L., and Barber, R. T., Springer New York, New York, NY, 230–254, https://doi.org/10.1007/978-1-4613-8963-7_16, 1989.
Clague, J. J., Barendregt, R. W., Menounos, B., Roberts, N. J., Rabassa, J., Martinez, O., Ercolano, B., Corbella, H., and Hemming, S. R.: Pliocene and Early Pleistocene glaciation and landscape evolution on the Patagonian Steppe, Santa Cruz province, Argentina, Quaternary Sci. Rev., 227, 105992, https://doi.org/10.1016/j.quascirev.2019.105992, 2020.
Cresswell, G. R. and Peterson, J. L.: The Leeuwin Current south of Western Australia, Journal of the Royal Society of Western Australia, 92, 83–100, 2009.
Daëron, M.: Full Propagation of Analytical Uncertainties in Δ47 Measurements, Geochem. Geophy. Geosy., 22, e2020GC009592, https://doi.org/10.1029/2020GC009592, 2021.
Daëron, M., Blamart, D., Peral, M., and Affek, H. P.: Absolute isotopic abundance ratios and the accuracy of Δ47 measurements, Chem. Geol., 442, 83–96, https://doi.org/10.1016/j.chemgeo.2016.08.014, 2016.
De Schepper, S., Gibbard, P. L., Salzmann, U., and Ehlers, J.: A global synthesis of the marine and terrestrial evidence for glaciation during the Pliocene Epoch, Earth-Sci. Rev., 135, 83–102, https://doi.org/10.1016/j.earscirev.2014.04.003, 2014.
De Vleeschouwer, D.: Natural Gamma Radiation-derived K, U and Th contents of marine sediments obtained during IODP Expeditions with DV JOIDES Resolution, Version 1.0, Interdisciplinary Earth Data Alliance (IEDA) [data set], https://doi.org/10.1594/IEDA/100668, 2017.
De Vleeschouwer, D., Dunlea, A. G., Auer, G., Anderson, C. H., Brumsack, H., de Loach, A., Gurnis, M., Huh, Y., Ishiwa, T., Jang, K., Kominz, M. A., März, C., Schnetger, B., Murray, R. W., Pälike, H., and Expedition 356 Shipboard, S.: Quantifying K, U, and Th contents of marine sediments using shipboard natural gamma radiation spectra measured on DV JOIDES Resolution, Geochem. Geophy. Geosy., 18, 1053–1064, https://doi.org/10.1002/2016GC006715, 2017.
De Vleeschouwer, D., Auer, G., Smith, R., Bogus, K. A., Christensen, B. A., Groeneveld, J., Petrick, B. F., Henderiks, J., Castañeda, I. S., O'Brian, E., Ellinghausen, M., Gallagher, S. J., Fulthorpe, C. S., and Pälike, H.: Planktic carbon and oxygen isotopes and NGR-derived K, U and Th data, PANGAEA [data set], https://doi.org/10.1594/PANGAEA.892422, 2018a.
De Vleeschouwer, D., Auer, G., Smith, R., Bogus, K., Christensen, B., Groeneveld, J., Petrick, B., Henderiks, J., Castañeda, I. S., O'Brien, E., Ellinghausen, M., Gallagher, S. J., Fulthorpe, C. S., and Pälike, H.: The amplifying effect of Indonesian Throughflow heat transport on Late Pliocene Southern Hemisphere climate cooling, Earth Planet. Sc. Lett., 500, 15–27, https://doi.org/10.1016/j.epsl.2018.07.035, 2018b.
De Vleeschouwer, D., Petrick, B. F., and Martínez‐García, A.: Biomarkers (TEX86), planktic isotopes and XRF records of IODP Site 356-U1459 (Perth Basin), PANGAEA [data set], https://doi.org/10.1594/PANGAEA.903102, 2019a.
De Vleeschouwer, D., Petrick, B. F., and Martínez-García, A.: Stepwise Weakening of the Pliocene Leeuwin Current, Geophys. Res. Lett., 46, 8310–8319, https://doi.org/10.1029/2019gl083670, 2019b.
De Vleeschouwer, D., Peral, M., and Marchegiano, M.: Clumped isotopes on planktonic foraminiferal calcite from IODP Site U1459 (Plio-Pleistocene), Version 1.0, Interdisciplinary Earth Data Alliance (IEDA) [data set], https://doi.org/10.26022/IEDA/112262, 2022a.
De Vleeschouwer, D., Peral, M., Marchegiano, M., Füllberg, A., Meinicke, N., Pälike, H., Auer, G., Petrick, B., Snoeck, C., Goderis, S., and Claeys, P.: Plio-Pleistocene Perth Basin water temperatures and Leeuwin Current dynamics (Indian Ocean) derived from oxygen and clumped isotope paleothermometry, Zenodo [code], https://doi.org/10.5281/zenodo.6380452, 2022b.
Dodson, J. R. and Macphail, M. K.: Palynological evidence for aridity events and vegetation change during the Middle Pliocene, a warm period in Southwestern Australia, Global Planet. Change, 41, 285–307, https://doi.org/10.1016/j.gloplacha.2004.01.013, 2004.
Dodson, J. R. and Ramrath, A.: An Upper Pliocene lacustrine environmental record from south-Western Australia – preliminary results, Palaeogeogr. Palaeocl., 167, 309–320, https://doi.org/10.1016/S0031-0182(00)00244-3, 2001.
Dolan, A. M., Haywood, A. M., Hunter, S. J., Tindall, J. C., Dowsett, H. J., Hill, D. J., and Pickering, S. J.: Modelling the enigmatic Late Pliocene Glacial Event — Marine Isotope Stage M2, Global Planet. Change, 128, 47–60, https://doi.org/10.1016/j.gloplacha.2015.02.001, 2015.
Duplessy, J. C., Bé, A. W. H., and Blanc, P. L.: Oxygen and carbon isotopic composition and biogeographic distribution of planktonic foraminifera in the Indian Ocean, Palaeogeogr. Palaeocl., 33, 9–46, https://doi.org/10.1016/0031-0182(81)90031-6, 1981.
Elderfield, H., Vautravers, M., and Cooper, M.: The relationship between shell size and Mg/Ca, Sr/Ca, δ18O, and δ13C of species of planktonic foraminifera, Geochem. Geophy. Geosy., 3, 1–13, https://doi.org/10.1029/2001GC000194, 2002.
Erez, J. and Luz, B.: Experimental paleotemperature equation for planktonic foraminifera, Geochim. Cosmochim. Ac., 47, 1025–1031, https://doi.org/10.1016/0016-7037(83)90232-6, 1983.
Escutia, C., Bárcena, M. A., Lucchi, R. G., Romero, O., Ballegeer, A. M., Gonzalez, J. J., and Harwood, D. M.: Circum-Antarctic warming events between 4 and 3.5 Ma recorded in marine sediments from the Prydz Bay (ODP Leg 188) and the Antarctic Peninsula (ODP Leg 178) margins, Global Planet. Change, 69, 170–184, https://doi.org/10.1016/j.gloplacha.2009.09.003, 2009.
Fiebig, J., Daëron, M., Bernecker, M., Guo, W., Schneider, G., Boch, R., Bernasconi, S. M., Jautzy, J., and Dietzel, M.: Calibration of the dual clumped isotope thermometer for carbonates, Geochim. Cosmochim. Ac., 312, 235–256, https://doi.org/10.1016/j.gca.2021.07.012, 2021.
Fujioka, T., Chappell, J., Fifield, L. K., and Rhodes, E. J.: Australian desert dune fields initiated with Pliocene–Pleistocene global climatic shift, Geology, 37, 51–54, 2009.
Gallagher, S. J., Wallace, M. W., Hoiles, P. W., and Southwood, J. M.: Seismic and stratigraphic evidence for reef expansion and onset of aridity on the Northwest Shelf of Australia during the Pleistocene, Mar. Petrol. Geol., 57, 470–481, https://doi.org/10.1016/j.marpetgeo.2014.06.011, 2014.
Gallagher, S. J., Fulthorpe, C. S., Bogus, K., Auer, G., Baranwal, S., Castañeda, I. S., Christensen, B. A., De Vleeschouwer, D., Franco, D. R., Groeneveld, J., Gurnis, M., Haller, C., He, Y., Henderiks, J., Himmler, T., Ishiwa, T., Iwatani, H., Jatiningrum, R. S., Kominz, M. A., Korpanty, C. A., Lee, E. Y., Levin, E., Mamo, B. L., McGregor, H. V., McHugh, C. M., Petrick, B. F., Potts, D. C., Rastegar Lari, A., Renema, W., Reuning, L., Takayanagi, H., and Zhang, W.: Site U1459, in: Indonesian Throughflow, edited by: Gallagher, S. J., Fulthorpe, C. S., Bogus, K., and the Expedition 356 Scientists, Proceedings of the International Ocean Discovery Program 356, College Station, TX, https://doi.org/10.14379/iodp.proc.356.104.2017, 2017.
Godfrey, J. and Ridgway, K.: The large-scale environment of the poleward-flowing Leeuwin Current, Western Australia: longshore steric height gradients, wind stresses and geostrophic flow, J. Phys. Oceanogr., 15, 481–495, 1985.
Grauel, A.-L., Schmid, T. W., Hu, B., Bergami, C., Capotondi, L., Zhou, L., and Bernasconi, S. M.: Calibration and application of the “clumped isotope” thermometer to foraminifera for high-resolution climate reconstructions, Geochim. Cosmochim. Ac., 108, 125–140, https://doi.org/10.1016/j.gca.2012.12.049, 2013.
Groeneveld, J., Henderiks, J., Renema, W., McHugh, C. M., De Vleeschouwer, D., Christensen, B. A., Fulthorpe, C. S., Reuning, L., Gallagher, S. J., Bogus, K., Auer, G., and Ishiwa, T.: Australian shelf sediments reveal shifts in Miocene Southern Hemisphere westerlies, Science Advances, 3, e1602567, https://doi.org/10.1126/sciadv.1602567, 2017.
Groeneveld, J., De Vleeschouwer, D., McCaffrey, J. C., and Gallagher, S. J.: Dating the Northwest Shelf of Australia Since the Pliocene, Geochem. Geophy. Geosy., 22, e2020GC009418, https://doi.org/10.1029/2020GC009418, 2021.
Guo, J., Yuan, H., Song, J., Qu, B., Xing, J., Wang, Q., Li, X., Duan, L., Li, N., and Wang, Y.: Variation of Isoprenoid GDGTs in the Stratified Marine Water Column: Implications for GDGT-Based TEX86 Paleothermometry, Frontiers in Marine Science, 8, 715708, https://doi.org/10.3389/fmars.2021.715708, 2021.
Gurnis, M., Kominz, M., and Gallagher, S. J.: Reversible subsidence on the North West Shelf of Australia, Earth Planet. Sc. Lett., 534, 116070, https://doi.org/10.1016/j.epsl.2020.116070, 2020.
Haq, B. U., Rad, U., O'Connell, S., and Shipboard Scientific Party: Proc. ODP, Init. Repts., 122, Ocean Drilling Program, College Station, TX, USA, https://doi.org/10.2973/odp.proc.ir.122.1990, 1990.
He, Y. and Wang, H.: Terrestrial Material Input to the Northwest Shelf of Australia Through the Pliocene-Pleistocene Period and Its Implications on Continental Climates, Geophys. Res. Lett., 48, e2021GL092745, https://doi.org/10.1029/2021GL092745, 2021.
He, Y., Wang, H., and Liu, Z.: Development of the Leeuwin Current on the northwest shelf of Australia through the Pliocene-Pleistocene period, Earth Planet. Sc. Lett., 559, 116767, https://doi.org/10.1016/j.epsl.2021.116767, 2021.
Herbert, T. D., Lawrence, K. T., Tzanova, A., Peterson, L. C., Caballero-Gill, R., and Kelly, C. S.: Late Miocene global cooling and the rise of modern ecosystems, Nat. Geosci., 9, 843–847, https://doi.org/10.1038/ngeo2813, 2016.
Ho, S. L. and Laepple, T.: Flat meridional temperature gradient in the early Eocene in the subsurface rather than surface ocean, Nat. Geosci., 9, 606–610, https://doi.org/10.1038/ngeo2763, 2016.
John, C. M. and Bowen, D.: Community software for challenging isotope analysis: First applications of “Easotope” to clumped isotopes, Rapid Commun. Mass Sp., 30, 2285–2300, 2016.
Jonkers, L. and Kučera, M.: Global analysis of seasonality in the shell flux of extant planktonic Foraminifera, Biogeosciences, 12, 2207–2226, https://doi.org/10.5194/bg-12-2207-2015, 2015.
Jonkers, L. and Kučera, M.: Quantifying the effect of seasonal and vertical habitat tracking on planktonic foraminifera proxies, Clim. Past, 13, 573–586, https://doi.org/10.5194/cp-13-573-2017, 2017.
Karas, C., Nürnberg, D., Gupta, A. K., Tiedemann, R., Mohan, K., and Bickert, T.: Mid-Pliocene climate change amplified by a switch in Indonesian subsurface throughflow, Nat. Geosci., 2, 434–438, 2009.
Karas, C., Nürnberg, D., Tiedemann, R., and Garbe-Schonberg, D.: Pliocene Indonesian Throughflow and Leeuwin Current dynamics: Implications for Indian Ocean polar heat flux, Paleoceanography, PA2217, 26, https://doi.org/10.1029/2010pa001949, 2011a.
Karas, C., Nürnberg, D., Tiedemann, R., and Garbe-Schönberg, D.: Indian Ocean Pliocene Paired Foraminiferal δ18O and Mg Ca Data, IGBP PAGES/World Data Center for Paleoclimatology [data set], https://www.ncei.noaa.gov/pub/data/paleo/contributions_by_author/karas2011/karas2011.txt (last access: 22 May 2022), 2011b.
Karatsolis, B.-T., De Vleeschouwer, D., Groeneveld, J., Christensen, B., and Henderiks, J.: The Late Miocene to Early Pliocene “Humid Interval” on the NW Australian Shelf: Disentangling Climate Forcing From Regional Basin Evolution, Paleoceanography and Paleoclimatology, 35, e2019PA003780, https://doi.org/10.1029/2019pa003780, 2020.
Kato, Y.: Diatom-based reconstruction of the Subantarctic Front migrations during the late Miocene and Pliocene, Mar. Micropaleontol., 160, 101908, https://doi.org/10.1016/j.marmicro.2020.101908, 2020.
Kim, J.-H., van der Meer, J., Schouten, S., Helmke, P., Willmott, V., Sangiorgi, F., Koç, N., Hopmans, E. C., and Damsté, J. S. S.: New indices and calibrations derived from the distribution of crenarchaeal isoprenoid tetraether lipids: Implications for past sea surface temperature reconstructions, Geochim. Cosmochim. Ac., 74, 4639–4654, https://doi.org/10.1016/j.gca.2010.05.027, 2010.
Kocken, I. J., Müller, I. A., and Ziegler, M.: Optimizing the Use of Carbonate Standards to Minimize Uncertainties in Clumped Isotope Data, Geochem. Geophy. Geosy., 20, 5565–5577, https://doi.org/10.1029/2019GC008545, 2019.
Krebs, U., Park, W., and Schneider, B.: Pliocene aridification of Australia caused by tectonically induced weakening of the Indonesian throughflow, Palaeogeogr. Palaeocl., 309, 111–117, https://doi.org/10.1016/j.palaeo.2011.06.002, 2011.
Kretschmer, K., Jonkers, L., Kucera, M., and Schulz, M.: Modeling seasonal and vertical habitats of planktonic foraminifera on a global scale, Biogeosciences, 15, 4405–4429, https://doi.org/10.5194/bg-15-4405-2018, 2018.
Kuhnt, W., Holbourn, A., Xu, J., Opdyke, B., De Deckker, P., Röhl, U., and Mudelsee, M.: Southern Hemisphere control on Australian monsoon variability during the late deglaciation and Holocene, Nat. Commun., 6, 5916, https://doi.org/10.1038/ncomms6916, 2015.
Kuroyanagi, A. and Kawahata, H.: Vertical distribution of living planktonic foraminifera in the seas around Japan, Mar. Micropaleontol., 53, 173–196, https://doi.org/10.1016/j.marmicro.2004.06.001, 2004.
Laskar, J., Robutel, P., Joutel, F., Gastineau, M., Correia, A., and Levrard, B.: A long-term numerical solution for the insolation quantities of the Earth, Astron. Astrophys., 428, 261–285, 2004.
Lisiecki, L. E. and Raymo, M. E.: A Pliocene-Pleistocene stack of 57 globally distributed benthic δ18O records, Paleoceanography, 20, PA1003, https://doi.org/10.1029/2004PA001071, 2005.
Martínez-Garcia, A., Rosell-Melé, A., McClymont, E. L., Gersonde, R., and Haug, G. H.: Subpolar Link to the Emergence of the Modern Equatorial Pacific Cold Tongue, Science, 328, 1550–1553, https://doi.org/10.1126/science.1184480, 2010.
McCaffrey, J. C., Wallace, M. W., and Gallagher, S. J.: A Cenozoic Great Barrier Reef on Australia's North West shelf, Global Planet. Change, 184, 103048, https://doi.org/10.1016/j.gloplacha.2019.103048, 2020.
Meckler, A. N., Ziegler, M., Millán, M. I., Breitenbach, S. F. M., and Bernasconi, S. M.: Long-term performance of the Kiel carbonate device with a new correction scheme for clumped isotope measurements, Rapid Commun. Mass Sp., 28, 1705–1715, https://doi.org/10.1002/rcm.6949, 2014.
Meinicke, N., Ho, S. L., Hannisdal, B., Nürnberg, D., Tripati, A., Schiebel, R., and Meckler, A. N.: A robust calibration of the clumped isotopes to temperature relationship for foraminifers, Geochim. Cosmochim. Ac., 270, 160–183, https://doi.org/10.1016/j.gca.2019.11.022, 2020.
Meinicke, N., Reimi, M. A., Ravelo, A. C., and Meckler, A. N.: Coupled Mg/Ca and Clumped Isotope Measurements Indicate Lack of Substantial Mixed Layer Cooling in the Western Pacific Warm Pool During the Last ∼5 Million Years, Paleoceanography and Paleoclimatology, 36, e2020PA004115, https://doi.org/10.1029/2020PA004115, 2021.
Mohtadi, M., Oppo, D. W., Lückge, A., DePol-Holz, R., Steinke, S., Groeneveld, J., Hemme, N., and Hebbeln, D.: Reconstructing the thermal structure of the upper ocean: Insights from planktic foraminifera shell chemistry and alkenones in modern sediments of the tropical eastern Indian Ocean, Paleoceanography, 26, PA3219, https://doi.org/10.1029/2011PA002132, 2011.
Pearce, A.: Eastern boundary currents of the southern hemisphere, Journal of the Royal Society of Western Australia, 74, 35–45, 1991.
Peral, M., Daëron, M., Blamart, D., Bassinot, F., Dewilde, F., Smialkowski, N., Isguder, G., Bonnin, J., Jorissen, F., Kissel, C., Michel, E., Vázquez Riveiros, N., and Waelbroeck, C.: Updated calibration of the clumped isotope thermometer in planktonic and benthic foraminifera, Geochim. Cosmochim. Ac., 239, 1–16, https://doi.org/10.1016/j.gca.2018.07.016, 2018.
Peral, M., Bassinot, F., Daëron, M., Blamart, D., Bonnin, J., Jorissen, F., Kissel, C., Michel, E., Waelbroeck, C., Rebaubier, H., and Gray, W. R.: On the combination of the planktonic foraminiferal Mg/Ca, clumped (Δ47) and conventional (δ18O) stable isotope paleothermometers in palaeoceanographic studies, EarthArXiv, 3235, https://doi.org/10.31223/X5VK82, in review, 2022.
Petersen, S. V., Defliese, W. F., Saenger, C., Daëron, M., Huntington, K. W., John, C. M., Kelson, J. R., Bernasconi, S. M., Colman, A. S., Kluge, T., Olack, G. A., Schauer, A. J., Bajnai, D., Bonifacie, M., Breitenbach, S. F. M., Fiebig, J., Fernandez, A. B., Henkes, G. A., Hodell, D., Katz, A., Kele, S., Lohmann, K. C., Passey, B. H., Peral, M. Y., Petrizzo, D. A., Rosenheim, B. E., Tripati, A., Venturelli, R., Young, E. D., and Winkelstern, I. Z.: Effects of Improved 17O Correction on Interlaboratory Agreement in Clumped Isotope Calibrations, Estimates of Mineral-Specific Offsets, and Temperature Dependence of Acid Digestion Fractionation, Geochem. Geophy. Geosy., 20, 3495–3519, https://doi.org/10.1029/2018GC008127, 2019.
Petrick, B., McClymont, E. L., Littler, K., Rosell-Melé, A., Clarkson, M. O., Maslin, M., Röhl, U., Shevenell, A. E., and Pancost, R. D.: Oceanographic and climatic evolution of the southeastern subtropical Atlantic over the last 3.5 Ma, Earth Planet. Sc. Lett., 492, 12–21, https://doi.org/10.1016/j.epsl.2018.03.054, 2018.
Petrick, B., Martínez-García, A., Auer, G., Reuning, L., Auderset, A., Deik, H., Takayanagi, H., De Vleeschouwer, D., Iryu, Y., and Haug, G. H.: Glacial Indonesian Throughflow weakening across the Mid-Pleistocene Climatic Transition, Scientific Reports, 9, 16995, https://doi.org/10.1038/s41598-019-53382-0, 2019.
Piasecki, A., Bernasconi, S. M., Grauel, A.-L., Hannisdal, B., Ho, S. L., Leutert, T. J., Marchitto, T. M., Meinicke, N., Tisserand, A., and Meckler, N.: Application of Clumped Isotope Thermometry to Benthic Foraminifera, Geochem. Geophy. Geosy., 20, 2082–2090, https://doi.org/10.1029/2018GC007961, 2019.
Prescott, C. L., Dolan, A. M., Haywood, A. M., Hunter, S. J., and Tindall, J. C.: Regional climate and vegetation response to orbital forcing within the mid-Pliocene Warm Period: A study using HadCM3, Global Planet. Change, 161, 231–243, https://doi.org/10.1016/j.gloplacha.2017.12.015, 2018.
Rebotim, A., Voelker, A. H. L., Jonkers, L., Waniek, J. J., Meggers, H., Schiebel, R., Fraile, I., Schulz, M., and Kucera, M.: Factors controlling the depth habitat of planktonic foraminifera in the subtropical eastern North Atlantic, Biogeosciences, 14, 827–859, https://doi.org/10.5194/bg-14-827-2017, 2017.
Reynolds, R. W., Rayner, N. A., Smith, T. M., Stokes, D. C., and Wang, W.: An Improved In Situ and Satellite SST Analysis for Climate, J. Climate, 15, 1609–1625, https://doi.org/10.1175/1520-0442, 2002.
Ridgway, K. R. and Godfrey, J. S.: The source of the Leeuwin Current seasonality, J. Geophys. Res.-Oceans, 120, 6843–6864, https://doi.org/10.1002/2015JC011049, 2015.
Rippert, N., Nürnberg, D., Raddatz, J., Maier, E., Hathorne, E., Bijma, J., and Tiedemann, R.: Constraining foraminiferal calcification depths in the western Pacific warm pool, Mar. Micropaleontol., 128, 14–27, https://doi.org/10.1016/j.marmicro.2016.08.004, 2016.
Rohling, E. J., Yu, J., Heslop, D., Foster, G. L., Opdyke, B., and Roberts, A. P.: Sea level and deep-sea temperature reconstructions suggest quasi-stable states and critical transitions over the past 40 million years, Science Advances, 7, eabf5326, https://doi.org/10.1126/sciadv.abf5326, 2021.
Smith, R. A., Castañeda, I. S., Groeneveld, J., De Vleeschouwer, D., Henderiks, J., Christensen, B. A., Renema, W., Auer, G., Bogus, K., Gallagher, S. J., and Fulthorpe, C. S.: Plio–Pleistocene Indonesian Throughflow variability drove Eastern Indian Ocean sea surface temperatures, Paleoceanography and Paleoclimatology, 35, e2020PA003872, https://doi.org/10.1029/2020pa003872, 2020.
Sniderman, J. M. K., Woodhead, J. D., Hellstrom, J., Jordan, G. J., Drysdale, R. N., Tyler, J. J., and Porch, N.: Pliocene reversal of late Neogene aridification, P. Natl. Acad. Sci. USA, 113, 1999–2004, https://doi.org/10.1073/pnas.1520188113, 2016.
Spooner, M. I., De Deckker, P., Barrows, T. T., and Fifield, L. K.: The behaviour of the Leeuwin Current offshore NW Australia during the last five glacial–interglacial cycles, Global Planet. Change, 75, 119–132, https://doi.org/10.1016/j.gloplacha.2010.10.015, 2011.
Stainbank, S., Spezzaferri, S., De Boever, E., Bouvier, A.-S., Chilcott, C., de Leau, E. S., Foubert, A., Kunkelova, T., Pichevin, L., Raddatz, J., Rüggeberg, A., Wright, J. D., Yu, S. M., Zhang, M., and Kroon, D.: Assessing the impact of diagenesis on foraminiferal geochemistry from a low latitude, shallow-water drift deposit, Earth Planet. Sc. Lett., 545, 116390, https://doi.org/10.1016/j.epsl.2020.116390, 2020.
Stuut, J.-B. W., Temmesfeld, F., and De Deckker, P.: A 550 ka record of aeolian activity near North West Cape, Australia: inferences from grain-size distributions and bulk chemistry of SE Indian Ocean deep-sea sediments, Quaternary Sci. Rev., 83, 83–94, https://doi.org/10.1016/j.quascirev.2013.11.003, 2014.
Stuut, J.-B. W., De Deckker, P., Saavedra-Pellitero, M., Bassinot, F., Drury, A. J., Walczak, M. H., Nagashima, K., and Murayama, M.: A 5.3-Million-Year History of Monsoonal Precipitation in Northwestern Australia, Geophys. Res. Lett., 46, 6946–6954, https://doi.org/10.1029/2019GL083035, 2019.
Tagliaro, G., Fulthorpe, C. S., Gallagher, S. J., McHugh, C. M., Kominz, M., and Lavier, L. L.: Neogene siliciclastic deposition and climate variability on a carbonate margin: Australian Northwest Shelf, Mar. Geol., 403, 285–300, https://doi.org/10.1016/j.margeo.2018.06.007, 2018.
Takahashi, K. and Be, A. W. H.: Planktonic foraminifera: factors controlling sinking speeds, Deep-Sea Res., 31, 1477–1500, https://doi.org/10.1016/0198-0149(84)90083-9, 1984.
Thomson, D. J.: Spectrum Estimation and Harmonic-Analysis, P. IEEE, 70, 1055–1096, 1982.
Tierney, J. E. and Tingley, M. P.: A Bayesian, spatially-varying calibration model for the TEX86 proxy, Geochim. Cosmochim. Ac., 127, 83–106, https://doi.org/10.1016/j.gca.2013.11.026, 2014.
Waite, A. M., Thompson, P. A., Pesant, S., Feng, M., Beckley, L. E., Domingues, C. M., Gaughan, D., Hanson, C. E., Holl, C. M., Koslow, T., Meuleners, M., Montoya, J. P., Moore, T., Muhling, B. A., Paterson, H., Rennie, S., Strzelecki, J., and Twomey, L.: The Leeuwin Current and its eddies: An introductory overview, Deep-Sea Res. Pt. II, 54, 789–796, https://doi.org/10.1016/j.dsr2.2006.12.008, 2007.
Westerhold, T., Marwan, N., Drury, A. J., Liebrand, D., Agnini, C., Anagnostou, E., Barnet, J. S. K., Bohaty, S. M., De Vleeschouwer, D., Florindo, F., Frederichs, T., Hodell, D. A., Holbourn, A. E., Kroon, D., Lauretano, V., Littler, K., Lourens, L. J., Lyle, M., Pälike, H., Röhl, U., Tian, J., Wilkens, R. H., Wilson, P. A., and Zachos, J. C.: An astronomically dated record of Earth's climate and its predictability over the last 66 million years, Science, 369, 1383–1387, https://doi.org/10.1126/science.aba6853, 2020.
Wycech, J. B., Kelly, D. C., Kitajima, K., Kozdon, R., Orland, I. J., and Valley, J. W.: Combined Effects of Gametogenic Calcification and Dissolution on ä18O Measurements of the Planktic Foraminifer Trilobatus sacculifer, Geochem. Geophy. Geosy., 19, 4487–4501, https://doi.org/10.1029/2018GC007908, 2018.
Wyrwoll, K.-H., Greenstein, B. J., and Kendrick, G.: The palaeoceanography of the Leeuwin Current: implications for a future world, Journal of the Royal Society of Western Australia, 92, 37–51, 2009.
Zammit-Mangion, A. and Wikle, C. K.: Deep integro-difference equation models for spatio-temporal forecasting, Spatial Statistics, 37, 100408, https://doi.org/10.1016/j.spasta.2020.100408, 2020.
Zhang, P., Zuraida, R., Rosenthal, Y., Holbourn, A., Kuhnt, W., and Xu, J.: Geochemical characteristics from tests of four modern planktonic foraminiferal species in the Indonesian Throughflow region and their implications, Geosci. Front., 10, 505–516, https://doi.org/10.1016/j.gsf.2018.01.011, 2019.
- Abstract
- Introduction
- Materials and methods
- Results
- Discussion
- Conclusions
- Appendix A: Age–depth models of IODP Site U1459 and ODP Site 763
- Appendix B: Present-day oceanography of the southeastern Indian Ocean
- Appendix C: T. sacculifer scanning electron microscope images
- Appendix D: TEX86 and isotopic gradients along the Leeuwin Current pathway as a proxy for Leeuwin Current intensity
- Code availability
- Data availability
- Author contributions
- Competing interests
- Disclaimer
- Acknowledgements
- Financial support
- Review statement
- References