the Creative Commons Attribution 4.0 License.
the Creative Commons Attribution 4.0 License.
 | 24 May 2022
Prospects for dendroanatomy in paleoclimatology – a case study on Picea engelmannii from the Canadian Rockies
Kristina Seftigen
Marina V. Fonti
Brian Luckman
Miloš Rydval
Petter Stridbeck
Georg von Arx
Rob Wilson
Jesper Björklund
The continuous development of new proxies as well as a refinement of existing tools are key to advances in paleoclimate research and improvements in the accuracy of existing climate reconstructions. Herein, we build on recent methodological progress in dendroanatomy, the analyses of wood anatomical parameters in dated tree rings, and introduce the longest (1585–2014 CE) dendroanatomical dataset currently developed for North America. We explore the potential of dendroanatomy of high-elevation Engelmann spruce (Picea engelmannii) as a proxy of past temperatures by measuring anatomical cell dimensions of 15 living trees from the Columbia Icefield area. X-ray maximum latewood density (MXD) and its blue intensity counterpart (MXBI) have previously been measured, allowing comparison between the different parameters. Our findings highlight anatomical MXD and maximum radial cell wall thickness as the two most promising wood anatomical proxy parameters for past temperatures, each explaining 46 % and 49 %, respectively, of detrended instrumental July–August maximum temperatures over the 1901–1994 period. While both parameters display comparable climatic imprinting at higher frequencies to X-ray derived MXD, the anatomical dataset distinguishes itself from its predecessors by providing the most temporally stable warm season temperature signal. Further studies, including samples from more diverse age cohorts and the adaptation of the regional curve standardization method, are needed to disentangle the ontogenetic and climatic components of long-term signals stored in the wood anatomical traits and to more comprehensively evaluate the potential contribution of this new dataset to paleoclimate research.
- Article
(9039 KB) - Full-text XML
-
Supplement
(1430 KB) - BibTeX
- EndNote


Tree rings form the backbone of high-resolution paleoclimatology of the Common Era by providing precisely dated, annually resolved, spatially widespread and easily accessible archives of climate proxy data. Tree-ring archives make up more than half of all publicly available temperature proxy records and are greatly influential in multi-proxy hemispheric-scale temperature reconstructions (PAGES 2k Consortium, 2017). They are vital for spatially explicit mapping of the Medieval Climate Anomaly, the Little Ice Age, and other important climate periods (e.g., PAGES 2k Consortium, 2013), and the study of temporally distinct cooling events caused by volcanic eruptions (e.g., Schneider et al., 2015; Stoffel et al., 2015; Wilson et al., 2016). Moreover, tree-ring-based climate reconstructions play a key role in many of the emerging proxy model comparison efforts (e.g., Phipps et al., 2013; Seftigen et al., 2017; Luterbacher et al., 2016; Goosse, 2017; Pages k-PMIP3 group, 2015).
The most frequently and successfully used tree-ring parameters for the study of past temperature variations at high latitudes and altitudes are ring width and maximum latewood density or simply maximum density (MXD) (e.g., Esper et al., 2018). While ring width is the most easily acquired proxy of year to year variations in climate, the parameter often proves difficult to interpret as it may represent distorted transformations of the underlying climate (e.g., Lücke et al., 2019; Frank et al., 2010). In particular, ring width may exhibit amplified low-frequency signals (von Storch et al., 2004) resulting from lagged growth processes in response to climatic (Esper et al., 2015) or non-climatic processes (Rydval et al., 2015). Consequently, the presence of prominent decadal variability should not be taken as evidence of corresponding variability distribution in climate observations, and an overestimation of low-frequency signals is often observed (e.g., Franke et al., 2013; Seftigen et al., 2017; Wilson et al., 2016). The MXD parameter, in contrast, generally contains a stronger climate signal with higher signal-to-noise ratios (e.g., Ljungqvist et al., 2020; Briffa et al., 2002) as well as less biological persistence (Esper et al., 2015) and age-related signal muting (Konter et al., 2016), and is less influenced by stand disturbances (Rydval et al., 2018). However, a number of recent studies (Björklund et al., 2019, 2020; Edwards et al., 2022) have proposed the accuracy of the MXD parameter to be sensitive to measurement resolution. Björklund et al. (2019) showed that increasingly lower resolution of MXD data could result in an increased artificial similarity to the climate response of ring width, and thus that several of the issues facing ring width as a climate proxy may also represent constraints on the MXD parameter.
To reduce uncertainties, future reconstruction efforts could profit from the development of new proxy types and parameters for paleoclimatology, as well as new and expanding methodologies. Recently, dendroanatomy, the analysis of wood anatomical traits in dated tree rings (Pacheco et al., 2018; Fonti et al., 2010), has become more accessible through semi-automated approaches to quantify wood cell anatomy (Prendin et al., 2017; von Arx and Carrer, 2014; von Arx et al., 2016). Analysis of anatomical cell dimensions is now possible at the scale required for high-quality climate reconstruction over centuries to millennia (Björklund et al., 2020). Unlike ring width, anatomical traits of temperature-limited conifers appear to be less affected by biological memory effects and are imprinted with strong and mechanistically grounded temperature signals (Björklund et al., 2019; Cuny et al., 2019, 2014). Moreover, cell anatomical measurements have unprecedentedly high temporal resolution relying on the base unit of the xylem, the tracheid cell, and their biological foundations and functional links are comparably well understood (e.g., Bouche et al., 2014; Pittermann et al., 2011; Wilkinson et al., 2015).
In this article, we aim to explore the value of dendroanatomy for high-elevation Engelmann spruce (Picea engelmannii) trees as a proxy of past temperatures. We make use of tree samples from the Columbia Icefield area of the Canadian Rockies (Fig. 1), a site known for hosting the longest (950–1994 CE) available temperature-sensitive tree-ring densitometric collections for boreal North America (Luckman and Wilson, 2005; Luckman et al., 1997). The Icefield collection, originally comprising ring width and MXD measurements, has previously been used in regional (Luckman, 1997, 2000; St. George and Luckman, 2001) and hemispheric-scale (Briffa et al., 2002; Esper et al., 2002; Mann et al., 1999; D'Arrigo et al., 2006) temperature reconstructions, including the recent large-scale Northern Hemisphere summer temperature reconstruction syntheses (Wilson et al., 2016; Anchukaitis et al., 2017; Schneider et al., 2015). The analysis of the new dendroanatomical dataset produced here includes an assessment of its signal strength and the imprint of temperature within a number of wood anatomical traits spanning the period 1585–2014 CE. We detail common variance amongst selected anatomical parameters and emphasize the reconstruction potential of this dataset. The availability of MXD from the Columbia Icefield area (Luckman and Wilson, 2005; Luckman et al., 1997), produced with the Walesch Electronic Dendro2003 technique (Eschbach et al., 1995) and its predecessor (Schweingruber et al., 1978) (hereafter referred to as X-ray MXD), and latewood blue intensity (referred to as MXBI, McCarroll et al., 2002) measurements allow an optimal opportunity for testing the accuracy and potential advantages of dendroanatomical parameters as climate proxies. This work is part of a larger ongoing collaborative effort dedicated to developing a network of long (∼ 500–1000 years) dendroanatomical chronologies across the Northern Hemisphere. The ultimate ambition of this initiative is to sharpen signal interpretations of the dendrochronological records and to optimize seasonal and temporal fidelity of the proxy-based reconstructions in order to revise (or reinforce) previous conclusions about preindustrial climate variability and the mechanisms causing this variability. This work also represents a first step towards a millennium long anatomical P. engelmannii dataset for the Columbia Icefield area, Canada.
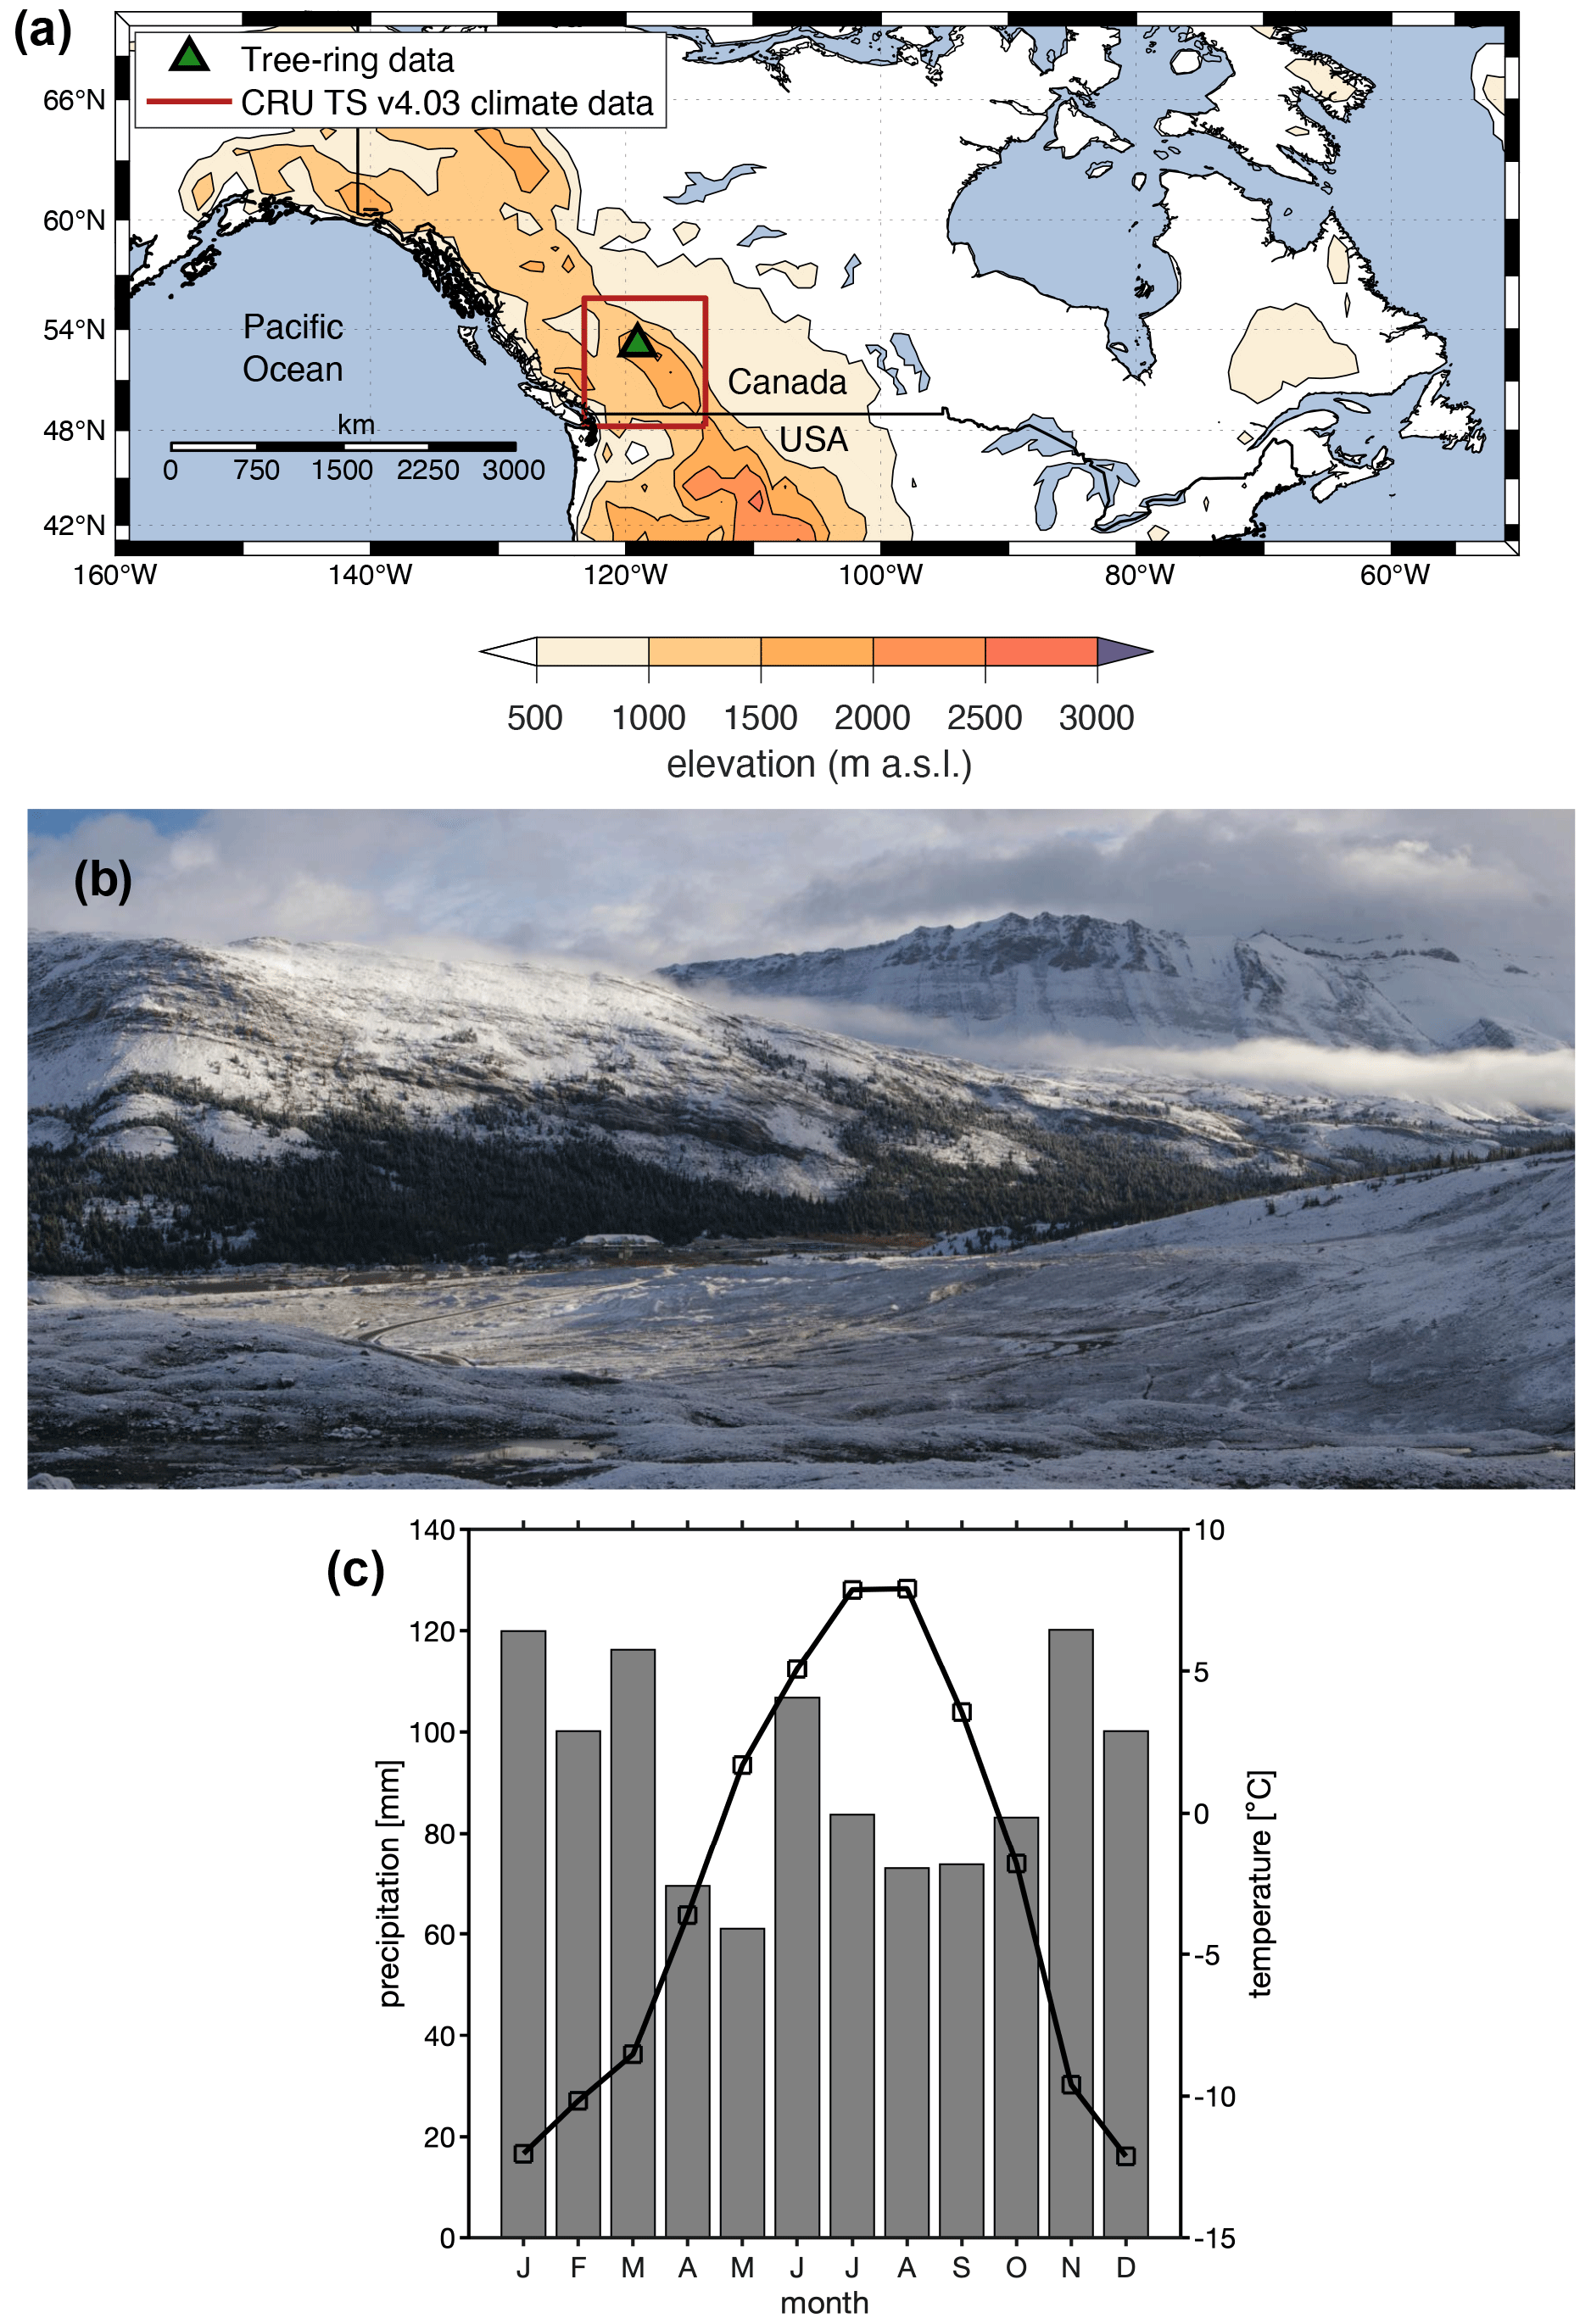
Figure 1(a) Location of the Columbia Icefield site, Canadian Rockies, where tree cores for dendroanatomical measurements were collected in 2015. (b) The tree-ring sampling site at the Columbia Icefield. The view is to the north from the Athabasca Glacier forefield in September 2018. The 2015 samples were obtained from sites east and west of the Icefield Centre (building located in the middle of the image). The Athabasca Glacier extended to the foot of the slope in the left of the photo in the 1840s. (c) Monthly mean temperature (black line) and total precipitation (gray bars) (1970–2018 averages) for the CRU TS v4.03 grid point (52.25∘ N, 117.25∘ W) covering the Columbia Icefield area.
2.1 Sample preparation and dendroanatomical measurements
A total of 15 living P. engelmannii trees (1 core per tree) were selected for dendroanatomical measurements from a collection sampled in 2015, from tree-line sites (2000–2100 m a.s.l.) adjacent to the Athabasca Glacier in the Columbia Icefield area of the Canadian Rockies (52.13∘ N, 117.14∘ W, Fig. 1). The selection of cores was based on (1) the visual appearance of the material (cores with obvious defects were avoided), (2) the temporal coverage of the series (we strived to have an even replication through time) and, (3) the common signal strength of the ring width measurements (in general, cores with higher than average correlation with the master chronology built from all the other series were selected for wood anatomy). The selection was primarily dictated by factors (1) and (2), and only secondarily by factor (3).
Wood cores were refluxed in alcohol for 24 h using a Soxhlet apparatus to remove resin and other soluble substances, and subsequently embedded in paraffin using a Tissue Processor TP1020 and Histocore Arcadia Embedding Center (Leica, Germany). A rotary microtome RM2245 (Leica Biosystems, Germany), equipped with N35 disposable microtome blades (Feather, Japan), were used to cut 12 µm thick transverse sections from the wood cores. The thin sections were stained with a 1:1 safranin-astrablue solution and mounted on slides with Euparal (Carl Roth, Germany), following standard procedures (von Arx et al., 2016). Digital images from each section were taken with a Zeiss Axio Scan Z1 (Carl Zeiss, Germany) at a resolution of 2.3 pixels µm−1. Tree ring borders and individual tracheid cells were then semi-automatically identified, and ring width as well as the position and anatomical dimension of each tracheid cell were measured in the digital images using the image analysis software ROXAS (v3.1) (von Arx and Carrer, 2014). The anatomical parameters included, for instance, cell lumen area and cell wall thickness (CWT), where the latter was measured in four directions to obtain the average cell wall thickness, i.e., two radial and two tangential cell walls per tracheid cell (Prendin et al., 2017). Each tree ring was divided into 20 µm wide bands parallel to the ring border (the tangential extension of each band encompasses ∼ 75–100 tracheids). In order to minimize the influence of outliers, for each anatomical parameter the values of all cells corresponding to the 75th percentile within each 20 µm-wide band were retained for further analysis, i.e., from the cells within the radial and tangential extension of each band, the 75th percentile of each cell dimension was calculated, building up intra-annual measurement profiles of CWT, lumen area, and other anatomical traits. The maximum parameters (e.g., Max. radial CWT) thus retain the highest value of the profile for each year, the minimum parameters retain the lowest value of the profile for each year, and the earlywood and latewood parameters retain the average value of the profile for the earlywood and latewood portions of the ring, respectively. The anatomical density was derived as the ratio of wall area to overall cell area (i.e., including both wall and lumen area) in each 20 µm wide band. Mork's index (Denne, 1989) was used to separate the earlywood and the latewood portions of the ring. For further details regarding the dendroanatomical measurements, see Björklund et al. (2020).
2.2 Chronology development
From the potentially large number of possible dendroanatomical parameters, we narrowed down subsequent analyses to seven parameters of anatomical dimensions, and three wood density parameters based on anatomical dimensions, which are directly comparable to X-ray and MXBI-based microdensitometric parameters. The parameters are listed in Table 1. For comparative purposes, we also retained X-ray derived measurements of MXD (Luckman and Wilson, 2005), and the previously unpublished latewood blue intensity counterpart (MXBI) measured on P. engelmannii from the Columbia Icefield area. The X-ray MXD was produced using radiodensitometric techniques (Schweingruber et al., 1978) from 1.2 mm-thick laths, cut using a twin-blade saw along the tree cores but perpendicular to the fiber direction (see Luckman and Wilson, 2005 for details). For the production of MXBI, the methodology outlined in Rydval et al. (2014) was adopted. The MXBI measurements were conducted using the CooRecorder software (ver. 8.1) (http://www.cybis.se/forfun/dendro/index.htm, last access: 12 January 2021). Corresponding time series of ring width were also obtained and hereafter referred to as original ring width, as opposed to ROXAS ring-width, which were measured in the ROXAS program on the 15 cores used for the dendroanatomical measurements. The X-ray MXD and MXBI datasets were originally developed from living trees and snag material; however, to ensure consistency for the parameter comparison, we used X-ray MXD, MXBI and original ring width measurements from living trees only (X-ray MXD: N=78 series, MXBI: N=182, and original ring width: N=182, see Table 1). The dendroanatomical analysis was performed on tree cores for which original ring width and MXBI measurements were available. Thus, an additional subset based on the 15 trees was retained for the latter 2 parameters to also ensure a direct comparison with the dendroanatomical chronologies. For the full MXBI dataset (N=182), we additionally derived eight partly overlapping percentile chronologies based on absolute ring width (Fig. S1 in the Supplement), to assess whether a similar ring width dependence as previously reported by Björklund et al. (2019) from northern Fennoscandia could also be detected in the Icefield dataset, i.e., ring width-related differences of MXBI measurements taken in narrow versus wide rings. The following ring width percentile intervals were used: 0–30th, 10th–40th, 20th–50th, 30th–60th, 40th–70th, 50th–80th, 60th–90th, and 70th–100th to derive the subsampled MXBI chronologies. Thus, for example, the 70th–100th percentile chronology is computed from MXBI values measured in the 30 % widest rings, while the 0–30th percentile chronology corresponds to MXBI values from the 30 % of the narrowest rings. Unfortunately, it was not possible to conduct a similar comparative analysis for the X-ray MXD as the corresponding ring width measurements originally developed were unavailable to us in the current study.
Since the analysis was performed on data derived from a cohort of same-aged living trees, capturing low-frequency variability (i.e., decadal and longer) with regional curve standardization (RCS) type methods is a challenge (e.g., Briffa et al., 1992). This is because living trees only, share potential climate signal on lower frequencies even if they are aligned by cambial age (trend in signal) (Briffa and Melvin, 2011). Any attempt, even using signal-free approaches, will provide indices that likely would have to be revised when implementing the same technique on a large multigenerational dataset, and ultimately reflect certainty where there is little. Thus, we primarily focused here on the year to year signals in the tree ring anatomical parameters. To emphasize the interannual variations, the individual dendroanatomical series were detrended in the program MATLAB (version R2021a), by (1) fitting a cubic smoothing spline function with 50 % frequency response cut-off at 35 years to the raw tree ring series (Cook and Peters, 1981), (2) subtracting the fitted values from the observed values to obtain detrended series (division was used to standardize the ring width measurements), and finally (3) averaging the detrended series by simple arithmetic mean to produce the final parameter-specific chronologies (hereafter referred to as detrended data). The same detrending procedure was performed on the MXBI, X-ray derived MXD and original ring width series in order to obtain data that are comparable with the dendroanatomical datasets. All chronologies were truncated to the 1700–1994 period in the subsequent analyses to ensure a consistent overlap between datasets as well as a sample depth ranging between 9 and 15 cores for the anatomical dataset.
2.3 Statistical methods
To evaluate the strength of the between-series common signal and establish the replication needed to obtain mean chronologies meeting the commonly accepted standard, we used the RBAR (defined as the mean Pearson's correlation coefficient between all possible pairs of individual tree ring series) (Wigley et al., 1984) and expressed population signal (EPS) (Briffa et al., 1992) statistics. To assess the degree to which the various parameters co-vary, principal component analysis (PCA) and pairwise correlations were computed over the 1700–1994 period.
Detrended tree ring parameter chronologies were assessed for their relationship to regional monthly mean (Tmean) and maximum (Tmax) temperatures, by correlation against the monthly gridded CRU TS v4.03 dataset (Harris et al., 2020) for the grid point average bounded by the latitude and longitude coordinates 48.25–55.75∘ N/113.75–123.25∘ W (Figs. 1, 2). The Tmax was included in the analysis because previous work has demonstrated slightly stronger calibration statistics than for Tmean when using MXD and ring width chronologies for climate reconstruction in this region (e.g., Wilson and Luckman, 2003; Heeter et al., 2021; Wilson et al., 2019, 2014). The associations with monthly precipitation totals and minimum temperatures were also tested, but not included here due to weak significant empirical relationships. The lack of precipitation sensitivity of P. engelmanni in the Icefield area was already noted in St. George and Luckman, 2001, which is not surprising as the trees are growing in temperature-limited upper tree-line environments. Pearson's correlations were calculated between parameter-specific chronologies and monthly meteorological variables over the 1901–1994 period, and the 1901–1948 and 1949–1994 subperiods to evaluate temporal stability of the climate responses. A paired t test was used to test whether the calibration statistics differed between tree ring parameters and sub-periods. To make the climate sensitivity analysis comparable to previous studies from the Columbia Icefield area, we also included the homogenized (1895–present) 50×50 km gridded temperature data (Zhang et al., 2000; Vincent and Gullett, 1999) originally developed by the Meteorological Service of Canada and previously used in Luckman and Wilson (2005) to reconstruct last-millennium summer temperatures for the Canadian Rockies. Similar to Luckman and Wilson (2005), we used the mean of four grids closest to the Columbia Icefield area. Calibration trials with these data are provided in the supplement (Figs. S2 and S3). To ensure the climate analysis was not affected by long-term trends, all temperature data were filtered prior to analysis using the same 35-year filter as was used to detrend the tree ring parameters (henceforth referred to as detrended data).
Furthermore, the dynamic nature of the temperature signal (i.e., optimal target season and its temporal stability) was evaluated through moving window correlation analysis between detrended tree ring chronologies and detrended average daily temperature data (grid 52.5∘ N, 118.5∘ W) from the Berkeley Earth dataset (http://berkeleyearth.org/data/, last access: 31 January 2021) (Rohde and Hausfather, 2020) covering the 1880–recent period. Pearson's correlations were computed for 30-year sliding windows with a 1-year offset. For each 30-year block, temperatures were averaged in 30 d long windows which were shifted at daily time steps throughout the year (sensu Jevšenak and Levanič, 2018).
3.1 Picea engelmannii dendroanatomy characteristics
Besides the conventional width parameters (i.e., ring width, earlywood and latewood width, referred to as ROXAS in Table 1), seven anatomical parameters and three anatomically-based density parameters were retained for analysis. Basic chronology assessments of detrended data over the common 1700–1994 CE period are provided in Table 1, and non-detrended mean chronologies for selected parameters are shown in Fig. 2. In line with previous work by Björklund et al. (2020) on temperature-sensitive conifers, we found that maximum radial cell wall thickness (Max. radial CWT) and anatomical MXD (aMXD) are the two anatomical parameters with the highest mean inter-series correlation (RBAR = 0.47 and 0.48, respectively). For both parameters, EPS reaches the 0.85 threshold (Wigley et al., 1984) with 6 series (Table 1). Notably, these values are of comparable strength to the RBAR and EPS of X-ray based MXD (RBAR = 0.49, 6 trees required for EPS = 0.85). By comparison, the RBAR for MXBI is surprisingly low at 0.19 and the replication needed to attain the EPS of 0.85 is 24 series. These MXBI chronology statistics are lower than for ring width (RBAR = 0.22 and 0.28 for original and ROXAS ring width, respectively), an observation noted previously by Rydval et al. (2014) and Wilson et al. (2019). The RBAR and EPS values for MXBI slightly decrease if computed only on the 15 trees that have been preselected for the dendroanatomical analysis. This is surprising given that the selection of the cores for dendroanatomy was partly based on its ring width signal strength (see Sect. 2.1), and that the RBAR and EPS statistics for ring width actually improve when narrowing the analyses down to these 15 trees (see Table 1). Although the BI-based density parameters typically require a larger sample size than ring width (e.g., Blake et al., 2020; Wilson et al., 2021) for a robust chronology, the MXBI chronology statistics obtained for P. engelmannii from our site are still lower than the previously reported MXBI findings for the same species across British Columbia, Canada (Wilson et al., 2014).
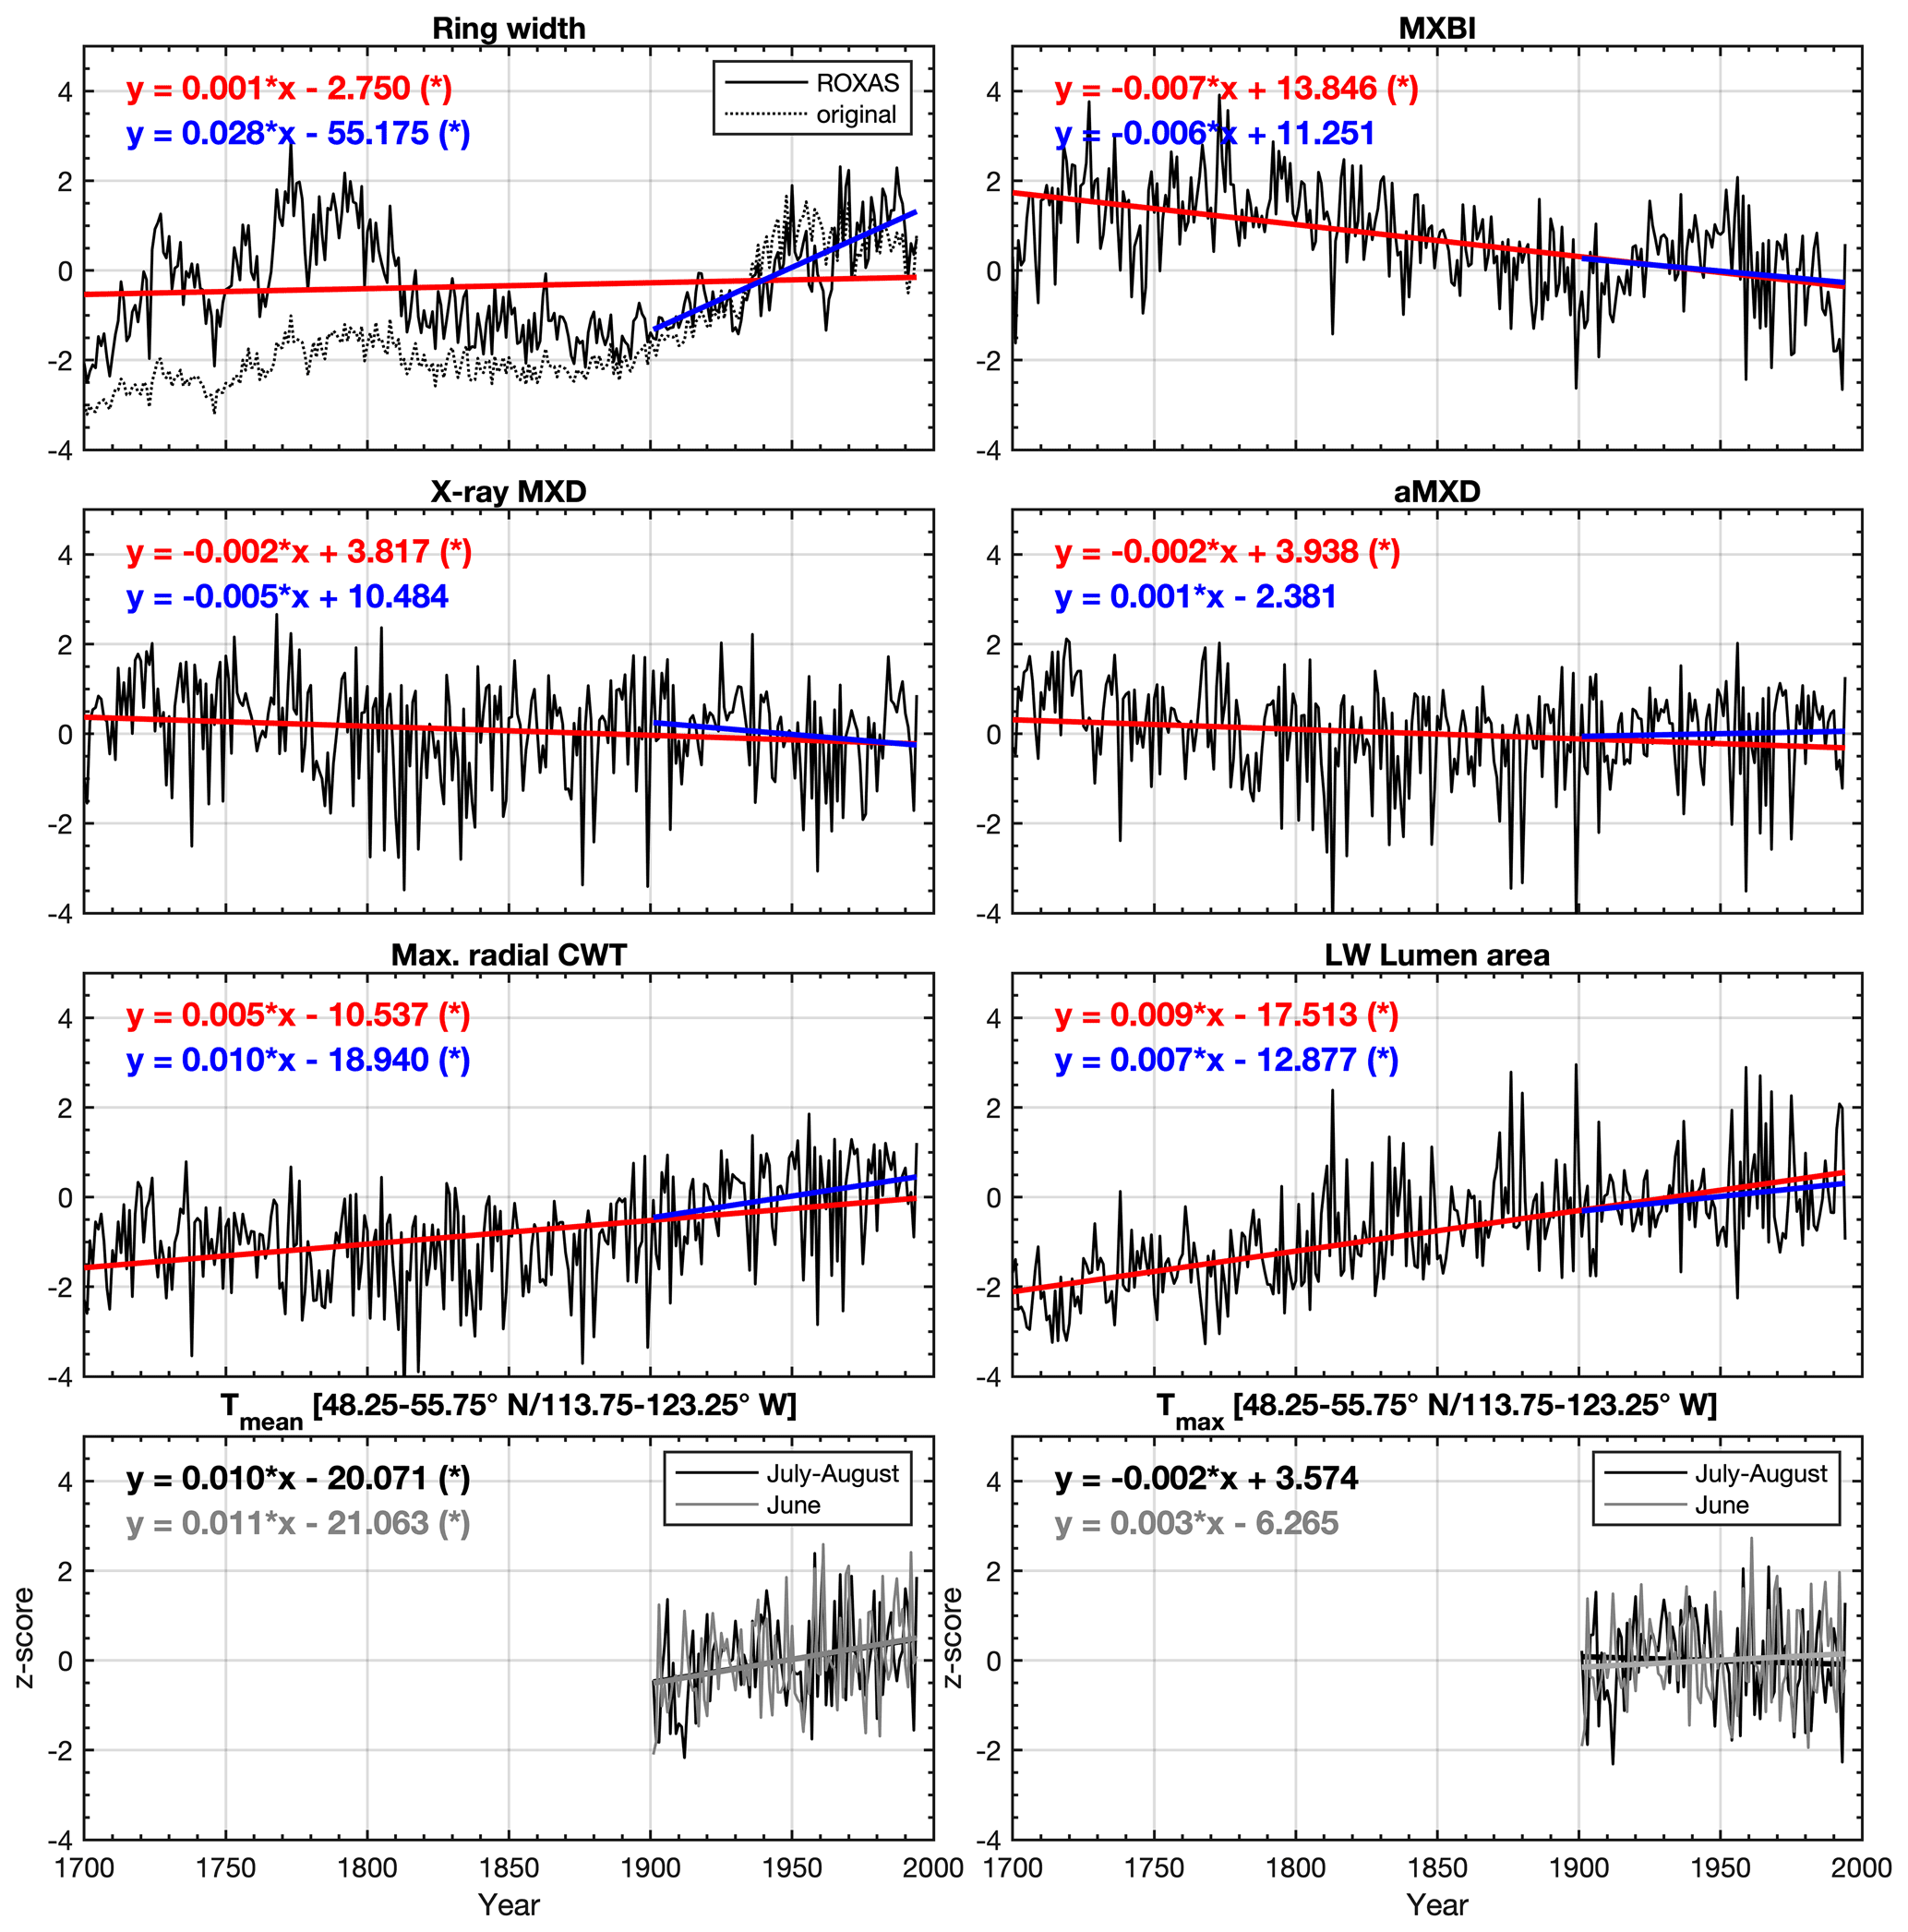
Figure 2Average non-detrended time series of selected tree ring parameters, z-scored over the 1901–1994 reference period. The blue and red lines show the linear trends over the 1901–1994 and 1700–1994 periods, respectively. Seasonally averaged June–August (48.25–55.75∘ N/113.75–123.25∘ W CRU TS v4.03 subset average) mean (Tmean) and maximum (Tmax) temperatures are provided for comparison. * significant trend (α=0.05) estimated by the Mann–Kendall trend detection test. LW latewood, CWT cell wall thickness, aLWD anatomical latewood density and aMXD anatomical maximum latewood density. See Fig. S4 for full 1586–2015 CE period chronologies.
Notably, several anatomical and density parameters are found to exhibit a relatively low common signal, yet a reasonably strong temperature sensitivity (see Sect. 3.2). These include, in decreasing order of signal strength: earlywood (EW) cell wall area (RBAR = 0.13), EW lumen area (RBAR = 0.12), EW density (RBAR = 0.10), EW cell area (RBAR = 0.09) and latewood (LW) cell area (RBAR = 0.09). The replication required to attain robust EPS statistics ranges between 38 (EW cell wall area) and 57 trees (EW cell area and LW cell area).
Table 1Basic summary statistics for each detrended parameter chronology, based on the common 1700–1994 period. EW earlywood, LW latewood, CWT cell wall thickness, aLWD anatomical latewood density and aMXD anatomical maximum latewood density. Estimations of the number of trees needed to reach the arbitrary EPS threshold level of 0.85 are derived from the EPS equation (see Wigley et al., 1984) using the RBAR statistic for each tree ring parameter. Parameters highlighted in italics are those requiring the lowest sample replication to reach the threshold level.
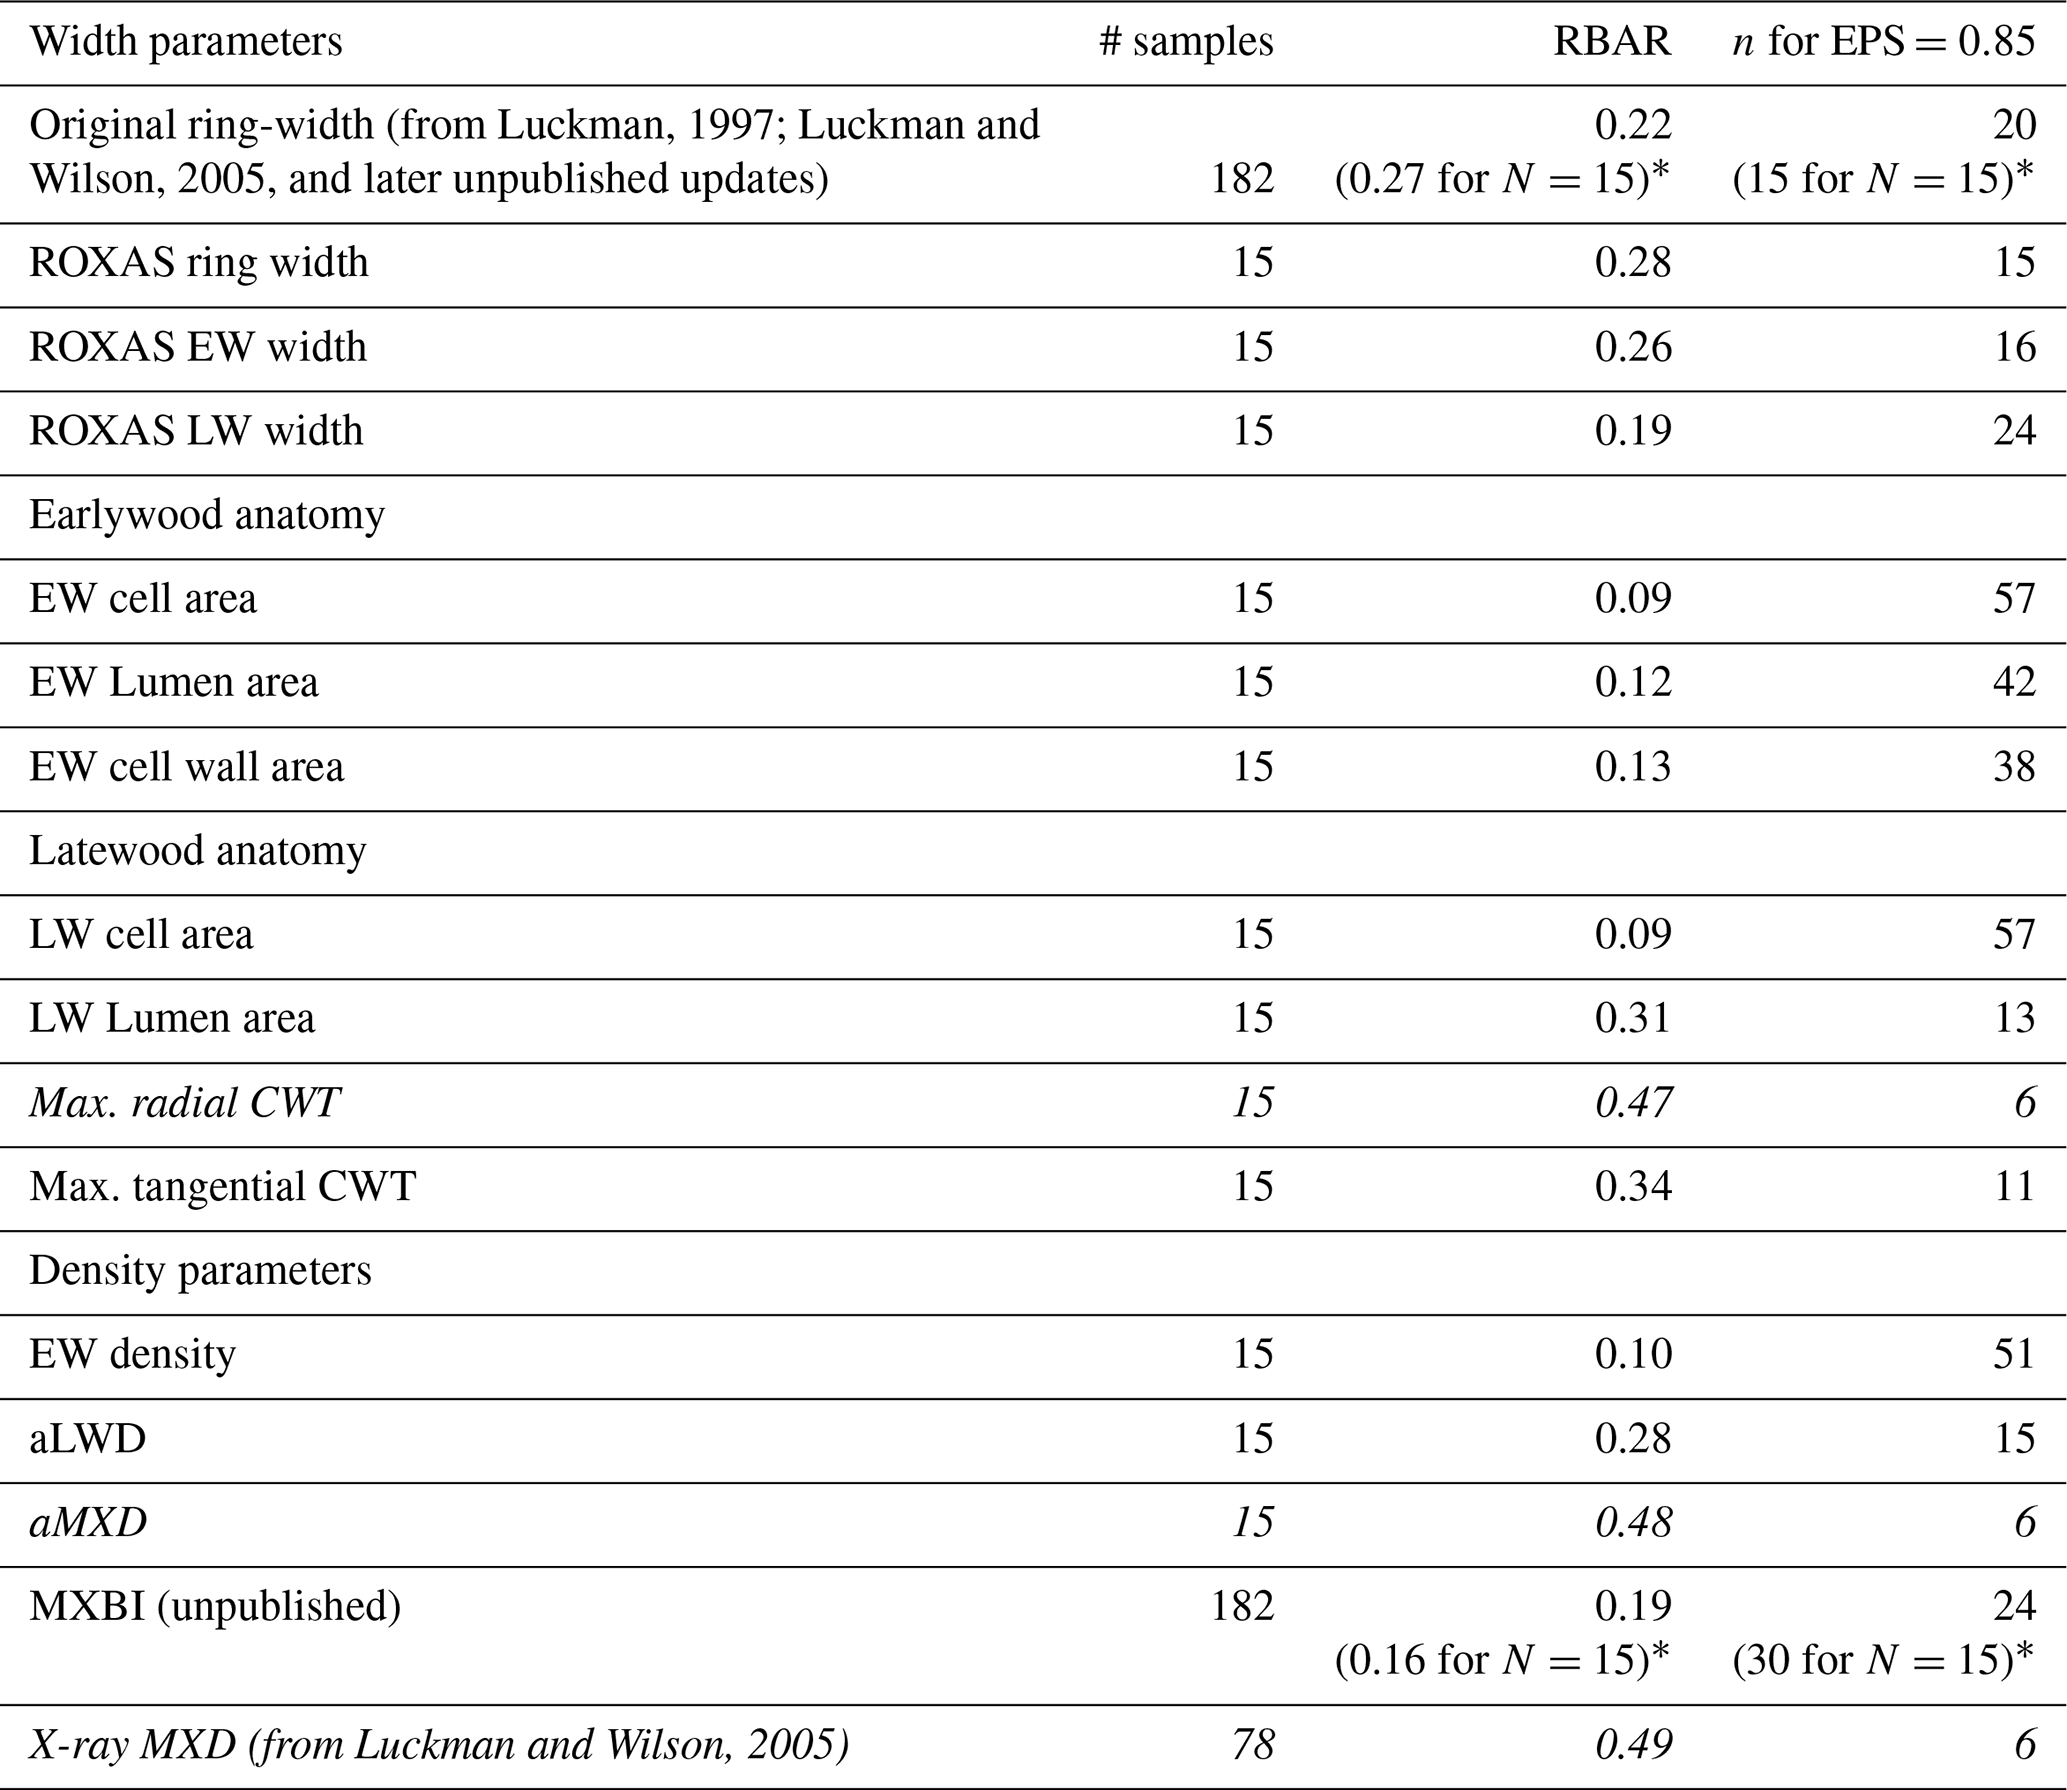
* The RBAR and EPS values in parentheses are for the original ring width and MXBI time series computed for exactly the same 15 trees that have been used to produce the wood anatomy datasets.
The co-variability between the various parameters over the common 1700–1994 period was assessed through principal component analysis and pairwise correlations (Fig. 3). The first two components together represent 68.1 % of the total variation. The PC1 alone explains 43.8 % of variance, and is dominated by latewood-related parameters, including both anatomy and density parameters. We found that aMXD, Max. radial CWT and X-ray MXD cluster together in the bivariate plot, showing that all three parameters express comparable signals (also corroborated by the correlation matrix in Fig. 3b). The MXBI also loads strongly positively on PC1, but slightly separates from this cluster by being positively correlated to PC2. Among the LW density-related components, MXBI is the parameter best correlated with ring width and latewood width chronologies (Fig. 3b), although these correlations are only moderate (, ). The principal component analysis including the subsampled MXBI percentile chronologies based on the absolute corresponding ring widths reveal that the correlation coefficients against the latewood width, and to some degree also ring width, successively increase for the “narrow-ring MXBI chronologies” (Fig. S5). The “wide-ring MXBI chronologies” (i.e., ∼ 50th–100th percentiles) are, on the other hand, more similar to the aLWD, Max. radial CWT, aMXD and X-ray MXD chronologies. This observed ring width inclination of MXBI suggests that the dataset might be subject to a resolution bias (Björklund et al., 2019). More detail on this issue is given in Sect. 3.4.
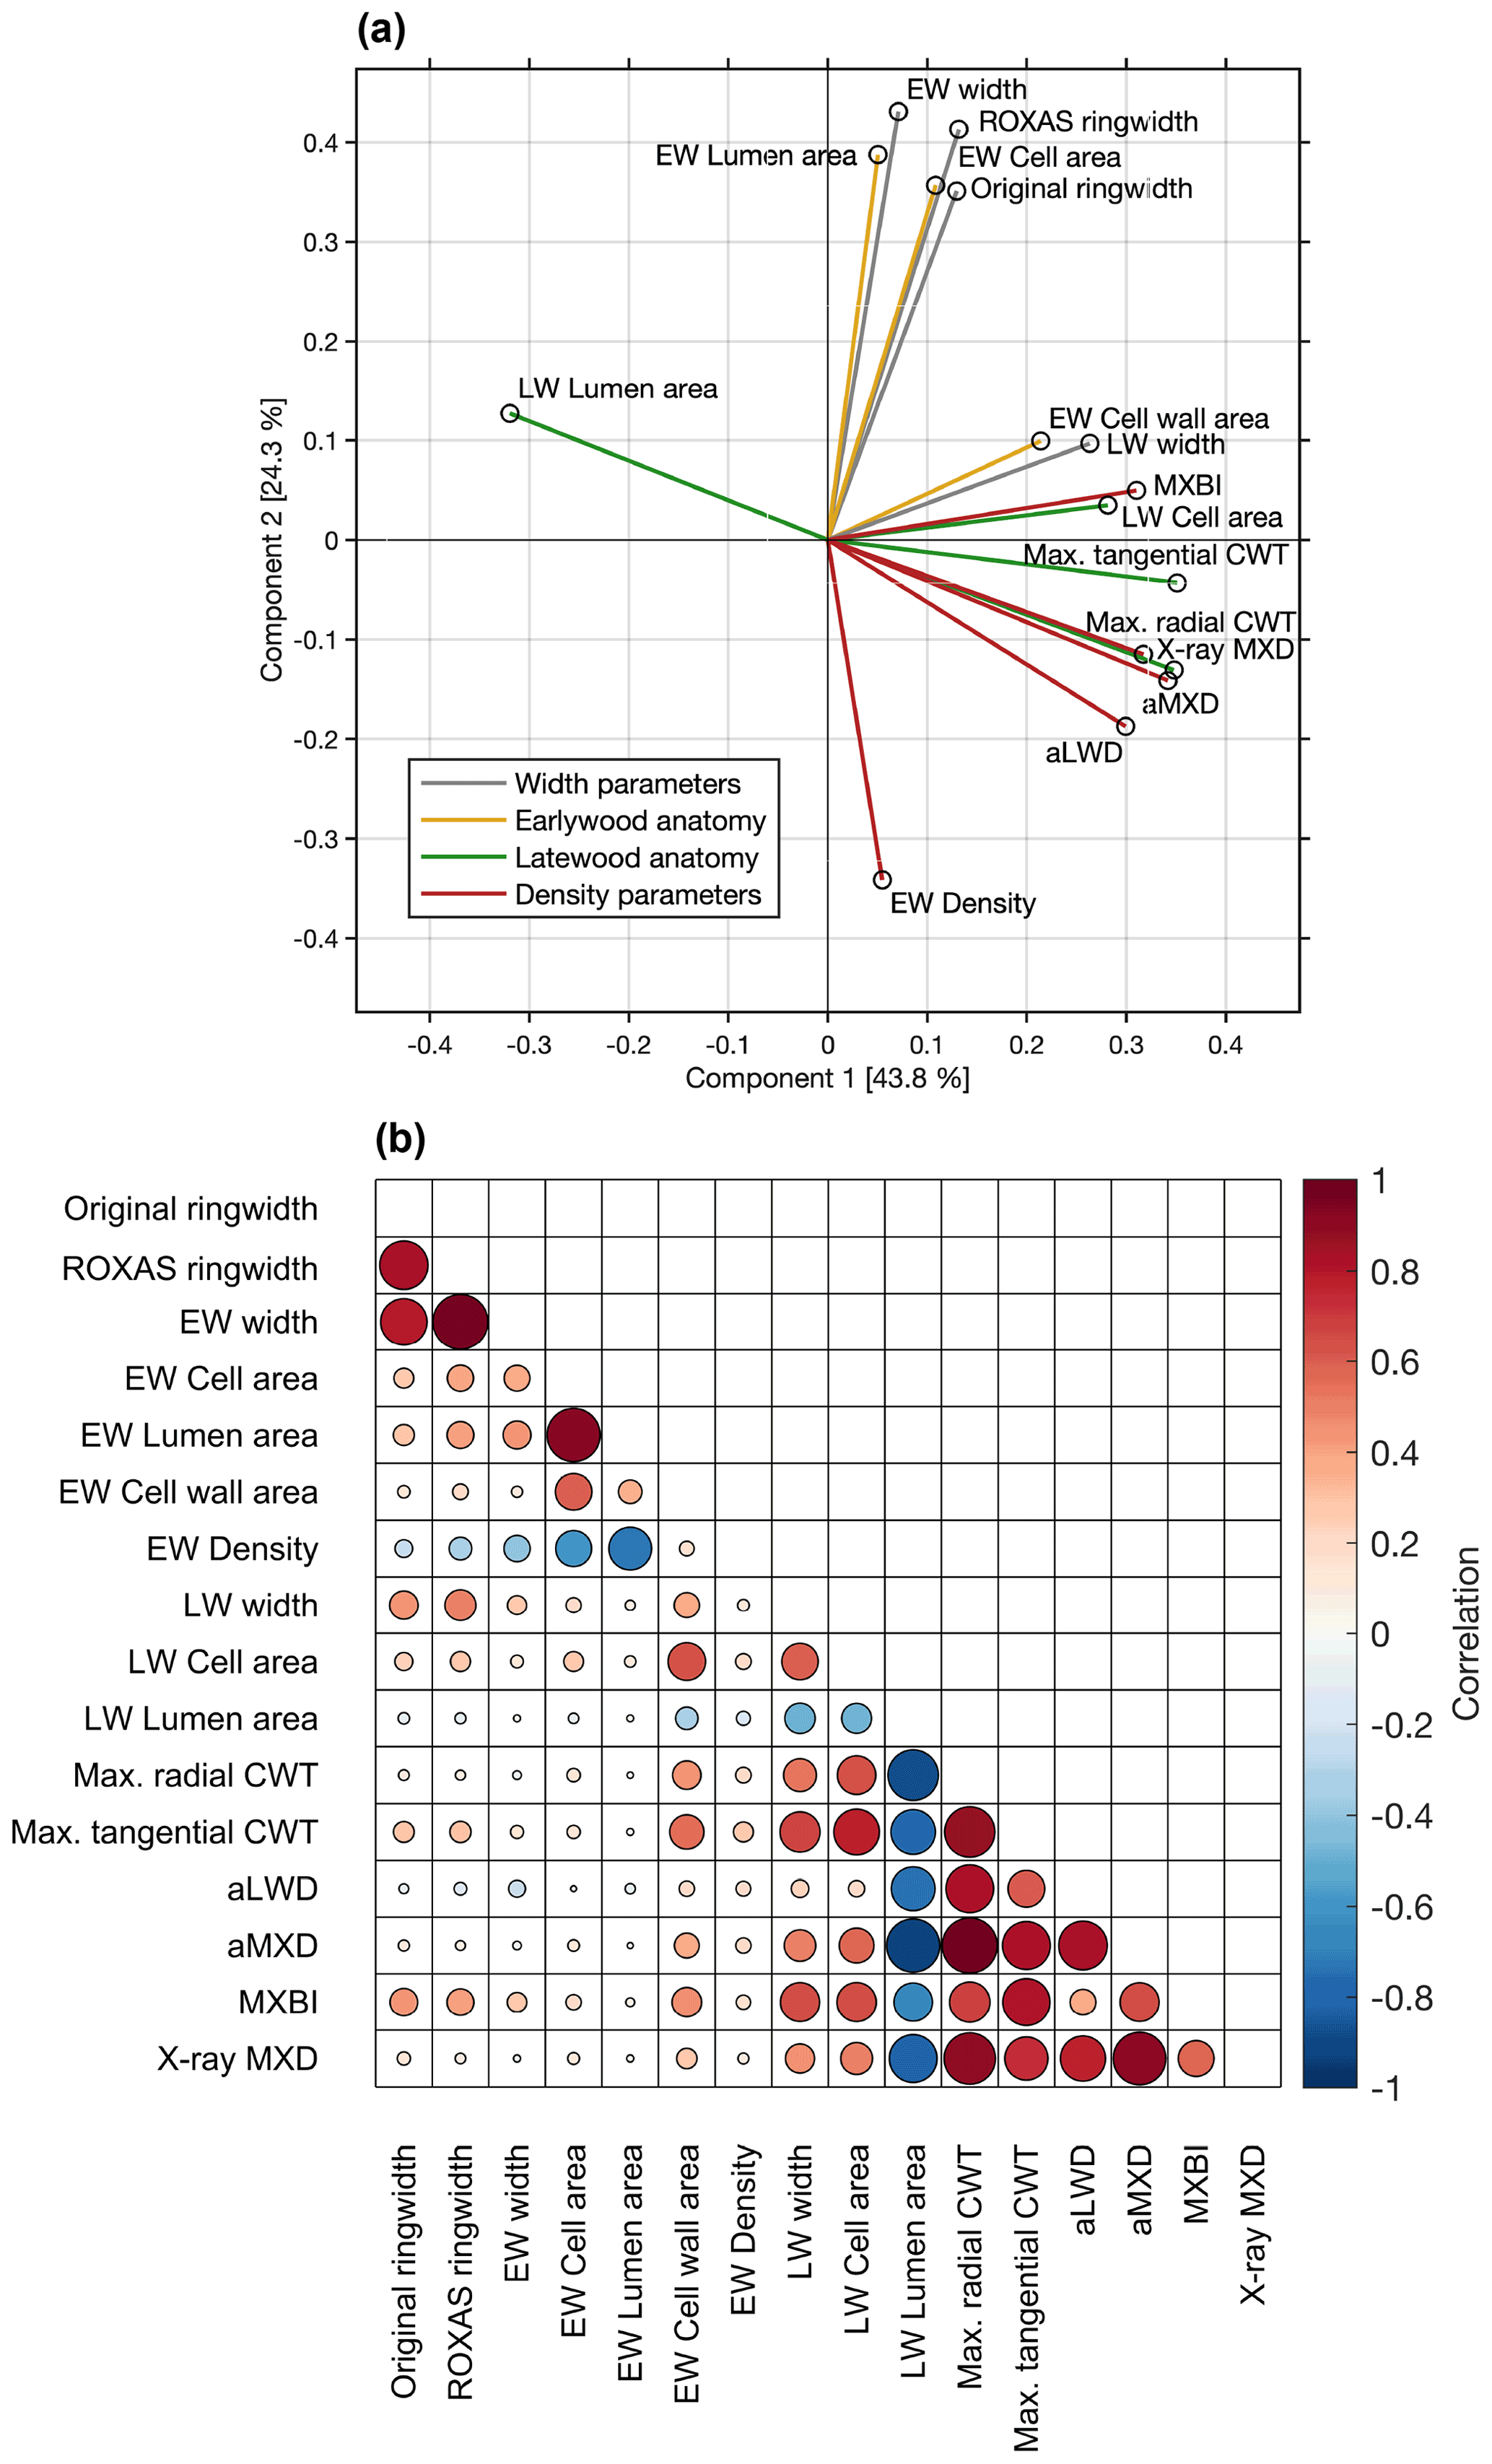
Figure 3(a) Biplot of the first two principal components of the PCA performed over the 1700–1994 CE period on the width, anatomy and density parameters. The colors of the vectors correspond to the parameter grouping used in Table 1. The first two components together represent 68.1 % of the total variation. (b) Pearson's correlation matrix between various anatomical and width parameters. X-ray MXD and MXBI are included for comparison. Correlations are computed over the common 1700–1994 period using detrended chronologies. The color and size of the markers denote the direction and strength of the relationships.
The variance of PC2 (24.3 % of total variability) is dominated by ring width and earlywood-related density and anatomy parameters. Amongst these, EW density stands out by loading strongly negatively on the PC2 axis (reflecting its negative association with early summer temperatures, see Sect. 3.2). Moreover, the EW cell wall area stands out by loading more strongly on the PC1 axis than on the PC2 axis, and by clustering more closely with the latewood than with the earlywood components (reflecting its late summer temperature sensitivity, see Sect. 3.2).
3.2 Climate response
Simple linear correlations between selected parameters and monthly CRU TS mean (Tmean) and maximum (Tmax) detrended temperatures are shown in Fig. 4. In line with previous work from North America (Heeter et al., 2021; Wilson and Luckman, 2003; Luckman and Wilson, 2005; Wilson et al., 2014; Harley et al., 2021), our results reinforce the importance of Tmax temperatures for wood formation and growth of P. engelmannii in the region by providing in general, slightly higher correlation values for Tmax than for Tmean. Interestingly, the pattern observed in North America contrasts to many other temperature-limited regions of the Northern Hemisphere, where conifers have generally been noted to correlate more strongly to Tmean than to Tmax (observation made by the author team, results not published). Whether this is actually grounded in a tree physiological mechanism is still an open question. Furthermore, the general pattern revealed by the climate response analysis shows that the various dendroanatomical traits respond to consecutive temporal windows within a short seasonal window extending from June to August, in line with our understanding of the successive physiological processes (i.e., cell expansion and cell wall thickening) behind wood formation and growth (e.g., Fonti et al., 2013). These results support the climate-response pattern that has generally been observed for conifers across the Canadian Rockies (Luckman and Wilson, 2005) and the adjacent Interior British Columbia (Wilson and Luckman, 2003; Wilson et al., 2014), yet contrasts to the seasonally wide temperature imprint (extending between May and August and occasionally even between April and September) within latewood density of Picea mariana in the eastern Canadian taiga (Wang et al., 2020). This is also the case when comparing our results with the previous study of Björklund et al. (2020) on latewood anatomical traits of Pinus sylvestris in northern Scandinavia, where the temperature response window extends from April to September. The narrow window of response patterns seen here is most likely constrained by the distinct and short warm season characterizing the climatology of the study site, where average monthly temperatures rise above 0 ∘C only in 5 months of the year (Fig. 1c).

Figure 4Correlations between tree ring parameters and monthly (a) average (Tmean) and (b) maximum (Tmax) temperatures from the CRU TS v4.03 product (48.25–55.75∘ N/113.75–123.25∘ W subset average). Pearson's correlation coefficients are computed over the 1901–1994 period using detrended data. The RBAR statistics for each parameter chronology, and correlation coefficients for the best temperature target season are provided on the right side of the plots (June for ring width and EW parameters, July–August and August for LW parameters). For original ring width and MXBI, results are also provided for chronologies (denoted as N=15) built from the same 15 trees that are used to produce the dendroanatomy data. Significant correlations (p<0.01) are marked with white circles. Correlations with temperature data produced by the Meteorological Service of Canada are given in the Supplement (Fig. S2).
We found that latewood-related parameters in general display a late summer (July–August) temperature sensitivity, while ring width and earlywood-related density and anatomy parameters most strongly correlate with mid-summer (June–July) temperatures (Fig. 4). The strongest temperature signals are found in anatomical components of the latewood, which are also the parameters displaying the highest RBAR statistics (Table 1). In particular, aMXD and Max. radial CWT stand out. The imprints of year-to-year temperature variability within these two parameters are, over the 1901–1994 period, very similar, if not identical, to those of the MXD derived from the X-ray technique. By comparison, the exceptionally weak inter-series signal strength of the MXBI parameter (Table 1) is compensated by high replication (N=182), and thus MXBI is also rather similar to aMXD, Max. radial CWT and X-ray MXD. However, the temperature signal of MXBI is shifted earlier by expressing a stronger correlation with July temperatures but weaker with August compared to aMXD, Max. radial CWT and X-ray MXD. The aggregated July–August temperature response of MXBI is thus in fact only marginally weaker than that of X-ray MXD, aMXD and Max. radial CWT.
3.3 Temporal signal stability
Focusing only on anatomical traits with the highest temperature sensitivity (aMXD and Max. radial CWT), comparison with daily temperatures (Fig. 5) confirms a significant and strong mid-to-late summer signal over the 1880–1994 period. Breaking down the climate response in daily increments reveals that the strongest signal (r>0.5) occurs on average between days 192 and 251 of the year (i.e., 11 July until 8–9 September, with a peak correlation of 0.74 for Max. radial CWT and aMXD occurring between 21 July–20 August and 23 July–22 August), respectively. The temperature associations at the margins of the target season are, however, more unstable. We note, for example, that the September signal disappears around the first half of the 20th century for both anatomical parameters. A similar correlation structure holds for X-ray-derived MXD and to a lesser degree MXBI (N=182), but the two parameters exhibit enhanced correlation coefficients in the second half of the 20th century compared to the early period (also corroborated by the split-period calibration in Fig. 6). Moreover, despite the high sample replication, MXBI shows slightly weaker correlations with daily data than the other density-related parameters, particularly in the early 1880–1930 period, when ring widths coincidentally are the narrowest in the record (see Fig. 8 and Sect. 3.4). For comparative purposes we also include anatomically derived ring width, which shows on average the strongest correlations (r= 0.3 to 0.5) with temperatures between days 146 and 206 of the year (i.e., 26 May to 25 July).
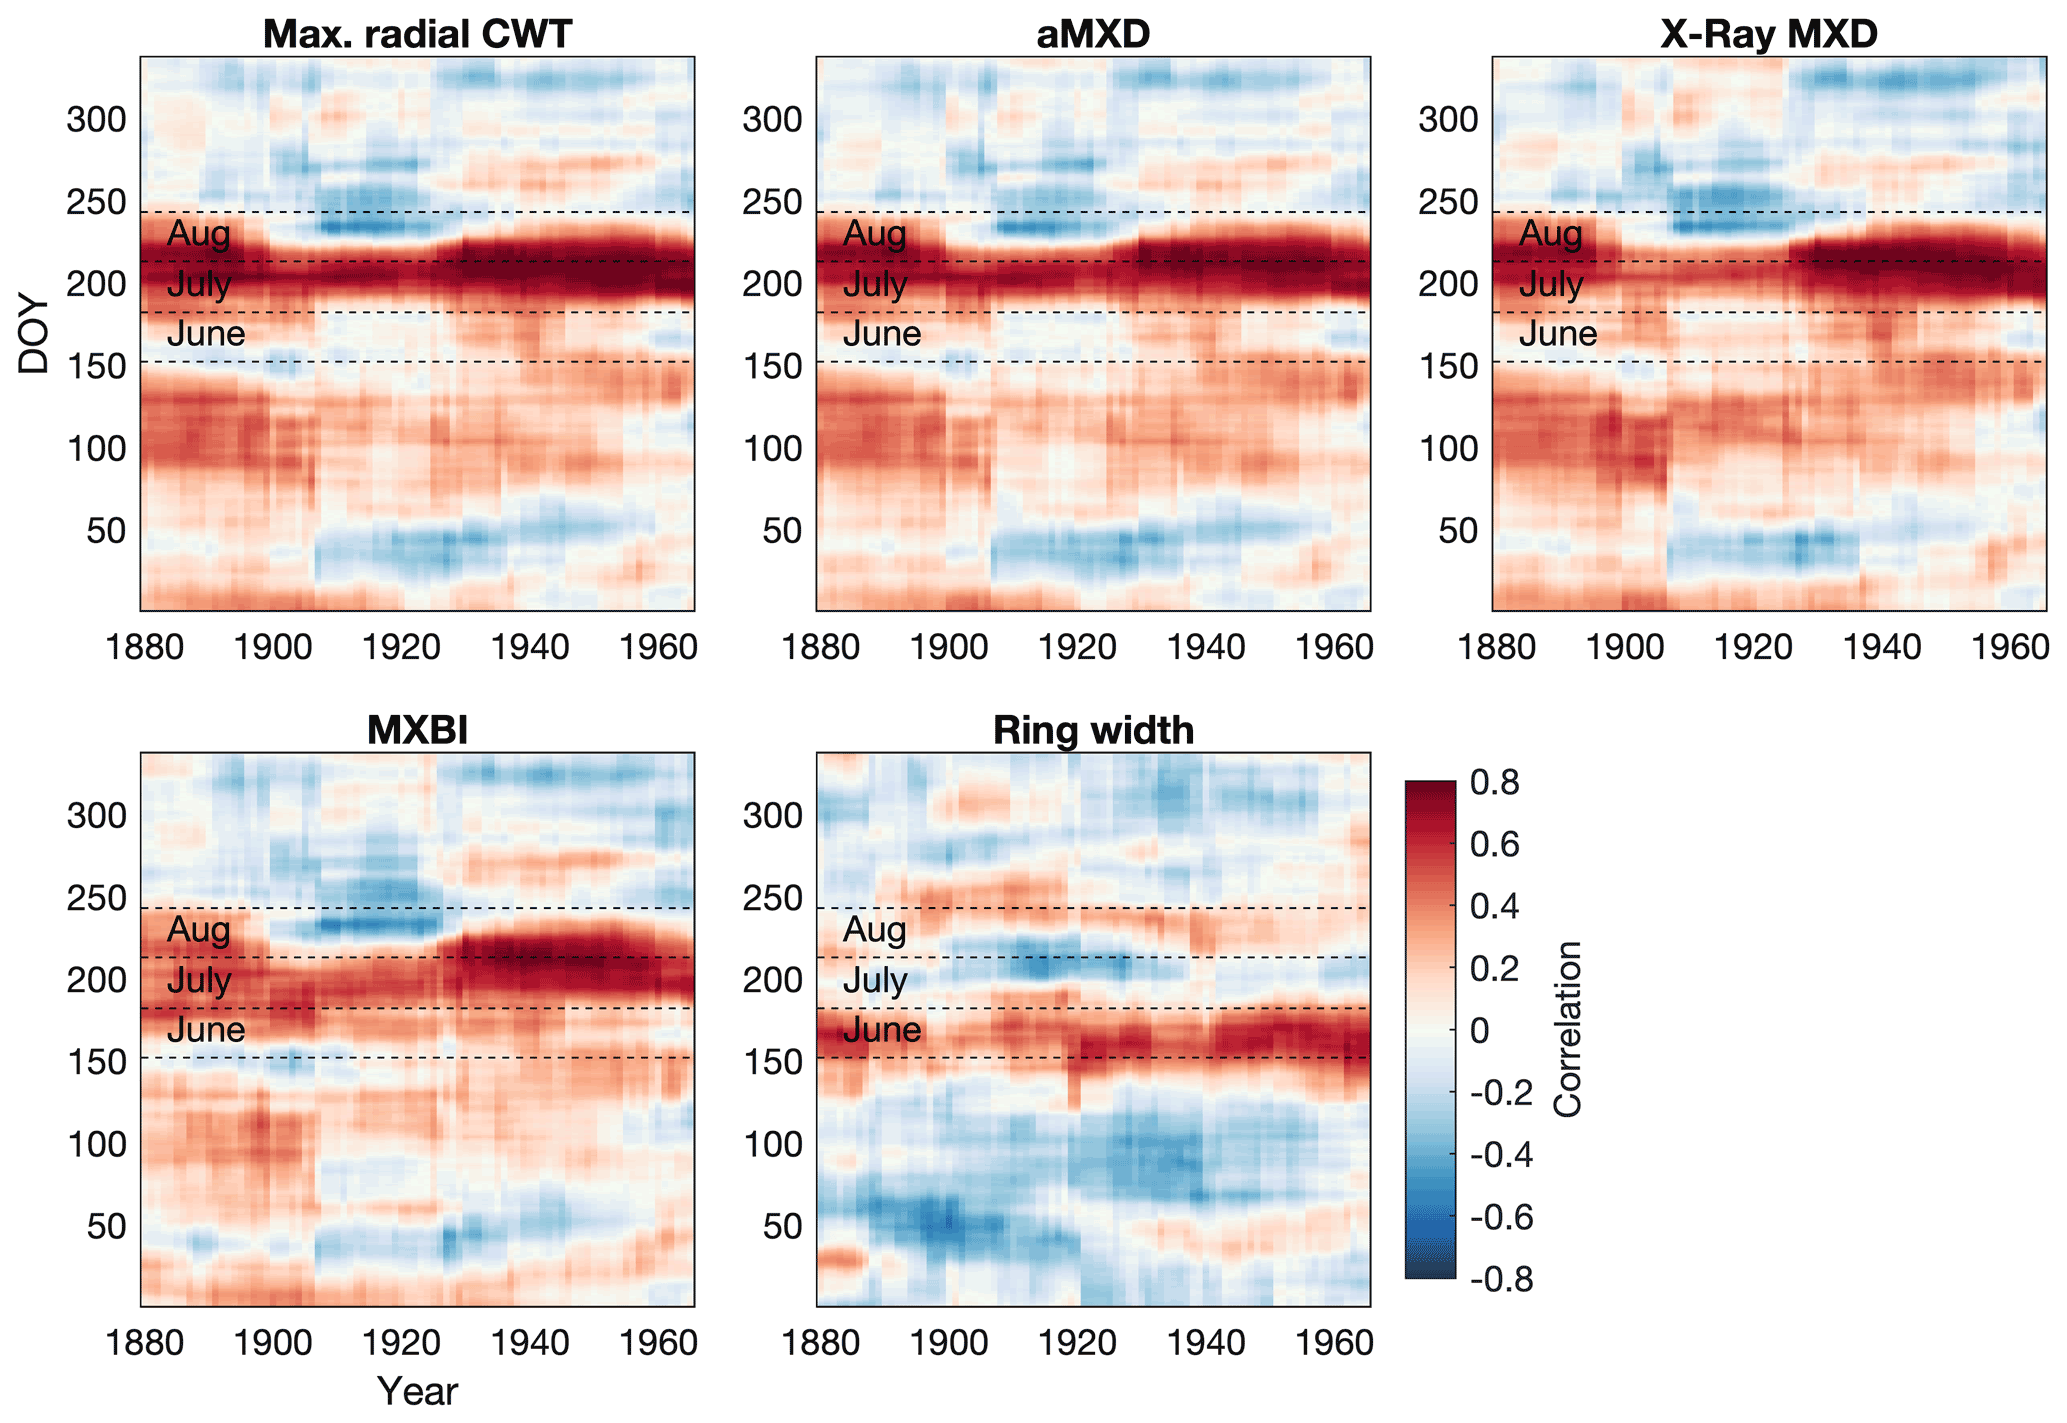
Figure 5Moving correlation between the full tree ring parameter datasets and Berkeley Earth gridded daily temperatures (grid 52.5∘ N 118.5∘ W, 1880–1994 period). A 30-year moving window, shifted by 1 year, was used in the analysis. Temperatures were averaged over a 30 d window and shifted throughout the year at daily steps. The days on the x and y axes thus show the first day of the 30-year and 30 d windows, respectively, e.g., day 152 on the y axis represents the period 1–30 June. Both tree ring and temperature data have been detrended prior to analysis. The months June–August are highlighted to aid interpretation. Pearson's correlations between monthly aggregated (i.e., average daily data for each calendar month) Berkeley Earth temperatures and tree ring parameters are provided in Fig. S6 for comparison.
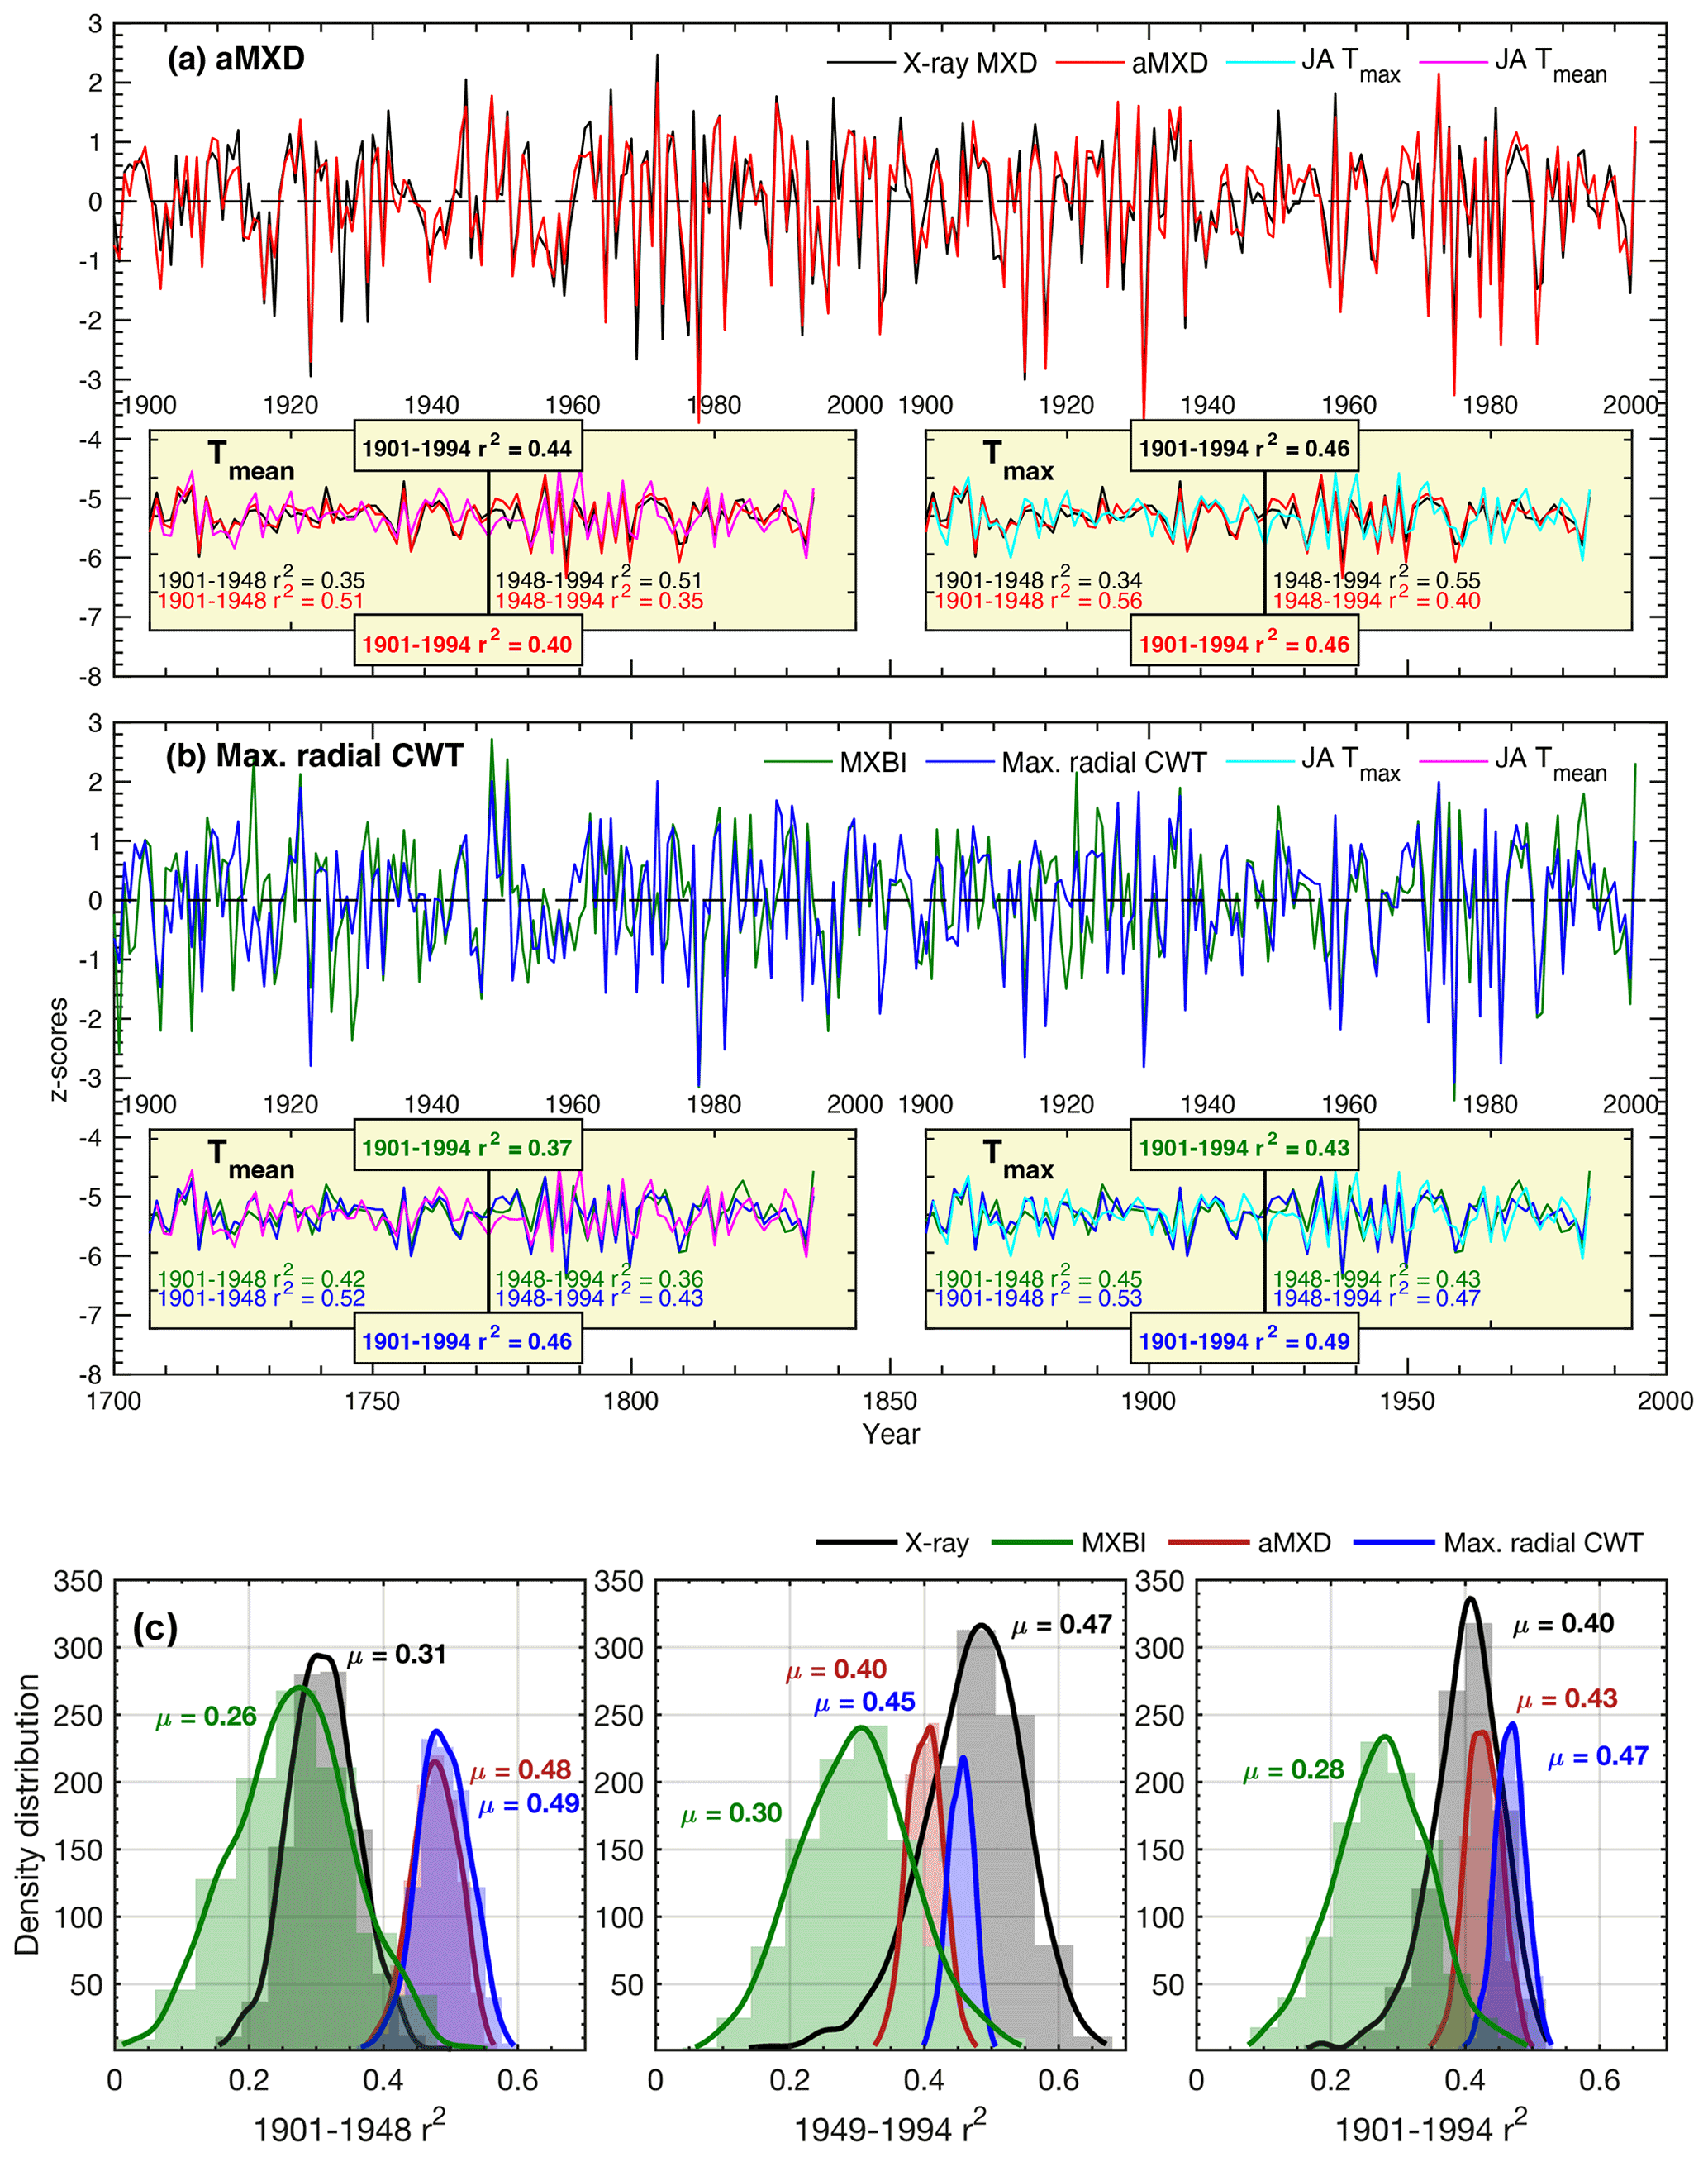
Figure 6(a, b) Full (1901–1994) and split-period (1901–1948, 1949–1994) calibration statistics for the Max. radial CWT (blue line), aMXD (red line), X-ray MXD (black line) and MXBI (green line) chronologies against July–August mean and maximum CRU TS temperatures. Time series in the figures show non-detrended mean chronologies, z-scored over the instrumental 1901–1994 period. (c) The density distribution and its mean (μ) of r2 values obtained from 1000 calibration trials where parameter chronologies are built from 10 series randomly drawn without replacement from the sample cohort. The resampling trials are based on detrended climate and tree-ring data. Calibrations are performed against July–August maximum temperatures.
The stability of the July–August temperature signals of detrended aMXD and Max. radial CWT, along with X-ray MXD and MXBI, were further assessed by a split-period calibration procedure (1901–1948 and 1949–1994) (Fig. 6). The two wood anatomical parameters calibrate more strongly to the early period compared to the late, when using both Tmean and Tmax. However, especially for Max. radial CWT, the calibration differences in the two periods are slight (r2= 53 % and 47 % against Tmax, respectively). By comparison, the X-ray MXD calibrates more strongly in the latter half of the instrumental period and shows more pronounced temporal instabilities (r2= 34 % and 55 % against Tmax, respectively). This contrasts to the prior finding (Luckman and Wilson, 2005) where no such instabilities in the early 20th century were detected. These contrasting results are most likely not related to using different climate data products because similar results (Fig. S3) were obtained when using the Luckman and Wilson (2005) temperature data, originally produced by the Meteorological Service of Canada. Instead we suspect that the discrepancy can be attributed to either using a larger network of MXD data than used in this study, or that Luckman and Wilson (2005) used multivariate regression models (including ring width and lagged growth responses) to explain a wider target season than attempted here.
Calibration trials with detrended data over the full period 1901–1994 reveal that Max. radial CWT performs overall best (Tmaxr2= 49 %), closely followed by aMXD (r2= 0.46 %) and X-ray MXD (r2= 0.46 %). The temporal instability of X-ray MXD and by comparison the robust and strong signals of the aMXD and especially the Max. radial CWT parameters are further confirmed by the resampling calibration trials presented in Fig. 6c, where 10 random series are drawn from the sample cohorts 1000 times without replacement, and the resulting parameter chronologies are subsequently correlated against July–August Tmax. The reason for the X-ray MXD loss in signal is difficult to disentangle, but it is unlikely related to having different samples for the X-ray and anatomical datasets because the resampling scheme clearly show that the r2 distributions are different (Fig. 6c) (also corroborated by a two-sample t test at a significance threshold of 0.05, indicating that the r2 statistics come from two populations with unequal means).
3.4 Possible implications of measurement resolution on climate signal
As shown in the previous sections, the climate imprint within the anatomical LW density components slightly differs from its X-ray and BI-based counterparts, although all these parameters essentially measure the same component in wood. As previously noted by Björklund et al. (2020), the main difference between these metrics is the measurement resolution, while factors such as the cell wall density is of marginal importance (Björklund et al., 2021). Thus, as part of a multiparameter approach, the higher resolution of dendroanatomy may serve to evaluate the potential risk of a resolution bias (in X-ray MXD and MXBI) when implementing these parameters both on shorter and longer time scales.
We have seen that the monthly correlations of the full MXBI dataset (N=182) differ slightly from the more physically direct density and anatomy parameters, which we hypothesize could partially be related to the lower measurement resolution that artificially makes it more similar to ring width and latewood width (Björklund et al., 2019). The pairwise correlation between parameter chronologies (Fig. 3) and the PCA biplot based on the percentile MXBI chronologies (Fig. S5) confirms this enhanced relationship with ring width and latewood width. To test this theory further, we have correlated the percentile MXBI chronologies against the target July–August Tmax (Fig. 7a) and against the full (N=182) detrended original ring width chronology (Fig. 7b), using resampling of data. Unfortunately, corresponding latewood width measurements are not available for MXBI, so this comparative analysis is restricted to ring width. Nevertheless, we find that when using the full July–August season the poorest temperature imprint is found in the MXBI values of the narrowest (∼40 %), and the widest (∼40 %) of the rings, while the strongest July–August signal can be recovered from the MXBI values in rings that are close to average in width (40th–70th percentile). Expanding the climate correlation analysis to monthly Tmax data (Fig. 7c) reveals, however, a gradual transition from a predominantly August temperature signal in the wide ring MXBI chronologies to a more July-dominated signal in the narrow ring MXBI chronologies. The MXBI values in rings that are close to average in width correlate equally strongly to both July and August, which explains the overall better performance of these data when comparing to the July–August target (Fig. 7c). Importantly, we find no correlation between the MXBI and ring width in the widest rings (Fig. S5). However, as we move towards narrower rings, the MXBI values become successively more like ring width/latewood width (Figs. 7b and S5). All in all, these results suggest that an effect of low measurement resolution may be present for narrower ring widths/latewood widths. If so, this means that the MXBI parameter may become subject to greater target season uncertainty, which may fluctuate between July and August signals over time, largely depending on the absolute ring width/latewood width of the analyzed tree ring sample collection and the resolution of the captured image. Although posing a challenge for paleoclimate reconstructions, this resolution issue is likely to become a less relevant methodological problem in a near future, as more laboratories are currently investing in the development of high-resolution image capturing systems and other analytical techniques to enhance the precision of the BI data.
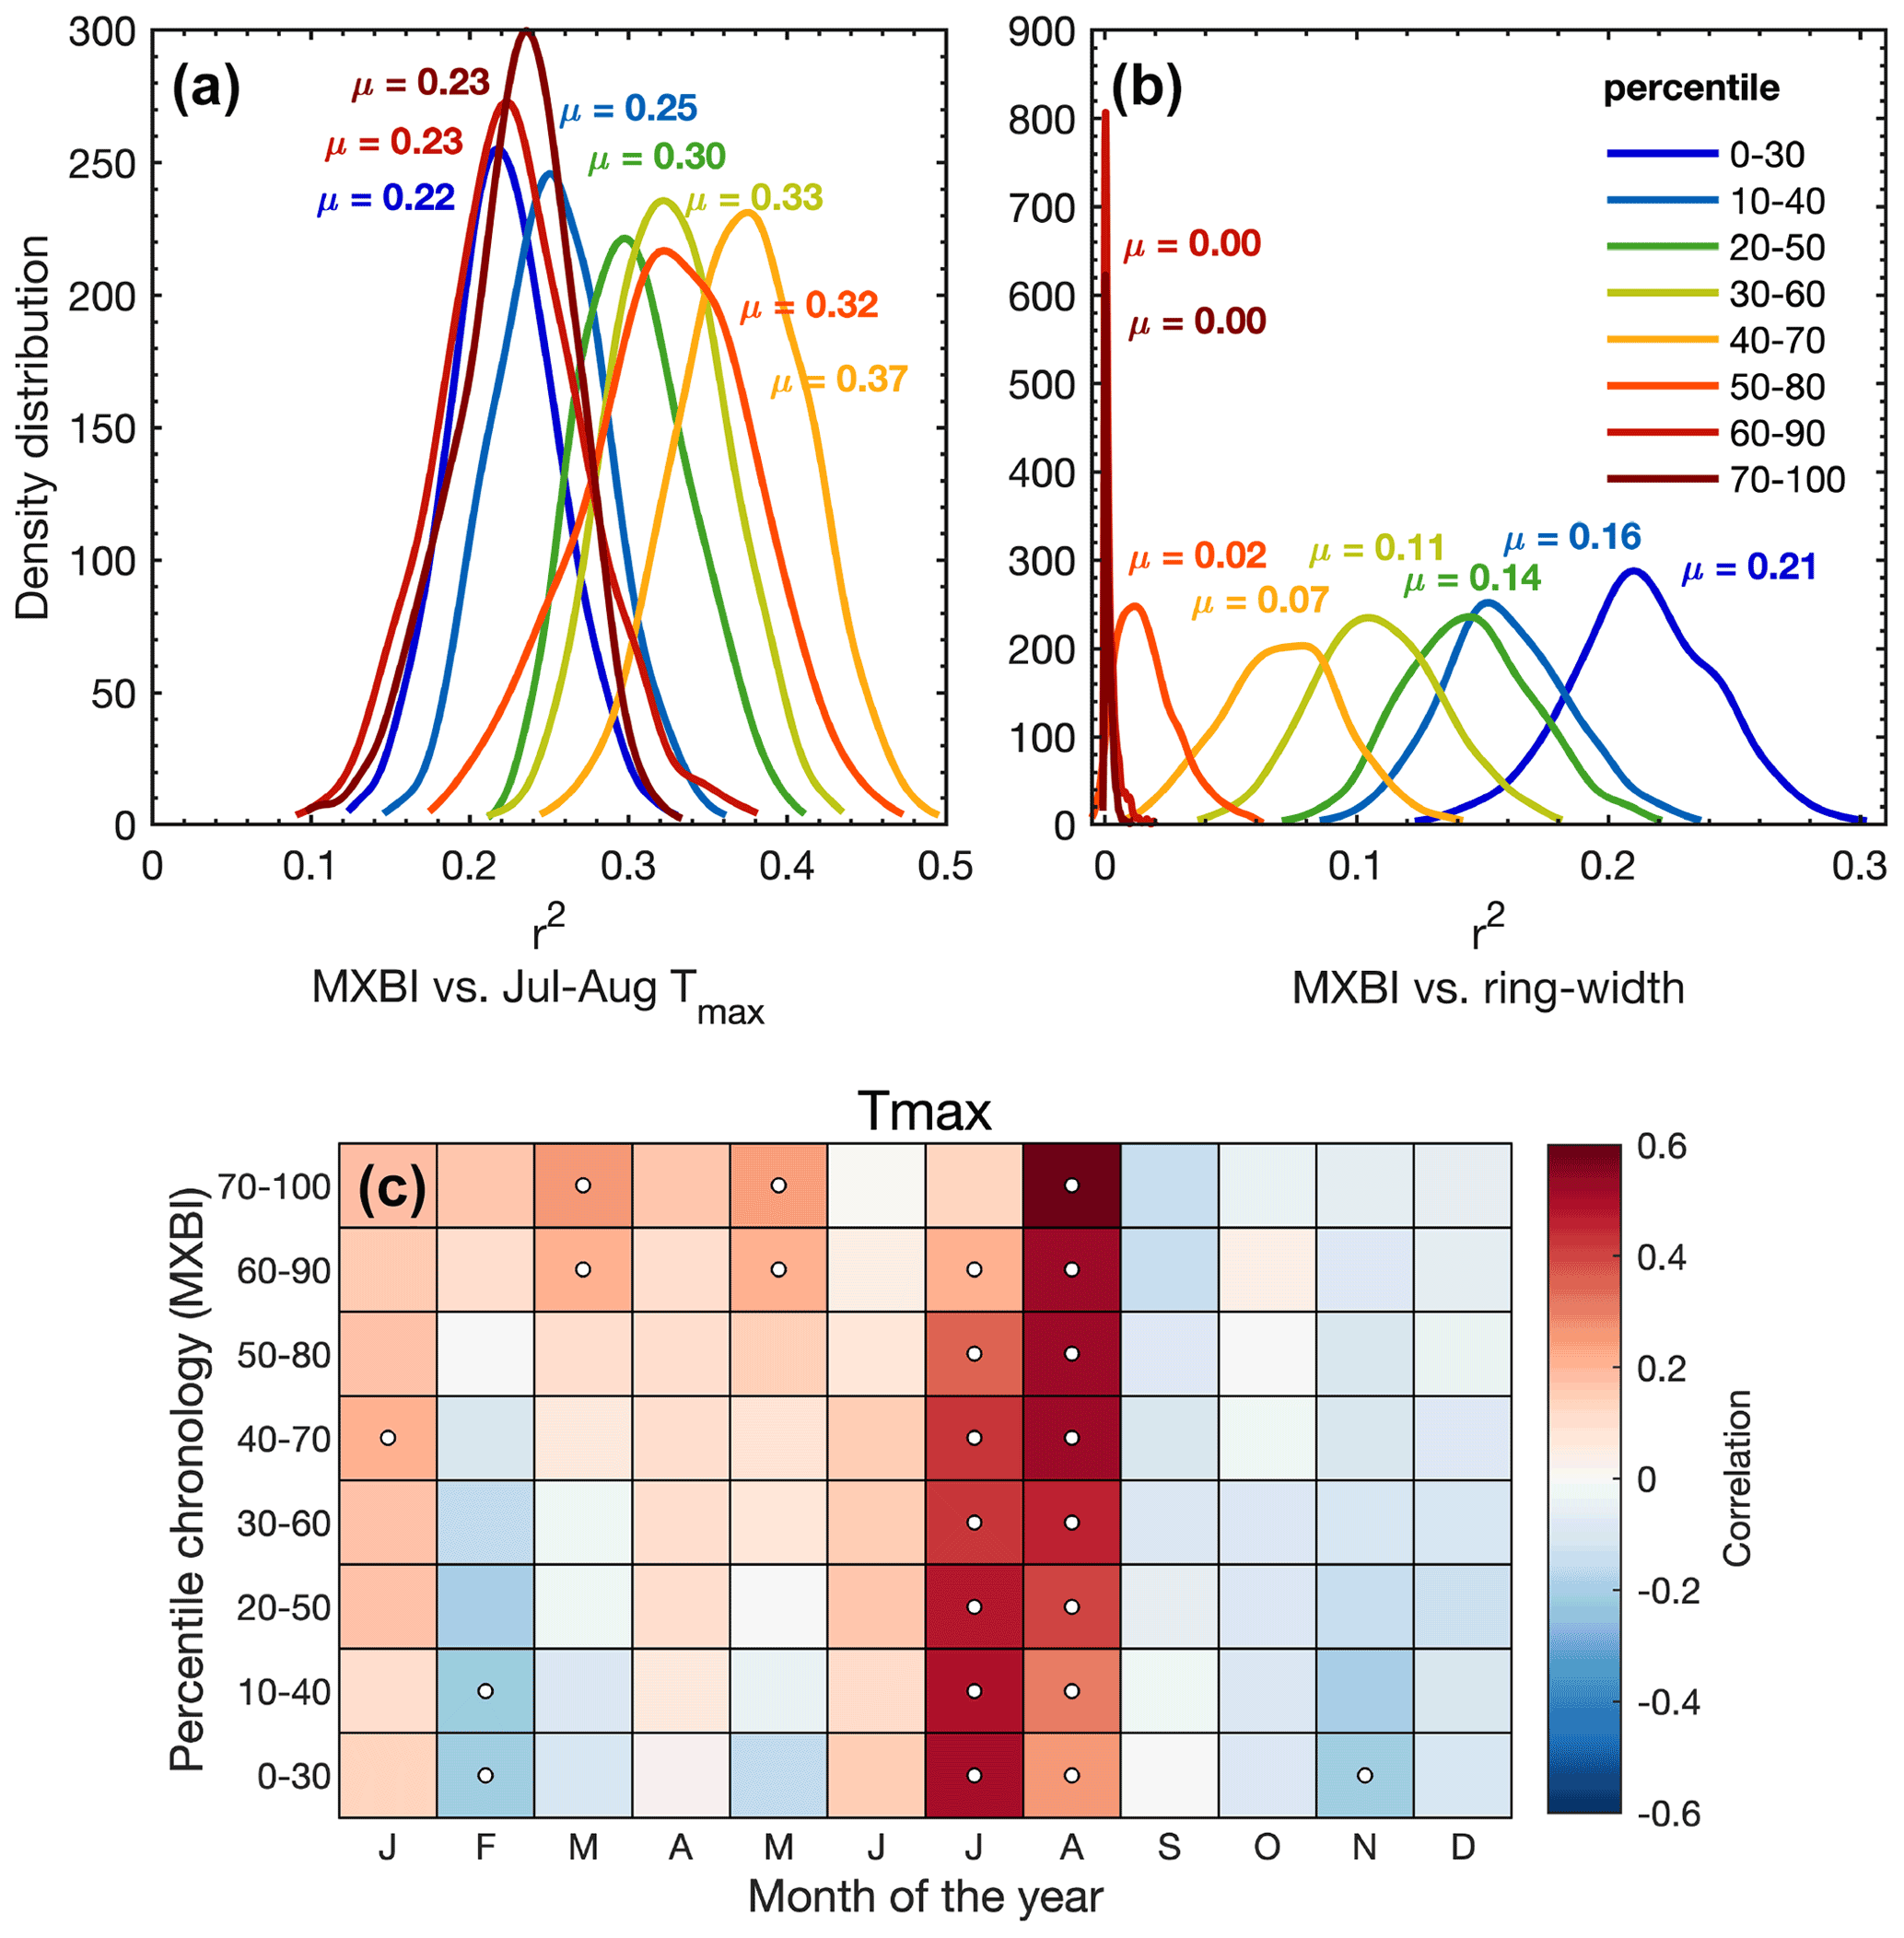
Figure 7(a, b) The density distribution of r2 values obtained from 1000 calibration trials (1901–1994 period) where MXBI chronologies are built from 100 series randomly drawn from the total of 182 series without replacement. The detrended MXBI values are sorted into percentiles based on the absolute ring width (e.g., the 0–30 percentile are the corresponding MXBI values for the narrowest 30 % of the rings), and then averaged into percentile chronologies. (a) The calibration r2 values between these chronologies and detrended July–August CRU TS Tmax, (b) same as (a) but calibrated against the full (N=182) detrended ring width chronology. (c) Correlation between the MXBI percentile chronologies and monthly maximum (Tmax) temperatures from the CRU TS v4.03 product (48.25–55.75∘ N/113.75–123.25∘ W subset average). Correlation coefficients are computed over the 1901–1994 period using detrended tree ring and temperature data. Significant correlations (p<0.01) are outlined with white circles.
Furthermore, we note that the correlations between the various latewood parameters against ring widths change from the early to late 20th century periods, and that the correlations slightly differ in magnitude and sign (Fig. 8). The MXBI is positively correlated with ring width, whereas the correlations for X-ray MXD range from non-significant to weakly positive. The Max. radial CWT, on the other hand, show a non-significant or weak negative correlation with ring width during the 20th century. This gradual, and slightly larger shift in moving window correlation against ring width during the early 20th century may thus be an indication that both MXBI and to some degree X-ray MXD are challenged by comparatively low measurement resolution. If this is the case, then the inter-annual climate signal may potentially become muted when ring (latewood) widths are narrow. This dependence could, in fact, affect the lower frequencies, and inflate multidecadal variability (Esper et al., 2015). Moreover, the fidelity to the monthly temperature targets may exhibit instability when rings (latewood) are narrow, shifting back and forth between August- or July-dominated signals (as seen in Fig. 7c). At the moment it is unclear how this phenomenon could affect the lower frequencies of our chronologies, as a robust picture of long-term trends in dendroanatomical parameters can only emerge from analysis of millennial length, multigeneration, composite chronologies suitable for RCS type detrending (Briffa and Melvin, 2011). Moreover, periods with persistence in narrow ring widths will force MXBI, and perhaps also X-ray MXD, to exhibit persistently low densitometric values (Björklund et al., 2019). Exacerbating this issue is that persistently narrow ring width and latewood width may not even be a product of the distinct and earlier temperature target (June–July, Fig. 4), but could also be related to stand dynamics/disturbances (Rydval et al., 2018), and thus pass down non-climatic distortions of decadal to centennial variations to X-ray MXD and MXBI. This clearly needs further scrutiny because it may be important for the interpretation of inferred climate signals back in time, particularly because the ring width correlation converges for the X-ray and anatomy data but dramatically diverges for MXBI (Fig. 8). The lower late period (1949–1994) signal of the anatomical parameters compared to X-ray MXD requires a different explanation (Fig. 6). According to the distribution of the r2 values in the resampling scheme of Fig. 6c, the late period Tmax signals are not appreciably different, so perhaps this is simply by chance compounded by having five times higher X-ray MXD replication.

Figure 8(a) Running Pearson's correlation (a 50-year window shifted by 1 year) between selected density parameters and ring width. The years on the x axis show the first year of the 50-year correlation windows. Note that for X-ray MXD, the ring width data are not obtained from the same tree cores as have been used for the density measurements, which is otherwise the case for both MXBI and anatomy. (b) Running average of absolute ring widths (original and ROXAS datasets) computed using a 50-year window shifted by 1 year, together with the chronology sample depths of the X-ray MXD, MXBI and dendroanatomical datasets.
Tree ring-based reconstructions of the preindustrial climate provide a key insight into the earth's present and future changing climate, yet their full potential will remain unexploited without a concerted effort to overcome several critical challenges. This study is part of a larger ongoing synergetic effort (e.g., Björklund et al., 2020, and other work currently in preparation) directed at exploring the efficacy of highly temperature-sensitive tree ring data frequently used in large scale temperature reconstructions (e.g., Wilson et al., 2016), with the ambition to improve upon these existing records using dendroanatomical techniques. This is because dendroanatomy represents the direct morphological refinement of current microdensitometric techniques where it is possible to control within-ring specific location of the measurements down to the cellular level (von Arx and Carrer, 2014).
In summary, based on the collective comparison between the new wood anatomical dataset of P. engelmannii from the Columbia Icefield and the two predecessors X-ray MXD and MXBI, we are able to draw the following conclusions:
-
Maximum radial cell wall thickness and anatomical MXD are the two most promising wood anatomical proxy parameters for estimating past temperatures, each explaining >45 % in instrumental detrended July–August maximum temperatures. Both parameters display a comparable climatic imprint and strength of signal to the X-ray derived MXD. It does, however, appear that the stability of the temperature signal over time is more robust for the maximum radial cell wall thickness than for X-ray MXD.
-
For these anatomical parameters, the number of trees needed to reach the commonly accepted quality threshold for chronologies used in dendroclimatic analyses is, for our experimental site and species, exemplary with just six trees. However, this high common signal strength is matched by the X-ray MXD parameter and thus does not constitute an obvious advantage by itself. Nevertheless, if the temperature signal is more stable in maximum radial cell wall thickness, it is advantageous to know that very few trees are needed to reach chronological confidence. This is especially true given that the problem of fading records, i.e., the general decrease in sample replication and between tree correlations back in time (Esper and Büntgen, 2021), poses a severe constraint to almost all chronologies extending up to or beyond the last millennium.
-
The higher resolution of dendroanatomy appears to positively influence the high-frequency temperature signal stability. Using anatomical parameters as opposed to density parameters, be it from X-ray or anatomy, may also be beneficial for data quality and the mechanistic interpretation of the proxy record. However, further research is needed to consolidate this and other important potential effects regarding the low frequency fidelity of long-term temperature reconstructions based on X-ray densitometry.
Justification of the cost and time constraints currently associated with the production of long dendroanatomical datasets requires that there must be an information gain not obtainable from conventional techniques. In fact, high-resolution, cell-based measurements already offer an advantage when it comes to the understanding of the structure-function relationships (e.g., Bouche et al., 2014; Pittermann et al., 2011; Wilkinson et al., 2015), the complex mechanisms behind tree ring formation (Rathgeber et al., 2016), with relative time stamps (Ziaco, 2020) of brief intra-seasonal climate extremes, such as late growing season cold spells or initiation of volcanic cooling episodes (Piermattei et al., 2020; Edwards et al., 2022). The question remains, however, whether dendroanatomy can also provide additional paleoclimate information. Despite the encouraging results detailed herein, it is necessary to continue to extend this dataset by adding more series from multiple age classes across the last millennium to more thoroughly evaluate the multicentennial to millennial scale variations of this key temperature proxy site. The work detailed here is the first piece of a puzzle to explore dendroanatomy of the P. engelmannii sample set for the Columbia Icefield area in Canada, formerly analyzed with X-ray and BI techniques (Luckman and Wilson, 2005). As such, it also represents the longest (1585–2014 CE) dendroanatomical dataset currently developed for North America.
The dendroanatomical chronologies from the Icefield area, Canada, are available on request.
The supplement related to this article is available online at: https://doi.org/10.5194/cp-18-1151-2022-supplement.
KS and JB conceptualized the research and obtained the funding to support it. MVF performed the dendroanatomical measurements, using wood material collected by BL and RW. GvA aided the interpretation of the dendroanatomical data, and MR of the BI measurements. KS carried out the analysis and drafted the paper. All authors contributed to the planning and structuring of the paper.
The contact author has declared that neither they nor their co-authors have any competing interests.
Publisher’s note: Copernicus Publications remains neutral with regard to jurisdictional claims in published maps and institutional affiliations.
We thank the two anonymous reviewers and editor Pierre Francus for their helpful and insightful comments and suggestions.
This research was supported by the Svenska Forskningsrådet Formas (grant no. 2019-01482), the National Science Foundation (grant no. 1502150), the Schweizerischer Nationalfonds zur Förderung der Wissenschaftlichen Forschung (grant no. 200021_182398), and the Grantová Agentura České Republiky (grant no. 20-22351Y).
The article processing charges for this open-access publication were covered by the Gothenburg University Library.
This paper was edited by Pierre Francus and reviewed by two anonymous referees.
Anchukaitis, K. J., Wilson, R., Briffa, K. R., Büntgen, U., Cook, E. R., D'Arrigo, R., Davi, N., Esper, J., Frank, D., Gunnarson, B. E., Hegerl, G., Helama, S., Klesse, S., Krusic, P. J., Linderholm, H. W., Myglan, V., Osborn, T. J., Zhang, P., Rydval, M., Schneider, L., Schurer, A., Wiles, G., and Zorita, E.: Last millennium Northern Hemisphere summer temperatures from tree rings: Part II, spatially resolved reconstructions, Quaternary Sci. Rev., 163, 1–22, https://doi.org/10.1016/j.quascirev.2017.02.020, 2017.
Björklund, J., von Arx, G., Nievergelt, D., Wilson, R., Van den Bulcke, J., Günther, B., Loader, N. J., Rydval, M., Fonti, P., Scharnweber, T., Andreu-Hayles, L., Büntgen, U., D'Arrigo, R., Davi, N., De Mil, T., Esper, J., Gärtner, H., Geary, J., Gunnarson, B. E., Hartl, C., Hevia, A., Song, H., Janecka, K., Kaczka, R. J., Kirdyanov, A. V., Kochbeck, M., Liu, Y., Meko, M., Mundo, I., Nicolussi, K., Oelkers, R., Pichler, T., Sánchez-Salguero, R., Schneider, L., Schweingruber, F., Timonen, M., Trouet, V., Van Acker, J., Verstege, A., Villalba, R., Wilmking, M., and Frank, D.: Scientific merits and analytical challenges of tree-ring densitometry, Rev. Geophys., 57, 1224–1264, https://doi.org/10.1029/2019RG000642, 2019.
Björklund, J., Seftigen, K., Fonti, P., Nievergelt, D., and von Arx, G.: Dendroclimatic potential of dendroanatomy in temperature-sensitive Pinus sylvestris, Dendrochronologia, 60, 125673, https://doi.org/10.1016/j.dendro.2020.125673, 2020.
Björklund, J., Fonti, M. V., Fonti, P., Van den Bulcke, J., and von Arx, G.: Cell wall dimensions reign supreme: cell wall composition is irrelevant for the temperature signal of latewood density/blue intensity in Scots pine, Dendrochronologia, 65, 125785, https://doi.org/10.1016/j.dendro.2020.125785, 2021.
Blake, S. A. P., Palmer, J. G., Björklund, J., Harper, J. B., and Turney, C. S. M.: Palaeoclimate potential of New Zealand Manoao colensoi (silver pine) tree rings using Blue-Intensity (BI), Dendrochronologia, 60, 125664, https://doi.org/10.1016/j.dendro.2020.125664, 2020.
Bouche, P. S., Larter, M., Domec, J.-C., Burlett, R., Gasson, P., Jansen, S., and Delzon, S.: A broad survey of hydraulic and mechanical safety in the xylem of conifers, J. Exp. Bot., 65, 4419–4431, https://doi.org/10.1093/jxb/eru218, 2014.
Briffa, K. R. and Melvin, T. M.: A Closer Look at Regional Curve Standardization of Tree-Ring Records: Justification of the Need, a Warning of Some Pitfalls, and Suggested Improvements in Its Application, in: Dendroclimatology: Progress and Prospects, edited by: Hughes, M. K., Swetnam, T. W., and Diaz, H. F., Springer Netherlands, Dordrecht, 113–145, https://doi.org/10.1007/978-1-4020-5725-0_5, 2011.
Briffa, K. R., Jones, P. D., Bartholin, T. S., Eckstein, D., Schweingruber, F. H., Karlén, W., Zetterberg, P., and Eronen, M.: Fennoscandian summers from AD 500: temperature changes on short and long timescales, Clim. Dynam., 7, 111–119, https://doi.org/10.1007/bf00211153, 1992.
Briffa, K. R., Osborn, T. J., Schweingruber, F. H., Jones, P. D., Shiyatov, S. G., and Vaganov, E. A.: Tree-ring width and density data around the Northern Hemisphere: Part 1, local and regional climate signals, The Holocene, 12, 737–757, https://doi.org/10.1191/0959683602hl587rp, 2002.
Cook, E. R. and Peters, K.: The smoothing spline: a new approach to standardizing forest interior tree-ring width series for dendroclimatic studies, Tree-Ring Bulletin, 41, 45–53, 1981.
Cuny, H. E., Rathgeber, C. B. K., Frank, D., Fonti, P., and Fournier, M.: Kinetics of tracheid development explain conifer tree-ring structure, New Phytol., 203, 1231–1241, https://doi.org/10.1111/nph.12871, 2014.
Cuny, H. E., Fonti, P., Rathgeber, C. B. K., von Arx, G., Peters, R. L., and Frank, D. C.: Couplings in cell differentiation kinetics mitigate air temperature influence on conifer wood anatomy, Plant Cell Environ., 42, 1222–1232, https://doi.org/10.1111/pce.13464, 2019.
D'Arrigo, R., Wilson, R., and Jacoby, G.: On the long-term context for late twentieth century warming, J. Geophys. Res., 111, D03103, https://doi.org/10.1029/2005JD006352, 2006.
Denne, M. P.: Definition of Latewood According to Mork (1928), Iawa J., 10, 59–62, https://doi.org/10.1163/22941932-90001112, 1989.
Edwards, J., Anchukaitis, K. J., Gunnarson, B. E., Pearson, C., Seftigen, K., von Arx, G., and Linderholm, H. W.: The Origin of Tree-Ring Reconstructed Summer Cooling in Northern Europe During the 18th Century Eruption of Laki, Paleoceanography and Paleoclimatology, 37, e2021PA004386, https://doi.org/10.1029/2021PA004386, 2022.
Eschbach, W., Nogler, P., Schär, E., and Schweingruber, F.: Technical advances in the radiodensitometrical determination of wood density, Dendrochronologia, 13, 155–168, 1995.
Esper, J. and Büntgen, U.: The future of paleoclimate, Clim. Res., 83, 57–59, 2021.
Esper, J., Cook, E. R., and Schweingruber, F. H.: Low-frequency signals in long tree-ring chronologies for reconstructing past temperature variability, Science, 295, 2250–2253, 2002.
Esper, J., Schneider, L., Smerdon, J. E., Schöne, B. R., and Büntgen, U.: Signals and memory in tree-ring width and density data, Dendrochronologia, 35, 62–70, https://doi.org/10.1016/j.dendro.2015.07.001, 2015.
Esper, J., St. George, S., Anchukaitis, K., D'Arrigo, R., Ljungqvist, F. C., Luterbacher, J., Schneider, L., Stoffel, M., Wilson, R., and Büntgen, U.: Large-scale, millennial-length temperature reconstructions from tree-rings, Dendrochronologia, 50, 81–90, https://doi.org/10.1016/j.dendro.2018.06.001, 2018.
Fonti, P., von Arx, G., Garcia-Gonzalez, I., Eilmann, B., Sass-Klaassen, U., Gartner, H., and Eckstein, D.: Studying global change through investigation of the plastic responses of xylem anatomy in tree rings, New Phytol., 185, 42–53, https://doi.org/10.1111/j.1469-8137.2009.03030.x, 2010.
Fonti, P., Bryukhanova, M. V., Myglan, V. S., Kirdyanov, A. V., Naumova, O. V., and Vaganov, E. A.: Temperature-induced responses of xylem structure of Larix sibirica (Pinaceae) from the Russian Altay, Am. J. Bot., 100, 1332–1343, https://doi.org/10.3732/ajb.1200484, 2013.
Frank, D., Esper, J., Zorita, E., and Wilson, R.: A noodle, hockey stick, and spaghetti plate: a perspective on high-resolution paleoclimatology, WIREs Clim. Change, 1, 507–516, https://doi.org/10.1002/wcc.53, 2010.
Franke, J., Frank, D., Raible, C. C., Esper, J., and Bronnimann, S.: Spectral biases in tree-ring climate proxies, Nat. Clim. Change, 3, 360–364, 2013.
Goosse, H.: Reconstructed and simulated temperature asymmetry between continents in both hemispheres over the last centuries, Clim. Dynam., 48, 1483–1501, https://doi.org/10.1007/s00382-016-3154-z, 2017.
Harley, G. L., Heeter, K. J., Maxwell, J. T., Rayback, S. A., Maxwell, R. S., Reinemann, T. E. P., and H. Taylor, A.: Towards broad-scale temperature reconstructions for Eastern North America using blue light intensity from tree rings, Int. J. Climatol., 41, E3142–E3159, https://doi.org/10.1002/joc.6910, 2021.
Harris, I., Osborn, T. J., Jones, P., and Lister, D.: Version 4 of the CRU TS monthly high-resolution gridded multivariate climate dataset, Scientific Data, 7, 109, https://doi.org/10.1038/s41597-020-0453-3, 2020.
Heeter, K. J., Harley, G. L., Maxwell, J. T., Wilson, R. J., Abatzoglou, J. T., Rayback, S. A., Rochner, M. L., and Kitchens, K. A.: Summer temperature variability since 1730 CE across the low-to-mid latitudes of western North America from a tree ring blue intensity network, Quaternary Sci. Rev., 267, 107064, https://doi.org/10.1016/j.quascirev.2021.107064, 2021.
Jevšenak, J. and Levanič, T.: dendroTools: R package for studying linear and nonlinear responses between tree-rings and daily environmental data, Dendrochronologia, 48, 32–39, https://doi.org/10.1016/j.dendro.2018.01.005, 2018.
Konter, O., Büntgen, U., Carrer, M., Timonen, M., and Esper, J.: Climate signal age effects in boreal tree-rings: Lessons to be learned for paleoclimatic reconstructions, Quaternary Sci. Rev., 142, 164–172, https://doi.org/10.1016/j.quascirev.2016.04.020, 2016.
Ljungqvist, F. C., Thejll, P., Björklund, J., Gunnarson, B. E., Piermattei, A., Rydval, M., Seftigen, K., Støve, B., and Büntgen, U.: Assessing non-linearity in European temperature-sensitive tree-ring data, Dendrochronologia, 59, 125652, https://doi.org/10.1016/j.dendro.2019.125652, 2020.
Lücke, L. J., Hegerl, G. C., Schurer, A. P., and Wilson, R.: Effects of Memory Biases on Variability of Temperature Reconstructions, J. Climate, 32, 8713–8731, https://doi.org/10.1175/jcli-d-19-0184.1, 2019.
Luckman, B. H.: Developing a proxy climate record for the last 300 years in the Canadian rockies – some problems and opportunities, Clim. Change, 36, 455–476, https://doi.org/10.1023/A:1005376713554, 1997.
Luckman, B. H.: The Little Ice Age in the Canadian Rockies, Geomorphology, 32, 357–384, https://doi.org/10.1016/S0169-555X(99)00104-X, 2000.
Luckman, B. H. and Wilson, R. J. S.: Summer temperatures in the Canadian Rockies during the last millennium: a revised record, Clim. Dynam., 24, 131–144, https://doi.org/10.1007/s00382-004-0511-0, 2005.
Luckman, B. H., Briffa, K. R., Jones, P. D., and Schweingruber, F. H.: Tree-ring based reconstruction of summer temperatures at the Columbia Icefield, Alberta, Canada, AD 1073–1983, The Holocene, 7, 375–389, https://doi.org/10.1177/095968369700700401, 1997.
Luterbacher, J., Werner, J. P., Smerdon, J. E., Fernández-Donado, L., González-Rouco, F. J., Barriopedro, D., Ljungqvist, F. C., Büntgen, U., Zorita, E., Wagner, S., Esper, J., McCarroll, D., Toreti, A., Frank, D., Jungclaus, J. H., Barriendos, M., Bertolin, C., Bothe, O., Brázdil, R., Camuffo, D., Dobrovolný, P., Gagen, M., García-Bustamante, E., Ge, Q., Gómez-Navarro, J. J., Guiot, J., Hao, Z., Hegerl, G. C., Holmgren, K., Klimenko, V. V., Martín-Chivelet, J., Pfister, C., Roberts, N., Schindler, A., Schurer, A., Solomina, O., Gunten, L. v., Wahl, E., Wanner, H., Wetter, O., Xoplaki, E., Yuan, N., Zanchettin, D., Zhang, H., and Zerefos, C.: European summer temperatures since Roman times, Environ. Res. Lett., 11, 024001, https://doi.org/10.1088/1748-9326/11/2/024001, 2016.
Mann, M. E., Bradley, R. S., and Hughes, M. K.: Northern hemisphere temperatures during the past millennium: Inferences, uncertainties, and limitations, Geophys. Res. Lett., 26, 759–762, https://doi.org/10.1029/1999GL900070, 1999.
McCarroll, D., Pettigrew, E., Luckman, A., Guibal, F., and Edouard, J. L.: Blue Reflectance Provides a Surrogate for Latewood Density of High-latitude Pine Tree Rings, Arct. Antarct. Alp. Res., 34, 450–453, https://doi.org/10.1080/15230430.2002.12003516, 2002.
Pacheco, A., Camarero, J. J., and Carrer, M.: Shifts of irrigation in Aleppo pine under semi-arid conditions reveal uncoupled growth and carbon storage and legacy effects on wood anatomy, Agr. Forest Meteorol., 253–254, 225–232, https://doi.org/10.1016/j.agrformet.2018.02.018, 2018.
PAGES 2k Consortium: Continental-scale temperature variability during the past two millennia, Nat. Geosci., 6, 339–346, https://doi.org/10.1038/ngeo1797, 2013.
PAGES 2k Consortium: A global multiproxy database for temperature reconstructions of the Common Era, Scientific Data, 4, 170088, https://doi.org/10.1038/sdata.2017.88, 2017.
PAGES 2k-PMIP3 group: Continental-scale temperature variability in PMIP3 simulations and PAGES 2k regional temperature reconstructions over the past millennium, Clim. Past, 11, 1673–1699, https://doi.org/10.5194/cp-11-1673-2015, 2015.
Phipps, S. J., McGregor, H. V., Gergis, J., Gallant, A. J. E., Neukom, R., Stevenson, S., Ackerley, D., Brown, J. R., Fischer, M. J., and van Ommen, T. D.: Paleoclimate Data–Model Comparison and the Role of Climate Forcings over the Past 1500 Years, J. Climate, 26, 6915–6936, https://doi.org/10.1175/jcli-d-12-00108.1, 2013.
Piermattei, A., Crivellaro, A., Krusic, P. J., Esper, J., Vítek, P., Oppenheimer, C., Felhofer, M., Gierlinger, N., Reinig, F., Urban, O., Verstege, A., Lobo, H., and Büntgen, U.: A millennium-long 'Blue Ring' chronology from the Spanish Pyrenees reveals severe ephemeral summer cooling after volcanic eruptions, Environ. Res. Lett., 15, 124016, https://doi.org/10.1088/1748-9326/abc120, 2020.
Pittermann, J., Limm, E., Rico, C., and Christman, M. A.: Structure–function constraints of tracheid-based xylem: a comparison of conifers and ferns, New Phytol., 192, 449–461, https://doi.org/10.1111/j.1469-8137.2011.03817.x, 2011.
Prendin, A. L., Petit, G., Carrer, M., Fonti, P., Björklund, J., and von Arx, G.: New research perspectives from a novel approach to quantify tracheid wall thickness, Tree Physiol., 37, 976–983, 2017.
Rathgeber, C. B., Cuny, H. E., and Fonti, P.: Biological Basis of Tree-Ring Formation: A Crash Course, Front. Plant Sci., 7, 734, https://doi.org/10.3389/fpls.2016.00734, 2016.
Rohde, R. A. and Hausfather, Z.: The Berkeley Earth Land/Ocean Temperature Record, Earth Syst. Sci. Data, 12, 3469–3479, https://doi.org/10.5194/essd-12-3469-2020, 2020.
Rydval, M., Larsson, L.-Å., McGlynn, L., Gunnarson, B. E., Loader, N. J., Young, G. H. F., and Wilson, R.: Blue intensity for dendroclimatology: Should we have the blues? Experiments from Scotland, Dendrochronologia, 32, 191–204, https://doi.org/10.1016/j.dendro.2014.04.003, 2014.
Rydval, M., Druckenbrod, D., Anchukaitis, K. J., and Wilson, R.: Detection and removal of disturbance trends in tree-ring series for dendroclimatology, Can. J. Forest Res., 46, 387–401, https://doi.org/10.1139/cjfr-2015-0366, 2015.
Rydval, M., Druckenbrod, D. L., Svoboda, M., Trotsiuk, V., Janda, P., Mikoláš, M., Čada, V., Bače, R., Teodosiu, M., and Wilson, R.: Influence of sampling and disturbance history on climatic sensitivity of temperature-limited conifers, The Holocene, 28, 1574–1587, https://doi.org/10.1177/0959683618782605, 2018.
Schneider, L., Smerdon, J. E., Büntgen, U., Wilson, R. J. S., Myglan, V. S., Kirdyanov, A. V., and Esper, J.: Revising midlatitude summer temperatures back to A.D. 600 based on a wood density network, Geophys. Res. Lett., 42, 4556–4562, https://doi.org/10.1002/2015GL063956, 2015.
Schweingruber, F., Fritts, H., Bräker, O., Drew, L., and Schär, E.: The X-ray technique as applied to dendroclimatology, Tree-Ring Bulletin, 38, 61–91, 1978.
Seftigen, K., Goosse, H., Klein, F., and Chen, D.: Hydroclimate variability in Scandinavia over the last millennium – insights from a climate model–proxy data comparison, Clim. Past, 13, 1831–1850, https://doi.org/10.5194/cp-13-1831-2017, 2017.
St. George, S. and Luckman, B. H.: Extracting a paleotemperature record from Picea engelmannii tree-line sites in the central Canadian Rockies, Can. J. Forest Res., 31, 457–470, https://doi.org/10.1139/x00-188, 2001.
Stoffel, M., Khodri, M., Corona, C., Guillet, S., Poulain, V., Bekki, S., Guiot, J., Luckman, B. H., Oppenheimer, C., Lebas, N., Beniston, M., and Masson-Delmotte, V.: Estimates of volcanic-induced cooling in the Northern Hemisphere over the past 1,500 years, Nat. Geosci., 8, 784–788, https://doi.org/10.1038/ngeo2526, 2015.
Vincent, L. A. and Gullett, D.: Canadian historical and homogeneous temperature datasets for climate change analyses, Int. J. Climatol., 19, 1375–1388, 1999.
von Arx, G. and Carrer, M.: ROXAS – a new tool to build centuries-long tracheid-lumen chronologies in conifers, Dendrochronologia, 32, 290–293, https://doi.org/10.1016/j.dendro.2013.12.001, 2014.
von Arx, G., Crivellaro, A., Prendin, A. L., Cufar, K., and Carrer, M.: Quantitative wood anatomy – practical guidelines, Front. Plant Sci., 7, 781, https://doi.org/10.3389/fpls.2016.00781, 2016.
von Storch, H., Zorita, E., Jones, J. M., Dimitriev, Y., González-Rouco, F., and Tett, S. F. B.: Reconstructing Past Climate from Noisy Data, Science, 306, 679–682, https://doi.org/10.1126/science.1096109, 2004.
Wang, F., Arseneault, D., Boucher, É., Galipaud Gloaguen, G., Deharte, A., Yu, S., and Trou-kechout, N.: Temperature sensitivity of blue intensity, maximum latewood density, and ring width data of living black spruce trees in the eastern Canadian taiga, Dendrochronologia, 64, 125771, https://doi.org/10.1016/j.dendro.2020.125771, 2020.
Wigley, T. M. L., Briffa, K. R., and Jones, P. D.: On the Average Value of Correlated Time Series, with Applications in Dendroclimatology and Hydrometeorology, J. Appl. Meteorol. Clim., 23, 201–213, https://doi.org/10.1175/1520-0450(1984)023<0201:OTAVOC>2.0.CO;2, 1984.
Wilkinson, S., Ogée, J., Domec, J.-C., Rayment, M., and Wingate, L.: Biophysical modelling of intra-ring variations in tracheid features and wood density of Pinus pinaster trees exposed to seasonal droughts, Tree Physiol., 35, 305–318, https://doi.org/10.1093/treephys/tpv010, 2015.
Wilson, R., Rao, R., Rydval, M., Wood, C., Larsson, L.-Å., and Luckman, B. H.: Blue Intensity for dendroclimatology: The BC blues: A case study from British Columbia, Canada, The Holocene, 24, 1428–1438, https://doi.org/10.1177/0959683614544051, 2014.
Wilson, R., Anchukaitis, K., Briffa, K. R., Büntgen, U., Cook, E., D'Arrigo, R., Davi, N., Esper, J., Frank, D., Gunnarson, B., Hegerl, G., Helama, S., Klesse, S., Krusic, P. J., Linderholm, H. W., Myglan, V., Osborn, T. J., Rydval, M., Schneider, L., Schurer, A., Wiles, G., Zhang, P., and Zorita, E.: Last millennium northern hemisphere summer temperatures from tree rings: Part I: The long term context, Quaternary Sci. Rev., 134, 1–18, https://doi.org/10.1016/j.quascirev.2015.12.005, 2016.
Wilson, R., Anchukaitis, K., Andreu-Hayles, L., Cook, E., D'Arrigo, R., Davi, N., Haberbauer, L., Krusic, P., Luckman, B., Morimoto, D., Oelkers, R., Wiles, G., and Wood, C.: Improved dendroclimatic calibration using blue intensity in the southern Yukon, The Holocene, 29, 1817–1830, https://doi.org/10.1177/0959683619862037, 2019.
Wilson, R., Allen, K., Baker, P., Boswijk, G., Buckley, B., Cook, E., D'Arrigo, R., Druckenbrod, D., Fowler, A., Grandjean, M., Krusic, P., and Palmer, J.: Evaluating the dendroclimatological potential of blue intensity on multiple conifer species from Tasmania and New Zealand, Biogeosciences, 18, 6393–6421, https://doi.org/10.5194/bg-18-6393-2021, 2021.
Wilson, R. J. S. and Luckman, B. H.: Dendroclimatic reconstruction of maximum summer temperatures from upper treeline sites in Interior British Columbia, Canada, The Holocene, 13, 851–861, https://doi.org/10.1191/0959683603hl663rp, 2003.
Zhang, X., Vincent, L. A., Hogg, W., and Niitsoo, A.: Temperature and precipitation trends in Canada during the 20th century, Atmos. Ocean, 38, 395–429, 2000.
Ziaco, E.: A phenology-based approach to the analysis of conifers intra-annual xylem anatomy in water-limited environments, Dendrochronologia, 59, 125662, https://doi.org/10.1016/j.dendro.2019.125662, 2020.