the Creative Commons Attribution 4.0 License.
the Creative Commons Attribution 4.0 License.
 | 20 Jan 2022
Holocene palaeoceanography of the Northeast Greenland shelf
Teodora Pados-Dibattista
Christof Pearce
Henrieka Detlef
Jørgen Bendtsen
The Northeast Greenland shelf is highly sensitive to climate and ocean variability because it is swept by the East Greenland Current, which, through the western Fram Strait, forms the main pathway of export of sea ice and cold water masses from the Arctic Ocean into the North Atlantic Ocean. In order to reconstruct the variability of the East Greenland Current and general palaeoceanographic conditions in the area during the Holocene, we carried out benthic foraminiferal assemblage, stable isotope, and sedimentological analyses of a marine sediment core retrieved from the Northeast Greenland shelf (core DA17-NG-ST07-73G). The results reveal significant variations in the water masses and thus in the strength of the East Greenland Current over the last ca. 9.4 kyr. Between 9.4 and 8.2 ka the water column off Northeast Greenland was highly stratified, with cold, sea-ice-loaded surface waters and a strong influx of warm Atlantic Water in the subsurface. At ∼ 8.4 ka a short-lived peak in terrestrial elements may be linked to an influx of iceberg-transported sediments and thus to the so-called 8.2 ka event. Conditions similar to those of the Holocene Thermal Maximum prevailed from 8.2 to 6.2 ka, with a strong influence of the Return Atlantic Current and a weakened transport of Polar Water in the upper East Greenland Current. After 6.2 ka we recorded a return to a more stratified water column with sea-ice-loaded surface waters and still Atlantic-sourced subsurface waters. After 4.2 ka increased Polar Water at the surface of the East Greenland Current and a reduction in the Return Atlantic Water at subsurface levels signifies freshening and reduced stratification of the water column and (near) perennial sea-ice cover. The neoglaciation started at 3.2 ka at our location, characterized by a strengthened East Greenland Current. Cold subsurface-water conditions with possible sea-ice cover and minimum surface-water productivity persisted here throughout the last ∼ 3 kyr.
- Article
(11244 KB) - Full-text XML
- BibTeX
- EndNote


The acceleration of climatic changes in the Arctic and subarctic regions is particularly marked by the drastic reduction of summer sea-ice cover. According to model simulations, the Arctic Ocean may become seasonally ice-free as early as 2040–2050 (Stroeve et al., 2012). This sea-ice reduction has societal and environmental relevance, as it may open new opportunities for shipping and societal development of Arctic regions and Greenland. Furthermore, the sea-ice decline has been shown to alter Arctic ecosystems (Ardyna et al., 2014). However, despite their importance, Holocene marine environments and corresponding natural sea-ice states around Greenland are still not well understood. The Northeast (NE) Greenland continental shelf is a particularly important region for studying and understanding the mechanisms that control sea-ice formation, melt, and drift. It is the broadest shelf along the Greenland margin, extending more than 300 km from the coastline. To the west it reaches the eastern Greenland coast with its major marine-terminating outlets of the Greenland Ice Sheet, while to the east it is bounded by the Fram Strait, which is the only deep passage between the Arctic Ocean and the rest of the world oceans. This shelf region is highly sensitive to climate and ocean variability because it underlies the East Greenland Current (EGC), which, through the western Fram Strait, is the main pathway of export of sea ice and cold water masses from the Arctic Ocean into the North Atlantic Ocean (Rudels and Quadfasel, 1991). The outflow of meltwater and sea ice is a key factor that determines the North Atlantic freshwater budget and stratification, and it influences the deep-water formation. Moreover, waters on the NE Greenland continental shelf play a major role in the stability of the glacier outlets (Nioghalvfjerdsfjorden Glacier, Zachariæ Isstrøm, Storstrømmen) of the Northeast Greenland Ice Stream (Wilson and Straneo, 2015; Schaffer et al., 2017).
At the surface, the EGC carries cold and fresh Polar Water (PW) southward. Below this relatively low-salinity layer, the water masses originate from submerged and recirculated Atlantic-sourced waters from the Arctic (Arctic Atlantic Water, AAW) and partly from the Return Atlantic Current (RAC) (Quadfasel et al., 1987) (Fig. 1). The EGC transports these water masses from the north and along the East Greenland shelf towards the North Atlantic Ocean.

Figure 1(a) Close-up image of the Northeast Greenland shelf showing its characteristic features, the location of the studied sediment core (black circle), and the schematic subsurface circulation of the continental shelf (orange arrows). Arctic Atlantic Water (AAW), Return Atlantic Water (RAW), Nioghalvfjerdsfjorden Glacier (79NG), Zachariæ Isstrøm (ZI), Storstrømmen (SS), the Northeast Greenland Ice Stream (NEGIS, grey arrows), and the Norske Øer Ice Barrier (NØIB; dashed white line) are all labelled. (b) Overview map of the study area with the studied sediment core DA17-NG-ST07-73G (black circle; Rumohr core DA17-NG-ST07-72R was taken from the same site), other core sites mentioned in the text (open circles), and schematic illustration of the major currents shown. The East Greenland Current (EGC), West Spitsbergen Current (WSC), Return Atlantic Current (RAC), Irminger Current (IC), and West Greenland Current (WGC) are all labelled. Red arrows show warm surface currents, blue arrows show cold surface currents, and the orange arrow shows cooled Atlantic-originated subsurface-water mass, i.e. Arctic Atlantic Water (AAW). The following core sites are also labelled: PS93/025 (Syring et al., 2020a; Zehnich et al., 2020), PS100/270 (Syring et al., 2020b), JM10-330 (Consolaro et al., 2018), MSM5/5-712 (Müller et al., 2012; Werner et al., 2013), JM02-440 (Ślubowska-Woldengen et al., 2007), PS1878 (Telesinski et al., 2014a, b), PS2641-4 (Müller et al., 2012; Perner et al., 2015; Kolling et al., 2017), PS1243 (Bauch et al., 2001), DA00-02 (Seidenkrantz et al., 2008), MD99-2317 (Jennings et al., 2011), JM96-1206 (Jennings et al., 2002; Perner et al., 2016), MD99-2322 (Jennings et al., 2011), MD99-2275 (Ran et al., 2006), MD95-2011 (Giraudeau et al., 2010), MD99-2269 (Giraudeau et al., 2004, 2010), MD99-2266 (Moossen et al., 2015), 248260 (Seidenkrantz et al., 2007), and DA12-11/2 (Van Nieuwenhove et al., 2018; Orme et al., 2018). The black line shows the location of the hydrographic transect pictured in Fig. 2b. The dashed black line shows the median sea-ice extent in September (1981–2010). The ocean bathymetry data are derived from GEBCO (Weatherall et al., 2015).
The freshwater budget here is one of the components that affects the strength of the Atlantic Meridional Overturning Circulation (AMOC; Rahmstorf, 1995; Clark et al., 2002). The AMOC transports warm and salty surface waters to high latitudes in the eastern Nordic Seas and the Arctic Ocean, where they cool, sink, and return southwards at depth. Increased freshwater flux from the EGC to the Nordic Seas and the northern North Atlantic may prevent deep convection, thus reducing meridional heat transport, which causes cooling of the high latitudes (Clark et al., 2001). At present, due to the anthropogenic global warming, the AMOC may be in its weakest state in the last 1000 years (Caesar et al., 2021), demanding an improved understanding of this complex system and its components.
The amount of PW transported southward in the EGC is related to ocean-atmosphere dynamics in the Arctic Ocean, such as the Transpolar Drift (e.g. Mysak, 2001) and the regional wind stress above the Nordic Seas and Greenland shelf area; it thereby also depends on the North Atlantic Oscillation (NAO) and its Arctic counterpart, the Arctic Oscillation (AO) (e.g. Hurell et al., 2003). The NAO/AO is one of the most prominent and recurrent patterns of atmospheric circulation variability. The NAO/AO mode of variability refers to a redistribution of air masses between the Arctic and the subtropical Atlantic linked to shifts in sea-level pressure. Its shifts from positive to negative phase produce large changes in the weather of the middle and high altitudes of the Northern Hemisphere (Hurrell et al., 2003). In cases of positive NAO/AO, strong southwesterlies carry moist air over Europe and Siberia, Atlantic Water (AW) inflow to the Arctic Ocean through the Fram Strait increases, and temperatures in the Arctic increase, which leads to a reduction in sea ice formation. During intervals of a negative NAO/AO these phenomena appear to be reversed (Kwok, 2000; Hurrell and Deser, 2010).
Several studies suggest that the East Greenland shelf has been subjected to a series of oceanographic and palaeoclimatic changes during the Holocene, induced by changes in the strength of the EGC linked to fluctuations in AW entrainment. Most of these studies focus on the shelf region of middle and southeastern Greenland (e.g. Jennings et al., 2002, 2011; Müller et al., 2012; Perner et al., 2015, 2016; Kolling et al., 2017) and only few studies have investigated the palaeoceanographic evolution of the EGC in the northern part of the East Greenland shelf (Bauch et al., 2001; Syring et al., 2020a, b; Zehnich et al., 2020).
In this study, we aim to reconstruct the dynamics and variability of the EGC off NE Greenland at centennial resolution throughout most of the Holocene, using micropalaeontological, sedimentological, and geochemical analysis of a sediment core retrieved from the central NE Greenland shelf. Faunal assemblage analysis of benthic and planktic foraminifera, stable isotope measurements, radiocarbon dating, and X-ray fluorescence data allow us to infer changes in sea surface productivity, subsurface temperatures, sea-ice conditions, and Greenland Ice Sheet melting over the last ca. 9.4 kyr. The reconstruction provides new insights into the not yet resolved palaeoceanographic evolution of this region, with comparisons to published records from the larger polar and subpolar North Atlantic region.
The bathymetry of the NE Greenland continental shelf is characterized by a trough system consisting of five prominent cross-shelf troughs that are deeper than the surrounding banks (Arndt et al., 2015). Nioghalvfjerdsfjorden Glacier (or 79 North Glacier), Zachariæ Isstrøm, and Storstrømmen (Fig. 1) are the three major marine-terminating glaciers of the Northeast Greenland Ice Stream that drain in the area. Our study site is located approximately in the middle of the shelf in an inter-trough area between the Westwind Trough and Norske Trough, facing Nioghalvfjerdsfjorden Glacier and Zachariæ Isstrøm (Fig. 1). The location lies directly on the flow path of the EGC, which flows southward along the Greenland shelf break (Johannessen, 1986) and over the middle to outer shelf (Bourke et al., 1987). Below a layer of the relatively low-salinity Polar Surface Water, mainly originating from the Arctic Ocean and with contribution from local meltwater, the upper part of the EGC carries cold, low-salinity (T: 0–1 ∘C; S: <32) Polar Water (PW) from the Arctic Ocean in the upper ca. 200 m of the water column. At subsurface levels below the PW, the water mass has its main origin from Atlantic sources, i.e. to varying extent from the Return Atlantic Water (RAW; transported by the RAC) and from Arctic Atlantic Water (AAW; also sometimes named “Arctic Intermediate Water”) (Rudels et al., 2005) (Fig. 2). The RAC is the western branch of the West Spitsbergen Current that transports relatively warm and saline water masses (T: <2 ∘C; S: 34–35) from the North Atlantic towards NE Greenland and then (by joining the EGC) travels southwards along the Greenland coast. In contrast, the eastern branch of the West Spitsbergen Current transports AW into the Arctic Ocean, where it circulates at subsurface levels and cools. The AAW (T: ≥0 ∘C; S: 34–35) is formed by this recirculated cool AW, which again exits the Arctic Ocean, and (together with the RAC) it forms the subsurface section of the EGC as it flows southward along the East Greenland shelf (e.g. Quadfasel et al., 1987; Rudels, 2012). Along this southward path, the bathymetry on the NE Greenland shelf steers parts of the AW into the prominent cross-shelf troughs, toward the marine-terminating glaciers of the Northeast Greenland Ice Stream, and thereby modulates the glaciers' basal melt rates (Arndt et al., 2015; Schaffer et al., 2017).

Figure 2(a) Temperature and salinity profile of the water column at the coring station (79.073∘ N, 11.918∘ W) obtained during the NorthGreen17 expedition, showing the main water masses. (b) Annual average temperature of the water column in the upper 1000 m along a transect at 78.876∘ N, showing the main water masses at the study site. Polar Surface Water (PSW), Polar Water (PW), combined Arctic Atlantic Water (AAW), Return Atlantic Water (RAW), and upper Polar Deep Water (uPDW) are shown. The yellow star indicates the location of the core site at 385 m water depth. Temperature data are taken from the World Ocean Atlas 2018 (Boyer et al., 2018). The location of the transect is marked as a black line in Fig. 1b.
The Polar Front in the Greenland Sea represents the eastern limit of perennial sea-ice cover. The location of the sea-ice edge in the summer depends on the extent of the sea-ice export from the Arctic Ocean (Vinje, 1977). Today the sea-ice margin and the location of the Polar Front lies east of our study site (Danish Meteorological Institute (DMI) and NSIDC, 2012). However, the Northeast Water Polynya is in fairly close proximity to our core location. This is a seasonally ice-free or only loosely ice-covered area south of Nordøstrundingen (Fig. 1) on the eastern Greenland coast. Two ice barriers support the seasonal formation of the Northeast Water Polynya. The shelf ice of the Ob Bank (Fig. 1a) pushes drift ice eastward, while the Norske Øer Ice Barrier (Fig. 1a) blocks the northward flowing sea ice, which is entrained in the NE Greenland coastal current (Schneider and Budéus, 1994). It starts to open around May–June, gradually increases in size, and closes in September (Pedersen et al., 1993). The polynya's maximum extent to the north can reach high latitudes up to 83∘ N, beyond the NE Greenland shelf. To the east, the polynya can occupy the entire NE Greenland shelf with only a little sea ice left in the area (Schneider and Budéus, 1997).
Gravity core DA17-NG-ST07-73G (79.068∘ N 11.903∘ W; hereafter 73G) was collected on 16 September 2017 at 385 m water depth in an isolated bathymetrical depression on the NE Greenland shelf during the NorthGreen2017 Expedition (Fig. 1; Seidenkrantz et al., 2018). In addition, we collected Rumohr core DA17-NG-ST07-72R (79.072∘ N 11.888∘ W, 384.6 m water depth; hereafter 72G) with an intact sediment–water interface from the same station, which provided information for the age model of the gravity core. Temperature and salinity of the water column were measured in situ by a Seabird CTD (conductivity–temperature–depth) profiler (Seabird SBE911 plus system equipped with two temperature and conductivity sensors) before the deployment of the gravity corer, with the core site being identified based on Innomar® sub-bottom profiler data obtained prior to coring.
The 410 cm long gravity core (73G) and the 88 cm long Rumohr core (72R) were stored at ca 3 ∘C before they were split lengthwise. The archive halves were scanned with an Itrax X-ray fluorescence (XRF) core scanner (Cox Analytical) at the Department of Geoscience, Aarhus University, Denmark. The scan was conducted with a Molybdenum tube (step size: 200 µm; exposure time: 10 s; voltage: 30 kV, current: 30 mA). The core scanning provided a line scan image, a 2 cm wide radiographic image of the centre of the core (voltage: 60 kV; current: 45 mA; exposure time: 2000 ms) and high-resolution analysis of bulk geochemical composition. From the results of the X-ray fluorescence scanning, we show the elements Si, K, and Ti and the ratio in Fig. 3.
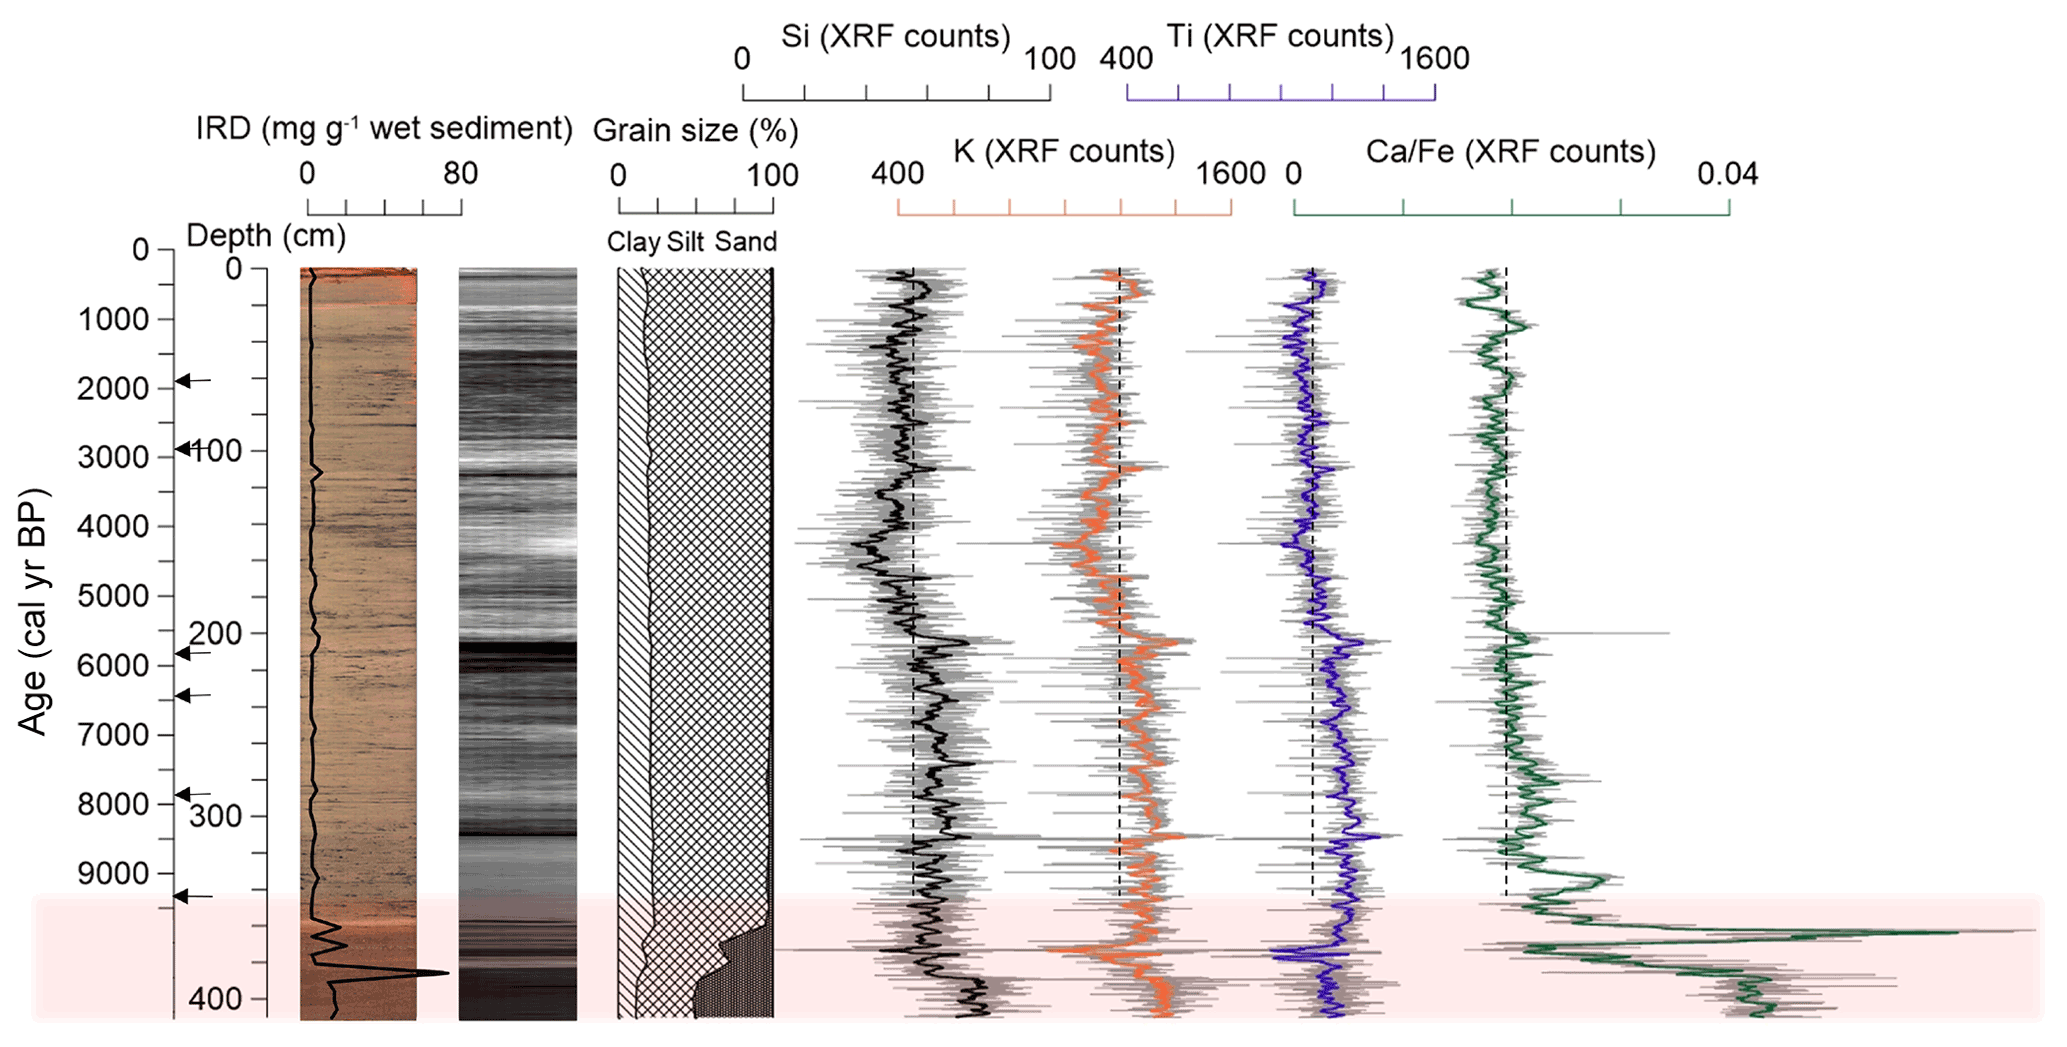
Figure 3Results of the sedimentological and XRF core scanning analyses of core DA17-NG-ST07-73G. From left to right, photograph of the core with the amount of IRD (black line), radiograph, grain size analysis, and XRF counts of selected elements are shown. Dashed black lines in the XRF curves represent the mean of the values measured throughout the core. Black arrows next to the left y axis (age) mark radiocarbon dates. The bottom 65 cm of the sediment core is marked with pink colour. The photograph and radiograph of the core were horizontally stretched.
The age–depth model of core 73G is based on six accelerator mass spectrometry radiocarbon (AMS 14C) dates, of which five are of mixed benthic foraminifera and one is of a worm tube lining. AMS 14C dating was performed at the Laboratory of Ion Beam Physics, ETH Zürich, Switzerland. Radiocarbon ages were calibrated using the Marine20 calibration dataset (Heaton et al., 2020) and a local marine reservoir age correction (ΔR) of 0 ± 50 years (Reimer and Reimer, 2001). We are aware that Heaton et al. (2020) state that the Marine20 is not suitable for polar regions. However, the same was true (but not explicitly stated) for the earlier marine radiocarbon age calibration curve Marine13 (Reimer et al., 2013), which has been commonly used in Arctic palaeoceanography (e.g. Perner et al., 2015; Seidenkrantz et al., 2019; Syring et al., 2020a). The presence of sea ice in polar regions impacts the local reservoir age, and therefore there is added uncertainty; this issue is not resolved by using an older calibration dataset. Since its publication, the Marine20 has been widely used in the Arctic realm (e.g. Farmer et al., 2021; El bani Altuna et al., 2021). Moreover, for this specific Holocene reconstruction, the differences between using Marine13 and Marine20 are much smaller than the associated uncertainties (see Table A1 in the appendix).
The age-depth model was made with the OxCal v4.4 software (Ramsey, 2008) using a P-sequence depositional model. Beyond the lowest radiocarbon date, the model is extrapolated toward the bottom of the core. The age of the upper part of the core is constrained by correlation to Rumohr core 72R by selected XRF elements (Fig. A1) to determine the amount of top sediment loss during gravity coring.
Samples for foraminiferal, ice-rafted debris (IRD) and stable isotope analyses were taken at 5 cm intervals at the Department of Geoscience, Aarhus University. The samples were weighed; wet-sieved with distilled water through sieves of 1000, 100, and 63 µm; dried at 40 ∘C for 24 h; and weighed again. For the foraminiferal assemblage analyses both planktic and benthic (calcareous and agglutinated) species were counted and identified to species level under a stereomicroscope for the size fractions of 63–100 µm and >100 µm; counts were subsequently combined prior to percentage calculations. When the samples contained excessive material, prior to counting they were split into equal parts containing >300 specimens, using a microsplitter. In these cases, foraminiferal tests of one part were counted and identified, and the total number of foraminifera was calculated. A minimum of 300 benthic specimens were identified for each sample, except for four samples (10–11, 15–16, 30–31, 195–196 cm). These four samples only contained between 242 and 296 specimens. Absolute foraminiferal concentrations were calculated as individuals per gram of wet sediment. Relative abundances of both benthic agglutinated and calcareous species were calculated as a percentage of the total benthic (calcareous and agglutinated) foraminiferal fauna. However, diagrams of the separate percentage calculations of the two benthic foraminiferal groups (agglutinated species of total agglutinated assemblage and calcareous species of total calcareous assemblage) are shown in the Appendix A (Figs. A2 and A3), as are diagrams of the same species as number of individuals per gram of wet sediment.
After counting, we placed selected benthic calcareous foraminifera species into groups according to their main environmental preferences; for details see the discussion (Sect. 5.2) and Table A3 in Appendix A. The Atlantic Water group includes Cassidulina neoteretis and Pullenia bulloides. The chilled Atlantic Water group includes Islandiella norcrossi and Melonis barleeanum. The Arctic Water group designates species that are commonly found in connection to Polar Water and it includes Stetsonia horvathi and Epistominella arctica; these species are also found in connection to sea ice. The sea-ice edge group includes Stainforthia feylingi.
For stable isotope analysis 5–200 specimens of the benthic foraminiferal species Elphidium clavatum were picked from every sample. The number of picked tests was restricted by the number of available, clearly identifiable tests without any corrosion or non-typical shapes. The specimens belonged mainly to the 100–1000 µm fraction, supplemented with few specimens from the 63–100 µm fraction when necessary. The oxygen and carbon isotope analysis of foraminiferal calcite was performed at the Leibniz Laboratory for Radiometric Dating and Stable Isotope Research at the Christian-Albrecht University of Kiel using a MAT253 (Thermo Scientific) mass spectrometer system and a Kiel IV carbonate preparation device, with an analytical accuracy of <0.08 ‰ for δ18O and <0.05 ‰ for δ13C. Results are expressed in δ notation refer to the PDB (Pee Dee Belemnite) standard, while using NBS-19 and IAEA-603 carbonate standards.
The content of IRD was calculated at 5 cm sample intervals using the dry weight of the size fraction >1000 µm divided by the wet weight of the bulk sample.
Grain size distribution was measured for 42 samples (taken at 10 cm intervals) using a laser diffraction particle sizer (Sympatec Helos) at the Department of Geoscience, Aarhus University, and grouped into three fractions, i.e. sand (>60 µm), silt (2–60 µm), and clay (<2 µm), according to the available particle size intervals.
4.1 Core description
Core DA17-NG-ST07-73G consists entirely of olive grey (5Y 4/1) marine silt with some clay, except for in the lowermost part of the core. The sediment of the lowest 40 cm of the core is much coarser, containing up to 51 % sand; it is also darker in colour (Fig. 3). In the rest of the core, the sand fraction is on average 1.5 %, and the clay : silt : sand ratio does not show any significant changes.
4.2 Chronology
The age model was developed using six AMS 14C measurements on mixed benthic foraminifera and on an organic worm tube lining from core 73G (Table 1). In order to evaluate potential loss of core top sediment during the coring process, we compared the XRF data of gravity core 73G and Rumohr core 72R (Fig. A1), which indicated that 12 cm sediment was missing from the top of core 73G; this information was used when constructing the age model of core 73G. This age model suggest that the 410 cm long sediment core covers the last ∼ 11.2 kyr (Fig. 4). However, the results of the grain size, IRD, and X-ray fluorescence analysis indicate that beyond the lowest radiocarbon-dated sample (at 345 cm depth, 9.4 ka) the sediments change significantly (Fig. 4). In the bottom 65 cm of the core, preliminary analysis of foraminiferal content revealed the presence of species indicating a Pliocene or Early Pleistocene age (Feyling-Hanssen, 1976, 1980; Feyling-Hanssen et al., 1983), in addition to the normal in situ foraminiferal assemblage (see Sect. 4.4.1). We suggest that these Pliocene or Early Pleistocene foraminifera are reworked into a glaciomarine setting. Due to this very different environment and the lack of 14C dates in this interval, the age model of the bottom 65 cm of core 73G is currently uncertain. Therefore, the main focus of this paper is on the last 9.4 kyr.
Table 1List of radiocarbon dates and modelled ages in core DA17-NG-ST07-73G. All dates were calibrated using the Marine20 calibration curve and years. Comparison between results from calibration with Marine20 and Marine13 is shown in Table A1 in Appendix A.
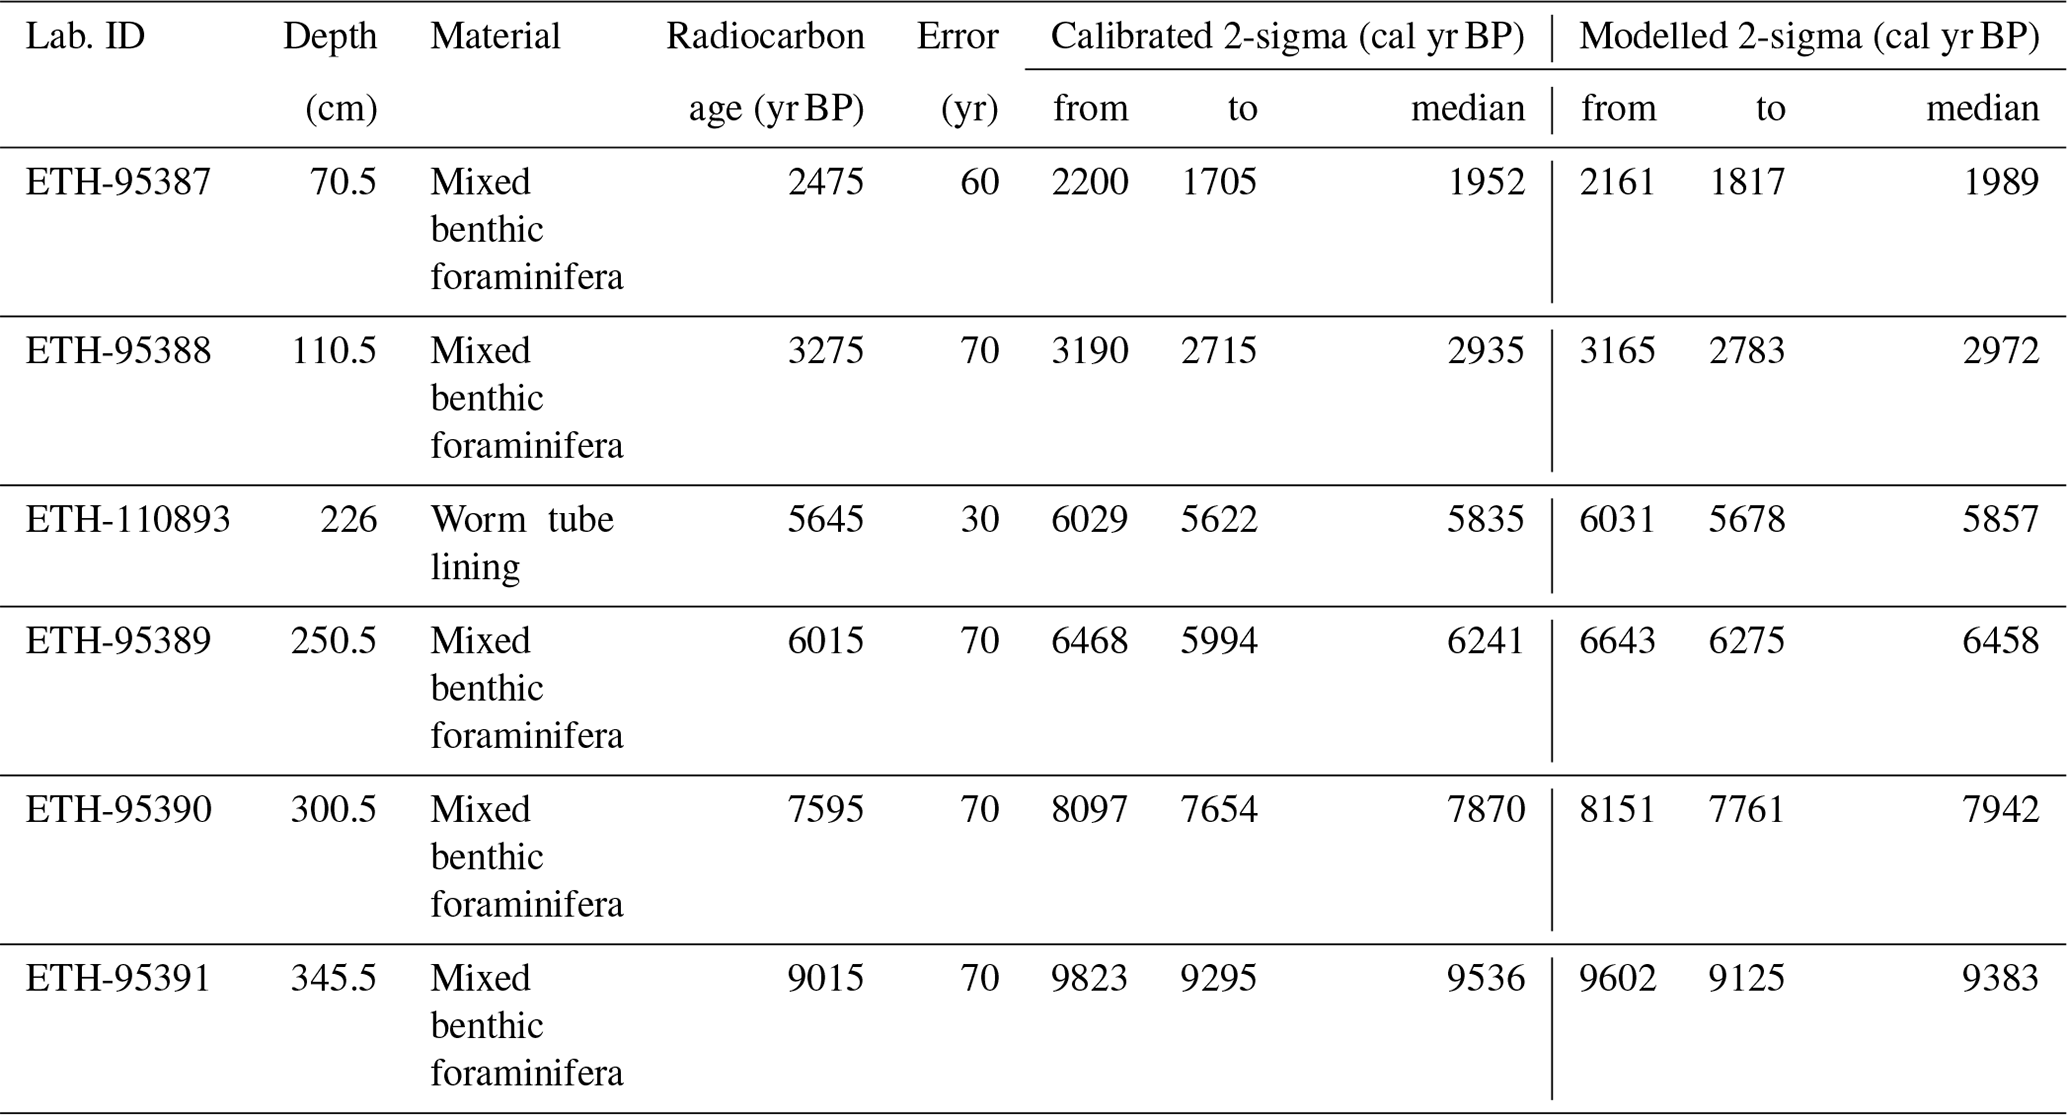
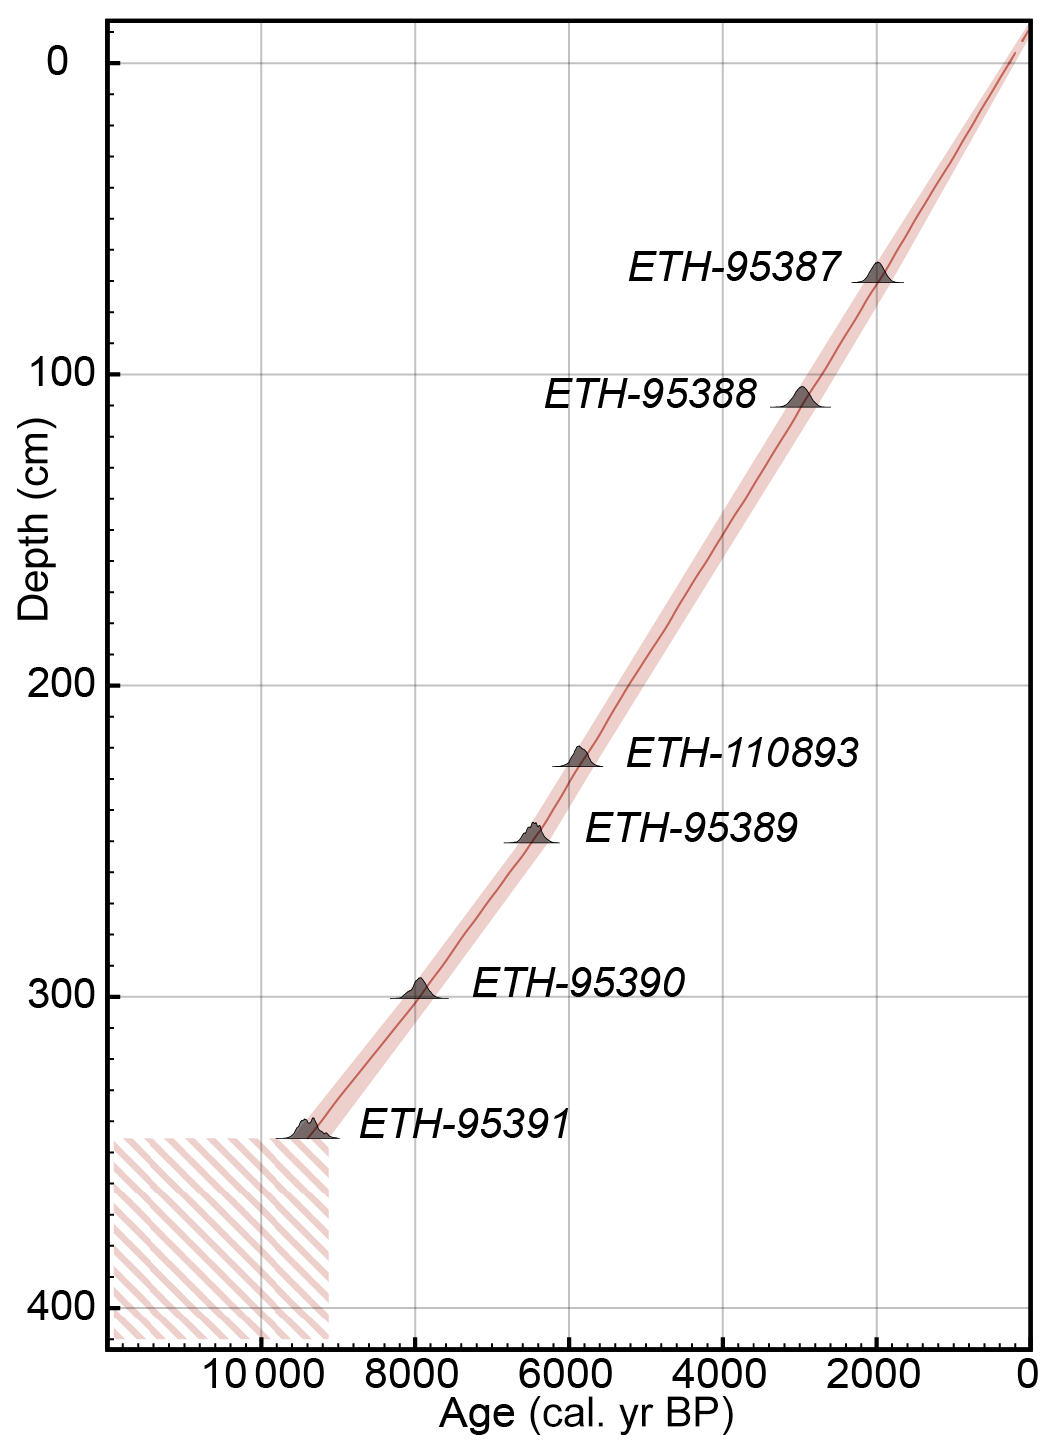
Figure 4Age–depth model of core DA17-NG-ST07-73G based on six AMS 14C dates and on the comparison with Rumohr core DA17-NG-ST7-72R. The shaded area around the line illustrates the 2-sigma uncertainty range of the model. The hatched box in the bottom of the core indicates an interval containing many reworked microfossils, which is therefore still of uncertain age (see pink shading in Fig. 3).
4.3 X-ray fluorescence
Throughout the whole core, Si, K, and Ti follow the same pattern. After a drop in values in the lowermost section of still uncertain age, all three records show relatively constant values until ∼ 318 cm depth (ca. 8.5 ka). At 316 cm (ca. 8.4 ka) all three elements displays peak counts, followed by a decrease until 161 cm (ca. 4.2 ka). There is a short-term drop in all three element counts at 161 cm depth (ca. 4.2 ka), followed by a steady increase until 125 cm (ca. 3.2 ka) and relatively constant values until the top of the core (Fig. 3). The ratio follows a steadily decreasing trend throughout the core, with slightly stronger fluctuations from 345 cm until ∼ 270 cm (ca. 7 ka) and in the top 55 cm (last ∼ 1.5 ka). The record shows a pronounced peak between 335 and 338 cm (ca. 9.1 ka), and two minor peaks at ∼ 213 cm (ca. 5.5 ka) and ∼ 34 cm (ca. 0.9 ka) (Fig. 3).
4.4 Foraminiferal analysis
4.4.1 At 410–345 cm core depth
The bottom 65 cm of the core are characterized by a mixture of two assemblages. An assemblage of relatively small, well-preserved specimens of Arctic species include Cassidulina reniforme, Elphidium clavatum, Islandiella norcrossi, and Melonis barleeanum. This assemblage is mixed with large specimens of Cibicidoides grossus, Cibicides scaldiciensis, Islandiella inflata, Cassidulina teretis, and Elphidium funderi, which depending on the species have been extinct since between the end of the Pliocene to the mid-Pleistocene (Feyling-Hanssen, 1976, 1980; Feyling-Hanssen et al., 1983; Seidenkrantz, 1995), and by species that are only present in temperate to tropical regions (Bulimina marginata, Faujasina sp.). The assemblage also contain some unusually large specimens of E. clavatum, Haynesina orbiculare, and Islandiella islandica.
4.4.2 At 345–0 cm core depth
We counted in total 70 samples and identified 65 benthic (44 calcareous and 21 agglutinated) and 3 planktic foraminiferal species (Table A2 in the appendix) in the top 345 cm of core 73G. Both benthic and planktic specimens were well-preserved and showed minor or no signs of post-mortem dissolution of the tests.
The foraminiferal content is relatively low throughout the core, the benthic foraminiferal concentration varies between 17 and 158 individuals (ind.) per gram of wet sediment (sed.) (calcareous 2–128 ind. g−1 sed., agglutinated 10–55 ind. g−1 sed.) (Fig. 5).
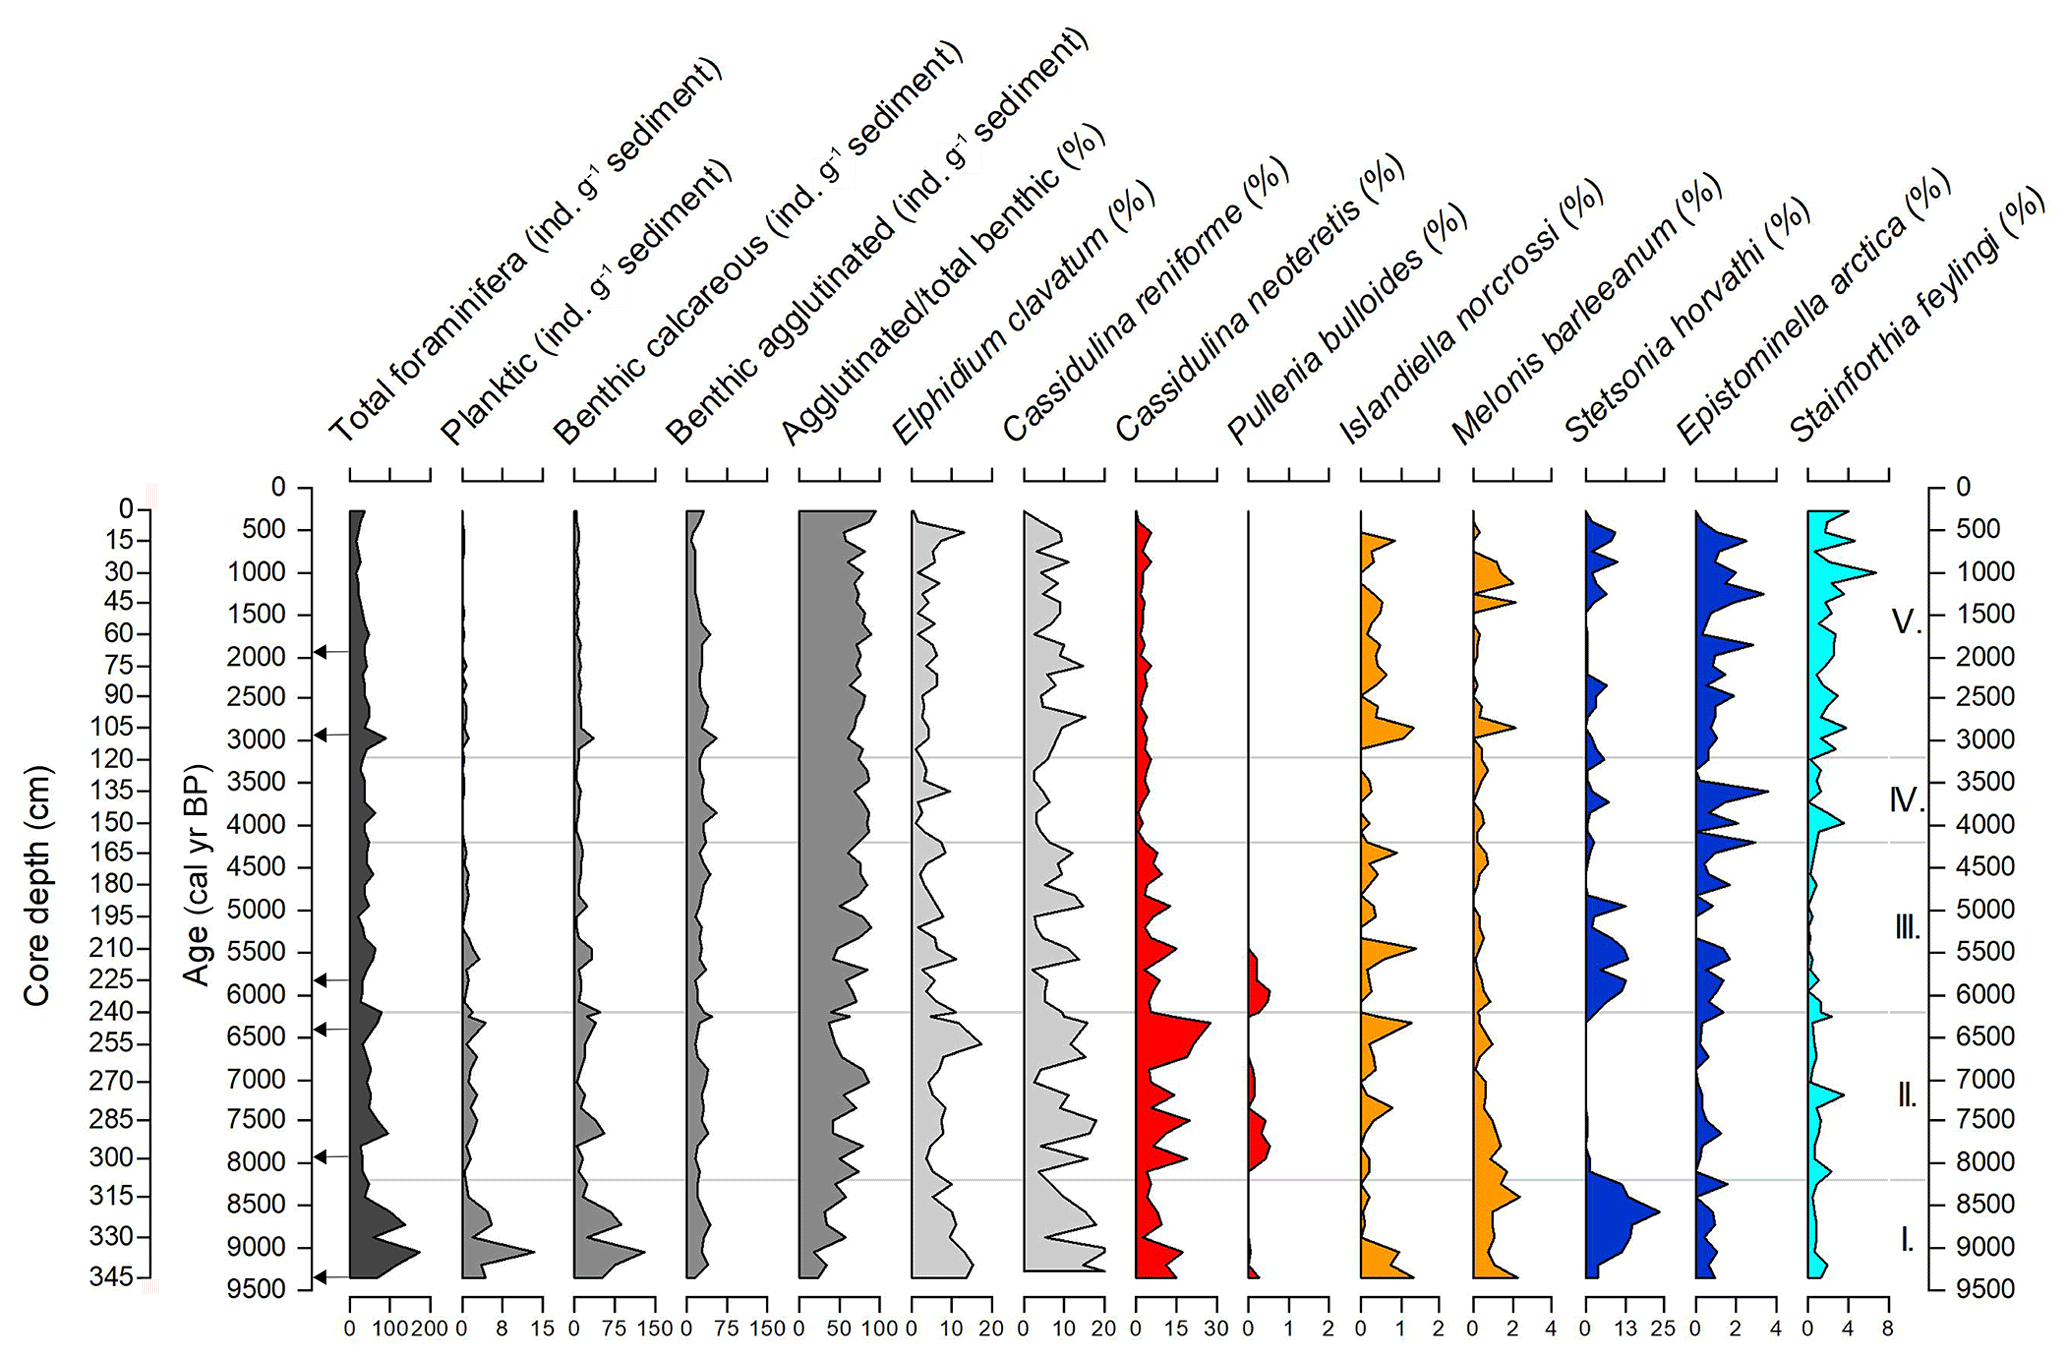
Figure 5Foraminiferal concentrations and relative abundances of nine selected calcareous benthic species (expressed as a percentage of total benthic foraminiferal content) versus calibrated age along sediment core DA17-NG-ST7-73G. The depicted species were chosen in order to show changes in the water masses. Red represents species that indicate warm Atlantic Water inflow, orange represents species that indicate in the Arctic recirculated and chilled Atlantic Water influence, dark blue represents Arctic Water species that are commonly found in connection to Polar Water and often live beneath perennial or near-perennial sea ice, and light blue represents a species that indicates sea ice edge conditions. Ecozones (I–V) are shown on the right side of the figure. Black arrows next to the left primary y axis (age) mark radiocarbon dates. Note that the x axes have different scalings.
The concentration of planktic foraminifera is extremely low throughout the core, being between 0 and 13 ind. g−1 sed. Planktic foraminifera are represented primarily by the polar species Neogloboquadrina pachyderma, occasionally accompanied in the interval between 340–130 cm (ca. 9.4–3.4 ka) by specimens of the subpolar species Turborotalita quinqueloba and Neogloboquadrina incompta. The overall occurrence of planktic foraminifera averages 2 % of the total foraminiferal fauna.
On average, benthic agglutinated foraminifera account for 65 % of the total foraminiferal assemblage. From the end of the record until 210 cm (ca. 5.4 ka) the calcareous species periodically outnumber the agglutinated ones. However, from 210 cm until the top of the record, agglutinated foraminifera continuously dominate the benthic assemblage (Fig. 5). Throughout the core, the most abundant benthic agglutinated species are Portatrochammina bipolaris, followed by Ammoglobigerina globigeriniformis, representing on average 42 % and 16 % (respectively) of the benthic agglutinated assemblage and 27.5 % and 10.5 % of the total benthic assemblage. They are both continuously present throughout the core, and their relative abundances do not show strong fluctuations (Fig. 6).
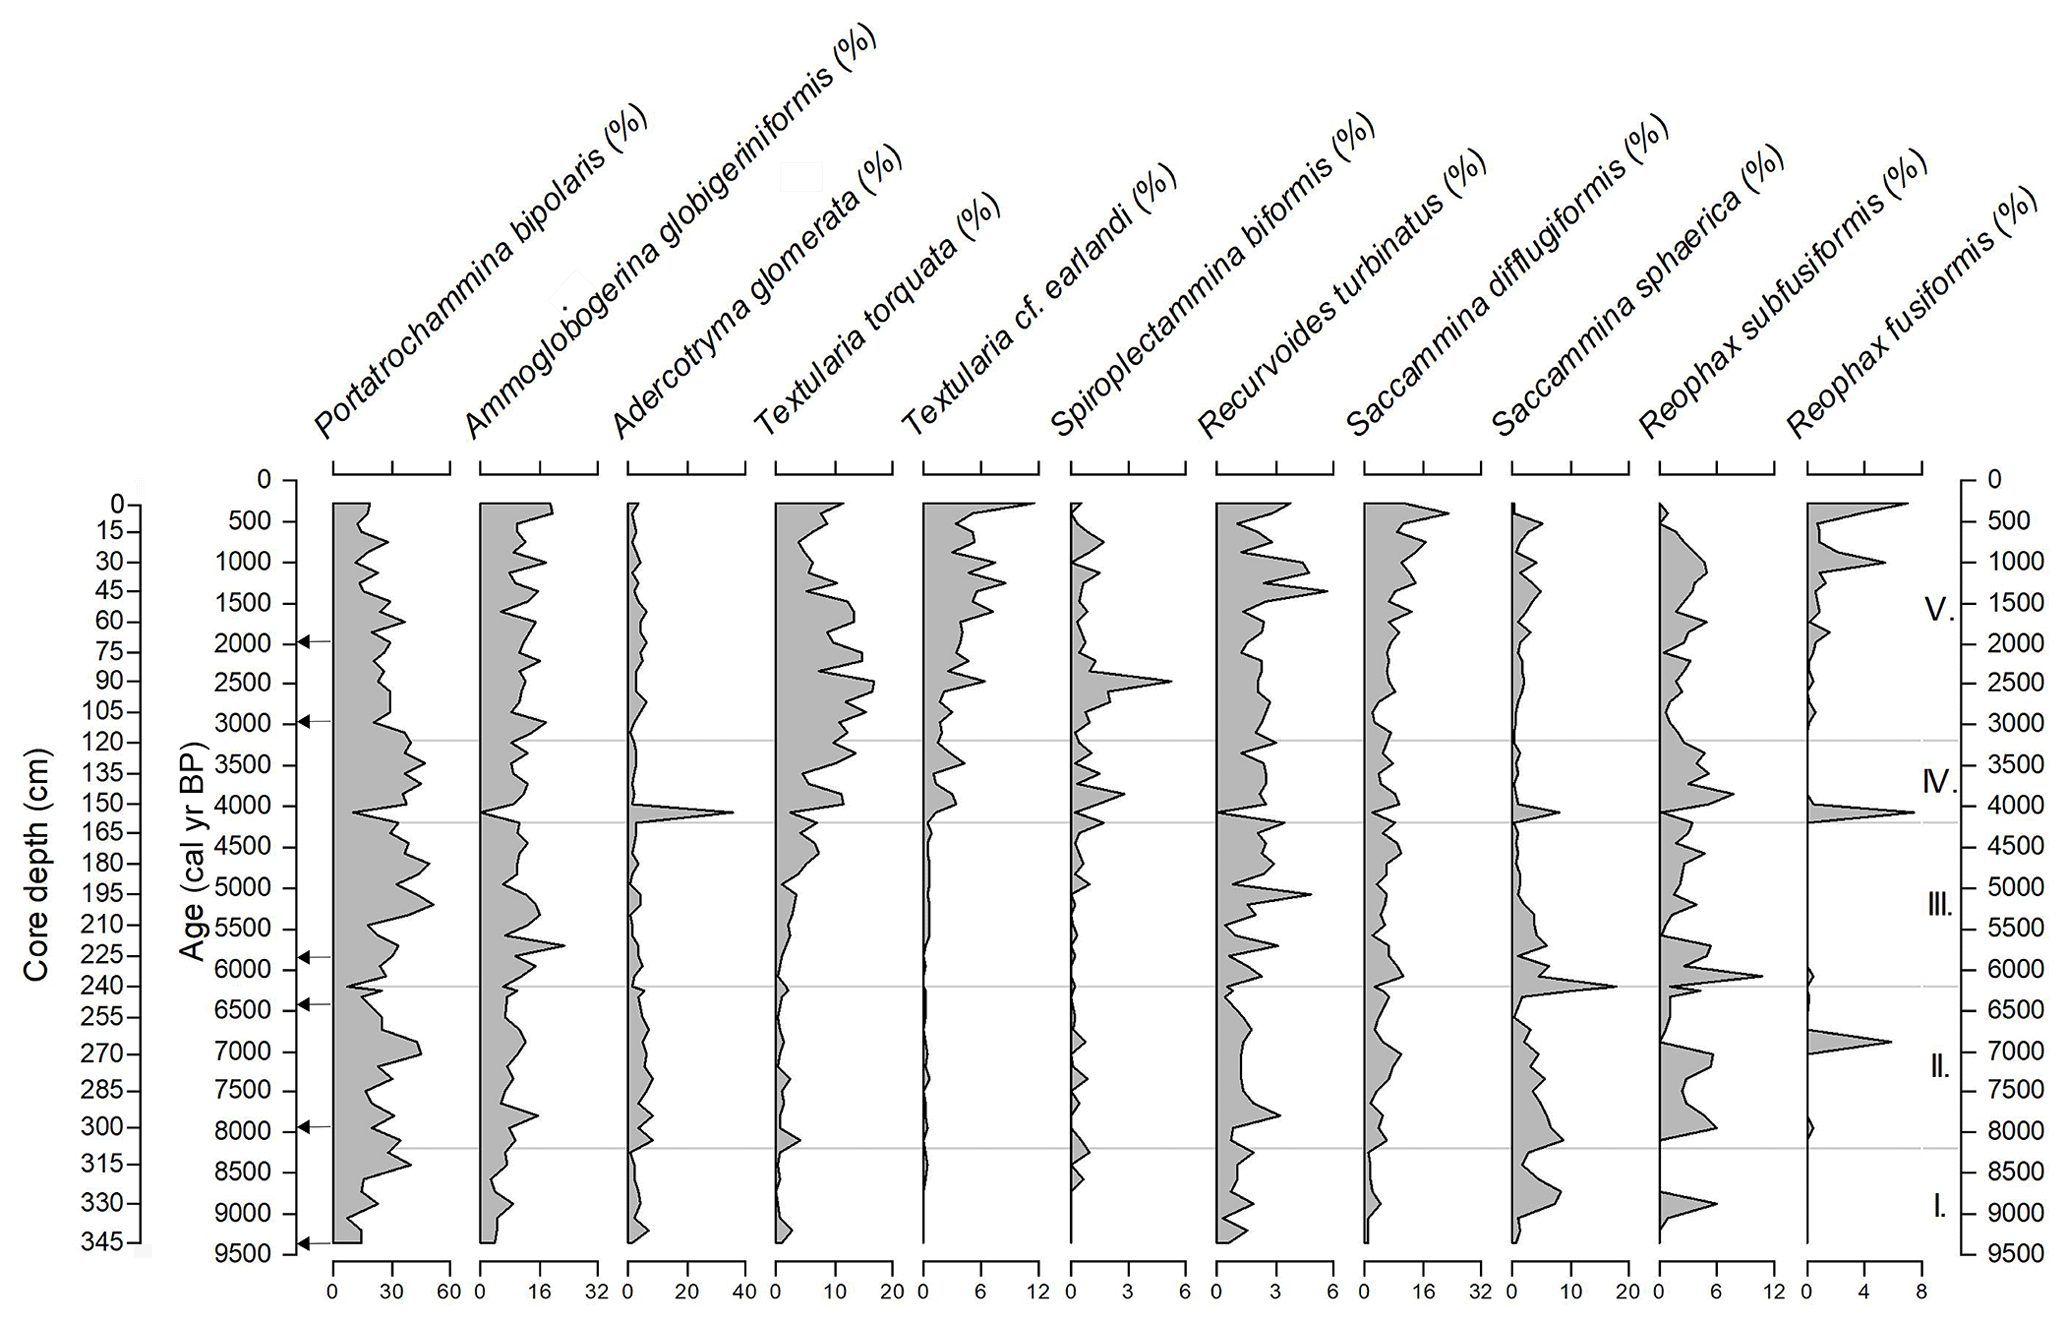
Figure 6Relative abundances of the most abundant (>5 % in at least one sample) agglutinated benthic foraminiferal species (expressed as a percentage of total benthic foraminiferal content) versus calibrated age along sediment core DA17-NG-ST07-73G. Ecozones (I–V) are shown on the right side of the figure. Black arrows next to the left primary y axis (age) mark radiocarbon dates. Note that the x axes have different scaling.
Benthic calcareous foraminifera represent on average 33 % of the total foraminiferal assemblage. The most abundant benthic calcareous species are C. reniforme, Cassidulina neoteretis, E. clavatum and Stetsonia horvathi (representing on average 8.7 %, 6.4 %, 5.9 % and 4.4 % of the whole benthic assemblage, respectively). From these four species the abundances of E. clavatum shows the least variability throughout the record (Fig. 5).
In the following sections, we describe foraminiferal assemblage zones (ecozones) in the dated section of the core (345–0 cm core depth). These zones were defined by visual evaluation and interpretation of the species abundances. Here it should be mentioned that species with relatively low abundances can also be significant for environmental interpretations. Boundaries were placed where major changes occurred in the relative abundances of the most important benthic calcareous and agglutinated species, indicating changes in the environment (Figs. 5 and 6). Unless otherwise specified, all relative frequencies are provided as average values for the interval.
4.4.3 Ecozone I (345–310 cm; ca. 9.4–8.2 ka)
This ecozone is characterized by the highest content of total foraminifera (171 ind. g−1 sed.), including the highest concentrations of planktic (13 ind. g−1 sed.) and benthic calcareous (128 ind. g−1 sed.) foraminifera throughout the core. These three categories show two peaks in this interval: the first and bigger peak at ca. 9 ka and the second, smaller peak at ca. 8.7 ka. We find in this interval the lowest agglutinated calcareous ratio (unshown), as the calcareous specimens almost continuously outnumber the agglutinated ones. The average concentration of agglutinated foraminifera is 29 ind. g−1 sed. in this zone, and it does not vary significantly throughout the other intervals either (27-29 ind. g−1 sed.). The benthic calcareous assemblage is dominated by C. reniforme (relative abundance on average 14 %), followed by S. horvathi (12 %), E. clavatum (11 %) and C. neoteretis (9 %) as important accessory species.
4.4.4 Ecozone II (310–245 cm; ca. 8.2–6.2 ka)
In this ecozone, we recognize a distinctive decrease in planktic and benthic calcareous foraminiferal concentrations, and as a consequence, a higher benthic agglutinated calcareous species ratio. The relative abundance of C. neoteretis promptly increases, and it becomes the dominating species of the benthic calcareous fauna in this interval (highest relative abundance 27 %, on average 13 %), followed by C. reniforme (10 %). Pullenia bulloides suddenly appears in the record, becoming an important accessory species, and at the same time the relative abundance of S. horvathi drastically decreases and remains around 1 % during the whole period. Even though the relative abundances of E. clavatum decrease compared to the previous interval, this species shows its highest relative abundance throughout the core in this ecozone at 255 cm (17 %; ca. 6.5 ka).The relative abundance of agglutinated species Adercotryma glomerata increases from 310 cm on and remains on the same level throughout this zone.
4.4.5 Ecozone III (245–165 cm; ca. 6.2–4.2 ka)
The concentrations of planktic and benthic calcareous foraminifera continue to decrease in this ecozone. From 245 cm, the relative abundance of C. neoteretis drops back to an average of 7 %, while the relative abundance of S. horvathi rises (from 1 % to 7 %). Although it is still only found in low numbers, Epistominella arctica also increases (from 0.4 % (previous interval) to 0.8 %), just like Textularia torquata, while the relative abundances of A. glomerata decreases.
4.4.6 Ecozone IV (165–125 cm; ca. 4.2–3.2 ka)
The base of this ecozone is defined by the drastic decrease in benthic calcareous foraminiferal concentrations (from 15.7 to 8.4 ind. g−1 sed.), and increased relative abundances of E. arctica and Stainforthia feylingi. C. neoteretis drops dramatically (to 3 %), just like C. reniforme, which reaches its lowest relative abundance in this zone (5 %). On the other hand, agglutinated species A. glomerata and Reophax fusiformis show a drastic peak at the beginning of this ecozone, and the relative abundances of T. torquata, Textularia cf. earlandi, and Spiroplectammina biformis start to increase as compared to the previous interval.
4.4.7 Ecozone V (125–0 cm; ca. 3.2–0.3 ka)
The concentrations of planktic foraminifera and the relative abundances of C. neoteretis further decrease and reach their lowest level throughout the core, while C. reniforme shows an increase compared to ecozone IV, just like S. feylingi. The relative abundances of agglutinated species T. torquata, T. cf. earlandi and S. biformis continue to increase, while Saccamina difflugiformis shows a steep rise unique to this interval.
4.5 Stable isotopes
From the 70 analysed samples, the results of three samples were not accepted: one of these (180 cm) was due to technical problems, and two samples gave too low signals due to small sample size (0 and 130 cm). The sample at 140 cm gave a comparatively very low δ18O (2.25 ‰) and a very high δ13C value (−1.07 ‰), but these outliers were nonetheless accepted.
Except for the one outlier, the variation of δ18O values is rather small throughout the core (between 2.85 ‰ and 3.69 ‰, with a mean of 3.29 ‰), and the values remain relatively constant, albeit with a slight increase towards the top of the core. The δ13C values show a constant increase from the bottom to the top of the core, varying between −1.07 ‰ and −2.61 ‰ (Fig. 7).
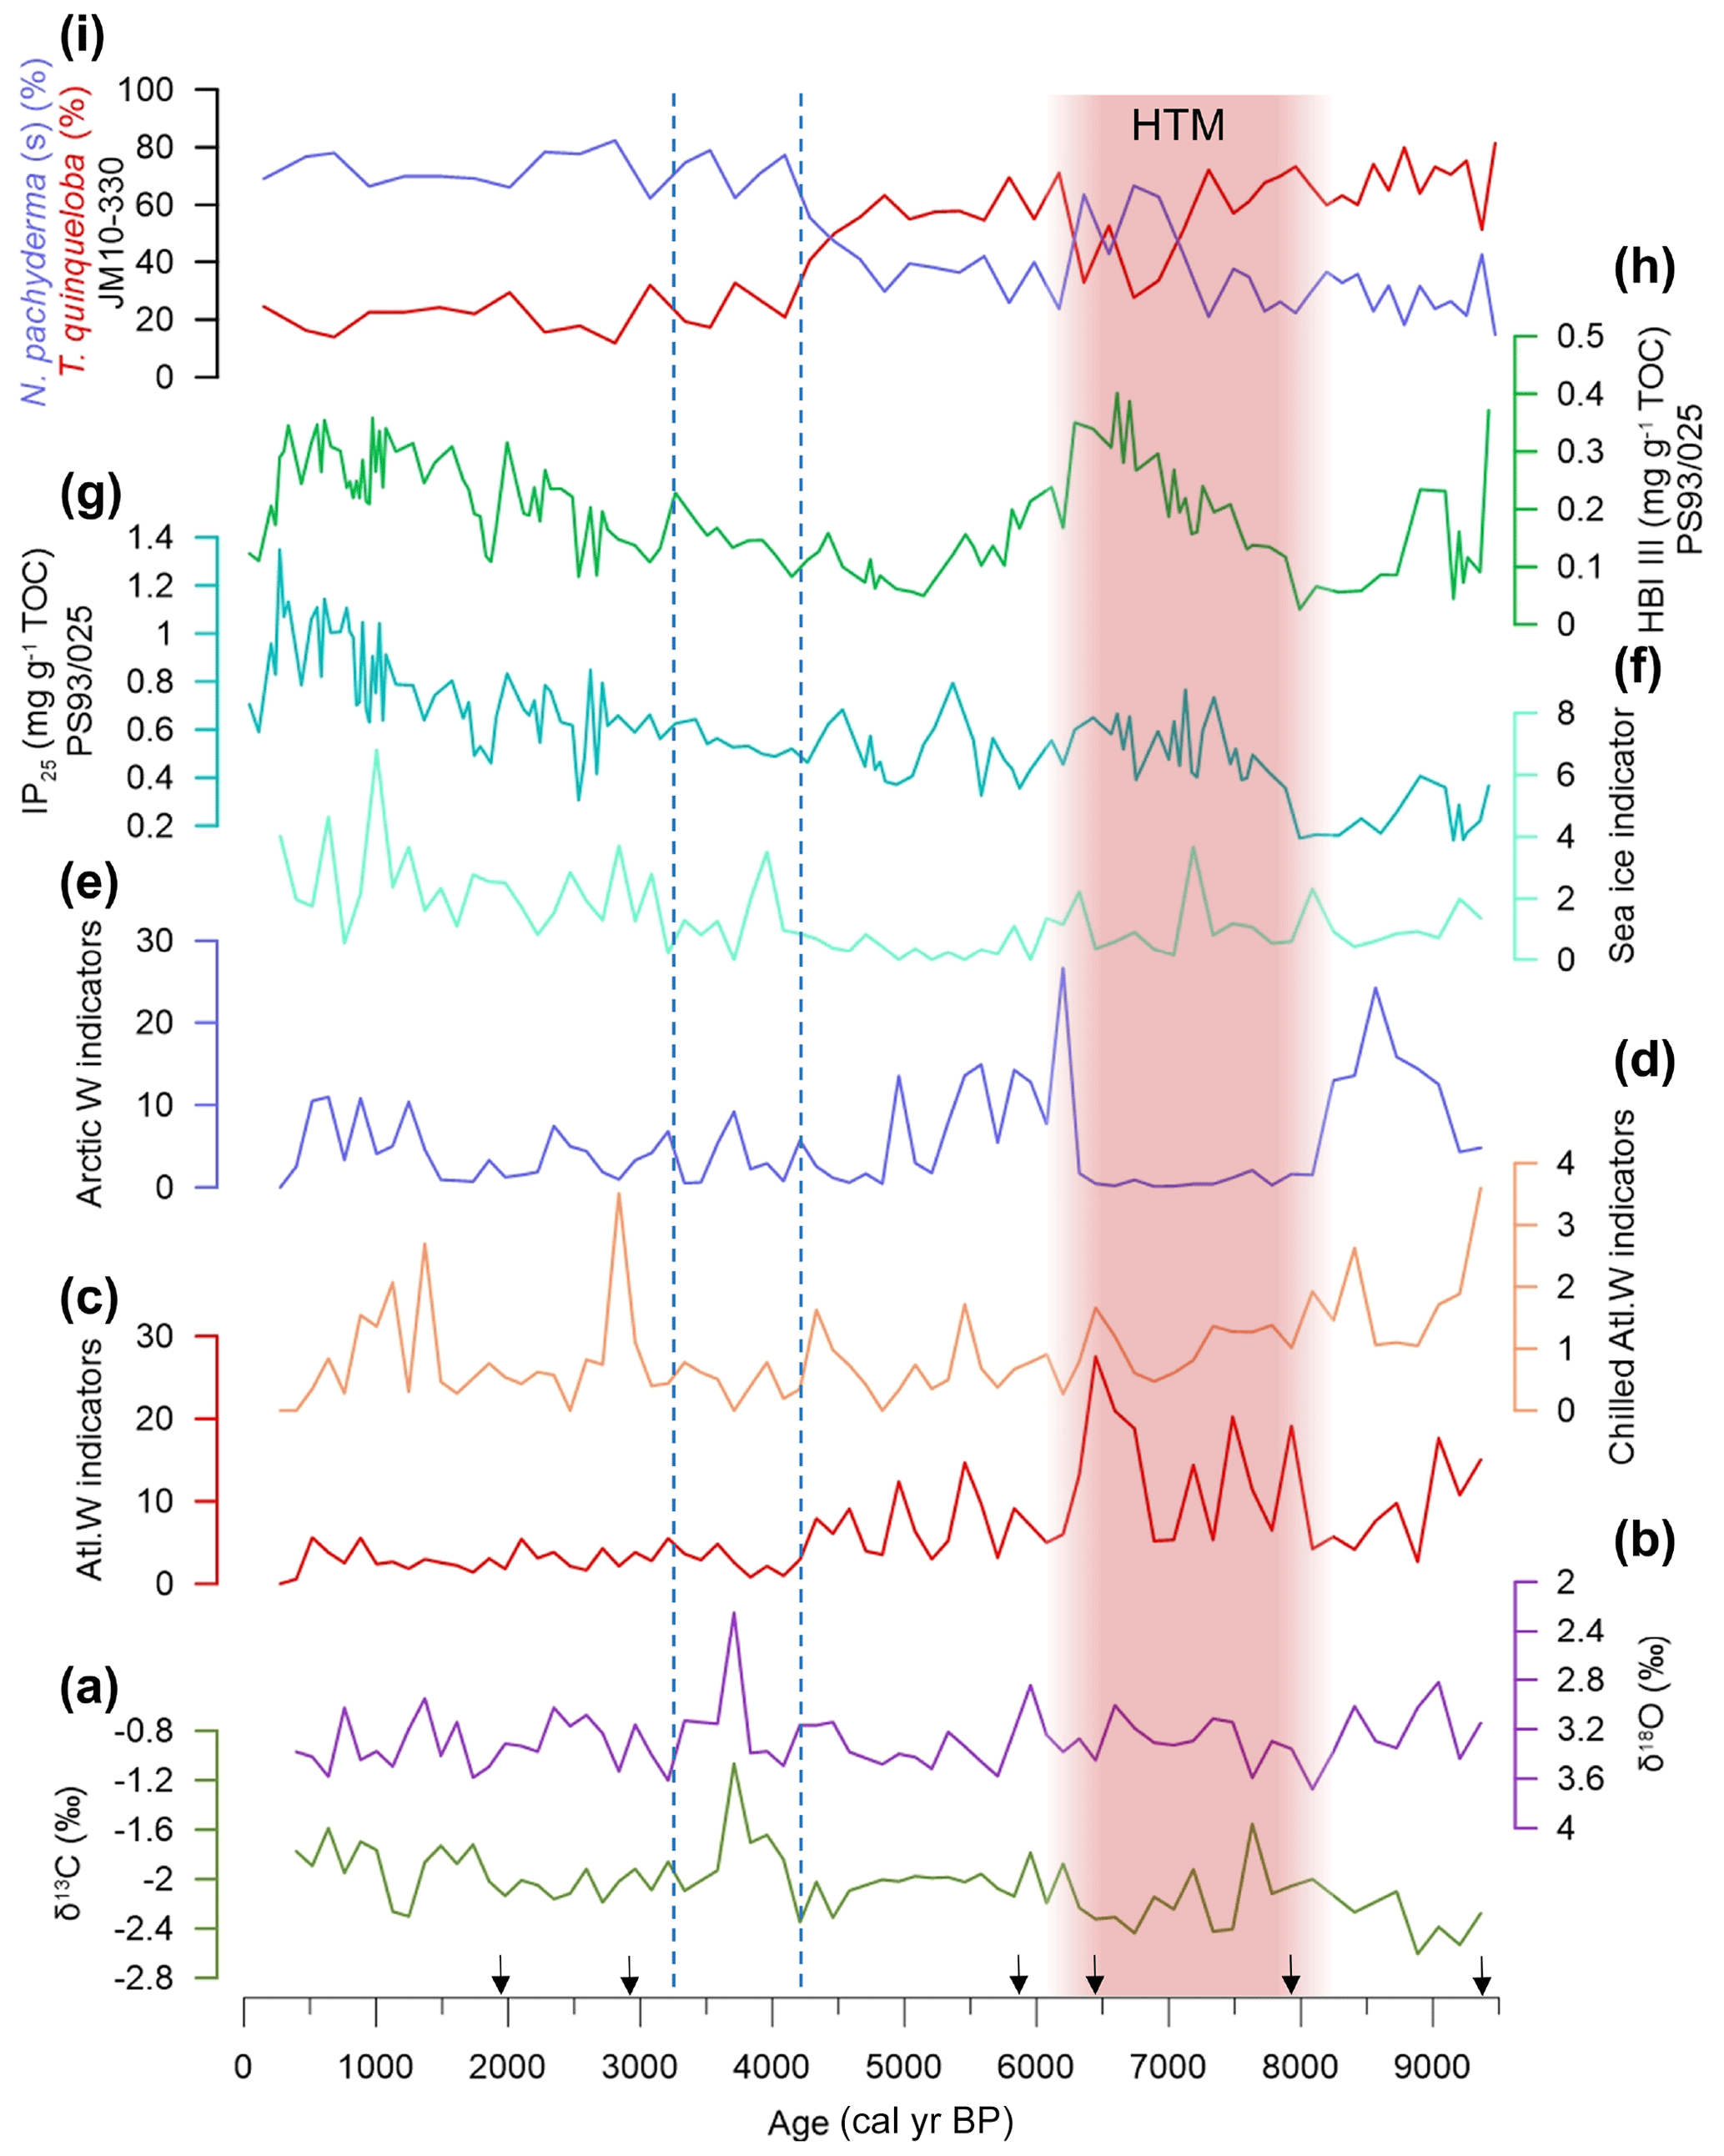
Figure 7From the bottom to the top: δ13C (a) and δ18O (b) results and relative abundances of the four calcareous benthic foraminifera groupings (c–f) (based on environmental preferences of the contained species; see Fig. 5 and Table A3; Atl. W stands for Atlantic Water; Arctic W stands for Arctic Water) from this study (core 73G), compared to other proxy records from the NE Greenland shelf and western Svalbard. IP25 (g) and HBI III (h) from core PS93/025 (Syring et al., 2020a). Relative abundances of planktic polar species Neogloboquadrina pachyderma (sin.) and subpolar species Turborotalita quinqueloba (i) from core JM10-330 (Consolaro et al., 2018). HTM stands for Holocene Thermal Maximum. Black arrows on the x axis mark radiocarbon dates.
5.1 Origin of Atlantic-sourced water at the core site
Although the study site is located on the central flow route of the EGC, the path of the influx of the Atlantic-sourced subsurface water, which is clearly identified as the bottom layer in the CTD profiles (Fig. 2), is less clear. The CTD profile with bottom-water temperatures below 1 ∘C and salinities of 34.8 suggest that the Atlantic-sourced subsurface water is closer in character to the water found in the Westwind Trough than that of the Atlantic-sourced water presently seen in the Norske Trough (see Budéus et al., 1997). This may indicate that cool Arctic Atlantic Water is the primary source of the Atlantic subsurface waters, rather than the warmer Return Atlantic Water (see Rudels et al., 2005; Schaffer et al., 2017). The Atlantic-sourced water may thus reach our study site via the Westwind Trough but may also be present due to wind-driven upwelling. This process leads to considerable modification of local water masses and shelf break exchanges (e.g. Estrade et al., 2008; Kirillov et al., 2016).
5.2 Environmental significance of foraminiferal assemblages
In order to be able to describe the changes in water masses over time on the NE Greenland shelf, we place selected benthic calcareous foraminiferal species into groups that are based on environmental preferences of the species (Table A3 in appendix). The Atlantic Water group includes C. neoteretis and P. bulloides. These species indicate warm and saline AW inflow underneath cold and low-salinity surface waters (e.g. Mackensen and Hald, 1988; Seidenkrantz, 1995; Rytter et al., 2002; Jennings et al., 2004, 2011; Cage et al., 2021). The chilled Atlantic Water group includes I. norcrossi and M. barleeanum. These species have been previously linked to cool AW (e.g. Slubowska-Woldengen et al., 2007; Perner et al., 2011, 2015; Cage et al., 2021), and we use them to represent the relative contribution of chilled AW recirculated in the Arctic Ocean to the EGC. The Arctic Water group, which designates species that are commonly found in connection to Polar Water, includes S. horvathi and E. arctica. Both species at present live beneath perennial to near-perennial sea ice, in the deeper part of the Arctic Ocean, and thus indicating cold, Arctic-originated deep waters (e.g. Green, 1960; Lagoe, 1979; Wollenburg and Mackensen, 1998; Jennings et al., 2020). Although S. horvathi is found beneath true perennial sea ice, E. arctica seems to thrive in high-productivity areas in open-water holes in the ice or at the sea-ice edge (Wollenburg and Mackensen, 1998; Jennings et al., 2020). Cassidulina reniforme is also an Arctic species, although it requires stable conditions (e.g. Hald and Korsun, 1997; Consolaro et al., 2018), and in some studies it has been considered linked to highly chilled Atlantic Water (Ślubowska et al., 2005; Hansen et al., 2020). S. feylingi is a true sea-ice edge indicator species that tolerates unstable conditions (Knudsen and Seidenkrantz, 1994; Seidenkrantz, 2013); its increase may refer to the location of a sea-ice margin at the study site. Co-occurrence of S. feylingi and E. arctica thus suggests the presence of a nearby sea-ice edge in an otherwise near-perennial sea-ice region. Moreover, we use in our interpretation the abundances of the agglutinated species A. glomerata, T. earlandi, T. torquata, S. biformis, and S. difflugiformis. A. glomerata is often correlated with Atlantic-sourced waters at high latitudes (e.g. Hald and Korsun, 1997; Lloyd, 2006; Perner et al., 2012). Many studies find T. earlandi, T. torquata, and S. biformis in areas influenced by cold, low-salinity Arctic water, often in glaciomarine environments (e.g. Jennings and Helgadottir, 1994; Korsun and Hald, 2000; Perner et al., 2012, 2015, Wangner et al., 2018). S. difflugiformis is described as being closely associated with Polar Water on the East Greenland shelf and in fjords (Jennings and Helgadottir, 1994).
5.3 Palaeoenvironmental interpretation
5.3.1 Bottom 65 cm of the sediment core
The combined presence of an assemblage of well-preserved small tests of Arctic foraminiferal species and many extinct Pliocene to Early Pleistocene specimens, today found in Plio–Pleistocene assemblages from Baffin Island and Peary Land (Feyling-Hanssen, 1976, 1980; Feyling-Hanssen et al., 1983; Funder et al., 2001), suggest that these Plio–Pleistocene foraminifera have been reworked from older deposits into a glaciomarine environment with in situ Arctic foraminifera. The closest known Plio–Pleistocene deposit is the Kap København Formation from Peary Land, northern Greenland (Funder et al., 2001; see Fig. 1b), but it is unknown if any such deposits may be found outcropping to the sea floor off NE Greenland. Reworking of older sediments during glacier ice retreat has previously been observed (e.g. Seidenkrantz et al., 2019). Therefore, we here suggest that the breakup and significant retreat of a nearby glacier caused reworking of older sediments, and thus the lowermost section of sediment from before 9.4 ka was deposited during a period of glacier retreat. However, further studies are required to resolve this issue.
5.3.2 Early Holocene (ca. 9.4–8.2 ka; ecozone I)
This interval was characterized by high percentages of S. horvathi, which has previously been considered linked to high sea-ice concentrations (e.g. Green, 1960; Lagoe, 1979; Wollenburg and Mackensen, 1988; Jennings et al., 2020) combined with the presence of Atlantic Water indicator species such as C. neoteretis, I. norcrossi, and M. barleeanum. This combination of Atlantic-sourced bottom water and sea ice suggest a highly stratified water column in the Early Holocene (Fig. 5). Cold, heavily sea-ice-loaded surface waters entrained in PW of the upper EGC characterized the upper water column, while at the same time the influx of warm Atlantic-sourced water from either the RAC or the AAW (or a combination of both) was also strong. When compared to the data from the top of the core, the water column stratification between the cold and warmer waters was likely more pronounced than today. Relatively high counts of the terrestrially derived elements Si, K, and Ti (Ren et al., 2009), together with relatively low δ18O values, may indicate increased meltwater influence from the Greenland Ice Sheet (Figs. 3 and 7) that may have reached the bottom through meltwater plumes. Alternatively, the low δ18O values seen here may be a consequence of the warmer bottom waters.
The interval was also likely characterized by high surface-water productivity, as shown by high concentrations of planktic and benthic calcareous foraminifera and the presence of E. arctica, which thrives in high-productivity environments (Wollenburg and Kuhnt, 2000). It is also supported by a pronounced peak in ratio, which is considered a general proxy for palaeo-productivity (e.g. Vare et al., 2009), and low and slowly rising benthic δ13C values that can also be related to high level of bioproductivity, due to decomposition of isotopically light organic carbon in the lower part of the water column. High surface-water productivity may sound contradictory to extensive sea-ice cover; however, the planktic foraminifera may have been transported to the site in the subsurface-water layer from a nearby more open-ocean site, suggesting increased surface-water bioproductivity in the general region. We propose that high productivity combined with sea ice indicates that our site was located west of the Polar Front but also that the Polar Front was situated in close proximity to our location in this time interval, which would have facilitated this high productivity. It should be noted that in the XRF data we recognize a short-lived but clear peak in terrestrially derived sediments around 8.5–8.4 ka (Fig. 3). This may be potentially linked to increased iceberg release during the so-called 8.2 ka event (i.a., Alley et al., 1997; Barber et al., 1999); however, this signal seems to be only reflected in the results of the sedimentological analyses. It is not recognizable in the foraminiferal assemblage changes or stable isotope results, although the lower temporal resolution of the latter may have prevented us from identifying any changes.
Our suggestions of cold water and sea ice at the surface combined with Atlantic-sourced bottom waters is in accordance with recent reconstructions from the NE Greenland shelf (Syring et al., 2020a; Zehnich et al., 2020; core PS93/025). The study of Syring et al. (2020a) reveals a cold interval with increased sea-ice cover between 9.3 and 7.9 ka, shown by lower concentrations of marginal sea-ice proxy HBI III and IP25, interpreted as low sea-ice algal productivity caused by an expansion of the sea-ice cover (Fig. 7). The stable isotope results of Zehnich et al. (2020) point to a relatively thick subsurface Atlantic water mass. Foraminiferal records from the Southeast Greenland shelf (Jennings et al., 2011; cores MD99-2322 and MD992317) suggests cold and unstable sea-surface conditions between 9.4 and 8.1 ka. Moreover, cool deep-water conditions in the eastern Fram Strait during this period (Consolaro et al., 2018; core JM10-330) point to a weakened RAC, suggesting that the strong water column stratification on the NE Greenland shelf was due to increased AAW influx.
The cold, heavily sea-ice-loaded surface waters and strongly stratified water column that characterized our study site on the NE Greenland shelf between 9.4 and 8.2 ka can be explained as a consequence of the extensive melting of the Greenland Ice Sheet. Early Holocene warming of the circum-Arctic region (Kaufmann et al., 2004) led to enhanced Greenland Ice Sheet and glacier melting around the Arctic (e.g. Solomina et al., 2015). During the Last Glacial Maximum (∼ 26–19 ka) the Greenland Ice Sheet extended onto the shelf offshore NE Greenland, perhaps even reaching the shelf break (Bennike and Weidick, 2001; Arndt et al., 2017). However, as a consequence of rising air temperatures due to the orbitally forced Northern Hemisphere summer insolation maximum (reported at approximately 10 ka; Andersen et al., 2004; Jansen et al., 2008), the deglaciation of the outer coast and retreat of the ice margin to its present location occurred already between 11.7 and 9.3 ka (Larsen et al., 2018); the ice shelf of 79NG rapidly retreated through the fjord between 9.6 and 7.5 ka (Syring et al., 2020b). The drastic ice recession of the Early Holocene produced an extended meltwater surface layer in the Greenland region prior to 8.6 ka (Seidenkrantz et al., 2013). The extensive melting of the Greenland Ice Sheet was strong enough to act as negative feedback to the Early Holocene warming and delayed the HTM by 2 kyr at our location compared to the eastern parts of the Nordic Seas (Blaschek and Renssen, 2013).
The strong freshwater discharge might have also weakened the recording of the 8.2 ka cooling event at our location, although a short-term increase in terrestrial deposits suggests transport of sediments from land via meltwater or icebergs during this event. This 8.2 ka cold event has been described in a number of palaeoceanographic archives from Greenland and the northern North Atlantic (e.g. Risebrobakken et al., 2003; Ellison et al., 2006; Rasmussen et al., 2007), and it is believed to be connected to the collapse of the Laurentide Ice Sheet and drainage of Lake Agassiz (e.g. Alley et al., 1997; Barber et al., 1999; Hillaire-Marcel et al., 2007; Hoffman et al., 2012). However, in many other records from areas that are mainly influenced by the EGC, WGC, or the Baffin Current–Labrador Current system (Keigwin et al., 2005; Sachs, 2007; Seidenkrantz et al., 2013), the 8.2 ka cooling event cannot be recognized; these sites were all characterized by the permanent presence of a low-salinity, cold surface layer at that time, which may also explain the weak signal of this event at our site.
5.3.3 Holocene Thermal Maximum (ca. 8.2–6.2 ka; ecozone II)
The interval from 8.2 to 6.2 ka was characterized by the warmest bottom-water conditions of the Holocene on the NE Greenland shelf, as well as reduced sea-ice cover, as indicated by the almost complete absence of sea-ice indicator species and maximum abundances of Atlantic Water species and other species indicating stable bottom waters. Cassidulina neoteretis and A. glomerata had their highest relative abundances during this interval (except for an extreme peak of A. glomerata at ∼ 4 ka), and P. bulloides appeared around 8 ka in the record after a long absence (Figs. 5 and 6), suggesting highly stable bottom waters (Rytter et al., 2002). A concurrent significant decrease in planktic and benthic calcareous foraminiferal concentrations indicates a transition towards lower surface and subsurface-water productivity, also shown in decreasing element ratios. We suggest that this may be explained by a strengthening of the RAC, transporting RAW to our site and causing higher-than-present entrainment of warm Atlantic-sourced water into the EGC. This is supported by several studies from the Fram Strait (Slubowska-Woldengen et al., 2007; core JM02-440; Werner et al., 2013; core MSM5/5-712; Werner et al., 2016; core MSM5/5-723; Consolaro et al., 2018; core JM10-330; see Fig. 1) that recorded strong AW flow and warm sea-surface conditions until 7–6.8 ka (Fig. 7). This strengthening would have also resulted in a stronger RAC. Moreover, in line with our findings, Müller et al. (2012) (core PS2641-4) and Jennings et al. (2011) (cores MD99-2322 and MD99-2317) reconstructed relatively warm conditions during the first part of the mid-Holocene on the middle East Greenland and Southeast Greenland shelves in surface and subsurface waters, respectively. In addition, further south in the Nordic Seas thermal-optimum-like conditions with warm sea surface temperatures prevailed until ca. 6 ka (Bauch et al., 2001; core PS1243).
The warmer sea-surface waters (as described in Müller at al., 2012, and Jennings et al., 2011), combined with the fact that our data indicate loss of sea ice and strengthened influx of Atlantic-sourced waters in the study area, suggest that the Polar Front moved from our location to further north or further inland during this period. This time interval, which represents the warmest of our record, we here refer to as the Holocene Thermal Maximum (HTM).
Due to the warming during the HTM, the floating ice margin of 79NG decreased (Bennike and Weidick, 2001), but on the other hand, the fresh, less dense basal meltwater of the glacier isolated the landfast sea-ice cover from the warm subsurface waters, and thus stabilized the Norske Øer Ice Barrier (Mayer et al., 2000; Syring et al., 2020b). Parallel to the warming of the EGC (Jennings et al., 2011; Müller et al., 2012), the strengthening of the RAC seen at our site could be potentially linked to the strengthened northern flow of AW, as recorded further south in the Norwegian Sea (Giraudeau et al., 2010) and on the western shelf of Svalbard (Slubowska-Woldengen et al., 2007).
5.3.4 Cooling after the HTM (ca. 6.2–4.2 ka; ecozone III)
Between 6.2–4.2 ka benthic foraminiferal assemblages again start to resemble those of the period prior to 8.2 ka, with an increased percentage of S. horvathi and a decrease in the Atlantic water indicator C. neoteretis (Fig. 5). This suggests a return to a more stratified water column with sea-ice-loaded surface water and Atlantic-sourced subsurface waters. However, in contrast to Ecozone I, neither the benthic and planktic foraminiferal concentrations nor stable isotope data suggest increased bioproductivity.
In line with the cooling of the bottom waters inferred from our data, the inflow of subsurface AW along West Spitsbergen, and thus the RAC, weakened after 7 ka (Consolaro et al., 2018; core JM10-330), and a gradual cooling of surface waters started around 7–6.6 ka (Müller et al., 2012; core MSM5/5-712), accompanied by increased sea-ice cover (Slubowska-Woldengen et al., 2007; core JM02-440). Similar to our record, a sediment core retrieved north of our location (Zehnich et al., 2020; Syring et al., 2020a; core PS93/025) shows stronger vertical stratification after 7.2 ka (derived from benthic–planktic δ18O difference). After 5.5 ka this site experienced seasonally more extended sea-ice cover (derived from decreasing HBI III and increasing IP25 concentrations; Fig. 7) and decreasing primary production (Zehnich et al., 2020; Syring et al., 2020a). Accordingly, at the same time, Perner et al. (2015) (core PS641-4) recorded the southward relocation of Polar Front to close to their site in the middle part of the East Greenland shelf. Giraudeau et al. (2004) (core MD99-2269) and Ran et al. (2006) (core MD99-2275) recorded increased influence of cool, low-salinity polar waters of the EGC on the North Iceland Shelf between 6.5–3.5 and 6.8–5.6 ka, respectively. In the Iceland Basin a long-term cooling trend started between 6.8 and 6.1 ka (Orme et al., 2018; Van Nieuwenhove et al., 2018; core DA12-11/2).
The cooling after the HTM started on the NE Greenland shelf with decreased but still persistent inflow of subsurface AW via the RAC. The EGC became stronger, with sea-ice-loaded surface waters and still relatively warm Atlantic-sourced subsurface waters (e.g. this study; Andrews et al., 1997; Jennings et al., 2002; Zehnich et al., 2020). Coincident with the expansion of the EGC, several studies from the Nordic Seas (e.g. Bauch et al., 2001; Hall et al., 2004; Hald et al., 2007) infer a weakening of the AMOC, increased water column stratification, and less ventilated subsurface during this period. In line with a decreased flux of recirculating AW onto the NE Greenland shelf, the Northeast Greenland Ice Margin started to advance from its Mid Holocene minimum around 6 ka (Larsen et al., 2018). Reduced amounts of warm AW on the inner continental shelf most probably reduced the basal melting within the 79NG fjord and may have contributed to the re-advance of the ice shelf of 79NG seen from around 4.5 ka on (Bennike and Weidick, 2001; Syring et al., 2020b).
5.3.5 Further cooling at the onset of the Late Holocene (ca. 4.2–3.2 ka; ecozone IV)
Our record shows clear evidence of significant changes occurring at 4.2 ka. The period starts at our location with a sudden rise in the relative abundances of the calcareous sea-ice indicator species S. feylingi and in the relative abundances of the agglutinated species T. earlandi, T. torquata, and S. biformis (Figs. 5 and 6), which are often connected to cold, low-salinity Polar Water (Jennings and Helgadottir, 1994; Korsun and Hald, 2000; Perner et al., 2012, 2015; Wangner et al., 2018). Furthermore, the interval is marked by lowest abundances of warm Atlantic Water species and very low concentrations (<1 ind. g−1) of planktic foraminifera. The benthic agglutinated calcareous foraminiferal ratio increases and the terrestrially derived elements Si, K, and Ti (Ren et al., 2009) show minimal values (Fig. 3), indicating very low meltwater influence in the EGC. Since the foraminiferal assemblage points to low bottom-water temperatures, we interpret the slightly higher benthic δ18O values and increasing δ13C values after 4.2 ka (Fig. 7) as indicative of general cooling and weak influence of AW. Accordingly, the light δ18O spike found in the middle of this interval cannot be attributed to sudden bottom-water warming on the basis of the foraminiferal fauna. It is more readily explained by local brine rejection during sea ice formation, which can carry the light isotopic signal from the surface to the ocean bottom (e.g. Mackensen and Schmiedl, 2016). It should here be noted that apart from a single sample with increased relative frequencies of the warmer-water agglutinated species A. glomerata (Figs. 6 and A3), there is no evidence of a shorter-lived climate excursion that might be linked to the so-called 4.2 ka event (Weiss, 2017), only a general change in environment at this time.
We suggest that increased PW at the surface of the EGC and reduction of warmer waters from the RAC at subsurface levels led to freshening and reduced stratification of the water column at our site; it may also have experienced (near) perennial sea-ice cover. The reduced strength of the RAC was likely caused by an overall decrease in AW transport of the North Atlantic and West Spitsbergen currents to the eastern Fram Strait, accompanied by surface-water cooling and increased sea-ice coverage after 5.5 ka (Hald et al., 2007; core MSM5/5-712; Werner et al., 2013; core PS1878; Telesinski et al., 2014b; core PS1878; Consolaro et al., 2018; core JM10-330; Fig. 7). The δ18O results of Zehnich et al. (2020; core PS93/025) point to colder conditions and weak AW advection after 5 ka north from our location. Harsh conditions and strengthened EGC with permanent sea-ice cover dominated the central Greenland shelf as well (Perner et al., 2015; Kolling et al., 2017; core PS641-4). Further south on the shelf, Jennings et al. (2002) and Perner et al. (2016) (core JM96-1206) described increased PW influence in the EGC, glacier advance, and iceberg rafting during this period.
5.3.6 Neoglaciation (ca. 3.2–0.3 ka; ecozone V)
The period from ca. 3.2 to 0.3 ka is characterized by a further increase in the relative abundances of sea-ice edge indicator species S. feylingi and the agglutinated species S. difflugiformis. Atlantic Water indicator C. neoteretis is only found in relatively low numbers, although there is some increase in species linked to chilled Atlantic Water (Figs. 5, 6 and 7). Continuously increasing benthic δ13C values indicate strong ventilation of the water column (Fig. 7). The results point to cold and unstable conditions with minimum surface-water productivity and increasing sea-ice cover at our location. During this period, the EGC was likely strengthened compared to previous times, with a thick layer of cold and fresh PW on the surface and recirculated AAW inflow from the Arctic at subsurface levels, as seen in the chilled Atlantic Water group.
Previous studies have indicated that during the late Holocene, the West Spitsbergen Current transported less and less heat (Slubowska-Woldengen et al., 2007; core JM02-440), causing less warm water to reach the EGC through the RAC. From West Spitsbergen (Müller et al., 2012; core MSM5/5-712; Consolaro et al., 2018; core JM10-330) and from several other locations in the Greenland Sea (e.g. Telesinski et al., 2014b, core PS1878) and western Greenland (e.g. Seidenkrantz et al., 2007; core 248260; Seidenkrantz et al., 2008; cores DA00-02P and DA00-03P), a general cooling trend has been reported, with more severe sea-ice conditions. On the Iceland shelf strongly reduced Irminger surface water and low coccolith carbonate sedimentation indicate extreme advection of polar waters and extended sea-ice development (Giraudeau et al., 2004; core MD99-2269).
The Neoglacial cold interval on the East Greenland shelf started with increased freshwater forcing from the Arctic Ocean (e.g. this study; Perner et al., 2015) and advance of the Greenland Ice Sheet (Andersen et al., 2004). According to model simulations of Renssen et al. (2006), the expansion of sea ice may be associated with a cooling triggered by a negative solar irradiance anomaly, which was amplified through a positive oceanic feedback mechanism. The cooling caused temporary relocation of deep-water formation sites in the Nordic Seas, which was accompanied by a distinct reduction in AMOC strength (Hall et al., 2004). The increase in sea-ice extent stratified the water column and hampered the deep-water formation, leading to additional cooling and more sea ice (Renssen et al., 2006).
5.4 Variations of Atlantic Water and Polar Water entrainment in the EGC during the Holocene and their implications for the general climatic trends in the Nordic Seas
Distinct variability in subsurface water mass properties that we see on the NE Greenland shelf through the Holocene point to broadscale changes in the proportion of RAW/AAW and PW in the EGC and thus to a strong covariance with the northward heat transport in the Nordic Seas (e.g. Moros et al., 2012). The increased entrainment of warm Atlantic-sourced water into the EGC that we document during the HTM (ca. 8.2–6.2 ka at our study site), coincides with increased advection of warm AW in the West Spitsbergen Current driven by increased wind force and/or stronger thermohaline circulation (Sarthein et al., 2003; Slubowska-Woldengen et al., 2007; Knudsen et al., 2011; Werner et al., 2013, 2016; Consolaro et al., 2018).
During the mid-Holocene (8.2–4.2 ka; Walker et al., 2018), the summer insolation declined at the northern latitudes due to the changes in the Earth's orbital parameter (Berger, 1978). From 7 ka, the summer sea surface temperatures of the Nordic Seas started to decrease (Koç et al., 1993; Andersen et al., 2004). This cooled AW progressed northward carrying less and less heat to the North Atlantic Current and West Spitsbergen Current (Sarthein et al., 2003; Slubowska-Woldengen et al., 2007; Risebrobakken et al., 2011; Consolaro et al., 2018; Hald et al., 2007); this was also due to a weakened AMOC (e.g. Bauch et al., 2001; Hall et al., 2004; Hald et al., 2007; Knudsen et al., 2011). We suggest that, in response to the reduced warm water transport through the RAC, the proportion of cooled AAW and PW in the EGC increased, which ended the ameliorated conditions on the East Greenland shelf seen at our study site.
The northward flow of AW with the North Atlantic Current and West Spitsbergen Current to the eastern Fram Strait arrived to a minimum during the late Holocene, after 4.5 ka (Slubowska-Woldengen et al., 2007). Assuming that the fraction of AW entering the Arctic Ocean and the RAC stayed constant, the RAW reaching the EGC would also have weakened. Consequently, the EGC became stronger, carrying a thick layer of fresh PW southward, as also seen after ca. 4.2 ka (and even more so after 3.2 ka) in DA17-NG-ST07-73G. A similar pronounced colder period after 4 ka is recognized in some (but not all) reconstructions north and south of Iceland, in the Greenland Sea, and to the west of Svalbard (Moossen et al., 2015; Orme et al., 2018; Telesinski et al., 2014b; Werner et al., 2016; respectively), particularly at locations influenced by the EGC. During intervals of a negative NAO/AO high pressure over Greenland and consequently stronger northerly winds over East Greenland can lead to strengthened outflow of PW from the Arctic Ocean through the Fram Strait (e.g. Hurrell et al., 2003). This PW will be carried southward by the EGC (e.g. Ionita et al., 2016). We therefore associate the gradual cooling trend seen in our record as well as at other North Atlantic sites with a continuous transition from a more prevailing positive NAO/AO phase towards a period of more negative NAO/AO (e.g. Andersen et al., 2004; Orme et al., 2018). The Late Holocene trend towards a stronger and fresher EGC is likely to have increasingly impacted the Subpolar Gyre dynamics (e.g. Born and Stocker, 2014). Increased freshwater input to the Labrador Sea may have weakened the Subpolar Gyre circulation by preventing deep convection (Hillaire-Marcel et al., 2001) and consequently reduced the amount of water entrained into the North Atlantic Current (Moros et al., 2012). This, on the other hand, may have forced enhanced northward heat transport via the North Atlantic Current and may have helped to restart (Thornalley et al., 2009) the previously weakened AMOC (e.g. Cronin et al., 2003; Oppo et al., 2003).
The presented multiproxy study, based on benthic foraminiferal assemblage, geochemical, and sedimentological analyses of sediment core DA17-NG-ST07-73G allowed us to reconstruct changes in sea surface productivity, subsurface-water temperatures, sea-ice conditions, Greenland Ice Sheet melting, and the strength of the EGC over the last ca. 9.4 ka on the NE Greenland shelf.
Between 9.4 and 8.2 ka the water column was highly stratified with cold heavily sea-ice-loaded surface waters and a strong influx of warm waters in the subsurface. High surface-water productivity suggests that the Polar Front was close to our location.
A short-lived peak in terrestrially derived elements suggesting transport of sediments from land via meltwater or icebergs may be linked to the so-called 8.2 ka event.
The interval from 8.2 to 6.2 ka was characterized by the warmest bottom-water conditions of the Holocene on the NE Greenland shelf, with low surface-water productivity and strong Atlantic Water (AW) influence from a persistent influx of RAW (from the RAC) to a generally weakened EGC.
After the HTM, the water column started to again resemble that of the period prior to 8.2 ka. The EGC became stronger, with sea-ice-loaded surface waters and relatively warm Atlantic-sourced subsurface waters. The subsurface inflow of warm AW from the RAC decreased, but remained persistent.
After 4.2 ka increased Polar Water (PW) at the surface of the EGC and reduction of the RAW at subsurface levels led to freshening and reduced stratification of the water column and to a (near) perennial sea-ice cover.
The period from ca. 3.2 until 0.3 ka is characterized by cold and unstable conditions, with minimum surface-water productivity and possibly sea-ice cover at our location. During this period, the EGC was likely strengthened, with a thick layer of cold and fresh PW on the surface and strong recirculated AAW inflow from the Arctic at subsurface levels.
The proportion of PW and AW in the EGC shows a strong covariance with the northward heat transport to the northern North Atlantic. Thus, the cooling trend that characterizes the Holocene after the HTM led to strengthened EGC and increased PW transport, probably due to transition to a more negative NAO/AO scenario, causing more PW to exit the Arctic Ocean via the Fram Strait. This stronger and fresher EGC in the Late Holocene likely impacted the Subpolar Gyre circulation and helped strengthen the AMOC.
Table A1Comparison of radiocarbon dates calibrated with the Marine20 (Heaton et al., 2020) and the Marine13 (Reimer et al., 2013) calibration curve in core DA17-NG-ST07-73G. For the dates calibrated with the Marine20 we used a local marine reservoir age correction (ΔR) of 0 ± 50 years; for the dates calibrated with the Marine13 we used a ΔR of 150 ± 50 years, as this is the approximate offset between the two curves (Heaton et al., 2020).
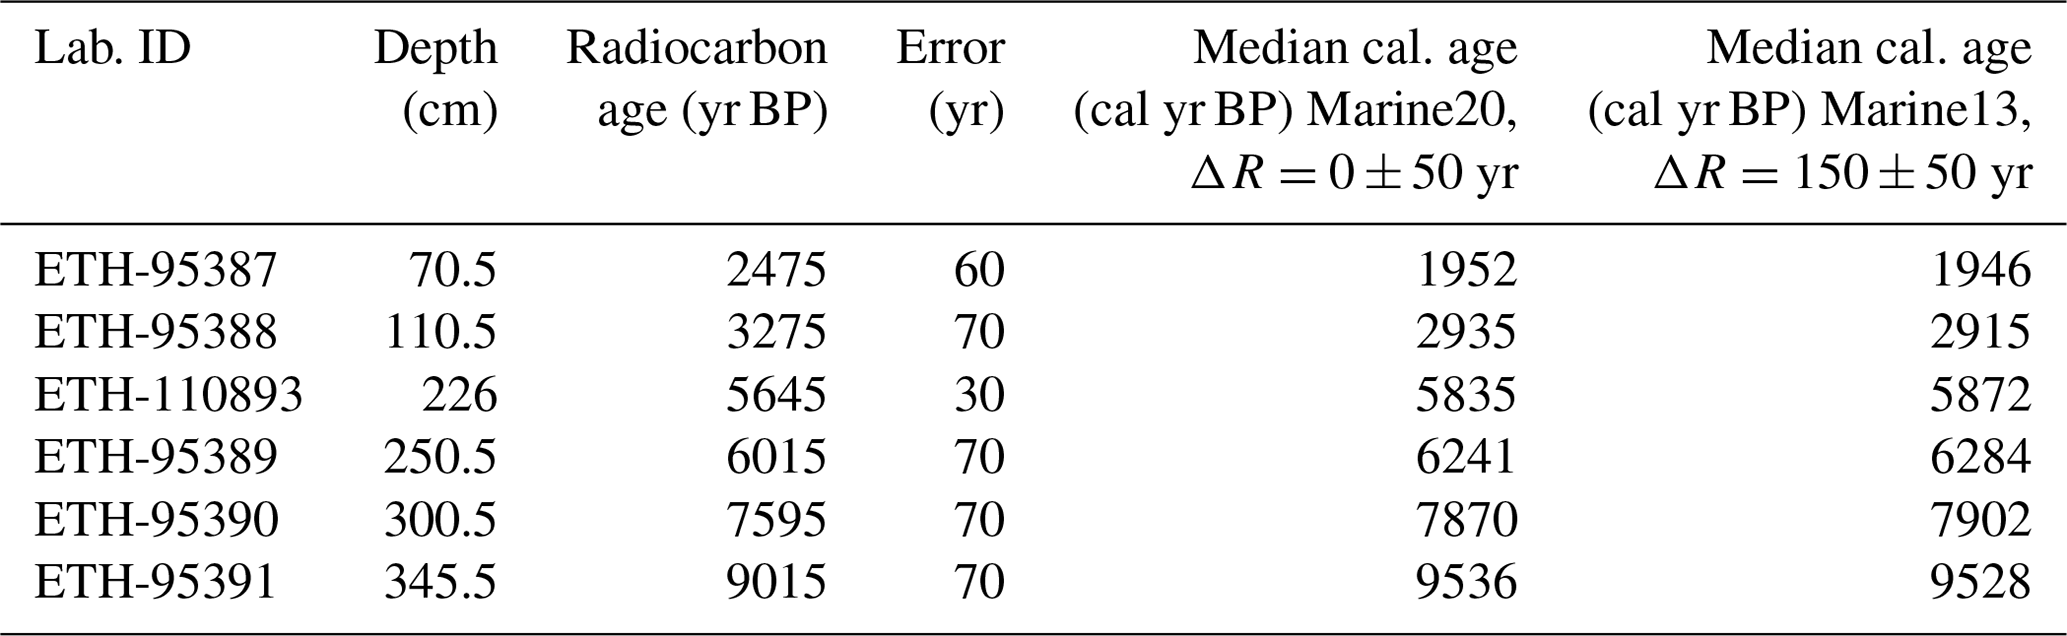
Table A2Foraminiferal taxa identified in this study (core depth 345–0 cm), with their original reference. Benthic calcareous, agglutinated, and planktic species are separated and listed alphabetically.
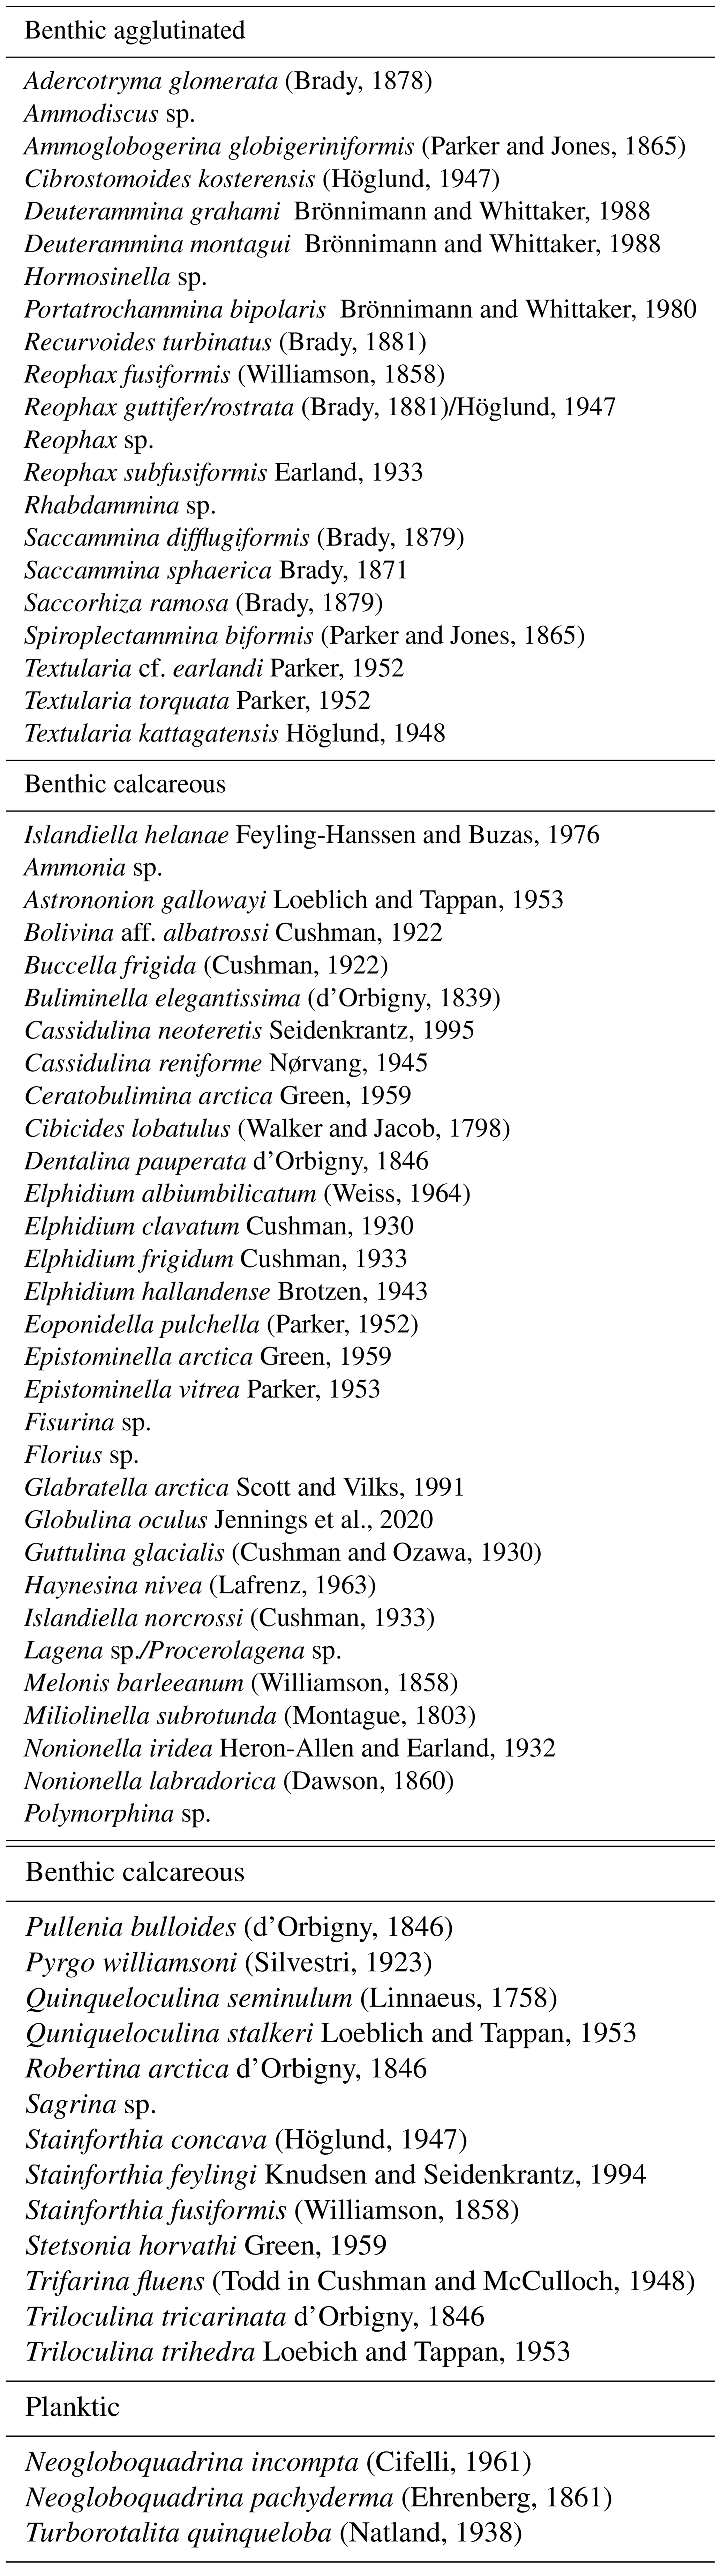
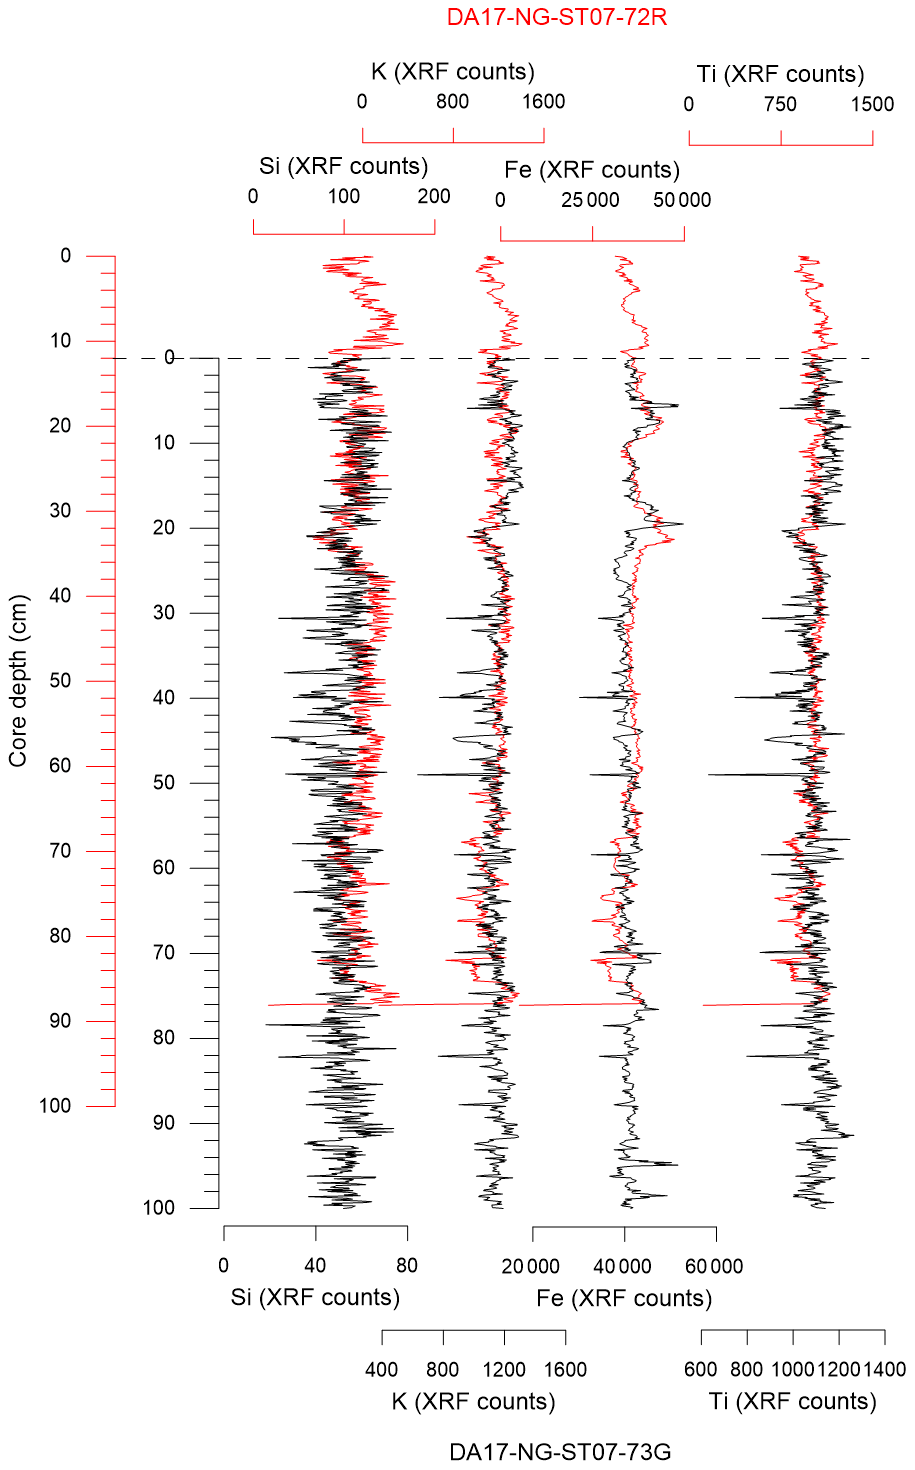
Figure A1Comparison of XRF data from gravity core DA17-NG-ST07-73G (black) and Rumohr core DA17-NG-ST07-72R (red).
Table A3List of benthic foraminiferal key species used for palaeoenvironmental reconstruction.

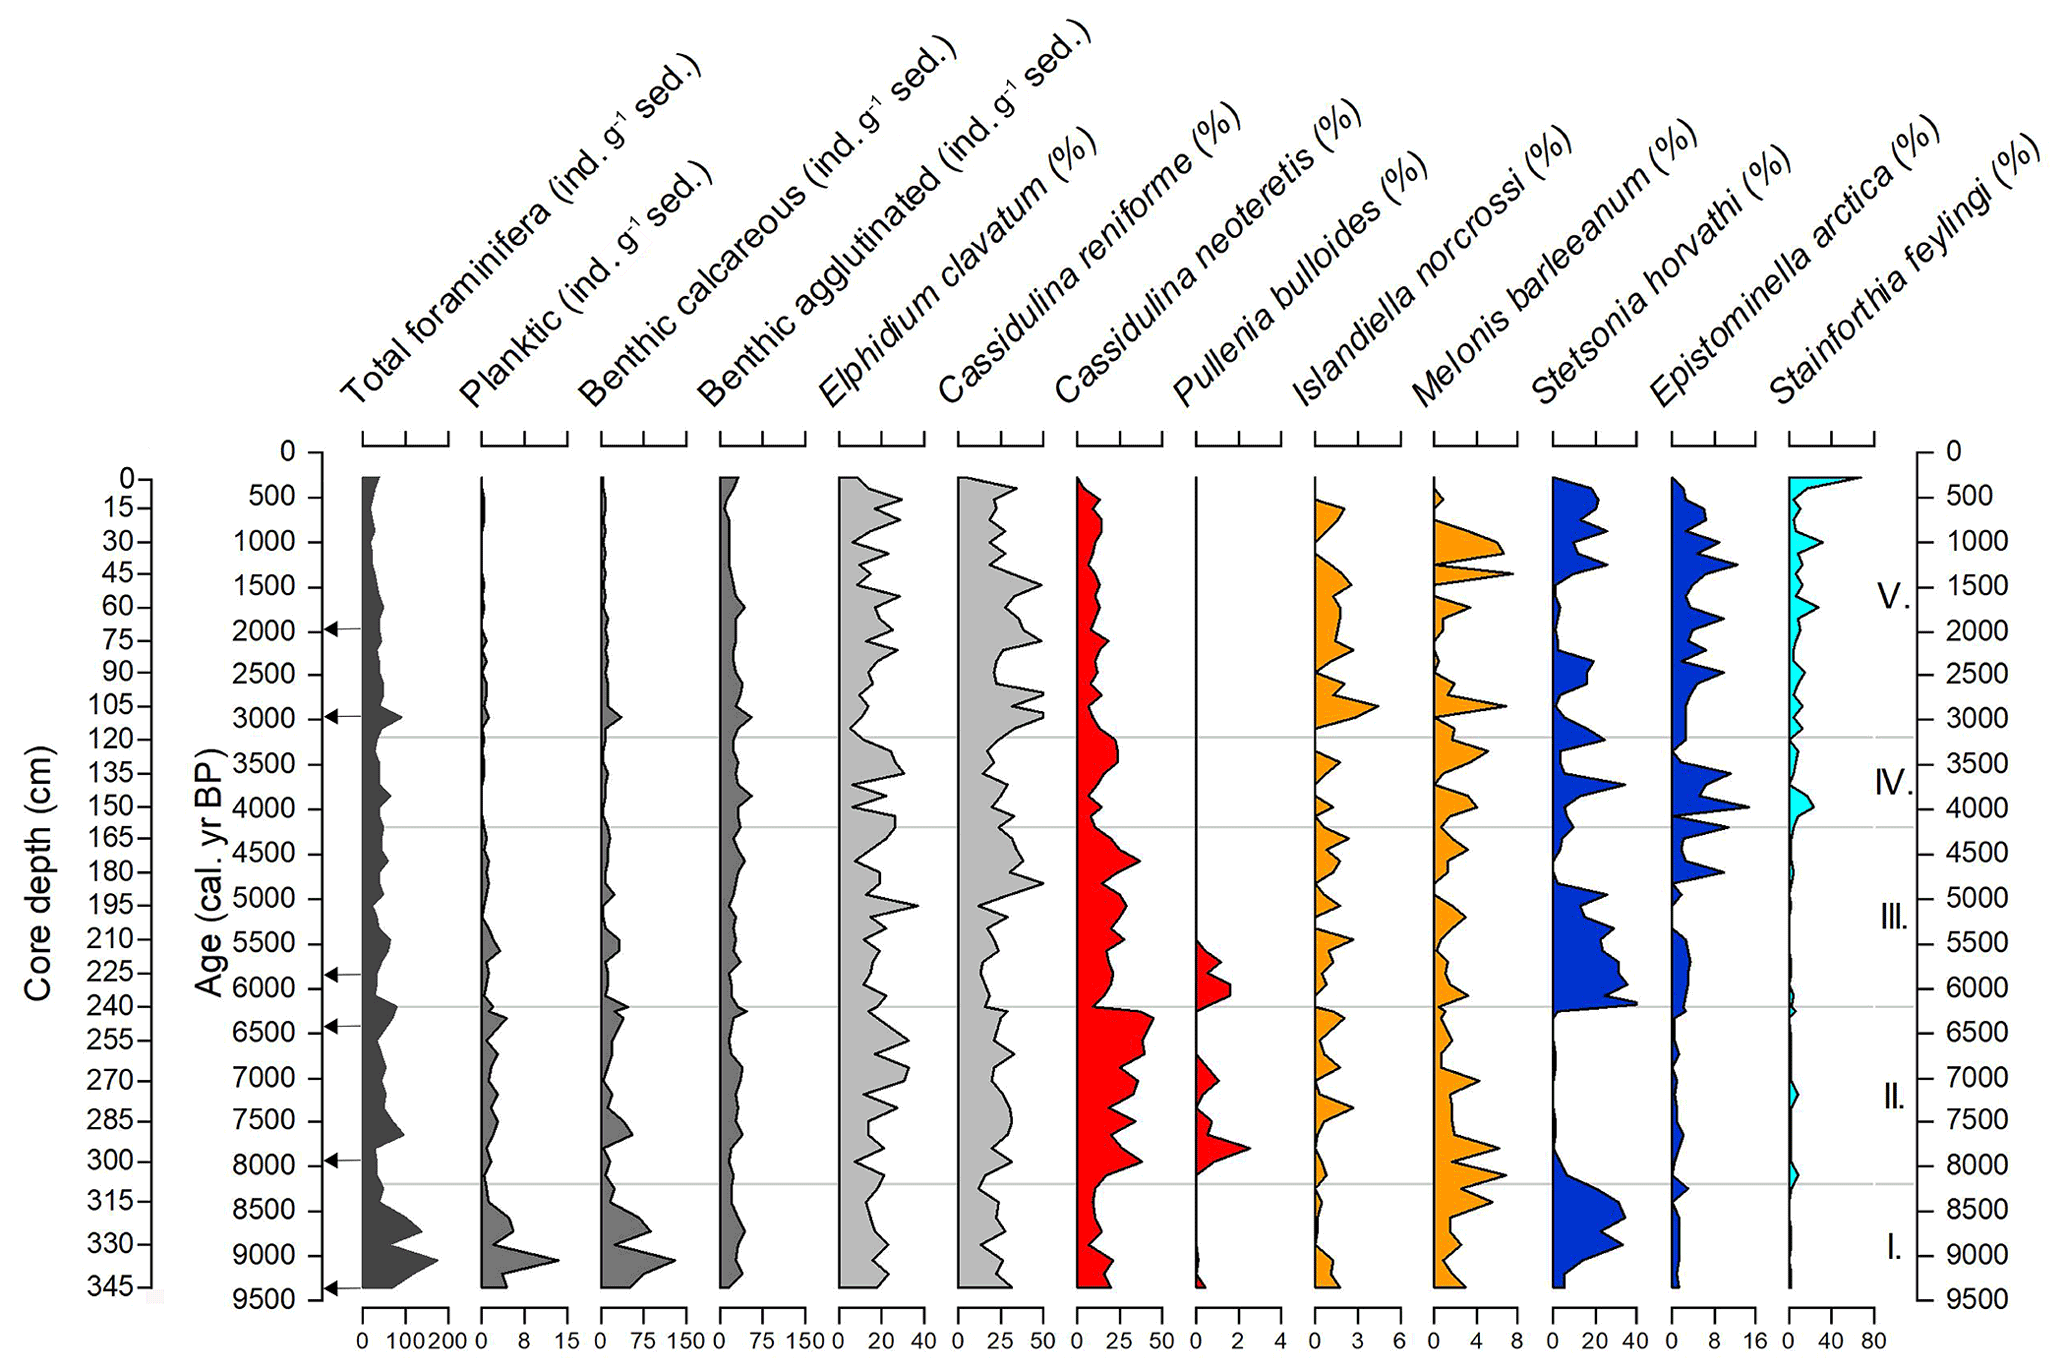
Figure A2Foraminiferal concentrations and relative abundances of nine selected calcareous benthic species (expressed as a percentage of total benthic calcareous foraminiferal content) versus calibrated age along sediment core DA17-NG-ST07-73G. The depicted species were chosen in order to show changes in the environment. Red represents species that indicate warm Atlantic Water inflow, orange represents species that indicate in the Arctic recirculated chilled Atlantic Water influence, dark blue represents Arctic Water species that are commonly found in connection to Polar Water and often live beneath perennial or near-perennial sea ice, and light blue represents a species that indicates sea ice. Ecozones (I–V) are shown on the right side of the figure. Black arrows next to the left primary y axis (age) mark radiocarbon dates. Note that the x axes have different scalings.

Figure A3Relative abundances of the most abundant (>5 % in at least one sample) agglutinated benthic foraminifera species (expressed as a percentage of total benthic agglutinated foraminiferal content) versus calibrated age along sediment core DA17-NG-ST07-73G. Ecozones (I–V) are shown on the right side of the figure. Black arrows next to the left primary y axis (age) mark radiocarbon dates. Note that the x axes have different scalings.
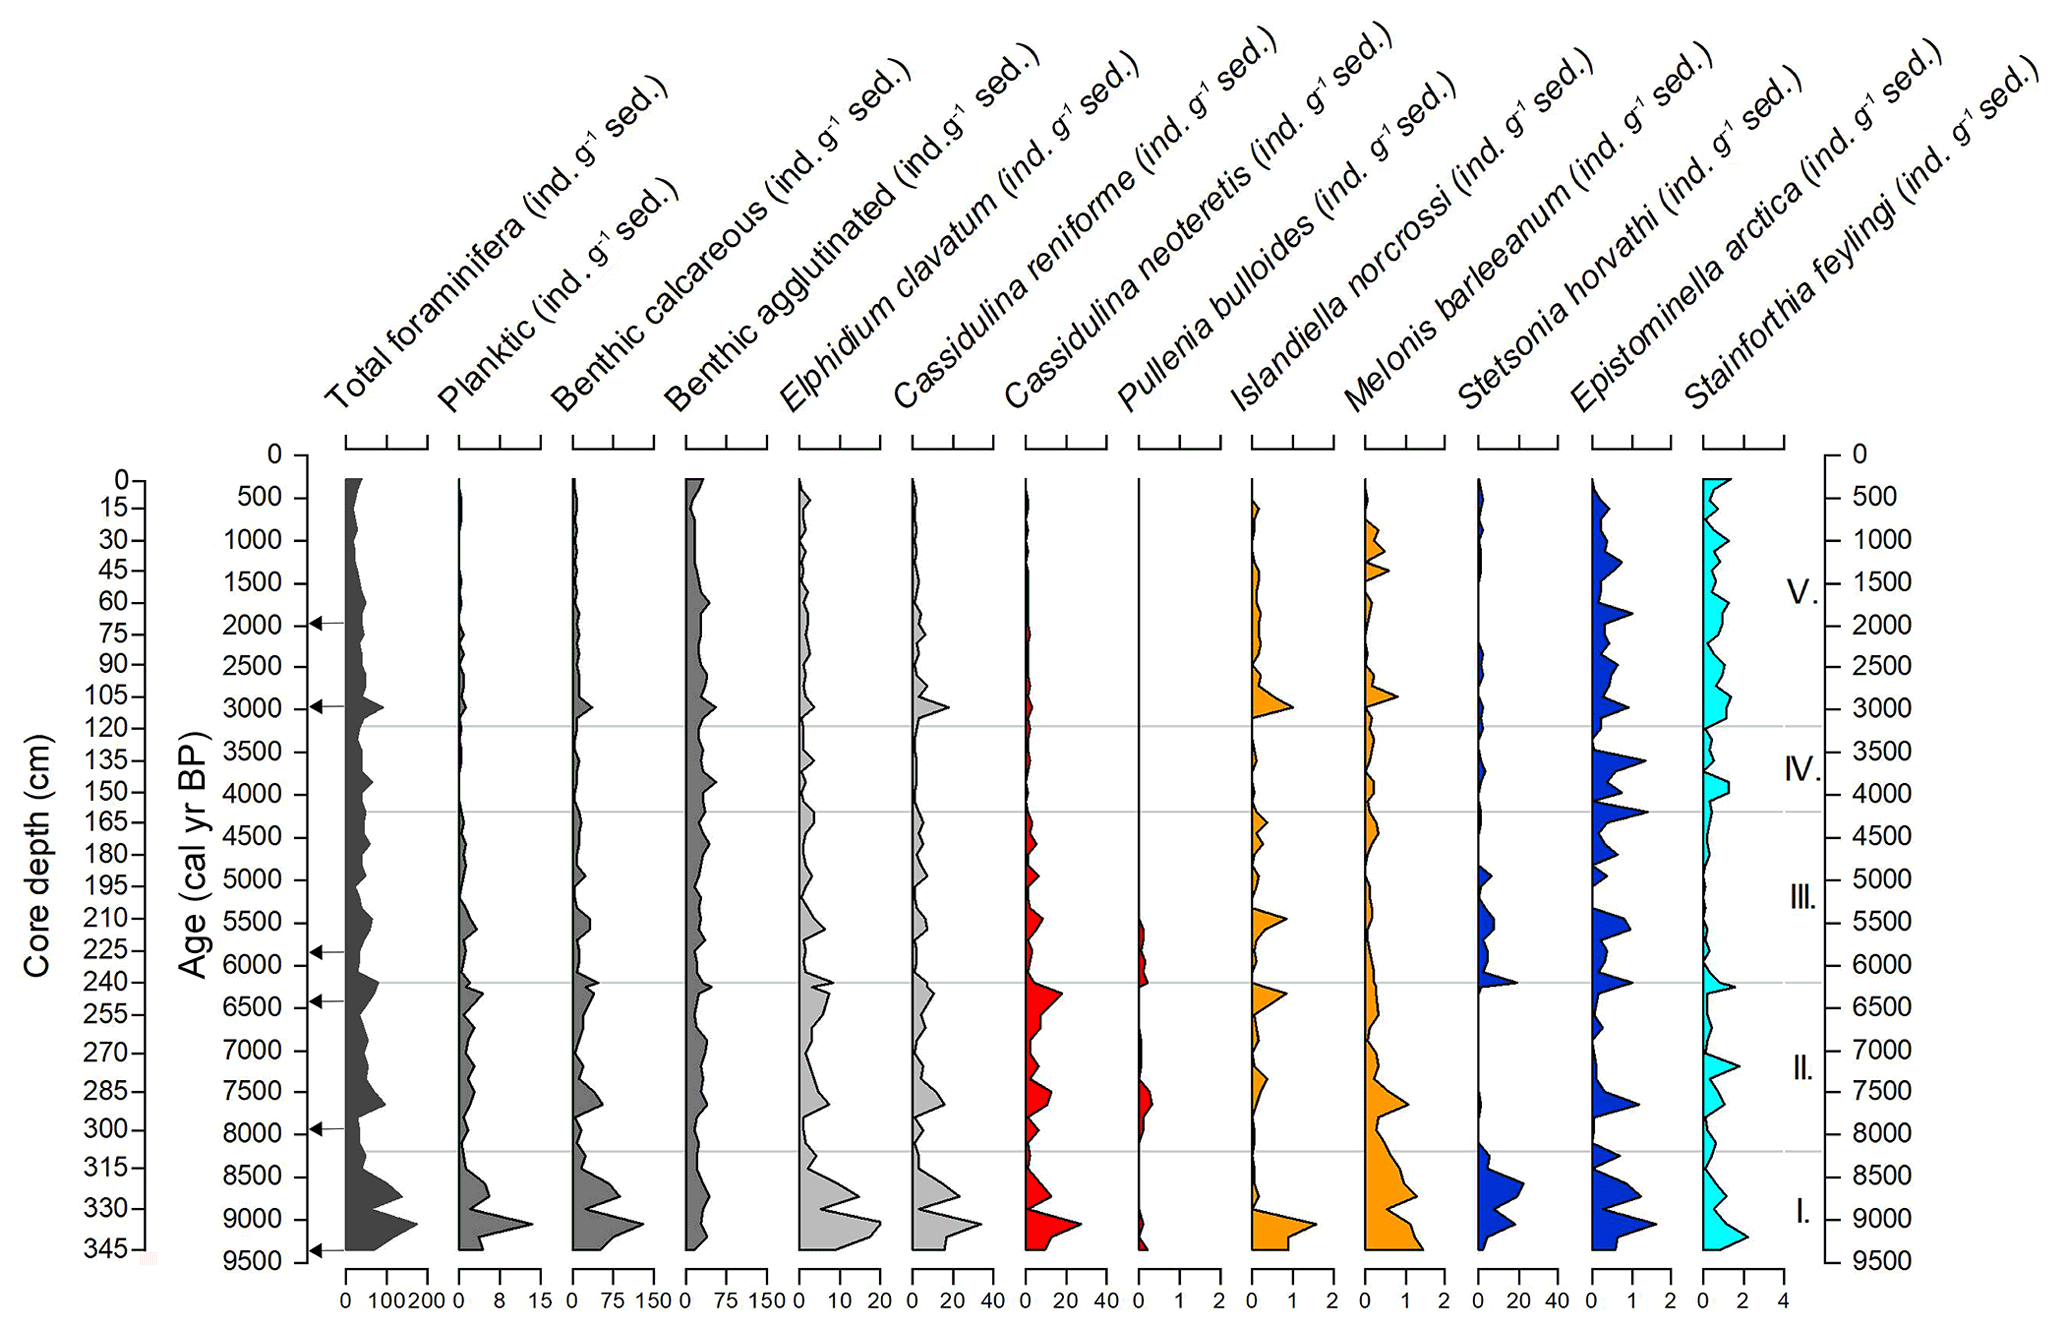
Figure A4Foraminiferal concentrations showing the concentrations of nine selected calcareous benthic species versus calibrated age along sediment core DA17-NG-ST07-73G. The depicted species were chosen in order to show changes in the environment. Red represents species that indicate warm Atlantic Water inflow, orange represents species that indicate in the Arctic recirculated chilled Atlantic Water influence, dark blue represents Arctic Water species that are commonly found in connection to Polar Water and often live beneath perennial or near-perennial sea ice, and light blue represents a species that indicates sea ice. Ecozones (I–V) are shown on the right side of the figure. Black arrows next to the left primary y axis (age) mark radiocarbon dates. Note that the x axes have different scalings.
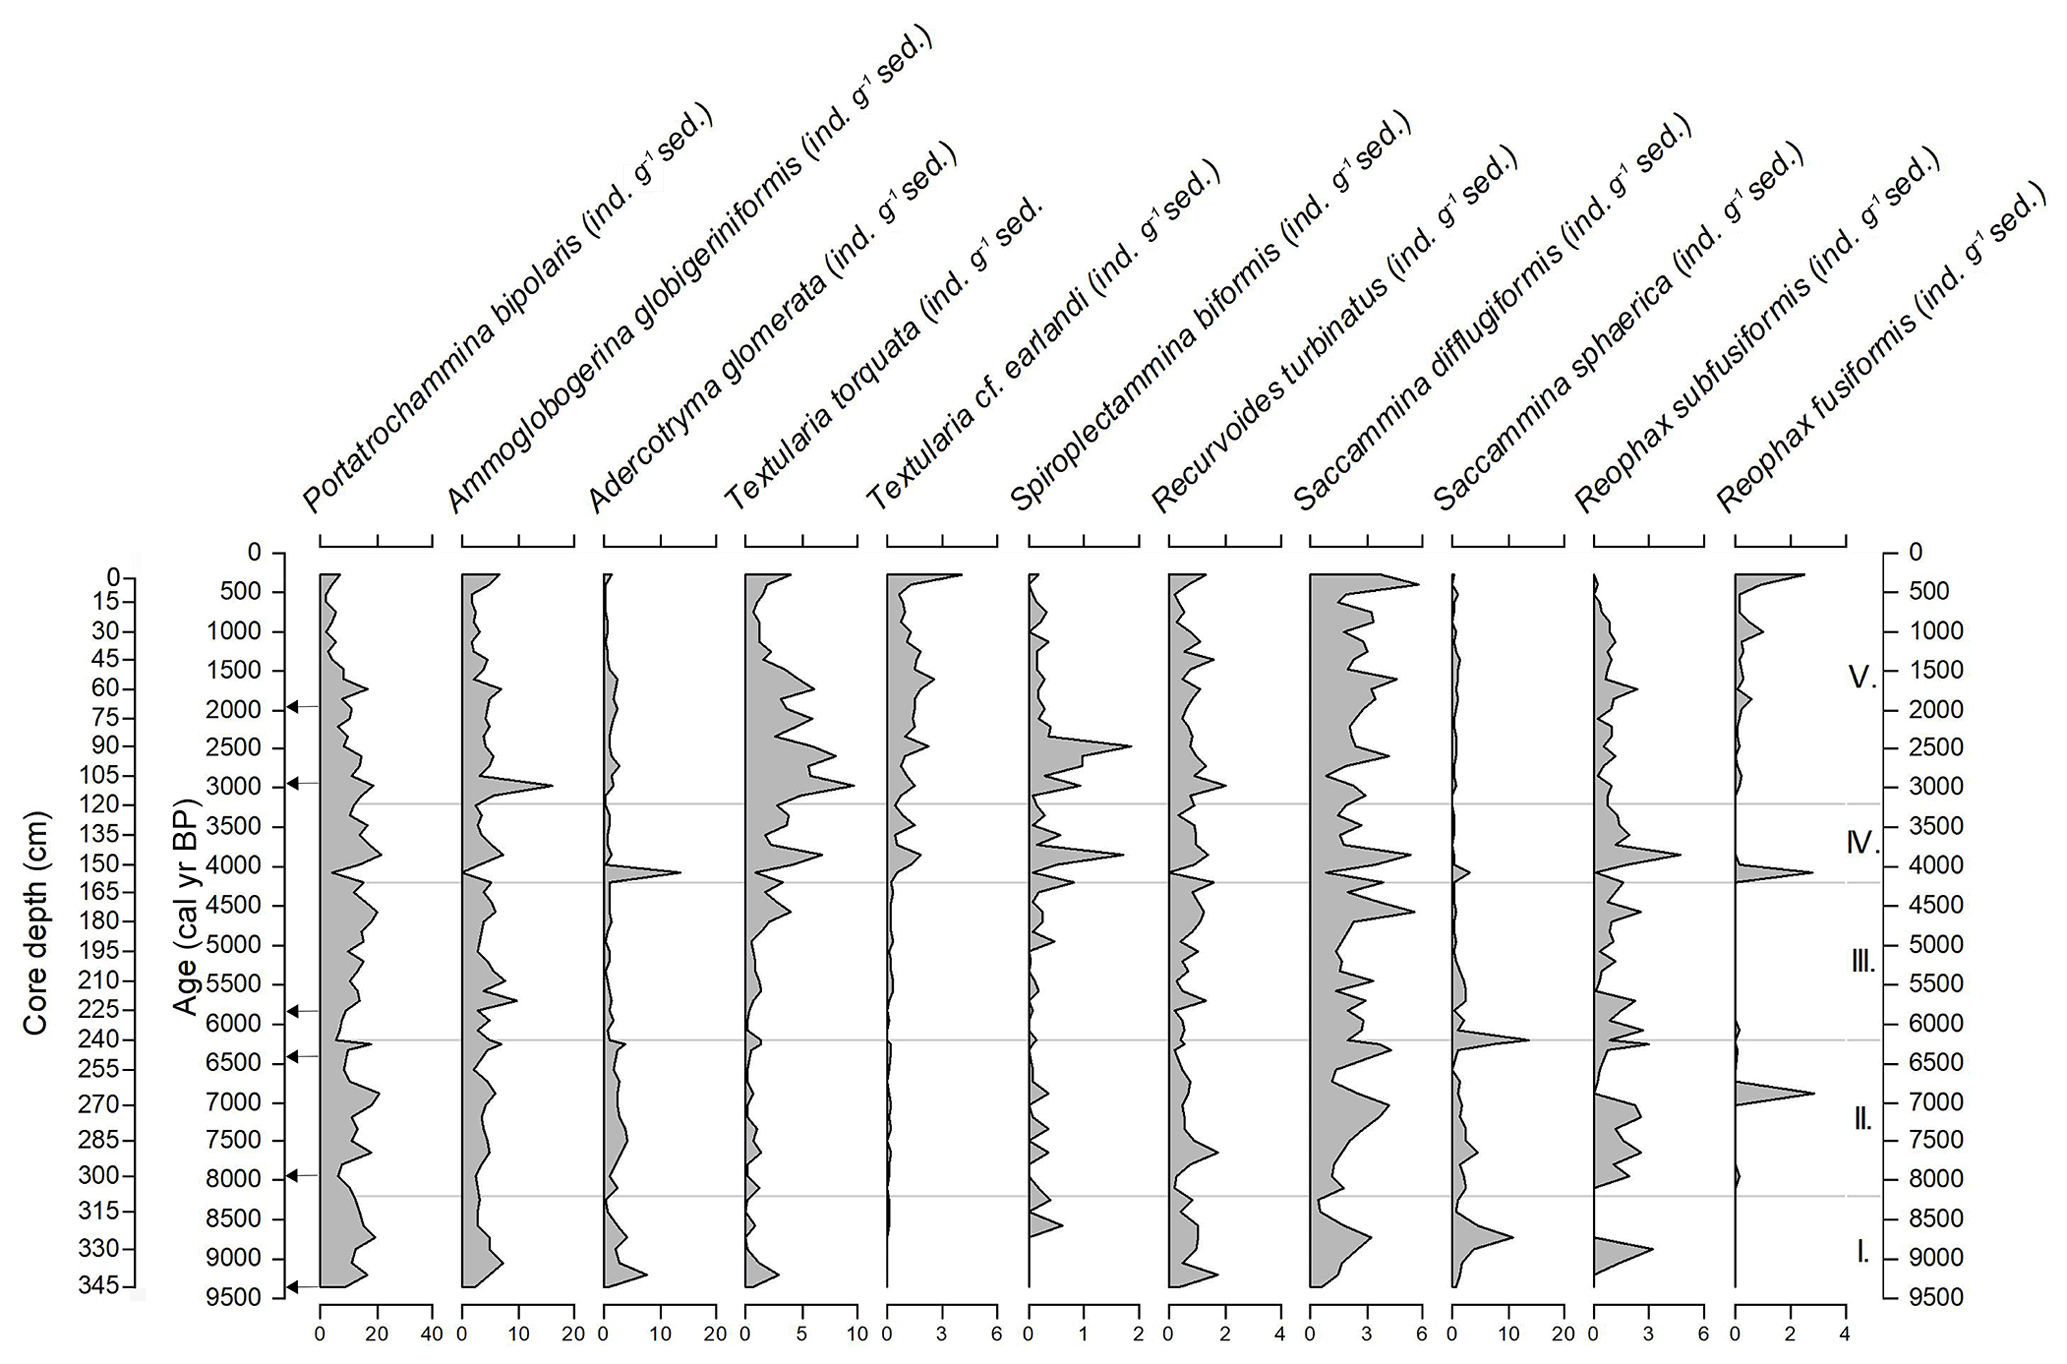
Figure A5Foraminiferal concentrations of the most abundant (>5 % in at least one sample) agglutinated benthic foraminifera species versus calibrated age along sediment core DA17-NG-ST07-73G. Ecozones (I–V) are shown on the right side of the figure. Black arrows next to the left primary y axis (age) mark radiocarbon dates. Note that the x axes have different scalings.
Data presented in this paper have been uploaded to PANGAEA (https://doi.pangaea.de/10.1594/PANGAEA.934100, Pados-Dibattista et al., 2021) and will be publicly accessible right after the publication of the paper.
TPD and MSS developed the research idea. TPD carried out the sampling, data collection, and the data analysis with the help of CP, HD, JB, and MSS. CP performed the age modelling of the core. TPD prepared the manuscript with contributions from all co-authors.
At least one of the (co-)authors is a member of the editorial board of Climate of the past. The peer-review process was guided by an independent editor, and the authors also have no other competing interests to declare.
Publisher's note: Copernicus Publications remains neutral with regard to jurisdictional claims in published maps and institutional affiliations.
We would like to thank the captain and crew, as well as the shipboard scientific party, onboard R/V Dana. We also wish to thank Marianne Lyngholm Nielsen for carrying out the X-ray fluorescence core scanning and the magnetic susceptibility measurements and Nils Andersen of the Leibniz Laboratory for Radiometric Dating and Stable Isotope Research at the Christian-Albrecht University of Kiel for the stable isotope measurements.
The NorthGreen17 expedition was funded by the Danish Centre for Marine Research and the Natural Science and Engineering Research Council of Canada. The research was funded by the European Union's Horizon 2020 research and innovation programme under grant agreement no. 792639, with further support from the Danish Council for Independent Research (grant nos. 7014-00113B (G-Ice) and 0135-00165B (GreenShelf) to MSS) and the European Union's Horizon 2020 research and innovation programme under grant agreement no. 869383 (ECOTIP).
This paper was edited by Bjørg Risebrobakken and reviewed by two anonymous referees.
Alley, R. B., Mayewski, P. A., Sowers, T., Stuiver, M., Taylor, K. C., and Clark, P. U.: Holocene climatic instability: A prominent, widespread event 8200 yr ago, Geology, 25, 483–486, 1997.
Andersen, C., Koç, N., Jennings, A. E., and Andrews, J. T.: Nonuniform response of the major surface currents in the Nordic Seas to insolation forcing: Implications for the Holocene climate variability, Paleoceanography, 19, PA2003, https://doi.org/10.1029/2002PA000873, 2004.
Andrews, J. T., Smith, L. M., Preston, R., Cooper, T., and Jennings, A. E.: Spatial and temporal patterns of iceberg rafting (IRD) along the East Greenland margin, ca. 68 N, over the last 14 cal. Ka, J. Quaternary Sci., 12, 1–13, 1997.
Ardyna, M., Babin, M., Gosselin, M., Devred, E., Rainville, L., and Tremblay, J.-É.: Recent Arctic Ocean sea ice loss triggers novel fall phytoplankton blooms, Geophys. Res. Lett., 41, 6207–6212, https://doi.org/10.1002/2014GL061047, 2014.
Arndt, J. E., Jokat, W., Dorschel, B., Myklebust, R., Dowdeswell, J. A., and Evans, J.: A new bathymetry of the Northeast Greenland continental shelf: Constraints on glacial and other processes, Geochem. Geophy. Geosy., 16, 3733–3753, 2015.
Arndt, J. E., Jokat, W., and Dorschel, B.: The last glaciation and deglaciation of the Northeast Greenland continental shelf revealed by hydro-acoustic data, Quaternary Sci. Rev., 160, 45–56, 2017.
Barber, D. C., Dyke, A., Hillaire-Marcel, C., Jennings, A. E., Andrews, J. T., Kerwin, M. W., Bilodeau, G., McNeely, R., Southon, J., Morehead, M. D., and Gagnon, J.-M.: Forcing of the cold event of 8,200 years ago by catastrophic drainage of Laurentide lakes, Nature, 400, 344–348, 1999.
Bauch, H. A., Erlenkeuser, H., Spielhagen, R. F., Struck, U., Matthiessen, J., Thiede, J., and Heinemeier, J.: A multiproxy reconstruction of the evolution of deep and surface waters in the subarctic Nordic seas over the last 30,000 yr, Quaternary Sci. Rev., 20, 659–678, 2001.
Bennike, O. L. E. and Weidick, A.: Late Quaternary history around Nioghalvfjerdsfjorden and Jøkelbugten, North-East Greenland, Boreas, 30, 205–227, 2001.
Berger, A.: Long-term variations of caloric insolation resulting from the Earth's orbital elements, Quaternary Res., 9, 139–167, 1978.
Blaschek, M. and Renssen, H.: The Holocene thermal maximum in the Nordic Seas: the impact of Greenland Ice Sheet melt and other forcings in a coupled atmosphere–sea-ice–ocean model, Clim. Past, 9, 1629–1643, https://doi.org/10.5194/cp-9-1629-2013, 2013.
Born, A. and Stocker, T. F.: Two stable equilibria of the Atlantic subpolar gyre, J. Phys. Oceanogr., 44, 246–264, https://doi.org/10.1175/JPO-D-13-073.1, 2014.
Bourke, R. H., Newton, J. L., Paquette, R. G., and Tunnicliffe, M. D.: Circulation and water masses of the East Greenland shelf, J. Geophys. Res., 92, 6729–6740, https://doi.org/10.1029/JC092iC07p06729, 1987.
Boyer, T. P., Garcia, H., E, Locarnini, R. A., Ricardo, A., Zweng, M. M., Mishonov, A. V., Reagan, J., R., Weathers, K., A., Baranova, O. K., Seidov, D., and Smolyar, I. V.: World Ocean Atlas 2018, NOAA National Centers for Environmental Information [data set], available at: https://accession.nodc.noaa.gov/NCEI-WOA18 (last access: 27 January 2021), 2018.
Budéus, G., Schneider, W., and Kattner, G.: Distribution and exchange of water masses in the Northeast Water polynya (Greenland Sea), J. Mar. Syst., 10, 123–138, https://doi.org/10.1016/S0924-7963(96)00074-7, 1997.
Caesar, L., McCarthy, G. D., Thornalley, D. J. R., Cahill, N., and Rahmstorf, S.: Current Atlantic Meridional Overturning Circulation weakest in last millennium, Nat. Geosci., 14, 118–120, https://doi.org/10.1038/s41561-021-00699-z, 2021.
Cage, A. G., Pieńkowski, A. J., Jennings, A., Knudsen, K. L., and Seidenkrantz, M.-S.: Comparative analysis of six common foraminiferal species of the genera Cassidulina, Paracassidulina, and Islandiella from the Arctic–North Atlantic domain, J. Micropalaeontol., 40, 37–60, https://doi.org/10.5194/jm-40-37-2021, 2021.
Clark, P. U., Marshall, S. J., Clarke, G. K., Hostetler, S. W., Licciardi, J. M., and Teller, J. T.: Freshwater forcing of abrupt climate change during the last glaciation, Science, 293, 283–287, 2001.
Clark, P. U., Pisias, N. G., Stocker, T. F., and Weaver, A. J.: The role of the thermohaline circulation in abrupt climate change, Nature, 415, 863–869, 2002.
Consolaro, C., Rasmussen, T. L., and Panieri, G.: Palaeoceanographic and environmental changes in the eastern Fram Strait during the last 14,000 years based on benthic and planktonic foraminifera, Mar. Micropaleontol., 139, 84–101, 2018.
Cronin, T. M., Dwyer, G. S., Kamiya, T., Schwede, S., and Willard, D. A.: Medieval warm period, little ice age and 20th century temperature variability from Chesapeake Bay, Global Planet. Change, 36, 17–29, 2003.
Danish Meteorological Institute (DMI) and NSIDC: Arctic Sea Ice Charts from the Danish Meteorological Institute, 1893–1995, edited by: Underhill, V. and Fetterer, F., National Snow and Ice Data Center, Boulder, Colorado USA, 2012.
El bani Altuna, N., Rasmussen, T. L., Ezat, M. M., Vadakkepuliyambatta, S., Groeneveld, J., and Greaves, M.: Deglacial bottom water warming intensified Arctic methane seepage in the NW Barents Sea, Communications Earth & Environment, 2, 188, https://doi.org/10.1038/s43247-021-00264-x, 2021.
Ellison, C. R. W., Chapman, M. R., and Hall, I. R.: Surface and deep ocean interactions during the cold climate event 8200 years ago, Science, 312, 1929–1932, https://doi.org/10.1126/science.1127213, 2006.
Estrade, P., Marchesiello, P., Colin De Verdiere, A., and Roy, C.: Cross-shelf structure of coastal upwelling: A two-dimensional extension of Ekman's theory and a mechanism for inner shelf upwelling shut down, J. Mar. Res., 66, 589–616, https://doi.org/10.1357/002224008787536790, 2008.
Farmer, J. R., Sigman, D. M., Granger, J., Underwood, O. M., Fripiat, F., Cronin, T. M., Martínez-García, A., and Haug, G. H.: Arctic Ocean stratification set by sea level and freshwater inputs since the last ice age, Nat. Geosci., 14, 684–689, https://doi.org/10.1038/s41561-021-00789-y, 2021.
Feyling-Hanssen, R. W.: The stratigraphy of the Quaternary Clyde Foreland Formation, Baffin Island, illustrated by the distribution of benthic foraminifera, Boreas, 5, 77–94, 1976.
Feyling-Hanssen, R. W.: Microbiostratigraphy of young Cenozoic marine deposits of Qivituq Peninsula, Baffin Island, Mar. Micropaleontol., 5, 153–184, 1980.
Feyling-Hanssen, R., Funder, S., and Petersen, K. S.: The Lodin Elv Formation; a Plio-Pleistocene occurrence in Greenland, B. Geol. Soc. Den., 31, 81–106, 1983.
Funder, S., Bennike, O., Böcher, J., Israelson, C., Strand Petersen, K., and Símonarson, L. A.: Late Pliocene Greenland–The Kap København Formation in North Greenland, B. Geol. Soc. Den., 48, 117–134, 2001.
Giraudeau, J., Jennings, A. E., and Andrews, J. T.: Timing and mechanisms of surface and intermediate water circulation changes in the Nordic Seas over the last 10,000 cal years: a view from the North Iceland shelf, Quaternary Sci. Rev., 23, 2127–2139, 2004.
Giraudeau, J., Grelaud, M., Solignac, S., Andrews, J. T., Moros, M., and Jansen, E.: Millennial-scale variability in Atlantic water advection to the Nordic Seas derived from Holocene coccolith concentration records, Quaternary Sci. Rev., 29, 1276–1287, 2010.
Green, K. E.: Ecology of some Arctic foraminifera, Micropaleontol., 6, 57–78, 1960.
Hald, M. and Korsun, S.: Distribution of modern benthic foraminifera from fjords of Svalbard, European Arctic, J. Foramin. Res., 27, 101–122, 1997.
Hald, M., Andersson, C., Ebbesen, H., Jansen, E., Klitgaard-Kristensen, D., Risebrobakken, B., Salomonsen, G. R., Sarnthein, M., Sejrup, H. P., and Telford, R. J.: Variations in temperature and extent of Atlantic Water in the northern North Atlantic during the Holocene, Quaternary Sci. Rev., 26, 3423–3440, 2007.
Hall, I. R., Bianchi, G. G., and Evans, J. R.: Centennial to millennial scale Holocene climate-deep water linkage in the North Atlantic, Quaternary Sci. Rev., 23, 1529–1536, 2004.
Hansen, K. E., Giraudeau, J., Wacker, L., Pearce, C., and Seidenkrantz, M.-S.: Reconstruction of Holocene oceanographic conditions in eastern Baffin Bay, Clim. Past, 16, 1075–1095, https://doi.org/10.5194/cp-16-1075-2020, 2020.
Heaton, T. J., Köhler, P., Butzin, M., Bard, E., Reimer, R. W., Austin, W. E. N., Bronk Ramsey, C., Grootes, P. M., Hughen, K. A., Kromer, B., Reimer, P. J., Adkins, J., Burke, A., Cook, M. S., Olsen, J., and Skinner, L. C.: Marine20 – The Marine Radiocarbon Age Calibration Curve (0–55,000 Cal BP), Radiocarbon, 62, 779–820, https://doi.org/10.1017/RDC.2020.68, 2020.
Hillaire-Marcel, C., De Vernal, A., Bilodeau, G., and Weaver, A. J.: Absence of deep-water formation in the Labrador Sea during the last interglacial period, Nature, 410, 1073–1077, 2001.
Hillaire-Marcel, C., De Vernal, A., and Piper, D. J.: Lake Agassiz final drainage event in the northwest North Atlantic, Geophys. Res. Lett., 34, L15601, https://doi.org/10.1029/2007GL030396, 2007.
Hoffman, J. S., Carlson, A. E., Winsor, K., Klinkhammer, G. P., LeGrande, A. N., Andrews, J. T., and Strasser, J. C.: Linking the 8.2 ka event and its freshwater forcing in the Labrador Sea, Geophys. Res. Lett., 39, L18703, https://doi.org/10.1029/2012GL053047, 2012.
Hurrell, J. W. and Deser, C.: North Atlantic climate variability: the role of the North Atlantic Oscillation, J. Marine Syst., 79, 231–244, 2010.
Hurrell, J. W., Kushnir, Y., Ottersen, G., and Visbeck, M.: An overview of the North Atlantic oscillation, Geophysical Monograph-American Geophysical Union, 134, 1–36, 2003.
Ionita, M., Scholz, P., Lohmann, G., Dima, M., and Prange, M.: Linkages between atmospheric blocking, sea ice export through Fram Strait and the Atlantic meridional overturning circulation, Sci. Rep.-UK, 6, 32881, https://doi.org/10.1038/srep32881, 2016.
Jansen, E., Andersson, C., Moros, M., Nisancioglu, K. H., Nyland, B. F., and Telford, R. J.: The Early to Mid-Holocene Thermal Optimum in the North Atlantic, in: Natural Climate Variability and Global Warming, edited by: Battarbee, R. W. and Binney, H. A., Wiley Blackwell, 123–137, https://doi.org/10.1002/9781444300932.ch5, 2008.
Jennings, A. E. and Helgadottir, G.: Foraminiferal assemblages from the fjords and shelf of eastern Greenland, J. Foramin. Res., 24, 123–144, 1994.
Jennings, A. E., Knudsen, K. L., Hald, M., Hansen, C. V., and Andrews, J. T.: A mid-Holocene shift in Arctic sea-ice variability on the East Greenland Shelf, The Holocene, 12, 49–58, 2002.
Jennings, A. E., Weiner, N. J., Helgadottir, G., and Andrews, J. T.: Modern foraminiferal faunas of the southwestern to northern Iceland shelf: oceanographic and environmental controls, J. Foramin. Res., 34, 180–207, 2004.
Jennings, A., Andrews, J., and Wilson, L.: Holocene environmental evolution of the SE Greenland Shelf North and South of the Denmark Strait: Irminger and East Greenland current interactions, Quaternary Sci. Rev., 30, 980–998, 2011.
Jennings, A., Andrews, J., Reilly, B., Walczak, M., Jakobsson, M., Mix, A., Stoner, J., Nicholls, K. W., and Cheseby, M.: Modern foraminiferal assemblages in northern Nares Strait, Petermann Fjord, and beneath Petermann ice tongue, NW Greenland, Arct. Antarct. Alp. Res., 52, 491–511, 2020.
Johannessen, O. M.: Brief overview of the physical oceanography, in: The Nordic Seas, edited by: Hurdle, B. G., Springer-Verlag, New York, https://doi.org/10.1007/978-1-4615-8035-5_4, 1986.
Kaufmann, D. S., Ager, T. A., Anderson, N. J., Anderson, P. M., Andrews, J. T., Bartlein, P. J., Brubaker, L. B., Coats, L. L., Cwynar, L. C., Duvall, M. L., Dyke, A. S., Edwards, M. E., Eisner, W. R., Gajewski, K., Geirsdóttir, A., Hu, F. S., Jennings, A. E., Kaplan, M. R., Kerwin, M. W., Lozhkin, A. V., MacDonald, G. M., Miller, G. H., Mock, C. J., Oswald, W. W., Otto-Bliesner, B. L., Porinchu, D. F., Rühland, K., Smol, J. P., Steig, E. J., and Wolfe, B. B.: Holocene thermal maximum in the western Arctic (0–180∘ W), Quaternary Sci. Rev., 23, 529–560, 2004.
Keigwin, L. D., Sachs, J. P., Rosenthal, Y., and Boyle, E. A.: The 8200 year B.P. event in the slope water system, western subpolar North Atlantic, Paleoceanography, 20, PA2003, https://doi.org/10.1029/2004PA001074, 2005.
Kirillov, S., Dmitrenko, I., Tremblay, B., Gratton, Y., Barber, D., and Rysgaard, S.: Upwelling of Atlantic Water along the Canadian Beaufort Sea continental slope: Favorable atmospheric conditions and seasonal and interannual variations, J. Clim., 29, 4509–4523, https://doi.org/10.1175/JCLI-D-15-0804.1, 2016.
Knudsen, K. L. and Seidenkrantz, M. S.: Stainforthia feylingi new species from arctic to subarctic environments, previously recorded as Stainforthia schreibersiana (Czjzek), Cushman Foundation for Foraminiferal Research Special Publication, 32, 5–13, 1994.
Knudsen, M. F., Seidenkrantz, M. S., Jacobsen, B. H., and Kuijpers, A.: Tracking the Atlantic Multidecadal Oscillation through the last 8,000 years, Nat. Commun., 2, 1–8, 2011.
Koç, N., Jansen, E., and Haflidason, H.: Paleoceanographic reconstructions of surface ocean conditions in the Greenland, Iceland and Norwegian seas through the last 14 ka based on diatoms, Quaternary Sci. Rev., 12, 115–140, 1993.
Kolling, H. M., Stein, R., Fahl, K., Perner, K., and Moros, M.: Short-term variability in late Holocene sea ice cover on the East Greenland Shelf and its driving mechanisms, Palaeogeogr. Palaeocl., 485, 336–350, 2017.
Korsun, S. and Hald, M.: Seasonal dynamics of benthic foraminifera in a glacially fed fjord of Svalbard, European Arctic, J. Foramin. Res., 30, 251–271, 2000.
Kwok, R.: Recent changes in Arctic Ocean sea ice motion associated with the North Atlantic Oscillation, Geophys. Res. Lett., 27, 775–778, 2000.
Lagoe, M. B.: Recent Benthic foraminifera from the Central Arctic Ocean, J. Foramin. Res., 7, 106–129, 1979.
Larsen, N. K., Levy, L. B., Carlson, A. E., Buizert, C., Olsen, J., Strunk, A., Bjørk, A. A., and Skov, D. S.: Instability of the Northeast Greenland Ice Stream over the last 45,000 years, Nat. Commun., 9, 1–8, 2018.
Lloyd, J. M.: Modern distribution of benthic foraminifera from Disko Bugt, West Greenland, J. Foramin. Res., 36, 315–331, 2006.
Mackensen, A. and Hald, M.: Cassidulina teretis Tappan and C. laevigata D'Orbigny: their modern and Late Quaternary distribution in Northern seas, J. Foramin. Res., 18, 16–24, 1988.
Mackensen, A. and Schmiedl, G.: Brine formation recorded by stable isotopes of recent benthic foraminifera in Storfjorden, Svalbard: palaeoceanographical implications, Boreas, 45, 552–556, https://doi.org/10.1111/bor.12174, 2016.
Mayer, C., Reeh, N., Jung-Rothenhäusler, F., Huybrechts, P., and Oerter, H.: The subglacial cavity and implied dynamics under Nioghalvfjerdsfjorden Glacier, NE-Greenland, Geophys. Res. Lett., 27, 2289–2292, 2000.
Moossen, H., Bendle, J., Seki, O., Quillmann, U., and Kawamura, K.: North Atlantic Holocene climate evolution recorded by high-resolution terrestrial and marine biomarker records, Quaternary Sci. Rev., 129, 111e127, https://doi.org/10.1016/j.quascirev.2015.10.013, 2015.
Moros, M., Jansen, E., Oppo, D. W., Giraudeau, J., and Kuijpers, A.: Reconstruction of the late-Holocene changes in the Sub-Arctic Front position at the Reykjanes Ridge, north Atlantic, The Holocene, 22, 877–886, 2012.
Müller, J., Werner, K., Stein, R., Fahl, K., Moros, M., and Jansen, E.: Holocene cooling culminates in sea ice oscillations in Fram Strait, Quaternary Sci. Rev., 47, 1–14, 2012.
Mysak, L. A.: Patterns of Arctic Circulation, Nature, 293, 1269–1270, https://doi.org/10.1126/science.1064217, 2001.
Oppo, D. W., McManus, J. F., and Cullen, J. L.: Deepwater variability in the Holocene epoch, Nature, 422, 277–277, 2003.
Orme, L. C., Miettinen, A., Divine, D., Husum, K., Pearce, C., Van Nieuwenhove, N., Born, A., Mohan, R., and Seidenkrantz, M. S.: Subpolar North Atlantic sea surface temperature since 6 ka BP: Indications of anomalous ocean-atmosphere interactions at 4-2 ka BP, Quaternary Sci. Rev., 194, 128–142, 2018.
Pados-Dibattista, T., Pearce, C., Detlef, H., Brendtsen, J., and Seidenkrantz, M.-S.: Benthic foraminiferal abundances, stable isotopes and XRF data from the Northeast Greenland shelf, sediment core DA17-NG-ST7-73G, PANGAEA [data set], https://doi.pangaea.de/10.1594/PANGAEA.934100, 2021.
Pedersen, L. T., Gudmandsen, P., and Skriver, H.: North-East Water – A remote sensing study, Report 545, Electromagnetic Institute, Technical University of Denmark, 1993.
Perner, K., Moros, M., Lloyd, J. M., Kuijpers, A., Telford, R. J., and Harff, J.: Centennial scale benthic foraminiferal record of late Holocene oceanographic variability in Disko Bugt, West Greenland, Quaternary Sci. Rev., 30, 2815–2826, 2011.
Perner, K., Moros, M., Jennings, A., Lloyd, J. M., and Knudsen, K. L.: Holocene palaeoceanographic evolution off West Greenland, The Holocene, 23, 374–387, 2012.
Perner, K., Moros, M., Lloyd, J. M., Jansen, E., and Stein, R.: Mid to late Holocene strengthening of the East Greenland Current linked to warm subsurface Atlantic water, Quaternary Sci. Rev., 129, 296–307, 2015.
Perner, K., Jennings, A. E., Moros, M., Andrews, J. T., and Wacker, L.: Interaction between warm Atlantic-sourced waters and the East Greenland Current in northern Denmark Strait (68 N) during the last 10 600 cal a BP, J. Quaternary Sci., 31, 472–483, 2016.
Quadfasel, D., Gascard, J. C., and Koltermann, K. P.: Large-scale oceanography in Fram Strait during the 1984 marginal ice zone experiment, J. Geophys. Res.-Oceans, 92, 6719–6728, 1987.
Rahmstorf, S.: Bifurcations of the Atlantic thermohaline circulation in response to changes in the hydrological cycle, Nature, 378, 145–149, 1995.
Ramsey, C. B.: Deposition models for chronological records, Quaternary Sci. Rev., 27, 42–60, 2008.
Ran, L., Jiang, H., Knudsen, K. L., Eiríksson, J., and Gu, Z.: Diatom response to the Holocene climatic optimum on the North Icelandic shelf, Mar. Micropaleontol., 60, 226–241, 2006.
Rasmussen, S. O., Vinther, B. M., Clausen, H. B., and Andersen, K. K.: Early Holocene climate oscillations recorded in three Greenland ice cores, Quaternary Sci. Rev., 26, 1907–1914, https://doi.org/10.1016/j.quascirev.2007.06.015, 2007.
Reimer, P. J. and Reimer, R. W.: A marine reservoir correction database and on-line interface, Radiocarbon, 43, 461–463, 2001.
Reimer, P. J., Bard, E., Bayliss, A., Beck, J. W., Backwell, P. G., Ramsey, C. B., Buck, C. E., Cheng, H., Edwards, R. L., Friedrich, M., Grootes, P. M., Guilderson, T. P., Haflidason, H., Hajdas, I., Hatté, C., Heaton, T. J., Hoffmann, D. L., Hogg, A. G., Hughen, K. A., Kaiser, K. F., Kromer, B., Manning, S. W., Niu, M., Reimer, R. W., Richards, D. A., Scott, E. M., Southon, J. R., Staff, R. A., Turney, C. S. M., and van der Plicht, J.: IntCal13 and Marine13 Radiocarbon Age Calibration Curves 0–50,000 Years cal BP, Radiocarbon, 55, 1869–1887, https://doi.org/10.2458/azu_js_rc.55.16947, 2013.
Ren, J., Jiang, H., Seidenkrantz, M. S., and Kuijpers, A.: A Diatom-Based Reconstruction of Early Holocene Hydrographic and Climatic Change in a Southwest Greenland Fjord, Mar. Micropaleontol., 70, 166–176, https://doi.org/10.1016/j.marmicro.2008.12.003, 2009.
Renssen, H., Goosse, H., and Muscheler, R.: Coupled climate model simulation of Holocene cooling events: oceanic feedback amplifies solar forcing, Clim. Past, 2, 79–90, https://doi.org/10.5194/cp-2-79-2006, 2006.
Risebrobakken, B., Jansen, E., Andersson, C., Mjelde, E., and Hevrøy, K.: A high-resolution study of Holocene paleoclimatic and paleoceanographic changes in the Nordic Seas, Paleoceanography, 18, 1017, https://doi.org/10.1029/2002PA000764, 2003.
Risebrobakken, B., Dokken, T., Smedsrud, L. H., Andersson, C., Jansen, E., Moros, M., and Ivanova, E. V.: Early Holocene temperature variability in the Nordic Seas: The role of oceanic heat advection versus changes in orbital forcing, Paleoceanography, 26, PA4206, https://doi.org/10.1029/2011PA002117, 2011.
Rudels, B.: Arctic Ocean circulation and variability – advection and external forcing encounter constraints and local processes, Ocean Sci., 8, 261–286, https://doi.org/10.5194/os-8-261-2012, 2012.
Rudels, B. and Quadfasel, D.: Convection and deep water formation in the Arctic Ocean-Greenland Sea system, J. Marine Syst., 2, 435–450, 1991.
Rudels, B., Björk, G., Nilsson, J., Winsor, P., Lake, I., and Nohr, C.: The interaction between waters from the Arctic Ocean and the Nordic Seas north of Fram Strait and along the East Greenland Current: results from the Arctic Ocean-02 Oden expedition, J. Marine Syst., 55, 1–30, 2005.
Rytter, F., Knudsen, K. L., Seidenkrantz, M. S., and Eiríksson, J.: Modern distribution of benthic foraminifera on the North Icelandic shelf and slope, J. Foramin. Res., 32, 217–244, 2002.
Sachs, J. P.: Cooling of Northwest Atlantic slope waters during the Holocene, Geophys. Res. Lett., 34, L03609, https://doi.org/10.1029/2006GL028495, 2007.
Sarnthein, M., Van Kreveld, S., Erlenkeuser, H., Grootes, P. M., Kucera, M., Pflaumann, U., and Schulz, M.: Centinnal-to-millenial-scale periodicities of Holocene climate and sediment injections off the western Barents shelf, 75 N, Boreas, 32, 447–461, 2003.
Schaffer, J., von Appen, W. J., Dodd, P. A., Hofstede, C., Mayer, C., de Steur, L., and Kanzow, T.: Warm water pathways toward Nioghalvfjerdsfjorden Glacier, Northeast Greenland. J. Geophys. Res.-Oceans, 122, 4004–4020, 2017.
Schneider, W. and Budéus, G.: The northeast water polynya (Greenland Sea), Polar Biol., 14, 1–9, 1994.
Schneider, W. and Budéus, G.: Summary of the Northeast Water polynya formation and development (Greenland Sea), J. Marine Syst., 10, 107–122, 1997.
Seidenkrantz, M. S.: Cassidulina teretis Tappan and Cassidulina neoteretis new species (Foraminifera): stratigraphic markers for deep sea and outer shelf areas, J. Micropalaeontol., 14, 145–157, 1995.
Seidenkrantz, M. S.: Benthic foraminifera as palaeo sea-ice indicators in the subarctic realm – examples from the Labrador Sea – Baffin Bay region, Quaternary Sci. Rev., 79, 135–144, https://doi.org/10.1016/j.quascirev.2013.03.014, 2013.
Seidenkrantz, M. S., Aagaard-Sørensen, S., Sulsbrück, H., Kuijpers, A., Jensen, K. G., and Kunzendorf, H.: Hydrography and climate of the last 4400 years in a SW Greenland fjord: implications for Labrador Sea palaeoceanography, The Holocene, 17, 387–401, 2007.
Seidenkrantz, M. S., Roncaglia, L., Fischel, A., Heilmann-Clausen, C., Kuijpers, A., and Moros, M.: Variable North Atlantic climate seesaw patterns documented by a late Holocene marine record from Disko Bugt, West Greenland, Mar. Micropaleontol., 68, 66–83, 2008.
Seidenkrantz, M. S., Ebbesen, H., Aagaard-Sørensen, S., Moros, M., Lloyd, J. M., Olsen, J., Knudsen, M. F., and Kuijpers, A.: Early Holocene large-scale meltwater discharge from Greenland documented by foraminifera and sediment parameters, Palaeogeogr. Palaeocl., 391, 71–81, 2013.
Seidenkrantz, M.-S., Andersen, J. R., Andresen, K. J., Bendtsen, J., Brice, C., Ellegaard, M., Eriksen, L. N., Gariboldi, K., Le Duc, C., Mathiasen, A. M., Nielsen, T., Ofstad, S., Pearce, C., Rasmussen, T. L., Ribeiro, S., Rysgaard, S., Røy, H., Scholze, C., Schultz, M., and Wangner, D. J.: NorthGreen2017 – a Marine Research Expedition to NE Greenland Onboard `R/V 1029 Dana' September 17 to October 1, Cruise Report, Aarhus University, Aarhus, Denmark, 53 pp., 2018.
Seidenkrantz, M.-S., Kuijpers, A., Olsen, J., Pearce, C., Lindblom, S., Ploug, J., Przybyło, P., and Snowball, I.: Southwest Greenland shelf glaciation during MIS 4 more extensive than during the Last Glacial Maximum, Sci. Rep.-UK, 9, 15617, https://doi.org/10.1038/s41598-019-51983-3, 2019.
Ślubowska, M. A., Koç, N., Rasmussen, T. L., and Klitgaard-Kristensen, D.: Changes in the flow of Atlantic water into the Arctic Ocean since the last deglaciation: Evidence from the northern Svalbard continental margin, 80∘ N, Paleoceanography, 20, PA401, https://doi.org/10.1029/2005PA001141, 2005.
Ślubowska-Woldengen, M., Rasmussen, T. L., Koc, N., Klitgaard-Kristensen, D., Nilsen, F., and Solheim, A.: Advection of Atlantic Water to the western and northern Svalbard shelf since 17,500 cal yr BP, Quaternary Sci. Rev., 26, 463–478, 2007.
Solomina, O. N., Bradley, R. S., Hodgson, D. A., Ivy-Ochs, S., Jomelli, V., Mackintosh, A. N., Nesje, A., Owen, L. A., Wanner, H., Wiles, G. C., and Young, N. E.: Holocene glacier fluctuations, Quaternary Sci. Rev., 111, 9–34, https://doi.org/10.1016/j.quascirev.2014.11.018, 2015.
Stroeve, J. C., Serreze, M. C., Holland, M. M., Kay, J. E., Malanik, J., and Barrett, A. P.: The Arctic's rapidly shrinking sea ice cover: a research synthesis, Clim. Change, 110, 1005–1027, 2012.
Syring, N., Stein, R., Fahl, K., Vahlenkamp, M., Zehnich, M., Spielhagen, R. F., and Niessen, F.: Holocene changes in sea-ice cover and polynya formation along the eastern North Greenland shelf: New insights from biomarker records, Quaternary Sci. Rev., 231, 106173, https://doi.org/10.1016/j.quascirev.2020.106173, 2020a.
Syring, N., Lloyd, J. M., Stein, R., Fahl, K., Roberts, D. H., Callard, L., and O'Cofaigh, C.: Holocene Interactions Between Glacier Retreat, Sea Ice Formation, and Atlantic Water Advection at the Inner Northeast Greenland Continental Shelf, Paleoceanogr. Paleocl., 35, e2020PA004019, https://doi.org/10.1029/2020PA004019, 2020b.
Telesiński, M. M., Spielhagen, R. F., and Bauch, H. A.: Water mass evolution of the Greenland Sea since late glacial times, Clim. Past, 10, 123–136, https://doi.org/10.5194/cp-10-123-2014, 2014a.
Telesiński, M. M., Spielhagen, R. F., and Lind, E. M.: A high-resolution Lateglacial and Holocene palaeoceanographic record from the Greenland Sea, Boreas, 43, 273–285, 2014b.
Thornalley, D. J., Elderfield, H., and McCave, I. N.: Holocene oscillations in temperature and salinity of the surface subpolar North Atlantic, Nature, 457, 711–714, 2009.
Van Nieuwenhove, N., Pearce, C., Knudsen, M. F., Røy, H., and Seidenkrantz, M. S.: Meltwater and seasonality influence on Subpolar Gyre circulation during the Holocene, Palaeogeogr. Palaeocl., 502, 104–118, 2018.
Vare, L. L., Masse, G., Gregory, T. R., Smart, C. W., and Belt, S. T.: Sea ice variations in the central Canadian Arctic Archipelago during the Holocene, Quaternary Sci. Rev., 28, 1354–1366, 2009.
Vinje, T. E.: Sea Ice Conditions in the European Sector of the Marginal Seas of the Arctic 1966–75, 1975, Norwegian Polar Institut, 163–174, 1977.
Walker, M., Head, M. J., Berkelhammer, M., Björck, S., Cheng, H., Cwynar, L., Fisher, D., Gkinis, V., Long, A., Lowe, J., Newnham, R., Rasmussen, S. O., and Weiss, H.: Formal ratification of the subdivision of the Holocene Series/Epoch (Quaternary System/Period): two new Global Boundary Stratotype Sections and Points (GSSPs) and three new stages/subseries, Episodes, 41, 213–223, https://doi.org/10.18814/epiiugs/2018/018016, 2018.
Wangner, D. J., Jennings, A. E., Vermassen, F., Dyke, L. M., Hogan, K. A., Schmidt, S., Kjær, K. H., Knudsen, M. F., and Andresen, C. S.: A 2000-year record of ocean influence on Jakobshavn Isbræ calving activity, based on marine sediment cores, The Holocene, 28, 1731–1744, 2018.
Weatherall, P., Marks, K. M., Jakobsson, M., Schmitt, T., Tani, S., Arndt, J. E., Rovere, M., Chayes, D., Ferrini, V. and Wigley, R.: A new digital bathymetric model of the world's oceans, Earth Space Sci., 2, 331–345, 2015.
Weiss, H.: 4.2 ka BP megadrought and the Akkadian collapse, in: Megadrought and Collapse: from early agriculture to Angkor, edited by: Weiss, H., Oxford University Press, Oxford, 93–160, 2017.
Werner, K., Spielhagen, R. F., Bauch, D., Hass, H. C., and Kandiano, E.: Atlantic Water advection versus sea-ice advances in the eastern Fram Strait during the last 9 ka: Multiproxy evidence for a two-phase Holocene, Paleoceanography, 28, 283–295, 2013.
Werner, K., Müller, J., Husum, K., Spielhagen, R. F., Kandiano, E. S., and Polyak, L.: Holocene sea subsurface and surface water masses in the Fram Strait–Comparisons of temperature and sea-ice reconstructions, Quaternary Sci. Rev., 147, 194–209, 2016.
Wilson, N. J. and Straneo, F.: Water exchange between the continental shelf and the cavity beneath Nioghalvfjerdsbræ (79 North Glacier), Geophys. Res. Lett., 42, 7648–7654, 2015.
Wollenburg, J. E. and Kuhnt, W.: The response of benthic foraminifers to carbon flux and primary production in the Arctic Ocean, Mar. Micropaleontol., 40, 189–231, 2000.
Wollenburg, J. E. and Mackensen, A.: Living benthic foraminifera from the central Arctic Ocean: Faunal composition, standing stock and diversity, Mar. Micropaleontol., 34, 153–185, 1998.
Zehnich, M., Spielhagen, R. F., Bauch, H. A., Forwick, M., Hass, H. C., Palme, T., Stein, R., and Syring, N.: Environmental variability off NE Greenland (western Fram Strait) during the past 10,600 years, The Holocene, 30, 1752–1766, 2020.