the Creative Commons Attribution 4.0 License.
the Creative Commons Attribution 4.0 License.
 | 25 Mar 2021
Reconstructing past hydrology of eastern Canadian boreal catchments using clastic varved sediments and hydro-climatic modelling: 160 years of fluvial inflows
Antoine Gagnon-Poiré
Pierre Brigode
Pierre Francus
David Fortin
Patrick Lajeunesse
Hugues Dorion
Annie-Pier Trottier
Analysis of short sediment cores collected in Grand Lake, Labrador, revealed that this lake is an excellent candidate for the preservation of a laminated sediment record. The great depth of Grand Lake, the availability of fine sediments along its tributaries and its important seasonal river inflow have favoured the formation of a 160-year-long clastic varved sequence. Each varve represents 1 hydrological year. Varve formation is mainly related to spring discharge conditions with contributions from summer and autumn rainfall events. The statistically significant relation between varve parameters and the Naskaupi River discharge observations provided the opportunity to develop local hydrological reconstructions beyond the instrumental period. The combined detrital layer thickness and the particle size (99th percentile) series extracted from each varve yield the strongest correlations with instrumental data (r=0.68 and 0.75 respectively) and have been used to reconstruct the respective Naskaupi River mean and maximum annual discharges over the 1856–2016 period. The reconstructed Q-mean series suggest that high Q-mean years occurred during the 1920–1960 period, and a slight decrease in Q-mean took place during the second half of the 20th century. Independent reconstructions based on rainfall–runoff modelling of the watershed from historical reanalysis of global geopotential height fields display a significant correlation with the reconstructed Naskaupi River discharge based on varve physical parameters. The Grand Lake varved sequence contains a regional hydrological signal, as suggested by the statistically significant relation between the combined detrital layer thickness series and the observed Labrador region Q-mean series extracted from five watersheds of different sizes.
- Article
(24856 KB) - Full-text XML
-
Supplement
(3492 KB) - BibTeX
- EndNote


Climate changes caused by rising concentrations of greenhouse gases can alter hydro-climatic conditions on inter- and intra-regional scales (Linderholm et al., 2018; Ljungqvist et al., 2016; Stocker et al., 2014). Hydropower, which is considered as a key renewable energy source to mitigate global warming, has strong sensitivity to changes in hydrological regime, especially in vulnerable northern regions (Cherry et al., 2017). Therefore, a clear understanding of the regional impacts that recent climate change combined with natural climate variability can have on river discharge and hydroelectric production is needed. However, the lack of instrumental records and the uncertainty related to hydroclimate variability projections (Collins et al., 2013) are obstacles to sustainable management of these water resources.
The Labrador region in eastern Canada is a critical area for hydropower generation, hosting the Churchill River hydroelectric project, one of the largest hydropower systems in the world. Average annual streamflow has been variable in eastern Canada during the last 50 years, with higher river discharges from 1970 to 1979 and from 1990 to 2007, and lower discharges from 1980 to 1989 (Mortsch et al., 2015; Déry and Wood, 2005; Jandhyala et al., 2009; Sveinsson et al., 2008; Zhang et al., 2001). These changes in streamflow represent a significant economic challenge for the long-term management of hydropower generation. The few decades of available instrumental observations (<60 years) and their low spatial coverage are not sufficient to allow for a robust analysis of multi-decadal hydrological variability.
The study of multi-decadal hydrological variability requires long instrumental records (>100 years), but such long-time series are non-existent for the Labrador region. Recently, rainfall–runoff modelling approaches have been used to expand instrumental streamflow datasets, using long-term climatic reanalysis as inputs. Rainfall–runoff modelling was used by Brigode et al. (2016) to reconstruct daily streamflow series over the 1881–2011 period in northern Quebec. Nevertheless, this type of method suffers from limited observations with respect to evaluating and validating the reconstructed hydro-climatic temporal series. The deficiency in observations led to the exploration of various natural archives for reconstructing past hydro-climatic conditions. Long hydro-climatic series based on natural proxies in eastern Canada are rare, limited to a tree ring (Boucher et al., 2017; Bégin et al., 2015; Naulier et al., 2015; Nicault et al., 2014; Boucher et al., 2011; Bégin et al., 2007; D'Arrigo et al., 2003) and pollen datasets (Viau and Gajewski, 2009), and have mainly focused on temperature reconstructions. Reconstructing river hydrological series using dendrological analysis is complex in the boreal region due to the indirect relation between tree ring indicators and streamflow. One study has reconstructed streamflow variations over the last 2 centuries in Labrador based on tree-ring isotopes series (Dinis et al., 2019). Still, the spatial coverage of palaeohydrological records from independent proxies must be increased in this region. From this perspective, annually laminated sediments composed of minerogenic particles (clastic varves) formed when seasonal runoff carrying suspended sediment enters a lake (Sturm, 1979) have the potential to produce long palaeohydrological series. The direct relationship between clastic varves and hydrological conditions makes this type of varve a specific and powerful proxy for streamflow reconstructions. Clastic varves can provide, in favourable settings, annually to seasonally resolved information about downstream sediment transport from a catchment area into a lake basin depending on regional hydro-climatic conditions (Lamoureux, 2000; Lamoureux et al., 2006; Tomkins et al., 2010; Cuven et al., 2011; Kaufman et al., 2011; Schillereff et al., 2014; Amann et al., 2015; Heideman et al., 2015; Zolitschka et al., 2015; Saarni et al., 2016; Czymzik et al., 2018).
Preliminary analysis of short sediment cores collected in Grand Lake, central Labrador, revealed that this lake is an excellent candidate for the preservation of the recent fluvial clastic laminated sediment record (Zolitschka et al., 2015). The objectives of this paper are to (1) confirm the annual character of the laminations record, (2) establish the relation between the physical parameters of laminations and local hydrological conditions to examine the potential proxy for hydrological reconstructions, (3) reconstruct the hydrology of the last 160 years and compare its similarities and differences with Brigode et al. (2016) rainfall–runoff modelling over the 1880–2011 period, and (4) determine if there is a Labrador regional streamflow signal recorded in Grand Lake laminated sediments.
Grand Lake is a 245 m deep (Trottier et al., 2020) elongated (60 km long) fjord lake located in a valley connected to the Lake Melville graben in central Labrador (53∘41′25.58′′ N, 60∘32′6.53′′ W; ∼15 m above sea level) (Fig. 1). The region is part of the Grenville structural province and is dominated by Precambrian granite, gneiss and acidic intrusive rocks. Grand Lake watershed deglaciation began after ∼8.2 ka cal BP (Trottier et al., 2020). During deglaciation, the marine limit reached an elevation of 120–150 m above modern sea level and invaded further upstream in the modern fluvial valleys that are connected to the lake (Fizthugh, 1973). This former glaciomarine/marine sedimentary fjord basin has been glacio-isostatically uplifted and isolated by a morainic sill to become a deep fjord lake (Trottier et al., 2020). The regional geomorphology is characterized by glacially sculpted bedrock exposures, glacial deposits consisting of till plateaus of various elevations, glacial lineations, drumlins, kames, eskers and raised beaches (Fulton, 1986). Podzolic soils dominate, with inclusions of brunisols and wetlands.
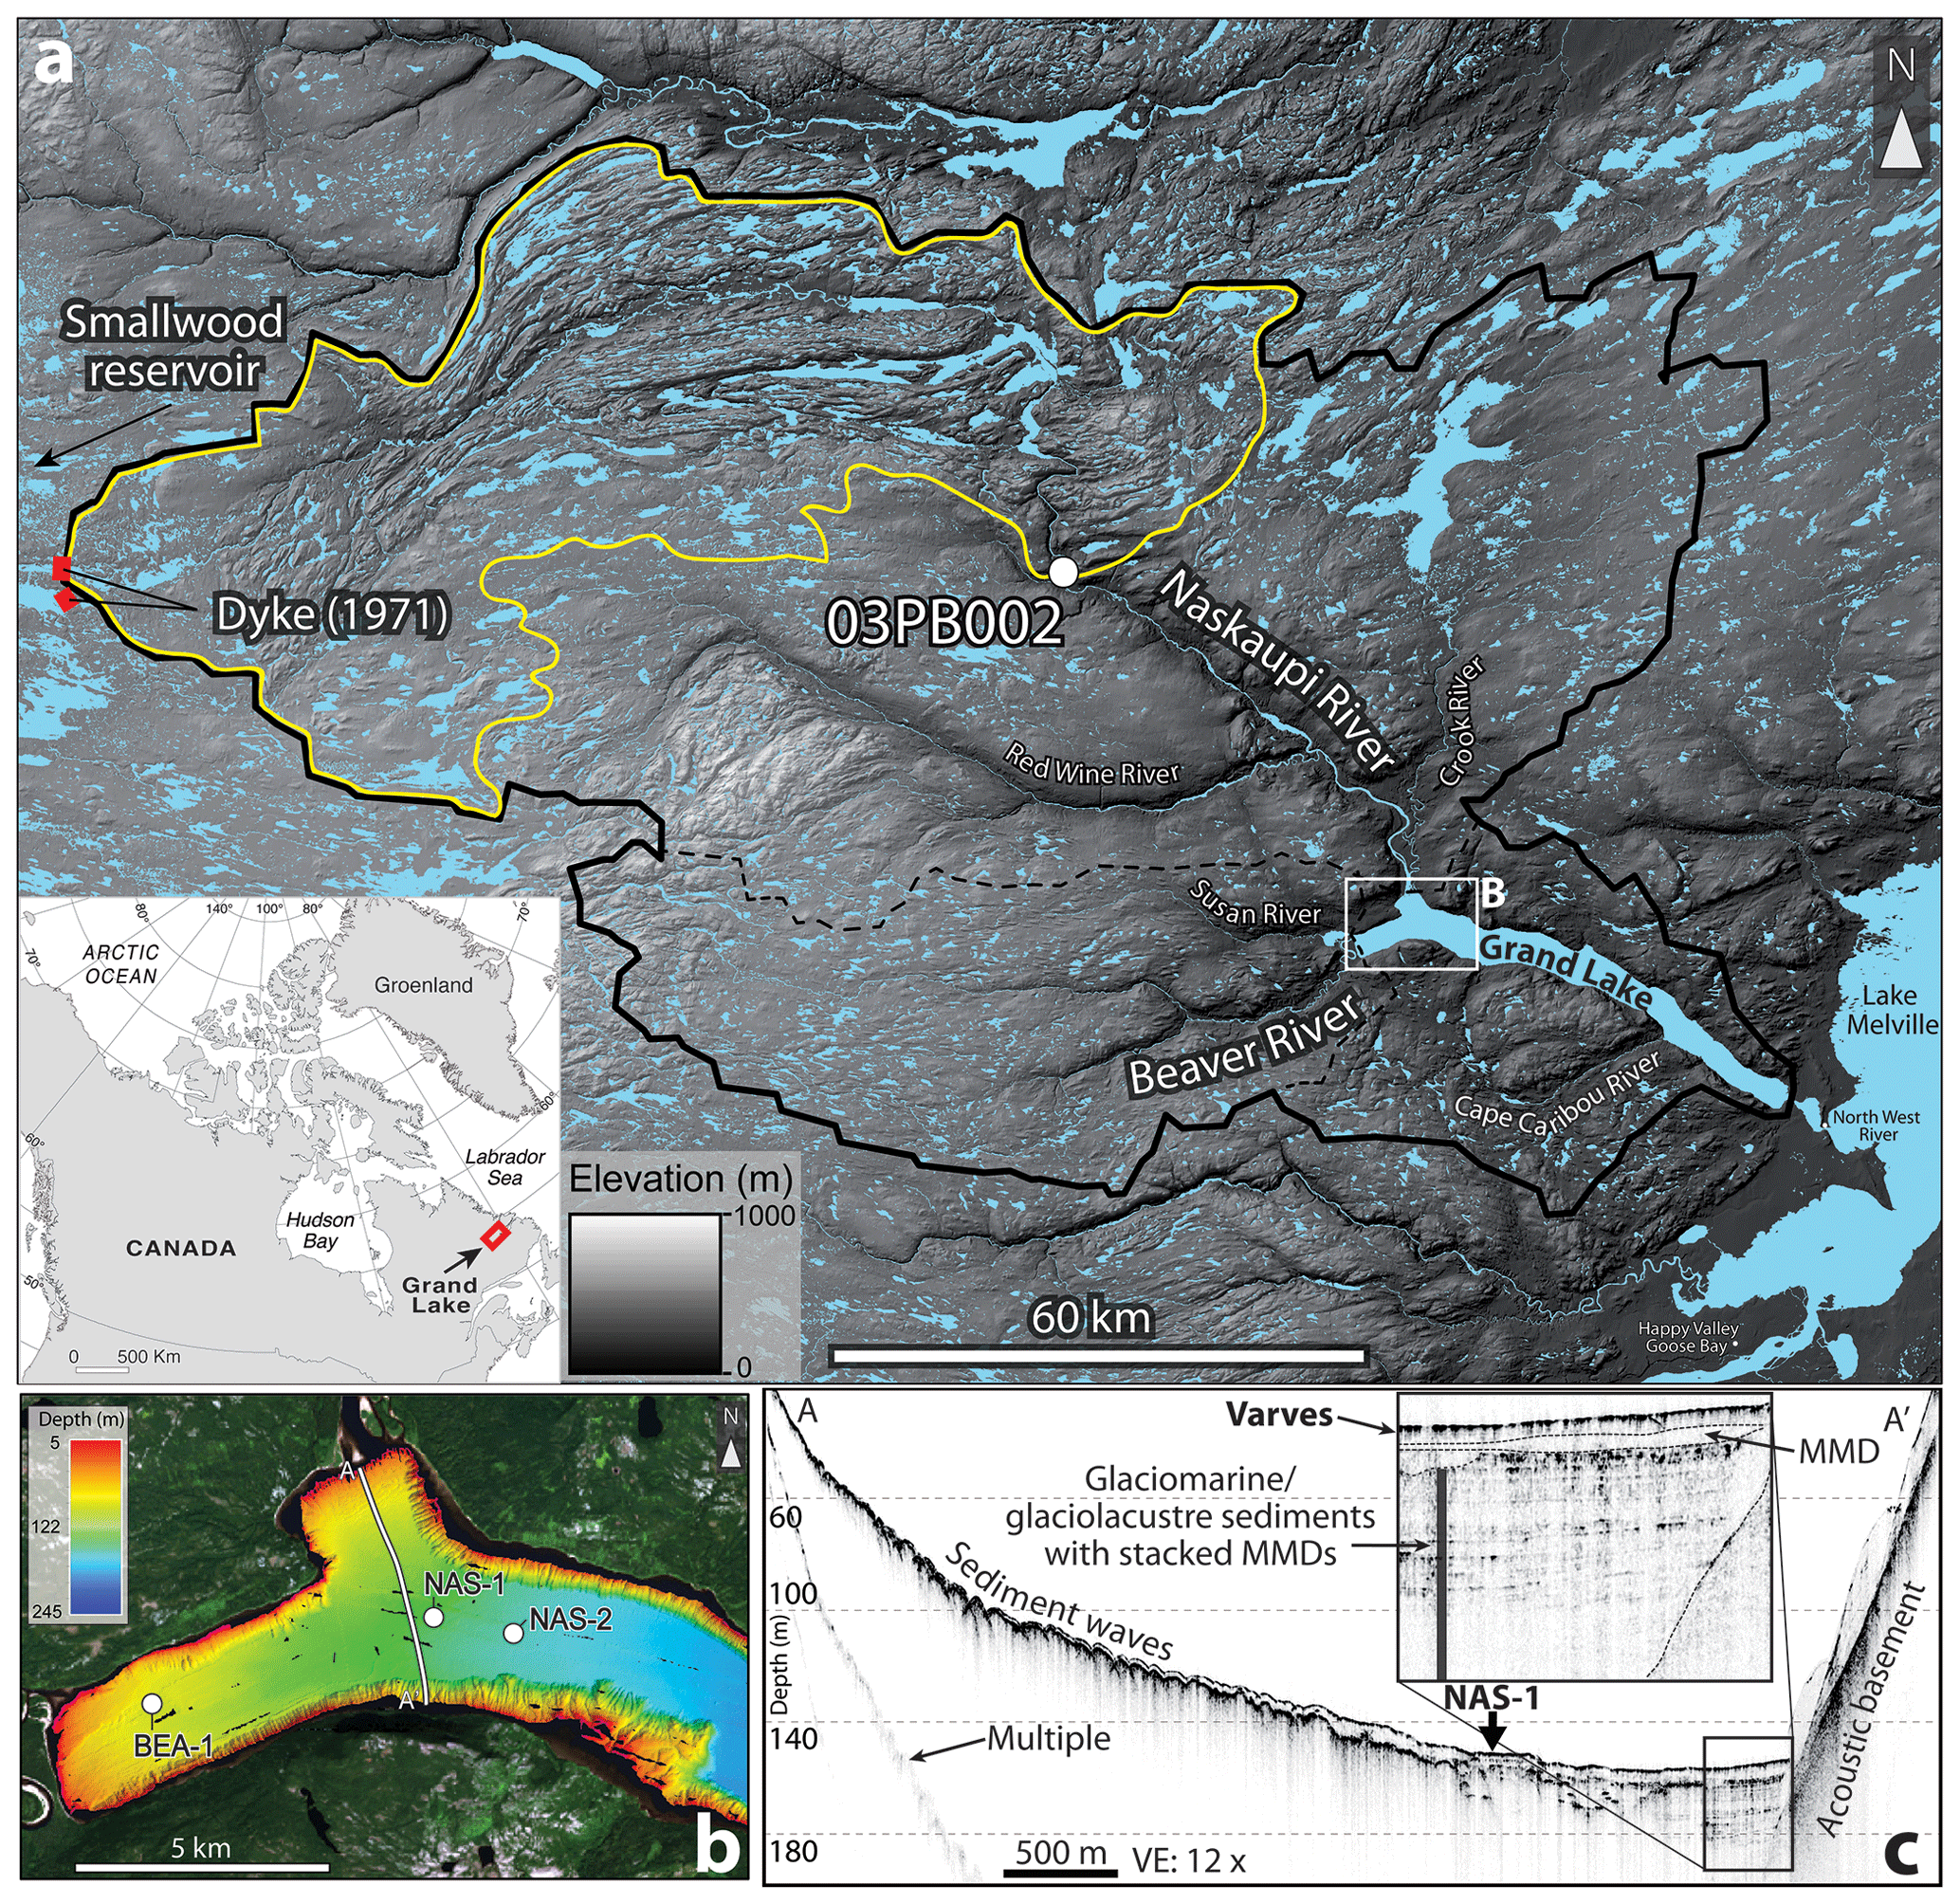
Figure 1(a) Location of the Grand Lake watershed (black line) and its principal tributaries. The Naskaupi River hydrometric station (03PB002, white dot) covering an area of 4480 km2 (yellow line). The locations of the dykes constructed in 1971 to divert water from the Naskaupi River to the Smallwood Reservoir hydroelectric system are also shown by the red bars. (b) High-resolution swath bathymetry (1 m resolution) of Grand Lake (Trottier et al., 2020) coupled with a Landsat image (USGS) and core site locations. The white line indicates the location of (c) a typical 3.5 kHz sub-bottom profile of the Naskaupi River delta (A–A′) showing the approximate location of core NAS-1. MMD denotes a mass movement deposit.
Grand Lake is located in the high boreal forest ecoregion, one of the most temperate climates in Labrador, hosting mixed forests dominated by productive, closed stands of Abies balsamea, Picea mariana, Betula papyrifera and Populus tremuloides (Riley et al., 2013). This region is influenced by temperate continental (westerly and southwesterly winds) and maritime (Labrador Current) conditions with cool humid summers (June, July and August) (∼8.5 ∘C) and cold winters (December, January, February and March) ( ∘C). The Grand Lake watershed extends upstream over the low subarctic Nipishish–Goose ecoregion, a broad bedrock plateau (<700 m a.s.l.) located on the west flank of the Lake Melville lowlands. Lichen-rich Picea woodlands with open canopies predominate. With cooler summers and longer cold winters, this area is slightly influenced by the Labrador Sea. Mean annual precipitation in the study region ranges from 800 to 1000 mm, with 400 to 500 cm of snowfall. The regional hydrological regime typically exhibits winter low flow and spring freshet, followed by summer flow recession (Fig. 2). Snowmelt in the Grand Lake region takes place from April to June.
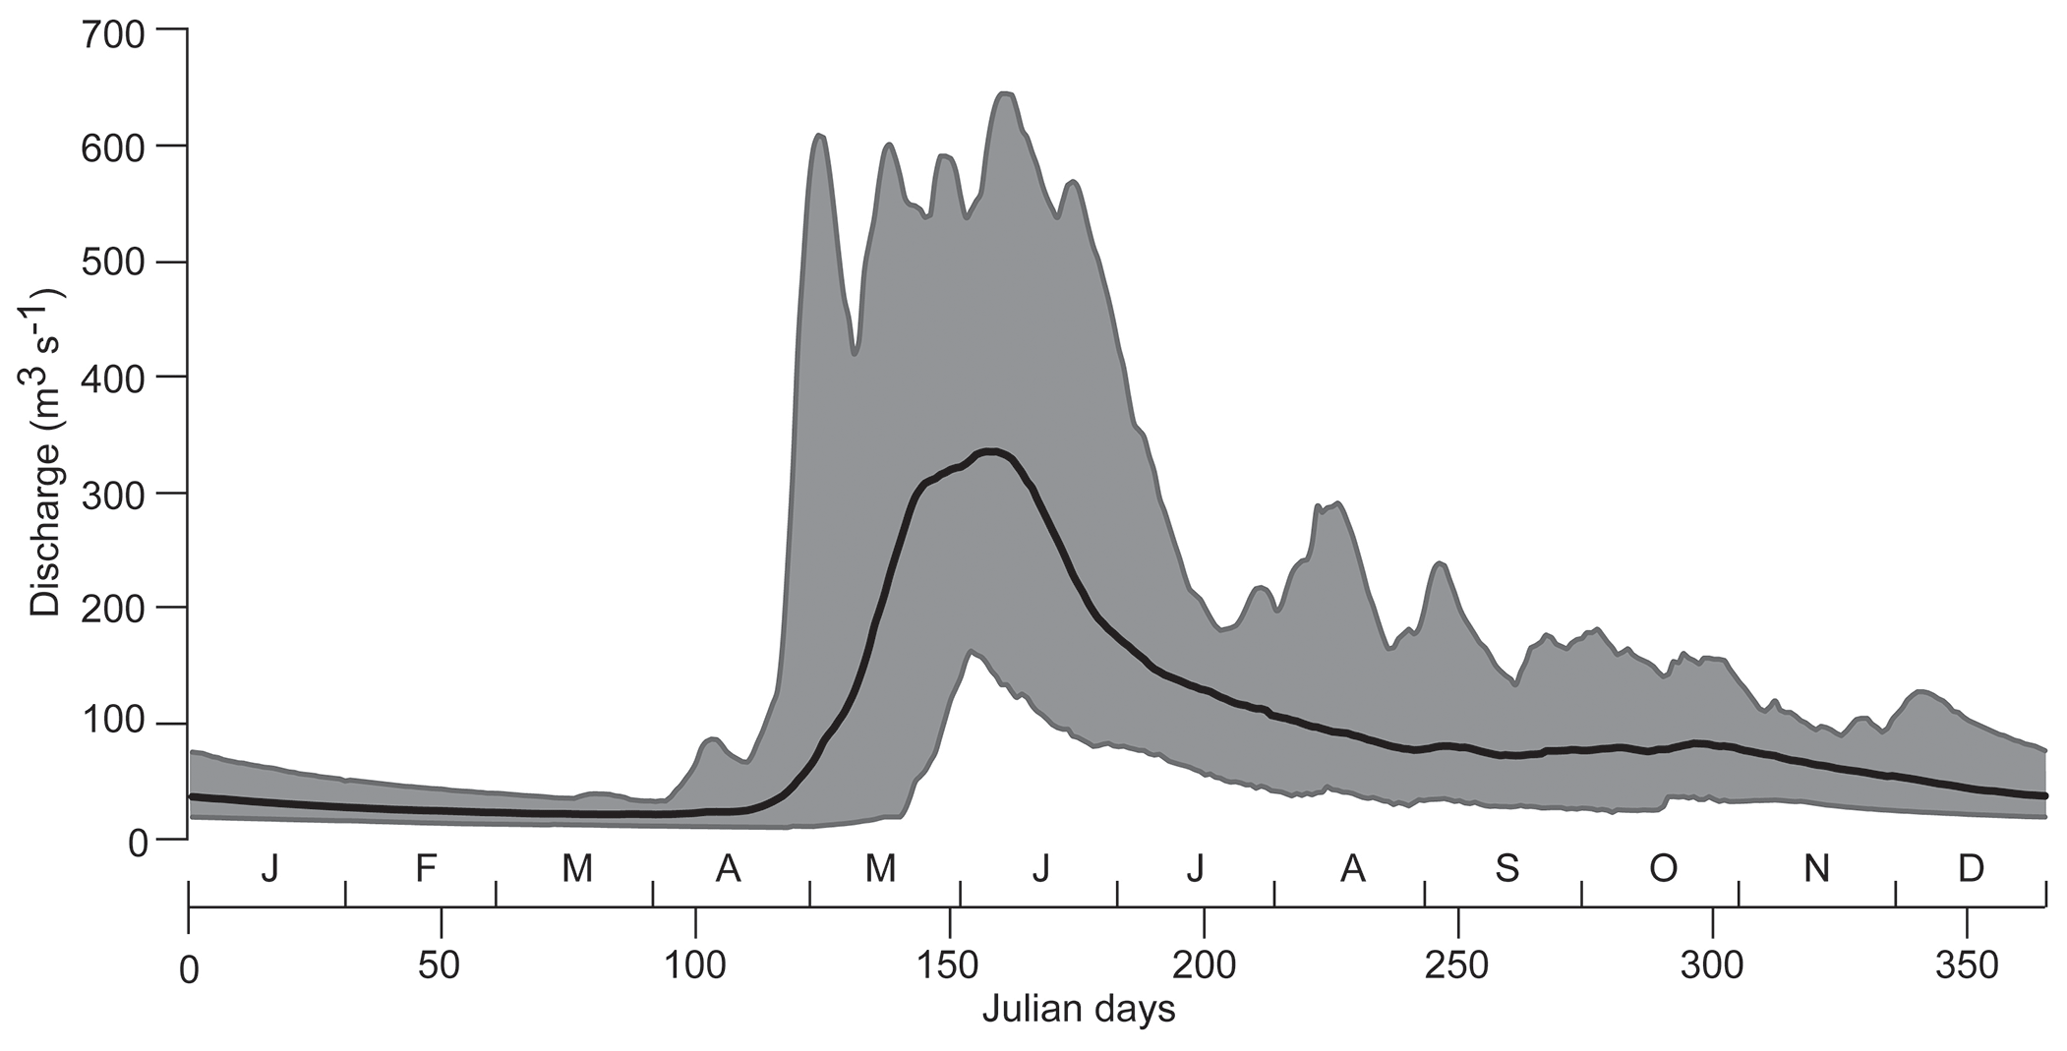
Figure 2Observed mean daily discharges of the Naskaupi River (hydrometric station 03PB002) for the 1978–2012 period (black line). The grey zone represents the minimum and maximum observed discharges.
The main tributary of Grand Lake is the Naskaupi River located at the lake head (Fig. 1a). The downstream part of the Naskaupi River is fed by the Red Wine and the Crook rivers. The Beaver River is the secondary tributary of Grand Lake. The Naskaupi and Beaver river structural valleys that connect to the Grand Lake Basin have a well-developed fluvial plain and a generally sinuous course that remobilize former deltaic systems and terraces composed of glaciomarine, marine, fluvio-glacial, lacustrine and modern fluvial deposits. Upstream river terraces show mass movement scarps and are affected by gully and aeolian activity. Grand Lake flows into a small tidal lake (Little Lake) and subsequently towards Lake Melville. On 28 April 1971, by closing a system of dykes, the headwaters of Naskaupi River watershed (Lake Michikamau) were diverted into the Churchill River hydropower development (Fig. 1a). This diversion has reduced the drainage area of the Naskaupi River from 23 310 to 12 691 km2 (Anderson, 1985).
Hydroacoustic data were collected in Grand Lake in 2016 (Trottier et al., 2020). The swath bathymetric imagery and 3.5 kHz sub-bottom profile show that the prodelta slopes present well-defined sediment waves at the Naskaupi River mouth (Trottier et al., 2020; Fig. 1b). The upper acoustic unit is composed of a high-amplitude acoustic surface changing into low-amplitude acoustic parallel reflections (Fig. 1c), a type of acoustic facies which can be associated with successive sedimentary layers of contrasting particle sizes (Gilbert and Desloges, 2012).
3.1 Sediment coring and processing
Four short sediment cores (BEA-1, NAS-1A, NAS-1B and NAS-2) were collected using a UWITEC percussion corer in March 2017 that was deployed from the lake ice cover. These cores were collected in undisturbed areas according to the swath bathymetry and sub-bottom profiling data (Trottier et al., 2020). Core BEA-1 was collected at the axis of the Beaver River at a depth of 93 m. Core NAS-1 was collected at the axis of the Naskaupi River at a depth of 146 m (Fig. 1b). BEA-1 and NAS-1 were collected from locations sharing relative similarities: at the distal frontal slope of the Beaver and Naskaupi river deltas (Fig. 1c). NAS-2 was collected away from the Naskaupi River delta, at a depth of 176 m at the beginning of the deep lake basin. The site where NAS-2 was collected is mainly fed by sediments from the Naskaupi River, but it is also in a distal position to the Beaver River. Duplicate cores of different lengths have been retrieved at each site to maximize undisturbed sediment recovery. Following the extraction of each core, wet floral foam was gently inserted through the top of the filled coring tube and slowly pushed towards the sediment surface to seal and preserve the sediment–water interface. A plastic cap was then installed on top of the foam to secure its position in contact with the intact sediment surface and avoid disturbance during transport of the cores. The cores were scanned using a Siemens SOMATOM Definition AS + 128 medical CT scanner at the Multidisciplinary Laboratory of CT Scan for Non-medical Use of the Institut National de la Recherche Scientifique–Eau Terre Environnement (INRS-ETE). The CT scan images allowed the identification of sedimentary structures (i.e., laminated facies, perturbation and hiatus). Expressed as CT numbers or Hounsfield units (HU), X-Ray attenuation is a function of density and the effective atomic number and, hence, sensitive to contrasts in mineralogy, grain size and sediment porosity (St-Onge et al., 2007). CT numbers were extracted at a resolution of 0.06 cm using the ImageJ software 2.0.0 (http://imagej.net, last access: 22 June 2017). The cores were then opened, described and photographed with a high-resolution line-scan camera mounted on an ITRAX core scanner (RGB colour images, 50 µm pixel size) at INRS-ETE. Geochemical non-destructive X-Ray fluorescence (XRF) analysis was performed on the core half (30 kV and 30 mA). XRF element profiles were used to visualize the structures and boundaries of the laminations and estimate particle size variability in sediment cores (Kylander et al., 2011; Cuven et al., 2010; Croudace et al., 2006). Elements were normalized by the total counts per second (cps) for each spectrum. Continuous XRF measurements were also carried out on overlapping impregnated sediment blocks in order to superpose element relative intensity profiles on thin sections.
3.2 Chronology and thickness measurement
Surface sediments from cores BEA-1 and NAS-1A were dated with the Cesium-137 (137Cs) method (Ritchie and McHenry, 1990) using a high-resolution germanium diode gamma detector and multichannel analyzer gamma counter. The 137Cs activity was used to identify sediment deposited during the 1963–1964 peak of nuclear tests and validate the annual character of the layers. A sampling interval of 2 cm was used to approximately identify the depth at which the 137Cs peaks were located. Subsequently, a sampling interval of ±0.5 cm was used to sample each lamination for the 1961–1965 period to determine the exact 137Cs peak location (1963–1964). In order to establish a chronology for each core, detailed lamination counts were executed on CT scan images and high-resolution photographs using the ImageJ 2.0.0 and Adobe Illustrator CC software packages (Francus et al., 2002b). As all of the core surface has been well preserved, the first complete lamination below the sediment surface was considered to represent the topmost year (i.e., 2016 CE). Chronology on each core was confirmed by cross-correlation between thick laminations selected as distinctive marker layers along the different sediment sequences (A to M; Fig. 4).
Thin sections of sediments were sampled from cores BEA-1 (1856-2016), NAS-1A (1953–2016), NAS-1B (1856–1952) and NAS-2 (1968–2016) (see Fig. 4 for thin section locations) following Francus and Cosby (2001) and Lamoureux (1994). Digital images of the thin sections were obtained using a transparency flatbed scanner at 2400 dpi resolution (1 pixel = 10.6 µm) in plain light and were used to characterize lamination substructure. Lamination counts and thickness measurements using a thin section image analysis software developed at INRS-ETE (Francus and Nobert, 2007) were performed to duplicate and validate previous chronologies established on CT scan images and high-resolution photographs. Two counts were made from thin section by the same observer (Antoine Gagnon-Poiré). The total varve thickness (TVT) and detrital layer thickness (DLT) of each year of sedimentation were measured from images of thin sections. Lamination counts made on CT scan images, high-resolution photographs and thin sections are identical, whereas TVT measurements show negligible difference (R2=0.96; p<0.05). The thickness measurements made from CT scan images and high-resolution photographs have been used to prolong the TVT series of core NAS-2 from 1968 back to 1856. Continuous TVT measurements allowed the establishment of high-resolution age–depth models for each site.
3.3 Image and particle size analysis
Using custom-made image analysis software (Francus and Nobert, 2007), regions of interest (ROIs) were selected on the thin section images. The software then automatically yielded scanning electron microscope (SEM) images of the ROIs using a Zeiss EVO 50 SEM in backscattered electron (BSE) mode. Eight-bit greyscale BSE images with a resolution of 1024 × 768 pixels were obtained with an accelerating voltage of 20 kV, a tilt angle of 6.1 and an 8.5 mm working distance with a pixel size of 1 µm. BSE images were processed to obtain black and white images where clastic grains (>3.5 µm) and clay matrix appeared in black and white respectively (Francus, 1998).
Each sedimentary particle (an average of 2225 particles per image) was measured according to the methodology used by Lapointe et al. (2012), Francus et al. (2002a) and Francus and Karabanov (2000) in order to calculate the particle size distribution on each ROI image. Due to the thickness of the laminations, results from several ROI images were merged to obtain measurements for each year of sedimentation, with an average of four images per lamination. Only clastic facies related to spring and summer discharges were used for particle size analysis in order to exclude ice-rafted debris (micrometre to millimetre scale) observed in the early spring layers (see Fig. 5 for details). The 99th percentile (P99D0) of the particle size distribution for each detrital layer was obtained from thin sections (Francus, 1998) for the last 160 years (1856–2016) for cores BEA-1 and NAS-1, and for the last 47 years (1968–2016) for core NAS-2, from 795, 717 and 132 BSE images respectively (Fig. 4).
3.4 Hydrological variables
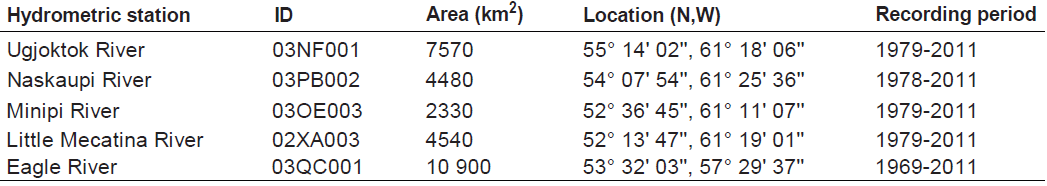
Hydrological variables (Table 1) were calculated from the time series of daily discharges recorded by the Naskaupi River hydrometric station over the 1978–2011 period (missing data from the years 1996, 1997 and 1998).

The Naskaupi River hydrological variables have been compared with four other hydrometric stations' data available around the study region (Fig. 3a, Table 2), which are devoid of anthropogenic perturbations. Q-mean series from the five stations have been normalized for the common 1979–2011 period and averaged in order to produce a Labrador region mean annual discharge series. This allows one to extend instrumental data series for the period from 1969 to 2011 and to fill in data for the missing years. The Labrador hydrometric station data used in this study come from a Government of Canada website (https://wateroffice.ec.gc.ca, last access: 12 May 2018).
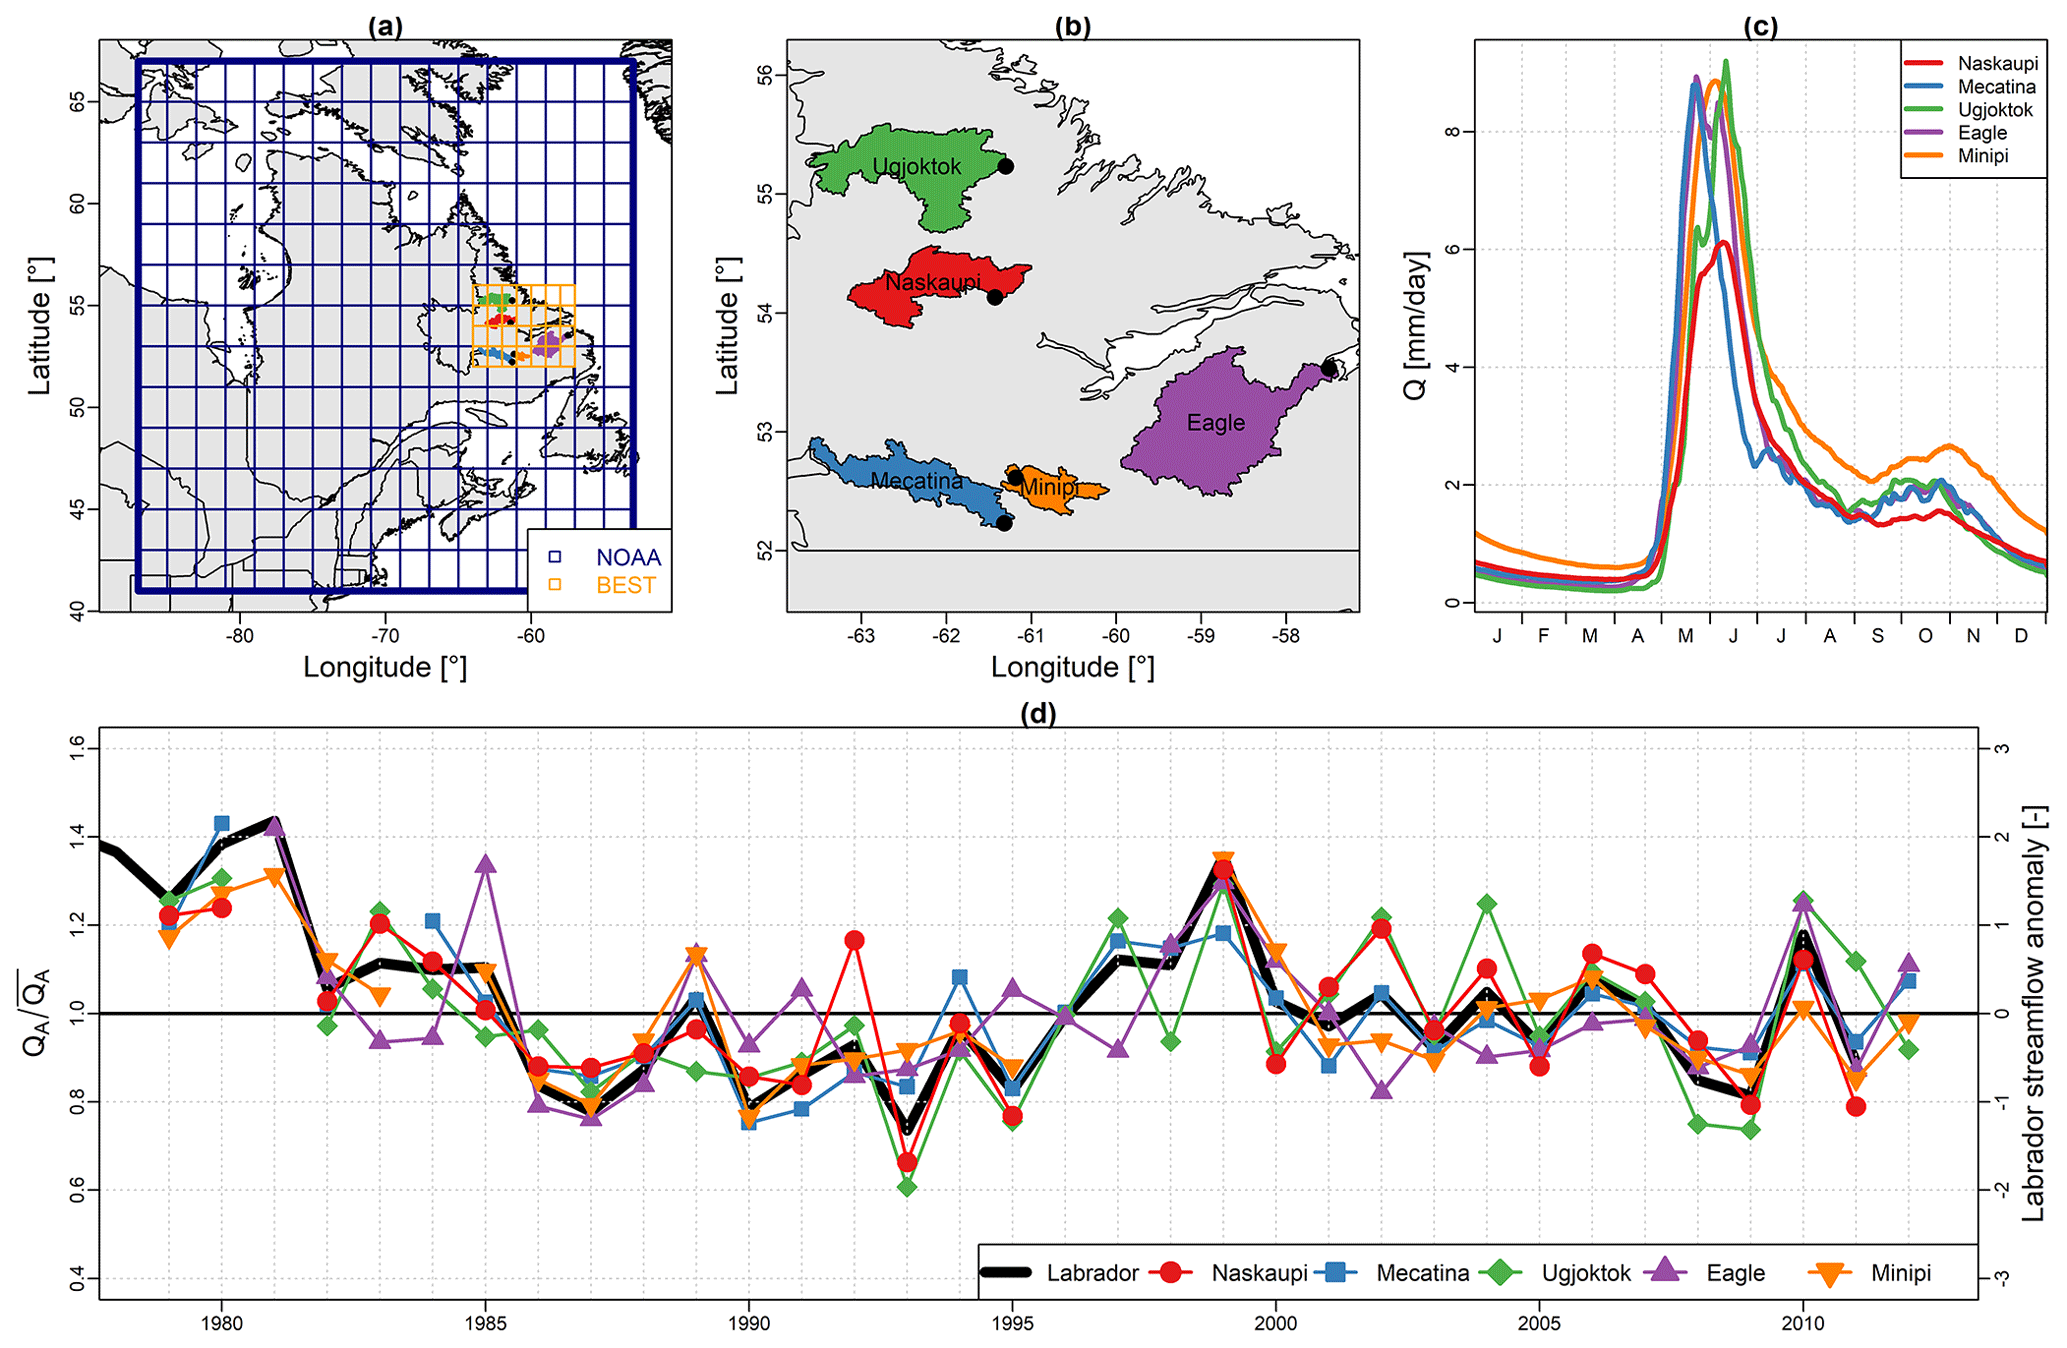
Figure 3(a) Dataset used for the hydro-climatic reconstruction based on rainfall–runoff modelling: the extension of the 20CR grid used is shown in blue, and the BEST grid used is highlighted in orange. (b) Spatial distribution of hydrometric stations used in this study (black dots) and their catchment areas. (c) Observed mean daily discharges of each hydrometric station for the 1978–2012 period. (d) Labrador streamflow anomaly and the Labrador region mean annual discharge series (thick black line).
3.5 Varve physical parameters and hydrological variables
A simple linear regression model was used to fit the DLT and P99D0 series with local (1978–2011) and regional (1969–2011) instrumental series and reconstructed hydrological variables (Q-mean, Q-max) back to 1856. Model calibration was performed using a twofold cross-validation technique over the instrumental period. Root mean squared errors (RMSE) and coefficients of determination (R2) were calculated for calibration periods, and the average reduction of error (RE) and average coefficient of efficiency (CE) were calculated to evaluate reconstruction skills (Briffa et al., 1988; Cook et al., 1999). The RE and CE of the verification periods must be >0 to validate the model skill. Statistical analysis was realized using the “treeclim” package (Zang and Biondi, 2015) in the R project environment (R Core Team, 2019, http://www.r-project.org/, last access: 15 January 2019).
3.6 Hydro-climatic reconstruction based on rainfall–runoff modelling
The applied reconstruction method is based on rainfall–runoff modelling. Firstly, it aims at producing, for the Naskaupi River hydrometric station catchment (Fig. 1a), daily climatic time series using a historical reanalysis of global geopotential height fields extracted over the studied region for a given time period (here 1880–2011). Secondly, the produced climatic series are used as inputs to a rainfall–runoff model previously calibrated on the studied catchment in order to obtain daily streamflow time series. The reconstruction method is fully described in Brigode et al. (2016) and was recently applied over southeastern Canadian catchments in Dinis et al. (2019). It is summarized in the following paragraphs.
The available observed hydro-climatic series for the Naskaupi River hydrometric station catchment have been aggregated at the catchment scale. Climatic series (daily air temperature and precipitation) have been extracted from the CANOPEX dataset (Arsenault et al., 2016), built using Environment Canada weather stations and Thiessen polygons to calculate climatic series at the catchment scale. Daily air temperature series have been used to calculate daily potential evapotranspiration at the catchment scale, via the Oudin et al. (2005) formula designed for rainfall–runoff modelling.
These daily series have been used to calibrate the GR4J rainfall–runoff model (Perrin et al., 2003) and its snow accumulation and melting module, CemaNeige (Valéry et al., 2014a), using the airGR package (Coron et al., 2017). This combination of GR4J and CemaNeige (hereafter denoted CemaNeigeGR4J) has been recently applied over eastern Canadian catchments and showed good modelling performance (e.g., Seiller et al., 2012; Valéry et al., 2014b, Brigode et al., 2016). CemaNeigeGR4J has been calibrated on the recorded period of the Naskaupi River hydrometric station catchment using the Kling–Gupta efficiency criterion (Gupta et al., 2009) as the objective function.
The observed climatic series have then been resampled over the 1880–2011 period, based on both season and similarity of geopotential height fields (Kuentz et al., 2015). The resampling is performed by calculating Teweles and Wobus (1954) distances between four geopotential height fields: (i) 1000 hPa at 0 h, (ii) 1000 hPa at 24 h, (iii) 500 hPa at 0 h and (iv) 500 hPa at 24 h. The NOAA 20th Century Reanalysis ensemble (Compo et al., 2011; hereafter denoted 20CR) has been used as a source of geopotential height fields (Fig. 3b).
As in Brigode et al. (2016), the resampled series of air temperature have been corrected at the catchment scale using a regression model calibrated with the Berkeley Earth Surface Temperature analysis (Rohde et al., 2013; hereafter denoted BEST). BEST is a gridded air temperature product starting in 1880 at the daily time step (Fig. 3b).
Finally, the daily climatic series are used as inputs to the CemaNeigeGR4J model in order to obtain daily streamflow time series on the same 1880–2011 period. Thus, the outputs of the hydro-climatic reconstruction are an ensemble of daily meteorological series (air temperature, potential evapotranspiration and precipitation) and an ensemble of daily streamflow series.
4.1 Lamination characterization
Sediment retrieved at the head of Grand Lake (Fig. 4) consist of dark greyish to dark yellowish brown (Munsell colour: 10YR-4/2 to 10YR-4/4) laminated minerogenic material, interpreted as clastic lamination of fluvial origin. Lamination structure can be divided in three seasonal layers (Fig. 5) based on their stratigraphic position and microfacies. Annual sedimentation starts with a layer composed of silt and clay sediment matrix which sometimes contains ice-rafted debris (micrometre to millimetre scale) interpreted as an early spring layer. The major lamination component is a spring and summer/autumn detrital layer. Its thick basal part is mostly poorly sorted, graded and composed of coarse minerogenic grains comprising fine sand and silts (<150 µm) with some redeposited cohesive sediment clasts eroded from the underlying early spring layer. This detrital layer has a sharp lower boundary. The upper part of the detrital layer consists of a finer detrital grain matrix containing thin visually coarser intercalated sub-layers in ∼75 % of the laminations. The allochthonous lithoclastic materials which compose the detrital layers are associated with higher density values (Fig. 4) and an increase in the relative intensity of the Sr and Ca elements (Zolitschka et al., 2015). Little organic debris and few charcoal fragments are observed throughout the detrital layers. The third topmost lamination layer is formed by a fine to medium silty layer with abundant clay rich in Fe and interpreted as an autumn and winter layer, also known as a clay cap (Zolitschka et al., 2015). Hence, the Fe peak values in autumn and winter layers are used to determine the upper lamination boundary (Fig. 4) (Zolitschka et al., 2015), as previously performed in other varved sequences (Cuven et al., 2010; Saarni et al., 2016).
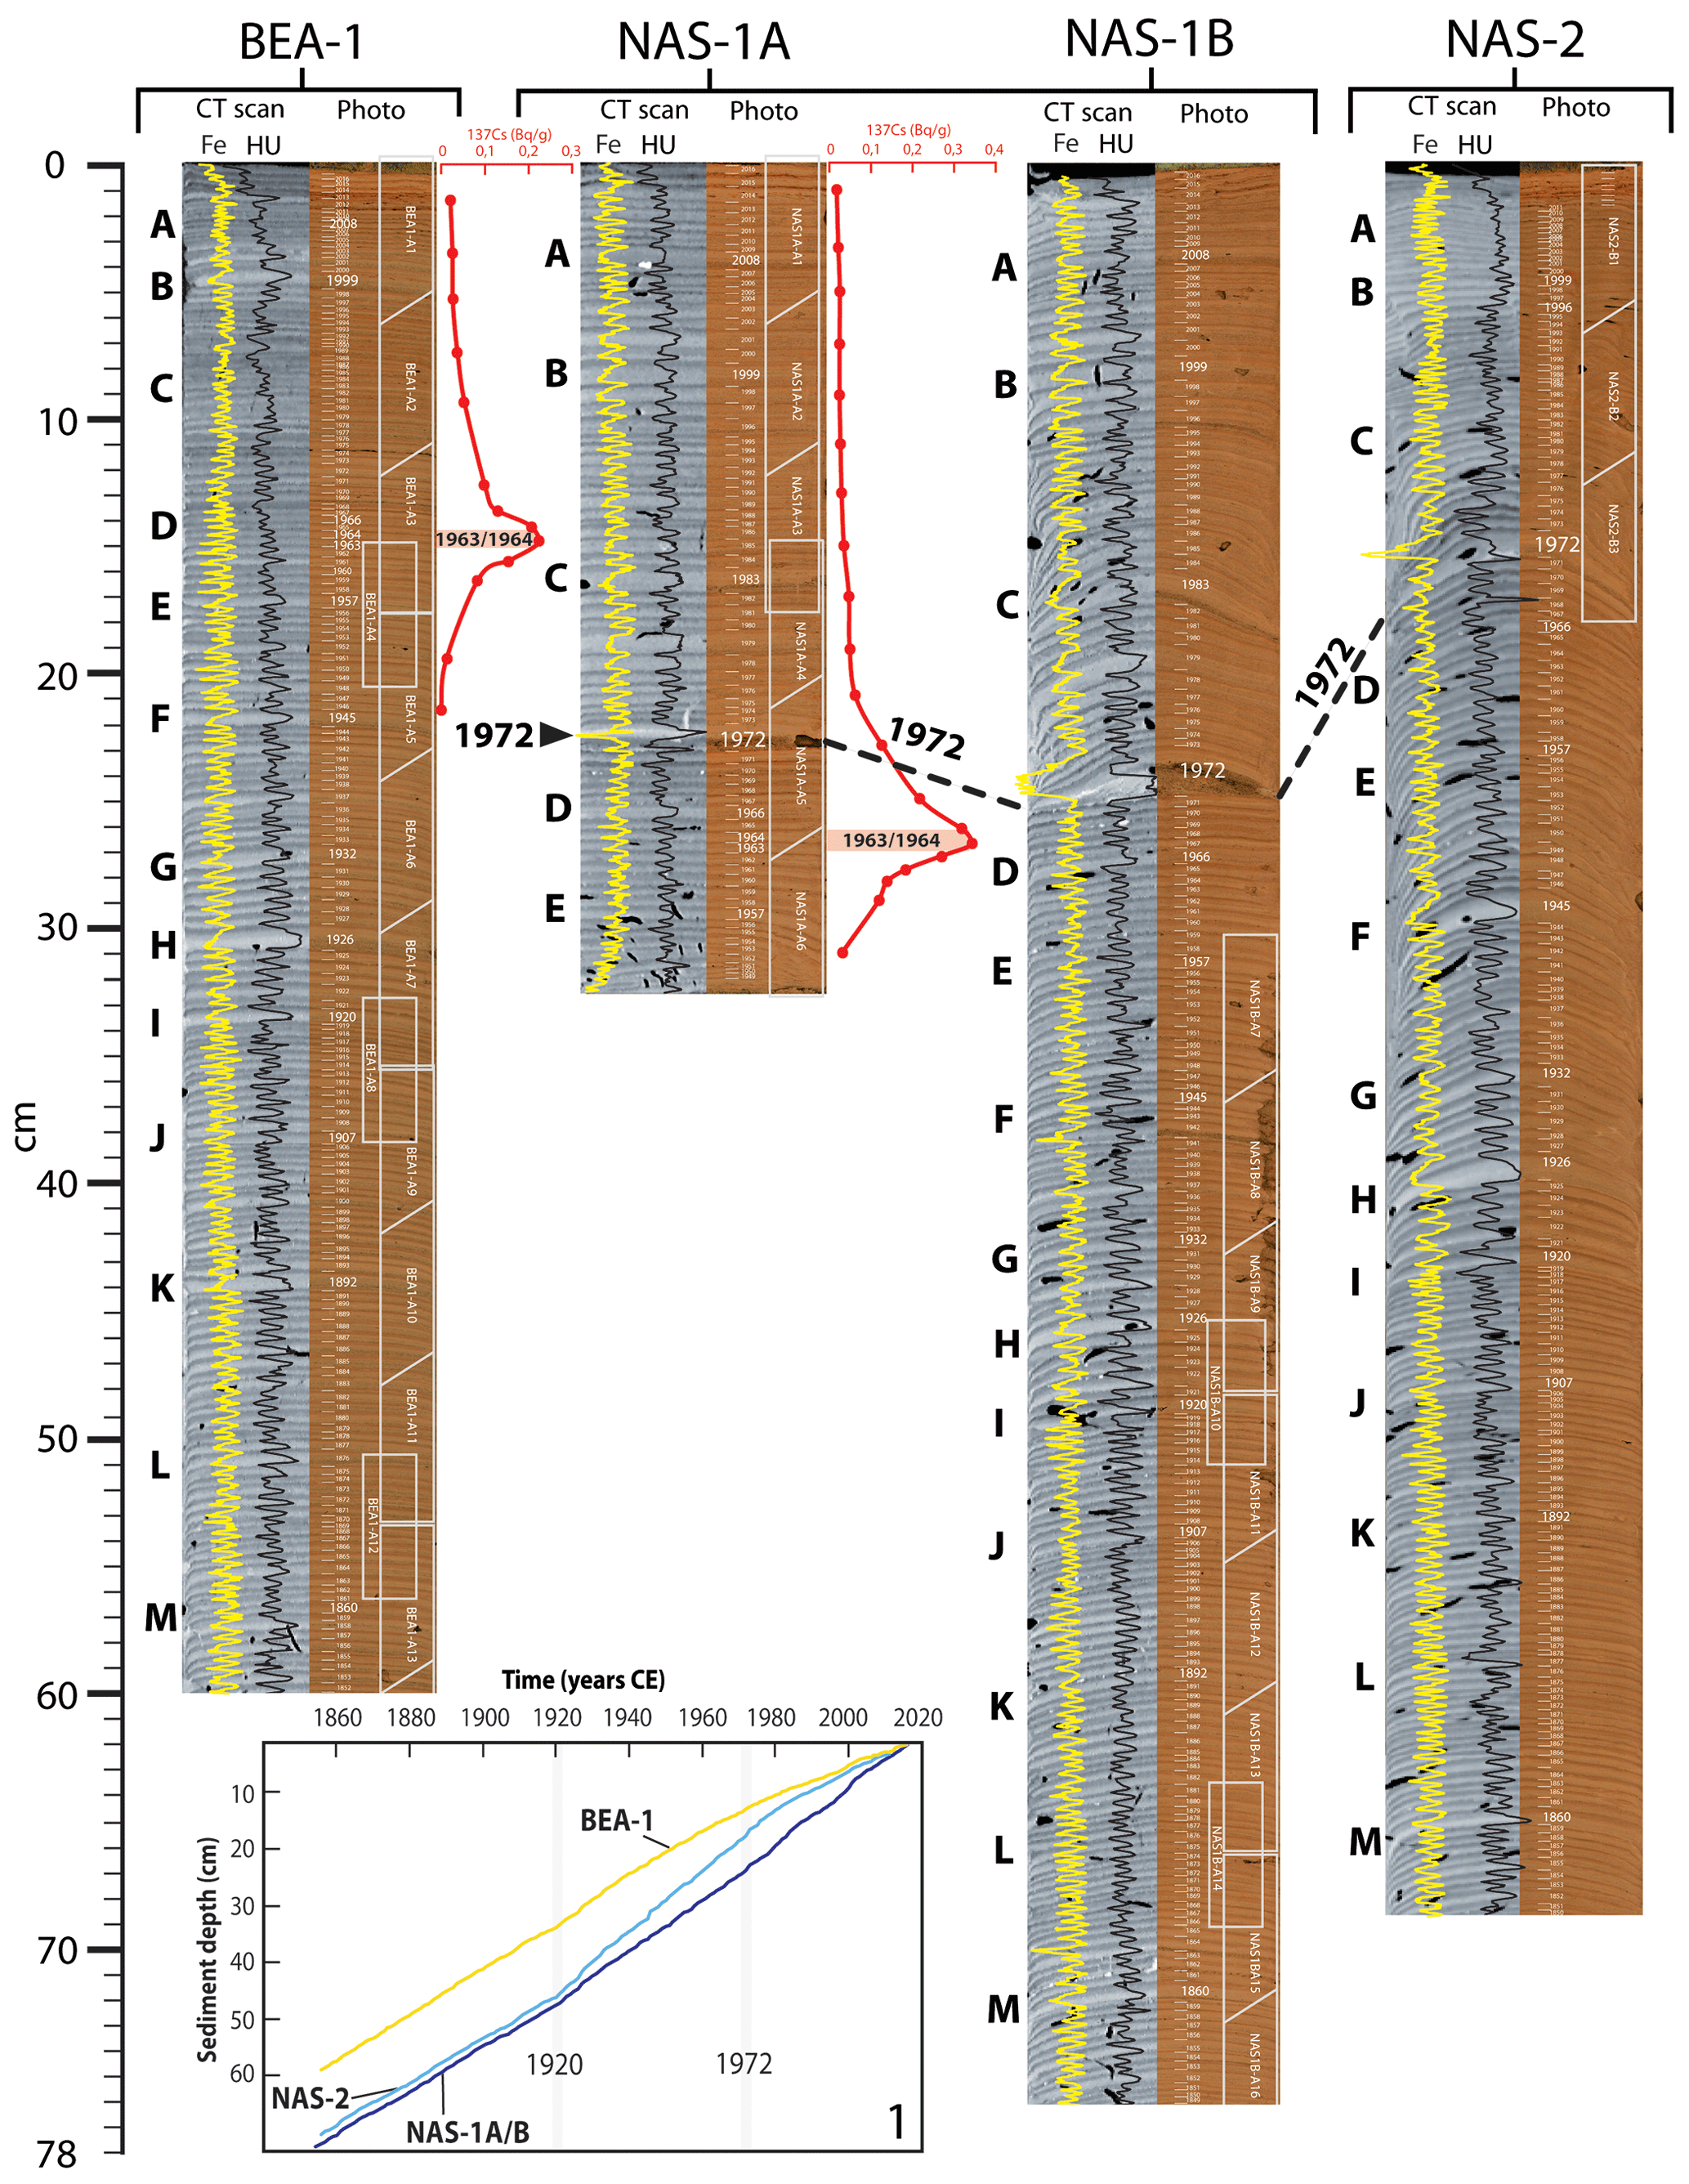
Figure 4Varve counts made on (left) CT scan and (right) high-resolution images from cores BEA-1, NAS-1A/B and NAS-2. Distinctive marker layers are identified by the letters A to M. The 1972 marker layer is outlined by the thick dark grey line. The Fe relative intensity and density (HU) profiles, represented by the yellow and black lines respectively, show rhythmic laminations. The activity profile of 137Cs in cores BEA-1 and NAS-1A is shown by the red line. Approximate thin section locations are outlined by white boxes. The age–depth model of the three cores is also presented (Box 1 at the bottom of the figure). See Fig. 1b for core locations.
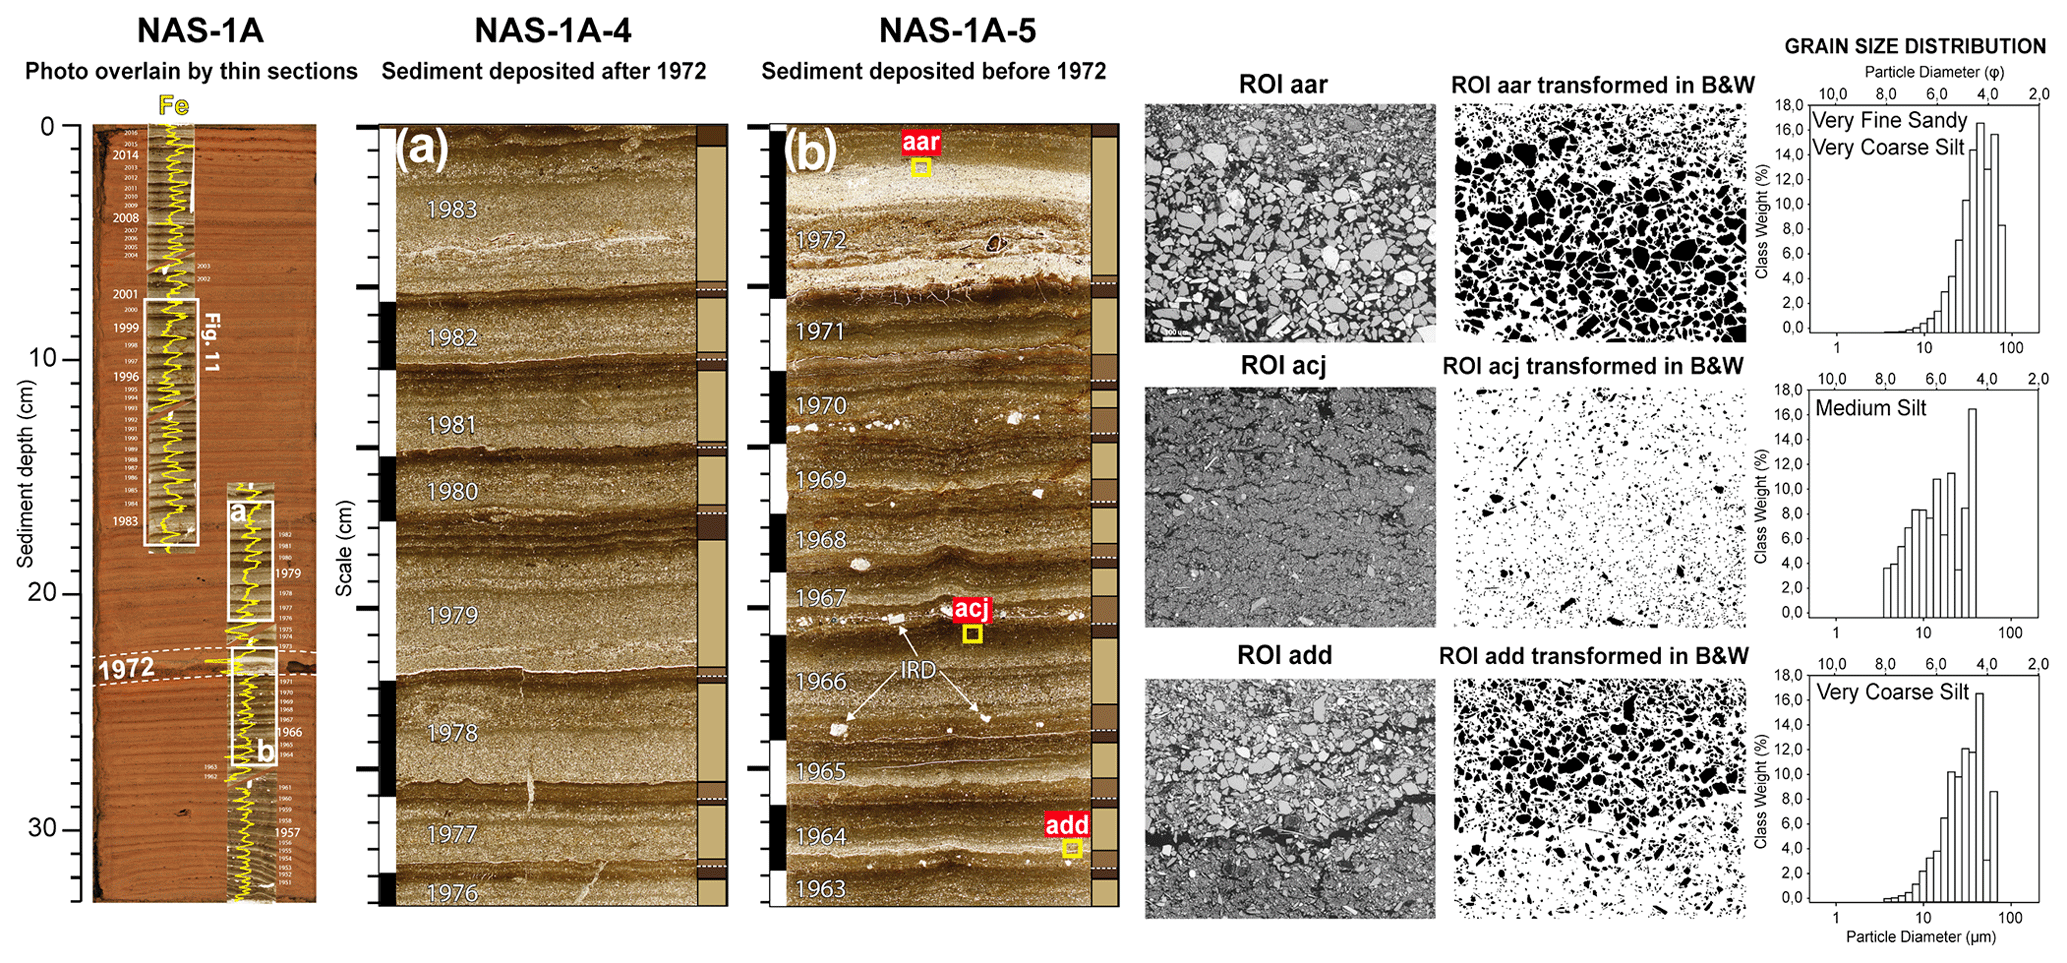
Figure 5(Left) Photo of core NAS-1A overlain by a thin section image and Fe relative intensity profile (yellow lines). The 1972 marker layer is highlighted by the white dashed lines. Thin section images showing the sedimentary structure of varves deposited (b) before and (a) after the 1972 marker bed. Varve boundaries are represented by the vertical black and white bars (left y axis). Varve layers are delimited by the medium brown (early spring layer), pale brown (detrital layer) and dark brown (autumn and winter layer) bars (right y axis). Typical ice-rafted debris (IRD) is shown by the white arrows in panel (b). (Right) BSE images of three ROIs transformed in black and white and their associated particle size distribution (aar represents the 1972 marker layer, acj represents a typical autumn and winter layer, and add represents the base of a typical detrital layer); see the yellow squares in panel (b) for the ROI locations.
The lamination deposited in 1972 from sites at the axis of the Naskaupi River (NAS-1, Fig. 5b, and NAS-2, Fig. 4), present a thick (8.2 mm) and coarse (67.8 µm) detrital layer composed of very fine sandy and very coarse silt (Fig. 5b) representing the highest particle size measured in all sequences. Furthermore, there is a difference in lamination physical parameters and microfacies deposited before and after the 1972 marker bed, especially in core NAS-1, the proximal site from the Naskaupi River mouth. Laminations deposited prior to 1972 have a well-developed substructure that is relatively constant among each annual lamination (Fig. 5b). The early spring layer of the pre-1972 laminations is thicker and more clearly visible. Conversely, the detrital layer of laminations post-1972 is thicker, whereas the early spring layer is more difficult to discern and contributes less to the TVT (Fig. 5a). The mean contribution of the early spring layer and the autumn and winter layer to the total lamination thickness is 52 % for the pre- and 35 % for the post-1972 intervals. The early spring layer in lamination post-1971 from sites NAS-1 and NAS-2 no longer contains isolated coarse debris. The changes in lamination facies are less noticeable in core NAS-2, which was sampled further away from the Naskaupi River mouth. The 1972 marker bed and related facies changes are not found at the Beaver River mouth site BEA-1.
4.2 Varve chronology
The laminated sequences' chronologies are consistent with the Cesium-137 main peaks corresponding to the highest atmospheric nuclear testing period (1963–1964 CE). Peaks are found at 14–14.5 cm (BEA-1) and 26.5–27 cm (NAS-1A) depth (Fig. 4) and perfectly match the lamination counts in both cores, confirming the varve assumption. The presence of the distinct 1972 marker layer at this chronostratigraphic position in the varve sequence which coincides with the occurrence of the Naskaupi River diversion that took place in April 1971 (see Sect. 5.2 for details) supports the reliability of the constructed chronologies.
Independent varve chronologies were established from sediment cores BEA-1, NAS-1 and NAS-2 (Fig. 4). A total of 160 varves were counted at each site, covering the 1856–2016 period. The thickness and the good quality of the well-preserved varve structures allowed a robust age model that was reproducible among cores to be constructed. Despite the distance between the coring sites (1 to 5 km) and the two different sediment sources (Naskaupi and Beaver rivers; Fig. 1b), there is no varve count difference between the selected thick marker layers (A to M; Fig. 4) among cores. The few counting difficulties occur within varve years 1952–1953, 1935–1934 and 1918–1919, as they contain ambiguous coarse non-annual intercalated sub-layers with an intermediate clay cap that can be interpreted as 1 year of sedimentation. Both varve counts performed on thin sections show a low overall counting error (±1.8 %) which demonstrated the precision and accuracy of the varve sequences chronology. The age–depth models (Fig. 4, Box. 1) show changes in sediment accumulation rates (thickness) among cores in 1920 and 1972.
4.3 Thickness and particle size measurements
The TVTs from cores BEA-1, NAS-1 and NAS-2 vary between 0.9 and 12.9 mm, with an average thickness of 4.09 mm (Fig. 6a, b, c, Supplement Fig. S1 and Table S1). The DLTs vary between 0.3 and 8.3 mm, with an average thickness of 1.9 mm (Fig. 6a, b, c, Supplement Fig. S2 and Table S2). There are significant strong positive correlations between TVT and DLT for each core (r=0.79 to 0.91; p<0.01). A step in the TVT is observable in the early 1920s at the three sites (Fig. 6a, b, c), especially in core NAS-2, which recorded their highest values (12.9 mm) during the 1920–1972 period (Fig. 6c). Since the 1920s, there is a statistically significant decreasing trend in TVTs and DLTs in core BEA-1 (Fig. 6a). Thickness data from the three sites have been normalized and averaged to produce combined TVT and DLT series (Fig. 6d, e). From 1920 to 1972, combined TVT and DLT series show a statistically significant downward trend, despite an increase in years associated with high thickness values. Overall, TVT and DLT vary similarly in time between sites during the 1856–1971 period (Fig. 6d, e). However, after 1972, TVT and DLT series are more divergent. From 1972 to 2016, there is a statistically significant decreasing trend in TVT and DLT in core NAS-2 (Fig. 6c), and the amplitude of their variability tends to diminish. For core NAS-1 (Fig. 6b), the post-1971 period is associated with higher thickness values. Core NAS-1 has recorded a slight TVT and DLT decrease for the 1972–2016 period, but unlike the other cores, the variability tends to increase. The TVT and DLT are generally finer in the distal core NAS-2 compared with the more proximal core NAS-1 (Fig. 4, Box. 1, Supplement Tables S1, S2).

Figure 6Total varve thickness (TVT; thick line) and detrital layer thickness (DLT; thin line) time series of cores (a) BEA-1, (b) NAS-1 and (c) NAS-2. Normalized (d) TVT and (e) DLT series and the combined series (mean of the normalized data from the three sites). Pearson correlation coefficients between TVT and DLT for the 1856–2016, 1856–1971 and 1972–2016 periods are shown. The selected marker layers are identified by the letters A to M, and the 1972 marker layer is outlined by the thick black dashed line.
The P99D0 of cores BEA-1, NAS-1 and NAS-2 vary between 20 and 67.8 µm, with an average value of 34.3 µm (Fig. 7, Supplement Fig. S3 and Table S3). The grain size is finer in core NAS-2 compared with core NAS-1. Particle size data from the three sites have been normalized and averaged to produce combined P99D0 series (Fig. 7c). The combined P99D0 series show a slight coarsening trend towards the end of the 19th century. From 1900 to 1971, P99D0 values are generally below average. The 1972 marker layer of core NAS-1 presented the maximum P99D0 values (Fig. 7b). After 1972, there is an increase in P99D0 values in core NAS-1, where a step is observable. Pre-1971, varves in core NAS-1 have a mean P99D0 of 32,47 µm compared with 42,91 µm for the 1972–2016 period.
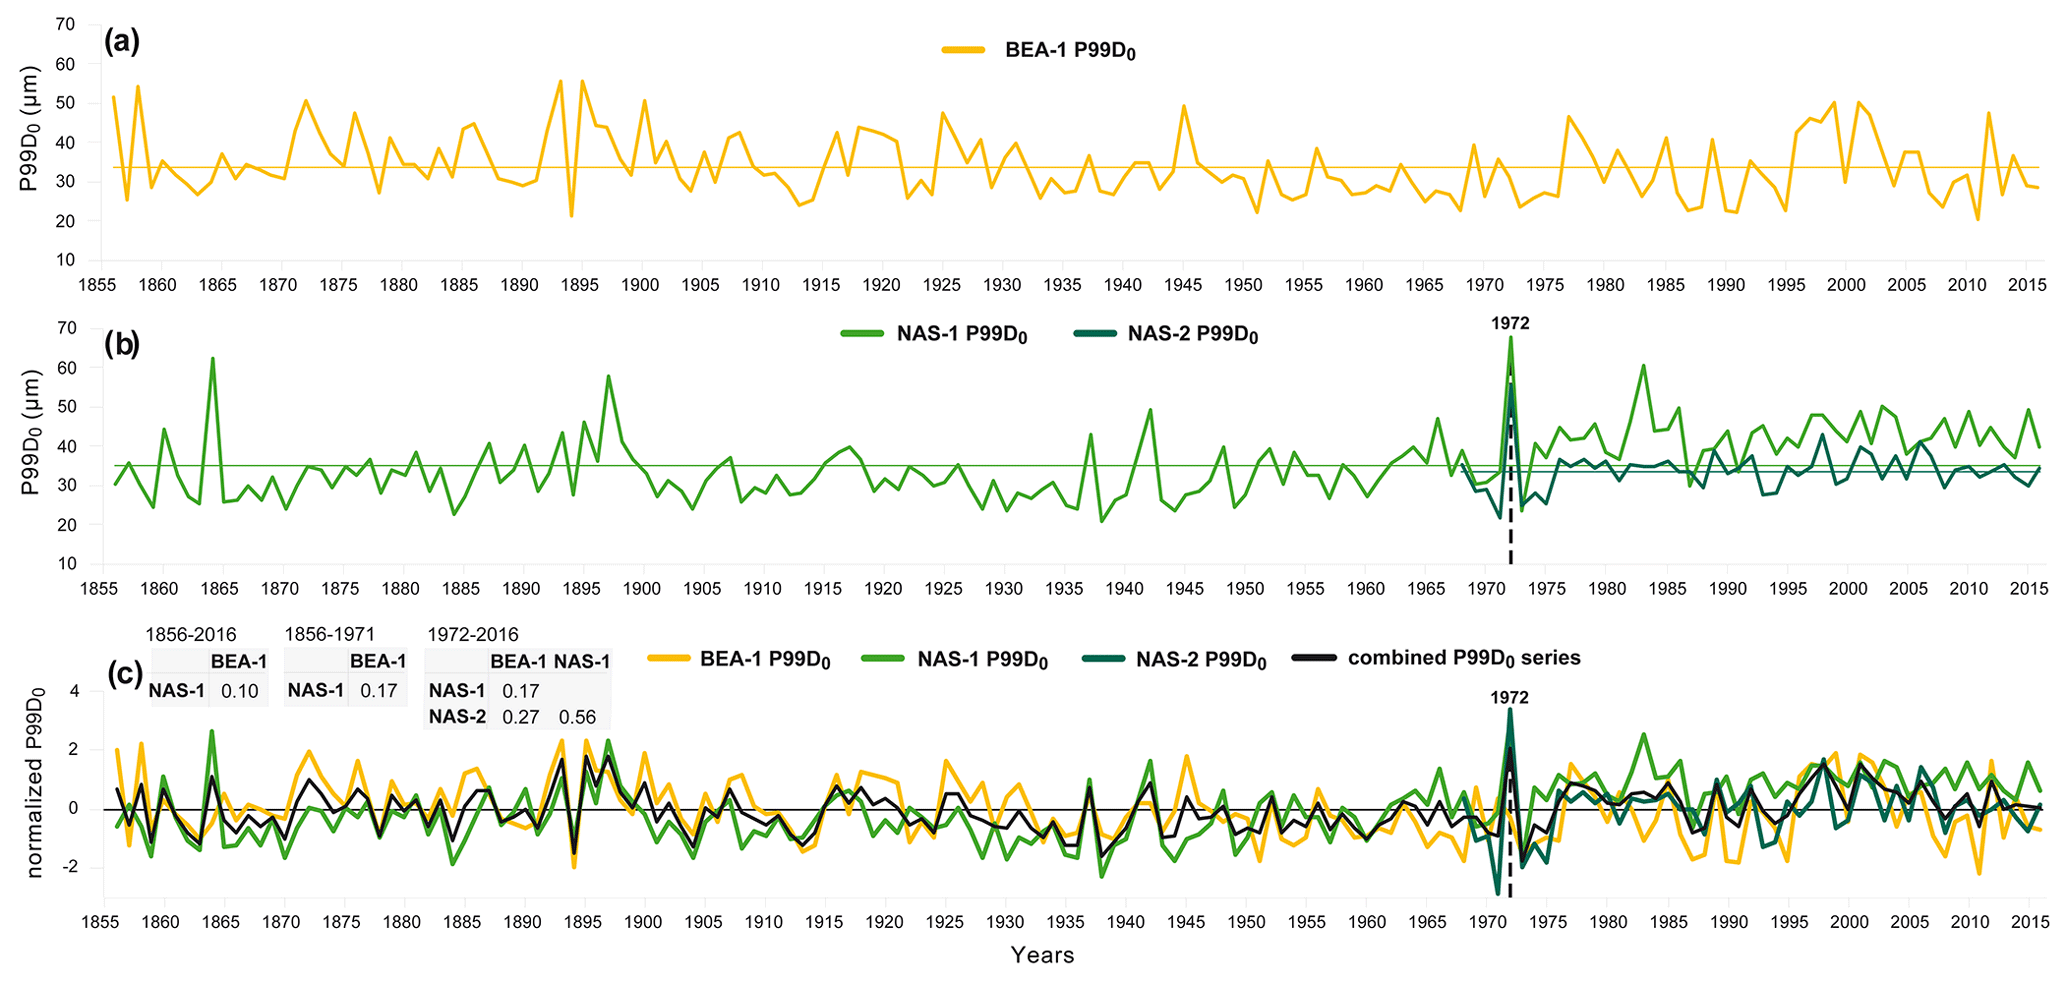
Figure 7P99D0 time series of cores (a) BEA-1, (b) NAS-1 (1856–2016) and NAS-2 (1968–2016). (c) Normalized P99D0 series and the combined series (mean of the normalized data from the three sites). The 1972 marker layer is outlined by the black dashed line. Pearson correlation coefficients between the P99D0 series for the 1856–2016, 1856–1971 and 1972–2016 periods are shown.
There is weak to moderate positive correlation between TVT and P99D0 from a same core (BEA-1: r=0.41, p<0.01; NAS-1: r=0.52, p<0.01; NAS-2: r=0.27, p<0.05). The correlation between DLT and P99D0 is stronger (BEA-1: r=0.49, p<0.01; NAS-1: r=0.65, p<0.01; NAS-2: r=0.49, p<0.01). Thick varves are more likely to have high grain size values. However, these correlations show that TVT, DLT and P99D0 remain independent variables and can all reveal different hydrological information.
4.4 Relation between varve series and instrumental record
4.4.1 Naskaupi River
To examine how the physical parameters of the varves are related to local hydrology and to demonstrate their potential for hydrological reconstruction, sediment parameters (TVT, DLT and P99D0) of each core were systematically compared to hydrological variables (Table 1). TVT, DLT and P99D0 series from the three coring sites show significant positive correlations with the Q-mean and Q-max extracted from the Naskaupi River hydrometric station (03PB002) data for the 1978–2011 period (n=31) (Table 3). The TVT and DLT of cores BEA-1 and NAS-2 show a stronger correlation with Q-mean, whereas the TVT and DLT of core NAS-1 have a better relation with Q-max. There is a significant negative correlation between the P99D0 of core NAS-1 and Q-max-Jd () and Rise-Time (). Sediment parameters also present significant positive correlations with Q-Nival (r=0.32 to 0.61) and Nb-days-SupQ80 (>125 m3 s−1) (r=0.44 to 0.62). The combined DLT and P99D0 series (Figs. 6d, e; 7c) yield the strongest correlations in our dataset (r=0.68 and 0.75 respectively; Table 3) and have been used to reconstruct Naskaupi River Q-mean and Q-max respectively (Fig. 8).
Table 3Matrix of correlation coefficients (Pearson r) of the hydrological variables defined in Table 1 with total varve thickness (TVT), detrital layer thickness (DLT) and particle size (P99D0) for the instrumental period (1978–2011; n=31) for each core. Correlations between the hydrological variables and the combined TVT, DLT and P99D0 series (normalized and averaged varve parameters of cores BEA, NAS-1 and NAS-2) are also present. Correlations in boldface are significant at p<0.05 (Supplement Table S4). Correlations marked by an asterisk were used for the final Q-mean and Q-max reconstructions.
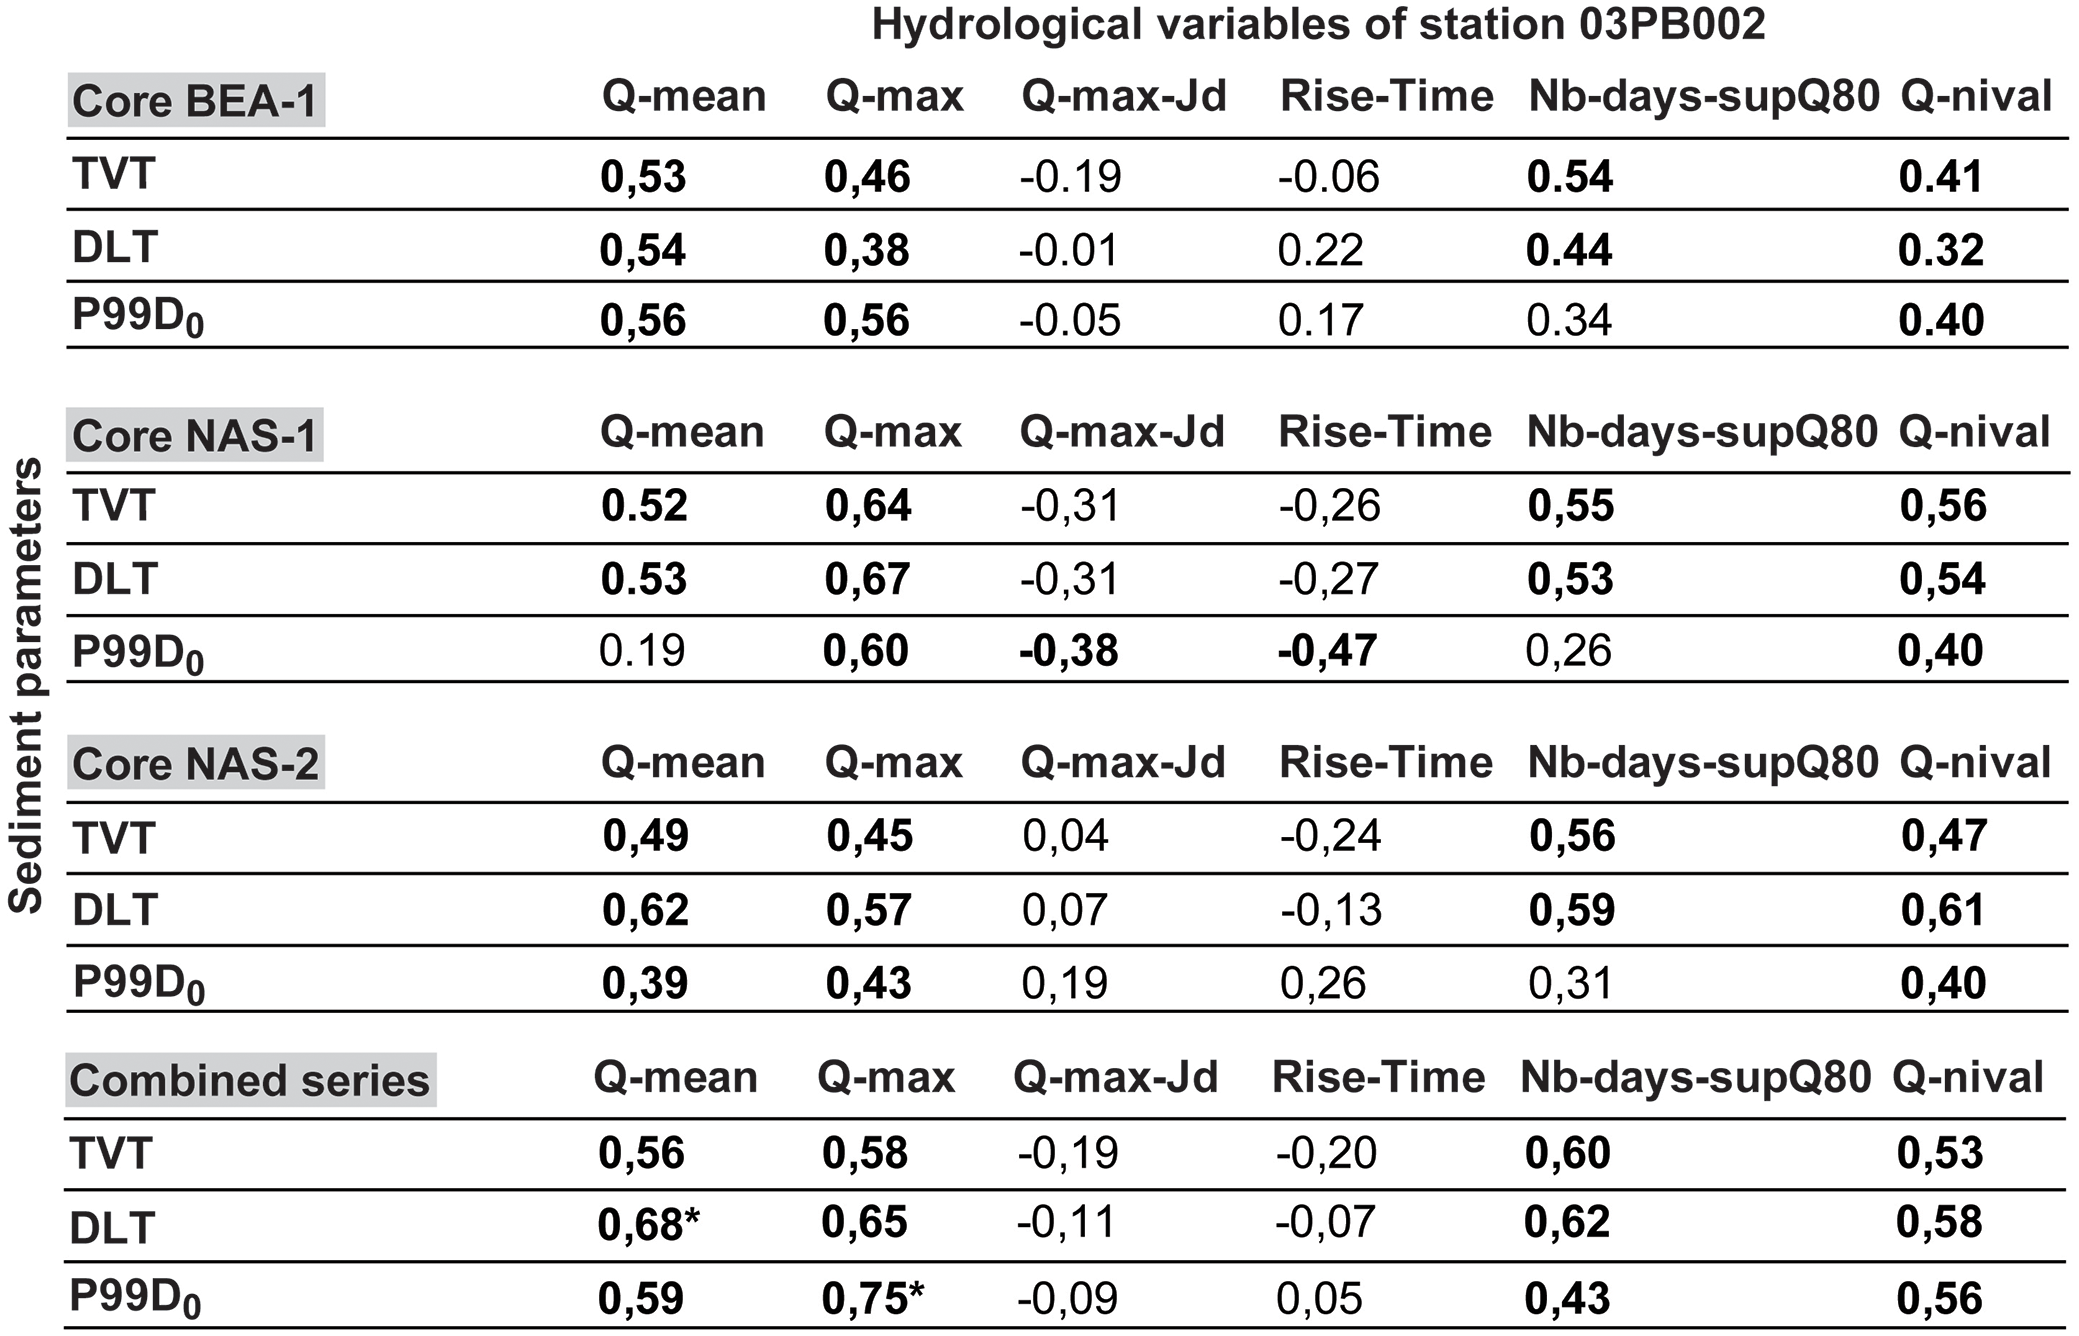
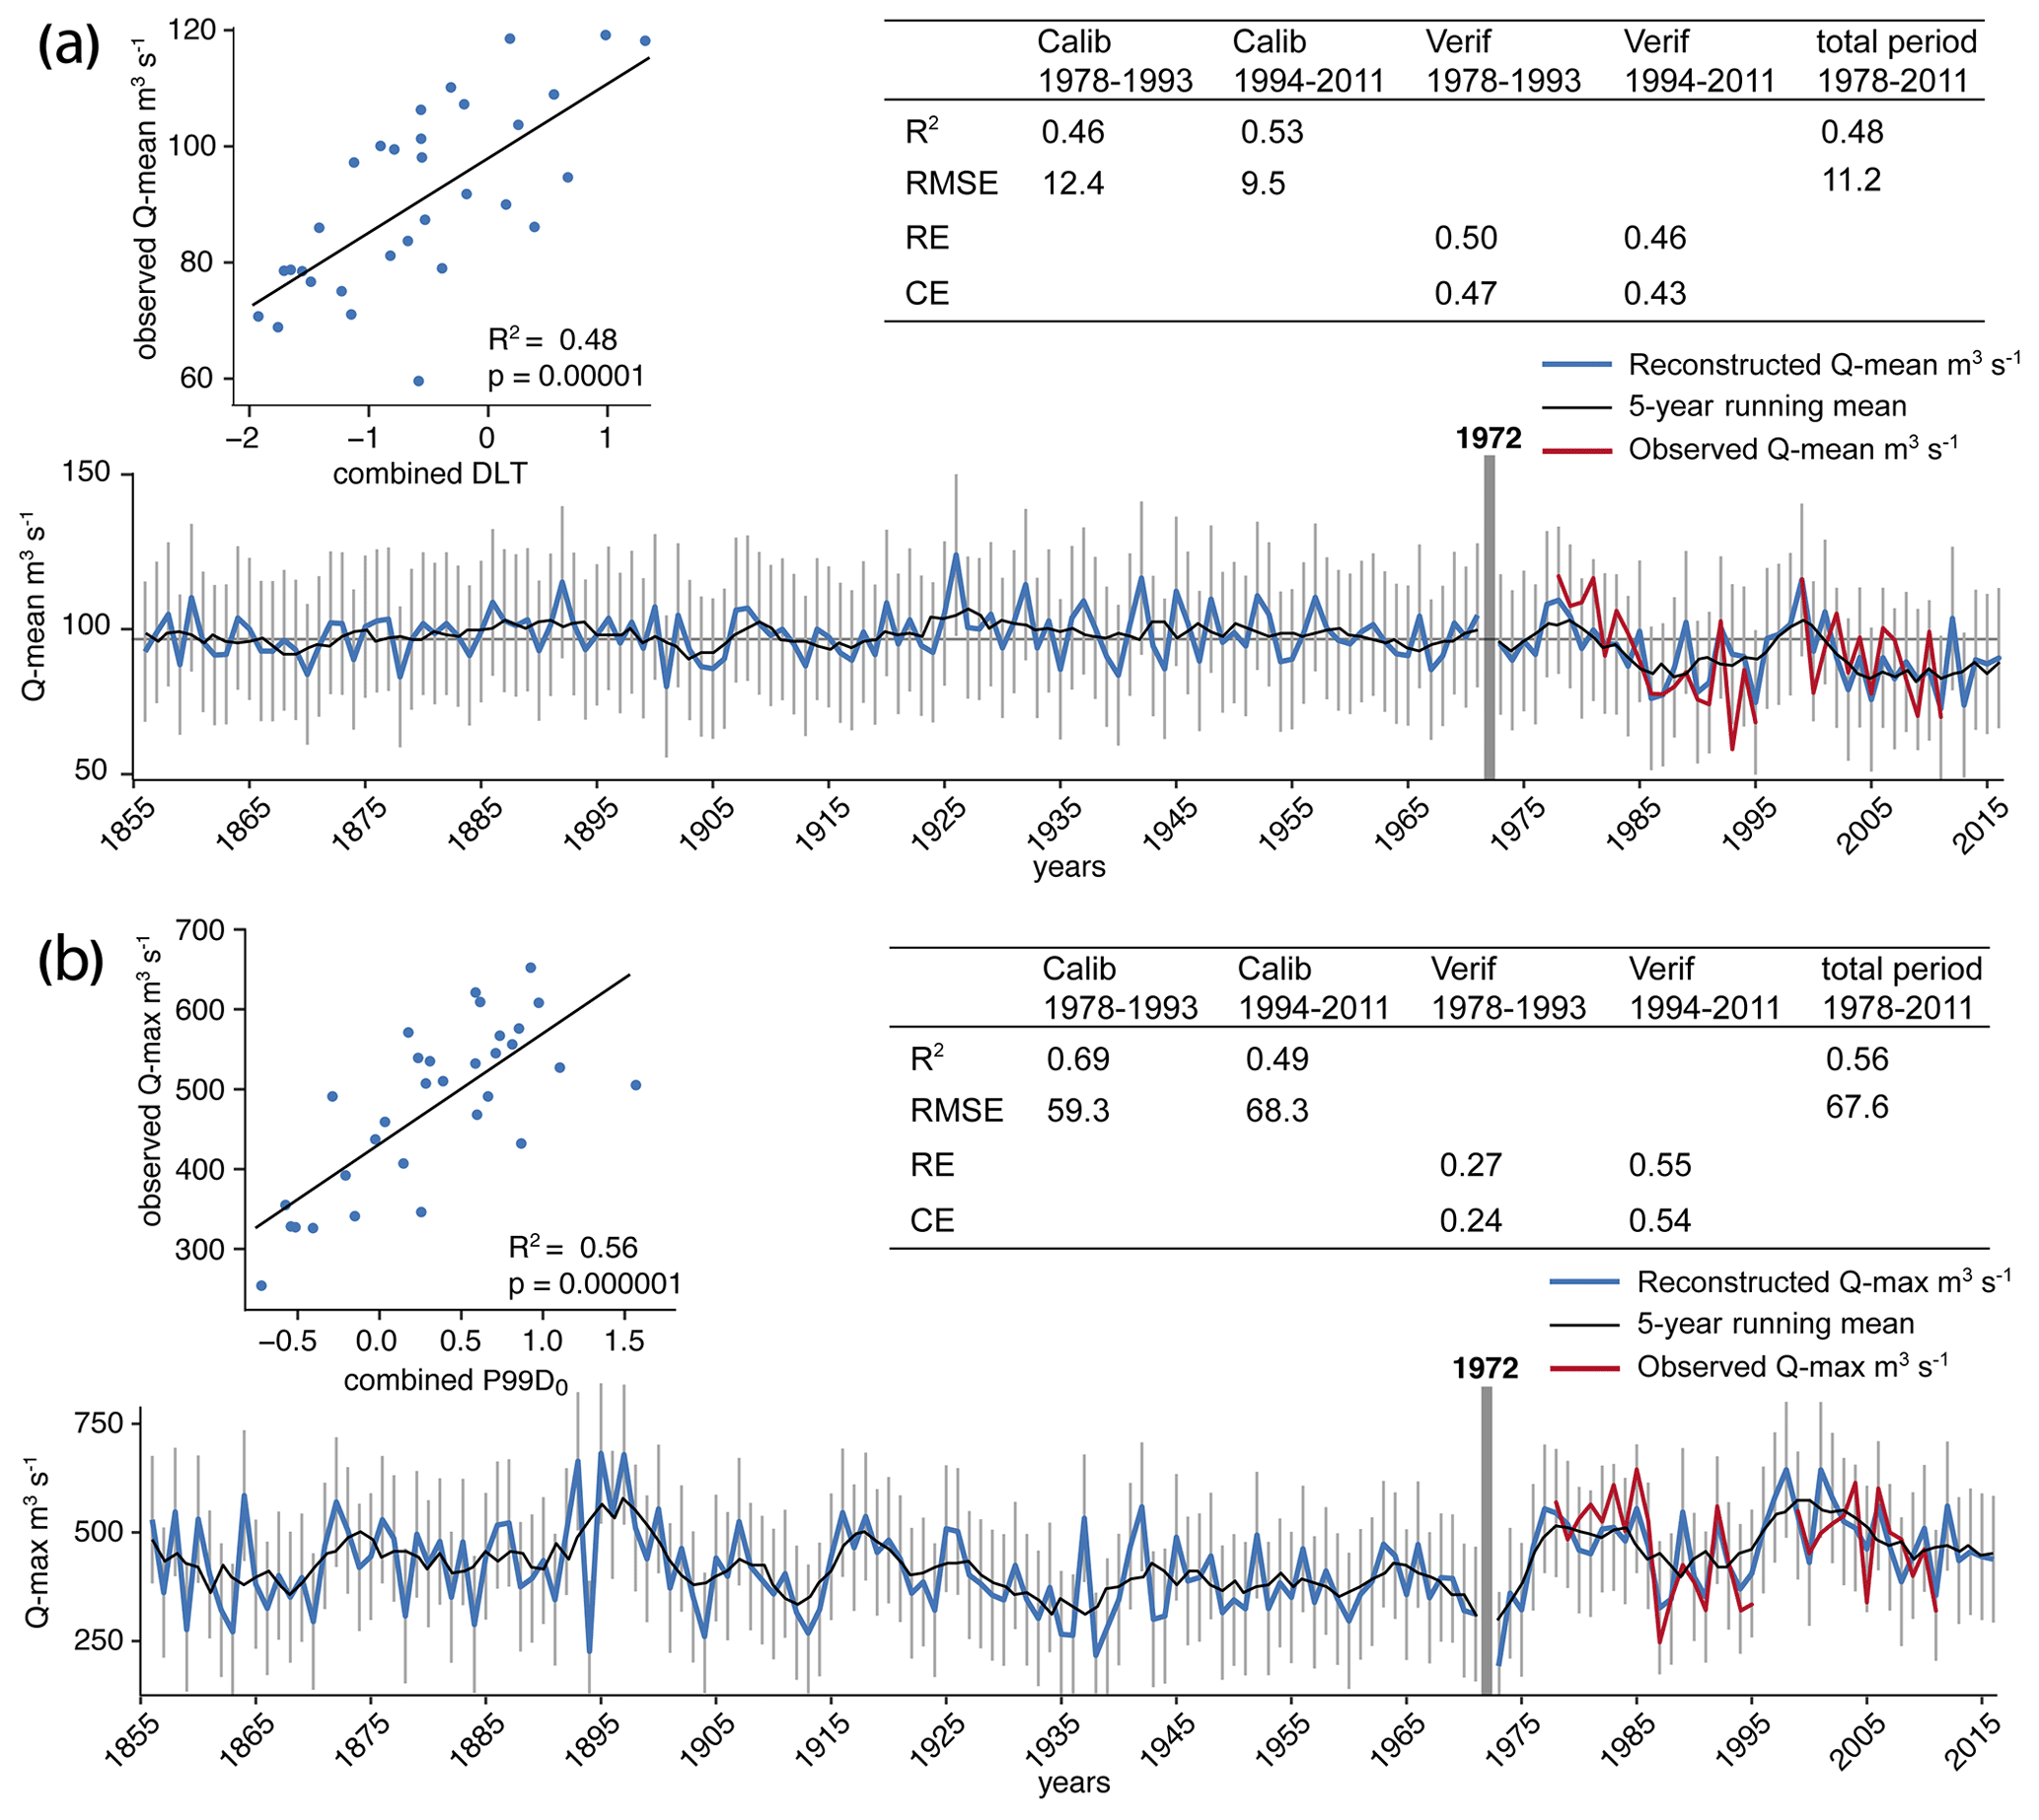
Figure 8Naskaupi River (a) Q-mean and (b) Q-max reconstructed from combined DLT (without the NAS-1 1978-2016 period) and P99D0 series respectively, for the 1856–2016 period (blue line), with a 5-year moving average (black line). Error bars represent the 95 % confidence interval. Observed Q-mean and Q-max are also shown for the 1978–2011 period (red line).
4.4.2 Labrador region
To determine if there is a regional hydrological signal in Labrador and whether the Grand Lake varved sedimentary sequence has recorded this signal, the Naskaupi River hydrological variables were compared with other Labrador hydrometric stations (Table 2). Despite specific local geomorphological and climatic conditions, strong similarities exist between observed mean daily discharges (Fig. 3c) and annual streamflow (Fig. 3d) recorded by hydrometric stations in Labrador for the 1978–2011 period. The shape of the five annual regimes shows similar characteristics (i.e., flood-timing, strength, duration, snowmelt and rainfall response). The instrumental Naskaupi River mean annual discharge series data show significant (p<0.01, Supplement Table S5) positive correlations with other hydrometric stations (Ugjoktok: r=0.84; Minipi: r=0.70; Little Mecatina: r=0.73; Eagle: r=0.49). Hydrological conditions in the Naskaupi River region are, thus, representative of a broader region of Labrador. Therefore, the combined DLT series (without the NAS-1 1978-2016 period) has been used to reconstruct the Labrador region mean annual discharge series (Fig. 9).
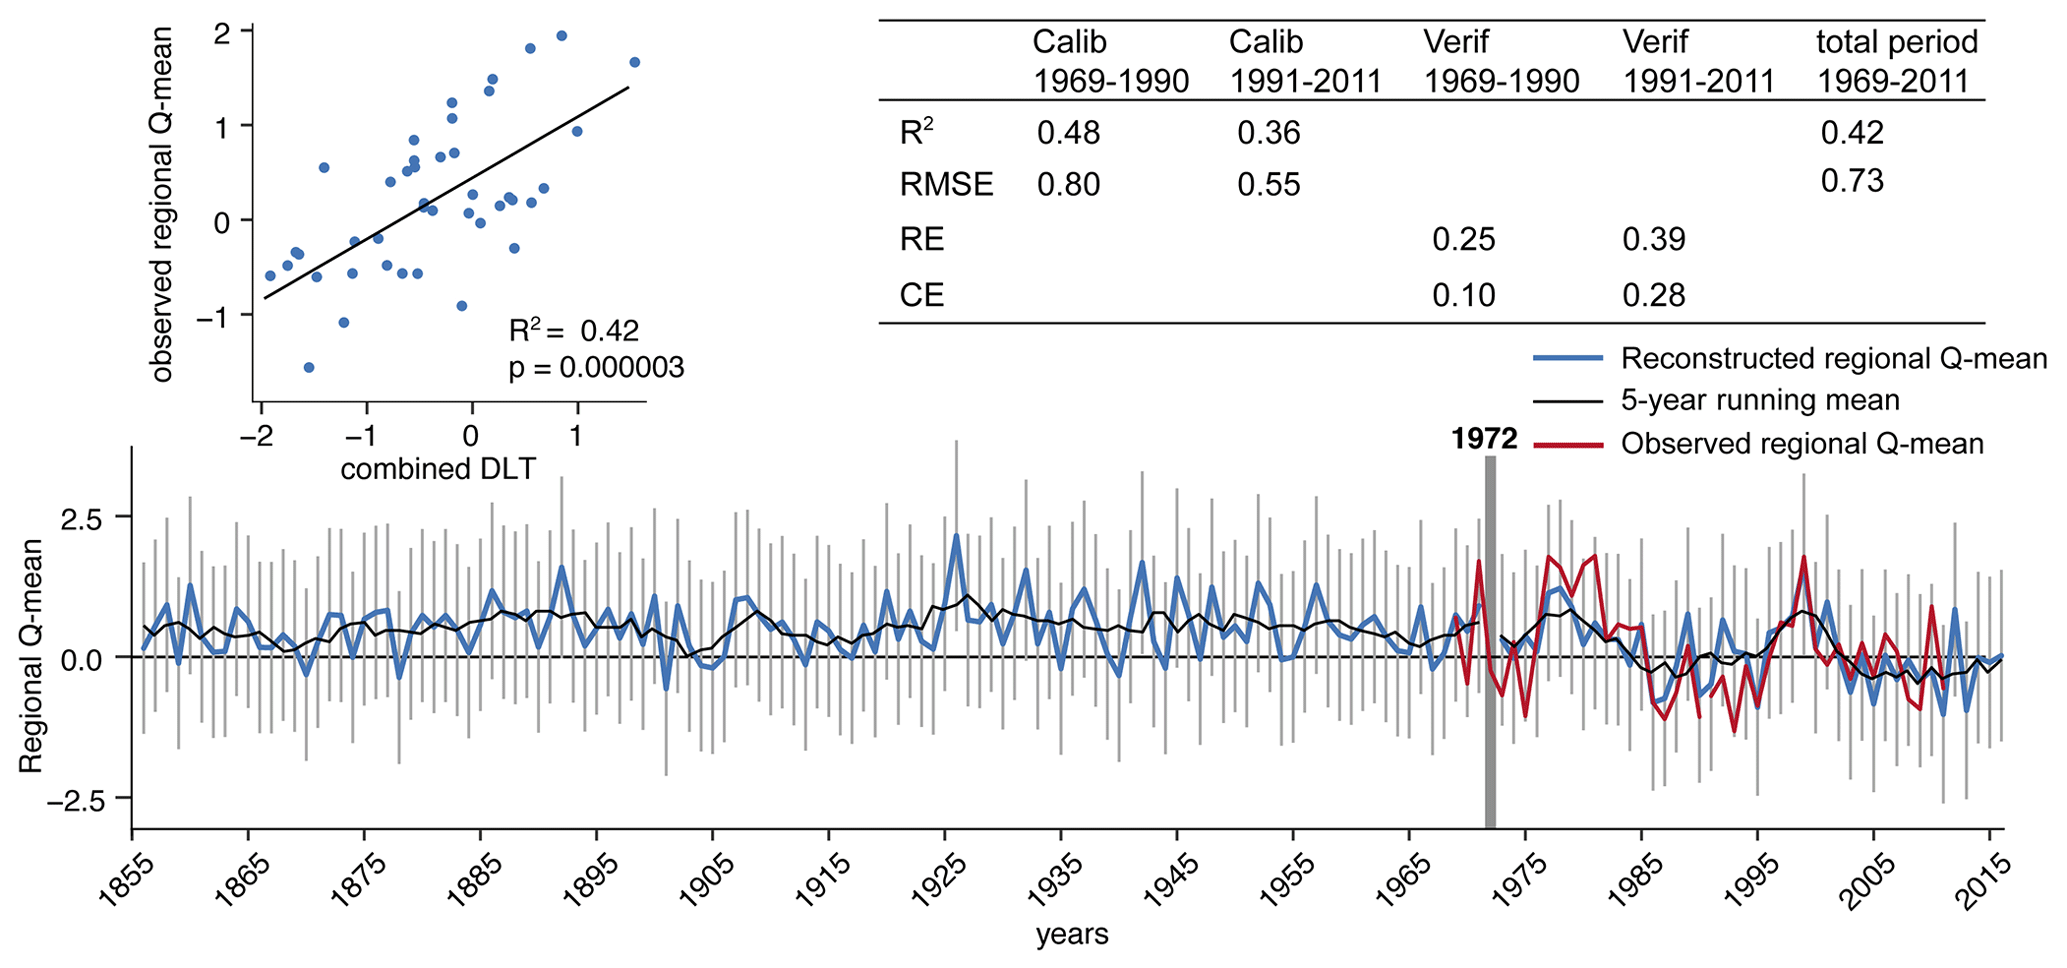
Figure 9Labrador region Q-mean reconstructed from combined DLT series (without the NAS-1 1972–2016 period) for the 1856–2016 period (blue line), with a 5-year moving average (black line). Error bars represent the 95 % confidence interval. The observed Labrador region Q-mean series is also shown for the 1969-2011 period (red line).
4.5 Hydrological reconstructions using varve parameters
4.5.1 Naskaupi River Q-mean and Q-max
The Naskaupi River mean and maximum annual discharges (Q-mean and Q-max) were reconstructed using DLT and P99D0 series for the 1856–2016 period. The reconstructions were performed using single-core data, combined DLT and P99D0 series, and other combinations of core data, in order to propose the most relevant reconstructions (Supplement Figs. S4, S5). The observations and the reconstructed Q-mean and Q-max extracted from the different series over the 1978–2011 period are consistent. Despite differences, all reconstructions tested using different sources of sedimentological data generally share common inter-annual and longer-term variability.
Excluding the 1972–2016 measurements from NAS-1 from the combined series for reconstructions was also tested to remove the likely anthropogenic impact on sedimentation during this period. The combined DLT series without the 1972–2016 period presents a slightly better fit with the instrumental data (lowest RMSE and the most significant and highest R2; Supplement Table S6). The model calibrations based on a twofold cross-validation reveal that this DLT series has better overall predictive capacity to reconstructed Q-mean (Supplement Table S7). The 1972–2016 period of core NAS-1 was then excluded from the combined DLT series used to perform the best reconstruction of Naskaupi River Q-mean presented in Fig. 8a. However, significantly stronger calibration and validation statistical results were obtained by keeping this period in the combined P99D0 series used to reconstruct Naskaupi River Q-max (Fig. 8b, Supplement Tables S8, S9). The varve of year 1972 is considered as an outlier that originated from anthropogenic impacts and, thus, was not included in all reconstructions.
The reconstructed Naskaupi River Q-mean from combined DLT series varies between 73 and 126 m3 s−1, with an average of 96 m3 s−1 (Fig. 8a), and remains relatively stable from 1856 to 1920, generally close to the mean. Several years with high Q-mean occurred during the 1920–1960 period. A statistically significant downward trend of the Q-mean is observed over the last 90 years. Recently, high Q-mean periods are observed from 1976 to 1985 and from 1996 to 2002, and lower Q-mean periods are observed from 1986 to 1995 and from 2003 to 2016. The reconstructed Naskaupi Q-max from combined P99D0 series varies between 192 and 681 m3 s−1, with an average of 426 m3 s−1 (Fig. 8b). There is a slight upward trend in Q-max at the end of the 19th century. The 1900–1971 period is characterized by a Q-max that is generally below average. Three periods of high Q-max are observed from 1887 to 1900, from 1976 to 1986 and from 1995 to 2008 (Fig. 8b).
4.5.2 Labrador region Q-mean
The consistency between combined DLT series and the observed Labrador region Q-mean series (Fig. 9), based on the discharge variability of five watersheds with different sizes and locations, demonstrates that the Grand Lake varved sequence contains a regional signal. The best reconstruction of the Labrador region mean annual discharges is the one performed using the combined DLT series without the NAS-1 1972–2016 period. This reconstruction demonstrates the best predictive capacity (RE and CE must be >0 to validate the model skills; Supplement Tables S10, S11). The regional Q-mean reconstruction for the 1856–2016 period is presented in Fig. 9.
4.6 Hydrological reconstruction using the rainfall–runoff modelling approach and comparison with the varved-based reconstruction
Naskaupi River Q-mean and Q-max (Fig. 8) were also reconstructed using the ANATEM rainfall–runoff model (Fig. 10). The independent modelling approach results show similarities with reconstructions based on varved series. The ANATEM reconstructions are statistically and positively correlated with the yearly time series obtained from combined DLT and P99D0 series during the 1880–2011 period (Q-mean: r=0.41; Q-max: r=0.22; n=131; p<0.01). The reconstructed Q-mean and Q-max annual variabilities show similarities, especially during the 1973–2011 period (Q-mean: r=0.58; Q-max: r=0.34; n=43; p<0.05).
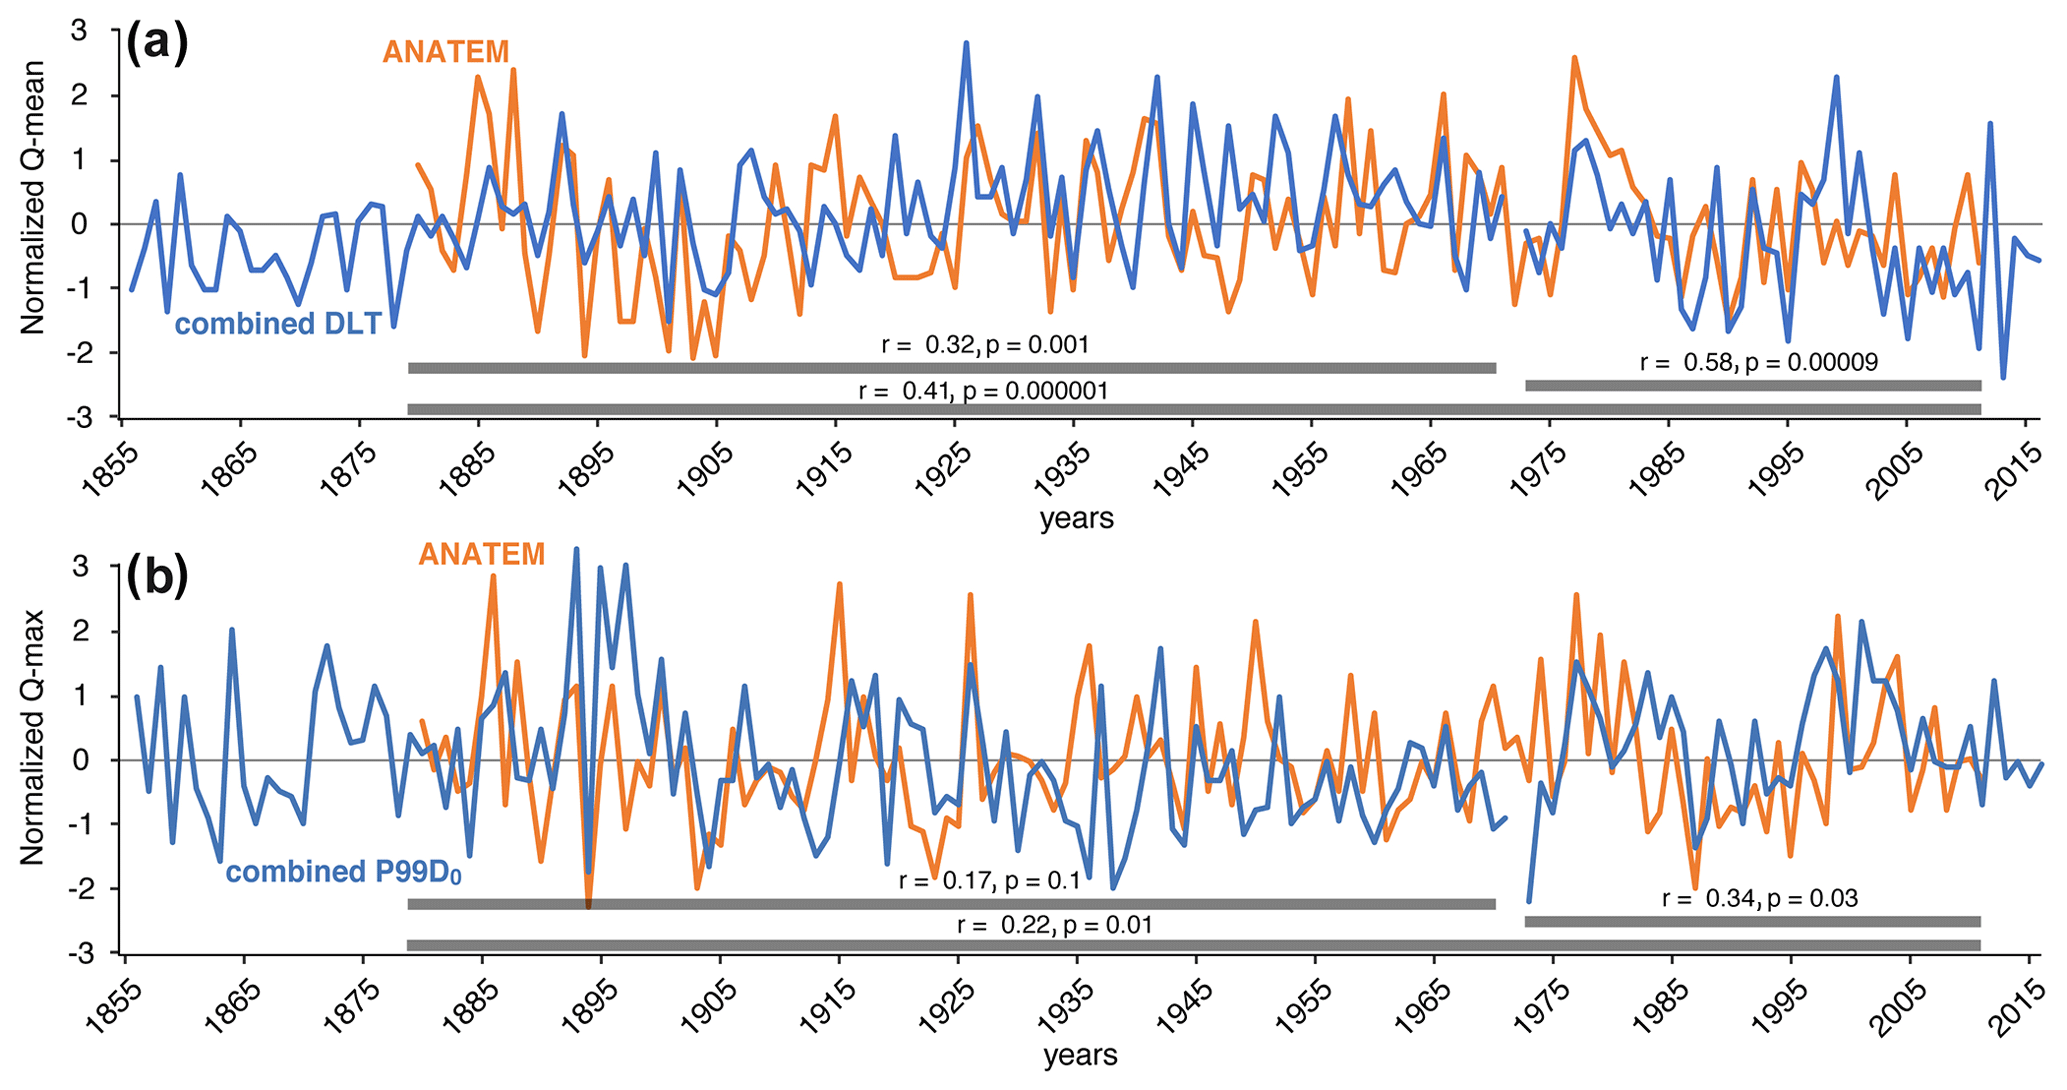
Figure 10Comparison between the Naskaupi River (a) Q-mean and (b) Q-max reconstruction using combined detrital layer thickness (DLT) (without the NAS-1 1972–2016 period) and P99D0 series respectively (blue line) and the rainfall–runoff modelling (orange line) for raw yearly data.
Q-mean reconstructions with both varve parameters and modelling are better correlated than the Q-max reconstructions. This may be due to the higher uncertainty related to the Q-max reconstruction with the modelling approach. Indeed, high flow modelling requires good reconstruction performance on several hydro-climatic processes (i.e., snow accumulation during the winter, timing of the snowmelt, spring precipitation). Moreover, the uncertainty of the hydrological reconstruction is less important for recent periods (>1950), due to the better quality of the geopotential height field reanalysis over recent decades, as more stations series are available and, thus, used in the reanalysis. The decrease in the uncertainty related to reanalysis over time might explain the better correlation between the two approaches for the recent period.
5.1 Grand Lake varve formation
Lakes containing well-defined and continuous varved sequences that allow for the establishment of an internal chronology are rare in boreal regions. However, the great depth of Grand Lake, the availability of fine sediments in its watershed due to the glacial and postglacial history of the region (Trottier et al., 2020), as well as its important seasonal river inflow have favoured the formation and preservation of exquisite and thick varves. The seasonal streamflow regime plays a significant role in the annual cycle of sedimentation in Grand Lake and is responsible for the formation of the three distinct varve layers. Due to the thickness and the clarity of the varve structures, it is possible to infer the deposition mechanism for each layer and the season in which they were deposited.
The early spring layers are interpreted to be deposited during the river and lake ice break-up and disintegration period, when erosion and resuspension of fine-grained sediments are initiated but still low. Available Landsat 8 images of Grand Lake covering the 1983–2018 period (courtesy of the U.S. Geological Survey) show that Grand Lake ice cover starts to melt at the Naskaupi and Beaver river mouths. This ice melting pattern creates open bays where drifting floating ice melts, thereby depositing ice-rafted debris (Lamoureux, 1999, 2004) as observed in the early spring layer facies. The overlying detrital layers are interpreted as flood-induced turbidites deposited at the lake bottom during the open-water season. High-energy sediment-laden river flows produce hyperpycnal flows allowing silt and sand-sized sediments to reach the cored sites (Cockburn and Lamoureux, 2008). The sharp contact boundary between the early spring layer and the detrital layer at the top part of the early spring layer supports the hypothesis that the detrital layers originate from underflows (Mangili et al., 2005). The sediment waves on the Naskaupi and Beaver river delta slopes (Trottier et al., 2020) (Fig. 1b, c) also indicate significant downstream sediment transport by supercritical density flows (Normandeau et al., 2016). The thick and grading upward basal part of the detrital layers are deposited during the high spring discharge period generated by snowmelt runoffs. The lack of erosion marks between the early spring layer and the detrital layer and the incorporation of rare cohesive sediment clasts within the detrital layer suggest that erosion of the underlying early spring layers occurs in more proximal and energetic settings. Three observations justify the combination of varve measurements from the three coring sites : (1) the sedimentary processes inferred from the observation of thin sections, the high-resolution bathymetric and the sub-bottom surveys are similar; (2) the similarity of the varve facies and properties for each single year at the three different sites suggests a sedimentary pattern devoid of disturbances due to local factors; (3) grains-size differences are too subtle to infer different sedimentary processes and environments. The upper part of varve structure in core NAS-1 shows the most perceptible difference after 1972 (see discussion below). In spring, river discharge reaches annual peaks and sediment transport capacities that are then not reached again during the rest of the summer and autumn (Figs. 2, 3c, 11). However, the presence of thin coarser intercalated sub-layers in the upper part of the detrital layer indicates that some rainfall events, as observed in Fig. 11 (i.e., 1983, 1987, 1992 and 1999), also contribute to the deposition of sediments in this layer. The overlying autumn and winter layer resulted from the settling and flocculation of fine particles under non-turbulent conditions from autumn through to the onset of lake ice, forming a typical clay cap.
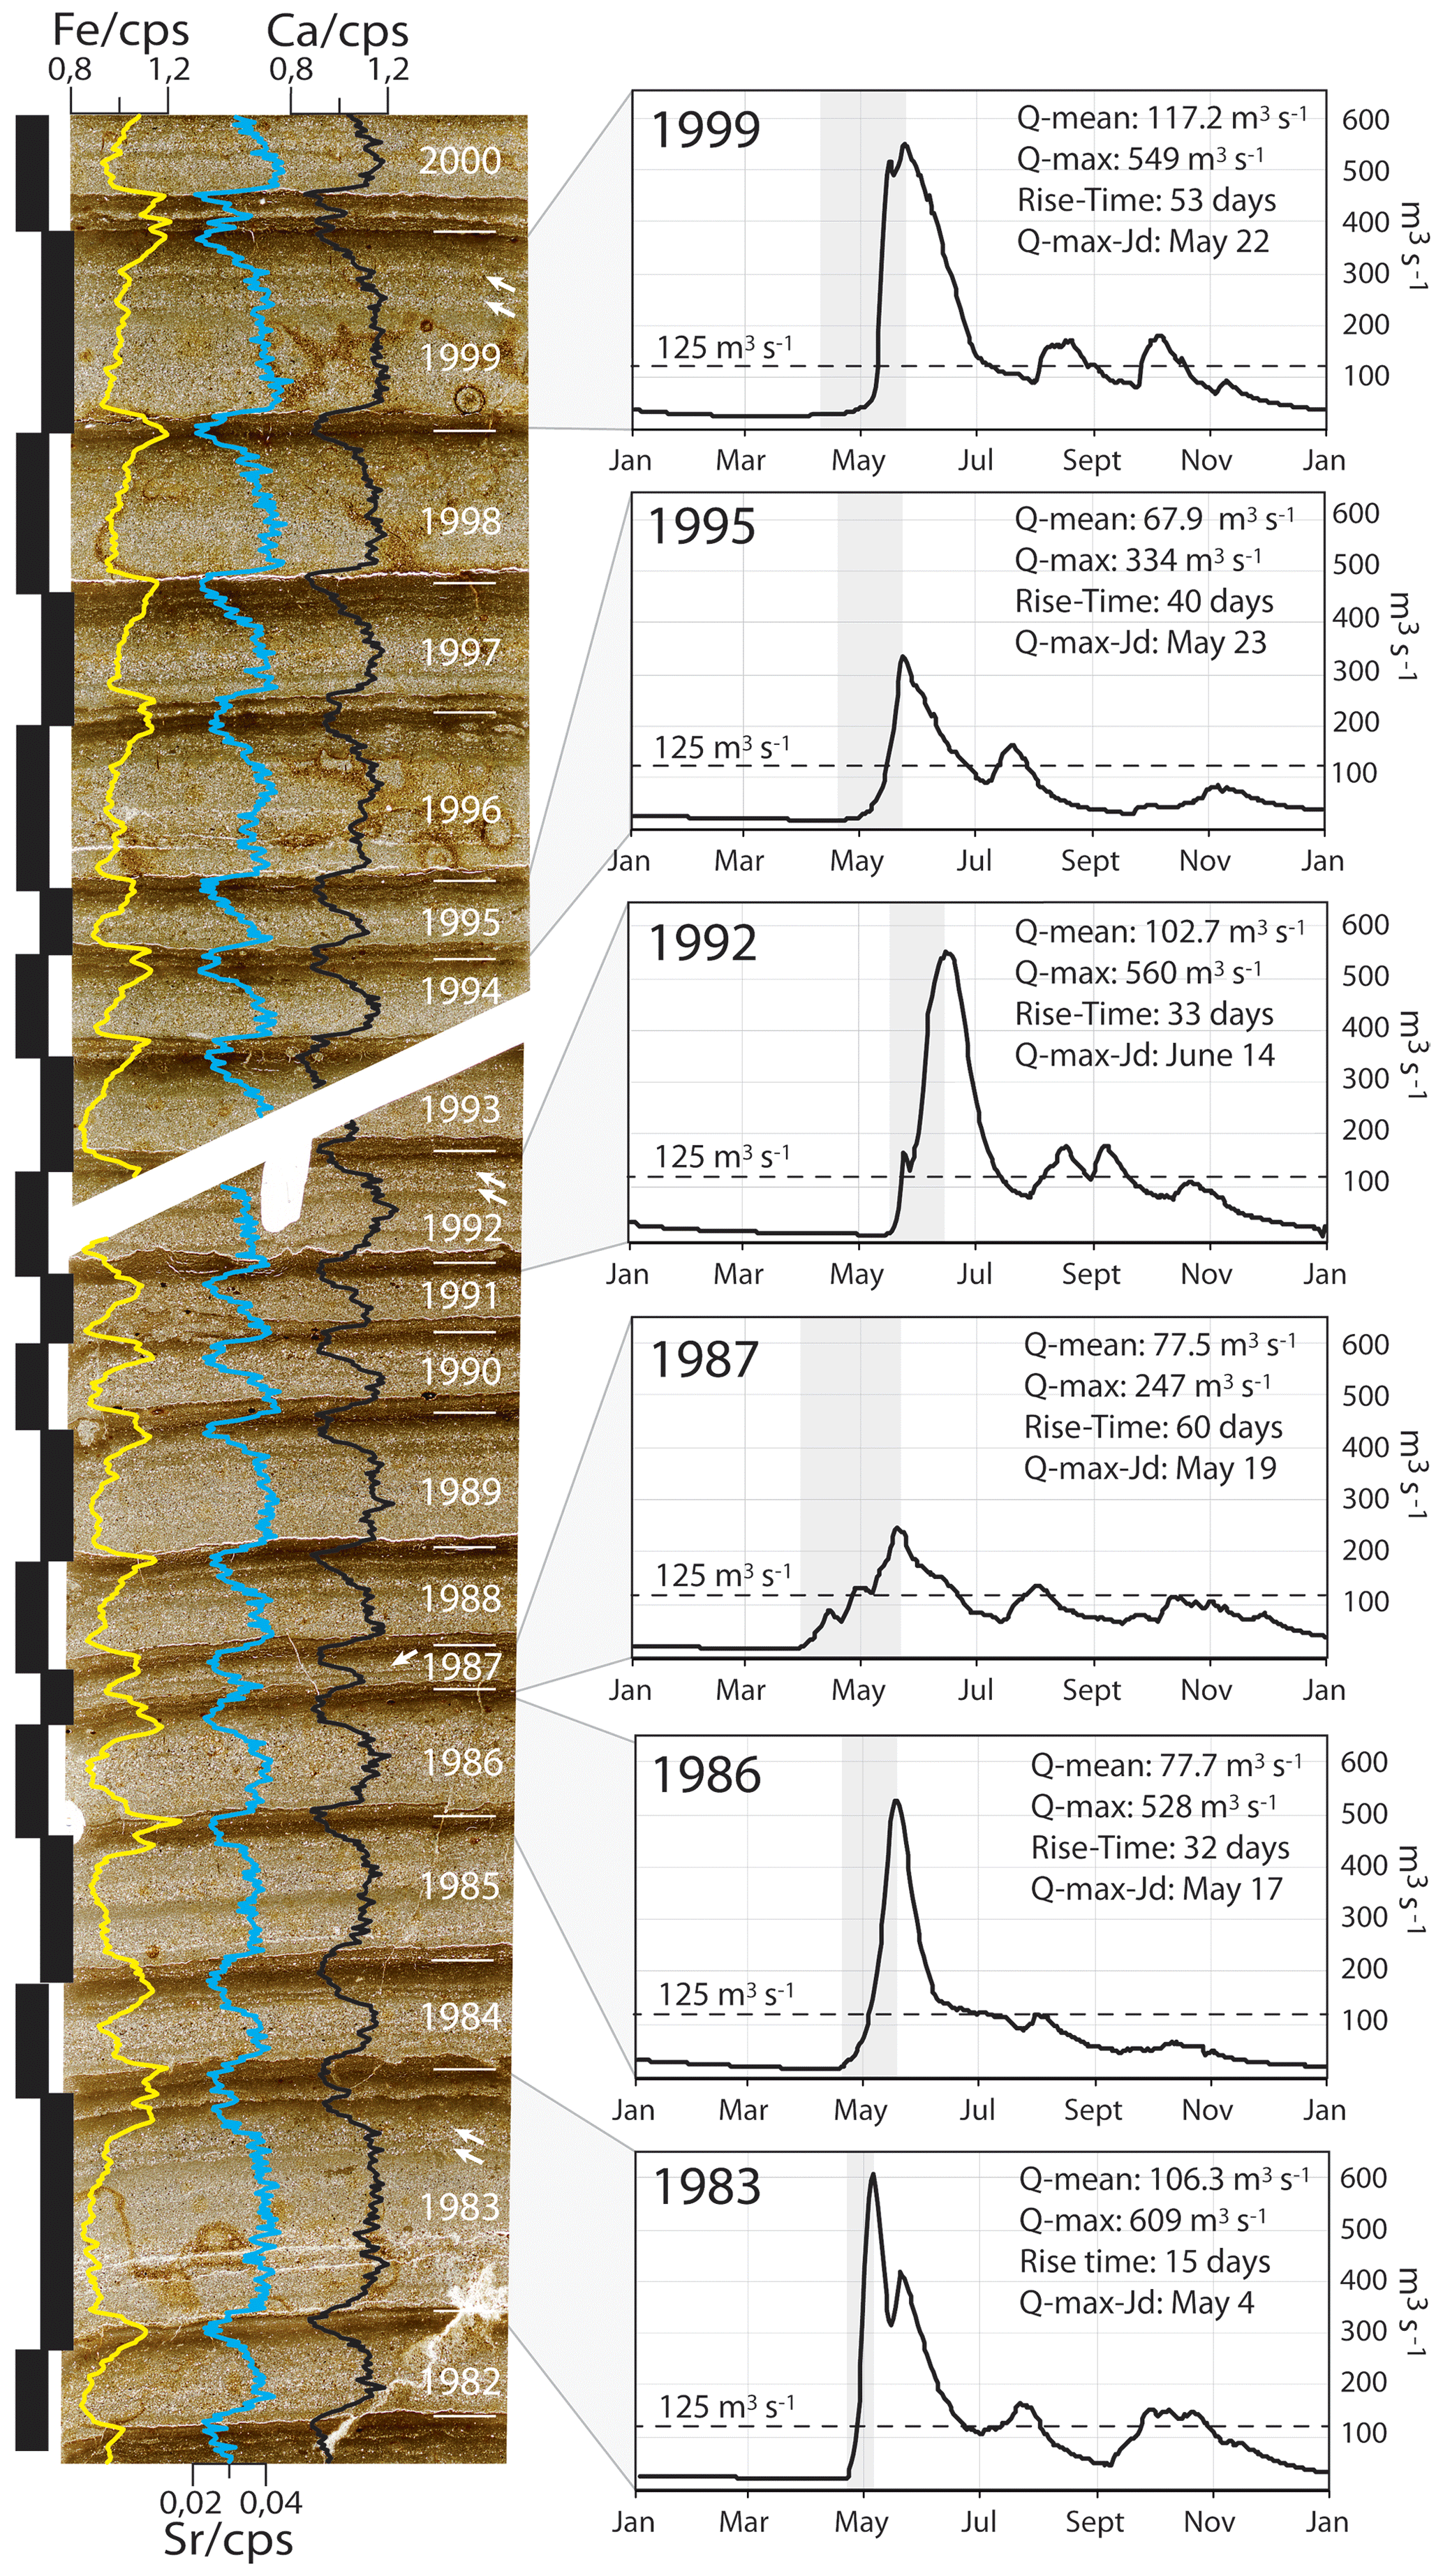
Figure 11Qualitative comparison between NAS-1A varves from thin sections (delimited by the black bars) and the hydrographs of the Naskaupi River. Observed annual Q-mean and Q-max as well as the timing and rise time of the peak spring discharge are shown. Black dotted lines represent the discharge threshold of ∼125 m3 s−1. The years 1999, 1992, 1986 and 1983 represent strong spring floods associated with thick coarse varves. The years 1995 and 1987 represent low spring floods associated with thin varves. The years 1999, 1992, 1987 and 1983 represent coarser intercalated sub-layers in the upper part of the detrital layer linked with summer and autumn high-discharge events. The year 1986 represents a strong spring flood with a low summer and autumn flow associated with a varve without substructure. Thin sections are overlain by iron (Fe, yellow line), strontium (Sr, blue line) and calcium (Ca, black line) relative intensities. See Fig. 5 for thin sections locations.
5.2 Anthropogenic influences on recent sedimentation
Anthropogenic environmental impacts on watersheds can be preserved in varved lake sediments (Zolitschka et al., 2015; Saarni et al., 2016; Czymzik et al., 2018). Changes observed in physical parameters of the varves deposited pre- and post-1971 at the NAS sites suggest that the effect of the dyke system on the Naskaupi River sediment inputs is perceptible in the Grand Lake varved sequence. The well-developed layers of varves deposited prior to 1972 from sites NAS-1 (Fig. 6b) and NAS-2 as well as the similarity between TVT and DLT values and variations among all sites over the 1856–1971 period (Fig. 6d) indicate that seasonal sedimentation cycles appeared to have reached a relative state of equilibrium prior to the Naskaupi River diversion. The reduction of nearly half of the area of the Naskaupi River watershed, due to its diversion in April 1971, reduced the water inflows and changed the base level of the downstream river system. The rapid base level fall must have triggered modifications in the fluvial dynamics from late-spring to winter 1971 (i.e., channel incision, bank destabilization, and upstream knickpoint migration), likely increasing the availability of sediments in the river system. The Naskaupi River spring/summer/autumn flood(s) of 1972 then remobilized and transported a large amount of newly available floodplain sediment. This major sediment discharge plunged into Grand Lake and extended as hyperpycnal flow at the axis of the Naskaupi River, depositing a thick and coarse-grained turbidite following the lake bathymetry. This 1972 marker bed suggests that the Naskaupi River diversion had an impact on sedimentation at sites NAS-1 and NAS-2.
The thin early spring layers free of ice-rafted debris in varve post-1971 in cores NAS-1 (Figs. 5a, 11) and NAS-2 indicate a decrease in the capacity of early spring discharge to transport fine sediments and its ability to float ice to Grand Lake (see Sect. 4.1) due to the reduction in water supply caused by the Naskaupi River diversion. The increases in the thickness and particle size values of the detrital layers post-1971 in core NAS-1 (Figs. 5a, 6b, 7b, 11) suggest that the diversion has affected sedimentation at this site over time. During the 1972–2016 period, the river floodplain morphology must have been in a re-equilibration phase favourable to erosion, sediment transport, and deposition of thicker and coarser detrital layers. Since the river diversion, detrital layers at the NAS-1 site appear to have become more sensitive to maximum spring discharge variations than to mean annual discharges. The sensitivity of the more proximal NAS-1 site to Naskaupi River extreme discharge variability may partly explain why better results are obtained without the 1972–2016 period when reconstructing Q-mean and by keeping this period when reconstructing Q-max. The negative correlations between P99D0 of core NAS-1 and the timing and rise time of spring discharge (Table 3) also demonstrate reactivity to spring entrainment energy conditions at this site. The distal NAS-2 site shows that sedimentation seems to have slightly lost sensitivity to river discharge post-1971 and that sediment input continued to decline at the beginning of the deep lake basin. The increase in sediment input at the NAS-1 site after 1971 contrasts with the decrease in sediment input at the NAS-2 site. This recent difference in sedimentation between these two sites could be explained by the increased availability of sediments for erosion on the floodplain, which would have favoured the accumulation of additional sediments mainly on the front of the delta (NAS-1), whereas the reduction in maximum discharges due to a smaller watershed would have resulted in a decrease in the river's transport capacity to site NAS-2.
It is indeed tempting to link the decrease in varve thickness in core NAS-2 over the 1972–2016 period to the discharge reduction due to the river diversion. However, similarities with core BEA-1, a site devoid of anthropogenic perturbations (unaffected by the Naskaupi River diversion) which also shows a decline in varve thickness, suggest that this decrease could potentially be due to natural hydro-climatic conditions. The observed Naskaupi River Q-mean series also show a decrease in the 1978–2011 period. Indeed, because of the distant location of site BEA-1 from the Naskaupi River mouth, the diversion is most likely not responsible for the decrease in varve thickness in this sector. Moreover, it is quite unlikely that the sedimentary input from the Naskaupi River contributed to sediment accumulation at the mouth of the Beaver River. The absence of any traces of the 1972 marker bed at the Beaver River mouth (BEA-1) supports this hypothesis. Furthermore, the thickness decrease observed in BEA-1 began after ∼1920 (Fig. 6a), which is before the 1971 diversion.
Anthropogenic modification of the Naskaupi River watershed makes it challenging to discuss natural hydroclimate-related variations before and after 1971. Some caution should be applied when comparing pre- and post-1972 reconstructions, given the changes in watershed conditions that happened after the construction of the system of dykes. There are no instrumental data available for the Naskaupi River watershed before 1971 to confirm that the calibration model post-diversion (1978–2011) is similarly robust for the preceding period. The river diversion affected the Naskaupi River sedimentation dynamics but did not modify it drastically. Despite the observed post-diversion changes in varves' physical parameters in cores NAS-1 and NAS-2, which are moderate, the varves still responded directly to variations in river discharge. In addition, the part of the watershed that has been diverted is an area composed mainly of lakes, which are not very hydrologically reactive.
5.3 The hydrological signal in the varve record
The significant correlations between continuous varve thickness and particle size measurements with instrumental hydrological variables (Table 3) show that Grand Lake varved sediments are reliable proxies to reconstruct past hydrologic conditions through time at the annual to seasonal scale. The thick and/or coarse-grained varves correspond well to years of high river discharges, whereas thin and/or fine-grained varves are related to years of low discharge. Moreover, Fig. 11 clearly demonstrates how the Grand Lake varve record can be exploited to examine the interaction between meteorological conditions and river discharge at an inter-seasonal scale, which is a temporal resolution rarely obtained with natural proxies.
Data from the three sites were combined in order to better capture the regional hydrological signal and to somehow attenuate the noise that is inherent from the analysis of a single core in a very large lake. A single core will be more sensitive to local specificities and is probably less representative of the entire hydrogram. The Beaver and the Naskaupi rivers have adjacent catchments that share the same climatological and geological characteristics, whereas the Beaver River's catchment is devoid of anthropogenic modifications. The combination of varve parameters from different coring sites with distinct sediment sources (Fig. 1b) improved the correlations with local and regional hydrological variables (Table 3) and, thus, the reconstructions (Figs. 8, 9). Integrating core BEA into the combined data allows one to capture the hydrological signal from a larger region (Naskaupi and Beaver watersheds), and it helps to capture the natural hydrological signal in our combined series used for reconstructions.
As demonstrated by previous studies on varved sediments, the use of both varve thickness and particle size analysis allows for a more specific investigation of the range of hydroclimate conditions recorded within varves (Francus et al., 2002a; Cockburn and Lamoureux, 2008; Lapointe et al., 2012). For Grand Lake, the combined DLT is found to be the best proxy to reconstruct all hydrological events occurring throughout the year (Q-mean). DLT series are better at predicting Q-mean because the early spring layer's and autumn and winter layers' thickness are more variable and are included in the TVT measurements. This variability can be linked to specific climatic and geomorphological parameters such as the duration of ice cover on Grand Lake and the Naskaupi River ice break-up processes which induce noise in the hydrologic signal contained in TVT series. The combined P99D0 yields the strongest correlation in our dataset (Table 3) and is the best proxy to reconstruct maximum annual discharges (Q-max). This result is logical because the peak discharge is controlling the competence of the river and, consequently, the size of the particles that can be transported. Moreover, this indicator is not sensitive to sediment compaction, which may affect other proxies based on thickness.
The significant positive correlations between varve physical parameters and Q-max and Q-nival (Table 3) demonstrate that Grand Lake varve predominantly reflects spring discharge conditions (e.g., Ojala and Alenius, 2005; Lamoureux et al., 2006; Saarni et al., 2016; Czymzik et al., 2018), which is the major component of the regional streamflow regimes classified as nival (snowmelt dominated) (Bonsal et al., 2019). In boreal regions, the intensity and length of spring floods are controlled by the snow accumulation during winter and by the temperature of the melting period (Hardy et al., 1996; Snowball et al., 1999; Cockburn and Lamoureux, 2008; Ojala et al., 2013; Saarni et al., 2017). The negative correlation between P99D0 of the NAS-1 and the timing and rise time of spring discharge suggests that early spring flows that increase rapidly are conducive conditions for high entrainment energy and the deposition of coarser laminations on the distal part of the delta slope (Fig. 11; site NAS-1). The erosion of detrital materials in early spring increases when snowmelt runoffs occur on soils that are not yet stabilized and protected by vegetation (Ojala and Alenius, 2005; Czymzik et al., 2018).
Intercalated sub-layers in the upper part of the detrital layer are interpreted to be produced by summer or fall rainfall events (Fig. 11). The significant positive correlations between varve thickness and Nb-days-SupQ80 suggests that a daily discharge of ∼125 m3 s−1 represents an approximate threshold above which the deposition of coarse sediments in Grand Lake (detrital layers) is more likely to occur (Fig. 11) (e.g., Czymzik et al., 2010; Kämpf et al., 2014). According to the instrumental data (Figs. 2, 11), such discharge can be generated during the summer/autumn period, confirming that rainfall events can indeed be triggering the deposition of the thin intercalated sub-layers observed in the upper part of the detrital layers (Fig. 11).
The comparison between the Naskaupi River hydrological variables and other Labrador hydrometric stations (Fig. 3) show that a coherent regional hydrological pattern exists in the Labrador region. The performed regional Q-mean reconstitution and validation (Fig. 9) indicated that the Labrador region hydrologic signal is recorded in the Grand Lake varve sequence. The local and regional Q-mean reconstructions from the combined DLT series (without the NAS-1 1972–2016 period) suggest a statistically significant decreasing trend in mean annual discharge during the last 90 years. Naskaupi River Q-mean and Q-max reconstructions based on both varve series and rainfall–runoff modelling revealed high-value periods from 1975 to 1985 and from 1995 to 2005, and low-value periods from 1986 to 1994 and from 2006 to 2016 (Fig. 10). These results agree with the downward trend of the annual streamflow observed in eastern Canada during the 20th century in other studies and also with the reported higher river discharges from 1970 to 1979 and from 1990 to 2007, and lower discharges from 1980 to 1989 (Zhang et al., 2001; Sveinsson et al., 2008; Jandhyala et al., 2009; Déry et al., 2009; Mortsch et al., 2015; Dinis et al., 2019).
In addition to providing a new high-quality varved record in eastern Canada, this research highlights the complementarity between palaeohydrological reconstructions extracted from clastic varved sediments and rainfall–runoff modelling. Both methods independently offer a similar, yet robust, centennial perspective on river discharge variability in an important region for the economic and sustainable development of water resources in Canada. Reconstructed long-term mean and maximum annual river discharge series provide valuable quantitative information particularly for water supply management for hydropower generation and the estimation of flood and drought hazards. The varved sediment of Grand Lake also allows for documentation of the effect of dyke systems on the downstream sediment transport dynamic into a watershed and its implication for palaeohydrological reconstruction. Further investigation of the impacts of the Naskaupi watershed reduction on sediment transport could help better refine these reconstructions. Future work in Grand Lake should be directed towards the high-resolution analysis of long sediment cores in order to produce longer reconstructions. The Grand Lake deeper varved sequence potentially recorded the hydro-climatic variability that occurred during the late Holocene in a region sensitive to the North Atlantic climate, allowing interesting prospects into large-scale atmospheric and oceanic modes of variability.
The great depth of Grand Lake, the availability of fine sediments along its tributaries and its important seasonal river inflow have favoured the formation and preservation of fluvial clastic laminated sediments. By using a new varved record in eastern Canada and a rainfall–runoff modelling approach, this paper provides a better understanding of the recording of hydrological conditions in large and deep boreal lakes and allows for the extension of the discharge series beyond the instrumental period as well as the spatial coverage of the rare annual palaeohydrological proxies in North America. The key results of this study are as follows:
-
The annual character of the 160-year-long lamination sequence has been confirmed. Each varve, composed of an early spring layer, a spring/summer/autumn detrital layer, and an autumn and winter layer, represents 1 hydrological year.
-
Grand Lake varve formation is mainly related to the largest hydrological event of the year, the spring discharge, with contributions from summer and autumn rainfall events.
-
Two hydrological parameters, the Naskaupi River Q-mean and Q-max annual discharges, are robustly reconstructed from two independent varves' physical parameters, i.e., the detrital layer thickness (DLT) and grain size (P99D0) respectively, over the 1856–2016 period. The reconstructed Q-mean series suggest that high Q-mean years occurred during the 1920–1960 period and that a decrease in Q-mean takes place during the second half of the 20th century.
-
The same two hydrological parameters (Q-mean and Q-max) were also reconstructed using the ANATEM rainfall–runoff model. ANATEM discharge series show similarities with reconstructions based on the varved series, which support the reliability of the two independent reconstruction approaches.
-
The statistically significant relation between combined DLT series and the observed Labrador region Q-mean series, extracted from five watersheds with different sizes and locations, demonstrates that Grand Lake varved sequence can also be used as a proxy for regional river discharge conditions.
-
The effects of Naskaupi River dyking in 1971 are clearly visible in the sedimentary record and affected sedimentary patterns afterwards. While this event makes the hydroclimatic reconstruction trickier, it remains that the outstanding quality of this varved sequence provides one of the best hydroclimatic reconstruction from a sedimentary record, with Pearson correlation coefficients of up to r=0.75.
The dataset used in this study can be found at https://doi.org/10.5683/SP2/SAI39X (Gagnon-Poiré, 2021).
The supplement related to this article is available online at: https://doi.org/10.5194/cp-17-653-2021-supplement.
This study is part of AGP's thesis under the supervision of PF and PL. APT and PL provided geophysical data (Fig. 1b, c) and useful information on the morpho-stratigraphical framework of Grand Lake. AGP and DF conducted the coring field trip. AGP and PB collected instrumental data. PB calculated hydrological variables from instrumental data (Fig. 3) and performed the rainfall–runoff modelling. HD and AGP adapted the code used to establish the relationship between the varve parameters and the instrumental data and for the regression model. AGP performed most of the data analysis, wrote the paper and created the figures with contributions from PF and PB. All authors provided valuable feedback and contributed to the improvement of the paper.
The author Pierre Francus is a member of the editorial board of the journal.
The authors are grateful to Arnaud De Coninck, David Deligny and Louis-Frédéric Daigle for their participation during fieldwork and in the laboratory as well as for helpful discussions. We greatly thank Wanda and Dave Blake from North West River for their guiding experience and accommodation at Grand Lake. We thank the Labrador Institute at North West River for the use of their facility during fieldwork. We want to thank Stéphane Ferré from the Micro-Geoarchaeology Laboratory of the Center for Northern Studies (CEN) in Québec, QC, Canada, for the production of the high-quality thin sections used in this study. We would also like to thank the three reviewers for their constructive review of this article. Finally, many thanks to Monique Gagnon, Charles Smith and Clarence Gagnon for reviewing the English of an earlier version of the paper.
This research has been supported by a Natural Sciences and Engineering Research Council of Canada, Ouranos, Hydro-Québec and Manitoba Hydro grant (grant no. 341054318) awarded to Étienne Boucher, Pierre Francus, Patrick Lajeunesse and Dominique Arseneault; the Fonds de recherche du Québec–Nature et Technologies through a doctoral (B2X) research scholarship (grant no. 207471) to Antoine Gagnon-Poiré; and the Make Our Planet Great Again Short Stay program grant (grant no. mopga-short-0000000032) at Université Côte d’Azur, Nice, France, to Antoine Gagnon-Poiré and Pierre Brigode. The fieldwork campaigns have been supported by the POLAR Knowledge Canada through the Northern Scientific Training Program grant to Antoine Gagnon-Poiré and Pierre Francus.
This paper was edited by Keely Mills and reviewed by Krystopher Chutko and two anonymous referees.
Amann, B., Szidat, S., and Grosjean, M.: A millennial-long record of warm season precipitation and flood frequency for the North-western Alps inferred from varved lake sediments: implications for the future, Quaternary Sci. Rev., 115, 89–100, https://doi.org/10.1016/j.quascirev.2015.03.002, 2015.
Anderson, T.: Rivers of Labrador, Canadian Special Publication of Fisheries and Aquatic Sciences, 81, Department of Fisheries and Oceans, Ottawa, Ontario, 1985.
Arsenault, R., Bazile, R., Ouellet Dallaire, C., and Brissette, F.: CANOPEX: A Canadian hydrometeorological watershed database, Hydrological Processes, 30, 2734–2736, https://doi.org/10.1002/hyp.10880, 2016.
Bégin, C., Gingras, M., Savard, M. M., Marion, J., Nicault, A., and Bégin, Y.: Assessing tree-ring carbon and oxygen stable isotopes for climate reconstruction in the Canadian northeastern boreal forest, Palaeogeogr. Palaeoclimatol. Palaeoecol., 423, 91–101, https://doi.org/10.1016/j.palaeo.2015.01.021, 2015.
Bégin, Y., Nicault, A., Bégin, C., Savard, M. M., Arseneault, D., Berninger, F., Guiot, J., Boreux, J.-J., and Perreault, L.: Analyse dendrochronologique des variations passées du régime hydro climatique au complexe de la grande rivière dans le Nord du Québec, La Houille Blanche, 6, 70–77, https://doi.org/10.1051/lhb:2007085, 2007.
Bonsal, B. R., Peters, D. L., Seglenieks, F., Rivera, A., and Berg, A.: Changes in freshwater availability across Canada, in: Canada's Changing Climate Report, edited by: Bush E. and Lemmen, D. S., Government of Canada, Ottawa, Ontario, 2019.
Boucher, É., Ouarda, T. B., Bégin, Y., and Nicault, A.: Spring flood reconstruction from continuous and discrete tree ring series, Water. Resour. Res., 47, W07516, https://doi.org/10.1029/2010WR010131, 2011.
Boucher, E., Nicault, A., Arseneault, D., Bégin, Y., and Karami, M. P.: Decadal Variations in Eastern Canada's Taiga Wood Biomass Production Forced by Ocean-Atmosphere Interactions, Sci. Rep.-UK., 7, 1–13, https://doi.org/10.1038/s41598-017-02580-9, 2017.
Briffa, K., Jones, P., Pilcher, J., and Hughes, M.: Reconstructing summer temperatures in northern Fennoscandinavia back to AD 1700 using tree-ring data from Scots pine, Arct. Antartic Alp. Res., 20, 385–394, https://doi.org/10.2307/1551336, 1988.
Brigode, P., Brissette, F., Nicault, A., Perreault, L., Kuentz, A., Mathevet, T., and Gailhard, J.: Streamflow variability over the 1881–2011 period in northern Québec: comparison of hydrological reconstructions based on tree rings and geopotential height field reanalysis, Clim. Past, 12, 1785–1804, https://doi.org/10.5194/cp-12-1785-2016, 2016.
Cherry, J. E., Knapp, C., Trainor, S., Ray, A. J., Tedesche, M., and Walker, S.: Planning for climate change impacts on hydropower in the Far North, Hydrol. Earth Syst. Sci., 21, 133–151, https://doi.org/10.5194/hess-21-133-2017, 2017.
Cockburn, J. M. and Lamoureux, S. F.: Inflow and lake controls on short-term mass accumulation and sedimentary particle size in a High Arctic lake: implications for interpreting varved lacustrine sedimentary records, J. Paleolimnol., 40, 923–942, https://doi.org/10.1007/s10933-008-9207-5, 2008.
Collins, M., Knutti, R., Arblaster, J., Dufresne, J.-L., Fichefet, T., Friedlingstein, P., Gao, X., Gutowski, W. J., Johns, T., Krinner, G., Shongwe, M., Tebaldi, C., Weaver, A. J., Wehner, M. F., Allen, M. R., Andrews, T., Beyerle, U., Bitz, C. M., Bony, S., and Booth, B. B. B.: Long-term climate change: projections, commitments and irreversibility, in: Climate Change 2013 – The Physical Science Basis, Contribution of Working Group I to the Fifth Assessment Report of the Intergovernmental Panel on Climate Change, Intergovernmental Panel on Climate Change, Cambridge University Press, 1029–1136, 2013.
Compo, G. P., Whitaker, J. S., Sardeshmukh, P. D., Matsui, N., Allan, R. J., Yin, X., Gleason, B. E., Vose, R. S., Rutledge, G., and Bessemoulin, P.: The twentieth century reanalysis project, Q. J. Roy. Meteorol. Soc., 137, 1–28, https://doi.org/10.1002/qj.776, 2011.
Cook, E. R., Meko, D. M., Stahle, D. W., and Cleaveland, M. K.: Drought reconstructions for the continental United States, J. Climate, 12, 1145–1162, https://doi.org/10.1175/1520-0442(1999)012<1145:DRFTCU>2.0.CO;2, 1999.
Coron, L., Thirel, G., Delaigue, O., Perrin, C., and Andréassian, V.: The suite of lumped GR hydrological models in an R package, Environ. Modell. Softw., 94, 166–171, https://doi.org/10.1016/j.envsoft.2017.05.002, 2017.
Croudace, I. W., Rindby, A., and Rothwell, R. G.: ITRAX: description and evaluation of a new multi-function X-ray core scanner, Geological Society, London, Special Publications, 267, 51–63, https://doi.org/10.1144/GSL.SP.2006.267.01.04, 2006.
Cuven, S., Francus, P., and Lamoureux, S. F.: Estimation of grain size variability with micro X-ray fluorescence in laminated lacustrine sediments, Cape Bounty, Canadian High Arctic, J. Paleolimnol., 44, 803–817, https://doi.org/10.1007/s10933-010-9453-1, 2010.
Cuven, S., Francus, P., and Lamoureux, S.: Mid to Late Holocene hydroclimatic and geochemical records from the varved sediments of East Lake, Cape Bounty, Canadian High Arctic, Quaternary Sci. Rev., 30, 2651–2665, https://doi.org/10.1016/j.quascirev.2011.05.019, 2011.
Czymzik, M., Dulski, P., Plessen, B., Von Grafenstein, U., Naumann, R., and Brauer, A.: A 450 year record of spring-summer flood layers in annually laminated sediments from Lake Ammersee (southern Germany), Water. Resour. Res., 46, https://doi.org/10.1029/2009WR008360, 2010.
Czymzik, M., Haltia, E., Saarni, S., Saarinen, T., and Brauer, A.: Differential North Atlantic control of winter hydroclimate in late Holocene varved sediments of Lake Kortejärvi, eastern Finland, Boreas, 47, 926–937, https://doi.org/10.1111/bor.12315, 2018.
D'Arrigo, R., Buckley, B., Kaplan, S., and Woollett, J.: Interannual to multidecadal modes of Labrador climate variability inferred from tree rings, Clim. Dyn., 20, 219–228, https://doi.org/10.1007/s00382-002-0275-3, 2003.
Déry, S. J. and Wood, E. F.: Decreasing river discharge in northern Canada, Geophys. Res. Lett., 32, L10401, https://doi.org/10.1029/2005GL022845, 2005.
Dinis, L., Bégin, C., Savard, M. M., Marion, J., Brigode, P., and Alvarez, C.: Tree-ring stable isotopes for regional discharge reconstruction in eastern Labrador and teleconnection with the Arctic Oscillation, Clim. Dyn., 53, 3625–3640, https://doi.org/10.1007/s00382-019-04731-2, 2019.
Fitzhugh, W.: Environmental Approaches to the Prehistory of the North, Journal of the Washington Academy of Sciences, 63, 39–53, 1973.
Francus, P.: An image-analysis technique to measure grain-size variation in thin sections of soft clastic sediments, Sedimentary Geol., 121, 289–298, https://doi.org/10.1016/S0037-0738(98)00078-5, 1998.
Francus, P. and Cosby, C. A.: Sub-sampling unconsolidated sediments: A solution for the preparation of undistrubed thin-sections from clay-rich sediments, J. Paleolimnol., 26, 323–326, https://doi.org/10.1023/A:1017572602692, 2001.
Francus, P. and Karabanov, E.: A computer-assisted thin-section study of Lake Baikal sediments: a tool for understanding sedimentary processes and deciphering their climatic signal, Int. J. Earth. Sci., 89, 260–267, https://doi.org/10.1007/s005319900064, 2000.
Francus, P. and Nobert, P.: An integrated computer system to acquire, process, measure and store images of laminated sediments, in: 4th International limnogeology congress, Barcelona, 11–14 July 2007, SAT-P04, 2007.
Francus, P., Bradley, R. S., Abbott, M. B., Patridge, W., and Keimig, F.: Paleoclimate studies of minerogenic sediments using annually resolved textural parameters, Geophys. Res. Lett., 29, 59-51–59-54, https://doi.org/10.1029/2002GL015082, 2002a.
Francus, P., Keimig, F., and Besonen, M.: An algorithm to aid varve counting and measurement from thin-sections, J. Paleolimnol., 28, 283–286, https://doi.org/10.1023/A:1021624415920, 2002b.
Fulton, R. J.: Suficial geology, Red Wine River, Labrador, Newfoundland; Geological Survey of Canada, Map 162A1, scale 1:500 000, https://doi.org/10.4095/126473, 1986.
Gagnon-Poiré, A.: Dataset for the paper entitled “Reconstructing past hydrology of eastern Canadian boreal catchments using clastic varved sediments and hydro-climatic modelling: 160 years of fluvial inflows”, Scholars Portal Dataverse, V1, https://doi.org/10.5683/SP2/SAI39X, 2021.
Gilbert, R. and Desloges, J. R.: Late glacial and Holocene sedimentary environments of Quesnel Lake, British Columbia, Geomorphology, 179, 186–196, https://doi.org/10.1016/j.geomorph.2012.08.010, 2012.
Gupta, H. V., Kling, H., Yilmaz, K. K., and Martinez, G. F.: Decomposition of the mean squared error and NSE performance criteria: Implications for improving hydrological modelling, J. Hydrol., 377, 80–91, https://doi.org/10.1016/j.jhydrol.2009.08.003, 2009.
Hardy, D. R., Bradley, R. S., and Zolitschka, B.: The climatic signal in varved sediments from Lake C2, northern Ellesmere Island, Canada, J. Paleolimnol., 16, 227–238, https://doi.org/10.1007/BF00176938, 1996.
Heideman, M., Menounos, B., and Clague, J. J.: An 825-year long varve record from Lillooet Lake, British Columbia, and its potential as a flood proxy, Quaternary. Sci. Rev., 126, 158–174, https://doi.org/10.1016/j.quascirev.2015.08.017, 2015.
Jandhyala, V. K., Liu, P., and Fotopoulos, S. B.: River stream flows in the northern Québec Labrador region: A multivariate change point analysis via maximum likelihood, Water. Resour. Res., 45, W02408, https://doi.org/10.1029/2007WR006499, 2009.
Kämpf, L., Brauer, A., Swierczynski, T., Czymzik, M., Mueller, P., and Dulski, P.: Processes of flood-triggered detrital layer deposition in the varved Lake Mondsee sediment record revealed by a dual calibration approach, J. Quaternary Sci., 29, 475–486, https://doi.org/10.1002/jqs.2721, 2014.
Kaufman, C. A., Lamoureux, S. F., and Kaufman, D. S.: Long-term river discharge and multidecadal climate variability inferred from varved sediments, southwest Alaska, Quaternary Res., 76, 1–9, https://doi.org/10.1016/j.yqres.2011.04.005, 2011.
Kuentz, A., Mathevet, T., Gailhard, J., and Hingray, B.: Building long-term and high spatio-temporal resolution precipitation and air temperature reanalyses by mixing local observations and global atmospheric reanalyses: the ANATEM model, Hydrol. Earth Syst. Sci., 19, 2717–2736, https://doi.org/10.5194/hess-19-2717-2015, 2015.
Kylander, M. E., Ampel, L., Wohlfarth, B., and Veres, D.: High-resolution X-ray fluorescence core scanning analysis of Les Echets (France) sedimentary sequence: new insights from chemical proxies, J. Quaternary Sci., 26, 109–117, https://doi.org/10.1002/jqs.1438, 2011.
Lamoureux, S.: Five centuries of interannual sediment yield and rainfall-induced erosion in the Canadian High Arctic recorded in lacustrine varves, Water. Resour. Res., 36, 309–318, https://doi.org/10.1029/1999WR900271, 2000.
Lamoureux, S. F.: Embedding unfrozen lake sediments for thin section preparation, J. Paleolimnol., 10, 141–146, https://doi.org/10.1007/BF00682510, 1994.
Lamoureux, S. F.: Catchment and lake controls over the formation of varves in monomictic Nicolay Lake, Cornwall Island, Nunavut, Canadian J. Earth Sci., 36, 1533–1546, https://doi.org/10.1139/e99-040, 1999.
Lamoureux, S. F. and Gilbert, R.: A 750-yr record of autumn snowfall and temperature variability and winter storminess recorded in the varved sediments of Bear Lake, Devon Island, Arctic Canada, Quaternary Research, 61, 134–147, https://doi.org/10.1016/j.yqres.2003.11.003, 2004.
Lamoureux, S. F., Stewart, K. A., Forbes, A. C., and Fortin, D.: Multidecadal variations and decline in spring discharge in the Canadian middle Arctic since 1550 AD, Geophys. Res. Lett., 33, L02403, https://doi.org/10.1029/2005GL024942, 2006.
Lapointe, F., Francus, P., Lamoureux, S. F., Saïd, M., and Cuven, S.: 1750 years of large rainfall events inferred from particle size at East Lake, Cape Bounty, Melville Island, Canada, J. paleolimnol., 48, 159–173, https://doi.org/10.1007/s10933-012-9611-8, 2012.
Linderholm, H. W., Nicolle, M., Francus, P., Gajewski, K., Helama, S., Korhola, A., Solomina, O., Yu, Z., Zhang, P., D'Andrea, W. J., Debret, M., Divine, D. V., Gunnarson, B. E., Loader, N. J., Massei, N., Seftigen, K., Thomas, E. K., Werner, J., Andersson, S., Berntsson, A., Luoto, T. P., Nevalainen, L., Saarni, S., and Väliranta, M.: Arctic hydroclimate variability during the last 2000 years: current understanding and research challenges, Clim. Past, 14, 473–514, https://doi.org/10.5194/cp-14-473-2018, 2018.
Ljungqvist, F. C., Krusic, P. J., Sundqvist, H. S., Zorita, E., Brattström, G., and Frank, D.: Northern Hemisphere hydroclimate variability over the past twelve centuries, Nature, 532, 94–98, https://doi.org/10.1038/nature17418, 2016.
Mangili, C., Brauer, A., Moscariello, A., and Naumann, R.: Microfacies of detrital event layers deposited in Quaternary varved lake sediments of the Piànico-Sèllere Basin (northern Italy), Sedimentology, 52, 927–943, https://doi.org/10.1111/j.1365-3091.2005.00717.x, 2005.
Mortsch, L., Cohen, S., and Koshida, G.: Climate and water availability indicators in Canada: Challenges and a way forward. Part II – Historic trends, Can. Water Resour. J., 40, 146–159, https://doi.org/10.1080/07011784.2015.1006024, 2015.
Naulier, M., Savard, M. M., Bégin, C., Gennaretti, F., Arseneault, D., Marion, J., Nicault, A., and Bégin, Y.: A millennial summer temperature reconstruction for northeastern Canada using oxygen isotopes in subfossil trees, Clim. Past, 11, 1153–1164, https://doi.org/10.5194/cp-11-1153-2015, 2015.
Nicault, A., Boucher, E., Bégin, C., Guiot, J., Marion, J., Perreault, L., Roy, R., Savard, M. M., and Bégin, Y.: Hydrological reconstruction from tree-ring multi-proxies over the last two centuries at the Caniapiscau Reservoir, northern Québec, Canada, J. Hydrol., 513, 435–445, https://doi.org/10.1016/j.jhydrol.2014.03.054, 2014.
Normandeau, A., Lajeunesse, P., Poiré, A. G., and Francus, P.: Morphological expression of bedforms formed by supercritical sediment density flows on four fjord-lake deltas of the south-eastern Canadian Shield (Eastern Canada), Sedimentology, 63, 2106–2129, https://doi.org/10.1111/sed.12298, 2016.
Ojala, A. E. and Alenius, T.: 10 000 years of interannual sedimentation recorded in the Lake Nautajärvi (Finland) clastic–organic varves, Palaeogeogr. Palaeoclimatol. Palaeoecol., 219, 285–302, https://doi.org/10.1016/j.palaeo.2005.01.002, 2005.
Ojala, A. E., Kosonen, E., Weckström, J., Korkonen, S., and Korhola, A.: Seasonal formation of clastic-biogenic varves: the potential for palaeoenvironmental interpretations, GFF, 135, 237–247, https://doi.org/10.1080/11035897.2013.801925, 2013.
Oudin, L., Hervieu, F., Michel, C., Perrin, C., Andréassian, V., Anctil, F., and Loumagne, C.: Which potential evapotranspiration input for a lumped rainfall–runoff model?: Part 2 – Towards a simple and efficient potential evapotranspiration model for rainfall–runoff modelling, J. Hydrol., 303, 290–306, https://doi.org/10.1016/j.jhydrol.2004.08.026, 2005.
Perrin, C., Michel, C., and Andréassian, V.: Improvement of a parsimonious model for streamflow simulation, J. Hydrol., 279, 275–289, https://doi.org/10.1016/S0022-1694(03)00225-7, 2003.
R Core Team: R: A Language and Environment for Statistical Computing, R Foundation for Statistical Computing, Vienna, Austria, available at: http://www.R-project.org/, last access: 15 January 2019.
Riley, J. L., Notzl, L., and Greene, R.: Labrador Nature Atlas: Vol. II, Ecozones, coregions and Ecodistricts, Nature Conservancy of Canada, Toronto, Ontario, 128 pp., ISBN 978-1-897386-29-3, 2013.
Ritchie, J. C. and McHenry, J. R.: Application of radioactive fallout cesium‐137 for measuring soil erosion and sediment accumulation rates and patterns: A review, J. Environ. Qual., 19, 215–233, https://doi.org/10.2134/jeq1990.00472425001900020006x, 1990.
Rohde, R., Muller, R., Jacobsen, R., Muller, E., Perlmutter, S., Rosenfeld, A., Wurtele, J., Groom, D., and Wickham, C.: A New Estimate of the Average Earth Surface Land Temperature Spanning 1753 to 2011, Geoinfor. Geostat. An Overview, 1, 2, https://doi.org/10.4172/2327-4581.1000101, 2013.
Saarni, S., Saarinen, T., and Dulski, P.: Between the North Atlantic Oscillation and the Siberian High: A 4000-year snow accumulation history inferred from varved lake sediments in Finland, Holocene, 26, 423–431, https://doi.org/10.1177/0959683615609747, 2016.
Saarni, S., Lensu, A., Tammelin, M., Haltia, E., and Saarinen, T.: Winter climate signal in boreal clastic-biogenic varves: a comprehensive analysis of three varved records from 1890 to 1990 AD with meteorological and hydrological data from Eastern Finland, GFF, 139, 314–326, https://doi.org/10.1080/11035897.2017.1389984, 2017.
Schillereff, D. N., Chiverrell, R. C., Macdonald, N., and Hooke, J. M.: Flood stratigraphies in lake sediments: A review, Earth-Sci. Rev., 135, 17–37, https://doi.org/10.1016/j.earscirev.2014.03.011, 2014.
Seiller, G., Anctil, F., and Perrin, C.: Multimodel evaluation of twenty lumped hydrological models under contrasted climate conditions, Hydrol. Earth Syst. Sci., 16, 1171–1189, https://doi.org/10.5194/hess-16-1171-2012, 2012.
Snowball, I., Sandgren, P., and Petterson, G.: The mineral magnetic properties of an annually laminated Holocene lake-sediment sequence in northern Sweden, Holocene, 9, 353–362, https://doi.org/10.1191/095968399670520633, 1999.
St-Onge, G., Mulder, T., Francus, P., and Long, B.: Chapter two continuous physical properties of cored marine sediments, Dev. Mar. Geol., 1, 63–98, https://doi.org/10.1016/S1572-5480(07)01007-X, 2007.
Stocker, T. F., Qin, D., Plattner, G.-K., Tignor, M. M., Allen, S. K., Boschung, J., Nauels, A., Xia, Y., Bex, V., and Midgley, P. M.: Climate change 2013: the physical science basis. Contribution of working group I to the fifth assessment report of IPCC the intergovernmental panel on climate change, Cambridge University Press, Cambridge, UK, https://doi.org/10.1017/CBO9781107415324, 2014.
Sturm, M.: Origin and composition of clastic varves, in: Moraines and Varves: Origin, Genesis, Classification, edited by Schlüchter, C., Balkema, Rotterdam, The Netherlands, 281–285, 1979.
Sveinsson, O. G., Lall, U., Fortin, V., Perrault, L., Gaudet, J., Zebiak, S., and Kushnir, Y.: Forecasting spring reservoir inflows in Churchill Falls basin in Quebec, Canada, J. Hydrol. Eng., 13, 426–437, https://doi.org/10.1061/(Asce)1084-0699(2008)13:6(426), 2008.
Teweles Jr., S. and Wobus, H. B.: Verification of prognostic charts, B. Am. Meteorol. Soc., 35, 455–463, https://doi.org/10.1175/1520-0477-35.10.455, 1954.
Tomkins, J. D., Lamoureux, S. F., Antoniades, D., and Vincent, W. F.: Autumn snowfall and hydroclimatic variability during the past millennium inferred from the varved sediments of meromictic Lake A, northern Ellesmere Island, Canada, Quaternary Res., 74, 188–198, https://doi.org/10.1016/j.yqres.2010.06.005, 2010.
Trottier, A. P., Lajeunesse, P., Gagnon-Poiré, A., and Francus, P.: Morphological signatures of deglaciation and postglacial sedimentary processes in a deep fjord-lake (Grand Lake, Labrador), Earth Surf. Proc. Land., 45, 928–947, https://doi.org/10.1002/esp.4786, 2020.
Valéry, A., Andréassian, V., and Perrin, C.: `As simple as possible but not simpler': What is useful in a temperature-based snow-accounting routine? Part 1–Comparison of six snow accounting routines on 380 catchments, J. Hydrol., 517, 1166–1175, https://doi.org/10.1016/j.jhydrol.2014.04.059, 2014a.
Valéry, A., Andréassian, V., and Perrin, C.: `As simple as possible but not simpler': What is useful in a temperature-based snow-accounting routine? Part 2 – Sensitivity analysis of the Cemaneige snow accounting routine on 380 catchments, J. Hydrol., 517, 1176–1187, https://doi.org/10.1016/j.jhydrol.2014.04.058, 2014b.
Viau, A. E. and Gajewski, K.: Reconstructing millennial-scale, regional paleoclimates of boreal Canada during the Holocene, J. Climate, 22, 316–330, https://doi.org/10.1175/2008JCLI2342.1, 2009.
Zang, C. and Biondi, F.: treeclim: an R package for the numerical calibration of proxy-climate relationships, Ecography, 38, 431–436, https://doi.org/10.1111/ecog.01335, 2015.
Zhang, X., Harvey, K. D., Hogg, W., and Yuzyk, T. R.: Trends in Canadian streamflow, Water Resour. Res., 37, 987–998, https://doi.org/10.1029/2000WR900357, 2001.
Zolitschka, B., Francus, P., Ojala, A. E., and Schimmelmann, A.: Varves in lake sediments–a review, Quaternary Sci. Rev., 117, 1–41, https://doi.org/10.1016/j.quascirev.2015.03.019, 2015.