the Creative Commons Attribution 4.0 License.
the Creative Commons Attribution 4.0 License.
 | 25 Feb 2021
Mid-Pliocene Atlantic Meridional Overturning Circulation simulated in PlioMIP2
Xiangyu Li
Chuncheng Guo
Odd Helge Otterå
Kerim H. Nisancioglu
Ning Tan
Camille Contoux
Gilles Ramstein
Ran Feng
Bette L. Otto-Bliesner
Esther Brady
Deepak Chandan
W. Richard Peltier
Michiel L. J. Baatsen
Anna S. von der Heydt
Julia E. Weiffenbach
Christian Stepanek
Gerrit Lohmann
Qiong Zhang
Mark A. Chandler
Linda E. Sohl
Alan M. Haywood
Stephen J. Hunter
Julia C. Tindall
Charles Williams
Daniel J. Lunt
Wing-Le Chan
Ayako Abe-Ouchi
In the Pliocene Model Intercomparison Project Phase 2 (PlioMIP2), coupled climate models have been used to simulate an interglacial climate during the mid-Piacenzian warm period (mPWP; 3.264 to 3.025 Ma). Here, we compare the Atlantic Meridional Overturning Circulation (AMOC), poleward ocean heat transport and sea surface warming in the Atlantic simulated with these models. In PlioMIP2, all models simulate an intensified mid-Pliocene AMOC. However, there is no consistent response in the simulated Atlantic ocean heat transport nor in the depth of the Atlantic overturning cell. The models show a large spread in the simulated AMOC maximum, the Atlantic ocean heat transport and the surface warming in the North Atlantic. Although a few models simulate a surface warming of ∼ 8–12 ∘C in the North Atlantic, similar to the reconstruction from Pliocene Research, Interpretation and Synoptic Mapping (PRISM) version 4, most models appear to underestimate this warming. The large model spread and model–data discrepancies in the PlioMIP2 ensemble do not support the hypothesis that an intensification of the AMOC, together with an increase in northward ocean heat transport, is the dominant mechanism for the mid-Pliocene warm climate over the North Atlantic.
- Article
(4359 KB) - Full-text XML
- BibTeX
- EndNote


The mid-Piacenzian warm period (mPWP; 3.264–3.025 Ma) was a recent period of sustained warmth in geological history, with the land–sea distribution, topography and levels of greenhouse gases being comparable to today (Dowsett et al., 2010, 2016; Haywood et al., 2010, 2016a). The estimated global mean temperature during the mPWP was 2–4 ∘C higher than the pre-industrial level (e.g. Dowsett et al., 2010, 2016; Haywood et al., 2010, 2016a), and the atmospheric CO2 level was above 400 ppmv (Badger et al., 2013). Thus, the mPWP climate is often thought of as a plausible test case that has the potential to provide insights for our future climate (e.g. Zubakov and Borzenkova, 1988; Haywood et al., 2016b; Burke et al., 2018).
To understand the mPWP climate, the Pliocene Modelling Intercomparison Project (PlioMIP) Phase 1 was launched in 2010 (Haywood et al., 2010). The major forcing considered in PlioMIP1 was an increase (compared with the pre-industrial level) in the atmospheric CO2 level to 405 ppmv, combined with a modern land–sea distribution (Haywood et al., 2013). The PlioMIP1 simulations (e.g. Chan et al., 2011; Bragg et al., 2012; Contoux et al., 2012; Kamae and Ueda, 2012; Stepanek and Lohmann, 2012; Zhang et al., 2012; Chandler et al., 2013; Rosenbloom et al., 2013) showed that the global annual mean surface air temperature (SAT) was 1.9–3.6 ∘C warmer than the pre-industrial level in the multi-model ensemble mean (Haywood et al., 2013), whereas the strength of Atlantic Meridional Overturning Circulation (AMOC) was similar to the pre-industrial level (Zhang et al., 2013a). However, when compared to marine (Dowsett et al., 2012, 2013) and terrestrial reconstructions (Salzmann et al. 2013), there was a large model–data discrepancy (Haywood et al., 2013) in the North Atlantic and the land realm of the Northern Hemisphere. The PlioMIP1-simulated surface warming in the North Atlantic is ∼ 4–6 ∘C smaller than the reconstruction. Because the PlioMIP1 simulations (Zhang et al., 2013a, b) did not support a stronger Pliocene AMOC (compared with the pre-industrial level) and an inferred enhancement of Atlantic northward ocean heat transport (OHT) suggested by proxies (Dowsett et al., 1992; Raymo et al., 1996), it was difficult to explain the reconstructed strong surface warming in the high-latitude North Atlantic during the mid-Pliocene.
To further understand the mPWP climate and to improve upon the model–data discrepancy, PlioMIP Phase 2 was initiated (Haywood et al., 2016a). PlioMIP2 employs the state-of-the-art boundary conditions from the Pliocene Research, Interpretation and Synoptic Mapping (PRISM) version 4 (Dowsett et al., 2016a) and focuses on the KM5c interglacial period (3.205 Ma) during the mPWP (Haywood et al., 2016a). The PRISM4 boundary conditions include reconstructed ocean bathymetry and land–ice surface topography, and they also incorporate Pliocene soils and lakes (Dowsett et al., 2016; Haywood et al., 2016a). The most important change in boundary conditions in the northern high latitudes is the closure of the Arctic gateways, including the Canadian Archipelago and the Bering Strait (Haywood et al., 2016a). In PlioMIP2, the simulated global annual mean SAT increases by 1.7–5.2 ∘C relative to the pre-industrial level, with a multi-model mean SAT increase of 3.2 ∘C (Haywood et al., 2020). In the Arctic, the simulated annual mean SAT increases by 3.7–11.6 ∘C compared with the pre-industrial level, with a multi-model mean increase of 7.2 ∘C (de Nooijer et al., 2020).
In this study, we investigate the simulated AMOC in PlioMIP2 in order to further address the question of whether an intensified AMOC and enhanced Atlantic OHT can explain the reconstructed North Atlantic–Arctic sea surface warming during the mPWP. In Sect. 2, we briefly introduce the models that participated in PlioMIP2. In Sect. 3, we compare the simulated AMOC and Atlantic OHT between PlioMIP1 and PlioMIP2. In Sect. 4, we investigate the relationship between the simulated AMOC response and changes in North Atlantic sea surface temperature (SST). Finally, the results are discussed and summarized in Sect. 5.
Table 1Comparison of PlioMIP2 models. “PI” denotes pre-industrial, “MP” denotes mid-Pliocene and “OHT” denotes ocean heat transport.
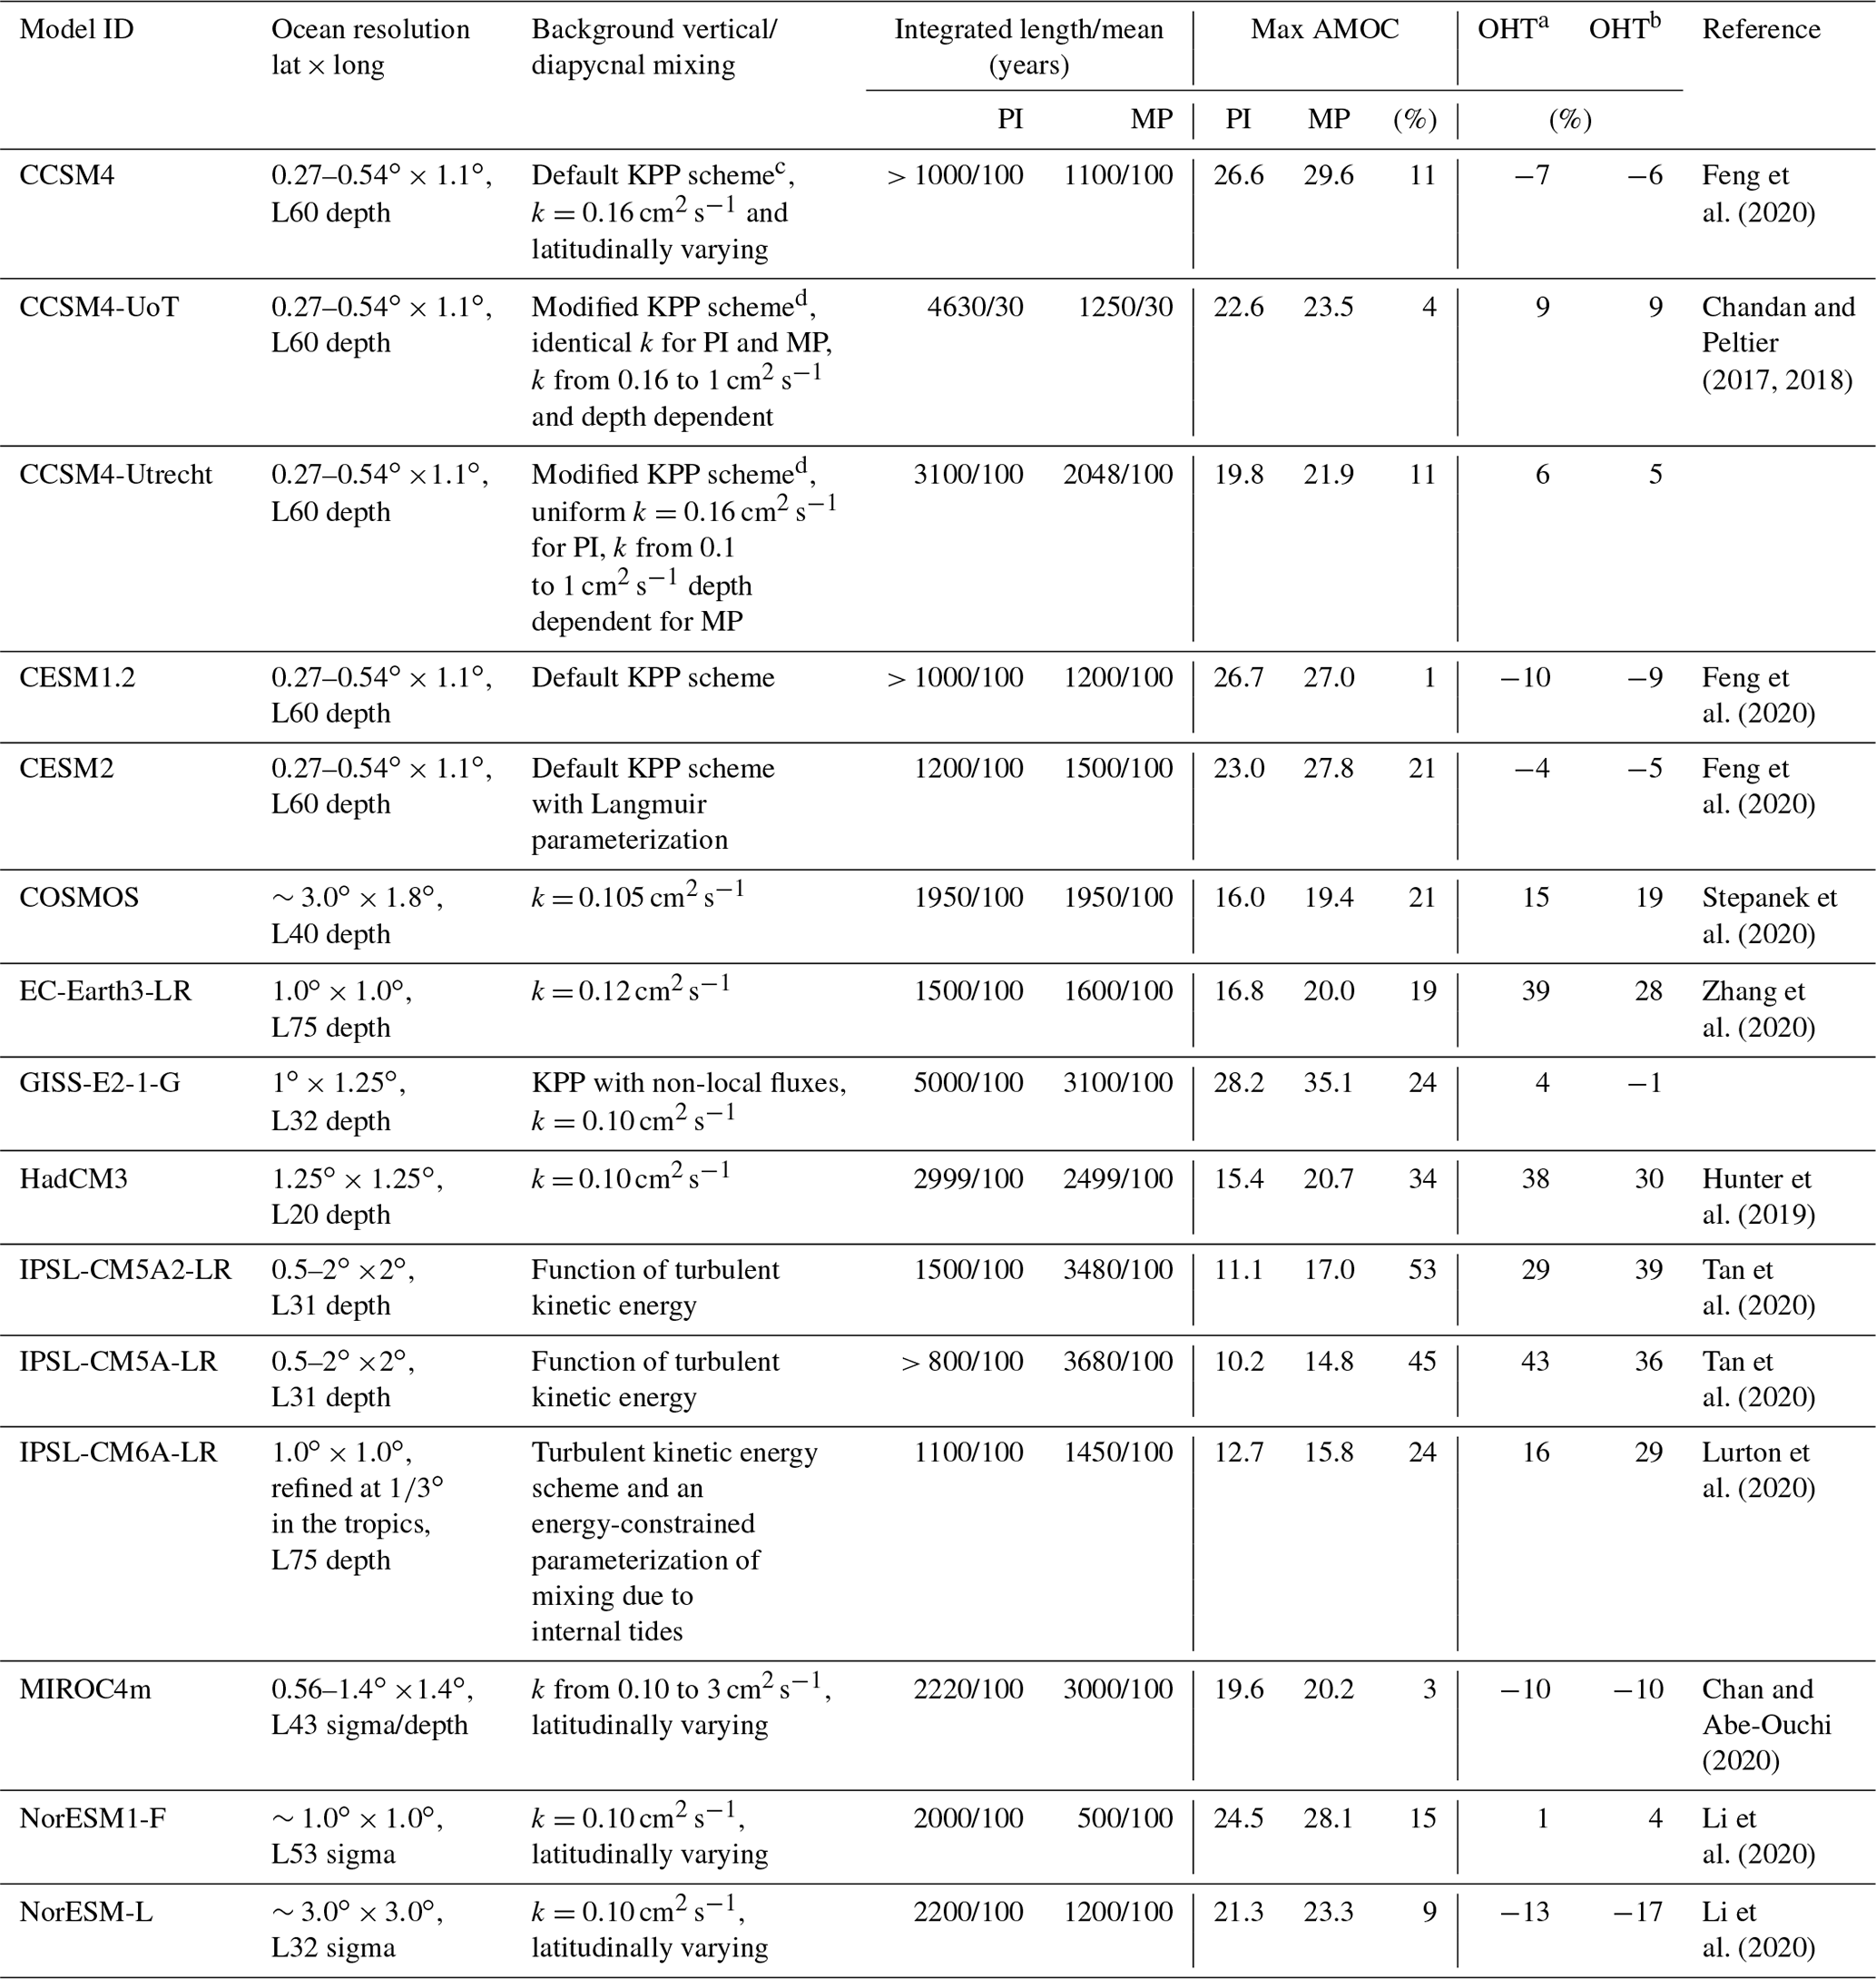
a North Atlantic ocean heat transport between 30 and 80∘ N. b Atlantic ocean heat transport between 30∘ S and 80∘ N. c KPP (K-Profile Parameterization) scheme parameterizes boundary layer mixing and internal diabatic mixing by convection, shear instability, internal waves, tides and double diffusion. d KPP parameterization but with the overflow parameterization and the tidal mixing switched off.
CESM2, EC-Earth3-LR, GISS-E2-1-G and IPSL-CM6A-LR take part in the Coupled Model Intercomparison Project (CMIP) Phase 6.
In this study, we analyse simulations with the 15 models that have participated and provided the simulated AMOC results to PlioMIP2 (Table 1). All 15 models have performed simulations according to the PlioMIP2 experimental protocol (Haywood et al., 2016asuggested by proxies). They provide the pre-industrial control experiment (pi-E280) and the mid-Pliocene experiment (midPliocene-Eoi400) as a minimum. In the mid-Pliocene experiment, a land–sea mask with the Arctic gateways closed and an atmospheric CO2 level of 400 ppmv are used. The atmospheric CO2 level is in line with the very latest high-resolution proxy reconstruction based on Boron isotopes for ∼ 3.2 Ma (Chalk et al., 2018). More details on the individual models and experimental design are introduced in a recent synthesis study (Haywood et al., 2020) and several individual modelling studies (Chandan and Peltier, 2017, 2018; Hunter et al., 2019; Chan and Abe-Ouchi, 2020; Feng et al., 2020; Li et al., 2020; Lurton et al., 2020; Stepanek et al., 2020; Tan et al., 2020; Zhang et al., 2020). In addition to these 15 models, MRI-CGCM (Kamae et al., 2016) and HadGEM3-GC31-LL have taken part in PlioMIP2. However, MRI-CGCM and HadGEM3-GC31-LL are not considered in detail here, because MRI-CGCM did not provide the AMOC results to the PlioMIP2 database, and HadGEM3-GC31-LL did not use the enhanced land–sea distribution condition with the Arctic gateways closed instead using the modern land–sea distribution. Note that five models come from the Community Climate System Model/Community Earth System Model (CCSM/CESM) family in the PlioMIP2 ensemble. To avoid these models taking undue weights in the PlioMIP2 ensemble, median instead of mean values are used in this study.
Of the 15 PlioMIP2 models used here, 6 of them also took part in PlioMIP1. They are CCSM4, COSMOS, HadCM3, IPSL-CM5A-LR, MIROC4m and NorESM-L. However, all of these six models have submitted new pre-industrial control experiments to the PlioMIP2 database. CCSM4 has also been employed in a modified form by other modelling groups and is referred to herein as CCSM4-UoT and CCSM4-Utrecht. Therefore, the pre-industrial AMOC maximums and depths in PlioMIP2 are slightly different to the values in PlioMIP1.
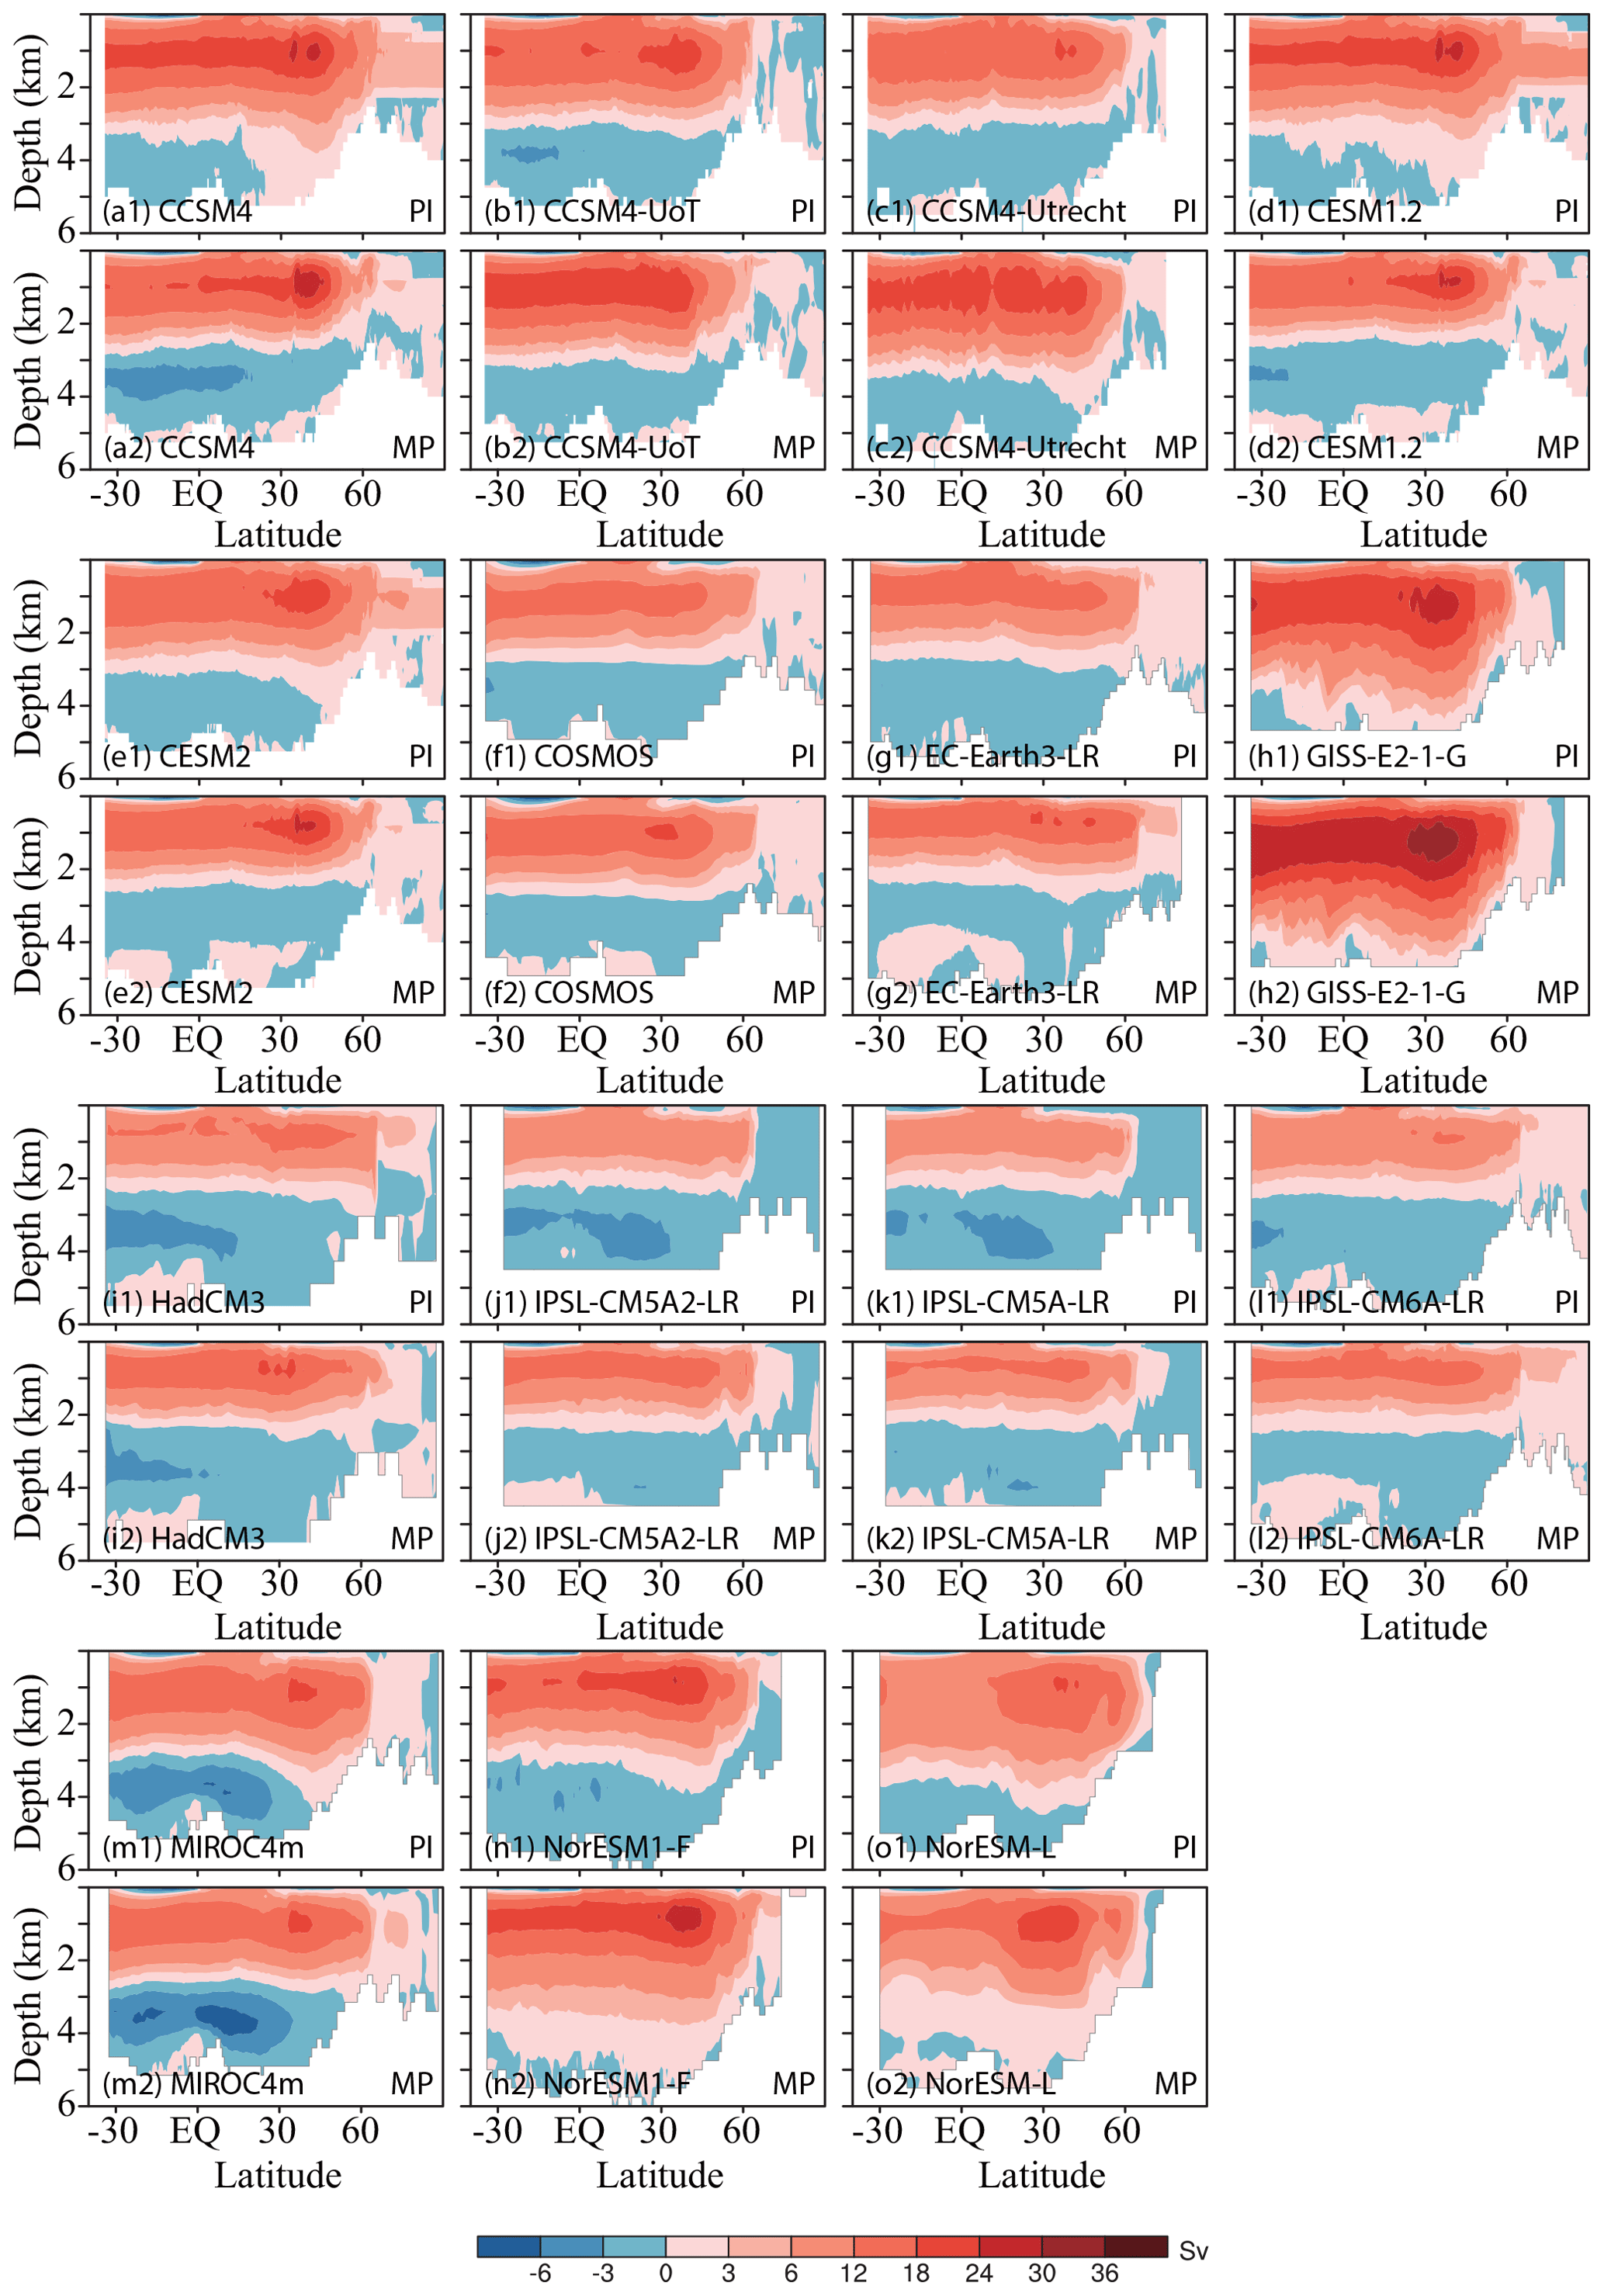
Figure 1The simulated AMOC (unit: Sv) in PlioMIP2. “PI” denotes pre-industrial, and “MP” denotes mid-Pliocene.
3.1 Simulated AMOC in PlioMIP2
The PlioMIP2 models produce reasonable simulations for the pre-industrial AMOC. The pre-industrial modelled AMOC maximums (the maximum of the Atlantic meridional overturning streamfunction) range from ∼ 10 to 28 Sv (1 Sv = 106 m3 s−1; Table 1, Fig. 1). The multi-model median value of the AMOC maximums is 19.8 Sv, which is comparable to the observational AMOC strength of 18.7 ± 2.1 Sv at 26.5∘ N (Kanzow et al. 2010). The depths of the Atlantic overturning cell range from 2300 to 3800 m.
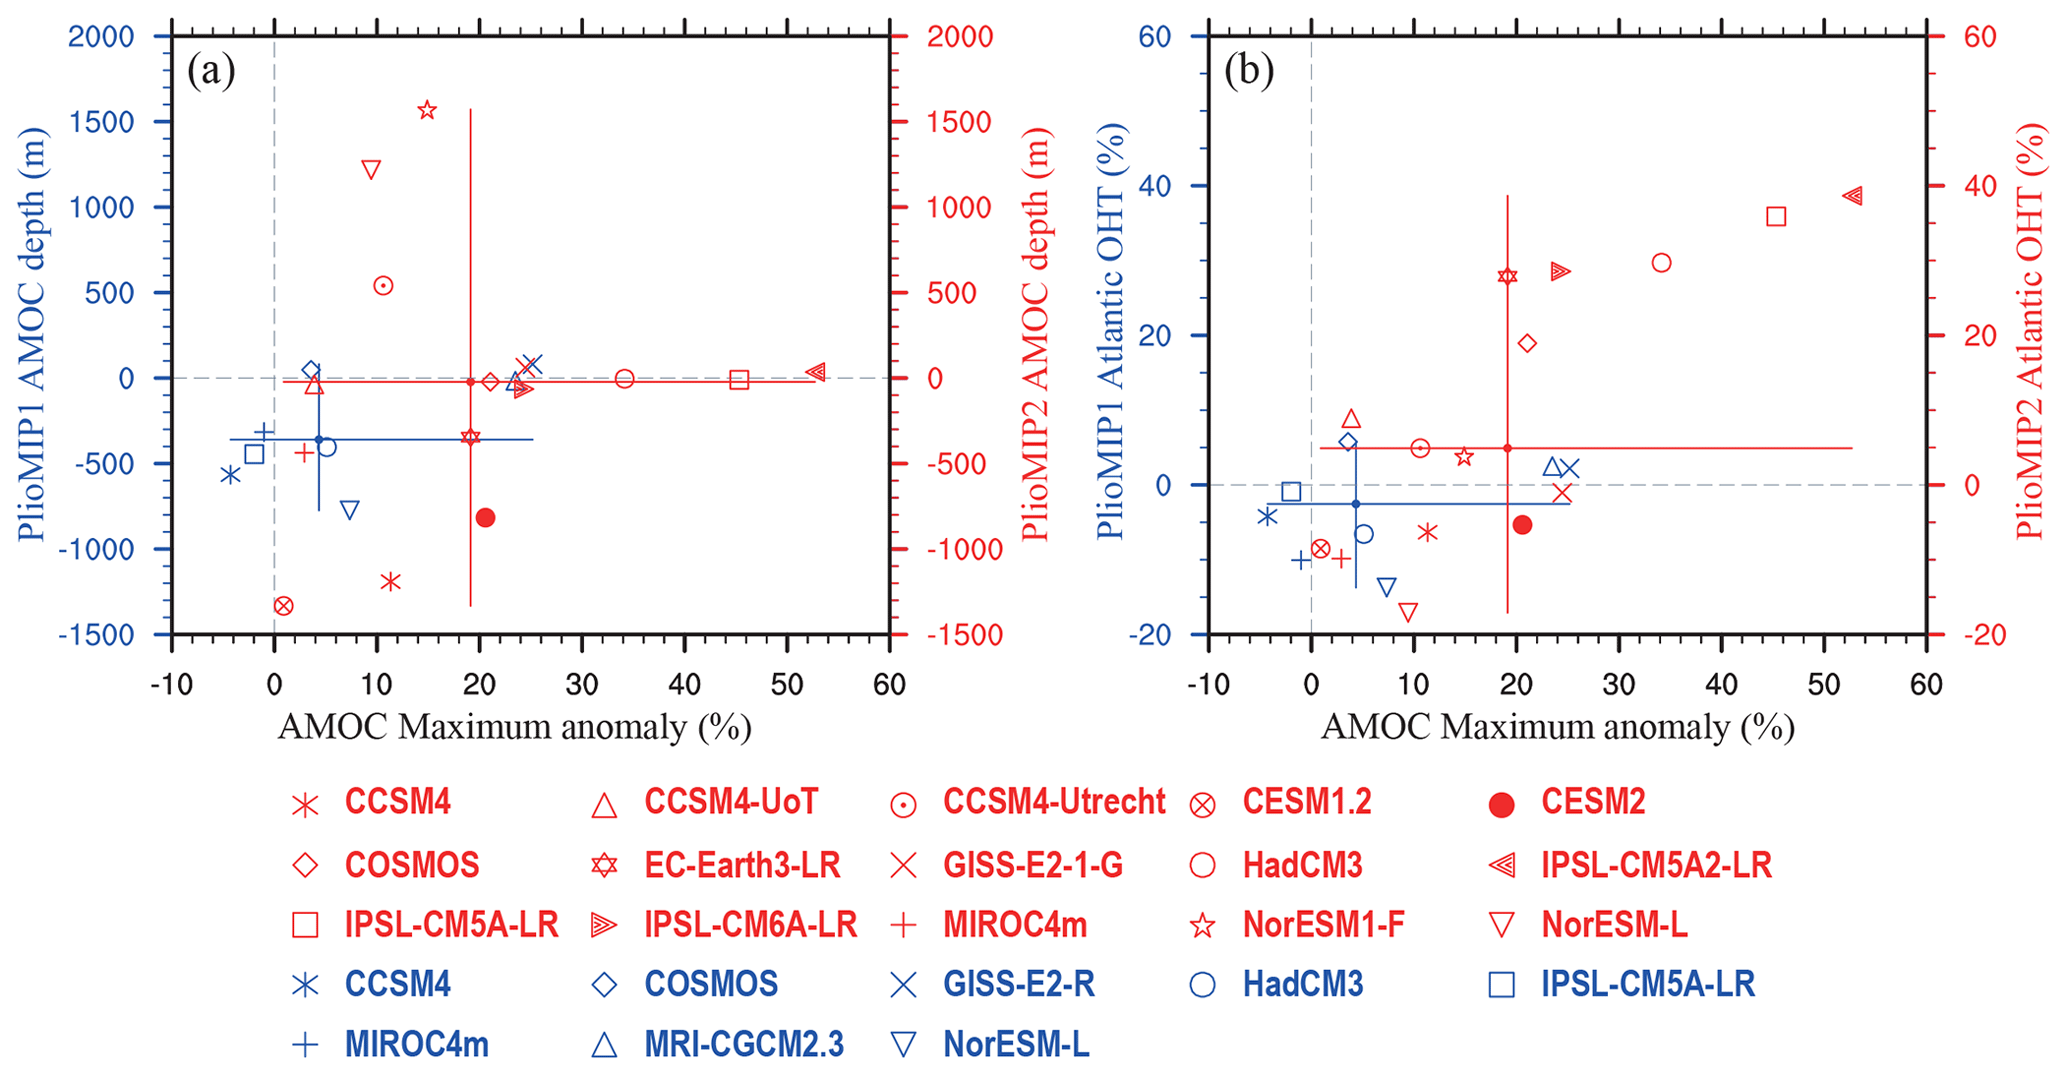
Figure 2Simulated changes in the AMOC maximum, depth and Atlantic northward OHT. (a) Changes in the AMOC maximum (unit: %) vs. responses in the mean depth of the AMOC cell (unit: m). (b) Changes in the AMOC maximum (unit: %) vs. responses in the mean ocean heat transport in the Atlantic between 30∘ S and 80∘ N (unit: %). The blue markers show the PlioMIP1 simulations, and the red markers show the PlioMIP2 simulations. The vertical and horizontal lines show the model range, and the intersection of these lines indicates the median value. Note that only the mean values of the AMOC maximum, depth and Atlantic northward OHT for each model are used here to calculate the anomalies, and significance tests are not employed.
In PlioMIP2, the models show that the maximum AMOC is enhanced by 1 % to 53 % in the mid-Pliocene, relative to the pre-industrial level (Table 1, Fig. 1). The median value of the enhancement in maximum AMOC is 19 %. Seven models (CCSM-UoT, COSMOS, GISS-E2-1-G, HadCM3, IPSL-CM5A-LR, IPSL-CM5A2-LR and IPSL-CM6A-LR) show small changes in the mean depth of the AMOC cell (the mean depth of positive streamfunction) in the mid-Pliocene (with depth changes of less than 100 m), when compared with the pre-industrial level. However, five models (CCSM4, CESM1.2, CESM2, EC-Earth3-LR and MIROC4m) simulate a shoaling of the Atlantic overturning cell for the mid-Pliocene, with a shoaling of ∼ 1190, ∼ 1330, ∼ 820, ∼ 350 and ∼ 440 m respectively. On the other hand, three models (CCSM4-Utrecht, NorESM1-F and NorESM-L) simulate a deeper mid-Pliocene Atlantic overturning cell with respective increases in the depth of ∼ 540, ∼ 1590 and ∼ 1330 m (Figs. 1, 2).
Compared with PlioMIP1 (Zhang et al., 2013a), the simulated AMOC responses to Pliocene boundary conditions are different in PlioMIP2 (Fig. 2). In PlioMIP1, there was no consistent increase in the maximum strength of the AMOC, whereas there was a consistent shoaling of the Atlantic overturning cell. However, in PlioMIP2, there is a consistent increase in the maximum strength of the AMOC, whereas there is no consistent change in the depth of Atlantic overturning cell.
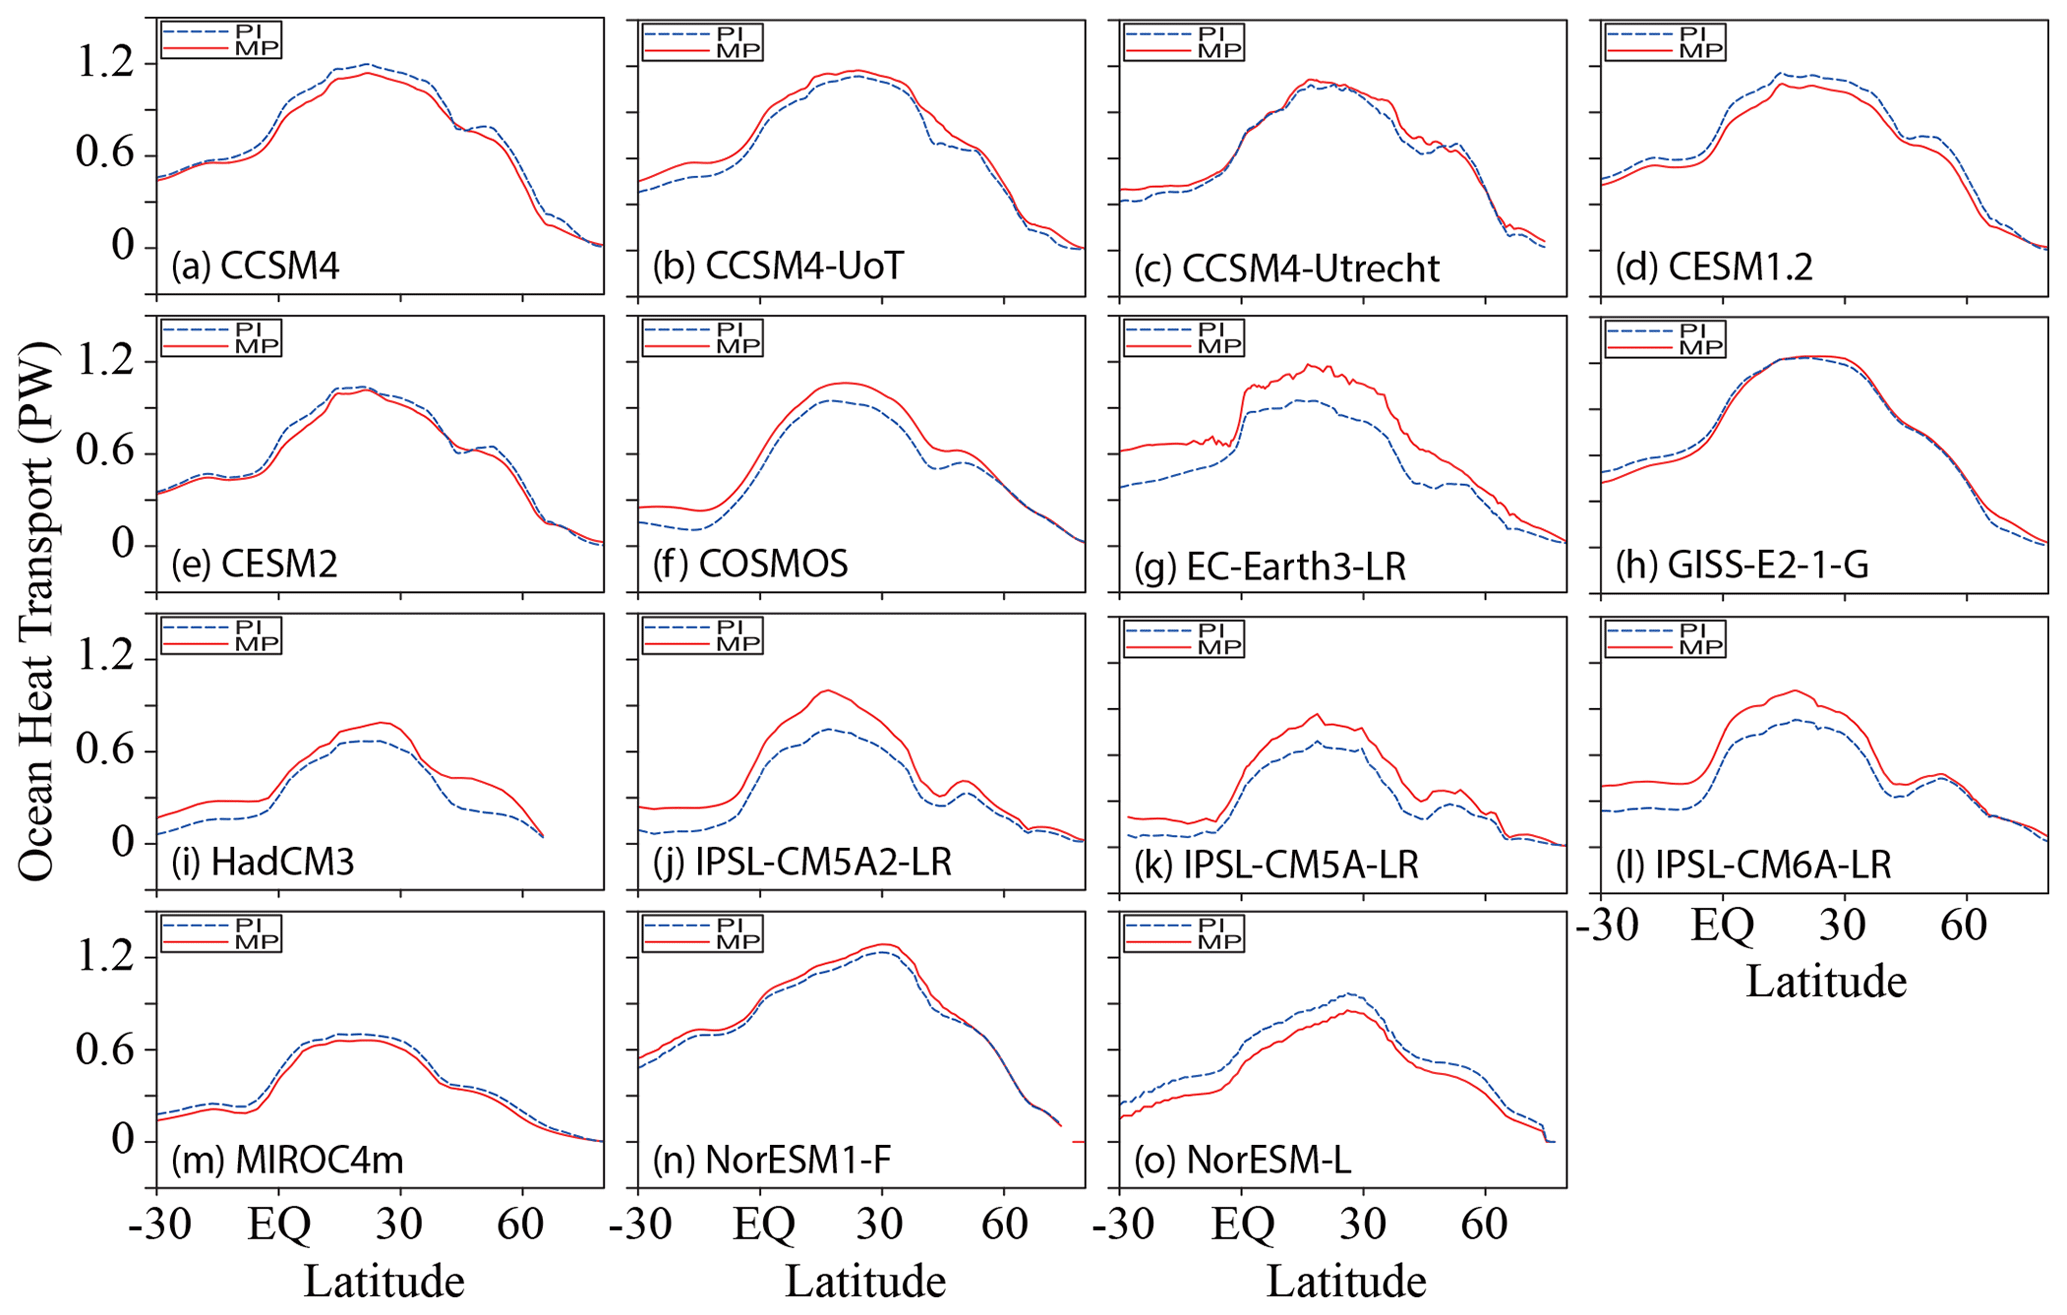
Figure 3Simulated Atlantic poleward oceanic heat transport in PlioMIP2 (unit: PW). Blue dashed lines show the pre-industrial, and red solid lines show the mid-Pliocene.
3.2 Simulated Atlantic OHT in PlioMIP2
As expected from the intensified AMOC, most models simulate an enhanced Atlantic OHT (averaged between 30∘ S and 80∘ N) in the mid-Pliocene experiments relative to the pre-industrial level (Table 1, Fig. 3). The increases range from 4 % to 39 %. The largest enhancement is found in the simulation with IPSL-CM5A2-LR, whereas the smallest enhancement is simulated with NorESM1-F. In contrast, six models (CCSM4, CESM1.2, CESM2, GISS-E2-1-G, MIROC4m and NorESM-L) show a decrease (ranging from −1 % to −17 %) in Atlantic OHT.
Obviously, there is no linear relationship between the intensification in the AMOC and the changes in mean Atlantic OHT in the PlioMIP2 simulations (Fig. 2b). For example, GISS-E2-1-G and IPSL-CM6A-LR both simulate increases of 24 % in the AMOC maximum; however, GISS-E2-1-G shows a −1 % decrease in mean Atlantic OHT, whereas IPSL-CM6A-LR shows an increase of 29 %. CCSM4 and CCSM4-Utrecht also show the same increase of 11 % in the AMOC maximum but inverse responses in the mean Atlantic OHT. This large model spread in PlioMIP2 suggests that the relationship between the AMOC strength and Atlantic northward OHT are highly model dependent.
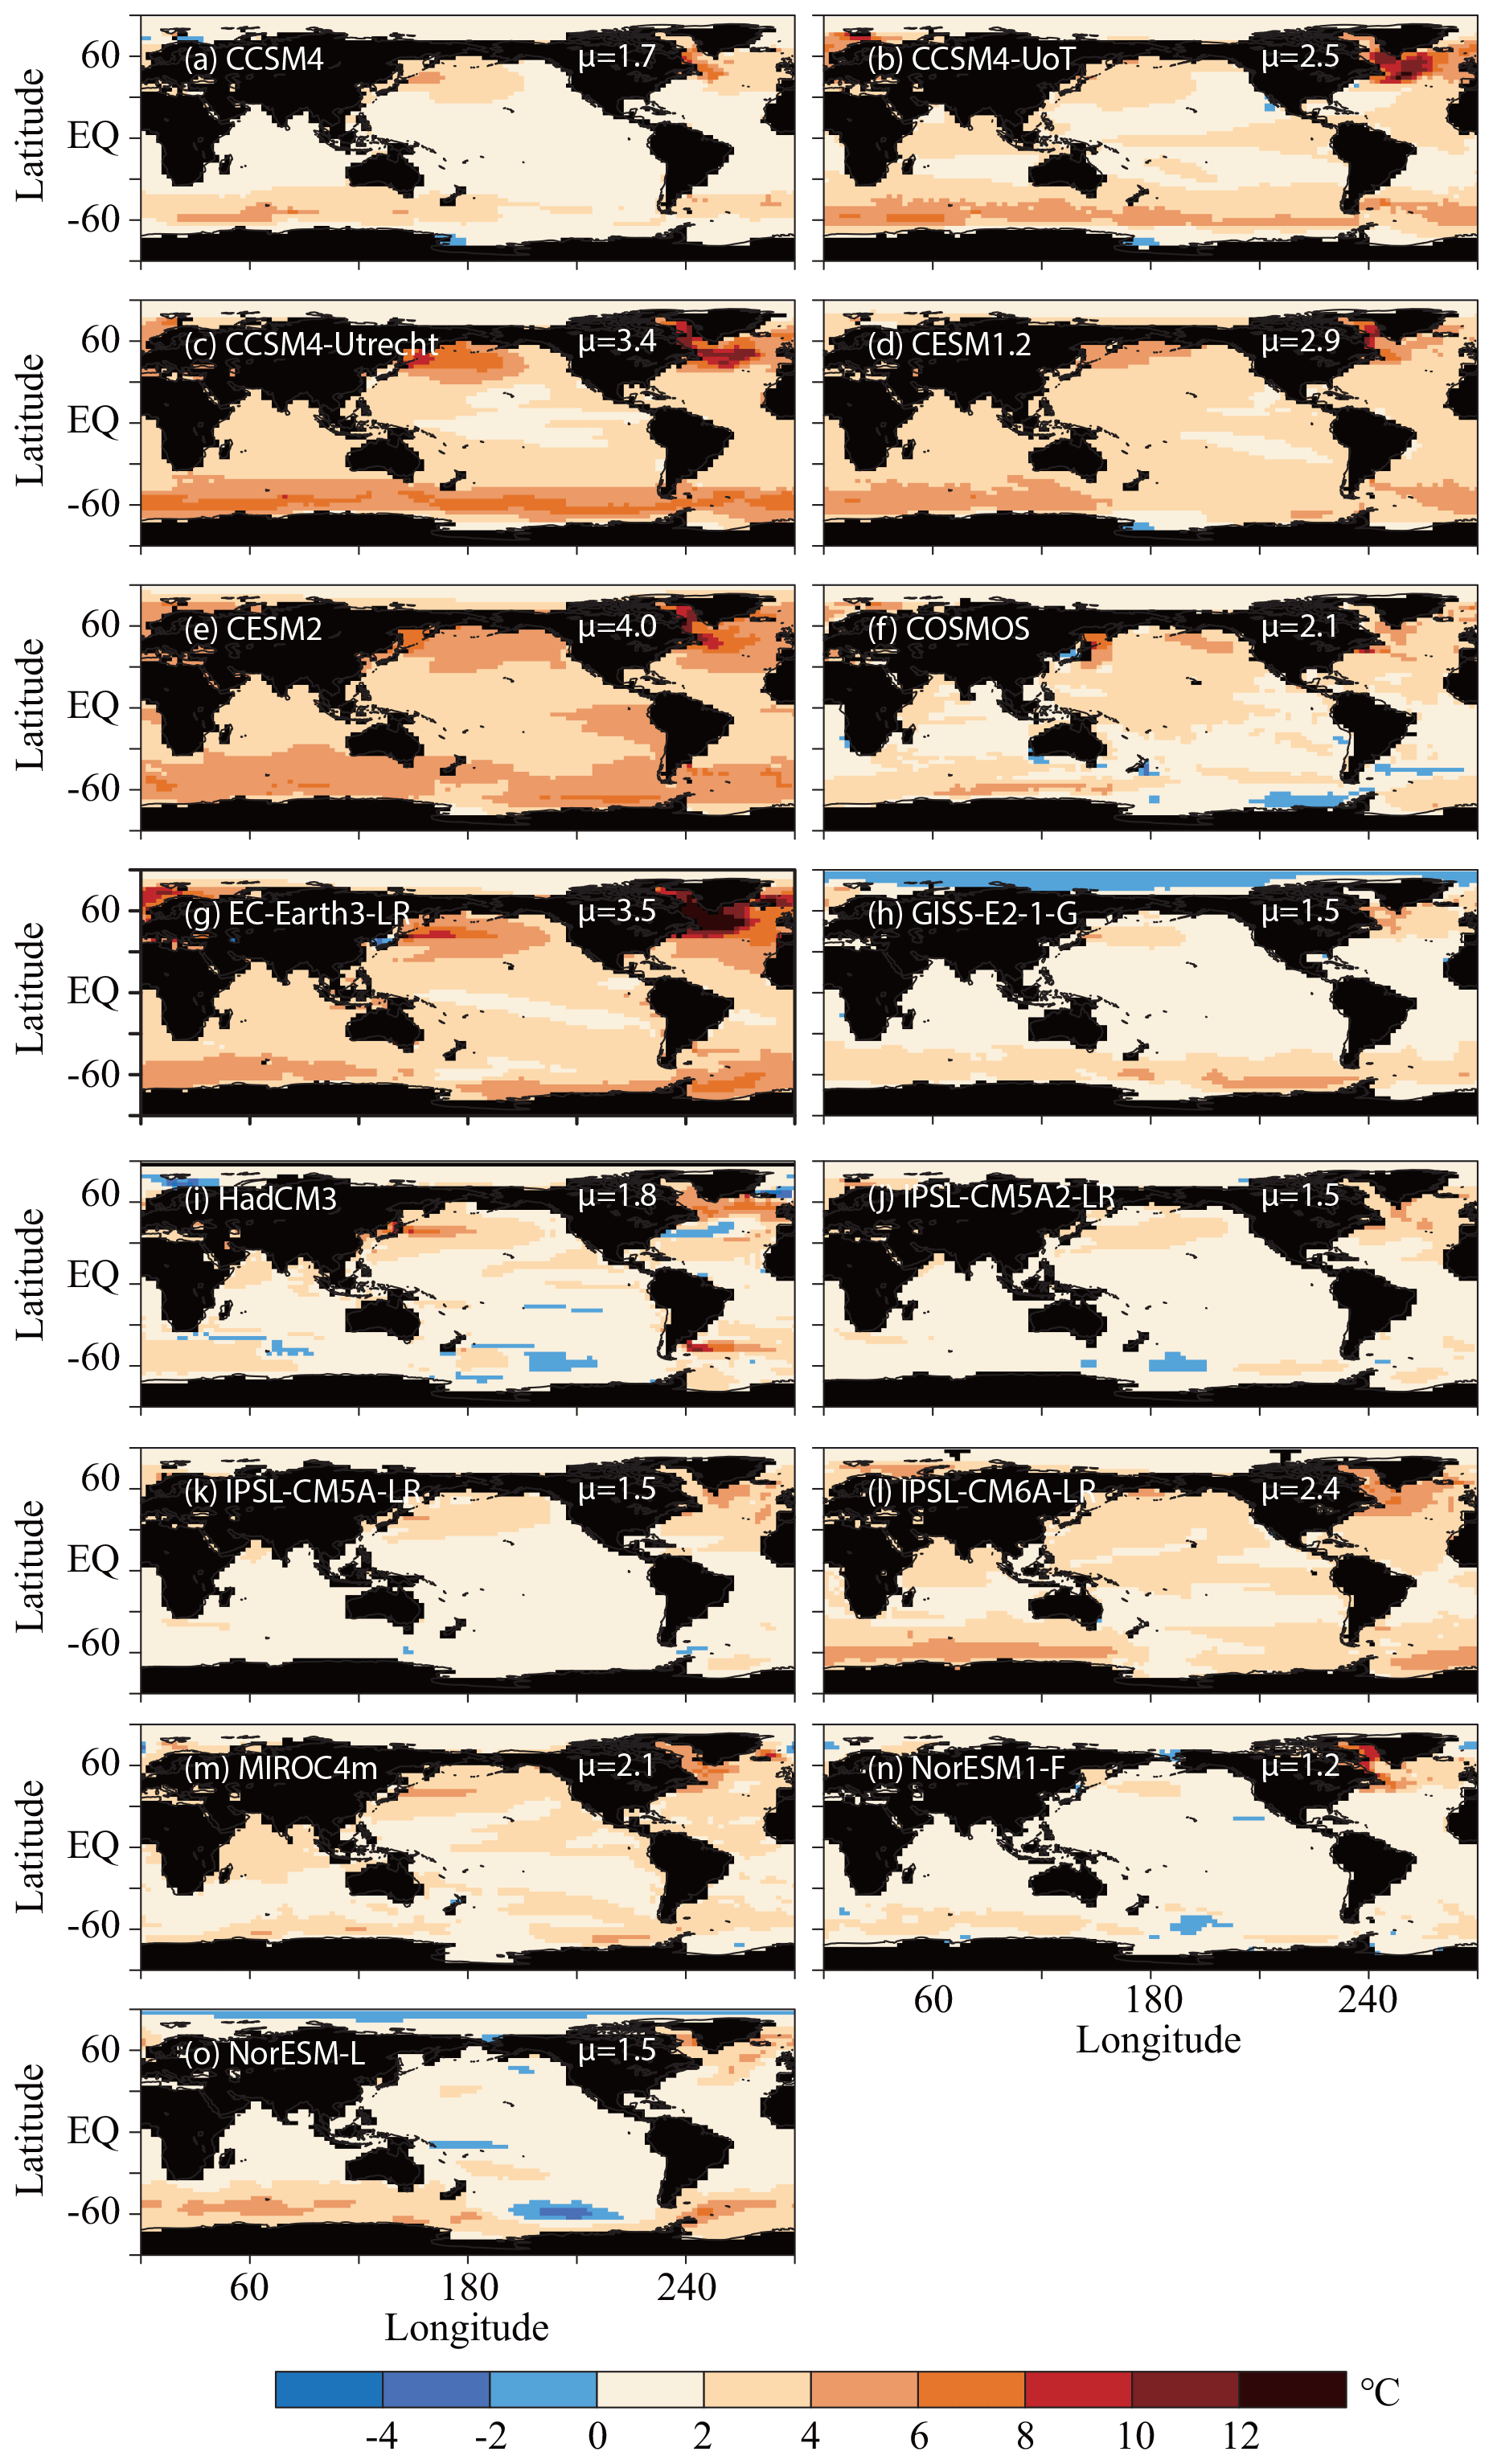
Figure 4Simulated mid-Pliocene annual SST anomalies in PlioMIP2 (unit: ∘C). μ denotes the global mean.
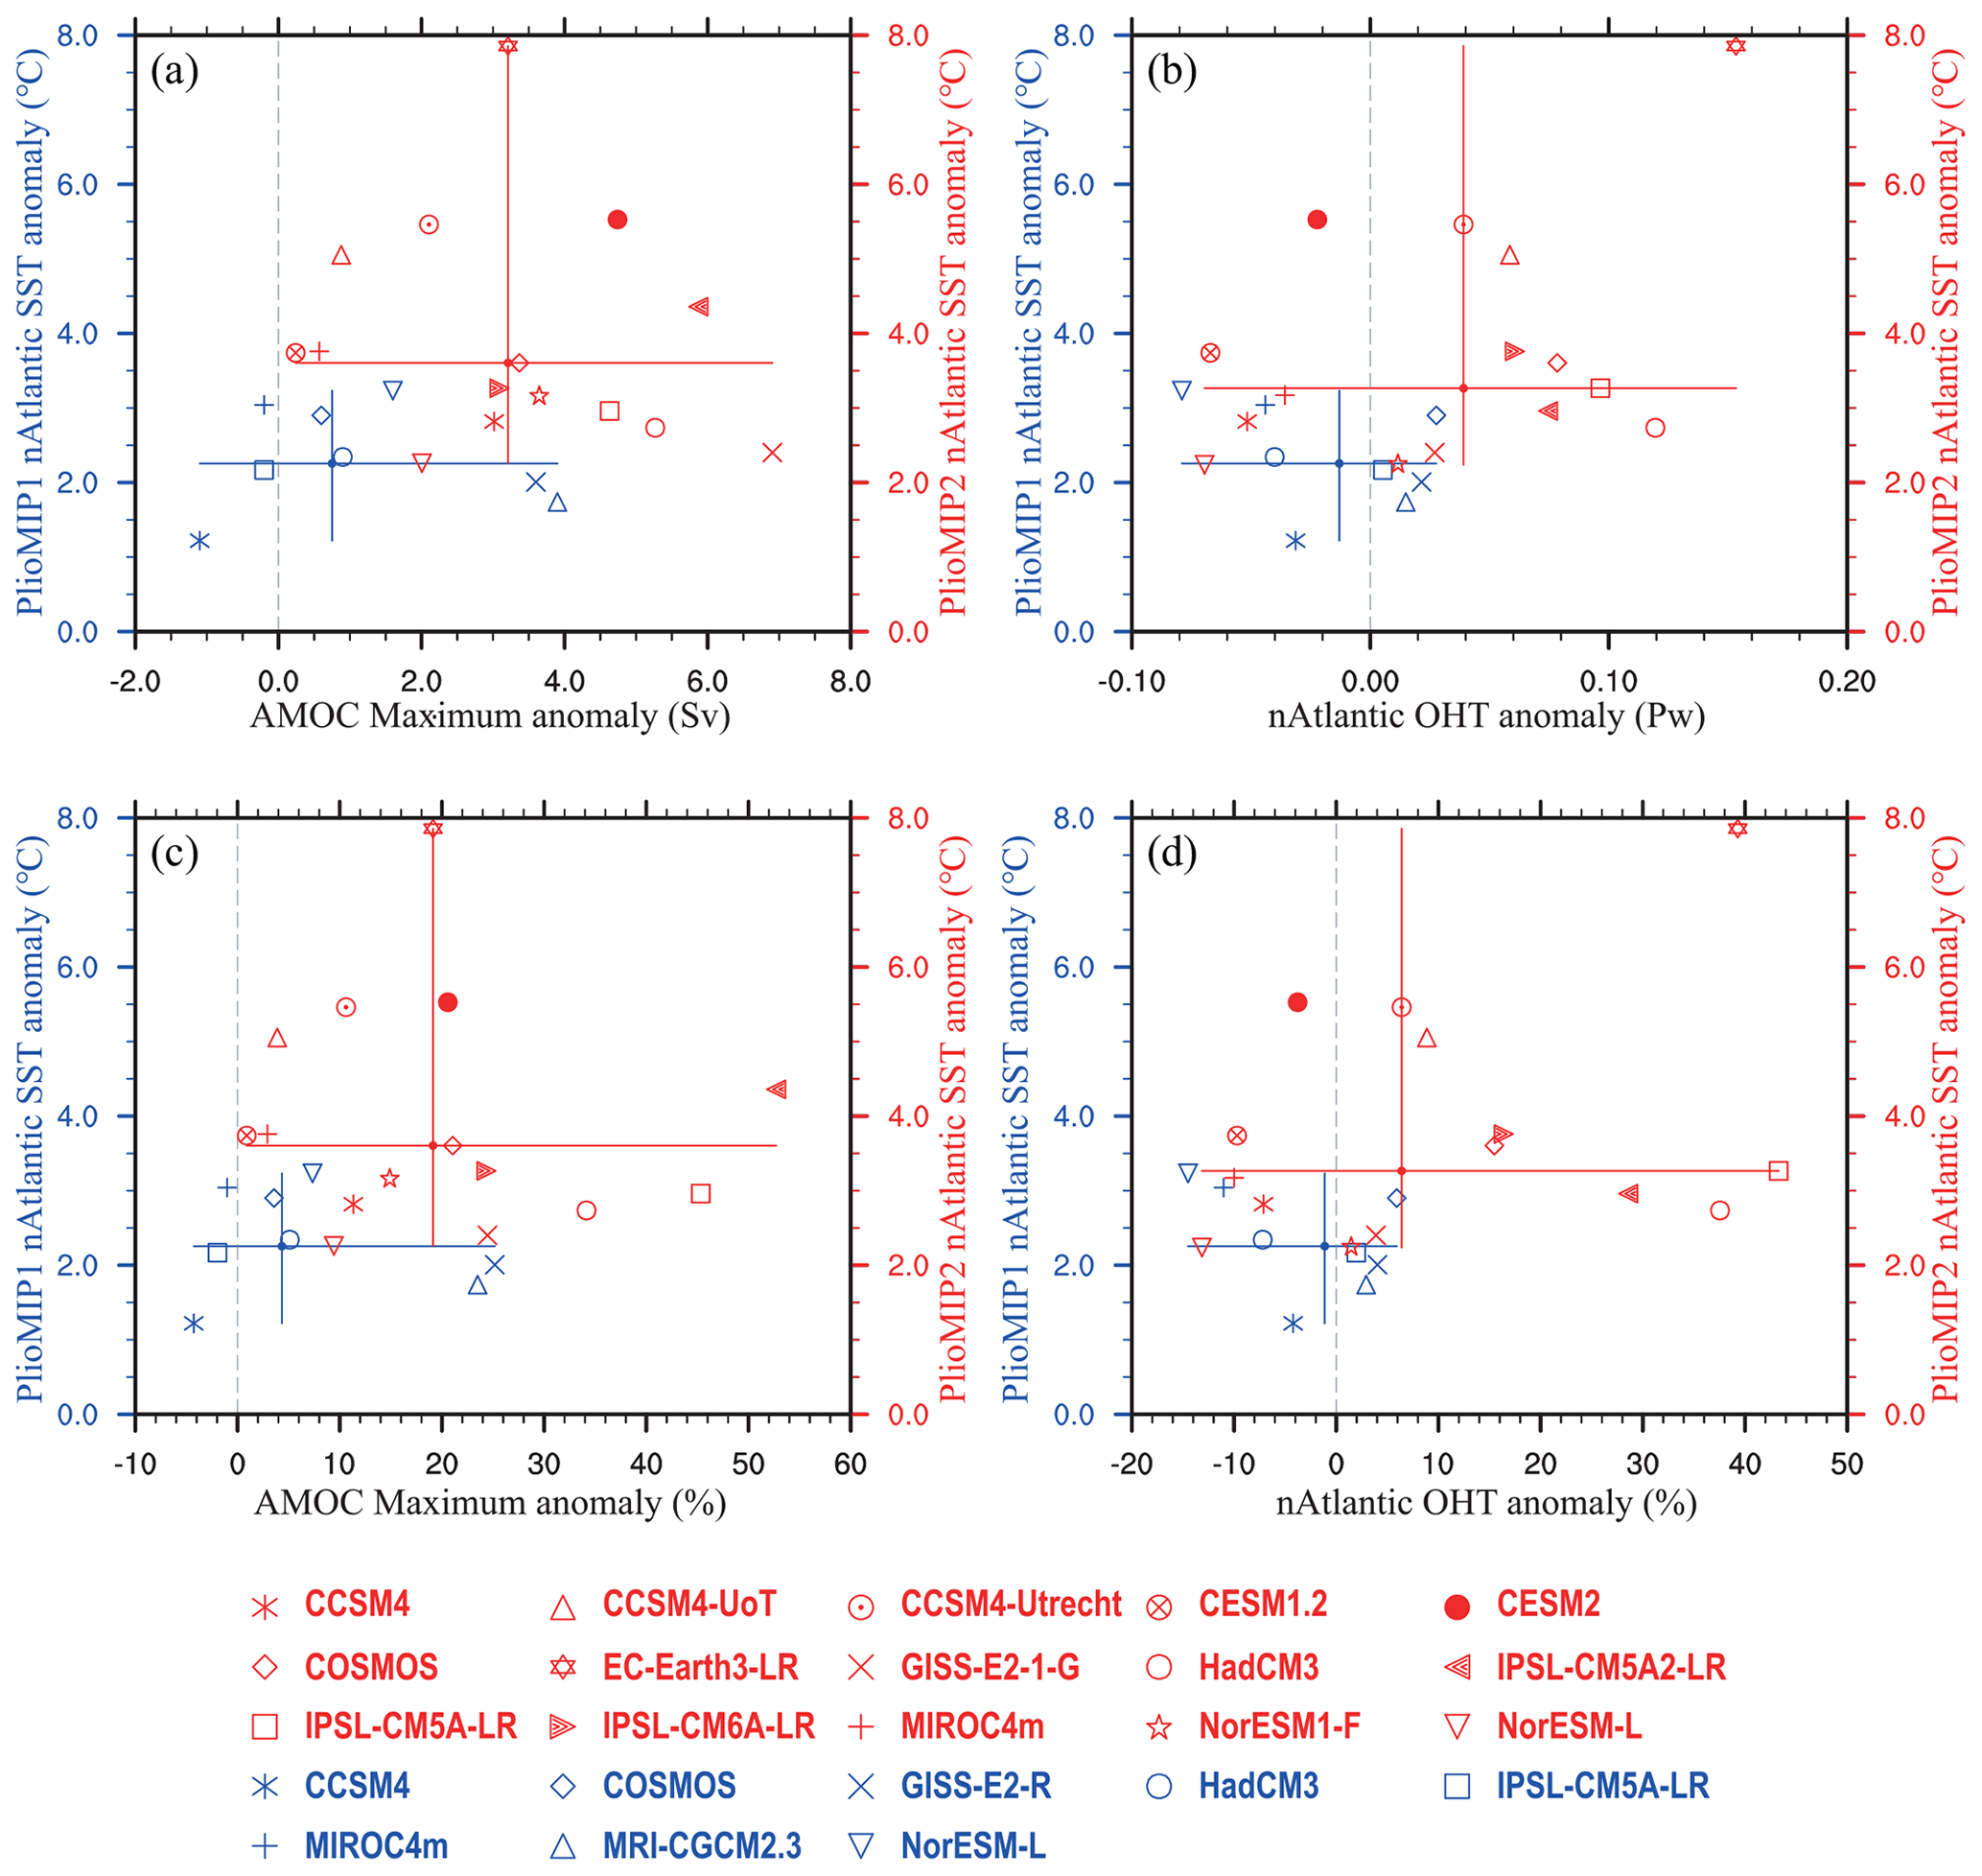
Figure 5Simulated changes in the AMOC maximum and the North Atlantic (nAtlantic) OHT, and responses in the high-latitude North Atlantic SST. The North Atlantic OHT is the averaged value between 30 and 80∘ N. The high-latitude North Atlantic includes the Atlantic and Greenland–Iceland–Norwegian (GIN) seas between 30 and 80∘ N. Note that only the mean values of the AMOC maximum, the North Atlantic OHT and the SST for each model are used to calculate the anomalies, and significance tests are not employed.
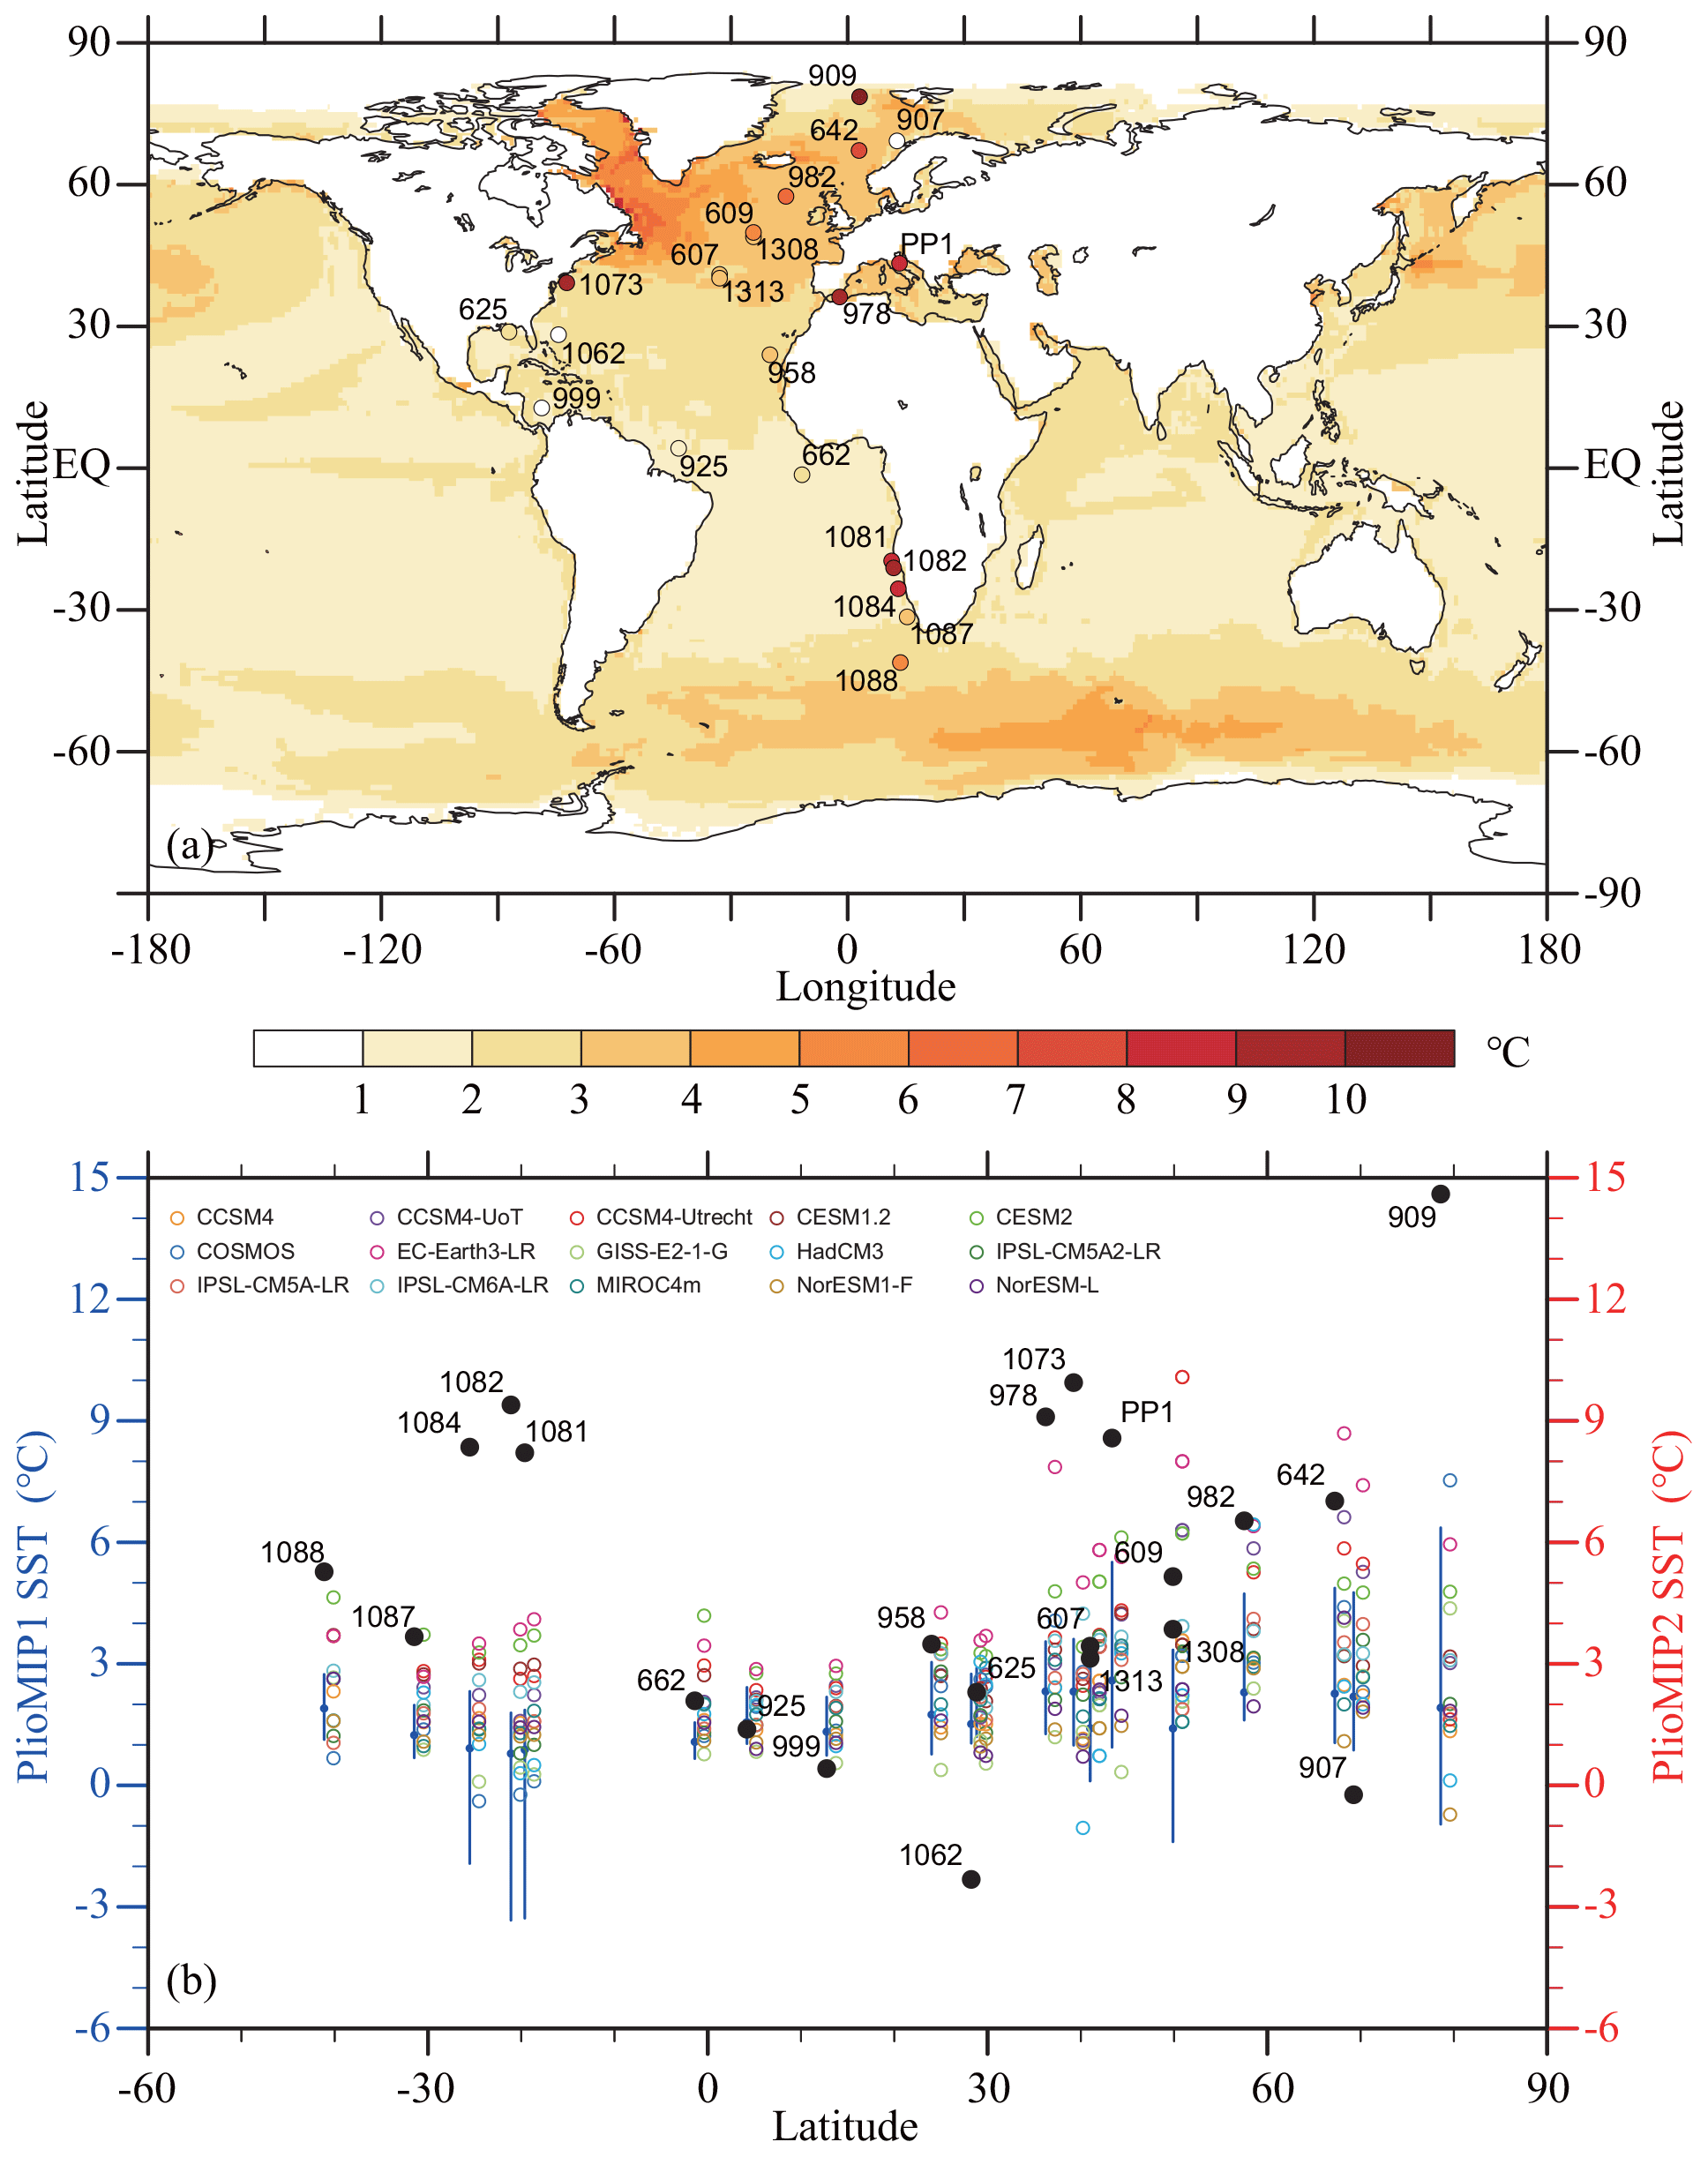
Figure 6PlioMIP2 and PRISM4 SST comparison in the Atlantic. (a) PRISM4 SST anomalies (points) at data sites in the Atlantic and the Mediterranean plotted against the multi-model ensemble median of SST anomalies (shaded; the mid-Pliocene vs. the pre-industrial) simulated in PlioMIP2 (unit: ∘C). (b) Black dots show the PRISM4 SST anomalies (unit: ∘C) at each site. Vertical blue lines and dots show the PlioMIP1 ranges and median values of changes in SST for each site. Coloured markers show SST changes simulated by each model in PlioMIP2. The PRISM4 SST anomalies are calculated based on the PRISM4 mid-Pliocene reconstructions (3.19–3.22 Ma; Foley and Dowsett, 2019) and the modern observation (1870–1899; Rayner et al., 2003).
In PlioMIP2, the simulated mid-Pliocene global annual mean SST is between 1.2 and 4.0 ∘C warmer than the pre-industrial level. Most models show that the strongest sea surface warming appears in the mid- to high-latitude North Atlantic (Figs. 4, 5). The median of the multi-model ensemble shows that the SST increases by ∼ 2–8 ∘C in the North Atlantic between 30 and 80∘ N (Fig. 6). The largest increase in the ensemble median of 6–8 ∘C appears in the Labrador Sea south of Cape Farewell (the southernmost point of Greenland). EC-Earth3-LR simulates the largest increase in the North Atlantic SST above 12 ∘C in the mid-Pliocene experiment (Fig. 4).
However, the SST increases in the North Atlantic (averaged between 30 and 80∘ N), in response to the changes in the AMOC maximum and North Atlantic OHT (averaged between 30 and 80∘ N), are highly model dependent (Fig. 5). Of the 15 PlioMIP2 models, 11 models simulate a mean SST increase between 2 and 4 ∘C in the North Atlantic. The ranges of the changes in the AMOC maximum (from 1 % to 53 %) and mean North Atlantic OHT (from −13 % to 43 %) are large. Meanwhile, EC-Earth3-LR produces an increase of ∼ 8 ∘C in the mean North Atlantic SST, which is associated with an intensification of 3.2 Sv (19 %) in the AMOC maximum and an enhancement of 0.16 PW (41 %) in the mean North Atlantic OHT. CCSM4-UoT, CCSM4-Utrecht and CESM2 produce a similar increase of ∼ 5 ∘C in the mean North Atlantic SST, while the intensification in the AMOC maximum shows a large range covering 0.9 Sv (4 %), 2.1 Sv (11 %) and 4.7 Sv (21 %) and the mean North Atlantic OHT changes by 0.06 PW (9 %), 0.04 PW (6 %), −0.02 PW (−4 %) respectively.
In PlioMIP2, the surface warming simulated with CCSM4-UoT, CCSM4-Utrecht, CESM2 and EC-Earth3-LR is close to or warmer than the PRISM4 reconstructions (Foley and Dowsett, 2019) in the North Atlantic between 30 and 80∘ N, whereas the other models still appear to underestimate the North Atlantic SST (Fig. 6). Previous studies (Brierley and Fedorov, 2016; Otto-Bliesner et al., 2017; Song et al., 2018) showed that the closing of the Arctic gateways led to warmer North Atlantic SSTs in the mid-Pliocene experiment, when compared to the pre-industrial level. However, the Arctic gateways are closed in all PlioMIP2 simulations analysed here, but not all of them simulate the warm North Atlantic SSTs as reconstructed in the PRISM4 data set (Foley and Dowsett, 2019). Although the Arctic gateways may lead to a better agreement between simulated and reconstructed mid-Pliocene North Atlantic SSTs in some models, the effect is either not present for all of the models or it is not of sufficient amplitude to fully resolve the model–data discord. The PlioMIP2 models show a larger model spread in the simulated mid-Pliocene SST increases in the high-latitude North Atlantic, as well as the responses in the AMOC and North Atlantic OHT, relative to PlioMIP1. This reduced agreement is not surprising, as the model spread in global average surface temperatures is likewise more pronounced in PlioMIP2: 1.86–3.60 ∘C in PlioMIP1 (Haywood et al., 2013) compared with 1.7–5.2 ∘C in PlioMIP2 (Haywood et al., 2020).
Compared with the PlioMIP1 ensemble in which the Arctic gateways were kept open, all PlioMIP2 models forced with the PRISM4 reconstructions that consider the closed Arctic gateways simulate an intensification in the mid-Pliocene AMOC. CCSM4, COSMOS, HadCM3, IPSL-CM5A-LR, MIROC4m and NorESM-L have all participated in both PlioMIP1 and PlioMIP 2. These six models simulate an increase (compared with the pre-industrial level) in the mid-Pliocene AMOC maximum, which is larger in PlioMIP2 than in PlioMIP1, supporting the hypothesis that closed Arctic gateways are a requirement for the intensification of the mid-Pliocene AMOC. There are several further lines of evidence that support this hypothesis. HadGEM3-GC31-LL, which carried out the mid-Pliocene experiment forced with the PlioMIP2 boundary conditions, except with the land–sea distribution condition identical to the pre-industrial simulation, produces a weaker mid-Pliocene AMOC (with a maximum of 14.3 Sv) compared with the pre-industrial simulation (with a maximum of 16.1 Sv). With COSMOS, a sensitivity experiment forced with the modern land–sea distribution (the Arctic gateways open) also shows a weaker AMOC, when compared with the core mid-Pliocene simulation (Stepanek et al., 2020). As revealed in the earlier study (Otto-Bliesner et al., 2017), closed Arctic gateways lead to a stronger AMOC by inhibiting Arctic freshwater export to the North Atlantic. However, the magnitude of the intensification in the AMOC due to the closed Arctic gateways seems highly model dependent. Some simulations suggest that the AMOC is enhanced by ∼ 2 Sv due to the closed Bering Strait (Brierley and Fedorov, 2016; Otto-Bliesner et al., 2017; Song et al., 2018), whereas some unpublished simulations in PlioMIP2 show much larger responses. Without consistent sensitivity experiments for the Arctic gateways, it remains difficult to reveal the range of model spread on the gateways' impacts in PlioMIP2. This model dependence will be addressed in more dedicated sensitivity experiments in the future.
In PlioMIP2, the large model spread does not support the notion that an intensified mid-Pliocene AMOC is the principal mechanism responsible for the simulated warming of the North Atlantic SSTs. Compared with CCSM4, both CCSM4-UoT and CCSM4-Utrecht (Table 1) simulate warmer SSTs in the North Atlantic, suggesting that the increased background ocean vertical mixing parameters likely contribute to the strong mid-Pliocene North Atlantic warming simulated with these two models. Each model's climate sensitivity also influences the simulated mid-Pliocene warming in PlioMIP2. For example, relative to CCSM4 and CESM1.2, CESM2 has a greater equilibrium climate sensitivity (Feng et al., 2020; Haywood et al., 2020) and simulates the strongest North Atlantic warming in the mid-Pliocene experiment. With the modern land–sea distribution conditions, HadGEM3-GC31-LL simulates a weakened mid-Pliocene AMOC but much warmer SSTs in the North Atlantic as well as an increase in the mid-Pliocene global mean SST (SAT) of 3.8 ∘C (5.1 ∘C) relative to the pre-industrial level, which is the second largest warming in PlioMIP2 (Fig. 4). Moreover, a new lake and soil condition is employed in PlioMIP2 (Pound et al., 2014; Haywood et al., 2016a). Methods for modifying the soil condition and their impacts on climate in the models are highly model dependent due to the large variety of land surface schemes included in the PlioMIP2 models, which could further amplify the diversity of warming signals in high-latitude regions. As not all models carried out the sensitivity experiments designed in PlioMIP2, it remains difficult to distinguish which change in boundary conditions is more dominant for the strong mid-Pliocene North Atlantic surface warming. Earlier studies (e.g. Feng et al., 2017) noted that the North Atlantic warming is not a unique feature in many mid-Pliocene simulations, as the warming in the North Pacific is also remarkable (Fig. 4). This inter-basin symmetry suggests a potentially important component of the zonal mean polar amplification of the SST warming across the North Atlantic. Energy balance analyses (Hill et al., 2014; Feng et al., 2017) show that amplified zonal mean northern high-latitude warming is dominated by regional radiative feedbacks from lowered surface albedo and an enhanced high-latitude greenhouse effect (from changes in water vapour), even with an enhanced AMOC due to gateway closure.
It should be noted that observations of strong high-latitude warming in the North Atlantic are not sufficient to constrain the strength of AMOC or OHT (Zhang et al., 2013b). The AMOC strength measures the contrast in water transport between the upper and lower branches of the Atlantic cells, but the OHT is also influenced by the contrast in water temperature as well as the depth of the AMOC. Moreover, OHT can be decomposed into a (vertical) MOC component and a (horizontal) gyre component. While the MOC component dominates in most of the Atlantic region, the gyre component has a comparable magnitude in the subpolar region (Williams et al., 2015). Therefore, there is no one-to-one correspondence between AMOC and OHT, especially in the subpolar regions. Furthermore, the SST warming pattern is not entirely determined by OHT, as demonstrated by the simulations in both PlioMIP1 and PlioMIP2.
Nevertheless, the PlioMIP2 experiments simulate a sea surface warming that is in better agreement with the PRISM4 reconstructions (Foley and Dowsett, 2019) in the North Atlantic, relative to the PlioMIP1 ensemble. As shown in the synthesis paper by Haywood et al. (2020), the multi-model means (with equal weight for each model) agree well with the reconstructions at the North Atlantic sites 609 and 1308, and they show only small differences from the reconstructions at sites 982 and 642. The comparison between the PlioMIP2 simulations and the SST reconstructions in the KM5c interglacial (McClymont et al., 2020) also demonstrates the reduced model–data discord.
However, the improved model–data agreement in the North Atlantic is primarily caused by the relatively warm mid-Pliocene simulations run with EC-Earth3-LR and the five models from the CCSM/CESM family (Fig. 6). For the other models, the range of warming at these sites is similar to that of PlioMIP1. This large model spread suggests that the reconstructed strong mid-Pliocene sea surface warming in the North Atlantic is not necessarily caused by the intensified AMOC and enhanced Atlantic northward OHT as suggested previously (Dowsett et al., 1992; Raymo et al., 1996). Even given the intensified AMOC in PlioMIP2 due to the closed Arctic gateways, most models produce the mid-Pliocene North Atlantic sea surface warming that is weaker than the PRISM4 reconstruction (Foley and Dowsett, 2019).
Although the model–data discrepancy is reduced in the North Atlantic partly due to the intensified AMOC, the model–data mismatch remains large in other regions in PlioMIP2, for example sites 1081, 1082, 1084 and 1087 in the Benguela upwelling region (Fig. 6). The PRISM4 (Foley and Dowsett, 2019) and other syntheses of Pliocene SST (Fedorov et al., 2013, McClymont et al., 2020) reconstruct that the SSTs are about 6–8 ∘C warmer than today in this region. All PlioMIP2 models underestimate this warming in PlioMIP2 (Fig. 6). Even EC-Earth3-LR, which produces the warmest mid-Pliocene simulation in the North Atlantic, only simulates 2–4 ∘C sea surface warming in the Benguela upwelling region.
A major feature of the mid-Pliocene seems to be the large increase in SST (about 2–10 ∘C) in the mid-latitude coastal upwelling regions and the relatively smaller increases in SST (about 2–4 ∘C) in the mid- to high latitudes (Fedorov et al., 2013) compared with the pre-industrial level, although some studies suggest that SST reconstructions in upwelling regions are highly proxy dependent (e.g. Leduc et al., 2014). For example, in the Benguela upwelling region, the -based SST is ∼ 3–10 ∘C colder than the alkenone-based SST (Leduc et al., 2014). In the California upwelling region, Foley and Dowsett (2019) show that the Pliocene SST is similar to today, whereas Fedorov et al. (2013) show the regional SST is about 2–8 ∘C warmer than today. Despite the uncertainties in reconstructions, the simulated warming in the mid-latitude upwelling regions in PlioMIP2 can be found at the low end of the proxy-estimated range. Realistic simulations in upwelling regions require good model abilities with respect to simulating large-scale ocean stratification and sea surface wind stress (Miller and Tziperman, 2017; Li et al., 2019), which are partly model-resolution dependent in both atmosphere and ocean models (Gent et al., 2010; Small et al., 2015).
Taken together, these model–data discrepancies make it difficult to associate the intensified AMOC and enhanced Atlantic northward OHT with the reconstructed high mid-Pliocene SSTs. Fedorov et al. (2013) suggested a possible mechanism for understanding the warm SSTs during the mPWP. Increased mixing in the subtropical ocean and reduced extra-tropical cloud albedo cause a strong warming in the mid-latitudes, including some upwelling regions. In PlioMIP2, CCSM4-UoT and CCSM4-Utrecht have considered increasing the ocean background mixing parameters, but no model has tested the impact of a reduction in the extra-tropical cloud albedo in the mid-Pliocene experiments. This mechanism can be further addressed in the future to investigate whether it is a suitable candidate for improving the simulation for upwelling regions.
Furthermore, it remains problematic to use the intensified AMOC to explain other features of the mid-Pliocene ocean circulation. During the mPWP, the vertical and meridional δ13C gradients are reduced in the Atlantic. This can be explained with the increased ventilation in the Southern Ocean and does not necessarily depend on an intensified AMOC (Zhang et al., 2013b). However, simulations of Southern Ocean dynamics are highly model dependent (Zhang et al., 2013a). In addition to the Southern Ocean, the Pliocene deep-ocean circulation in the North Pacific appears different to the present day. In the subarctic North Pacific, high accumulation rates of calcium carbonate and biogenic opal suggest a strong deep convection there and, thus, the existence of North Pacific deep-water formation and a Pacific Meridional Overturning Circulation (PMOC, Burls et al., 2017). However, with an intensified AMOC, a PMOC remains absent in the PlioMIP2 simulations.
In summary, all 15 coupled models in PlioMIP2 used in this study simulate an intensified mid-Pliocene AMOC, relative to the pre-industrial level. The simulated AMOC maximum (the maximum of the Atlantic meridional overturning streamfunction) increases by between 1 % and 53 %. However, these models do not simulate a consistent change in the depth of the Atlantic overturning cell and the Atlantic OHT. The spread in the responses of the AMOC and Atlantic OHT in the models becomes larger in PlioMIP2, when compared with PlioMIP1. In the North Atlantic, EC-Earth3-LR and the models from the CCSM/CESM family can simulate an SST increase (∼ 8–12 ∘C) close to the PRISM4 reconstruction, whereas other models appear to underestimate the sea surface warming. In PlioMIP2, the model–data discrepancy is reduced in the North Atlantic, but the discrepancy remains large in the upwelling regions. The large model spread and the remaining model–data discrepancy suggests that an intensified AMOC and an enhanced Atlantic northward OHT cannot explain the reconstructed warm climate of the mid-Pliocene surface oceans.
To access the PlioMIP2 database, please send a request to Alan M. Haywood (a.m.haywood@leeds.ac.uk). PlioMIP2 data from CESM2, EC-Earth3-LR, GISS-E2-1-G, IPSL-CM6A-LR and NorESM1-F can be obtained from the Earth System Grid Federation (ESGF, 2020, https://esgf-node.llnl.gov/search/cmip6/, last access: 3 December 2020).
ZZ and XL analysed the data and wrote the draft of the paper. All authors contributed to discussion of the results and writing the paper.
The authors declare that they have no conflict of interest.
This article is part of the special issue “PlioMIP Phase 2: experimental design, implementation and scientific results”. It is not associated with a conference.
Zhongshi Zhang and Xiangyu Li were supported by the National Natural Science Foundation of China (grant no. 41888101), the National Key Research and Development Program of China (grant no. 2018YFA0605602), the China Scholarship Council (grant no. 201804910023), the China Postdoctoral Science Foundation (grant no. 2015M581154), the Norwegian Research Council (project nos. 221712, 229819 and 262618), the NordForsk-funded project GREENICE (project no. 61841) and computing resources from Notur/NorStore (project nos. NN9133/NS9133 and NN9486/NS9486).
Ran Feng, Bette L. Otto-Bliesner and Esther Brady acknowledge the CESM project, which is primarily supported by the National Science Foundation (NSF). This material is based upon work supported by the National Center for Atmospheric Research (NCAR), which is a major facility sponsored by the NSF under cooperative agreement no. 1852977. This research was additionally sponsored by U.S. National Science Foundation grant nos. 1903650 and 1814029 to Ran Feng and grant no. 1418411 to Bette L. Otto-Bliesner. Computing and data storage resources, including the Cheyenne supercomputer (https://doi.org/10.5065/D6RX99HX), were provided by the Computational and Information Systems Laboratory (CISL) at NCAR.
W. Richard Peltier and Deepak Chandan were supported by a Canadian NSERC Discovery Grant (grant no. A9627), and they wish to acknowledge the SciNet HPC consortium for providing computing facilities. SciNet is funded by the Canada Foundation for Innovation under the auspices of Compute Canada, the Government of Ontario, the Ontario Research Fund – Research Excellence and the University of Toronto.
Anna S. von der Heydt and Michiel L. J. Baatsen, acknowledge the Netherlands Earth System Science Centre (NESSC) programme, which is financially supported by the Ministry of Education, Culture and Science (OCW; grant no. 024.002.001). Simulations with CCSM4-Utrecht were performed at the SURFsara Dutch national computing facilities and were sponsored by NWO-EW (Netherlands Organization for Scientific Research, Exact Sciences) under project no. 17189.
Gerrit Lohmann and Christian Stepanek acknowledge the use of computational resources from the Computing and Data Centre of the Alfred Wegener Institute – Helmholtz-Centre for Polar and Marine Research towards the generation of the COSMOS PlioMIP2 simulation ensemble. Gerrit Lohmann acknowledges funding via the Alfred Wegener Institute's PACES2 research programme. Christian Stepanek acknowledges funding from the Helmholtz Climate Initiative REKLIM and the Alfred Wegener Institute's PACES2 research programme.
Qiong Zhang acknowledges financial support from the Swedish Research Council (Vetenskapsrådet; grant nos. 2013-06476 and 2017-04232). The model simulations with EC-Earth3 and the data analysis were performed using resources provided by ECMWF's computing and archive facilities and the Swedish National Infrastructure for Computing (SNIC) at the National Supercomputer Centre (NSC), which is partially funded by the Swedish Research Council through grant agreement no. 2016-07213.
Alan M. Haywood, Stephen J. Hunter and Julia C. Tindall acknowledge the FP7 Ideas programme of the European Research Council (grant no. PLIO-ESS, 278636), the Past Earth Network (EPSRC grant no. EP/M008.363/1) and the University of Leeds Advanced Research Computing service. Julia C. Tindall was also supported through the Centre for Environmental Modelling And Computation (CEMAC), University of Leeds.
Wing-Le Chan and Ayako Abe-Ouchi acknowledge funding from JSPS KAKENHI (grant 17H06104) and MEXT KAKENHI (grant 17H06323), and they are grateful to JAMSTEC for use of the Earth Simulator supercomputer.
This research has been supported by the National Natural Science Foundation of China (grant no. 41888101), the National Key Research and Development Program of China (grant no. 2018YFA0605602), the China Scholarship Council (grant no. 201804910023), the China Postdoctoral Science Foundation (grant no. 2015M581154), the Norwegian Research Council (project nos. 221712, 229819 and 262618) and the NordForsk-funded project GREENICE (project no. 61841).
This paper was edited by Appy Sluijs and reviewed by Chris Brierley and one anonymous referee.
Badger, M. P. S., Schmidt, D. N., Mackensen, A., and Pancost, R. D.: High-resolution alkenone palaeobarometry indicates relatively stable pCO2 during the pliocene (3.3–2.8 ma), Philos. T. R. Soc. A, 371, 20130094, https://doi.org/10.1098/rsta.2013.0094, 2013.
Bragg, F. J., Lunt, D. J., and Haywood, A. M.: Mid-Pliocene climate modelled using the UK Hadley Centre Model: PlioMIP Experiments 1 and 2, Geosci. Model Dev., 5, 1109–1125, https://doi.org/10.5194/gmd-5-1109-2012, 2012.
Brierley, C. M. and Fedorov, A. V.: Comparing the impacts of Miocene–Pliocene changes in inter-ocean gateways on climate: Central American Seaway, Bering Strait, and Indonesia, Earth Planet. Sc. Lett., 444, 116–130, https://doi.org/10.1016/j.epsl.2016.03.010, 2016.
Burke, K. D., Williams, J. W., Chandler, M. A., Haywood, A. M., Lunt, D. J., and Otto-Bliesner, B. L.: Pliocene and Eocene provide best analogs for near-future climates, P. Natl. Acad. Sci. USA, 115, 13288–13293, 2018.
Burls, N. J., Fedorov, A. V., Sigman, D. M., Jaccard, S. L., Tiedemann, R., and Haug G. H.: Active Pacific meridional overturning circulation (PMOC) during the warm Pliocene, Science Advances, 3, e1700156, https://doi.org/10.1126/sciadv.1700156, 2017.
Chalk, T. B., De La Vega, E., Foster, G. L., Bysani, R., and Wilson, P. A.: Warming in a warm world: Orbital CO2 forcing variations in the warm Pliocene, Abstract PP21C-1434 presented at the 2018 AGU Fall Meeting, San Francisco, CA, 11 December 2018.
Chan, W.-L. and Abe-Ouchi, A.: Pliocene Model Intercomparison Project (PlioMIP2) simulations using the Model for Interdisciplinary Research on Climate (MIROC4m), Clim. Past, 16, 1523–1545, https://doi.org/10.5194/cp-16-1523-2020, 2020.
Chan, W.-L., Abe-Ouchi, A., and Ohgaito, R.: Simulating the mid-Pliocene climate with the MIROC general circulation model: experimental design and initial results, Geosci. Model Dev., 4, 1035–1049, https://doi.org/10.5194/gmd-4-1035-2011, 2011.
Chandan, D. and Peltier, W. R.: Regional and global climate for the mid-Pliocene using the University of Toronto version of CCSM4 and PlioMIP2 boundary conditions, Clim. Past, 13, 919–942, https://doi.org/10.5194/cp-13-919-2017, 2017.
Chandan, D. and Peltier, W. R.: On the mechanisms of warming the mid-Pliocene and the inference of a hierarchy of climate sensitivities with relevance to the understanding of climate futures, Clim. Past, 14, 825–856, https://doi.org/10.5194/cp-14-825-2018, 2018.
Chandler, M. A., Sohl, L. E., Jonas, J. A., Dowsett, H. J., and Kelley, M.: Simulations of the mid-Pliocene Warm Period using two versions of the NASA/GISS ModelE2-R Coupled Model, Geosci. Model Dev., 6, 517–531, https://doi.org/10.5194/gmd-6-517-2013, 2013.
Contoux, C., Ramstein, G., and Jost, A.: Modelling the mid-Pliocene Warm Period climate with the IPSL coupled model and its atmospheric component LMDZ5A, Geosci. Model Dev., 5, 903–917, https://doi.org/10.5194/gmd-5-903-2012, 2012.
de Nooijer, W., Zhang, Q., Li, Q., Zhang, Q., Li, X., Zhang, Z., Guo, C., Nisancioglu, K. H., Haywood, A. M., Tindall, J. C., Hunter, S. J., Dowsett, H. J., Stepanek, C., Lohmann, G., Otto-Bliesner, B. L., Feng, R., Sohl, L. E., Chandler, M. A., Tan, N., Contoux, C., Ramstein, G., Baatsen, M. L. J., von der Heydt, A. S., Chandan, D., Peltier, W. R., Abe-Ouchi, A., Chan, W.-L., Kamae, Y., and Brierley, C. M.: Evaluation of Arctic warming in mid-Pliocene climate simulations, Clim. Past, 16, 2325–2341, https://doi.org/10.5194/cp-16-2325-2020, 2020.
Dowsett, H., Robinson, M., Haywood, A., Salzmann, U., Hill, D., Sohl, L., Chandler, M., Williams, M., Foley, K., and Stoll, D.: The PRISM3D paleoenvironmental reconstruction, Stratigraphy, 7, 123–139, 2010.
Dowsett, H., Dolan, A., Rowley, D., Moucha, R., Forte, A. M., Mitrovica, J. X., Pound, M., Salzmann, U., Robinson, M., Chandler, M., Foley, K., and Haywood, A.: The PRISM4 (mid-Piacenzian) paleoenvironmental reconstruction, Clim. Past, 12, 1519–1538, https://doi.org/10.5194/cp-12-1519-2016, 2016.
Dowsett, H. J., Cronin, T. M., Poore, R. Z., Thompson, R. S., Whatley, R. C., and Wood, A. M.: Micropaleontological evidence for increased meridional heat transport in the North Atlantic Ocean during the Pliocene, Science, 258, 1133–1135, 1992.
Dowsett, H. J., Robinson, M. M., Haywood, A. M., Hill, D. J., Dolan, A. M., Stoll, D. K., Chan, W.-L., Abe-Ouchi, A., Chandler, M. A., Rosenbloom, N. A., Otto-Bliesner, B. L., Bragg, F. J., Lunt, D. J., Foley, K. M., and Riesselman, C. R.: Assessing confidence in Pliocene sea surface temperatures to evaluate predictive models, Nat. Clim. Change, 2, 365–371, 2012.
Dowsett, H. J., Foley, K. M., Stoll, D. K., Chandler, M. A., Sohl, L. E., Bentsen, M., Otto-Bliesner, B. L., Bragg, F. J., Chan, W.-L., Contoux, C., Dolan, A. M., Haywood, A. M., Jonas, J. A., Jost, A., Kamae, Y., Lohmann, G., Lunt, D. J., Nisancioglu, K. H., Abe-Ouchi, A., Ramstein, G., Riesselman, C. R., Robinson, M. M., Rosenbloom, N. A., Salzmann, U., Stepanek, C., Strother, S. L., Ueda, H., Yan, Q., and Zhang, Z.: Sea Surface Temperature of the mid-Piacenzian Ocean: A Data-Model Comparison, Sci. Rep.-UK, 3, 2013, https://doi.org/10.1038/srep02013, 2013.
ESGF: Datasets from CMIP6 simulations, available at: https://esgf-node.llnl.gov/search/cmip6/, last access: 3 December 2020.
Fedorov, A. V., Brierley, C. M., Lawrence, K. T., Liu, Z., Dekens, P. S., and Ravelo, A. C.: Patterns and mechanisms of early Pliocene warmth, Nature, 496, 43–49, 2013.
Feng, R., Otto-Bliesner, B. L., Fletcher, T. L., Tabor, C. R., Ballantyne, A. P., and Brady, E. C.: Amplified Late Pliocene terrestrial warmth in northern high latitudes from greater radiative forcing and closed Arctic Ocean gateways, Earth Planet. Sc. Lett., 466, 129–138, 2017.
Feng, R., Otto-Bliesner, B. L., Brady, E. C., and Rosenbloom, N.: Increased Climate Response and Earth System Sensitivity from CCSM4 to CESM2 in mid-Pliocene simulations, J. Adv. Model. Earth Sy., 12, e2019MS002033, https://doi.org/10.1029/2019MS002033, 2020.
Foley, K. M. and Dowsett, H. J.: Community sourced mid-Piacenzian sea surface temperature (SST) data, US Geological Survey data release, https://doi.org/10.5066/P9YP3DTV, 2019.
Gent, P. R., Yeager, S. G., Neale, R. B., Levis, S., and Bailey, D. A.: Improvements in a half degree atmosphere/land version of the CCSM, Clim. Dynam., 34, 819–833, 2010.
Haywood, A. M., Dowsett, H. J., Otto-Bliesner, B., Chandler, M. A., Dolan, A. M., Hill, D. J., Lunt, D. J., Robinson, M. M., Rosenbloom, N., Salzmann, U., and Sohl, L. E.: Pliocene Model Intercomparison Project (PlioMIP): experimental design and boundary conditions (Experiment 1), Geosci. Model Dev., 3, 227–242, https://doi.org/10.5194/gmd-3-227-2010, 2010.
Haywood, A. M., Hill, D. J., Dolan, A. M., Otto-Bliesner, B. L., Bragg, F., Chan, W.-L., Chandler, M. A., Contoux, C., Dowsett, H. J., Jost, A., Kamae, Y., Lohmann, G., Lunt, D. J., Abe-Ouchi, A., Pickering, S. J., Ramstein, G., Rosenbloom, N. A., Salzmann, U., Sohl, L., Stepanek, C., Ueda, H., Yan, Q., and Zhang, Z.: Large-scale features of Pliocene climate: results from the Pliocene Model Intercomparison Project, Clim. Past, 9, 191–209, https://doi.org/10.5194/cp-9-191-2013, 2013.
Haywood, A. M., Dowsett, H. J., Dolan, A. M., Rowley, D., Abe-Ouchi, A., Otto-Bliesner, B., Chandler, M. A., Hunter, S. J., Lunt, D. J., Pound, M., and Salzmann, U.: The Pliocene Model Intercomparison Project (PlioMIP) Phase 2: scientific objectives and experimental design, Clim. Past, 12, 663–675, https://doi.org/10.5194/cp-12-663-2016, 2016a.
Haywood, A. M., Dowsett, H. J., and Dolan, A. M.: Integrating geological archives and climate models for the mid-Pliocene warm period, Nat. Commun., 7, 10646, https://doi.org/10.1038/ncomms10646, 2016b.
Haywood, A. M., Tindall, J. C., Dowsett, H. J., Dolan, A. M., Foley, K. M., Hunter, S. J., Hill, D. J., Chan, W.-L., Abe-Ouchi, A., Stepanek, C., Lohmann, G., Chandan, D., Peltier, W. R., Tan, N., Contoux, C., Ramstein, G., Li, X., Zhang, Z., Guo, C., Nisancioglu, K. H., Zhang, Q., Li, Q., Kamae, Y., Chandler, M. A., Sohl, L. E., Otto-Bliesner, B. L., Feng, R., Brady, E. C., von der Heydt, A. S., Baatsen, M. L. J., and Lunt, D. J.: The Pliocene Model Intercomparison Project Phase 2: large-scale climate features and climate sensitivity, Clim. Past, 16, 2095–2123, https://doi.org/10.5194/cp-16-2095-2020, 2020.
Hill, D. J., Haywood, A. M., Lunt, D. J., Hunter, S. J., Bragg, F. J., Contoux, C., Stepanek, C., Sohl, L., Rosenbloom, N. A., Chan, W.-L., Kamae, Y., Zhang, Z., Abe-Ouchi, A., Chandler, M. A., Jost, A., Lohmann, G., Otto-Bliesner, B. L., Ramstein, G., and Ueda, H.: Evaluating the dominant components of warming in Pliocene climate simulations, Clim. Past, 10, 79–90, https://doi.org/10.5194/cp-10-79-2014, 2014.
Hunter, S. J., Haywood, A. M., Dolan, A. M., and Tindall, J. C.: The HadCM3 contribution to PlioMIP phase 2, Clim. Past, 15, 1691–1713, https://doi.org/10.5194/cp-15-1691-2019, 2019.
Kamae, Y. and Ueda, H.: Mid-Pliocene global climate simulation with MRI-CGCM2.3: set-up and initial results of PlioMIP Experiments 1 and 2, Geosci. Model Dev., 5, 793–808, https://doi.org/10.5194/gmd-5-793-2012, 2012.
Kamae, Y., Yoshida, K., and Ueda, H.: Sensitivity of Pliocene climate simulations in MRI-CGCM2.3 to respective boundary conditions, Clim. Past, 12, 1619–1634, https://doi.org/10.5194/cp-12-1619-2016, 2016.
Kanzow, T., Cunningham, S. A., Johns, W. E., Hirschi, J.J-M., Marotzke, J., Baringer, M. O., Meinen, C. S., Chidichimo, M. P., Atkinson, C., Beal, L. M., Bryden, H. L., and Collins, J.: Seasonal Variability of the Atlantic Meridional Overturning Circulation at 26.5∘ N, J. Climate, 23, 5678–5698, 2010.
Leduc, G., Garbe-Schönberg, D., Regenberg, M., Contoux, C., Etourneau, J., and Schneider, R.: The late Pliocene Benguela upwelling status revisited by means of multiple temperature proxies, Geochem. Geophy. Geosy., 15, 475–491, 2014.
Li, X., Guo, C., Zhang, Z., Otterå, O. H., and Zhang, R.: PlioMIP2 simulations with NorESM-L and NorESM1-F, Clim. Past, 16, 183–197, https://doi.org/10.5194/cp-16-183-2020, 2020.
Li, Z., Luo, Y., Arnold, N., and Tziperman, E.: Reductions in Strong Upwelling-Favorable Wind Events in the Pliocene, Paleoceanography and Paleoclimatology, 34, 1931–1944, 2019.
Lurton, T., Balkkanski, Y., Bastrikov, V., Bekki, S., Bopp, L., Braconnot, P., Brockmann, P., Cadule, P., Contoux, C., Cozic, A., Cugnet, D., Dufresne, J.-L., Ethé, C., Foujols, M.-A., Ghattas, J., Hauglustaine, D., Hu, R.-M., Kageyama, M., Khodri, M., Lebas, N., Levavasseur, G., Marchand, M., Ottlé, C., Peylin, P., Sima, A. Szopa, S., Thiéblemont, R., Vuichard, N., and Boucher, O.: Implementation of the CMIP6 forcing data in the IPSL-CM6A-LR model, J. Adv. Model. Earth Sy., 12, e2019MS001940, https://doi.org/10.1029/2019MS001940, 2020.
McClymont, E. L., Ford, H. L., Ho, S. L., Tindall, J. C., Haywood, A. M., Alonso-Garcia, M., Bailey, I., Berke, M. A., Littler, K., Patterson, M. O., Petrick, B., Peterse, F., Ravelo, A. C., Risebrobakken, B., De Schepper, S., Swann, G. E. A., Thirumalai, K., Tierney, J. E., van der Weijst, C., White, S., Abe-Ouchi, A., Baatsen, M. L. J., Brady, E. C., Chan, W.-L., Chandan, D., Feng, R., Guo, C., von der Heydt, A. S., Hunter, S., Li, X., Lohmann, G., Nisancioglu, K. H., Otto-Bliesner, B. L., Peltier, W. R., Stepanek, C., and Zhang, Z.: Lessons from a high-CO2 world: an ocean view from ∼ 3 million years ago, Clim. Past, 16, 1599–1615, https://doi.org/10.5194/cp-16-1599-2020, 2020.
Miller, M. D. and Tziperman, E.: The effect of changes in surface winds and ocean stratification on coastal upwelling and sea surface temperatures in the Pliocene, Paleoceanography, 32, 371–383, 2017.
Otto-Bliesner, B. L., Jahn, A., Feng, R., Brady, E. C., Hu, A., and Löfverström, M.: Amplified North Atlantic warming in the late Pliocene by changes in Arctic gateways, Geophys. Res. Lett., 44, 957–964, 2017.
Pound, M. J., Tindall, J., Pickering, S. J., Haywood, A. M., Dowsett, H. J., and Salzmann, U.: Late Pliocene lakes and soils: a global data set for the analysis of climate feedbacks in a warmer world, Clim. Past, 10, 167–180, https://doi.org/10.5194/cp-10-167-2014, 2014.
Raymo, M. E., Grant, B., Horowitz, M., and Rau, G. H.: Mid-Pliocene warmth: stronger greenhouse and stronger conveyor, Mar. Micropaleontol., 27, 313–326, 1996.
Rayner, N. A., Parker, D. E., Horton, E. B., Folland, C. K., Alexander, L. V., Rowell, D. P., Kent, E. C., and Kaplan, A.: Global analyses of sea surface temperature, sea ice, and night marine air temperature since the late nineteenth century, J. Geophys. Res., 108, 4407, https://doi.org/10.1029/2002JD002670, 2003
Rosenbloom, N. A., Otto-Bliesner, B. L., Brady, E. C., and Lawrence, P. J.: Simulating the mid-Pliocene Warm Period with the CCSM4 model, Geosci. Model Dev., 6, 549–561, https://doi.org/10.5194/gmd-6-549-2013, 2013.
Salzmann, U., Dolan, A. M., Haywood, A. M., Chan, W.-L., Voss, J., Hill, D. J., Abe-Ouchi, A., Otto-Bliesner, B., Bragg, F. J., Chandler, M. A., Contoux, C., Dowsett, H. J., Jost, A., Kamae, Y., Lohmann, G., Lunt, D. J., Pickering, S. J., Pound, M. J., Ramstein, G., Rosenbloom, N. A., Sohl, L., Stepanek, C., Ueda, H., and Zhang, Z.: Challenges in quantifying Pliocene terrestrial warming revealed by data–model discord, Nat. Clim. Change, 3, 969–974, 2013.
Small, R. J., Curchitser, E., Hedstrom, K., Kauffman, B., and Large, W. G.: The Benguela Upwelling System: Quantifying the Sensitivity to Resolution and Coastal Wind Representation in a Global Climate Model, J. Climate, 28, 9409–9432, https://doi.org/10.1175/JCLI-D-15-0192.1, 2015.
Song, Z., Latif, M., Park, W., and Zhang, Y.: Influence of model bias on simulating North Atlantic sea surface temperature during the mid-Pliocene, Paleoceanography and Paleoclimatology, 33, 884–893, https://doi.org/10.1029/2018PA003397, 2018.
Stepanek, C. and Lohmann, G.: Modelling mid-Pliocene climate with COSMOS, Geosci. Model Dev., 5, 1221–1243, https://doi.org/10.5194/gmd-5-1221-2012, 2012.
Stepanek, C., Samakinwa, E., Knorr, G., and Lohmann, G.: Contribution of the coupled atmosphere–ocean–sea ice–vegetation model COSMOS to the PlioMIP2, Clim. Past, 16, 2275–2323, https://doi.org/10.5194/cp-16-2275-2020, 2020.
Tan, N., Contoux, C., Ramstein, G., Sun, Y., Dumas, C., Sepulchre, P., and Guo, Z.: Modeling a modern-like pCO2 warm period (Marine Isotope Stage KM5c) with two versions of an Institut Pierre Simon Laplace atmosphere–ocean coupled general circulation model, Clim. Past, 16, 1–16, https://doi.org/10.5194/cp-16-1-2020, 2020.
Williams, R. G., Roussenov, V., Lozier, M. S., and Smith, D.: Mechanisms of Heat Content and Thermocline Change in the Subtropical and Subpolar North Atlantic, J. Climate, 28, 9803–9815, 2015.
Zhang, Q., Li, Q., Zhang, Q., Berntell, E., Axelsson, J., Chen, J., Han, Z., de Nooijer, W., Lu, Z., Wyser, K., and Yang, S.: Simulating the mid-Holocene, Last Interglacial and mid-Pliocene climate with EC-Earth3-LR, Geosci. Model Dev. Discuss. [preprint], https://doi.org/10.5194/gmd-2020-208, in review, 2020.
Zhang, Z. S., Nisancioglu, K., Bentsen, M., Tjiputra, J., Bethke, I., Yan, Q., Risebrobakken, B., Andersson, C., and Jansen, E.: Pre-industrial and mid-Pliocene simulations with NorESM-L, Geosci. Model Dev., 5, 523–533, https://doi.org/10.5194/gmd-5-523-2012, 2012.
Zhang, Z.-S., Nisancioglu, K. H., Chandler, M. A., Haywood, A. M., Otto-Bliesner, B. L., Ramstein, G., Stepanek, C., Abe-Ouchi, A., Chan, W.-L., Bragg, F. J., Contoux, C., Dolan, A. M., Hill, D. J., Jost, A., Kamae, Y., Lohmann, G., Lunt, D. J., Rosenbloom, N. A., Sohl, L. E., and Ueda, H.: Mid-pliocene Atlantic Meridional Overturning Circulation not unlike modern, Clim. Past, 9, 1495–1504, https://doi.org/10.5194/cp-9-1495-2013, 2013a.
Zhang, Z.-S., Nisancioglu, K. H., and Ninnemann, U. S.: Increased ventilation of Antarctic deep water during the warm mid-Pliocene, Nat. Commun., 4, 1499, https://doi.org/10.1038/ncomms2521, 2013b.
Zubakov, V. A. and Borzenkova, I. I.: Pliocene palaeoclimates: Past climates as possible analogues of mid-twenty-first century climate, Palaeogeogr. Palaeocl., 65, 35–49, 1988.