the Creative Commons Attribution 4.0 License.
the Creative Commons Attribution 4.0 License.
 | 29 Jan 2021
Glacial to interglacial climate variability in the southeastern African subtropics (25–20° S)
Enno Schefuß
Jeroen Groeneveld
Charlotte Miller
Matthias Zabel
We present a continuous and well-resolved record of climatic variability for the past 100 000 years from a marine sediment core taken in Delagoa Bight, off southeastern Africa. In addition to providing a sea surface temperature reconstruction for the past ca. 100 000 years, this record also allows a high-resolution continental climatic reconstruction. Climate sensitive organic proxies, like the distribution and isotopic composition of plant-wax lipids as well as elemental indicators of fluvial input and weathering type provide information on climatic changes in the adjacent catchment areas (Incomati, Matola and Lusutfu rivers). At the transition between glacials and interglacials, shifts in vegetation correlate with changes in sea surface temperature in the Agulhas Current. The local hydrology, however, does not follow these orbitally paced shifts. Instead, precipitation patterns follow millennial-scale variations with different forcing mechanisms in glacial vs. interglacial climatic states. During glacials, southward displacement of the Intertropical Convergence Zone facilitates a transmission of northern hemispheric signals (e.g., Heinrich events) to the southern hemispheric subtropics. Furthermore, the southern hemispheric westerlies become a more direct source of precipitation as they shift northward over the study site, especially during Antarctic cold phases. During interglacials, the observed short-term hydrological variability is also a function of Antarctic climate variability; however, it is driven by the indirect influence of the southern hemispheric westerlies and the associated South African high-pressure cell blocking the South Indian Ocean Convergence Zone related precipitation. As a consequence of the interplay of these effects, small-scale climatic zones exist. We propose a conceptual model describing latitudinal shifts of these zones along the southeastern African coast as tropical and temperate climate systems shift over glacial and interglacial cycles. The proposed model explains some of the apparent contradictions between several paleoclimate records in the region.
- Article
(2992 KB) - Full-text XML
-
Supplement
(708 KB) - BibTeX
- EndNote


Despite the increasing number of southern African paleoclimate studies, large data gaps and unresolved debates remain. Controversies concern both the interpretation of the climate records as well as the contradictory major climate forcings that have been proposed for the region. In southeastern Africa, the main moisture source is the warm Indian Ocean (Tyson and Preston-Whyte, 2000), the mechanisms controlling the intensity and duration of the easterly rainfall over time, however, remain uncertain. Climate variations on glacial–interglacial timescales in southernmost Africa were reported to be directly forced by local (southern hemispheric) insolation (Partridge et al., 1997; Schefuß et al., 2011; Simon et al., 2015; Caley et al., 2018). Strong southern hemispheric summer insolation was hypothesized to cause wet climatic conditions along the east African coast due to a stronger atmospheric convection and an increase in the land–ocean temperature contrast, which results in higher moisture transport by the tropical easterlies. However, recent paleo-reconstructions suggested a synchrony with Northern Hemisphere climate signals, which are inversely correlated to southern hemispheric insolation (e.g., Truc et al., 2013). As a mechanism of transmitting the northern hemispheric signal to southern Africa, ocean circulation variability (Agulhas Current strength; i.e., sea surface temperatures, SSTs) has often been proposed (Biastoch et al., 1999; Reason and Rouault, 2005; Dupont et al., 2011; Tierney et al., 2008; Stager et al., 2012; Scott et al., 2012; Truc et al., 2013; Baker et al., 2017; Chase et al., 2017). In terms of vegetation shifts, atmospheric CO2 variability and temperature have been suggested as major driving mechanisms over glacial–interglacial cycles (Dupont et al., 2019). Nowadays, eastern southern Africa is not under the direct influence of the Intertropical Convergence Zone (ITCZ) as its modern maximum southern extension is ca. 13–14∘ S (Gasse et al., 2008). However, the position of the ITCZ was more southerly during glacial periods (Nicholson and Flohn, 1980; Chiang et al., 2003; Chiang and Bitz, 2005), which may have allowed ITCZ shifts to reach much further south along the east African coast than today (see Johnson et al., 2002; Schefuß et al., 2011; Ziegler et al., 2013; Simon et al., 2015). At the same time, the southern hemispheric westerlies (SHWs), which presently influence only the southernmost tip of Africa, are hypothesized to have moved northward during glacial periods of increased south Atlantic sea ice extent (Anderson et al., 2009; Sigman et al., 2010; Miller et al., 2020). As suggested by Miller et al. (2020), in such a scenario the temperate systems may have brought winter moisture to the southeast African coast and/or blocked South Indian Ocean Convergence Zone (SIOCZ) related precipitation during the summer months. Regional studies integrating many of the available records have found that (i) several small-scale climatic dipoles exist due to the interaction of various driving mechanisms and that (ii) the spatial extent of these climatic regions has varied considerably since the last glacial (Chevalier et al., 2017; Chase et al., 2018; Miller et al., 2020). Miller et al. (2020) compile paleo-records along the southeastern African coast and propose a conceptual model of climatic variability during the Holocene. The authors describe three climatic zones; a northern SRZ (summer rainfall zone) where the climate is driven by local insolation and a central and eastern SRZ and southern South African zone where climate is driven by shifts of the Southern Hemisphere westerlies, the South African high-pressure cell and the SIOCZ. Equatorward shifts of the Southern Hemisphere westerlies, the South African high-pressure cell and the SIOCZ result in humid conditions in the southern South African zone, whereas they cause arid conditions in the central and eastern SRZ. We analyze a marine core located within the central and eastern SRZ that offers a continuous high-resolution record of the past ca. 100 000 years allowing us to add to the existing conceptual models of southeastern African climate dynamics and to gain an understanding of glacial climate mechanisms in the region. A combination of organic and inorganic geochemical proxies is used in order to decipher the hydrological processes on land, while foraminiferal shell geochemistry serves as a proxy for ocean circulation variability. With this approach we aim to decipher some of the discrepancies concerning the driving mechanisms of southeast African hydroclimate and vegetation shifts during the last glacial–interglacial cycle.
Regional setting
The coring site is located in an embayment on the southeastern African continental shelf called the Delagoa Bight (Fig. 1a). The southern directed Agulhas Current flows along the east African margin transporting warm and saline water from the tropical Indian Ocean to the tip of southern Africa (Zahn et al., 2012). The current system is structured into a series of large-scale (∼200 km diameter) anticyclonic eddies occurring about four to five times per year (Quartly and Srokosz, 2004). As they pass the Delagoa Bight, these eddies, together with the Agulhas Current itself, drive the Delagoa Bight eddy, a topographically constrained cyclonic lee eddy at the coring location (Lutjeharms and Da Silva, 1988; Quartly and Srokosz, 2004). Although the coring site is located just west of the mouth of the major Limpopo River system, Schüürman et al. (2019) show that the inorganic material at our site most likely originates from three minor rivers – Incomati, Matola and Lusutfu – that flow into the Indian Ocean further to the southwest. This is attributed to the eastward deflection of the Limpopo sediments by the Delagoa Bight eddy. The eddy appears to have been stable and strong enough to effectively constrain the drift of the Limpopo sediments eastwards over the Late Pleistocene and Holocene (Schüürman et al., 2019). The three rivers – Incomati (also known as Komati), Matola (also known as Umbeluzi) and Lusutfu (also known as Maputo) – have catchment areas of ca. 45 300, 6600 and 22 700 km2, respectively, comprising the coastal region and the eastern flank of the Drakensberg Mountains. Between the Drakensberg escarpment and the coast lies a N–S-oriented low ridge, the Lebombo Mountains (400–800 m a.s.l.). The geological formations of this area are the Archean Kaapvaal Craton, the Karoo Igneous Province and the Quaternary deposits on the coastal plains (de Wit et al., 1992; Sweeney et al., 1994). Climatically these catchments are in the transition zone between tropical and subtropical climate, at the southern limit of the subtropical ridge between the southern Hadley and the Ferrel cells (Tyson and Preston-Whyte, 2000). The average annual temperature ranges from 16 ∘C in the highlands to 24 ∘C in the lowland area (Kersberg, 1996). Rain (ca. 1000 mm annually) falls mostly in summer (ca. 67 % of annual rainfall from November to March) (Xie and Arkin, 1997; Chase and Meadows, 2007). Although the ITCZ currently does not directly affect the region, it does induce latitudinal shifts in the SIOCZ, which can be regarded as a southward extension of the ITCZ. When the ITCZ is in its southernmost (summer) position, tropical temperate troughs (TTTs), forming at the SIOCZ, bring easterly rainfall from the Indian Ocean (Jury et al., 1993; Reason and Mulenga, 1999) (Fig. 1b). During austral summer, a low-pressure cell dominates the southern African interior, enabling tropical easterlies or TTTs to bring rainfall to the region. This rainfall is suppressed during austral winter, when a subtropical high-pressure cell is located over southern Africa (Fig. 1b). This high-pressure cell creates a blocking effect over the continent, which stops moisture advection inland over the majority of southern Africa during winter (Dedekind et al., 2016). The winter rain that does fall (33 % of annual rainfall from April to October) is associated with extratropical cloud bands and thunderstorms linked to frontal systems that develop in the main SHW flow (between 40 and 50∘ S). As the SHWs shift northward during the winter, these frontal systems may become cut off and displaced equatorward as far north as 25∘ S (see Baray et al., 2003; Mason and Jury, 1997) (Fig. 1c). Associated with this climatological and topographic setting we find a vegetation in the Incomati, Matola and Lusutfu catchment areas that consists mainly of coastal forests and mountain woodlands with savanna elements only in the northernmost parts of the catchment and sedges along the riverbanks and floodplains (see White, 1983, and Dupont et al., 2011, for a more detailed description of the vegetation biomes).
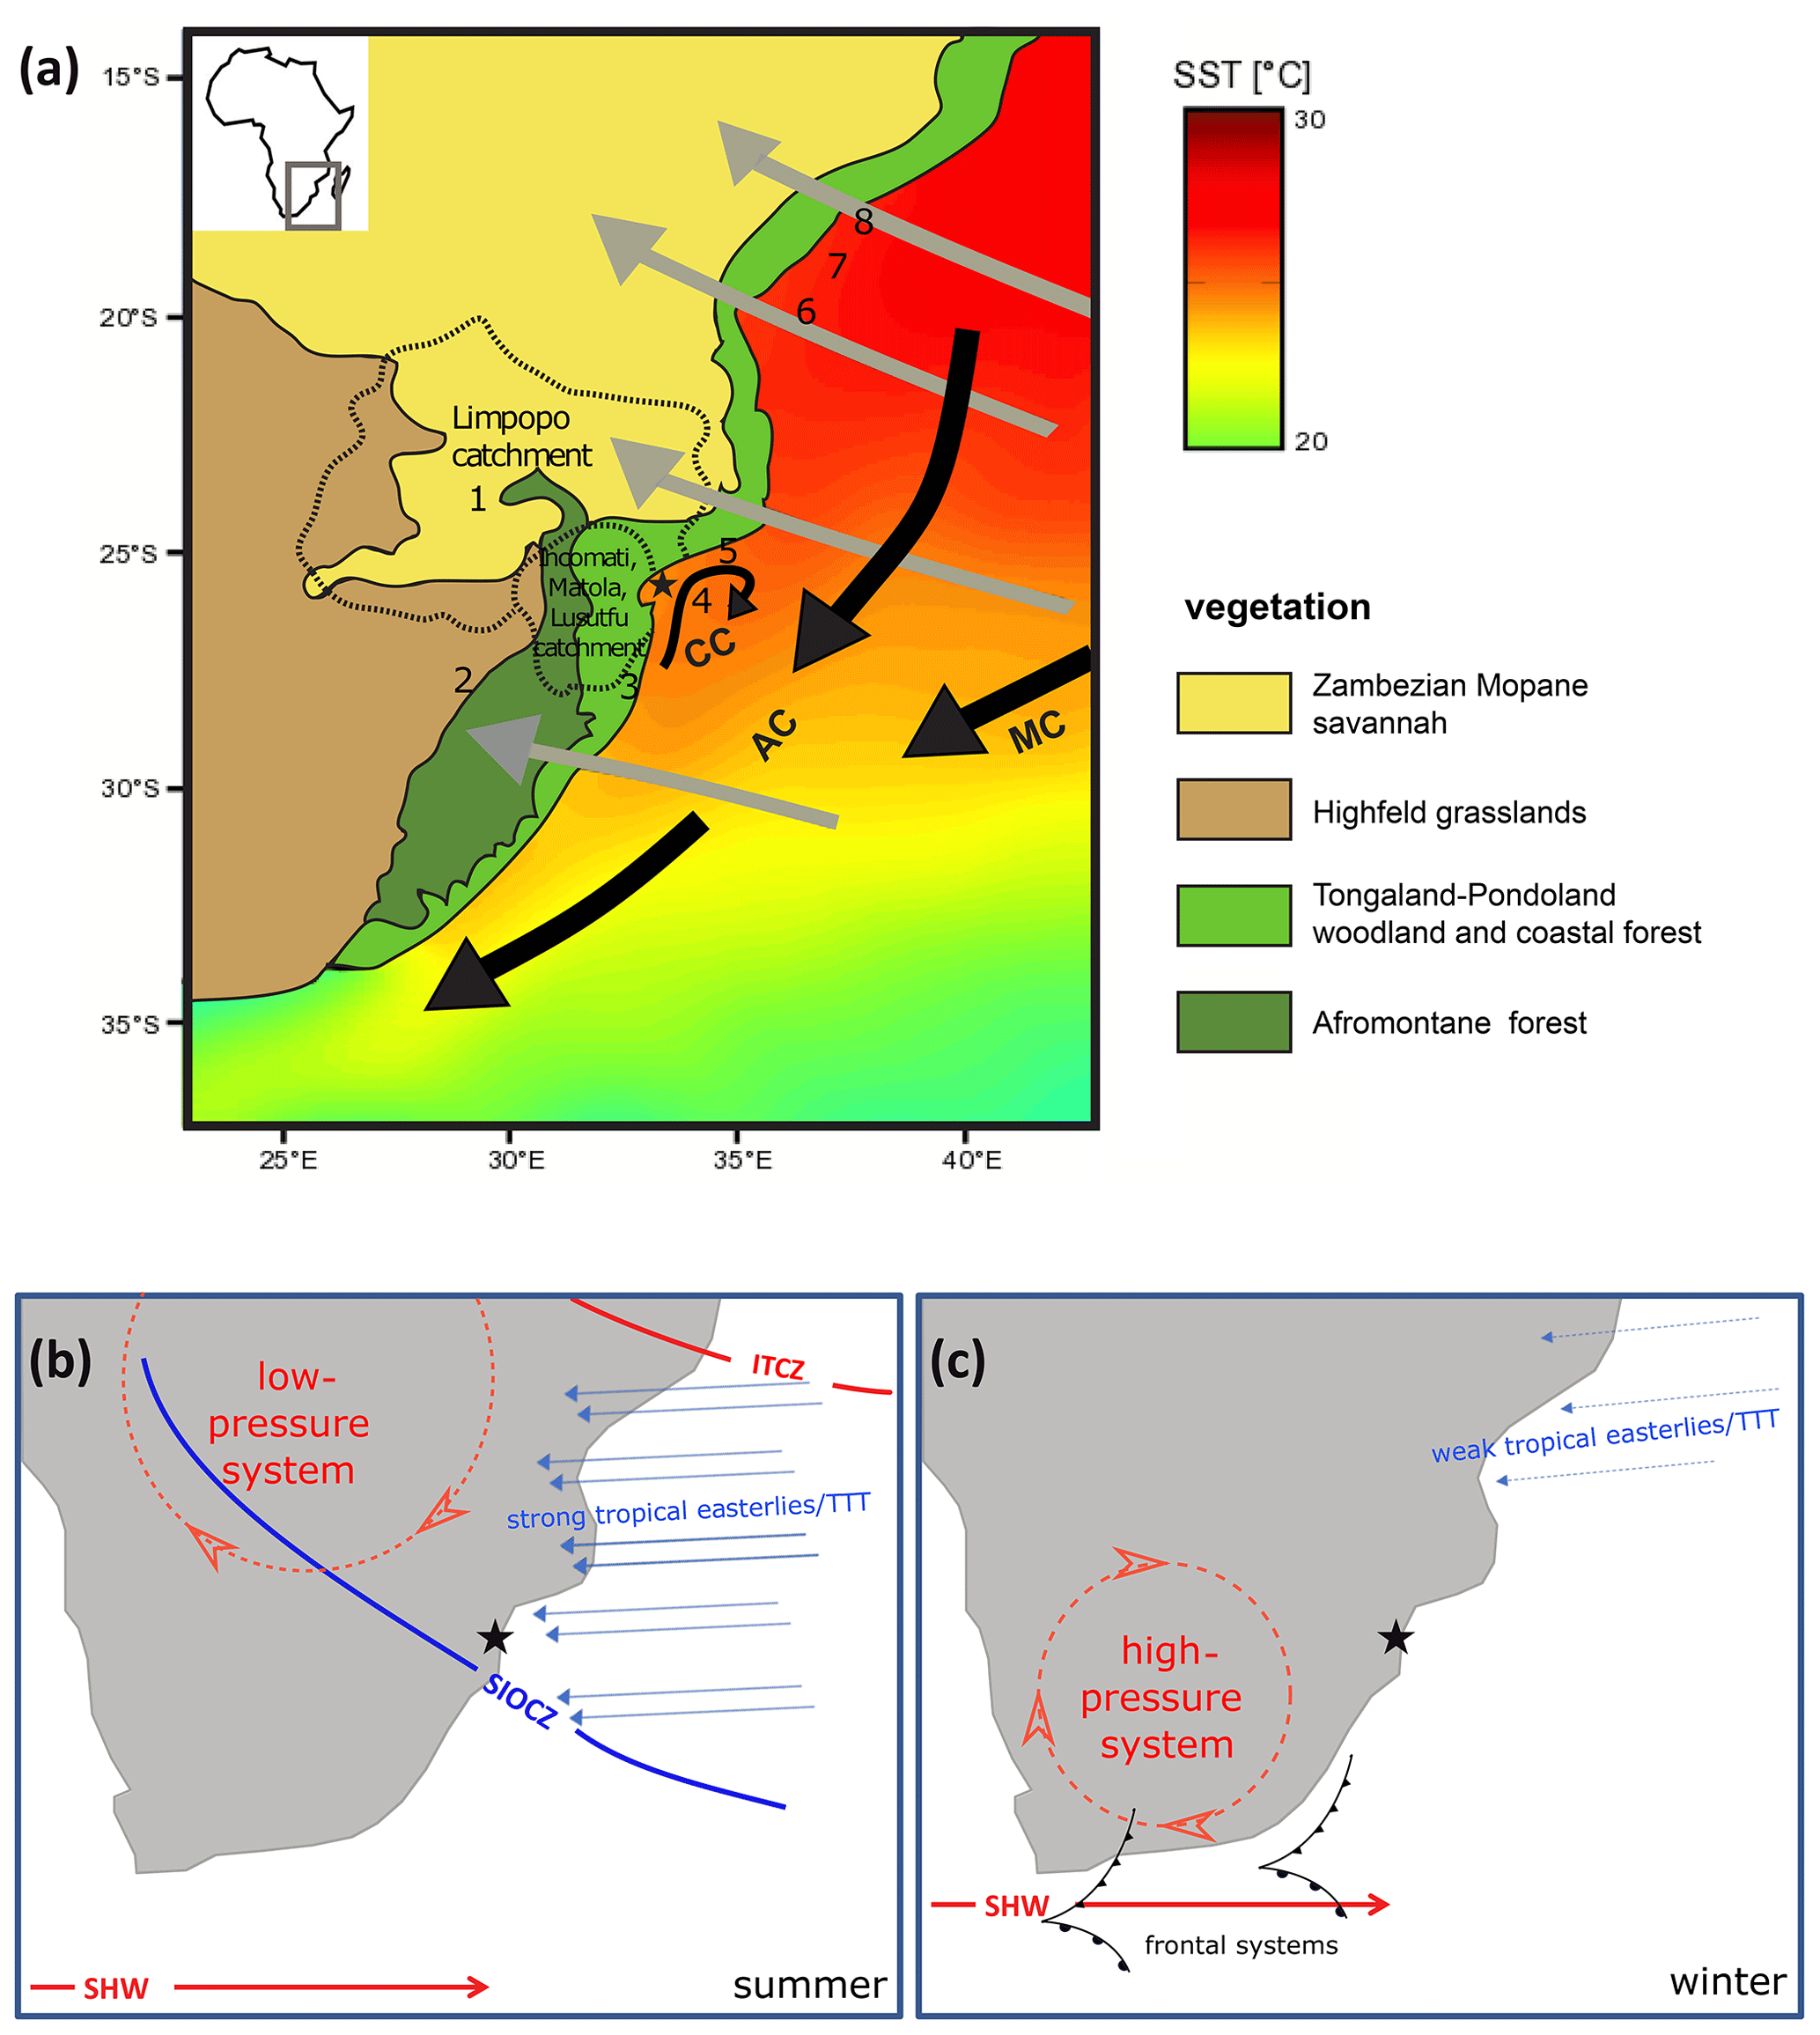
Figure 1(a) Modern vegetation of southern Africa and the Incomati, Matola and Lusutfu catchments (after White, 1983) and annual SST over the Indian Ocean (Locarnini et al., 2013). Gray arrows represent the main easterly transport of moisture from the warm Indian Ocean. The Mozambique Current (MC), Agulhas Current (AC) and countercurrent (cc) forming a coastal eddy are shown in black. Sites mentioned in the discussion are numbered as (1) Wonderkrater (Truc et al., 2013), (2) Braamhoek (Norström et al., 2009), (3) Mfabeni (Miller et al., 2019), (4) MD96-2048 (Dupont et al., 2011; Caley et al., 2011, 2018), (5) GeoB20610-1 (Miller et al., 2020), (6) GIK16160-3 (Wang et al., 2013), (7) MD79-257 (Bard et al., 1997; Sonzogni et al., 1998; Levi et al., 2007) and (8) GeoB9307-3 (Schefuß et al., 2011). (b) Map of southern Africa in austral summer showing the schematic position of the low-pressure system, the ITCZ (Intertropical Convergence Zone), the SIOCZ (South Indian Ocean Convergence Zone) and related rain-bearing TTTs (tropical temperate troughs). (c) Map of southern Africa in austral winter showing the schematic position of the high-pressure system, the weaker TTTs and the frontal systems associated with the northward-shifted SHWs (southern hemispheric westerlies).
2.1 Sediments
Gravity core GeoB20616-1 (958 cm long) was retrieved from 25∘35.395′ S, 33∘20.084′ E on 15 February 2016 from a water depth of about 460 m. Shipboard sedimentological analysis showed a lithology of clayey silt with signs of slight bioturbation. The composition was observed as mainly clastic with the occurrence of foraminifera and shell fragments (Zabel, 2016).
2.2 Oxygen isotopic composition of planktonic foraminifera
Stable oxygen isotope values of planktonic foraminifera (G. ruber, white variety, >150 µm) were measured in the interval between 395 and 935 cm at 10 cm resolution for age modeling (Table S1 in the Supplement). For each measurement, around eight shells of G. ruber were selected and analyzed at MARUM – Center for Marine Environmental Sciences, University of Bremen, Germany, using a ThermoFisher Scientific 253 plus gas isotope ratio mass spectrometer with a Kiel IV automated carbonate preparation device. Data were calibrated against an in-house standard (Solnhofen limestone). The results are reported in per mill (‰, parts per thousand) vs. Vienna Pee Dee belemnite (VPDB). Standard deviation of the in-house standard (Solnhofen limestone) 18O over the measurement period was 0.06 ‰.
2.3 Age model
Up to the limit of radiocarbon dating, the age model used in this study is based on eight radiocarbon ages of G. ruber, one shell fragment and a bulk total organic carbon surface sample (see Table 1). The cleaning procedures as well as the accelerator mass spectrometry (AMS) measurements were carried out in the Poznań Radiocarbon Laboratory, Poland. The modeled ocean average curve (Marine13) (Reimer et al., 2013) and a local marine ΔR of 121±16 per year (Maboya et al., 2017) were applied to calibrate the radiocarbon ages. To perform these calculations the Calib 7.1 software (Stuiver et al., 2019) was used. For flexible Bayesian age–depth modeling of the available 14C dates, the software Bacon (Blaauw and Christen, 2011) (Fig. 2b) was used. The uncertainty of the radiocarbon dates is indicated in Table 1. The uncertainty of the Bacon model is indicated in Fig. 2b (gray lines). However, there is possibly an underestimation of the error in the age model around two periods of slow deposition in the interval from 15 to 6 ka and in the interval from 32 to 25 ka. The calibrated 14C age of a shell fragment found in this interval (390 cm) was used as a 14C tie point (see Table 1); additionally two δ18O tie points were defined and an age model was calculated using the software AnalySeries (Paillard et al., 1996) (Fig. 2a). The age–depth model was extended by planktonic foraminifera δ18O correlation using major δ18O shifts in the LR04 stack as a reference (Lisiecki and Raymo, 2005) (Fig. 2a and b). With this low number of tie points it is difficult to capture heterogeneity in the deposition rate, which must be considered when estimating the error of the age model. For the error estimation of δ18O tie points the mean resolution of the GeoB20616-1 δ18O record and the reference curve around the tie point depth and age (respectively) was taken into account as well as the absolute age error of the timescale used for the reference record and a matching error visually estimated when defining tie points. Figure 2b (gray lines) gives an estimate of the age model error. In this paper, we refer to median age estimations.
Table 1AMS radiocarbon analyses of material from core GeoB20616-1. The modeled ocean average curve (Marine13) (Reimer et al., 2013) was used for calibration and a local ΔR of 121±16 per year (Maboya et al., 2017) was applied. The ages were calibrated with Calib 7.1 software (Stuiver et al., 2019).
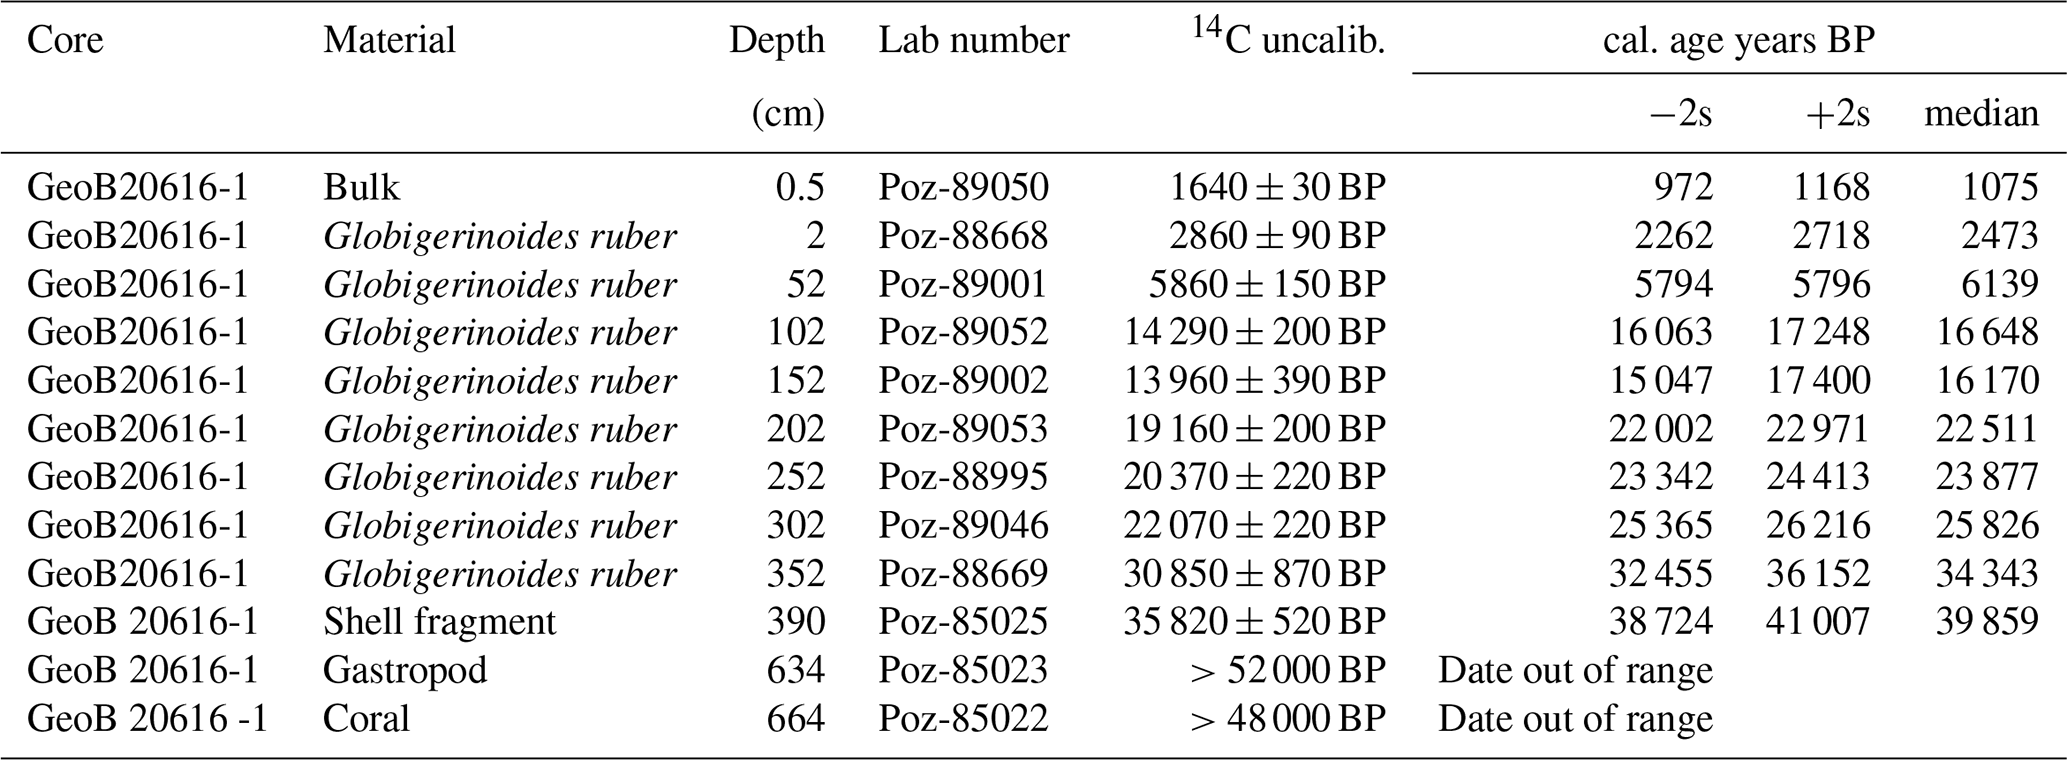
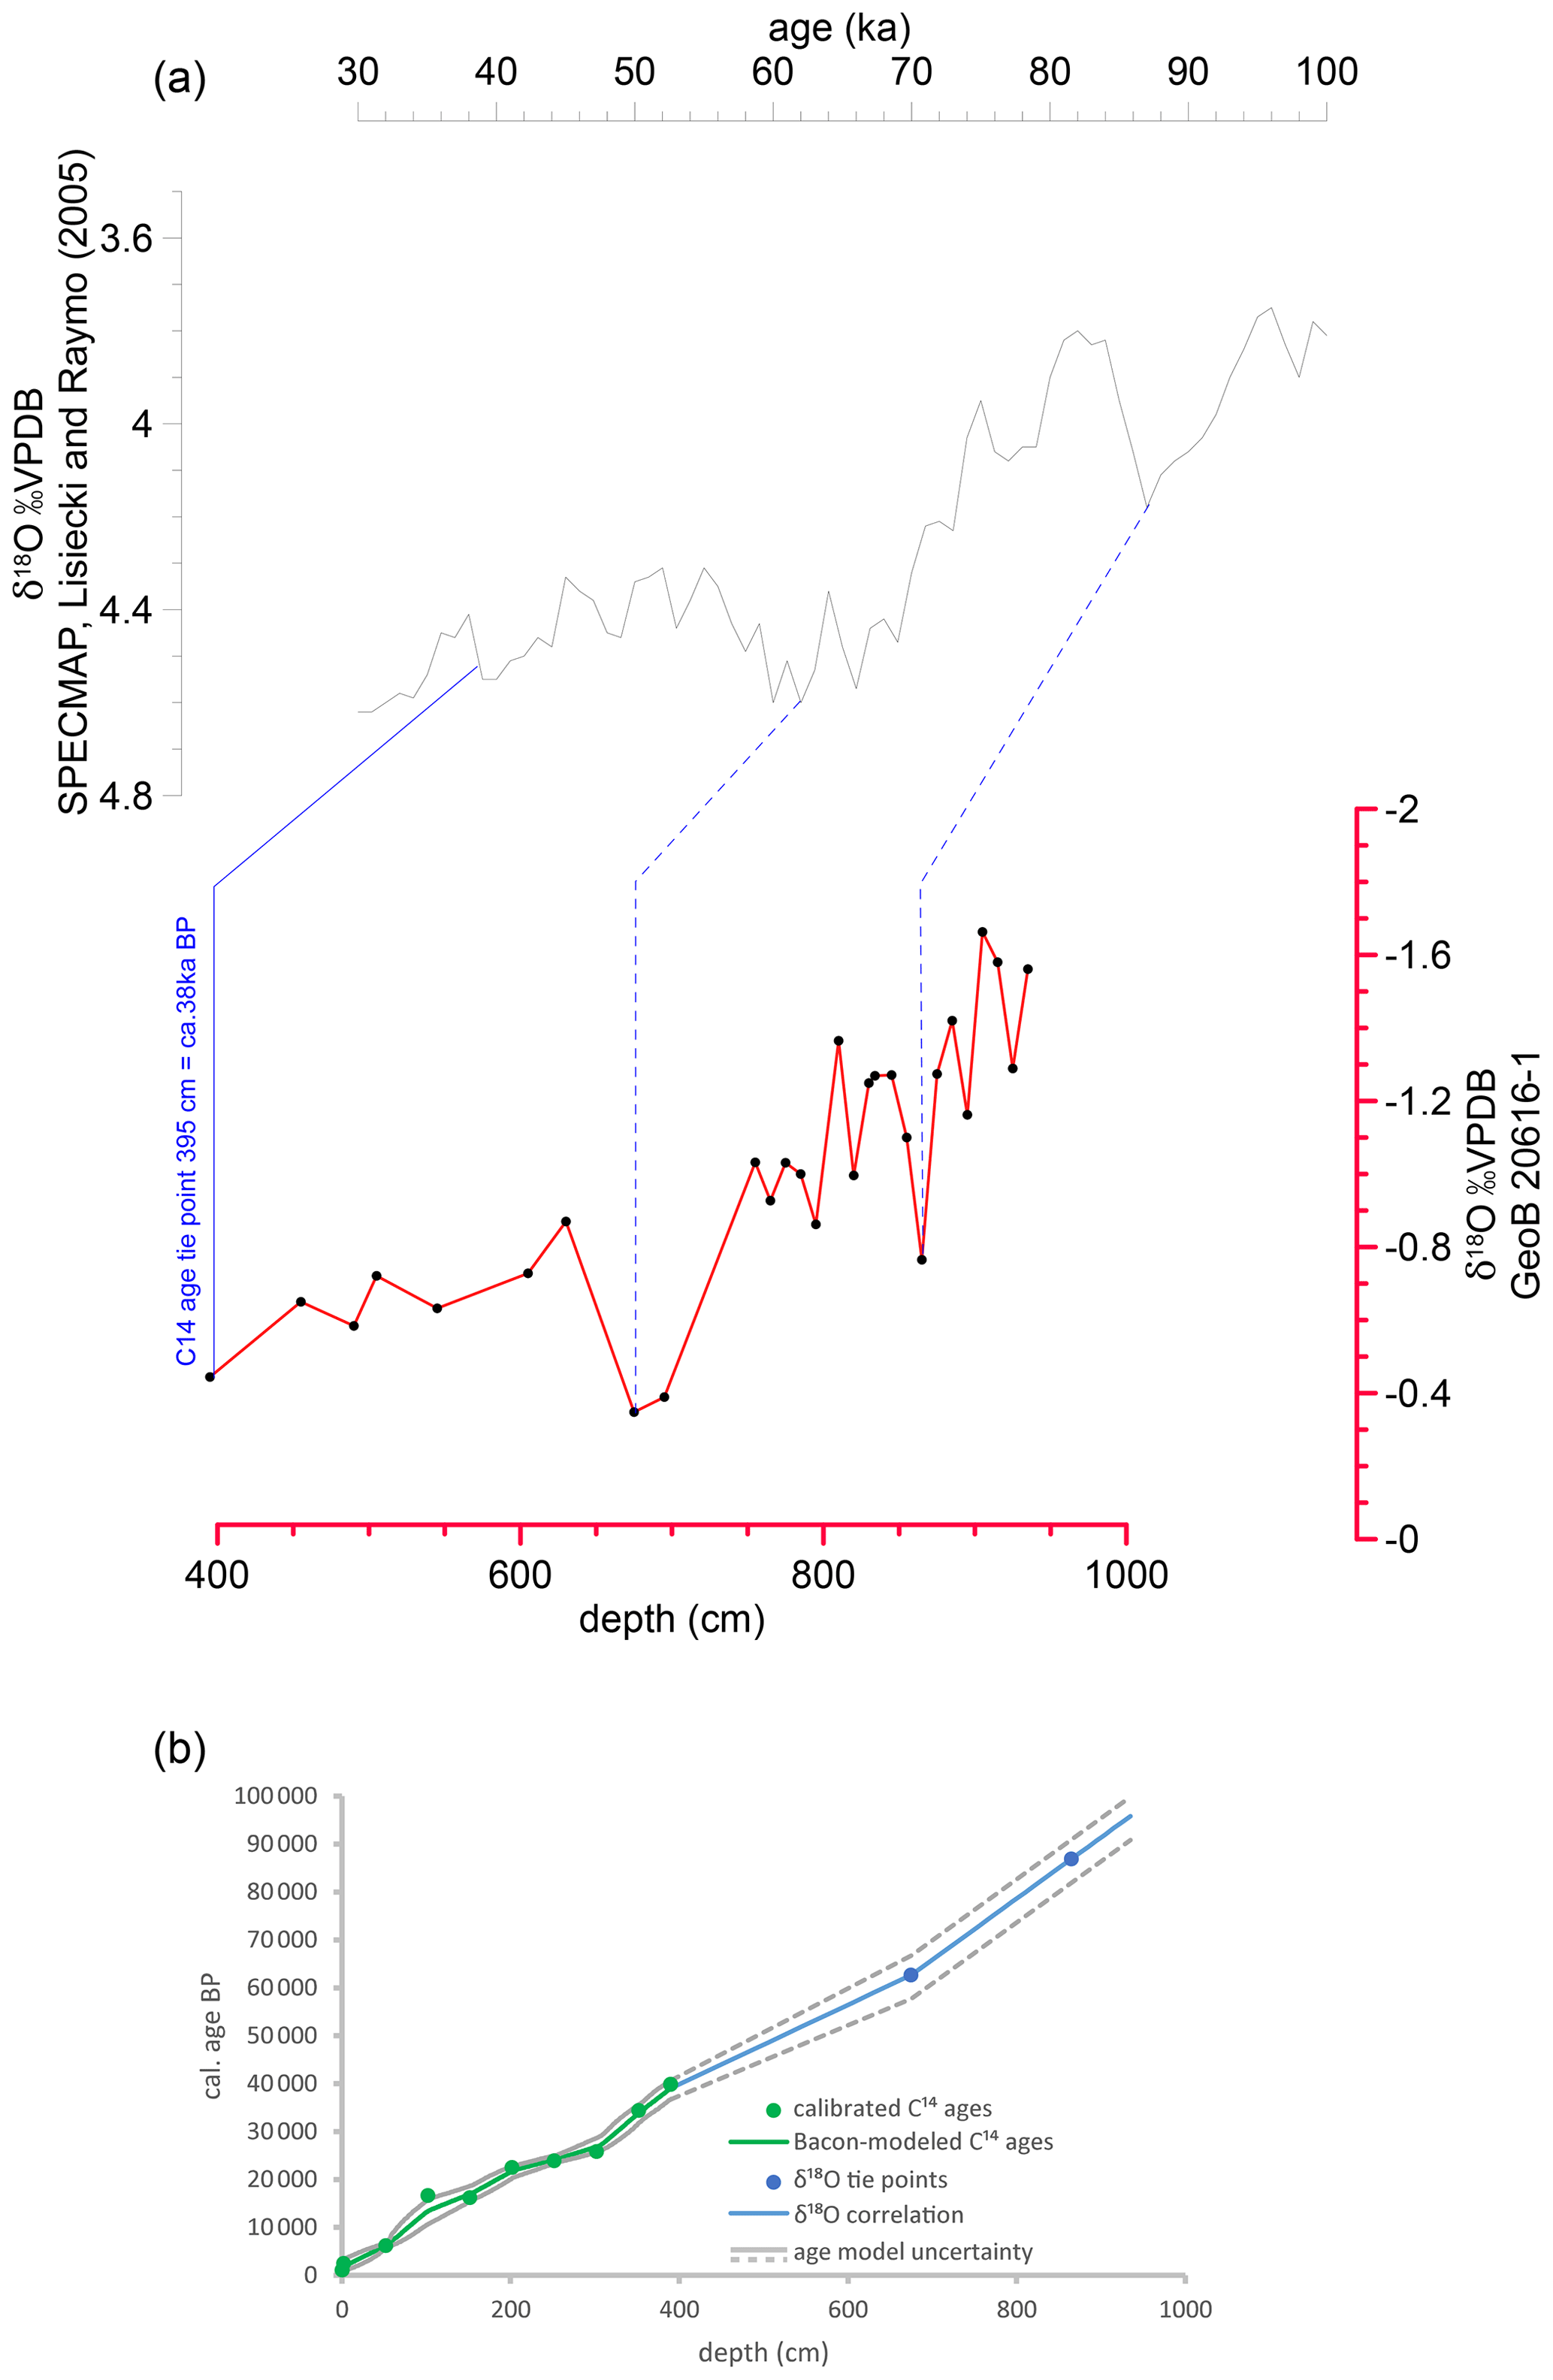
Figure 2Reference curves and age–depth model of core GeoB20616-1. (a) LR04 benthic foraminifera δ18O stack (Lisiecki and Raymo, 2005) (black) compared to GeoB20616-1 (red) G. ruber foraminifera δ18O with indicated tie points. (b) Age–depth model based on Bacon v. 2.2 (Blaauw and Christen, 2011; green) and δ18O correlation (blue). Blue circles in panel (b) represent the positions of calibrated 14C ages, whereas blue circles indicate δ18O tie points. Gray lines indicate uncertainty.
2.4 Foraminiferal Mg∕Ca
Up to 20 specimens (>150 µm) of G. ruber (white) (>150 µm) were selected for Mg∕Ca analysis (see Table S2). Foraminiferal tests were gently crushed prior to standard cleaning procedures for Mg∕Ca in foraminifera (Barker et al., 2003). For clay and organic matter removal ultrasonic cleaning was alternated with washes in deionized water and methanol; an oxidizing step with 1 % H2O2 buffered in 0.1 M NaOH followed, which was then neutralized by deionized water washes. A final weak acid leach with 0.001 M QD HNO3 was performed before dissolution in 0.5 mL 0.075 M QD HNO3 and centrifugation for 10 min (6000 rpm). The samples were diluted with Seralpur water before analysis with inductively coupled plasma optical emission spectrometry (Agilent Technologies, 700 Series with autosampler ASX-520 CETAC and micro-nebulizer) at MARUM, University of Bremen, Germany. Instrumental precision was monitored after every five samples using analysis of an in-house standard solution with a Mg∕Ca of 2.93 mmol mol−1 (standard deviation of 0.020 mmol mol−1 or 0.67 %). A limestone standard (ECRM752-1, reported Mg∕Ca of 3.75 mmol mol−1) was analyzed to allow inter-laboratory comparison (Greaves et al., 2008; Groeneveld and Filipsson, 2013).
2.5 Organic geochemistry
Total lipid extracts (TLEs) were extracted from ca. 9–27 g of the freeze-dried, homogenized samples with a DIONEX accelerated solvent extractor (ASE 200) at 100 ∘C and at 1000 psi for 5 min (repeated three times) using a dichloromethane (DCM) : methanol (MeOH) (9:1, v∕v) mixture. Squalane was added in a known amount to the samples as an internal standard before extraction. Elemental sulfur was removed from the TLEs using copper turnings. After saponification by adding 6 % KOH in MeOH and extraction of the neutral fractions with hexane, the neutral fractions were split into hydrocarbon, ketone and polar fractions using silica gel column chromatography (with a mesh size of 60 µm) and elution with hexane, DCM and DCM:MeOH (1:1), respectively. Subsequently the elution of the hydrocarbon fractions with hexane over an AgNO3-impregnated silica column yielded saturated hydrocarbon fractions. The concentrations of long-chain n-alkanes in the saturated hydrocarbon fractions were determined using a Thermo Fischer Scientific Focus gas chromatograph (GC) with flame-ionization detection (FID) equipped with a Restek Rxi 5 ms column ( µm). Quantities of individual n-alkanes were estimated by comparison with an external standard containing n-alkanes (C19–C34) at a known concentration. Replicate analyses of the external standard yielded a quantification uncertainty of <5 %. The carbon preference index (CPI) was calculated using the following equation:
with Cx the amount of each homologue (Bray and Evans 1961).
The δD values of long-chain n-alkanes were measured using a Thermo Trace GC equipped with an Agilent DB-5MS (30 m length, 0.25 mm ID, 1.00 µm film) coupled via a pyrolysis reactor (operated at 1420 ∘C) to a Thermo Fisher MAT 253 isotope ratio mass spectrometer (GC/IR-MS). The δD values were calibrated against external H2 reference gas. The H3+ factor was monitored daily and varied around 6.23±0.04 ppm nA−1. δD values are reported in per mill (‰) vs. Vienna Standard Mean Ocean Water (VSMOW). An n-alkane standard of 16 externally calibrated alkanes was measured every sixth measurement. Long-term precision and accuracy of the external alkane standard were 3 ‰ and <1 ‰, respectively. When n-alkane concentrations permitted, samples were run at least in duplicate. Precision and accuracy of the squalane internal standard were 2 ‰ and <1 ‰, respectively (n=41). Average precision of the n-C29 alkane in replicates was 4 ‰. The δ13C values of the long-chain n-alkanes were measured using a Thermo Trace GC Ultra coupled to a Finnigan MAT 252 isotope ratio monitoring mass spectrometer via a combustion interface operated at 1000 ∘C. The δ13C values were calibrated against external CO2 reference gas. δ13C values are reported in per mill (‰) against VPDB. When concentrations permitted, samples were run at least in duplicate. Precision and accuracy of the squalane internal standard were 0.1 ‰ and 0.4 ‰, respectively (n=41). An external standard mixture was analyzed repeatedly every six runs and yielded a long-term mean standard deviation of 0.2 ‰ with a mean deviation of 0.1 ‰ from the reference values. Average precision of the n-C29 alkane in replicates was 0.3 ‰. We focus the discussion on the isotopic signals of the n-C31 alkane, as this compound is derived from grasses and trees present throughout the study area. Table S3, however, shows that the n-C29 and n-C33 alkanes reveal similar trends.
2.6 Inorganic geochemistry
The elemental composition of all onshore and offshore samples was measured using a combination of high-resolution (1 cm) semi-quantitative XRF (X-ray fluorescence) scanning and lower-resolution (5 cm) quantitative XRF measurements on discrete samples (see Table S4). XRF core scanning (Avaatech XRF Scanner II at MARUM, University of Bremen) was performed with an excitation potential of 10 kV, a current of 250 mA and 30 s counting time for Ca, Fe, K and Al. For discrete measurements on 110 dried and ground samples, a PANalytical Epsilon3-XL XRF spectrometer equipped with a rhodium tube, several filters and an SSD5 detector was used. A calibration based on certified standard materials (e.g., GBW07309, GBW07316 and MAG-1) was used to quantify elemental counts (see Govin et al., 2012).
3.1 Proxy indicators
3.1.1 SST
The magnitude of temperature variability (from ca. 27 ∘C during interglacials to ca. 24 ∘C during glacials) in the GeoB20616-1 Mg∕Ca SST record and the timing of changes (post-glacial warming at ca. 17 ka) correspond to existing regional Mg∕Ca SST records (see Fig. 3; Bard et al., 1997; Levi et al., 2007; Wang et al., 2013). They do not, however, correspond to SST calculated from other indicators (i.e., U, TEX86) (e.g., Wang et al., 2013; Caley et al., 2011). These indicators show slightly different patterns, which may be attributed to a seasonal bias in the proxies (Wang et al., 2013). Wang et al. (2013) suggest that U SST reflects warm-season, however, SST mediated by changes in the Atlantic, whereas the G. ruber Mg∕Ca SST indicator used in this study records cold season SST mediated by climate changes in the Southern Hemisphere.
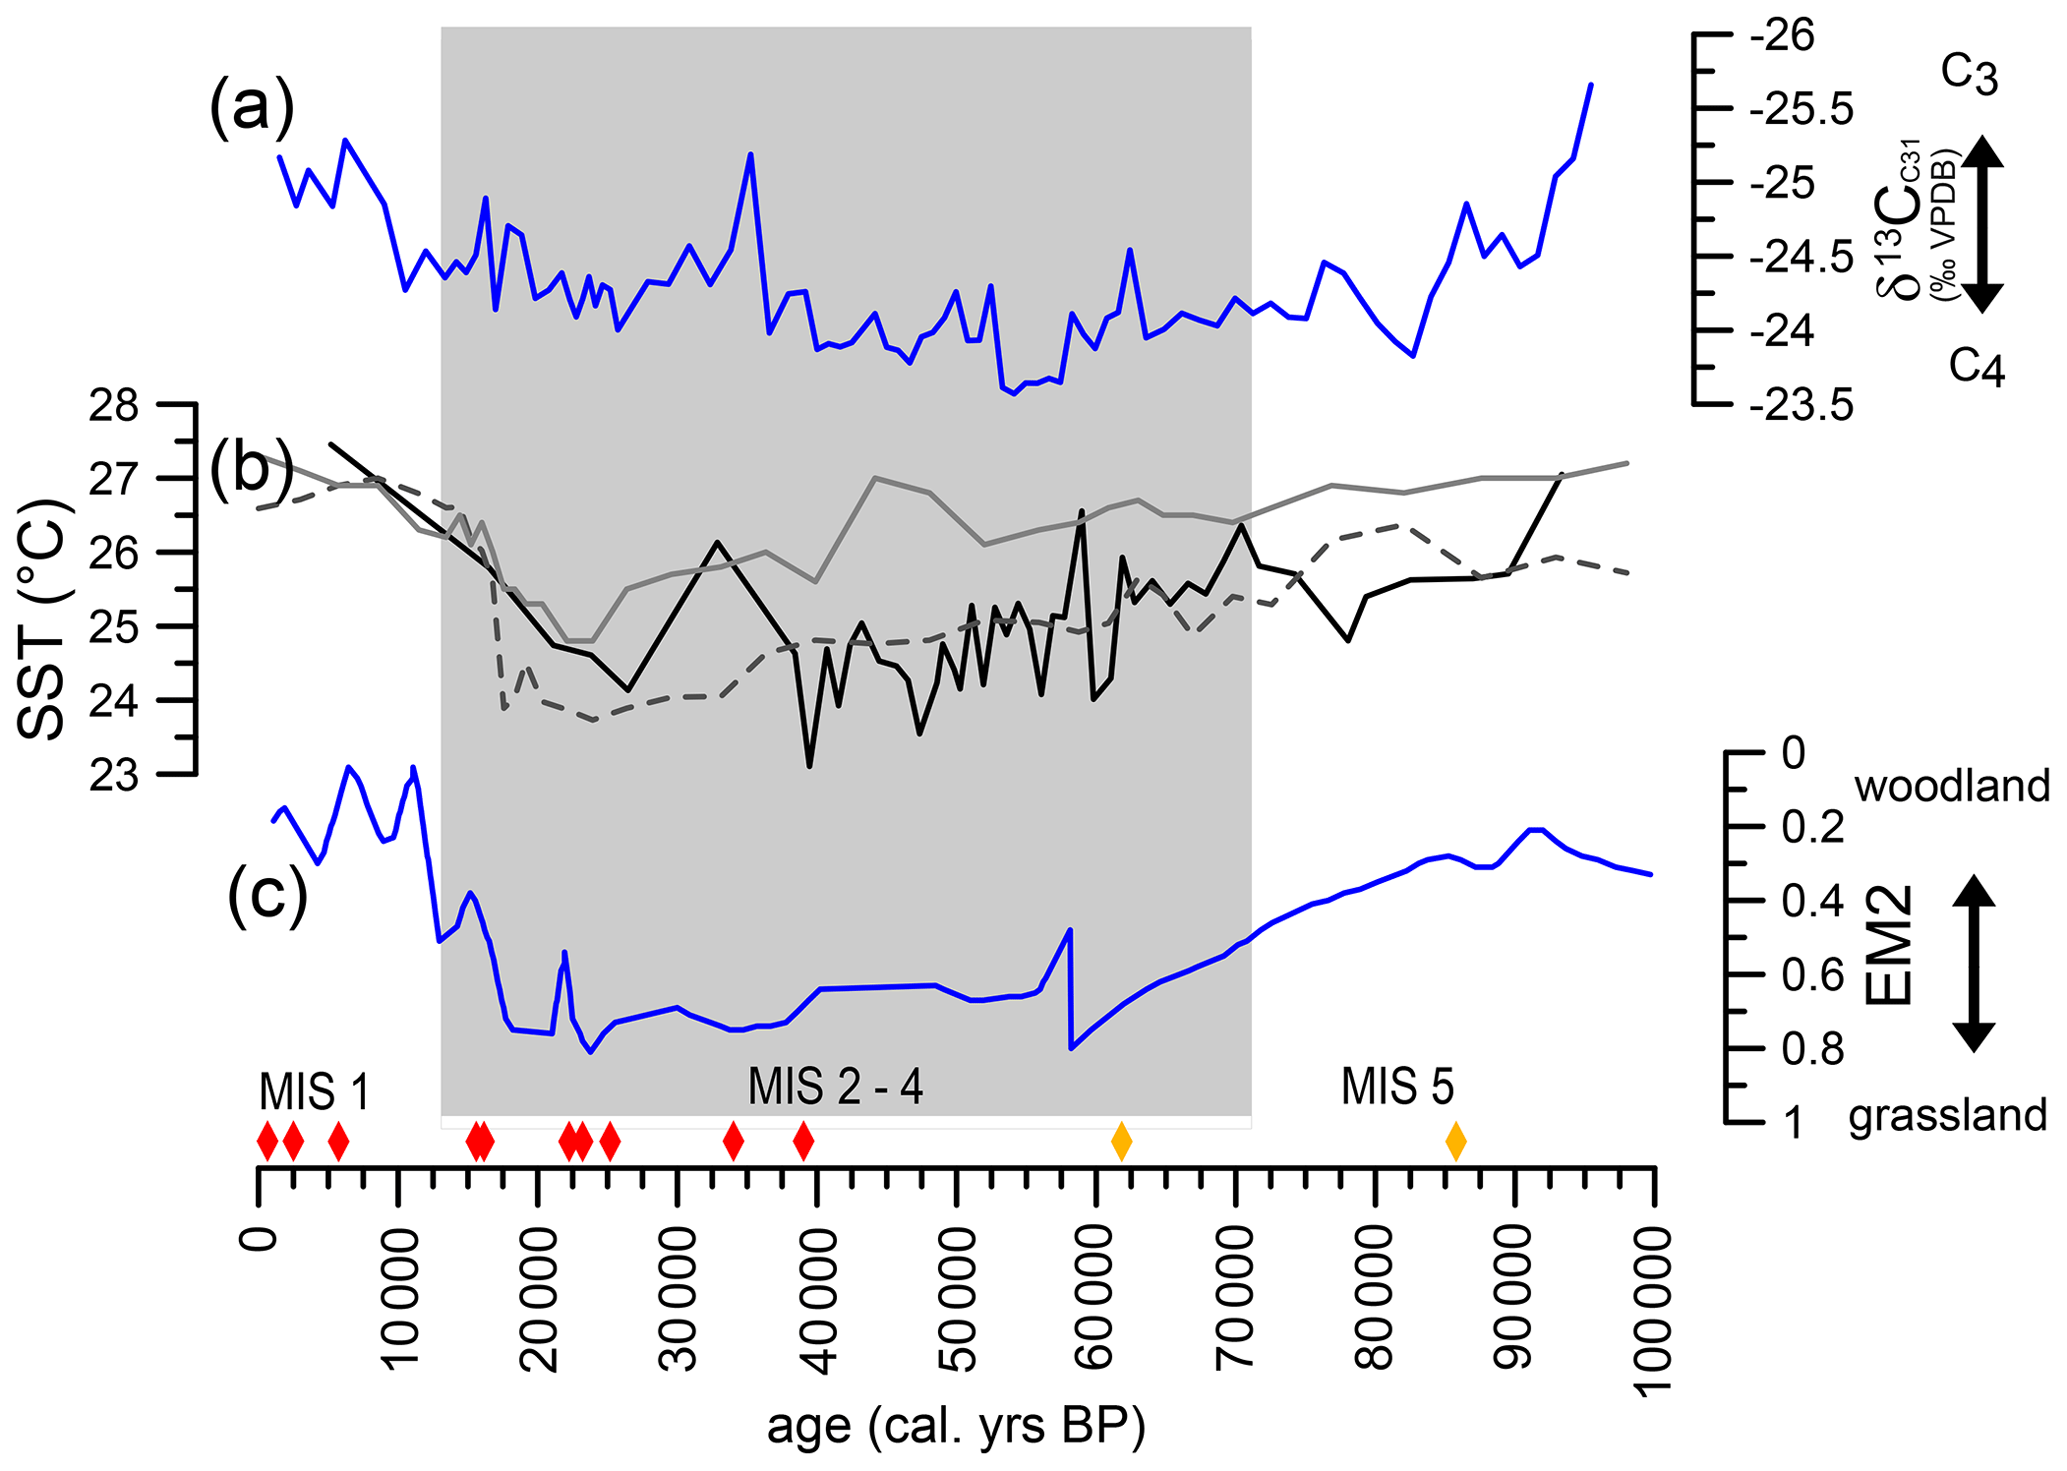
Figure 3Climatic patterns at orbital timescales recorded in GeoB20616-1. Panel (a) shows down-core δ13C values of the C31n-alkane in per mill VPDB of GeoB20616-1 as indicators of shifts in vegetation type (C3 vs. C4). Panel (b) shows SST (sea surface temperatures) recorded by G. ruber Mg∕Ca (black line) in GeoB20616-1 as well as offshore Limpopo River (core MD96-2048) SST calculated from TEX86 (dashed line) and from U (gray line) (Caley et al., 2011). Panel (c) shows Limpopo vegetation endmember EM2 from Dupont et al. (2011). The diamonds indicate C14 dates (red) and δ18O tie points (orange).
3.1.2 Vegetation signatures
The δ13Cwax record of core GeoB20616-1 shows average values of approximately −24 ‰ VPDB (see Supplement 3) and shifts from ca. −25 ‰ to ca. −24 ‰ (at 85 ka) and from −24 ‰ to −25 ‰ (at ca. 10 ka). The stable carbon isotopic composition of plant waxes reflects discrimination between 12C and 13C during biosynthesis varying with vegetation type: C4 plants have higher δ13C values than C3 plants (e.g., Collister et al., 1994; Herrmann et al., 2016). The average δ13C value of the analyzed samples falls into the range between C3 alkanes (around −35 ‰) and C4 alkanes (around −20 ‰) (Garcin et al., 2014) indicating that the n-alkanes were derived from C3 sources in the catchment such as mountain shrublands and coastal forests, as well as from C4 sedges which grow along rivers and in the associated swamplands (see Fig. 1a). There is no correlation (R2=0.15) of δ13Cwax variability and hydrological variability indicated by δDwax (see Sect. 3.1.3 Precipitation indicators o details on this proxy). We therefore suggest that the shifts we see in the δ13Cwax were not induced by a xeric or mesic adaptation of the same plant community. Instead, we imply that the shifts in the δ13Cwax signal were related to shifts in the vegetation community. Palynological work on a nearby marine sediment core by Dupont et al. (2011) shows that large shifts in vegetation biomes are also observed in the Limpopo catchment, which is directly adjacent to the Incomati, Matola and Lusutfu catchments (Fig. 1a). A comparison of the Dupont et al. (2011) palynological data (Fig. 3c) and the δ13Cwax data at our site (Fig. 3a) shows a covariation in major shifts in vegetation and δ13Cwax. Although the similarities in the pattern of vegetation shifts detected in the nearby Limpopo River sediment core and at our study site suggest that large-scale vegetation shifts took place in the region over glacial–interglacial transitions, this does not necessarily imply the mechanisms behind these trends are the same. Studies of the Limpopo sediment record (Dupont et al., 2011; Caley et al., 2018) reveal a δ13Cwax-enriched grassland vegetation for glacial intervals and an increase in woodland vegetation during well-developed interglacial periods, as is the case for MIS 5 and 1 (as opposed to MIS 3), reflected in lighter δ13Cwax values. Caley et al. (2018) attribute the δ13Cwax enrichment in Limpopo River sediments during glacials to an expansion of floodplains and the associated C4 sedges, as well as discharge from the upper Limpopo catchment which reached well into the grassland interior of southern Africa (almost 1000 km inland). The headwaters of the Incomati, Matola and Lusutfu catchment areas, however, are in the Lebombo mountain range located within 200 km of the coast. They do not reach into the interior grassland biomes of South Africa. We therefore propose that in the Incomati, Matola and Lusutfu catchment areas, the heavier δ13Cwax values for the glacial MIS 4–2 interval reflect retreating forests and an expansion of drought-tolerant C4 plants (grasses) due to growing season aridity, whereas interglacial (MIS 1 and 5) lighter δ13Cwax values reflect the formation of woodlands. Furthermore, sedge-dominated open swamps that fringed rivers during MIS 4–2 may have been replaced by gallery forests during MIS 1 and 5 contributing to the glacial to interglacial δ13Cwax depletion.
3.1.3 Precipitation indicators
Hydrogen isotope changes measured in plant waxes are related to the isotope composition of precipitation since hydrogen used for biosynthesis originates directly from the water taken up by the plants (Sessions et al., 1999). In tropical and subtropical areas, the isotopic composition of rainfall (δDp) mainly reflects the amount of precipitation – with δDp depletion indicating more rainfall (Dansgaard, 1964). Furthermore, rainfall δDp signatures may also become deuterium-depleted with altitude (ca. 10 ‰–15 ‰ per 1000 m, Gonfiantini et al., 2001). The δD values of leaf waxes in the three catchments are probably affected by both the amount as well as the altitude effect. Rainfall at higher altitudes takes place during times of generally increased rainfall, as it is high-precipitation events that reach the interior. The altitude effect therefore enhances the δD depletion of the “amount effect”. The K∕Al ratio of the sediment is a less direct indicator of the precipitation regime: K∕Al has been interpreted as an index between illite (K,H3O) and kaolinite (Al2Si2O5(OH)4) giving an indication of the prevailing weathering regime as illite is a product of physical weathering, whereas kaolinite is produced during chemical weathering (Clift et al., 2008; Dickson et al., 2010; Burnett et al., 2011). The Ca∕Fe ratio is generally used as a proxy of marine (Ca) vs. terrestrial (Fe) input to the core site and is thus indicative of changes in terrestrial discharge by the river systems (Hebbeln and Cortés, 2001; Croudace et al., 2006; Rogerson et al., 2006; Rothwell and Rack, 2006; McGregor et al., 2009; Dickson et al., 2010; Nizou et al., 2010). The red ∕ blue ratio of the sediment reflects sediment color nuance and increases with sediment lightness. In Geob20616-1 we interpret the reddish values as a more clastic deposition indicative of arid conditions, whereas darker blueish colors may reflect clay and organic-rich sediments preferentially deposited during humid phases (see also M123 cruise report Zabel, 2016). In the records of δDC31, red/blue, K∕Al and Ca∕Fe similar patterns can be observed: they all display relatively high values (up to −144 ‰; 1.4, 12 and 0.25, respectively) in the intervals marked in red or yellow in Fig. 4 and lower values (down to −160 ‰, 1.1, 1 and 0.2, respectively) in the intervals marked in blue or green in Fig. 4. We associate these variations with (respectively) decreasing (red or yellow) and increasing (blue or green) precipitation over the Incomati, Matola and Lusutfu catchment areas. We note that the observed correlation, in particular for the inorganic proxies (K∕Al and Ca∕Fe), is relative rather than absolute in nature. This can be associated with the changing background conditions over glacial and interglacial cycles, which may cause shifts in the elemental composition. We also note that of the four proxy indicators (δDC31, red ∕ blue, K∕Al and Ca∕Fe) only δDC31 can be regarded as a direct indicator of past precipitation change. Red ∕ blue, K∕Al and Ca∕Fe depend to varying extents on precipitation, erosion and fluvial transport, whereas these factors do not necessarily vary in concert. For instance, erosion is not always directly linked to the amount of precipitation and vegetation density is often an additional and more important factor for erosion rates. Erosion rates can also increase substantially at times of rapid climatic and associated vegetation changes. Because the relationship between precipitation, erosion and riverine transport is not linear we base our precipitation reconstruction (i.e., the definition of the arid and wet intervals described in Sect. 3.2 and colored-coded in Fig. 4) mainly on the δDC31 values. We regard the red ∕ blue, K∕Al and Ca∕Fe values as supporting information; the relative correlation of the four proxies suggests that phases of increased precipitation are, for the most part, associated with an increase in erosion rates, chemical weathering and riverine transport. This underlines the reliability of our paleo-precipitation reconstruction.
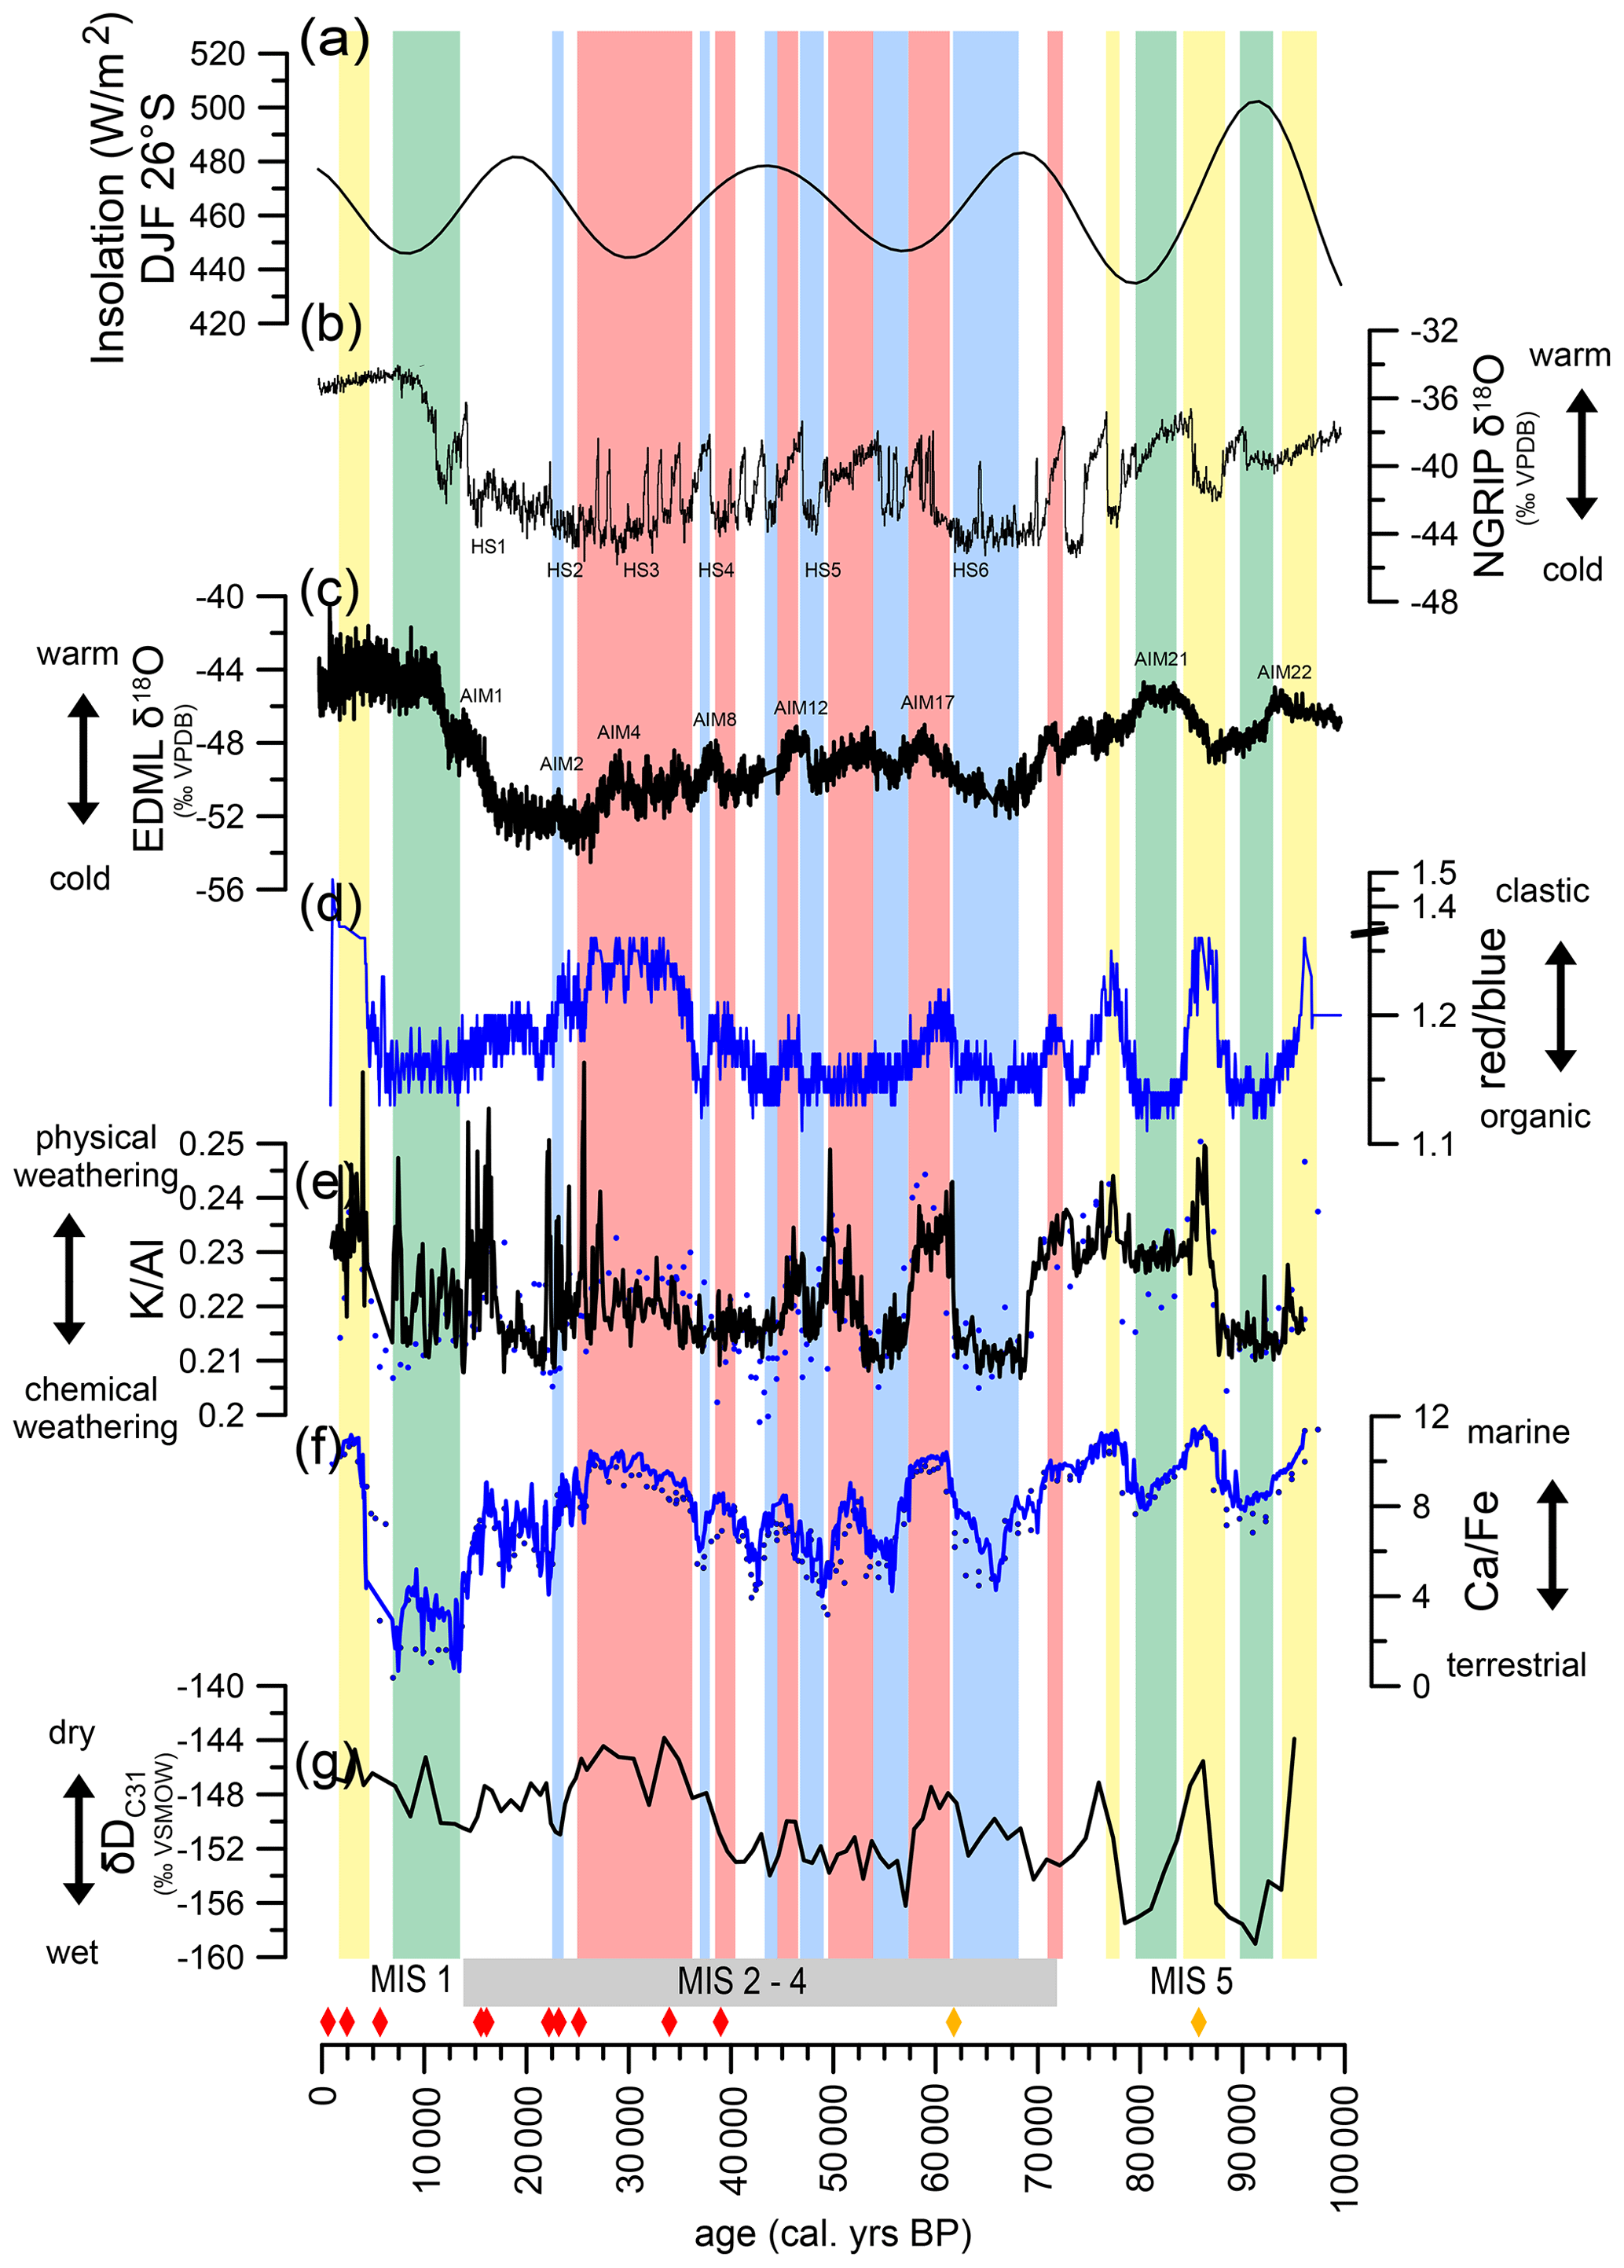
Figure 4Millennial-scale hydrological variability recorded in core GeoB20616-1. Organic and inorganic down-core geochemistry (c–f: δD, red ∕ blue, K∕Al and Ca∕Fe) of GeoB20616-1 as indicators of weathering type, fluvial input and aridity. Intervals identified as wet using these indicators are marked in blue or green, while dry phases are marked in red or yellow. Wet intervals marked in green are associated with southward shifts of the SHWs (southern hemispheric westerlies) and the South African high-pressure cell allowing for the SIOCZ (South Indian Ocean Convergence Zone) and related rain-bearing TTTs (tropical temperate troughs) to move over the study area during interglacials. In turn, wet intervals marked in blue are associated with northward shifts of the SHW and/or southward shifts of the ITCZ during glacials. Arid phases during interglacials (marked in yellow) are related to northward shifts of the SHW as this induces the moisture-blocking effect of the South African high-pressure cell over the region. During glacials, however, southward shifts of the SHW are often associated with arid phases (marked in red) as the rain-bearing systems related to the SHW move south. Transitional intervals between arid and wet intervals are not colored. XRF scanning data are marked as a line, whereas discrete XRF measurements are represented by points. For comparative purposes local insolation (a: Laskar et al., 2011) as well as Arctic and Antarctic ice core d18O records are plotted (b: NGRIP members, 2004; c: EPICA members, 2010). Panel (c) represents the δD of the C31n alkane in the unit ‰ VSMOW. For comparative purposes local insolation (Laskar et al., 2011) as well as Arctic and Antarctic ice core d18O records are plotted (NGRIP members, 2004; EPICA members, 2010). The most prominent AIM (Antarctic isotope maxima) and HS (Heinrich Stadial) events are named. The diamonds indicate C14 dates (red) and δ18O tie points (orange).
3.2 Climatic patterns at different timescales
3.2.1 Orbital timescales
Sea surface temperatures and vegetation
Over the past 100 000 years the SST and δ13C values show a common trend of high SST and low δ13Cwax values during interglacial MIS 5 and 1 and low SST and high δ13C values during glacial MIS 4–2 (Fig. 3). Our data reveal an increase in SST of ca. 4 ∘C from glacial to interglacial conditions. This correlation between SST and glacial–interglacial change cycles is commonly found for this area (Caley et al., 2011, 2018; Dupont et al., 2011). On this glacial–interglacial timescale, variations in local SST are thought to be an important driver of hydroclimate in southeastern Africa (see Dupont et al., 2011). During interglacials, warm SST within the Mozambique Channel and Agulhas Current induces an advection of moist air and higher rainfall in the east South African summer rainfall zone (e.g., Walker, 1990; Reason and Mulenga, 1999; Tyson and Preston-Whyte, 2000). The opposite effect is inferred for glacial periods (Dupont et al., 2011; Chevalier and Chase, 2015). The strong influence of western Indian Ocean surface temperatures on the summer precipitation in northern South Africa and southern Mozambique induces a tight coupling between vegetation dynamics in southeastern Africa and sea surface temperature variations in the western Indian Ocean. This has been shown for several glacial–interglacial cycles in a palynological study offshore of the Limpopo River (core MD96-2048; Fig. 1a) by Dupont et al. (2011).
Hydrology over glacial–interglacial transitions
δD, XRF and color data are indicators of catchment precipitation changes: decreases in red ∕ blue, Ca∕Fe, K∕Al ratios and δD values indicate higher precipitation in the catchment, more fluvial discharge and higher chemical weathering rates (see Sect. 3.1.3). Although there is much variability in the hydrological record of core GeoB20616-1, red ∕ blue, Ca∕Fe, K∕Al ratios and δD values are surprisingly stable over glacial–interglacial transitions (mean δD value of MIS 1 and 5: −149 ‰; vs. mean δD value of MIS 2–4: −150 ‰). It can be assumed that, during glacials, the rainfall from the main rain-bearing systems (SIOCZ-related tropical temperate troughs) was reduced due to generally lower land and sea surface temperatures and a weaker global hydrological cycle. However, a southward shift of the ITCZ during glacials as previously suggested (Nicholson and Flohn, 1980; Johnson et al., 2002; Chiang et al., 2003; Chiang and Bitz, 2005; Schefuß et al., 2011) would have contributed to increased rainfall in the study area. It is unclear if the region would have been under the direct influence of the ITCZ during glacials or if southward shifts of the ITCZ entailed a southward shift of the SIOCZ and thus increased precipitation via the TTT. Furthermore, SHW-related low-pressure systems shifting northward to the Incomati, Matola and Lusutfu catchment areas during glacial conditions may have become a major additional precipitation source. The SHW northward shift of ca. 5∘ latitude is well documented (Chase and Meadows, 2007; Chevalier and Chase, 2015; Chase et al., 2017; Miller et al., 2020). The possibility of more frequent SHW-related low-pressure systems bringing moisture to our study area during the Last Glacial Maximum (LGM) has previous been proposed by Scott et al. (2012) in the framework of a regional pollen review paper. It is also suggested by a modeling study showing an LGM scenario of drier summers and wetter winters for the southeastern African coast (Engelbrecht et al., 2019). During glacial periods, a reduced summer (SIOCZ-related) rainfall amount and an increase in SHW-related frontal systems as an additional winter precipitation source, possibly in combination with precipitation from a more southerly ITCZ, would translate to a relatively stable annual rainfall amount over glacial–interglacial transitions.
3.2.2 Millennial-scale hydrological variability
During Interglacial MIS 5
During MIS 5 there are several prominent (ca. −10 ‰) short-term (1–2 ka) decreases in the δD record, which are paralleled with decreases in Ca∕Fe, K∕Al and red ∕ blue ratios (Fig. 4). We interpret these intervals (approximately 83–80 and 93–90 ka) as wet periods while intervals of high Ca∕Fe, K∕Al and red ∕ blue ratios and δD values (approximately 97–95, 87.5–85 and 77.5 ka) are interpreted as arid intervals (see Sect. 3.1.2. for details on proxy interpretation). During the interglacial MIS 5, millennial-scale increases in humidity correlate broadly with periods of warmth in the Antarctic ice core records termed AIM22 and AIM 21 (AIM: Antarctic isotope maxima) (see Fig. 4; EPICA members, 2010). During these Antarctic warm periods, sea ice, the circumpolar circulation and the SHW retreated. This is recorded by Southern Ocean diatom burial rates as well as paleoclimate archives at the southernmost tips of Africa and South America (Lamy et al., 2001; Anderson et al., 2009; Chase et al., 2009; Hahn et al., 2017 and references therein; Zhao et al., 2016). It has been hypothesized that southward shifts of the SHW and the South African high-pressure cell allow the SIOCZ and TTT to shift further south causing an increase in humidity in our study area. Miller et al. (2020) suggest this mechanism for the region just south of our site (termed eastern central zone), which shows Holocene hydroclimatic shifts similar to those recorded in GeoB20616-1. Holocene arid events in this region are attributed to northward shifts of the SHW and the South African high-pressure cell, which block the SIOCZ and TTT-related moisture. These mechanisms are described in detail by Miller et al. (2020) and our data suggest that they were also active during earlier interglacial periods (e.g., MIS 5) (see schematic model in Fig. 5a). Our current chronology suggests that southward SHW shifts during Antarctic warm periods caused the prominent humid phases during MIS 5 in the Incomati, Matola and Lusutfu catchment areas during the timeframes around 83–80 ka (AIM21) and 93–90 ka (AIM22). When our best age estimate is applied, there is little correspondence between northern or southern insolation maxima and the MIS5 humid phases. In view of the chronological uncertainty in this early part of the record (beyond the 14C dating limit), we cannot exclude that these humid phases are related to precessional variability, in the absence of ice interference, causing the division in MIS5a-e. However, in accordance with the conceptual model by Miller et al. (2020) for the Holocene, we observe no local insolation control on climate at our study site. We suggest that the major shifts in the large-scale rain-bearing systems may override the local insolation forcing.
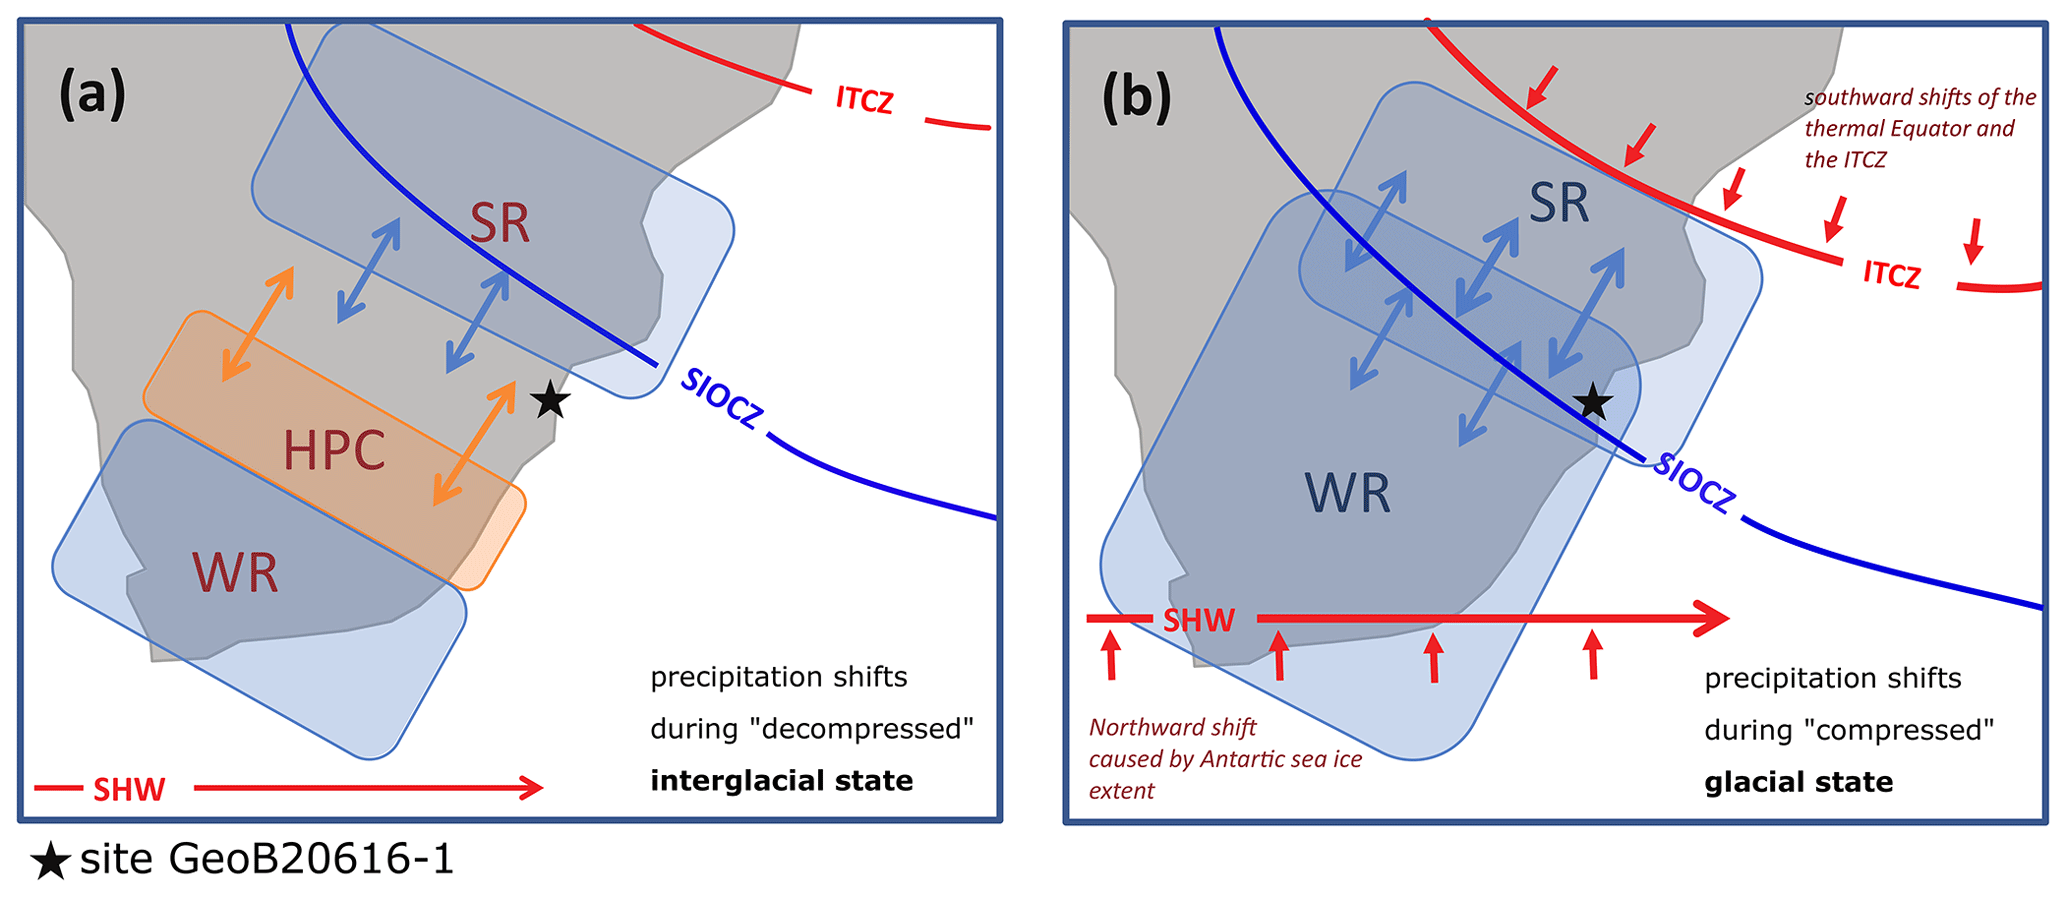
Figure 5Conceptual model of precipitation shifts during glacial vs. interglacial (present conditions) intervals. The blue shaded boxes indicate the locations of the major regional rain-bearing systems: (i) the TTT (tropical temperate trough) moisture shifting with the SIOCZ (south Indian Ocean Convergence Zone) and bearing summer rain (therefore marked as SR); (ii) the low-pressure systems related to the SHW (southern hemispheric westerlies), bringing mainly winter rain (therefore marked as WR). The orange shaded box marks the South African high-pressure cell (HPC) shifting with the SHW. The HPC blocks SIOCZ and TTT-related moisture and therefore causes aridity. The arrows mark the millennial-scale variability of the position of these systems over the study area which is marked by a star. Please note that the millennial-scale variations that the region experiences differ in the interglacial state (a) and the glacial state (b) since the organization of the major climatic systems (marked in red) is different (“decompressed” vs. “compressed”). The conceptualization for interglacial states presented in (a) is based on a schematic model by Miller et al. (2020). In this decompressed state latitudinal shifts of the SHW indirectly control precipitation at our study site via the moisture blocking effect of the South African HPC: southward shifts of the SHW and HPC allow the SIOCZ-related TTT to bring SR to our site, whereas northward movements block this SR moisture (Miller et al., 2020). During the compressed glacial state (box B) the SHW-related WR reaches much further north, directly influencing the study site. The SR, in turn, is shifted southward, and an HPC blocking effect is not noted at our site.
During MIS 4–2 glacial conditions
During the glacial periods MIS 2 and 4 and the less prominent interglacial MIS 3, the correlation between southeastern African humidity and Antarctic warm periods (AIM events) does not persist. In contrast, the first two prominent humid phases in MIS 4 (around 68–63 and 56 ka) as well as some of the following more short-term humid phases coincide with cold periods in the Antarctic ice core record (Fig. 4). The general position of the SHW trajectories is suggested to have been located 5∘ in latitude further north during glacial periods (see “Hydrology over glacial–interglacial transitions” section Hydrology over glacial–interglacial transitions). The Incomati, Matola and Lusutfu catchment areas would therefore have been in the direct trajectory of the SHW-related low-pressure systems. Whilst northward shifts of the SHW and the South African high-pressure cell during an interglacial cause aridity by blocking the SIOCZ and TTT (as suggested by Miller et al., 2020, and as described in the section entitled “During Interglacial MIS 5” in Sect. 3.2.2 for, e.g., MIS 5), we suggest that during a glacial, additional northward shifts of the SHW (e.g., during Antarctic cold events) would have led to an increase in precipitation related to particularly strong direct influence of the SHW and the related low-pressure cells (see schematic model Fig. 5b). Figure 4 also shows a correlation between some of the humid phases during MIS 2–4 and Greenland cold phases i.e., Heinrich stadials. The timing of the wet phases at 68–63, 56, 44, 37 and 23 ka corresponds roughly to the following Heinrich stadials: HS6 (after 60 ka, Rasmussen et al., 2014), HS5a (56 ka, Chapman and Shackleton, 1999), HS5 (45 ka; Hemming 2004), and HS4 and HS2 (37 and 23 ka, Bond and Lotti, 1995). Wet phases in eastern Africa have previously been associated with Heinrich events (Caley et al., 2018; Dupont et al., 2011; Schefuß et al., 2011). It is well documented that during glacial conditions the large ice masses of the Northern Hemisphere displace the thermal Equator southward (Nicholson and Flohn, 1980; Johnson et al., 2002; Chiang et al., 2003; Chiang and Bitz, 2005; Schefuß et al., 2011). It is therefore hypothesized that the ITCZ reached latitudes further south than its modern maximal extent causing the MIS 2–4 rainfall peaks. There is no notable “blocking” effect of the South African high-pressure cell during glacials (schematic model Fig. 5b). The transitions from cold “stadial” to warm “interstadial” conditions and back during MIS 2–4 are extremely rapid and short term. The sampling resolution and age control of our record (especially prior to ca. 50 ka – the limit of 14C dating) is not always sufficient for capturing these variations (e.g., HS4). The association of humid phases with a northward-shifting SHW and/or southward-shifting ITCZ is therefore not always clear and a combination of both may also be possible.
From the LGM to the Holocene
Relative to the prolonged arid phase during the late MIS 3 or early MIS 2 (37–25 ka; see Fig. 4), we observe a trend towards more humid conditions during the LGM (25–18 ka) marked by a decrease in Ca∕Fe, K∕Al, red ∕ blue ratios and δD values. This is most likely due to the more frequent SHW-related low-pressure systems bringing moisture to our study area during the LGM and/or southward shifts of the ITCZ as discussed in the “Hydrology over glacial–interglacial transitions” section (see also Fig. 5b). Our record shows a wetting trend after the Last Glacial Maximum and during the deglacial (from ca. 15 ka). Several paleoenvironmental records show a common humidity increase for this interval (Meadows and Meadows, 1988; Scott, 1989; Norström et al., 2009). Chase et al. (2017) attribute this to the invigoration of tropical systems with post-glacial warming. The wet conditions prevail until the Early Holocene (ca. 8 ka). Similar observations of a ca. 15–8 ka wet phase have been made in the region (e.g., Norström et al., 2009; Neumann et al., 2010). For this Early–Mid-Holocene period, we infer from the leaf wax δ13C values a shift from grassland to woodlands as described in the “Sea surface temperatures and vegetation” section. and in Dupont et al. (2011). This may be related to the rainfall intensification as well as to the global temperature and CO2 increase (see Dupont et al., 2019). The Early–Mid-Holocene wet phase in our study region (eastern central SRZ) is described by Miller et al. (2020) and associated with a southward shift of the SHW and the South African high-pressure cell allowing for the SIOCZ-related rain-bearing systems (TTTs) to shift southward over the region. The Late Holocene (the last 5 kyr), however, was an arid phase at our study cite as suggested by the precipitation indicators δD, Ca∕Fe, K∕Al and red ∕ blue ratios. Several regional records (e.g., Mfabeni peatlands and the eastern-central region) show similar shifts: from a wet deglacial or Early Holocene (18–5 ka) to dry conditions thereafter (Chevalier and Chase, 2015; Miller et al., 2019). Miller et al. (2020) compile eastern African climate records and recognize a Late Holocene tripole of increased humidity north of 20∘ S and south of 25∘ S and a contrasting aridity trend in the region in between. Our catchment is located at the northernmost extent of this intermediate region; while we record an aridity trend in the Late Holocene, the adjacent Limpopo catchment just to the north received higher rainfall amounts during this time interval (Miller et al., 2020). A northward shift in SHW with the South African high-pressure cell blocking the SIOCZ and TTT is a suggested mechanism for this Late Holocene aridity (Miller et al., 2020; also described in the “During MIS 4–2 glacial conditions” section). Likewise, Mason and Jury (1997) (based on a conceptual model by Tyson, 1984) suggest that northward-shifting SHWs induce rain-bearing low-pressure cells to shift away from the eastern African coast towards Madagascar. During the Late Holocene the modern climatic situation of the study area was established: during the summer months the SHW and the South African high-pressure cell are in their southernmost position allowing the SIOCZ-related TTT to bring rainfall to the region (66 % of annual precipitation). During the winter months the SHW and the South African high-pressure cell shift northward. In this constellation the SIOCZ and TTT influence are blocked by the South African high-pressure cell; however, low-pressure cells may become cut from the main SHW flow bringing winter rainfall to the area (33 % of annual precipitation) as described in Sect. 1.1.
Using the organic and inorganic geochemical properties of sediment core GeoB20616-1 from the Delagoa Bight we were able to reconstruct the vegetation changes and rainfall patterns in the Incomati, Matola and Lusutfu catchments as well as SST trends of the Agulhas waters for the past ca. 100 000 years offshore southeastern Africa. Our reconstructions underline the existing dipoles or tripoles in southeastern African climate: although the glacial–interglacial variability at our site resembles that observed in the adjacent Limpopo River catchment, the Holocene hydrological trends are exactly inverted in these neighboring catchments. Small-scale climatic zones have been previously described for the region (see Scott et al., 2012; Chevalier and Chase, 2015; Miller et al., 2020), and each zone has been attributed to a climatic driving mechanism. Our data provide insights into the spatial shifts of these zones as fundamental shifts in the major climate systems occurred over glacial–interglacial cycles. In accordance with Miller et al. (2020) we identify displacements of the SHW as the main hydroclimate driver during the Holocene in our study area (termed central and eastern zone). The main trajectories of the SHW-related disturbances remain so far south during the Holocene, that they rarely deliver direct rainfall to the study area. Instead, northward shifts of the SHW and the South African high-pressure cell block the SIOCZ and thus TTT-related rainfalls over the region (Fig. 5a). In this manner latitudinal SHW shifts influence the local rainfall indirectly. Our study not only confirms the Miller et al. (2020) conceptual model for the Holocene but also finds the same mechanisms to be active during MIS5. Similar to Miller et al. (2020) we find an absence of insolation forcing in our study area. We suggest that at these latitudes local insolation as a climatic forcing mechanism is overridden by shifts in the major rain-bearing systems. We conclude that during interglacials regional wet phases are induced by southward-shifting westerlies (related to Antarctic warming trends) allowing for the influence of the SIOCZ-related TTT. During glacial periods, however, we observe an inverted relationship between Antarctic warm events and regional humidity and an additional correlation of several humid intervals with extreme northern hemispheric cold events (HS). This suggests that the mechanisms driving the millennial-scale hydrological variability during glacials are not the same as during interglacials. We attribute this to the global reorganization of climate systems during the glacial as the large ice masses at both poles induce a southward shift of the thermal Equator and the ITCZ as well as a northward shift of the SHW. Our study site is located at the interface of these “compressed” climate systems. As a result, during full glacial conditions, the region may have received precipitation both from SHW-related disturbances as well as from SIOCZ-related TTT (Fig. 5b). In this compressed state the northward shifts of the SHW and the South African high pressure no longer have the net effect of blocking SIOCZ-related precipitation as this is compensated for by the increase in winter rains. Overall humidity therefore shows no considerable decrease during MIS 2–4. Nevertheless, a shift in vegetation from woodland to grasslands takes place during glacials; we attribute this to a reduced growing season (summer) precipitation, probably in combination with low temperatures and atmospheric CO2. Our study shows that these mechanisms are active in a spatially very restrained area resulting in small-scale variability. These small-scale climatic dipoles or tripoles make the southeastern African coastal area especially sensitive to shifts in the global climatic system.
Data are archived in the Pangaea databank (https://doi.org/10.1594/PANGAEA.910537, Hahn et al., 2020) of MARUM, University of Bremen.
Samples are archived at the GeoB Core Repository located at MARUM, University of Bremen.
Table S1: GeoB20616-1 oxygen and carbon isotopic composition of planktonic foraminifera (G. ruber). Table S2: GeoB20616-1 down-core sea surface temperatures (SSTs) calculated following Lea et al. (2003) using Mg∕Ca analyzed on the planktonic foraminifer G. ruber (in mmol mol−1). Table S3: GeoB20616-1 organic geochemical down-core data. n-alkane isotopic composition and distribution descriptive parameters averaged. The elevated CPI values ranging from 3.8 to 14 indicate that the n-alkanes within the terrestrial and marine samples were likely derived from non-degraded, terrestrial, higher plant material (Eglinton and Hamilton, 1967). We focus the discussion on the isotopic signals of the n-C31 alkane but note that the n-C29 and n-C33 alkanes reveal similar trends. Table S4: GeoB20616-1 inorganic geochemical down-core data from discrete XRF measurements. The supplement related to this article is available online at: https://doi.org/10.5194/cp-17-345-2021-supplement.
AH was responsible for the conceptualization, investigation, analysis, visualization and writing of this manuscript. ES contributed to the funding acquisition, conceptualization, investigation, review and editing of this manuscript. JG contributed to the analysis, interpretation, methodology, review and editing of this study. CM participated in the analysis, interpretation, review and editing of this manuscript. MZ was responsible for funding acquisition, project administration, conceptualization, investigation, review and editing of this study.
The authors declare that they have no conflict of interest.
The captain, crew and scientists of the Meteor M123 cruise are acknowledged for facilitating the recovery of the studied material. This study would not have been possible without MARUM – Center for Marine Environmental Sciences, University of Bremen, Germany, and the laboratory help of Henning Kuhnert, Ralph Kreutz and Silvana Pape. In particular, we thank the GeoB Core Repository at MARUM and Pangaea (http://www.pangaea.de, last access: 14 January 2021) for archiving the sediments and the data used in this paper. Thanks to all RAiN members as well as Stephan Woodborne and the anonymous reviewer of this paper for critical comments and helpful advice.
This research has been supported by the Bundesministerium für Bildung und Forschung (BMBF, Bonn, Germany) within the projects “Regional Archives for Integrated Investigation (RAiN)” (project no. 03G0840A) and “Tracing Human and Climate impacts in South Africa (TRACES)” (project no. 03F0798C).
The article processing charges for this open-access publication were covered by the University of Bremen.
This paper was edited by Dominik Fleitmann and reviewed by Stephan Woodborne and one anonymous referee.
Anderson, R. F., Ali, S., Bradtmiller, L. I., Nielsen, S. H. H., Fleisher, M. Q., Anderson, B. E., and Burckle, L. H.: Wind-Driven Upwelling in the Southern Ocean and the Deglacial Rise in Atmospheric CO2, Science, 323, 1443–1448, https://doi.org/10.1126/science.1167441, 2009.
Baker, A., Pedentchouk, N., Routh, J., and Roychoudhury, A. N.: Climatic variability in peatlands (South Africa) since the late Pleistocene, Quaternary Sci. Rev., 160, 57–66, 2017.
Baray, J. L., Baldy, S., Diab, R. D., and Cammas, J. P.: Dynamical study of a tropical cut-off low over South Africa, and its impact on tropospheric ozone, Atmos. Environ., 37, 1475–1488, 2003.
Bard, E., Rostek, F., and Sonzogni, C.: Interhemispheric synchrony of the last deglaciation inferred from alkenone palaeothermometry, Nature, 385, 707–710, 1997.
Barker, S., Greaves, M., and Elderfield, H.: A study of cleaning procedures used for foraminiferal Mg∕Ca paleothermometry, Geochem. Geophy. Geosy., 4, 8407, https://doi.org/10.1029/2003gc000559, 2003.
Biastoch, A., Reason, C. J. C., Lutjeharms, J. R. E., and Boebel, O.: The importance of flow in the Mozambique Channel to seasonality in the greater Agulhas Current system, Geophys. Res. Lett., 26, 3321–3324, 1999.
Blaauw, M. and Christen, J. A.: Flexible paleoclimate age-depth models using an autoregressive gamma process, Bayesian Anal., 6, 457–474, 2011.
Bond, G. C. and Lotti, R.: Iceberg Discharges into the North Atlantic on Millennial Time Scales During the Last Glaciation, Science, 267, 1005–1010, 1995.
Bray, E. E. and Evans, E. D.: Distribution of n-paraffins as a clue to recognition of source beds, Geochim. Cosmochim. Ac., 22, 2–15, https://doi.org/10.1016/0016-7037(61)90069-2, 1961.
Burnett, A. P., Soreghan, M. J., Scholz, C. A., and Brown, E. T.: Tropical East African climate change and its relation to global climate: a record from Lake Tanganyika, Tropical East Africa, over the past 90+ kyr, Palaeogeogr. Palaeocl., 303, 155–167, 2011.
Caley, T., Malaizé, B., Revel, M., Ducassou, E., Wainer, K., Ibrahim, M., Shoeaib, D., Migeon, S., and Marieu, V.: Orbital timing of the Indian, East Asian and African boreal monsoons and the concept of a “global monsoon”, Quaternary Sci. Rev., 30, 3705–3715, 2011.
Caley, T., Extier, T., Collins, J. A., Schefuß, E., Dupont, L., Malaizé, B., Rossignol, L., Souron, A., McClymont, E. L., and Jimenez-Espejo, F. J.: A two-million-year-long hydroclimatic context for hominin evolution in southeastern Africa, Nature, 560, 76–79, https://doi.org/10.1038/s41586-018-0309-6, 2018.
Chapman, M. R. and Shackleton N. J.: Global ice-volume fluctuations, North Atlantic ice-rafting events, and deep-ocean circulation changes between 130 and 70 ka, Geology, 27, 795–798, 1999.
Chase, B. M. and Meadows, M. E.: Late Quaternary dynamics of southern Africa's winter rainfall zone, Earth Sci. Rev., 84, 103–138, 2007.
Chase, B., Meadows, M., Scott, L., Thomas, D., Marais, E., Sealy, J., and Reimer, P.: A record of rapid Holocene climate change preserved in hyrax middens from southwestern Africa, Geology, 37, 703–706, 2009.
Chase, B. M., Chevalier, M., Boom, A., and Carr, A. S.: The dynamic relationship between temperate and tropical circulation systems across South Africa since the last glacial maximum, Quaternary Sci. Rev., 174, 54–62, 2017.
Chase, B. M., Faith, J. T., Mackay, A., Chevalier, M., Carr, A. S., Boom, A., Lim, S., and Reimer, P. J.: Climatic controls on Later Stone Age human adaptation in Africa's southern Cape, J. Hum. Evol., 114, 35–44, 2018.
Chevalier, M. and Chase, B. M.: Southeast African records reveal a coherent shift from high- to low-latitude forcing mechanisms along the east African margin across last glacial–interglacial transition, Quaternary Sci. Rev., 125, 117–130, 2015.
Chevalier, M., Brewer, S., and Chase, B. M.: Qualitative assessment of PMIP3 rainfall simulations across the eastern African monsoon domains during the mid-Holocene and the Last Glacial Maximum, Quaternary Sci. Rev., 156, 107–120, 2017.
Chiang, J. C. H. and Bitz, C. M.: Influence of high latitude ice cover on the marine Intertropical Convergence Zone, Clim. Dynam., 25, 477–496, 2005.
Chiang, J. C. H., Biasutti, M., and Battisti, D. S.: Sensitivity of the Atlantic Intertropical Convergence Zone to Last Glacial Maximum boundary conditions, Paleoceanography, 18, 1094, https://doi.org/10.1029/2003PA000916, 2003.
Clift, P. D., Hodges, K. V., Heslop, D., Hannigan, R., Van Long, H., and Calves, G.: Correlation of Himalayan exhumation rates and Asian monsoon intensity, Nat. Geosci., 1, 875–880, 2008.
Collister, J. W., Rieley, G., Stern, B., Eglinton, G., and Fry, B.: Compound-specific δ13C analyses of leaf lipids from plants with differing carbon dioxide metabolisms, Org. Geochem., 21, 619–627, 1994.
Herrmann, N., Boom, A., Carr, A. S., Chase, B. M., Granger, R., Hahn, A., Zabel, M., and Schefuß, E.: Sources, transport and deposition of terrestrial organic material: A case study from southwestern Africa, Quaternary Sci. Rev., 149, 215–229, https://doi.org/10.1016/j.quascirev.2016.07.028, 2016.
Garcin, Y., Schefuß, E., Schwab, V. F., Garreta, V., Gleixner, G., Vincens, A., Todou, G., Séné, O., Onana, J.-M., Achoundong, G., and Sachse, D.: Reconstructing C3 and C4 vegetation cover using n-alkane carbon isotope ratios in recent lake sediments from Cameroon, Western Central Africa, Geochim. Cosmochim. Ac., 142, 482–500, https://doi.org/10.1016/j.gca.2014.07.004, 2014.
Croudace, I. W., Rindby, A., and Rothwell, R. G.: ITRAX: Description and evaluation of a new multi-function X-ray core scanner, Geol. Soc. Spec. Publ., 267, 51–63, 2006.
Dansgaard, W.: Stable isotopes in precipitation, Tellus, 16, 436–468, 1964.
Dedekind, Z., Engelbrecht, F., and Merwe, J.: Model simulations of rainfall over southern Africa and its eastern escarpment, Water SA, 42, 129–143, https://doi.org/10.4314/wsa.v42i1.13, 2016
De Wit, M. J., De Ronde, C. E. J., Tredoux, M., Roering, C., Hart, R. J., Armstrong, R. A., Green, R. W. E., Peberdy, E., and Hart, R. A.: Formation of an Archaean continent, Nature, 357, 553–562, https://doi.org/10.1038/357553a0, 1992.
Dickson, A., Leng, M., Maslin, M., and Röhl, U.: Oceanic, atmospheric and ice-sheet forcing of Southeast Atlantic Ocean productivity and South African monsoon intensity during MIS-12 to 10, Quaternary Sci. Rev., 29, 3936–3947, 2010.
Dupont, L. M., Caley, T., Kim, J.-H., CastaÑeda, I., Malaizé, B., and Giraudeau, J.: Glacial-interglacial vegetation dynamics in South Eastern Africa coupled to sea surface temperature variations in the Western Indian Ocean, Clim. Past, 7, 1209–1224, https://doi.org/10.5194/cp-7-1209-2011, 2011.
Dupont, L. M., Caley, T., and CastaÑeda, I. S.: Effects of atmospheric CO2 variability of the past 800 kyr on the biomes of southeast Africa, Clim. Past, 15, 1083–1097, https://doi.org/10.5194/cp-15-1083-2019, 2019.
Eglinton, G. and Hamilton, R. J.: Leaf epicuticular waxes, Science, 156, 1322–1335, 1967.
Engelbrecht, F. A., Marean, C. W., Cowling, R. M., Engelbrecht, C. J., Neumann, F. H., Scott, L., Nkoana, R., O'Neal, D., Fisher, E., Shook, E., Franklin, J., Thatcher, M., McGregor, J. L., Van der Merwe, J., Dedekind, Z., and Difford, M.: Downscaling Last Glacial Maximum climate over southern Africa, Quaternary Science Reviews, 226, 105879, https://doi.org/10.1016/j.quascirev.2019.105879, 2019.
EPICA Members: Stable oxygen isotopes of ice core EDML, PANGAEA, https://doi.org/10.1594/PANGAEA.754444, 2010.
Gasse, F., Chalié, F., Vincens, A., Williams M. A. J., and Williamson D.: Climatic patterns in equatorial and southern Africa from 30,000 to 10,000 years ago reconstructed from terrestrial and near-shore proxy data, Quaternary Sci. Rev., 27, 2316–2340, 2008.
Gonfiantini, R., Roche, M.-A., Olivry, J.-C., Fontes, J.-C., and Zuppi, G. M.: The altitude effect on the isotopic composition of tropical rains, Chem. Geol., 181, 147–167, 2001.
Govin, A., Holzwarth, U., Heslop, D., Ford Keeling, L., Zabel, M., Mulitza, S., Collins, J. A., and Chiessi, C. M.: Distribution of major elements in Atlantic surface sediments (36∘ N–49∘ S): Imprint of terrigenous input and continental weathering, Geochem. Geophy. Geosy., 13, Q01013, https://doi.org/10.1029/2011GC003785, 2012.
Greaves, M., Caillon, N., Rebaubier, H., Bartoli, G., Bohaty, S., Cacho, I., Clarke, L., Cooper, M., Daunt, C., and Delaney, M.: Interlaboratory comparison study of calibration standards for foraminiferal Mg∕Ca thermometry, Geochem. Geophy. Geosy., 9, Q08010, https://doi.org/10.1029/2008GC001974, 2008.
Groeneveld, J. and Filipsson, H. L.: Mg∕Ca and Mn∕Ca ratios in benthic foraminifera: the potential to reconstruct past variations in temperature and hypoxia in shelf regions, Biogeosciences, 10, 5125–5138, https://doi.org/10.5194/bg-10-5125-2013, 2013.
Hahn, A., Schefuß, E., Andò, S., Cawthra, H. C., Frenzel, P., Kugel, M., Meschner, S., Mollenhauer, G., and Zabel, M.: Southern Hemisphere anticyclonic circulation drives oceanic and climatic conditions in late Holocene southernmost Africa, Clim. Past, 13, 649–665, https://doi.org/10.5194/cp-13-649-2017, 2017.
Hahn, A., Schefuß, E., Miller, C., Zabel, M., and Groeneveld, J.: Age, biomarker, sea surface temperature, and stable isotopic records of sediment core GeoB20616-1, PANGAEA, https://doi.org/10.1594/PANGAEA.910537, 2020.
Hebbeln, D. and Cortés, J.: Sedimentation in a tropical fjord: Golfo Dulce, Costa Rica, Geo-Mar. Lett., 20, 142–148, 2001.
Hemming, S. R.: Heinrich events: Massive late Pleistocene detritus layers of the North Atlantic and their global climate imprint, Rev. Geophys., 42, RG1005, https://doi.org/10.1029/2003RG000128, 2004.
Johnson, T. C., Brown, E. T., McManus, J., Barry, S., Barker, P., and Gasse, F.: A high-resolution paleoclimate record spanning the past 25,000 years in southern East Africa, Science, 296, 113–132, https://doi.org/10.1126/science.1070057, 2002.
Jury, M. R., Valentine, H. R., and Lutjeharms, J. R. E.: Influence of the Agulhas Current on Summer Rainfall along the Southeast Coast of South Africa, J. Appl. Meteorol., 32, 1282–1287, 1993.
Kersberg, H.: Vegetationsgeographie, Südafrika (Mosambik, Swasiland, Republik Südafrika), Gebrüder Borntraeger, Stuttgart, Germany, 1996.
Lamy, F., Hebbeln, D., Röhl, U., and Wefer, G.: Holocene rainfall variability in southern Chile: a marine record of latitudinal shifts of the Southern Westerlies, Earth Planet. Sc. Lett., 185, 369–382, 2001.
Laskar, J., Fienga, A., Gastineau, M., and Manche, H.: La2010: A new orbital solution for the long-term motion of the Earth, Astron. Astrophys., 532, A89, https://doi.org/10.1051/0004-6361/201116836, 2011
Lea, D. W., Pak, D. K., Peterson, L. C., and Hughen, K. A.: Synchroneity of tropical and high-latitude Atlantic temperatures over the last glacial termination, Science, 301, 1361–1364, 2003.
Levi, C., Labeyrie, L., Bassinot, F., Guichard, F., Cortijo, E., Waelbroeck, C., Caillon, N., Duprat, J., de Garidel-Thoron, T., and Elderfield, H.: Low-latitude hydrological cycle and rapid climate changes during the last deglaciation, Geochem. Geophy. Geosys., 8, Q05N12, https://doi.org/10.1029/2006GC001514, 2007.
Lisiecki, L. E. and Raymo, M. E.: A Pliocene-Pleistocene stack of 57 globally distributed benthic δ18O records, Paleoceanography, 20, PA1003, https://doi.org/10.1029/2004PA001071, 2005.
Locarnini, R. A., Mishonov, A. V., Antonov, J. I., Boyer, T. P., Garcia, H. E., Baranova, O. K., Zweng, M. M., Paver, C. R., Reagan, J. R., Johnson, D. R., Hamilton, M., Seidov, D., and Levitus, S.: World ocean atlas 2013, Volume 1, Temperature, National Oceanic and Atmospheric Administration, Silver Spring, USA, https://doi.org/10.7289/V55X26VD, 2013.
Lutjeharms, J. R. E. and Da Silva, A. J.: The Delagoa Bight eddy, Deep-Sea Res. Pt. I., 35, 619–634, 1988.
Maboya, L., Meadows, M., Reimer, P., and Haberzettl, T.: Marine reservoir correction ΔAR, for south and east coasts of South Africa, in: 21st Biennial Conference of the South African Society of Quaternary Research, Johannesburg, 3–7 April 2017, 25, 2017.
Mason, S. and Jury, M.: Climatic variability and change over southern Africa: a reflection on underlying processes, Prog. Phys. Geog., 21, 23–50, 1997.
McGregor, H. V., Dupont, L., Stuut, J.-B. W., and Kuhlmann, H.: Vegetation change, goats, and religion: a 2,000-year history of land use in southern Morocco, Quaternary Sci. Rev., 28, 1434–1448, 2009.
Meadows, M. E. and Meadows, K. F.: Late Quaternary vegetation history of the Winterberg Mountains, eastern Cape, South Africa, S. Afr. J. Sci., 84, 253–259, 1988.
Miller, C., Finch, J., Hill, T., Peterse, F., Humphries, M., Zabel, M., and Schefuß, E.: Late Quaternary climate variability at Mfabeni peatland, eastern South Africa, Clim. Past, 15, 1153–1170, https://doi.org/10.5194/cp-15-1153-2019, 2019.
Miller, C., Hahn, A., Liebrand, D., Zabel, M., and Schefuß, E.: Mid- and low latitude effects on eastern South African rainfall over the Holocene, Quaternary Sci. Rev., 229, 106088, https://doi.org/10.1016/j.quascirev.2019.106088, 2020.
Neumann, F. H., Scott, L., Bousman, C. B., and Van As, L.: A Holocene sequence of vegetation change at Lake Eteza, coastal KwaZulu-Natal, South Africa, Rev. Palaeobot. Palyno., 162, 39–53, https://doi.org/10.1016/j.revpalbo.2010.05.001, 2010.
NGRIP members: High-resolution record of Northern Hemisphere climate extending into the last interglacial period, Nature, 431, 147–151, 2004.
Nicholson, S. E. and Flohn, H.: African environmental and climatic changes and the general atmospheric circulation in late Pleistocene and Holocene, Climatic Change, 2, 313–348, 1980.
Nizou, J., Hanebuth, T. J. J., and Vogt, C.: Deciphering signals of late Holocene fluvial and aeolian supply from a shelf sediment depocenter off Senegal (north-west Africa), J. Quaternary Sci., 26, 411–421, https://doi.org/10.1002/jqs.1467, 2010.
Norström, E., Scott, L., Partridge, T., Risberg, J., and Holmgren, K.: Reconstruction of environmental and climate changes at Braamhoek wetland, eastern escarpment South Africa, during the last 16,000 years with emphasis on the Pleistocene–Holocene transition, Palaeogeogr. Palaeocl., 271, 240–258, 2009.
Paillard, D., Labeyrie, L., and Yiou, P.: Macintosh program performs time – series analysis, EOS T. Am. Geophys. Un., 77, 379–379, 1996.
Partridge, T. C., Demenocal, P. B., Lorentz, S. A., Paiker, M. J., and Vogel, J. C.: Orbital forcing of climate over South Africa: A 200,000-year rainfall record from the pretoria saltpan, Quaternary Sci. Rev., 16, 1125–1133, 1997.
Quartly, G. D. and Srokosz, M. A.: Eddies in the southern Mozambique Channel, Deep-Sea Res. Pt. II, 51, 69–83, 2004.
Rasmussen, S. O., Bigler, M., Blockley, S. P., Blunier, T., Buchardt, S. L., Clausen, H. B., Cvijanovic, I., Dahl-Jensen, D., Johnsen, S. J., Fischer, H., Gkinis, V., Guillevic, M., Hoek, W. Z., Lowe, J. J., Pedro, J. B., Popp, T., Seierstad, I. K., Steffensen, J. P., Svensson, A. M., Vallelonga, P., Vinther, B. M., Walker, M. J. C., Wheatley, J. J., and Winstrup, M.: A stratigraphic framework for abrupt climatic changes during the Last Glacial period based on three synchronized Greenland ice-core records: refining and extending the INTIMATE event stratigraphy, Quaternary Sci. Rev., 106, 14–28, https://doi.org/10.1016/j.quascirev.2014.09.007, 2014.
Reason, C. and Mulenga, H.: Relationships between South African rainfall and SST anomalies in the southwest Indian Ocean, Int. J. Climatol., 19, 1651–1673, 1999.
Reason, C. and Rouault, M.: Links between the Antarctic Oscillation and winter rainfall over western South Africa, Geophys. Res. Lett., 32, L07705, https://doi.org/10.1029/2005GL022419, 2005.
Reimer, P. J., Bard, E., Bayliss, A., Beck, J. W., Blackwell, P. G., Ramsey, C. B., Buck, C. E., Cheng, H., Edwards, R. L., and Friedrich, M.: IntCal13 and Marine13 radiocarbon age calibration curves 0–50,000 years cal BP, Radiocarbon, 55, 1869–1887, 2013.
Rogerson, M., Rohling, E., and Weaver, P.: Promotion of meridional overturning by Mediterranean-derived salt during the last deglaciation, Paleoceanography, 21, PA4101, https://doi.org/10.1029/2006PA001306, 2006.
Rothwell, R. G. and Rack, F. R.: New techniques in sediment core analysis: an introduction, Geol. Soc. Spec. Publ., 267, 1–29, https://doi.org/10.1144/GSL.SP.2006.267.01.01, 2006.
Schefuß, E., Kuhlmann, H., Mollenhauer, G., Prange, M., and Patzold, J.: Forcing of wet phases in southeast Africa over the past 17,000 years, Nature, 480, 509–12, 2011.
Schüürman, J., Hahn, A., and Zabel, M.: In search of sediment deposits from the Limpopo (Delagoa Bight, southern Africa): Deciphering the catchment provenance of coastal sediments, Sediment. Geol., 380, 94–104, 2019.
Scott, L.: Climatic conditions in Southern Africa since the last glacial maximum, inferred from pollen analysis, Palaeogeogr. Palaeocl., 70, 345–353, https://doi.org/10.1016/0031-0182(89)90112-0, 1989.
Scott, L., Neumann, F. H., Brook, G. A., Bousman, C. B., Norström, E., and Metwally, A. A.: Terrestrial fossil-pollen evidence of climate change during the last 26 thousand years in Southern Africa, Quaternary Sci. Rev., 32, 100–118, https://doi.org/10.1016/j.quascirev.2011.11.010, 2012.
Sessions, A. L., Burgoyne, T. W., Schimmelmann, A., and Hayes, J. M.: Fractionation of hydrogen isotopes in lipid biosynthesis, Org. Geochem., 30, 1193–1200, 1999.
Sigman, D. M., Hain, M. P., and Haug, G. H.: The polar ocean and glacial cycles in atmospheric CO2 concentration, Nature, 466, 47–55, https://doi.org/10.1038/nature09149, 2010.
Simon, M. H., Ziegler, M., Bosmans, J., Barker, S., Reason, C. J. C., and Hall, I. R.: Eastern South African hydroclimate over the past 270,000 years, Sci. Rep.-UK, 5, 18153, https://doi.org/10.1038/srep18153, 2015.
Sonzogni, C., Bard, E., and Rostek, F.: Tropical sea-surface temperatures during the last glacial period: a view based on alkenones in Indian Ocean sediments, Quaternary Science Reviews, 17, 1185–1201, 1998.
Stager, J. C., Mayewski, P. A., White, J., Chase, B. M., Neumann, F. H., Meadows, M. E., King, C. D., and Dixon, D. A.: Precipitation variability in the winter rainfall zone of South Africa during the last 1400 yr linked to the austral westerlies, Clim. Past, 8, 877–887, https://doi.org/10.5194/cp-8-877-2012, 2012.
Stuiver, M., Reimer, P., and Reimer, R.: CALIB 7.1, available at: http://calib.org, last access: 23 August 2019.
Sweeney, R. J., Duncan, A. R., and Erlank, A. J.: Geochemistry and Petrogenesis of Central Lebombo Basalts of the Karoo Igneous Province, J. Petrol., 35, 95–125, 1994.
Tierney, J. E., Russell, J. M., Huang, Y., Damsté, J. S. S., Hopmans, E. C., and Cohen, A. S.: Northern Hemisphere Controls on Tropical Southeast African Climate During the Past 60,000 Years, Science, 322, 252–255, https://doi.org/10.1126/science.1160485, 2008.
Truc, L., Chevalier, M., Favier, C., Cheddadi, R., Meadows, M. E., Scott, L., Carr, A. S., Smith, G. F., and Chase, B. M.: Quantification of climate change for the last 20,000 years from Wonderkrater, South Africa: Implications for the long-term dynamics of the Intertropical Convergence Zone, Palaeogeogr. Palaeocl., 386, 575–587, https://doi.org/10.1016/j.palaeo.2013.06.024, 2013.
Tyson, P. D.: The atmospheric modulation of extended wet and dry spells over South Africa, 1958–1978, Int. J. Climatol., 4, 621–635, https://doi.org/10.1002/joc.3370040606, 1984.
Tyson, P. D. and Preston-Whyte, R. A.: Weather and climate of southern Africa, Oxford University Press, Oxford, UK, 2000.
Walker, N. D.: Links between South African summer rainfall and temperature variability of the Agulhas and Benguela Current systems, J. Geophys. Res., 95, 3297–3319, 1990.
Wang, Y. V., Leduc, G., Regenberg, M., Andersen, N., Larsen, T., Blanz, T., and Schneider, R. R.: Northern and Southern Hemisphere controls on seasonal sea surface temperatures in the Indian Ocean during the last deglaciation, Paleoceanography, 28, 619–632, https://doi.org/10.1002/palo.20053, 2013.
White, F.: The vegetation of Africa, Natural Resources Research, UNESCO, Paris, 20, 1983.
Xie, P. and Arkin, P. A.: Global precipitation: A 17-year monthly analysis based on gauge observations, satellite estimates, and numerical model outputs, B. Am. Meteorol. Soc., 78, 2539–2558, 1997.
Zabel, M.: Climate archives in coastal waters of southern Africa–Cruise No. M123 – February 3–February 27, 2016 – Walvis Bay (Namibia) – Cape Town (Rep. of South Africa), METEOR-Berichte M123, 50 pp., 2016.
Zhao, X., Dupont, L., Schefuß, E., Meadows, M., Hahn, A., and Wefer, G.: Holocene vegetation and climate variability between winter and summer rainfall zones of South Africa, Quatern. Int., 404, 185–186, 2016.
Zahn, R., Hall, I., Schneider, R., Barker S., Compton, J., Dupont, L., Flores, J.-A., Franzese, A., Goldstein,S., Hemming, S., Knorr, G., Marino, G., Mazaud, A., Peeters, F., Preu, B., Reichert, G.-J., Spiess, V., Uenzelmann-Neben, G., Weldcab, S., and Ziegler, M.: Southern African Climates, Agulhas Warm Water Transports and Retroflection, and Interocean Exchanges – SAFARI, IODP Past Achievements and Future Opportunities, EuroForum 2006, Cardiff, UK, 8–9 May 2012.
Ziegler, M., Simon, M. H., Hall, I. R., Barker, S., Stringer, C., and Zahn, R.: Development of Middle Stone Age innovation linked to rapid climate change, Nat. Commun., 4, 1905, https://doi.org/10.1038/ncomms2897, 2013.