the Creative Commons Attribution 4.0 License.
the Creative Commons Attribution 4.0 License.
 | 25 Nov 2021
Maastrichtian–Rupelian paleoclimates in the southwest Pacific – a critical re-evaluation of biomarker paleothermometry and dinoflagellate cyst paleoecology at Ocean Drilling Program Site 1172
Joost Frieling
Marlow Julius Cramwinckel
Christine Boschman
Appy Sluijs
Francien Peterse
Sea surface temperature (SST) reconstructions based on isoprenoid glycerol dialkyl glycerol tetraether (isoGDGT) distributions from the Eocene southwest (SW) Pacific Ocean are unequivocally warmer than can be reconciled with state-of-the-art fully coupled climate models. However, the SST signal preserved in sedimentary archives can be affected by contributions of additional isoGDGT sources. Methods now exist to identify and possibly correct for overprinting effects on the isoGDGT distribution in marine sediments. Here, we use the current proxy insights to (re-)assess the reliability of the isoGDGT-based SST signal in 69 newly analyzed and 242 reanalyzed sediments at Ocean Drilling Program (ODP) Site 1172 (East Tasman Plateau, Australia) following state-of-the-art chromatographic techniques. We compare our results with paleoenvironmental and paleoclimatologic reconstructions based on dinoflagellate cysts. The resulting ∼ 130 kyr resolution Maastrichtian–Oligocene SST record based on the TetraEther indeX of tetraethers with 86 carbon atoms (TEX86) confirms previous conclusions of anomalous warmth in the early Eocene SW Pacific and remarkably cool conditions during the mid-Paleocene. Dinocyst diversity and assemblages show a strong response to the local SST evolution, supporting the robustness of the TEX86 record. Soil-derived branched GDGTs stored in the same sediments are used to reconstruct mean annual air temperature (MAAT) of the nearby land using the Methylation index of Branched Tetraethers with 5-methyl bonds (MBT'5me) proxy. MAAT is consistently lower than SST during the early Eocene, independent of the calibration chosen. General trends in SST and MAAT are similar, except for (1) an enigmatic absence of MAAT rise during the Paleocene–Eocene Thermal Maximum and Middle Eocene Climatic Optimum, and (2) a subdued middle–late Eocene MAAT cooling relative to SST. Both dinocysts and GDGT signals suggest a mid-shelf depositional environment with strong river runoff during the Paleocene–early Eocene progressively becoming more marine thereafter. This trend reflects gradual subsidence and more pronounced wet/dry seasons in the northward-drifting Australian hinterland, which may also explain the subdued middle Eocene MAAT cooling relative to that of SST. The overall correlation between dinocyst assemblages, marine biodiversity and SST changes suggests that temperature exerted a strong influence on the surface-water ecosystem. Finally, we find support for a potential temperature control on compositional changes of branched glycerol monoalkyl glycerol tetraethers (brGMGTs) in marine sediments. It is encouraging that a critical evaluation of the GDGT signals confirms that most of the generated data are reliable. However, this also implies that the high TEX86-based SSTs for the Eocene SW Pacific and the systematic offset between absolute TEX86-based SST and MBT'5me-based MAAT estimates remain without definitive explanation.
- Article
(7275 KB) - Full-text XML
-
Supplement
(63 KB) - BibTeX
- EndNote


1.1 The Paleogene southwest Pacific Ocean
Reconstructions of deep-sea (Westerhold et al., 2020) and sea surface temperature (Bijl et al., 2009, 2013a; Hollis et al., 2012, 2019; Frieling et al., 2014; Inglis et al., 2015; O'Brien et al., 2017; Evans et al., 2018; Cramwinckel et al., 2018; O'Connor et al., 2019; Sluijs et al., 2020) have revealed an overall cool climate in the Maastrichtian and Paleocene, long-term warming towards the early Eocene Climatic Optimum (EECO; 53.4–49.2 Ma) and subsequent cooling during the middle and late Eocene (48.6–33.6 Ma). The EECO stands out as particularly warm, with ice-free polar regions (Hollis et al., 2009, 2012; Pross et al., 2012; Bijl et al., 2013a; Frieling et al., 2014; Hines et al., 2017). Certain southern high-latitude regions retain warm–temperate conditions into the late Eocene (Bijl et al., 2009; Liu et al., 2009; Houben et al., 2019) and, despite ample evidence for pronounced Antarctic glacial expansion across the Eocene–Oligocene transition (EOT) (Salamy and Zachos, 1999; Bohaty et al., 2012), even into the early Oligocene (Passchier et al., 2013, 2017; Hartman et al., 2018; O'Brien et al., 2020). Variations in atmospheric CO2 concentrations (Anagnostou et al., 2016, 2020; Foster et al., 2017) are likely the primary driver of these multi-million-year climatic trends (Cramwinckel et al., 2018). While equatorial proxy-based sea surface temperatures (SSTs) and deep-sea temperatures, assumed to reflect high-latitude SSTs, show good correspondence with numerical model simulations under Eocene boundary conditions and with varying CO2 forcing (Cramwinckel et al., 2018), proxy-based SST reconstructions of the southwest (SW) Pacific remain warmer than those from model simulations (Bijl et al., 2009; Cramwinckel et al., 2018; Hollis et al., 2019; Crouch et al., 2020; Lunt et al., 2021), despite proposed zonal heterogeneity (Douglas et al., 2014). Specifically, numerical climate models are currently unable to simulate a paleoclimate in which the annual SST difference between the equatorial Atlantic Ocean (Cramwinckel et al., 2018) and the SW Pacific Ocean (Hollis et al., 2012; Bijl et al., 2013a) is as small as the proxy data suggest. Mechanisms explaining this mismatch might be found in the geographic boundary conditions and spatial resolution of the numerical models, and the limitations of the proxies to reflect absolute temperatures. The absolute SST estimates for the SW Pacific are closer to those from the equatorial regions than they are to the deep sea (Cramwinckel et al., 2018), which is implausible given that the South Pacific is inferred to have been the dominant region of deep-water formation during the Eocene (Huber and Thomas, 2010; Thomas et al., 2003, 2014). Without this model–data mismatch resolved, it remains unclear to what extent climate models properly simulate polar amplification or, alternatively, if the current proxies properly reflect high-latitude temperatures under greenhouse conditions (Lunt et al., 2012).
Proxy evidence for warmth in the Eocene derives from a suite of organic and calcite-based proxies for marine or terrestrial temperature. SST reconstructions of the SW Pacific Ocean have primarily relied on organic geochemical proxies, mainly the TetraEther indeX of tetraethers with 86 carbon atoms (TEX86) (Sluijs et al., 2011; Hollis et al., 2009, 2012; Bijl et al., 2009, 2013a; Cramwinckel et al., 2020; Crouch et al., 2020). Although absolute temperatures have significant uncertainties, they have been broadly confirmed by robust oxygen isotope ratios (δ18O) and trace element ratios () from well-preserved planktonic foraminifera from Eocene sections in New Zealand (Hollis et al., 2009, 2012; Creech et al., 2010; Hines et al., 2017; Crouch et al., 2020). These proxies require assumptions regarding seawater chemistry (, δ18O seawater, pH) that also carry significant uncertainty (e.g., Evans et al., 2018; Kozdon et al., 2020), and these uncertainties may affect trends in multi-million-year carbonate-based reconstructions. The application of clumped isotope paleothermometry can reduce some of the uncertainties surrounding carbonate-based proxies and provide additional SST constraints (Evans et al., 2018), as has been demonstrated in work on Seymour Island (Douglas et al., 2014).
Pollen-based vegetation reconstructions from New Zealand, Tasmania and Wilkes Land (Carpenter et al., 2012; Pross et al., 2012; Contreras et al., 2013, 2014; Huurdeman et al., 2020) present mean annual air temperature (MAAT) reconstructions which confirm the warm conditions from SST proxies. Here, uncertainties on absolute temperatures are dependent on the diversity of the pollen assemblage, and the temperature tolerances of nearest living relatives (NLRs). Uncertainties increase when evolutionary distances to NLRs are large. In general, vegetation-based reconstructions arguably deliver the best constraints on winter temperatures. This is because of fundamental physiological restrictions in individual tolerances of plants (e.g., Reichgelt et al., 2018), whereas MAAT exerts much less control on the standing vegetation than seasonal temperature and (seasonal) hydrological extremes. Absolute air temperature reconstructions from soil-derived lipid biomarkers (e.g., using brGDGT-based paleothermometry; e.g., Weijers et al., 2007a; De Jonge et al., 2014a) have also yielded MAAT reconstructions for the Eocene (Pancost et al., 2013; Bijl et al., 2013a; Huurdeman et al., 2020; Lauretano et al., 2021). The resulting MAAT records are more in line with numerical model simulations (Lunt et al., 2021) but considerably colder than the SSTs from the same sections. This is difficult to reconcile in a coastal climate setting, where SST and adjacent air temperature should be broadly consistent.
These uncertainties in lipid-based absolute temperature reconstructions have been put forward as the underlying reason for the data–model mismatch in past climate reconstructions. This sparked major research efforts to improve understanding of proxy functioning and potential confounding factors, ultimately to improve the accuracy of biomarker-derived temperature estimates, and to resolve the mismatch between model simulations and proxy data.
1.2 Advances in GDGT paleothermometry
TEX86 utilizes the correspondence of proportionally higher numbers of cyclopentane rings in sedimentary archaeal membrane lipids, the isoprenoid glycerol dialkyl glycerol tetraethers (isoGDGTs), with higher SST (Schouten et al., 2002). This relationship is attributed to a viscoelastic adaptation of the membrane of pelagic Thaumarchaeota, the dominant source organisms of isoGDGTs, to temperature (Schouten et al., 2002, 2013). For some periods in geological deep time, including the Paleocene and Eocene, TEX86 calibrations based on GDGTs in core-top sediments need to be extrapolated above the modern SST range (∼ 30 °C) to estimate SST. It remains unclear if the relationship between SST and TEX86 is linear or exponential beyond the high end of the core-top calibration (e.g., Cramwinckel et al., 2018; Hollis et al., 2019). It is therefore recommended that both linear and exponential calibrations are presented, which typically lead to higher and lower SST estimates, respectively (Hollis et al., 2019). Yet, as the absolute TEX86 values of many Eocene sediments exceed those observed for modern core tops, even the most conservative calibrations yield SSTs >30 °C in the warmest intervals. Increasingly, such temperatures are corroborated by estimates from other SST proxies (e.g., Bijl et al., 2010; Douglas et al., 2014; Hines et al., 2017; Crouch et al., 2020).
Along with calibration uncertainties, a number of confounding factors have been identified since the first publication of the isoGDGT-based SST records from the SW Pacific. These are related to a suite of pre-, syn- and post-depositional processes that might alter the pelagic isoGDGT signal in marine sediments. In addition to the pelagic contribution, isoGDGT assemblages may include contributions from methanogenic (Blaga et al., 2009) and methanotrophic (Weijers et al., 2011; Zhang et al., 2011) archaea, deep-dwelling archaea (Taylor et al., 2013) and terrestrial sources (Hopmans et al., 2004; Weijers et al., 2006). Various approaches have been developed to recognize these contributions, leading to more reliable SST reconstructions. However, the influence of growth phase (Elling et al., 2014), and environmental ammonium and oxygen concentrations (Qin et al., 2015; Hurley et al., 2016) on sedimentary isoGDGT distributions is still poorly constrained.
Branched GDGTs (brGDGTs) produced by soil bacteria can be used to reconstruct MAAT. The Methylation index of Branched Tetraethers with 5-methyl bonds (MBT'5me) (De Jonge et al., 2014a; Naafs et al., 2019; Dearing Crampton-Flood et al., 2020) represents the degree of methylation of the 5-methyl brGDGTs which strongly responds to MAAT. Studies on brGDGTs in marine sediments reveal that the MAAT evolution of Australian–New Zealand land masses followed the trends in deep- and surface-ocean temperature remarkably well but with lower absolute values than SST (Bijl et al., 2013a; Pancost et al., 2013). With improved analytical techniques (Hopmans et al., 2016), brGDGT isomers with a methylation on the “5” or the “6” position of the alkyl chain can now be separated and quantified (De Jonge et al., 2013). With this separation, the pH co-dependence of the brGDGT signal can be removed by only considering 5-methyl brGDGTs that only respond to temperature (De Jonge et al., 2014a; Naafs et al., 2017a). The separation of brGDGT isomers also allows the recognition and correction of potential contributions of aquatic brGDGTs to the soil-derived brGDGT signal stored in marine sediments that complicate the use of brGDGTs as continental paleothermometer in continental margin sediments (Peterse et al., 2009; Tierney and Russell, 2009; Zell et al., 2013; De Jonge et al., 2014b, 2015; Sinninghe Damsté, 2016; Dearing Crampton-Flood et al., 2018).
Lipids from a related biomarker family, the branched glycerol monoalkyl glycerol tetraethers (brGMGTs), were identified in the marine realm in core-top sediments (Liu et al., 2012), oxygen minimum zones (Xie et al., 2014) and Paleogene sediments (Sluijs et al., 2020). In the terrestrial realm, they were described in peats (Naafs et al., 2018a) and East African lake sediments (Baxter et al 2019), the latter identifying seven individual brGMGTs. The brGMGTs contain a covalent bond connecting the two alkyl chains, which is thought to enhance membrane stability at higher temperatures (Morii et al., 1998). The abundance of brGMGTs relative to that of brGDGTs, as well as the relative distribution of brGMGT isomers, seems to vary with temperature in both the terrestrial (Naafs et al., 2018a; Baxter et al., 2019; Tang et al., 2021) and marine realms (Sluijs et al., 2020), although this is thus far only based on empirical relationships. The exact sources of these compounds in sedimentary archives and their temperature relation are as yet not fully understood. For example, brGMGTs in Paleogene Arctic Ocean sediments seem to be produced in a marine system with a strong oxygen minimum zone and substantial input of penecontemporaneous terrestrial matter (Sluijs et al., 2020). Similar to the temperature response of 5-methyl brGDGTs, the degree of methylation of acyclic brGMGTs (HMBTacyclic) follows the TEX86 in the Paleogene Arctic record. However, the index of brGMGTI, which was empirically calibrated to temperature using a suite of East African lake sediments (Baxter et al., 2019), does not (Sluijs et al., 2020).
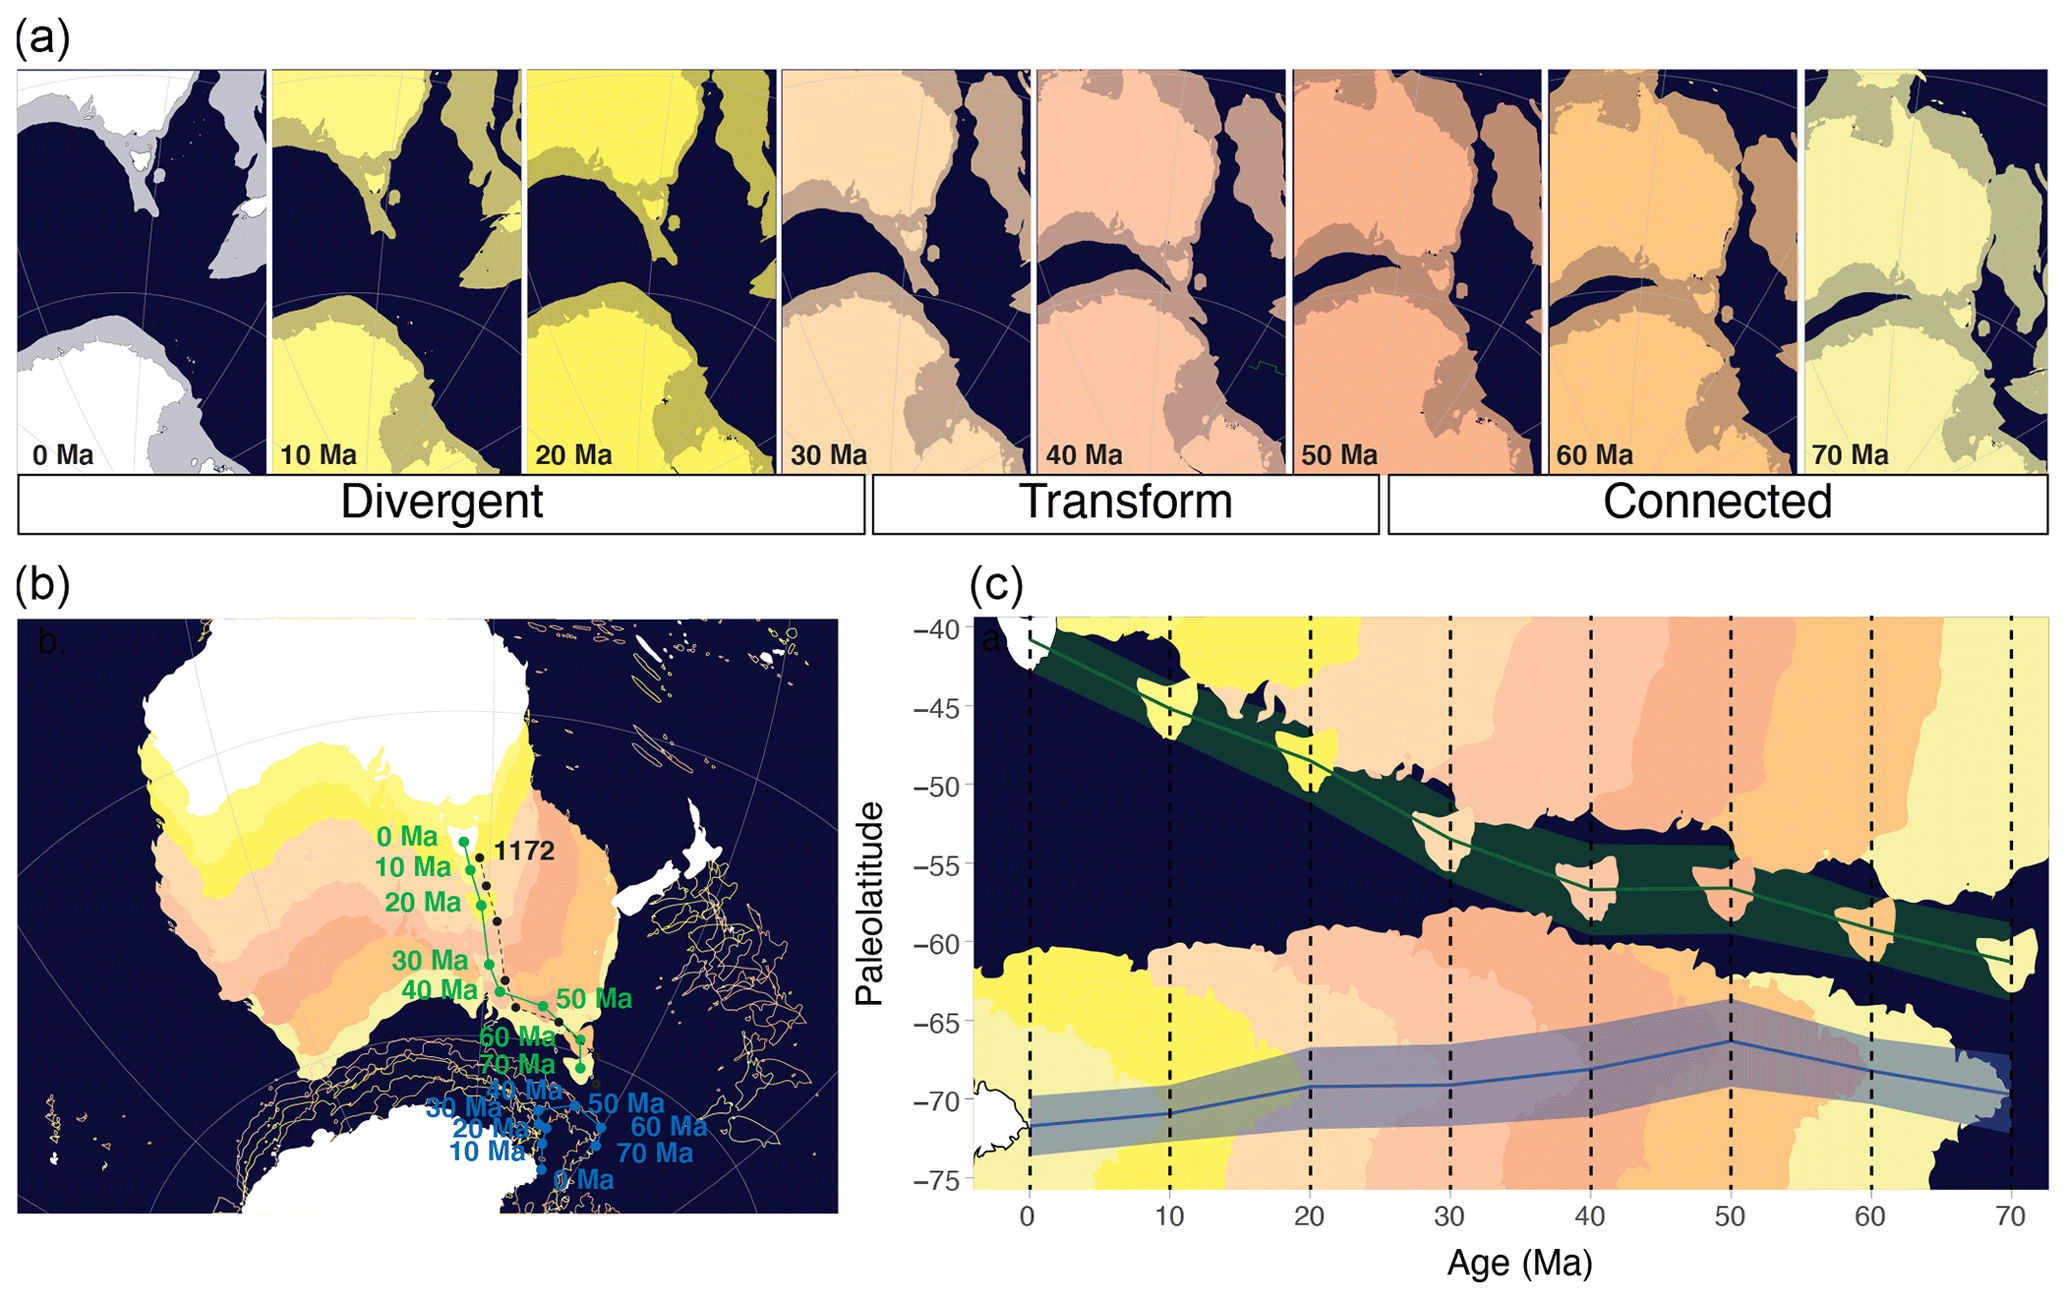
Figure 1Absolute plate tectonic changes around Tasmania during the Maastrichtian to a recent era. (a) Tasmanian Gateway (TG) opening in eight time slices, present to 70 Ma. Relative tectonic motion between Australia and Antarctica is limited until about 53 Ma, transform until 34 Ma and divergent from 34 Ma onwards. (b) Like panel (a) but on an orthographic projection (compiled with Gplates, using a paleomagnetic reference frame (Torsvik et al., 2012) from Seton et al., 2012). Green and blue lines and dots represent the pathways of Tasmania and Cape Adare, respectively; the dashed black line and dots represent the paleoposition of Site 1172. (c) The absolute paleolatitude of Cape Adare, Antarctica (blue line; blue shading indicates uncertainty), as indicative of the plate tectonic motion around the pathway of the Tasman Current, and of Tasmania (green line; green shading indicates uncertainty), as indicative of the plate tectonic motion of the source area of the terrestrial organic matter, in 10 Myr time steps from 70–0 Ma, obtained from http://paleolatitude.org (last access: 10 November 2021) (Van Hinsbergen et al., 2015). Plate contours represent paleolatitude of present-day shorelines for orientation (obtained from Gplates). Note that, in the visualizations in panels (b) and (c), submerged continental crust is not shown but does limit TG opening.
1.3 Revisiting GDGTs and investigating brGMGTs at Site 1172
From the new insights about the GDGT-based proxies, it is clear that assessing the reliability of previously published GDGT-based temperature reconstructions requires a detailed review of the depositional conditions. Moreover, the presence and proxy potential of brGMGTs in the early Paleogene SW Pacific has not yet been studied. To this end, we have revisited the sedimentary record at Ocean Drilling Program (ODP) Site 1172 on the East Tasman Plateau (ETP), which contains an almost complete succession of late Cretaceous (Maastrichtian) to early Oligocene sediments (Brinkhuis et al., 2003; Schellenberg et al., 2004; Stickley et al., 2004a; Bijl et al., 2013b, 2014). We have undertaken new analyses of isoGDGTs, brGDGTs and brGMGTs from the Maastrichtian and Paleocene section of the record and reanalyzed previously published sample sets using the chromatography method with improved compound separation (Hopmans et al., 2016). We critically evaluate the biomarker results using established indicators for a pre-, syn- or post-depositional overprint of the primary sea surface and air temperature signals. In addition, we use dinoflagellate cyst assemblages and terrestrial palynomorph abundance as recorders of paleoenvironmental change on the continental shelf, for constraints on depositional, environmental and hydrological changes, in order to aid interpretations of the GDGT proxies. We also evaluate the nature, source and possible temperature affinity of the brGMGTs in our record. After this critical (re-)evaluation, we interpret the Maastrichtian to early Oligocene sea surface and air temperature, and paleoenvironmental evolution of the SW Pacific region.
2.1 Site locality and tectonic evolution
Since the Cenomanian, the continental complex including Australia, Tasmania, ETP and the South Tasman Rise (STR) tectonically moved as one continental plate (Müller et al., 2000) – here referred to as Australia. True polar wander, although relatively poorly constrained, has caused absolute motions of the spin axis relative to the paleopositions of the plate circuit (Torsvik et al., 2012; Van Hinsbergen et al., 2015). On a paleomagnetic reference frame, Antarctica and Australia rotated northwestward by 3° of latitude and over 3° longitude between 70 and 50 Ma (Fig. 1), with only little transform displacement between them. From 50 Ma onwards, the tectonic drift orientation of Antarctica shifted slightly more southwards than that of Australia, causing left transform motion between notably west of Cape Adare and west Tasmania (Fig. 1; Williams et al., 2019). Although this divergence effectively opened the Tasmanian Gateway (TG) to surface flow of the Antarctic Counter Current close to the early–middle Eocene boundary (Bijl et al., 2013a), probably through subsidence of the Antarctic continental margin and STR, rapid northward movement of Australia and southward movement of East Antarctica did not start before about 40 Ma (Fig. 1; Cande and Stock, 2004; Seton et al., 2012). Yet, a connection between Australian and Antarctic continental blocks persisted until 34 Ma when transform motion between STR and Wilkes Land changed into spreading and ocean crust formation (Cande and Stock, 2004; Seton et al., 2012).

Figure 2(a) Age tie points used to construct the age model for ODP Site 1172, based on stable carbon isotopic (red dot; Sluijs et al., 2011), magnetostratigraphic (green triangles; Stickley et al., 2004a; Bijl et al., 2010; Houben et al., 2019) and nannofossil (blue square; Houben et al., 2019) age constraints. Black wobbly lines represent hiatuses. (b) Shipboard magnetic susceptibility from Exon et al. (2001). (c) Clay mineralogy and (d) smear slide-based lithological observations from Robert (2004).
2.2 Lithology
A 760 m thick sediment sequence was recovered at ODP Site 1172, on the western part of the ETP, east of Tasmania, Australia (Exon et al., 2001). We studied the interval from 760 m below the sea floor (m b.s.f.) to about 350 m b.s.f. in a composite (Röhl et al., 2004a) of Hole A and Hole D. The carbonate ooze from 350 m b.s.f. upwards did not yield any GDGTs. The studied succession consists broadly of green-gray silty claystones from 760 to ∼ 505 m b.s.f., grading into dark gray to black silty claystones from 636–625 m b.s.f., then a return of the greenish-gray silty claystones, which is interrupted by a more lithified unit at 610 m b.s.f. (Exon et al., 2001; Röhl et al., 2004a, b; Schellenberg et al., 2004; Sluijs et al., 2011). The silty claystones turn gradually and cyclically lighter from 570 m b.s.f. upwards until ∼ 361 m b.s.f., with gradually more calcium carbonate and biogenic silica preserved (Röhl et al., 2004a). The clay mineralogy is dominated by smectite but contains progressively more kaolinite above ∼ 500 m b.s.f. (Fig. 2; Exon et al., 2001; Robert, 2004). Gray silty claystones give way to a green glauconitic horizon between 360.1 and 357.3 m b.s.f. (Exon et al., 2001). Above this greensand, carbonate oozes continue further upwards. The record is quasi-continuously bioturbated by Zoophycos (Exon et al., 2001). We follow the depth corrections published in Sluijs et al. (2011) for Cores 12–31 R, based on the correlation of core-log and downhole log magnetic susceptibility.
2.3 Age model
For age tie points (Table S1 in the Supplement; Fig. 2), we use the identification of the Paleocene–Eocene Thermal Maximum (PETM) (Sluijs et al., 2011) and Middle Eocene Climatic Optimum (MECO; Bijl et al., 2010) and robust biostratigraphical constraints from the Eocene–Oligocene boundary interval (Houben et al., 2019; Sluijs et al., 2003). In the intervals between these tie points, the age model is based on magnetostratigraphy, which in the early Eocene suffers from a strong normal overprint (Dallanave et al., 2016). Despite the overprint, there is a paleomagnetic signal preserved in the inclination data (Fuller and Touchard, 2004). Biostratigraphic constraints from calcareous nannofossils, diatoms and dinocysts (Stickley et al., 2004a; Bijl et al., 2013b) are broadly consistent with nearby sites (Dallanave et al., 2016).
The nature of the sediments and depositional setting (see below) implies that small hiatuses may exist between the age tie points (Röhl et al., 2004a). Indeed, hiatuses were already identified across the Cretaceous–Paleogene boundary (Schellenberg et al., 2004), in the mid-Paleocene (Bijl et al., 2013b; Hollis et al., 2014), early Eocene (Bijl et al., 2013b) and middle Eocene (Röhl et al., 2004a), corresponding to spikes in magnetic susceptibility (Fig. 2). The section across the Eocene–Oligocene transition is strongly condensed (Stickley et al., 2004a, b; Houben et al., 2019).
2.4 Depositional setting
From the lithology (Robert, 2004) and palynological content (Brinkhuis et al., 2003), the Maastrichtian–Eocene part of the record is interpreted to represent a shallow-marine, mid-continental shelf depositional setting, with gradual deepening in the middle Eocene based on an increase in calcium carbonate content (Fig. 2; Röhl et al., 2004a). The late Eocene greensands were initially interpreted as indicating deepening and current inception as a result of widening of the TG (Stickley et al., 2004b). Later studies have related the greensands to invigorated ocean circulation and winnowing (Houben et al., 2019), with no deepening required. Volcanic activity of the Balleny plume in the late Eocene (Hill and Moore, 2001) might have influenced bathymetric changes of the ETP, in addition to the tectonic stresses that act on diverging plates in the TG area.
The regional tectonic evolution has implications for interpreting the marine and terrestrial temperature record at this site, because it influenced regional oceanography and climatic conditions in the hinterland. Field data and model simulations indicate that with a closed TG, the Tasman Current, a strong western boundary current of the proto-Ross Gyre, bathed the plateau with Antarctic-derived surface waters (Huber et al., 2004; Bijl et al., 2011, 2013b; Sijp et al., 2014, 2016). Palynological evidence confirms that the proto-Ross Gyre influence persisted at the ETP until the late Eocene (Warnaar et al., 2009; Bijl et al., 2011). This means that despite northward tectonic drift, the same strong western boundary current bathed the site during the Maastrichtian to late Eocene (Sijp et al., 2016), with perhaps some intermittent influence of East Australian Current waters from the north (Bijl et al., 2010; Cramwinckel et al., 2020). This ended when the proto-Leeuwin Current started to flow through the progressively widening TG (Fig. 1), bringing the ETP under the influence of more northerly sourced surface waters (Stickley et al., 2004b; Houben et al., 2019).
Persistent terrigenous input (Brinkhuis et al., 2003) arguably requires a large terrestrial catchment area, and the ETP seems too small (∼ 50 000 km2) to have had vast areas above sea level. Seismic information from the East Tasman Saddle, connecting the Tasmanian Margin to the ETP, does not suggest there was a deep basin in between (Hill and Exon, 2004). Therefore, Tasmanian-sourced detrital material could reach the ETP. Paleocene–Eocene terrestrial palynomorph assemblages contain common Permian–Triassic elements (Contreras et al., 2014); the Permian–Triassic upper Parmeener group contains thick terrestrial (coal) deposits and comprises the surface lithology of most of eastern Tasmania today. Therefore, the source area for the terrestrial organic matter (OM) and detrital input was likely Tasmania. Minor contributions could have derived from rivers flowing from southeast Australia. Also, the Cretaceous–Paleocene ETP might have received perhaps a minor component of Antarctic-sourced terrestrial OM input, in addition to the dominant Tasmanian source. The regional palynology (Truswell, 1997; Macphail, 2000, 2002; Carpenter et al., 2012; Pross et al., 2012; Contreras et al., 2013, 2014), the abundance of peatlands (Holdgate et al., 2009) and the felsic lithology (Moore et al., 2013) suggest the hinterland catchment contained acidic, wet soils and peats.
2.5 Samples
For this study, we used lipid extracts that have been analyzed for GDGTs previously (Bijl et al., 2009; Sluijs et al., 2011; Hollis et al., 2014; Houben et al., 2019). We augmented these with 69 new extracts of sediments from the Maastrichtian and the Paleocene to extend and improve the temporal resolution of the record. Unfortunately, not all archived samples from the PETM interval (Sluijs et al., 2011) could be located, and the interval was reanalyzed in a lower resolution (six samples over the PETM interval). For the remaining PETM, we used the published peak areas (Sluijs et al., 2011) to calculate TEX86, which is warranted given the new analytical technique does not affect isoGDGT peak area ratios (Hopmans et al., 2016). For palynology, we collated and revisited presented data (Brinkhuis et al., 2003; Bijl et al., 2010, 2013b; Sluijs et al., 2011; Houben et al., 2019) and generated higher-resolution data for the Maastrichtian and Paleocene.
3.1 Organic geochemistry
3.1.1 Extraction, column separation and analysis
Earlier work (Bijl et al., 2009, 2010, 2013a; Sluijs et al., 2011; Houben et al., 2019) presented in detail the extraction, Al2O3 column separation and filtering techniques used for the samples. We followed the same procedures for the processing of the new samples. We reanalyzed all available polar fractions using the double-column ultra-high performance liquid chromatography – mass spectrometry (UHPLC-MS) approach as described in Hopmans et al. (2016). In short, processing involved extraction with a Dionex accelerated solvent extractor using dichloromethane : methanol (DCM : MeOH) 9:1 (), column separation of the total lipid extract using solvent mixtures hexane : DCM 9:1 (), hexane : DCM 1:1 () and DCM : MeOH 1:1 () for apolar, ketone and polar fractions, respectively. Polar fractions were filtered using a 0.45 µm polytetrafluorethylene filter and analyzed using an Agilent 1260 Infinity series HPLC system coupled to an Agilent 6130 single-quadrupole mass spectrometer.
3.1.2 Data analysis: indices, overprints
Since the discovery of isoGDGTs as a proxy for SST (see Schouten et al. (2013) for a review), several non-SST effects have been identified that may affect the distribution of isoGDGTs in the sediment. Several indices have been developed to identify most of the known sources of overprints (Table 1). As well as identifying potential overprints, these indices can provide additional paleoenvironmental information.
Table 1Indices from iso- and brGDGTs and brGMGTs. For the chemical structure of these components, see Fig. 3.
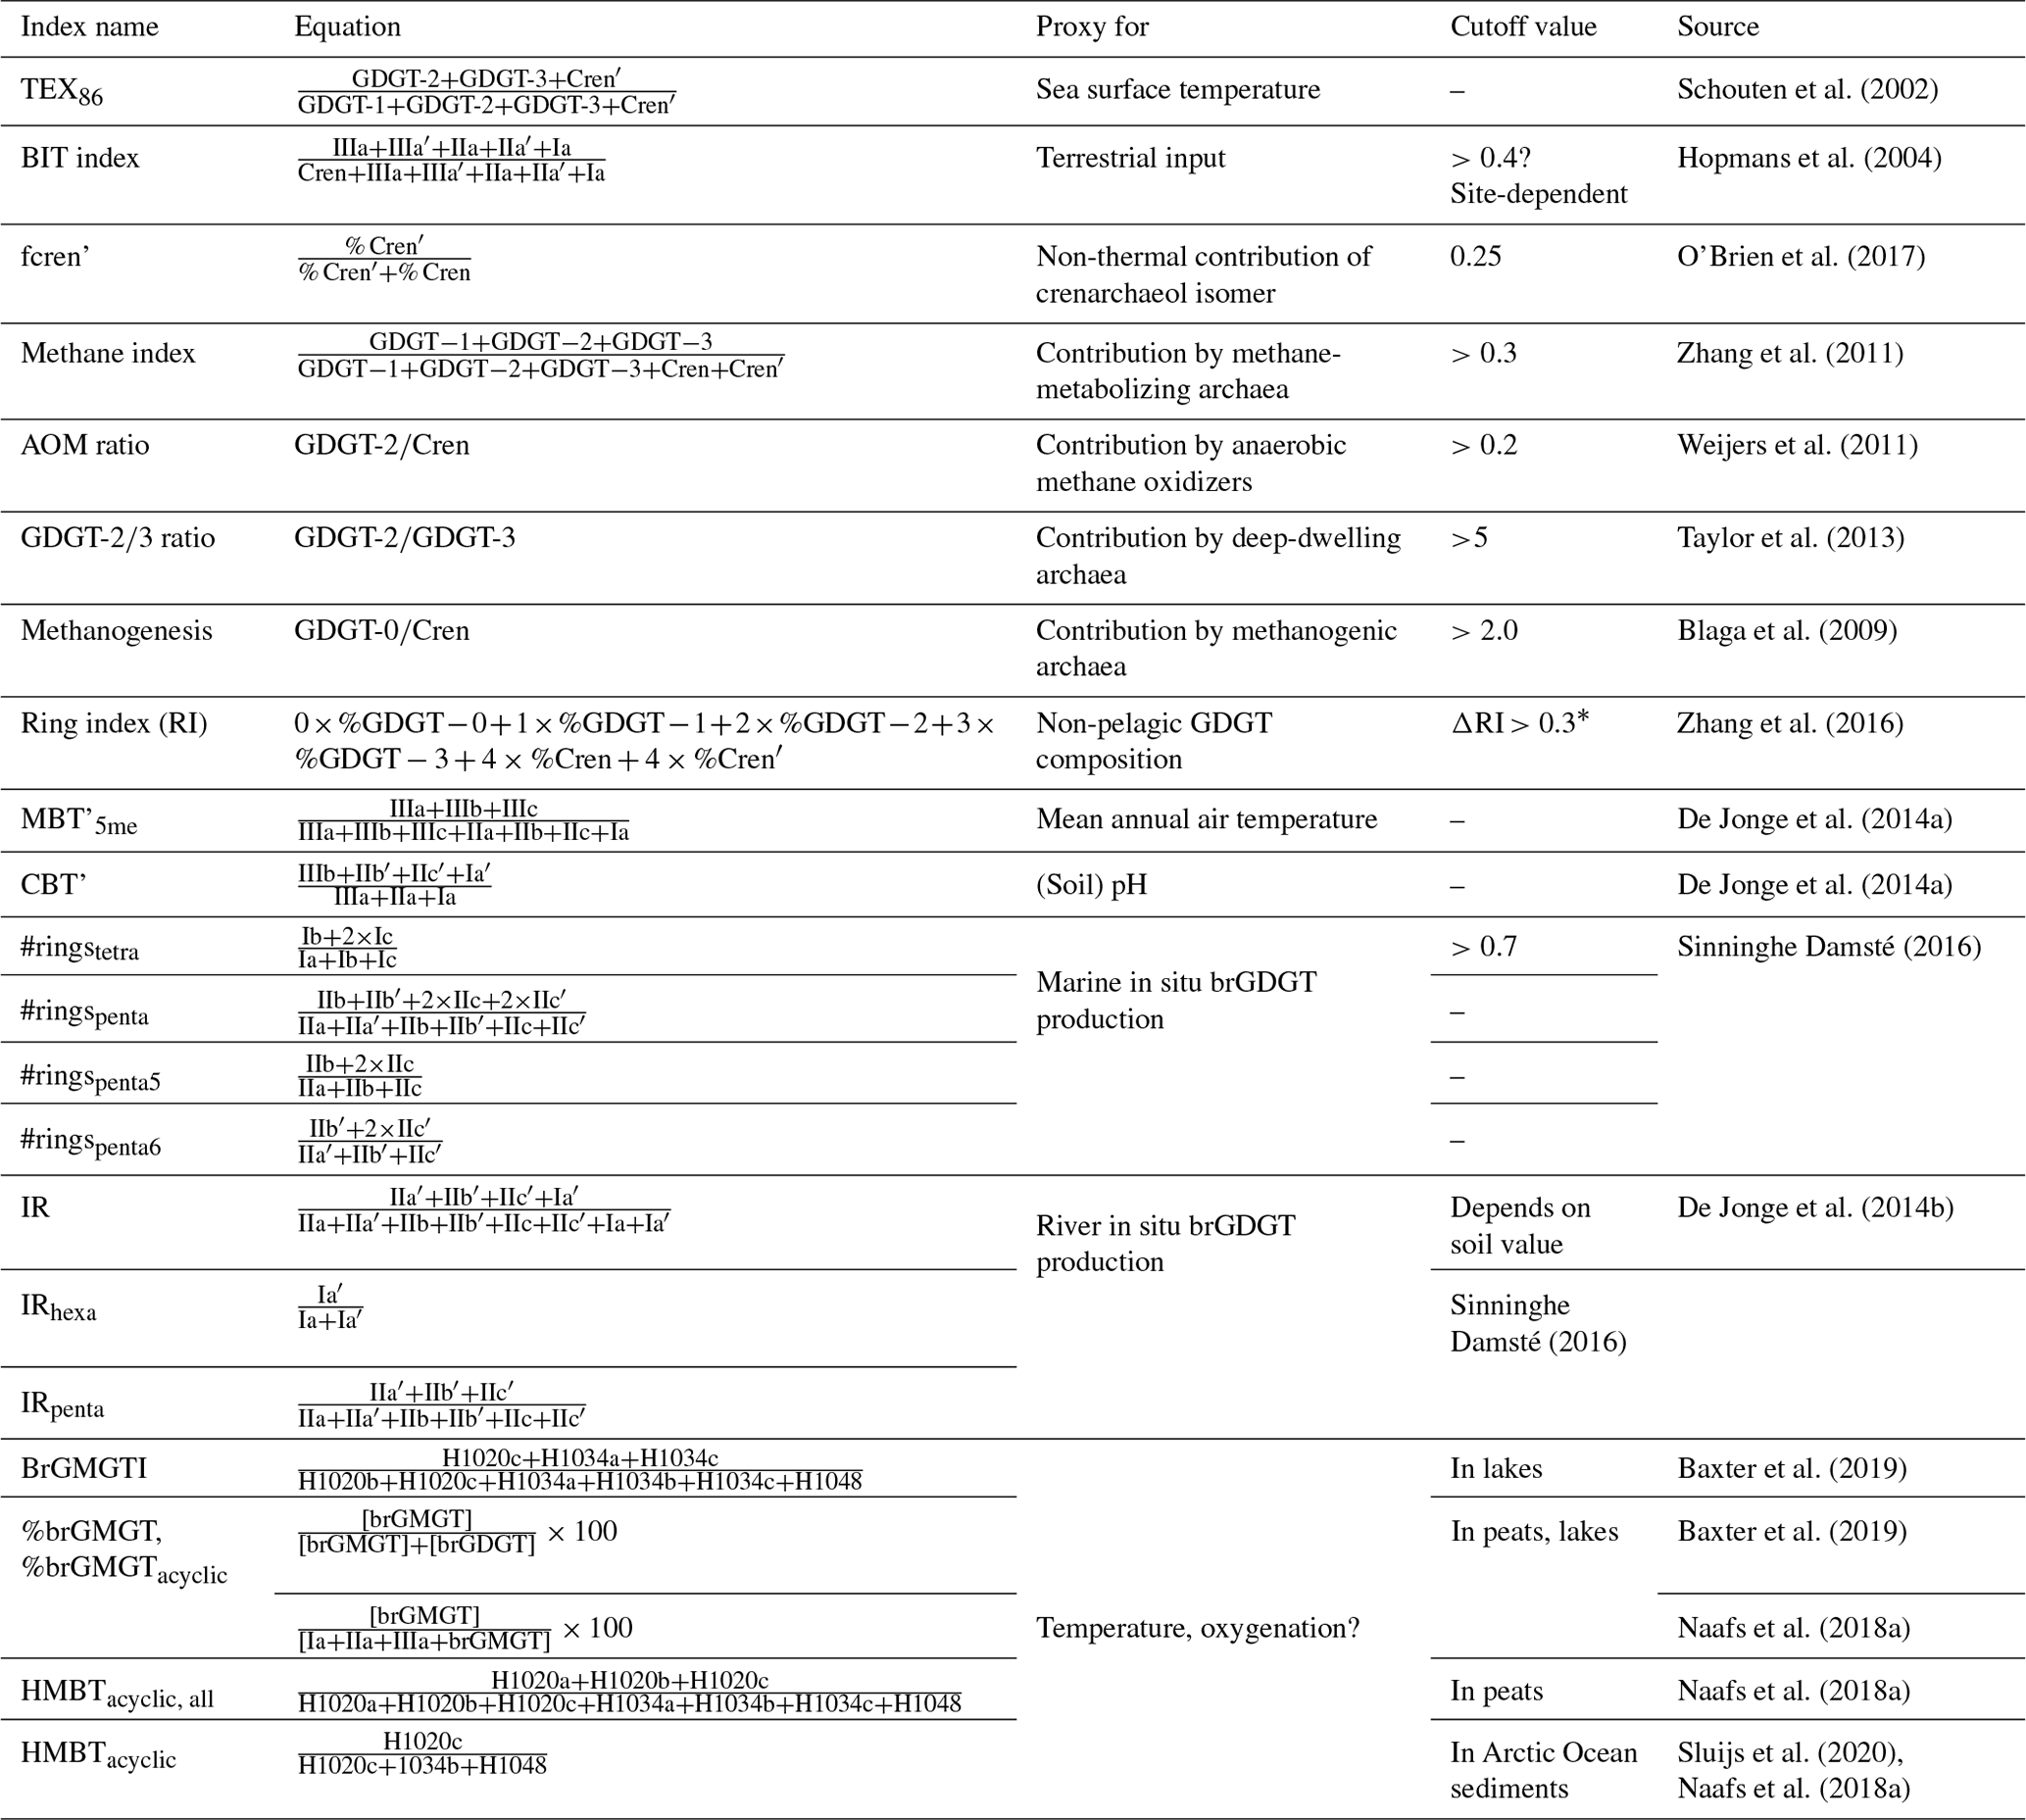
* Cutoff depends on TEX86 value. , where .
All of the ratios that signal biases express the influence of this bias relative to modern “normal” or idealized compositions. For the branched and isoprenoid tetraether (BIT) index, it was proposed that the closed sum ratio between brGDGTs, which were thought to derive exclusively from soils, and the isoGDGT crenarchaeol, which was thought to be produced exclusively by marine archaea, could be an indicator for the relative contribution of soil organic matter (OM) into marine sediments (Hopmans et al., 2004). However, it was subsequently shown that crenarchaeol, but critically also other isoGDGTs, is also produced on land (Weijers et al., 2006), and that a large contribution of soil OM to marine sediments can cause a bias in TEX86. Weijers et al. (2006) used an endmember model to calculate the potential bias in TEX86-based SST reconstructions in the Congo Fan, and this shows significant bias (>2 °C) for BIT above 0.3. However, it is rather arbitrary to assign a cutoff for BIT based on the magnitude of the SST bias alone, as this bias depends primarily on the difference between the isoGDGT composition of the soil and marine endmembers. As a consequence, there is no uniform value for BIT index above which TEX86 should be discarded. Secondly, because the BIT index is a closed sum, the index is equally affected by increased production of crenarchaeol as it is by the input of brGDGTs. Although this could be verified with absolute concentrations of GDGTs, these are not always presented. Third, brGDGTs are produced in situ in the marine realm (Peterse et al., 2009; Sinninghe Damsté, 2016). The corollary of this is that the cutoff value for BIT to infer an overprint in the isoGDGT-based SST signal should be assumed to differ per environmental setting and perhaps also through time if the setting changes significantly (e.g., Sluijs et al., 2020). As a result, cutoffs have been set higher (e.g., 0.4; Bijl et al., 2013a) when no relationship between TEX86 and BIT index values is detected. This approach is also not without complications, because the abundance and composition of isoGDGTs (including crenarchaeol) in soil material varies (Weijers et al., 2006; De Jonge et al., 2015, 2016; Naafs et al., 2019; Sluijs et al., 2020). This implies that for samples with intermediate to high BIT (Weijers et al., 2006), a terrestrially derived isoGDGT contribution with a variable isoGDGT composition or a TEX86 signature close to the original pelagic isoGDGT signal would become undetectable in a TEX86–BIT index cross plot. In some paleoenvironmental settings that evidently lack high input of soil OM, BIT index values are high (Leutert et al., 2020). For reasons given above, this could either mean very low crenarchaeol production in the marine realm or in situ production of brGDGTs. These two scenarios make for a completely different paleoenvironmental interpretation and fail to indicate whether the brGDGTs can be used to reconstruct MAAT of the hinterland, or whether isoGDGTs can be used for reliable paleothermometry. For that, it is important to assess the sources of brGDGTs, as brGDGTs produced in rivers (Zell et al., 2013; De Jonge et al., 2014b) or the (coastal) marine environment (Peterse et al., 2009; Sinninghe Damsté, 2016) may contribute and thereby bias the initial soil-derived brGDGT signal, affecting the reliability of MAAT reconstructions. Fortunately, production of brGDGTs in the marine realm can be recognized based on the weighed number of rings of the tetramethylated brGDGTs, quantified in the #ringstetra, where values >0.7 indicate a purely marine source of the brGDGTs (Sinninghe Damsté, 2016). The #ringstetra in coastal marine sediments can subsequently be used to determine and correct for the contribution of marine brGDGTs to the temperature signal of the soil-derived brGDGTs (Dearing Crampton-Flood et al., 2018). Similarly, brGDGTs that are produced in rivers are characterized by a relatively high abundance of the 6-methyl brGDGTs relative to the 5-methyl brGDGTs, expressed as the isomerization ratio (IR; De Jonge et al., 2014b).
For the other indices for overprints, cutoff values may not be as uniformly applicable to all depositional settings either. Leutert et al. (2020) showed that modern samples exceeding cutoff values for the GDGT ratio and methanogenesis index do not have anomalous TEX86 index values in the modern core-top dataset based on the Ring Index. This suggests that the TEX86 index value is not equally influenced by non-thermal contributions in all depositional settings. As a result, evaluating non-thermal contributions on TEX86 index values should consider the depositional and environmental setting along with the cutoff values.
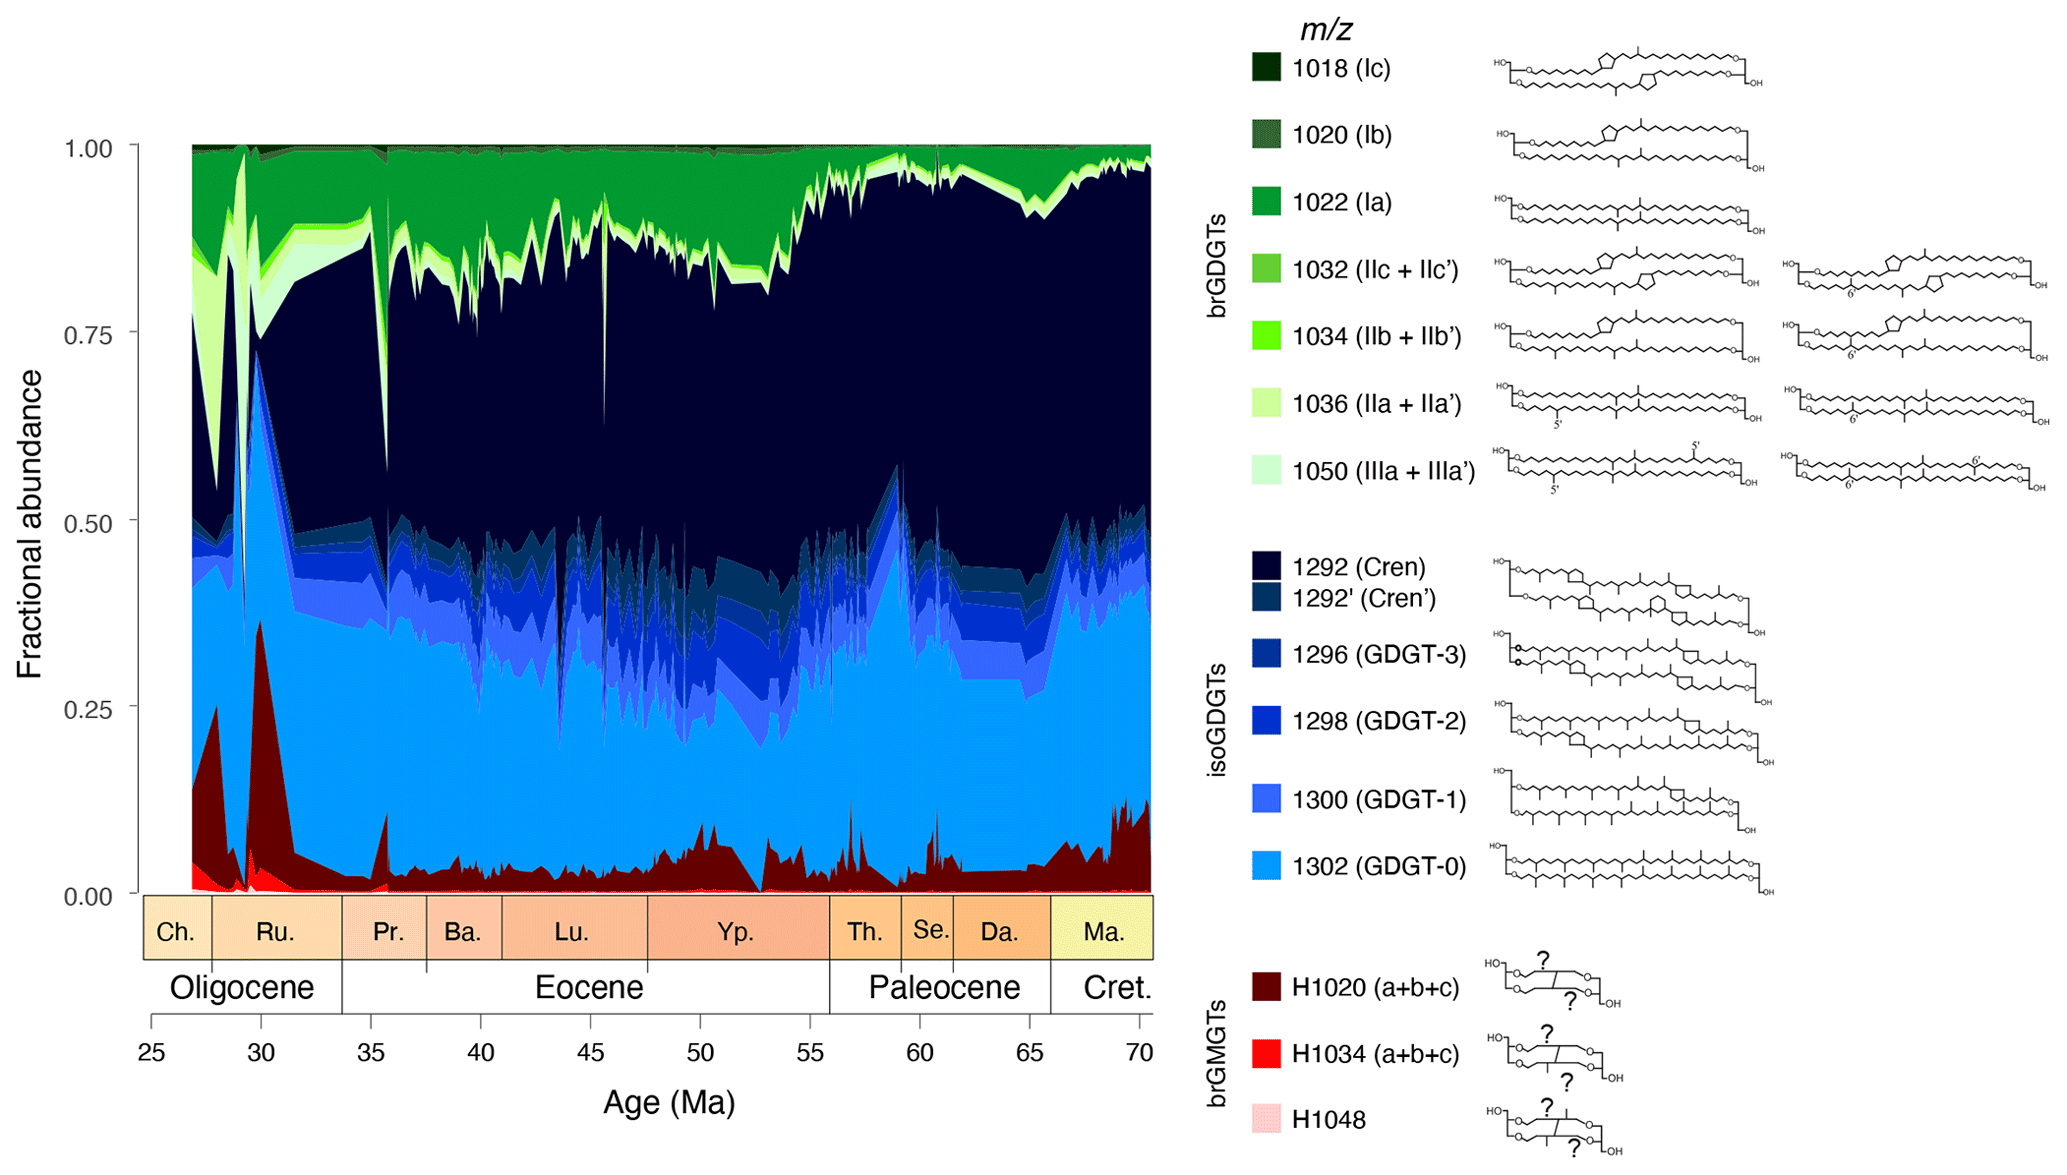
Figure 3Variations in fractional abundances of the various branched (green) and isoprenoid (blue) GDGTs, and branched GMGTs (red) at ODP Site 1172.
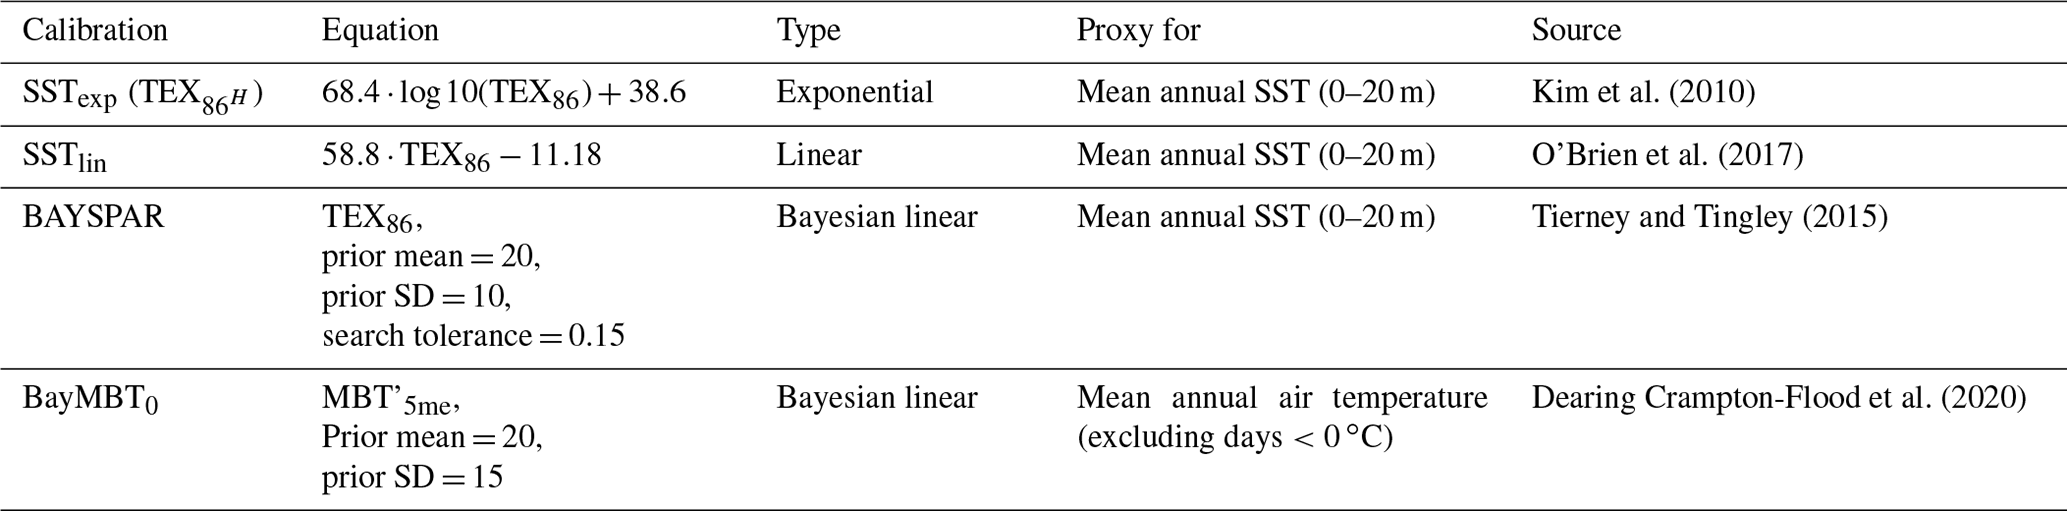
3.1.3 Calibrations for TEX86 and MBT'5me
Several calibrations have been proposed to convert TEX86 index values to sea surface temperatures. For higher temperatures, it remains uncertain if the TEX86–SST relationship is linear or exponential for values above the modern calibration (O'Brien et al., 2017; Tierney et al., 2017; Cramwinckel et al., 2018; Hollis et al., 2019). Following recent recommendations (Hollis et al., 2019), we here apply several calibrations to convert our TEX86 values to SSTs. We apply an exponential calibration (Kim et al., 2010), even though it suffers from a regression dilution bias (Tierney and Tingley, 2015), and two linear calibrations: one on the warm part (>15 °C) of the core-top dataset (O'Brien et al., 2017) and one using Bayesian statistics (BAYSPAR; Tierney and Tingley, 2015) to convert our TEX86 values to SSTs. We chose these calibrations to present the appropriate uncertainty related to calibration function, particularly for TEX86 values exceeding those of the modern core-top data. For MAAT reconstructions, we use the Bayesian BayMBT0 of Dearing Crampton-Flood et al. (2020). We will compare the calibrations for both proxies to middle Eocene U-based SSTs (from Bijl et al., 2010 but using the BAYSPLINE calibration of Tierney and Tingley, 2018) and to Paleocene–early Eocene sporomorph-based MAAT estimates (Contreras et al., 2014) from the same site.
3.1.4 R script for data analysis and evaluation
To facilitate systematic calculation of GDGT ratios, data analysis, visualization and evaluation, we constructed a set of R markdowns (https://github.com/bijlpeter83/RGDGT.git, last access: 10 November 2021) that can be applied to any time or depth series of isoGDGT, brGDGT and/or brGMGT data. The R script loads peak areas of GDGTs/GMGTs from Microsoft Excel spreadsheets, calculates and plots fractional abundances, overprinting indices and paleotemperature time or depth series.
3.2 Palynology
3.2.1 Sample processing
Palynological sample processing techniques were published in the original papers describing these datasets (Brinkhuis et al., 2003; Bijl et al., 2010, 2013b; Sluijs et al., 2011; Houben et al., 2019). We followed the same procedure for the new Maastrichtian–Paleocene samples. These publications do utilize different sieve mesh sizes (10 or 15 µm) but given all counted dinocysts are larger than 15 µm, this has not led to differences in the dinocyst results.
3.2.2 Taxonomy
We used the taxonomic framework cited in Williams et al. (2017), in our counts down to the species level, with one exception. For the Wetzelielloidae subfamily, we follow Bijl et al. (2017), for reasons stated therein. We follow the supra-generic classification of Fensome et al. (1993), also for genera described post-1993.
3.2.3 Ecological affinities of dinocyst eco-groups
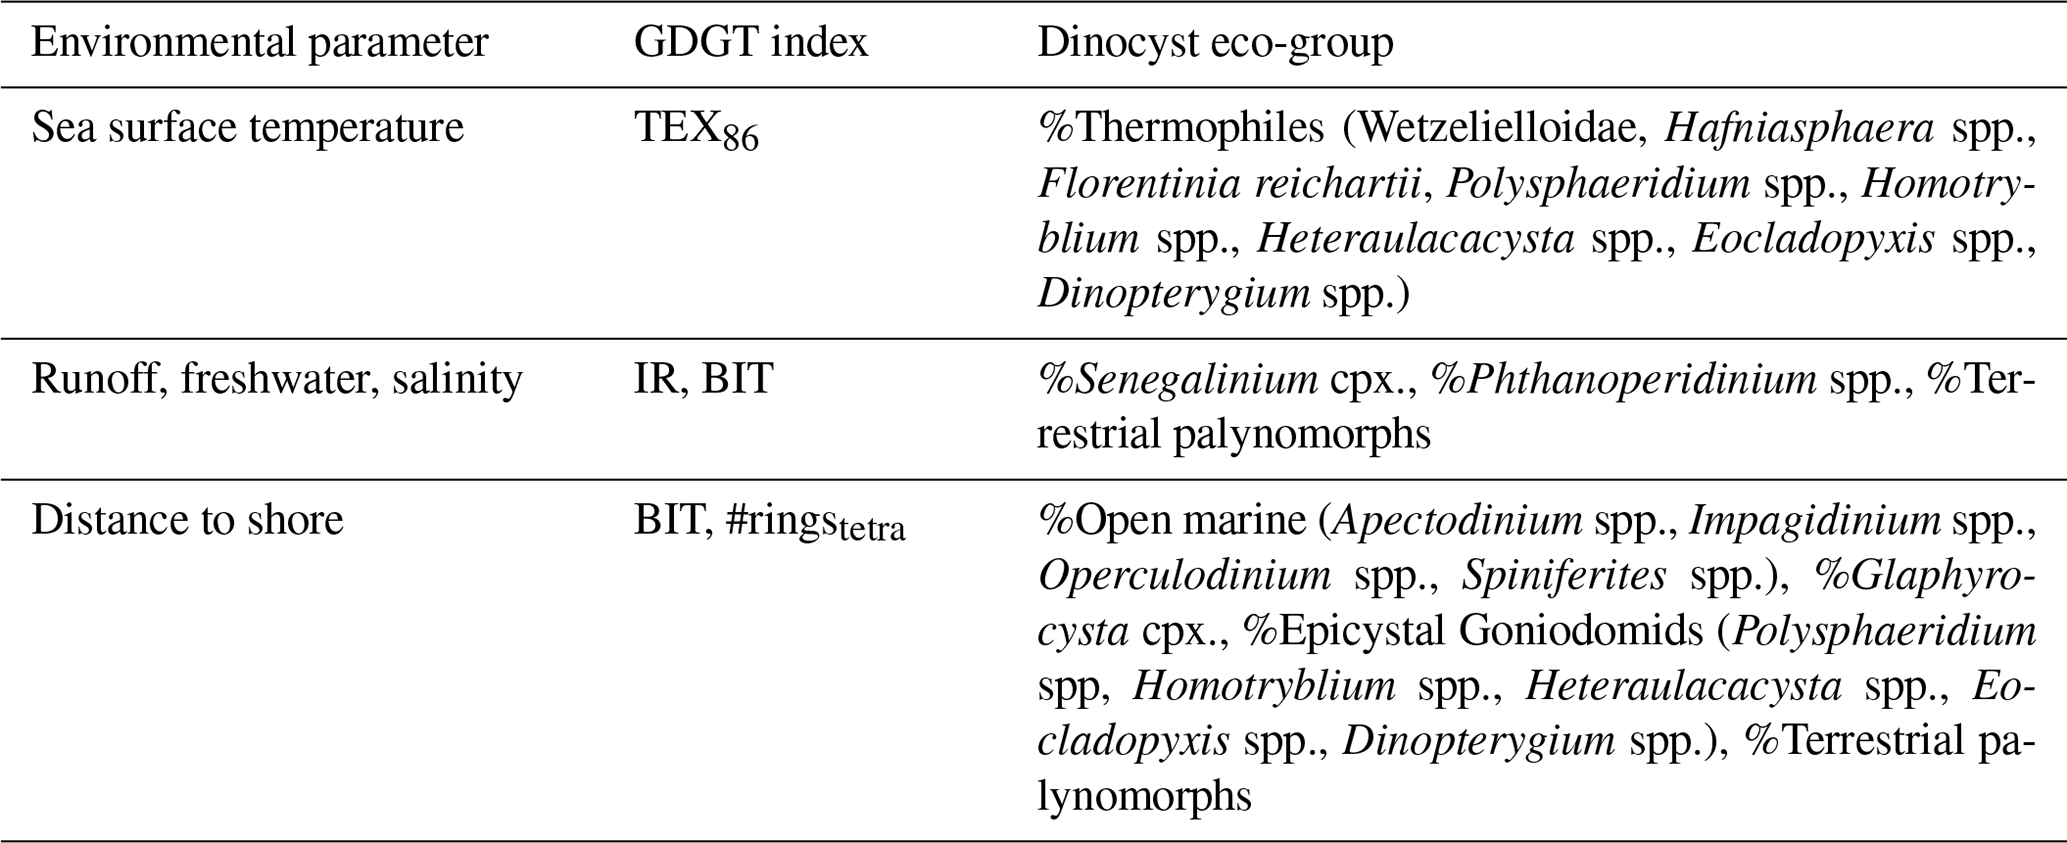
In this paper, dinocysts are plotted in eco-groups and complexes, which group species with similar ecologic affinities based on modern (for extant taxa) and empirical (for extant and extinct taxa) data (Sluijs et al., 2005; Frieling and Sluijs, 2018). The species of which the ecologic affinity was not assessed previously were included into larger groups based on shared morphological characteristics: primarily tabulation, archeopyle and cyst and process shapes. For example, the “Apectodinium complex” is equated to “Wetzellioids” following Frieling et al. (2014; see Table S2 for taxonomic grouping). We directly compare dinocyst and terrestrial palynomorph indices with GDGT-based indices (following the approach of Frieling and Sluijs, 2018) to arrive at multi-proxy reconstructions of SST, river runoff and distance to shore (Table 3). For this, we resampled and binned GDGT-based indices to the sample resolution of the dinocyst data. Some dinocyst groups have affinities for multiple environmental parameters, due to the strong covariance of environmental gradients on an inshore-to-offshore transect. Therefore, the complete dinocyst assemblage (including absence of presence) and knowledge of the geographic setting is used to reconstruct changes in paleoenvironmental conditions from dinocysts.
Table 3Environmental parameters, and their corresponding GDGT indices and dinocyst eco-groups, based on Sluijs et al. (2005), Frieling and Sluijs (2018) and Sluijs and Brinkhuis (2009).
3.2.4 Diversity and variability indices
To gain insight into the diversity and variability of the dinocyst assemblage through time, we employ several indices (Table 4), and compare their results at species and eco-group level. We note that diversity in dinocyst taxonomy is complicated because dinocysts are dominantly produced during the hypnozygotic phase of the dinoflagellate life cycle following sexual reproduction. Only ∼15 % of modern dinoflagellates have this cyst stage (Fensome et al., 1993). This leaves a large proportion of the biological group unrepresented in the fossil record, including, for example, coral and foraminifer symbionts, but also many free-swimming taxa. Dinocyst diversity is therefore a biased indicator for plankton diversity. As a further complication, taxonomic divisions of cysts, although strongly related to dinoflagellate morphology and taxonomy, is fully based on the morphology of dinocysts. Even modern dinoflagellate–dinocyst relationships are often ambiguous. Some dinoflagellate species produce various cyst morphologies (Rochon et al., 2008) that represent multiple cyst genera or species. Some of these cyst morphological variations are the result of ecology (Mertens et al., 2011). This complicates comparing cyst datasets on the species level and affects assessing biological diversity based on cysts. On the genus level, taxonomic division of cysts is in most cases based on plate tabulation, which is the morphologic feature that has the closest relationship to dinoflagellate biological diversity (Fensome et al., 1993). However, ecologic or biogeographic affinities have been established for some dinocysts on a species level (e.g., Frieling and Sluijs, 2018), which does suggest subtle morphological features may have biologic and ecologic significance. The eco-groups we use here are the result of extensive reviews of empirical data. These groups combine dinocyst genera and species with fundamentally similar plate tabulations and thus probably group cysts of closely affiliated biological dinoflagellate species and, as such, also ecologic affinities. For our diversity calculations, we use both the ungrouped data on species level and the diversity in dinocyst eco-groups.
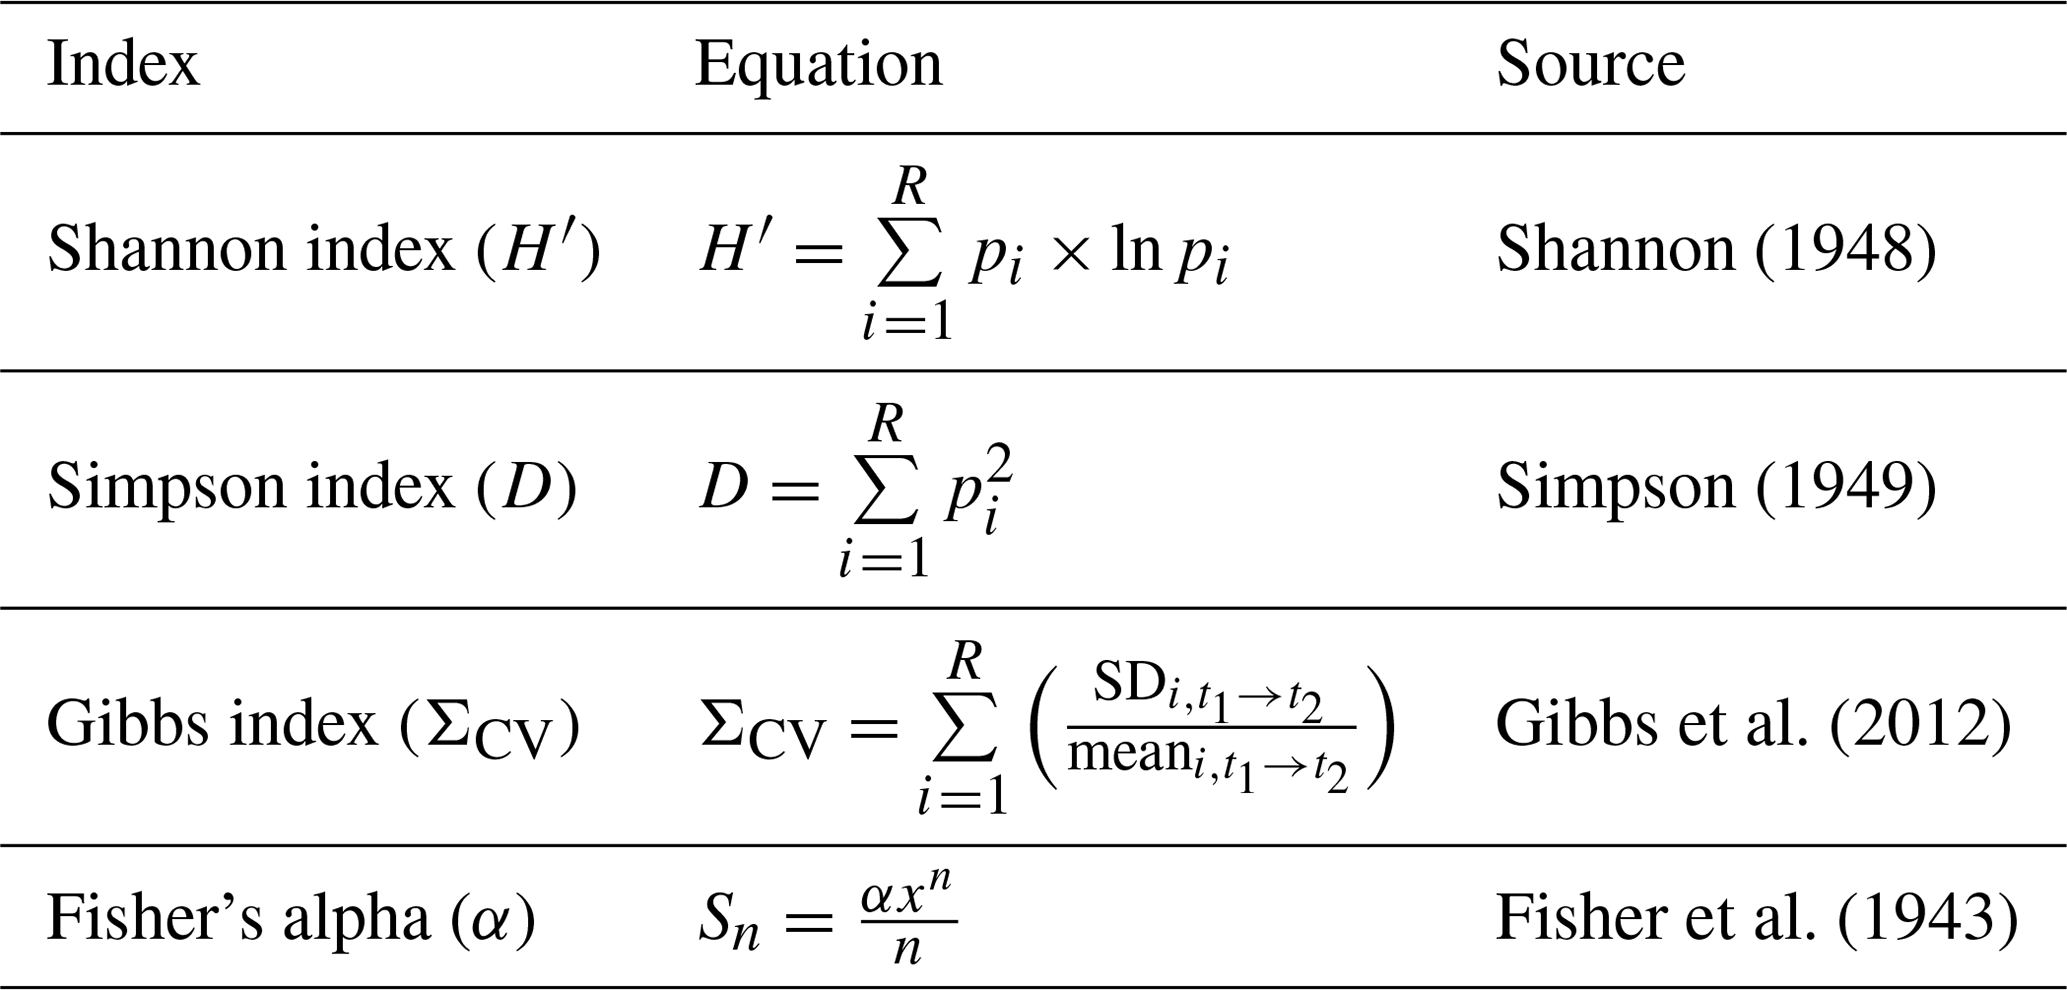
As the simplest approximation of biological diversity, the richness (R) sums dinocyst taxa. Furthermore, several diversity measures were calculated using the R package Vegan (Oksanen et al., 2015): Fisher's alpha (α), Shannon index (H′) and Simpson index (D). Finally, we employed the ΣCV metric (Gibbs et al., 2012), which we here dub the “Gibbs index”, which provides a measure for assemblage variability. Together, these metrics give insight into changing stability and diversity of these regional dinocyst assemblages over the Maastrichtian to early Oligocene.
Table 4Diversity and variability indices for (fossil) assemblages. In the Shannon and Simpson indices, pi represents the proportional abundance of the ith taxon of the total amount of taxa R. The Gibbs index summates the coefficients of variation (SDmean) of all taxa (i to R) over a certain rolling window t1→t2. In Fisher's alpha, the α parameter is estimated from the dataset in which S is the expected number of species with an abundance of n. x represents a nuisance parameter estimated from the dataset, generally between 0.9 and 1. While the Gibbs index is calculated over a rolling window, the other indices are calculated per sample.
3.3 Comparison of GDGT and dinocyst assemblage data
Both dinocyst eco-groups and GDGT indices bear information on SST, runoff (∼ salinity), nutrients and marine primary productivity, and relative distance to shore (Table 4). As dinocyst and GDGT analyses were performed on partly separate datasets, the highest resolution dataset (dinocysts) was linearly resampled to the depth intervals of the GDGT data to facilitate intercomparison.
4.1 GDGTs
The resulting dataset has an average temporal resolution of ∼ 130 kyr for the time interval between 70 and 30 Ma. IsoGDGTs dominate the pool of GDGTs (particularly GDGT-0 and crenarchaeol), with a gradual increasing relative abundance of brGDGTs (particularly Ia) throughout the record (Fig. 3). BrGMGTs are in low (<10 %) relative abundance, except in the Oligocene, where they account for up to 30 % of the total pool of tetraether lipids.
4.1.1 Isoprenoidal GDGTs
Before the TEX86 index results (Fig. 4a) can be interpreted in terms of SST, we assess whether the isoGDGTs are primarily derived from the sea surface or have received contributions from non-pelagic sources. Across the Ypresian, the BIT index (Fig. 4b) increases from values around 0.1 in the underlying sediments to values at times exceeding 0.4. Most EECO and middle Eocene values, however, have BIT index values between 0.2 and 0.35. The remaining sediments have BIT index values of around 0.3, with the exception of some upper Eocene and Oligocene sediments that occasionally have values around 0.75. There is no correlation between TEX86 and BIT index in our entire dataset (R2=0.0067; p=0.15). None of the samples have fcren' (Fig. 4c) values above the cutoff of 0.25, which excludes non-thermal contributions of the crenarchaeol isomer to the isoGDGTs. In fact, the consistent trend in fcren' and the TEX86 (Fig. 4) demonstrates the temperature sensitivity of cren'. With the exception of six samples in the Oligocene, all samples have methane index values below the conservative cutoff value of 0.3 (Fig. 4d), although in the early and middle Eocene, methane index values do approach the cutoff. AOM ratio values suggest an overprint from anaerobic methane oxidizers in one sample in the early Eocene that also has a high BIT index and five samples from the Oligocene where isoGDGTs supposedly received a contribution of anaerobic methane oxidizers (Fig. 4e). As a result, these samples were not used for SST reconstruction.
Values signalling a deeper water column overprint (GDGT- ratio) fall below 5 for most of the data (Fig. 4f), which was expected given the depositional setting on a continental shelf. A total of five samples have GDGT- values exceeding 5, four of which also had other indications of overprinted isoGDGT signals. We discard eight TEX86 data points because GDGT-0crenarchaeol ratios are above 2 (Fig. 4g). One of these is from the PETM, with a value just above the cutoff. The others represent Oligocene samples.
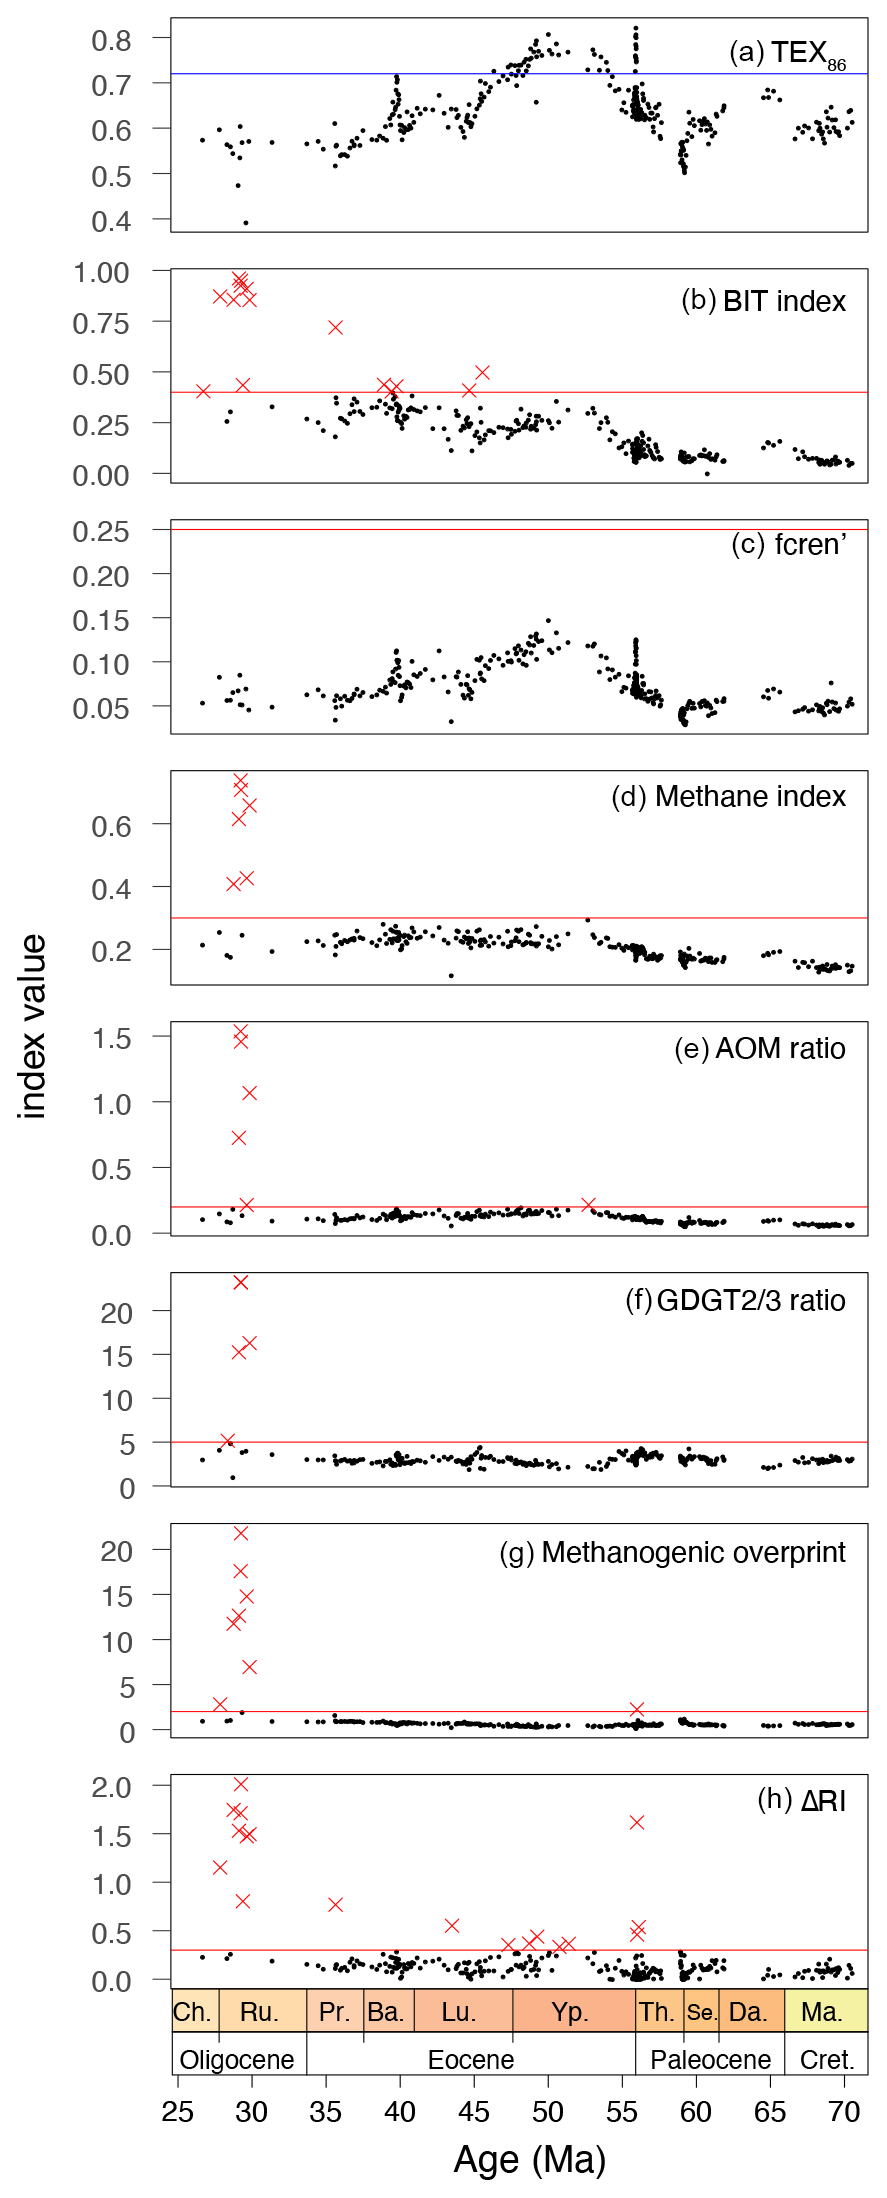
Figure 4TEX86 index and indices to identify overprints. For the equations of these indices, see Table 1. The red line indicates the cutoff value; red crosses indicate samples exceed the cutoff (a) TEX86 (Schouten et al., 2002), with the blue line indicating the maximum modern core-top value (∼ 0.72). (b) BIT index (Hopmans et al., 2004). (c) fcren' (O'Brien et al., 2017), no samples discarded. (d) Methane index (Zhang et al., 2011), ndiscarded=6. (e) AOM ratio (Weijers et al., 2011), ndiscarded=6. (f) GDGT- (Taylor et al., 2013), conservative cutoff of 5, ndiscarded=4, one sample retained for absence of anomalous Ring index values (see text). (g) Methanogenesis (Blaga et al., 2009), cutoff of 2.0, ndiscarded=8. (h) ΔRI ndiscarded=18.
In total, 18 samples fall outside the range of RI values that characterize modern pelagic-derived isoGDGT compositions (ΔRI>0.3; Fig. 4h, or 95 % confidence interval; Fig. 5). Nine of these 18 come from the interval >43 Ma and have no other indications of overprints. These samples fall just outside the 95 % confidence interval limits (Fig. 5) and do follow the overall RITEX86 trend, but here we discard them to be conservative. The other nine samples with too-high ΔRI come from the late Eocene–Oligocene and have BIT index values over 0.4. Two of these samples have no other overprint indication; the other seven have multiple other overprints. One sample has RI values above the range of modern samples (with no other overprinting indications); the others have too-low RI values. Eight samples with normal RI values do have overprints based on the other indices: BIT index values slightly over 0.4 (six samples), GDGT- ratio values over 5 (one sample), and AOM ratio over 0.2 (one sample). Following Leutert et al. (2020), we retained the samples with normal RI values and high BIT or GDGT- ratio values. After considering all these potential biases, and retaining those with normal isoGDGT distributions, we discard a total of 19 samples. Most discarded samples are from the Oligocene and are excluded based on multiple overprint criteria.
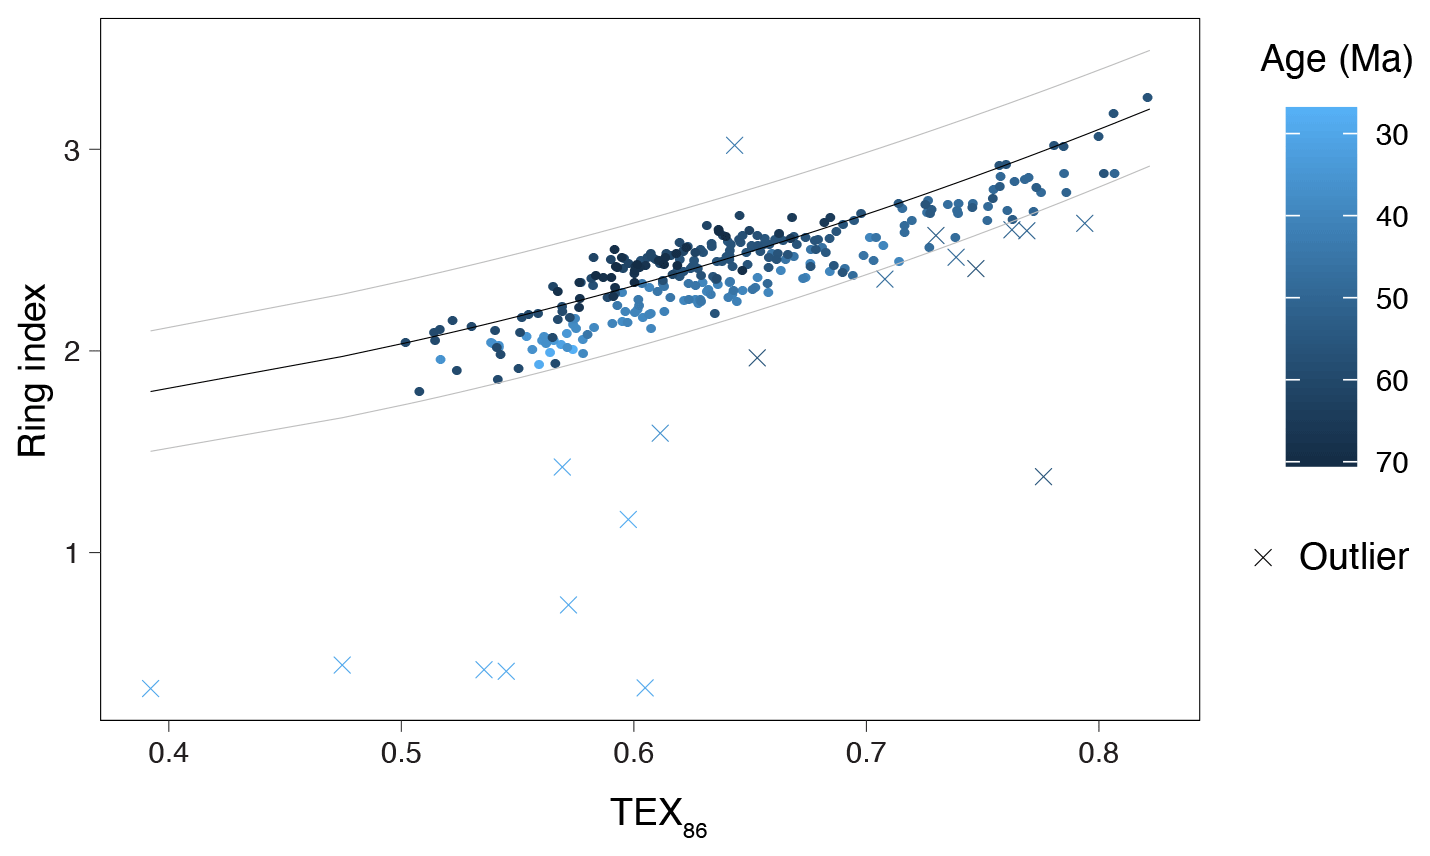
Figure 5Ring index (RI) vs. TEX86. Dots indicate RITEX86 values for samples that are retained; crosses indicate samples that are discarded (see Fig. 4). Color of all data points indicates age of the sample, from Maastrichtian (dark blue) to Oligocene (light blue). Black and gray curves represent the RITEX86 ratio in modern core-top samples and the 95 % confidence interval, respectively (see Table 1).
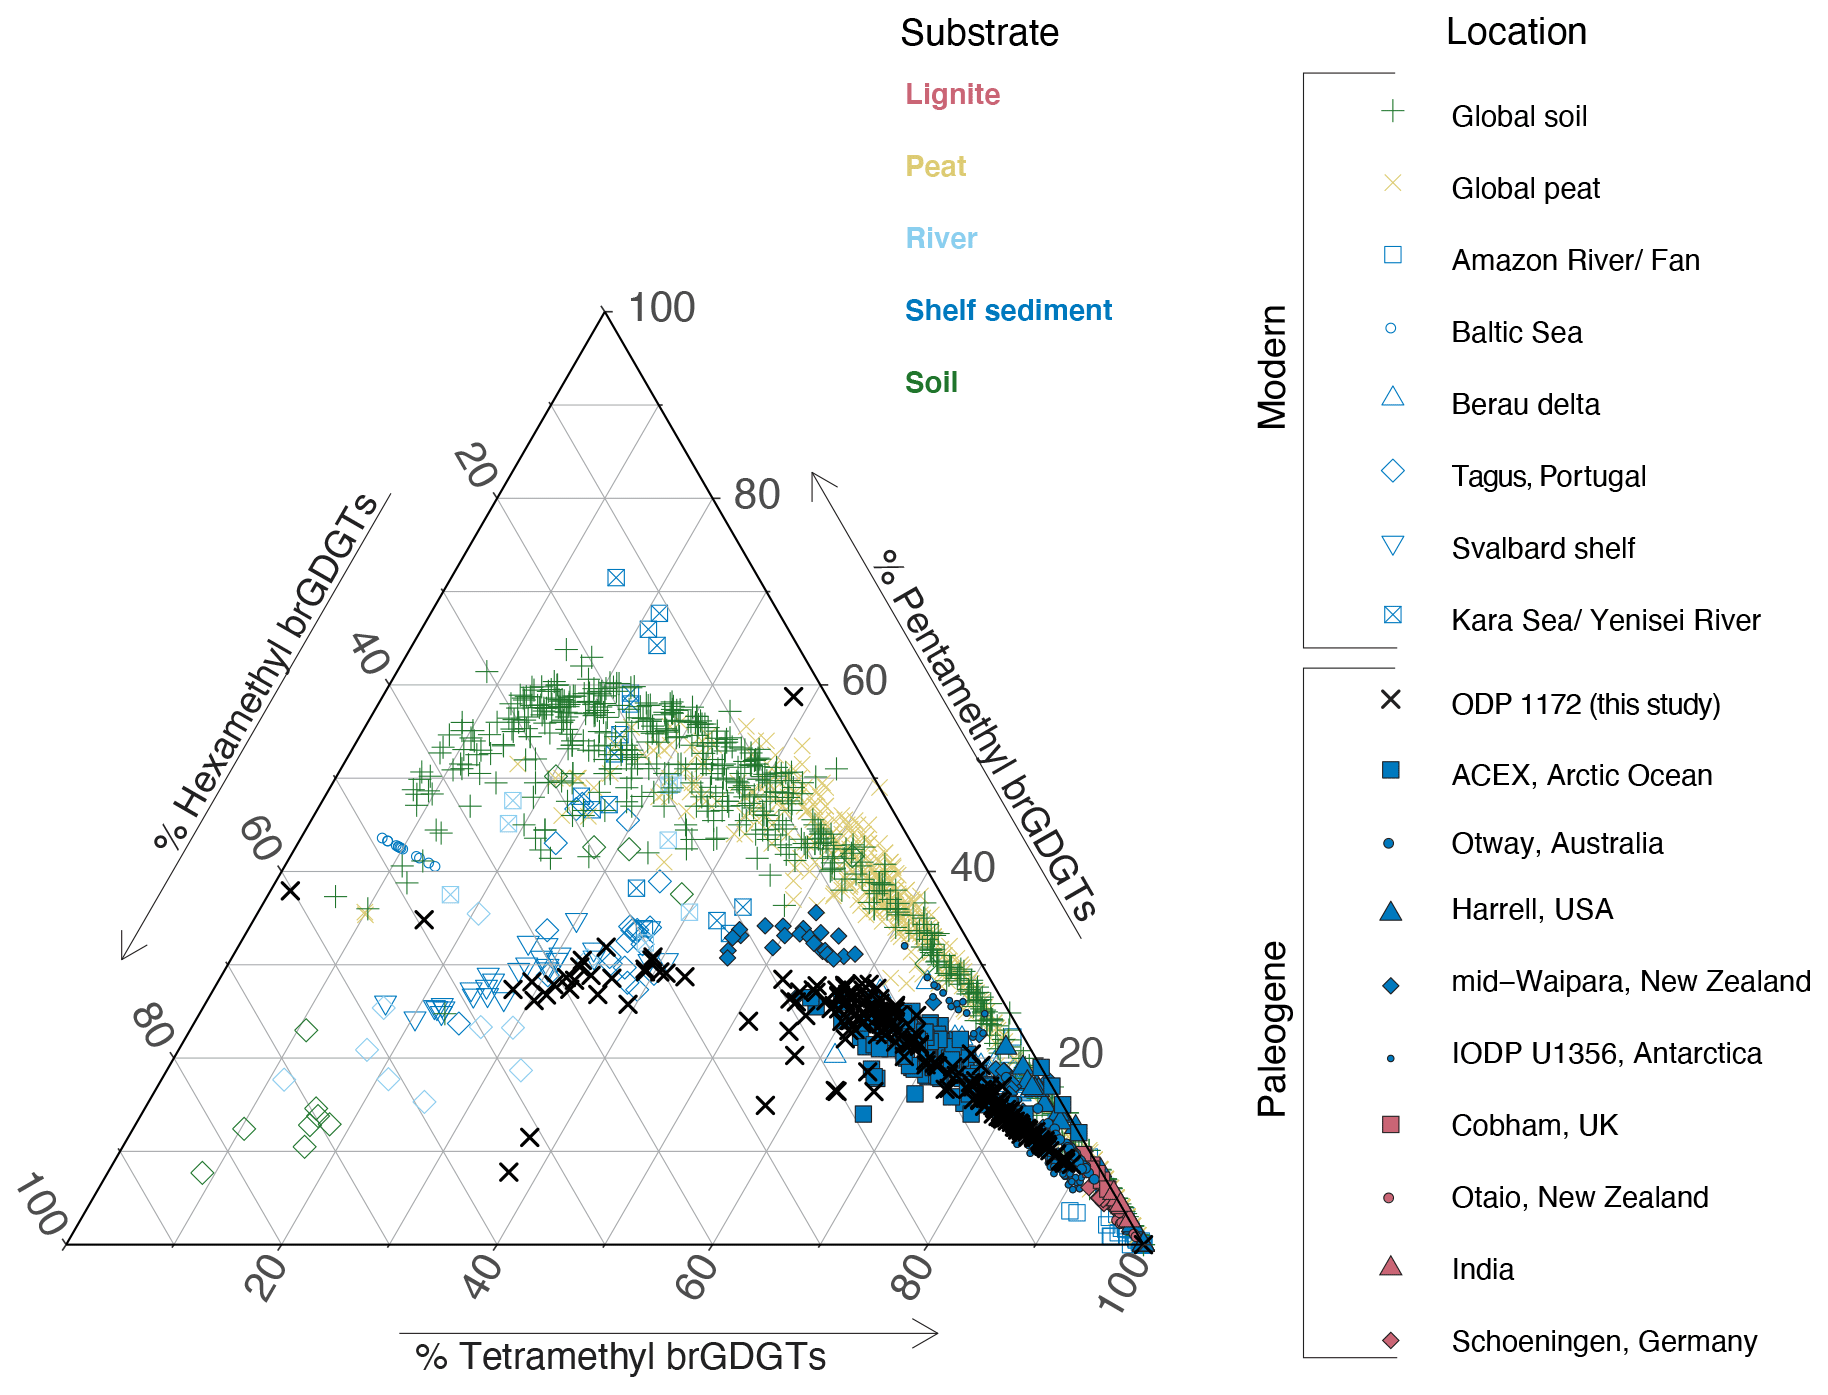
Figure 6Ternary diagram showing fractional abundance of tetra-, penta- and hexamethylated brGDGTs from modern soils (Dearing Crampton-Flood et al., 2020), peats (Naafs et al., 2017b), rivers (Tagus River, Portugal (Warden et al., 2016) and Yenisei River (De Jonge et al., 2015)) and marine sediments (Kara Sea (De Jonge et al., 2015), Svalbard (Dearing Crampton-Flood et al., 2019), Berau Delta (Sinninghe Damsté, 2016), Portugal (Warden et al., 2016), Baltic Sea (Warden et al., 2018), and Amazon Fan (Zell et al., 2014)), Paleogene lignites (Cobham, Schöningen, India and Otaio (Naafs et al., 2018b)) and Paleogene marine sediments (Arctic Ocean, International Ocean Discovery Program (IODP) Arctic Coring Expedition (ACEX) (Willard et al., 2019), Otway Basin, Australia (Huurdeman et al., 2020), Gulf of Mexico coastal plain, Harrel core (Sluijs et al., 2014), New Zealand (Pancost et al., 2013) and Antarctic Margin IODP Site U1356 (Bijl et al., 2013a)). Data from ODP Site 1172 are indicated by black crosses.
4.1.2 Branched GDGTs
Before brGDGT distributions can be interpreted in terms of air temperature, we assess whether they are primarily derived from soils or have received contributions from river or marine in situ production. The relative abundance of tetra-, penta- and hexamethylated brGDGTs in the samples from Site 1172 deviates from that in modern and Paleogene soils and peats (Fig. 6): it has either comparatively less tetra-, less penta- or more hexamethylated brGDGTs, and the data split into two clusters. The largest cluster follows the distribution observed in modern soils and peats with an offset (Fig. 6).
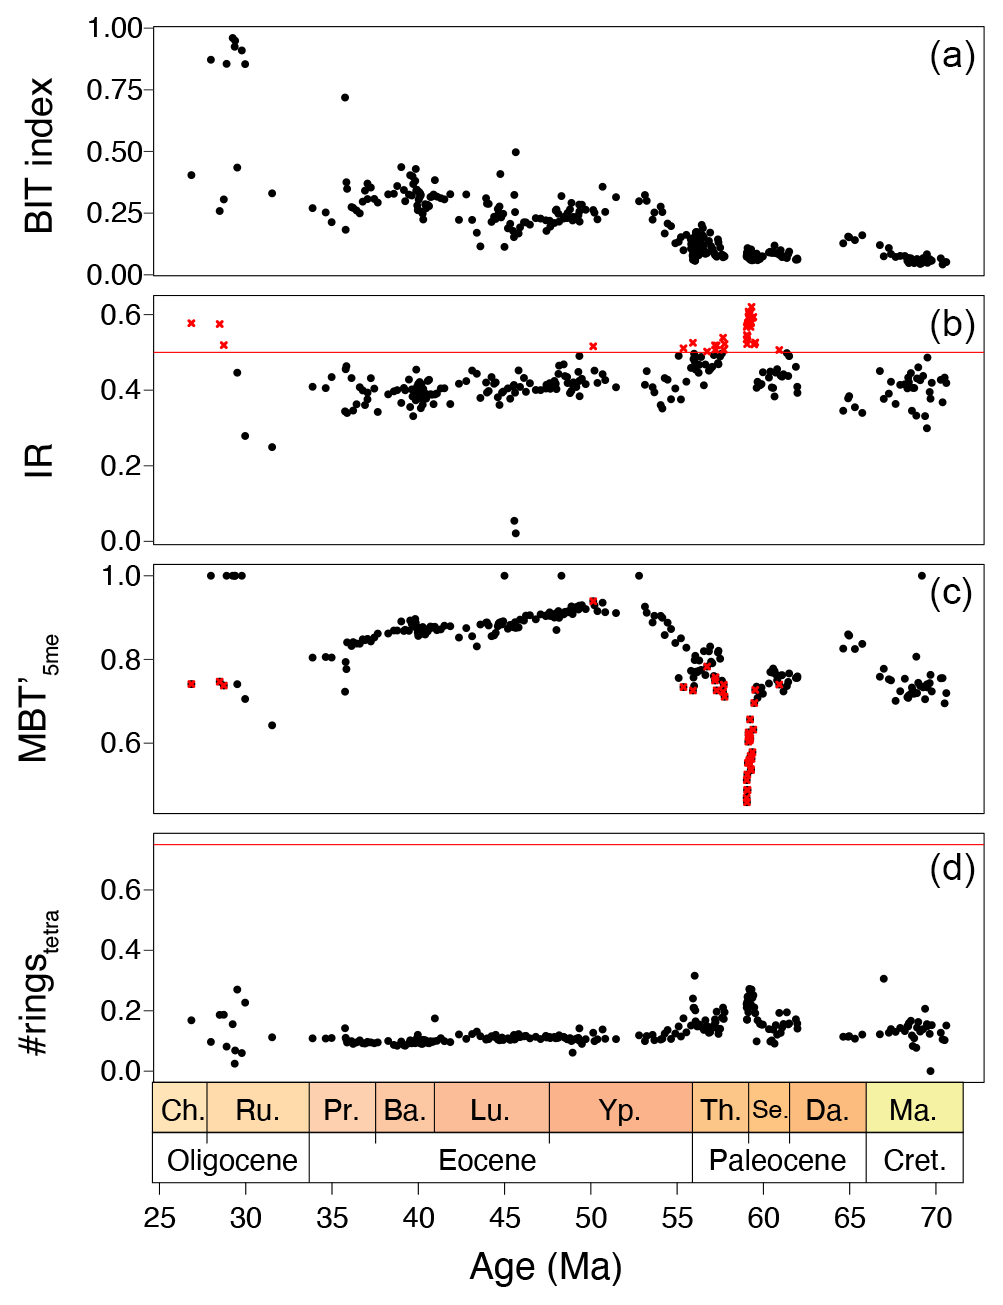
Figure 7(a) BIT index, (b) IR (with cutoff value of the Australian soil IR of 0.5 and discarded MAAT samples in red crosses), (c) MBT'5me and (d) #ringstetra from Site 1172.
This generally indicates brGDGT contributions from sources other than soils. The smaller second cluster, containing exclusively mid-to-late Paleocene samples, is indeed close to that of modern continental shelf sediments (Berau delta and Svalbard; Sinninghe Damsté, 2016; Dearing Crampton-Flood et al., 2019) for which in situ brGDGT production substantially exceeds soil contributions. This would generally suggest that the smaller cluster, and perhaps also the larger cluster of samples, have contributions from marine in situ brGDGT production. However, unlike those modern marine sediments, our entire record does not show elevated #ringstetra values that are associated to marine in situ produced brGDGTs (Fig. 7). Instead, the low #ringstetra values on our record (<0.3) suggest that brGDGTs have a terrestrial source. In the modern soil and peat brGDGT dataset, #ringspenta and #ringstetra follow a coherent 1:1 correlation (Fig. 8a). At Site 1172, however, #ringstetra is below 0.3, whereas #ringspenta ranges up to 0.6. This diverts from the 1:1 line but brings the brGDGT dataset from Site 1172 within the area of other Paleogene marine brGDGT datasets (Fig. 8a). This is consistent with the relative abundances of tetra-, penta- and hexamethylated brGDGTs plotted in the ternary diagram, where all Paleogene data plotted offset those in modern soils. #ringstetra and #ringspenta for the 5- (Fig. 8b) and 6-methyl brGDGTs (Fig. 8c) separately shows that the diversion of the 1172 data from modern soils and peats is primarily caused by a larger degree of cyclization of the 6-methyl brGDGTs.
The samples within the Paleocene cluster have relatively high IR. The IR in our record averages ∼ 0.4 but is elevated between 62 and 54 Ma, with peak values in the mid-Paleocene up to 0.6 (Fig. 7). Although both the IRpenta and IRhexa are well within the range of the modern soil and peat data (Fig. 8d), they exceed the two available data points from modern southeast Australian soils, which have IR values of maximum 0.5 (De Jonge et al., 2014a), suggesting a contribution by non-soil sources (be it marine or river in situ production; De Jonge et al., 2014a). Given that the relatively low #ringstetra values argue against a large contribution from marine in situ production, we suggest that river-produced 6-methyl brGDGTs have contributed to the GDGT pool in the Paleocene samples with high IR. Therefore, for MBT'5me calculation, we eliminate all brGDGT samples in our record that have IR values above that of Australian soils.
Finally, the consistent offset in brGDGT composition in Paleogene marine sediments relative to modern soils can potentially be explained by non-soil contributions even though many (most) indices suggest soil-dominated sourcing. Notably, not only Paleogene marine sediments from Site 1172 are offset from present-day soils, but this extends to other sites as well, including Paleogene lignites that are not influenced by marine contributions. We suggest that there may be an additional evolutionary or bacterial community factor that is at least in part responsible for the observed offset brGDGT distributions during the Paleogene. Except where indices suggest non-soil contributions, Paleogene marine sediments may contain a dominant soil-derived brGDGT signal in spite of their offset composition.
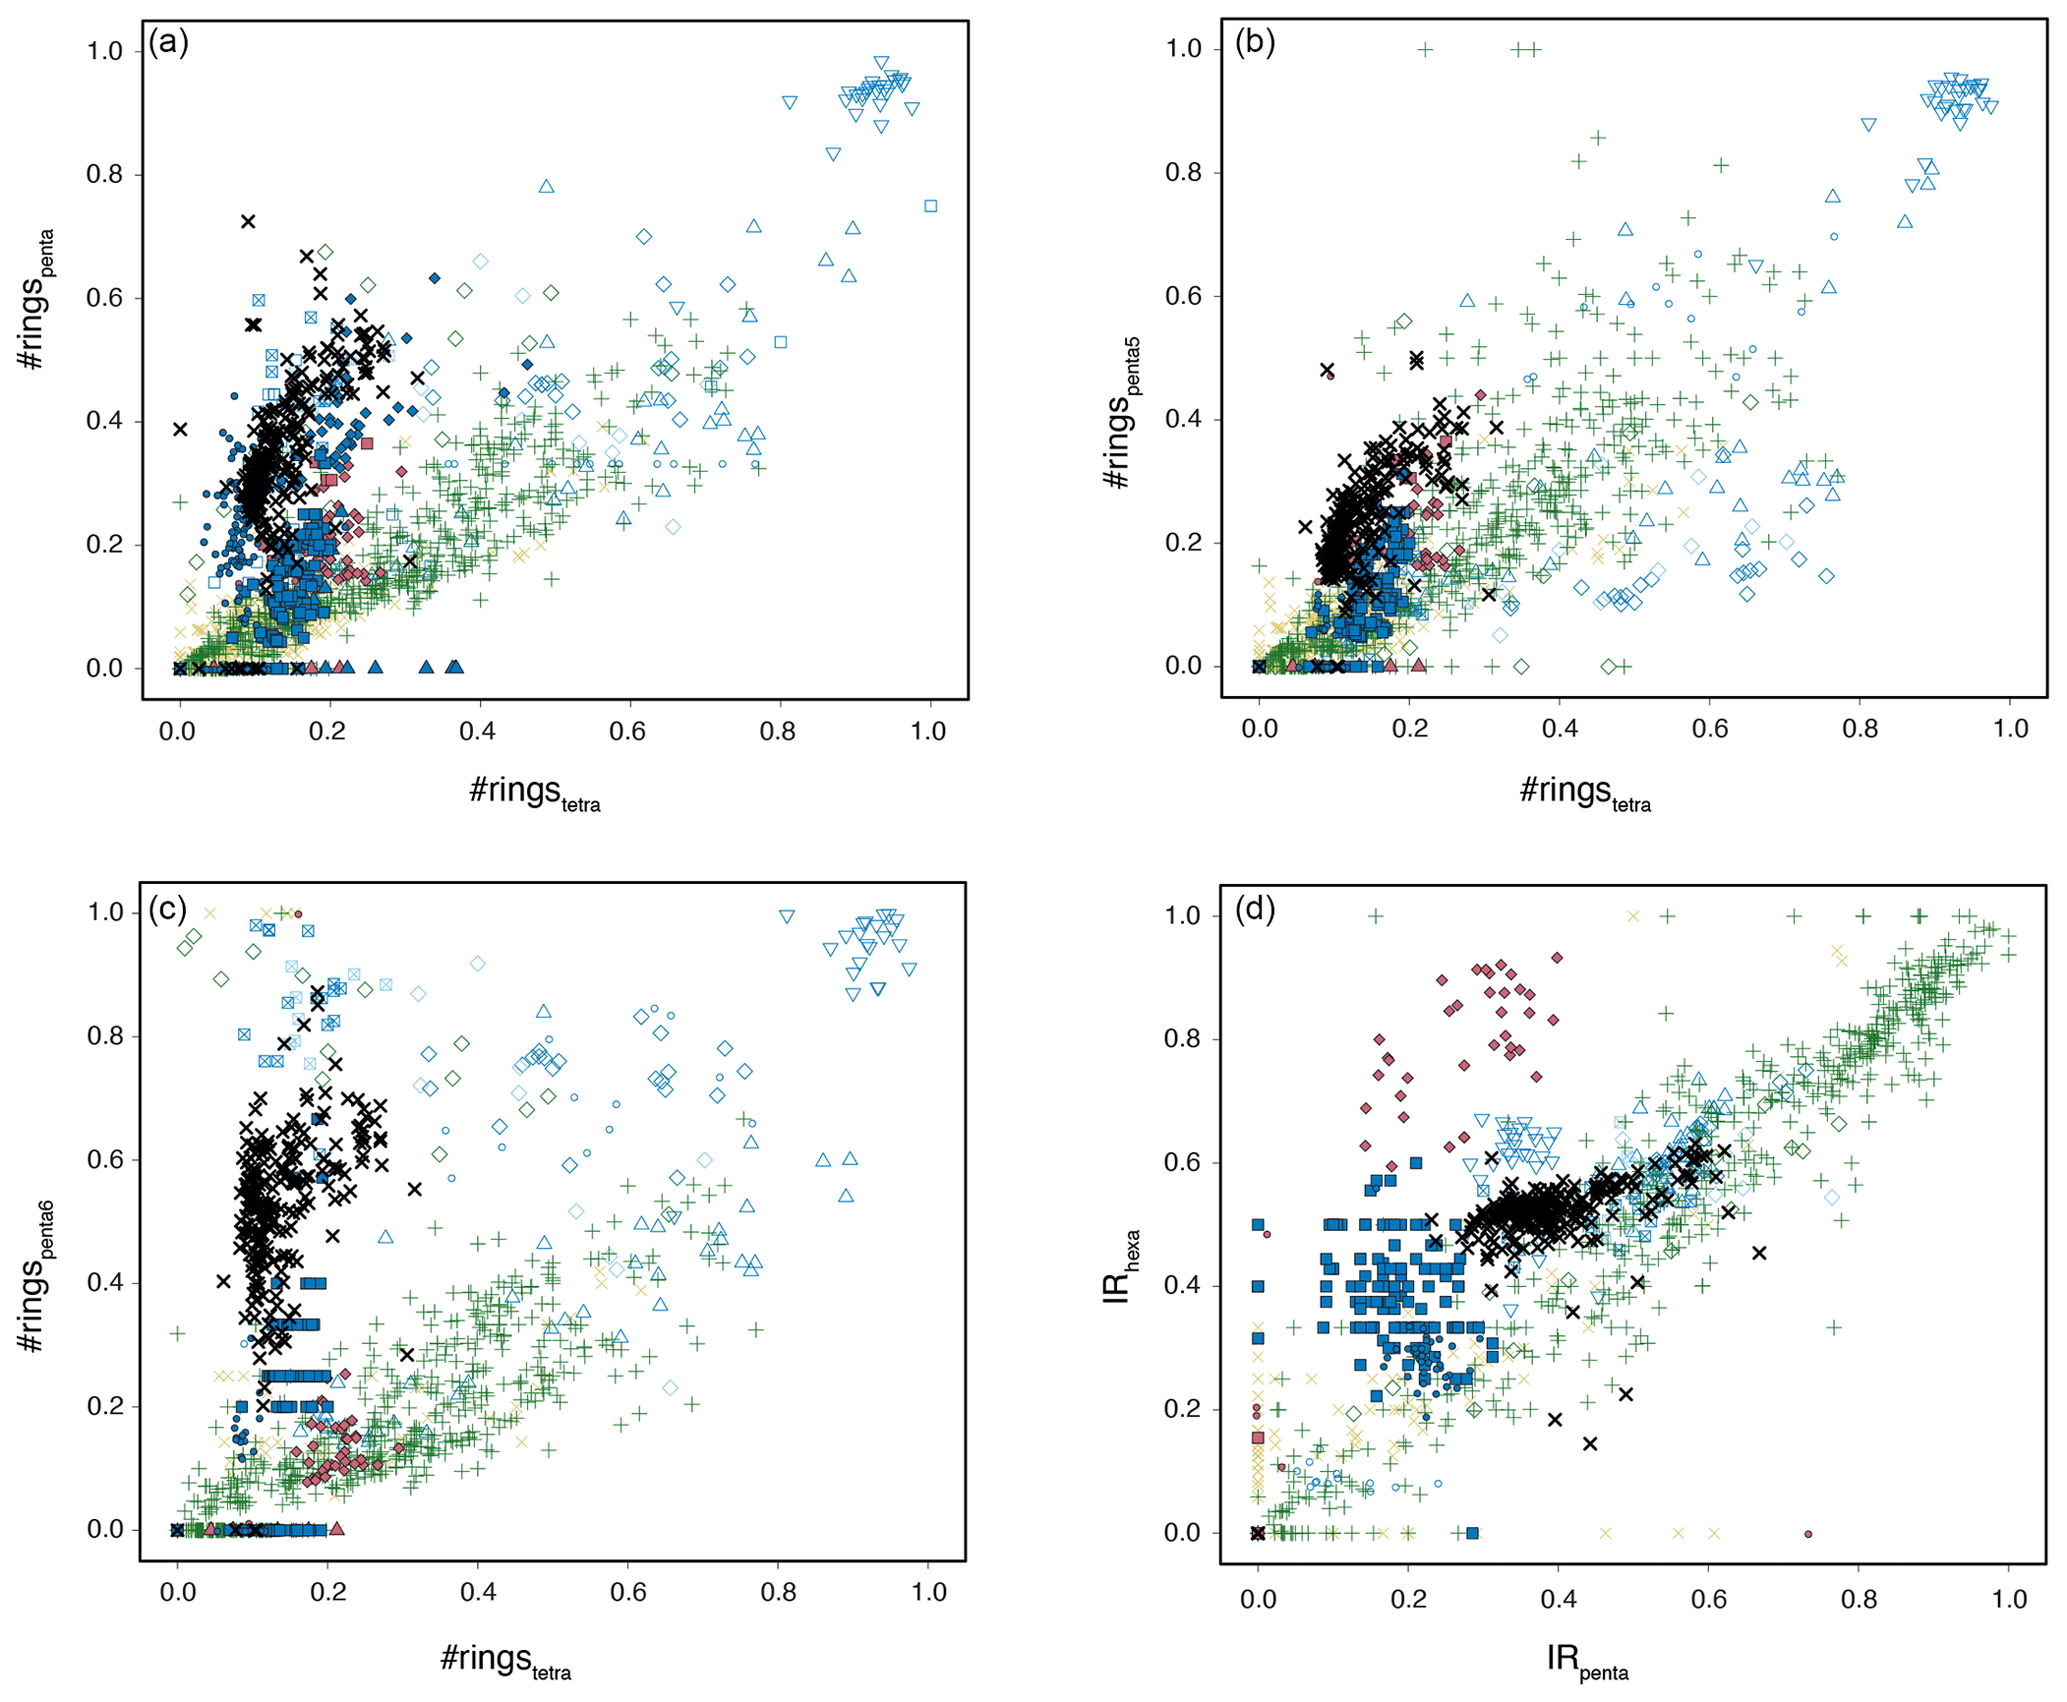
Figure 8Cross plots of various brGDGT indices. (a) #ringstetra vs. #ringspenta, #ringstetra vs. #ringspenta5, #ringstetra vs. #ringspenta6, IRpenta vs. IRhexa. For the color and symbol legend, see Fig. 6.
4.2 SST and MAAT reconstructions
4.2.1 SST
By removing all samples with potential overprint from the record, we can now assess the trends in TEX86-based SST (Fig. 9a). Reconstructed SSTs differ by up to 4 °C between the exponential SSTexp and the linear SSTlin calibration in the warmest intervals, and progressively less with lower SSTs (Fig. 9a). The BAYSPAR method, which uses a linear relation between SST and TEX86 yields the lowest SSTs for the low TEX86 values in the Maastrichtian, Paleocene and middle–late Eocene, and SSTs between those based on the linear and exponential calibrations for the highest TEX86 index values (Fig. 9a). U-based SSTs (Bijl et al., 2010, with BAYSPLINE calibration) around the MECO are in best agreement with the high SSTs derived from the linear TEXOBL calibration, although in this TEX86 range all calibrations yield SSTs within error (Fig. 9a).
In general, Maastrichtian (70.5–66.7 Ma) SSTs show a gradual cooling trend towards the late Maastrichtian–early Danian hiatus of ∼ 800 kyr. The early Danian (∼ 65 Ma) is roughly 3 °C warmer than the late Maastrichtian (∼ 67 Ma). The mid-Paleocene (62–59 Ma) shows two cooling steps: a ∼ 2 °C cooling at 62 Ma, followed by a return to higher SSTs roughly at 60 Ma, and a ∼ 5 °C cooling to minimum values of around 18 °C around 59.5 Ma, where the record is truncated by a hiatus.
A hiatus straddling the early Thanetian (59.0–57.7 Ma) likely obscures the onset of late Paleocene warming out of the mid-Paleocene temperature minimum. The latest background Paleocene SSTs fluctuate considerably, but the PETM warming clearly stands out (Sluijs et al., 2011), with a magnitude (5–7 °C depending on the calibration) comparable to that in other mid- to high-latitude sections and similar to the global average (Frieling et al., 2017). Post-PETM SSTs drop back to pre-PETM values completely, followed by renewed warming towards the EECO. The magnitude of warming is 6 to 11 °C depending on the choice of calibration. Smaller early Eocene hyperthermal events cannot be confidently identified at Site 1172.
The highest SSTs of the EECO are slightly lower than peak PETM values in all calibrations, consistent with other records (Hollis et al., 2019; Inglis et al., 2020). However, a hiatus between 52.7 and 51.4 Ma may conceal peak EECO temperatures (Hollis et al., 2019; Lauretano et al., 2018). A gradual SST decline marks the end of the EECO around 49.2 Ma, which is broadly coeval with cooling inferred from benthic foraminiferal isotope records (Lauretano et al., 2018) and proxy records from New Zealand (Dallanave et al., 2016; Crouch et al., 2020).
Post-EECO cooling is gradual and of small magnitude (2 °C from peak EECO values) until about 46.4 Ma, after which it accelerates (5 °C) between 46.2 and 44.4 Ma. The age model in this particular interval is uncertain, due to a questionable assignment of chron C21n (Bijl et al., 2010, 2013b). Following the minimum SSTs at 44.4 Ma, SSTs rise again towards a plateau at 42.7 Ma. An SST minimum of ∼ 22 °C is observed just prior to the MECO, at 40.2 Ma, followed by MECO warming of about 5–7 °C at 39.9 Ma. Post-MECO cooling seems more gradual than MECO warming, although this might be the result of fine-scale sedimentation rate changes (Bijl et al., 2010), which are not accounted for in our age model. SSTs are almost identical to those for the MECO at the nearby Site 1170 on the South Tasman Rise (Cramwinckel et al., 2020). Post-MECO cooling transitions into gradual late Eocene cooling, down to a minimum of ∼ 19 °C at 35.7 Ma. The following latest Eocene–Oligocene TEX86-based SSTs (35–27 Ma) are 3 °C warmer, with surprisingly no cooling across the Eocene–Oligocene transition (Houben et al., 2019).
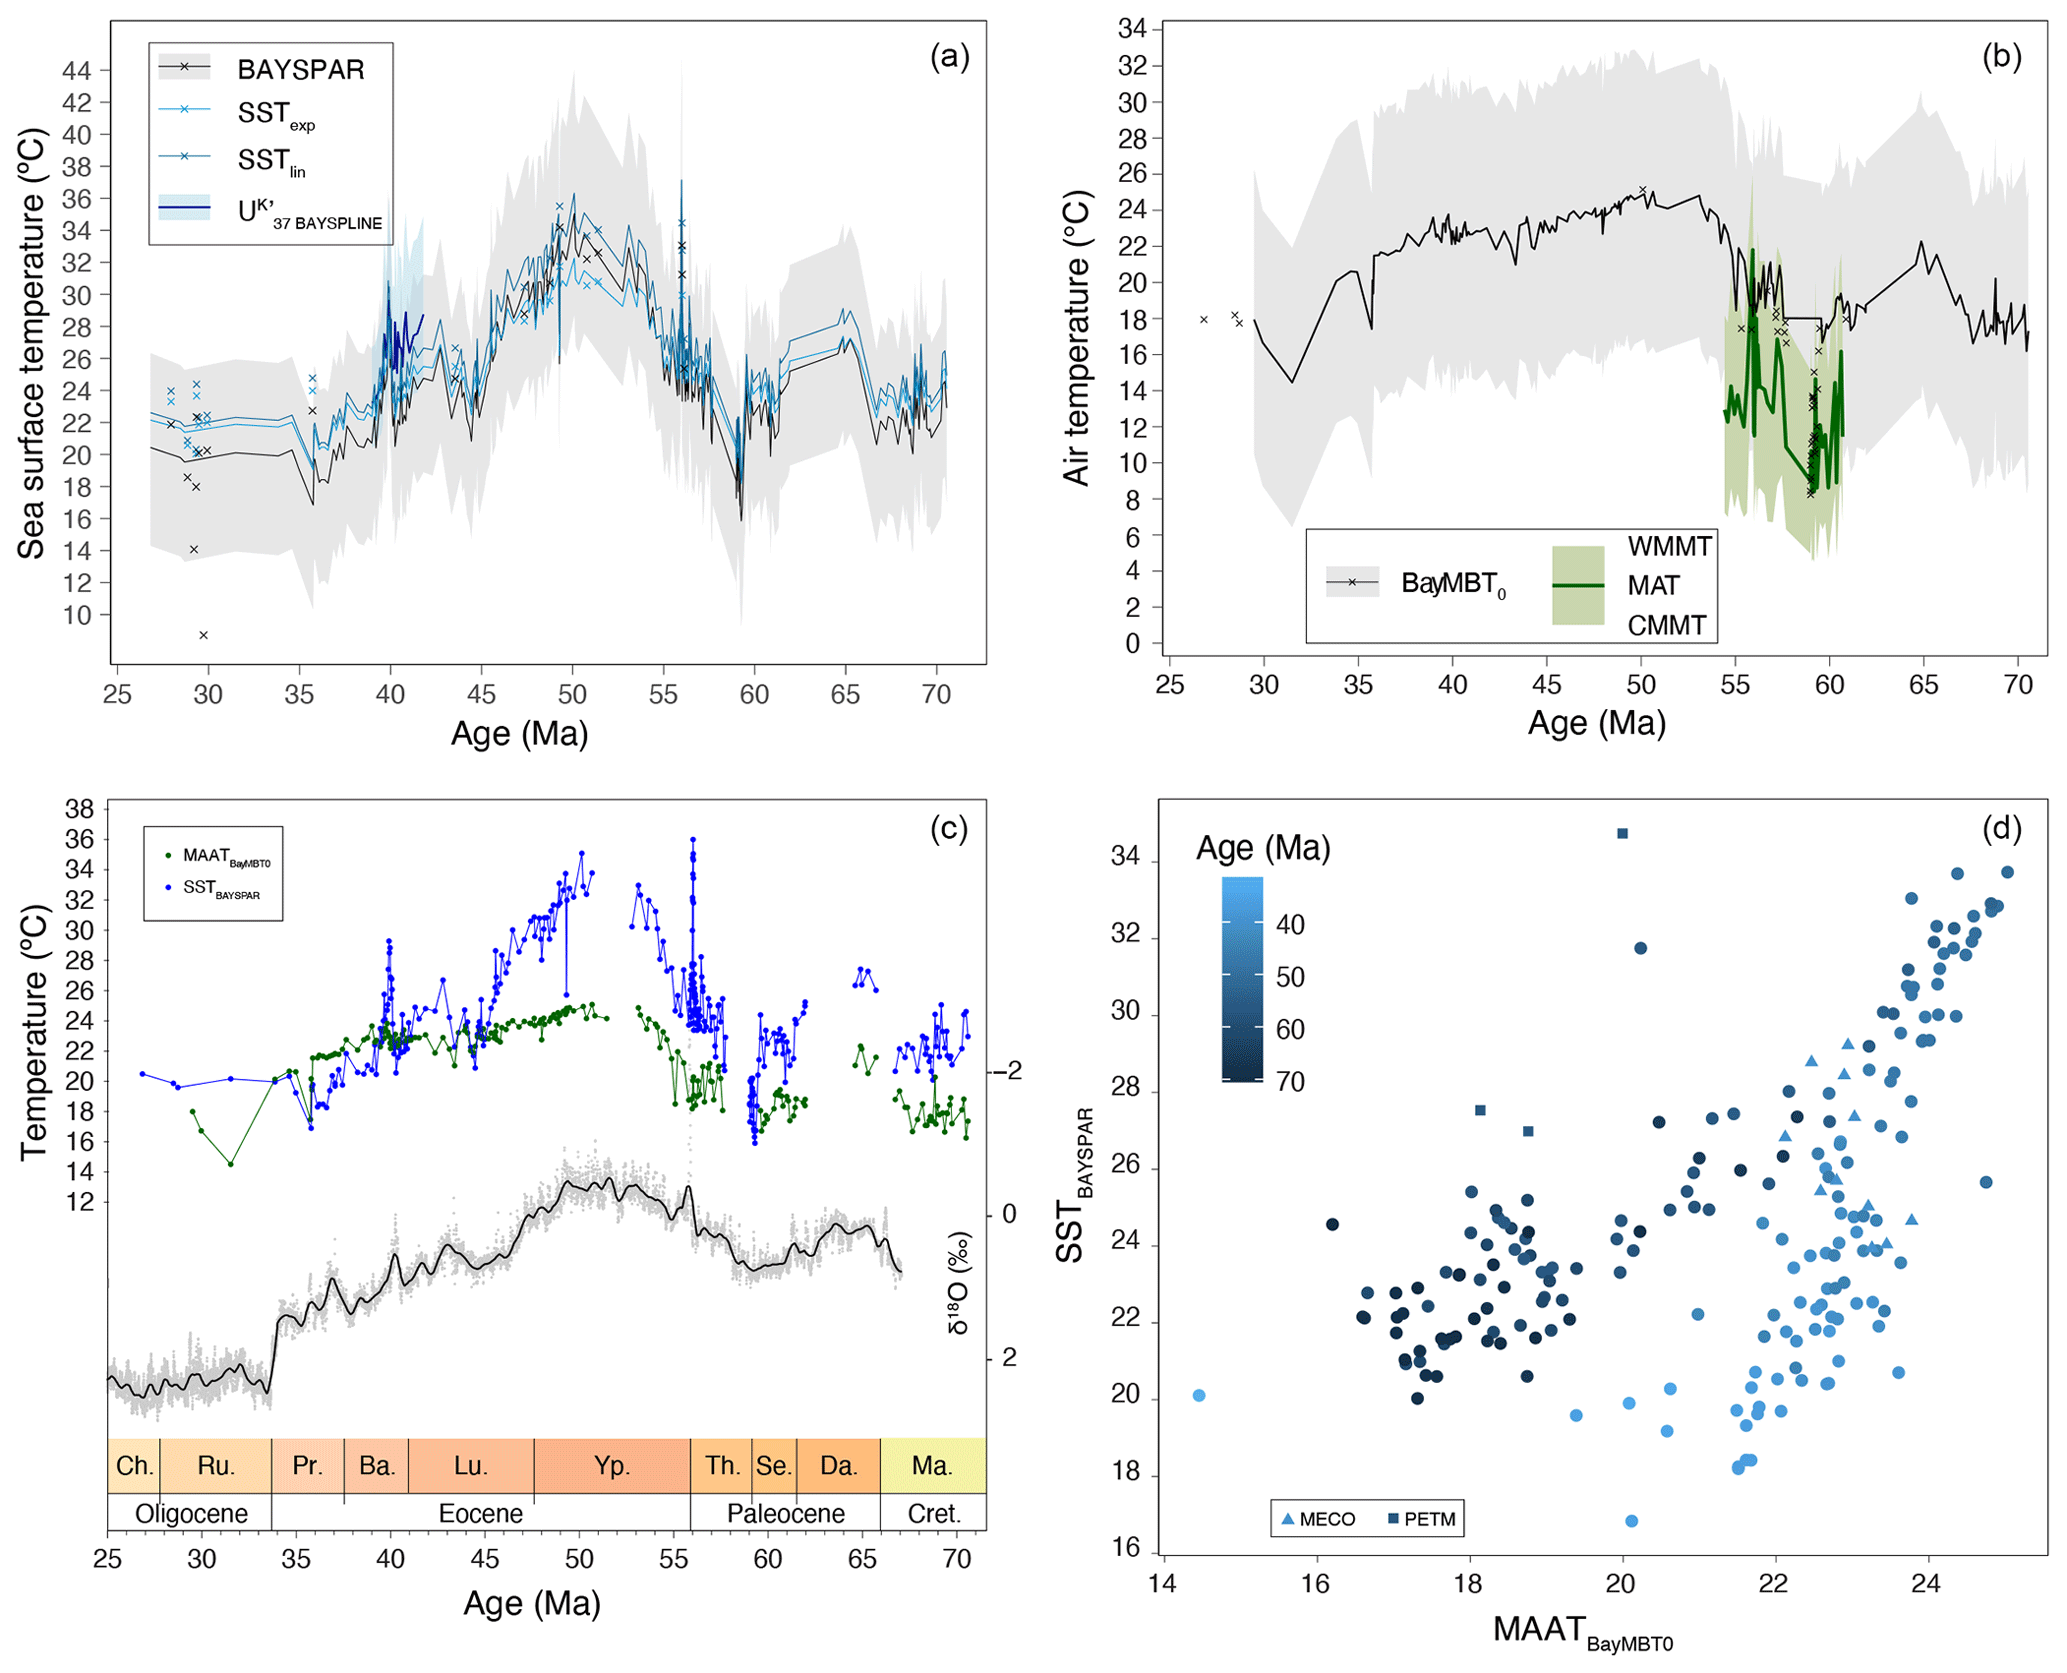
Figure 9Paleothermometers. (a) TEX86-based SST reconstructions, using a Bayesian (BAYSPAR; black, with 90 % confidence interval in gray envelope; Tierney and Tingley, 2015), exponential (SSTexp; light blue; Kim et al., 2010) and linear (SSTlin; dark blue; O'Brien et al., 2017) calibrations. Also plotted are U-based SSTs (thick blue line; from Bijl et al., 2010, recalculated using BAYSPLINE of Tierney and Tingley, 2018). Discarded samples are indicated by the crosses. (b) BrGDGT-based MAAT reconstructions using the Bayesian calibration (BayMBT0; black, with 90 % uncertainty interval in a gray envelope; Dearing Crampton-Flood et al., 2020). Discarded samples are indicated in crosses. Also plotted are pollen-based NLR-approach mean annual (MAT) reconstructions (thick dark green, with light green envelope representing coldest and warmest month mean temperatures; from Contreras et al., 2014). (c) SST and MAAT reconstructions using the Bayesian calibrations calibrations, with the CENOGRID benthic foraminifer oxygen isotope splice of Westerhold et al. (2020) (10-point locally weighted scatterplot smooth (LOESS) in gray; 500 pnt LOESS in black). (d) Cross correlation between SST and MAAT using the calibrations shown in panel (c).
4.2.2 MAAT
After excluding samples with IR values above those of local soils, we present MBT'5me-based MAAT reconstructions. MAAT evolution reveals late Maastrichtian–early Danian warming of 3 °C, gradual 4 °C cooling towards the mid-Paleocene and gradual 8 °C warming towards the EECO, with a conspicuous absence of warming at the PETM. Gradual cooling of 4 °C starts at 49.5 Ma and continues into the late Eocene. MAAT reaches a minimum at 43 Ma, followed by a plateau phase. There is little warming that can be associated to the MECO. MAAT shows a conspicuous transient 3 °C cooling in the late Eocene, at the onset of glauconite deposition. The Eocene–Oligocene Transition is characterized by another 5 °C cooling. Except during the late Eocene, SST is overall warmer than MAAT (Fig. 9c). This difference is largest during the EECO (up to 9 °C).
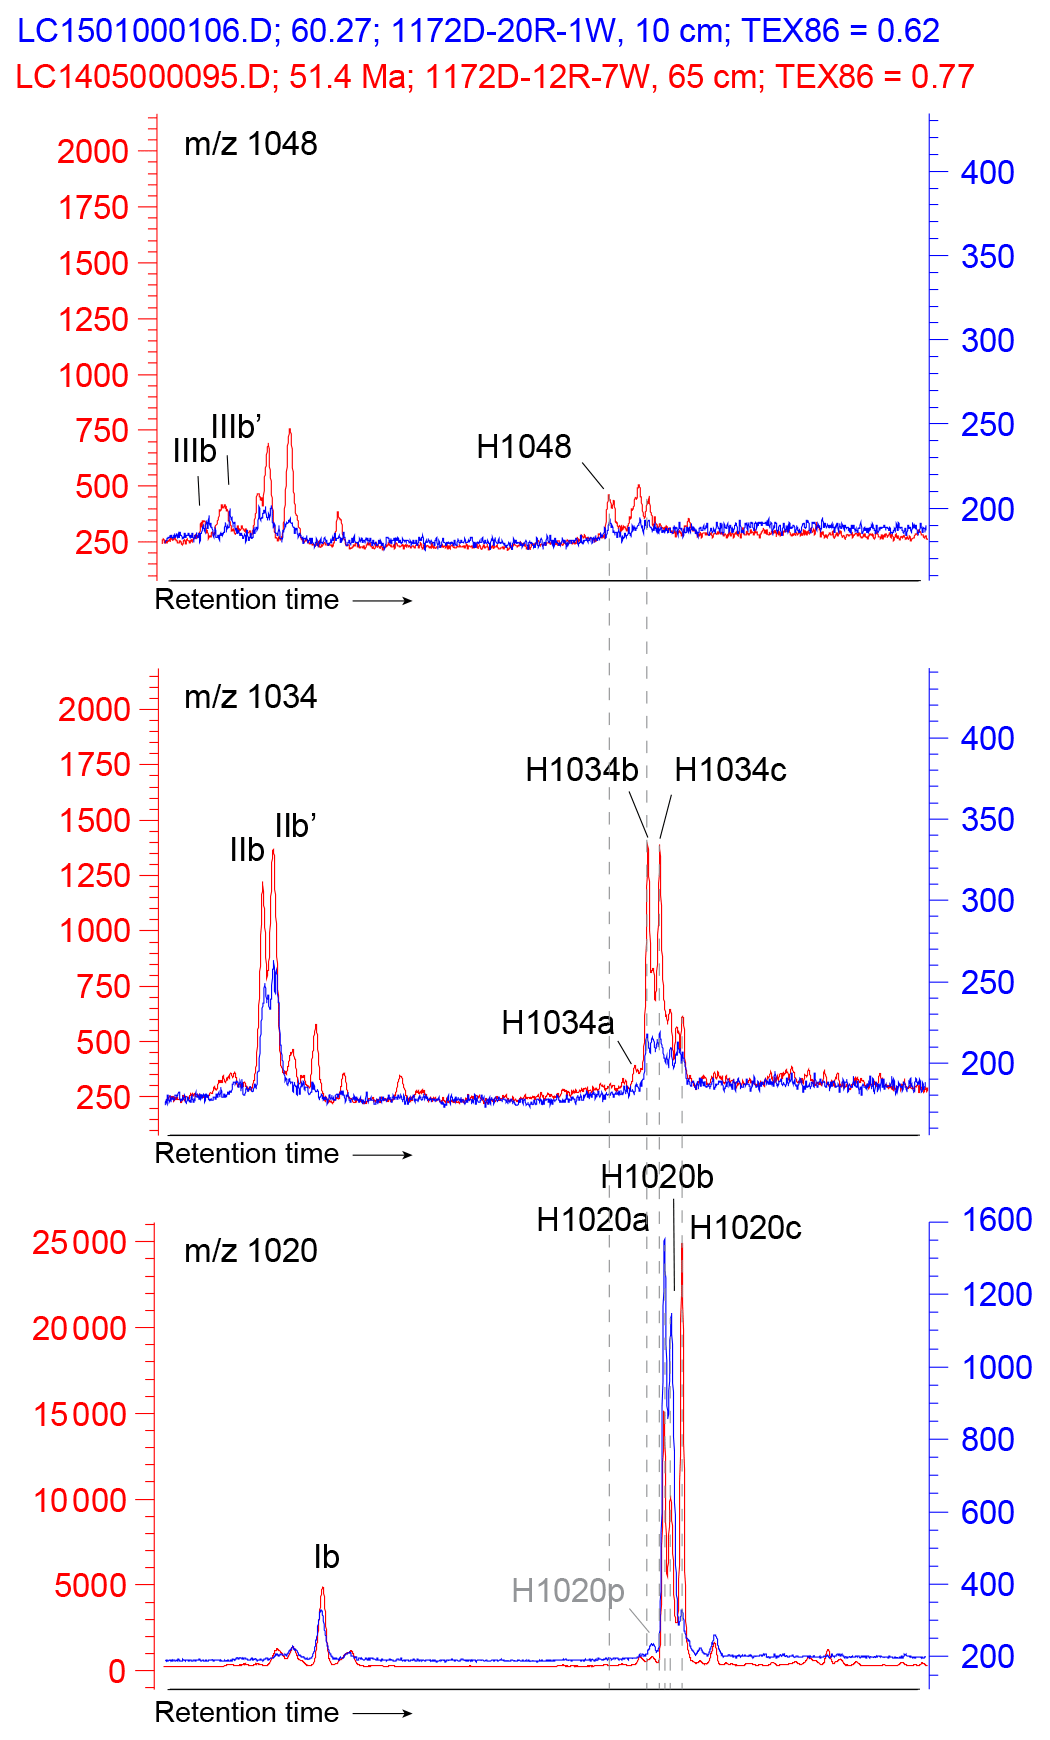
Figure 10Stack of two UHPLC-MS chromatograms (1172D-12R-7W, 65 cm; 51.41 Ma in red and 1172D-20R-1W, 10 cm; 60.27 Ma in blue) of 1048, 1034 and 1020 traces, between ∼ 40 and ∼ 60 min retention time, showing the pattern of peaks corresponding to brGDGTs and brGMGTs. Peak labels refer to the molecular structures in Fig. 3. Note that not all peaks are 3 times the baseline.
4.3 Branched GMGTs
We detected brGMGTs throughout the record (see Fig. 10 for typical chromatograms). The exact molecular structure and position of the C–C bridge is still unknown but based on visual comparison with chromatograms of brGMGTs in African lake sediments (Baxter et al., 2019), (traces of) all seven known brGMGTs can be identified. Next to H1020a, b, and c as most abundant brGMGTs, also H1034a, b and c are detected, although in some samples in the Maastrichtian, individual peaks could not be separated. Traces of H1048 can be seen at times, suggesting presence of this compound as well, albeit in low relative abundance. Next to these previously described peaks, we here recognized several other peaks that consistently occur at Site 1172: one compound that elutes just prior to H1020a, which we term H1020p (Fig. 10).
The fractional abundances of the H1020 isomers show qualitatively similar relations to temperature as in the East African lake dataset of Baxter et al. (2019): the relative abundance of H1020b has a negative relationship with MAAT, while H1020c has a positive relationship (Fig. 11). In addition, H1020a seems negatively correlated with MAAT in our data, although this compound does not show any relation to temperature in lakes (Baxter et al., 2019). The relative abundances of the H1034 isomers do not show a clear relationship with MAAT (Fig. 11), similar as in the tropical lake dataset, where the scatter increases at lower (H1034b) or higher (H1034a, c) temperatures (Baxter et al., 2019).
Downcore trends in brGMGTI are primarily controlled by the relative abundance of H1020c and closely follow those in both SST and MAAT. Upon cross correlation, we note that brGMGTI has a higher correlation with MAAT (R = 0.89) than with SST (R=0.57; Fig. 12). Interestingly, the correlations between brGMGTI and temperature indices only hold for part of the dataset. Samples with high IR values, for which brGDGT-based MAAT is influenced by a fluvial brGDGT contribution, fall outside the correlation (gray crosses in Fig. 12). In addition, we also note that brGMGTI approaches 0 at reconstructed MAAT of 15 °C. The correlation with temperature (both MAAT and SST) is divided into two clusters. BrGMGTI values for samples from the younger part of the record, with BIT index , seem to correlate better to temperature than those from the older part of the record, with BIT index values (Fig. 12). In the Oligocene, where many isoGDGT signals were evidently overprinted, the %brGMGTs increases (Figs. 3, 12d), and the brGMGT composition is characterized by a relatively higher abundance of H1020c, H1034b and H1048 compared to the rest of the record (Figs. 3, 12).
There is no clear relationship between %brGMGTs and brGDGT-based MAAT (Fig. 12h, i). This differs from the Paleocene–Eocene Arctic Ocean record (Sluijs et al., 2020), where the brGMGTI has no correlation to temperature, while %brGMGTs do. This may indicate differences in sources of brGMGTs between the sites, differences in oceanographic settings or a non-temperature control on their distribution. In contrast, HMBTacyclic appears to show similar trends to the brGDGT-based MAAT (Fig. 12g), as is also seen in the Arctic Ocean (Sluijs et al., 2020).
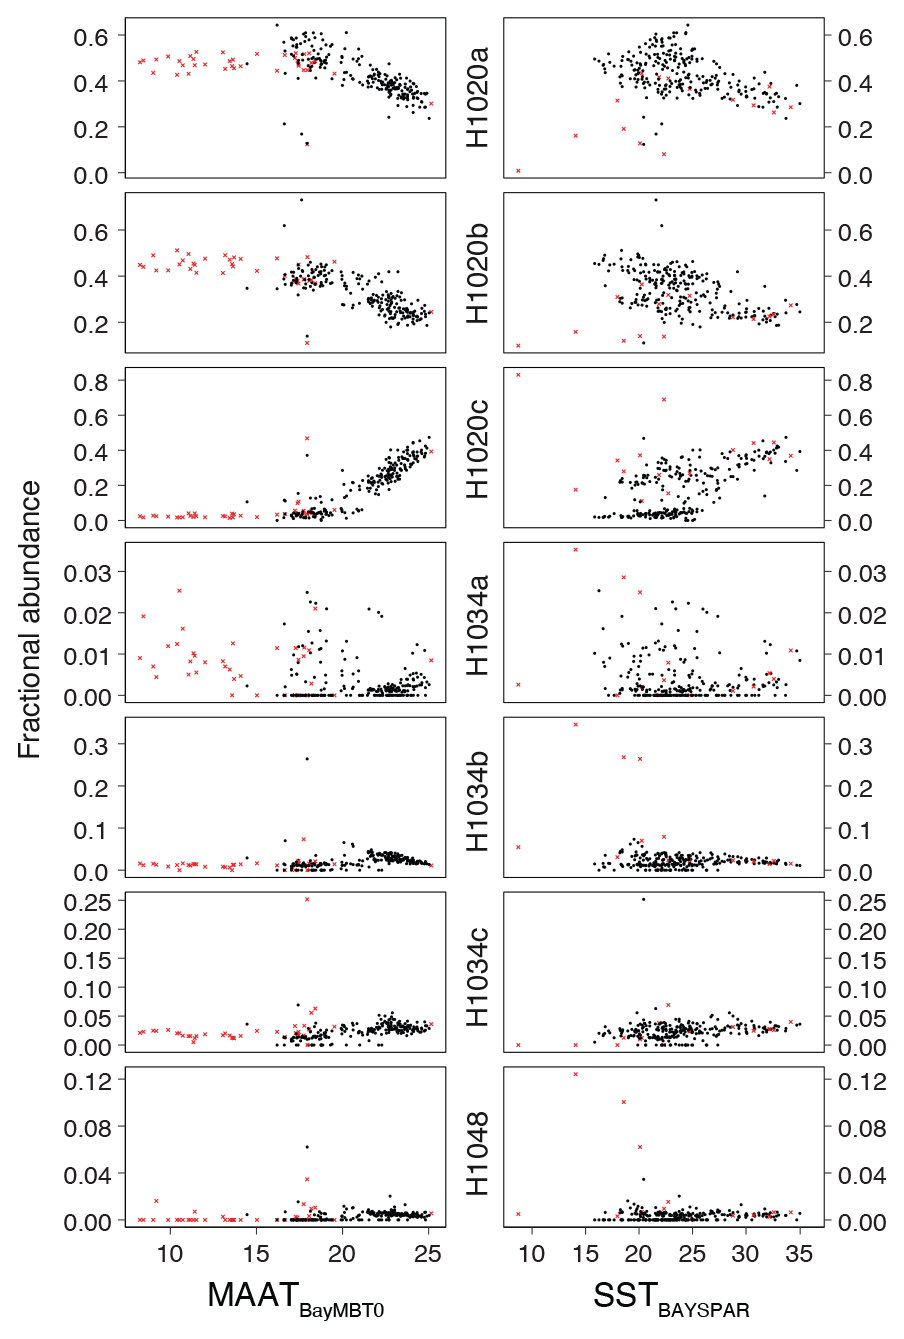
Figure 11Fractional abundances of brGMGTs plotted against MAATsoil and SSTlin. Red crosses are those samples that have non-thermal overprints on the paleotemperatures.
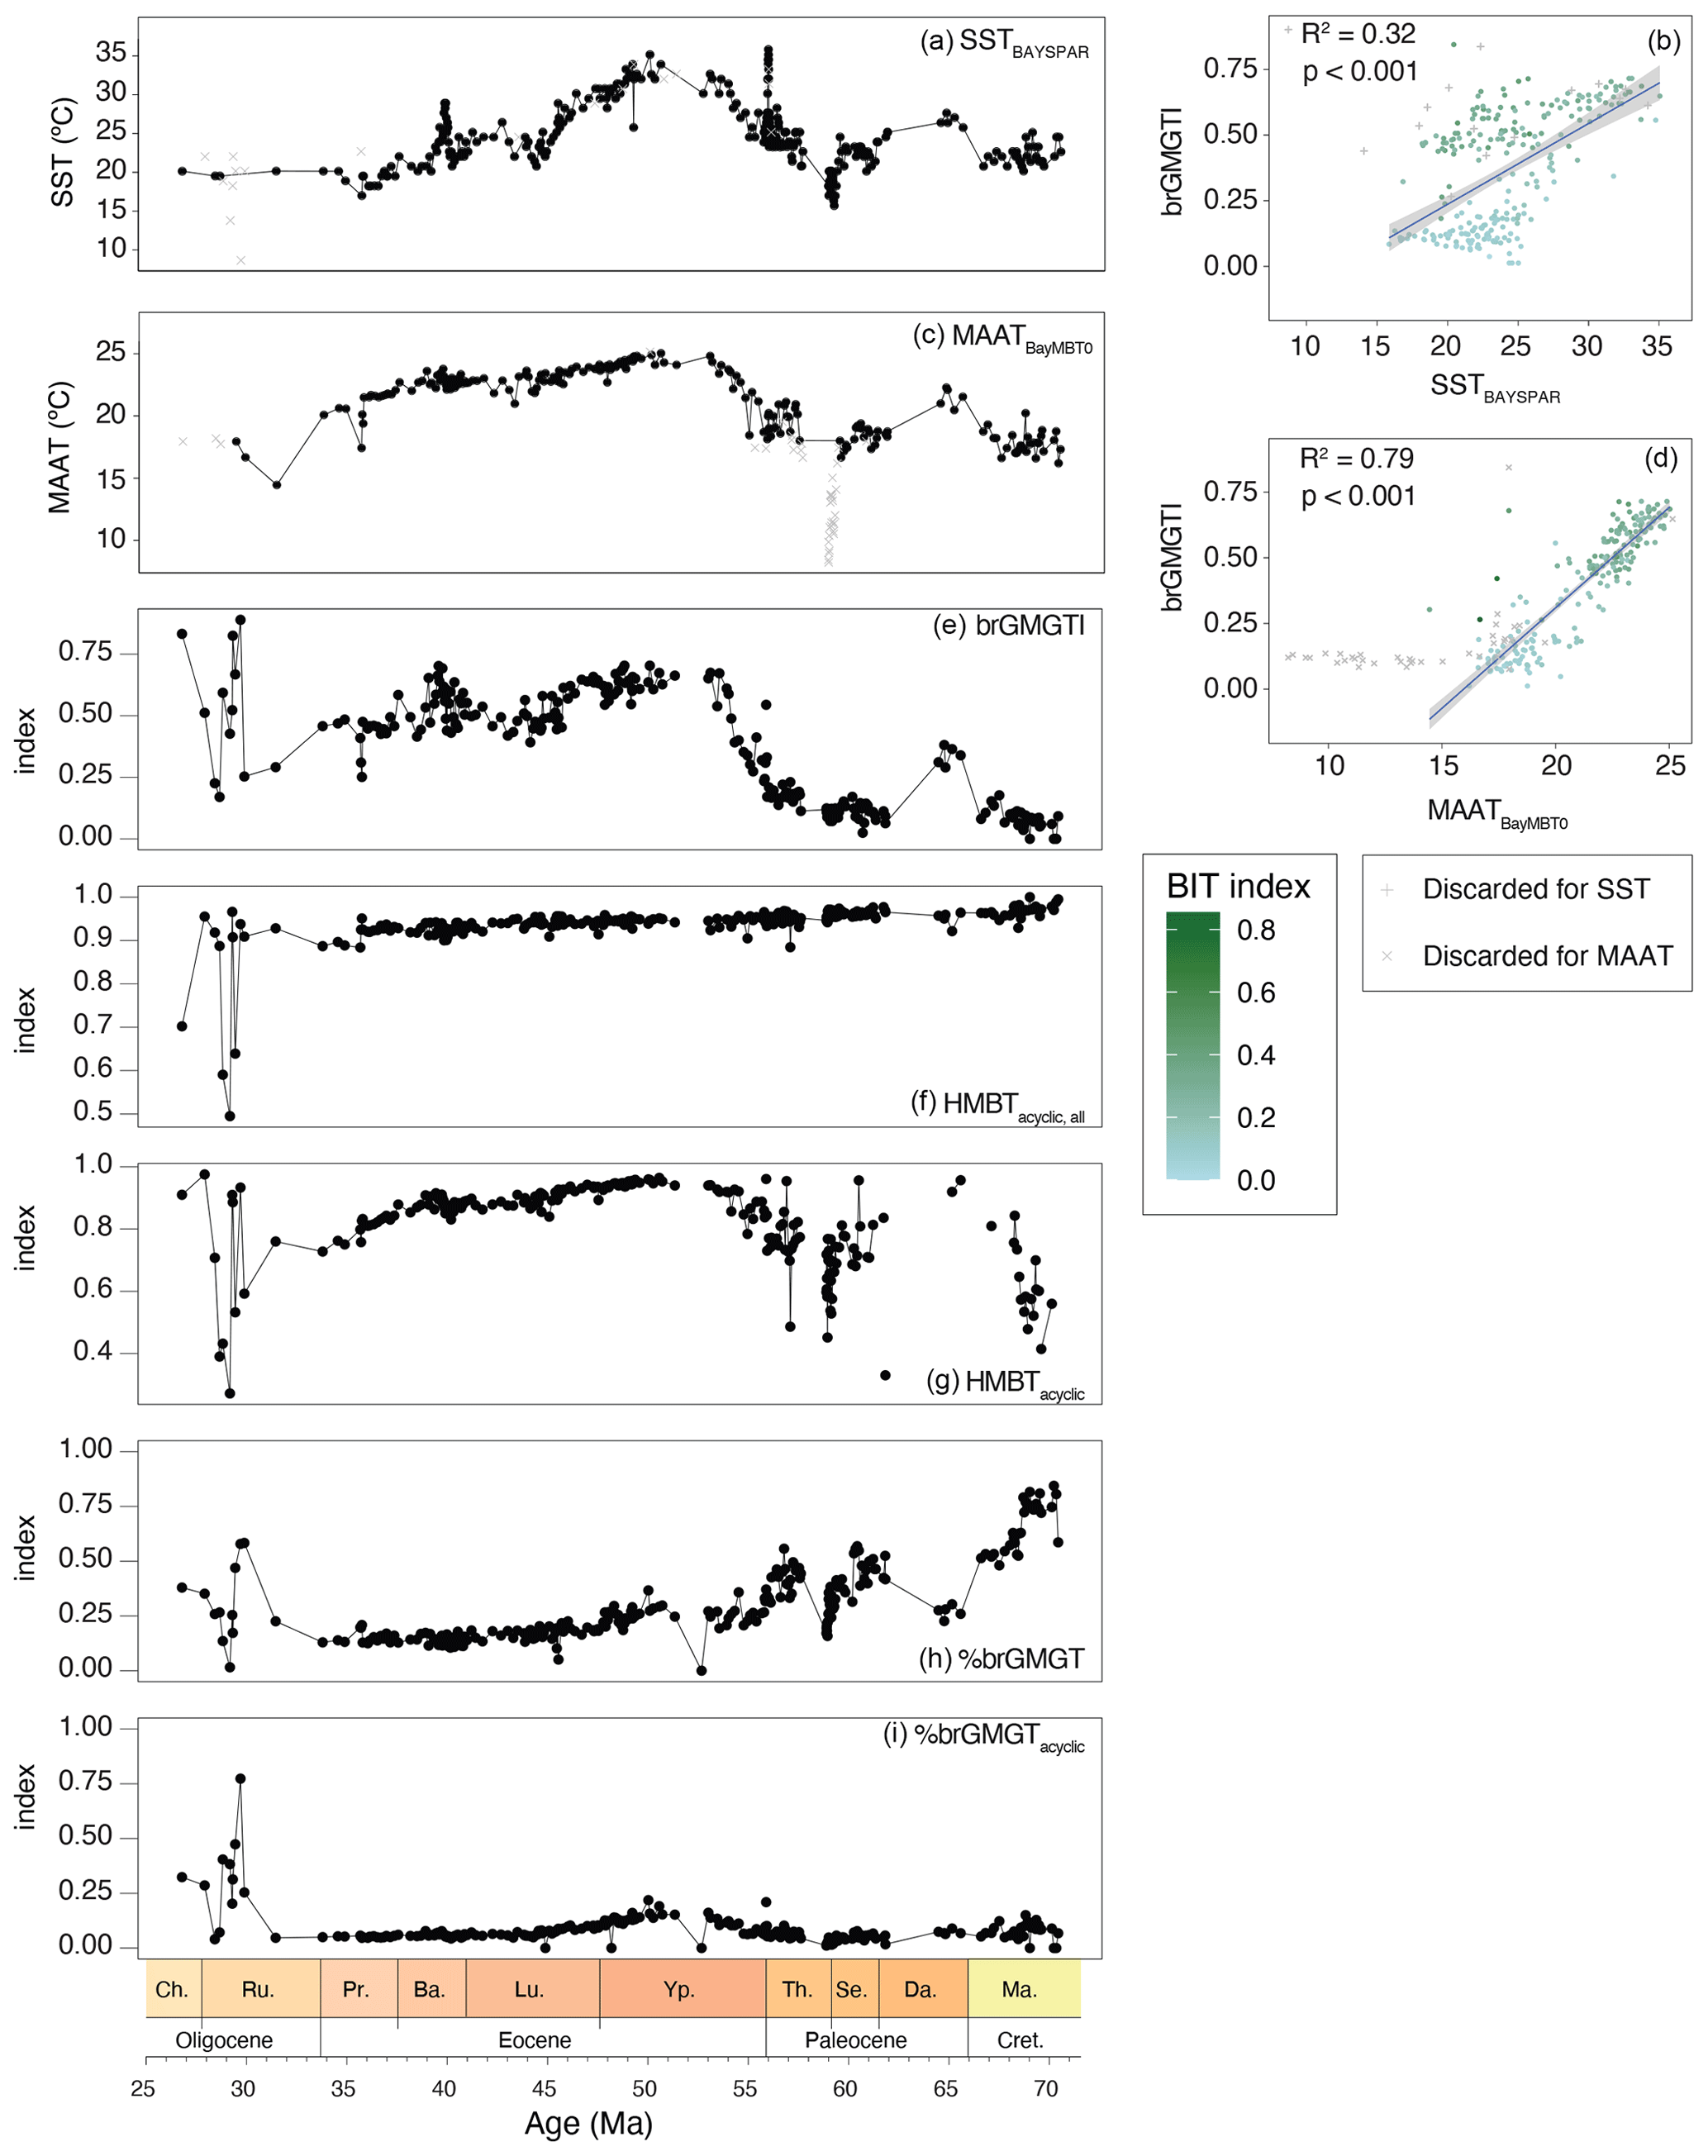
Figure 12Time series and cross plots of brGMGT-based indices with MAAT and SST reconstructions. (a) SSTlin (b) cross plot of SSTlin and brGMGTI, (c) MAATsoil, (d) cross plot of MAATsoil and brGMGTI, (e) brGMGTI, (f) HMBTacyclic,all, (g) HMBTacyclic, (h) %brGMGT (Baxter et al., 2019), (i) %brGMGTacyclic (Naafs et al., 2018a). For equations, see Table 1). Variable colors in the cross plots indicate the BIT index value.
4.4 Palynology
4.4.1 Assemblages
Dinocyst assemblages are dominated by Manumiella spp. throughout the Maastrichtian, together with Goniodomideae (notably Dinopterygium spp.), and Cerebrocysta cpx. (Fig. 13). From the late Maastrichtian onwards, Senegalinium cpx. increases gradually in relative abundance, interrupted by acmes of Palaeoperidinium pyrophorum in the Danian and Glaphyrocysta cpx. in the lower Selandian. Senegalinium cpx. is most abundant during the mid-Paleocene and the Paleocene–Eocene transition, while the PETM itself is characterized by abundant Apectodinium (∼ 30 %) and common Senegalinium cpx. and Goniodomideae (Sluijs et al., 2011). After the PETM, Senegalinium cpx. abundance temporarily increases, followed by a high abundance of Deflandrea cpx., Spinidinium cpx. and Elytrocysta spp. with minor contributions of various other genera, e.g., Wetzeliella, Hystrichokolpoma, Goniodomideae (Fig. 13). From 45 to ∼ 37 Ma, Enneadocysta spp. abundance oscillated with Deflandrea cpx. and Spinidinium/Vozzhennikovia cpx., with contributions of Phthanoperidinium spp. (Röhl et al., 2004a). Protoperidinioid dinocysts become common in the late Eocene, around 35.5 Ma (Houben et al., 2019; Sluijs et al., 2003; Fig. 13).
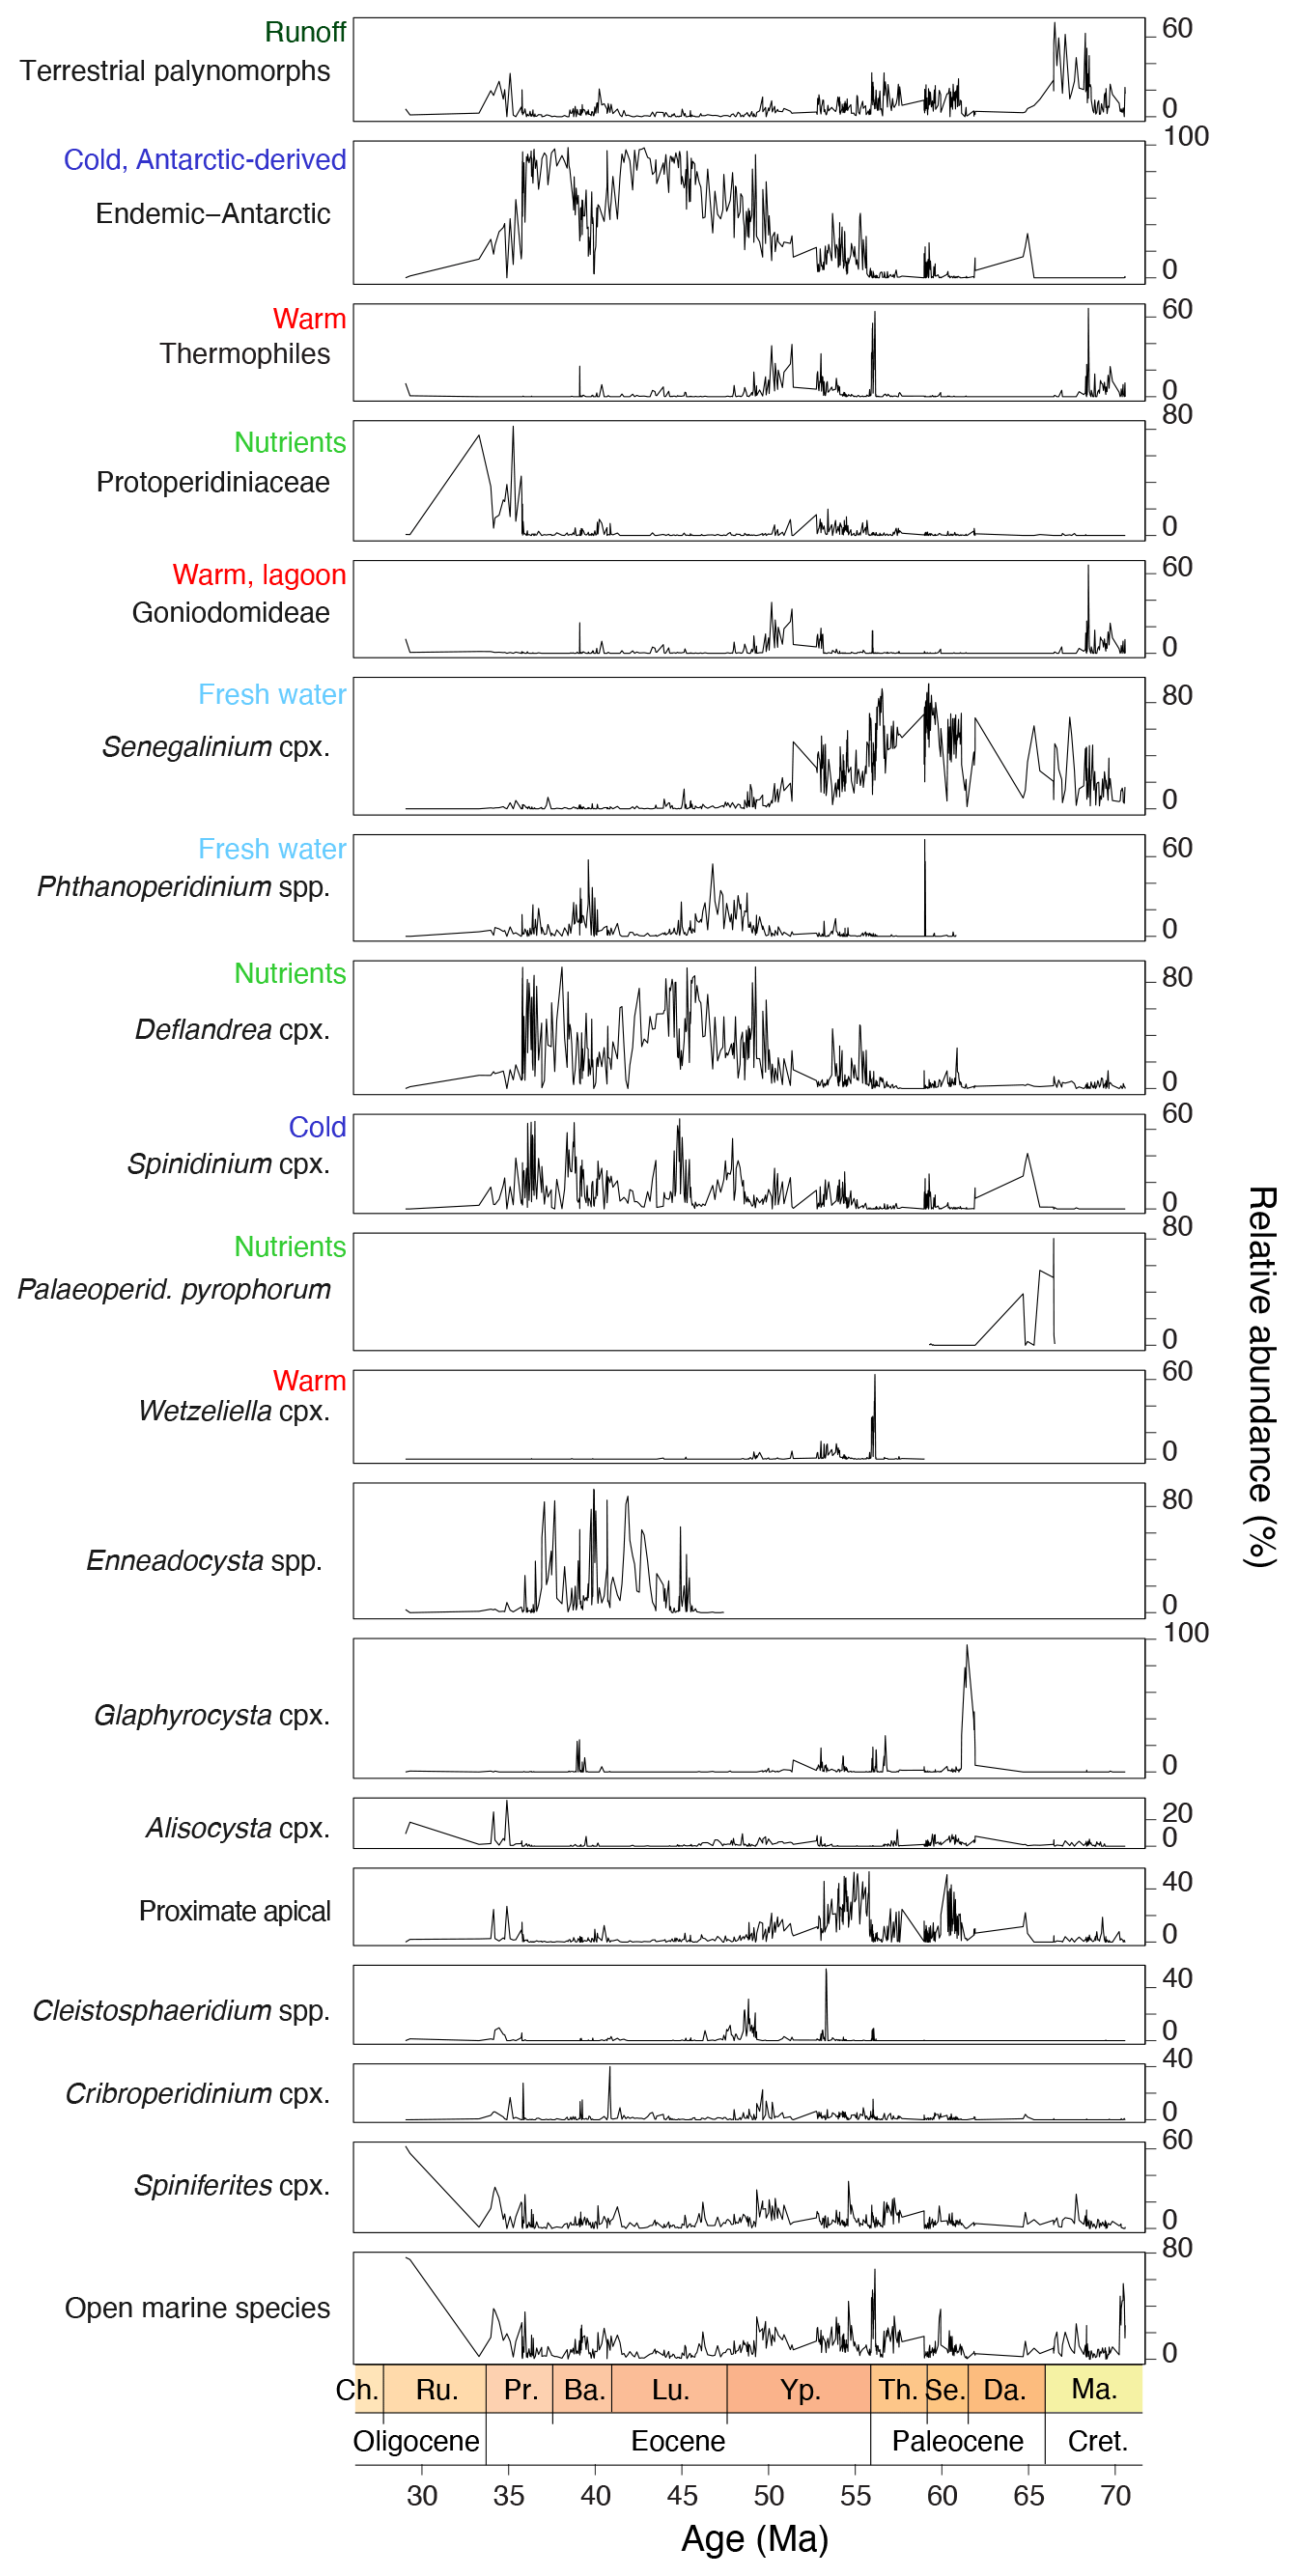
Figure 13Dinocyst eco-groups and %terrestrial palynomorphs from Site 1172. From left to right, eco-groups are ordered in an inshore-to-offshore transect. Relative abundance ticks represent 20 %.
4.4.2 Diversity and variability
Together with the changing assemblage composition, some strong and coherent changes in diversity and variability indices are observed (Fig. 14). First, results are highly similar for the full species-level dataset and the grouped assemblages, indicating robustness of both the grouping and diversity analysis. The Maastrichtian–Paleocene assemblages are characterized by relatively low diversity, which increases towards the EECO, as variability indicated by the Gibbs index decreases. After this, diversity drops and variability increases during middle–late Eocene cooling ∼ 49–38 Ma, with an interruption around 41–39 Ma. Towards the top of the record, both diversity and variability increase.
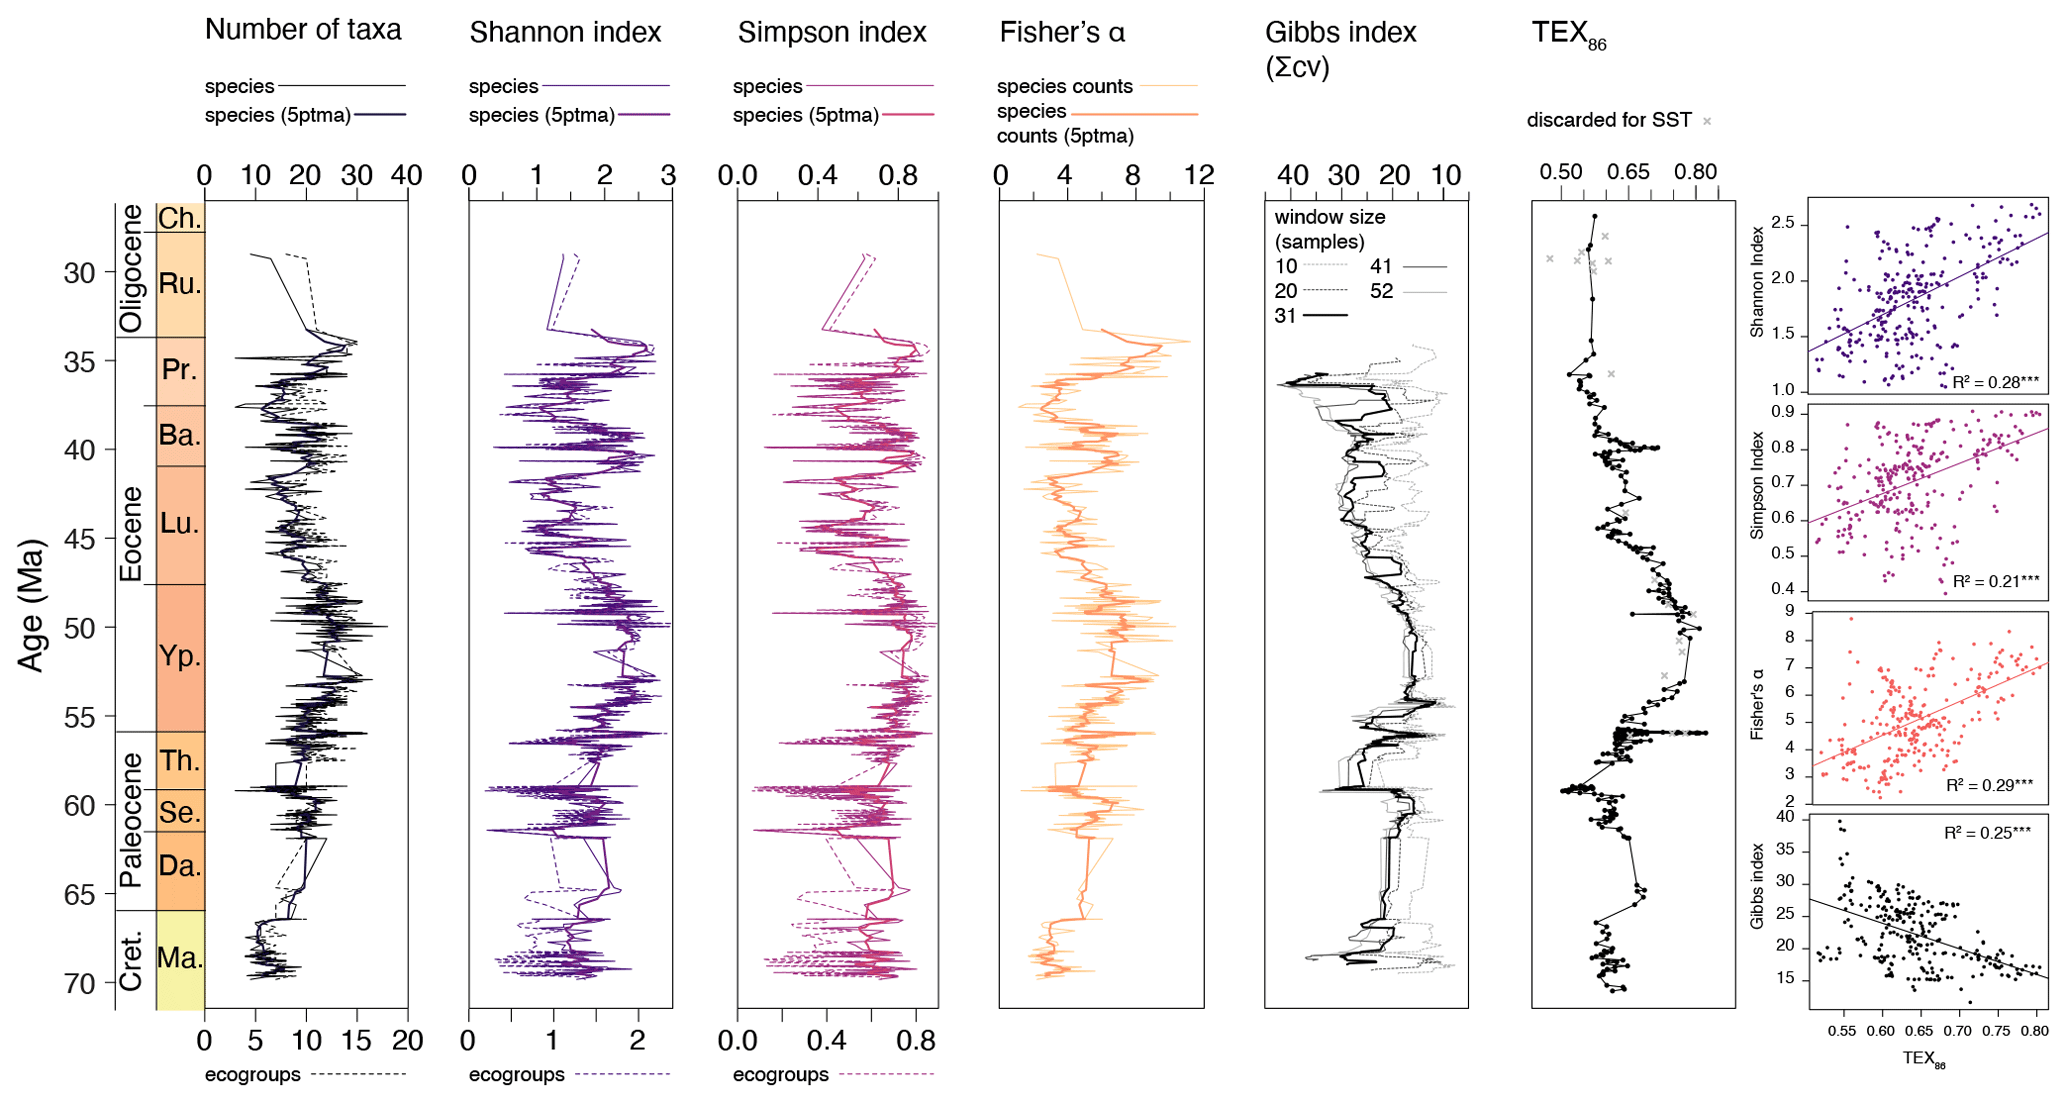
Figure 14Dinocyst taxonomic diversity and variability through time. From left to right: plotted number of taxa (black), Shannon index (purple), Simpson index (pink), Fisher's alpha (orange) (species-based dataset in solid lines; eco-grouped dataset in dashed lines) and Gibbs index (note the reversed axis; different window sizes in gray–black). TEX86 plotted for comparison. Gray crosses indicate samples that have non-pelagic or non-thermal contributions. Cross plots show correlation of these indices with TEX86.
5.1 Air and sea surface temperature evolution compared
The nearshore depositional setting of our record should have recorded a coastal terrestrial environment, with MAATs similar to the local SSTs. Indeed, the brGDGT-based MAAT record shows strong similarities to SST particularly in multi-million-year trends (Fig. 9). Specifically, the early Danian is warmer than the Maastrichtian, and both records show a two-step Paleocene cooling, late Paleocene warming towards peak values in the EECO and middle–late Eocene cooling. On shorter timescales, both records, occasionally even on a sample-to-sample level, show synchronous variability (Fig. 9). The Bayesian calibrations for MAAT and SST generate overlapping median temperatures for the colder middle–late Eocene and Paleocene, but in the warmer Eocene time intervals SSTs remain consistently warmer (by ∼8 °C). The lower MAATs cannot be explained by a saturation of the MBT'5me index that is underlying the paleothermometer, as maximum recorded MBT'5me values are around 0.85 in the EECO. The large calibration errors of BAYSPAR (±6 °C) and BayMBT0 (±8 °C) in principle could resolve the offset. However, applying the extremes in calibration error to make them consistent with each other would make both profoundly inconsistent to the independent SST and MAAT estimates from the same samples. More importantly, the colder MAAT compared to SST seems to be a consistent feature in many regions where TEX86 and MBT'5me were applied together (see, e.g., Hollis et al., 2019, and compare Willard et al., 2019 and Sluijs et al., 2020). The offset between MAAT and SST would have been more variable between sites if it were only the result of calibration errors. TEX86-based SSTs in the southwest Pacific realm have been on the high end of many multi-proxy-based temperature reconstructions for the Eocene (Hollis et al., 2012), and therefore may be assumed to have an as yet poorly understood warm bias. However, the consistency of TEX86-based SSTs with other SST proxies for specific time intervals and locations (Bijl et al., 2010; Hines et al., 2017) suggests the SST–MAAT offset cannot be easily reconciled by only invoking a warm bias in TEX86, as was also shown by Hollis et al. (2012). MAAT reconstructions on the other hand have been broadly consistent with NLR-based temperature reconstructions on pollen assemblages in many applications in the Eocene (Pross et al., 2012; Contreras et al., 2013, 2014; Pancost et al., 2013; Willard et al., 2019), but both brGDGT and plant-based temperature estimates are arguably prone to cold biases at the high-temperature end (e.g., Naafs et al., 2018b; Van Dijk et al., 2020). In addition, it may be that the same evolutionary or bacterial community factors that make Paleogene brGDGT assemblages deviate from that in modern soils also cause a deviation in the calibration to MAAT. This may resolve some of the offset between MAAT and SST reconstructions. Although this implies that quantitative MAAT estimates based on MBT'5me in non-analogue settings such as the present one should be interpreted with care, the strong temperature dependence in Paleogene brGDGTs cannot be ignored.
Another surprising result is that the brGDGT-based MAAT record does not capture PETM and MECO warming (Fig. 9b), while pollen-based MAAT does. This is remarkable for several reasons: (1) brGDGTs were measured on the same samples as isoGDGTs, which precludes a sampling bias; (2) SST changes of longer duration (Maastrichtian–Danian warming, mid-Paleocene cooling and early Eocene warming towards the EECO) are represented in the MAAT record; (3) the duration of PETM (∼ 150–250 kyr; Röhl et al., 2007; Zeebe and Lourens, 2019) and MECO (∼ 400 kyr; Bohaty et al., 2009) is too long to explain the absence in MAAT warming with a lag in soil-derived OM delivery to the ocean (up to several kyr; see, e.g., Feng et al., 2013; Schefuß et al., 2016; Huurdeman et al., 2020); (4) it seems incompatible with the fact that other low-amplitude, shorter-term SST changes are reflected in the MAAT record (Fig. 9), which suggests that soil-derived OM did capture short-term climate variability on the time resolution of the samples; (5) other brGDGT-based records from the region do show a temperature response during the PETM (Hollis et al., 2012; Pancost et al., 2013; Huurdeman et al., 2020). A lack of MAAT rise during the PETM and the MECO could be explained by a switch from brGDGT sourcing from soils to (peaty) lakes, which are notoriously cold biased (Tierney et al., 2010). Paleocene–Eocene peats are abundant in southeast Australia (Holdgate et al., 2009), and it is possible that a contribution from peat lakes at times of global warming, contributed to a dampening of the proxy response. This may also explain the lack of response at the EECO and explain why MBT'5me does not reach saturation in that interval. The final option, which, although unlikely, cannot be excluded, is that a dominant fraction of the brGDGT was produced in situ and subdues the temperature response during these warming phases.
The subdued middle–late Eocene cooling in the air temperature record compared to the strong decrease in SST is particularly clear when cross plotting SST vs. MAAT (Fig. 9d): the relationship between the two proxies is different in the Maastrichtian–early Eocene compared to the middle–late Eocene. This may be related to the start of a progressive northward tectonic drift of the Tasmanian hinterland, which occurred around the same time (Fig. 1). A similar subdued MAAT record relative to SST cooling was observed in records from New Zealand (Pancost et al., 2013; Crouch et al., 2020), which was also moving northward at that time. This puts the hinterland of the soil-derived brGDGTs into warmer climate zones throughout the middle–late Eocene, while the ETP remained under the influence of the Antarctic-derived Tasman Current (TC) through that time (Huber et al., 2004; Sijp et al., 2016). The TC cools and likely strengthens in the middle and late Eocene. The terrestrial climate cooled as well, but this signal will be subdued if the soil material is sourced from a progressively lower-latitude environment as Australia drifted northward. Yet, one would expect that the close coupling between coastal and offshore temperatures in nearshore environments would subdue such tectonic effects in mean annual temperature reconstructions.
Both marine and terrestrial temperature records diverge once more during the late Eocene–Oligocene, when they show a sharp cooling of 2–3 °C at the onset of greensand deposition, at ∼ 35.5 Ma. Whereas this is merely a continuation of progressive late Eocene cooling in the SST record, the decrease in MAAT is more pronounced compared to the middle–late Eocene trends. Another 3–4 °C MAAT drop occurs sometime between the late Eocene and the early Oligocene (likely associated with the Eocene–Oligocene transition), while SSTs revert to warmer, middle Eocene-like values. The continued sea surface warmth across the EOT has been related to persistent influence of the proto-Leeuwin Current (Houben et al., 2019), which apparently retained a constant temperature across the EOT. Since MAAT decreased while SSTs remained high, the influence of regional oceanographic changes did not appear to impact climate changes in the source region of brGDGTs during this time interval. Later, at 30 Ma, MAAT does rise in the region, which could be related to either the progressive northward movement of the site or a response to widespread warming in the early Oligocene (e.g., Westerhold et al., 2020). This is surprising given the proximity of the sediment record to the coastline, but it represents further evidence that hinterland MAAT and nearshore SST trends can be decoupled under certain circumstances. MAAT temperatures from Site 1172 around EOT are somewhat colder than those from southern Australia (Lauretano et al., 2021), although calibration error bars do overlap.
Minimum mid-Paleocene SSTs are lower than those for the early Oligocene at Site 1172. However, the site migrated northward by ∼ 7° latitude between the mid-Paleocene and the early Oligocene (Fig. 1) and the oceanographic regime changed with throughflow of the proto-Leeuwin Current through the TG in the late Eocene (Houben et al., 2019). More remarkably, the mid-Paleocene SSTs approach those of the warmest interglacial intervals of Oligocene Wilkes Land margin, East Antarctica (Hartman et al., 2018), at a similar paleolatitude as the Paleocene ETP. This suggests that mid-Paleocene Antarctic-proximal temperatures were similar to those at times of major Antarctic glaciation during EOT. Previous work has indeed presented widespread evidence for low sea level during this time interval (e.g., Guasti et al., 2006; Frieling et al., 2014, 2018; Hollis et al., 2014), which, combined with low SSTs, suggests the presence of some continental ice on the Antarctic continent during this mid-Paleocene interval.
5.2 BrGMGTs
The continuous presence of brGMGTs in our record appears unrelated to depositional conditions, and distributional changes of brGMGT isomers do not correlate to varying relative contributions of terrestrial material. This suggests that at least part of the brGMGTs have a marine origin, in line with observations from modern sediments and water columns (Liu et al., 2012; Xie et al., 2014) and from Paleogene Arctic Ocean sediments (Sluijs et al., 2020). Their sparse presence in modern mineral soils (Francien Peterse, personal observation, 2020; based on metadata from De Jonge et al., 2019; Kirkels et al., 2020), seems to confirm this, although abundant occurrence in peats and lakes (Naafs et al., 2018a; Baxter et al., 2019; Tang et al., 2021) shows clear potential for terrestrial input. Despite the uncertainties in sourcing of brGMGTs, we find signals in the brGMGTs at Site 1172 resemble those from East African lakes. For example, the brGMGT index (brGMGTI), which was derived to quantify the relationship between brGMGT composition and MAAT in surface sediments of East African lakes (Baxter et al., 2019), seems to be correlated to temperature in our record as well (Fig. 12b, d). In addition, H1020c is practically absent in the cold mid-Paleocene part of our record, similar to what occurs in cold (<12 °C), high-altitude lakes (Baxter et al., 2019), which suggests that the biosynthesis of H1020c occurs only above a certain temperature, or that the microbes that biosynthesize H1020c do not live at low temperatures. However, contrasting to in lakes, site 1172 lacks H1048 isomers in the cold mid-Paleocene interval, illustrating that there are also differences between freshwater and marine depositional settings.
The HMBT record does not reflect a temperature signal when using all brGMGT isomers in the calculation (Fig. 12f), as H1020 isomers are by far the most abundant brGMGTs at Site 1172, and any change in the abundance of H1020c is compensated by both H1020b and H1020a in our record. In contrast, only using the H1020c and H1034b isomers does show some correlation to temperature in our record (Fig. 12g).
%BrGMGT does not show a clear relationship with temperature (Fig. 12h, i), in contrast to observations in modern peats (Naafs et al., 2018a) and lake sediments (Baxter et al., 2019). We do note the extremely high %brGMGT (∼ 80 %) in the Maastrichtian and Oligocene, much higher than seen elsewhere. We also do not see a clear inverse relationship between %brGMGT and the BIT index, as in the Arctic Eocene record of Sluijs et al. (2020). There, it does correlate with SST, which we do not see either. These discrepancies may be because of the complexity in the sources of brGDGTs in the records.
BrGMGTs are more abundant and different in composition in the Oligocene, compared to the rest of the record. This coincides with abundant signs of overprints in all br- and isoGDGT indices, which may indicate a source change of brGMGTs in this interval, e.g., related to the same changes in contribution that cause the overprints in isoGDGTs. The differences in brGMGT signals between our record, the Eocene Arctic Ocean record and modern sediments demonstrate that more research is needed on their modern sources and environmental dependencies to further assess their use and value in paleoclimate studies.
5.3 Integrated environmental and climatological reconstruction
5.3.1 Sea level and ecosystem response to SST changes
The abundance of temperature-responsive dinocyst eco-groups qualitatively confirm our SST trends. The thermophile dinocyst eco-group shows higher relative abundance at higher SSTs (Fig. 15). This eco-group has been empirically linked to SST in a global compilation of late Paleocene–early Eocene records (Frieling and Sluijs, 2018), and here we see the same relationship for the longer early Paleogene. The somewhat muted response of the dinocyst assemblages to the large EECO SST rise is consistent with that in other SW Pacific records and microfossil groups (Crouch et al., 2020), and might be related to the already warm background conditions upon which this warming took place. Moreover, the abundance of SST-insensitive dinocysts in the assemblage and absence of typical cold indicators could further explain the muted response. The relationship between isoGDGT-based SSTs and relative abundance of the supposedly cold-affiliated endemic dinocysts (Bijl et al., 2011) is not as clear. This might be because the majority of dinocyst species within the endemic-Antarctic dinocyst eco-group are restricted to the Eocene (Bijl et al., 2011). The absence of endemic-Antarctic dinocysts in the cold mid-Paleocene is interesting, given that some endemic species had already appeared (Bijl et al., 2013b). It might be that the strong freshwater influence negatively affected their proliferation in the mid-Paleocene. Indeed, from 50 Ma onwards, SST has a negative correlation with the %endemic-Antarctic dinocyst abundance in the record (Fig. 15; see Bijl et al., 2011), which may indicate a more distinct biogeographical separation through the development of stronger meridional gradients or evolutive adaptation of the endemic dinocyst community to more polar environments following the extreme warmth of the EECO.
We particularly note the correlation between TEX86-based SST and the relative abundance of more open-ocean-affiliated dinocysts (Fig. 15), which suggests that SST correlates with regional sea level. The thermophilic and open-ocean eco-groups share some outer neritic species. However, the strong covariance is caused by the absence of other open-ocean species, such as Impagidinium spp., Spiniferites spp. and Operculodinium spp. Moreover, sea-level trends derived from open-ocean dinocysts are supported by weight %CaCO3 in these sediments in the middle Eocene (Röhl et al., 2004a), on orbital and longer timescales. SST-induced sea-level changes hint at steric effects as driver. Indeed, because of the flatness of continental shelf areas during long-term greenhouse climates (Somme et al., 2009), small changes in regional sea level will cause large changes in distance to shore and associated characteristics, including, e.g., salinity, nutrients and suspended sediment loads, which subsequently shapes the dinocyst assemblages.
The SST control on dinocyst assemblages is further demonstrated in diversity and assemblage variability indices. Throughout the long time interval covered by our record, dinocyst richness and diversity show a remarkably similar pattern to TEX86-based SST. Species richness, as well as diversity expressed in the Shannon and Simpson indices and Fisher's alpha, reaches a maximum during the prolonged warmth of the EECO and drop during middle–late Eocene cooling. These relationships are demonstrated by a modest correlation coefficient between diversity and TEX86 (Fig. 14). This pattern holds for the long-term trends, as well as for the short-term PETM, but, surprisingly, not for the MECO. Dinocyst diversity is known to peak midway on an inshore-to-offshore transect in the modern and Eocene oceans (Brinkhuis, 1994; Pross and Brinkhuis, 2005). As our assemblages indeed consist of many mid-shelf species, the correlation between diversity and SST might thus be indirectly related through habitat size, with expansion of the flat shelf area and thereby increase in shelf niches during the EECO (Somme et al., 2009). Variability as indicated by the Gibbs index records the opposite pattern to diversity for the long-term trends into and out of the EECO (Fig. 14). That is, the lower-diversity assemblages in general have a higher variability or sample-to-sample fluctuations within the relative abundances. This indicates that the higher-diversity dinocyst assemblages might be more ecologically resilient.
5.3.2 Marine environmental response to runoff changes
Senegalinium cpx. abundance broadly correlates with the IR (Fig. 16), which signals input of river-produced brGDGTs. Senegalinium cpx. is generally thought to have tolerated low salinity environments (Sluijs and Brinkhuis, 2009; Barke et al., 2011). These two proxies together confirm a large input of freshwater at this site during the mid-to-late Paleocene in line with high relative abundance of terrestrial palynomorphs, low abundances of open-ocean dinocysts and high IR values (Fig. 16). Interestingly, Phthanoperidinium spp., which is also generally associated with low-salinity to near freshwater conditions (Sluijs and Brinkhuis, 2009; Barke et al., 2011; Frieling and Sluijs, 2018), does not correlate with IR (Fig. 16). Because we find different species of Phthanoperidinium spp. than those previously associated to freshwater conditions (e.g., Barke et al., 2011), it could be that the freshwater tolerance of Phthanoperidinium spp. was not shared among all species. It could also be that some species of Phthanoperidinium spp. were slightly less euryhaline than Senegalinium, contrary to the species noted by Barke et al. (2011).
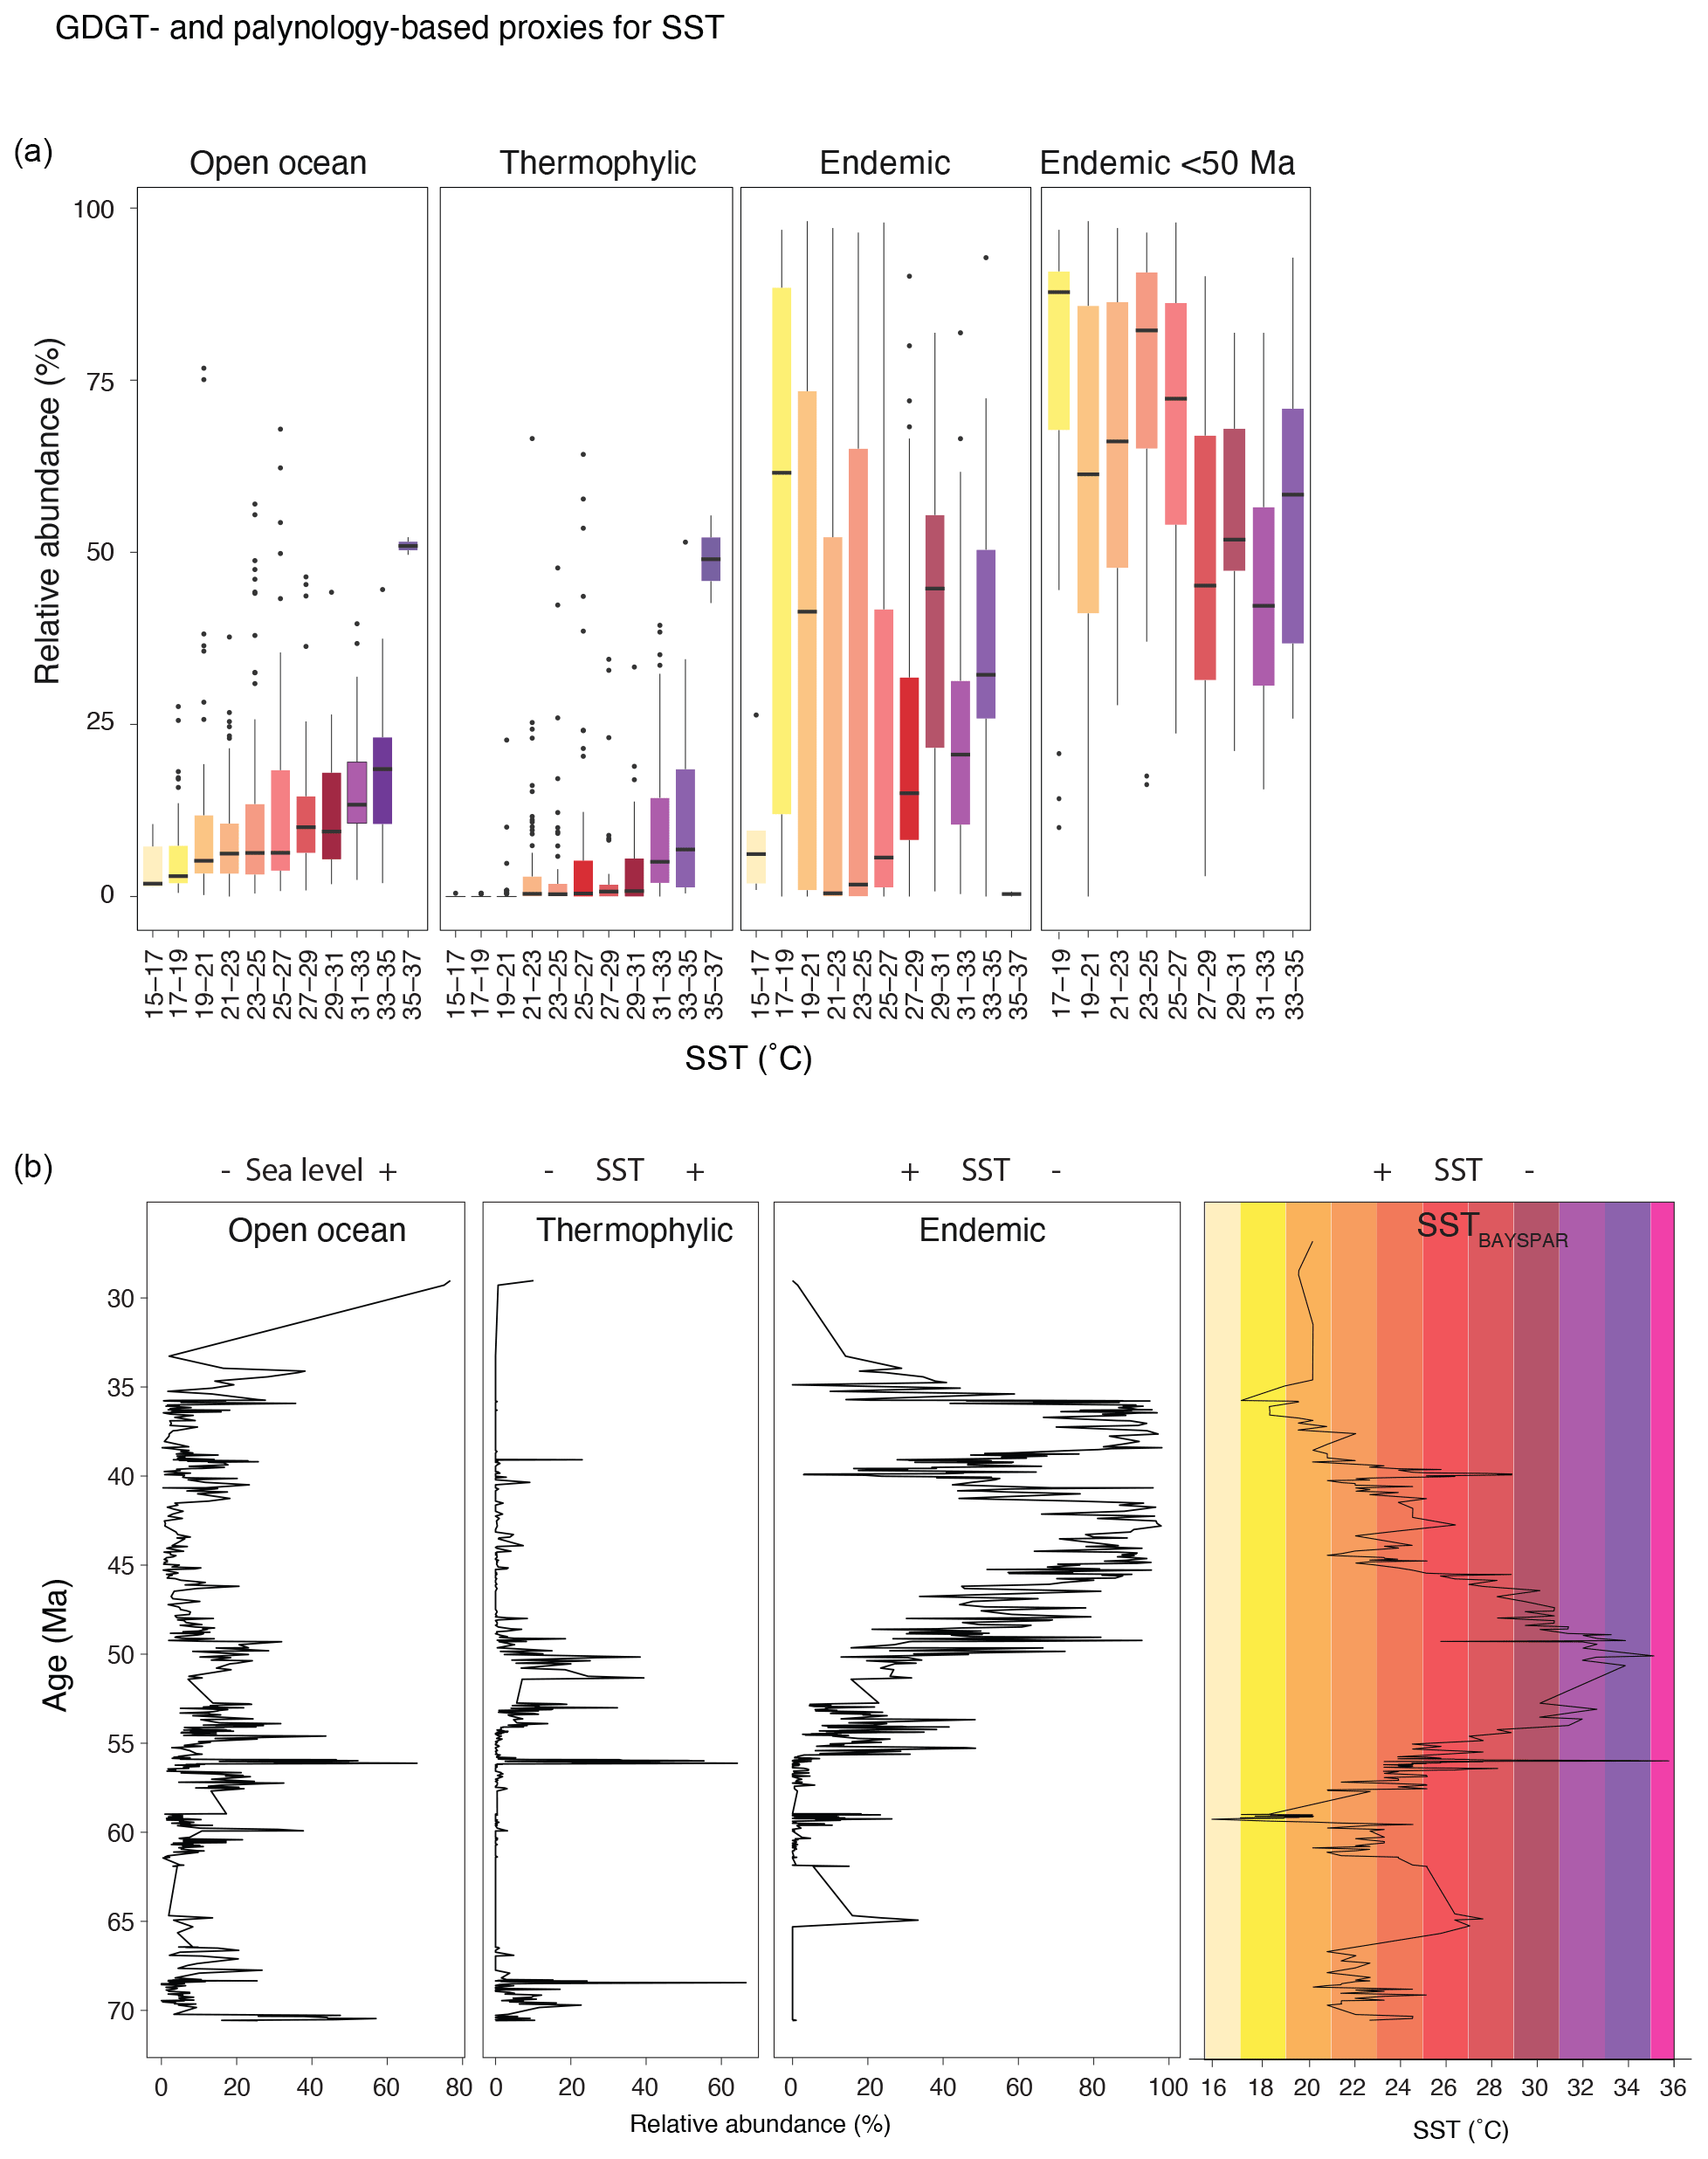
Figure 15isoGDGT- and palynology-based proxies for SST. (a) Relative abundance of open-ocean, thermophylic and endemic-Antarctic dinocyst eco-groups (for groups, see Table 3; total dataset and samples <50 Ma only) plotted against linearly interpolated (resampled) TEX86-based SST, in 2° bins. Median (black bars), lower-to-upper quartiles (25th–75th percentiles; colored envelopes), lower-to-upper whiskers (95 % confidence intervals; black lines), outlier samples (black dots). (b) Time series of the same dinocyst eco-groups and SST.
Tasmania was located at latitudes between 55 and 60° S, in the middle of the region of strong westerly winds, within the range of low atmospheric pressure and received a large amount of precipitation during the Paleocene (Huber and Caballero, 2011). River input from Tasmania and perhaps also Australia could have reached the site. Interestingly, while Tasmania migrated northwards only a few degrees latitude between 60 and 40 Ma (Fig. 1), under warmer temperature conditions as in the mid-Paleocene, the freshwater input decreased, based on both Senegalinium cpx., terrestrial palynomorph abundance (decimated abundance from 50 Ma onwards) and the IR (decrease to normal values around 54 Ma; Fig. 16). This suggests either a rerouting of river input or a change in hinterland precipitation regime. Support for the latter comes from clay mineralogical data, showing an increase in kaolinite starting at 50 Ma (Fig. 2; Robert, 2004). Kaolinite forms abundantly at the base of acidic peats (Staub and Cohen, 1978; Korasidis et al., 2019) and in old, leached soils, which were ubiquitous in the Eocene Australian hinterland (Holdgate et al., 2009). While the hinterland could well retain the kaolinite-rich clays during the Maastrichtian and Paleocene, because the site was under a year-round high-precipitation regime, it was less efficient in doing so when the hinterland experienced seasonally more variable climatic conditions as Australia migrated northward. The increase in kaolinite delivery to Site 1172 is hence interpreted as a signal of enhanced soil (or peat) erosion from the catchment areas in Tasmania and SW, as a result of a (seasonally?) more variable climate regime.
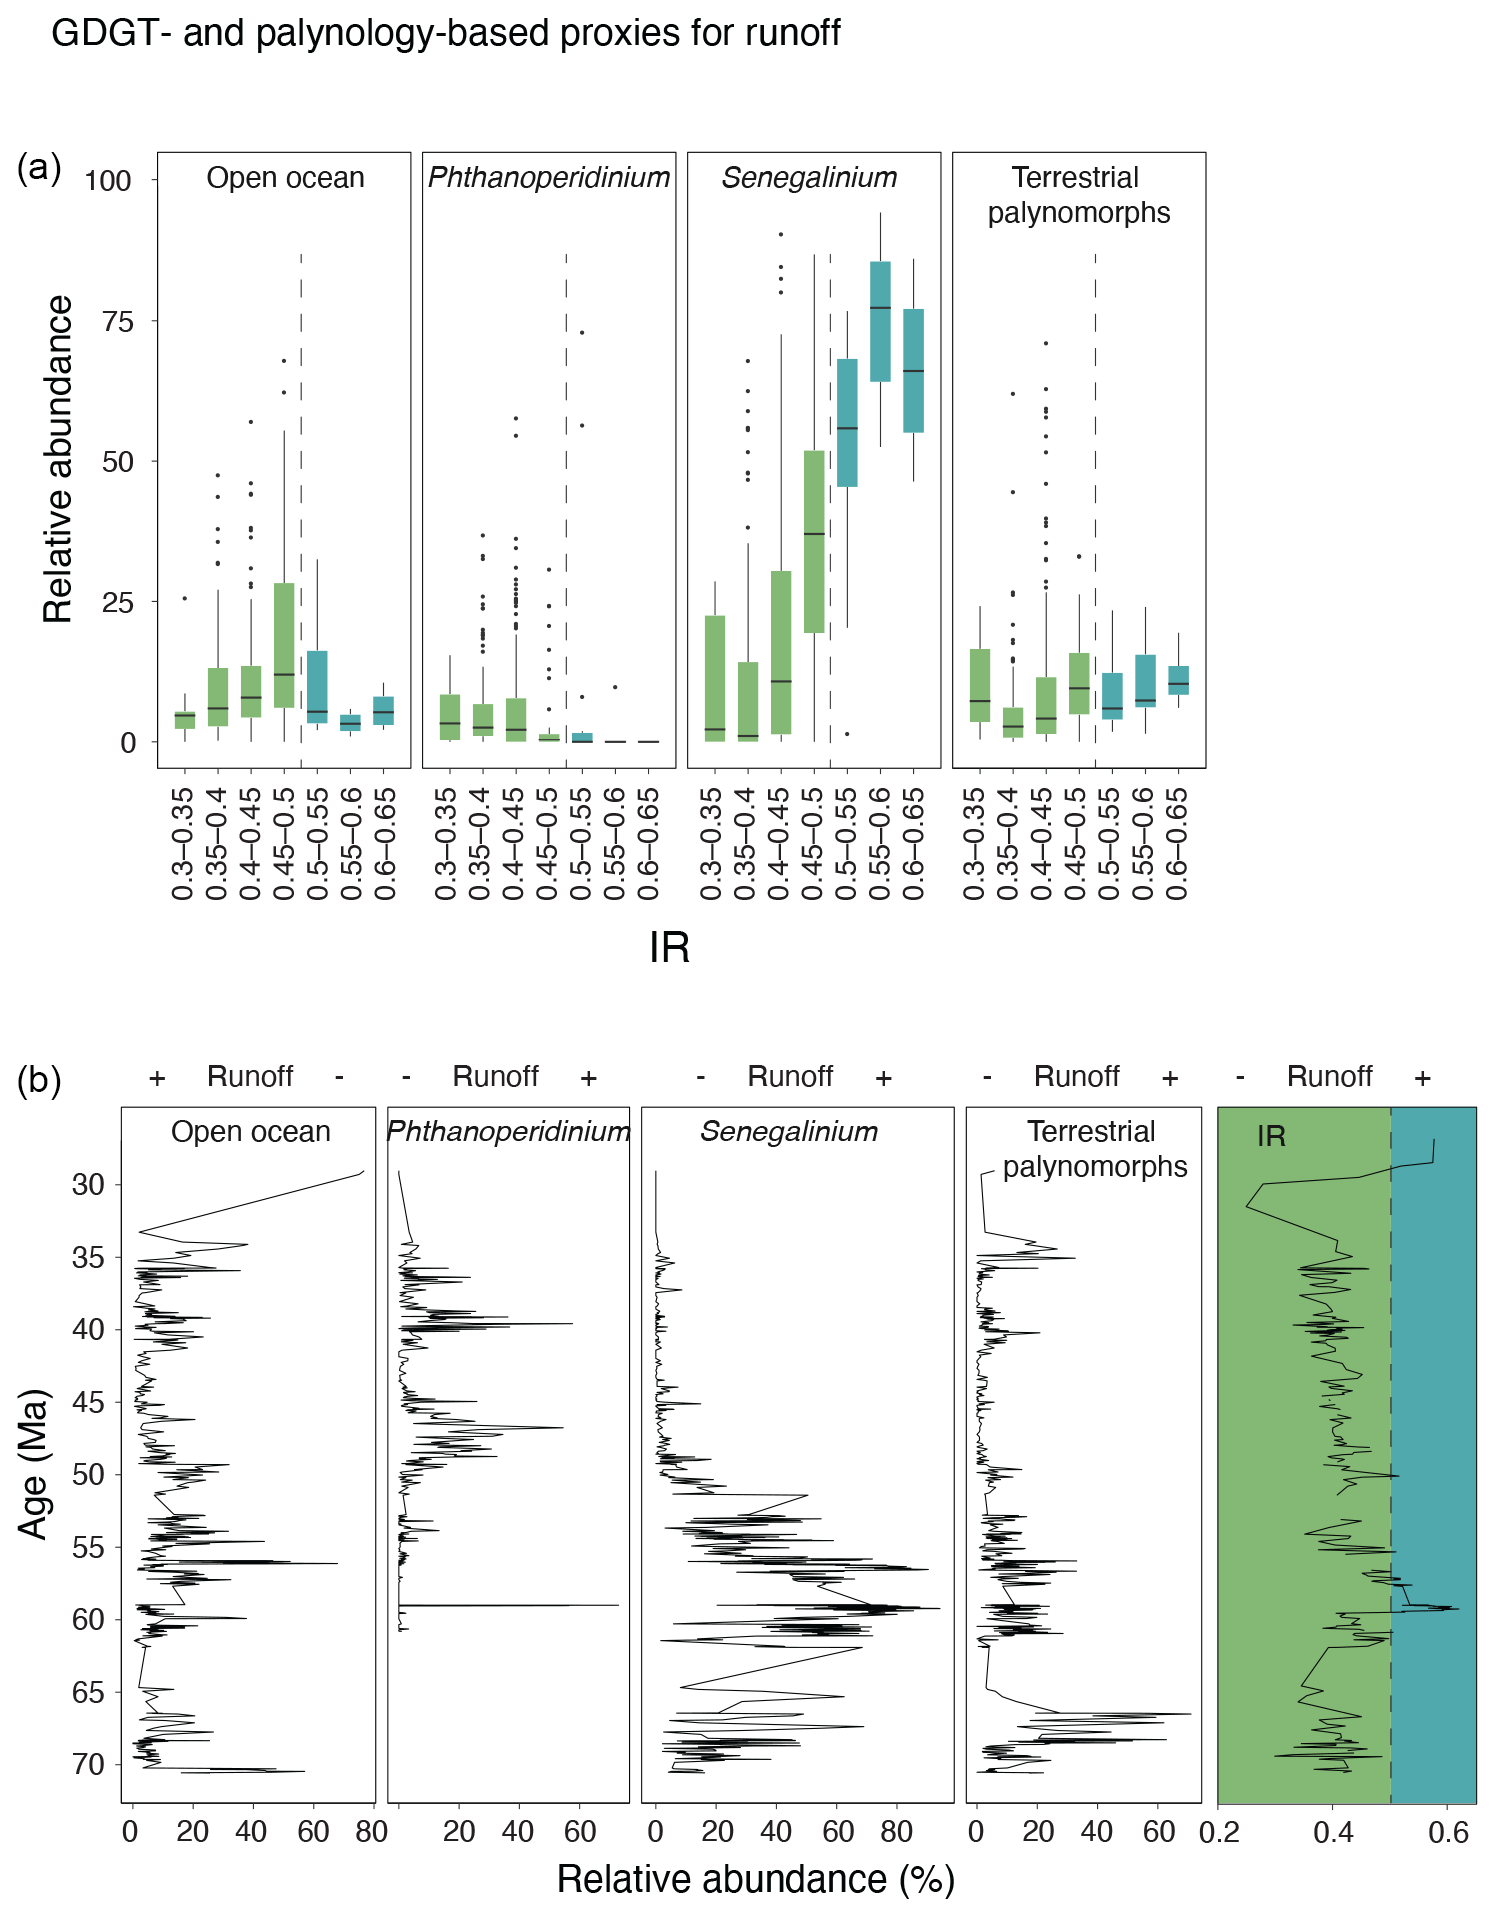
Figure 16BrGDGT- and palynology-based proxies for river runoff. (a) Relative abundance of open-ocean, Phthanoperidinium spp., Senegalinium cpx. (for groups, see Table 3) and terrestrial palynomorphs in 0.05 index unit bins of the resampled IR. The dashed line separates elevated IR bins from non-elevated IR bins. Median (black bars), lower-to-upper quartiles (25th–75th percentiles; colored envelopes), lower-to-upper whiskers (95 % confidence intervals; black lines), outlier samples (black dots). (b) Time series of the same palynology eco-groups and the IR.
5.4 Environmental and climatological changes in the catchment
The long-term trends in the BIT index are at odds with all the river runoff indicators in our data (Fig. 7). BIT remains low during the interval in which increased river water discharge is inferred but increases when this river–runoff signal decreases. This is unexpected because the BIT index should reflect high input of soil-derived brGDGTs into the marine sediments, associated with increased discharge (Hopmans et al., 2004). There are two ways to explain this signal. The BIT index could be responding to marine crenarchaeol production rather than to the terrestrial brGDGT flux. Indeed, marine productivity could have been spurred by runoff and associated nutrient delivery to the coastal zone during the Paleocene, and decreased in the Eocene, thereby lowering and increasing BIT index values, respectively. Another explanation is that the BIT index has been influenced by in-river crenarchaeol production, although crenarchaeol concentrations in rivers are normally negligible compared to those produced in the marine realm (Zell et al., 2013). Decreasing BIT index values with increasing river and soil input has been related to climate in the catchment in the late Quaternary Zambezi River (Lattaud et al., 2017), where hinterland vegetation and seasonality in precipitation controls soil–OM input to the marine realm. Studies of modern soil–river–ocean pathways in the Amazon River system show that whereas river-suspended brGDGTs in its upper tributaries during the wet season reflect catchment soils (Kirkels et al., 2020), the lower Amazon contains increasing contributions of in situ produced brGDGTs, especially during the dry season, when soil mobilization is limited (Zell et al., 2013). In addition, soil-derived brGDGTs appear to be rapidly lost upon entering a river and are only effectively transferred to the ocean floor in catchments with a distinct rainy season or during periods with heavy rainfall (e.g., Weijers et al., 2007b; Guo et al., 2020). The marine surface sediments of the Amazon Fan consequently contain a mix of soil, fluvial and marine brGDGTs (Zell et al., 2014). Thus, here we propose the following scenario to explain the BIT index trends for Site 1172: in the early Paleocene–early Eocene, year-round precipitation caused strong freshwater delivery into the SW Pacific. Soil-derived brGDGTs were partly remineralized in the river catchment, and the strongly diluted soil-derived OM was dominated by river-produced brGDGTs, which suppressed the BIT index. This explains the unexpectedly cold MAATs derived from the mid-Paleocene samples with high IR. The high fluvial discharge also promoted pelagic isoGDGT production, including crenarchaeol, due to associated nutrient delivery, further lowering the BIT index. Later in the early Eocene, precipitation in the hinterland decreased and became more seasonal as the hinterland gradually drifted out of the zone of intense precipitation. This led to a more effective transfer of soil-derived brGDGTs and kaolinite to the marine realm, increasing the BIT index at the ETP.
We have analyzed GDGT and dinoflagellate cyst data in samples from the Maastrichtian–lower Oligocene sediments at ODP Site 1172. IsoGDGTs represent a pelagic signal throughout the Maastrichtian–Eocene but are influenced by sedimentary-produced isoGDGTs in the Oligocene. BrGDGTs at this site are likely primarily soil or peat derived; albeit evolutionary changes in brGDGT producers may be responsible for Paleogene-specific brGDGT signals. Exceptions are the mid-Paleocene, where river-produced brGDGTs influence the record, and the Oligocene, where marine in situ brGDGTs dominate. TEX86 and MBT'5me records reveal the SST and MAAT evolution of the region, respectively, within the range of independent existing paleotemperature reconstructions from the same samples. A temperature offset between the SST and MAAT proxies remains poorly reconciled with the coastal proximity of the site but is likely a combined effect of evolutionary trends in MBT'5me–MAAT relationships and a disparate integration of climate signals by both proxies. The subdued air temperature cooling in the middle Eocene compared to the SST cooling could in part reflect progressive northward tectonic drift of the hinterland, while SSTs responded to stronger progressive cooling of southern-sourced surface waters. Strong MAAT cooling occurred stepwise at 35.5 Ma and around the Eocene–Oligocene transition. The absence of SST cooling around the Eocene–Oligocene transition seems to suggest some disconnection between oceanographic reorganizations and regional MAAT changes. The absence of a MAAT response at the PETM and MECO remains unresolved but might be related to shifting sources of brGDGTs during these warm phases.
The relatively high IR and low #ringstetra confirm inferences from dinocyst assemblages of an inner mid-shelf depositional setting. We reconstruct strong river runoff in the mid-Paleocene–earliest Eocene at this site and normal open-marine conditions thereafter. The latter reflects increased seasonality in precipitation in the catchment as the continent tectonically migrates northwards during the middle and late Eocene, out of the region of year-round precipitation. The correlation between SST changes, dinoflagellate cyst assemblages and biodiversity metrics suggests temperature-controlled sea-level changes influenced the site, probably through steric effects. We find corroborating evidence for a temperature signal in brGMGT assemblages, further demonstrating the potential to develop novel proxies with more extensive studies of modern distributions.
Raw GDGT/GMGT and palynological data presented in this paper, as well as R markdown code for data analysis and visualization, can be found on GitHub (https://github.com/bijlpeter83/RGDGT.git, last access: 8 November 2021). Data were deposited on Zenodo under https://doi.org/10.5281/zenodo.4471204 (Bijl, 2021).
The supplement related to this article is available online at: https://doi.org/10.5194/cp-17-2393-2021-supplement.
AS (PETM) and PKB (part) prepared samples for GDGT analyses. PKB (part), AS (PETM) and CB (part) integrated UHPLC-MS results. AS (PETM) and PKB (part) analyzed palynological samples. All authors contributed to the interpretation of the organic results, and PKB, AS, JF and MC interpreted dinocyst results. PKB wrote the R script for data analyses and visualization, drafted the figures and wrote the paper with input from all authors.
The authors declare that they have no conflict of interest.
Publisher’s note: Copernicus Publications remains neutral with regard to jurisdictional claims in published maps and institutional affiliations.
This research used samples from the Ocean Drilling Program, which was funded through US National Science foundation under the management of Joint Oceanographic Institutions, Inc. We thank Klaas Nierop, Desmond Eefting, Bregje van der Bolt, and Natasja Welters for technical/analytical support. We thank Chris Hollis and an anonymous reviewer for constructive, critical reviews which greatly improved the paper.
Peter K. Bijl acknowledges funding through NWO Vernieuwingsimpuls Veni (grant no. 863.13.002). This work was carried out under the program of the Netherlands Earth System Science Centre (NESSC), financially supported by the Dutch Ministry of Education, Culture and Science. Marlow Julius Cramwinckel and Appy Sluijs acknowledge the Ammodo Foundation for funding unfettered research of laureate Appy Sluijs. Peter K. Bijl and Appy Sluijs thank the European Research Council for starting grant no. 802835 (OceaNice) and consolidator grant no. 771497 (SPANC), respectively.
This paper was edited by Erin McClymont and reviewed by Chris Hollis and one anonymous referee.
Anagnostou, E., John, E. H., Edgar, K. M., Foster, G. L., Ridgwell, A., Inglis, G. N., Pancost, R. D., Lunt, D. J., and Pearson, P. N.: Changing atmospheric CO2 concentration was the primary driver of early Cenozoic climate, Nature, 533, 380–384, https://doi.org/10.1038/nature17423, 2016.
Anagnostou, E., John, E. H., Babila, T. L., Sexton, P. F., Ridgwell, A., Lunt, D. J., Pearson, P. N., Chalk, T. B., Pancost, R. D., Foster, G. L.: Proxy evidence for state-dependence of climate sensitivity in the Eocene greenhouse, Nat. Commun., 11, 4436, https://doi.org/10.1038/s41467-020-17887-x, 2020.
Barke, J., Abels, H. A., Sangiorgi, F., Greenwood, D. R., Sweet, A. R., Donders, T., Reichart, G. J., Lotter, A. F., and Brinkhuis, H.: Orbitally forced Azolla blooms and middle Eocene Arctic hydrology: Clues from palynology, Geology, 39, 427–430, https://doi.org/10.1130/G31640.1, 2011.
Baxter, A. J., Hopmans, E. C., Russell, J. M., and Sinninghe Damsté, J. S.: Bacterial GMGTs in east african lake sediments: Their potential as palaeotemperature indicators, Geochim. Cosmochim. Acta, 259, 155–169, https://doi.org/10.1016/j.gca.2019.05.039, 2019.
Bijl, P.: bijlpeter83/DINOSTRAT: Release DINOSTRAT V1 for peer review process (1.0), Zenodo [data set], https://doi.org/10.5281/zenodo.4471204, 2021.
Bijl, P. K., Schouten, S., Brinkhuis, H., Sluijs, A., Reichart, G. J., and Zachos, J. C.: Early Palaeogene temperature evolution of the southwest Pacific Ocean, Nature, 461, 776–779, 2009.
Bijl, P. K., Houben, A. J. P., Schouten, S., Bohaty, S. M., Sluijs, A., Reichart, G.-J., Sinninghe Damsté, J. S., and Brinkhuis, H.: Transient middle Eocene atmospheric carbon dioxide and temperature variations, Science, 330, 819–821, https://doi.org/10.1126/science.1193654, 2010.
Bijl, P. K., Pross, J., Warnaar, J., Stickley, C. E., Huber, M., Guerstein, R., Houben, A. J. P., Sluijs, A., Visscher, H., and Brinkhuis, H.: Environmental forcings of Paleogene Southern Ocean dinoflagellate biogeography, Paleoceanography, 26, PA1202, https://doi.org/10.1029/2009PA001905, 2011.
Bijl, P. K., Bendle, J. A. P., Bohaty, S. M., Pross, J., Schouten, S., Tauxe, L., Stickley, C. E., McKay, R. M., Röhl, U., Olney, M., Sluijs, A., Escutia, C., and Brinkhuis, H.: Eocene cooling linked to early flow across the Tasmanian Gateway, P. Natl. Acad. Sci. USA, 110, 9645–9650, https://doi.org/10.1073/pnas.1220872110, 2013a.
Bijl, P. K., Sluijs, A., and Brinkhuis, H.: A magneto- chemo- stratigraphically calibrated dinoflagellate cyst zonation of the early Paleogene South Pacific Ocean, Earth-Sci. Rev., 124, 1–31, 2013b.
Bijl, P. K., Sluijs, A., and Brinkhuis, H.: Erratum to ”A magneto- and chemostratigraphically calibrated dinoflagellate cyst zonation of the early Paleogene South Pacific Ocean” [Earth-Sci. Rev., 124 (2013) 1–31], Earth-Sci. Rev., 134, 160–163, https://doi.org/10.1016/j.earscirev.2014.03.010, 2014.
Bijl, P. K., Brinkhuis, H., Egger, L. M., Eldrett, J. S., Frieling, J., Grothe, A., Houben, A. J. P., Pross, J., Śliwińska, K. K., and Sluijs, A.: Comment on “Wetzeliella and its allies–the “hole” story: A taxonomic revision of the Paleogene dinoflagellate subfamily Wetzelielloideae” by Williams et al. (2015), Palynology, 41, 423–429. https://doi.org/10.1080/01916122.2016.1235056, 2017.
Blaga, C. I., Reichart, G.-J., Heiri, O., and Sinninghe Damsté, J. S.: Tetraether membrane lipid distributions in water-column particulate matter and sediments: A study of 47 European lakes along a north-south transect, J. Paleolimnol., 41, 523–540, https://doi.org/10.1007/s10933-008-9242-2, 2009.
Bohaty, S. M., Zachos, J. C., Florindo, F., and Delaney, M. L.: Coupled greenhouse warming and deep-sea acidification in the middle Eocene, Paleoceanography, 24, PA001676, https://doi.org/10.1029/2008PA001676, 2009.
Bohaty, S. M., Zachos, J. C., and Delaney, M. L.: Foraminiferal evidence for Southern Ocean cooling across the Eocene–Oligocene transition, Earth Planet. Sc. Lett., 317–318, 251–261, https://doi.org/10.1016/j.epsl.2011.11.037, 2012.
Brinkhuis, H.: Late Eocene to early Oligocene dinoflagellate cysts from the Priabonian type-area (northeast Italy); biostratigraphy and palaeoenvironmental interpretation, Palaeogeogr. Palaeocl., 107, 121–163, 1994.
Brinkhuis, H., Sengers, S., Sluijs, A., Warnaar, J., and Williams, G. L.: Latest Cretaceous to earliest Oligocene, and Quaternary dinoflagellates from ODP site 1172, East Tasman Plateau, in: Proceedings of the Ocean Drilling Program, scientific results, edited by: Exon, N. and Kennett, J. P., U.S. Government Printing Office, College Station, Texas, USA, https://doi.org/10.2973/odp.proc.sr.189.106.2003, 2003.
Cande, S. C., and Stock, J. M.: Cenozoic reconstructions of the Australia-new Zealand-south Pacific sector of antarctica, in: The Cenozoic Southern Ocean: Tectonics, sedimentation and climate change between australia and Antarctica, edited by: Exon, N. F., Kennett, P., and Malone, M., Geophys. Monogr. Ser., American Geophysical Union, 5–18, 2004.
Carpenter, R. J., Jordan, G. J., Macphail, M. K., and Hill, R. S.: Near-tropical early Eocene terrestrial temperatures at the Australo-Antarctic margin, western Tasmania, Geology, 40, 267–270, https://doi.org/10.1130/G32584.1, 2012.
Contreras, L., Pross, J., Bijl, P. K., Koutsodendris, A., Raine, J. I., van de Schootbrugge, B., and Brinkhuis, H.: Early to middle Eocene vegetation dynamics at the Wilkes Land Margin (Antarctica), Rev. Palaeobot. Palynol., 197, 119–142, https://doi.org/10.1016/j.revpalbo.2013.05.009, 2013.
Contreras, L., Pross, J., Bijl, P. K., O'Hara, R. B., Raine, J. I., Sluijs, A., and Brinkhuis, H.: Southern high-latitude terrestrial climate change during the Palaeocene–Eocene derived from a marine pollen record (ODP Site 1172, East Tasman Plateau), Clim. Past, 10, 1401–1420, https://doi.org/10.5194/cp-10-1401-2014, 2014.
Cramwinckel, M. J., Huber, M., Kocken, I. J., Agnini, C., Bijl, P. K., Bohaty, S. M., Frieling, J., Goldner, A., Hilgen, F. J., Kip, E. L., Peterse, F., Van Der Ploeg, R., Röhl, U., Schouten, S., and Sluijs, A.: Synchronous tropical and deep ocean temperature evolution in the Eocene, Nature, 559, 382–386, 2018.
Cramwinckel, M. J., Woelders, L., Huurdeman, E. P., Peterse, F., Gallagher, S. J., Pross, J., Burgess, C. E., Reichart, G.-J., Sluijs, A., and Bijl, P. K.: Surface-circulation change in the southwest Pacific Ocean across the Middle Eocene Climatic Optimum: inferences from dinoflagellate cysts and biomarker paleothermometry, Clim. Past, 16, 1667–1689, https://doi.org/10.5194/cp-16-1667-2020, 2020.
Creech, J. B., Baker, J. A., Hollis, C. J., Morgans, H. E. G., and Smith, E. G. C.: Eocene sea temperatures for the mid-latitude southwest Pacific from ratios in planktonic and benthic foraminifera, Earth Planet. Sc. Lett., 299, 483–495, 2010.
Crouch, E. M., Shepherd, C. L., Morgans, H. E. G., Naafs, B. D. A., Dallanave, E., Phillips, A., Hollis, C. J., and Pancost, R. D.: Climatic and environmental changes across the Early Eocene Climatic Optimum at mid-Waipara River, Canterbury Basin, New Zealand, Earth-Sci. Rev., 200, 102961, https://doi.org/10.1016/j.earscirev.2019.102961, 2020.
Dallanave, E., Bachtadse, V., Crouch, E. M., Tauxe, L., Shepherd, C. L., Morgans, H. E. G., Hollis, C. J., Hines, B. R., and Sugisaki, S.: Constraining early to middle Eocene climate evolution of the southwest Pacific and Southern Ocean, Earth Planet. Sc. Lett., 433, 380–392. https://doi.org/10.1016/j.epsl.2015.11.010, 2016.
Dearing Crampton-Flood, E., Peterse, F., Munsterman, D., and Sinninghe Damsté, J. S.: Using tetraether lipids archived in North Sea Basin sediments to extract North Western European Pliocene continental air temperatures, Earth Planet. Sc. Lett., 490, 193–205, 2018.
Dearing Crampton-Flood, E., Peterse, F., and Sinninghe Damsté, J. S.: Production of branched tetraethers in the marine realm: Svalbard fjord sediments revisited, Org. Gochem., 138, 103907, https://doi.org/10.1016/j.orggeochem.2019.103907, 2019.
Dearing Crampton-Flood, E., Tierney, J. E., Peterse, F., Kirkels, F. M. S. A., and Sinninghe Damsté, J. S.: BayMBT: A bayesian calibration model for branched glycerol dialkyl glycerol tetraethers in soils and peats, Geochim. Cosmochim. Ac., 268, 142–159, https://doi.org/10.1016/j.gca.2019.09.043, 2020.
De Jonge, C., Hopmans, E. C., Stadnitskaia, A., Rijpstra, W. I. C., Hofland, R., Tegelaar, E., and Sinninghe Damsté, J. S.: Identification of novel penta- and hexamethylated branched glycerol dialkyl glycerol tetraethers in peat using HPLC-MS2, GC-MS and GC-SMB-MS, Org. Geochem., 54, 78–82, https://doi.org/10.1016/j.orggeochem.2012.10.004, 2013.
De Jonge, C., Hopmans, E. C., Zell, C. I., Kim, J.-H., Schouten, S., and Sinninghe Damsté, J. S.: Occurrence and abundance of 6-methyl branched glycerol dialkyl glycerol tetraethers in soils: Implications for palaeoclimate reconstruction, Geochim. Cosmochim. Ac., 141, 97–112, https://doi.org/10.1016/j.gca.2014.06.013, 2014a.
De Jonge, C., Stadnitskaia, A., Hopmans, E. C., Cherkashov, G., Fedotov, A., and Sinninghe Damsté, J. S.: In situ produced branched glycerol dialkyl glycerol tetraethers in suspended particulate matter from the Yenisei River, eastern Siberia, Geochim. Cosmochim. Ac., 125, 476–491, https://doi.org/10.1016/j.gca.2013.10.031, 2014b.
De Jonge, C., Stadnitskaia, A., Hopmans, E. C., Cherkashov, G., Fedotov, A., Streletskaya, I. D., Vasiliev, A. A., and Sinninghe Damsté, J. S.: Drastic changes in the distribution of branched tetraether lipids in suspended matter and sediments from the Yenisei River and Kara Sea (Siberia): Implications for the use of brGDGT-based proxies in coastal marine sediments, Geochim. Cosmochim. Ac., 165, 200–225, https://doi.org/10.1016/j.gca.2015.05.044, 2015.
De Jonge, C., Stadnitskaia, A., Cherkashov, G., and Sinninghe Damsté, J. S.: Branched glycerol dialkyl glycerol tetraethers and crenarchaeol record post-glacial sea level rise and shift in source of terrigenous brGDGTs in the Kara Sea (Arctic Ocean), Org. Geochem., 92, 42–54, https://doi.org/10.1016/j.orggeochem.2015.11.009, 2016.
De Jonge, C., Radujković, D., Sigurdsson, B. D., Weedon, J. T., Janssens, I., and Peterse, F.: Lipid biomarker temperature proxy responds to abrupt shift in the bacterial community composition in geothermally heated soils, Org. Geochem., 137, 894 103897, https://doi.org/10.1016/j.orggeochem.2019.07.006, 2019.
Douglas, P. M. J., Affek, H. P., Ivany, L. C., Houben, A. J. P., Sijp, W. P., Sluijs, A., Schouten, S., and Pagani, M.: Pronounced zonal heterogeneity in Eocene southern high latitude sea surface temperatures, P. Natl. A. Sci., 111, 6582–6587, 2014.
Elling, F. J., Könneke, M., Lipp, J. S., Becker, K. W., Gagen, E. J., and Hinrichs, K.-U.: Effects of growth phase on the membrane lipid composition of the thaumarchaeon Nitrosopumilus maritimus and their implications for archaeal lipid distributions in the marine environment, Geochim. Cosmochim. Ac., 141, 579–597, https://doi.org/10.1016/j.gca.2014.07.005, 2014.
Evans, D., Sagoo, N., Renema, W., Cotton, L. J., Müller, W., Todd, J. A., Saraswati, P. K., Stassen, P., Ziegler, M., Pearson, P. N., Valdes, P. J., and Affek, H. P.: Eocene greenhouse climate revealed by coupled clumped isotope- thermometry, P. Natl. Acad. Sci. USA, 115, 1174–1179, https://doi.org/10.1073/pnas.1714744115, 2018.
Exon, N. F., Kennett, J. P., and Malone, M.: Proceedings of the Ocean Drilling Program, initial reports, 189, US Government Printing Office, College Station, Texas, USA, 2001.
Feng, X., Vonk, J. E., van Dongen, B. E., Gustafsson, Ö., Semiletov, I. P., Dudarev, O. V., Wang, Z., Montluçon, D. B., Wacker, L., and Eglinton, T. I.: Differential mobilization of terrestrial carbon pools in Eurasian Arctic river basins, P. Natl. Acad. Sci., 110, 14168–14173, https://doi.org/10.1073/pnas.1307031110, 2013.
Fensome, R. A., Taylor, F. J. R., Norris, G., Sarjeant, W. A. S., Wharton, D. I., and Williams, G. L.: A classification of modern and fossil dinoflagellates, in: Micropalaeontology, Special publication no. 7, edited by: Dinkins, G., Sheridan Press, Hanover, Pennsylvania, USA, 351 pp., 1993.
Fisher, R. A., Corbet, A. S., and Williams, C. B.: The relation between the number of species and the number of individuals in a random sample of an animal population, J. Anim. Ecol., 12, 42–58, https://doi.org/10.2307/1411, 1943.
Foster, G. L., Royer, D. L., and Lunt, D. J.: Future climate forcing potentially without precedent in the last 420 million years, Nat. Commun., 8, 14845, https://doi.org/10.1038/ncomms14845, 2017.
Frieling, J., and Sluijs, A.: Towards quantitative environmental reconstructions from ancient non-analogue microfossil assemblages: Ecological preferences of Paleocene – Eocene dinoflagellates, Earth-Sci. Rev., 185, 956–973, https://doi.org/10.1016/j.earscirev.2018.08.014, 2018.
Frieling, J., Iakovleva, A. I., Reichart, G.-J., Aleksandrova, G. N., Gnibidenko, Z. N., Schouten, S., and Sluijs, A.: Paleocene–Eocene warming and biotic response in the epicontinental west Siberian Sea, Geology, 42, 767–770, https://doi.org/10.1130/G35724.1, 2014.
Frieling, J., Gebhardt, H., Huber, M., Adekeye, O. A., Akande, S. O., Reichart, G.-J., Middelburg, J. J., Schouten, S., and Sluijs, A.: Extreme warmth and heat-stressed plankton in the tropics during the Paleocene-Eocene Thermal Maximum, Sci. Adv., 3, e1600891, https://doi.org/10.1126/sciadv.1600891, 2017.
Frieling, J., Huurdeman, E. P., Rem, C. C. M., Donders, T. H., Pross, J., Bohaty, S. M., Holdgate, G. R., Gallagher, S. J., McGowran, B., and Bijl, P. K.: Identification of the Paleocene-Eocene boundary in coastal strata in the Otway Basin, Victoria, Australia, J. Micropalaeontol., 37, 317–339, https://doi.org/10.5194/jm-37-317-2018, 2018.
Fuller, M. and Touchard, Y.: On the magnetostratigraphy of the East Tasman Plateau, timing of the opening of the Tasmanian Gateway and paleoenvironmental changes, in: The Cenozoic Southern Ocean. tectonics, sedimentation and climate change between Australia and Antarctica, edited by: Exon, N., Kennett, J. P., and Malone, M., American Geophysical Union (AGU), Geoph. Monog. Series, Washington, USA, 127–151, 2004.
Gibbs, S. J., Bown, P. R., Murphy, B. H., Sluijs, A., Edgar, K. M., Pälike, H., Bolton, C. T., and Zachos, J. C.: Scaled biotic disruption during early Eocene global warming events, Biogeosciences, 9, 4679–4688, https://doi.org/10.5194/bg-9-4679-2012, 2012.
Guasti, E., Speijer, R. P., Brinkhuis, H., Smit, J., and Steurbaut, E.: Paleoenvironmental change at the Danian-Selandian transition in Tunisia: Foraminifera, organic-walled dinoflagellate cyst and calcareous nannofossil records, Mar. Micropaleontol., 59, 210–229, 2006.
Guo, J., Glendell, M., Meersmans, J., Kirkels, F., Middelburg, J. J., and Peterse, F.: Assessing branched tetraether lipids as tracers of soil organic carbon transport through the Carminowe Creek catchment (southwest England), Biogeosciences, 17, 3183–3201, https://doi.org/10.5194/bg-17-3183-2020, 2020.
Hartman, J. D., Sangiorgi, F., Salabarnada, A., Peterse, F., Houben, A. J. P., Schouten, S., Brinkhuis, H., Escutia, C., and Bijl, P. K.: Paleoceanography and ice sheet variability offshore Wilkes Land, Antarctica – Part 3: Insights from Oligocene–Miocene TEX86-based sea surface temperature reconstructions, Clim. Past, 14, 1275–1297, https://doi.org/10.5194/cp-14-1275-2018, 2018.
Hill, P. J. and Exon, N. F.: Tectonics and basin development of the offshore Tasmanian area; incorporating results from deep ocean drilling, in: The Cenozoic Southern Ocean; tectonics, sedimentation and climate change between Australia and Antarctica, edn. 151, edited by: Exon, N. F., Kennett, J. P., and Malone, M., American Geophysical Union, Washington DC, USA, 19–42, 2004.
Hill, P. J. and Moore, A. M. G.: Geological framework of the South Tasman Rise and East Tasman Plateau, Geosci. Australia, 2001/40, 2001.
Hines, B. R., Hollis, C. J., Atkins, C. B., Baker, J. A., Morgans, H. E. G., and Strong, P. C.: Reduction of oceanic temperature gradients in the early Eocene southwest Pacific Ocean, Palaeogeogr. Palaeoclimatol. Palaeoecol., 475, 41–54, https://doi.org/10.1016/j.palaeo.2017.02.037, 2017.
Holdgate, G. R., McGowran, B., Fromhold, T., Wagstaff, B. E., Gallagher, S. J., Wallace, M. W., Sluiter, I. R. K., and Whitelaw, M.: Eocene-Miocene carbon-isotope and floral record from brown coal seams in the Gippsland Basin of southeast Australia, Glob. Planet. Change, 65, 89–103, https://doi.org/10.1016/j.gloplacha.2008.11.001, 2009.
Hollis, C. J., Handley, L., Crouch, E. M., Morgans, H. E. G., Baker, J. A., Creech, J., Collins, K. S., Gibbs, S. J., Huber, M., Schouten, S., Zachos, J. S., and Pancost, R. D.: Tropical sea temperatures in the high latitude South Pacific during the Eocene, Geology, 37, 99–102, https://doi.org/10.1130/G25200A.1, 2009.
Hollis, C. J., Taylor, K. W. R., Handley, L., Pancost, R. D., Huber, M., Creech, J. B., Hines, B. R., Crouch, E. M., Morgans, H. E. G., Crampton, J. S., Gibbs, S., Pearson, P. N., and Zachos, J. C.: Early Paleogene temperature history of the southwest Pacific Ocean: Reconciling proxies and models, Earth Planet. Sc. Lett., 349–350, 53–66, https://doi.org/10.1016/j.epsl.2012.06.024, 2012.
Hollis, C. J., Tayler, M. J. S., Andrew, B., Taylor, K. W., Lurcock, P., Bijl, P. K., Kulhanek, D. K., Crouch, E. M., Nelson, C. S., Pancost, R. D., Huber, M., Wilson, G. S., Ventura, G. T., Crampton, J. S., Schiøler, P., and Phillips, A.: Organic-rich sedimentation in the south Pacific Ocean associated with late Paleocene climatic cooling, Earth-Sci. Rev., 134, 81–97, https://doi.org/10.1016/j.earscirev.2014.03.006, 2014.
Hollis, C. J., Dunkley Jones, T., Anagnostou, E., Bijl, P. K., Cramwinckel, M. J., Cui, Y., Dickens, G. R., Edgar, K. M., Eley, Y., Evans, D., Foster, G. L., Frieling, J., Inglis, G. N., Kennedy, E. M., Kozdon, R., Lauretano, V., Lear, C. H., Littler, K., Lourens, L., Meckler, A. N., Naafs, B. D. A., Pälike, H., Pancost, R. D., Pearson, P. N., Röhl, U., Royer, D. L., Salzmann, U., Schubert, B. A., Seebeck, H., Sluijs, A., Speijer, R. P., Stassen, P., Tierney, J., Tripati, A., Wade, B., Westerhold, T., Witkowski, C., Zachos, J. C., Zhang, Y. G., Huber, M., and Lunt, D. J.: The DeepMIP contribution to PMIP4: methodologies for selection, compilation and analysis of latest Paleocene and early Eocene climate proxy data, incorporating version 0.1 of the DeepMIP database, Geosci. Model Dev., 12, 3149–3206, https://doi.org/10.5194/gmd-12-3149-2019, 2019.
Hopmans, E. C., Weijers, J. W. H., Schefuß, E., Herfort, L., Sinninghe Damsté, J. S., and Schouten, S.: A novel proxy for terrestrial organic matter in sediments based on branched and isoprenoid tetraether lipids, Earth Planet. Sc. Lett., 224, 107–116, 2004.
Hopmans, E. C., Schouten, S., and Sinninghe Damsté, J. S.: The effect of improved chromatography on GDGT-based palaeoproxies, Org. Geochem., 93, 1–6, https://doi.org/10.1016/j.orggeochem.2015.12.006, 2016.
Houben, A. J. P., Bijl, P. K., Sluijs, A., Schouten, S., and Brinkhuis, H.: Late Eocene Southern Ocean cooling and invigoration of circulation preconditioned Antarctica for full-scale glaciation, Geochem. Geophys. Geosyst., 20, 2214–2234, https://doi.org/10.1029/2019GC008182, 2019.
Huber, M. and Caballero, R.: The early Eocene equable climate problem revisited, Clim. Past, 7, 603–633, https://doi.org/10.5194/cp-7-603-2011, 2011.
Huber, M. and Thomas, E., Paleoceanography: The greenhouse world, in: Encyclopedia of Ocean Sciences, Elsevier, Amsterdam, NL, 319–329, 2010.
Huber, M., Brinkhuis, H., Stickley, C. E., Döös, K., Sluijs, A., Warnaar, J., Schellenberg, S. A., and Williams, G. L.: Eocene circulation of the Southern Ocean: Was Antarctica kept warm by subtropical waters?, Paleoceanography, 19, PA4026, https://doi.org/10.1029/2004PA001014, 2004.
Hurley, S. J., Elling, F. J., K.nneke, M., Buchwald, C., Wankel, S. D., Santoro, A. E., Lipp, J. S., Hinrichs, K.-U., and Pearson, A.: Influence of ammonia oxidation rate on thaumarchaeal lipid composition and the TEX86 temperature proxy, P. Natl. Acad. Sci., 113, 7762–7767, https://doi.org/10.1073/pnas.1518534113, 2016.
Huurdeman, E. P., Frieling, J., Reichgelt, T., Bijl, P.K., Bohaty, S. M., Holdgate, G. R., Gallagher, S. J., Peterse, F., Greenwood, D. R., and Pross; J.: Rapid expansion of meso-megathermal rain forests into the southern high latitudes at the onset of the Paleocene-Eocene Thermal Maximum, Geology, 49, G47343, https://doi.org/10.1130/G47343.1, 2020.
Inglis, G. N., Farnsworth, A., Lunt, D., Foster, G. L., Hollis, C. J., Pagani, M., Jardine, P. E., Pearson, P. N., Markwick, P., Galsworthy, A. M. J., Raynham, L., Taylor, K. W. R., and Pancost, R. D.: Descent toward the icehouse: Eocene sea surface cooling inferred from GDGT distributions, Paleoceanography, 30, 1000–1020, https://doi.org/10.1002/2014PA002723, 2015.
Inglis, G. N., Bragg, F., Burls, N. J., Cramwinckel, M. J., Evans, D., Foster, G. L., Huber, M., Lunt, D. J., Siler, N., Steinig, S., Tierney, J. E., Wilkinson, R., Anagnostou, E., de Boer, A. M., Dunkley Jones, T., Edgar, K. M., Hollis, C. J., Hutchinson, D. K., and Pancost, R. D.: Global mean surface temperature and climate sensitivity of the early Eocene Climatic Optimum (EECO), Paleocene–Eocene Thermal Maximum (PETM), and latest Paleocene, Clim. Past, 16, 1953–1968, https://doi.org/10.5194/cp-16-1953-2020, 2020.
Kim, J.-H., Meer, J. v. d., Schouten, S., Helmke, P., Willmott, V., Sangiorgi, F., et al.: New indices and calibrations derived from the distribution of crenarchaeal isoprenoid tetraether lipids: Implications for past sea surface temperature reconstructions, Geochim. Cosmochim. Ac., 74, 4639–4654, 2010.
Kirkels, F. M. S. A., Ponton, C., Galy, V., West, A. J., Feakins, S. J., and Peterse, F.: From Andes to Amazon: Assessing Branched Tetraether Lipids as Tracers for Soil Organic Carbon in the Madre de Dios River System, J. Geophys. Res.-Biogeosci., 125, e2019JG005270, https://doi.org/10.1029/2019jg005270, 2020.
Korasidis, V. A., Wallace, M. W., Dickinson, J. A., and Hoffman, N.: Depositional setting for Eocene seat earths and related facies of the Gippsland Basin, Australia, Sediment. Geol., 390, 100–113, https://doi.org/10.1016/j.sedgeo.2019.07.007, 2019.
Kozdon, R., Penman, D. E., Kelly, D. C., Zachos, J. C., Fournelle, J. H., and Valley, J. W.: Enhanced poleward flux of atmospheric moisture to the Weddell Sea region (ODP Site 690) during the Paleocene-Eocene Thermal Maximum, Paleoceanogr. Paleoclimatol., 35, e2019PA003811, https://doi.org/10.1029/2019PA003811, 2020.
Lattaud, J., Dorhout, D., Schulz, H., Castañeda, I. S., Schefuß, E., Sinninghe Damsté, J. S., and Schouten, S.: The C32 alkane-1,15-diol as a proxy of late Quaternary riverine input in coastal margins, Clim. Past, 13, 1049–1061, https://doi.org/10.5194/cp-13-1049-2017, 2017.
Lauretano, V., Zachos, J. C., and Lourens, L. J.: Orbitally paced carbon and deep-sea temperature changes at the peak of the Early Eocene Climatic Optimum, Paleoceanogr. Paleoclimatol., 33, 1050–1065, https://doi.org/10.1029/2018PA003422, 2018.
Lauretano, V., Kennedy-Asser, A. T., Korasidis, V. A., Wallace, M. W., Valdes, P. J., Lunt, D. J., Pancost, R. D., Naafs, B. D. A.: Eocene to Oligocene terrestrial Southern Hemisphere cooling caused by declining pCO2, Nat. Geosci., 14, 659–664, https://doi.org/10.1038/s41561-021-00788-z, 2021.
Leutert, T. J., Auderset, A., Martínez-García, A., Modestou, S., and Meckler, A. N.: Southern Ocean temperature evolution coupled to middle Miocene ice sheet expansion, Nat. Geosci., 13, 634–639, 2020.
Liu, Z., Pagani, M., Zinniker, D., DeConto, R., Huber, M., Brinkhuis, H., Shah, S. R., Leckie, R. M., Pearson, A.: Global cooling during the eocene-oligocene climate transition, Science, 323, 1187–1190, https://doi.org/10.1126/science.1166368, 2009.
Liu, X., Lipp, J. S., Simpson, J. H., Lin, Y., Summons, R. E., and Hinrichs, K.: Mono- and dihydroxyl glycerol dibiphytanyl glycerol tetraethers in marine sediments: Identification of both core and intact polar lipid forms, Geochim. Cosmochim. Ac., 89, 102–115, https://doi.org/10.1016/j.gca.2012.04.053, 2012.
Lunt, D. J., Dunkley Jones, T., Heinemann, M., Huber, M., LeGrande, A., Winguth, A., Loptson, C., Marotzke, J., Roberts, C. D., Tindall, J., Valdes, P., and Winguth, C.: A model–data comparison for a multi-model ensemble of early Eocene atmosphere–ocean simulations: EoMIP, Clim. Past, 8, 1717–1736, https://doi.org/10.5194/cp-8-1717-2012, 2012.
Lunt, D. J., Bragg, F., Chan, W.-L., Hutchinson, D. K., Ladant, J.-B., Morozova, P., Niezgodzki, I., Steinig, S., Zhang, Z., Zhu, J., Abe-Ouchi, A., Anagnostou, E., de Boer, A. M., Coxall, H. K., Donnadieu, Y., Foster, G., Inglis, G. N., Knorr, G., Langebroek, P. M., Lear, C. H., Lohmann, G., Poulsen, C. J., Sepulchre, P., Tierney, J. E., Valdes, P. J., Volodin, E. M., Dunkley Jones, T., Hollis, C. J., Huber, M., and Otto-Bliesner, B. L.: DeepMIP: model intercomparison of early Eocene climatic optimum (EECO) large-scale climate features and comparison with proxy data, Clim. Past, 17, 203–227, https://doi.org/10.5194/cp-17-203-2021, 2021.
Macphail, M. K.: Australian palaeoclimates, cretaceous to tertiary, volume 1: Review of palaeobotanical and related evidence up to 2000, Geology Department, Australian National University, Canberra, Australia, 2000.
Macphail, M. K.: Ocean Drilling Program Leg 189 initial results: Terrestrial plant microfossils, Australian Geological Survey Organisation, Geosci. Australia, Canberra, Australia, 34 pp., 2002.
Mertens, K. N., Dale, B., Ellegaard, M., Jansson, I., Godhe, A., Kremp, A., and Louwye, S.: Process length variation in cysts of the dinoflagellate protoceratium reticulatum, from surface sediments of the baltic-kattegat-skagerrak estuarine system: A regional salinity proxy, Boreas, 40, 242–255, https://doi.org/10.1111/j.1502-3885.2010.00193.x, 2011.
Moore, D. H., Betts, P. G., and Hall, M.: Towards understanding the early Gondwanan margin in southeastern Australia, Gondwana Res., 23, 1581–1598, https://doi.org/10.1016/j.gr.2012.08.006, 2013.
Morii, H., Eguchi, T., Nishihara, M., Kakinuma, K., König, H., and Koga, Y.: A novel ether core lipid with H-shaped C80-isoprenoid hydrocarbon chain from the hyperthermophilic methanogen Methanothermus fervidus, Biochim. Biophys. Acta, 1390, 339–345, https://doi.org/10.1016/s0005-2760(97)00183-5, 1998.
Müller, R. D., Gaina, C., and Clark, S.: Seafloor spreading around Australia, in: Billion-year earth history of Australia and neighbours in gondwanaland, edited by: Veevers, J., School of Geosciences, University of Sydney, Sydney, Australia, 1–1, 2000.
Naafs, B. D. A., Gallego-Sala, A. V., Inglis, G. N., and Pancost, R. D.: Refining the global branched glycerol dialkyl glycerol tetraether (brGDGT) soil temperature calibration, Org. Geochem., 106, 48–56, https://doi.org/10.1016/j.orggeochem.2017.01.009, 2017a.
Naafs, B. D. A., Inglis, G. N., Zheng, Y., Amesbury, M. J., Biester, H., Bindler, R., and Louwye, S.: Introducing global peat-specific temperature and pH calibrations based on brGDGT bacterial lipids, Geochim. Cosmochim. Ac., 208, 285–301, https://doi.org/10.1016/j.gca.2017.01.038, 2017b.
Naafs, B. D. A., McCormick, D., Inglis, G. N., and Pancost, R. D.: Archaeal and bacterial H-GDGTs are abundant in peat and their relative abundance is positively correlated with temperature, Geochim. Cosmochim. Ac., 227, 156–170, https://doi.org/10.1016/j.gca.2018.02.025, 2018a.
Naafs, B. D. A., Rohrssen, M., Inglis, G. N., Lähteenoja, O., Feakins, S. J., Collinson, M. E., Kennedy, E. M., Singh, P. K., Singh, M. P., Lunt, D. J., and Pancost, R. D.: High temperatures in the terrestrial mid-latitudes during the early Palaeogene, Nat. Geosci., 11, 766–771, https://doi.org/10.1038/s41561-018-0199-0, 2018b.
Naafs, B. D. A., Inglis, G. N., Blewett, J., McClymont, E. L., Lauretano, V., Xie, S., Evershed, R. P., and Pancost, R. D.: The potential of biomarker proxies to trace climate, vegetation, and biogeochemical processes in peat: A review, Global Planet. Change, 179, 57–79, https://doi.org/10.1016/j.gloplacha.2019.05.006, 2019.
O'Brien, C. L., Robinson, S. A., Pancost, R. D., Sinninghe Damsté, J. S., Schouten, S., Lunt, D. J., Alsenz, H., Bornemann, A., Bottini, C., Brassell, S. C., Farnsworth, A., Forster, A., Huber, B. T., Inglis, G. N., Jenkyns, H. C., Linnert, C., Littler, K., Markwick, P., McAnena, A., Mutterlose, J., Naafs, B. D. A., Püttmann, W., Sluijs, A., van Helmond, N. A. G. M., Vellekoop, J., Wagner, T., and Wrobel, N. E.: Cretaceous sea-surface temperature evolution: Constraints from TEX86 and planktonic foraminiferal oxygen isotopes, Earth-Sci. Rev., 172, 224–247, https://doi.org/10.1016/j.earscirev.2017.07.012, 2017.
O'Brien, C. L., Huber, M., Thomas, E., Pagani, M., Super, J. R., Elder, L. E., and Hull, P. M.: The enigma of Oligocene climate and global surface temperature evolution, P. Natl. Acad. Sci. USA, 117, 25302–25309, https://doi.org/10.1073/pnas.2003914117, 2020.
O'Connor, L. K., Robinson, S. A., Naafs, B. D. A., Jenkyns, H. C., Henson, S., Clarke, M., and Pancost, R. D.: Late Cretaceous temperature evolution of the southern high latitudes: A TEX86 perspective, Paleoceanogr. Paleoclimatol., 34, 436–454, https://doi.org/10.1029/2018PA003546, 2019.
Oksanen, J., Blanchet, F. G., Friendly, M., Kindt, R., Legendre, P., McGlinn, D., et al.: Vegan: Community ecology package, http://CRAN.Rproject.org/package=vegan (last access: 8 November 2021), 2015.
Pancost, R. D., Taylor, K. W. R., Inglis, G. N., Kennedy, E. M., Handley, L., Hollis, C. J., Crouch, E. M., Pross, J., Huber, M., Schouten, S., Pearson, P. N., Morgans, H. E. G., and Raine, J. I.: Early Paleogene evolution of terrestrial climate in the SW Pacific, southern New Zealand, Geochem. Geophy. Geosy., 14, 5413–5429, https://doi.org/10.1002/2013GC004935, 2013.
Passchier, S., Bohaty, S. M., Jiménez-Espejo, F., Pross, J., Röhl, U., Van De Flierdt, T., Escutia, C., and Brinkhuis, H.: Early Eocene to middle Miocene cooling and aridification of east Antarctica, Geochem. Geophy. Geosy., 14, 1399–1410, https://doi.org/10.1002/ggge.20106, 2013.
Passchier, S., Ciarletta, D. J., Miriagos, T. E., Bijl, P. K., and Bohaty, S. M.: An Antarctic stratigraphic record of stepwise ice growth through the Eocene-Oligocene transition, Bull. Geol. Soc. Am., 129, 318–330, https://doi.org/10.1130/B31482.1, 2017.
Peterse, F., Kim, J.-H., Schouten, S., Kristensen, D. K., Koç, N., and Sinninghe Damsté, J. S.: Constraints on the application of the MBT-CBT paleothermometer at high latitude environments (Svalbard, Norway), Org. Geochem., 40, 692–699, https://doi.org/10.1016/j.orggeochem.2009.03.004, 2009.
Pross, J. and Brinkhuis, H.: Organic-walled dinoflagellate cysts as paleoenvironmental indicators in the paleogene; a synopsis of concepts, Palaeont. Z., 79, 53–59, https://doi.org/10.1007/BF03021753, 2005.
Pross, J., Contreras, L., Bijl, P. K., Greenwood, D. R., Bohaty, S. M., Schouten, S., Bendle, J. A., Röhl, U., Tauxe, L., Raine, J. I., Huck, C. E., Van De Flierdt, T., Jamieson, S. S. R., Stickley, C. E., Van De Schootbrugge, B., Escutia, C., Brinkhuis, H., Escutia Dotti, C., Klaus, A., Fehr, A., Williams, T., Bendle, J. A. P., Carr, S. A., Dunbar, R. B., Gonzèlez, J. J., Hayden, T. G., Iwai, M., Jimenez Espejo, F. J., Katsuki, K., Soo Kong, G., McKay, R. M., Nakai, M., Olney, M. P., Passchier, S., Pekar, S. F., Riesselman, C. R., Sakai, T., Shrivastava, P. K., Sugisaki, S., Tuo, S., Welsh, K., Yamane, M., and Integrated Ocean Drilling Program Expedition 318 Scientists: Persistent near-tropical warmth on the Antarctic continent during the early Eocene epoch, Nature, 488, 73–73, https://doi.org/10.1038/nature11300, 2012.
Qin, W., Carlson, L. T., Armbrust, E. V., Devol, A. H., Moffett, J. W., Stahl, D. A., and Ingalls, A. E.: Confounding effects of oxygen and temperature on the TEX86 signature of marine Thaumarchaeota, P. Natl. A. Sci., 112, 10979–10984, https://doi.org/10.1073/pnas.1501568112, 2015.
Reichgelt, T., West, C. K., and Greenwood, D. R.: The relation between global palm distribution and climate, Sci. Rep.-UK, 8, 4721, https://doi.org/10.1038/s41598-018-23147-2, 2018.
Robert, C.: Cenozoic environments in the Tasmanian area of the Southern Ocean (ODP Leg 189): Inferences from bulk and clay mineralogy, Geophys. Monog. Series, 151, 127–151, https://doi.org/10.1029/GM151, 2004.
Rochon, A., Lewis, J., Ellegaard, M., and Harding, I. C.: The gonyaulax spinifera (dinophyceae) “complex”: Perpetuating the paradox?, Rev. Palaeobot. Palyno., 155, 52–60, https://doi.org/10.1016/j.revpalbo.2008.12.017, 2008.
Röhl, U., Brinkhuis, H., Stickley, C. E., Fuller, M., Schellenberg, S. A., Wefer, G., and Williams, G. L.: Sea level and astronomically induced environmental changes in middle and late Eocene sediments from the East Tasman Plateau, Geophys. Monog. Series, 151, 127–151, https://doi.org/10.1029/GM151, 2004a.
Röhl, U., Brinkhuis, H., Sluijs, A., and Fuller, M.: On the search for the Paleocene/eocene boundary in the Southern Ocean: Exploring ODP Leg 189 Holes 1171D and 1172D, Tasman Sea, Geophys. Monog. Series, 151, 113–124, https://doi.org/10.1029/GM151, 2004b.
Röhl, U., Westerhold, T., Bralower, T. J., and Zachos, J. C.: On the duration of the Paleocene-Eocene Thermal Maximum (PETM), Geochem. Geophys. Geosys., 8, Q12002, https://doi.org/10.1029/2007GC001784, 2007.
Salamy, K. A. and Zachos, J. C.: Latest Eocene-Early Oligocene climate change and Southern Ocean fertility: Inferences from sediment accumulation and stable isotope data, Palaeogeogr. Palaeoclimatol. Palaeoecol., 145, 61–77, 1999.
Schefuß, E., Eglinton, T. I., Spencer-Jones, C. L., Rullkötter, J., De Pol-Holz, R., Talbot, H. M., Grootes, P. M., and Schneider, R. R.: Hydrologic control of carbon cycling and aged carbon discharge in the Congo River basin, Nature Geosci., 9, 687–690, https://doi.org/10.1038/ngeo2778, 2016.
Schellenberg, S. A., Brinkhuis, H., Stickley, C. E., Fuller, M., Kyte, F. T., and Williams, G. L.: The Cretaceous/Paleogene transition on the East Tasman Plateau, southwestern Pacific, in: The Cenozoic Southern Ocean; tectonics, sedimentation and climate change between Australia and Antarctica, edited by: Exon, N., Kennett, J. P., and Malone, M., American Geophysical Union, Washington, USA, 151, 93–112, https://doi.org/10.1029/GM151, 2004.
Schouten, S., Hopmans, E. C., Schefuß, E., and Sinninghe Damsté, J. S.: Distributional variations in marine crenarchaeotal membrane lipids: A new tool for reconstructing ancient sea water temperatures?, Earth Planet. Sc. Lett., 204, 265–274, https://doi.org/10.1016/S0012-821X(02)00979-2, 2002.
Schouten, S., Hopmans, E. C., and Sinninghe Damsté, J. S.: The organic geochemistry of glycerol dialkyl glycerol tetraether lipids: A review, Org. Geochem., 54, 19–61, https://doi.org/10.1016/j.orggeochem.2012.09.006, 2013.
Seton, M., Müller, R. D., Zahirovic, S., Gaina, C., Torsvik, T., Shephard, G., Talsma, A., Gurnis, M., Turner, M., Maus, S., and Chandler, M.: Global continental and ocean basin reconstructions since 200 Ma, Earth-Sci. Rev., 113, 212–270, 2012.
Shannon, C. E.: A mathematical theory of communication, Bell Syst. Tech. J., 27, 379–423, https://doi.org/10.1002/j.1538-7305.1948.tb01338.x, 1948.
Sijp, W. P., von der Heydt, A. S., Dijkstra, H. A., Flögel, S., Douglas, P. M. J., and Bijl, P. K.: The role of ocean gateways on cooling climate on long time scales, Global Planet. Change, 119, 1–22, https://doi.org/10.1016/j.gloplacha.2014.04.004, 2014.
Sijp, W. P., von der Heydt, A. S., and Bijl, P. K.: Model simulations of early westward flow across the Tasman Gateway during the early Eocene, Clim. Past, 12, 807–817, https://doi.org/10.5194/cp-12-807-2016, 2016.
Simpson, E.: Measurement of diversity, Nature, 163, 688, 1949.
Sinninghe Damsté, J. S.: Spatial heterogeneity of sources of branched tetraethers in shelf systems: The geochemistry of tetraethers in the Berau River delta (Kalimantan, Indonesia), Geochim. Cosmochim. Ac., 186, 13–31, https://doi.org/10.1016/j.gca.2016.04.033, 2016.
Sluijs, A. and Brinkhuis, H.: A dynamic climate and ecosystem state during the Paleocene-Eocene Thermal Maximum: Inferences from dinoflagellate cyst assemblages on the New Jersey Shelf, Biogeosciences, 6, 1755–1781, https://doi.org/10.5194/bg-6-1755-2009, 2009.
Sluijs, A., Brinkhuis, H., Stickley, C. E., Warnaar, J., Williams, G. L., and Fuller, M.: Dinoflagellate cysts from the Eocene – Oligocene transition in the Southern Ocean: Results from ODP Leg 189, in: Proceedings of the Ocean Drilling Program, scientific results, edited by: Exon, N. and Kennett, J. P, U.S. Government Printing Office, College Station, Texas, USA, 2003.
Sluijs, A., Pross, J., and Brinkhuis, H.: From greenhouse to icehouse; organic walled dinoflagellate cysts as paleoenvironmental indicators in the Paleogene, Earth-Sci. Rev., 68, 281–315, https://doi.org/10.1016/j.earscirev.2004.06.001, 2005.
Sluijs, A., Bijl, P. K., Schouten, S., Röhl, U., Reichart, G.-J., and Brinkhuis, H.: Southern ocean warming, sea level and hydrological change during the Paleocene-Eocene thermal maximum, Clim. Past, 7, 47–61, https://doi.org/10.5194/cp-7-47-2011, 2011.
Sluijs, A., van Roij, L., Harrington, G. J., Schouten, S., Sessa, J. A., LeVay, L. J., Reichart, G.-J., and Slomp, C. P.: Warming, euxinia and sea level rise during the Paleocene–Eocene Thermal Maximum on the Gulf Coastal Plain: implications for ocean oxygenation and nutrient cycling, Clim. Past, 10, 1421–1439, https://doi.org/10.5194/cp-10-1421-2014, 2014.
Sluijs, A., Frieling, J., Inglis, G. N., Nierop, K. G. J., Peterse, F., Sangiorgi, F., and Schouten, S.: Late Paleocene–early Eocene Arctic Ocean sea surface temperatures: reassessing biomarker paleothermometry at Lomonosov Ridge, Clim. Past, 16, 2381–2400, https://doi.org/10.5194/cp-16-2381-2020, 2020.
Somme, T. O., Helland-Hansen, W., and Granjeon, D.: Impact of eustatic amplitude variations on shelf morphology, sediment dispersal, and sequence stratigraphic interpretation: Icehouse versus greenhouse systems, Geology, 37, 587–590, https://doi.org/10.1130/g25511a.1, 2009.
Staub, J. R. and Cohen, A. D.: Kaolinite-enrichment Beneath Coals; A Modern Analog, Snuggedy Swamp, South Carolina, J. Sediment. Res., 48, 203–210, 1978.
Stickley, C. E., Brinkhuis, H., McGonigal, K. L., Chaproniere, G. C. H., Fuller, M., Kelly, D. C., Nürnberg, D., Pfuhl, H. A., Schellenberg, S. A., Schoenfeld, J., Suzuki, N., Touchard, Y., Wei, W., Williams, G. L., Lara, J., and Stant, S. A.: Late Cretaceous–Quaternary biomagnetostratigraphy of ODP Sites 1168, 1170, 1171, and 1172, Tasmanian Gateway, in: Proc. Ocean Drill. Prog. Sci. Results, edited by: Exon, N. F., Kennett, J. P., and Malone, M. J., Ocean Drilling Program, College Station, Texas, USA, 189, https://doi.org/10.2973/odp.proc.sr.189.111.2004, 2004.
Stickley, C. E., Brinkhuis, H., Schellenberg, S. A., Sluijs, A., R¨hl, U., Fuller, M., Grauert, M., Huber, M., Warnaar, J., and Williams, G. L.: Timing and nature of the deepening of the Tasmanian Gateway, Paleoceanography, 19, 4027, https://doi.org/10.1029/2004PA001022, 2004b.
Tang, X., Naafs, B. D., Pancost, R. D., Liu, Z., Fan, T., and Zheng, Y.: Exploring the influences of temperature on “H-shaped” glycerol dialkyl glycerol tetraethers in a stratigraphic context: Evidence from two peat cores across the late Quaternary, Front. Earth Sci., 8, 477, https://doi.org/10.3389/feart.2020.541685, 2021.
Taylor, K. W. R., Huber, M., Hollis, C. J., Hernandez-Sanchez, M. T., and Pancost, R. D.: Re-evaluating modern and Palaeogene GDGT distributions: Implications for SST reconstructions, Global Planet. Change, 108, 158–174, https://doi.org/10.1016/j.gloplacha.2013.06.011, 2013.
Thomas, D. J., Bralower, T. J., and Jones, C. E.: Neodymium isotopic reconstruction of the late Paleocene – early Eocene thermohaline circulation, Earth Planet. Sc. Lett., 209, 309–322, https://doi.org/10.1016/S0012-821X(03)00096-7, 2003.
Thomas, D. J., Korty, R., Huber, M., Schubert, J. A., and Haines, B.: Nd isotopic structure of the Pacific Ocean 70–30 Ma and numerical evidence for vigorous ocean circulation and ocean heat transport in a greenhouse world, Paleoceanography, 29, 454–469, https://doi.org/10.1002/2013PA002535, 2014.
Tierney, J. E. and Russell, J. M.: Distributions of branched GDGTs in a tropical lake system: Implications for lacustrine application of the MBT/CBT paleoproxy, Org. Geochem., 40, 1032–1036, https://doi.org/10.1016/j.orggeochem.2009.04.014, 2009.
Tierney, J. E. and Tingley, M. P.: A TEX86 surface sediment database and extended bayesian calibration, Scientific Data, 2, 150029, https://doi.org/10.1038/sdata.2015.29, 2015.
Tierney, J. E. and Tingley, M. P.: BAYSPLINE: A new calibration for the alkenone paleothermometer, Paleoceanogr. Paleoclimatol., 33, 281–301, https://doi.org/10.1002/2017PA003201, 2018.
Tierney, J. E., Russell, J. M., Eggermont, H., Hopmans, E. C., Verschuren, D., and Sinninghe Damsté, J. S.: Environmental controls on branched tetraether lipid distributions in tropical East African lake sediments, Geochim. Cosmochim. Ac., 74, 4902–4918, https://doi.org/10.1016/j.gca.2010.06.002, 2010.
Tierney, J. E., Sinninghe Damsté, J. S., Pancost, R. D., Sluijs, A., and Zachos, J. C.: Eocene temperature gradients, Nature Geosci., 10, 538–539, https://doi.org/10.1038/ngeo2997, 2017.
Torsvik, T. H., Van der Voo, R., Preeden, U., Mac Niocaill, C., Steinberger, B., Doubrovine, P. V., van Hinsbergen, D. J. J., Domeier, M., Gaina, C., Tohver, E., Meert, J. G., McCausland, P. J. A., and Cocks, L. R. M.: Phanerozoic polar wander, palaeogeography and dynamics, Earth-Sci. Rev., 114, 325–368, https://doi.org/10.1016/j.earscirev.2012.06.007, 2012.
Truswell, E. M.: Palynomorph assemblages from marine Eocene sediments on the west Tasmanian continental margin and the South Tasman Rise, Aust. J. Earth Sci., 44, 633–654, 1997.
Van Dijk, J., Fernandez, A., Bernasconi, S. M., Caves Rugenstein, J. K., Passey, S. R., and White, T.: Spatial pattern of super-greenhouse warmth controlled by elevated specific humidity, Nature Geosci., 13, 739–744, https://doi.org/10.1038/s41561-020-00648-2, 2020.
Van Hinsbergen, D. J. J., De Groot, L. V., Van Schaik, S. J., Spakman, W., Bijl, P. K., Sluijs, A., Langereis, C. G., and Brinkhuis, H.: A paleolatitude calculator for paleoclimate studies, Plos One, 10, e0126946, https://doi.org/10.1371/journal.pone.0126946, 2015.
Warden, L., Kim, J.-H., Zell, C., Vis, G.-J., de Stigter, H., Bonnin, J., and Sinninghe Damsté, J. S.: Examining the provenance of branched GDGTs in the Tagus River drainage basin and its outflow into the Atlantic Ocean over the Holocene to determine their usefulness for paleoclimate applications, Biogeosciences, 13, 5719–5738, https://doi.org/10.5194/bg-13-5719-2016, 2016.
Warden, L., Moros, M., Weber, Y., and Sinninghe Damsté, J. S.: Change in provenance of branched glycerol dialkyl glycerol tetraethers over the Holocene in the Baltic Sea and its impact on continental climate reconstruction, Org. Geochem., 121, 138–154, https://doi.org/10.1016/j.orggeochem.2018.03.007, 2018.
Warnaar, J., Bijl, P. K., Huber, M., Sloan, L., Brinkhuis, H., Röhl, U., Sriver, R., and Visscher, H.: Orbitally forced climate changes in the Tasman sector during the middle Eocene, Palaeogeogr. Palaeoclimatol. Palaeoecol., 280, 361–370, https://doi.org/10.1016/j.palaeo.2009.06.023, 2009.
Weijers, J. W. H., Schouten, S., Spaargaren, O. C., and Sinninghe Damste, J. S.: Occurrence and distribution of tetraether membrane lipids in soils: Implications for the use of the TEX86 proxy and the BIT index, Org. Geochem., 37, 1680–1693, https://doi.org/10.1016/j.orggeochem.2006.07.018, 2006.
Weijers, J. W. H., Schouten, S., van den Donker, J. C., Hopmans, E. C., and Sinninghe Damsté, J. S.: Environmental controls on bacterial tetraether membrane lipid distribution in soils, Geochim. Cosmochim. Ac., 71, 703–713, 2007a.
Weijers, J. W. H., Schefuß, E., Schouten, S., Damsté, J. S. S., Coupled thermal and hydrological evolution of tropical Africa over the last deglaciation, Science, 315, 1701–1704, 2007b.
Weijers, J. W. H., Lim, K. L. H., Aquilina, A., Damsté, J. S. S., and Pancost, R. D.: Biogeochemical controls on glycerol dialkyl glycerol tetraether lipid distributions in sediments characterized by diffusive methane flux, Geochem. Geophys. Geosyst., 12, GC003724, https://doi.org/10.1029/2011GC003724, 2011.
Westerhold, T., Marwan, N., Drury, A. J., Liebrand, D., Agnini, C., Anagnostou, E., Barnet, J. S. K., Bohaty, S. M., De Vleeschouwer, D., Florindo, F., Frederichs, T., Hodell, D. A., Holbourn, A. E., Kroon, D., Lauretano, V., Littler, K., Lourens, L. J., Lyle, M., Pälike, H., Röhl, U., Tian, J., Wilkens, R. H., Wilson, P. A., and Zachos, J. C.: An astronomically dated record of earth's climate and its predictability over the last 66 million years, Science, 369, 1383–1387, https://doi.org/10.1126/science.aba6853, 2020.
Willard, D. A., Donders, T. H., Reichgelt, T., Greenwood, D. R., Sangiorgi, F., Peterse, F., Nierop, K. G. J., Frieling, J., Schouten, S., and Sluijs, A.: Arctic vegetation, temperature, and hydrology during early Eocene transient global warming events, Global Planet. Change, 178, 139–152, https://doi.org/10.1016/j.gloplacha.2019.04.012, 2019.
Williams, G. L., Fensome, R. A., and MacRae, R. A.: Dinoflaj3, American Association of Stratigraphic Palynologists, Data Series, 2, ISSN 0160-8843, 2017.
Williams, S. E., Whittaker, J. M., Halpin, J. A., and Müller, R. D.: Australian-Antarctic breakup and seafloor spreading: Balancing geological and geophysical constraints, Earth-Sci. Rev., 188, 41–58, https://doi.org/10.1016/j.earscirev.2018.10.011, 2019.
Xie, S., Liu, X., Schubotz, F., Wakeham, S. G., and Hinrichs, K.: Distribution of glycerol ether lipids in the oxygen minimum zone of the eastern tropical north pacific ocean, Org. Geochem., 71, 60–71, https://doi.org/10.1016/j.orggeochem.2014.04.006, 2014.
Zeebe, R. E. and Lourens, L. J.: Solar System chaos and the Paleocene–Eocene boundary age constrained by geology and astronomy, Science, 365, 926–929, https://doi.org/10.1126/science.aax0612, 2019.
Zell, C., Kim, J.-H., Moreira-Turcq, P., Abril, G., Hopmans, E. C., Bonnet, M.-P., Lima Sobrinho, R., and Sinninghe Damsté, J. S. : Disentangling the origins of branched tetraether lipids and crenarchaeol in the lower Amazon River: Implications for GDGT-based proxies, Limnol. Oceanogr., 58, 343–353, https://doi.org/10.4319/lo.2013.58.1.0343, 2013.
Zell, C., Kim, J.-H., Hollander, D., Lorenzoni, L., Baker, P., Silva, C. G., Nittrouer, C., and Sinninghe Damsté, J. S.: Sources and distributions of branched and isoprenoid tetraether lipids on the Amazon shelf and fan: Implications for the use of GDGT-based proxies in marine sediments, Geochim. Cosmochim. Ac., 139, 293–312, https://doi.org/10.1016/j.gca.2014.04.038, 2014.
Zhang, Y. G., Zhang, C. L., Liu, X.-L., Li, L., Hinrichs, K.-U., and Noakes, J. E.: Methane index: A tetraether archaeal lipid biomarker indicator for detecting the instability of marine gas hydrates, Earth Planet. Sc. Lett., 307, 525–534, https://doi.org/10.1016/j.epsl.2011.05.031, 2011.
Zhang, Y. G., Pagani, M., and Wang, Z.: Ring index: A new strategy to evaluate the integrity of TEX86, Paleoceanogr. Paleoclimatol., 31, 220–232, https://doi.org/10.1002/2015PA002848, 2016.