the Creative Commons Attribution 4.0 License.
the Creative Commons Attribution 4.0 License.
 | 24 Sep 2021
Stalagmite carbon isotopes suggest deglacial increase in soil respiration in western Europe driven by temperature change
Franziska A. Lechleitner
Christopher C. Day
Oliver Kost
Micah Wilhelm
Negar Haghipour
Gideon M. Henderson
Heather M. Stoll
The temperate region of western Europe underwent significant climatic and environmental change during the last deglaciation. Much of what is known about the terrestrial ecosystem response to deglacial warming stems from pollen preserved in sediment sequences, providing information on vegetation composition. Other ecosystem processes, such as soil respiration, remain poorly constrained over past climatic transitions but are critical for understanding the global carbon cycle and its response to ongoing anthropogenic warming. Here we show that speleothem carbon isotope (δ13Cspel) records may retain information on soil respiration and allow its reconstruction over time. While this notion has been proposed in the past, our study is the first to rigorously test it, using a combination of multi-proxy geochemical analysis (δ13C, Ca isotopes, and radiocarbon) on three speleothems from the NW Iberian Peninsula and quantitative forward modelling of processes in soil, karst, and cave. Our study is the first to quantify and remove the effects of prior calcite precipitation (PCP, using Ca isotopes) and bedrock dissolution (using the radiocarbon reservoir effect) from the δ13Cspel signal to derive changes in respired δ13C. The coupling of soil gas pCO2 and δ13C via a mixing line describing diffusive gas transport between an atmospheric and a respired end-member allows the modelling of changes in soil respiration in response to temperature. Using this coupling and a range of other parameters describing carbonate dissolution and cave atmospheric conditions, we generate large simulation ensembles from which the results most closely matching the measured speleothem data are selected. Our results robustly show that an increase in soil gas pCO2 (and thus respiration) is needed to explain the observed deglacial trend in δ13Cspel. However, the Q10 (temperature sensitivity) derived from the model results is higher than current measurements, suggesting that part of the signal may be related to a change in the composition of the soil respired δ13C, likely from changing substrate through increasing contribution from vegetation biomass with the onset of the Holocene.
- Article
(3026 KB) - Full-text XML
- EGU Outstanding Young Scientist Award
-
Supplement
(630 KB) - BibTeX
- EndNote


The last deglaciation was a period of profound global climate change. Between 22 and 10 ka (thousands of years before 1950), global mean surface air temperatures increased by up to ∼ 6 ∘C (Tierney et al., 2020), leading to the disintegration of the large Northern Hemisphere ice sheets and a consequent rise in global sea level by ∼ 80–120 m (Bova et al., 2021; Lambeck et al., 2014). On land, shifts in ecosystem types and vegetation productivity accompanied the deglacial climate change, with repercussions for the terrestrial carbon cycle and the release of greenhouse gases to the atmosphere (Clark et al., 2012). The temperate region of western Europe was particularly affected by large and latitudinally diverse environmental changes during the last deglaciation, driven by its proximity to the Scandinavian Ice Sheet and the North Atlantic (Moreno et al., 2014). Over the entire region, terrestrial paleo-climate records indicate a transition from colder to warmer climatic conditions, punctuated by millennial-scale events which closely match the Greenland ice core record (Genty et al., 2006; Moreno et al., 2014). Pollen records from western Europe reveal a general deglacial trend from grassland steppe and tundra ecosystems towards landscapes dominated by temperate forest and provide evidence for a remarkably rapid ecosystem response to temperature changes on millennial scales over the last glacial (Fletcher et al., 2010).
Speleothem carbon isotope (δ13Cspel) records from the temperate region of western Europe are often clearly correlated to regional temperature reconstructions during the last glacial (Genty et al., 2003) and the deglaciation (Baldini et al., 2015; Denniston et al., 2018; Genty et al., 2006; Moreno et al., 2010; Rossi et al., 2018; Verheyden et al., 2014) (Fig. 1), pointing towards a regionally coherent mechanism driving the response to the temperature increase. Early on, Genty et al. (2006, 2003) suggested that the temperature sensitivity of δ13Cspel in western Europe was likely related to the response of vegetation and soil respiration to climate warming. Higher concentrations of respired CO2 in the soil gas lower its δ13C signature, due to the increase in strongly fractionated organic carbon in the system. Speleothems can capture this change as they are fed by drip water, which equilibrates with soil gas pCO2 before proceeding to the dissolution of carbonate bedrock. This mechanism could lead to the observed transitions from higher δ13Cspel during colder periods to lower δ13Cspel during warmer periods and may provide a means to quantify past changes in soil respiration, an elusive parameter in the global carbon cycle (Bond-Lamberty and Thomson, 2010). However, formal testing of this mechanism has so far not been attempted, mainly because of the numerous and complex processes that influence δ13Cspel (Fohlmeister et al., 2020).
Speleothem carbon can originate from three sources: atmospheric CO2, biogenic CO2 from autotrophic (root and rhizosphere) and heterotrophic (soil microbial) soil respiration (from here onwards jointly referred to as “soil respiration”), and the carbonate bedrock itself (Fig. 2). Recent research has additionally suggested that deep underground reservoirs of carbon (“ground air”; Mattey et al., 2016) or deeply rooted vegetation (Breecker et al., 2012) may play a significant role in the karst carbon cycle. The relative importance of these different sources on δ13Cspel is modulated by hydroclimate and temperature. This can occur as a propagation of a biosphere response to climate change, e.g. changes in vegetation composition (Braun et al., 2019), changes in soil respiration (Genty et al., 2003), and changes in soil turnover rates (Rudzka et al., 2011). Secondly, δ13Cspel can be modulated by changes in karst hydrology, i.e. the carbonate bedrock dissolution regime (Hendy, 1971). Thirdly, compounded changes in hydrology and cave atmospheric pCO2 can lead to prior calcite precipitation (PCP) during carbonate precipitation (Fohlmeister et al., 2020). Altitudinal transects in caves in the European Alps have shown that changes in soil respiration, vegetation, and temperature have a traceable effect on speleothem fabrics, stable oxygen isotope ratios, and δ13Cspel (Borsato et al., 2015). So far, it has not been possible to disentangle these effects and quantify their relative importance on δ13Cspel records, but this quantification is a crucial step towards evaluating the potential of δ13Cspel as a paleo-soil respiration proxy. Here, we generate a multi-proxy dataset from three stalagmites from the NW Iberian Peninsula and use quantitative forward modelling to show that changes in soil respiration can explain much of the observed deglacial trend in western European δ13Cspel. Our approach is the first to leverage differing proxy sensitivities to quantitatively model key environmental parameters, in particular soil gas pCO2, allowing us to estimate the total temperature sensitivity of soil respiration (Q10), including the effect of changing vegetation communities.

Figure 1Speleothem δ13C records covering the last deglaciation in temperate western Europe. (a) δ13Cspel vs. age, colour-coded by cave. Villars Cave – stalagmites Vil-stm11 (Genty et al., 2006) and Vil-car-1 (Wainer et al., 2011); Chauvet Cave – stalagmite Chau-stm6 (Genty et al., 2006); El Pindal Cave (studied here)– previously published record from stalagmite Candela (Moreno et al., 2010); La Garma Cave – stalagmite GAR-01 (Baldini et al., 2015); El Soplao Cave – stalagmite SIR-1 (Rossi et al., 2018); Père Noël Cave – stalagmite PN-95-5 (Verheyden et al., 2014); Buraca Gloriosa – stalagmite BG6LR (Denniston et al., 2018). All stalagmite data were extracted from the SISAL database, version 2 (Comas-Bru et al., 2020b, a). Shown here is the millennial-scale trend in the records, calculated using a Gaussian kernel smoother (nest package in R, Rehfeld and Kurths, 2014). Please note that the record from Villars Cave is very low resolution but no hiatus is reported between 18–14 ka. Time slices at the top of the figure are as defined for the modelling in this study. GS: Greenland Stadial, as defined in Rasmussen et al. (2014). (b) Cave locations. (c) Original (not filtered) records.
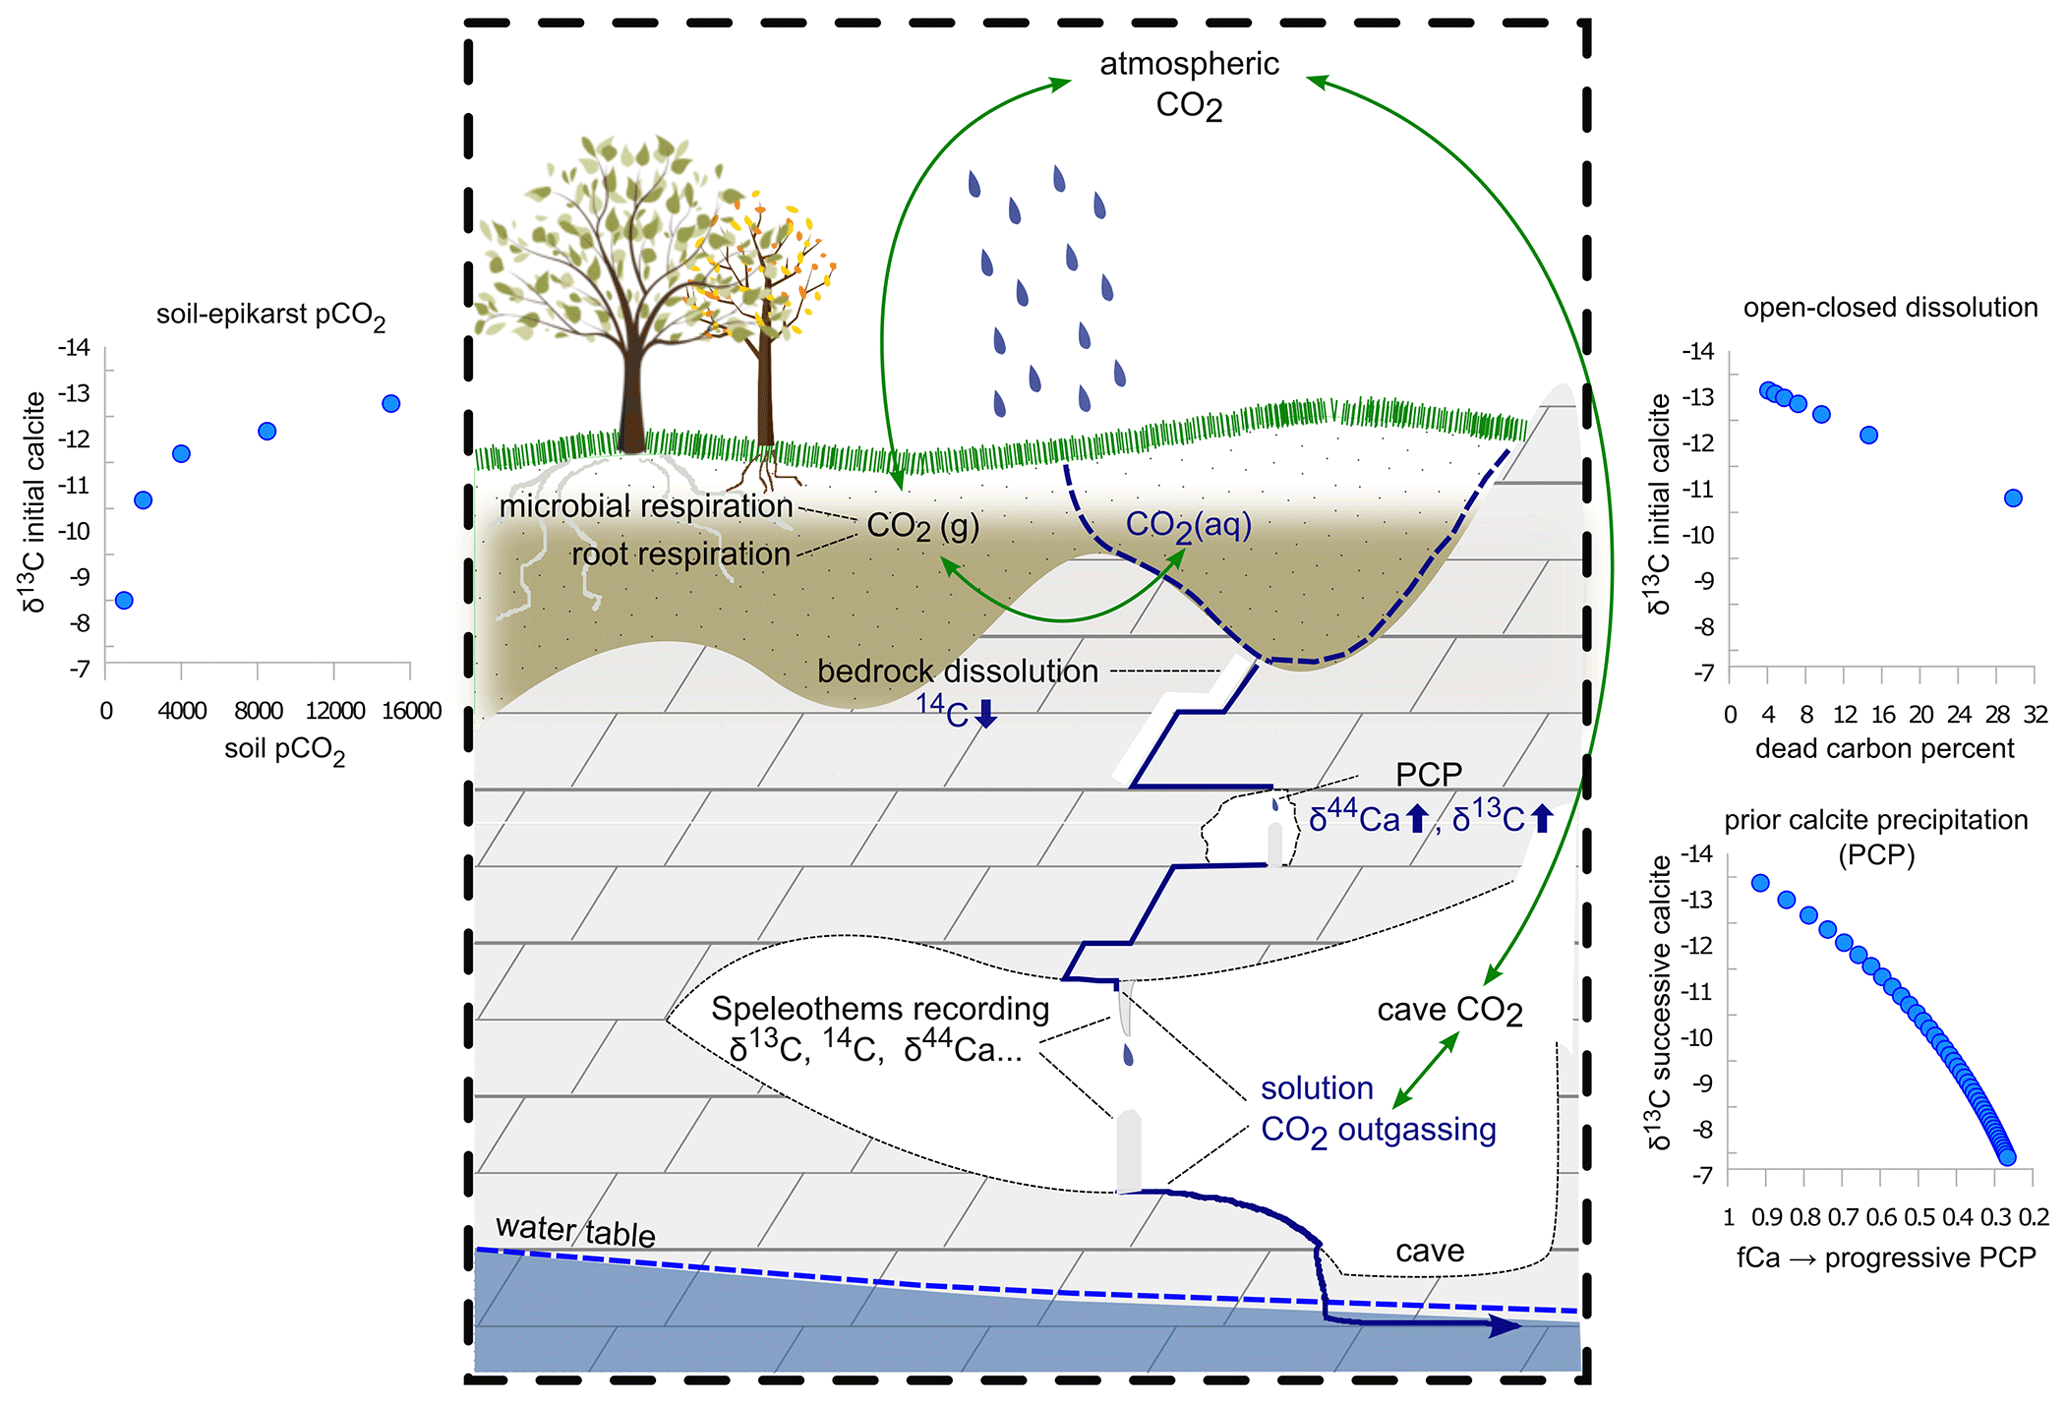
Figure 2Schematic representation of the main processes modulating δ13C, Ca, and 14C in the soil–karst–cave system. The small inserts show the evolution of δ13Cspel in response to changes in soil pCO2, DCF, and PCP. The dissolution process can be constrained using DCF, while PCP is constrained using δ44Ca. Soil pCO2 affects all three proxies but can be constrained further using the coupled relationship with δ13C from the mixing lines. Adapted from Day et al. (2021).
El Pindal and La Vallina caves are located ∼ 30 km apart on the coastal plain in Asturias, NW Iberian Peninsula, at 23 and 70 m a.s.l., respectively ( N, W; Fig. 1). Both caves developed in the non-dolomitic, Carboniferous limestones of the Barcaliente formation, with an overburden of 10–35 m of bedrock for El Pindal Cave and 10–20 m for the gallery in which samples were collected in La Vallina.
Current climate in the NW Iberian Peninsula is characterised by temperate maritime conditions, with clear precipitation seasonality but no summer drought (Peinado Lorca and Martínez-Parras, 1987). The region is strongly affected by North Atlantic climate conditions, in contrast to the rest of the Iberian Peninsula, where North Atlantic and Mediterranean influences persist (Moreno et al., 2010). Both caves are affected by similar climatic conditions, with ∼ 1250 mm/yr annual precipitation (Stoll et al., 2013) and maximum precipitation occurring in November (140 mm/month) (AEMET meteorological stations at Santander and Oviedo, period 1973–2010; AEMET, 2020). Due to the proximity to the coast, temperature exhibits a clear but modest seasonality, with averages of 9 ∘C for winter months (December–March) and 20 ∘C for summer months (June–September) (AEMET meteorological station at Santander, period 1987–2000; AEMET, 2020). For the last deglaciation, quantitative estimates of temperature can be derived from marine records from the western and southern Iberian margins. These likely give a reasonable estimate of the deglacial temperature change in caves on the coastal plain, as the region's modern seasonal cycle displays a similar amplitude to sea surface temperatures (Stoll et al., 2015). Minimum average temperatures are reconstructed for Greenland Stadial 2.1a (GS-2.1a, Heinrich event 1, 18–15 ka; Rasmussen et al., 2014) and are ∼ 8 ∘C cooler than those of the Early Holocene (∼ 8 ka; Darfeuil et al., 2016).
Previous monitoring data from the two caves reveals seasonal variations in cave air pCO2 driven by external temperature variations (Moreno et al., 2010; Stoll et al., 2012). Both caves are well ventilated in the cold season with close to atmospheric pCO2 values but feature elevated CO2 concentrations during the warm summer season (Stoll et al., 2012). The caves are covered by thin (< 1 m deep) and rocky soils, and modern vegetation is strongly impacted by Late Holocene land use change, including deforestation of native Quercus ilex (evergreen oak) for lime kilns above El Pindal Cave, and discontinuous pasture maintained by cycles of burning above both caves. At present, the vegetation above the two caves includes pasture and gorse shrub (Ulex), but in some areas above El Pindal Cave, the recent abandonment of pastures has permitted the return of patches of native Quercus ilex forest. Above La Vallina Cave, pastures are interspersed with native oak (Quercus) and planted groves of Eucalyptus, the roots of which penetrate the cave in points directly beneath the tree groves.
Candela is a calcitic stalagmite that grew ∼ 500 m inside El Pindal Cave and was not active at the time of collection (Moreno et al., 2010). Previous investigations revealed that the stalagmite grew between ∼ 25–7 ka and provide high-resolution stable isotope and trace element records (Moreno et al., 2010), as well as radiocarbon (14C) measurements between 15.4–8.8 ka (Rudzka et al., 2011). Growth of Candela is strongly condensed between 18–15.5 and 11–9 ka (Stoll et al., 2013). Stalagmite Laura is from El Pindal Cave, while Galia grew in La Vallina Cave. Both Laura and Galia are also composed of calcite. Previous U–Th dating on Galia revealed intermittent growth between 60 and 4 ka (Stoll et al., 2013), including a short growth phase at 26 ka, which together with the Holocene growth is sampled here. Laura grew between 16.1–14.2 ka, covering the GS-2.1a–Greenland Interstadial 1 (GI-1) interval.
3.1 Geochemical measurements
To minimise sampling bias, samples from all three stalagmites were drilled from the same locations for all geochemical analyses using either a handheld drill or a semi-automated high-precision drill. An aliquot each of the collected powder was used for U–Th dating, δ13C, 14C, and Ca isotopes. In the case of Candela, where a few U–Th dates were available from previous investigations (Moreno et al., 2010), powders for the remaining proxies were drilled from the same sampling holes. Additional paired multi-collector inductively coupled plasma mass spectrometry (MC-ICP-MS) U–Th dates from all three stalagmites are detailed elsewhere (Stoll et al., 2021).
For stable carbon isotopes, an aliquot of powder was analysed on a ThermoFinnigan GasBench II carbonate preparation device at the Geological Institute, ETH Zurich, following the procedure by Breitenbach and Bernasconi (2011). Measurement runs were evaluated using an in-house standard (MS2) that has been linked to NBS19 and the external standard deviation (1σ) for δ13C is smaller than 0.08 per mil (‰). Isotope values are expressed in per mil and referenced to the Vienna Pee Dee belemnite standard (VPDB).
Radiocarbon measurements were performed at the Laboratory for Ion Beam Physics, ETH Zurich, using a MICADAS (mini radiocarbon dating system) accelerator mass spectrometer (AMS; Synal et al., 2007) coupled to a gas ion source (GIS; Fahrni et al., 2013). Carbonate powders (∼ 1 mg) were dissolved in 85 % H3PO4 and the resulting CO2 gas was directly injected into the GIS. Quality control of the AMS measurements was ensured by measuring oxalic acid II (NIST SRM 4990C), IAEA C-2 as a carbonate standard, and IAEA C-1 as carbonate blank, and measurement precision was better than 10 ‰. We use the 14C reservoir effect (“dead carbon fraction”, DCF), which quantifies the amount of fossil carbon incorporated in the speleothems and serves as a tracer for changes in karst hydrology or mean soil carbon age (Genty et al., 2001). The DCF is calculated as the normalised difference between the atmospheric 14C activity (F14C; Reimer, 2013) at the time of speleothem deposition (defined through the independent U–Th chronology) and the speleothem 14C activity corrected for decay. Using paired U–Th and 14C ages has the advantage of minimising uncertainty from age modelling interpolation techniques. To account for the uncertainty in matching the speleothem chronology with the atmospheric 14C record (IntCal13 calibration curve; Reimer et al., 2013) the atmospheric record was interpolated to a yearly resolution and matched to 10 000 simulated speleothem ages for each U–Th dating point. The average and standard deviations from these ensembles were then used for the final DCF calculation and uncertainty propagation.
Samples for Ca-isotope analysis were taken from the stalagmites and from three pieces of bedrock overlying both caves. Combined bedrock and stalagmite Ca-isotope analyses allow the reconstruction of the Ca-isotopic composition of the initial growth solution and therefore of the fraction of Ca remaining in solution (fCa) at the point of stalagmite growth, a quantitative measure for PCP (Owen et al., 2016). Aliquots of CaCO3 (200–650 µg) were dissolved in distilled 2 M HNO3. The Ca was purified using an automated Ca–Sr separation method (PrepFAST MC, Elemental Scientific, Omaha, NE, USA). This process separates Ca from Sr, Mg, and other matrix elements to avoid isobaric interferences during MC-ICP-MS. Ca-isotope ratios were analysed at the University of Oxford using a Nu Instruments MC-ICP-MS, following the method of Reynard et al. (2011). All solutions were at 10 ± 1 ppm concentration, and the samples were measured with standard-sample bracketing. Each sample was analysed a minimum of 5 times. Ca was calculated using Ca Ca ⋅ (Hippler et al., 2003) and is reported normalised to NIST SRM 915a. Secondary standards HPSnew (in-house standard) and NIST-SRM-915b (purified alongside the samples) were used to determine accuracy and external precision. Measured values for our purified SRM 915b were Ca = 0.71 ± 0.06 ‰ (2se, n=12), which match values obtained by TIMS (thermal ionization mass spectrometry), Ca = 0.72 ± 0.04 ‰ (2se; Heuser and Eisenhauer, 2008). Uncertainty on Ca-isotope data is quoted as the t-distribution-derived 95 % confidence interval on the mean of repeat measurements calculated using either the standard deviation on all repeat measurements on each sample or the standard deviation on all secondary standard analyses, whichever is greater.
3.2 Process modelling and sensitivity analysis
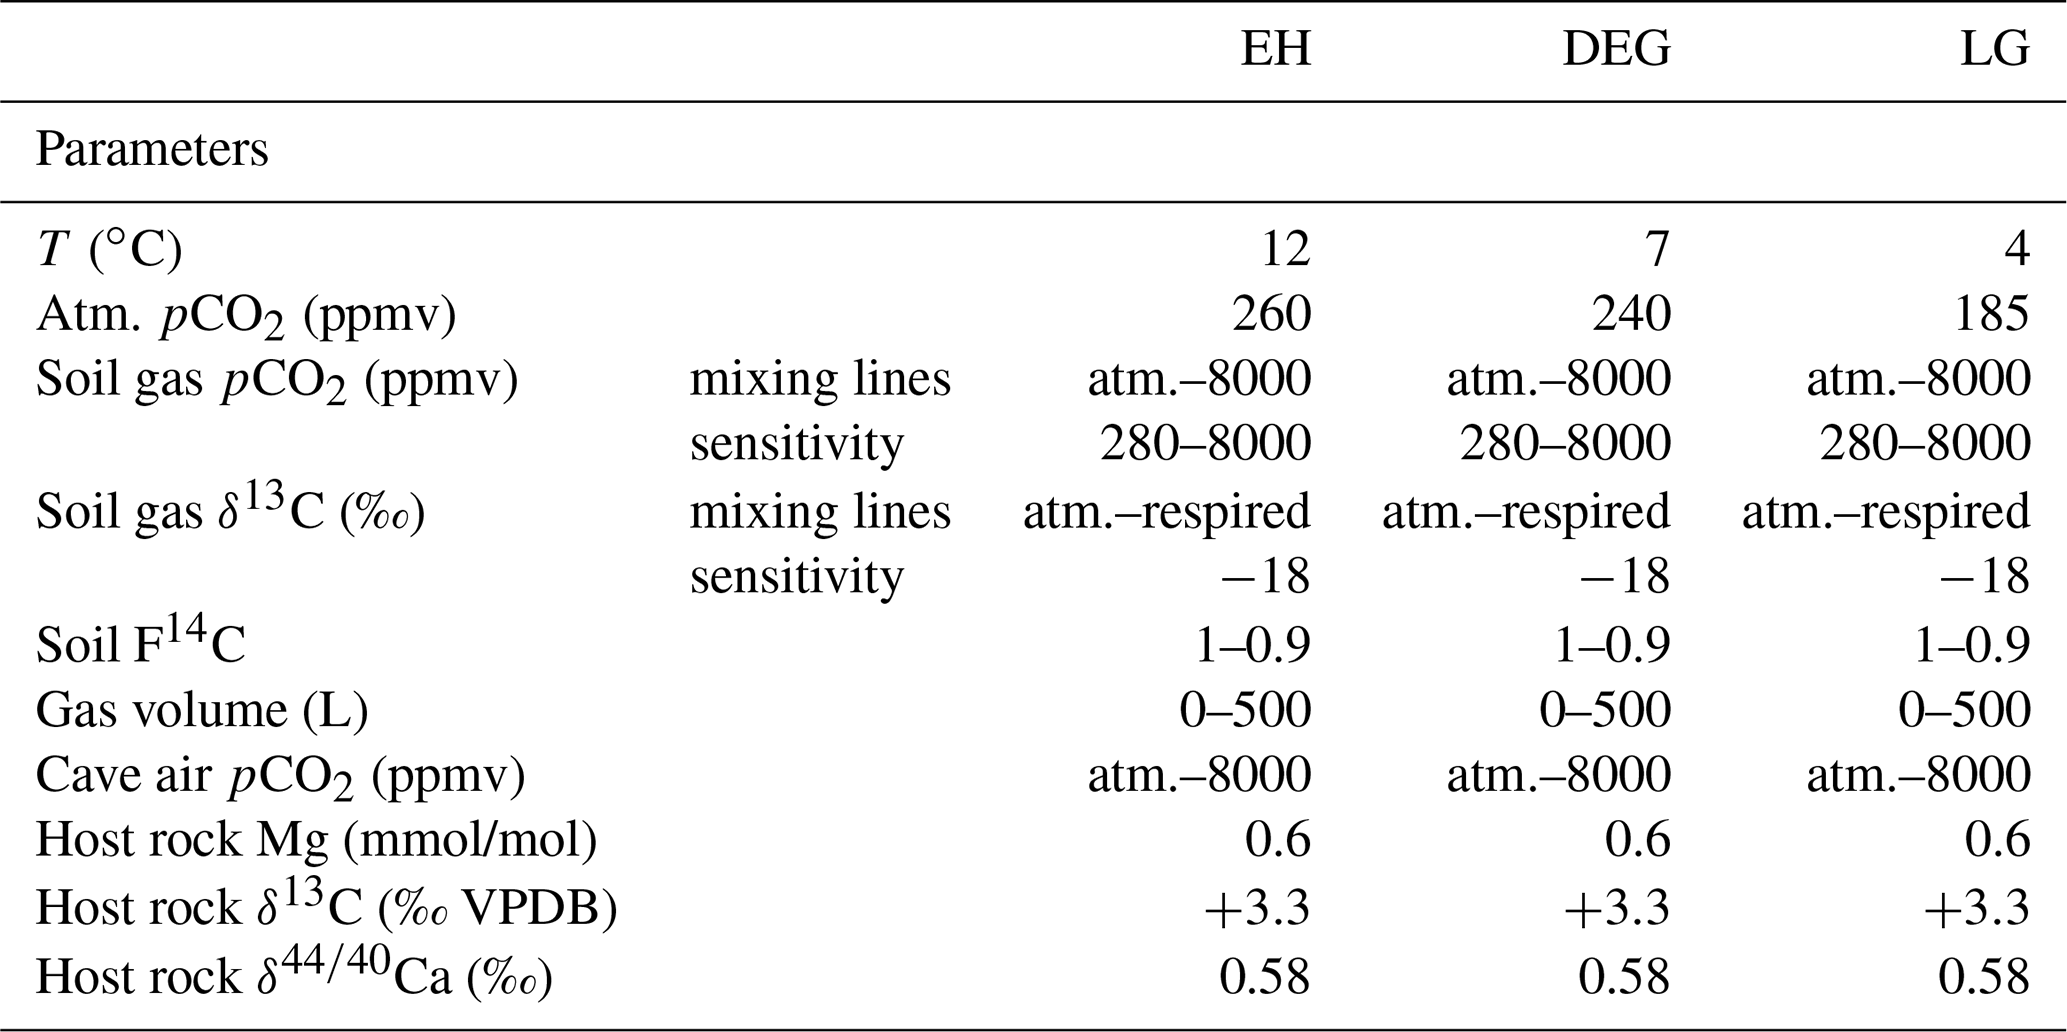
Forward modelling of processes occurring in the soil, karst, and cave allow us to investigate the combination of parameters which would simultaneously simulate δ13Cspel, Ca, and DCF for each time period sampled. Using Ca and DCF to quantify changes in PCP and bedrock dissolution conditions (open vs. closed system), respectively, we can remove these effects from δ13Cspel and derive soil gas pCO2 and δ13C (Fig. 2). We employ the PHREEQC-based, numerical model CaveCalc (Owen et al., 2018), a tool that enables us to evaluate and combine the effects of PCP and bedrock dissolution quantitatively and systematically. We generate large ensembles of simulations from which we then choose the solutions best fitting the measured proxy data. CaveCalc simulates the equilibration between meteoric water and soil CO2, the subsequent dissolution of the host carbonate rock by this solution, and the degassing of CO2 from the solution in the cave environment that leads to the formation of speleothem carbonate. Key model inputs (Table 1) are the concentration and isotopic composition of soil CO2 and the degree to which isotopic exchange during carbonate dissolution occurs under open/closed or intermediate conditions (gas volume relative to solution volume), which set the initial saturation state and isotopic composition of the drip water. Together with the soil gas pCO2, the pCO2 of the cave environment is modelled to set the degree of oversaturation the solution will have in the cave, and it determines the amount of carbonate which can precipitate before the solution reaches equilibrium. Constraints on the model parameters are given by δ13Cspel, Ca, and DCF.
Our primary interest is evaluating constraints on soil respiration, soil gas pCO2, and its isotopic composition. Soil CO2 is a mixture of carbon from respired, atmospheric, and bedrock sources, with its concentration depending mainly on temperature, water content, porosity, and soil depth (Amundson et al., 1998; Cerling et al., 1991). Global regressions find growing season soil gas pCO2 strongly positively correlated with temperature and actual evapotranspiration (Borsato et al., 2015; Brook et al., 1983), and water balance is responsible for a steep gradient in soil pH globally (Slessarev et al., 2016). As soil gas pCO2 is typically much higher than atmospheric pCO2, CO2 diffuses from the soil along concentration gradients, and its concentration and δ13C value can be approximated using a mixing line between an atmospheric and a soil respired end-member using the Keeling plot approach (Amundson et al., 1998; Cerling et al., 1991; Pataki et al., 2003). Here we use this relationship to test whether changes in soil respiration can realistically explain the observed deglacial δ13Cspel trend. The likely range of values for the soil respired end-member was constrained through monitoring of cave air pCO2 and δ13Ccave-air at La Vallina Cave, supplemented by measurements of local atmospheric pCO2 and δ13C over 1 year. This is possible because the cave, like the soil, is defined by a two end-member mixing system (soil gas and atmospheric air), driven by seasonal ventilation. Monthly CO2 measurements reveal a strong correlation between cave air pCO2 and δ13Ccave-air, in particular during the summer, when soil respiration is highest (Fig. 3a). Our estimation of the modern respired end-member, defined along a mixing line which includes the modern global atmospheric end-member, is −26.9 ± 0.8 ‰. This end-member may be more negative than the preindustrial end-member (which characterised the Early and mid-Holocene growth periods of the stalagmites in this study) because atmospheric δ13C has decreased by 2 ‰ over the last century due to anthropogenic activities (Suess effect). Assuming modern and decadal age soil carbon pools contributing dominantly to the respired end-member, the preindustrial respired end-member may have been as much as 2 ‰ heavier (∼ −25 ‰). If a significant fraction of the respired pool is older, then the preindustrial respired end-member may fall between −27 ‰ and −25 ‰, but this is unlikely since actively growing stalagmites from the cave show rapid post-bomb spike decrease in 14C.
Using this respired end-member, we define mixing lines for relevant periods of the late glacial (LG, before 16.5 ka), deglaciation (DEG, 16.5–11.7 ka), and Early Holocene (EH, after 11.7 ka), using atmospheric CO2 compositions as published from ice core measurements (Table 1, Fig. 3b). The isotopic composition of the atmospheric CO2 remains within a few tenths of a per mil of the Holocene value (Schmitt et al., 2012). Therefore, assuming a constant respired end-member, the slope of the mixing line is reduced during periods of lower atmospheric pCO2 (Fig. 3b). The mixing line may also vary if the respired end-member changes. Although there is variation in the respired end-member both within and among biomes, the mean respired end-member for the potential biomes which may have characterised this site over the last 25 ka – temperate broadleaf, temperate conifer, and boreal – feature mean δ13C of respired end-members which differ by only 1 ‰ (Fig. 3b; Pataki et al., 2003). This suggests that we cannot predict a systematic change in the δ13C of the respired end-member with changes in the biome. Moreover, the fact that deglacial trends in δ13Cspel across western Europe are very similar also indicates that highly localised factors that may lead to a strong change in respired δ13C without a biome change are unlikely. Consequently, we address the potential for variation in the respired end-member by completing a sensitivity analysis of mixing lines which encompass 3 ‰ heavier and lighter respired end-members (Supplement Table S1). For the modelling, we use a maximum soil CO2 concentration of 8000 ppmv, consistent with predictions based on modern climatology and global regressions of pCO2 from climatic factors (e.g. Borsato et al., 2015; Brook et al., 1983). Current vegetation density and soil gas pCO2 may underestimate Holocene conditions that preceded significant land use alteration, but they provide the best available constraints on the end-member. While cave conservation efforts did not permit extensive monitoring of El Pindal Cave, the proximity and similar conditions to La Vallina Cave allow us to use this end-member for both sites.
The sensitivities of the measured speleothem proxies (DCF, Ca, and δ13C) to different processes in the soil–karst–cave system allow us to use them to assess the most realistic coupling between measured δ13Cspel and soil gas pCO2. For each combination of soil gas pCO2 and δ13C calculated from the mixing lines, changes in mean soil 14C concentration, dissolution conditions (termed “gas volume” and indicating the amount of gas that 1 L of groundwater solution interacts with; Owen et al., 2018), and cave air pCO2 were allowed to vary within realistic bounds (Table 1). These boundary conditions were set based on the available monitoring data, e.g. cave air pCO2 was left to vary between atmospheric and the maximum soil gas pCO2, modelling the effect of cave ventilation dynamics on the proxies. To test whether the system can also be described without invoking changes in soil gas δ13C, we performed a second set of experiments (“sensitivity analysis”) where all parameters (soil gas pCO2, soil 14C, gas volume, cave air pCO2) were allowed to vary as before but soil gas δ13C was kept constant at −18 ‰ (Table 1).
The model solutions were compared to the measured data from Candela (the stalagmite with the most complete deglacial record) and all solutions matching the measured DCF, Ca, and δ13Cspel within a defined interval were extracted. For DCF, the confidence interval of the proxy was chosen, while for δ13Cspel and Ca, where measurement uncertainties are much smaller, we defined the threshold at ±1.5 ‰ VPDB and ±0.2 ‰, respectively. Model solutions were filtered sequentially for all three proxies, and each possible permutation of the sequences (e.g. DCF → Ca → δ13Cspel) was calculated. The median and % quantiles of all filtered solution ensembles are used as final model result. To avoid too many solutions without matches to the data, we selected the 5 % simulations closest to the measured proxy value for the sensitivity analysis.
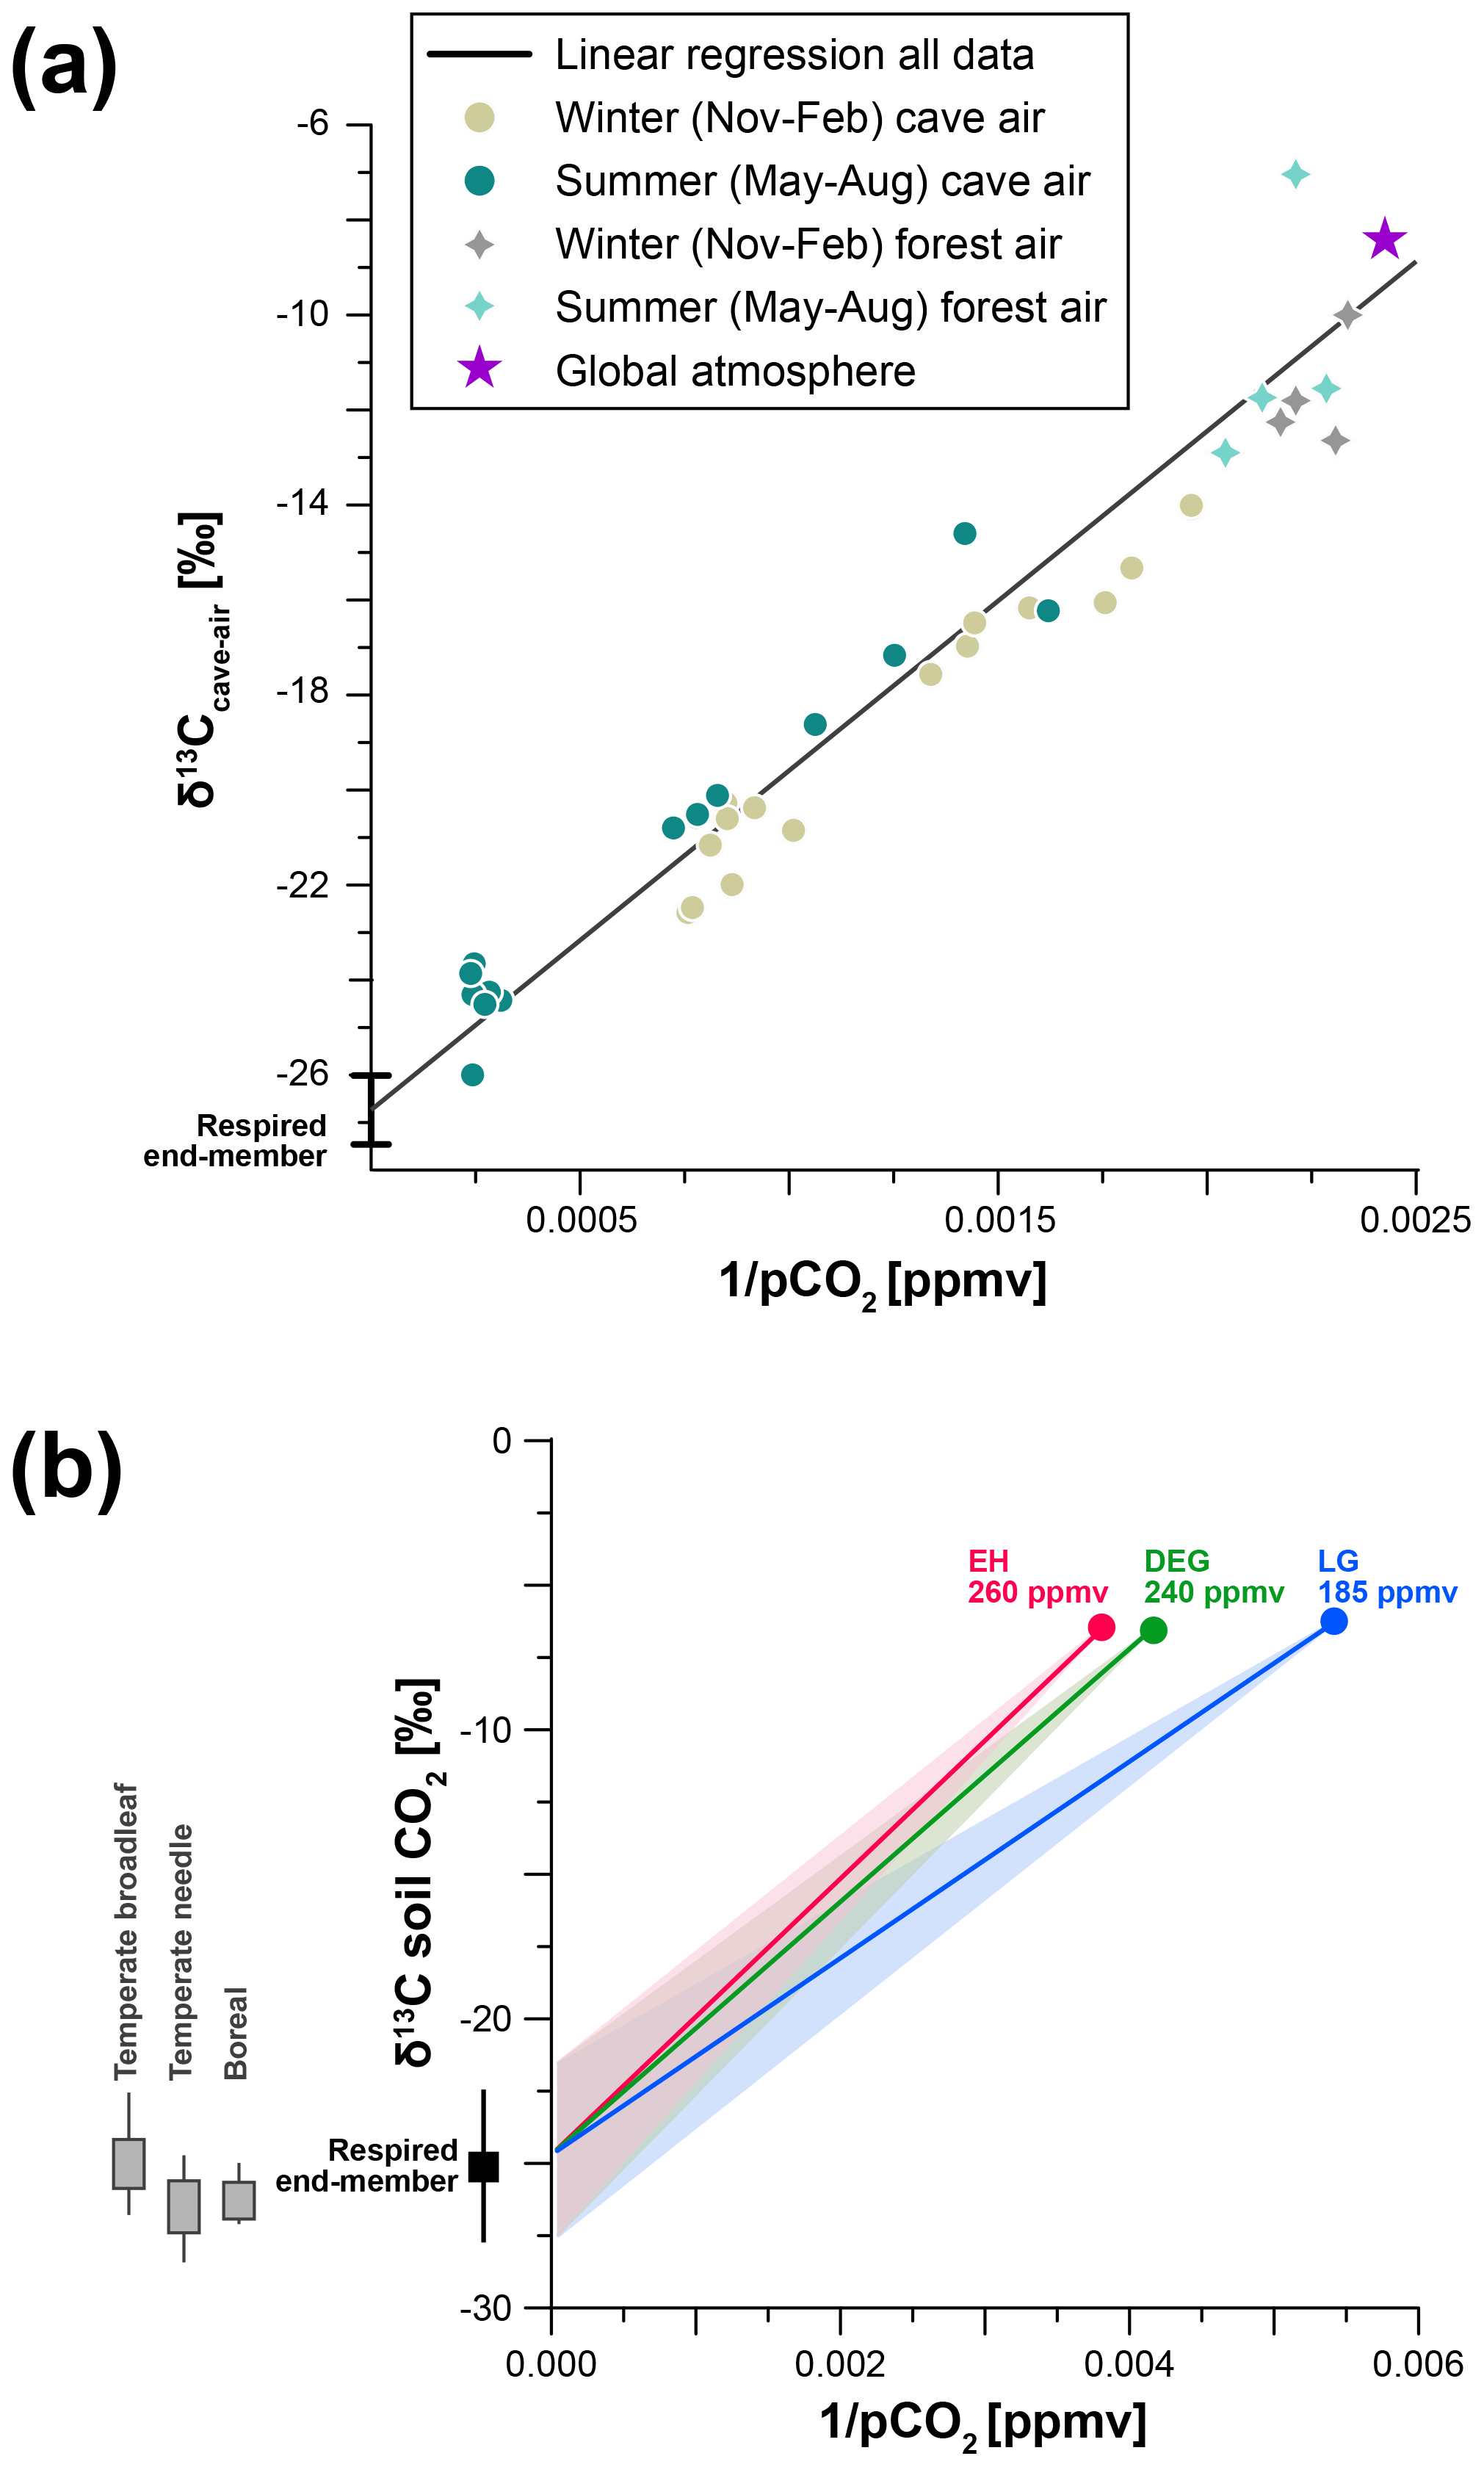
Figure 3(a) Keeling plot of cave and local atmospheric CO2 used to define the respired end-member of soil gas. The respired end-member is defined through linear regression of the entire dataset. (b) Mixing lines defined for the model simulations of past soil gas pCO2 and δ13C. We define three mixing lines based on the changes in the atmospheric composition (EH, DEG, LG). All three mixing lines use the same respired end-member, with a variability of ±3 ‰ to account for changes in respired substrate. Mean respired δ13C of soil CO2 across relevant biomes, adapted from Pataki et al. (2003), is shown on the left.
Table 1Model initial parameters used for the mixing line simulations and sensitivity analysis. Model runs were repeated for each time slice (LG, DEG, EH). Details on the mixing line values can be found in Supplement Table S1.
4.1 Geochemistry
Both Candela and Galia record a substantial decrease in δ13Cspel between the LG and the EH (Fig. 4). For Candela, δ13Cspel is highest (−2.48 ‰ and −4.43 ‰ VPDB) at 24.9–15.4 ka and then decreases by about 2 ‰ with the onset of GI-1 (14.4–12.9 ka). After a short-lived increase back to values of ∼ −3 ‰ VPDB at 12.3 ka (corresponding to Greenland Stadial 1, GS-1, Younger Dryas), δ13Cspel decreases further to −10 ‰ to −7.7 ‰ VPDB in the EH (8.5–7.9 ka). In Galia, δ13Cspel is −3.88 ‰ VPDB during the LG (26.8 ka) and between −9.78 ‰ and −8.79 ‰ VPDB in the EH (8.7–4.2 ka). Laura covers the time period between 14.3–16.1 ka, where the δ13Cspel decreases from ∼ −1.7 ‰ to −7.8 ‰ VPDB. Importantly, the absolute values and the magnitude of changes in δ13Cspel in all three stalagmites are comparable over the study period.
The DCF is relatively low in the younger part of the record (∼ 16–4 ka) of all three stalagmites (averages of 6.7 %, 7.2 %, and 13 % for Candela, Galia, and Laura, respectively, Fig. 4). DCF in Candela is slightly higher in the LG portion of the record (∼ 11 %–15 %, 18–20 ka), while values at 24 ka are again comparable with the EH. We disregard the one negative (and physically impossible) DCF value at 24.9 ka, as this is probably an artefact due to issues with U–Th dating in this section (open-system conditions in the basal section of Candela and potentially instrumental issues). For the modelling we use a value of 7 %, which is similar to values obtained for nearby paired U–Th – 14C samples (e.g. 24.2 and 24 ka; Supplement Table S2). The DCF in the LG sample from Galia is much higher (23 %) than any in the three stalagmites, but there is no indication of alteration or other reasons why this sample should not be trusted.
While the absolute Ca values in the individual stalagmites are very different, probably reflecting variations in drip path length and drip interval, leading to different amounts of PCP, their temporal variation is remarkably small. In Candela, a slight tendency towards less negative Ca values can be observed during GS-2.1a, while values are lower during the LG, GS-1, and in the EH (Fig. 4). Ca values in Galia and Laura are within uncertainty of each other. The Ca values of the three bedrock samples are consistent, suggesting a homogeneous source of Ca for the three stalagmites (Fig. 4). This allows us to calculate fCa and quantitatively estimate the amount of PCP for the stalagmites. By their nature, fCa values mirror the Ca and suggest that Galia was subject to PCP to a much higher degree than Candela and Laura, where fCa is comparable. As for the Ca, fCa values in all three stalagmites indicate no major changes over the deglaciation, suggesting minimal changes in PCP.
Comparing the three proxies to temperature reconstructions from the Iberian Margin (Darfeuil et al., 2016), using linear interpolation to roughly match the different records, confirms a negative correlation between δ13Cspel and temperature (−0.63 ‰ ∘C−1 to −0.9 ‰ ∘C−1, r2=0.67–0.96), while the relationship between Ca and DCF to temperature is weak and/or inconsistent (Fig. 5). Since this comparison is meant to simply illustrate the concept, we refrain from using more advanced statistical methods to determine correlations between the records, and also do not consider any chronological and measurement uncertainties associated with either reconstruction.
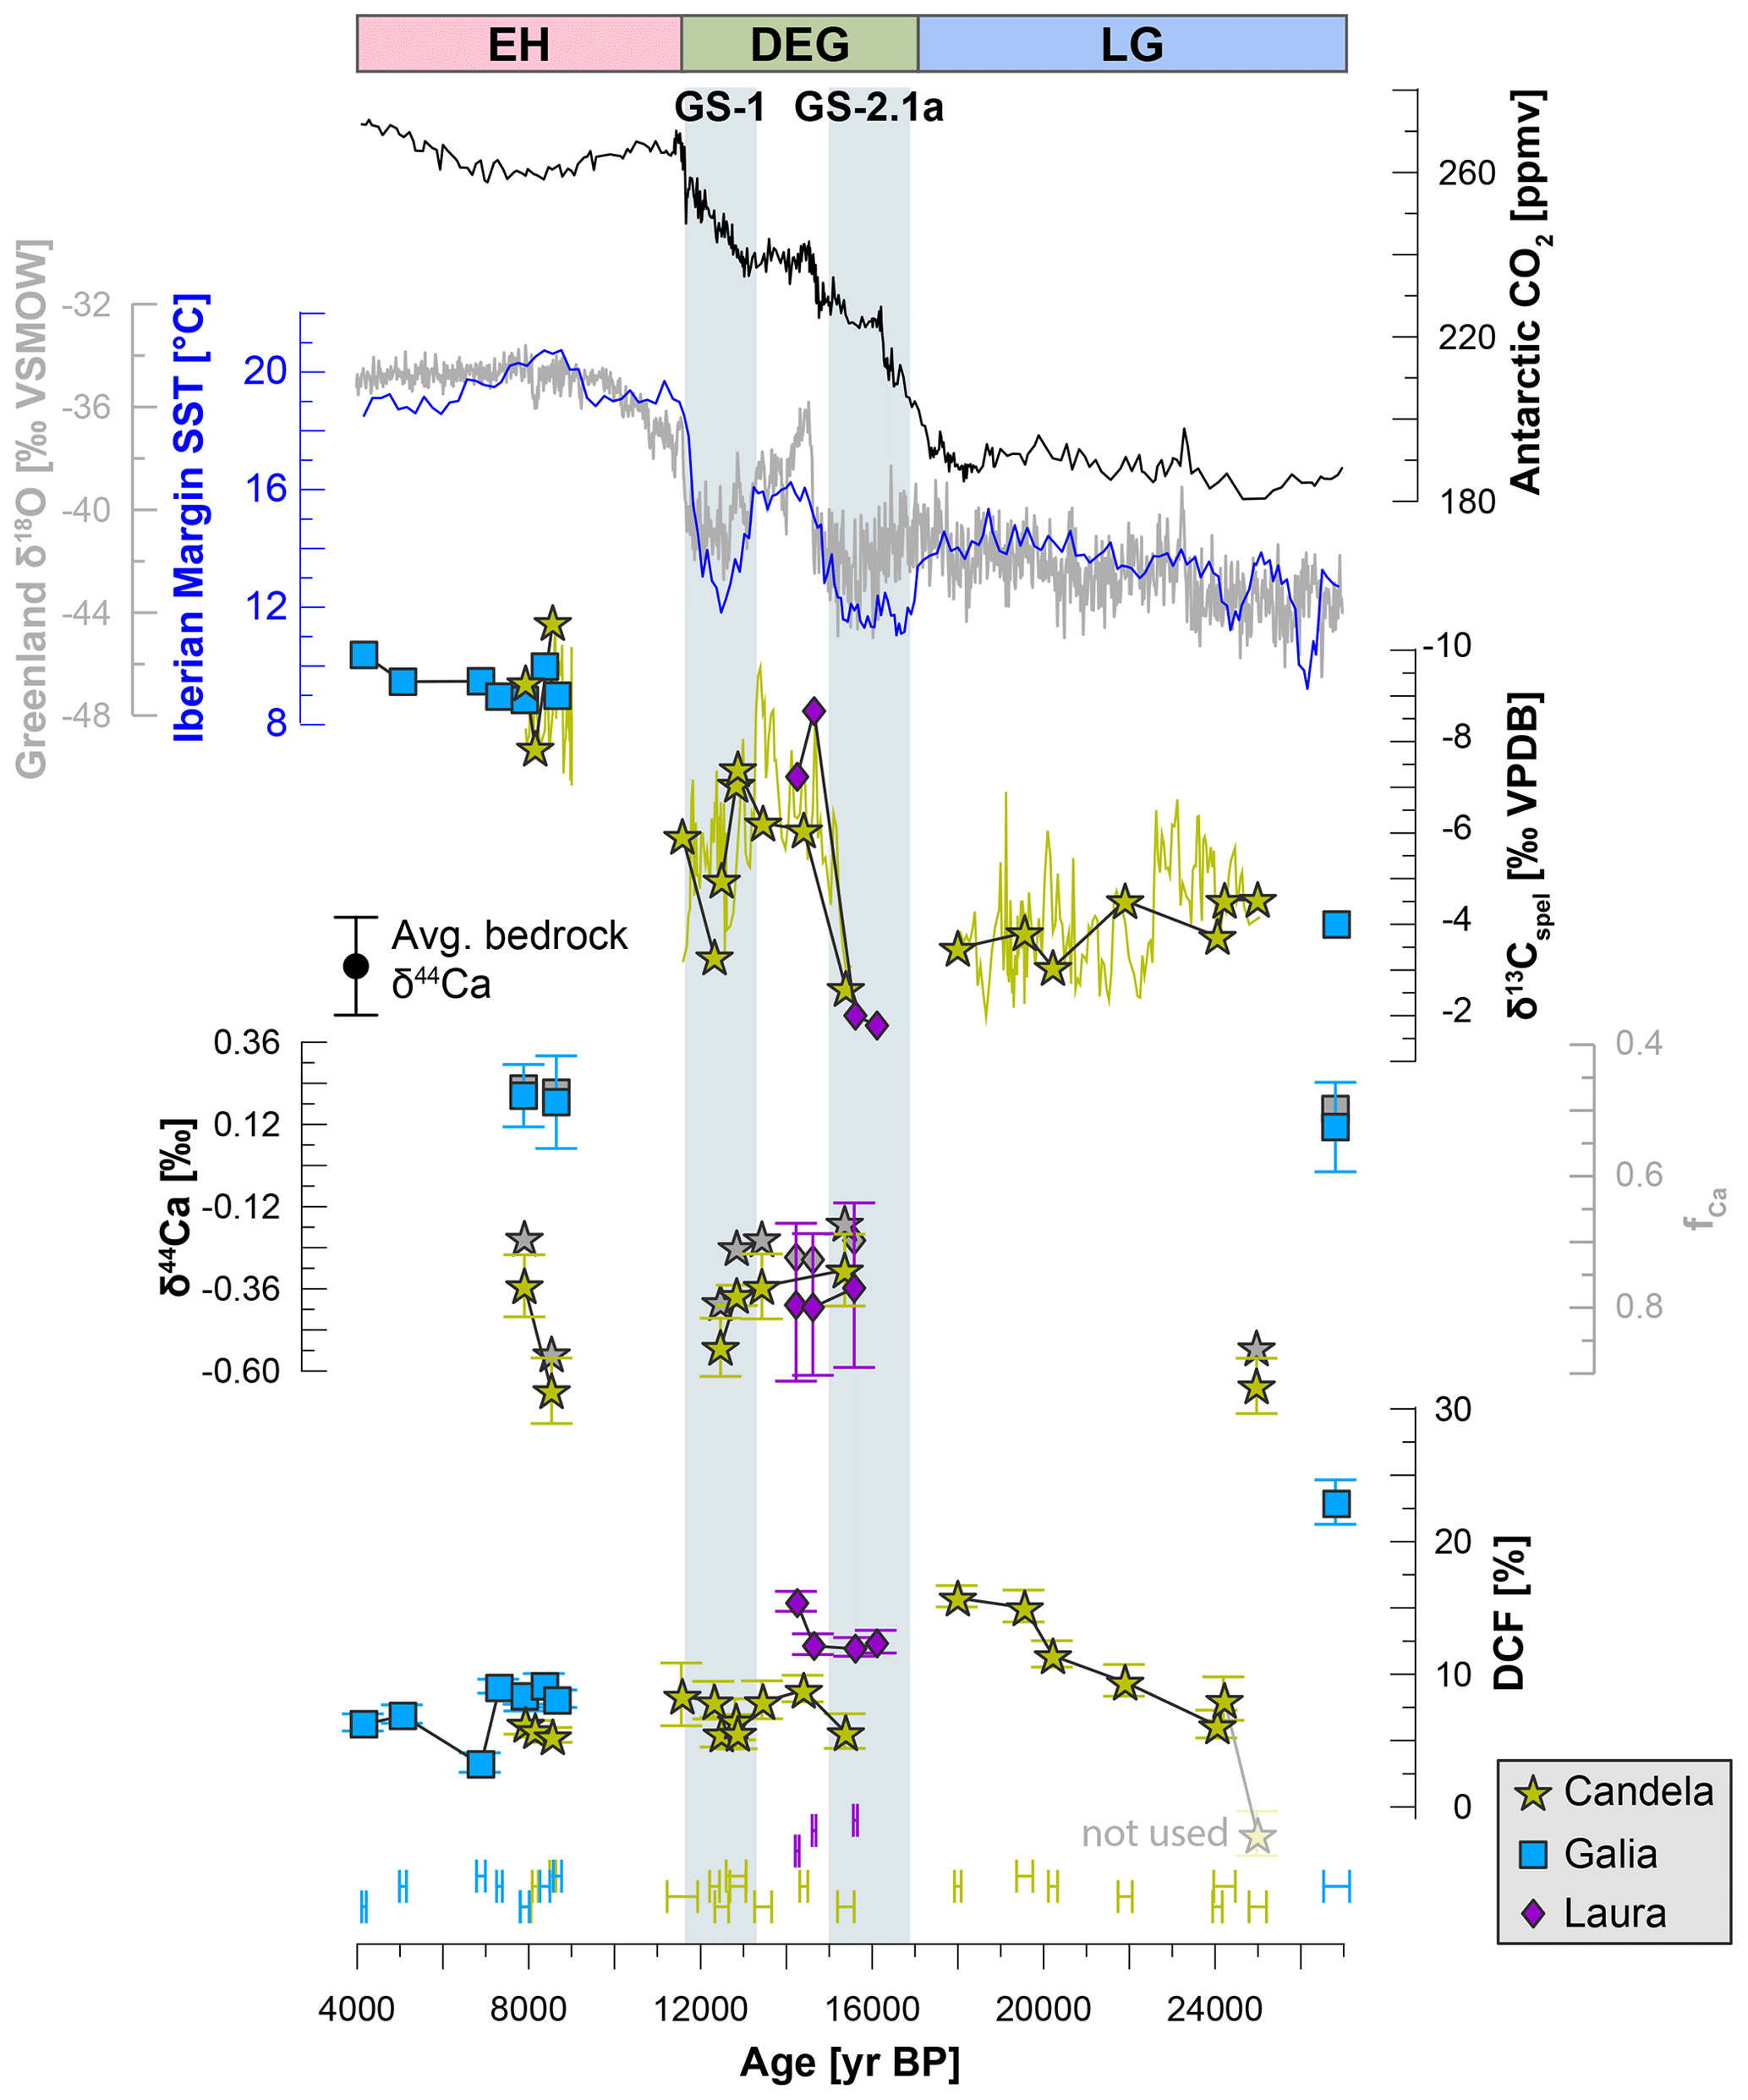
Figure 4Proxy records from stalagmites Candela, Galia, and Laura over time (see Supplement Table S2), compared to regional temperature reconstructions (TEX86-derived sea surface temperatures from the Iberian Margin; Darfeuil et al., 2016), a Greenland ice core δ18O record (NGRIP on GICC05 timescale; Wolff et al., 2010), and global CO2 (ice core composite from Antarctica; Bereiter et al., 2015). The high-resolution δ13Cspel record from Candela (thin green line) is shown for reference and was originally published in Moreno et al. (2010). The DCF values were calculated from 14C measurements paired with U–Th ages. The time periods (LG, DEG, EH) at the top of the figure indicate the intervals used for the modelling to define temperature and atmospheric pCO2.
4.2 Modelling
Each combination of soil gas pCO2 and δ13C produced 363 model solutions, resulting in 13 068 solutions for the LG, 11 979 for the DEG, and 10 890 for the EH (the total number of solutions varies due to extrapolation to lower atmospheric pCO2 during the LG and DEG). However, only a fraction of the simulations resulted in carbonate precipitation (37 % for LG, 40 % for DEG, and 44 % for EH), while for the rest, precipitation was inhibited by the solution not reaching supersaturation with respect to calcium carbonate. Supersaturation was not reached where low soil gas pCO2 or closed-system conditions reduced the amount of carbonate being dissolved or where the difference between cave air pCO2 and solution pCO2 was very small or negative. Thus, there is no need to further prescribe the cave air pCO2 as a fraction of the soil gas pCO2, as simulations with unrealistic parameter combinations (i.e. higher cave air pCO2 than soil gas pCO2) are automatically discarded.
Simulations from all three mixing lines produce results that match the stalagmite DCF, Ca, and δ13Cspel within measurement uncertainty (Fig. 6). Thus, the initial parameter selection was sufficient to constrain the system and the estimate of the soil respired end-member composition is accurate. Test simulations extending the mixing line to pCO2 higher than 8000 ppmv consistently lead to overestimation of stalagmite Ca values, further validating the initial parameter selection.
The matching solutions from all three mixing lines show an increasing trend in median soil gas pCO2 values over the deglaciation (Supplement Fig. S1). Soil gas pCO2 values are consistently lower during colder time periods (LG, GS-2.1a, and GS-1) and increase during warmer periods (GI-1 and EH), maximising with the onset of the Holocene. This also holds true when considering the results from all mixing lines combined (Fig. 6). Mixing lines 1 and 3 result in few matching solutions for the LG, GS-2.1a, and GS-1, a consequence of the more negative respired end-member δ13C used (−24.5 ‰ VPDB and −27.5 ‰ VPDB, respectively), compared to mixing line 2 (respired end-member −21.5 ‰ VPDB). Moreover, sensitivity tests using mixing lines with much higher/lower soil gas pCO2 (10 000 and 4000 ppmv) but keeping the δ13C as in mixing line 1 again results in increasing soil gas pCO2 values over the deglaciation.
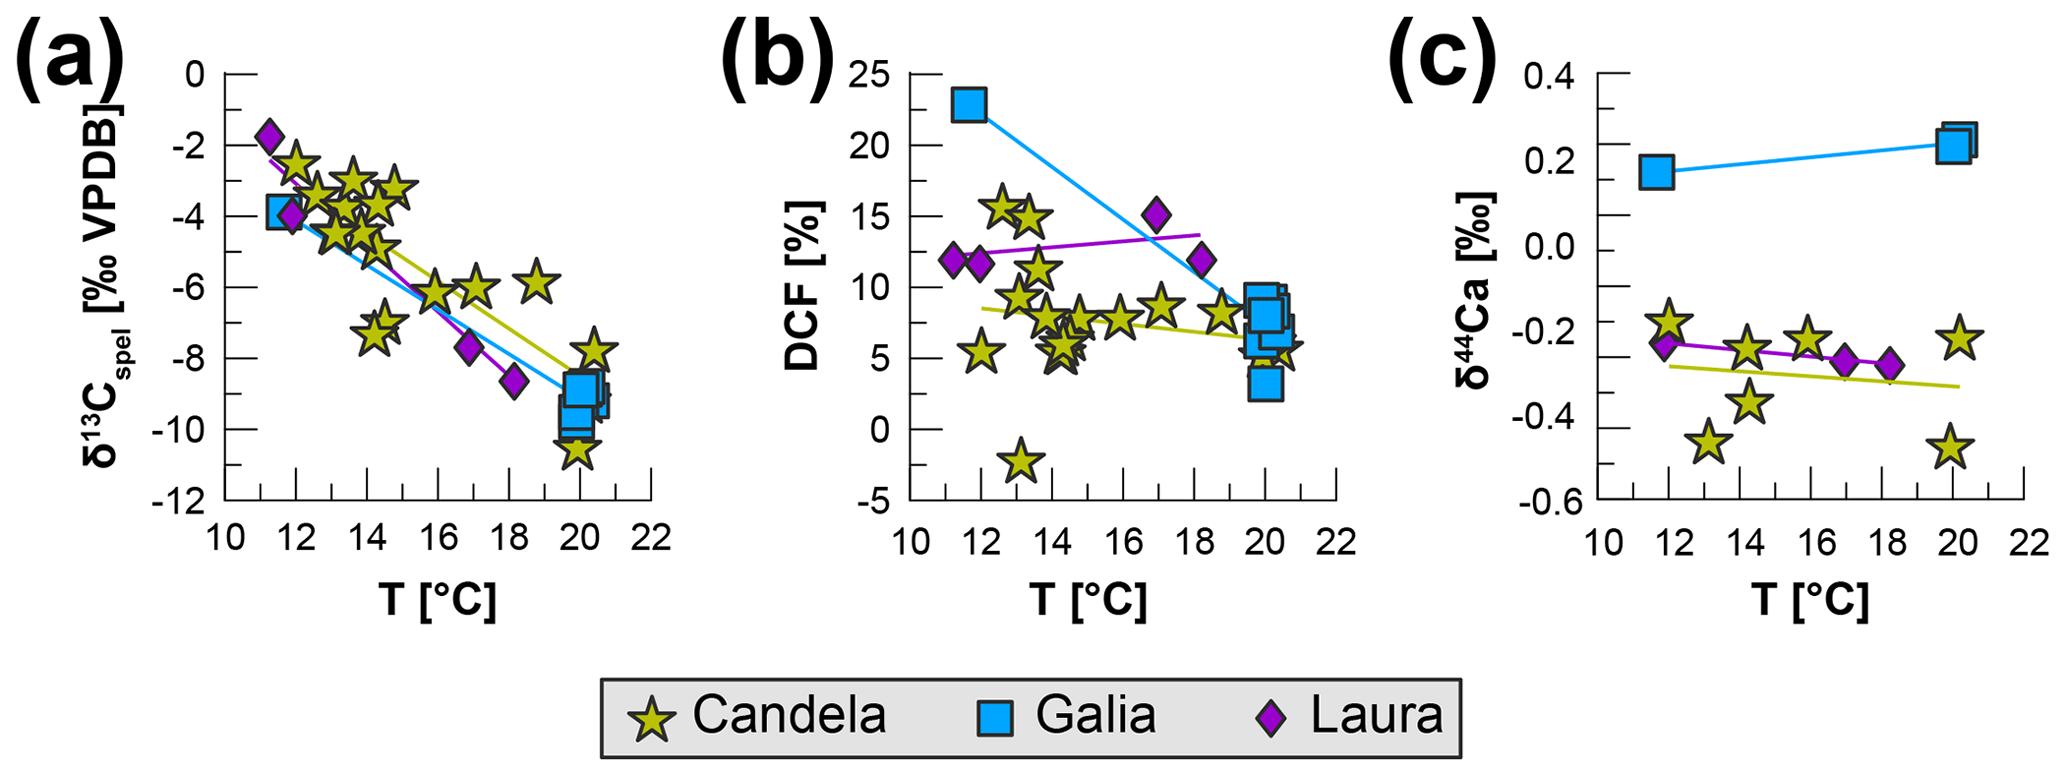
Figure 5Stalagmite proxies vs. temperature, colour-coded by stalagmite. (a) δ13Cspel; (b) DCF; (c) Ca. The corresponding paleo-temperatures are linearly interpolated from the Iberian Margin sea surface temperature (SST) record by Darfeuil et al. (2016) without considering chronological and measurement uncertainties in either reconstruction.
The model is not very sensitive to the choice of DCF threshold. Tests using a higher DCF confidence interval (±3 %) did not lead to any meaningful change in the results. Changes in δ44Ca, however, are more important, and we had to increase the confidence interval from the uncertainty from the proxy measurement, as lower uncertainty led to the model not finding matching solutions for all three proxies.
The sensitivity analysis allows more degrees of freedom in the model, where soil gas pCO2, soil gas F14C, cave air pCO2, and gas volume are allowed to freely vary but soil gas δ13C is kept constant at −18 ‰. While solutions matching DCF and Ca are easily found with this set of parameters, the deglacial trend in δ13Cspel cannot be reproduced (Fig. 6). Only ∼ 2 ‰ of the ∼ 6 ‰ decrease in δ13Cspel (between 24.9 and 8.5 ka) can be explained through processes other than changes in the soil gas δ13C (Fig. 7). It should be noted that the absolute value of the residual calculated from the measured and modelled δ13Cspel is tied to the initial parameter selection and would vary if we chose differently. The relative differences, however, would remain the same, as long as the initial soil gas δ13C is not allowed to vary. We have chosen a relatively high initial soil gas δ13C as more negative values result in very few solutions matching the proxy data. This illustrates how the δ13Cspel trend over the deglaciation requires a change in the initial soil gas δ13C. Holding soil gas pCO2 constant and letting soil gas δ13C vary would lead to the entire 6 ‰ change in δ13Cspel being driven by changes in the respired end-member δ13C. This is unrealistic, as biome-level values of respired δ13C typically show little variation (e.g. Pataki et al., 2003; Fig. 3b), and therefore even a substantial deglacial transition from boreal to forested landscape would likely not lead to such a large shift in δ13C.
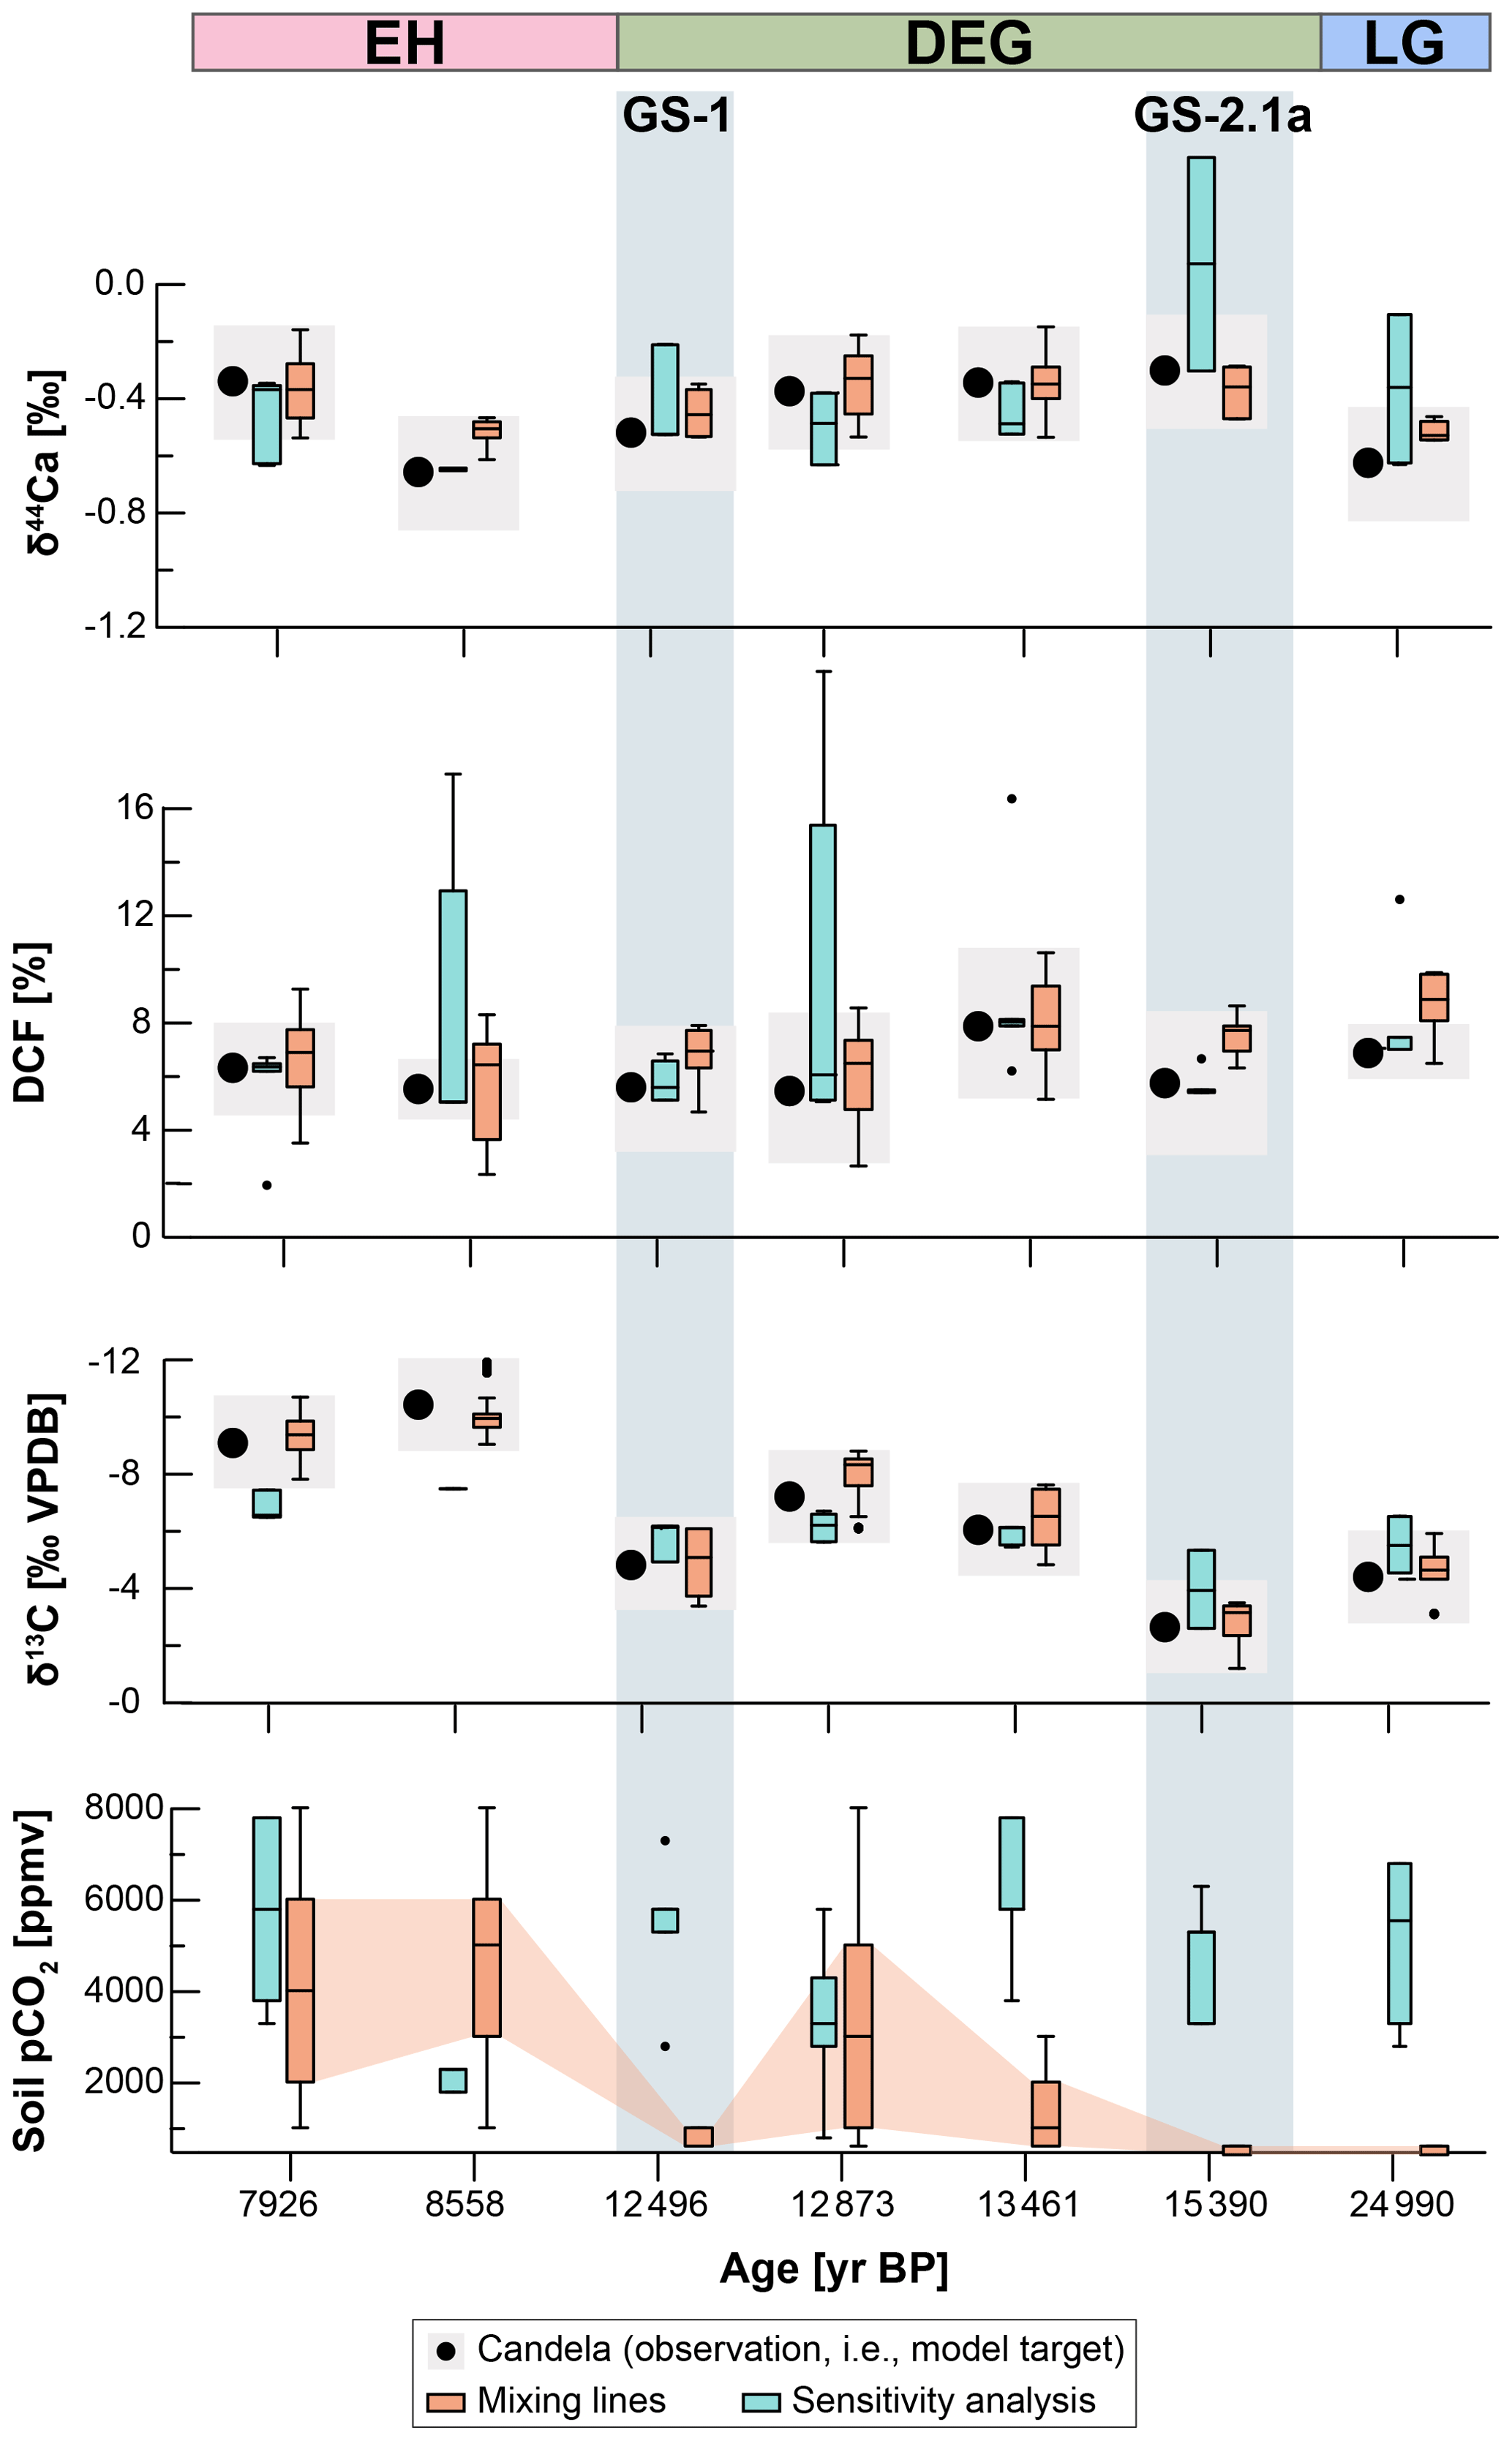
Figure 6Modelling results compared to measured proxies in stalagmite Candela. Stalagmite measurements (δ13Cspel, DCF, Ca; black dots) are compared to best-fitting model solutions (colour-coded by simulation type). Simulation results are shown as box plots, with the median and upper and lower quartiles displayed. Outliers are shown as dots. Grey shading indicates intervals of the measured proxy values used to filter the simulations. The soil gas pCO2 derived from the different model solutions is shown. The time periods (LG, DEG, EH) at the top of the figure indicate the intervals used for the modelling to define temperature and atmospheric pCO2.
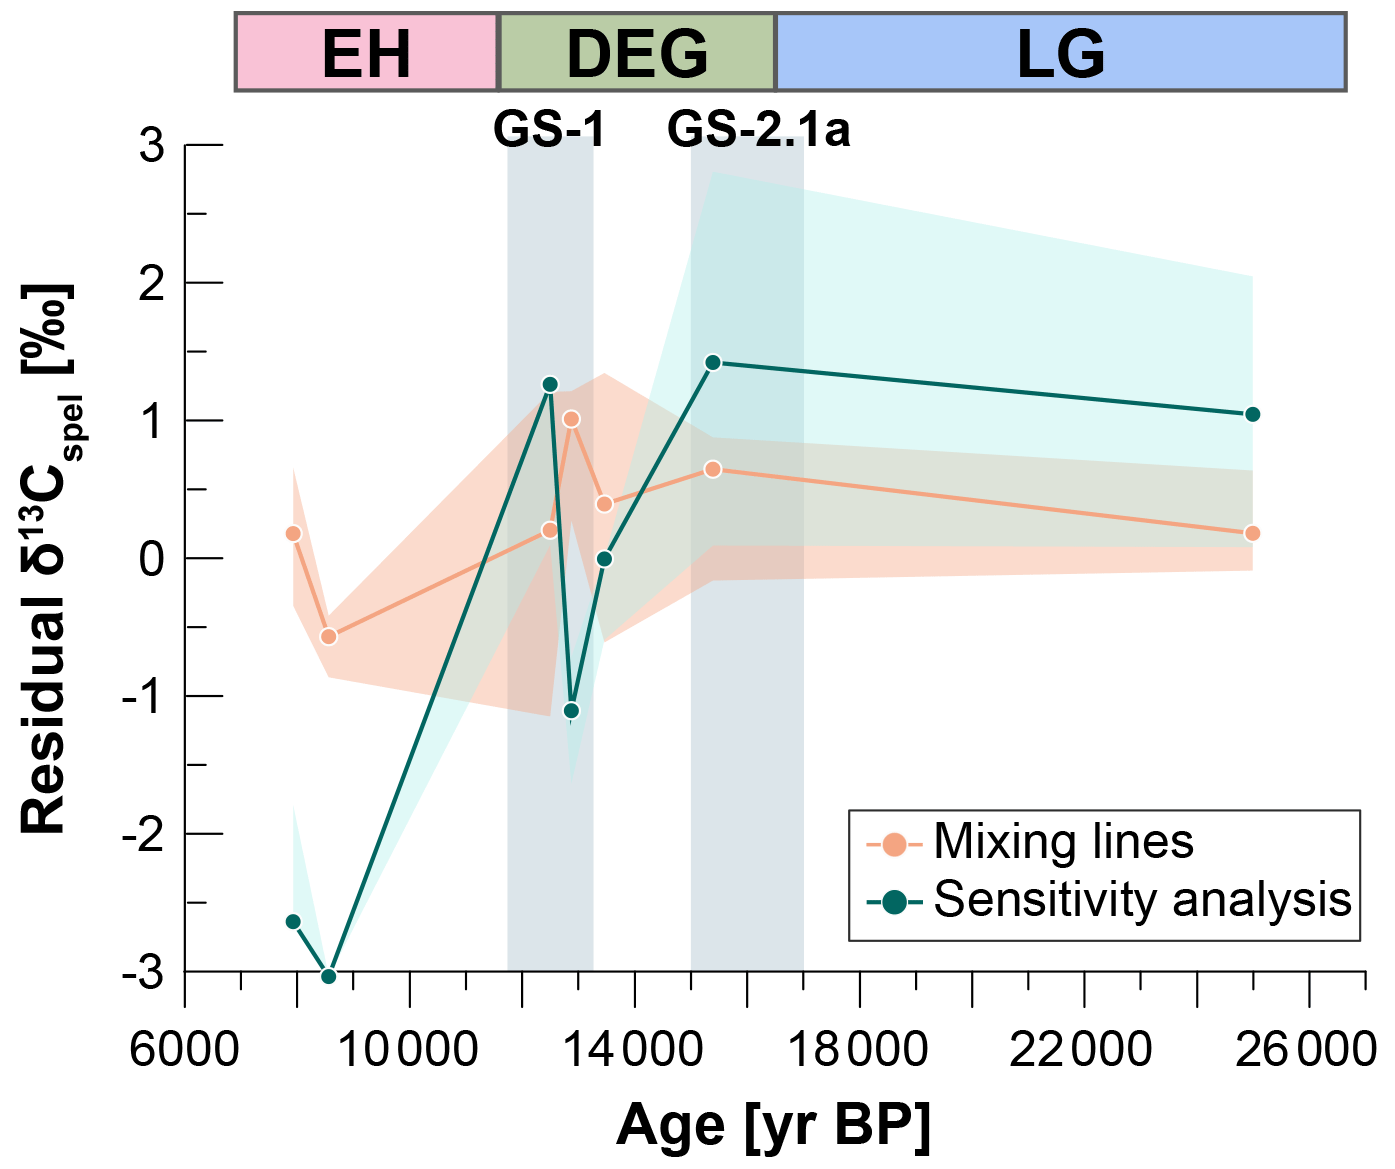
Figure 7Residual δ13Cspel calculated as the difference between measured and modelled δ13Cspel over time.
5.1 Estimation of the soil respired end-member from cave air
Combined multi-proxy analysis on three stalagmites and geochemical modelling provide strong evidence that changes in initial soil gas δ13C are necessary to explain the deglacial trend in δ13Cspel observed in the NW Iberian Peninsula. Here we show that this trend is best explained by variations in soil respiration and in the relative proportion of respired vs. atmospheric CO2 in soil gas. Soil gas CO2 is a mixture of CO2 from respiration and atmospheric air (Amundson et al., 1998). Therefore, the pCO2 and isotopic composition of soil gas over depth can be modelled by a mixing line between the atmospheric and soil respired end-member (Pataki et al., 2003). While more recent research has pointed out that this approach neglects spatio-temporal fluctuations in the isotopic signature of soil CO2 sources (Goffin et al., 2014), as well as soil storage capacity and the possibility of turbulent transport (Maier et al., 2010), it still provides a valid model with which we can test the overall effects of bulk variations in soil respiration on the drip water solution. In the absence of a full soil monitoring campaign, samples collected from the cave in summer months represent a reasonable approach to estimate the isotopic value of the respired end-member contributing to soil/epikarst gas. This is because the cave, like the soil, is defined by a two end-member mixing system, which is driven by the physical ventilation of the cave. The main fluxes of carbon in a system like El Pindal and La Vallina caves are from soil gas (mainly seeping through the host rock and into the cave) and atmospheric air (through ventilation). Like many mid-latitude and high-latitude cave systems, there is a seasonal reversal in the airflow direction in La Vallina cave (Stoll et al., 2012). In the summer, when cave air is colder than exterior air, cave air flows out the entrance and is replaced by inflow and diffusion of soil/epikarst gas. In this season, the cave air has the highest CO2 concentrations, with an isotopic composition that falls close to the soil respired end-member on the Keeling plot (Fig. 3a). In the winter, when cave air is warmer than exterior air, exterior air flows in through the cave entrance, bringing the cave closer to the atmospheric end-member. The data from the monitoring of the cave primarily reflects CO2 from the soil that is drawn through the karst network into the cave. It therefore likely reflects soil column-integrated conditions and the full contribution of respired CO2 in the soil and epikarst unsaturated zone (below the soil, “ground air”). We do not consider the effect from increasing canopy cover over the deglacial transition, which may affect the soil gas δ13C through the canopy effect (more depleted CO2 close to the ground; Buchmann et al., 2002), as well as atmospheric turbulence and advection effects, as these effects lead to small shifts in soil gas δ13C compared to the recorded signal.
Any contribution of carbon from bedrock dissolution does not significantly affect our estimation of the respired end-member because the intercept defining the respired end-member is most influenced by the summer season cave air pCO2 data (Fig. 3a). During the summer season drip flow rates are more than an order of magnitude lower than in the winter, and degassing from this drip is suppressed by the high cave air pCO2. In winter, when drip rates are higher and cave air pCO2 is lower, degassing may contribute to carbon in cave air, as seen in other systems (Waring et al., 2017). However, winter monitoring data corresponding to ventilated periods are near the global atmospheric composition, suggesting an insignificant impact of degassing of dissolved limestone on our calculated mixing line. Furthermore we do not find evidence for a different Keeling intercept in winter and summer, unlike monitoring studies which infer a strong effect of degassing of a carbon source from limestone dissolution (Waring et al., 2017).
The seasonality of the modern cave air has the advantage of helping to define the modern respired end-member. From our monitoring, we do not find evidence for a different isotopic value of the respired end-member in different seasons. Thus, exploiting the seasonal ventilation of the cave to define the mixing line and respired end-member does not preclude using this respired end-member to interpret records from speleothems in which deposition is dominant in one season. We therefore argue that summer cave air can be used to estimate the isotopic composition of the respired end-member of soil CO2, when the competing fluxes are minimised.
5.2 Temperature sensitivity of soil respiration as the main driver for δ13Cspel
Our modelling results show a consistent pattern of increasing soil gas pCO2 over the last deglaciation, with absolute values ranging between ∼ 410–600 ppmv during the LG (at 24.9 ka), and ∼ 1000–6000 ppmv during the EH (at 8.6 ka), depending on the mixing line used. An increase in soil respiration rates coinciding with deglacial warming is likely, as higher temperatures promote more rapid soil carbon turnover (Vaughn and Torn, 2019) and the establishment of denser forests (Vargas and Allen, 2008). Climate model simulations confirm that net primary productivity in the NW Iberian Peninsula was lower during the LG than at present (Scheff et al., 2017). Pollen studies from the NW Iberian Peninsula show significant and rapid changes in vegetation type and cover over the Pleistocene–Holocene transition (Moreno et al., 2014). While LG pollen reconstructions suggest a landscape dominated by open grassland (30 %–35 % Poaceae) with significant steppe taxa and low arboreal pollen (30 %–50 % primarily Pinus sylvestris and Betula), the EH pollen assemblage is dominated by arboreal pollen (70 %–90 %; Moreno et al., 2011). It is likely that the rapid response of pollen assemblages to climate warming is due to the region's proximity to documented tree refugia in the Mediterranean region (Fletcher et al., 2010).
Assuming a temperature change of roughly 7 ∘C between the LG and EH, in line with TEX86-based temperature reconstructions from the Iberian Margin (Darfeuil et al., 2016), the sensitivity of soil respiration to temperature change (Q10, i.e. factor by which soil respiration increases with a 10 ∘C rise in temperature) derived by our modelling experiments lies between 3.6 and 14.7, depending on the initial conditions of the models. This is higher than the mean global Q10 values of 3.0 ± 1.1 found by the soil respiration database (Bond-Lamberty and Thomson, 2010), and may be exaggerated by chronological uncertainty in the marine and speleothem records and by uncertainties in the temperature proxies (> 4 ∘C, Darfeuil et al., 2016; Tierney and Tingley, 2015). Changes in seasonality between EH and LG could also lead to bias in the temperature reconstruction due to shifts in nutrient availability and marine productivity (Darfeuil et al., 2016). Furthermore, a change in respired substrate over time, leading to a shift in the soil respired end-member δ13C (Boström et al., 2007), could lead to higher Q10 than the global mean. We can exclude changes in vegetation assemblage from C4 to C3 plants, as there is no evidence for the widespread presence of C4 plants during the glacial in the NW Iberian Peninsula (Moreno et al., 2010) or elsewhere at temperate western European sites (Denniston et al., 2018; Genty et al., 2006, 2003). A change in the balance between heterotrophic and autotrophic respiration is another possibility that would influence the soil gas δ13C. Changes in temperature affect root and microbial respiration differently (Wang et al., 2014), as do changes in other environmental variables, e.g. precipitation regimes and nutrient cycling (Li et al., 2018). Microorganisms are typically enriched by 2 ‰–4 ‰ compared to plants (Gleixner et al., 1993), and vertical enrichment by ∼ 2.5 ‰ in soil profiles has been attributed to an increasing contribution of soil microbially derived material with depth to the overall soil carbon turnover (Boström et al., 2007). The release of older and enriched carbon from soils and long-lived plant material through respiration could provide an additional mechanism with which the soil gas δ13C could be shifted regardless of changes in soil respiration (Fung et al., 1997). Very high Q10 values have also been found in winter at a Danish beech forest site, suggesting a stronger temperature (and potentially soil moisture) control during the cold season, potentially resulting in the activation of dormant microbial communities, the alteration of diffusion processes of organic molecules and of cell metabolism (Janssens and Pilegaard, 2003). It is possible that the significant environmental changes occurring over the last deglaciation resulted in similar responses from the soil microbial community, leading to the observed high Q10 values. A higher respired δ13C during the LG is also suggested by the model results, where mixing line 3 with the lowest respired δ13C (−25.9 ‰) fails to produce solutions matching the speleothem data (Fig. S1). Given the small variation in DCF values in Candela over the deglaciation, we can exclude the possibility that changes in the fraction of bedrock carbon from changing dissolution conditions constitute an important driver of the deglacial signal.
Another intriguing possibility is that the carbon isotopic fractionation of C3 vegetation is controlled by atmospheric pCO2 (Schubert and Jahren, 2015). A recent global compilation of speleothem records shows that, after correcting for the expected effect of precipitation and temperature on δ13C of C3 biomass and the temperature-dependent fractionation between CO2 and calcite, the global average δ13Cspel closely tracks atmospheric pCO2 over the last 90 ka (Breecker, 2017). The magnitude of the deglacial shift in C3 plant δ13C has been proposed to lie around 2.1 ‰ (Schubert and Jahren, 2015). The deglacial δ13Cspel record from the NW Iberian Peninsula, however, shows clear millennial-scale variations that coincide with temperature variations, but are not driven by atmospheric CO2 (Fig. 4). Therefore, while it is possible that a CO2 fertilisation effect contributed to the overall decrease in δ13Cspel over the deglaciation, this effect is likely not dominant.
Our findings will likely apply more broadly for caves in settings where soil gas pCO2 is temperature limited. Sites where soil gas pCO2 is moisture limited, e.g. further south on the Iberian Peninsula, will likely exhibit very different trends in δ13Cspel over glacial–interglacial cycles, as hydroclimate and temperature may have different phasings.
5.3 Other processes affecting δ13Cspel
While a change in soil respiration and consequently in the proportion of respired vs. atmospheric CO2 in the soil gas can explain the deglacial trend in δ13Cspel, a number of other, cave-specific processes could also contribute to changes in δ13Cspel. The direct effect of the glacial–interglacial temperature change on carbonate equilibria and fractionation factors is small and taken into consideration by running the simulations with EH, DEG, and LG parameters. It is more difficult to assess whether kinetic fractionation effects affected the stalagmite at different times, potentially amplifying the δ13Cspel signal. CaveCalc uses standard kinetic fractionation factors for the CO2–DIC–carbonate system (Romanek et al., 1992; Zhang et al., 1995), where DIC stands for dissolved inorganic carbon, and therefore such variations are not considered by the model. However, the high degree of coherence between δ13Cspel records from the entire temperate western European region suggests that localised, cave-specific kinetic fractionation effects likely played a minor role in driving the deglacial trend (Fig. 1).
Changes in the amount of PCP the drip water experiences en route to the speleothem can lead to significant variability in δ13Cspel records (Fohlmeister et al., 2020), and they are tightly coupled to changes in cave air pCO2 and cave ventilation dynamics. Higher cave air pCO2 and a reduced CO2 gradient between the supersaturated drip water solution and the cave air result in less PCP and vice versa for lower cave air pCO2. It is likely that cave air pCO2 was lower during the last glacial at the study sites, and indeed this is also suggested by our model results (Supplement Fig. S2). Cave air pCO2 is coupled to soil gas pCO2, which provides its upper limit, and model results automatically filter out unrealistic scenarios, as no speleothem precipitation occurs when cave air pCO2 is equal to or higher than soil gas pCO2. Our multi-proxy dataset allows us to evaluate the importance of PCP for δ13Cspel quantitatively, as Ca can provide quantitative PCP reconstructions over time (Owen et al., 2016). ratios are also often used as a proxy for PCP; however, caution is required in their interpretation in El Pindal Cave because in the Holocene, is also affected by increasing surf-zone marine aerosol contributions as rising sea level brought the coastline to the foot of the sea cliff in which the cave has its entrance (Supplement Figs. S3 and S4). Over the last deglaciation, Ca and fCa varied only minimally in both Candela and Galia (Fig. 4), suggesting that changes in PCP were small. This is also reflected in the sensitivity analysis, where changes in δ13Cspel cannot be reproduced while also fitting the Ca curve (Fig. 6). CaveCalc uses cave air pCO2 to match the degree to which drip water has lost its initial Ca due to calcite precipitation, giving us a measure for PCP. A solution equilibrated with a high soil gas pCO2 would lose the majority of its carbonate in a simulation where cave air pCO2 is atmospheric, due to the high degree of oversaturation of the drip water solution compared to cave air. If Ca provides evidence that only a small portion of Ca has been precipitated, then the simulation must match the data by prescribing a higher cave air pCO2. In reality, the fraction of Ca precipitated from drip waters depends not only on the oversaturation of the solution, but also on the time the water is present as a thin film on the cave ceiling and stalagmite surface before being replaced by a new water parcel (i.e. drip interval; Fohlmeister et al., 2020; Stoll et al., 2012). When the drip interval is short, none of the water parcels will have enough time to fully degas CO2 and equilibrate with the cave atmosphere, and PCP is lower than what would be possible given the cave air pCO2. CaveCalc does not model drip interval, and therefore the cave air pCO2 inferred from the simulations might be overestimated. We test the effect of drip interval length changes on fCa and PCP using the forward model ISTAL (Stoll et al., 2012), which explicitly models this parameter. Two model scenarios simulate full glacial and Holocene conditions, including changes in temperature, cave air pCO2, and soil gas pCO2 for “winter” (i.e. atmospheric) and “summer” (i.e. elevated) cave air pCO2 (Supplement Fig. S4). The effect of the glacial–interglacial temperature change is only significant for high drip intervals during the cold season, where PCP is slightly higher during interglacial conditions. At high drip intervals, the temperature increase leads to a change in fCa of ∼ −0.1, which translates to a ∼ 0.04 ‰ change in Ca and a −0.7 ‰ VPDB change in δ13Cspel. This corroborates our expectation from the Ca record and CaveCalc model results, suggesting that only a small part of the shift in Candela δ13Cspel over the last deglaciation was due to changes in PCP.
While it is likely that some or all of these processes affected the deglacial δ13Cspel to some extent, their magnitude is not large enough to explain the measured ∼ 6 ‰ shift, suggesting that changes in soil gas pCO2 played a significant role.
5.4 Insights into regional hydroclimate over the last deglaciation
Our new multi-proxy record from stalagmites from the NW Iberian Peninsula also offers nuanced insights into local hydroclimate conditions over the last deglaciation. While DCF mainly responds to changes in carbonate dissolution conditions and therefore is sensitive to changes in infiltration, Ca is driven by both infiltration dynamics (determining the initial oversaturation of drip water and the degassing timescale) and cave atmospheric pCO2 (determining the amount of PCP occurring). The Candela record suggests no substantial shift in infiltration dynamics or PCP occurring between LG and EH (Fig. 6), as both proxies fluctuate around a mean value without long-term trends. This result suggests that the glacial hydroclimate in the NW Iberian Peninsula was not significantly different from the Holocene and stands at odds with previous mainly pollen-based studies that often point towards a drier glacial but with considerable variability over millennial timescales (Fletcher et al., 2010). Recent modelling results have challenged the interpretation of the glacial being cold and dry, suggesting instead that, while precipitation was lower during the LG, topsoil moisture was actually higher than at present (Scheff et al., 2017). Our new stalagmite data support this interpretation, suggesting that temperature, and not hydroclimate conditions, was the main driver of ecosystem productivity over the deglaciation.
We have combined multi-proxy (δ13C, Ca, and DCF) data from three speleothems and quantitative geochemical modelling to show that the temperature sensitivity of δ13Cspel over the last deglaciation in western Europe is best explained by increasing soil respiration. Generating a large ensemble of forward models of processes in soil, karst, and cave allows the estimation of their likely importance and variability over time. Speleothem geochemical proxies that are sensitive to different components of the soil–karst–cave system can be employed to extract the most likely model solutions from the ensembles, thus quantifying the system's initial conditions, particularly soil gas pCO2. Our approach involved the coupling of soil gas pCO2 and δ13C values, as expected when following a mixing line between a soil respired and an atmospheric end-member, thus allowing us to model changes in soil respiration. While uncertainties remain, in particular with respect to possible changes in the soil respired end-member δ13C value over time, we find that an increase in soil respiration is necessary to explain the large shifts in δ13Cspel over the last deglaciation in the NW Iberian Peninsula. Given the exceptional regional coherency of δ13Cspel records over temperate western Europe, it is likely that this effect is of broader regional significance. Our study is the first to quantitatively model environmental processes in karst systems using a multi-proxy approach and paves the way towards more nuanced interpretations of δ13Cspel records. Moreover, our multi-proxy records support recent climate model results that reject the long-standing “drier and colder glacial” notion in western Europe, pointing instead toward a dominant forcing of temperature, rather than hydroclimate, on ecosystem productivity.
The code used for calculation of the stalagmite dead carbon fraction can be found at (https://github.com/flechleitner/DCF_calculator, last access: 16 September 2021, and https://doi.org/10.5281/zenodo.5503025, Lechleitner, 2021). All data used in the study and codes for the modelling can be found at https://github.com/flechleitner/Spain_analysis, last access: 16 September 2021, and https://doi.org/10.5281/zenodo.5503041 (Lechleitner and Wilhelm, 2021) and in the Supplement provided with the article.
The supplement related to this article is available online at: https://doi.org/10.5194/cp-17-1903-2021-supplement.
FAL, HS, and GMH designed the study and acquired funding for the project. FAL, NH, and CCD performed the geochemical analysis on speleothem samples. OK collected and measured cave air samples from La Vallina Cave and acquired funding for the monitoring work. FAL and MW performed the modelling experiments in CaveCalc and wrote the R code for the data–model evaluation. FAL wrote the paper and generated the figures. HMS and CCD provided additional input to the text. All authors provided feedback on the paper and approved it before submission.
The authors declare that they have no conflict of interest.
Publisher's note: Copernicus Publications remains neutral with regard to jurisdictional claims in published maps and institutional affiliations.
This study was funded by the Swiss National Science Foundation (SNSF) grant P400P2_180789 awarded to Franziska A. Lechleitner, by ETH core funding to Heather M. Stoll, and by doctoral Fellowship ETH-13 18-1 to Oliver Kost. We thank Yu-Te (Alan) Hsieh for assistance with the Ca measurements at the University of Oxford, Madalina Jaggi at ETH Zurich for measurements of δ13C and trace elements, and Saul Gonzalez-Lemos for cave air sampling. We thank two anonymous reviewers and handling editor Marie-France Loutre for their fair and competent assessment of our paper.
This research has been supported by the Schweizerischer Nationalfonds zur Förderung der Wissenschaftlichen Forschung (grant no. P400P2_180789), by ETH core, and from ETH doctoral fellowship ETH-13 18-1.
This paper was edited by Marie-France Loutre and reviewed by two anonymous referees.
AEMET: State Meteorological Agency (AEMET) [WWW Document], available at: http://www.aemet.es/en/portada (last access: 13 September 2021), 2020.
Amundson, R., Stern, L., Baisden, T., and Wang, Y.: The isotopic composition of soil and soil-respired CO2, Geoderma, 82, 83–114, 1998.
Baldini, L. M., McDermott, F., Baldini, J. U. L., Arias, P., Cueto, M., Fairchild, I. J., Hoffmann, D. L., Mattey, D. P., Müller, W., Constantin, D., Ontañón, R., Garciá-Moncó, C., and Richards, D. A.: Regional temperature, atmospheric circulation, and sea-ice variability within the Younger Dryas Event constrained using a speleothem from northern Iberia, Earth Planet. Sc. Lett. 419, 101–110, https://doi.org/10.1016/j.epsl.2015.03.015, 2015.
Bereiter, B., Eggleston, S., Schmitt, J., Nehrbass-Ahles, C., Stocker, T. F., Fischer, H., Kipfstuhl, S., and Chappellaz, J.: Revision of the EPICA Dome C CO2 record from 800 to 600 kyr before present, Geophys. Res. Lett., 42, 542–549, https://doi.org/10.1002/2014GL061957, 2015.
Bond-Lamberty, B. and Thomson, A.: A global database of soil respiration data, Biogeosciences, 7, 1915–1926, https://doi.org/10.5194/bg-7-1915-2010, 2010.
Borsato, A., Frisia, S., and Miorandi, R.: Carbon dioxide concentration in temperate climate caves and parent soils over an altitudinal gradient and its influence on speleothem growth and fabrics, Earth Surf. Proc. Land., 40, 1158–1170, https://doi.org/10.1002/esp.3706, 2015.
Boström, B., Comstedt, D., and Ekblad, A.: Isotope fractionation and 13C enrichment in soil profiles during the decomposition of soil organic matter, Oecologia, 153, 89–98, https://doi.org/10.1007/s00442-007-0700-8, 2007.
Bova, S., Rosenthal, Y., Liu, Z., Godad, S. P., and Yan, M.: Seasonal origin of the thermal maxima at the Holocene and the last interglacial, Nature, 589, 548–553, https://doi.org/10.1038/s41586-020-03155-x, 2021.
Braun, K., Bar-Matthews, M., Matthews, A., Ayalon, A., Cowling, R. M., Karkanas, P., Fisher, E. C., Dyez, K., Zilberman, T., and Marean, C. W.: Late Pleistocene records of speleothem stable isotopic compositions from Pinnacle Point on the South African south coast, Quaternary Res., 91, 265–288, https://doi.org/10.1017/qua.2018.61, 2019.
Breecker, D. O.: Atmospheric pCO2 control on speleothem stable carbon isotope compositions, Earth Planet. Sc. Lett., 458, 58–68, https://doi.org/10.1016/j.epsl.2016.10.042, 2017.
Breecker, D. O., Payne, A. E., Quade, J., Banner, J. L., Ball, C. E., Meyer, K. W., and Cowan, B. D.: The sources and sinks of CO2 in caves under mixed woodland and grassland vegetation, Geochim. Cosmochim. Ac., 96, 230–246, https://doi.org/10.1016/j.gca.2012.08.023, 2012.
Breitenbach, S. F. M. and Bernasconi, S. M.: Carbon and oxygen isotope analysis of small carbonate samples (20 to 100 ug) with a GasBench II preparation device, Rapid Commun. Mass Spectrom., 25, 1910–1914, https://doi.org/10.1002/rcm.5052, 2011.
Brook, G. A., Folkoff, M. E., and Box, E. O.: A World model of soil carbon dioxide, Earth Surf. Proc. Land., 8, 79–88, 1983.
Buchmann, N., Brooks, J. R., and Ehleringer, J. R.: Predicting daytime carbon isotope ratios of atmospheric CO2 within forest canopies, Funct. Ecol., 16, 49–57, 2002.
Cerling, T. E., Solomon, D. K., Quade, J., and Bowman, J. R.: On the isotopic composition of carbon in soil carbon dioxide, Geochim. Cosmochim. Ac., 55, 3403–3405, https://doi.org/10.1016/0016-7037(91)90498-T, 1991.
Clark, P. U., Shakun, J. D., Baker, P. A., Bartlein, P. J., Brewer, S., Brook, E., Carlson, A. E., Cheng, H., Kaufman, D. S., Liu, Z., Marchitto, T. M., Mix, A. C., Morrill, C., Otto-Bliesner, B. L., Pahnke, K., Russell, J. M., Whitlock, C., Adkins, J. F., Blois, J. L., Clark, J., Colman, S. M., Curry, W. B., Flower, B. P., He, F., Johnson, T. C., Lynch-Stieglitz, J., Markgraf, V., McManus, J., Mitrovica, J. X., Moreno, P. I., and Williams, J. W.: Global climate evolution during the last deglaciation, P. Natl. Acad. Sci. USA, 109, 1134–1142, https://doi.org/10.1073/pnas.1116619109, 2012.
Comas-Bru, L., Atsawawaranunt, K., Harrison, S., and SISAL (Speleothem Isotopes Synthesis and AnaLysis) Working Group Members: SISAL (Speleothem Isotopes Synthesis and AnaLysis Working Group) database version 2.0, University of Reading Research Data Archive [data set], https://doi.org/10.17864/1947.242, 2020a.
Comas-Bru, L., Rehfeld, K., Roesch, C., Amirnezhad-Mozhdehi, S., Harrison, S. P., Atsawawaranunt, K., Ahmad, S. M., Brahim, Y. A., Baker, A., Bosomworth, M., Breitenbach, S. F. M., Burstyn, Y., Columbu, A., Deininger, M., Demény, A., Dixon, B., Fohlmeister, J., Hatvani, I. G., Hu, J., Kaushal, N., Kern, Z., Labuhn, I., Lechleitner, F. A., Lorrey, A., Martrat, B., Novello, V. F., Oster, J., Pérez-Mejías, C., Scholz, D., Scroxton, N., Sinha, N., Ward, B. M., Warken, S., Zhang, H., and SISAL Working Group members: SISALv2: a comprehensive speleothem isotope database with multiple age–depth models, Earth Syst. Sci. Data, 12, 2579–2606, https://doi.org/10.5194/essd-12-2579-2020, 2020b.
Darfeuil, S., Ménot, G., Giraud, X., Rostek, F., Tachikawa, K., Garcia, M., and Bard, É.: Sea surface temperature reconstructions over the last 70 kyr off Portugal: Biomarker data and regional modeling, Paleoceanography, 31, 40–65, https://doi.org/10.1002/2015PA002831, 2016.
Day, C. C., Pogge von Strandmann, P. A. E., and Mason, A. J.: Lithium isotopes and partition coefficients in inorganic carbonates: Proxy calibration for weathering reconstruction, Geochim. Cosmochim. Ac., 305, 243–262, https://doi.org/10.1016/j.gca.2021.02.037, 2021.
Denniston, R. F., Houts, A. N., Asmerom, Y., Wanamaker Jr., A. D., Haws, J. A., Polyak, V. J., Thatcher, D. L., Altan-Ochir, S., Borowske, A. C., Breitenbach, S. F. M., Ummenhofer, C. C., Regala, F. T., Benedetti, M. M., and Bicho, N. F.: A stalagmite test of North Atlantic SST and Iberian hydroclimate linkages over the last two glacial cycles, Clim. Past, 14, 1893–1913, https://doi.org/10.5194/cp-14-1893-2018, 2018.
Fahrni, S. M., Wacker, L., Synal, H.-A., and Szidat, S.: Improving a gas ion source for 14C AMS, Nucl. Instrum. Meth. B, 294, 320–327, https://doi.org/10.1016/j.nimb.2012.03.037, 2013.
Fletcher, W. J., Sanchez Goñi, M. F., Allen, J. R. M., Cheddadi, R., Combourieu-Nebout, N., Huntley, B., Lawson, I., Londeix, L., Magri, D., Margari, V., Müller, U. C., Naughton, F., Novenko, E., Roucoux, K., and Tzedakis, P. C.: Millennial-scale variability during the last glacial in vegetation records from Europe, Quaternary Sci. Rev., 29, 2839–2864, https://doi.org/10.1016/j.quascirev.2009.11.015, 2010.
Fohlmeister, J., Voarintsoa, N. R. G., Lechleitner, F. A., Boyd, M., Brandtstätter, S., Jacobson, M. J., and Oster, J. L.: Main controls on the stable carbon isotope composition of speleothems, Geochim. Cosmochim. Ac., 279, 67–87, https://doi.org/10.1016/j.gca.2020.03.042, 2020.
Fung, I., Field, C. B., Berry, J. A., Thompson, M. V., Randerson, J. T., Malmström, C. M., Vitousek, P. M., James Collatz, G., Sellers, P. J., Randall, D. A., Denning, A. S., Badeck, F., and John, J.: Carbon 13 exchanges between the atmosphere and biosphere, Global Biogeochem. Cy., 11, 507–533, 1997.
Genty, D., Baker, A., Massault, M., Proctor, C., Gilmour, M., Pons-Branchu, E., and Hamelin, B.: Dead carbon in stalagmites: carbonate bedrock paleodissolution vs. ageing of soil organic matter, Implications for 13C variations in speleothems, Geochim. Cosmochim. Ac., 65, 3443–3457, https://doi.org/10.1016/S0016-7037(01)00697-4, 2001.
Genty, D., Blamart, D., Ouahdi, R., Gilmour, M., Baker, A., Jouzel, J., and Van-Exter, S.: Precise dating of Dansgaard-Oeschger climate oscillations in western Europe from stalagmite data, Nature, 421, 833–837, https://doi.org/10.1038/nature01391, 2003.
Genty, D., Blamart, D., Ghaleb, B., Plagnes, V., Causse, C., Bakalowicz, M., Zouari, K., Chkir, N., Hellstrom, J., Wainer, K., and Bourges, F.: Timing and dynamics of the last deglaciation from European and North African δ13C stalagmite profiles – Comparison with Chinese and South Hemisphere stalagmites, Quaternary Sci. Rev., 25, 2118–2142, https://doi.org/10.1016/j.quascirev.2006.01.030, 2006.
Gleixner, G., Danier, H.-J., Werner, R. A., and Schmidt, H.-L.: Correlations between the 13C content of primary and secondary plant products in different cell compartments and that in decomposing basidiomycetes, Plant Physiol., 102, 1287–1290, 1993.
Goffin, S., Aubinet, M., Maier, M., Plain, C., Schack-Kirchner, H., and Longdoz, B.: Characterization of the soil CO2 production and its carbon isotope composition in forest soil layers using the flux-gradient approach, Agr. Forest Meteorol., 188, 45–57, https://doi.org/10.1016/j.agrformet.2013.11.005, 2014.
Hendy, C. H.: The isotopic geochemistry of speleothems—I. The calculation of the effects of different modes of formation on the isotopic composition of speleothems and their applicability as palaeoclimatic indicators, Geochim. Cosmochim. Ac., 35, 801–824, https://doi.org/10.1016/0016-7037(71)90127-X, 1971.
Heuser, A. and Eisenhauer, A.: The calcium isotope composition (Ca) of NIST SRM 915b and NIST SRM 1486, Geostand. Geoanal. Res., 32, 27–32, 2008.
Hippler, D., Schmitt, A.-D., Gussone, N., Heuser, A., Stille, P., Eisenhauer, A., and Nägler, T. F.: Calcium isotopic composition of various reference materials and seawater, Geostand. Newslett., 27, 13–19, 2003.
Janssens, I. A. and Pilegaard, K.: Large seasonal changes in Q10 of soil respiration in a beech, Glob. Change Biol., 9, 911–918, 2003.
Lambeck, K., Rouby, H., Purcell, A., Sun, Y., and Sambridge, M.: Sea level and global ice volumes from the Last Glacial Maximum to the Holocene, P. Natl. Acad. Sci. USA, 111, 15296–15303, https://doi.org/10.1073/pnas.1411762111, 2014.
Lechleitner, F: flechleitner/DCF_calculator: (v1.0), Zenodo [code], https://doi.org/10.5281/zenodo.5503025, 2021.
Lechleitner, F. and Wilhelm, M.: flechleitner/Spain_analysis: (v1.0), Zenodo [data set], https://doi.org/10.5281/zenodo.5503041, 2021.
Li, C., Peng, Y., Nie, X., Yang, Y., Yang, L., Li, F., Fang, K., Xiao, Y., and Zhou, G.: Differential responses of heterotrophic and autotrophic respiration to nitrogen addition and precipitation changes in a Tibetan alpine steppe, Sci. Rep., 8, 16546, https://doi.org/10.1038/s41598-018-34969-5, 2018.
Maier, M., Schack-Kirchner, H., Hildebrand, E. E., and Holst, J.: Pore-space CO2 dynamics in a deep, well-aerated soil, Eur. J. Soil Sci., 61, 877–887, https://doi.org/10.1111/j.1365-2389.2010.01287.x, 2010.
Mattey, D. P., Atkinson, T. C., Barker, J. A., Fisher, R., Latin, J.-P., Durell, R., and Ainsworth, M.: Carbon dioxide, ground air and carbon cycling in Gibraltar karst, Geochim. Cosmochim. Ac., 184, 88–113, https://doi.org/10.1016/j.gca.2016.01.041, 2016.
Moreno, A., Stoll, H., Jiménez-Sánchez, M., Cacho, I., Valero-Garcés, B., Ito, E., and Edwards, R. L.: A speleothem record of glacial (25–11.6 kyr BP) rapid climatic changes from northern Iberian Peninsula, Global Planet. Change, 71, 218–231, https://doi.org/10.1016/j.gloplacha.2009.10.002, 2010.
Moreno, A., Lopez-Merino, L., Leira, M., Marco-Barba, J., Gonzalez-Sampériz, P., Valero-Garcés, B.L., Lopez-Saez, J.A., Santos, L., Mata, P., and Ito, E.: Revealing the last 13,500 years of environmental history from the multiproxy record of a mountain lake (Lago Enol, northern Iberian Peninsula), J. Paleolimnol., 46, 327–349, https://doi.org/10.1007/s10933-009-9387-7, 2011.
Moreno, A., Svensson, A., Brooks, S. J., Connor, S., Engels, S., Fletcher, W., Genty, D., Heiri, O., Labuhn, I., Pers, A., Peyron, O., Sadori, L., Valero-Garcés, B., Wulf, S., Zanchetta, G., and data contributors: A compilation of Western European terrestrial records 60 – 8 ka BP: towards an understanding of latitudinal climatic gradients, Quaternary Sci. Rev., 106, 167–185, https://doi.org/10.1016/j.quascirev.2014.06.030, 2014.
Owen, R. A., Day, C. C., Hu, C., Liu, Y., Pointing, M. D., Blättler, C. L., and Henderson, G. M.: Calcium isotopes in caves as a proxy for aridity: Modern calibration and application to the 8.2 kyr event, Earth Planet. Sc. Lett., 443, 129–138, https://doi.org/10.1016/j.epsl.2016.03.027, 2016.
Owen, R. A., Day, C. C., and Henderson, G. M.: CaveCalc: A new model for speleothem chemistry & isotopes, Comput. Geosci., 119, 115–122, https://doi.org/10.1016/J.CAGEO.2018.06.011, 2018.
Pataki, D. E., Ehleringer, J. R., Flanagan, L. B., Yakir, D., Bowling, D. R., Still, C. J., Buchmann, N., Kaplan, J. O., and Berry, J. A.: The application and interpretation of Keeling plots in terrestrial carbon cycle research, Global Biogeochem. Cy., 17, 1022, https://doi.org/10.1029/2001GB001850, 2003.
Peinado Lorca, M. and Martínez-Parras, J. M.: Castilla-La Mancha, in: La Vegetación de España, Alcala de Henares, Universidad de Alcala de Henares, 163–196, 1987.
Rasmussen, S. O., Bigler, M., Blockley, S. P., Blunier, T., Buchardt, S. L., Clausen, H. B., Cvijanovic, I., Dahl-Jensen, D., Johnsen, S. J., Fischer, H., Gkinis, V., Guillevic, M., Hoek, W. Z., Lowe, J. J., Pedro, J. B., Popp, T., Seierstad, I. K., Steffensen, J. P., Svensson, A. M., Vallelonga, P., Vinther, B. M., Walker, M. J. C., Wheatley, J. J., and Winstrup, M.: A stratigraphic framework for abrupt climatic changes during the Last Glacial period based on three synchronized Greenland ice-core records: Refining and extending the INTIMATE event stratigraphy, Quaternary Sci. Rev., 106, 14–28, https://doi.org/10.1016/j.quascirev.2014.09.007, 2014.
Rehfeld, K. and Kurths, J.: Similarity estimators for irregular and age-uncertain time series, Clim. Past, 10, 107–122, https://doi.org/10.5194/cp-10-107-2014, 2014.
Reimer, P.: Selection and Treatment of Data for Radiocarbon Calibration: An Update to the International Calibration (IntCal) Criteria, Radiocarbon, 55, 1923–1945, https://doi.org/10.2458/azu_js_rc.55.16955, 2013.
Reimer, P., Bard, E., Bayliss, A., Beck, J. W., Blackwell, P. G., Bronk Ramsey, C., Buck, C., Cheng, H., Edwards, R. L., Friedrich, M., Grootes, P. M., Guilderson, T. P., Haflidason, H., Hajdas, I., Hatté, C., Heaton, T. J., Hoffmann, D. L., Hogg, A. G., Hughen, K. A., Kaiser, K. F., Kromer, B., Manning, S. W., Niu, M., Reimer, R. W., Richards, D. A., Scott, E. M., Southon, J. R., Staff, R. A., Turney, C. S. M., and van der Plicht, J.: IntCal13 and Marine13 Radiocarbon Age Calibration Curves 0–50,000 Years cal BP, Radiocarbon, 55, 1869–1887, https://doi.org/10.2458/azu_js_rc.55.16947, 2013.
Reynard, L. M., Day, C. C., and Henderson, G. M.: Large fractionation of calcium isotopes during cave-analogue calcium carbonate growth, Geochim. Cosmochim. Ac., 75, 3726–3740, https://doi.org/10.1016/j.gca.2011.04.010, 2011.
Romanek, C. S., Grossman, E. L., and Morse, J. W.: Carbon isotopic fractionation in synthetic aragonite and calcite: effects of temperature and precipitation rate, Geochim. Cosmochim. Ac., 56, 419–430, 1992.
Rossi, C., Bajo, P., Lozano, R. P., and Hellstrom, J.: Younger Dryas to Early Holocene paleoclimate in Cantabria (N Spain): Constraints from speleothem Mg, annual fluorescence banding and stable isotope records, Quaternary Sci. Rev., 192, 71–85, https://doi.org/10.1016/j.quascirev.2018.05.025, 2018.
Rudzka, D., McDermott, F., Baldini, L. M., Fleitmann, D., Moreno, A., and Stoll, H.: The coupled δ13C-radiocarbon systematics of three Late Glacial/early Holocene speleothems; insights into soil and cave processes at climatic transitions, Geochim. Cosmochim. Ac., 75, 4321–4339, https://doi.org/10.1016/j.gca.2011.05.022, 2011.
Scheff, J., Seager, R., Liu, H., and Coats, S.: Are Glacials Dry? Consequences for Paleoclimatology and for Greenhouse Warming, J. Climate, 30, 6593–6609, https://doi.org/10.1175/JCLI-D-16-0854.1, 2017.
Schmitt, J., Schneider, R., Elsig, J., Leuenberger, D., Lourantou, A., Chappellaz, J., Köhler, P., Joos, F., Stocker, T. F., Leuenberger, M., and Fischer, H.: Carbon isotope constraints on the deglacial CO2 rise from ice cores, Science, 336, 711–715, 2012.
Schubert, B. A. and Jahren, A. H.: Global increase in plant carbon isotope fractionation following the last glacial maximum caused by increase in atmospheric pCO2, Geology, 43, 435–438, https://doi.org/10.1130/G36467.1, 2015.
Slessarev, E. W., Lin, Y., Bingham, N. L., Johnson, J. E., Dai, Y., Schimel, J. P., and Chadwick, O. A.: Water balance creates a threshold in soil pH at the global scale, Nature, 540, 567–569, https://doi.org/10.1038/nature20139, 2016.
Stoll, H., Mendez-Vicente, A., Gonzalez-Lemos, S., Moreno, A., Cacho, I., Cheng, H., and Edwards, R. L.: Interpretation of orbital scale variability in mid-latitude speleothem d18O: Significance of growth rate controlled kinetic fractionation effects, Quaternary Sci. Rev., 127, 215–228, https://doi.org/10.1016/j.quascirev.2015.08.025, 2015.
Stoll, H. M., Müller, W., and Prieto, M.: I-STAL, a model for interpretation of , Sr/Ca and Ba/Ca variations in speleothems and its forward and inverse application on seasonal to millennial scales, Geochem. Geophy. Geosy., 13, 1–27, https://doi.org/10.1029/2012GC004183, 2012.
Stoll, H. M., Moreno, A., Mendez-Vicente, A., Gonzalez-Lemos, S., Jimenez-Sanchez, M., Dominguez-Cuesta, M. J., Edwards, R. L., Cheng, H., and Wang, X.: Paleoclimate and growth rates of speleothems in the northwestern Iberian Peninsula over the last two glacial cycles, Quaternary Res., 80, 284–290, https://doi.org/10.1016/j.yqres.2013.05.002, 2013.
Stoll, H. M., Cacho, I., Gasson, E., Sliwinski, J., Kost, O., Moreno, A., Iglesias, M., Torner, J., Perez, C., Haghipour, N., Cheng, H., Lawrence Edwards, R.: Rapid melting of a large Eurasian Ice Sheet during the penultimate deglaciation, Nat. Geosci., in review, 2021.
Synal, H. A., Stocker, M., and Suter, M.: MICADAS: A new compact radiocarbon AMS system, Nucl. Instrum. Meth. B, 259, 7–13, https://doi.org/10.1016/j.nimb.2007.01.138, 2007.
Tierney, J. E. and Tingley, M. P.: A TEX86 surface sediment database and extended Bayesian calibration, Sci. Data, 2, 150029, https://doi.org/10.1038/sdata.2015.29, 2015.
Tierney, J. E., Zhu, J., King, J., Malevich, S. B., Hakim, G. J., and Poulsen, C. J.: Glacial cooling and climate sensitivity revisited, Nature, 584, 569–573, https://doi.org/10.1038/s41586-020-2617-x, 2020.
Vargas, R. and Allen, M. F.: Environmental controls and the influence of vegetation type, fine roots and rhizomorphs on diel and seasonal variation in soil respiration, New Phytol., 179, 460–471, 2008.
Vaughn, L. J. S. and Torn, M. S.: 14C evidence that millennial and fast-cycling soil carbon are equally sensitive to warming, Nat. Clim. Chang., 9, 467–471, https://doi.org/10.1038/s41558-019-0468-y, 2019.
Verheyden, S., Keppens, E., Quinif, Y., Cheng, H., and Edwards, L. R.: Late-glacial and Holocene climate reconstruction as inferred from a stalagmite – Grotte du Pere Noel, Han-sur-Lesse, Belgium, Geol. Belgica, 17, 83–89, 2014.
Wainer, K., Genty, D., Blamart, D., Daëron, M., Bar-Matthews, M., Vonhof, H., Dublyansky, Y., Pons-Branchu, E., Thomas, L., van Calsteren, P., Quinif, Y., and Caillon, N.: Speleothem record of the last 180 ka in Villars cave (SW France): Investigation of a large δ18O shift between MIS6 and MIS5, Quaternary Sci. Rev., 30, 130–146, https://doi.org/10.1016/j.quascirev.2010.07.004, 2011.
Wang, X., Liu, L., Piao, S., Janssens, I. A., Tang, J., Liu, W., Chi, Y., Wang, J., and Xu, S.: Soil respiration under climate warming: differential response of heterotrophic and autotrophic respiration, Glob. Change Biol., 20, 3229–3237, https://doi.org/10.1111/gcb.12620, 2014.
Waring, C. L., Hankin, S. I., Griffith, D. W. T., Kertesz, M. A., Kobylski, V., Wilson, N. L., Coleman, N. V, Kettlewell, G., Zlot, R., Bosse, M., and Bell, G.: Seasonal total methane depletion in limestone caves, Sci. Rep., 7, 8314, https://doi.org/10.1038/s41598-017-07769-6, 2017.
Wolff, E. W., Chappellaz, J., Blunier, T., Rasmussen, S. O., and Svensson, A.: Millennial-scale variability during the last glacial: The ice core record, Quaternary Sci. Rev., 29, 2828–2838, https://doi.org/10.1016/j.quascirev.2009.10.013, 2010.
Zhang, J., Quay, P. D., and Wilbur, D.: Carbon isotope fractionation during gas-water exchange and dissolution of CO2, Geochim. Cosmochim. Ac., 59, 107–114, 1995.
- Article
(3026 KB) - Full-text XML