the Creative Commons Attribution 4.0 License.
the Creative Commons Attribution 4.0 License.
 | 05 Aug 2021
Mid-Holocene monsoons in South and Southeast Asia: dynamically downscaled simulations and the influence of the Green Sahara
Yiling Huo
William Richard Peltier
Deepak Chandan
Proxy records suggest that the Northern Hemisphere during the mid-Holocene (MH), to be assumed herein to correspond to 6000 years ago, was generally warmer than today during summer and colder in the winter due to the enhanced seasonal contrast in the amount of solar radiation reaching the top of the atmosphere. The complex orography of both South and Southeast Asia (SA and SEA), which includes the Himalayas and the Tibetan Plateau (TP) in the north and the Western Ghats mountains along the west coast of India in the south, renders the regional climate complex and the simulation of the intensity and spatial variability of the MH summer monsoon technically challenging. In order to more accurately capture important regional features of the monsoon system in these regions, we have completed a series of regional climate simulations using a coupled modeling system to dynamically downscale MH global simulations. This regional coupled modeling system consists of the University of Toronto version of the Community Climate System Model version 4 (UofT-CCSM4), the Weather Research and Forecasting (WRF) regional climate model, and the 3D Coastal and Regional Ocean Community model (CROCO). In the global model, we have taken care to incorporate Green Sahara (GS) boundary conditions in order to compare with standard MH simulations and to capture interactions between the GS and the monsoon circulations in India and SEA. Comparison of simulated and reconstructed climates suggest that the dynamically downscaled simulations produce significantly more realistic anomalies in the Asian monsoon than the global climate model, although they both continue to underestimate the inferred changes in precipitation based upon reconstructions using climate proxy information. Monsoon precipitation over SA and SEA is also greatly influenced by the inclusion of a GS, with a large increase particularly being predicted over northern SA and SEA, and a lengthening of the monsoon season. Data–model comparisons with downscaled simulations outperform those with the coarser global model, highlighting the crucial role of downscaling in paleo data–model comparison.
- Article
(10616 KB) - Full-text XML
- BibTeX
- EndNote


The climate over both South and Southeast Asia (SA and SEA) is characterized by rainy summers and cold dry winters. During summer, warm and moist air originating from the Indian Ocean is transported northeast towards the Indian subcontinent and the Indochina peninsula where the air mass organizes into the South and Southeast Asian monsoon (SAM and SEAM, respectively) circulations. Apart from the external forcing of the land–sea heating contrast that is essential for initiating SAM and SEAM (Webster et al., 1998), internal feedback processes, which have been recognized as changing over the recent decades (Mishra et al., 2018; Endo et al., 2009), play a crucial role in amplifying their strength. Since monsoon systems are characterized by a strong temporal variability (Ding, 2007; Kutzbach, 1987; Prell and Kutzbach, 1987), the limited modern observational datasets are insufficient to constrain the expected future response of these systems to climate change. Projections of monsoon evolution from climate modeling of future conditions remain highly uncertain (Huang et al., 2020). Therefore, analysis of past changes in monsoon circulation systems under significantly different forcing conditions for both SAM and SEAM is potentially of great value in contributing to the understanding of these monsoons and their expected future changes.
The mid-Holocene (MH; 6 ka) is characteristic of a typical interglacial period during which the insolation distribution was significantly different from that of the present day (Fig. 1). During the MH, differences in the Earth's orbital configuration compared to the present day altered Northern Hemisphere insolation, which in the latitudinal range of these monsoons induces a top-of-the-atmosphere insolation increase of ∼20 W m−2 in summer (Fig. 1; Laskar et al., 2004; Berger, 1978). Significant changes in the strength of the Asian monsoon during the MH have been revealed by various paleoclimatic reconstructions, such as those based on paleoceanographic evidence (Hutson and Prell, 1980; Prell, 1984a, b; Cullen and Prell, 1984; Prell and Van Campo, 1986), Tibetan ice cores (Thompson et al., 2000), Chinese Loess Plateau deposits (An, 2000; Porter, 2001), and stalagmites (Wang et al., 2001; Dykoski et al., 2005). During this period, the Indian monsoon penetrated deeper into the Indian subcontinent (Wang et al., 2010; Herzschuh, 2006; Kutzbach and Street-Perrott, 1985), although detailed knowledge is still limited by the absence of high-resolution proxy information. Furthermore, owing to a lack of paleoclimate proxies from SEA, little is known about the incursion and variability of the SEAM.
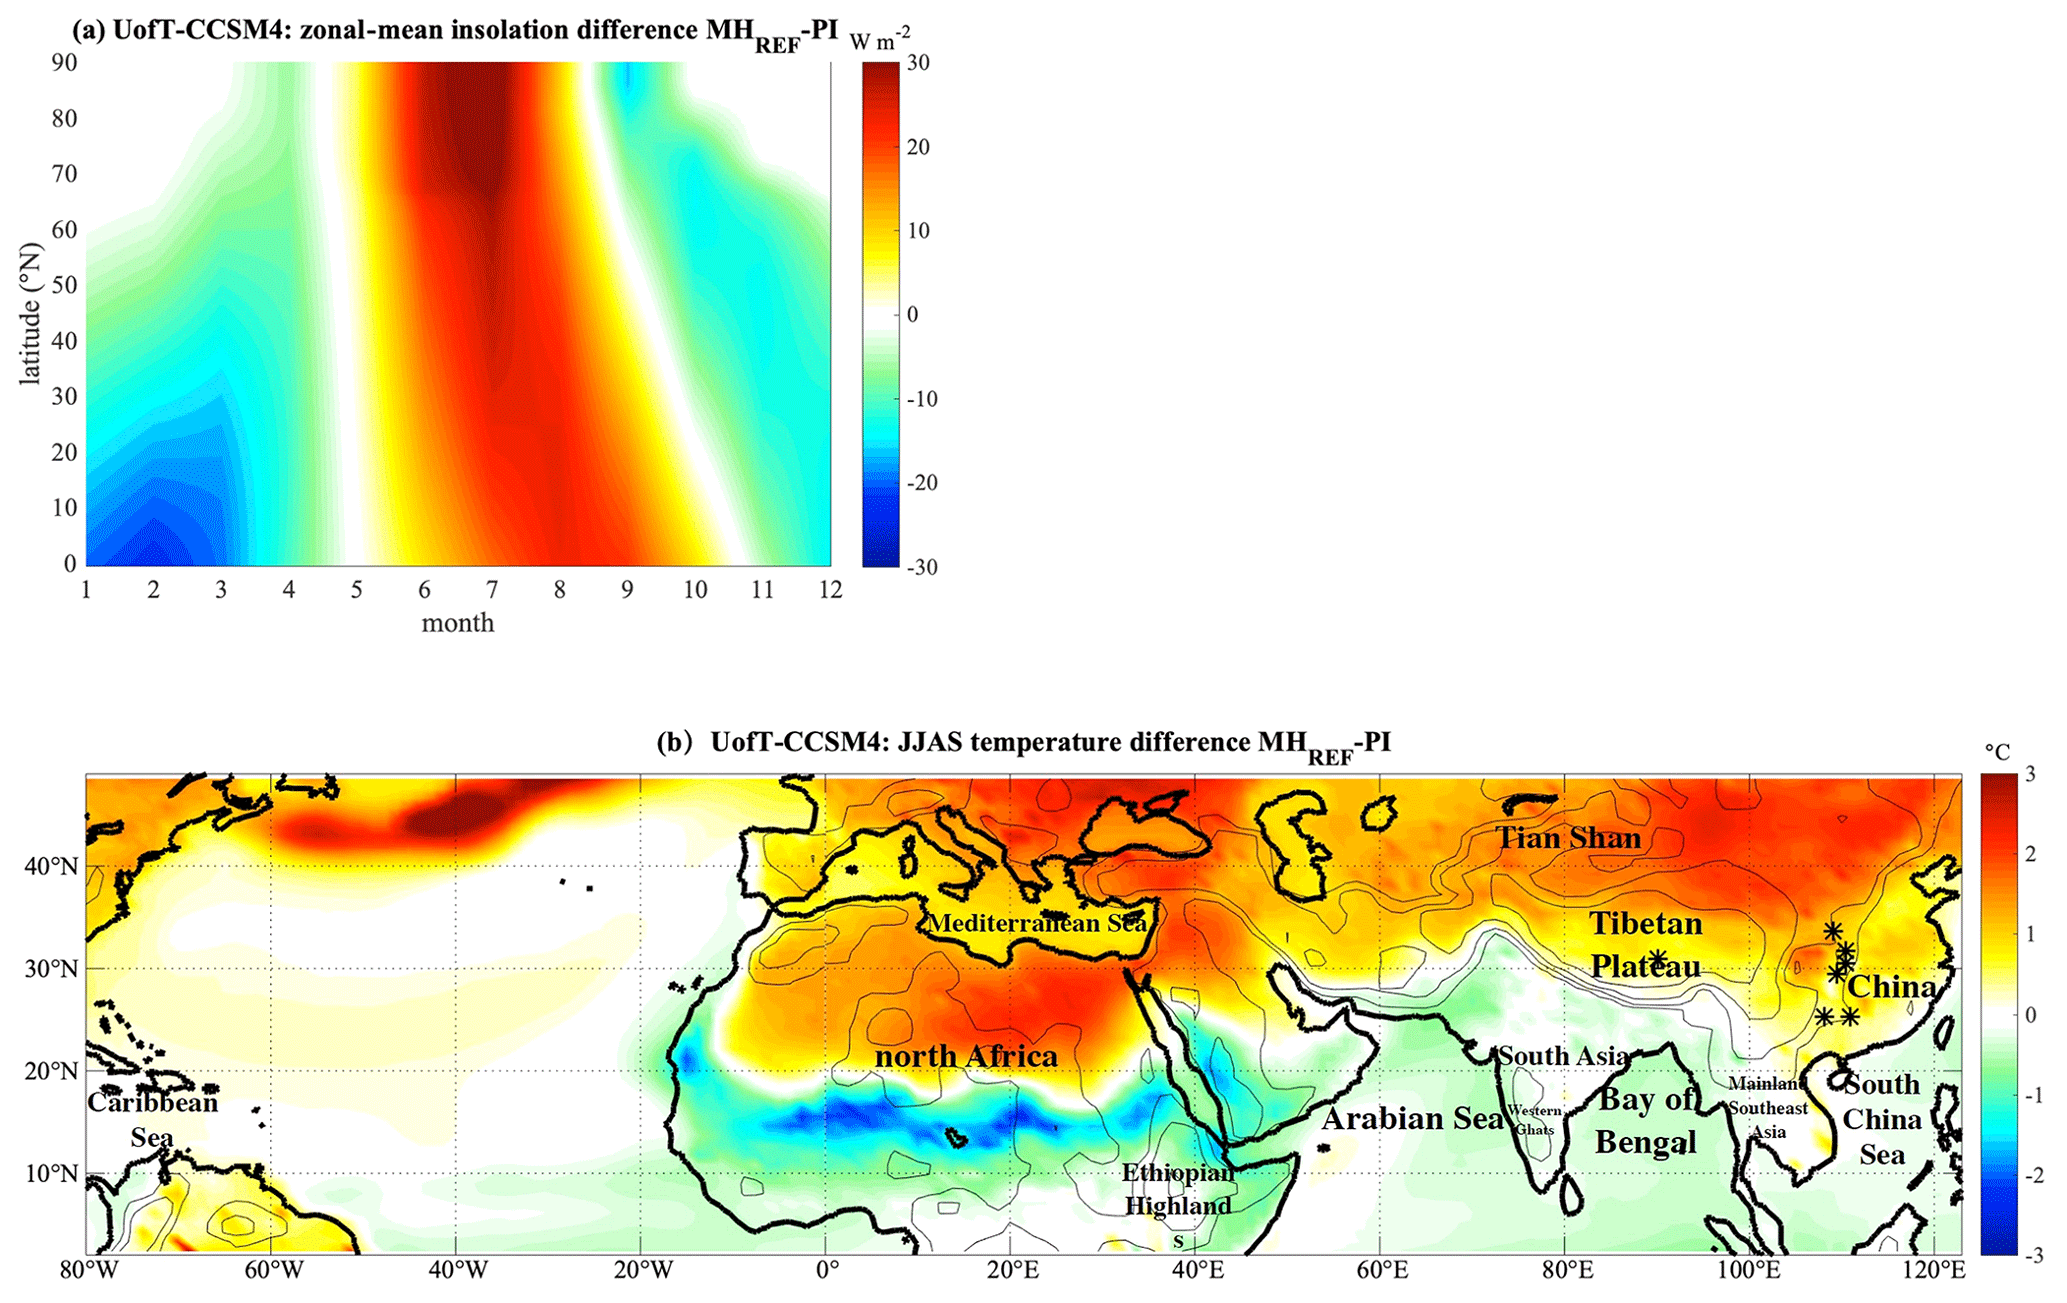
Figure 1(a) Zonal-mean insolation difference per month between MH and PI at the top of the atmosphere (W m−2) for MHREF from the UofT-CCSM4. (b) JJAS temperature difference between MHREF and PI from the UofT-CCSM4 with the names of the geographic regions of interest. The locations of Tianmen (30.9∘ N, 90.1∘ E), Dongge (25.3∘ N, 108.1∘ E), Jiuxian (33.6∘ N, 109.1∘ E), Lianhua (109.5∘ E, 29.5∘ N), Heshang (30.5∘ N, 110.4∘ E), Sanbao (31.7∘ N, 110.4∘ E), and Xiangshui (25.3∘ N, 110.9∘ E) caves are indicated by “*”. The topography contours of 500, 1000, 2000, and 4000 m are also shown.
To better understand orbital-scale monsoon changes, various numerical experiments have been performed, primarily using global climate models (GCMs) to simulate the large-scale atmospheric circulation and the related monsoon circulation (Jalihal et al., 2019; Jiang et al., 2013; Dallmeyer et al., 2013). The earliest modeling studies of the MH monsoons focused only on the direct effect of insolation forcing (Kutzbach and Otto-Bliesner, 1982; Kutzbach and Guetter, 1986; Kutzbach and Gallimore, 1988). These studies generally produced strengthened monsoons and increased precipitation in Asia in response to the increased land–sea surface temperature contrast in summer caused by the enhanced seasonal cycle of MH insolation. Although the early GCM simulations were based on prescribed sea surface temperatures (SSTs) and land vegetation, recent studies have shown that land and ocean feedbacks can enhance the orbitally forced monsoon changes (Zhao and Harrison, 2012; Kutzbach et al., 2001). In addition, the strengths of SAM and SEAM circulations and their onset, maintenance, and withdrawal are greatly influenced by the contiguous Tibetan Plateau (TP; Fig. 1), which serves an elevated heat source for the atmosphere in summer that intensifies the thermal contrast between the continent and ocean in the region influenced by the Asian monsoons (Wu et al., 2007). However, due to the coarse horizontal resolutions of the global models, the TP, as well as the local mountains over SA and SEA, is poorly represented in GCMs. As a result, GCMs are incapable of realistically capturing local-scale atmospheric circulation and precipitation processes, which are strongly influenced by the orography. In order to respond to the need for high-quality climate information on regional scales while maintaining the computational tractability of the problem, this study employs the same dynamical downscaling pipeline described in Huo and Peltier (2021) to dynamically downscale MH global simulations.
During the MH, northern Africa (Fig. 1) was considerably wetter than today and was covered to a great extent by a mixture of shrubland, grassland, trees, and wetlands – a period referred to as the Green Sahara (GS; Claussen et al., 2017; Pausata et al., 2020; Holmes and Hoelzmann, 2017; Chandan and Peltier, 2020) or the African Humid Period. While it is well established that the Sahara existed in a state very different from that of today during the MH (Hély et al., 2014; Harrison and Bartlein, 2012) and had far-reaching local and global climatic influences (Chandan and Peltier, 2020; Pausata et al., 2017a, b), most studies investigating the Asian monsoon variability during the MH have employed the same global vegetation distribution as that characteristic of the preindustrial (PI) period and have been demonstrated to significantly underestimate the strength and extent of the SAM and SEAM (Zhao and Harrison, 2012; Braconnot et al., 2012). Since other key factors, including remote changes in vegetation cover, have been shown to modify the climate response to the insolation forcing (Piao et al., 2020; Sun et al., 2019), we have taken care in the current study to incorporate GS boundary conditions (Chandan and Peltier, 2020) in the analyses to be described herein in order to compare with the standard MH simulations and to capture interactions between the African Humid Period monsoon and that in India and SEA. Our intention is to construct a high-resolution representation of the teleconnection between these two regions. Pausata et al. (2017b) and Sun et al. (2019) pointed out that the presence of GS conditions in northern Africa shifts the Walker circulation westward through changes in equatorial Atlantic SSTs and warms the Indian Ocean, which enhances the SAM and SEAM. Griffiths et al. (2020) have also suggested that the transition out of the African Humid Period led to an amplification of middle to late Holocene megadroughts in mainland Southeast Asia via ocean–atmospheric teleconnections. Moreover, some recent studies have projected future increases in Sahelian precipitation in addition to a surface greening in the Sahel (Giannini and Kaplan, 2019; Evan et al., 2016). Hence, understanding the influence of African vegetation on the SAM and SEAM may also help us better appreciate the changes in the Asian monsoon system to be expected from ongoing climate change associated with human activity.
This paper presents an analysis of the MH monsoon using high-resolution coupled regional climate model (RCM) simulations. The key questions are the following. (1) How does SAM and SEAM precipitation respond to the MH orbital forcing on regional scales? (2) Do simulations produced by the coupled modeling system agree both qualitatively and quantitatively with proxy data during the monsoon season? (3) What are the impacts of the GS boundary conditions on SAM and SEAM? The coupled model system and the simulation configurations are described in Sect. 2. A synthesis of major monsoon changes is provided in Sect. 3, which also includes a discussion of the sensitivity of the SAM and SEAM to MH Sahara vegetation changes. In Sect. 4 we offer a summary of our conclusions.
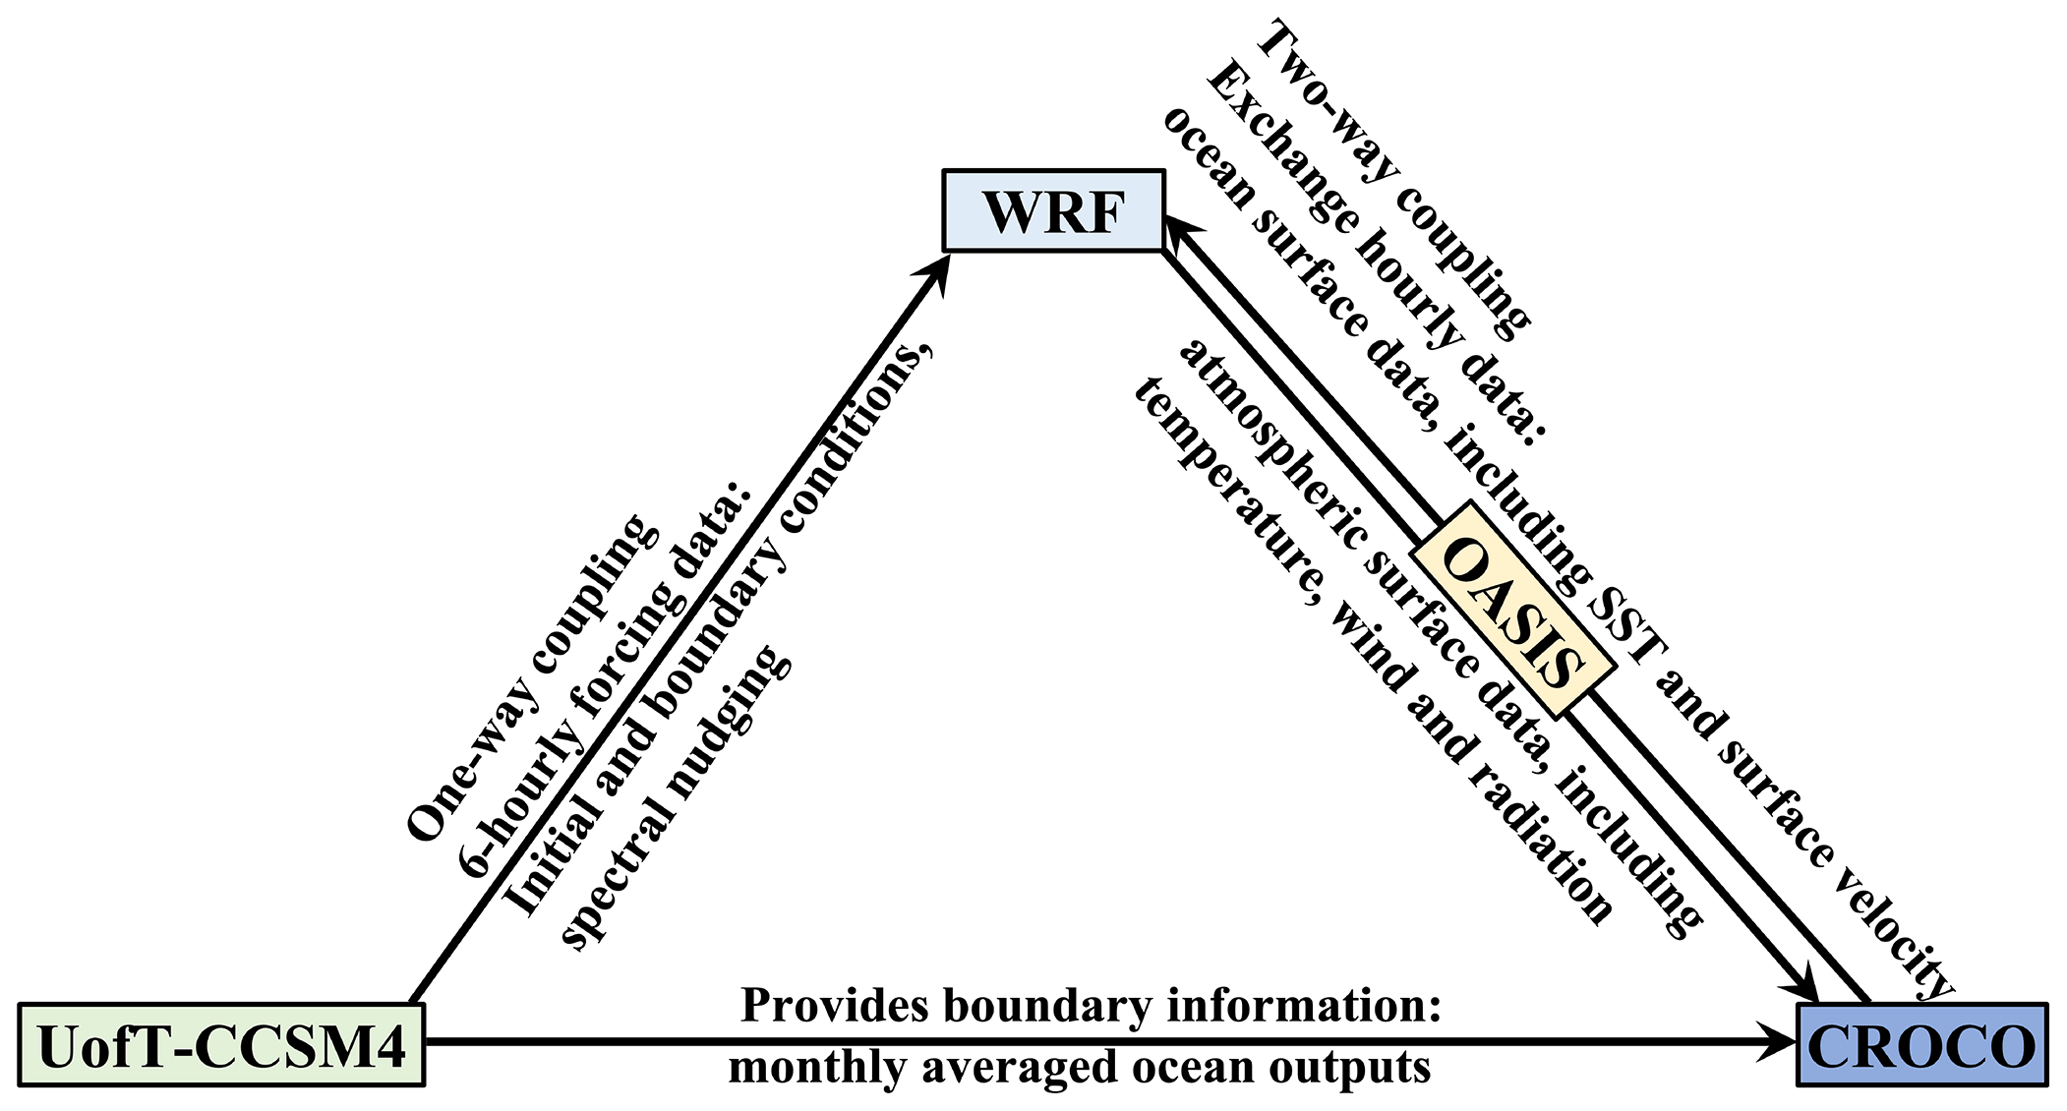
The dynamical downscaling methodology employed for the analyses to follow (Fig. 2) is the same as that in Huo and Peltier (2021), which further developed the dynamical downscaling “pipeline” originally introduced in Gula and Peltier (2012) and then applied in d'Orgeville et al. (2014), Erler and Peltier (2016), and Peltier et al. (2018) for the purpose of investigating the expected precipitation changes over the Great Lakes Basin of North America and over western Canada, upstream and downstream of the Rocky Mountains topographic barrier. In the present version of this pipeline, a regional climate model – the Weather Research and Forecasting (WRF) Model – is coupled to a regional ocean model – the 3D Coastal and Regional Ocean Community model (CROCO) – and both are forced with the output from a GCM – the University of Toronto version of the NCAR Community Climate System Model version 4 (UofT-CCSM4) – at the lateral boundaries (Fig. 2). This pipeline has been applied in the projection of modern global warming impacts for SEAM, and results are verified to be in good agreement with the general monsoon patterns compared to instrumental era observations (Huo and Peltier, 2021). Similar simulations have also been carried out for the Indian monsoon region for present-day and future climate projections by Huo and Peltier (2019, 2020) with a somewhat simplified pipeline that did not include the CROCO regional ocean model and utilized an older version of WRF (V3.9.1).
The regional atmospheric model component of the pipeline is the WRF model version 4.1 (Skamarock and Klemp, 2008), with the same choice of major physics parameterizations as in Huo and Peltier (2021) except for the cloud microphysics parameterization. Unlike Huo and Peltier (2021), who employed two different microphysics schemes, this study uses a single microphysics parameterization scheme (the single-moment six-class scheme; Hong and Lim, 2006) for all experiments because the choice of microphysics scheme was found to have a much smaller impact on the simulated monsoon precipitation compared to the cumulus scheme in the modern-day simulations of both SAM (Huo and Peltier, 2020) and SEAM (Huo and Peltier, 2021). The same four cumulus parameterization schemes as in Huo and Peltier (2021), namely the Tiedtke scheme (Tiedtke, 1989), the Grell–Freitas ensemble scheme (GF; Grell and Freitas, 2014), the Betts–Miller–Janjic scheme (BMJ; Janjic, 1994), and the Kain–Fritsch scheme (KF; Kain, 2004), are employed in this study in order to construct a mini-physics ensemble for the SAM and the SEAM, which enables us to study the sensitivity of model performance to different cumulus parameterizations and thereby to estimate the uncertainty associated with these parameterizations in the simulated MH climate. In the radiation module of WRF, we have applied trace gases and orbital parameters based on the Paleoclimate Modeling Intercomparison Project Phase 4 (PMIP4; Otto-Bliesner et al., 2017) protocol for the MH simulations. The WRF domain covers most of the Asian landmass (shaded in Fig. 3) at 30 km resolution. Note here that most PMIP4 models have a resolution of approximately 1∘ (Otto-Bliesner et al., 2017), which is close to that of our GCM (the UofT-CCSM4 model) and is considerably coarser than the resolution of our regional model.
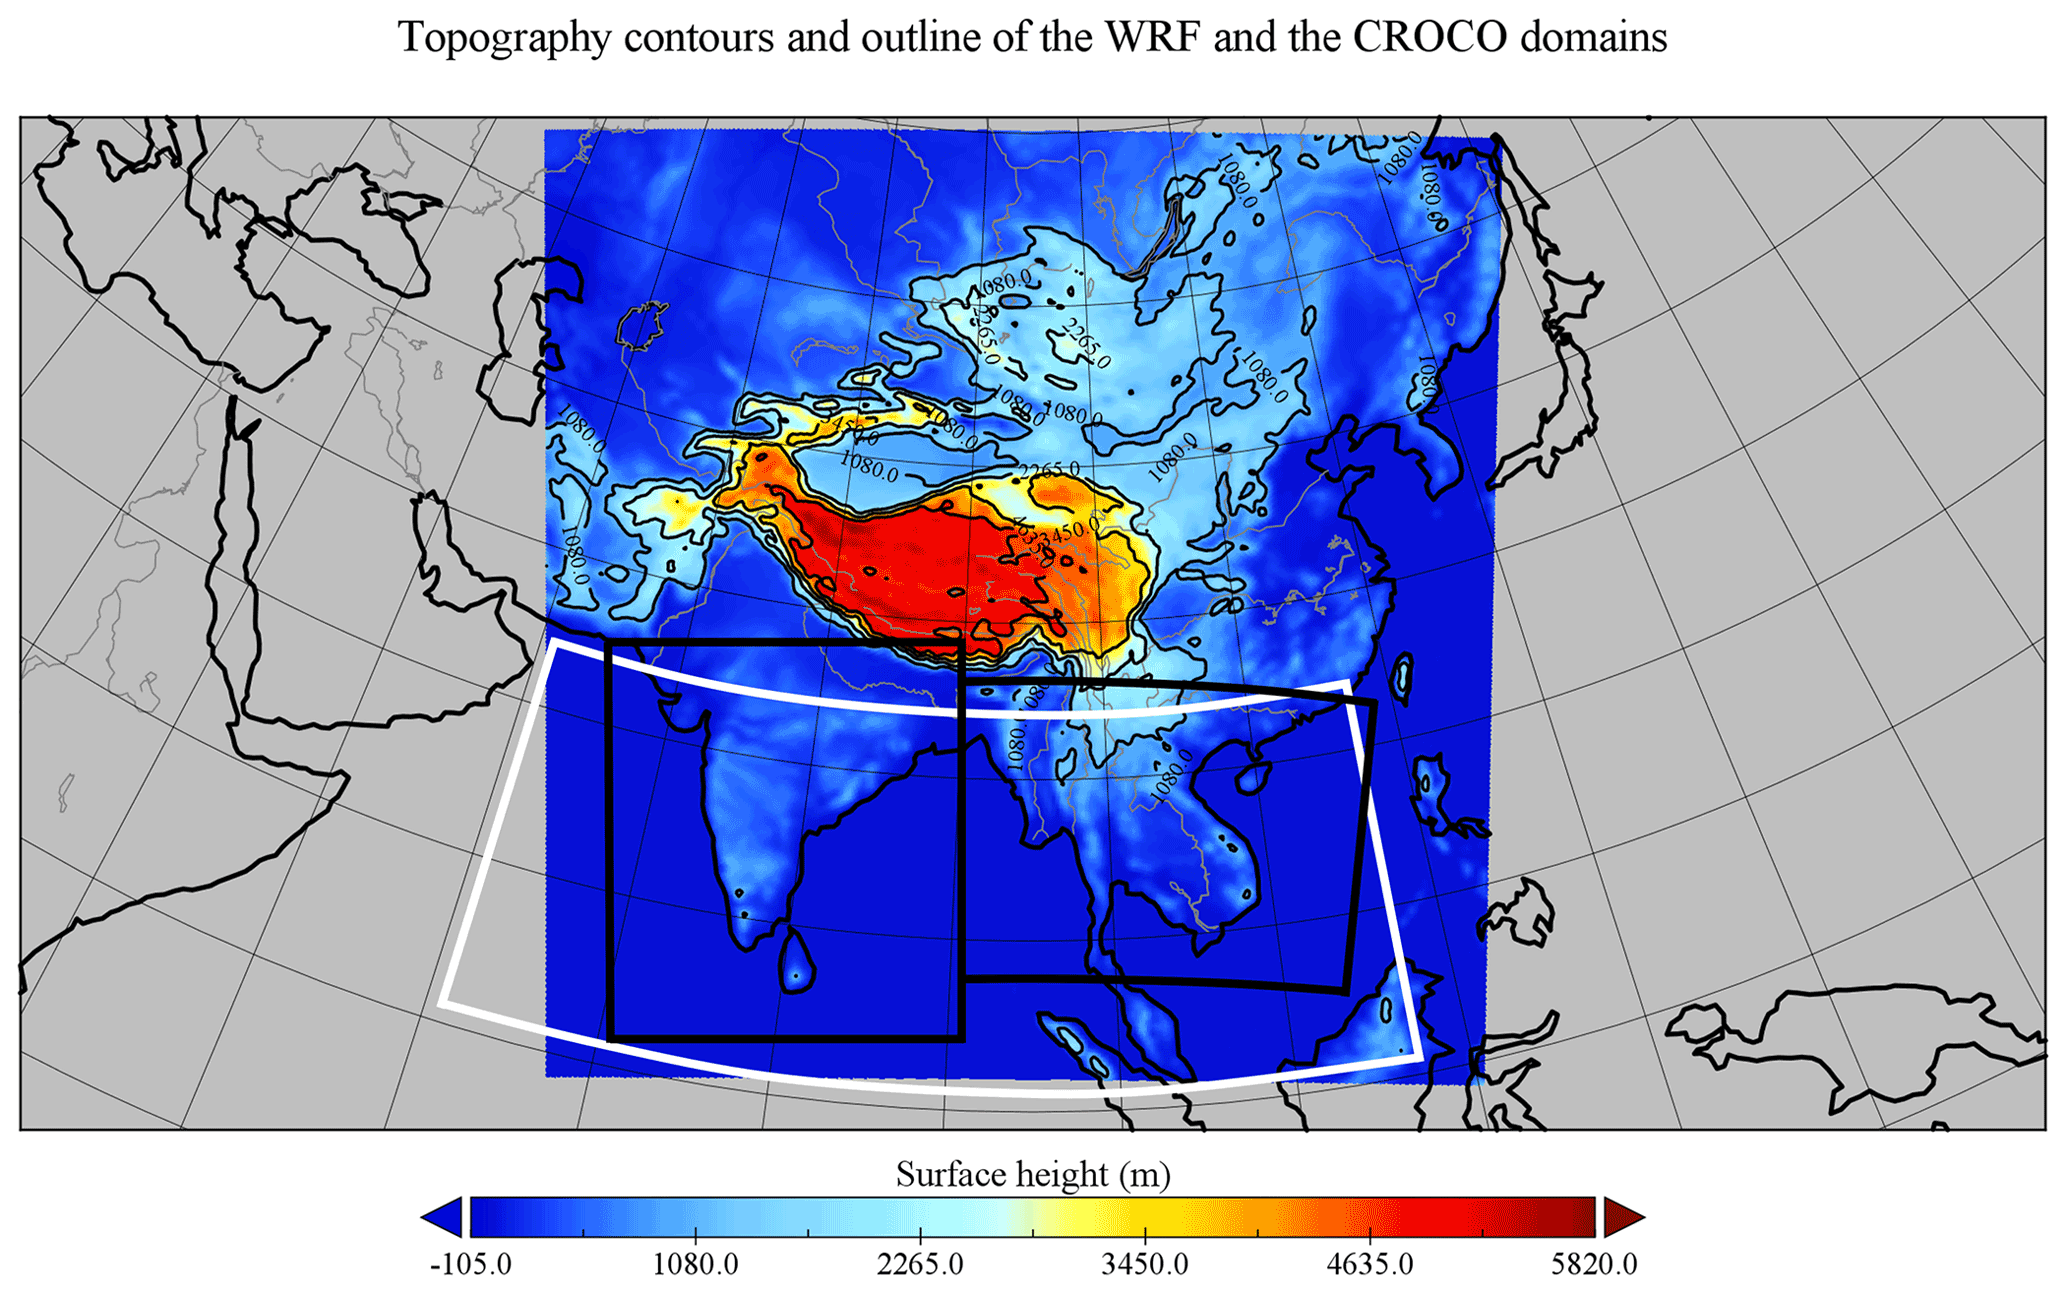
Figure 3Shaded topography along with the outlines of the (shaded region) WRF and (white rectangle) CROCO domains. The two black rectangles denote the regions used to calculate spatial averages over SA and SEA. Major rivers and lakes are shown in grey contours, and selected topographic heights are shown in thin black contours.
The 3D CROCO ocean model has also been coupled to the WRF using the OASIS 3 coupler (Valcke, 2013) through which hourly prognostic fields are exchanged (Fig. 2). This study employs the same ocean domain as in Huo and Peltier (2021), which covers most of the oceanic area in the WRF domain including the Bay of Bengal (BOB), the eastern part of the Arabian Sea, and the western part of the South China Sea (the white rectangular area in Fig. 3). It operates at a horizontal resolution of 0.2∘ (approximately 20 km) with 32 vertical levels.
Both WRF and CROCO are forced at their lateral boundaries by the atmospheric and oceanic fields obtained from simulations with a global model. The global simulations have been generated using a fully coupled atmosphere–ocean–land–sea–ice GCM: the University of Toronto version of the National Center for Atmospheric Research (NCAR) Community Climate System Model version 4 (UofT-CCSM4; Peltier and Vettoretti, 2014; Chandan and Peltier, 2017, 2018, 2020). It is based on the standard CCSM4 model (Gent et al., 2011) with modifications of the ocean component for paleoclimate simulations. The UofT-CCSM4 simulations were produced in its coupled configuration with a horizontal resolution of 1∘. For the analyses reported herein, WRF–CROCO was driven by three distinct GCM simulations, including one for the PI climate and two for the MH climate, the latter being forced by the PMIP4-mandated concentrations of greenhouse gases (GHGs) and orbital parameters (Otto-Bliesner et al., 2017). One of the MH experiments employs a preindustrial land surface and a vegetation prescribed to PI values, and it therefore differs from the PI only with regards to the orbital configuration and trace gas concentrations; the other MH experiment also incorporates GS boundary conditions by including vegetation, soil, and lake modifications over Africa and Arabia. Both of these simulations were recently described in detail in Chandan and Peltier (2020), where they were referred to as MHREF and MHVSL, respectively. Each UofT-CCSM4 experiment was integrated for several hundred years, and the last 15 years of output of each were downscaled using WRF–CROCO for the purpose of the analyses to be reported below. The two sets of MH experiments, both including results for each member of the four-member mini-ensemble, can be compared to investigate the role of the Saharan landscape in altering the SAM and SEAM. We will also compare the simulated changes in precipitation in the two sets of experiments to pollen-based climate reconstructions (Bartlein et al., 2011; Herzschuh et al., 2019) to help us evaluate the degree to which the incorporation of GS boundary conditions will lead to a diminution of the previously obtained misfits of global model-based climate reconstructions of SAM and SEAM rainfall. In the following analysis, the set of MH experiments (both global and regional) including no specific land surface changes over North Africa is referred to as the reference MH simulation and denoted as MHREF, while the other set of MH simulations, which incorporates GS boundary conditions, is referred to as MHGS.
We begin by discussing the sea surface temperature (SST) and surface air temperature anomalies simulated for MHREF before turning our attention to precipitation changes realized in the same simulation. Following this, we discuss the impact of including the full GS boundary conditions on the simulated MH SAM and SEAM. All spatially averaged anomalies reported here are calculated over the land surface of the Indian subcontinent or mainland SEA south of the TP (the two black rectangles in Fig. 3). These two analysis regions are identical to the inner WRF domains in Huo and Peltier (2020, 2021) wherein two levels of downscaling were employed.
3.1 Ocean SST and surface atmospheric temperature changes in MHREF
The establishment of the Asian monsoon circulations is determined by the seasonal cycle of SSTs of the Indian Ocean and the contrast with the surface temperature variation over the landmass to the north and east. Seasonal variations in the strength of the monsoon are therefore closely connected with variations in SSTs (Clark et al., 2000). Figure 4 shows the SST anomalies, with respect to the preindustrial, simulated for MHREF by the GCM and the four WRF–CROCO ensemble members (ensemble mean). In the downscaled MHREF simulation, SSTs in JJAS (June–July–August–September) are 0.5 ∘C colder than in the PI in the northeastern Arabian Sea (Fig. 4b), whereas the global model produces larger negative anomalies (up to −0.8 ∘C) across the eastern Arabian Sea. Regional Mg Ca (Banakar et al., 2010; Govil and Naidu, 2010) and alkenones (Böll et al., 2015) indicate 0 to 1 ∘C cooling in the northern and eastern Arabian Sea during the MH, which is consistent with both global and regional model results. In contrast, the JJAS SST anomalies of up to −1 ∘C that are simulated for the BOB in the downscaled simulations produced with CROCO are larger than those in the global model. This extended cooling all along the eastern coastline of India is likely the result of stronger coastal upwelling driven by the strengthened MH monsoonal winds. CROCO also simulates warm SST anomalies (up to 0.5 ∘C) around the southern tip of India, whereas UofT-CCSM4 simulates cold SST anomalies over the entire ocean domain. Proxy records also suggest slight warming off the coast of southern India (Saraswat et al., 2013; Gaye et al., 2018), which is more consistent with the results of CROCO.
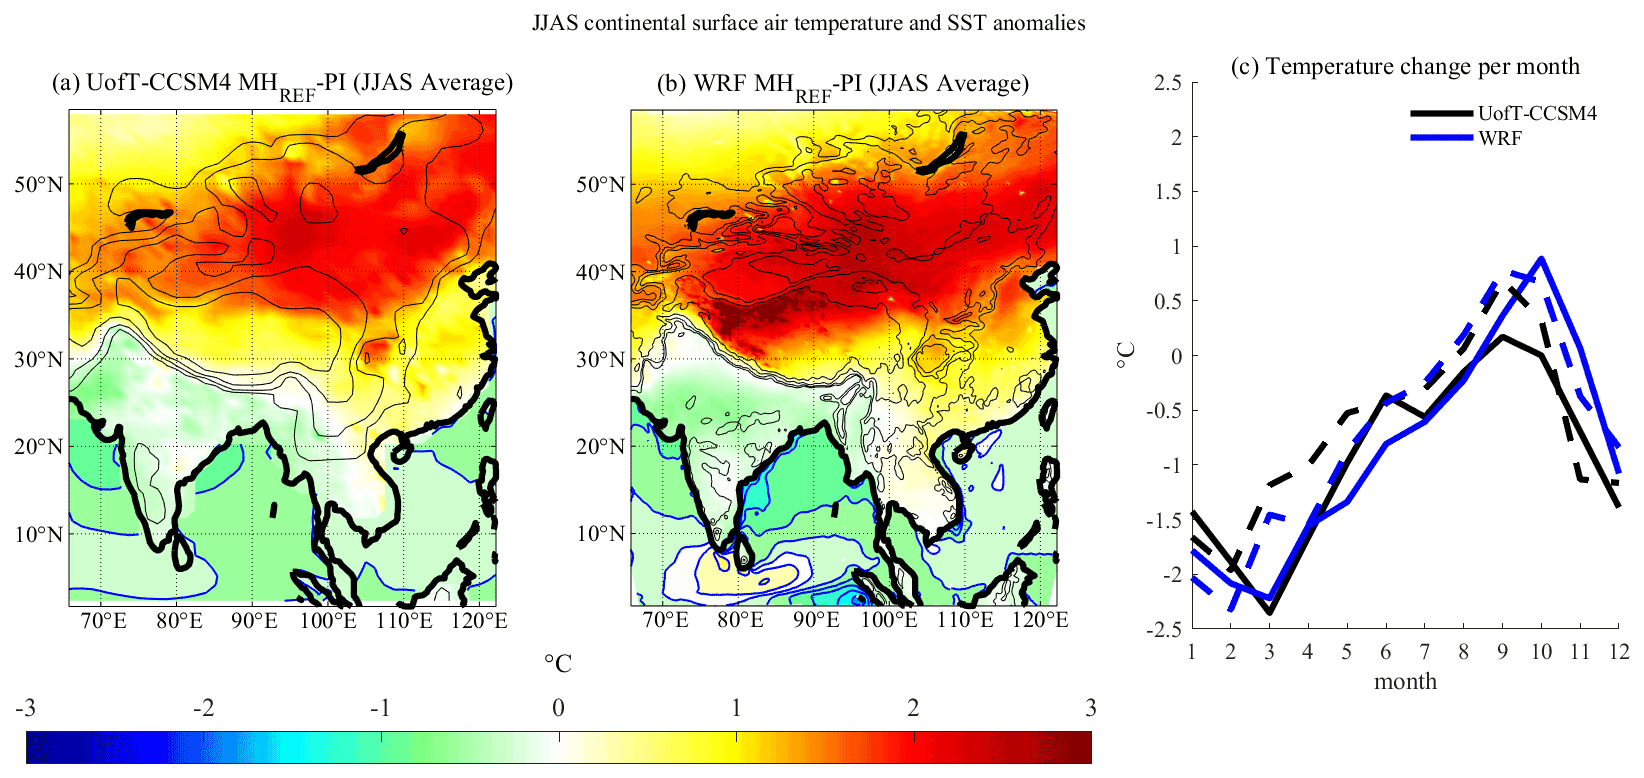
Figure 4JJAS SST (contour interval 0.3 ∘C) and continental surface air temperature anomalies (∘C) for MHREF in (a) UofT-CCSM4 and the (b) WRF ensemble mean. (c) Monthly continental air temperature anomalies over SA (solid) and SEA (dashed). Shifts in calendar are not accounted for; i.e., the model calendar is used for the calculation of all anomalies. The topography contours (black) of 500, 1000, 2000, and 4000 m are also shown in (a, b).
In response to the MH changes in the orbital parameters and GHG concentrations, the 2 m air temperature over land in summer also changes significantly compared to the preindustrial (Fig. 4). During JJAS, land temperatures in the MH are warmer by up to 2 ∘C northward of the TP, and the largest warming center occurs at around 45∘ N. The intensity of this warming center and its spatial extent in the downscaled simulation (Fig. 4b) are larger than in the GCM (Fig. 4a). The Indian subcontinent itself experiences a small cooling (approximately 0.5 ∘C), whose expression does not differ significantly between the GCM and WRF. A summer cooling over SA of similar magnitude was also found in PMIP4 MH simulations (Brierley et al., 2020). The Indochinese peninsula features small temperature anomalies of opposite signs in the western and eastern regions, leading to no significant average temperature change over the peninsula (Fig. 4c). As a result of these changes, the MH summer land meridional temperature gradient decreases through the low to midlatitudes. At the same time, the land–ocean thermal contrast increases due to the rise in the spatially averaged JJAS temperature over the continent and decrease in temperature over the sea, which intensified the moisture transport towards the continent within the low-level monsoonal wind field (see Sect. 3.4). Moreover, the MH insolation forcing yields a climate that is cooler over SA and SEA during three-quarters of the year (Fig. 4c) and warmer only from midsummer to early fall.
Table 1MRE values for the MHREF and MHGS simulations of the GCM and the RCM.

3.2 Average precipitation changes in MHREF
These changes in the SST and the temperature distribution over land and sea have a large impact on the summer monsoon wind field, moisture transport towards the Eurasian landmass, and the regional precipitation distribution. Figure 5 shows the annual mean precipitation difference between the MHREF and the PI and its comparison to proxy-inferred precipitation changes. Under modern climate conditions, the SAM has the highest precipitation rates over the west coast of the Indian subcontinent associated with the Western Ghats mountains and in the north along the Himalayan foothills (Fig. 4 in Huo and Peltier, 2020), whereas the SEAM produces the most intense precipitation over the west coast of Myanmar (Fig. 5 in Huo and Peltier, 2021). For MHREF, most of SA experiences a wetter climate compared to the PI (Fig. 5b), which is consistent with the results obtained in other PMIP3 and PMIP4 model experiments (e.g., Zhao and Harrison, 2012; Brierley et al., 2020). Annual mean rainfall is increased by up to 1 mm d−1 in the northwestern part of SEA, northeastern India, and along the windward side of the Western Ghats foothills in WRF–CROCO simulations (Fig. 5b), which is broadly similar to the results of the regional simulations by Polanski et al. (2012) at 50 km resolution with the exception that they found a decrease in rainfall over central India. These increases are much weaker in the global UofT-CCSM4 model, while the locations of increased precipitation along the Himalayan Range differ from WRF–CROCO: in the global model the largest precipitation increase occurs over the Hindu Kush and Pamir mountain ranges in the western Himalayas, whereas in the downscaled model precipitation increases over a broad region of the Himalayan foothills extending from Hindu Kush to the India–China–Myanmar border in the east. The global model, on the other hand, simulates drying over the eastern Himalayas, while wetter conditions were indicated by the semi-quantitative moisture reconstructions of Wang et al. (2010). These substantial differences between the global and the regional model results attest to the importance of high-resolution modeling over regions of complex land surface. Over SEA, decreased precipitation (approximately 0.5 mm d−1) is delivered by both global and regional models over the southern region, which is consistent with the results obtained in other PMIP4 simulations (Brierley et al., 2020). Over southern India, the global model produces a decrease in annual precipitation, while the WRF–CROCO simulation shows an increase.
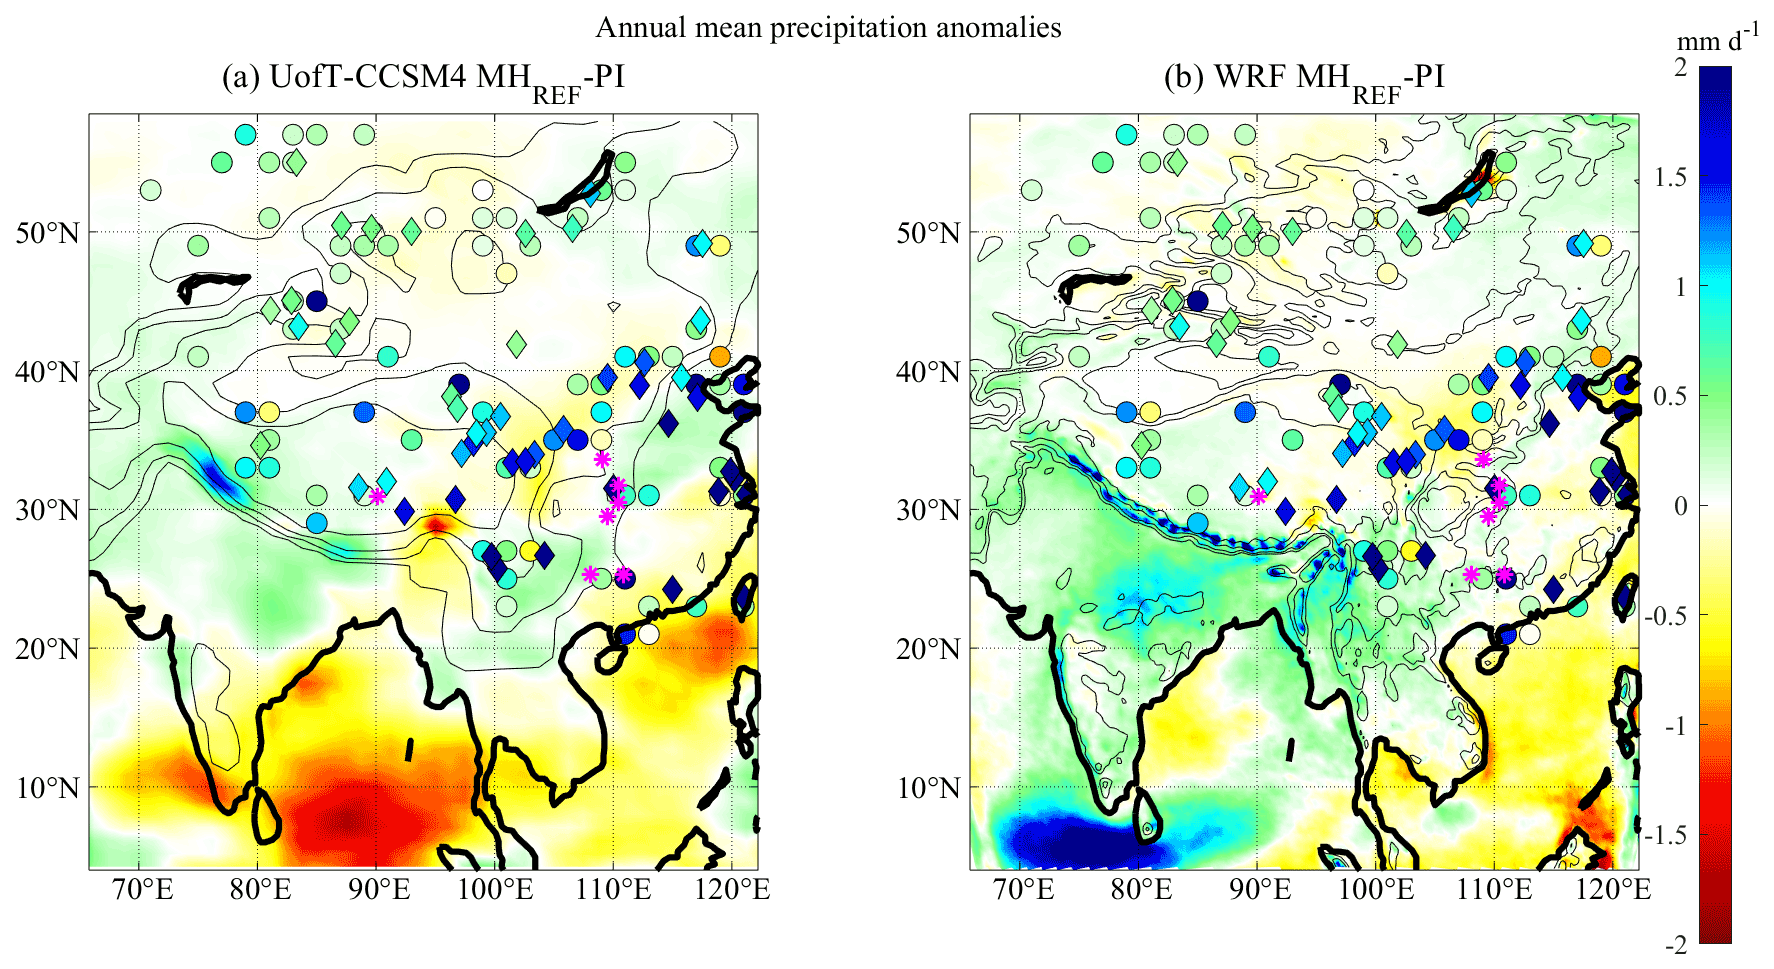
Figure 5Annual mean precipitation anomalies (mm d−1) for MHREF in (a) UofT-CCSM4 and the (b) WRF ensemble member mean. Reconstructed precipitation differences between the MH and present day from Bartlein et al. (2011) and Herzschuh et al. (2019) are plotted as circles and diamonds, respectively. The locations of Tianmen (30.9∘ N, 90.1∘ E), Dongge (25.3∘ N, 108.1∘ E), Jiuxian (33.6∘ N, 109.1∘ E), Lianhua (29.5∘ N, 109.5∘ E), Heshang (30.5∘ N, 110.4∘ E), Sanbao (31.7∘ N, 110.4∘ E), and Xiangshui (25.3∘ N, 110.9∘ E) caves are indicated by “*”. The topography contours of 500, 1000, 2000, and 4000 m are also shown. (c) Monthly precipitation anomalies over SA (solid) and SEA (dashed).
Figure 5 also compares the simulated annual precipitation anomalies with the pollen-based paleoclimatic reconstructions (Bartlein et al., 2011; Herzschuh et al., 2019) in order to evaluate the degree to which the dynamical downscaling-based analysis is able to improve the simulation of MH monsoon rainfall. Overall, there is qualitative agreement between the palynology-based reconstructions by Bartlein et al. (2011) and the model predictions, with wetter conditions in the northern region of SEA and along the windward slopes of the western and central Himalayas. These wet anomalies were also found in the moisture reconstructions by Wang et al. (2010). However, the model MH prediction disagrees with the reconstructions in the eastern part of the TP, where the model produces a negative precipitation anomaly, while the reconstructions indicate increased rainfall in the MH. A similar dry bias was also found in the regional simulations by Polanski et al. (2012). Moisture reconstructions at several sites over eastern Tibet by Wang et al. (2010), however, indicate opposite signs of anomalies during the MH. Overall, the downscaled model simulation displays a slightly greater similarity in pattern to reconstructions by Bartlein et al. (2011), Herzschuh et al. (2019), and Wang et al. (2010) than the GCM in the northern part of SEA and southwestern China, although they both continue to significantly underestimate the inferred changes in precipitation. Both the GCM and downscaled simulations generally suggest a drier climate north of the TP and in central and eastern China during the MH, while the pollen-based reconstructions suggest predominantly wetter conditions. However, even the proxy-based reconstructions are somewhat contradictory from site to site, which may result from topographic differences or local hydrological processes. To quantify the fit to the reconstructions, mean relative error (MRE) is calculated using Eq. (1):
where n is the number of data points, di stands for the proxy data, and pi stands for the model prediction. Considering all the points that have proxy data by Bartlein et al. (2011) in the WRF domain, dynamical downscaling reduced the MRE of the global model by 10 % (Table 1). For the points north of the TP, both the GCM and the downscaled simulation fail to simulate the same sign of precipitation anomalies as indicated by the proxy data. Considering only the points south of 40∘ N, the MRE of the downscaled simulation is 33 % smaller than that of the GCM. The pollen-based dataset by Herzschuh et al. (2019), however, suggests much larger precipitation enhancement during the MH, especially over East China, and is therefore less consistent with both global and regional model results. Additionally, stalagmite records from seven caves in Asia (Cai et al., 2012; Dykoski et al., 2005; Cai et al., 2010; Cosford et al., 2008; Hu et al., 2008; Dong et al., 2010; Zhang et al., 2004) all indicate generally high monsoon precipitation during the MH. The locations of the seven caves (Tianmen, Dongge, Jiuxian, Lianhua, Heshang, Sanbao, and Xiangshui caves) are shown as “*” in Fig. 6a and b. The stalagmite records from Dongge, Sanbao, and Xiangshui caves in East China are qualitatively in accord with results from the coupled WRF–CROCO simulation, while the GCM simulates a wetter climate at the locations of two of the caves but a drier climate at the location of Xiangshui Cave (25.3∘ N, 110.9∘ E). At the location of the Tianmen, Jiuxian, and Lianhua records, both UofT-CCSM4 and WRF–CROCO simulate no significant change (<0.1 mm d−1) during the MH. Note here that Chinese cave records have been interpreted by some studies as not reflecting local MH rainfall changes but upstream monsoon rainfall or rainfall source changes (Liu et al., 2014; Maher, 2008). Since regional precipitation is characterized by high spatial variability and reconstructions inherently have large uncertainties, more proxy data would be needed for a more comprehensive comparison between the model simulations and the reconstructions, particularly over India and SEA.
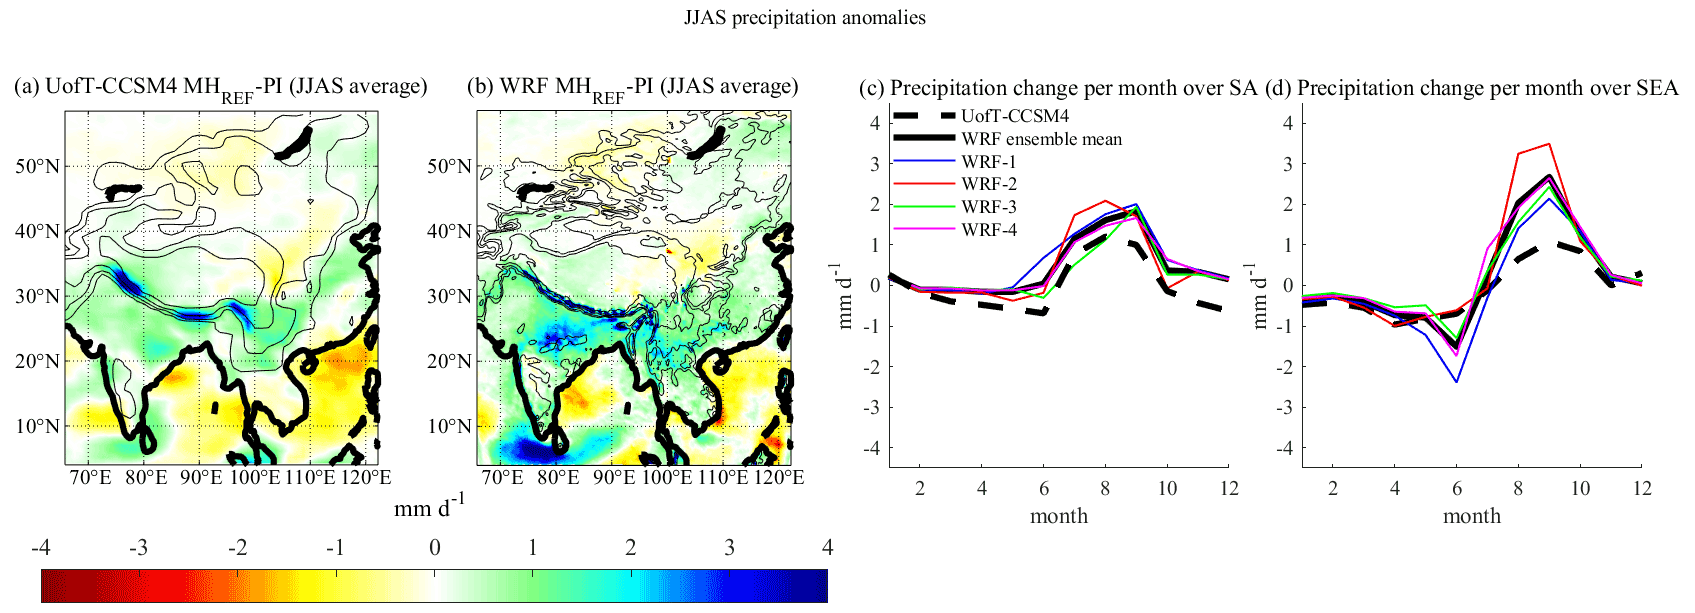
Figure 6(a, b) JJAS average precipitation anomalies (mm d−1) for MHREF in UofT-CCSM4 and the WRF ensemble mean. Monthly precipitation anomalies (mm d−1) for MHREF in UofT-CCSM4 and four physics ensemble members over (c) SA and (d) SEA. Shifts in calendar are not accounted for; i.e., the model calendar is used for the calculation of all anomalies. The topography contours of 500, 1000, 2000, and 4000 m are also shown in (a, b).
Annual precipitation is strongly controlled by summer rainfall, so the JJAS precipitation anomaly patterns (Figs. 6 and A1) resemble those of the annual mean except over southern China, where a decrease is simulated in the annual mean, while JJAS rainfall is simulated to increase (Figs. 5b and 6b). However, compared with the distribution of annual rainfall changes (Fig. 5), the monsoon rainfall increase is greater (up to 3 mm d−1) during the monsoon season over northern SA and SEA. The intensification of the monsoon results in increased cloudiness and evaporation, thereby contributing to the lower temperature over northern SA and SEA (Fig. 4).
Based on the annual cycle of precipitation over SEA (Fig. 6d), monsoon intensity is actually weaker during the early stage (June) in both the global model and all WRF–CROCO ensemble members, although the decrease is much greater in downscaled simulations than in the GCM. This rainfall reduction during the early stage of the monsoon indicates that SEAM starts later in the MH than in PI, which is consistent with previous studies (Dallmeyer et al., 2013). The late monsoon onset is likely related to the lower temperature on the Indochina peninsula during spring and early summer (Fig. 4c). On the other hand, the maximum precipitation increase over SEA occurs in September, which is near the end of the Asian monsoon season. Furthermore, the precipitation increase in October suggests that the withdrawal of the summer monsoon is postponed in Indochina. Over SA, the peak monthly rainfall increase occurs in August and September in all ensemble members, and October experiences a very small increase. Although the monthly rainfall changes due to MH forcing are more drastic over SEA, the overall monsoon (JJAS) rainfall increase is actually smaller over SEA than SA due to the large dry anomaly in June that compensates for the increased precipitation during late summer. Furthermore, all of these monthly monsoon rainfall changes discussed above are stronger in the downscaled simulations than in the GCM (Figs. 5, 6, and A1). The spatially averaged JJAS precipitation increases produced by the WRF–CROCO ensemble mean (UofT-CCCSM4) are 1.2 mm d−1 (0.6 mm d−1) over SA and 0.9 mm d−1 (0.2 mm d−1) over SEA. Such rainfall intensification is probably related to a better representation of topography as the major wet anomaly centers in the downscaled simulation lie in the local mountain ranges over SA and SEA, including the Western Ghats, the Satpura Range in northern SA, and the Garo–Khasi–Jaintia range in northwestern SEA. Moreover, the warmer SSTs over the Arabian Sea also lead to more evaporation and thus contribute to the enhanced wet anomalies, especially over SA.
3.3 Impact of the GS boundary conditions
To investigate the land–ocean–atmosphere feedbacks and teleconnections between GS boundary conditions during the northern African and Asian monsoons, another four-member physics ensemble, forced with global simulations that included GS boundary conditions, was constructed.
In the MHGS simulations, the influence of GS surface boundary conditions (Chandan and Peltier, 2020) leads to a JJAS temperature anomaly over Asia that has much in common with MHREF, with higher latitudes serving as the primary center of warming (Figs. 4b and 7a). However, except over India, the warming in MHGS is more pronounced than that in MHREF over the majority of the WRF domain, with the largest increase over the TP and East Asia (Fig. 7b). Such enhanced warming is conducive to increasing the northward moisture flux to SA and SEA by increasing the strength of the low-pressure center over the continental interior. JJAS temperature over northeastern India is cooler than in the experiment without GS forcing, which may be linked to the further increase in albedo resulting from the greater increase in cloud fraction and JJAS rainfall over the region (Fig. 9), similar to previous modeling results (Pausata et al., 2020). Over SEA, inclusion of a GS leads to increased warming year round, with the greatest increase in October (up to 0.7 ∘C; Fig. 7c). With a GS the climate becomes warmer than present over most of SEA by approximately 0.2 ∘C during JJAS (Fig. 7a), whereas the MH orbital and trace gas forcing alone (MHREF) produces a small cooling over western SEA (Fig. 4b). Such warming is directly related to the increase in the SSTs since regions with the most pronounced warming (west coast of SA and southern and western SEA) also have the largest increase in SST (Fig. 7b). Compared to MHREF, the SSTs over the Indian Ocean and the South China Sea (Fig. 1) are now warmer everywhere by at least 0.5 ∘C, with pockets of even warmer SSTs to the south of India and Vietnam. As a result of this warming, the warm SST center south of India that was present in MHREF intensifies in strength (up to 2 ∘C warmer than PI; Fig. 7a), and the cooling over the northeastern Arabian Sea and BOB is reduced. The increase in SST favors more evaporation over the Arabian Sea and BOB, thus contributing to the SAM and SEAM precipitation increase.
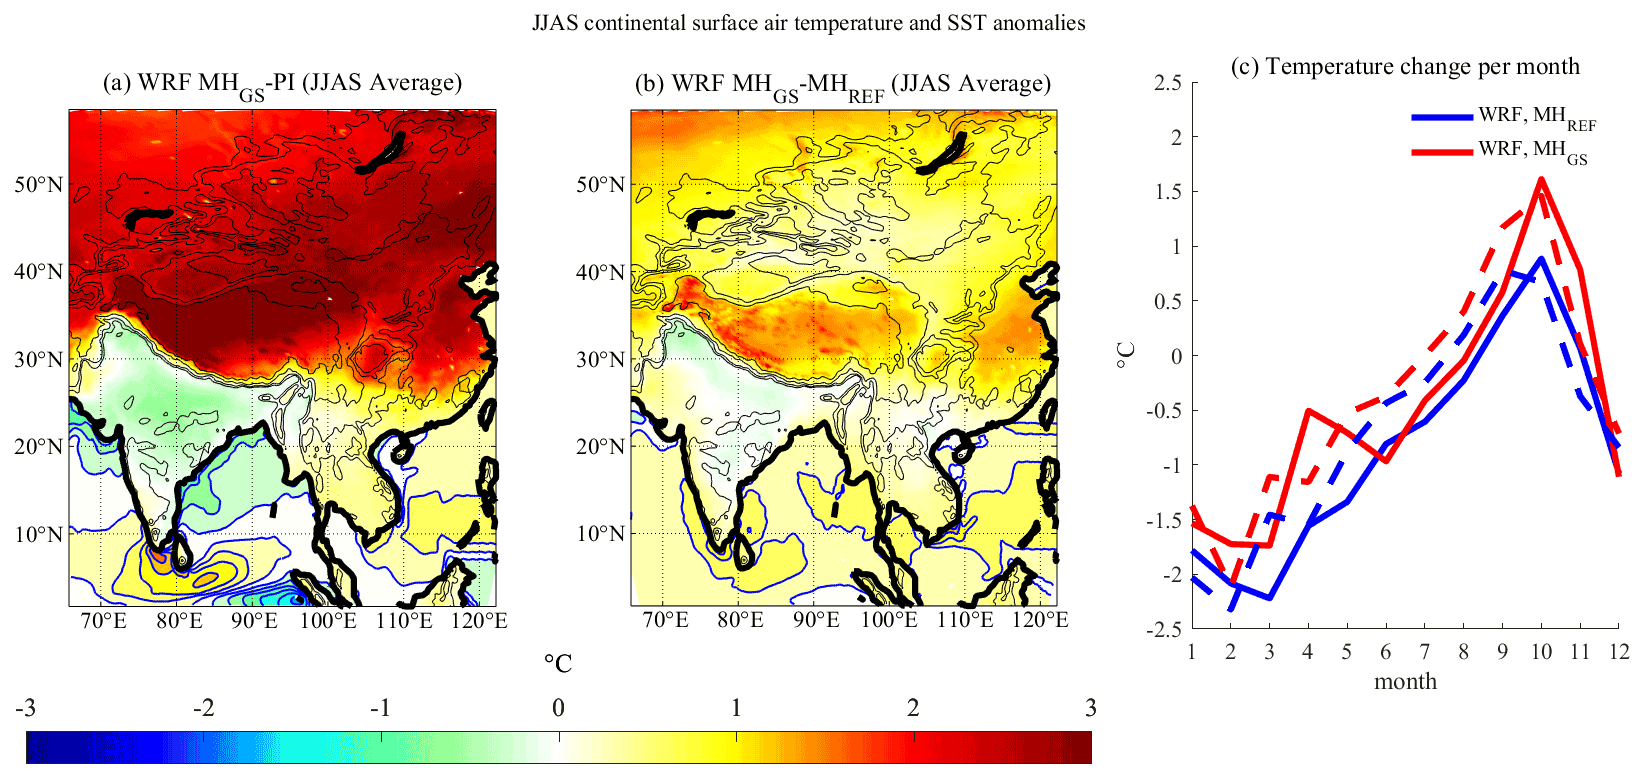
Figure 7JJAS SST (contour interval 0.3 ∘C) and continental surface air temperature anomalies (in ∘C) for (a) MHGS and (b) differences between MHGS and MHREF in the WRF ensemble mean. (c) Monthly continental air temperature anomalies over SA (solid) and SEA (dashed). Shifts in calendar are not accounted for; i.e., the model calendar is used for the calculation of all anomalies. The topography contours (black) of 500, 1000, 2000, and 4000 m are also shown in (a, b).
The inclusion of a GS significantly reinforces the precipitation anomaly pattern that was simulated over SA only in the presence of MH orbital insolation and GHG forcings (Figs. 8b, 9b, and A2). The positive rainfall anomaly is particularly large in northeastern India and along the Western Ghats (up to 3 mm d−1). In southern India, whereas there were no significant precipitation changes in the rain shadow east of the Western Ghats in MHREF (Fig. 5b), there is now a strong increase in precipitation in the simulations with GS forcing (Fig. 8b). Over SEA, feedbacks from land surface changes over northern Africa also lead to a precipitation intensification relative to MHREF (Figs. 8b and 9d), albeit with a smaller amplitude than that over SA (Figs. 8b and 9c). The positive rainfall anomaly in the northern region of the Indochina peninsula extends southward, reducing the negative precipitation anomaly that was modeled over the southern region in MHREF. The decrease in precipitation over the western BOB in MHREF is also reduced.
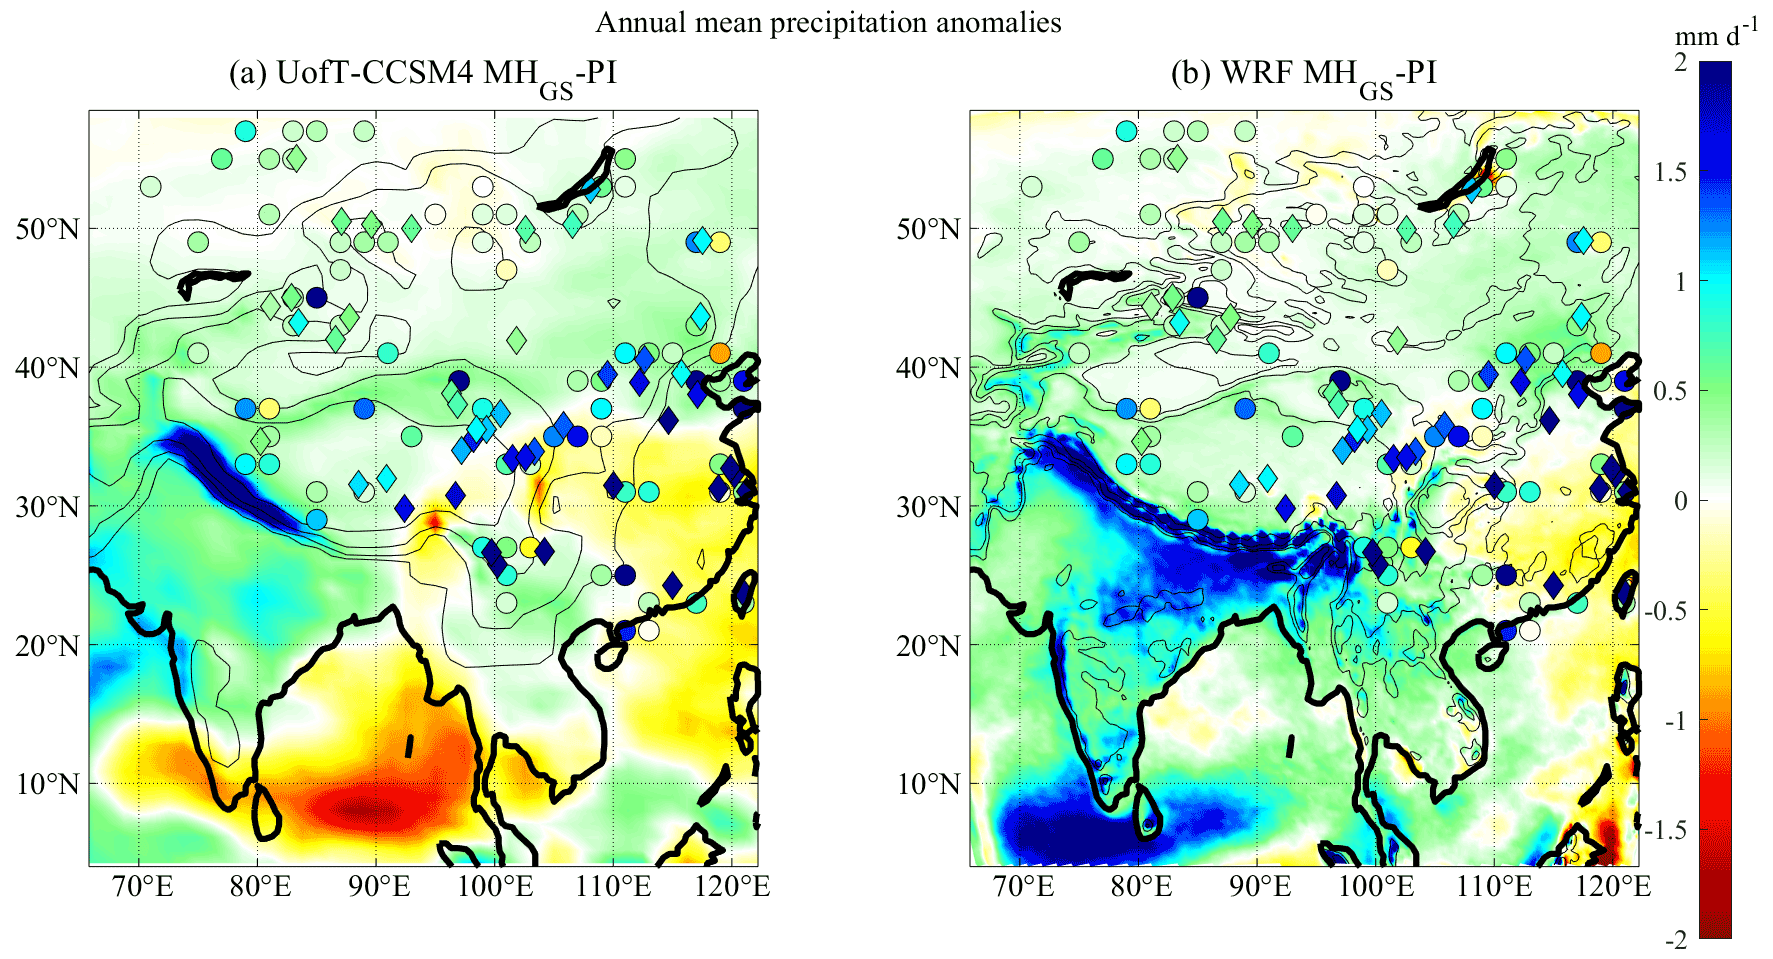
Figure 8Same as Fig. 5, but for MHGS.
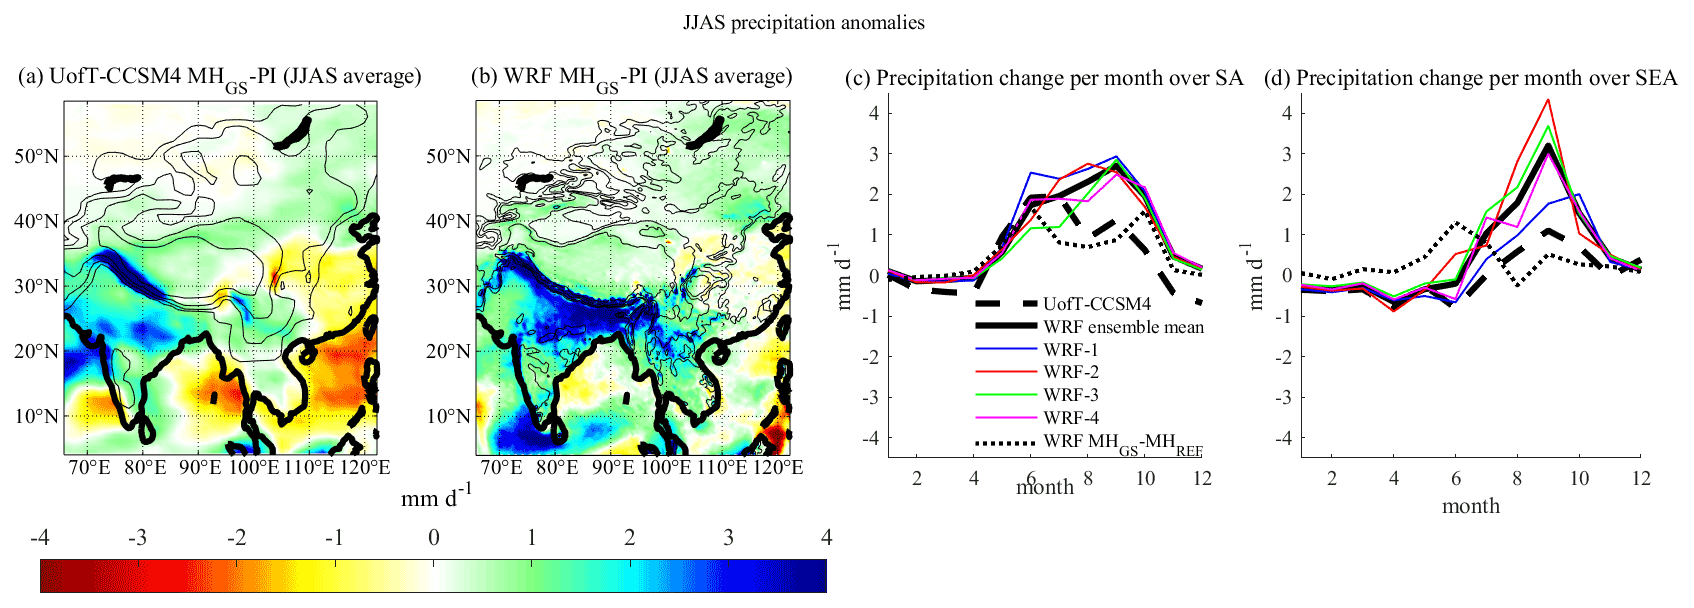
Figure 9Same as Fig. 6, but for MHGS. The dotted lines in (c, d) represent the MHGS–MHREF anomalies in the WRF ensemble mean.
Generally, when the northern African land surface changes in the MH are included, the modeled annual mean precipitation change over most of the Asian monsoon regions shows significantly improved agreement with proxy records, particularly over the TP and North China (Fig. 8), compared to that which is obtained only in the presence of MH orbital and GHG forcings (Fig. 5). Comparing MHREF and MHGS from the UofT-CCSM4 (Figs. 5a and 8a), inclusion of a vegetated Sahara during the MH enhances precipitation along the Himalayas and produces a positive anomaly band stretching from the western TP to northeastern China, which leads to an improvement of model–proxy agreement and is consistent with Tabor et al. (2020). With dynamical downscaling, the model better captures both the sign and magnitude of the local-scale response characteristics of the MH proxy records by both Bartlein et al. (2011) and Herzschuh et al. (2019) (Fig. 8), especially the precipitation enhancement along the Tian Shan (Fig. 1) north of the TP and from the northern SEA to North China, thus further improving the proxy–data comparison. For all the points in the WRF domain, inclusion of a GS into the downscaled simulation leads to a 11 % reduction of the MRE relative to the reconstructions by Bartlein et al. (2011). However, the precipitation increase over the eastern TP and southeastern China that is revealed by the two proxy datasets is still not captured by dynamical downscaling or by incorporating the influence of the greening of the Sahara.
While JJAS average rainfall determines the overall amount of water supply, shifts in monsoon onset and withdrawal play an important role in determining the length and thus the net precipitation that falls during the monsoon season. In the PI experiment, the SAM starts in late May and then develops until August and starts to retreat in September (Fig. 10a). In MHREF, the monsoon onset is delayed and the precipitation reduction is greater at lower latitudes (Fig. 10b). The impact of the late onset is offset by a delayed withdrawal, which lengthens the SAM duration. Inclusion of the GS boundary conditions results in a further lengthening of the monsoon season to November (Fig. 10c). The delay of the monsoon onset in MHREF is also eliminated by including a vegetated Sahara, although the region at lower latitudes is still characterized by a relatively smaller precipitation increase in June. On the contrary, SEA has a much stronger delay of the monsoon onset and is characterized by a greater decrease in rainfall in early summer in MHREF (Fig. 10e). The withdrawal of the SEAM is also delayed by approximately 1 month. MHGS displays a weaker decrease in precipitation than MHREF in spring and early summer. The Sahara greening also increases the rainfall at the end of the monsoon season (September and October), especially at the higher latitudes, further postponing the monsoon withdrawal.
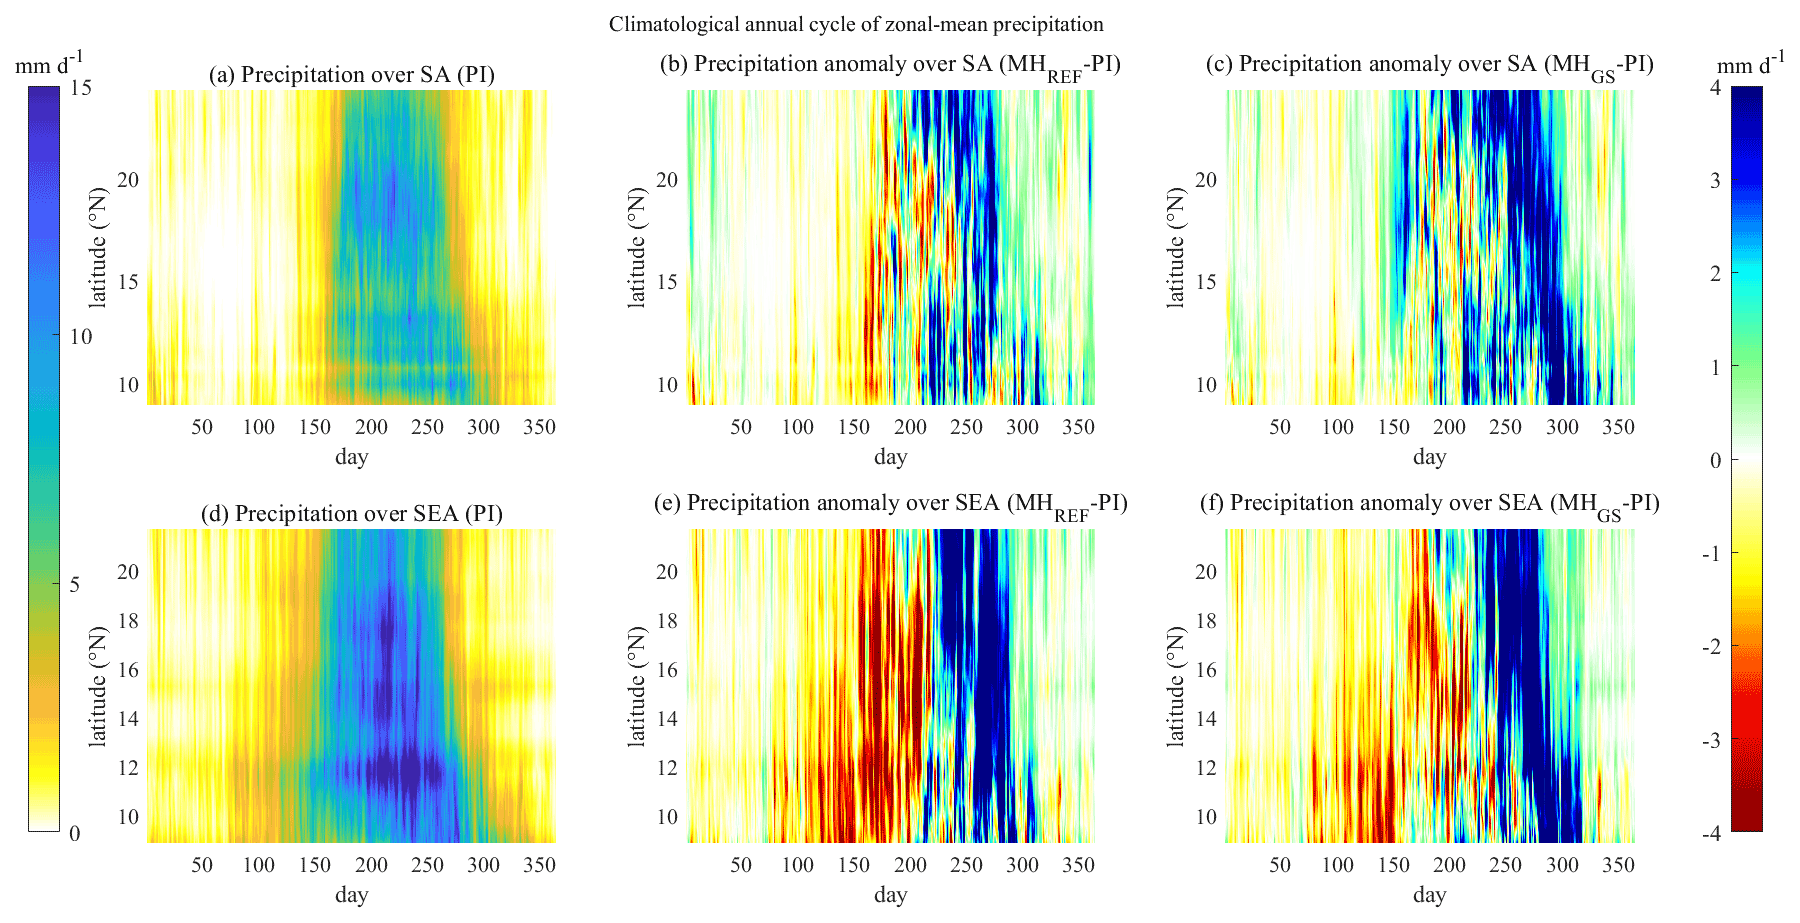
Figure 10Climatological seasonal cycle of zonal-mean precipitation (mm d−1) for the PI simulations of the WRF–CROCO ensemble mean over (a) SA and (d) SEA. Zonal-mean precipitation anomalies for (b, e) MHREF and (c, f) MHGS over (b, c) SA and (e, f) SEA.
3.4 Changes in the large-scale moisture flux
The JJAS precipitation over SA and SEA is closely related to the summer monsoonal winds transporting moisture from the ocean to the Eurasian continent (Fig. 11d). The enhanced Northern Hemisphere insolation during the MH (Fig. 1) and enhanced land–sea temperature gradients (Fig. 4) result in an intensification of the westward flow around the southern tip of India and the westerly across SA and SEA, intensifying the simulated Asian monsoonal circulation and strengthening the moisture flux to SA and SEA (Fig. 11e). This spatial pattern of wind anomaly agrees well with previous studies (Pausata et al., 2020; Piao et al., 2020) and explains the rainfall changes in Fig. 6. Furthermore, the negative SST anomalies over the northern Arabian Sea probably result from the enhanced upwelling caused by the intensified monsoonal flow, and the increased SSTs south of the Indian subcontinent (Fig. 4) are likely related to the weakened westerlies over that region. The convergence of the simulated low-level moisture flux has a positive anomaly over northern SA and South China, while the water vapor flux becomes slightly more divergent over southern SEA and southern SA in MHREF. As a consequence, the enhanced moisture flux and convergence over northern India lead to a greater JJAS precipitation increase than in southern India during the MH. Conversely, the reduction of JJAS precipitation in the southern part of SEA is connected to the decreased moisture flux convergence in that region. At midlatitudes, the high-level moisture flux above the Eurasian continent becomes more divergent in MHREF than in the PI (Fig. 11h). In the global model, the GS enhances the northward expansion of the North African monsoon (Fig. 11c). Under the GS boundary conditions, the low-level westerlies over the northern Indo-Pacific Ocean become weaker than in MHREF (Fig. 11f), which decreases the upwelling and hence increases the SSTs of that region (Fig. 7), favoring more evaporation. Anomalous easterlies induced by GS over the North Pacific carry more moisture into SA and SEA, intensifying the monsoon precipitation there. In the regional model, the inclusion of a vegetated Sahara intensifies the anomaly pattern characteristic of the MHREF experiment over the entire domain, in particular over northern India, which explains the strong precipitation increase over most of SA (Figs. 9 and A2).
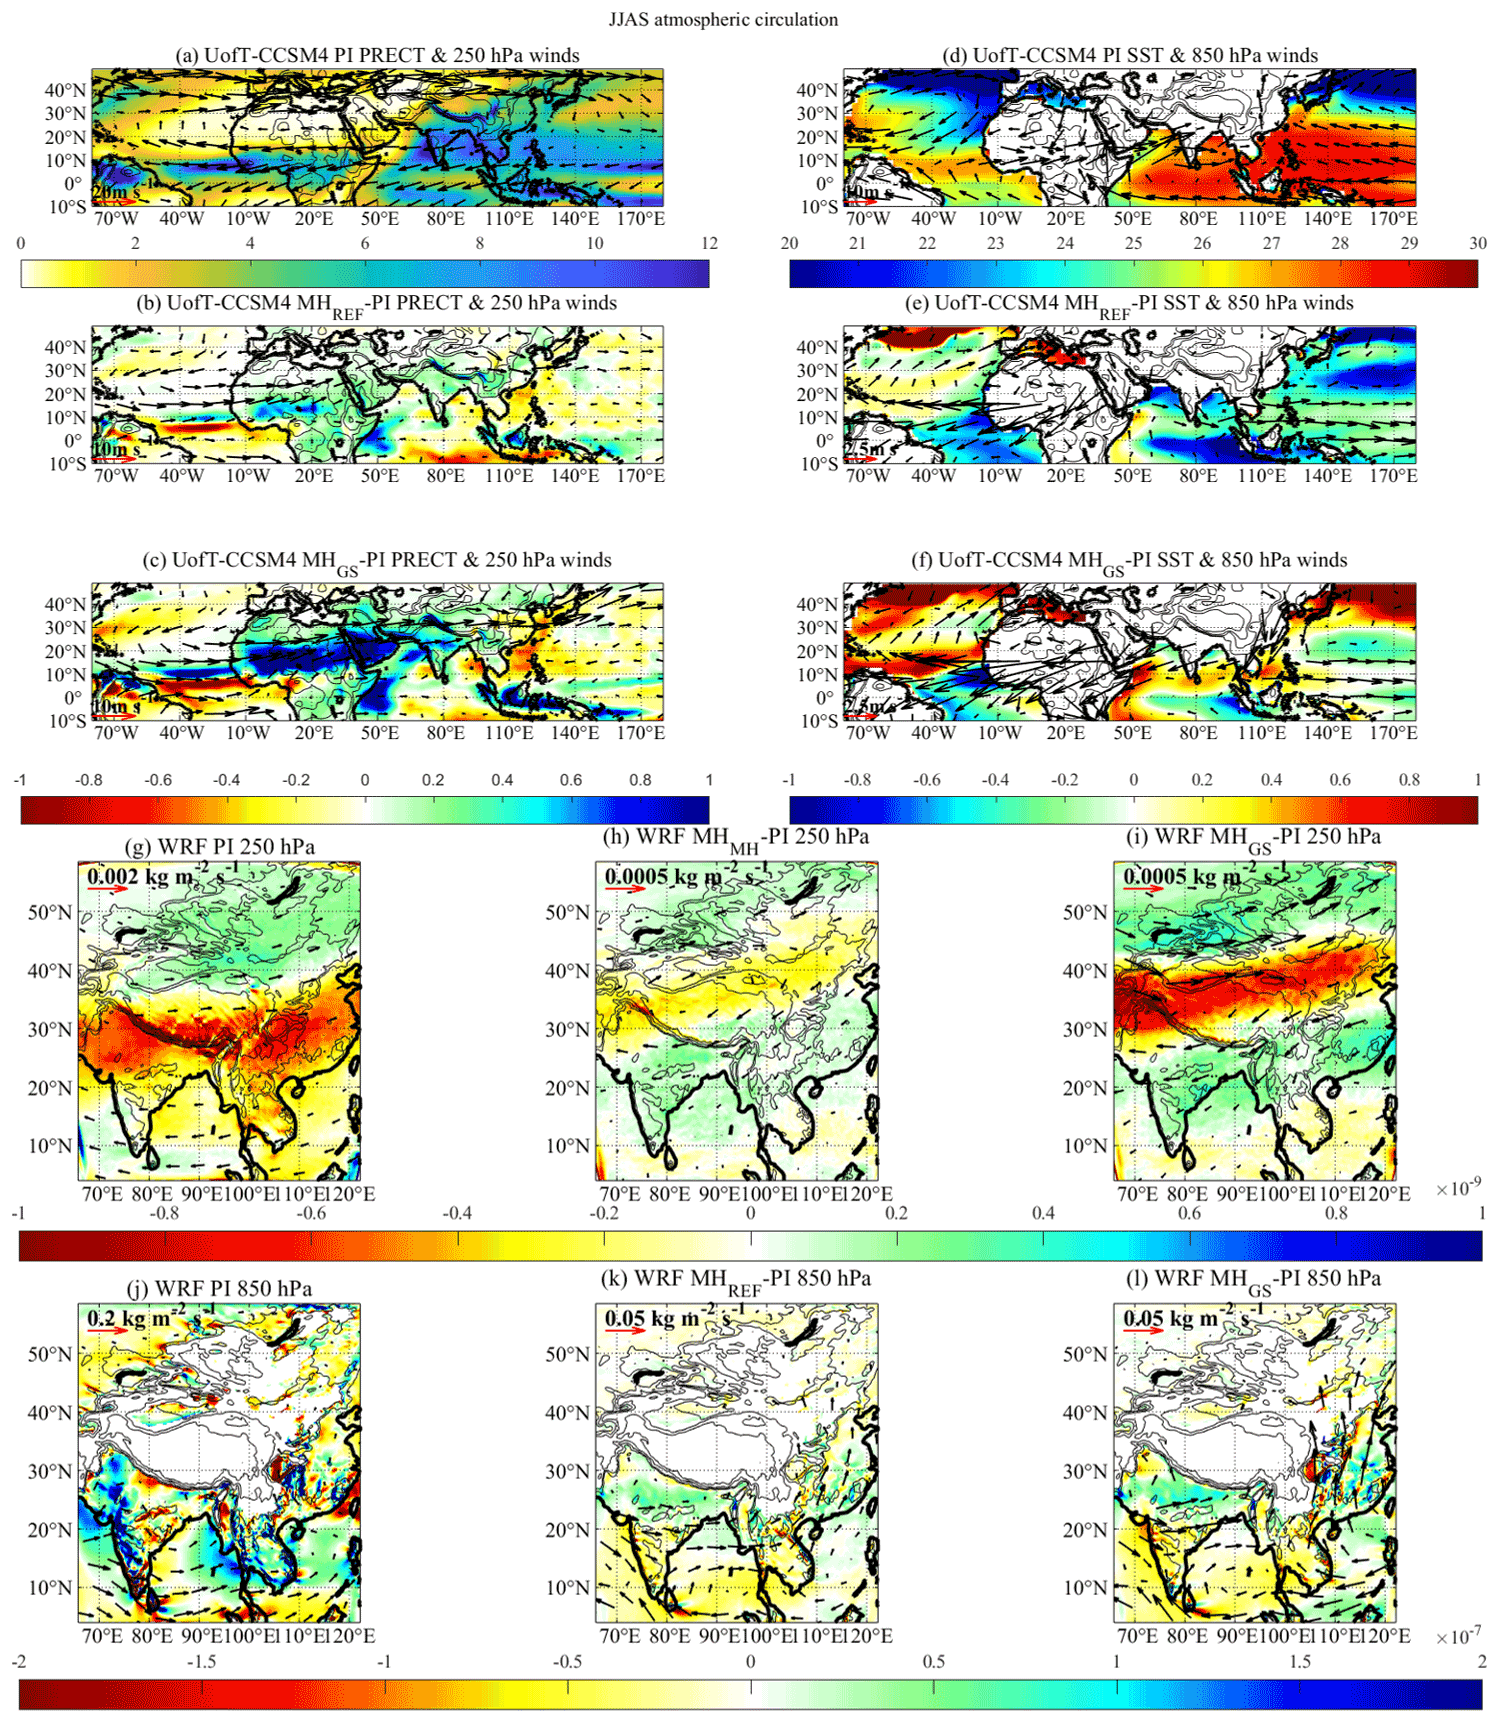
Figure 11250 hPa winds (vector, m s−1) and precipitation (shaded, mm d−1) from the UofT-CCSM4 for (a) the PI simulations and anomalies in (b) MHREF and (c) MHGS. 850 hPa winds (vector, m s−1) and SST (shaded, ∘C) from the UofT-CCSM4 for (d) the PI simulations and anomalies in (e) MHREF and (f) MHGS. Moisture flux (vector, ) and its convergence (shaded, ), with blue indicating convergence (moisture sink) and red divergence (moisture source), for the PI simulations of WRF–CROCO ensemble mean at (g) 250 hPa and (j) 850 hPa. Anomalies of moisture flux (vector, ) and its convergence (shaded, ) for (h, k) MHREF and (i, l) MHGS at (h, i) 250 hPa and (k, l) 850 hPa. The topography contours of 500, 1000, 2000, and 4000 m are also shown.
In this study, we have reported on paleoclimate experiments with dynamical downscaling simulations that we have conducted using the coupled WRF–CROCO model driven by the output from the global coupled UofT-CCSM4 GCM to investigate the MH Asian regional climate. We have focused attention on the summer monsoon circulations of this region, reconstructing these at much higher resolution than is possible with a global model by employing a dynamical downscaling procedure. By employing a downscaling pipeline in which the reginal climate model WRF is coupled to the regional ocean model CROCO we have been able to not only capture the effects of the complex surface orography and land–sea contrast of the region but also achieve a much higher-fidelity data–model comparison than has been achieved previously. Furthermore, and in contrast to the common protocol for climate simulations of the MH Asian monsoon system (Otto-Bliesner et al., 2017), which only includes the impact of solar insolation changes and ignores the potential for teleconnection effects on the Asian monsoons, our study also incorporates a set of downscaled simulations that include Green Sahara (GS) boundary conditions through which we have been able to assess the remote response of the MH SAM and SEAM systems to the greening of the Sahara. These effects have been shown to be of first order in importance. The magnitude of the impacts is significantly enhanced by the high spatial resolution delivered by the downscaling pipeline.
Compared to the preindustrial, all physics ensemble members downscaled from the reference MH climate, which does not include a GS, consistently exhibit a strengthened summer monsoon intensity during the MH over both SA and SEA. The increase in summer rainfall is particularly strong over northern India and northern Indochina, while monsoon precipitation decreases over the southern part of SEA and the western BOB. MH monsoon intensity is weaker during early summer, particularly over SEA, which is likely linked to the lower SSTs in the eastern Arabian Sea and the BOB. A late monsoon onset and a delay in the monsoon withdrawal over both SA and SEA are also found in our analysis. All of these changes are stronger in the downscaled simulations than in the GCM.
Comparison with paleoclimatic reconstructions demonstrates that over northern Indochina and along the Himalayas, the simulated annual rainfall anomalies agree well with the reconstructions from a qualitative perspective. However, over the eastern TP, the model simulations are characterized by a drier climate, while wetter conditions are indicated by proxy data for the MH. Overall, the WRF results are in better agreement with proxy inferences, especially in the northern part of SEA and southwestern China, than the predictions of the UofT-CCSM4 global model, which is much coarser in resolution and does not resolve the regional orography accurately. Given that climate models using coarse spatial resolutions generally reproduce the direction and large-scale patterns of the MH monsoon system changes but tend to underestimate the regional response (Hargreaves et al., 2013; Zhao and Harrison, 2012; Braconnot et al., 2012), this study clearly demonstrates the added value of using dynamical downscaling in paleoclimate studies of the Asian monsoon system. However, since proxy data are scarce both geographically and temporally, particularly over SEA and the southern part of SA, more reconstruction work based on various proxies and methods will be required to draw more robust conclusions.
Comparison between simulations with and without GS boundary conditions demonstrates that greening of the Sahara amplifies the response of SAM and SEAM and leads to a further increase in MH monsoon precipitation, which is likely related to increased heating over the interior of the Eurasian continent. Over SA under GS conditions, the water vapor flux from the Arabian Sea to the northern Indian subcontinent is enhanced compared to the case when only the orbital forcing is considered. Over the southern part of SEA, although a Green Sahara weakens the low-level westerly moisture flux, it also reduces the moisture divergence. With a GS, the JJAS rainfall increases are more than twice as large as those caused by the orbital and GHG forcings in all WRF–CROCO physics ensemble members over SA. The precipitation increase in response to the GS forcing is associated with a drop in surface temperature over SA and SEAM (Fig. 7), which reduces the sensible heat flux. On the other hand, the substantially increased SAM and SEAM precipitation leads to a release of latent heat, which warms the middle and upper troposphere and adds to the temperature difference between land and ocean (Fig. 7), thus driving stronger winds and moisture advection, which in turn leads to enhanced precipitation. The duration of the monsoon season is also lengthened by several months over both regions by extending its withdrawal phase. Comparison of downscaled results including a GS with paleoclimate reconstructions points to significant improvements in simulating precipitation, especially over the TP and North China. These results highlight the climate sensitivity of Saharan vegetation changes via ocean–atmosphere teleconnections and emphasize the importance of incorporating MH vegetation feedbacks.
Finally, the precipitation anomalies reported in this study are subject to uncertainties associated with the parts of the GCM simulations used to drive WRF–CROCO. Since the Asian monsoon precipitation is strongly influenced by the El Niño–Southern Oscillation (ENSO), further simulations forced by different parts of the global simulations are necessary to characterize the internal variability and confirm the robustness of the current study. In addition, in this study we have only considered the impact of land surface changes over northern Africa on SAM and SEAM using one coupled regional modeling system. However, some recent studies also argue for an impact on the MH Asian monsoon arising from reduced dust over northern Africa (Pausata et al., 2020; Sun et al., 2019). Additionally, proxy data from the MH indicate widespread vegetation changes everywhere, particularly greater vegetation coverage over Eurasia (Tarasov et al., 1998) and South and East Asia (Zhang et al., 2014). It has already been shown that the higher Eurasian forest cover during the MH can shift the intertropical convergence zone northward and has a remote impact on global climate (Swann et al., 2014). These results call for further investigations using both diverse numerical models and more realistic vegetation distributions as well as dust concentrations to enable further improvements in reconstructions of the MH Asian monsoon systems.
Four different cumulus parameterization schemes (Tiedtke, GF, BMJ, and KF) are employed in the WRF model to form a mini-physics ensemble, which enables us to study the sensitivity of model performance to different cumulus parameterizations and thereby to estimate the uncertainty associated with these parameterizations in the simulated MH climate.
Comparing different ensemble members, all physics configurations provide generally consistent signals for both SA and SEA during JJAS, with a greater monsoon precipitation increase over northern SA and SEA and along the windward slope of the Western Ghats (Fig. A1). Among all the ensemble members, the GF scheme in the second ensemble member produces the largest JJAS precipitation increase (1.5 mm d−1), while the first ensemble member based on the KF cumulus scheme produces the smallest wet anomaly over SEA (0.2 mm d−1), which is a result of the large dry anomaly in the south compensating for the rainfall increase in the north. Over SA, however, the KF cumulus scheme produces the largest wet anomaly among all ensemble members (1.4 mm d−1), while the third ensemble member using the Tiedtke cumulus scheme has the smallest precipitation change (0.8 mm d−1). Furthermore, the GF scheme produces the second-largest JJAS rainfall increase over SA (1.3 mm d−1). Such different JJAS rainfall signals over SA and SEA indicate the impact of the choice of different cumulus schemes on the spatial distribution of moisture. In our simulations of SA and SEA for the present day (Huo and Peltier, 2020, 2021), the KF cumulus scheme performed the best in terms of reproducing the mean SAM precipitation of all cumulus schemes, while it significantly overestimated precipitation over nearly all of SEA. The Tiedtke scheme has a general dry bias over SA, while it can be considered the best in terms of the SEAM average precipitation simulation during the instrumental era. The BMJ cumulus scheme generally produces a moist bias in both the Indian and SEA cases under modern climate conditions.
The JJAS precipitation anomalies in the experiments with GS boundary conditions are generally consistent among different WRF–CROCO ensemble members: both the SAM rainfall and SEAM rainfall significantly increase compared to the PI climate and to MHREF (Fig. A2). All ensemble members are characterized by increased wet anomalies in the north compared to the south in both SA and SEA. In terms of the spatially averaged JJAS precipitation over SA, in almost all ensemble members the presence of GS conditions leads to a doubling of the precipitation increase produced by MHREF. On the other hand, over SEA, the amplitude of the increase in MHGS is less consistent between the ensemble members. The first ensemble member, which is characterized by small overall JJAS rainfall changes over SEA in MHREF due to the opposite signs of anomalies simulated in the south and the north, triples the wet anomaly in MHGS by reducing the widespread drying over southern SEA. In the fourth ensemble member using the BMJ cumulus scheme, feedbacks from the Sahara greening lead to the smallest precipitation intensification compared to the simulation with only the orbital and GHG forcing (0.3 mm d−1) among all ensemble members, which is only 30 % of the averaged wet anomaly in MHREF (0.9 mm d−1).
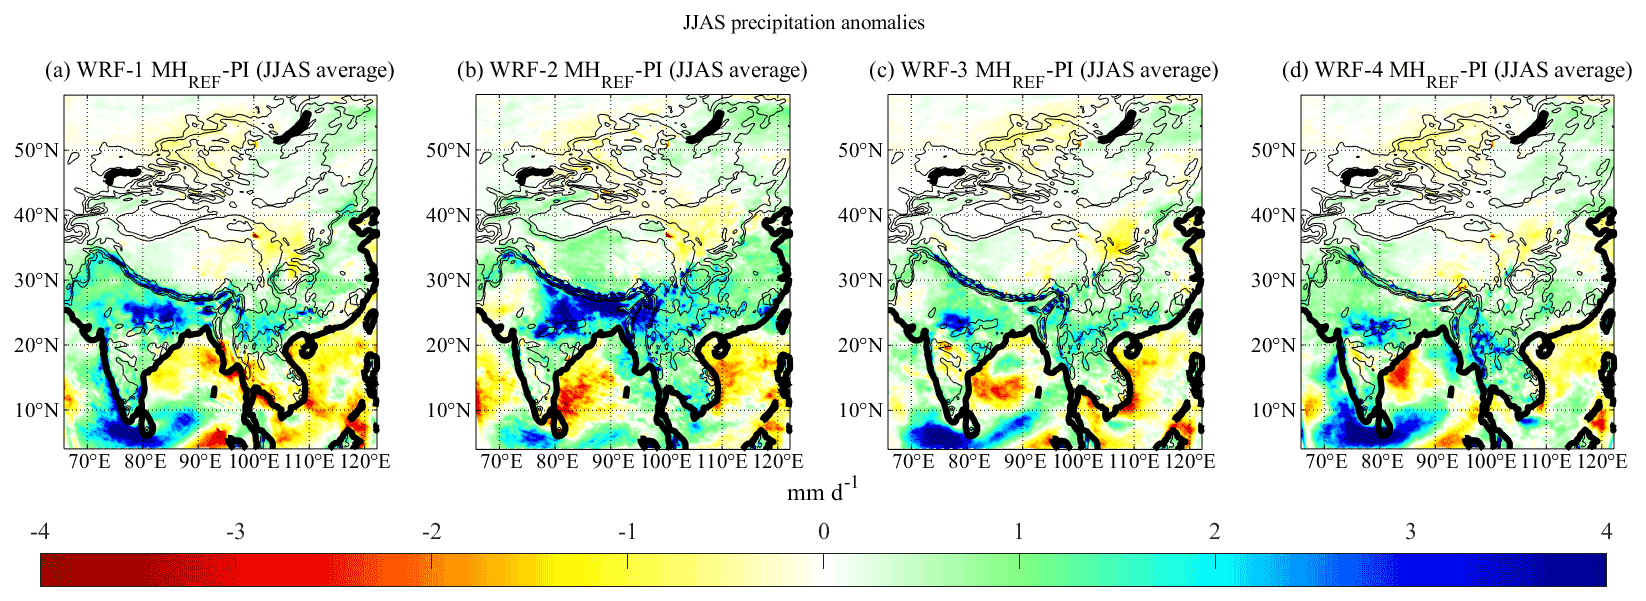
Figure A1JJAS average precipitation anomalies (mm d−1) for MHREF in four WRF physics ensemble members. The topography contours of 500, 1000, 2000, and 4000 m are also shown in (a–d).

Figure A2Same as Fig. A1, but for MHGS.
Code and data for reproducing each of the figures in the paper can be obtained from Yiling Huo.
WRP and YH designed the experiments, and YH carried them out. WRP worked to integrate CROCO into the UofT downscaling pipeline together with SciNet colleagues. DC designed the Green Sahara simulation and performed the UofT-CCSM4 global experiments. YH adapted the WRF radiation module for the MH experiments with the help of DC. YH prepared the paper with contributions from both co-authors.
The authors declare that they have no conflict of interest.
Publisher's note: Copernicus Publications remains neutral with regard to jurisdictional claims in published maps and institutional affiliations.
Fengyi Xie consulted on the CROCO coupled WRF pipeline, and his inputs are also gratefully acknowledged. The simulations presented in this paper were performed at the SciNet high-performance computing facility at the University of Toronto, which is a component of the Compute Canada HPC platform.
This research has been supported by the Natural Sciences and Engineering Research Council of Canada (grant no. A9627).
This paper was edited by Qiuzhen Yin and reviewed by Chris Brierley and one anonymous referee.
An, Z.: The history and variability of the East Asian paleomonsoon climate, Quaternary Sci. Rev., 19, 171–187, https://doi.org/10.1016/S0277-3791(99)00060-8, 2000.
Banakar, V. K., Mahesh, B. S., Burr, G., and Chodankar, A. R.: Climatology of the Eastern Arabian Sea during the last glacial Cycle reconstructed from paired measurement of foraminiferal δ18O and , Quaternary Res., 73, 535–540, https://doi.org/10.1016/j.yqres.2010.02.002, 2010.
Bartlein, P. J., Harrison, S. P., Brewer, S., Connor, S., Davis, B. A. S., Gajeweski, K., Guiot, J., Harrison-Prentice, T. I., Henderson, A., Peyron, O., Prentice, I. C., Scholze, M., Seppä, H., Shuman, B., Sugita, S., Thompson, R. S., Viau, A. E., Williams, J., and Wu, H.: Pollen-based continental climate reconstructions at 6 and 21 ka: a global synthesis, Clim. Dynam., 37, 775–802, https://doi.org/10.1007/s00382-010-0904-1, 2011.
Berger, A.: Long-term variations of daily insolation and quater-nary climatic changes, J. Atmos. Sci., 35, 2362–2367, https://doi.org/10.1175/1520-0469(1978)035<2362:LTVODI>2.0.CO;2, 1978.
Böll, A., Schulz, H., Munz, P., Rixen, T., Gaye, B., and Emeis, K.-C.: Contrasting sea surface temperature of summer and winter monsoon variability in the northern Arabian Sea over the last 25 ka, Palaeogeogr. Palaeocl., 426, 10–21, https://doi.org/10.1016/J.PALAEO.2015.02.036, 2015.
Brierley, C. M., Zhao, A., Harrison, S. P., Braconnot, P., Williams, C. J. R., Thornalley, D. J. R., Shi, X., Peterschmitt, J.-Y., Ohgaito, R., Kaufman, D. S., Kageyama, M., Hargreaves, J. C., Erb, M. P., Emile-Geay, J., D'Agostino, R., Chandan, D., Carré, M., Bartlein, P. J., Zheng, W., Zhang, Z., Zhang, Q., Yang, H., Volodin, E. M., Tomas, R. A., Routson, C., Peltier, W. R., Otto-Bliesner, B., Morozova, P. A., McKay, N. P., Lohmann, G., Legrande, A. N., Guo, C., Cao, J., Brady, E., Annan, J. D., and Abe-Ouchi, A.: Large-scale features and evaluation of the PMIP4-CMIP6 midHolocene simulations, Clim. Past, 16, 1847–1872, https://doi.org/10.5194/cp-16-1847-2020, 2020.
Braconnot, P., Harrison, S. P., Kageyama, M., Bartlein, P. J., Masson-Delmotte, V., Abe-Ouchi, A., Otto-Bliesner, B., and Zhao, Y.: Evaluation of climate models using palaeoclimatic data, Nat. Clim. Change, 2, 417–424, https://doi.org/10.1038/nclimate1456, 2012.
Cai, Y., Tan, L., Cheng, H., An, Z., Edwards, R. L., Kelly, M. J., Kong, X., and Wang, X.: The variation of summer monsoon precipitation in central China since the last deglaciation, Earth Planet. Sc. Lett., 291, 21–31, https://doi.org/10.1016/j.epsl.2009.12.039, 2010.
Cai, Y., Zhang, H., Cheng, H., An, Z., Edwards, R. L., Wang, X., Tan, L., Liang, F., Wang, J., and Kelly, M.: The Holocene Indian monsoon variability over the southern Tibetan Plateau and its teleconnections, Earth Planet. Sc. Lett., 335, 135–144, https://doi.org/10.1016/j.epsl.2012.04.035, 2012.
Chandan, D. and Peltier, W. R.: Regional and global climate for the mid-Pliocene using the University of Toronto version of CCSM4 and PlioMIP2 boundary conditions, Clim. Past, 13, 919–942, https://doi.org/10.5194/cp-13-919-2017, 2017.
Chandan, D. and Peltier, W. R.: On the mechanisms of warming the mid-Pliocene and the inference of a hierarchy of climate sensitivities with relevance to the understanding of climate futures, Clim. Past, 14, 825–856, https://doi.org/10.5194/cp-14-825-2018, 2018.
Chandan, D. and Peltier, W. R.: African Humid Period precipitation sustained by robust vegetation, soil, and lake feedbacks, Geophys. Res. Lett. 47, e2020GL088728, https://doi.org/10.1029/2020GL088728, 2020.
Clark, C. O., Cole, J. E., and Webster, P. J.: Indian Ocean SST and Indian summer rainfall: predictive relationships and their decadal variability, J. Climate, 13, 4452–4452, https://doi.org/10.1175/1520-0442(2000)013<2503:IOSAIS>2.0.CO;2, 2000.
Claussen, M., Dallmeyer, A., and Bader, J.: Theory and modeling of the African humid period and the green Sahara, in: Oxford Research Encyclopedia of Climate Science, Oxford University Press, New York, https://doi.org/10.1093/acrefore/9780190228620.013.532, 2017.
Cosford, J., Qing, H., Eglington, B., Mattey, D., Yuan, D., Zhang, M., and Cheng, H.: East Asian monsoon variability since the mid-Holocene recorded in a high-resolution, absolute-dated aragonite speleothem from eastern China, Earth Planet. Sc. Lett., 275, 296–307, https://doi.org/10.1016/j.epsl.2008.08.018, 2008.
Cullen, J. L. and Prell, W. L.: Planktonic Foraminifera of the northern Indian Ocean: distribution and preservation in surface sediments, Mar. Micropaleontol., 9, 1–52, https://doi.org/10.1016/0377-8398(84)90022-7, 1984.
Dallmeyer, A., Claussen, M., Wang, Y., and Herzschuh, U.: Spatial variability of Holocene changes in the annual precipitation pattern: a model-data synthesis for the Asian monsoon region, Clim. Dynam., 40, 2919–2936, https://doi.org/10.1007/s00382-012-1550-6, 2013.
Ding, Y. H.: The variability of the Asian summer monsoon, J. Meteorol. Soc. Jpn., 85, 21–54, https://doi.org/10.2151/jmsj.85B.21, 2007.
Dong, J., Wang, Y., Cheng, H., Hardt, B., Edwards, R. L., Kong, X., Wu, J., Chen, S., Liu, D., Jiang, X., and Zhao, K.: A high-resolution stalagmite record of the Holocene East Asian monsoon from Mt Shennongjia, central China, Holocene, 20, 257–264, https://doi.org/10.1177/0959683609350393, 2010.
d'Orgeville, M., Peltier, W. R., Erler, A. R., and Gula, J.: Climate change impacts on Great Lakes Basin precipitation extremes, J. Geophys. Res., 119, 10 799–10 812, https://doi.org/10.1002/2014JD021855, 2014.
Dykoski, C. A., Revenaugh, J., Edwards, R. L., Cheng, H., Yuan, D., Cai, Y., Zhang, M., Lin, Y., Qing, J., An, Z., and Revenaugh, J.: A high-resolution, absolute-dated Holocene and deglacial Asian monsoon record from Dongge Cave, China, Earth Planet. Sc. Lett., 233, 71–86, https://doi.org/10.1016/j.epsl.2005.01.036, 2005.
Endo, N., Matsumoto, J., and Lwin T.: Trends in precipitation extremes over Southeast Asia, Sola, 5, 168–171, https://doi.org/10.2151/sola.2009-043, 2009.
Erler, A. R. and Peltier, W. R.: Projected Changes in Precipitation Extremes for Western Canada based on High-resolution Regional Climate Simulations, J. Climate, 29, 8841–8863, https://doi.org/10.1175/JCLI-D-15-0530.1, 2016.
Evan, A. T., Flamant, C., Gaetani, M., and Guichard, F.: The past, present and future of African dust, Nature, 531, 493–495, https://doi.org/10.1038/nature17149, 2016.
Gaye, B., Böll, A., Segschneider, J., Burdanowitz, N., Emeis, K.-C., Ramaswamy, V., Lahajnar, N., Lückge, A., and Rixen, T.: Glacial–interglacial changes and Holocene variations in Arabian Sea denitrification, Biogeosciences, 15, 507–527, https://doi.org/10.5194/bg-15-507-2018, 2018.
Gent, P. R., Danabasoglu, G., Donner, L. J., Holland, M. M, Hunke, E. C., Jayne, S. R., Lawrence, D. M., Neale, R. B., Rasch, P. J., Vertenstein, M., Worley, P. H., Yang, Z.-L., and Zhang, M.: The community climate system model version 4, J. Climate, 24, 4973–4991, https://doi.org/10.1175/2011JCLI4083.1, 2011.
Giannini, A. and Kaplan, A.: The role of aerosols and greenhouse gases in Sahel drought and recovery, Climatic Change, 152, 449–466, https://doi.org/10.1007/s10584-018-2341-9, 2019.
Govil, P. and Naidu, P. D.: Evaporation-precipitation changes in the eastern Arabian Sea for the last 68 ka: Implications on monsoon variability, Paleoceanography, 25, https://doi.org/10.1029/2008PA001687, 2010.
Grell, G. A. and Freitas, S. R.: A scale and aerosol aware stochastic convective parameterization for weather and air quality modeling, Atmos. Chem. Phys., 14, 5233–5250, https://doi.org/10.5194/acp-14-5233-2014, 2014.
Griffiths, M. L., Johnson, K. R., Pausata, F. S. R. White, J. C., Henderson, G. M., Wood, C. T., Yang, H., Ersek, V., Conrad, C., and Sekhon, N.: End of Green Sahara amplified mid- to late Holocene megadroughts in mainland Southeast Asia, Nat. Commun., 11, 4204, https://doi.org/10.1038/s41467-020-17927-6, 2020.
Gula, J. and Peltier, W. R.: Dynamical downscaling over the Great Lakes Basin of North America using the WRF regional climate model: The impact of the Great Lakes system on regional greenhouse warming, J. Climate, 25, 7723–7742, https://doi.org/10.1175/JCLI-D-11-00388.1, 2012.
Hargreaves, J. C., Annan, J. D., Ohgaito, R., Paul, A., and Abe-Ouchi, A.: Skill and reliability of climate model ensembles at the Last Glacial Maximum and mid-Holocene, Clim. Past, 9, 811–823, https://doi.org/10.5194/cp-9-811-2013, 2013.
Harrison, S. P. and Bartlein, P. J.: Records from the past, lessons for the future: what the palaeo-record implies about mechanisms of global change, in: The future of the world's climates, edited by: Henderson-Sellers, A. and McGuffie, K., Elsevier, Amsterdam, 403–436, https://doi.org/10.1016/B978-0-12-386917-3.00014-2, 2012.
Hély, C., Lézine, A.-M., and contributors, A.: Holocene changes in African vegetation: tradeoff between climate and water availability, Clim. Past, 10, 681–686, https://doi.org/10.5194/cp-10-681-2014, 2014.
Herzschuh, U.: Palaeo-moisture evolution in monsoonal Central Asia during the last 50.000 years, Quaternary Sci. Rev., 25, 163–178, https://doi.org/10.1016/j.quascirev.2005.02.006, 2006.
Herzschuh, U., Cao, X., Laepple, T., Dallmeyer, A., Telford, R. J., Ni, J., Chen, F., Kong, Z., Liu, G., Liu, K., Liu, X., Stebich, M., Tang, L., Tian, F., Wang, Y., Wischnewski, J., Xu, Q., Yan, S., Yang, Z., Yu, G., Zhang, Y., Zhao, Y., and Zheng Z.: Position and orientation of the westerly jet determined Holocene rainfall patterns in China, Nat. Commun., 10, 2376, https://doi.org/10.1038/s41467-019-09866-8, 2019.
Holmes, J. and Hoelzmann, P.: The late Pleistocene-Holocene African Humid Period as evident in lakes, Oxford University Press, Oxford, https://doi.org/10.1093/acrefore/9780190228620.013.531, 2017.
Hong, Y. and Lim, J. O. J.: The WRF single–moment 6–class microphysics scheme (WSM6), J. Korean Meteor. Soc., 42, 129–151, 2006.
Hu, C., Henderson, G. M., Huang, J., Xie, S., Sun, Y., and Johnson, K. R.: Quantification of Holocene Asian monsoon rainfall from spatially separated cave records, Earth Planet. Sc. Lett., 266, 221–232, https://doi.org/10.1016/j.epsl.2007.10.015, 2008.
Huang, X., Zhou, T., Dai, A., Li, H., Li, C., Chen, X., Lu, J., Von Storch, J.-S., and Wu, B.: South Asian summer monsoon projections constrained by the interdecadal Pacific oscillation, Sci. Adv., 6, eaay6546, https://doi.org/10.1126/sciadv.aay6546, 2020.
Huo, Y. and Peltier, W. R.: Dynamically Downscaled Climate Simulations of the Indian Monsoon in the Instrumental Era: Physics Parameterization Impacts and Precipitation Extremes, J. Appl. Meteorol. Clim., 58, 831–852, https://doi.org/10.1175/JAMC-D-18-0226.1, 2019.
Huo, Y. and Peltier, W. R.: Dynamically Downscaled Climate Change Projections for the South Asian Monsoon: Mean and Extreme Precipitation Changes and Physics Parameterization Impacts, J. Climate, 33, 2311–2331, https://doi.org/10.1175/JCLI-D-19-0268.1, 2020.
Huo, Y. and Peltier, W. R.: The Southeast Asian Monsoon: Dynamically Downscaled Climate Change Projections and High Resolution Regional Ocean Modelling on the Effects of the Tibetan Plateau, Clim. Dynam., 56, 2597–2616, https://doi.org/10.1007/s00382-020-05604-9, 2021.
Hutson, W. H. and Prell, W. L.: A paleoecologic al transfer function, FI-2, for Indian Ocean planktonic foraminifera, J. Paleontol., 54, 381–399, available at: https://www.jstor.org/stable/1304070 (last access: 1 August 2021), 1980.
Jalihal, C., Srinivasan, J., and Chakraborty, A.: Modulation of Indian monsoon by water vapor and cloud feedback over the past 22,000 years, Nat. Commun., 10, 5701, https://doi.org/10.1038/s41467-019-13754-6, 2019.
Janjic, Z. I.: The Step–Mountain Eta Coordinate Model: Further developments of the convection, viscous sublayer, and turbulence closure schemes, Mon. Weather Rev., 122, 927–945, https://doi.org/10.1175/1520-0493(1994)122<0927:TSMECM>2.0.CO;2, 1994.
Jiang, D., Lang, X., Tian, Z., and Ju, L.: Mid-Holocene East Asian summer monsoon strengthening: insights from Paleoclimate Modeling Intercomparison Project (PMIP) simulations, Paleogeog. Paleoclimatol. Paleoecol., 369, 422–429, https://doi.org/10.1016/j.palaeo.2012.11.007, 2013.
Kain, J. S.: The Kain–Fritsch convective parameterization: An update, J. Appl. Meteorol., 43, 170–181, https://doi.org/10.1175/1520-0450(2004)043<0170:TKCPAU>2.0.CO;2, 2004.
Kutzbach, J. E.: The changing pulse of the Monsoon, in: Monsoon, edited by: Fein, J. S. and Stephens, P. L., John Wiley, New York, 247–268, 1987.
Kutzbach, J. E. and Guetter, P.: The influence of changing orbital parameters and surface boundary conditions on climate simulations for the past 18 000 years, J. Atmos. Sci., 43, 1726–1759, https://doi.org/10.1175/1520-0469(1986)043<1726:TIOCOP>2.0.CO;2, 1986.
Kutzbach, J. E. and Gallimore, R. G.: Sensitivity of a coupled atmosphere/mixed layer ocean model to changes in orbital forcing at 9000 years B. P., J. Geophys. Res., 93, 803–821, https://doi.org/10.1029/JD093iD01p00803, 1988.
Kutzbach, J. E. and Otto-Bliesner, B. I.: The sensitivity of theAfrican–Asian monsoonal climate to orbital parameter changesfor 9000 yr B. P. in a low-resolution general circulation model, J. Atmos. Sci., 39, 1177–1188, https://doi.org/10.1175/1520-0469(1982)039<1177:TSOTAA>2.0.CO;2, 1982.
Kutzbach, J. E. and Street-Perrott, F. A.: Milankovitch forcing of fluc-tuations in the level f tropical lakes from 18 to 0 kyr BP, Nature, 317, 130–140, https://doi.org/10.1038/317130a0, 1985.
Kutzbach, J. E., Harrison, S. P., and Coe, M. T.: Land-Ocean-Atmosphere Interactions and Monsoon Climate Change: A Paleo-Perspective, in: Global Biogeochemical Cycles in the Climate System, edited by: Schulze, E. D., Heimann, M., Harrison, S. P., Holland, E., Lloyd, J., Prentice, I. C., and Schimel, D., Academic Press, San Diego, London, 73–83, https://doi.org/10.1016/B978-012631260-7/50008-X, 2001.
Laskar, J., Robutel, P., Joutel, F., Gastineau, M., Correia, A. C. M., and Levrard, B.: A long-term numerical solution for the insolation quantities of the Earth, Astron. Astrophys., 428, 261–285, https://doi.org/10.1051/0004-6361:20041335, 2004.
Liu, Z., Wen, X., Brady, E. C., Otto-Bliesner, B., Yu, G., Lu, H., Cheng, H., Wang, Y., Zheng, W., Ding, Y., Edwards, R. L., Cheng, J., Liu, W., and Yang, H.: Chinese cave records and the East Asia Summer Monsoon, Quaternary Sci. Rev., 83, 115–128, https://doi.org/10.1016/j.quascirev.2013.10.021, 2014.
Maher, B. A.: Holocene variability of the East Asian summer monsoon from Chinese cave records: a re-assessment, Holocene, 18, 861–866, https://doi.org/10.1177/0959683608095569, 2008.
Mishra, A. K., Nagaraju, V., Rafiq, M., and Chandra, S.: Evidence of links between regional climate change and precipitation extremes over India, Weather, 74, 281–221, https://doi.org/10.1002/WEA.3259, 2018.
Otto-Bliesner, B. L., Braconnot, P., Harrison, S. P., Lunt, D. J., Abe-Ouchi, A., Albani, S., Bartlein, P. J., Capron, E., Carlson, A. E., Dutton, A., Fischer, H., Goelzer, H., Govin, A., Haywood, A., Joos, F., LeGrande, A. N., Lipscomb, W. H., Lohmann, G., Mahowald, N., Nehrbass-Ahles, C., Pausata, F. S. R., Peterschmitt, J.-Y., Phipps, S. J., Renssen, H., and Zhang, Q.: The PMIP4 contribution to CMIP6 – Part 2: Two interglacials, scientific objective and experimental design for Holocene and Last Interglacial simulations, Geosci. Model Dev., 10, 3979–4003, https://doi.org/10.5194/gmd-10-3979-2017, 2017.
Pausata, F. S. R., Emanuel, K. A., Chiacchio, M., Diro, G. T., Zhang, Q., Sushama, L., Stager, J. C., and Donnelly, J. P.: Tropical cyclone activity enhanced by Sahara greening and reduced dust emissions during the African Humid Period, P. Natl. Acad. Sci. USA, 114, 6221–6226, https://doi.org/10.1073/pnas.1619111114, 2017a.
Pausata, F. S. R., Zhang, Q., Muschitiello, F., Lu, Z., Chafik, L., Niedermeyer, E. M., Stager, J. C., Cobb, K. M., and Liu, Z.: Greening of the Sahara suppressed ENSO activity during the mid-Holocene, Nat. Commun., 8, 16020, https://doi.org/10.1038/ncomms16020, 2017b.
Pausata, F. S. R., Gaetani, M., Messori, G., Berg, A., Maia de Souza, D., Sage, R. F., and deMenocal, P. B.: The Greening of the Sahara: Past Changes and Future Implications, One Earth, 2, 235–250, https://doi.org/10.1016/j.oneear.2020.03.002, 2020.
Peltier, W. R., d'Orgeville, M., Erler, A. R., and Xie, F.: Uncertainty in Future Summer Precipitation in the Laurentian Great Lakes Basin: Dynamical Downscaling and the Influence of Continental Scale Processes on Regional Climate Change, J. Climate, 31, 2651–2673, https://doi.org/10.1175/JCLI-D-17-0416.1, 2018.
Peltier, W. R. and Vettoretti, G.: Dansgaard-Oeschger oscillations predicted in a comprehensive model of glacial climate: A “kicked” salt oscillator in the Atlantic, Geophys. Res. Lett., 41, 7306–7313, https://doi.org/10.1002/2014GL061413, 2014.
Piao, J., Chen, W., Wang, L., Pausata, F. S., and Zhang, Q.: Northward extension of the east Asian summer monsoon during the mid-Holocene. Global Planet. Change, 184, 103046, https://doi.org/10.1016/j.gloplacha.2019.103046, 2020.
Polanski, S., Rinke, A., Dethloff, K., Lorenz, S. J., Wang, Y., and Herzschuh, U.: Simulation and comparison between mid-Holocene and preindustrial Indian summer monsoon circulation using a regional climate model, The Open Atmospheric Science Journal, 6, 42–48, https://doi.org/10.2174/1874282301206010042, 2012.
Porter, S. C.: Chinese loess record of monsoon climate during the last glacial–interglacial cycle, Earth-Sci. Rev., 54, 115–128, https://doi.org/10.1016/S0012-8252(01)00043-5, 2001.
Prell, W. L.: Monsoonal climate of the Arabian Sea during the Late Quaternary: a response to changing solar radiation, in: Milankovitch and Climate, edited by: Berger, A. L., Imbrie, J., Hays, J., Kukla, G., and Saltzman, B., D. Reidel, Hingham, Massachusetts, 349–366, 1984a.
Prell, W. L.: Variation of monsoonal upwelling: a response to changing solar radiation, in: Climate Processes and Climate Sensitivity, edited by: Hansen, J. and Takahashi, T., AGU, Washington, D.C., 48–57, https://doi.org/10.1029/GM029p0048, 1984b.
Prell, W. L. and Kutzbach, J. E.: Monsoon variability over the past 150000 years, J. Geophys. Res., 82, 8411–8425, https://doi.org/10.1029/JD092iD07p08411, 1987.
Prell, W. L. and Van Campo, E.: Coherent response of Arabian Sea upwelling and pollen transport to late Quaternary monsoonal winds, Nature, 323, 526–528, https://doi.org/10.1038/323526a0, 1986.
Saraswat, R., Lea, D. W., Nigam, R., Mackensen, A., and Naik, D. K.: Deglaciation in the tropical Indian Ocean driven by interplay between the regional monsoon and global teleconnections, Earth Planet. Sc. Lett., 375, 166–175, https://doi.org/10.1016/j.epsl.2013.05.022, 2013.
Skamarock, W. C. and Klemp, J. B.: A time-split nonhydrostatic atmospheric model for weather research and forecasting applications, J. Comput. Phys., 227, 3465–3485, https://doi.org/10.1016/j.jcp.2007.01.037, 2008.
Sun, W., Wang, B., Zhang, Q., Pausata, F. S. R., Chen, D., Lu, G., Yan, M., Ning, L., and Liu, J.: Northern Hemisphere Land Monsoon Precipitation Increased by the Green Sahara During Middle Holocene, Geophys. Res. Lett., 46, 9870–9879, https://doi.org/10.1029/2019GL082116, 2019.
Swann, A. L. S., Fung, I. Y., Liu, Y., and Chiang, J. C. H.: Remote Vegetation Feedbacks and the Mid-Holocene Green Sahara, J. Climate, 27, 4857–4870, https://doi.org/10.1175/JCLI-D-13-00690.1, 2014.
Tabor, C., Otto-Bliesner, B., and Liu, Z.: Speleothems of South Americanand Asian monsoons influenced by a Green Sahara, Geophys. Res. Lett., 47, e2020GL089695, https://doi.org/10.1029/2020GL089695, 2020.
Tarasov, P. E., Webb III, T., Andreev, A. A., Afanas'eva, N. B., Berezina, N. A., Bezusko, L. G., Blyakharchuk, T. A., Bolikhovskaya, N. S., Cheddadi, R., Chernavskaya, M. M., Chernova, G. M., Dorofeyuk, N. I., Dirksen, V. G., Elina, G. A., Filimonova, L. V., Glebov, F. Z., Guiot, J., Gunova, V. S., Harrison, S. P., Jolly, D., Khomutova, V. I., Kvavadze, E. V., Osipova, I. M., Panova, N. K., Prentice, I. C., Saarse, L., Sevastyanov, D. V., Volkova, V. S., and Zernitskaya, V. P.: Present-day and mid-Holocene biomes reconstructed from pollen and plant macrofossil data from the former Soviet Union and Mongolia, J. Biogeogr., 25, 1029–1053, https://doi.org/10.1046/j.1365-2699.1998.00236.x, 1998.
Thompson, L. G., Yao, T., Mosley-Thompson, E., Davis, M. E., Henderson, K. A., and Lin, P.-N.: A high-resolution millennial record of the South Asian monsoon from Himalayan ice cores, Science, 289, 1916–1919, https://doi.org/10.1126/science.289.5486.1916, 2000.
Tiedtke, M.: A comprehensive mass flux scheme for cumulus parameterization in large–scale models, Mon. Weather Rev., 117, 1779–1800, https://doi.org/10.1175/1520-0493(1989)117<1779:ACMFSF>2.0.CO;2, 1989.
Turner, A. G. and Annamalai, H.: Climate change and the South Asian summer monsoon, Nat. Clim. Change, 2, 587–595, https://doi.org/10.1038/nclimate1495, 2012.
Valcke, S.: The OASIS3 coupler: a European climate modelling community software, Geosci. Model Dev., 6, 373–388, https://doi.org/10.5194/gmd-6-373-2013, 2013.
Wang, Y.-J., Cheng, H., Edwards, R. L., An, Z. S., Wu, J. Y., Shen, C.-C., and Dorale, J. A.: A high-resolution absolute-dated late Pleistocene monsoon record from Hulu Cave, China, Science, 294, 2345–2348, https://doi.org/10.1126/science.1064618, 2001.
Wang, Y., Liu, X., and Herzschuh, U.: Asynchronous evolution of the Indian and East Asian Summer Monsoon indicated by Holocene moisture pattern in monsoonal central Asia, Earth-Science Rev., 103, 135–153, https://doi.org/10.1016/j.earscirev.2010.09.004, 2010.
Webster, P. J., Magaňa, V. O., Palmer, T. N., Shukla, J., Tomas, R. A., Yanai, M., and Yasunari, T.: Monsoons: processes, predictability, and the prospects for prediction, J. Geophys. Res., 103, 14451–14510, https://doi.org/10.1029/97JC02719, 1998.
Wu, G. X., Liu, Y. M., Wang, T. M., Wan, R., Liu, X., Li, W., Wang, Z., Zhang, Q., Duan, A., and Liang, X.: The influence of the mechanical and thermal forcing of the Tibetan plateau on the Asian climate, J. Hydrometeorol., 8, 770–789, https://doi.org/10.1175/JHM609.1, 2007.
Zhang, M. L., Yuan, D. X., Lin, Y. S., Qin, J. M., Bin, L., Cheng, H., and Edwards, R. L.: A 6000-year high-resolution climatic record from a stalagmite in Xiangshui Cave, Guilin, China, Holocene, 14, 697–702, https://doi.org/10.1191/0959683604hl748rp, 2004.
Zhang, W., Ming, Q., Shi, Z., Chen, G., Niu, J., Lei, G., Chang, F., and Zhang, H.: Lake Sediment Records on Climate Change and Human Activities in the Xingyun Lake Catchment, SW China, PLoS One, 9, e102167, https://doi.org/10.1371/journal.pone.0102167, 2014.
Zhao, Y. and Harrison, S. P.: Mid-Holocene monsoons: a multi-model analysis of the inter-hemispheric differences in the responses to orbital forcing and ocean feedbacks, Clim. Dynam., 39, 1457–1487, https://doi.org/10.1007/s00382-011-1193-z, 2012.
- Abstract
- Introduction
- Model descriptions and experimental design
- Results and discussion
- Conclusions
- Appendix A: Sensitivity to cumulus parameterization schemes
- Code and data availability
- Author contributions
- Competing interests
- Disclaimer
- Acknowledgements
- Financial support
- Review statement
- References