the Creative Commons Attribution 4.0 License.
the Creative Commons Attribution 4.0 License.
 | 03 Aug 2021
CH4 and N2O fluctuations during the penultimate deglaciation
Loïc Schmidely
Christoph Nehrbass-Ahles
Jochen Schmitt
Juhyeong Han
Lucas Silva
Jinwha Shin
Fortunat Joos
Jérôme Chappellaz
Hubertus Fischer
Thomas F. Stocker
Deglaciations are characterized by the largest natural changes in methane (CH4) and nitrous oxide (N2O) concentrations of the past 800 000 years. Reconstructions of millennial- to centennial-scale variability within these periods are mostly restricted to the last deglaciation. In this study, we present composite records of CH4 and N2O concentrations from the EPICA Dome C ice core covering the penultimate deglaciation at temporal resolutions of ∼100 years. Our data permit the identification of centennial-scale fluctuations during the transition from glacial to interglacial levels. At ∼134 000 and ∼129 000 years before present (hereafter ka), both CH4 and N2O increased on centennial timescales. These abrupt rises are similar to the fluctuations associated with the Dansgaard–Oeschger events identified in the last glacial period. In addition, gradually rising N2O levels at ∼130 ka resemble a pattern of increasing N2O concentrations on millennial timescales characterizing the later part of Heinrich stadials. Overall, the events in CH4 and N2O during the penultimate deglaciation exhibit modes of variability that are also found during the last deglaciation and glacial cycle, suggesting that the processes leading to changes in emission during the transitions were similar but their timing differed.
- Article
(3327 KB) - Full-text XML
- BibTeX
- EndNote


Methane (CH4) and nitrous oxide (N2O) are currently the second- and third-most potent well-mixed anthropogenic greenhouse gases after carbon dioxide (CO2) (Myhre et al., 2013). The impact of these trace gases on the Earth's radiative balance in the future depends on the sensitivity of natural sources to anthropogenic warming. Time periods of climate change in the past provide natural templates to study this coupling (Fischer et al., 2018). Reconstructions of greenhouse gas concentrations before the instrumental era are only enabled by analysing the composition of air trapped in tiny bubbles in polar ice cores, reflecting the atmospheric composition at the time the bubbles were formed. Ice core records of CH4 and N2O concentrations combined with temperature reconstructions revealed the natural variability of these gases and their coupling to climate change during the glacial cycles of the past 800 000 years. The overall increase in concentrations accompanying deglaciations represents the largest recurring changes (Spahni et al., 2005; Loulergue et al., 2008; Schilt et al., 2010a). Records spanning the last deglaciation (Termination I (TI), 18 000–11 000 years before present (hereafter ka), where present is defined as 1950 Common Era) showed that this overall increase appears as a sequence of millennial and centennial fluctuations superimposed, for CH4, on longer-term, gradually rising concentrations (Marcott et al., 2014; Rhodes et al., 2015). Records resolving short-term fluctuations within deglaciations are limited to TI, owing to the availability of multiple high-accumulation ice cores.
The aim of this study is to produce a high-resolution deglacial record for the penultimate deglaciation (Termination II (TII), 140–128 ka). We present CH4 and N2O composite datasets from the EPICA Dome C (EDC) ice core including 150 new measurements covering the time interval 145–125 ka, combined with the published data of Loulergue et al. (2008) and Schilt et al. (2010a). We increased the sampling resolution of the aforementioned records by a factor ∼3.5 and ∼5 to obtain mean resolutions of 100 and 115 years for CH4 and N2O, respectively. These values are on the order of the mean width of the gas age distribution (GAD) for the EDC ice core in the interval 145–125 ka. This width is estimated to range between ∼110–220 years using the approach of Nehrbass-Ahles et al. (2020), where the width is defined as the arithmetic mean of the distribution, and ∼50–130 years using the approach of Epifanio et al. (2020), where the width is defined as the spectral width of the distribution. In addition, we also present seven N2O isotopic measurements (δ15N (N2O) and δ18O (N2O)), used to assess the integrity of the data with respect to in situ formation of N2O.
CH4 and N2O fluctuations observed during TI belong to recurrent modes of variability. The most studied of these modes characterizes the climate transitions from stadials to interstadials and is most notably exemplified by the transitions associated with the Dansgaard–Oeschger (DO) events of the last glacial period as well as by the transitions to the Bølling–Allerød and the Holocene during TI. This DO-type mode of variability is characterized by abrupt increases in CH4 concentrations (∼50–260 ppb in a few centuries), approximately synchronous with the onsets of interstadial Greenland warming by a few decades (Baumgartner et al., 2014; Rosen et al., 2014), while N2O concentrations exhibit concomitant increases reaching up to ∼60 ppb, taking more than a century to stabilize because of their longer atmospheric lifetime (Flückiger et al., 2004; Schilt et al., 2010a, 2013). In addition, N2O concentrations gradually increase in the later part of Heinrich stadials (HSs), extended stadials defined by the occurrence of massive iceberg discharges through the Hudson Strait into the North Atlantic (Hemming, 2004), starting centuries to millennia before interstadial Greenland temperature and CH4 rises (Schilt et al., 2013). This late HS-type mode of N2O variability characterized the HS during both the last deglaciation (Fischer et al., 2019; Schilt et al., 2014) as well as the last glacial period (Schilt et al., 2013). A second mode of CH4 variability has been identified during HSs of the last glacial and deglaciation. This HS-type mode of CH4 variability consists of intermittent CH4 peaks displaying amplitudes of 32–53 ppb and characteristic timescales of 90–190 years, sometimes followed (HS4 and HS5) by elevated background concentrations relative to before the event (Rhodes et al., 2015).
DO-type and HS-type CH4 fluctuations are likely driven by changes in tropical wetland emissions (Rhodes et al., 2015; Bock et al., 2017), where CH4 is produced by the decomposition of organic matter under anaerobic conditions. Changes in geologic and pyrogenic emissions as well as changes in the sink strength play only a minor role (Dyonisius et al., 2020; Bock et al., 2010, 2017; Levine et al., 2012; Hopcroft et al., 2017). Wetland emissions are controlled by climate (precipitation, temperature, and atmospheric CO2 concentration), modulating wetland extent, emission rates, and ecosystem composition (Van Groenigen et al., 2011; Melton et al., 2013; Bloom et al., 2010). Changes in tropical wetland emissions during DO-type fluctuations are linked to the strengthening of monsoonal precipitation in the Northern Hemisphere (NH) tropics, enhancing wetland emission rates (Bock et al., 2017). Increased NH tropical precipitation is associated with northward shifts of the Intertropical Convergence Zone (ITCZ) in response to changes in heat distribution by the Atlantic Meridional Overturning Circulation (AMOC) (Broccoli et al., 2006; Alley, 2007). On the other hand, HS-type CH4 fluctuations are hypothesized to result from large iceberg discharges, associated with a southward shift of the ITCZ, leading to an intensification of monsoonal precipitation in the Southern Hemisphere (SH) tropics, ultimately producing an increase in wetland emissions (Rhodes et al., 2015).
DO-type N2O variability is likely driven by changes in emission from the terrestrial and marine biospheres, where N2O is emitted as a by-product of nitrification and an intermediate product of denitrification (Joos et al., 2019, 2020; Fischer et al., 2019; Schilt et al., 2014). Terrestrial emissions are controlled by climate (precipitation, temperature, and atmospheric CO2 concentration) and available land area (Joos et al., 2020; Van Groenigen et al., 2011). During TI, the response of terrestrial N2O emissions for DO-type fluctuations is believed to result from temperature and precipitation changes (Joos et al., 2020) and appeared in phase with Greenland warming with the transition period lasting a maximum of ∼200 years (Fischer et al., 2019). Marine emissions are linked to the strength of the AMOC, modulating oxygen concentrations in the upper ocean and the amount of available organic matter at depth. For DO-type fluctuations, marine emissions are believed to be stimulated mainly by deoxygenation in the upper ocean as a consequence of the reinvigoration of the AMOC (Joos et al., 2019). Finally, the late HS-type N2O increase during TI is thought to be driven exclusively by marine emissions (Fischer et al., 2019; Schilt et al., 2014), possibly resulting from a long-term reorganization of the nitrate and oxygen inventories following the preceding AMOC collapse (Schmittner and Galbraith, 2008).
The results presented in this study are derived from two different instruments. The δ15N (N2O) and δ18O (N2O) data were measured with the device described in Schmitt et al. (2014), combining continuous extraction under vacuum with gas chromatography (GC) and isotope ratio mass spectrometry.
CH4 and N2O measurements were performed with a completely revised analytical system, firstly employed during this study (comprehensive description in Appendix A). The new apparatus uses continuous extraction under vacuum, comparable to the approach of Schmitt et al. (2014) or Oyabu et al. (2020), combined with GC techniques to determine CH4 and N2O mole fractions in air extracted from small (∼20 g) ice samples with a sample throughput of five to six samples per day. The instrument is equipped with a thermal conductivity detector, a flame-ionization detector, and an electron-capture detector for the quantification of air, CH4, and N2O, respectively. The results are referenced to the World Meteorological Organisation mole fraction scales: the WMOX2004A scale (CH4) and NOAA-2006A (N2O) (Dlugokencky et al., 2005; Hall et al., 2007) using three standard gases bracketing the glacial–interglacial range of CH4 (358.88 ± 0.16 ppb, 838.59 ± 0.28 ppb, and 1729.30 ± 0.34 ppb) and N2O concentrations (187.10 ± 0.12 ppb, 194.13 ± 0.12 ppb, and 300.20 ± 0.12 ppb). The uncertainty of the measurements derived from the revised instrument amounts to 7 (CH4) and 6 ppb (N2O).
Our centennial-scale records show the progressions of the overall ∼390 and ∼60 ppb increase in CH4 and N2O concentration (Fig. 1), respectively, from the end of the Penultimate Glacial Maximum (PGM) to the beginning of the Last Interglacial (LIG). Our CH4 data identify an outstanding value at ∼140 ka in the dataset by Loulergue et al. (2008), ∼80 ppb higher than adjacent samples (Fig. 1). The N2O data appear substantially more scattered in the early part of the record, especially around the PGM (∼145–140 ka). This scatter tends to decrease with younger ages. The spikes appear in the interval where the isotopic composition of N2O becomes enriched in δ15N (N2O) (up to 21 ‰) and depleted in δ18O (N2O) (down to 41 ‰), compared to the relatively steady values in the ranges ∼11–14 ‰ and ∼45–47 ‰, respectively, observed for 125–136 ka (Fig. 1).
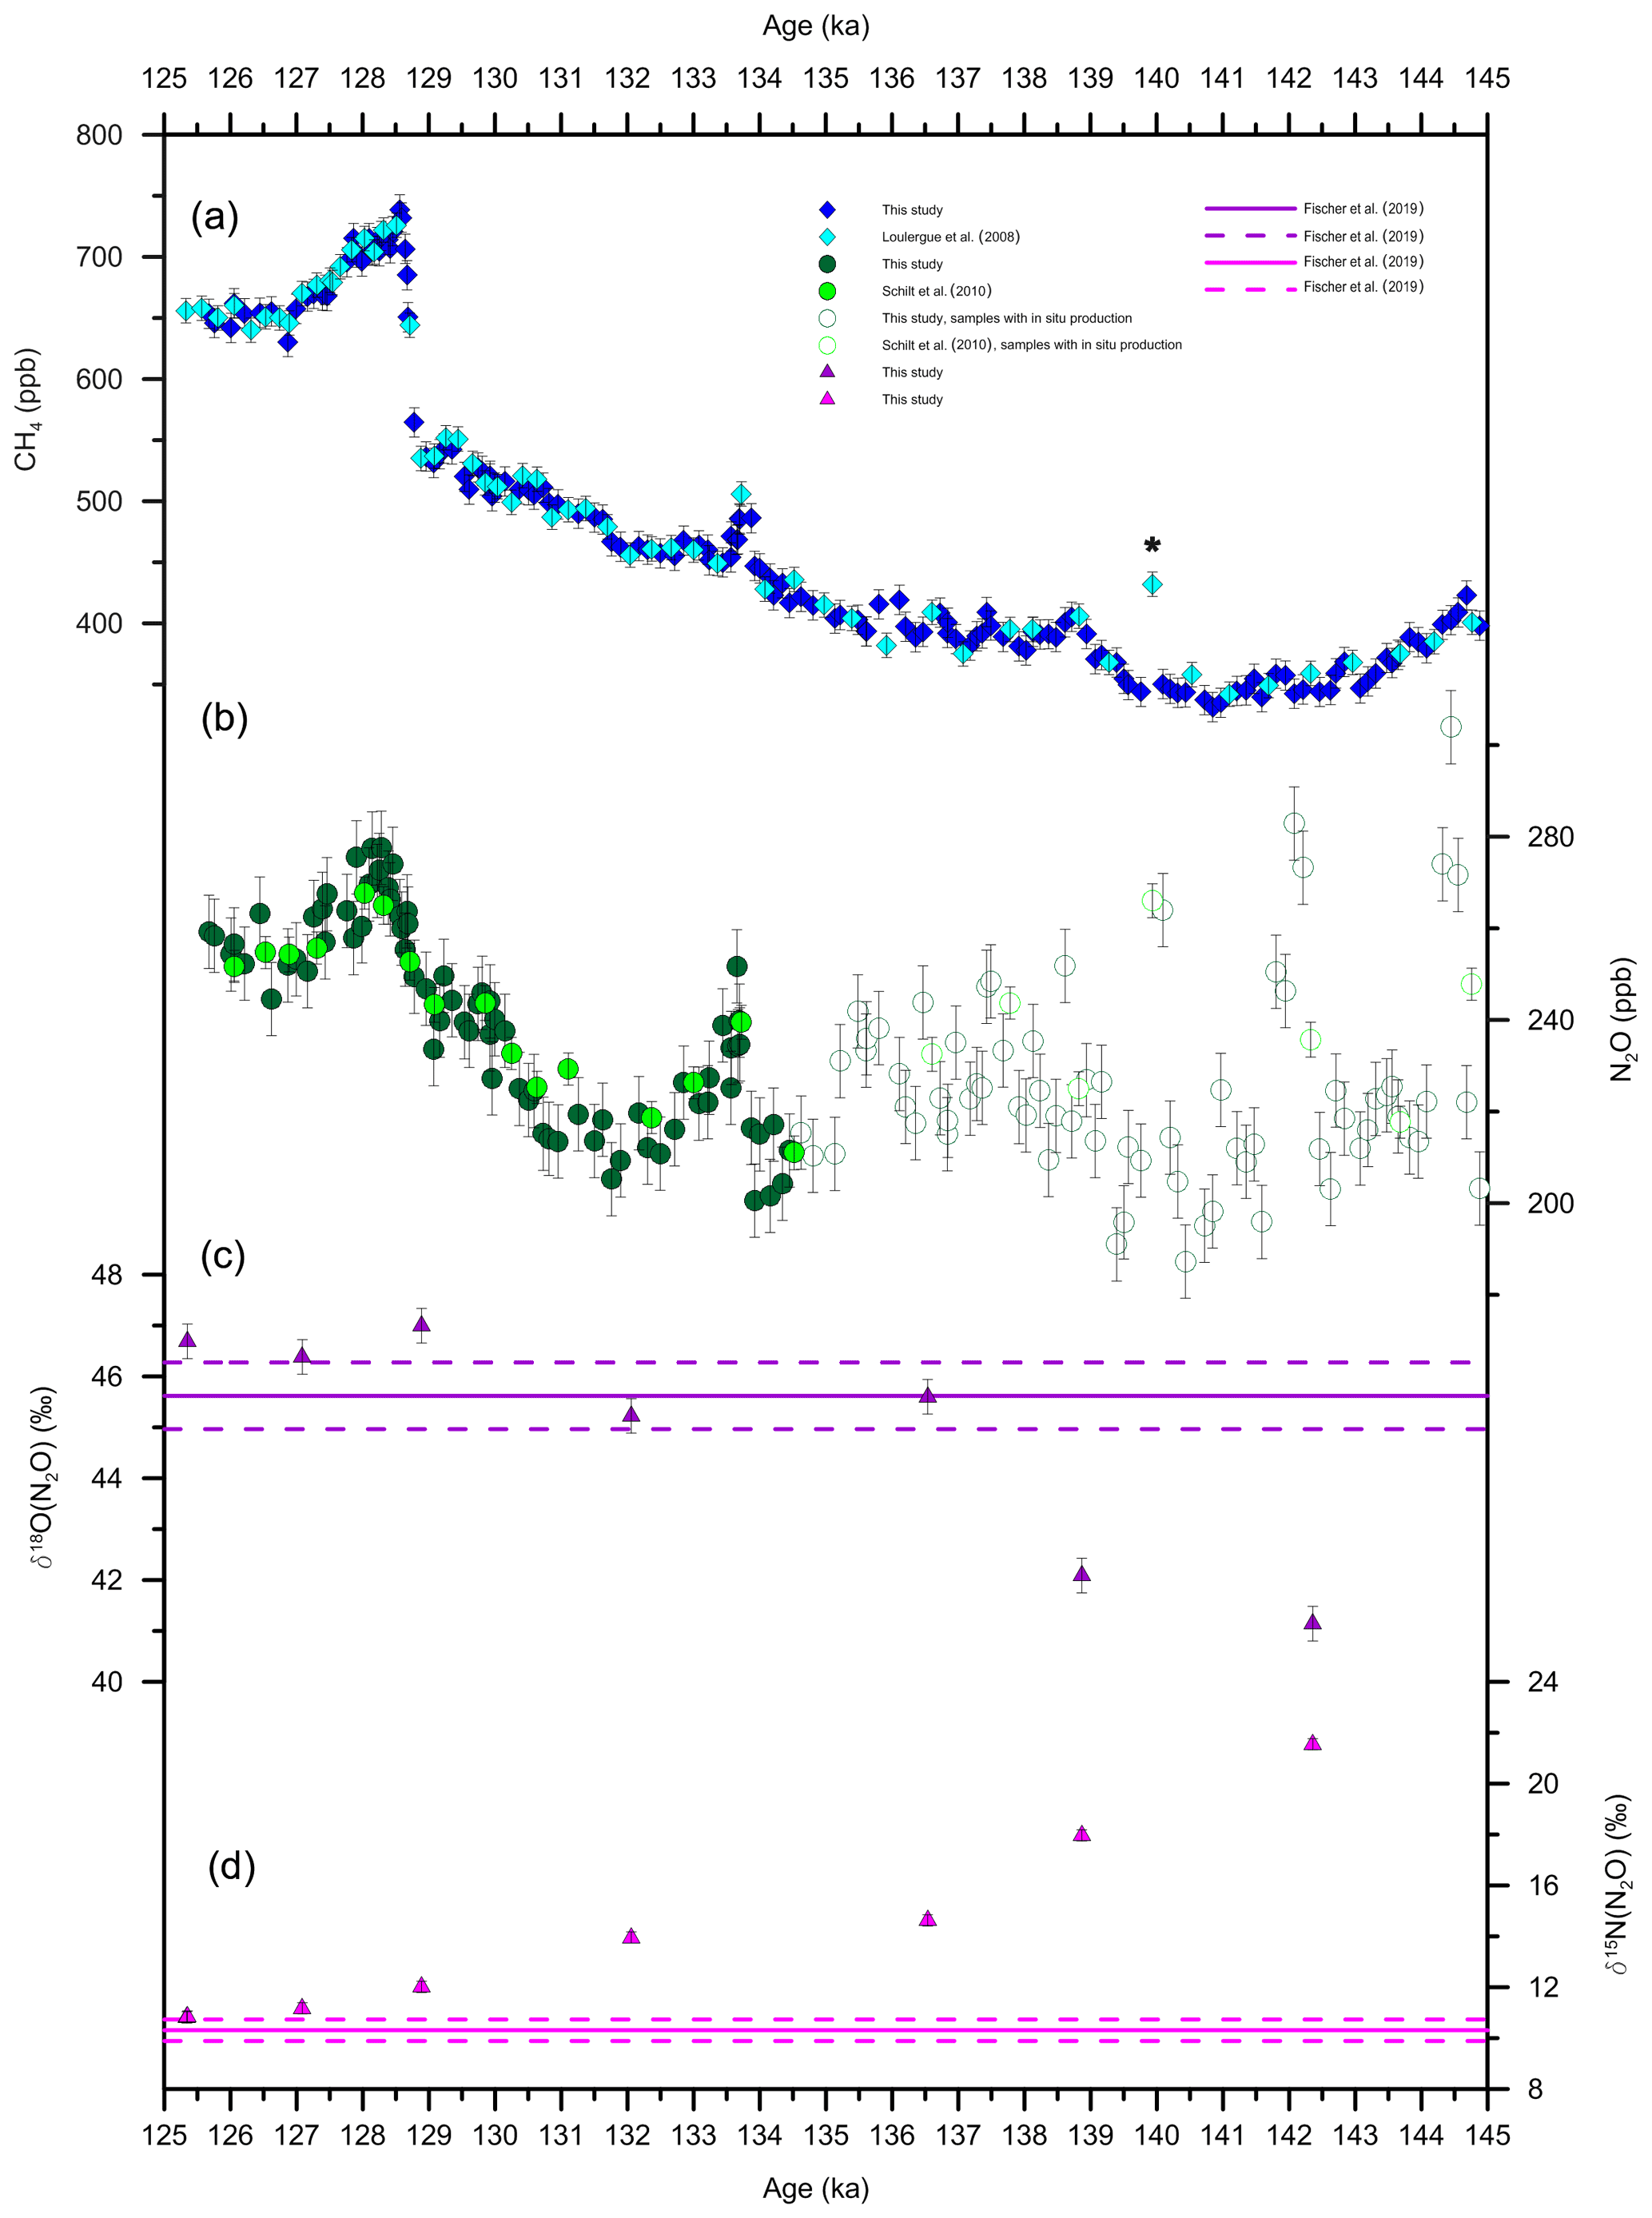
Figure 1CH4, N2O, δ18O (N2O), and δ15N (N2O) records from the EDC ice core on the AICC2012 timescale (Bazin et al., 2013). The vertical bars represent the uncertainty of the measurements. (a) Composite CH4 record with published data (light blue, Loulergue et al., 2008) and new measurements (this study, dark blue) after offset correction. The asterisk indicates the data point regarded as an outlier. (b) Composite N2O record with published data (light green, Schilt et al., 2010a) and new measurements (this study, dark green) after offset correction. The empty symbols illustrate the data points considered affected by in situ production. (c) δ18O (N2O) record. For comparison, the average (solid line) and standard deviation (dashed line, 1σ) of δ18O (N2O) over TI are included (Fischer et al., 2019). (d) δ15N (N2O) record. For comparison, the average (solid line) and standard deviation (dashed line, 1σ) of δ15N (N2O) over TI are included (Fischer et al., 2019).
Our records display several fluctuations standing out in the overall evolution of the CH4 and N2O concentrations. For CH4, these events are identified based on their high rates of change (>10 ppb per century, Table 1). CH4 rises on centennial timescales at ∼134 and ∼129 ka. At ∼134 ka, concentrations increased by ∼70 ppb in ∼200 years before declining by ∼60 ppb in ∼400 years. The 129 ka event consists of a ∼200 ppb increase proceeding in ∼300 years.
Table 1Characteristics of the events observed at ∼134, ∼129, and ∼130 ka. The indications “up” and “down” in the first column refer to the ascending and descending limbs of the 134 ka event, respectively. The columns “start” and “end” indicate the starting and end points of the events (rounded to the hundred). The columns Cinitial and Cfinal indicate the concentrations (rounded to the 10) in the years preceding and following the events, respectively. The rates of change are average values over the time period comprised between the start and end points of the events. Rates of change are calculated from spline approximations (cut-off period: 200 years) computed according to Enting (1987) with the same routine as Beck et al. (2018).
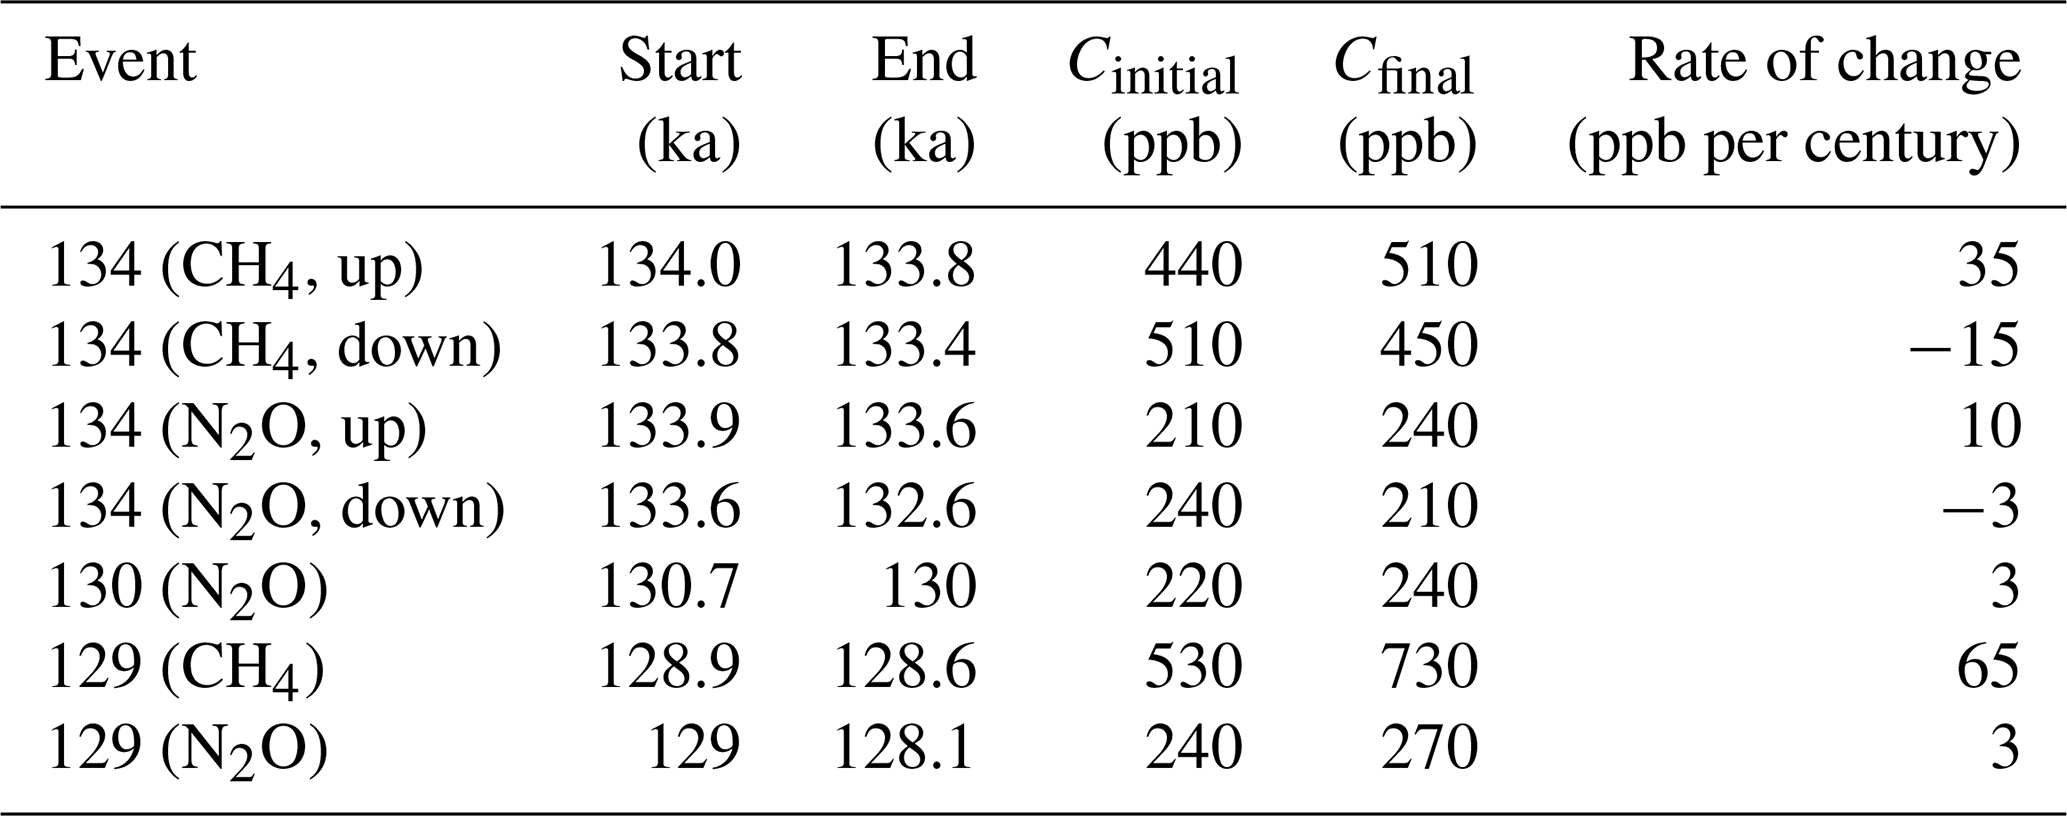
The evolution of N2O concentrations alternates between periods of plateaus and well-marked fluctuations. Similar to CH4, a feature is resolved at ∼134 ka where concentrations increased by ∼30 ppb in ∼300 years before declining to previous levels in ∼1000 years. The 129 ka event is also imprinted in our N2O record and is characterized by a ∼30 ppb rise in ∼900 years. In addition, an increase is identified at ∼130 ka, where concentrations rose by ∼20 ppb in ∼700 years. The 130 and 129 ka events are separated by a plateau that lasted ∼1000 years.
Overall, the improved resolution of our records allowed us to identify features not resolved in the previously published CH4 and N2O EDC datasets. In particular, the 134 ka event and the 130 ka event in N2O are resolved for the first time. Retrieving CH4 and N2O concentrations from the same samples enables us to study the relative phasing of both trace gases in the course of these events without age uncertainty. At the onset of the 134 and 129 ka events, the rise in both trace gases occurs simultaneously. In contrast, the 130 ka event in the N2O record is not accompanied by a concomitant fluctuation in CH4 concentrations.
4.1 Non-atmospheric CH4 and N2O variability
Interpreting our records in terms of atmospheric variability requires a closer inspection of the extreme values observed in the CH4 and N2O records.
The CH4 data point at ∼140 ka, previously published by Loulergue et al. (2008), is measured in the section characterized by the widest GAD in our record. For the time interval 141–139 ka, the width of the GAD is on the order of ∼220 years, using the approach of Nehrbass-Ahles et al. (2020), or ∼120 years using the approach of Epifanio et al. (2020). At ∼140 ka, the adjacent data points are ∼160 years older and ∼170 years younger than the data point in question. Consequently, it appears unlikely that such an abrupt fluctuation in the ice core record represents an atmospheric signal. Spurious peaks could potentially result from layered bubble trapping (Rhodes et al., 2016; Fourteau et al., 2017, 2020). However, this outlier is measured in a period of otherwise stable CH4 concentrations, where neither early nor late pore closures are expected to generate an anomaly (Rhodes et al., 2016; Fourteau et al., 2017). Secondly, similarly high concentrations are not observed in our record before the 134 ka event. Such an age anomaly (between the layers enclosing gas of abnormal age and the layers enclosing gas of the expected age) would be unrealistically high compared to the characteristic age anomalies reported by Fourteau et al. (2017) for the Vostok ice core (∼200 years). Accordingly, we regard this CH4 data point as an outlier.
The large variability observed in adjacent data points during the early part of the N2O record (Fig. 1) is unlikely to reflect atmospheric fluctuations given its atmospheric lifetime of 116 ± 9 years (Prather et al., 2015). Elevated concentrations and disproportionately high N2O variability have been observed in many instances for ice samples rich in mineral dust in both Antarctic and Greenland ice cores and are attributed to in situ production (Flückiger et al., 1999; Sowers, 2001; Flückiger et al., 2004; Spahni et al., 2005; Schilt et al., 2010a, 2013; Fischer et al., 2019). Measurements in the Vostok ice core by Sowers (2001) demonstrated this excess N2O production to have a strong imprint in both δ15N (N2O) and δ18O (N2O) records. For some of our EDC samples we observe the same systematic isotopic deviations as for the Vostok samples of that period, with δ15N (N2O) and δ18O (N2O) values that are more enriched and depleted, respectively, than typical atmospheric values. The coupling with dust is the basis of an empirical artefact detection method applicable to EDC samples. This method considers depth intervals where dust concentrations exceed an arbitrary threshold of 300 µg kg−1 as affected by in situ production (Spahni et al., 2005; Schilt et al., 2010a). We follow this approach and define 134.5 ka as the boundary for the section affected by artefacts. This is a slightly younger age than the last value regarded as unbiased by Schilt et al. (2010a). Consequently, we refrain from interpreting N2O data points older than 134.5 ka as reflecting atmospheric variability.
The younger part of our records are used to study CH4 and N2O fluctuations during TII. In particular, we scrutinize our record with respect to the newly resolved variations belonging to the modes of variability presented above. To achieve this, we analyse the characteristics of the individual events as well as the background climate in which they occur.
4.2 The 129 ka event
The 129 ka event refers to the pronounced increase in CH4 and N2O concentrations to interglacial levels at the end of TII (Fig. 2). For both gases, this event accounts for about half of the deglacial change in concentrations.
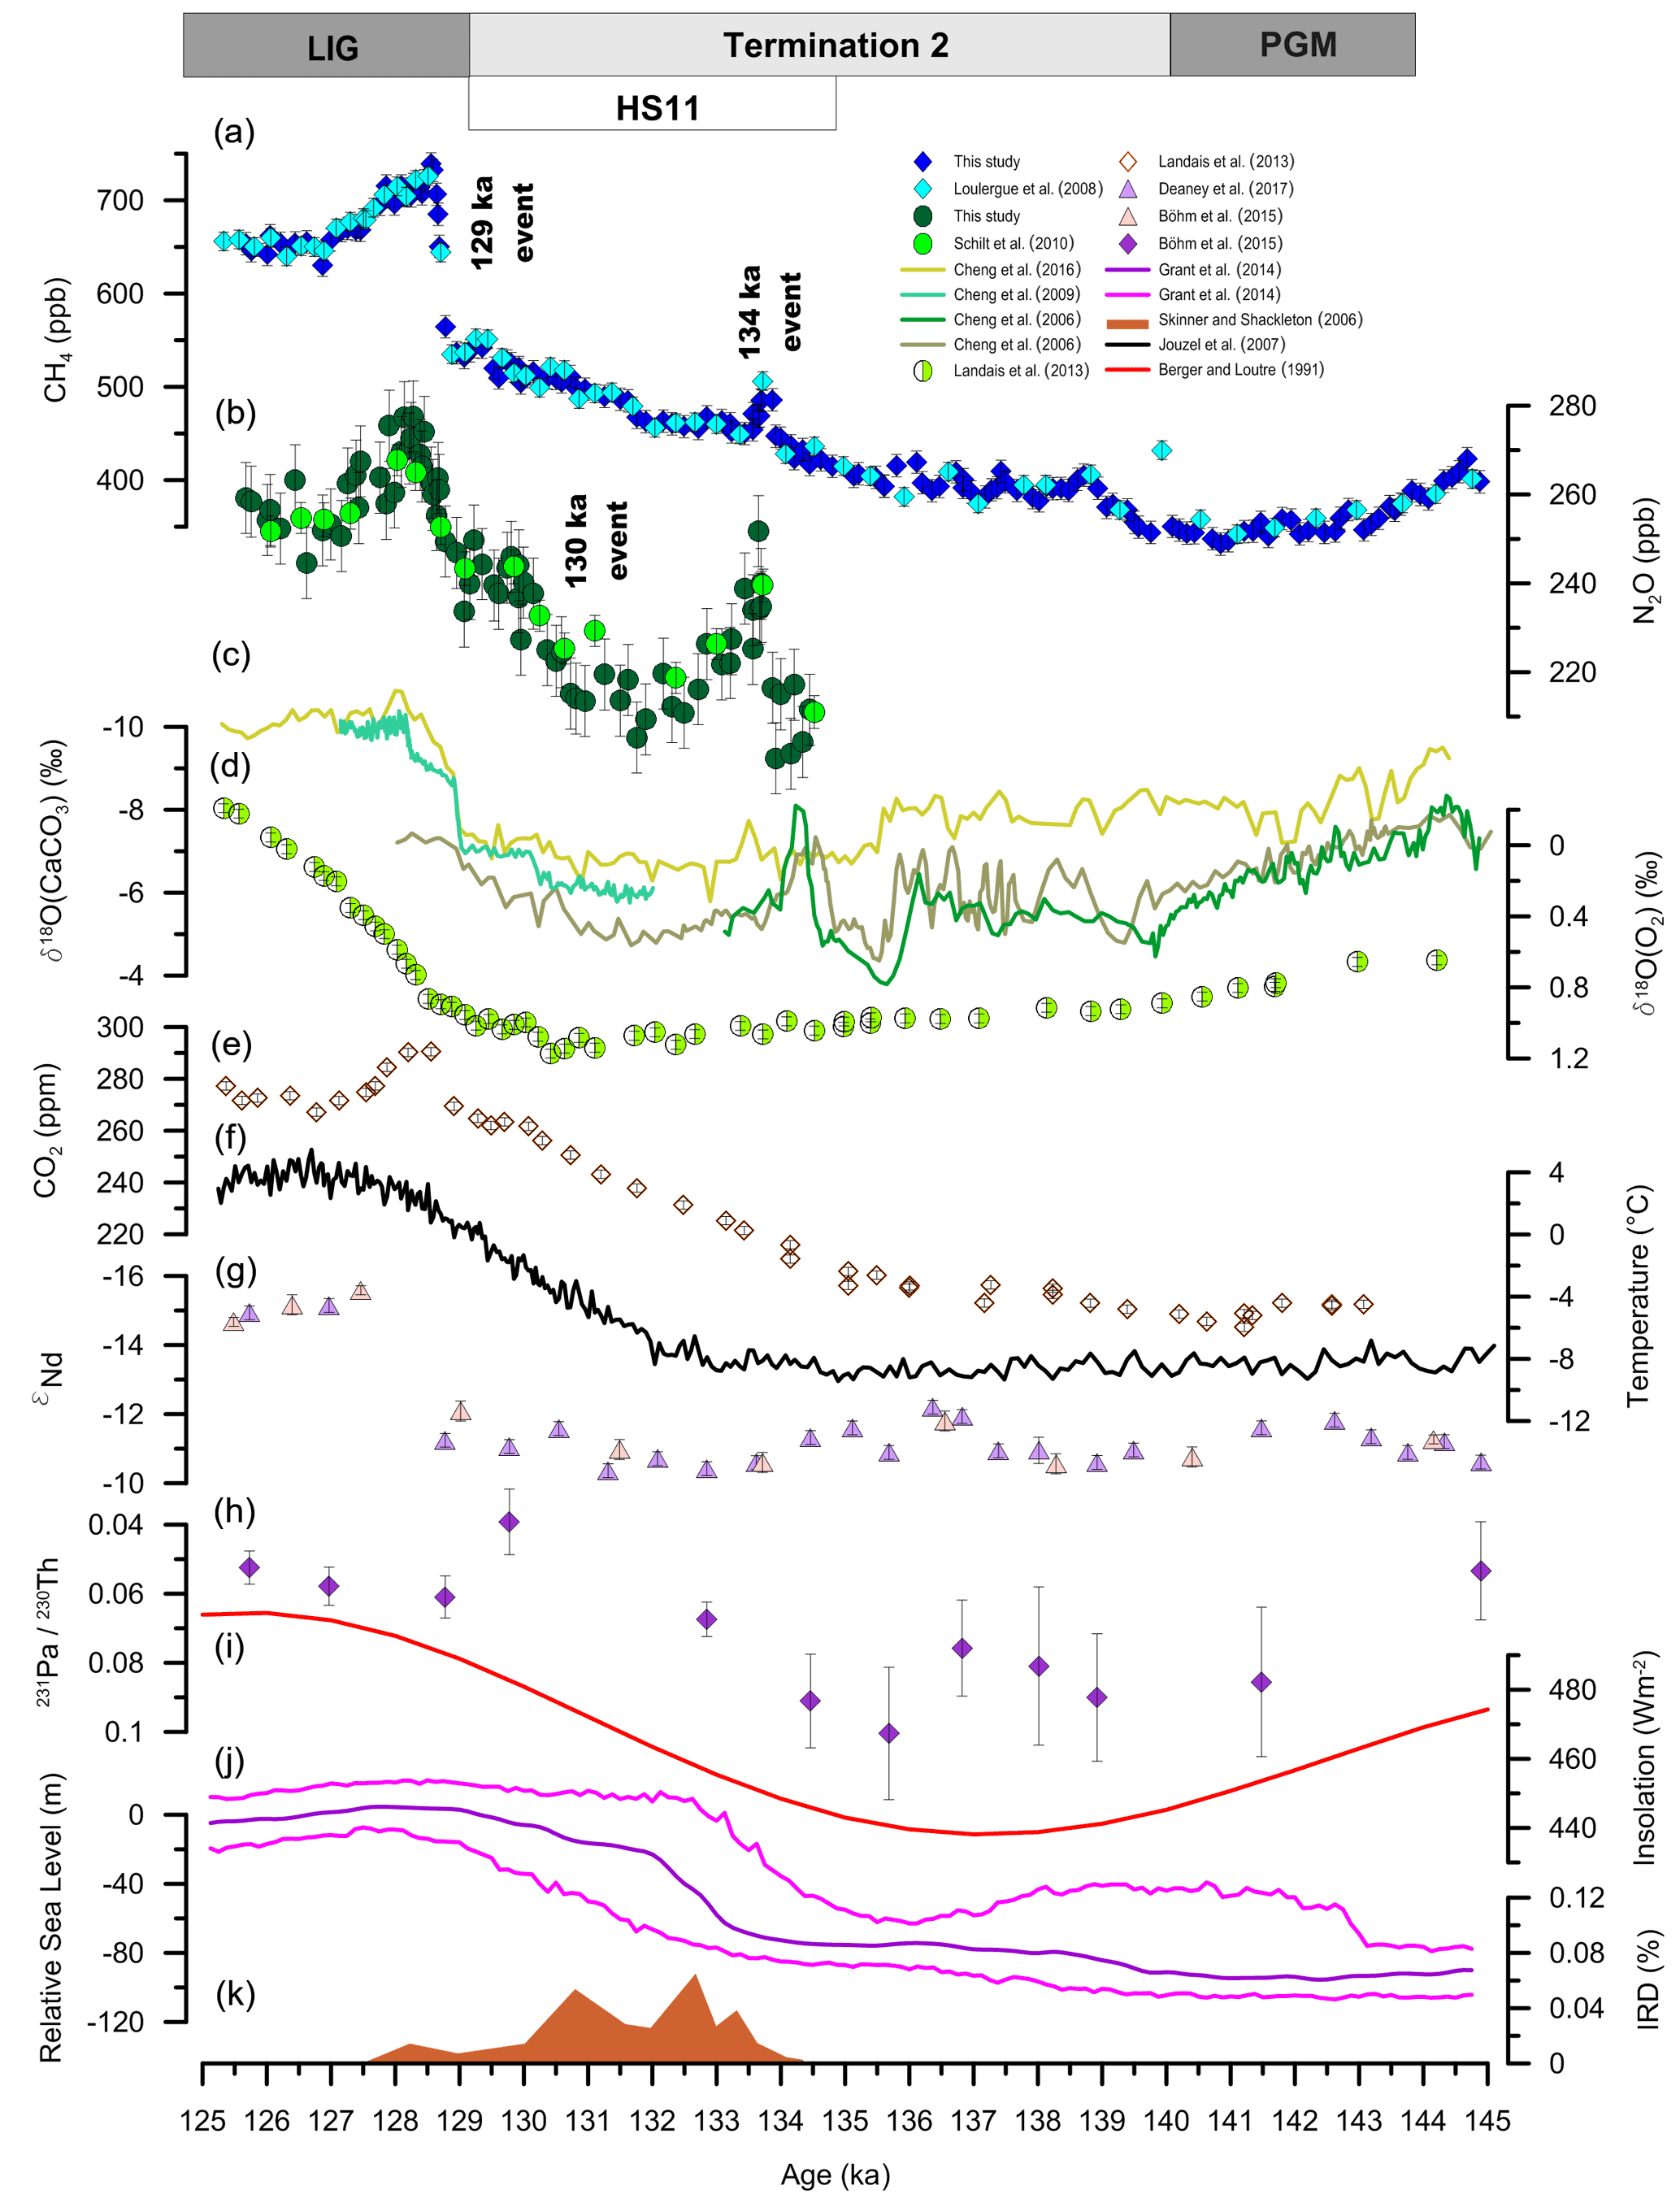
Figure 2Evolution of the CH4 and N2O concentrations combined with complementary climate proxies during TII. The boxes delineate the climate periods mentioned in the text: the Penultimate Glacial Maximum (PGM), Heinrich Stadial 11 (HS11, delineation according to Marino et al., 2015), and the Last Interglacial (LIG). (a) Composite CH4 record. (b) Composite N2O record. (c) Speleothem δ18O (CaCO3) records: Sanbao SB25 (light green) (Cheng et al., 2009), Hulu Cave MSX (khaki) (Cheng et al., 2006), Hulu cave MSP (dark green) (Cheng et al., 2006), and Sanbao–Dongge composite (pale yellow) (Cheng et al., 2016). (d) δ18O (O2) from EDC on the AICC2012 timescale (Landais et al., 2013). (e) CO2 from EDC on the AICC2012 timescale (Landais et al., 2013). (f) Antarctic surface temperature (relative to the last millennium) from EDC on the AICC2012 timescale (Jouzel et al., 2007). (g) Composite εNd from the sediment core ODP Site 1063 (Deaney et al., 2017), including data points from Böhm et al. (2015) (purple) and new measurements from Deaney et al. (2017) (pale pink), on the timescale of Deaney et al. (2017). (h) record from the sediment core ODP Site 1063 (Böhm et al., 2015), on the timescale of Deaney et al. (2017). (i) Mean summer (June to August) insolation at 40∘ N (Berger and Loutre, 1991). (j) Relative sea level stand from the Red Sea synchronized on a radiometric timescale, including the maximum probability curve (purple) and its 95 % confidence interval (magenta) (Grant et al., 2014). (k) Ice-rafted debris (IRD) from Skinner and Shackleton (2006) on the radiometric timescale of Marino et al. (2015).
CH4 and N2O concentrations rose in parallel with the main resumption of the AMOC, as indicated by the evolution of the isotopic ratio of neodymium 143 and 144 (εNd) (Deaney et al., 2017; Böhm et al., 2015). At the same time, the evolution of the isotopic composition of speleothem calcite (δ18O (CaCO3)) indicates a northward shift of the ITCZ (Cheng et al., 2009, 2016) (Fig. 3). These are fingerprints of DO-type variability. Accordingly, the abrupt CH4 rise likely reflects the response of terrestrial emissions from NH tropical wetlands. The simultaneous increase in both gases indicates that terrestrial emissions contributed, at least partly, to the N2O rise at ∼129 ka. However, because the deglacial AMOC resumption occurred at this time, it can be assumed that marine sources also played a role. A contribution from both marine and terrestrial emissions is in agreement with the findings of Schilt et al. (2014) and Fischer et al. (2019) for DO-type fluctuations during TI. Higher resolution measurements of the isotopic composition of N2O combined with a deconvolution, similar to the aforementioned studies, are needed to quantitatively determine the relative contribution of the sources during the 129 ka event.

Figure 3Details of the 129 (left panel) and 134 ka events (right panel). (a) Composite CH4 record. (b) Composite N2O record. (c) Speleothem δ18O (CaCO3) records: Sanbao SB25 (light green) (Cheng et al., 2009), Hulu Cave MSX (khaki) (Cheng et al., 2006), Hulu cave MSP (dark green) (Cheng et al., 2006), and Sanbao–Dongge composite (pale yellow). (d) δ18O (O2) from EDC on the AICC2012 timescale (Landais et al., 2013). (e) Antarctic surface temperature (relative to the last millennium) from EDC on the AICC2012 timescale (Jouzel et al., 2007). (f) Mean summer (June to August) insolation at 40∘ N (Berger and Loutre, 1991). (g) Composite εNd from the sediment core ODP Site 1063 (Deaney et al., 2017), including data points from Böhm et al. (2015) (purple) and new measurements from Deaney et al. (2017) (pale pink), on the timescale of Deaney et al. (2017). (h) Relative sea level stand from the Red Sea synchronized on a radiometric timescale, including the maximum probability curve (purple) and its 95 % confidence interval (magenta) (Grant et al., 2014).
4.3 The 130 ka event
The 129 ka event is preceded by a phase of rising N2O concentrations in the interval from 130.7 to 130 ka at the end of HS11 (Fig. 2). This is reminiscent of the pattern of late HS-type increase, where N2O concentrations rose before the rapid DO-type Greenland temperature and CH4 increases (Schilt et al., 2013). The timescale of the 130 ka event is in the range of the duration typically observed for these episodes (∼0.5–2 millennia) (Schilt et al., 2013), while the N2O growth rate appears slightly larger (∼3 ppb compared to typically ∼1 ppb per century). The lack of a concomitant CH4 fluctuation suggests that only the marine source contributed to the N2O increase, in agreement with the findings of Schilt et al. (2014) and Fischer et al. (2019) for the late HS1 rise. The change in marine emissions may be linked to a long-term adjustment of the nitrate and oxygen inventories in the upper ocean after a period of AMOC interruption (Schmittner and Galbraith, 2008). Overall, despite the somewhat different rates of change, the 130 ka event likely constitutes an instance of a late-HS N2O fluctuation during TII. The attribution of the 130 ka feature to the pattern of late HS increase would be strengthened by additional measurements of δ15N (N2O) and δ18O (N2O), allowing the unambiguous identification of the source contributing to this event.
4.4 The 134 ka event
Turning to the 134 ka event, its occurrence within HS11 and the properties of the CH4 increase (duration and amplitude) are reminiscent of the HS-type pattern of variability evidenced by Rhodes et al. (2015). HS-type fluctuations resolved in the WAIS Divide (WD) ice core fully developed within 90–190 years (Rhodes et al., 2015). The broader GAD of the EDC ice core implies that any such features would appear strongly dampened in our data. This is supported by continuous CH4 measurements in the Vostok ice core, demonstrating the absence of the characteristic overshoot resolved in the WD ice core during HS4 (Fourteau et al., 2020; Rhodes et al., 2015). Therefore, the sharpness and amplitude of the 134 ka event is not consistent with the picture of a substantially smoothed version of an HS-type fluctuation. The ∼70 ppb rise observed in the EDC record would translate into a WD signal exceeding by far the amplitude range of the HS1, HS2, HS4, and HS5 fluctuations (32–53 ppb) (Rhodes et al., 2015). Secondly, HS-type CH4 variability is also characterized by abrupt CO2 jumps, millennial-scale increases in δ18O (O2), enrichment in speleothem δ18O (CaCO3), and the absence of concomitant N2O variability (Bauska et al., 2016, 2018, 2021; Marcott et al., 2014; Fischer et al., 2019; Schilt et al., 2013, 2010a; Guillevic et al., 2014). The simultaneous occurrence of the CH4 and N2O pulses at ∼134 ka, the depletion in speleothem δ18O (CaCO3), and the lack of any fluctuation in the δ18O (O2) record (Landais et al., 2013) contradict these observations (Fig. 3). The 134 ka event is therefore likely to have resulted from different mechanisms and does not constitute an instance of an HS-type CH4 fluctuation during TII. On the other hand, simultaneous rises of atmospheric CH4 and N2O concentrations are observed during DO-type fluctuations. During the last glacial cycle, the amplitude of DO-type CH4 increases ranges from ∼50 to 220 ppb in Greenland ice cores and elevated concentrations lasted for centuries to millennia (Baumgartner et al., 2014; Flückiger et al., 2004). Accordingly, the magnitude of the 134 ka event fits well within the amplitude range observed for the well-resolved DO-type fluctuations in the EDC record of Loulergue et al. (2008) (∼50–185 ppb). Going further, results from Greenland ice cores have shown that the amplitude of DO-type CH4 rises tracks the variations in low- to mid-latitude NH summer insolation, where the most substantial changes in concentration are associated with higher insolation. This indicates that the amount or seasonal distribution of solar radiation has modulated the response of CH4 sources during interstadials (Brook et al., 1996; Flückiger et al., 2004). The 134 ka event occurs during a time period of low NH summer insolation (Fig. 2), comparable to this at DO2. Yet, the magnitude of the 134 ka event appears larger (∼70 ppb compared to ∼50 ppb for DO2 in the EDC record).
Associating our event with a DO-type pattern of variability requires evidence for a northward shift of the ITCZ and reinvigoration of the AMOC. Synchronous with the 134 ka event, within dating uncertainty, we observe a short-lived negative excursion in speleothem δ18O (CaCO3) records (Cheng et al., 2006) (Fig. 3) as well as fluctuations in proxies reflecting salinity and runoff intensity in the Bay of Bengal (Nilsson-Kerr et al., 2019). These data indicate a transient strengthening of the NH tropical monsoon systems consistent with a northward shift of the ITCZ. Concerning the behaviour of the AMOC, we are not aware of studies reporting on a potential reinvigoration at this time. Nevertheless, oceanic tracers exhibit a small and short-lived fluctuation in the time interval 133–132 ka (on the timescale of Böhm et al., 2015) before reaching their maximum HS11 values (Böhm et al., 2015). On the updated chronology of the sediment core ODP Site 1063 (Deaney et al., 2017), the negative excursion in the εNd record of Böhm et al. (2015) coincides with a comparably small value in the data of Deaney et al. (2017) (Fig. 2). However, the revised chronology places the excursion in εNd and substantially earlier than the 134 ka event (Fig. 3). The onset of this excursion is at ∼137.4 ka, corresponding to a shift by ∼4900 years with respect to the timescale of Böhm et al. (2015). Since the timescale of the sediment core is tuned to the Antarctic Ice Core Chronology (AICC2012) (Bazin et al., 2013; Veres et al., 2013) within an estimated uncertainty of 400 years, the fluctuations resolved in the ice and marine cores should, in principle, not be regarded as synchronous. However, the alignment with the AICC2012 is performed using only one tie point between CH4 and the isotopic composition of planktonic foraminifera (at ∼128.7 ka, corresponding to the abrupt CH4 increase into the LIG) (Deaney et al., 2017). Therefore, it may be possible that the two timescales are less tightly aligned away from this tie point. If this would be the case, it could be hypothesized that the excursions in oceanic proxies are synchronous with the fluctuations of δ18O (CaCO3), CH4, and N2O.
DO-type variability is typically also imprinted in the temperature record from Antarctic ice cores as well as in the δ18O (O2) record. However, the responses of these proxies are generally attenuated or occur on longer timescales compared to those of CH4 and δ18O (CaCO3). Accordingly, a short and small-amplitude interstadial at ∼134 ka might not have left discernible imprints in the respective records of Landais et al. (2013) and Jouzel et al. (2007) (Figs. 2 and 3).
Taking the proxy evidences together, we speculate that a brief and small-scale resumption of the AMOC might have occurred within HS11, accounting for the northward ITCZ shift and the rise in atmospheric CH4 and N2O concentrations. We acknowledge that our interpretation is limited by the relatively coarse resolution of εNd and as well as by the uncertainty arising from cross-dating sediment and ice core records. Concerning N2O, we finally note that the duration of the rise and the simultaneity with the excursion in CH4 suggest that terrestrial N2O emissions contributed by far the most to the 134 ka event (Fischer et al., 2019).
Should our interpretation hold, the 134 ka event can be regarded as a short DO-type fluctuation. We speculate that the hypothesized AMOC reinvigoration might have been perturbed by Meltwater Pulse 2B (MWP-2B). MWP-2B represents ∼70 % of the deglacial sea level change and coincides with the 134 ka event within dating uncertainty (Fig. 2) (Marino et al., 2015). The disruption of the oceanic circulation by freshwater forcing might have been enabled by the high susceptibility of the AMOC to perturbations at a time when the high-latitude SH was particularly cold (Buizert and Schmittner, 2015), as was the case during HS11 (Fig. 2). This situation favours the occurrence of relatively short, centennial, interstadials such as those appearing near the Last Glacial Maximum in Greenland ice cores.
In the present study, we increased the resolution of the deglacial CH4 and N2O records, allowing us to derive composite datasets covering TII (140–128 ka) at average resolutions of ∼100 years. Our results display pronounced fluctuations standing out of the overall transition of CH4 and N2O concentrations to interglacial conditions. The most prominent one is placed at ∼129 ka and delineates the transition into the LIG. We assume that terrestrial and marine sources contributed to the N2O increase at this time. Additionally, we unequivocally identify a 134 and 130 ka event. We link the latter to the pattern of late HS-type N2O increase, where changes in marine emissions are likely to be the only contributor. The former is regarded as a short DO-type fluctuation, whose timescale indicates that only terrestrial N2O sources likely contributed to the increase. We note that these fluctuations in CH4 and N2O concentrations during the penultimate deglaciation are all instances of recurrent modes of variability, also evidenced during the last deglaciation as well as during the last glacial period.
Although gas chromatography (GC) has been used extensively to measure CH4 and N2O at the University of Bern (e.g. Flückiger et al., 1999, 2002, 2004; Baumgartner et al., 2012, 2014; Loulergue et al., 2008; Schilt et al., 2010a, b, 2013; Spahni et al., 2005), the totally revised extraction and GC setup presented here has not been described before. The device is composed of different functional units, enabling the different actions of the system (standard injection, extraction, separation, and detection) (coloured boxes in Fig. A1). The measurements are carried out using three distinct lines. The ice line (IL, under vacuum, red path in Fig. A1) is used to extract air from ice core samples. The continuous-flow line (CFL, flushed with He, green path in Fig. A1) is used to measure standards to calibrate ice core measurements. Standards and samples are introduced differently into the separation unit to gain time during daily operation. Therefore, following the identical treatment principle, we also employ the standard over ice line (SOIL, blue line in Fig. A1) to periodically inject standards for comparison with similar measurements performed with the CFL in order to account for contamination stemming from the IL. The mean offset between the lines is used to correct IL data.
To extract gas from ice core samples, we use continuous extraction under vacuum. Air is released from the ice during the melting (immersing the bottom of the vessel in a ∼20 ∘C water bath) and is simultaneously adsorbed on an activated charcoal trap held at −196 ∘C using liquid nitrogen (T2 in Fig. A1). Water vapour is condensed beforehand using another cold trap held at −80 ∘C (T1 in Fig. A1). The progression of the extraction is monitored with a pressure gauge (P5 in Fig. A1). The completion of the extraction is indicated by a P5 pressure value ⩽0.25 mbar. When this value is reached, T2 is isolated from the vessel and heated to facilitate CH4 and N2O desorption from the charcoal bed. The duration and final temperature of the heating (5 min, 130 ∘C) ensure full recovery of the adsorbed gas. At the end of this phase, He flushes the content of T2 into the separation unit. Overall, the advantage of our procedure is the permanently low CH4 and N2O partial pressure, as well as total air pressure, prevailing in the vessel during the extraction. Accordingly, equilibrium conditions with respect to solubility are never reached, precluding the need of a solubility correction. This type of correction was required in traditional analyses using a melt–refreeze method, where the air sample is enclosed in the vessel head space during the extraction.
CH4 and N2O are separated from the bulk air in the separation unit before reaching the detection unit equipped with a thermal conductivity detector (TCD), a flame-ionization detector (FID), and an electron-capture detector (ECD) to quantify the amount of air, CH4, and N2O, respectively. The separation unit is composed of a succession of GC columns. CH4 and N2O are separated from the bulk air in the precolumn and analytical column (Fig. A1). After detection of the air peak by the TCD, V8 allows us to route CH4 towards the FID (via T5 and T7) and N2O towards the ECD (via T4 and T6) (Fig. A1). T5 and T4 are used to separate CH4 and N2O, respectively, from species having almost similar retention times. T7 and T6 are used to focus the gas to obtain sharp peaks in the chromatograph.
The amount of air, CH4, and N2O is quantified by integrating the area below the corresponding GC peaks. For each species, calibration curves are established between areas and the number of moles calculated using the volume, temperature, and pressure of the sample loop as well as the known CH4 and N2O mole fractions of the standard gases. We use a set of primary standards provided by the National Oceanic and Atmospheric Administration and referenced to the World Meteorological Organisation mole fraction scales: the WMOX2004A scale (CH4) and NOAA-2006A (N2O) (Dlugokencky et al., 2005; Hall et al., 2007). This set of standards brackets the glacial–interglacial range of CH4 (358.88 ± 0.16 ppb, 838.59 ± 0.28 ppb, and 1729.30 ± 0.34 ppb) and N2O concentrations (187.10 ± 0.12 ppb, 194.13 ± 0.12 ppb, and 300.20 ± 0.12 ppb). CH4 and N2O mole fractions are calculated by dividing the number of CH4 and N2O moles by the number moles of air. In addition, total air content can also be quantified using the TCD area as well as the volume, temperature, and pressure of the sample loop.
After calibration, the results are corrected for the line offset between CFL and SOIL. This offset accounts for the blank introduced in the IL and is averaged over, at least, a measurement campaign. The CH4 and N2O line offsets appear to be linearly dependent on the concentration enabling the use of linear interpolations to correct ice core results.
The uncertainty of the CH4 and N2O data derived with our instrument amounts to 7 and 6 ppb, respectively. It is calculated as the sum of the individual uncertainty, associated with the overall analytical procedure (1σ standard deviation of SOIL measurements) and with the line offset correction, in quadrature.
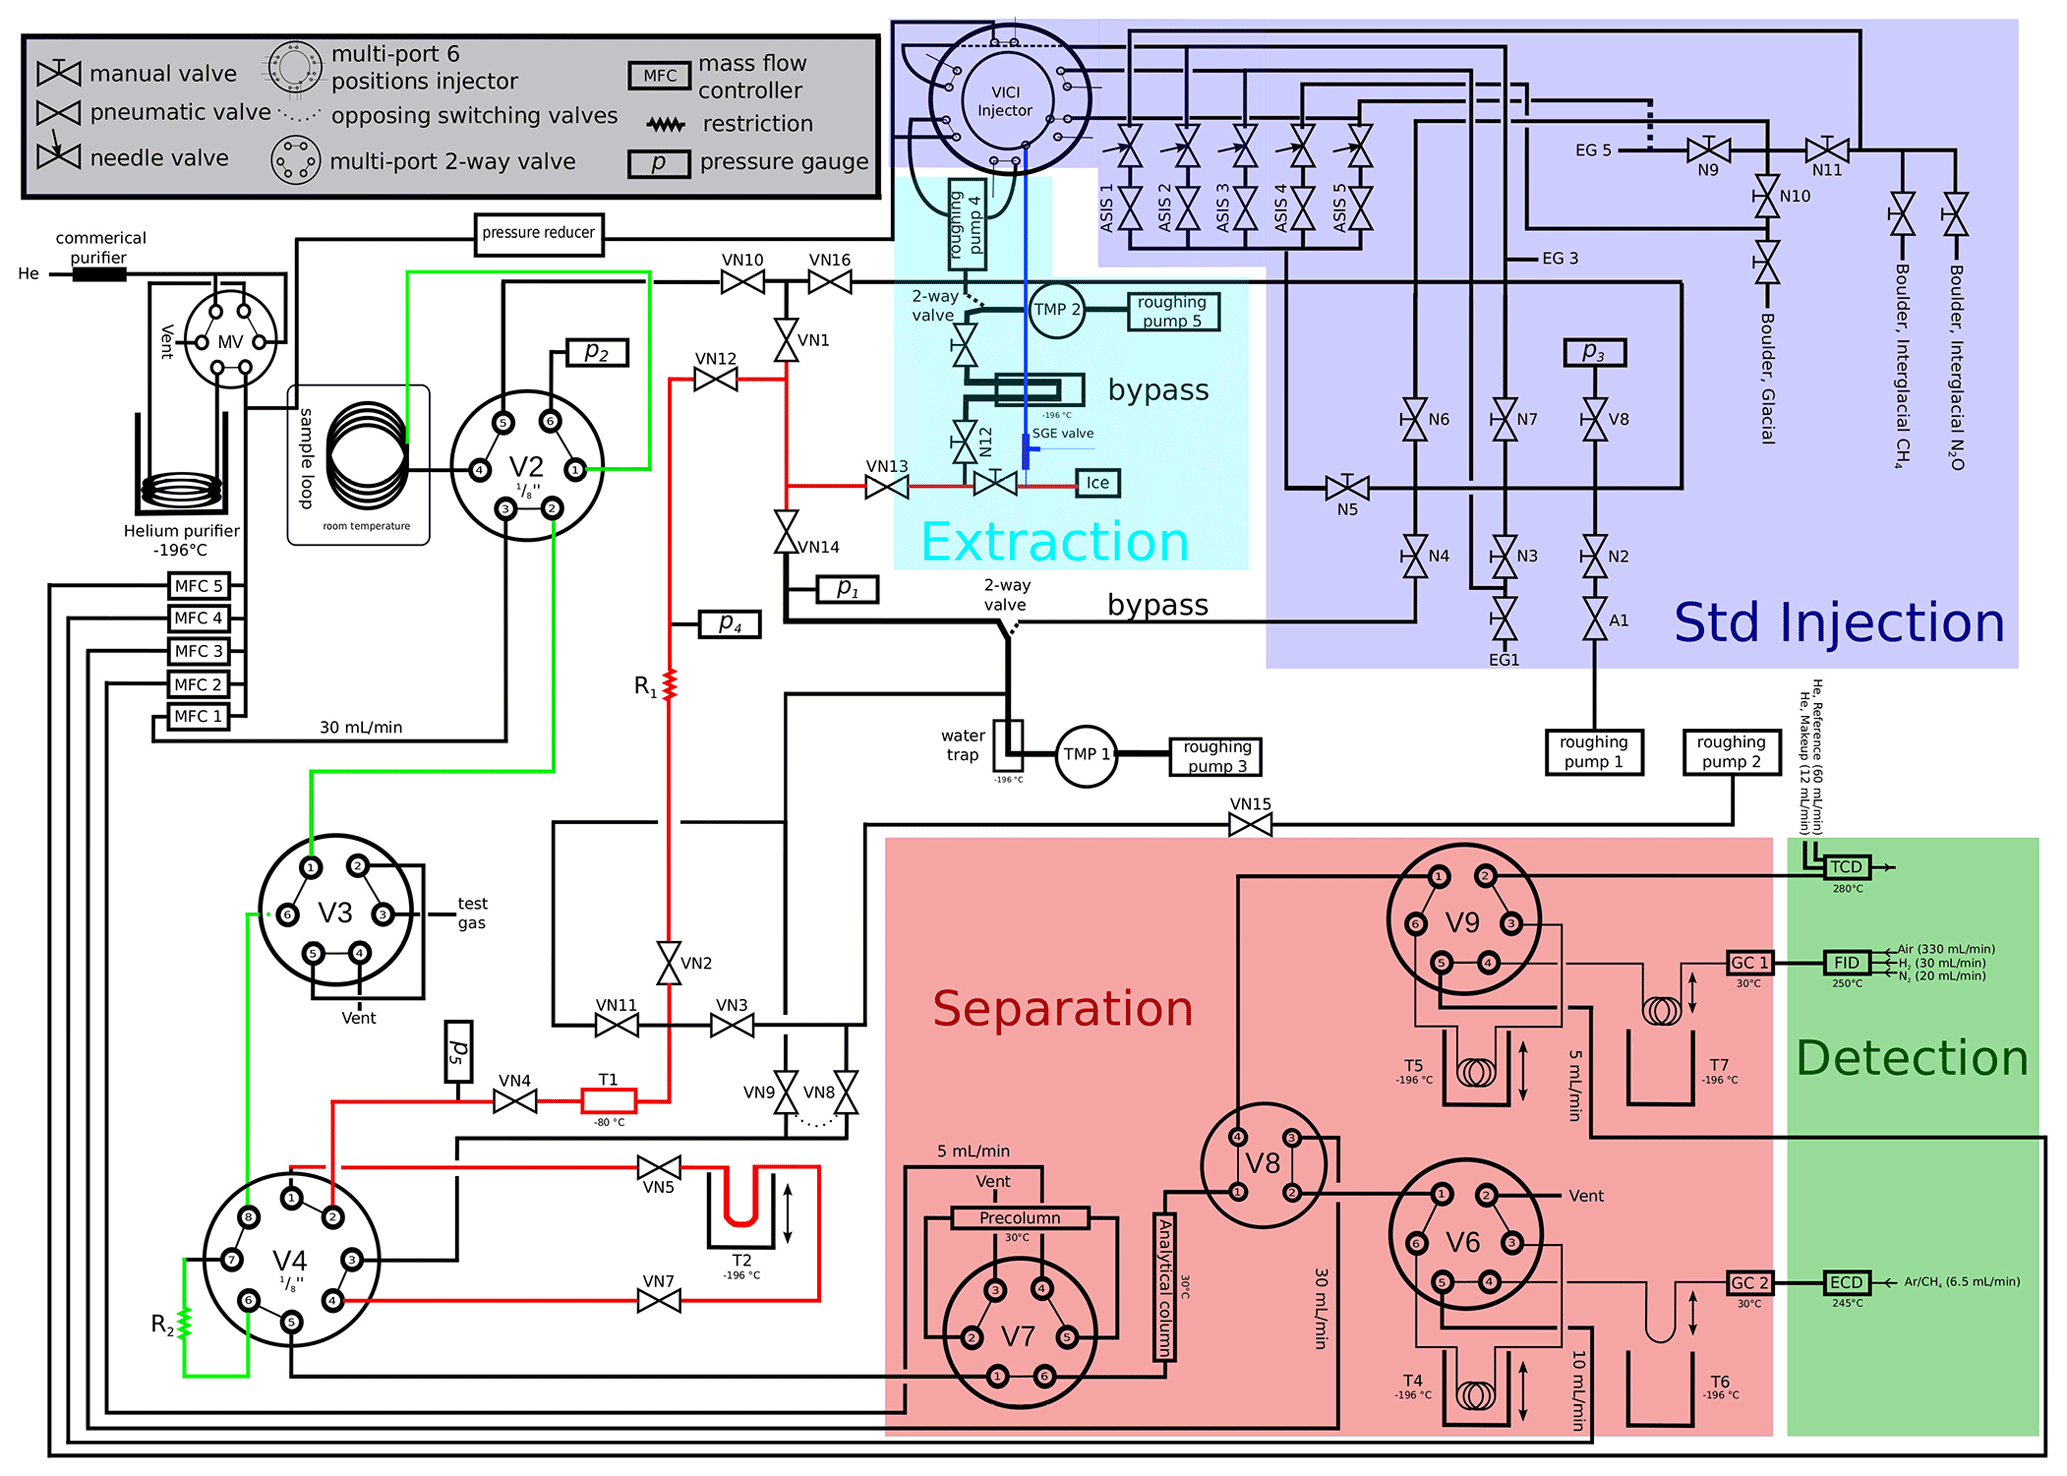
Figure A1Flow scheme of the CH4 and N2O measurement system. The red, green, and blue paths highlight the ice line (IL), continuous-flow line (CFL), and standard over ice line (SOIL), respectively. Coloured boxes display the different functional units of the system discussed in Appendix A.
The construction of the composite records presented in this study is complicated by offsets between the datasets, where our results appear on average 18 ± 10 ppb (CH4) and 21 ± 3 ppb (N2O) higher than previous data, although all datasets show the same relative changes (Fig. B1). The offsets are calculated as the mean of the residuals between splines with cut-off periods of 10 000 years fitted through the datasets. We computed splines according to Enting (1987), using the same routine as Beck et al. (2018), where each spline is the average of 1000 iterations with data points varied within a normal distribution inside their uncertainty range.
It seems likely that the offsets are linked to the different extraction techniques employed. In fact, the published EDC data were measured at the University of Bern and Grenoble with instruments using melt–refreeze extraction (Loulergue et al., 2008; Schilt et al., 2010a). Melt–refreeze extraction is prone to underestimate CH4 and N2O concentrations if the refreezing is not perfectly efficient, while in our method air is quantitatively extracted from the ice samples. We note that also the values presented in previous publications had to be aligned for interlaboratory offsets on the order of 10 ppb for CH4 (Loulergue et al., 2008), which may also reflect differences in the extraction efficiency of previously used melt–refreeze methods in different labs. Because melt–refreeze extraction has been the standard procedure for decades, the EDC records have been measured exclusively using this technique. We therefore think that additional overlapping measurements with an independent extraction technique (e.g. sublimation) are needed to resolve the dispute. Without further evidence, we prefer striving for consistency by correcting our data to the EDC benchmark records of Loulergue et al. (2008) and Schilt et al. (2010a). To achieve this, we subtract the mean offsets of 18 (CH4) and 21 ppb (N2O) from our results. This approach is facilitated by the high degree of co-variation between the datasets (Fig. B1).
The merging procedure described above adds an additional source of uncertainty to our results. Accounting for the uncertainty of the mean offset, taken as the standard deviation (1σ) of the residuals between the splines, increases the total uncertainty of the new data included in the composite records to 12 (CH4) and 8 ppb (N2O). For the published EDC values and the isotopic measurements, the uncertainties amount to 10 ppb (CH4), 4 ppb (N2O), 0.22 ‰ (δ15N (N2O)), and 0.34 ‰ (δ18O (N2O)), as reported in Loulergue et al. (2008), Schilt et al. (2010a), and Schmitt et al. (2014).
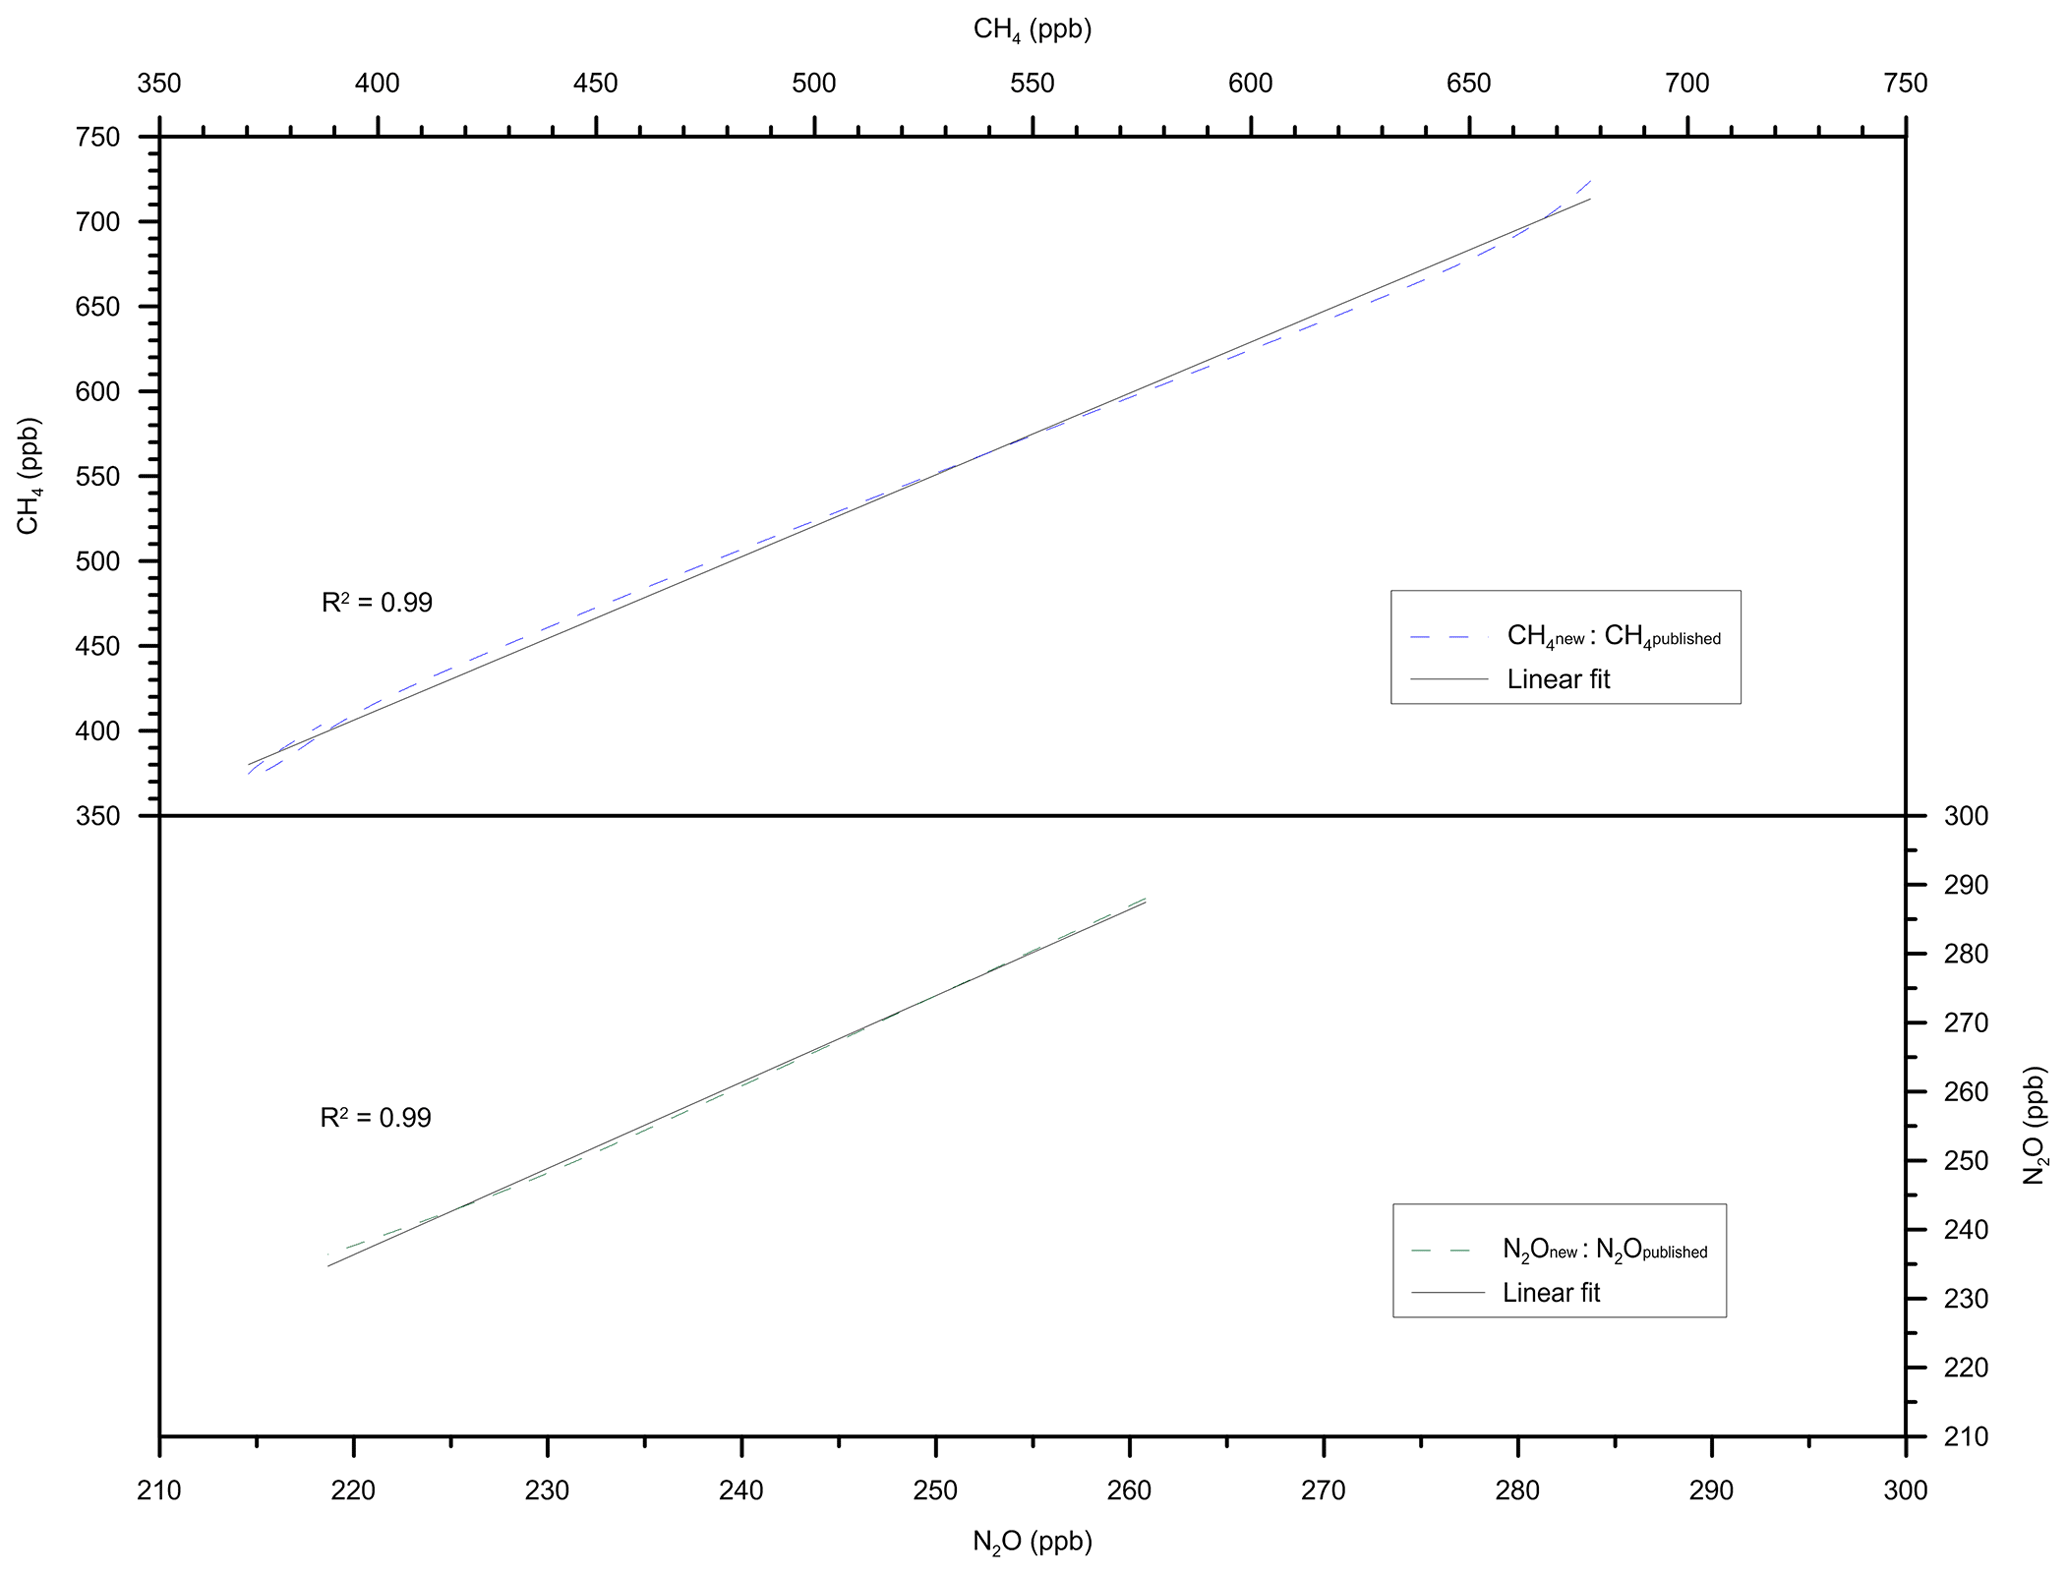
Figure B1Offsets between new and published CH4 and N2O EDC records. Dashed lines show the new measurements plotted against the published ones (data are from the spline approximations introduced in Appendix B). Solid lines are linear fits through these data.
The new CH4 and N2O data are available at the World Data Center for Paleoclimatology under the following link: https://www.ncdc.noaa.gov/paleo/study/33673 (Schmidely et al., 2020).
The present study was designed by TFS, HF, and LoS. LoS and JH performed the methane and nitrous oxide measurements. JoS provided the isotopic data. LoS wrote the text with inputs from CNA, JoS, JH, LuS, JiS, FJ, JC, HF, and TFS.
The authors declare that they have no conflict of interest.
Publisher’s note: Copernicus Publications remains neutral with regard to jurisdictional claims in published maps and institutional affiliations.
The authors would like to thank Barbara Seth for the measurements of the isotopic composition of N2O, Gregory Teste for assistance in cutting ice samples, and Michael Bock and Jan Strähl for the construction of the new CH4 and N2O measurement system. We thank the reviewers and the editor for detailed and constructive comments that improved this paper. We acknowledge financial support by the Swiss National Science Foundation (SNF project numbers 200020_172745, 200020_200492, 200020_172506, 200020_200511, and 200020_159563). This work is a contribution to the European Project for Ice Coring in Antarctica (EPICA), a joint European Science Foundation/European Commission scientific programme, funded by the European Union and by national contributions from Belgium, Denmark, France, Germany, Italy, The Netherlands, Norway, Sweden, Switzerland, and the United Kingdom. The main logistic support was provided by IPEV and PNRA (at Dome C) and AWI (at Dronning Maud Land). This is EPICA publication no. 319. This project is TiPES (Tipping Points in the Earth System) contribution no. 125. This project has received funding from the European Union's Horizon 2020 research and innovation programme under grant 820970.
This research has been supported by the Swiss National Science Foundation (SNF project numbers 200020_172745, 200020_172506, 200020_159563, 200020_200492 and 200020_200511) and by the European Union's Horizon 2020 research and innovation programme (grant no. 820970).
This paper was edited by Luke Skinner and reviewed by two anonymous referees.
Alley, R. B.: Wally was right: Predictive ability of the North Atlantic “conveyor belt” hypothesis for abrupt climate change, Annu. Rev. Earth Pl. Sc., 35, 241–272, https://doi.org/10.1146/annurev.earth.35.081006.131524, 2007. a
Baumgartner, M., Schilt, A., Eicher, O., Schmitt, J., Schwander, J., Spahni, R., Fischer, H., and Stocker, T. F.: High-resolution interpolar difference of atmospheric methane around the Last Glacial Maximum, Biogeosciences, 9, 3961–3977, https://doi.org/10.5194/bg-9-3961-2012, 2012. a
Baumgartner, M., Kindler, P., Eicher, O., Floch, G., Schilt, A., Schwander, J., Spahni, R., Capron, E., Chappellaz, J., Leuenberger, M., Fischer, H., and Stocker, T. F.: NGRIP CH4 concentration from 120 to 10 kyr before present and its relation to a δ15N temperature reconstruction from the same ice core, Clim. Past, 10, 903–920, https://doi.org/10.5194/cp-10-903-2014, 2014. a, b, c
Bauska, T. K., Baggenstos, D., Brook, E. J., Mix, A. C., Marcott, S. A., Petrenko, V. V., Schaefer, H., Severinghaus, J. P., and Lee, J. E.: Carbon isotopes characterize rapid changes in atmospheric carbon dioxide during the last deglaciation, P. Natl. Acad. Sci. USA, 113, 3465–3470, https://doi.org/10.1073/pnas.1513868113, 2016. a
Bauska, T. K., Brook, E. J., Marcott, S. A., Baggenstos, D., Shackleton, S., Severinghaus, J. P., and Petrenko, V. V.: Controls on millennial–scale atmospheric CO2 variability during the last glacial period, Geophys. Res. Lett., 45, 7731–7740, https://doi.org/10.1029/2018GL077881, 2018. a
Bauska, T. K., Marcott, S. A., and Brook, E. J.: Abrupt changes in the global carbon cycle during the last glacial period, Nat. Geosci., 14, 91–96, 2021. a
Bazin, L., Landais, A., Lemieux-Dudon, B., Toyé Mahamadou Kele, H., Veres, D., Parrenin, F., Martinerie, P., Ritz, C., Capron, E., Lipenkov, V., Loutre, M.-F., Raynaud, D., Vinther, B., Svensson, A., Rasmussen, S. O., Severi, M., Blunier, T., Leuenberger, M., Fischer, H., Masson-Delmotte, V., Chappellaz, J., and Wolff, E.: An optimized multi-proxy, multi-site Antarctic ice and gas orbital chronology (AICC2012): 120–800 ka, Clim. Past, 9, 1715–1731, https://doi.org/10.5194/cp-9-1715-2013, 2013. a, b
Beck, J., Bock, M., Schmitt, J., Seth, B., Blunier, T., and Fischer, H.: Bipolar carbon and hydrogen isotope constraints on the Holocene methane budget, Biogeosciences, 15, 7155–7175, https://doi.org/10.5194/bg-15-7155-2018, 2018. a, b
Berger, A. and Loutre, M.-F.: Insolation values for the climate of the last 10 million years, Quaternary Sci. Rev., 10, 297–317, 1991. a, b
Bloom, A. A., Palmer, I. P., Fraser, A., Reay, D. S., and Frankenberg, C.: Large–scale controls of methanogenesis inferred from methane and gravity spaceborne data, Science, 327, 322–325, https://doi.org/10.1126/science.1175176, 2010. a
Bock, M., Schmitt, J., Möller, L., Spahni, R., Blunier, T., and Fischer, H.: Hydrogen isotopes preclude marine hydrate CH4 emissions at the onset of Dansgaard–Oeschger events, Science, 328, 1686–1689, https://doi.org/10.1126/science.1187651, 2010. a
Bock, M., Schmitt, J., Beck, J., Seth, B., Chappellaz, J., and Fischer, H.: Glacial/interglacial wetland, biomass burning, and geologic methane emissions constrained by dual stable isotopic CH4 ice core records, P. Natl. Acad. Sci. USA, 114, E5778–E5786, https://doi.org/10.1073/pnas.1613883114, 2017. a, b, c
Böhm, E., Lippold, J., Gutjahr, M., Frank, M., Blaser, P., Antz, B., Fohlmeister, J., Frank, N., Andersen, M. B., and Deininger, M.: Strong and deep Atlantic meridional overturning circulation during the last glacial cycle, Nature, 517, 73–76, https://doi.org/10.1038/nature14059, 2015. a, b, c, d, e, f, g, h
Broccoli, A. J., Dahl, K. A., and Stouffer, R. J.: Response of the ICTZ to Northern Hemisphere cooling, Geophys. Res. Lett., 33, L01702, https://doi.org/10.1029/2005GL024546, 2006. a
Brook, E. J., Sowers, T., and Orchardo, J.: Rapid variations in atmospheric methane concentration during the past 110,000 years, Science, 273, 1087–1091, 1996. a
Buizert, C. and Schmittner, A.: Southern Ocean control of glacial AMOC stability and Dansgaard-Oeschger interstadial duration, Paleoceanography, 30, 1595–1612, 2015. a
Cheng, H., Edwards, R. L., Wang, Y., Kong, X., Ming, Y., Kelly, M. J., Wang, X., Gallup, C. D., and Liu, W.: A penultimate glacial monsoon record from Hulu Cave and two-phase glacial terminations, Geology, 34, 217–220, https://doi.org/10.1130/G22289.1, 2006. a, b, c, d, e
Cheng, H., Edwards, R. L., Broecker, W. S., Denton, G. H., Kong, X., Wang, Y., Zhang, R., and Wang, X.: Ice age terminations, Science, 326, 248–252, https://doi.org/10.1126/science.1177840, 2009. a, b, c
Cheng, H., Edwards, R. L., Sinha, A., Spötl, C., Yi, L., Chen, S., Kelly, M., Kathayat, G., Wang, X., Li, X., Kong, X., Wang, Y., Ning, Y., and Zhang, H.: The Asian monsoon over the past 640,000 years and ice age terminations, Nature, 534, 640–646, https://doi.org/10.1038/nature18591, 2016. a, b
Deaney, E. L., Barker, S., and Van de Flierdt, T.: Timing and nature of AMOC recovery across Termination II and magnitude of deglacial CO2 change, Nat. Commun., 8, 14595, https://doi.org/10.1038/ncomms14595, 2017. a, b, c, d, e, f, g, h, i, j, k
Dlugokencky, E. J., Myers, R. C., Lang, P. M., Masarie, K. A., Crotwell, A. M., Thoning, K. W., Hall, B. D., Elkins, J. W., and Steele, L. P.: Conversion of NOAA atmospheric dry air CH4 mole fractions to a gravimetrically prepared standard scale, J. Geophys. Res.-Atmos., 110, D18306, https://doi.org/10.1029/2005JD006035, 2005. a, b
Dyonisius, M. N., Petrenko, V. V., Smith, A. M., Hua, Q., Yang, B., Schmitt, J., Beck, J., Seth, B., Bock, M., Hmiel, B., Vimont, I., Menking, J. A., Shackleton, S. A., Baggenstos, D., Bauska, T. K., Rhodes, R. H., Sperlich, P., Beaudette, R., Harth, C., Kalk, M., Brook, E. J., Fischer, H., Severinghaus, J. P., and Weiss, R. F.: Old carbon reservoirs were not important in the deglacial methane budget, Science, 367, 907–910, https://doi.org/10.1126/science.aax0504, 2020. a
Enting, I.: On the use of smoothing splines to filter CO2 data, J. Geophys. Res.-Atmos., 92, 10977–10984, https://doi.org/10.1029/JD092iD09p10977, 1987. a, b
Epifanio, J. A., Brook, E. J., Buizert, C., Edwards, J. S., Sowers, T. A., Kahle, E. C., Severinghaus, J. P., Steig, E. J., Winski, D. A., Osterberg, E. C., Fudge, T. J., Aydin, M., Hood, E., Kalk, M., Kreutz, K. J., Ferris, D. G., and Kennedy, J. A.: The SP19 chronology for the South Pole Ice Core – Part 2: gas chronology, Δage, and smoothing of atmospheric records, Clim. Past, 16, 2431–2444, https://doi.org/10.5194/cp-16-2431-2020, 2020. a, b
Fischer, H., Meissner, K. J., Mix, A. C., Abram, N. J., Austermann, J., Brovkin, V., Capron, E., Colombaroli, D., Daniau, A.-L., Dyez, K. A., Felis, T., Finkelstein, S. A., Jaccard, S. L., McClymont, E. L., Rovere, A., Sutter, J., Wolff, E. W., Affolter, S., Bakker, P., Ballesteros-Ctánovas, J. A., Barbante, C., Caley, T., Carlson, A. E., Churakova (Sidorova), O., Cortese, G., Cumming, B. F., Davis, B. A. S., de Vernal, A., Emile-Geay, J., Fritz, S. C., Gierz, P., Gottschalk, J., Holloway, M. D., Joos, F., Kucera, M., Loutre, M.-F., Lunt, D. J., Marcisz, K., Marlon, J. R., Martinez, P., Masson-Delmotte, V., Nehrbass-Ahles, C., Otto-Bliesner, B. L., Raible, C. C., Risebrobakken, B., Sánchez Goñi, M. F., Saleem Arrigo, J., Sarnthein, M., Sjolte, J., Stocker, T. F., Velasquez Alvárez, P. A., Tinner, W., Valdes, P. J., Vogel, H., Wanner, H., Yan, Q., Yu, Z., Ziegler, M., and Zhou, L.: Palaeoclimate constraints on the impact of 2 ∘C anthropogenic warming and beyond, Nat. Geosci., 11, 474–485, https://doi.org/10.1038/s41561-018-0146-0, 2018. a
Fischer, H., Schmitt, J., Bock, M., Seth, B., Joos, F., Spahni, R., Lienert, S., Battaglia, G., Stocker, B. D., Schilt, A., and Brook, E. J.: N2O changes from the Last Glacial Maximum to the preindustrial – Part 1: Quantitative reconstruction of terrestrial and marine emissions using N2O stable isotopes in ice cores, Biogeosciences, 16, 3997–4021, https://doi.org/10.5194/bg-16-3997-2019, 2019. a, b, c, d, e, f, g, h, i, j, k
Flückiger, J., Dällenbach, A., Blunier, T., Stauffer, B., Stocker, T. F., Raynaud, D., and Barnola, J.-M.: Variations in atmospheric N2O concentration during abrupt climatic changes, Science, 285, 227–230, https://doi.org/10.1126/science.285.5425.227, 1999. a, b
Flückiger, J., Monnin, E., Stauffer, B., Schwander, J., Stocker, T. F., Chappellaz, J., Raynaud, D., and Barnola, J.-M.: High–resolution Holocene N2O ice core record and its relationship with CH4 and CO2, Global Biogeochem. Cy., 16, 10-1–10-8, https://doi.org/10.1029/2001GB001417, 2002. a
Flückiger, J., Blunier, T., Stauffer, B., Chappellaz, J., Spahni, R., Kawamura, K., Schwander, J., Stocker, T. F., and Dahl-Jensen, D.: N2O and CH4 variations during the last glacial epoch: Insight into global processes, Global Biogeochem. Cy., 18, GB1020, https://doi.org/10.1029/2003GB002122, 2004. a, b, c, d, e
Fourteau, K., Faïn, X., Martinerie, P., Landais, A., Ekaykin, A. A., Lipenkov, V. Ya., and Chappellaz, J.: Analytical constraints on layered gas trapping and smoothing of atmospheric variability in ice under low-accumulation conditions, Clim. Past, 13, 1815–1830, https://doi.org/10.5194/cp-13-1815-2017, 2017. a, b, c
Fourteau, K., Martinerie, P., Faïn, X., Ekaykin, A. A., Chappellaz, J., and Lipenkov, V.: Estimation of gas record alteration in very low-accumulation ice cores, Clim. Past, 16, 503–522, https://doi.org/10.5194/cp-16-503-2020, 2020. a, b
Grant, K. M., Rohling, E. J., Ramsey, B. C., Cheng, H., Edwards, R. L., Florindo, F., Heslop, D., Marra, F., Roberts, A. P., Tamisiea, M. E., and Williams, F.: Sea–level variability over five glacial cycles, Nat. Commun., 5, 6076, https://doi.org/10.1038/ncomms6076, 2014. a, b
Guillevic, M., Bazin, L., Landais, A., Stowasser, C., Masson-Delmotte, V., Blunier, T., Eynaud, F., Falourd, S., Michel, E., Minster, B., Popp, T., Prié, F., and Vinther, B. M.: Evidence for a three-phase sequence during Heinrich Stadial 4 using a multiproxy approach based on Greenland ice core records, Clim. Past, 10, 2115–2133, https://doi.org/10.5194/cp-10-2115-2014, 2014. a
Hall, B. D., Dutton, G. S., and Elkins, J. W.: The NOAA nitrous oxide standard scale for atmospheric observations, J. Geophys. Res.-Atmos., 112, D09305, https://doi.org/10.1029/2006JD007954, 2007. a, b
Hemming, S. R.: Heinrich events: Massive late Pleistocene detritus layers of the North Atlantic and their global climate imprint, Rev. Geophys., 42, RG1005, https://doi.org/10.1029/2003RG000128, 2004. a
Hopcroft, P. O., Valdes, P. J., O’Connor, F. M., Kaplan, J. O., and Beerling, D. J.: Understanding the glacial methane cycle, Nat. Commun., 8, 14383, https://doi.org/10.1038/ncomms14383, 2017. a
Joos, F., Battaglia, G., Fischer, H., Jeltsch-Thömmes, A., and Schmitt, J.: Marine N2O emissions during a Younger Dryas-like event: the role of meridional overturning, tropical thermocline ventilation, and biological productivity, Environ. Res. Lett., 14, 075007, https://doi.org/10.1088/1748-9326/ab2353, 2019. a, b
Joos, F., Spahni, R., Stocker, B. D., Lienert, S., Müller, J., Fischer, H., Schmitt, J., Prentice, I. C., Otto-Bliesner, B., and Liu, Z.: N2O changes from the Last Glacial Maximum to the preindustrial – Part 2: terrestrial N2O emissions and carbon–nitrogen cycle interactions, Biogeosciences, 17, 3511–3543, https://doi.org/10.5194/bg-17-3511-2020, 2020. a, b, c
Jouzel, J., Masson-Delmotte, V., Cattani, O., Dreyfus, G., Falourd, S., Hoffmann, G., Minster, B., Nouet, J., Barnola, J.-M., Chappellaz, J., Fischer, H., Gallet, J. C., Johnsen, S., Leuenberger, M., Loulergue, L., Luethi, D., Oerter, H., Parrenin, F., Raisbeck, G., Raynaud, D., Schilt, A., Schwander, J., Selmo, E., Souchez, R., Spahni, R., Stauffer, B., Steffensen, J. P., Stenni, B., Stocker, T. F., Tison, J. L., Werner, M., and Wolff, E. W.: Orbital and millennial Antarctic climate variability over the past 800,000 years, Science, 317, 793–796, 2007. a, b, c
Landais, A., Dreyfus, G., Capron, E., Jouzel, J., Masson-Delmotte, V., Roche, D. M., Prié, F., Caillon, N., Chappellaz, J., Leuenberger, M., Lourantou, A., Parrenin, F., Raynaud, D., and Teste, G.: Two-phase change in CO2, Antarctic temperature and global climate during Termination II, Nat. Geosci., 6, 1062–1065, https://doi.org/10.1038/ngeo1985, 2013. a, b, c, d, e
Levine, J. G., Wolff, E. W., Hopcroft, P. O., and Valdes, P. J.: Controls on the tropospheric oxidizing capacity during an idealized Dansgaard–Oeschger event, and their implications for the rapid rises in atmospheric methane during the last glacial period, Geophys. Res. Lett., 39, L12805, https://doi.org/10.1029/2012GL051866, 2012. a
Loulergue, L., Schilt, A., Spahni, R., Masson-Delmotte, V., Blunier, T., Lemieux-Dudon, B., Barnola, J.-M., Raynaud, D., Stocker, T. F., and Chappellaz, J.: Orbital and millennial-scale features of atmospheric CH4 over the past 800,000 years, Nature, 453, 383–386, https://doi.org/10.1038/nature06950, 2008. a, b, c, d, e, f, g, h, i, j, k
Marcott, S. A., Bauska, T. K., Buizert, C., Steig, E. J., Rosen, J. L., Cuffey, K. M., Fudge, T. J., Severinghaus, J. P., Ahn, J., Kalk, M. L., McConnell, J. R., Sowers, T., Taylor, K. C., White, J. W. C., and Brook, E. J.: Centennial–scale changes in the global carbon cycle during the last deglaciation, Nature, 514, 616–619, https://doi.org/10.1038/nature13799, 2014. a, b
Marino, G., Rohling, E. J., Rodríguez-Sanz, L., Grant, K. M., Heslop, D., Roberts, A. P., Stanford, J. D., and Yu, J.: Bipolar seesaw control on last interglacial sea level, Nature, 522, 197–201, https://doi.org/10.1038/nature14499, 2015. a, b, c
Melton, J. R., Wania, R., Hodson, E. L., Poulter, B., Ringeval, B., Spahni, R., Bohn, T., Avis, C. A., Beerling, D. J., Chen, G., Eliseev, A. V., Denisov, S. N., Hopcroft, P. O., Lettenmaier, D. P., Riley, W. J., Singarayer, J. S., Subin, Z. M., Tian, H., Zürcher, S., Brovkin, V., van Bodegom, P. M., Kleinen, T., Yu, Z. C., and Kaplan, J. O.: Present state of global wetland extent and wetland methane modelling: conclusions from a model inter-comparison project (WETCHIMP), Biogeosciences, 10, 753–788, https://doi.org/10.5194/bg-10-753-2013, 2013. a
Myhre, G., Shindell, D., Bréon, F.-M., Collins, W., Fuglestvedt, J., Huang, J., Koch, D., Lamarque, J.-F., Lee, D., Mendoza, B., Nakajima, T., Robock, A., Stephens, G., Takemura, T., and Zhang, H.: Anthropogenic and Natural Radiative Forcing, in: Climate Change 2013: The Physical Science Basis. Contribution of Working Group I to the Fifth Assessment Report of the Intergovernmental Panel on Climate Change, edited by: Stocker, T. F., Qin, D., Plattner, G.-K., Tignor, M., Allen, S. K., Boschung, J., Nauels, A., Xia, Y., Bex, V., and Midgley, P. M., Cambridge University Press, Cambridge, United Kingdom and New York, NY, USA, 2013. a
Nehrbass-Ahles, C., Shin, J., Schmitt, J., Bereiter, B., Joos, F., Schilt, A., Schmidely, L., Silva, L., Teste, G., Grilli, R., Chappellaz, J., Hodell, D., Fischer, H., and Stocker, T. F.: Abrupt CO2 release to the atmosphere under glacial and early interglacial climate conditions, Science, 369, 1000–1005, https://doi.org/10.1126/science.aay8178, 2020. a, b
Nilsson-Kerr, K., Anand, P., Sexton, P. F., Leng, M. J., Misra, S., Clemens, S. C., and Hammond, S. J.: Role of Asian summer monsoon subsystems in the inter-hemispheric progression of deglaciation, Nat. Geosci., 12, 290–295, https://doi.org/10.1038/s41561-019-0319-5, 2019. a
Oyabu, I., Kawamura, K., Kitamura, K., Dallmayr, R., Kitamura, A., Sawada, C., Severinghaus, J. P., Beaudette, R., Orsi, A., Sugawara, S., Ishidoya, S., Dahl-Jensen, D., Goto-Azuma, K., Aoki, S., and Nakazawa, T.: New technique for high-precision, simultaneous measurements of CH4, N2O and CO2 concentrations; isotopic and elemental ratios of N2, O2 and Ar; and total air content in ice cores by wet extraction, Atmos. Meas. Tech., 13, 6703–6731, https://doi.org/10.5194/amt-13-6703-2020, 2020. a
Prather, M. J., Hsu, J., DeLuca, N. M., Jackman, C. H., Oman, L. D., Douglass, A. R., Fleming, E. L., Strahan, S. E., Steenrod, S. D., Søvde, O. A., Isaksen, I. S. A., Froidevaux, P., and Funke, B.: Measuring and modeling the lifetime of nitrous oxide including its variability, J. Geophys. Res.-Atmos., 120, 5693–5705, https://doi.org/10.1002/2015JD023267, 2015. a
Rhodes, R. H., Brook, E. J., Chiang, J. C. H., Blunier, T., Maselli, O. J., McConnell, J. R., Romanini, D., and Severinghaus, J. P.: Enhanced tropical methane production in response to iceberg discharge in the North Atlantic, Science, 348, 1016–1019, https://doi.org/10.1126/science.1262005, 2015. a, b, c, d, e, f, g, h
Rhodes, R. H., Faïn, X., Brook, E. J., McConnell, J. R., Maselli, O. J., Sigl, M., Edwards, J., Buizert, C., Blunier, T., Chappellaz, J., and Freitag, J.: Local artifacts in ice core methane records caused by layered bubble trapping and in situ production: a multi-site investigation, Clim. Past, 12, 1061–1077, https://doi.org/10.5194/cp-12-1061-2016, 2016. a, b
Rosen, J. L., Brook, E. J., Severinghaus, J. P., Blunier, T., Mitchell, L. E., Lee, J. E., Edwards, J. S., and Gkinis, V.: An ice core record of near-synchronous global climate changes at the Bølling transition, Nat. Geosci., 7, 459–463, https://doi.org/10.1038/ngeo2147, 2014. a
Schilt, A., Baumgartner, M., Blunier, T., Schwander, J., Spahni, R., Fischer, H., and Stocker, T. F.: Glacial–interglacial and millennial-scale variations in the atmospheric nitrous oxide concentration during the last 800,000 years, Quaternary Sci. Rev., 29, 182–192, https://doi.org/10.1016/j.quascirev.2009.03.011, 2010a. a, b, c, d, e, f, g, h, i, j, k, l
Schilt, A., Baumgartner, M., Schwander, J., Buiron, D., Capron, E., Chappellaz, J., Loulergue, L., Schüpbach, S., Spahni, R., Fischer, H., and Stocker, T. F.: Atmospheric nitrous oxide during the last 140,000 years, Earth Planet. Sc. Lett., 300, 33–43, https://doi.org/10.1016/j.epsl.2010.09.027, 2010b. a
Schilt, A., Baumgartner, M., Eicher, O., Chappellaz, J., Schwander, J., Fischer, H., and Stocker, T. F.: The response of atmospheric nitrous oxide to climate variations during the last glacial period, Geophys. Res. Lett., 40, 1888–1893, https://doi.org/10.1002/grl.50380, 2013. a, b, c, d, e, f, g, h
Schilt, A., Brook, E. J., Bauska, T. K., Baggenstos, D., Fischer, H., Joos, F., Petrenko, V. V., Schaefer, H., Schmitt, J., Severinghaus, J. P., Spahni, R., and Stocker, T. F.: Isotopic constraints on marine and terrestrial N2O emissions during the last deglaciation, Nature, 516, 234–237, https://doi.org/10.1038/nature13971, 2014. a, b, c, d, e
Schmidely, L., Nehrbass-Ahles, C., Schmitt, J., Han, J., Silva, L., Shin, J., Joos, F., Chappellaz, J., Fischer, H., and Stocker, T. F.: CH4 and N2O fluctuations during the penultimate deglaciation, Climate of the Past Discussions, NOAA [data set], available at: https://www.ncdc.noaa.gov/paleo/study/33673 (last access: 29 July 2021), 2020. a
Schmitt, J., Seth, B., Bock, M., and Fischer, H.: Online technique for isotope and mixing ratios of CH4, N2O, Xe and mixing ratios of organic trace gases on a single ice core sample, Atmos. Meas. Tech., 7, 2645–2665, https://doi.org/10.5194/amt-7-2645-2014, 2014. a, b, c
Schmittner, A. and Galbraith, E. D.: Glacial greenhouse-gas fluctuations controlled by ocean circulation changes, Nature, 456, 373–376, https://doi.org/10.1038/nature07531, 2008. a, b
Skinner, L. C. and Shackleton, N. J.: Deconstructing Terminations I and II: revisiting the glacioeustatic paradigm based on deep-water temperature estimates, Quaternary Sci. Rev., 25, 3312–3321, https://doi.org/10.1016/j.quascirev.2006.07.005, 2006. a
Sowers, T.: N2O record spanning the penultimate deglaciation from the Vostok ice core, J. Geophys. Res.-Atmos., 106, 31903–31914, https://doi.org/10.1126/science.1121235, 2001. a, b
Spahni, R., Chappellaz, J., Stocker, T. F., Loulergue, L., Hausammann, G., Kawamura, K., Flückiger, J., Schwander, J., Raynaud, D., and Masson-Delmotte, V.: Atmospheric methane and nitrous oxide of the late Pleistocene from Antarctic ice cores, Science, 310, 1317–1321, https://doi.org/10.1126/science.1120132, 2005. a, b, c, d
Van Groenigen, K. J., Osenberg, C. W., and Hungate, B. A.: Increased soil emissions of potent greenhouse gases under increased atmospheric CO2, Nature, 475, 214–216, https://doi.org/10.1038/nature10176, 2011. a, b
Veres, D., Bazin, L., Landais, A., Toyé Mahamadou Kele, H., Lemieux-Dudon, B., Parrenin, F., Martinerie, P., Blayo, E., Blunier, T., Capron, E., Chappellaz, J., Rasmussen, S. O., Severi, M., Svensson, A., Vinther, B., and Wolff, E. W.: The Antarctic ice core chronology (AICC2012): an optimized multi-parameter and multi-site dating approach for the last 120 thousand years, Clim. Past, 9, 1733–1748, https://doi.org/10.5194/cp-9-1733-2013, 2013. a
- Abstract
- Introduction
- Method
- Results
- Discussion
- Conclusions
- Appendix A: New measurement system for CH4 and N2O
- Appendix B: Construction of composite CH4 and N2O records
- Data availability
- Author contributions
- Competing interests
- Disclaimer
- Acknowledgements
- Financial support
- Review statement
- References