the Creative Commons Attribution 4.0 License.
the Creative Commons Attribution 4.0 License.
 | 03 Aug 2021
Aptian–Albian clumped isotopes from northwest China: cool temperatures, variable atmospheric pCO2 and regional shifts in the hydrologic cycle
Marina B. Suarez
Jessica Uglesich
Hailu You
Daqing Li
Peter Dodson
The Early Cretaceous is characterized by warm background temperatures (i.e., greenhouse climate) and carbon cycle perturbations that are often marked by ocean anoxic events (OAEs) and associated shifts in the hydrologic cycle. Higher-resolution records of terrestrial and marine δ13C and δ18O (both carbonates and organics) suggest climate shifts during the Aptian–Albian, including a warm period associated with OAE 1a in the early Aptian and a subsequent “cold snap” near the Aptian–Albian boundary prior to the Kilian and OAE 1b. Understanding the continental system is an important factor in determining the triggers and feedbacks to these events. Here, we present new paleosol carbonate stable isotopic (δ13C, δ18O and Δ47) and CALMAG weathering parameter results from the Xiagou and Zhonggou formations (part of the Xinminpu Group in the Yujingzi Basin of NW China) spanning the Aptian–Albian. Published mean annual air temperature (MAAT) records of the Barremian–Albian from Asia are relatively cool with respect to the Early Cretaceous. However, these records are largely based on coupled δ18O measurements of dinosaur apatite phosphate (δ18Op) and carbonate (δ18Ocarb) and therefore rely on estimates of meteoric water δ18O (δ18Omw) from δ18Op. Significant shifts in the hydrologic cycle likely influenced δ18Omw in the region, complicating these MAAT estimates. Thus, temperature records independent of δ18Omw (e.g., clumped isotopes or Δ47) are desirable and required to confirm temperatures estimated with δ18Op and δ18Oc and to reliably determine regional shifts in δ18Omw. Primary carbonate material was identified using traditional petrography, cathodoluminescence inspection, and δ13C and δ18O subsampling. Our preliminary Δ47-based temperature reconstructions (record mean of 14.9 ∘C), which we interpret as likely being representative of MAAT, match prior estimates from similar paleolatitudes of Asian MAAT (average ∼ 15 ∘C) across the Aptian–Albian. This, supported by our estimated mean atmospheric paleo-pCO2 concentration of 396 ppmv, indicates relatively cooler midlatitude terrestrial climate. Additionally, our coupled δ18O and Δ47 records suggest shifts in the regional hydrologic cycle (i.e., ΔMAP, mean annual precipitation, and Δδ18Omw) that may track Aptian–Albian climate perturbations (i.e., a drying of Asian continental climate associated with the cool interval).
- Article
(18989 KB) - Full-text XML
-
Supplement
(48185 KB) - BibTeX
- EndNote


Early Cretaceous climate is characterized by a warm background greenhouse climate state and perturbations to climate and the carbon cycle associated with shifts in global δ13C, including Cretaceous ocean anoxic events (OAEs; Föllmi, 2012; Hay, 2016; Jenkyns, 2018). Such climate aberrations can provide insight into the sensitivities and coupling of the carbon cycle, climate, and the hydrologic cycle through quantitative reconstruction of past physical and environmental conditions (e.g., atmospheric paleo-pCO2, temperature and precipitation). Indeed, much work has been done generating geochemical proxy-based observations and simulations of past global warming events which serve as useful analogues of future warming (e.g., Zachos et al., 2008; Hönisch et al., 2012; Hay, 2016). Similarly, both long-term and abrupt cooling intervals in the past can supply proxy-based observations of negative climate feedbacks associated with carbon sequestration and global cooling.
Multiple climate events (including OAEs) have been identified during the late Early Cretaceous (Jenkyns, 2018; Vickers et al., 2019) oftentimes referred to as the mid-Cretaceous (i.e., here, our records span the Aptian–Albian; 125 to 100.5 Ma). While limited, available temperature records (e.g., Jenkyns, 2018) and high-latitude sedimentological evidence (Vickers et al., 2019) suggest a relatively cool interval (following warmth during OAE 1a) associated with a global carbon isotope maximum (i.e., “C10”; Menegatti et al., 1998; Bralower et al., 1999; Mutterlose et al., 2009) at the Aptian–Albian boundary prior to OAE 1b (Bottini et al., 2015). Estimates of Aptian–Albian atmospheric paleo-pCO2, while highly uncertain, tend to suggest low (less than 1000 to 1500 ppmv background greenhouse climate conditions; Franks et al., 2014) concentrations at the Aptian–Albian consistent with a cooler climate (Ekart et al., 1999; Wallmann, 2001; Fletcher et al., 2005; Aucour et al., 2008; Passalia, 2009; Haworth et al., 2010; Du et al., 2018). This C10 interval has been identified on land using stable isotopes in terrestrial paleosol carbonates and organic carbon from the continental interiors of North America (Ludvigson et al., 2010; Suarez et al., 2014) and Asia (Suarez et al., 2018). For Asia, Aptian–Albian terrestrial temperature estimates have been generated using oxygen isotopes in dinosaur tooth enamel (Amiot et al., 2011) and suggest a relatively cool interval (e.g., ∼ 10 ± 4 ∘C mean annual air temperature, MAAT; ∼ 42∘ N paleolatitude) consistent with marine paleotemperatures (Mutterlose et al., 2009; Bottini et al., 2015) and elevated global carbonate δ13C (Menegatti et al., 1998; Bralower et al., 1999). However, MAAT estimates from δ18O of dinosaur tooth enamel phosphate (δ18Op) hinge on the relationship between mean annual temperature, latitude and the δ18O of meteoric water or δ18Omw (Amiot et al., 2004). δ18Omw is influenced by other parameters in addition to temperature and latitude and is further complicated as the intensity of poleward moisture transport is altered by greenhouse climate conditions. Therefore, confirming these temperatures with a secondary geochemical proxy is warranted.
Hydrologic cycle models and observations of past warm intervals (e.g., early Cenozoic and greenhouse Cretaceous) indicate an “intensification” of the hydrologic cycle due to enhanced poleward moisture transport associated with global warming (e.g., White et al., 2001; Poulsen et al., 2007; Suarez et al., 2011a; Hasegawa et al., 2012; Carmichael et al., 2016). Likewise, as temperatures cool during Cretaceous climate recovery or during long-term transitions driven by changes in global tectonics and paleogeography, the hydrologic cycle tends to respond with regionally dependent shifts in mean annual precipitation (MAP). For example, Hasegawa et al. (2012) observed the hydrologic cycle responses track greenhouse gas (GHG) forcing in Asia during the mid-Cretaceous. For the Aptian–Albian, models and observations suggest changes in continental-interior precipitation during the global “cold snap” (e.g., Mutterlose et al., 2009) and the potential for variable Asian aridity associated with warm/cool cycles (Poulsen et al., 2007; Zhou et al., 2008; Hasegawa et al., 2010, 2012; Föllmi, 2012; Tabor et al., 2016), which may hamper δ18Op-based temperature reconstructions for the Aptian–Albian that fail to quantify δ18Omw independently of δ18Op. To address this deficiency, here we provide new multi-proxy records from the Yujingzi Basin of NW China spanning the Aptian–Albian using δ13C, δ18O and Δ47 (i.e., clumped isotopes) of terrestrial paleosol carbonates. Additionally, MAP is quantified using chemical weathering ratios, specifically CALMAG (Nordt and Driese, 2010). We combine our new records with organic stable carbon isotope chemostratigraphic records for the site (Suarez et al., 2018) to provide age control to quantitatively interpret shifts in regional temperature, δ18Omw, MAP and global atmospheric paleo-pCO2 associated with the Aptian–Albian. These proxy interpretations are compared to models and records of Cretaceous Asian climate and the global exogenic carbon cycle (i.e., atmospheric paleo-pCO2) to provide new constraints on Aptian–Albian climate, carbon and hydrologic cycles.
2.1 Sampling and analyses
The Xiagou and Zhonggou formations, part of the Xinminpu Group in the Yujingzi Basin of northwest China (Gansu Province), were sampled in 2011 with the goal of placing the Early Cretaceous paleobiology and geology of this region in a global climate and carbon isotope chemostratigraphic framework (e.g., Suarez et al., 2018). The Xinminpu Group, approximately Early Cretaceous in northwest China, is composed of four formations (ordered stratigraphically bottom to top): Chijinqiao Formation, Chijinpu Formation, Xiagou Formation and Zhonggou Formation. Outside of the Yujingzi Basin, Xinminpu Group strata produce Aptian radiometric dates of 123.0 ± 2.6 to 133.7 ± 1.8 Ma (Li et al., 2013; Kuang et al., 2013). Additionally, a recent study (Zheng et al., 2021) establishes regional ages through bio- and chronostratigraphy. They review available age controls for the Lower Cretaceous in northwest China and place the organic carbon isotope records of Suarez et al. (2018) (i.e., our study sections) within the chronostratigraphic framework of the region. Zheng et al. (2021) provide additional evidence that our study section spans the “C10” interval at the Aptian–Albian boundary. Outcrop sections (Fig. 1) are regionally exposed in the Yujingzi Basin at a fossil-rich site informally known as the White Pagoda Site, produced by accommodation of strike-slip motion from Lhasa Block convergence with Asia (Chen and Yang, 1996; Vincent and Allen, 1999).
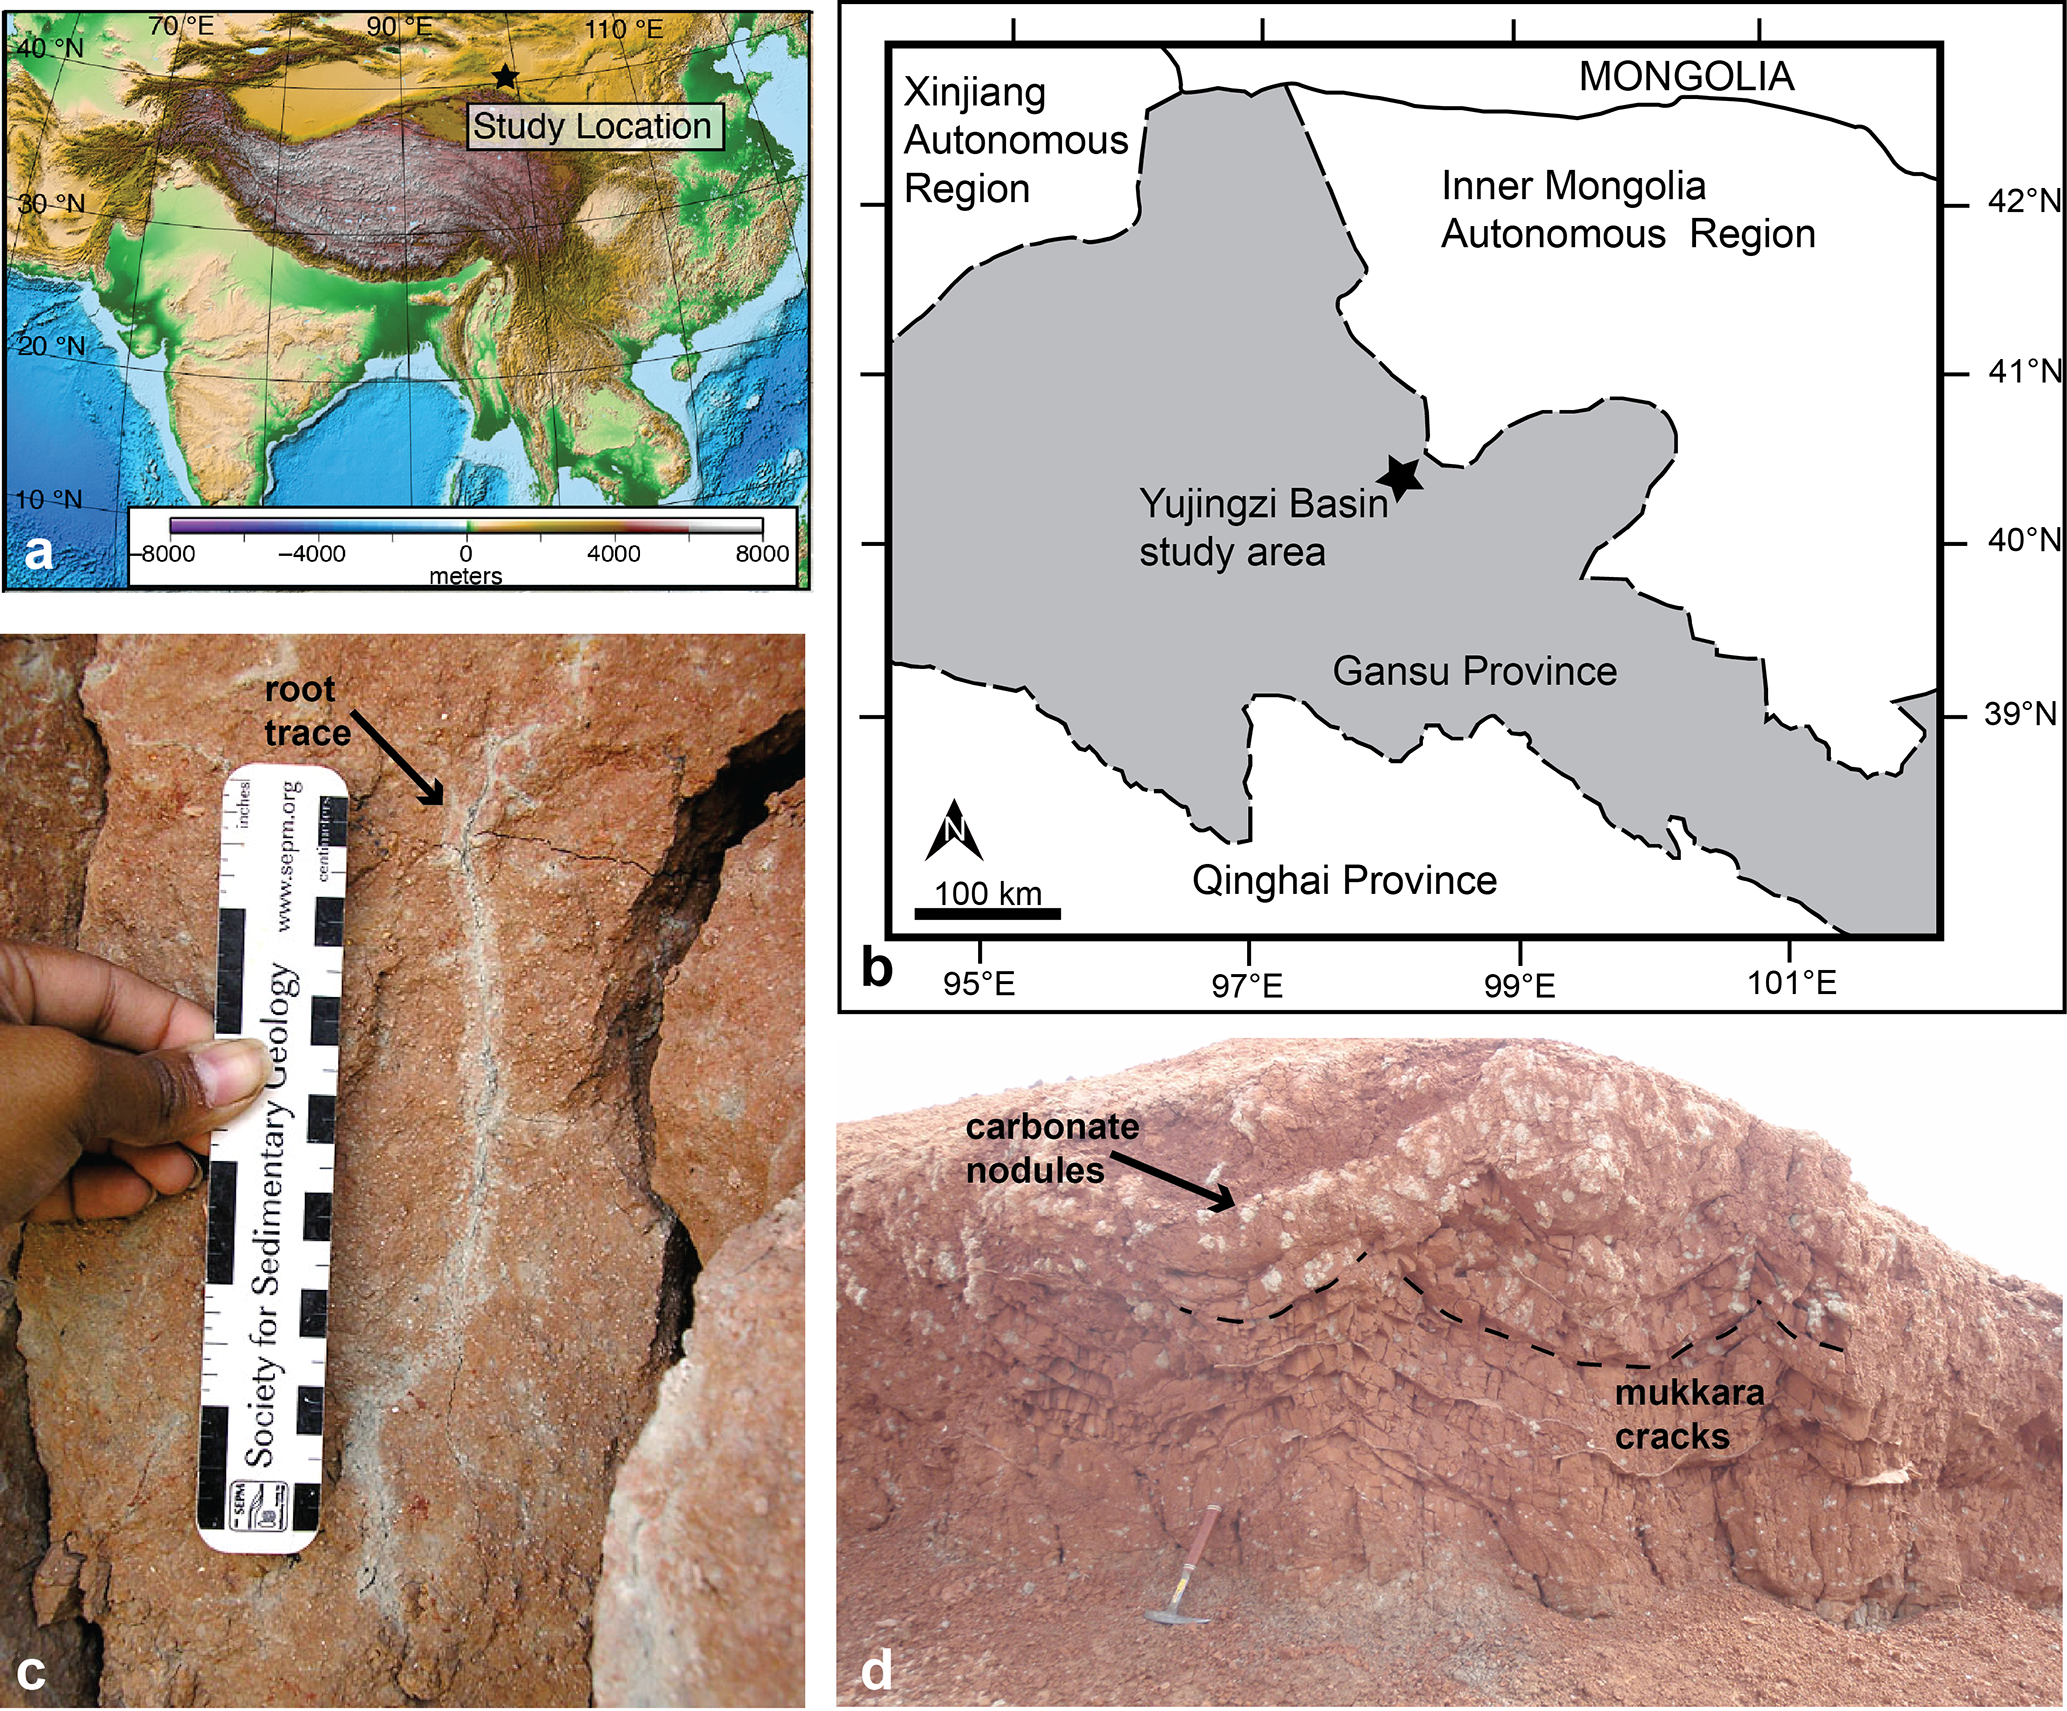
Figure 1Approximate location of sampled sections with respect to regional topography (a; Amante and Eakins, 2009) and geography (b). Outcrop images of carbonate nodule bearing Vertisol section typical of the composite study section (c, d). Root traces, mukkara cracks, ped structure and coloration (Retallack, 1997) are all indicative of Vertisols.
Outcrop sections for White Pagoda were numbered and split into three facies by Suarez et al. (2018): (1) the lowermost facies consisting of sections 1, 2, 2A, dominated by sandstones, (2) an overlying facies of alternating gray and variegated mudstones and muddy sandstones consisting of sections 3, 3A–H and 6, and (3) coarse-grained poorly sorted arkosic sandstones and sandy mudstones (section 4). Here, we utilize sample material from sections (in stratigraphic order) 3, 3A–H, 6 and 4 (see Fig. S1 in the Supplement for lithostratigraphic details). Suarez et al. (2018) observed carbonate nodules, root traces, charophytes, turtle remains, ostracods and gastropods within the middle facies (sections 3, 3A–H and 6), with root traces and nodules extending into the uppermost facies (section 4). Section 4 had a higher degree of color mottling, blocky ped structures and burrows compared to the underlying facies. Facies interpretations for sections sampled for this study indicate fluvio-lacustrine and palustrine environments (i.e., Suarez et al., 2018). For example, sections 3, 3A-H, 6 and 4 exhibit evidence of subaerial exposure (soils indicated by horizonation, slickensides, root traces and carbonate nodule formation), fluvial deposition (lenticular sands fining up with erosive bases) and lacustrine environments (turtle remains, charophytes, ostracods, thin limestones and organic-rich mudstones) (Suarez et al., 2018; Fig. 1). For the sections of interest, the presence of cracking, slickensides (mukkara structures) and expansive clays suggests wet and dry periods typical of Vertisols (Fig. 1).
The organic stable carbon isotope record at White Pagoda was used as a guide to sample carbonate nodules for analysis. Specifically, samples were selected to span deposition before, during and after carbon isotope excursions of interest, namely the C10 excursion. Nodules for analysis were sampled from well below channel sands and surface paleosol horizons in outcrop (i.e., sampled from paleosol B horizons; Tabor and Myers, 2015) to help avoid potential surficial biases on carbonate (e.g., radiative heating in soil depths < 50 cm; Burgener et al., 2019). Paleosols from which nodules are sampled are fine grained throughout the section, which suggests suitability for clumped isotope-based MAAT interpretation (e.g., Kelson et al., 2020).
Thin sections were cut from hand samples for petrographic analysis and cathodoluminescence (CL) imaging to aid in the identification and isolation of primary carbonate nodule material. Briefly, thin sections were inspected for environmental indicators and microfabrics and photographed under plane-polarized and cross-polarized light (PPL and XPL, respectively) using an Olympus BX43P petrographic microscope with an SC50 Olympus camera. Thin sections were then CL imaged using a Relion Industries Reliotron III cold-cathode chamber, with operating conditions consisting of a rarified helium atmosphere at 50 millitorr (6.7 Pa), accelerating voltage of 10 kV and a beam current of 0.5 mA (i.e., conditions for high luminescence sensitivity). Macroscale imaging through the 50 mm top window of the chamber was carried out using a 16 Mpx Canon EOS SL1 DSLR camera with a macro lens suspended over the CL chamber. Microphotography of CL images was taken with an Olympus BX41 compound microscope and DP73 17 megapixel Olympus camera at the Kansas Geologic Survey. CL imaging was used to detect any heterogeneities in cation substitution which may indicate alteration, as Mn2+ tends to substitute for Ca2+ in reducing conditions generating bright orange luminescence (Habermann et al., 2000; Cazenave et al., 2003). While luminescence in biogenic carbonates (e.g., mollusk shells) indicate diagenetic alteration from the original carbonate, high luminescence does not always indicate a degree of diagenesis in soil and palustrine carbonates which likely form in conditions that are alternately saturated and reducing and unsaturated and oxidative as water tables fluctuate (Ludvigson et al., 2010; Mintz et al., 2011).
Once located in thin section using petrography and CL, primary nodule carbonate was mapped onto the corresponding thin-section billet and sampled using a dental drill. In some samples, suspect non-primary carbonate material (e.g., spar) was also sampled for isotopic comparison but excluded from primary carbonate isotopic averages reported here. Depending on the number of nodules and lithologic complexity of a hand sample, approximately eight to fourteen ∼ 50 µg samples were drilled for traditional stable isotopes (i.e., δ13C and δ18O) in each hand sample. Stable isotope samples were heated to 200 ∘C in a vacuum for 1 h prior to analysis via ThermoFinnigan MAT 253 gas source isotope ratio mass spectrometer (IR-MS) coupled to a Kiel IV carbonate device at the University of Kansas (KU) Keck-NSF Paleoenvironmental and Environmental Stable Isotope Laboratory (KPESIL). Standard reproducibility indicates analytical precision (1σ) of 0.03 ‰ and 0.05 ‰ for δ13C and δ18O, respectively.
Following δ13C and δ18O analysis of dental-drilled carbonate powder, larger samples (∼ 6 mg of material for each analysis; n = 4 per sample with the exception of one sample with n = 3) were drilled for clumped isotope (Δ47) analysis from areas of primary nodule carbonate exhibiting uniform δ13C and δ18O and CL. Our pedogenic carbonate nodules were centimeter to multi-centimeter in scale, providing ample carbonate material for sampling. Clumped isotopes were measured at the University of Colorado Boulder (CUB) Earth Systems Stable Isotope Laboratory (CUBES-SIL) on a custom automated vacuum line sample introduction system, in which samples are digested at 90 ∘C in a common phosphoric acid bath. This system removes isobaric contamination by entraining the CO2 sample in helium and passing it through a ∼ 1.5 m long stainless steel column hand packed with Poropak for 45 min at −20 ∘C. CO2 is transferred to the sample side bellows of a ThermoFinnigan dual inlet MAT 253+. Values are reported relative to the carbon dioxide equilibration scale (Dennis et al., 2011), using gases with a range of bulk δ47 values and equilibrated at 1000 and 25 ∘C to convert in-house values to the Carbon Dioxide Equilibration Scale (CDES). IUPAC parameters for 17O corrections (Brand et al., 2010) were used in the initial steps of data reduction, following recommendations of Daëron et al. (2016) and Schauer et al. (2016). We then applied an acid correction factor (0.088 ‰) appropriate for use with values calculated using IUPAC parameters (Petersen et al., 2019). In addition to the heated and equilibrated gas reference frame, international carbonate standards (i.e., ETH1, ETH2, ETH3, ETH4, IAEA-C1, IAEA-C2, Merck and NBS19) were utilized to further correct Δ47 values (see Table S1 for acquired standard values). Potentially contaminated data were culled (e.g., sample analyses which exhibit Δ48 excess that tracks variability in Δ47; see Supplement). Replicate analyses tended to be highly consistent (see Supplement; Tables S2 and S3 for raw data).
X-ray fluorescence (XRF) measurements were carried out on samples from horizons that appear to be well-developed paleosols, specifically horizons interpreted as B horizons. Analysis was completed with a Rigaku Primus II WD-XRF spectrometer at the University of Texas at San Antonio. Raw X-ray intensities were calibrated by the analysis of eight USGS certified elemental standards (BIR-1a, COQ-1, DNC-1a, GSP-2, RGM-2, SBC-1, STM-2, W-2a), with an RSD (relative standard deviation) value of 0.036 %. Weight percentages were converted into molar weights before the application of a chemical index, following Sheldon and Tabor (2009). Al2O3, CaO and MgO are the oxides used for the calculation of the CALMAG (Nordt and Driese, 2010) chemical weathering index (see following section for parameter calculation and proxy details).
2.2 Quantitative proxies
Clumped isotopes (i.e., Δ47) have been successfully utilized to estimate temperature in carbonates, leveraging the thermodynamically controlled abundance of isotopically heavy 13C and 18O bonded isotopes (Ghosh et al., 2006; Schauble et al., 2006) relative to a stochastic abundance of such “clumps”. This approach has an advantage over δ18O-based temperature estimates, as other controlling variables (e.g., δ18Omw) need not be estimated. Δ47 values are translated into calcification temperature following the calibration of Petersen et al. (2019), and we define our temperature uncertainty as 2σ, or twice the mean propagated external precision (1σ) of each Δ47 analysis, as this likely captures compounded uncertainties in our temperature estimates (Fernandez et al., 2017; Bernasconi et al., 2021). We also include 2SE uncertainty for Δ47 (Fig. 5 and Table S3). Additional temperature calibration approaches (i.e., Ghosh et al., 2006; Bonifacie et al., 2017) and calculation details (i.e., R code for data analysis) are available in the Supplement. However, for this study, in subsequent calculations and figures, we opt for Petersen et al. (2019) Δ47 values and calibration temperatures calculated using the following relationship:
Groundwater δ18O is derived from the oxygen isotopic composition of precipitation, which is ultimately controlled by factors such as temperature, amount, continentality and seasonality. It can be further modified by processes such as evaporation in paleoenvironments which experience wet and dry cycles. δ18O of groundwater (δ18Ow) can be determined for pedogenic carbonate calcification once temperature is known and δ18Ocarb is measured following Friedman and O'Neil (1977):
To estimate mean regional precipitation for the study interval and determine shorter-term precipitation variability in our record, we use the bulk geochemical compositional proxy CALMAG (Nordt and Driese, 2010), which utilizes the gains and losses of elemental oxide abundances as a result of weathering in Vertisols. The concentration of aluminum oxide, calcium oxide and magnesium oxide are estimated using XRF, and the CALMAG parameter is determined:
Mean annual precipitation (MAP) is then determined from the CALMAG parameter based on the Nordt and Driese (2010) calibration:
Paleosols have been widely utilized as archives to determine the past concentration of atmospheric pCO2 (Cerling, 1991; Ekart et al., 1999). While requiring a number of assumptions, soil carbonate nodule δ13C, when used in tandem with estimates from other proxies (e.g., MAP from CALMAG and respired soil δ13C from δ13Corg), provides many of the most robust estimates of Cretaceous atmospheric pCO2 outside of a stomatal approach (Franks et al., 2014), especially because paleosol carbonate nodules are abundant in the rock record. The soil carbonate paleobarometer uses a diffusion model in which atmospheric pCO2 (δ13Ca) and respired CO2 from soils (δ13Cr) are the dominant controls on soil CO2 (δ13Cs) following the mixing model of Cerling (1991) in terms of δ13C (Ekart et al., 1999). The relative isotopic influence of atmospheric versus respired CO2 on soil CO2 (i.e., the source CO2 for calcite) will therefore be controlled by the concentration of CO2 in the atmosphere if the concentration of the soil-derived component of total gas at depth, S(z), is accounted for following Ekart et al. (1999):
δ13Cs can be determined from δ13Ccarb, assuming temperature-dependent fractionation (here we use Δ47-based temperature) between gaseous soil CO2 and carbonate (Romanek et al., 1992). Suarez et al. (2018) correlated sections in this study to bulk carbonate surface marine sections using δ13C chemostratigraphy. We estimate atmospheric δ13C (i.e., δ13Ca) from a marine section correlated chemostratigraphically with the White Pagoda Site (i.e., Peregrina Canyon, Mexico of Bralower et al., 1999, correlated to White Pagoda by Suarez et al., 2018), applying a δ13CDIC (i.e., δ13C of marine dissolved inorganic carbon, DIC) to δ13Ca fractionation of −8.23 ‰ consistent with “greenhouse climate” carbon cycle simulations (i.e., Zeebe, 2012) and assuming the bulk carbonate δ13C for the Peregrina Canyon section is representative of global surface DIC δ13C. This results in δ13Ca values ranging from −5.38 to −4.18 in samples used to compute pCO2. For δ13Cr, we apply the bulk sedimentary organic carbon δ13C values of Suarez et al. (2018).
In addition to estimates of δ13C for the three carbon reservoirs outlined above, the term S(z), or the depth-dependent contribution of soil-respired CO2, must be determined to compute atmospheric paleo-pCO2. While this term is a significant source of uncertainty due in part to a large range of potential past environmental conditions, Cotton and Sheldon (2012) hypothesized a relationship between summer minimum S(z) and MAP using observations of modern soils:
Here, we apply their relationship to compute S(z) from our CALMAG-based MAP estimates. It is important to note that the relationship defined by Cotton and Sheldon (2012) uses a dataset which does not include humid climate soils or Vertisols, and it is therefore cautiously applied and discussed in terms of paleoenvironmental influence on our paleo-pCO2 estimates (i.e., we evaluate our atmospheric pCO2 record against a large range in S(z)).
3.1 Petrography
Based on carbonate petrography we recognize two distinct microfacies in our samples and split samples into two groups (microfacies (i) and (ii)) to evaluate the origin of stable isotope values (primary vs. secondary; depositional environment) (Fig. 2; Table 1). Microfacies (i) is characterized by distinct nodules which originated from primarily clayey horizons, consisting of dense micrite with abundant root traces and fractures filled with sparry calcite and microspar calcite (Fig. 2). Fracturing is less pervasive and micritic nodules include less clay minerals in microfacies (i). Nodule micrite is dull to brightly luminescent under CL and secondary spar-filled fractures and voids tend to be non-luminescent or dull. The clay matrix displays birefringent microfabric and contains subangular to subrounded clasts of calcic and siliciclastic grains (mainly quartz and feldspars as well as fragments of other nodules) (Fig. 3). Microfacies (i) includes samples 3-021, 3A-097, 4-038 and 3H-014.

Figure 2Annotated photomicrographs from select carbonate nodules of the White Pagoda Site. Samples are split into two microfacies (a, b) with sample 3F-019 appearing to be a mixture of the two microfacies (c).
Table 1Primary carbonate stable isotope data measured at KU (δ13C and δ18O) for the White Pagoda Site. Δδ13C calculated with δ13Corg of Suarez et al. (2018).

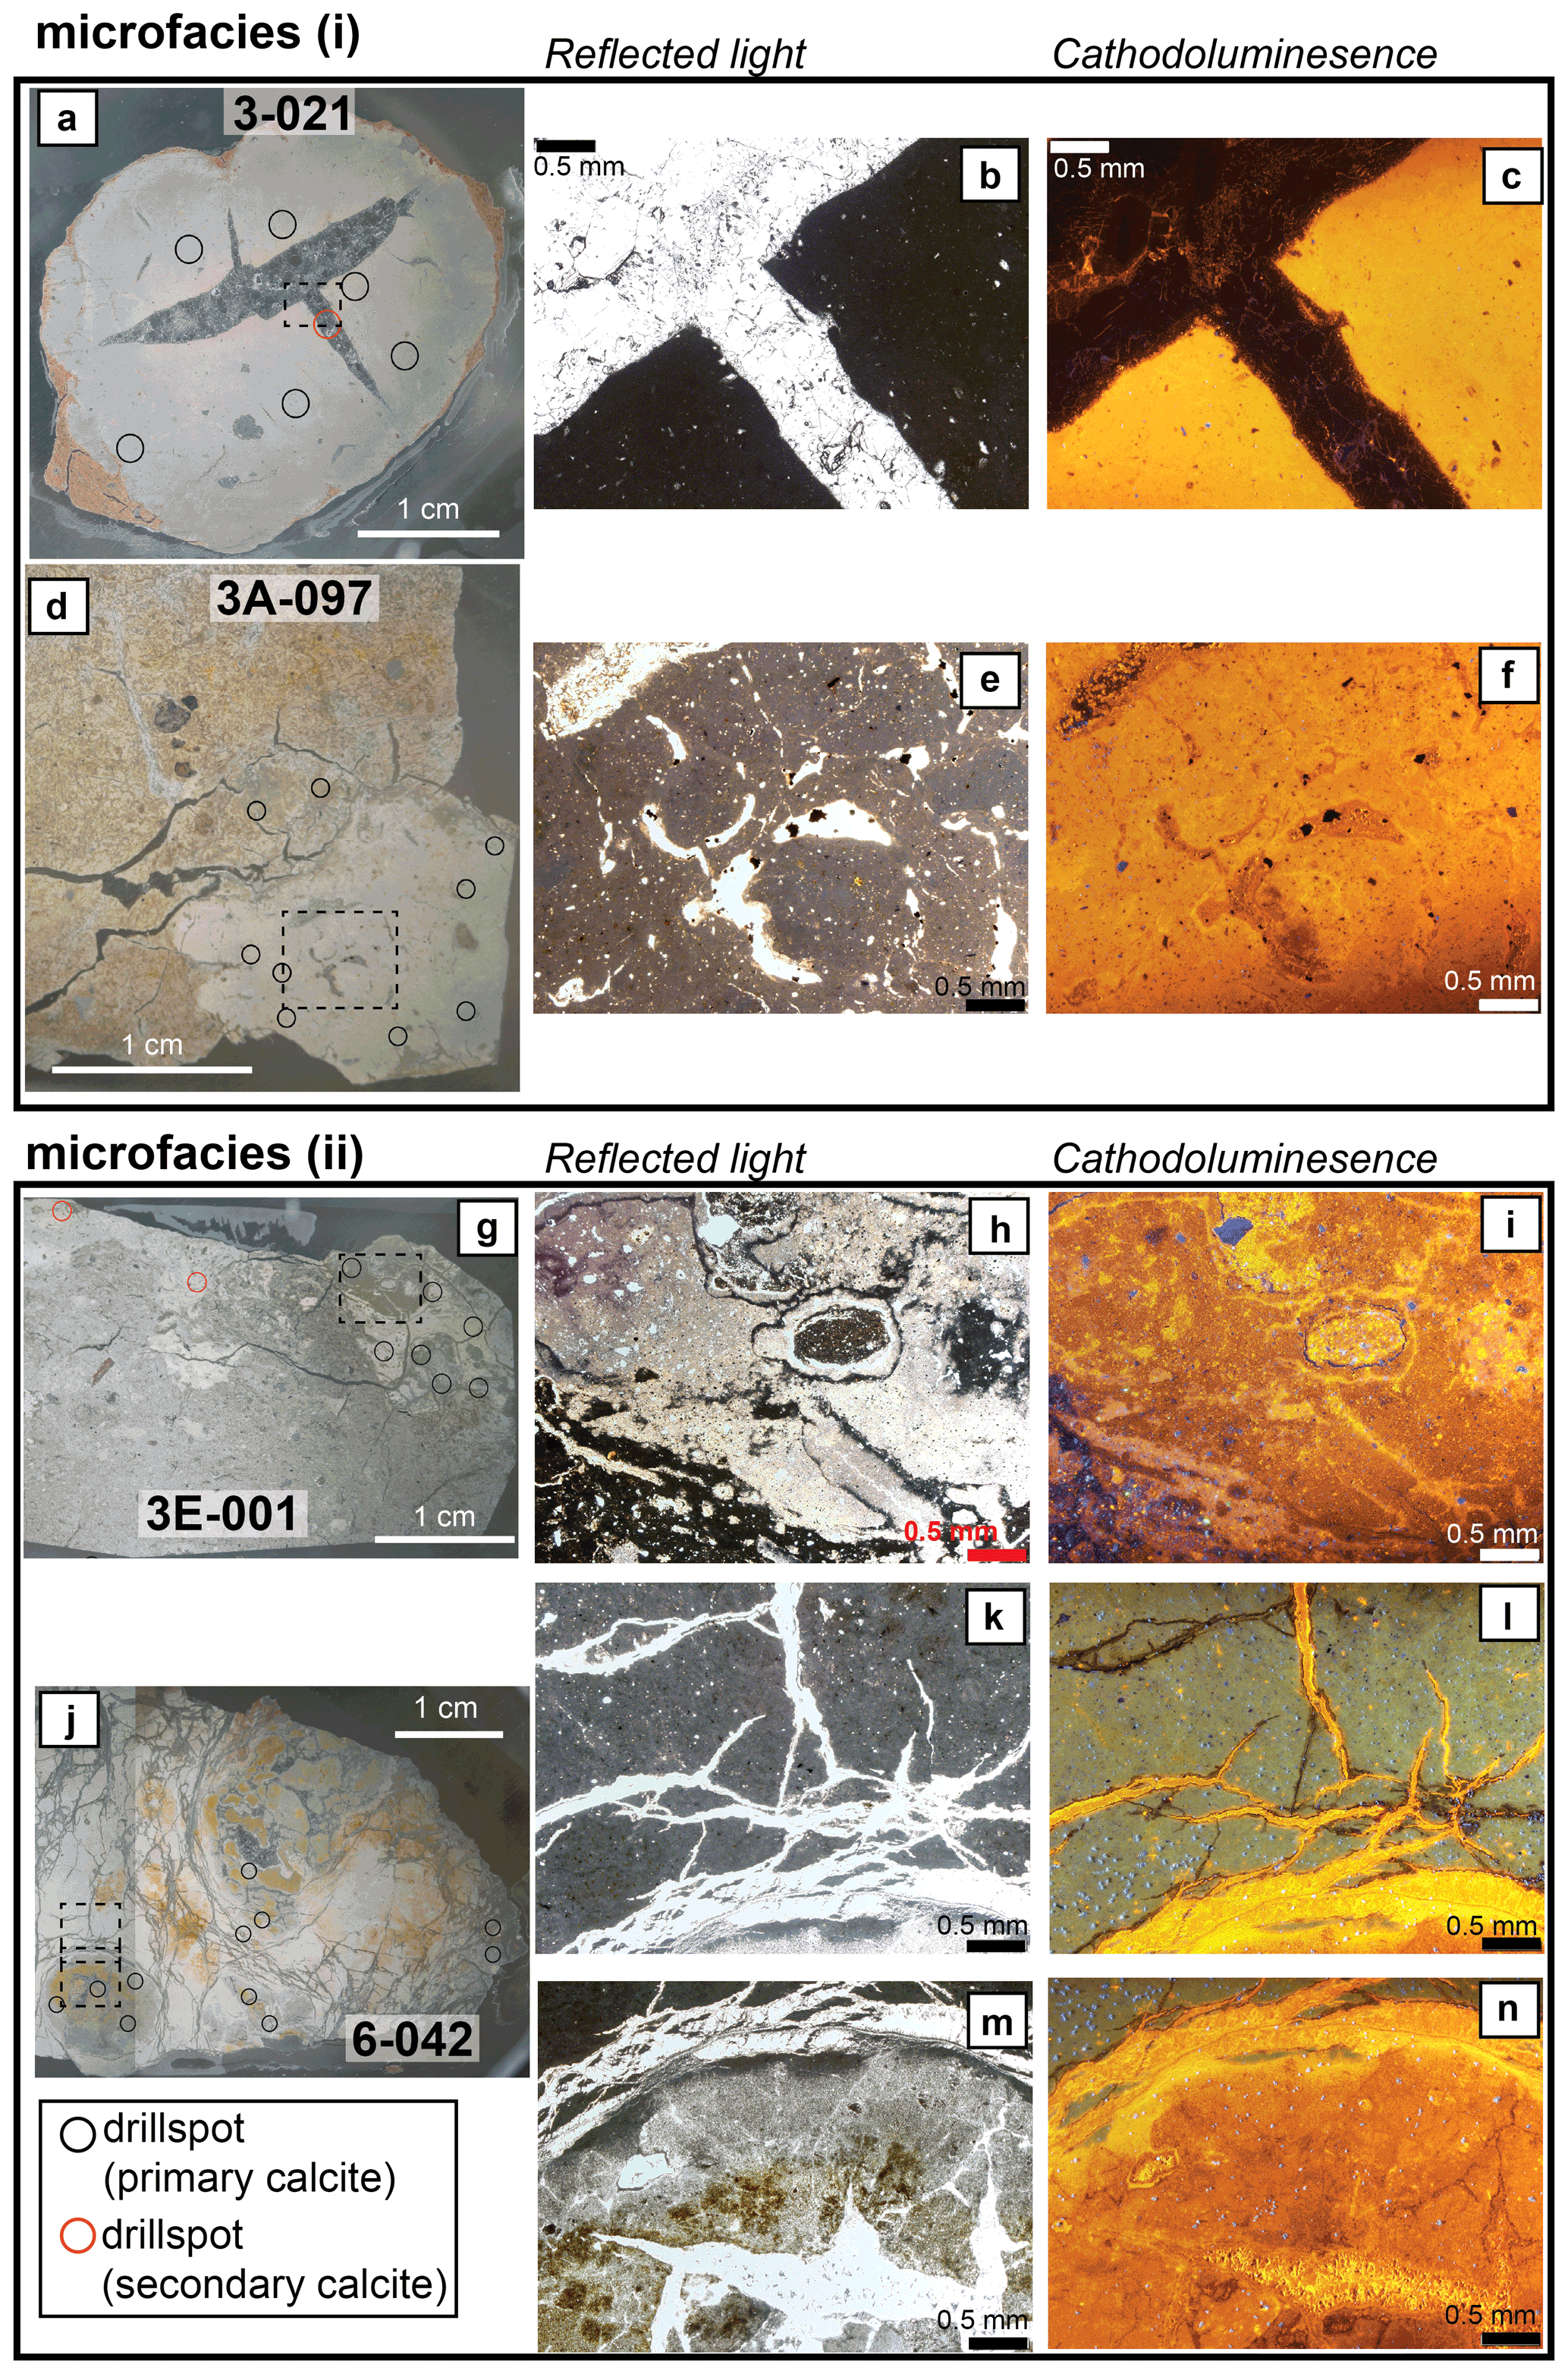
Figure 3Reflected light (left column), transmitted light (middle column) and cathodoluminescence (CL; right column) images of select nodule thin sections (two from each microfacies group; top two samples are microfacies (i) and bottom two samples are microfacies (ii)). Samples 3-021 (a–c), 3A-097 (d–f), 3E-001 (g–i) and 6-042 (j–m) are included. Drill spots for δ13C and δ18O analysis, mapped from billets, are indicated by circles. Dashed squares are the approximate field of view for transmitted light and CL images.
Samples in microfacies (ii) (observed in samples 3B-021, 3E-001, 6-003 and 6-042) tend to be coalesced nodules or beds comprised almost entirely of clay-rich microcrystalline calcite in which discreet nodules are less evident (e.g., samples 3E-001 and 6-042; Fig. 3). Microfacies (ii) shows dull yellow to orange luminescence of the micrite with brightly luminescent spar-filled fracture voids. The microfacies displays a higher degree of CL heterogeneity (i.e., patchiness). For example, Mn staining tends to luminesce to a greater degree than surrounding non-Mn-stained micrite (Fig. 3). The second microfacies is characterized by clay-rich (i.e., common to frequent in abundance) micritic limestone with abundant fracturing and brecciation, including circum-granular fractures (i.e., sample 6-042; Fig. 3). These are filled with microspar and spar (Fig. 2). Color mottling and Mn staining are observed, perhaps related to microbial activity (i.e., thrombolites and/or pisoids; Fig. 2b). Sample 3F-019 appears to be a mixture of the two microfacies, with dense, brightly luminescent (i.e., CL) micritic nodules in a dominantly clay matrix, mottled coloring in thin section, rhizoliths, circum-granular fractures and Mn staining (Fig. 2c). Nodules appear slightly coalesced in this sample (i.e., unlike microfacies (i)), whilst the individual nodule shape is somewhat maintained (i.e., unlike microfacies (ii)). CL displayed by White Pagoda samples is consistent with previous descriptions of vertic soil carbonates in which dull to lightly luminescent primary nodule carbonate is differentiated with either non-luminescing (early) or brightly luminescing (late) secondary material (Driese and Mora, 1993). In addition, variation in the luminescence of soil carbonates from modern Vertisols (Mintz et al., 2011) emphasizes that soil carbonates can often be precipitated and stabilized in varying Eh environments that can affect the luminescence of primary carbonate.
3.2 Traditional stable and clumped isotopes
Stable isotopes of drill spot samples show a high degree of intrasample homogeneity (Fig. 4). Measurements between University of Kansas and University of Colorado, Boulder, are largely consistent with comparable precision (Tables 1 and 2; Fig. 4). δ13C values range from −8 ‰ to −3 ‰ and δ18O ranges from −12 ‰ to −6 ‰ for carbonates measured in this study. Sample 3B-021 displays the most heavy-isotope-enriched δ13C and δ18O values, with δ13C more than 2 ‰ and δ18O more than 1 ‰ greater than all other samples (Fig. 4), despite the relative isotopic low in the δ13Corg curve which results in a large Δ13C for that sample (Table 1). Carbonate samples tend to be isotopically homogeneous (2σ≤0.6 ‰ for all sample δ13C and δ18O, with only two samples with 2σ > 0.3 ‰; Table 1) following Cotton and Sheldon (2012), who proposed a requirement of 2σ < 0.5 ‰ for δ13C and δ18O for all samples applied to paleo-pCO2 reconstructions. We discern no relationship between δ13C and δ18O of carbonates nor grouping of microfacies by stable isotopic composition (e.g., Fig. 4; Table 1).
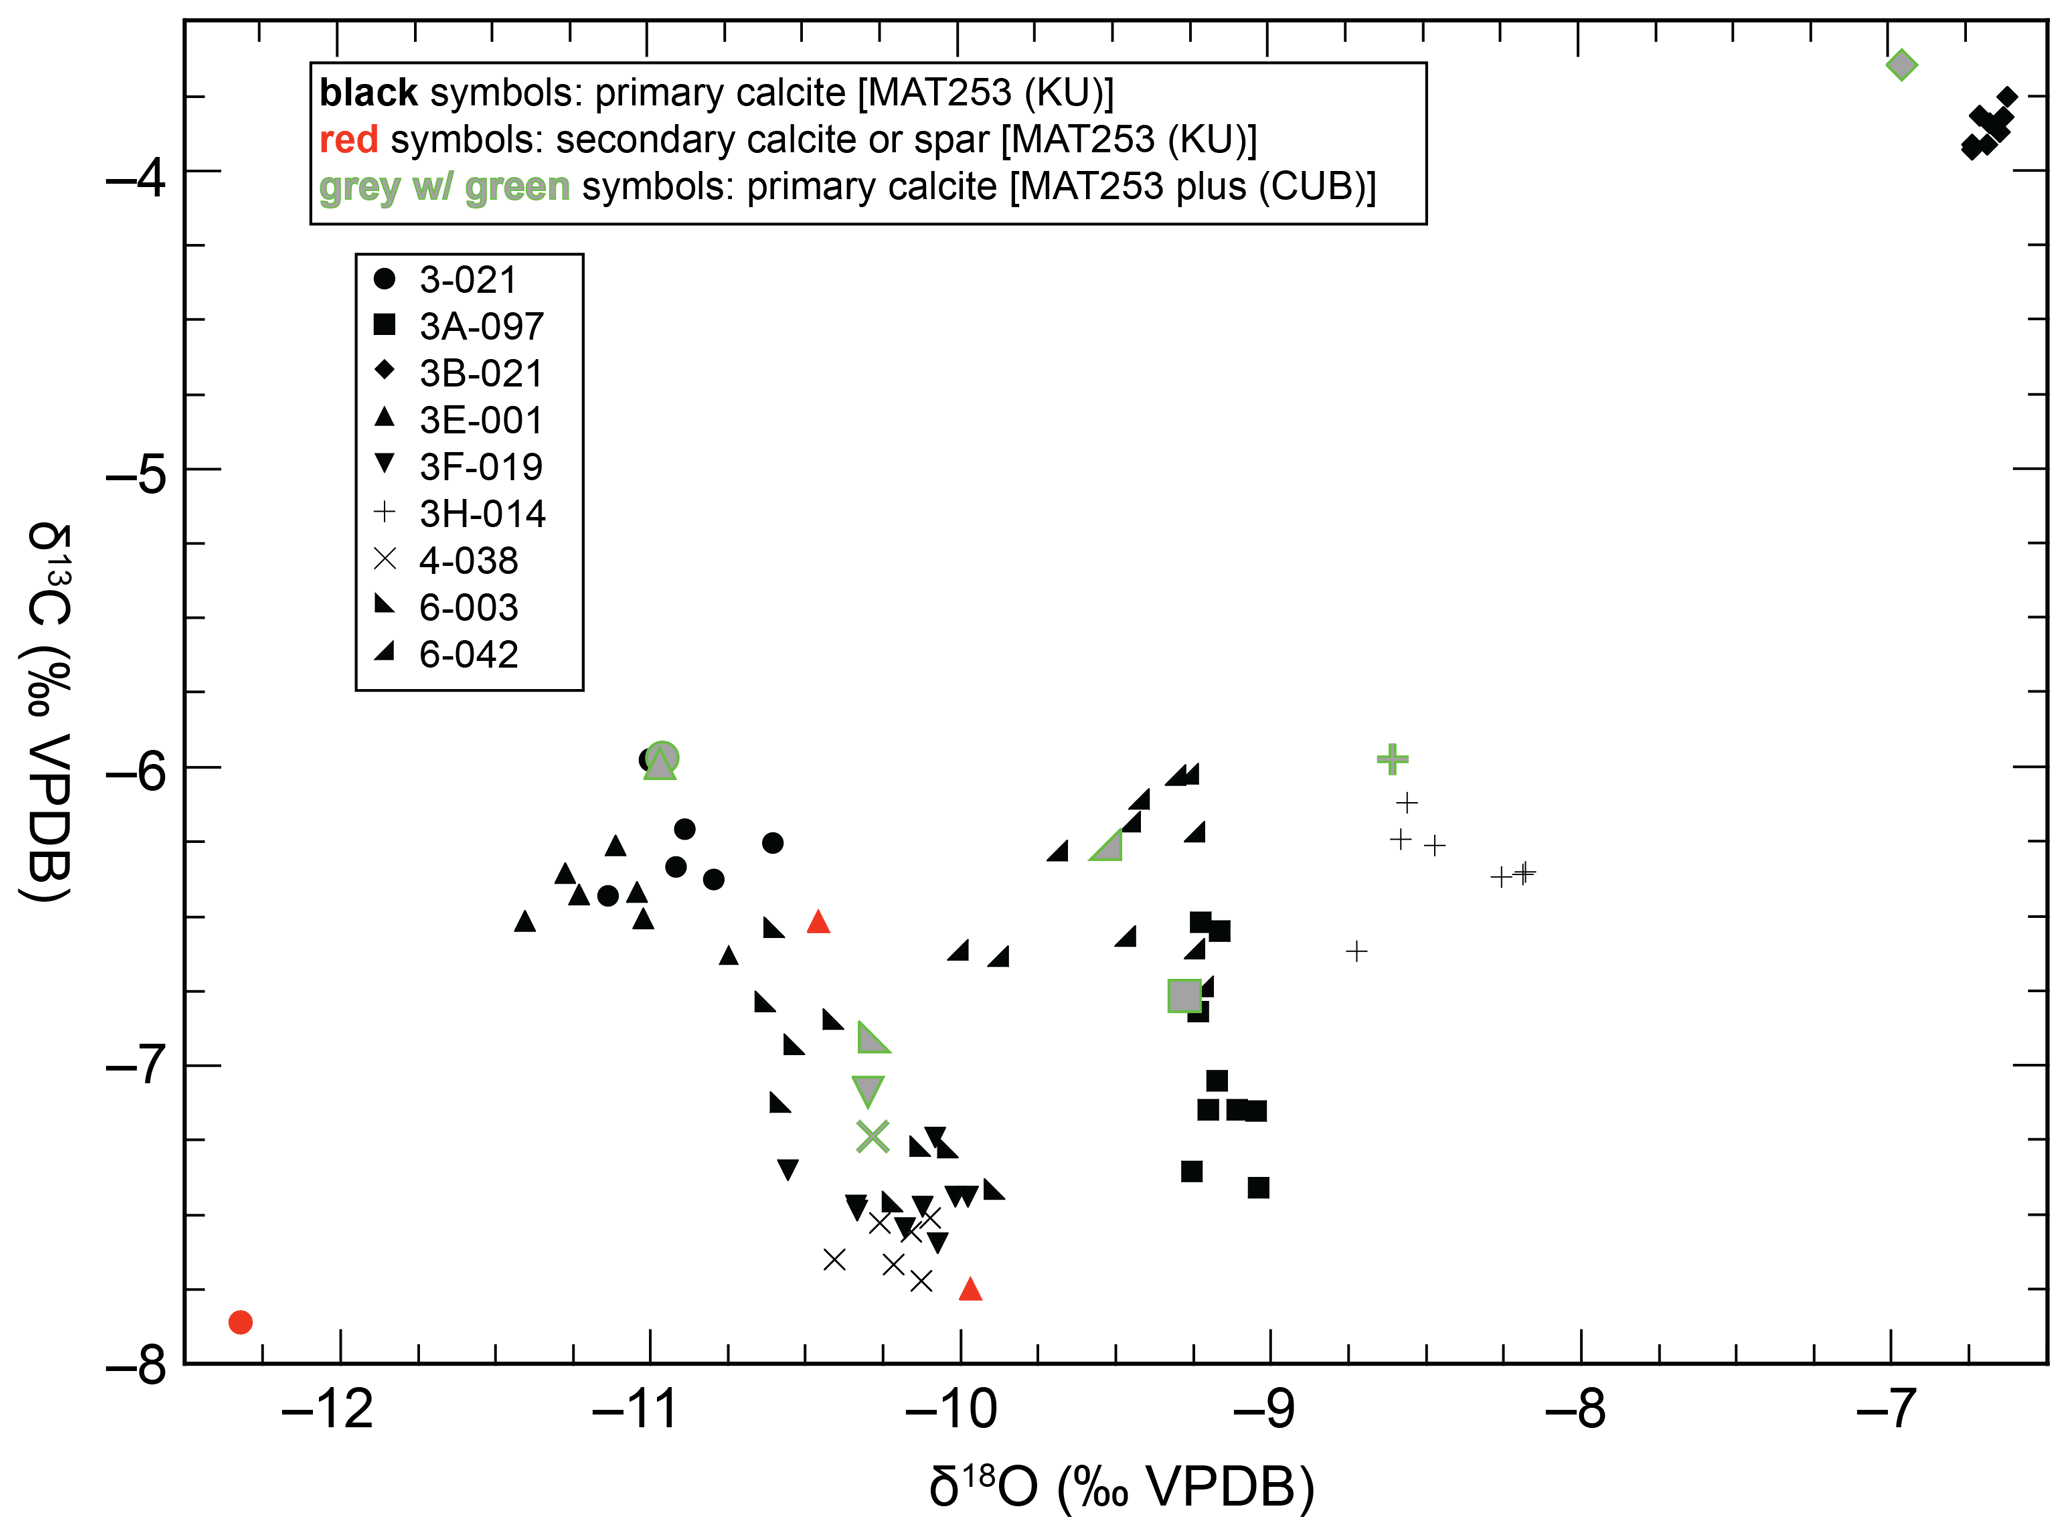
Figure 4Carbonate δ13C and δ18O for White Pagoda samples. Black symbols represent drill spot measurements of inferred primary calcite and red symbols represent drill spot measurements of inferred secondary calcite (measured at KU). Gray with green symbols represent mean δ13C and δ18O measured on larger inferred primary calcite samples at CUB.
Table 2Primary carbonate stable isotope data measured at CUB (Δ47, δ13C and δ18O) for the White Pagoda Site. Clumped isotopes and interpreted temperatures follow Petersen et al. (2019). Meteoric water δ18O calculated from δ18Ocarb (CUB measured), and clumped temperatures following Friedman and O'Neil (1977).

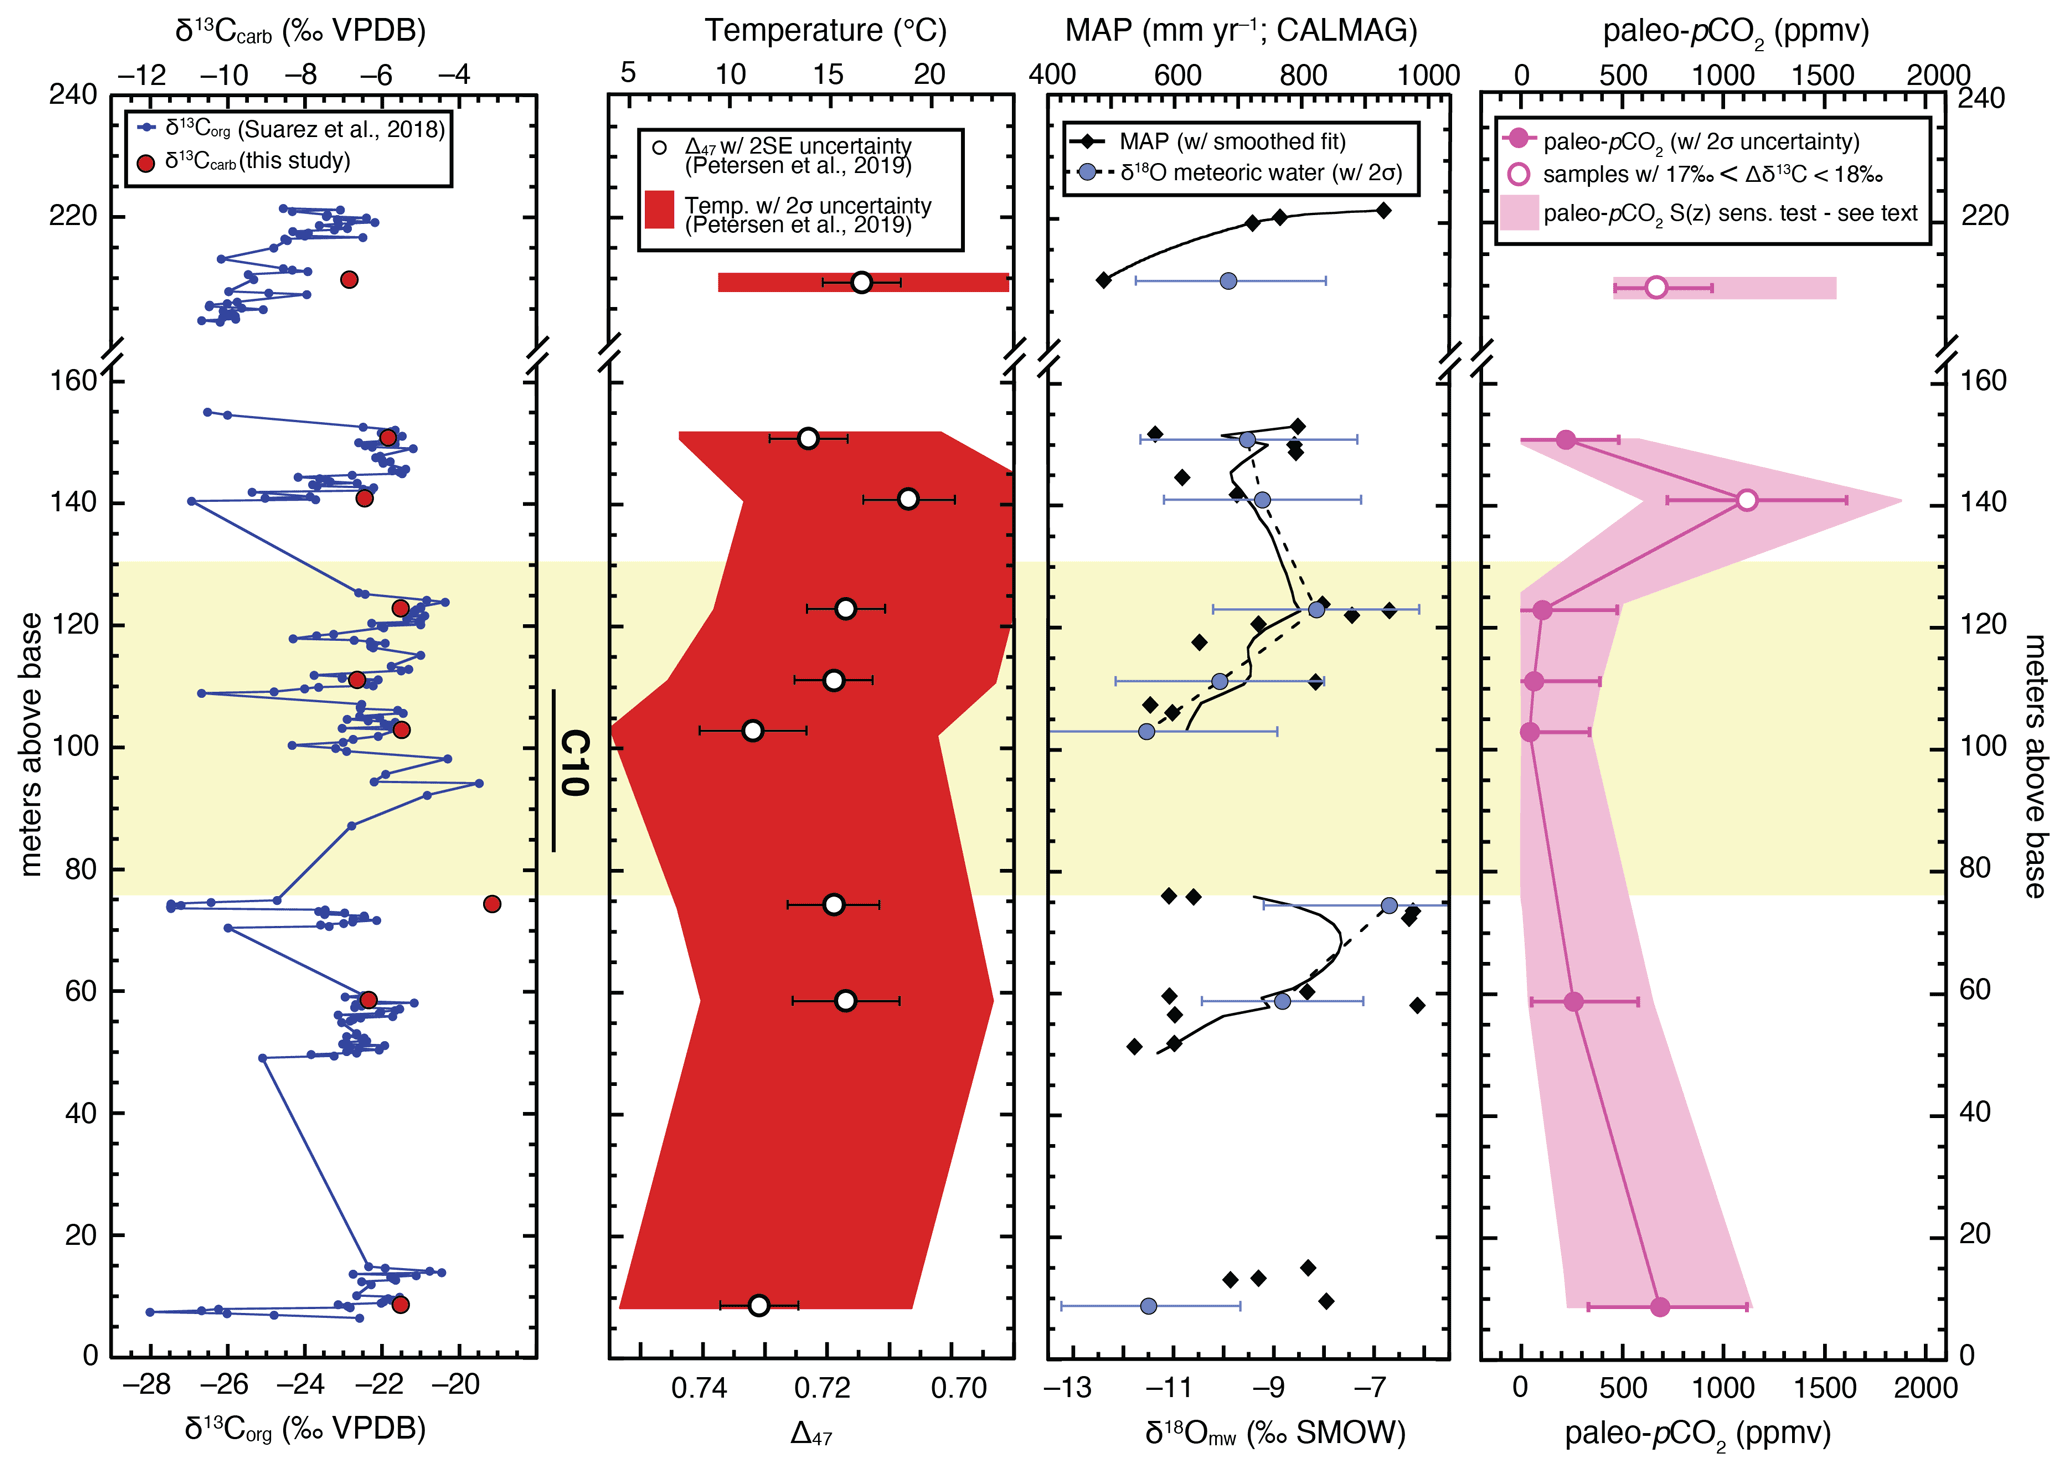
Figure 5Multi-proxy climate records and record interpretations from the White Pagoda Site, including δ13Corg of Suarez et al. (2018) and our new records of carbonate δ13C, Δ47 (with 2SE uncertainty) and temperature (with 2σ uncertainty), MAP and δ18Omw (with 2σ uncertainty), and atmospheric paleo-pCO2 with 2σ and additional S(z) sensitivity test (see main text; non-positive calculated values are not displayed). The C10 interval has been highlighted. Note the break in depth scale at ∼ 165 m.
Clumped isotope (Δ47) mean sample values range from 0.707 to 0.732 ‰ (Table 2), which, following the Petersen et al. (2019) calibration, translates to temperatures ranging from ∼ 10 to 20 ∘C, with an average temperature of 14.9 ∘C for the entire record. Transient cooling of ∼ 2 to 4 ∘C (i.e., down to 11.1 ∘C) is observed in the C10 carbon isotope interval, with the warmest temperature occurring immediately following the C10 interval (i.e., warms to 18.8 ∘C; Fig. 5). Temperature variation tends to be smaller in magnitude than 2σ temperature uncertainty.
3.3 CALMAG
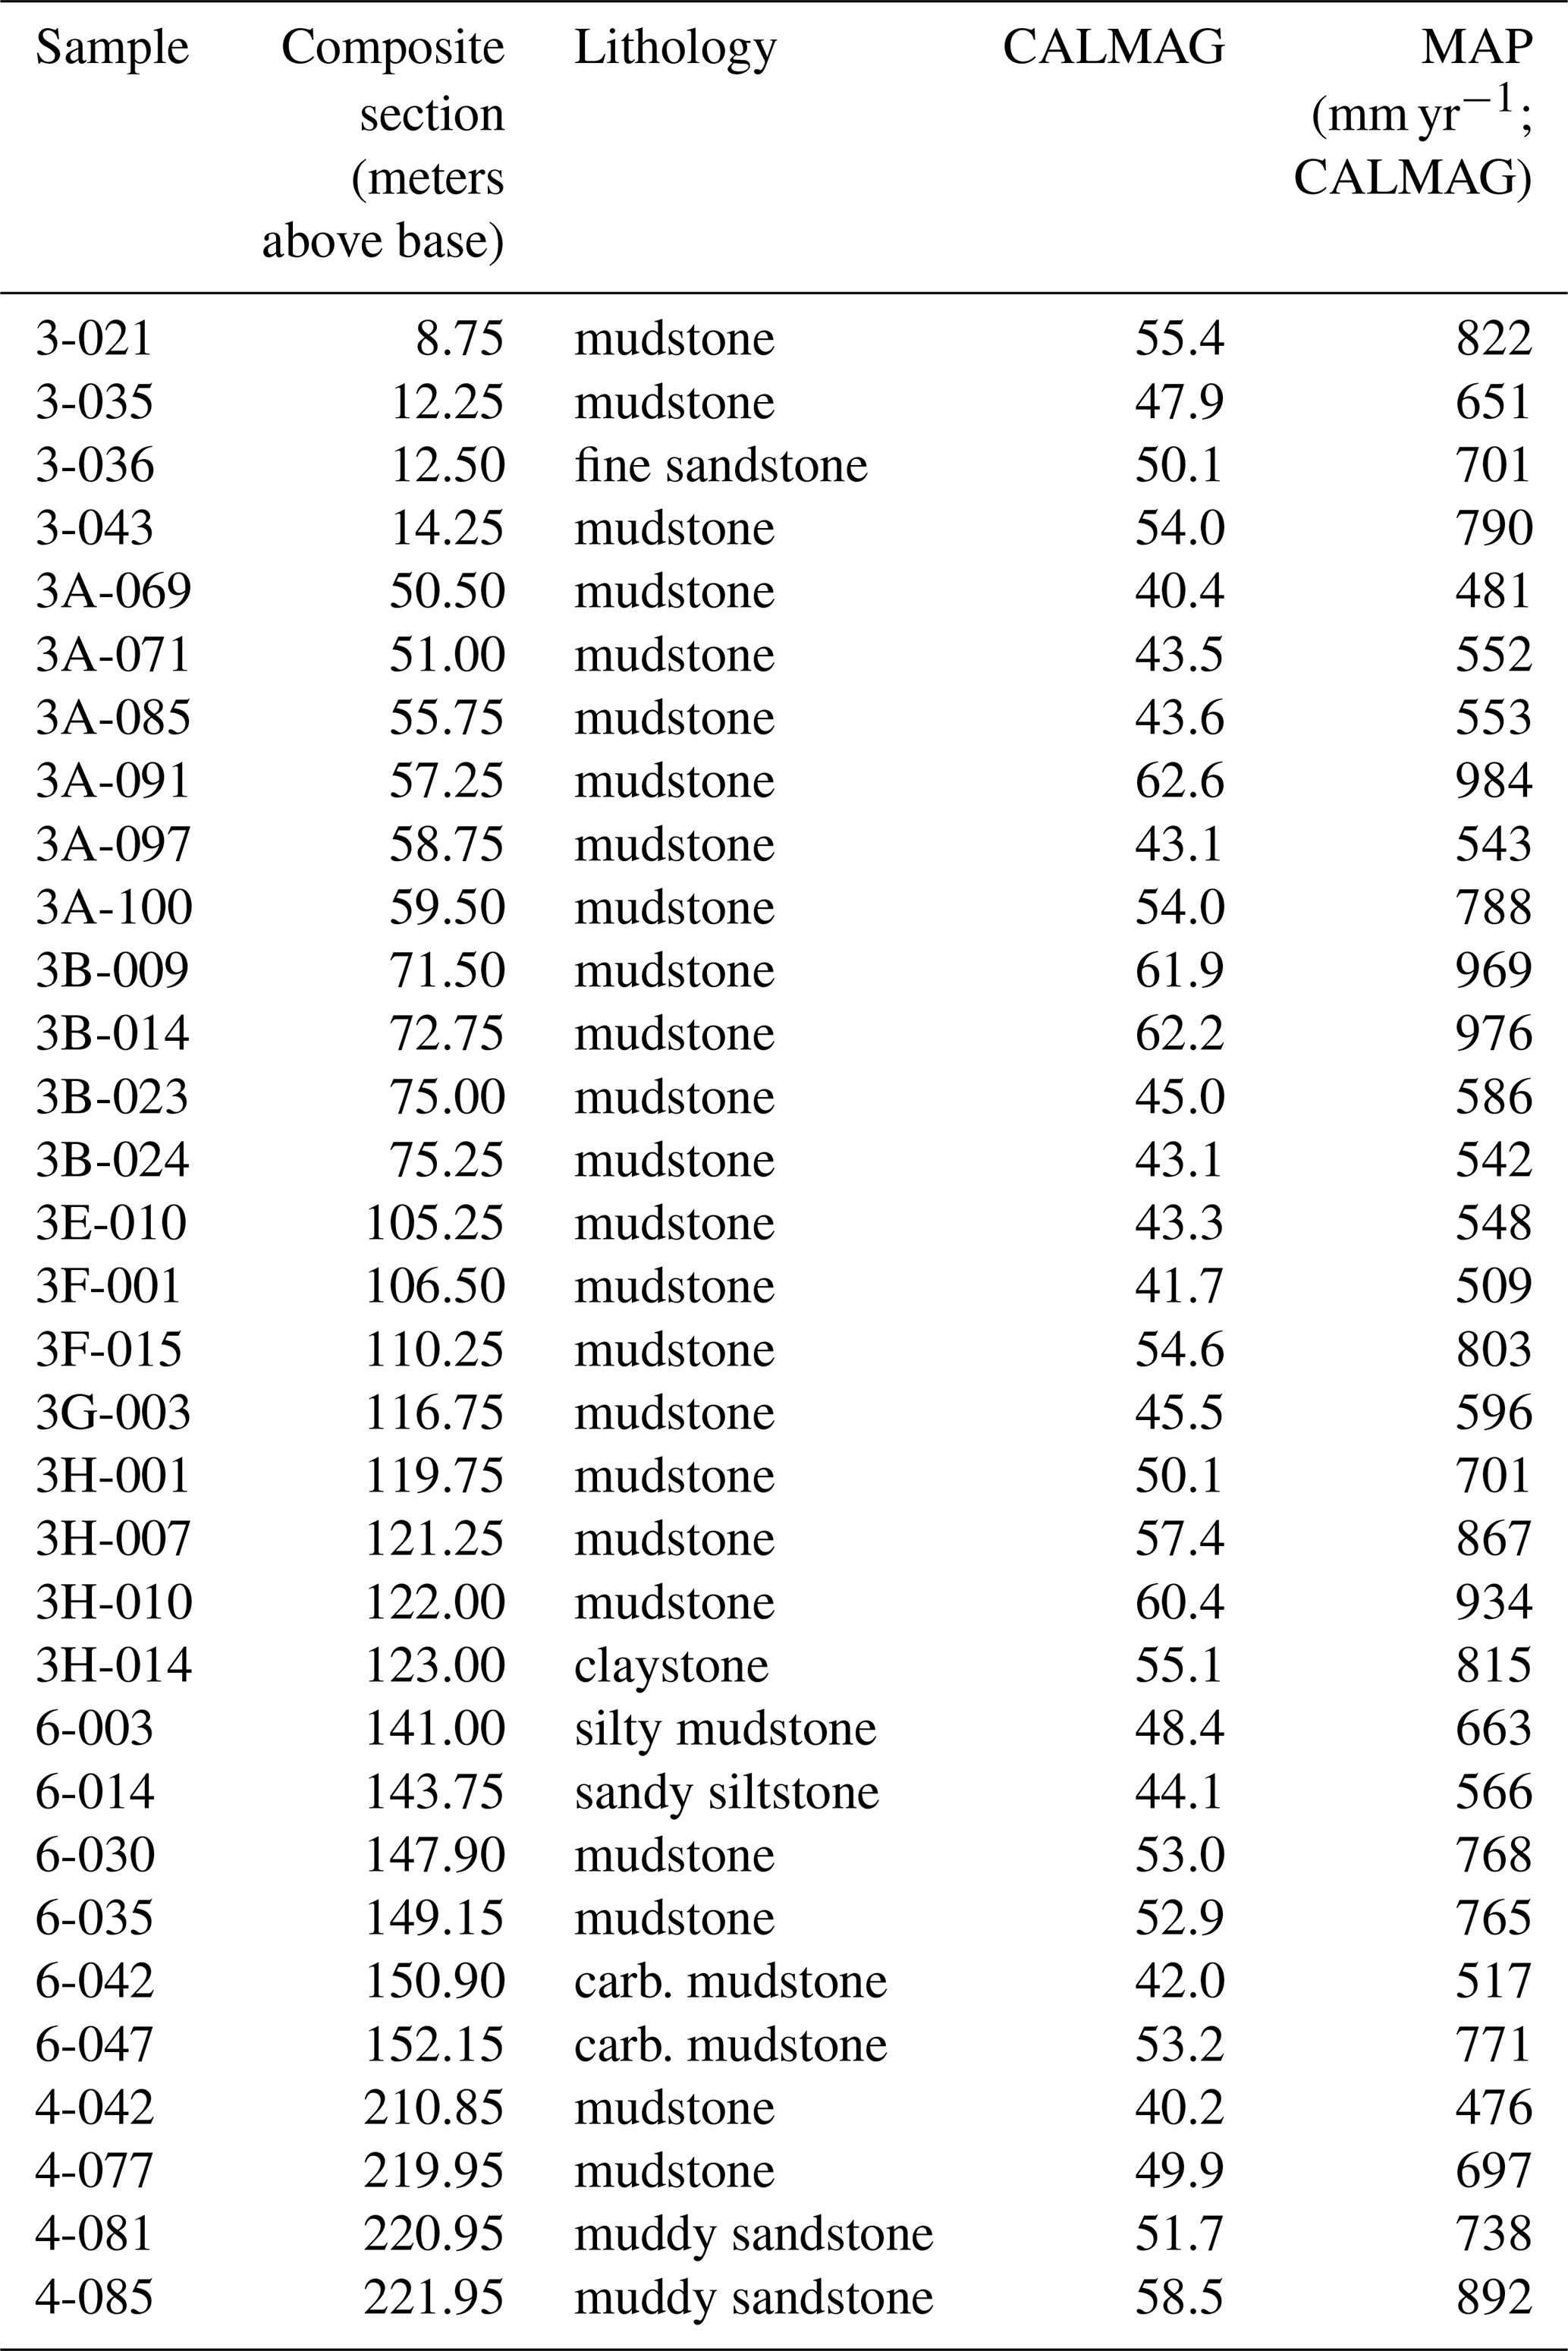
CALMAG values for all measured samples range from a low of 2 to a high of 70. Lowest values are either samples that were not identified as B horizons or likely immature soils which yield values inapplicable to range in calibration (CALMAG less than ∼ 35; Table S4). If only B-horizon samples applicable to the range in the Nordt and Driese (2010) calibration are considered, the maximum variability in CALMAG is ± 12 (Tables 3 and S4). This translates to MAP variability of ±270 mm yr−1 over the interval, with mean MAP of 641 mm yr−1 (i.e., mean CALMAG of 47.5) for paleosols in which clumped isotopes were also measured (Table 3; Fig. 5).
Table 3Lithologic and CALMAG (see text for details) data, with interpreted mean annual precipitation (MAP) for White Pagoda Site samples. All samples listed here are derived from interpreted B horizons of paleosols.
4.1 Carbonate nodule δ13C and δ18O
Light stable isotopes (δ13C and δ18O) of carbonate material measured at KU and CUB are consistent (Tables 1 and 2; Fig. 4) indicating primary carbonate was successfully sampled from nodules for clumped isotope analyses (i.e., primary carbonate isotopic composition characterized by drill spot measurements at KU match values from CUB clumped measurements). δ13C in carbonate nodules is controlled by soil water DIC which, through time, is ultimately controlled by variation in the other exogenic carbon reservoirs. Carbonate δ18O is reflective of regional meteoric water and temperature. Though of much coarser resolution, our carbonate δ13C largely follows δ13Corg which has been tied to global variations in the carbon cycle (Ando et al., 2002; Heimhoffer et al., 2003; Ludvigson et al., 2010, 2015; Suarez et al., 2018), suggesting both carbonate and organic records at the site track global variability in the carbon cycle originally described in Menegatti et al. (1998) and Bralower et al. (1999) (Fig. 5) (e.g., δ13Ccarb is highest in the C10 interval). We observe no clear grouping of carbonate stable isotopes by microfacies, and all samples contain pedogenic features. This suggests δ13Ccarb tracks global variations in the carbon cycle and δ18Ocarb values reflect δ18O of regional precipitation once temperature is considered.
4.2 Interpreting paleoenvironmental biases in Δ47-based temperatures
Macroscopic features described in Suarez et al. (2018) along with traditional carbonate petrography suggest a paleoenvironment which experienced wet and dry cycles. These features include redoximorphic color mottling, gilgai structures and mukkara cracks (Fig. 1), fracturing which is pervasive to varying degrees in carbonate nodules, microspar and spar recrystallization which is present in voids and fractures, Mn staining, and root traces (Figs. 1, 2 and 3). Microscopic features are consistent with facies interpretations of Suarez et al. (2018), which suggest a fluvio-palustrine paleoenvironment. Rhizoliths (i.e., calcified root structures) in nearly all nodule samples (e.g., Figs. 1 and 2) indicate that vegetation was present and the carbonate nodules are indeed soil-formed in subhumid to semiarid conditions (Zhou and Chafetz, 2009). Indeed, mean MAP derived from our CALMAG proxy record suggests 712 mm yr−1 (respective minimum and maximum MAP of 476 and 984 mm yr−1 for the interval; Fig. 5), and Δ47-based temperatures range from 11.4 ∘C ( ∘C; 2σ) to 18.8 ∘C ( ∘C; 2σ), consistent with the subhumid to semiarid environments in which soil carbonates commonly form (Birkeland et al., 1999; Zhou and Chafetz, 2009; Breecker et al., 2009).
Understanding the timing of carbonate formation in soils is important for the interpretation of δ13C, δ18O and Δ47. The solubility of calcite is the primary controlling factor on carbonate formation, and it is significantly affected by soil CO2 concentration. Because CO2 concentration is lower in warmer conditions and drier conditions result in a greater concentration of ions, calcite precipitation tends to occur during warm, dry conditions. Numerous early studies have suggested warm season bias in soil carbonate formation and thus the Δ47-derived temperatures (Breecker et al., 2009; Passey et al., 2010). Recent work of Kelson et al. (2020) suggests this may not always be the case for a number of reasons. The presence of vegetation (suggested by abundant root traces) may shade the soil surface from solar radiation. However, Burgener et al. (2019) and Kelson et al. (2020) found that this effect is rare, and samples for this study were collected from paleosol horizons deep enough (i.e., > 50 cm) to be buffered against the effects of radiative heating (i.e., Burgener et al., 2019). Seasonality of precipitation, evaporation and evapotranspiration likely affects the degree to which a warm season temperature bias may occur. In a study of modern soils in North America, Gallagher and Sheldon (2016) suggested that only continental climate with rainy seasons in the spring had summer temperature biases. Suarez et al. (2011b) suggested that lower than expected temperatures of Mio–Pliocene soil carbonates from the Chinese Loess Plateau may be the result of a monsoon climate in which the rainy seasons occur during the warmest part of the season and conditions for calcite precipitation occur prior to or after the warm season.
These studies suggest that carbonate nodule clumped isotope-based temperatures revealed from the Xinminpu Group likely represent lower temperatures than the mean warm season. In addition, mean clumped isotope-based temperature over the study interval (14.9 ∘C) matches Aptian–Albian MAATs derived from phosphate δ18O in dinosaur teeth from similar paleolatitudes in Asia (i.e., 15 ∘C for Xinminpu Group; Amiot et al., 2011). However, our midlatitude continental-interior temperatures reflect the temperature of calcite precipitation and may be biased towards the time of year during which a region experiences its first month without water storage, which varies by regional climate (Gallagher and Sheldon, 2016). Given our paleoenvironmental interpretation of wet–dry seasonality which resulted in Vertisol formation at our study location and proxy-based estimates of MAAT and MAP, the paleoenvironment is likely best represented by either the “continental” or “semiarid monsoonal” climates of Gallagher and Sheldon (2016). We note that the modern soil type for the settings of Gallagher and Sheldon (2016) consists of Mollisols and thus may not be representative of the Vertisols in which nodules used in this study formed. Their continental model indicates a decline in water storage in July–August, which tends to bias carbonate formation to warmer values. In contrast, the semiarid monsoonal model shows a decrease in water storage in April resulting in a slight cool season bias. However, cool season biases tend to be much smaller in magnitude (less than 4 ∘C) than warm season biases (as much as 24 ∘C) (Kelson et al., 2020). Therefore, regardless of the interpretation of seasonal biases, our mean temperature based on clumped isotopes (14.9 ∘C) suggests very cool conditions in the midlatitude Asian continental interior during the Aptian–Albian. Any potential warm season bias on our temperature results is unlikely as it would suggest even cooler conditions inconsistent with combined proxy observations. In addition, because soil carbonates likely form over long periods of time and are likely stabilized in the phreatic environment as the soil is removed from the active zone of pedogenesis, it is likely that seasonal temperature biases are further dampened. Indeed, the temperatures calculated here are consistent with other regional paleotemperature proxy observations (e.g., Amiot et al., 2011) and counter to the predominantly warm greenhouse climate of the Cretaceous (Föllmi, 2012).
4.3 Latitudinal gradients of temperature and δ18Omw for the Aptian–Albian
Clumped isotope-based temperatures for the White Pagoda site indicate a mean record value of 14.9 ∘C, which is equivalent to δ18Op-based temperature estimates (15 ∘C) carried out on dinosaur teeth from formations within the same group (Xinminpu) in NW Asia (Amiot et al., 2011). The meteoric water δ18O based on our combined clumped isotope and carbonate isotope analyses ranges from −11.5 ‰ to −6.7 ‰ (SMOW), with an average of −9.5 ‰, which is somewhat lower than the values of Amiot et al. (2011) (−7.0 ‰).
Modern climate observations of the study site indicate cool, dry conditions with mean δ18Omw of −9.3 ‰ and −7.7 ‰ in nearby Zhangye and Lanzhou, respectively (GNIP, 2020). Largely due to the influence of regional topography (study location elevation: ∼ 1500 m), present-day precipitation averages < 100 mm yr−1 and MAATs indicate locally cooler temperatures (9.0 and 10.5 ∘C in Zhangye and Lanzhou, respectively; GNIP, 2020) relative to global zonal averages (15.0 ∘C; Rozanski et al., 1993). Aptian–Albian temperatures may similarly be influenced by regional paleotopography, although topographic reconstructions for Asia during the Aptian–Albian are lacking, limiting speculation.
Generally, proxy-based temperatures and δ18Omw for the Xinminpu Group tend to fall within zonally averaged general circulation GENESIS-MOM model results (Zhou et al., 2008) given the large range in possible site paleolatitude during the Aptian–Albian. For example, paleogeographic reconstructions indicate paleolatitudes ranging from ∼ 35 to ∼ 48∘ N for the White Pagoda Site during the Aptian–Albian (Lin et al., 2003; Torsvik et al., 2012; Matthews et al., 2016), which corresponds to simulated temperatures ranging from 9 to 19 ∘C and simulated δ18Omw ranging from −11.8 ‰ to −6.7 ‰ (Zhou et al., 2008).
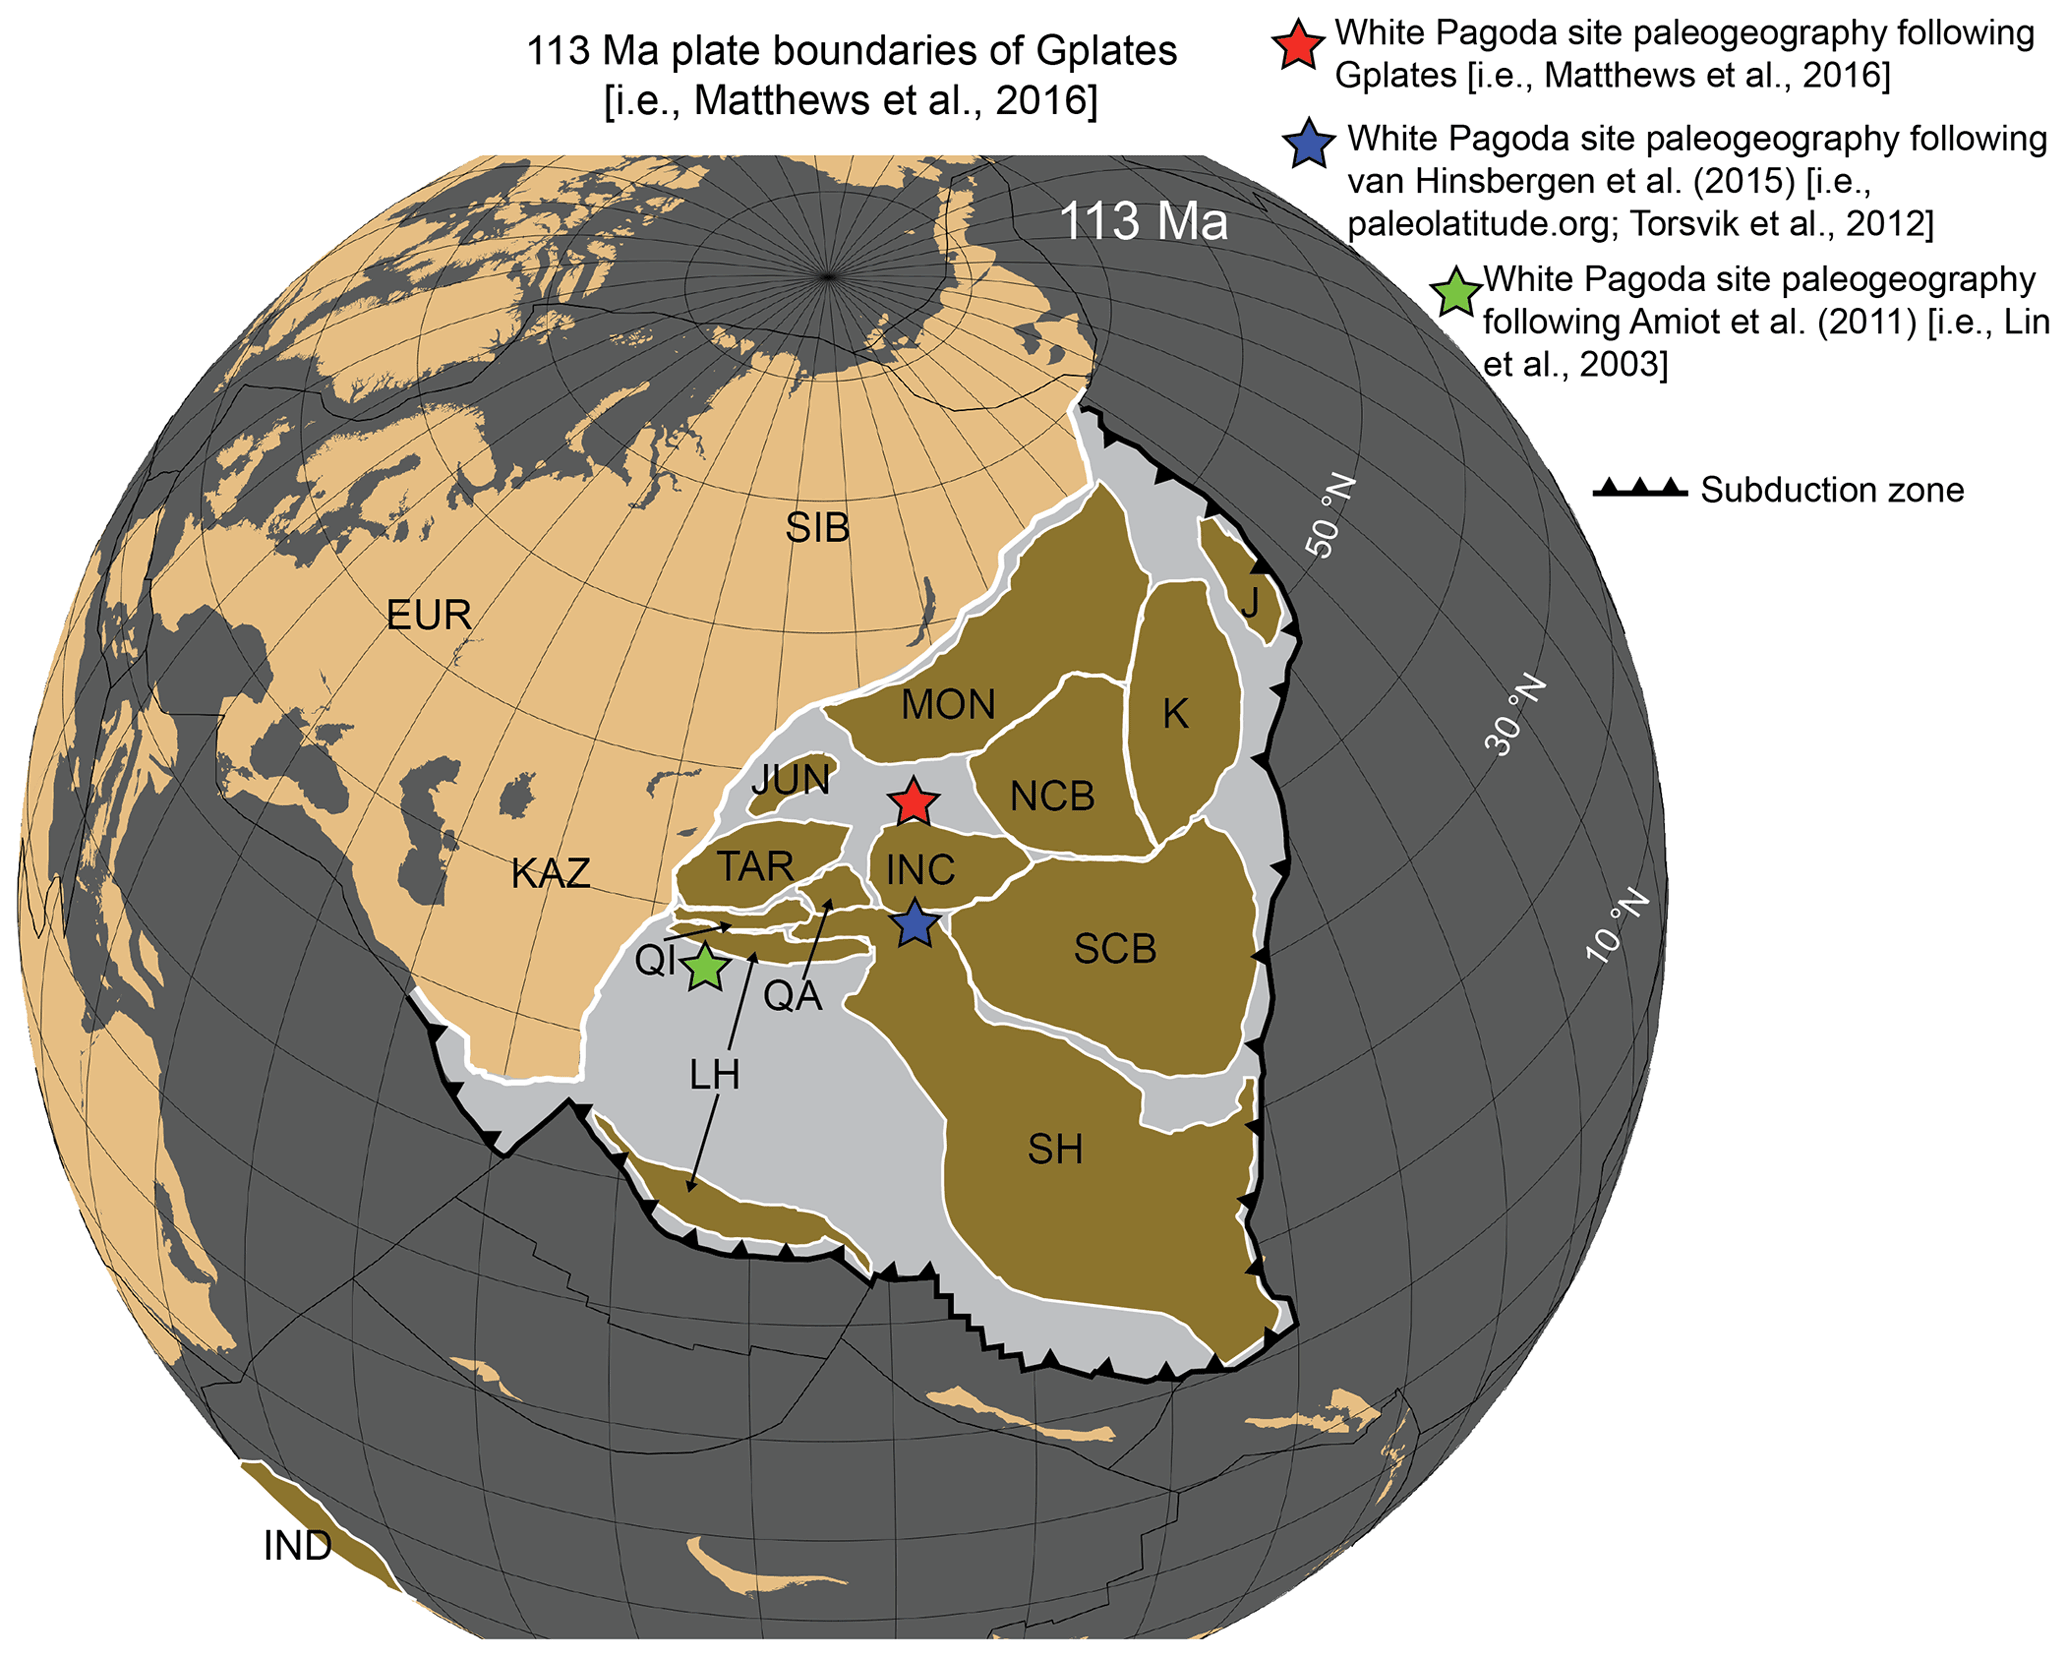
Figure 6Paleogeographic reconstruction of plate boundaries at ca. 113 Ma (Matthews et al., 2016) using the Gplates software. Approximate location of the White Pagoda site following Matthews et al. (2016) is plotted in red. Additional paleogeographic reconstructions are also plotted for comparison (Lin et al., 2003; Torsvik et al., 2012), although these paleolocations are inconsistent with plate boundary reconstructions shown here (i.e., do not follow Matthews et al., 2016). The Aptian–Albian paleolatitude using the Gplates software is more consistent with the cooler temperatures indicated by clumped isotope paleothermometry.

Figure 7Northern Hemisphere latitudinal gradients of temperature and meteoric water δ18O for the mid-Cretaceous (Barremian–Albian). Our mean record data (pink) and the data of Amiot et al. (2011) (black) are plotted with a range in modeled gradients of Cretaceous climate as a function of latitude (blue shaded area) compiled in Suarez et al. (2011a). Details on models included in this range are in the main text. Modern temperature and meteoric water δ18O (gray lines) are plotted following Rozanski et al. (1993). The 1σ uncertainty is included for all data. Two paleolatitude reconstructions are considered: Lin et al. (2003) (a, b) and Matthews et al. (2016) (c, d). Uncertainty in latitude is included in panels (a) and (b); reconstructions of Matthews et al. (2016) do not provide uncertainty.
Combining our new temperature and δ18Omw data with that compiled in Amiot et al. (2011), we re-cast latitudinal temperature and δ18Omw gradients according to the paleogeography applied in Amiot et al. (2011) (Lin et al., 2003) and using an updated paleogeography based on Matthews et al. (2016) (i.e., Gplates). The updated paleogeography results in higher Early Cretaceous paleolatitudes for all Asian sites included in this compilation (Supplement; Table S5), including a more than +13∘ N shift for the Xinminpu Group sites (Fig. 6). When placed on the paleogeography of Lin et al. (2003), proxy-based temperature reconstructions for Asia indicate a cool climate relative to latitudinal models of temperature and hydrology (i.e., land surface gradients compiled in Suarez et al., 2011a, including leaf physiognomy-based gradients of Spicer and Corfield, 1992, cool and warm Cretaceous gradients of Barron, 1983, and GENESIS-MOM general circulation model gradients of Zhou et al., 2008). For example, temperature data fall below even the coolest Cretaceous modeled gradient (i.e., Barron, 1983) despite agreement between proxy δ18Omw in midlatitude continental Asia and the modeled cool Cretaceous (Fig. 7a and b). However, if the Matthews et al. (2016) paleolatitudes are applied, proxy-based temperatures become better aligned with Cretaceous modeled temperature gradients (Fig. 7c). Additionally, the updated paleolatitudes tend to offset δ18Op-based δ18Omw estimates in a positive direction relative to the modeled cool Cretaceous δ18Omw gradient, aligning these data with a flatter, more modern appearing δ18Omw gradient (Fig. 7d). Meanwhile, our clumped isotope and δ18Ocarb-based δ18Omw value falls within the error of the range in Cretaceous modeled δ18Omw gradients (Fig. 7d) suggesting potential errors in required assumptions for δ18Op-based δ18Omw reconstructions of Amiot et al. (2011). The δ18Op may be more 18O-enriched compared to δ18Omw than accounted for in those original studies. The consumption of evaporatively enriched leaf water in herbivores provides one possible mechanism for 18Op enrichment (Levin et al., 2006). Alternatively, the range in paleolatitudes presented here demonstrates the large degree of uncertainty with regards to Early Cretaceous paleogeographic reconstructions of Asia (Supplement; Table S5), which may be driving Aptian–Albian proxy–model disparities.
4.4 Atmospheric paleo-pCO2
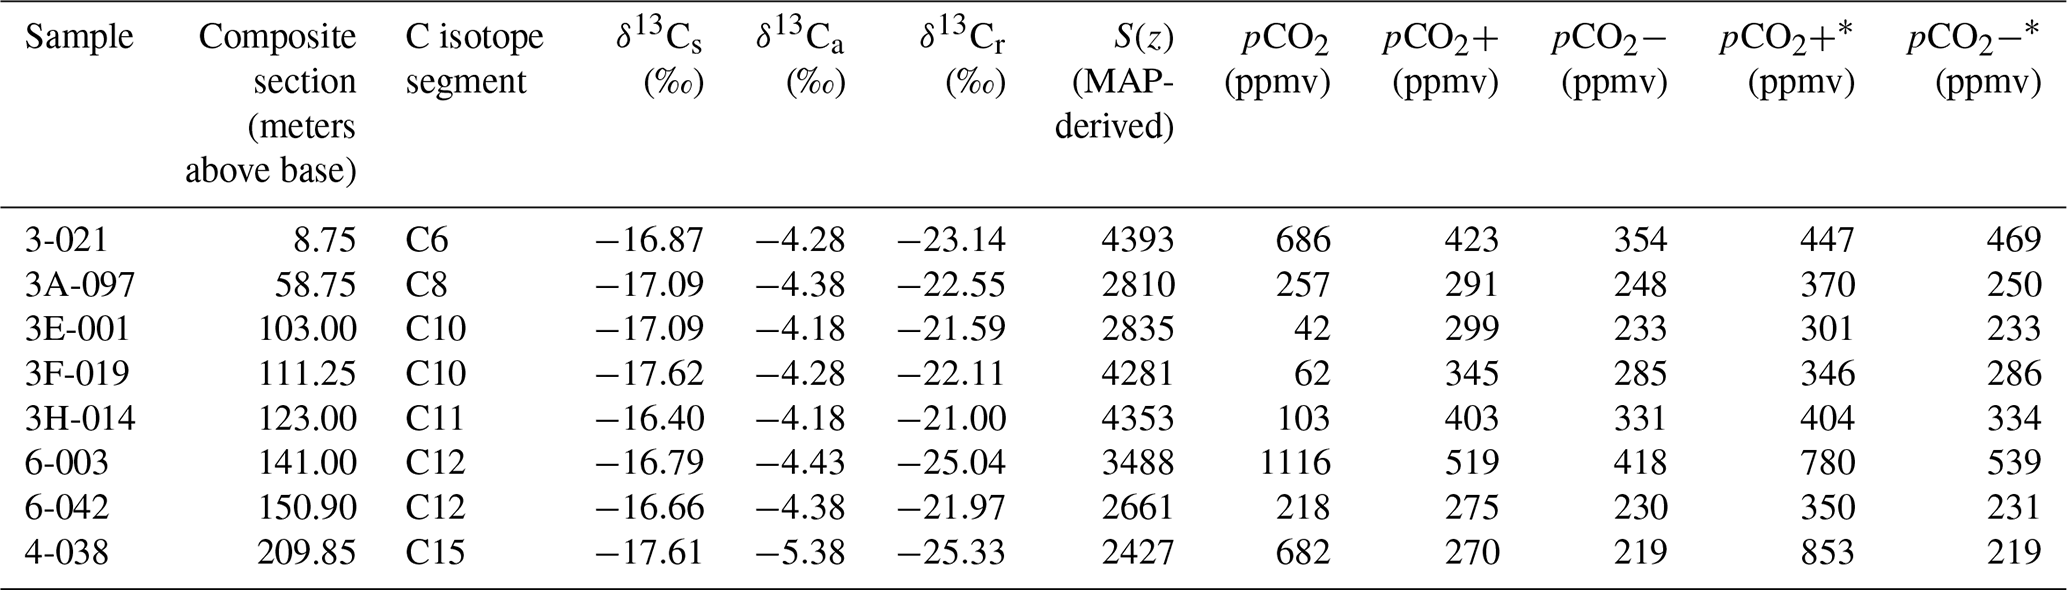
Cotton and Sheldon (2012) refine procedural guidelines previously established by Cerling and Quade (1993) and Ekart et al. (1999) for the use of pedogenic carbonates in reconstructions of atmospheric pCO2, which include maximum limits for Δ13C (i.e., δ13Ccarb−δ13Corg), isotopic heterogeneity and δ13C versus δ18O covariation. They suggest limiting proxy application to samples with 14 ‰ < Δ13C < 17 ‰ as modern soils with large Δ13C tend to have S(z) values which fall off the MAP versus S(z) relationship defined by Cotton and Sheldon (2012) and are likely to have been disproportionately influenced by atmospheric δ13C. For our atmospheric pCO2 reconstruction, we omitted samples with large Δ13C (i.e., samples with Δ13C > 18 ‰; sample 3B-021). We include two samples in our reconstruction (samples 6-003 and 4-038) which have 17 ‰ < Δ13C < 18 ‰ (Table 1 and Fig. 5). Though this Δ13C signature may indicate low productivity (Cotton and Sheldon, 2012), which can influence the MAP versus S(z) relationship, the presence of abundant root traces in sections 4 and 6 (i.e., Suarez et al., 2018) suggests otherwise. In addition to meeting Δ13C criteria, no clear correlation between carbonate δ13C and δ18O is observed (Fig. 4) and carbonates tend to be isotopically homogeneous (Fig. 4; Table 4; maximum 1σ of 0.3 ‰ in all samples for both δ13C and δ18O). We include estimates of uncertainty in our atmospheric pCO2 reconstructions following Retallack (2009). Specifically, uncertainty is equivalent to the square root of the sum of the individual components of uncertainty squared. Here, we propagate uncertainty in δ13Cc, including 2σ analytical uncertainty in δ13Ccarb and 2σ temperature uncertainty and δ13Cr (2σ analytical uncertainty). To test the sensitivity of S(z) estimates on pCO2, we include two pCO2 reconstructions using (1) the MAP-based variable S(z) computed for each sample following Cotton and Sheldon (2012) and (2) a large range in S(z), which is applied to all samples and propagated as additional uncertainty. For the second pCO2 reconstruction approach, the maximum range in S(z) is set using the relationship of Cotton and Sheldon (2012), applying the maximum MAP value observed in the sections containing samples for pCO2 reconstruction (i.e., 984 mm yr−1 which translates to S(z) of 5309 ppmv). This maximum value is representative of some maximum modern S(z) values observed in Holocene calcic soils by Breecker et al. (2010) and consistent with summer minimum S(z) values observed in grassland Vertisols by Mielnick and Dugas (2000). Minimum S(z) is set at 2500 ppmv, following the recommended S(z) of Breecker et al. (2010), as this value is consistent with minimum MAP for our record following the relationship of Cotton and Sheldon (2012). As observed previously for the Cretaceous (e.g., Franks et al., 2014), atmospheric paleo-pCO2 derived from pedogenic carbonate stable isotopes tends to lose sensitivity at low atmospheric CO2 concentrations, resulting in calculated error which spans negative concentrations. Here, we exclude negative, unrealistic pCO2 values from our record and report these minimums as 0 ppmv (Fig. 5) and note that calculated minimum pCO2 is > −231 ppmv for all samples (Table 4).
Table 4Atmospheric pCO2 calculated using δ13Cs (from δ13Ccarb with temperature-dependent enrichment factor; Romanek et al., 1992; 2σ uncertainty in δ13Ccarb and temperature propagated), δ13Ca (average Atlantic bulk carbonate for C isotope segments following Bralower et al., 1999, with DIC atmosphere fractionation of −8.23 ‰), δ13Cr (organic C record of Suarez et al., 2018, with 2σ analytical uncertainty (0.26 ‰) propagated), and S(z) (estimated from MAP following Cotton and Sheldon, 2012). pCO and pCO indicate the S(z) sensitivity test with the same 2σ uncertainty and large S(z) range (see text for details). All δ13C values reported are relative to VPDB.
Our atmospheric pCO2 reconstruction suggests relatively low (for greenhouse climates) and variable pCO2 over the study interval. This observation is consistent with cool Aptian–Albian temperatures (i.e., MAAT ∼ 15 ∘C in midlatitudes as indicated by this study and others). Mean atmospheric pCO2 for the entire record is 396 ppmv and pCO2 generally tracks temperature variability with low (i.e., < 300 ppmv) pCO2 in the cool C10 interval increasing up section to ∼ 1100 ppmv. Our record is largely in agreement with paleobotanical proxy-based pCO2 reconstructions for the Aptian–Albian, which range from ∼ 500 to 1300 ppmv (Aucour et al., 2008; Passalia, 2009; Haworth et al., 2010; Du et al., 2016). While this study indicates slightly lower pCO2 than other carbon-isotope-based records for the Aptian–Albian (e.g., Ekart et al., 1999, suggest ∼ 1500 ppmv; Wallmann, 2001, suggest 700 to 1500 ppmv; Fletcher et al., 2005, suggest 1100 to 1200 ppmv), these records do not all satisfy the requirements of Cotton and Sheldon (2012) (e.g., Δ13C < 17 ‰ in the record of Ekart et al., 1999, likely biases to higher atmospheric pCO2) and may lack the sampling resolution to pick up on shorter-term variations. Additionally, although comparatively offset to lower values, variability in our atmospheric pCO2 reconstruction follows the pattern of Aptian–Albian pCO2 variability observed in other pedogenic and pelagic marine carbonate-based estimates (i.e., gradual decrease in late Aptian with a low at the Aptian–Albian boundary before increasing into the early Albian; Li et al., 2013; Bottini et al., 2015).
4.5 Aptian–Albian variations in atmospheric pCO2, climate and the hydrologic cycle
Cooler midlatitude terrestrial temperatures (MAATs of ∼ 15 ∘C) are consistent with the post-OAE 1a cold snap hypothesis (e.g., Mutterlose et al., 2009) observed in terrestrial (e.g., Amiot et al., 2011) and sea surface temperature records (e.g., both nannofossil indicators and organic glycerol dialkyl glycerol tetraether (GDGT) temperature proxy TEX86 show cooling at globally distributed sites; Bottini et al., 2015). Following Friedman and O'Neil (1977), coupled carbonate δ18O and temperatures suggest variations in δ18Omw of ±2.2 ‰ over the study interval consistent with shifts in the distribution of atmospheric moisture associated with climate change but similar in magnitude to 2σ reconstruction uncertainty (Table 2). However, climate-change-induced variations in Asian continental-interior δ18Omw during the Early Cretaceous would be expected given model results which show shifts in δ18Omw of +2 ‰ to +4 ‰ associated with two doublings of atmospheric pCO2 (global average surface warming of 6 ∘C) in continental interiors (Poulsen et al., 2007). Our records similarly suggest subtle warming-induced 18O enrichment in δ18Omw for continental Asia, as atmospheric pCO2, temperature and δ18Omw increase following the C10 interval (Fig. 5). Variability in δ18Omw is likely minimally influenced by seasonality following our interpretation above of consistent seasonal formation of pedogenic carbonate nodules in Vertisols. While age controls are limited, chemostratigraphic correlations (i.e., Suarez et al., 2018) suggest our record spans several million years (i.e., C7 to C12 carbon isotope segments after Menegatti et al., 1998, and Bralower et al., 1999; roughly 6 million years). Given the temporal coarseness of our record which likely does not pick up on peak temperature variability, we observe subtle temperature shifts over the interval (i.e., cooling of −2 to −4 ∘C preceding +4 to +6 ∘C of warming across the inferred C10 interval), which likely corresponds to the cool interval between OAE 1a and OAE 1b and may include Kilian and/or OAE 1b warmth (e.g., Bottini et al., 2015) around 140 m (Fig. 5).
Shifts in the hydrologic cycle reflected in δ18Omw and MAP (Fig. 5) track Δ47-based temperatures, suggesting climate-controlled regional shifts in the interior Asian hydrologic cycle. Interestingly, the driest conditions tend to correlate to relative lows in temperature and δ18Omw perhaps pointing to variations in the seasonality and/or sourcing of meteoric waters in Asia associated with long-term climate evolution. Compared with background environmental conditions, cooler temperatures (down to 11.1 ∘C), drier conditions (MAP < 600 mm yr−1) and 18O-depleted meteoric waters are observed in the C10 interval, consistent with models of precipitation change for the mid-Cretaceous (e.g., Poulsen et al., 2007) and observations of more widespread dry conditions in Asia during cool Cretaceous intervals (e.g., Hasegawa et al., 2012).
Hasegawa et al. (2012) used sedimentological records from Asia to help constrain potential shifts in the descending limb of the Hadley cell related to Cretaceous climate change and compared these observations to Hadley cell circulation simulations, concluding that as paleo-pCO2 concentration increases, so does the width of the Hadley Cell, but that at ∼ 1000 ppmv paleo-pCO2 and greater, the descending limb of the Hadley cell contracts from 30∘ N and 30∘ S to 15∘ N and 15∘ S reorganizing the distribution of atmospheric water vapor. This hypothesis is further supported by paleoenvironmental observations (i.e., shifts in lithology and climate-sensitive fossils associated with changes in aridity; Chumakov et al., 1995; Chumakov, 2004) and general circulation models which indicate a 30∘ N position of the descending limb of the Hadley cell during Cretaceous greenhouse warmth (Floegel, 2001). The time bins that Hasegawa et al. (2012) investigates are larger than the interval investigated here, but the shifts in atmospheric pCO2 encompass the range of hypothesized thresholds for shifts in Hadley Cell circulation. The relatively cool and dry conditions and 18O-depleted meteoric waters during the C10 interval (potentially associated with the cold snap; Mutterlose et al., 2009) may reflect a shift in climate and Hadley cell circulation, driven by a decrease in atmospheric pCO2 (e.g., Hasegawa et al., 2012). Indeed, other sedimentological evidence (e.g., glendonites) provide further support for relatively cold conditions at high northern latitudes associated with this interval (Vickers et al., 2019). For our records, atmospheric pCO2 drops during the C10 interval from pre- and post-segment values within error of 1000 ppmv to < 350 ppmv in the C10 interval (Fig. 5; Table 4), well below the critical threshold proposed by Hasegawa et al. (2012). It is important to note that the decrease in atmospheric pCO2 observed in our record is similar in magnitude to the error associated with the reconstruction, and while declining pCO2 is consistent with cooling during the C10 interval, more chronologic work is needed to constrain the timing and complete magnitude of pCO2 variability across the Aptian–Albian along with wider spatial quantitative paleoclimate proxies. Generally, however, as atmospheric pCO2 increases from the low in the C10 interval to a peak just after, precipitation and temperature increase, consistent with the proposed climate shifts that Hasegawa et al. (2012) suggest, in a “super-greenhouse” mode. Variability in δ18Omw and MAP is observed throughout our study interval, however, which is consistent with either multiple fluctuations in Hadley cell circulation across the interval or, more likely, background regional variability in the Early Cretaceous hydrologic cycle in continental-interior Asia.
In summary, new continental Asia midlatitude multi-proxy records of the Aptian–Albian carbon cycle, climate and hydrologic cycle suggest cool conditions in Early Cretaceous midlatitudes (mean of 14.9 ∘C; 35 to 48∘ N paleolatitude depending on applied paleogeographic reconstruction) relative to background Cretaceous greenhouse warmth, consistent with our estimated atmospheric pCO2 (mean value of 396 ppmv) calculated using carbon isotopes in pedogenic carbonates and previous regional MAAT observations (Amiot et al., 2011). Variations in the hydrologic cycle (i.e., decreases in MAP and δ18Omw) are associated with transient cooling (−2 to −4 ∘C) during the C10 carbon isotope high, consistent with general circulation models which suggest differences in temperature, MAP and δ18Omw similar in magnitude to our observations associated with one to two doubling(s) (or in terms of cooling, halving(s)) of atmospheric pCO2. These new paleoclimate parameters may be useful to future climate modeling efforts and for understanding potential variability (cooling and warming; shifts in precipitation) in an otherwise greenhouse climate.
All new data reported herein can be found in the tables, Supplement and Open Science Framework (https://doi.org/10.17605/OSF.IO/CZJ68, Harper et al., 2021).
The supplement related to this article is available online at: https://doi.org/10.5194/cp-17-1607-2021-supplement.
MBS and DTH developed the study and carried out primary measurements at KU and CUB. MBS and JU carried out sample preparation for XRF measurements at UTSA. DTH and MBS drafted the initial paper. JU contributed to tables and methods. HY and DL contributed background on Chinese stratigraphy and study locality. PD contributed vertebrate paleontological context of study locality and time interval.
The authors declare that they have no conflict of interest.
Publisher’s note: Copernicus Publications remains neutral with regard to jurisdictional claims in published maps and institutional affiliations.
We are grateful to Bruce Barnett for discussion and analytical assistance in the KPESIL at KU and Katie Snell and Brett Davidheiser-Kroll for discussion, access and assistance in the CUBES-SIL at CUB for clumped isotope analyses. Thank you to Greg Ludvigson for help with cathodoluminescence and lively discussion. We also acknowledge Alexis Godet at UT San Antonio for XRF analyses. This paper was greatly improved by reviews from two anonymous reviewers and CL feedback from Hilary Corlett.
This research has been supported by the National Science Foundation (grant no. NSF EAR1941017 to Marina B. Suarez and grant no. NSF EAR1024671 to Peter Dodson), the Strategic Priority Research Program of Chinese Academy of Sciences (grant no. XDB260000000) and the National Natural Science Foundation of China (grant nos. 41688103 and 41872021).
This paper was edited by Alberto Reyes and reviewed by Hilary Corlett and two anonymous referees.
Amante, C. and Eakins, B. W.: ETOPO1 arc-minute global relief model: procedures, data sources and analysis, NOAA Technical Memorandum, United States Department of Commerce, Boulder, Colorado, USA, 2009.
Amiot, R., Lécuyer, C., Buffetaut, E., Fluteau, F., Legendre, S., and Martineau, F.: Latitudinal temperature gradient during the Cretaceous Upper Campanian–Middle Maastrichtian: δ18O record of continental vertebrates, Earth Planet. Sc. Lett., 226, 255–272, https://doi.org/10.1016/j.epsl.2004.07.015, 2004.
Amiot, R., Wang, X., Zhou, Z., Wang, X., Buffetaut, E., Lecuyer, C., Ding, Z., Fluteau, F., Hibino, T., Kusuhashi, N., Mo, J., Suteethorn, V., Wang, Y., Xu, X., and Zhang, F.: Oxygen isotopes of East Asian dinosaurs reveal exceptionally cold Early Cretaceous climates, P. Natl. Acad. Sci. USA, 108, 5179–5183, https://doi.org/10.1073/pnas.1011369108, 2011.
Ando, A., Kakegawa, T., Takashima, R., and Saito, T.: New perspective on Aptian carbon isotope stratigraphy: data from δ13C records of terrestrial organic matter, Geology, 30, 227–230, 2002.
Aucour, A.-M., Gomez, B., Sheppard, S. M. F., and Thévenard, F.: δ13C and stomatal number variability in the Cretaceous conifer Frenelopsis, Palaeogeogr. Palaeocl., 257, 462–473, 10.1016/j.palaeo.2007.10.027, 2008.
Barron, E. J.: A warm, equable Cretaceous: The nature of the problem, Earth-Sci. Rev., 19, 305–338, 1983.
Bernasconi, S. M., Daëron, M., Bergmann, K. D., Bonifacie, M., Meckler, A. N., Affek, H. P., Anderson, N., Bajnai, D., Barkan, E., Beverly, E., Blamart, D., Burgener, L., Calmels, D., Chaduteau, C., Clog, M., Davidheiser-Kroll, B., Davies, A., Dux, F., Eiler, J., Elliott, B., Fetrow, A. C., Fiebig, J., Goldberg, S., Hermoso, M., Huntington, K. W., Hyland, E., Ingalls, M., Jaggi, M., John, C. M., Jost, A. B., Katz, S., Kelson, J., Kluge, T., Kocken, I. J., Laskar, A., Leutert, T. J., Liang, D., Lucarelli, J., Mackey, T. J., Mangenot, X., Meinicke, N., Modestou, S. E., Müller, I. A., Murray, S., Neary, A., Packard, N., Passey, B. H., Pelletier, E., Petersen, S., Piasecki, A., Schauer, A., Snell, K. E., Swart, P. K., Tripati, A., Upadhyay, D., Vennemann, T., Winkelstern, I., Yarian, D., Yoshida, N., Zhang, N., and Ziegler, M.: InterCarb: A community effort to improve interlaboratory standardization of the carbonate clumped isotope thermometer using carbonate standards, Geochem. Geophy. Geos., 22, e2020GC009588, https://doi.org/10.1029/2020GC009588, 2021.
Birkeland, P. W., Miller, D. C., Patterson, P. E., Price, A. B., and Shroba, R. R.: Soil-geomorphic relationships near Rocky Flats, Boulder and Golden, Colorado area, with a stop at the pre-fountain formation paleosol of Wahlstrom (1948), Geologic Society of America Field Trip, 22, 13–13, 1999.
Bonifacie, M., Calmels, D., Eiler, J. M., Horita, J., Chaduteau, C., Vasconcelos, C., Agrinier, P., Katz, A., Passey, B. H., Ferry, J. M., and Bourrand, J.-J.: Calibration of the dolomite clumped isotope thermometer from 25 to 350 ∘C, and implications for a universal calibration for all (Ca, Mg, Fe)CO3 carbonates, Geochim. Cosmochim. Ac., 200, 255–279, https://doi.org/10.1016/j.gca.2016.11.028, 2017.
Bottini, C., Erba, E., Tiraboschi, D., Jenkyns, H. C., Schouten, S., and Sinninghe Damsté, J. S.: Climate variability and ocean fertility during the Aptian Stage, Clim. Past, 11, 383–402, https://doi.org/10.5194/cp-11-383-2015, 2015.
Bralower, T. J., CoBabe, E., Clement, B., Sliter, W. V., Osburn, C. L., and Longoria, J.: The record of global change in mid-Cretaceous (Barremian-Albian) sections from the Sierra Madre, Northeastern Mexico, J. Foramin. Res., 29, 418–437, 1999.
Brand, W. A., Assonov, S. S., and Coplen, T. B.: Correction for the 17O interference in δ(13C) measurements when analyzing CO2 with stable isotope mass spectrometry (IUPAC Technical Report), Pure Appl. Chem., 82, 1719–1733, https://doi.org/10.1351/pac-rep-09-01-05, 2010.
Breecker, D. O., Sharp, Z. D., and McFadden, L. D.: Seasonal bias in the formation and stable isotopic composition of pedogenic carbonate in modern soils from central New Mexico, USA, Geol. Soc. Am. Bull., 121, 630–640, https://doi.org/10.1130/b26413.1, 2009.
Breecker, D. O., Sharp, Z. D., and McFadden, L. D.: Atmospheric CO2 concentrations during ancient greenhouse climates were similar to those predicted for A.D. 2100, P. Natl. Acad. Sci. USA, 107, 576–580, https://doi.org/10.1073/pnas.0902323106, 2010.
Burgener, L., Hyland, E., Huntington, K. W., Kelson, J. R., and Sewall, J. O.: Revisiting the equable climate problem during the Late Cretaceous greenhouse using paleosol carbonate clumped isotope temperatures from the Campanian of the Western Interior Basin, USA, Palaeogeogr. Palaeocl., 516, 244–267, https://doi.org/10.1016/j.palaeo.2018.12.004, 2019.
Carmichael, M. J., Lunt, D. J., Huber, M., Heinemann, M., Kiehl, J., LeGrande, A., Loptson, C. A., Roberts, C. D., Sagoo, N., Shields, C., Valdes, P. J., Winguth, A., Winguth, C., and Pancost, R. D.: A model–model and data–model comparison for the early Eocene hydrological cycle, Clim. Past, 12, 455–481, https://doi.org/10.5194/cp-12-455-2016, 2016.
Cazenave, S., Chapoulie, R., and Villeneuve, G.: Cathodoluminescence of synthetic and natural calcite: the effects of manganese and iron on orange emission, Miner. Petrol., 78, 243–253, 2003.
Cerling, T. E.: Carbon dioxide in the atmosphere: Evidence from Cenozoic and Mesozoic paleosols, Am. J. Sci., 291, 377–400, https://doi.org/10.2475/ajs.291.4.377, 1991.
Cerling, T. E. and Quade, J.: Stable Carbon and Oxygen Isotopes in Soil Carbonates, Climate Change in Continental Isotopic Records, Geophysical Monograph 78, American Geophysical Union, Washington, D.C., USA, 1993.
Chen, J. and Yang, H.: Geological development of the northwest China basins during the Mesozoic and Ceonzoic, Phanerozoic Geology of Northwest China, Science Press, Beijing, PR China, 39–62, 1996.
Chumakov, N. M.: Climatic zones and climate of the Cretaceous period, in: Climate in the epochs of major biospheric transformations, edited by: Semikhatov, M. A. and Chumakov, N. M., Transactions of the Geological Institute of the Russian Academy of Sciences, 550, 105–123, 2004.
Chumakov, N. M., Zharkov, M. A., Herman, A. B., D'oludenko, M. P., Kalandadze, N. N., Lebedev, E. L., Ponomarenko, A. G., and Rautian, A. S.: Climatic belts of the mid-Cretaceous time, Stratigr. Geo. Correl.+, 3, 42–63, 1995.
Cotton, J. M. and Sheldon, N. D.: New constraints on using paleosols to reconstruct atmospheric pCO2, Geol. Soc. Am. Bull., 124, 1411–1423, https://doi.org/10.1130/b30607.1, 2012.
Daëron, M., Blamart, D., Peral, M., and Affek, H. P.: Absolute isotopic abundance ratios and the accuracy of Δ47 measurements, Chem. Geol., 442, 83–96, https://doi.org/10.1016/j.chemgeo.2016.08.014, 2016.
Dennis, K. J., Affek, H. P., Passey, B. H., Schrag, D. P., and Eiler, J. M.: Defining an absolute reference frame for “clumped” isotope studies of CO2, Geochim. Cosmochim. Ac., 75, 7117–7131, https://doi.org/10.1016/j.gca.2011.09.025, 2011.
Driese, S. D. and Mora, C. I.: Physico-chemical environment of pedogenic carbonate formation in Devonian vertic palaesols, central Appalachians, USA, Sedimentology, 40, 199–216, 1993.
Du, B., Sun, B., Zhang, M., Yang, G., Xing, L., Tang, F., and Bai, Y.: Atmospheric palaeo-CO2 estimates based on the carbon isotope and stomatal data of Cheirolepidiaceae from the Lower Cretaceous of the Jiuquan Basin, Gansu Province, Cretaceous Res., 62, 142–153, https://doi.org/10.1016/j.cretres.2015.07.020, 2016.
Du, B., Lei, X., Zhang, M., Wang, S., Li, A., Du, Z., and Xing, W.: Late Early Cretaceous climate and pCO2 estimates in the Liupanshan Basin, Northwest China, Palaeogeogr. Palaeocl., 503, 26–39, https://doi.org/10.1016/j.palaeo.2018.04.023, 2018.
Ekart, D. D., Cerling, T. E., Montanez, I. P., and Tabor, N., J,: A 400 million year carbon isotope record of pedogenic carbonate: Implications for paleoatmospheric carbon dioxide, Am. J. Sci., 299, 805–827, 1999.
Fernandez, A., Müller, I. A., Rodríguez-Sanz, L., van Dijk, J., Looser, N., and Bernasconi, S. M.: A Reassessment of the Precision of Carbonate Clumped Isotope Measurements: Implications for Calibrations and Paleoclimate Reconstructions, Geochem. Geophy. Geosy., 18, 4375–4386, https://doi.org/10.1002/2017gc007106, 2017.
Fletcher, B. J., Beerling, D. J., Brentnall, S. J., and Royer, D. L.: Fossil bryophytes as recorders of ancient CO2levels: Experimental evidence and a Cretaceous case study, Global Biogeochem. Cy., 19, GB3012, https://doi.org/10.1029/2005gb002495, 2005.
Floegel, S.: On the influence of precessional Milankovitch cycles on the Late Cretaceous climate system: comparison of GCM – results, geochemical, and sedimentary proxies for the Western Interior Seaway of North America, Faculty of Mathematics and Natural Sciences, Christian-Albrecht's- University, Kiel, Germany, 236 pp., 2001.
Föllmi, K. B.: Early Cretaceous life, climate and anoxia, Cretaceous Res., 35, 230–257, https://doi.org/10.1016/j.cretres.2011.12.005, 2012.
Franks, P. J., Royer, D. L., Beerling, D. J., Van de Water, P. K., Cantrill, D. J., Barbour, M. M., and Berry, J. A.: New constraints on atmospheric CO2concentration for the Phanerozoic, Geophys. Res. Lett., 41, 4685–4694, https://doi.org/10.1002/2014gl060457, 2014.
Friedman, I. and O'Neil, J. R.: Compilation of stable isotope fractionation factors of geochemical interest, in: Data of Geochemistry, 6th edn., edited by: Fleischer, M., US Government Printing Office, Washington, D.C., USA, 1977.
Gallagher, T. M. and Sheldon, N. D.: Combining soil water balance and clumped isotopes to understand the nature and timing of pedogenic carbonate formation, Chem. Geol., 435, 79–91, https://doi.org/10.1016/j.chemgeo.2016.04.023, 2016.
Global Network of Isotopes in Precipitation (GNIP): https://www.iaea.org/services/networks/gnip, last access: 24 January 2020.
Ghosh, P., Adkins, J., Affek, H., Balta, B., Guo, W., Schauble, E. A., Schrag, D., and Eiler, J. M.: 13C–18O bonds in carbonate minerals: A new kind of paleothermometer, Geochim. Cosmochim. Ac., 70, 1439–1456, https://doi.org/10.1016/j.gca.2005.11.014, 2006.
Habermann, D., Neuser, R. D., and Richter, D. K.: Quantitative High Resolution Spectral Analysis of Mn2+ in Sedimentary Calcite, in: Cathodoluminescence in Geosciences, Springer, Berlin, Heidelberg, Germany, 331–358, 2000.
Harper, D. T., Suarez, M. B., Uglesich, J., You, H., Li, D., and Dodson, P.: Data and Code for Aptian-Albian clumped isotopes from northwest China: Cool temperatures, variable atmospheric pCO2 and regional shifts in hydrologic cycle, Open Science Framework [data set], https://doi.org/10.17605/OSF.IO/CZJ68, 2021.
Hasegawa, H., Imsamut, S., Charusiri, P., Tada, R., Horiuchi, Y., and Hisada, K.-I.: `Thailand was a desert' during the mid-Cretaceous: Equatorward shift of the subtropical high-pressure belt indicated by eolian deposits (Phu Thok Formation) in the Khorat Basin, northeastern Thailand, Island Arc, 19, 605–621, https://doi.org/10.1111/j.1440-1738.2010.00728.x, 2010.
Hasegawa, H., Tada, R., Jiang, X., Suganuma, Y., Imsamut, S., Charusiri, P., Ichinnorov, N., and Khand, Y.: Drastic shrinking of the Hadley circulation during the mid-Cretaceous Supergreenhouse, Clim. Past, 8, 1323–1337, https://doi.org/10.5194/cp-8-1323-2012, 2012.
Haworth, M., Heath, J., and McElwain, J. C.: Differences in the response sensitivity of stomatal index to atmospheric CO2 among four genera of Cupressaceae conifers, Ann. Bot., 105, 411–418, https://doi.org/10.1093/aob/mcp309, 2010.
Hay, W. W.: Toward understanding Cretaceous climate – An updated review, Sci. China Earth Sci., 60, 5–19, https://doi.org/10.1007/s11430-016-0095-9, 2016.
Heimhofer, U., Hochuli, P. A., Burla, S., Andersen, N., and Weissert, H.: Terrestrial carbon-isotope records from coastal deposits (Algarve, Portugal): a tool for chemostratitgraphic correlation on an intrabasinal and global scale, Terra Nova, 15, 8–13, 2003.
Hönisch, B., Ridgwell, A., Schmidt, D. N., Thomas, E., Gibbs, S. J., Sluijs, A., Zeebe, R., Kump, L., Martindale, R. C., Greene, S. E., Kiessling, W., Ries, J., Zachos, J. C., Royer, D. L., Barker, S., Marchitto Jr., T. M.,, Moyer, R., Pelejero, C., Ziveri, P., Foster, G. L., and Williams, B.: The geological record of ocean acidification, Science, 335, 1058–1063, https://doi.org/10.1126/science.1208277, 2012.
Jenkyns, H. C.: Transient cooling episodes during Cretaceous Oceanic Anoxic Events with special reference to OAE 1a (Early Aptian), Philos. Trans. A Math. Phys. Eng. Sci., 376, 20170073, https://doi.org/10.1098/rsta.2017.0073, 2018.
Kelson, J. R., Huntington, K. W., Breecker, D. O., Burgener, L. K., Gallagher, T. M., Hoke, G. D., and Petersen, S. V.: A proxy for all seasons? A synthesis of clumped isotope data from Holocene soil carbonates, Quaternary Sci. Rev., 234, 106259, https://doi.org/10.1016/j.quascirev.2020.106259, 2020.
Kuang, H. W., Liu, Y. Q., Liu, Y. X., Peng, N., Xu, H., and Dong, C.: Stratigraphy and depositional palaeogeography of the Early Cretaceous basins in Da Hinggan Mountains–Mongolia orogenic belt and its neighboring areas, Geological Bulletin of China, 32, 1063–1084, 2013.
Levin, N. E., Cerling, T. E., Passey, B. H., Harris, J. M., and Ehleringer, J. R.: A stable isotope aridity index for terrestrial environments, P. Natl. Acad. Sci. USA, 103, 11201–11205, https://doi.org/10.1073/pnas.0604719103, 2006.
Li, X., Xu, W., Liu, W., Zhou, Y., Wang, Y., Sun, Y., and Liu, L.: Climatic and environmental indications of carbon and oxygen isotopes from the Lower Cretaceous calcrete and lacustrine carbonates in Southeast and Northwest China, Palaeogeogr. Palaeocl., 385, 171–189, https://doi.org/10.1016/j.palaeo.2013.03.011, 2013.
Lin, W., Chen, Y., Faure, M., and Wang, Q.: Tectonic implications of new Late Cretaceous paleomagnetic constraints from Eastern Liaoning Peninsula, NE China, J. Geophys. Res.-Sol. Ea., 108, 2313, https://doi.org/10.1029/2002jb002169, 2003.
Ludvigson, G. A., Joeckel, R. M., Gonzalez, L. A., Gulbranson, E. L., Rasbury, E. T., Hunt, G. J., Kirkland, J. I., and Madsen, S.: Correlation of Aptian-Albian Carbon Isotope Excursions in Continental Strata of the Cretaceous Foreland Basin, Eastern Utah, U.S.A, J. Sediment. Res., 80, 955–974, https://doi.org/10.2110/jsr.2010.086, 2010.
Ludvigson, G. A., Joeckel, R. M., Murphy, L. R., Stockli, D. F., González, L. A., Suarez, C. A., Kirkland, J. I., and Al-Suwaidi, A.: The emerging terrestrial record of Aptian-Albian global change, Cretaceous Res., 56, 1–24, https://doi.org/10.1016/j.cretres.2014.11.008, 2015.
Matthews, K. J., Maloney, K. T., Zahirovic, S., Williams, S. E., Seton, M., and Müller, R. D.: Global plate boundary evolution and kinematics since the late Paleozoic, Global Planet. Change, 146, 226–250, https://doi.org/10.1016/j.gloplacha.2016.10.002, 2016.
Menegatti, A. P., Weissert, H., Brown, R. S., Tyson, R. V., Farrimond, P., Strasser, A., and Caron, M.: High-resolution δ13C stratigraphy through the Early Aptian “Livello selli” of the Alpine tethys, Paleoceanography, 13, 530–545, https://doi.org/10.1029/98pa01793, 1998.
Mielnick, P. C. and Dugas, W. A.: Soil CO2 flux in a tallgrass prairie, Soil Biology and Biochemistry, 32, 221–228, 2000.
Mintz, J. S., Driese, S. G., Breecker, D. O., and Ludvigson, G. A.: Influence of Changing Hydrology on Pedogenic Calcite Precipitation in Vertisols, Dance Bayou, Brazoria County, Texas, U.S.A.: Implications for Estimating Paleoatmospheric PCO2, J. Sediment. Res., 81, 394–400, https://doi.org/10.2110/jsr.2011.36, 2011.
Mutterlose, J., Bornemann, A., and Herrle, J.: The Aptian – Albian cold snap: Evidence for “mid” Cretaceous icehouse interludes, Neues Jahrb. Geol. P.-A., 252, 217–225, https://doi.org/10.1127/0077-7749/2009/0252-0217, 2009.
Nordt, L. C. and Driese, S. D.: New weathering index improves paleorainfall estimates from Vertisols, Geology, 38, 407–410, https://doi.org/10.1130/g30689.1, 2010.
Passalia, M. G.: Cretaceous pCO2 estimation from stomatal frequency analysis of gymnosperm leaves of Patagonia, Argentina, Palaeogeogr. Palaeocl., 273, 17–24, 2009.
Passey, B. H., Levin, N. E., Cerling, T. E., Brown, F. H., and Eiler, J. M.: High-temperature environments of human evolution in East Africa based on bond ordering in paleosol carbonates, P. Natl. Acad. Sci. USA, 107, 11245–11249, https://doi.org/10.1073/pnas.1001824107, 2010.
Petersen, S. V., Defliese, W. F., Saenger, C., Daëron, M., Huntington, K. W., John, C. M., Kelson, J. R., Bernasconi, S. M., Colman, A. S., Kluge, T., Olack, G. A., Schauer, A. J., Bajnai, D., Bonifacie, M., Breitenbach, S. F. M., Fiebig, J., Fernandez, A. B., Henkes, G. A., Hodell, D., Katz, A., Kele, S., Lohmann, K. C., Passey, B. H., Peral, M. Y., Petrizzo, D. A., Rosenheim, B. E., Tripati, A., Venturelli, R., Young, E. D., and Winkelstern, I. Z.: Effects of Improved 17O Correction on Interlaboratory Agreement in Clumped Isotope Calibrations, Estimates of Mineral-Specific Offsets, and Temperature Dependence of Acid Digestion Fractionation, Geochem. Geophy. Geosy., 20, 3495–3519, https://doi.org/10.1029/2018gc008127, 2019.
Poulsen, C. J., Pollard, D., and White, T. S.: General circulation model simulation of the δ18O content of continental precipitation in the middle Cretaceous: A model-proxy comparison, Geology, 35, 199–202, https://doi.org/10.1130/g23343a.1, 2007.
Retallack, G. J.: Colour guide to paleosols, John Wiley and Sons Ltd., Chichester, UK, 1997.
Retallack, G. J.: Refining a pedogenic-carbonate CO2 paleobarometer to quantify a middle Miocene greenhouse spike, Palaeogeogr. Palaeocl., 281, 57–65, https://doi.org/10.1016/j.palaeo.2009.07.011, 2009.
Romanek, C. S., Grossman, E. L., and Morse, J. W.: Carbon isotopic fractionation in synthetic aragonite and calcite: effects of temperature and precipitation rate, Geochim. Cosmochim. Ac., 56, 419–430, 1992.
Rozanski, K., Luis, A., and Roberto, G.: Isotopic patterns in modern global precipitation, in: Climate Change in Continental Isotopic Records, edited by: Swart, P. K., Lohmann, K. C., Mckenzie, J., and Savin, S., Geophysical Monograph Series, American Geophysical Union, Washington, D.C., USA, 1993.
Schauble, E. A., Ghosh, P., and Eiler, J. M.: Preferential formation of 13C–18O bonds in carbonate minerals, estimated using first-principles lattice dynamics, Geochim. Cosmochim. Ac., 70, 2510–2529, https://doi.org/10.1016/j.gca.2006.02.011, 2006.
Schauer, A. J., Kelson, J., Saenger, C., and Huntington, K. W.: Choice of (17) O correction affects clumped isotope (Delta47) values of CO2 measured with mass spectrometry, Rapid Commun. Mass Spectrom., 30, 2607–2616, https://doi.org/10.1002/rcm.7743, 2016.
Sheldon, N. D. and Tabor, N. J.: Quantitative paleoenvironmental and paleoclimatic reconstruction using paleosols, Earth-Sci. Rev., 95, 1–52, https://doi.org/10.1016/j.earscirev.2009.03.004, 2009.
Spicer, R. A. and Corfield, R. M.: A review of terrestrial and marine climates in the Cretaceous with implications for modelling the “Greenhouse Earth”, Geol. Mag., 129, 169–180, 1992.
Suarez, C. A., Gonzalez, L. A., Ludvigson, G. A., Kirkland, J. I., Cifelli, R. L., and Kohn, M. J.: Multi-Taxa Isotopic Investigation of Paleohydrology In the Lower Cretaceous Cedar Mountain Formation, Eastern Utah, U.S.A.: Deciphering Effects Of the Nevadaplano Plateau On Regional Climate, J. Sediment. Res., 84, 975–987, https://doi.org/10.2110/jsr.2014.76, 2014.
Suarez, M. B., González, L. A., and Ludvigson, G. A.: Quantification of a greenhouse hydrologic cycle from equatorial to polar latitudes: The mid-Cretaceous water bearer revisited, Palaeogeogr. Palaeocl., 307, 301–312, https://doi.org/10.1016/j.palaeo.2011.05.027, 2011a.
Suarez, M. B., Passey, B. H., and Kaakinen, A.: Paleosol carbonate multiple isotopologue signature of active East Asian summer monsoons during the late Miocene and Pliocene, Geology, 39, 1151–1154, https://doi.org/10.1130/g32350.1, 2011b.
Suarez, M. B., Milder, T., Peng, N., Suarez, C. A., You, H., Li, D., and Dodson, P.: Chemostratigraphy of the Lower Cretaceous dinosaur-bearing Xiagou and Zhonggou Formations, Yujingzi Basin, Northwest China, J. Vertebr. Paleontol., 38, 12–21, https://doi.org/10.1080/02724634.2018.1510412, 2018.
Tabor, C. R., Poulsen, C. J., Lunt, D. J., Rosenbloom, N. A., Otto-Bliesner, B. L., Markwick, P. J., Brady, E. C., Farnsworth, A., and Feng, R.: The cause of Late Cretaceous cooling: A multimodel-proxy comparison, Geology, 44, 963–966, 2016.
Tabor, N. J. and Myers, T. S.: Paleosols as Indicators of Paleoenvironment and Paleoclimate, Annu. Rev. Earth Pl. Sc., 43, 333–361, https://doi.org/10.1146/annurev-earth-060614-105355, 2015.
Torsvik, T. H., VanderVoo, R., Preeden, U., MacNiocaill, C., Steinberger, B., Doubrovine, P. V., vanHinsbergen, D. J. J., Domeier, M., Gaina, C., Tovher, E., Meert, J. G., McCausland, P. J., and Cocks, L. R. M.: Phanerozoic polar wander, paleogeography and dynamics, Earth-Sci. Rev., 114, 325–368, 2012.
van Hinsbergen, D. J., de Groot, L. V., van Schaik, S. J., Spakman, W., Bijl, P. K., Sluijs, A., Langereis, C. G., and Brinkhuis, H.: A Paleolatitude Calculator for Paleoclimate Studies, PLoS One, 10, e0126946, https://doi.org/10.1371/journal.pone.0126946, 2015.
Vickers, M. L., Price, G. D., Jerrett, R. M., Sutton, P., Watkinson, M. P., and FitzPatrick, M.: The duration and magnitude of Cretaceous cool events: Evidence from the northern high latitudes, GSA Bulletin, 131, 1979–1994, https://doi.org/10.1130/b35074.1, 2019.
Vincent, S. J. and Allen, M. B.: Evolution of the Minle and Chaoshui Bains, China: Implications for Mesozoic strike-slip basin formation in Central Asia, GSA Bulletin, 111, 725–742, 1999.
Wallmann, K.: Controls on the Cretaceous and Cenozoic evolution of seawater composition, atmospheric CO2 and climate, Geochim. Cosmochim. Ac., 65, 3005–3025, 2001.
White, T. S., González, L. A., Ludvigson, G. A., and Poulsen, C. J.: Middle Cretaceous greenhouse hydrologic cycle of North America, Geology, 29, 363–366, 2001.
Zachos, J. C., Dickens, G. R., and Zeebe, R. E.: An early Cenozoic perspective on greenhouse warming and carbon-cycle dynamics, Nature, 451, 279–283, https://doi.org/10.1038/nature06588, 2008.
Zeebe, R. E.: LOSCAR: Long-term Ocean-atmosphere-Sediment CArbon cycle Reservoir Model v2.0.4, Geosci. Model Dev., 5, 149–166, https://doi.org/10.5194/gmd-5-149-2012, 2012.
Zheng, D., Wang, H., Li, S., Wang, B., Jarzembowski, E. A., Dong, C., Fang, Y., Teng, X., Yu, T., Yang, L., Li, Y., Zhao, X., Xue, N., Chang, S.-C., and Zhang, H.: Synthesis of a chrono- and biostratigraphical framework for the Lower Cretaceous of Jiuquan, NW China: Implications for major evolutionary events, Earth-Sci. Rev., 213, 103474, https://doi.org/10.1016/j.earscirev.2020.103474, 2021.
Zhou, J. and Chafetz, H. S.: Biogenic caliches in Texas: The role of organisms and effect of climate, Sediment. Geol., 222, 207–225, https://doi.org/10.1016/j.sedgeo.2009.09.003, 2009.
Zhou, J., Poulsen, C. J., Pollard, D., and White, T. S.: Simulation of modern and middle Cretaceous marine δ18O with an ocean-atmosphere general circulation model, Paleoceanography, 23, PA3223, https://doi.org/10.1029/2008pa001596, 2008.