the Creative Commons Attribution 4.0 License.
the Creative Commons Attribution 4.0 License.
 | 17 Jun 2021
Climate indices in historical climate reconstructions: a global state of the art
George C. D. Adamson
Linden Ashcroft
Martin Bauch
Chantal Camenisch
Dagomar Degroot
Joelle Gergis
Adrian Jusopović
Thomas Labbé
Kuan-Hui Elaine Lin
Sharon D. Nicholson
Qing Pei
María del Rosario Prieto
Ursula Rack
Facundo Rojas
Sam White
Narrative evidence contained within historical documents and inscriptions provides an important record of climate variability for periods prior to the onset of systematic meteorological data collection. A common approach used by historical climatologists to convert such qualitative information into continuous quantitative proxy data is through the generation of ordinal-scale climate indices. There is, however, considerable variability in the types of phenomena reconstructed using an index approach and the practice of index development in different parts of the world. This review, written by members of the PAGES (Past Global Changes) CRIAS working group – a collective of climate historians and historical climatologists researching Climate Reconstructions and Impacts from the Archives of Societies – provides the first global synthesis of the use of the index approach in climate reconstruction. We begin by summarising the range of studies that have used indices for climate reconstruction across six continents (Europe, Asia, Africa, the Americas, and Australia) as well as the world's oceans. We then outline the different methods by which indices are developed in each of these regions, including a discussion of the processes adopted to verify and calibrate index series, and the measures used to express confidence and uncertainty. We conclude with a series of recommendations to guide the development of future index-based climate reconstructions to maximise their effectiveness for use by climate modellers and in multiproxy climate reconstructions.


Much of the effort of the palaeoclimatological community in recent decades has focused on understanding long-term changes in climate, typically at millennial, centennial, or at best (in the case of dendroclimatology and palaeolimnology) sub-decadal to annual resolution. The results of this research have revolutionised our knowledge of both how climates have varied in the past and the potential drivers of such variability. However, as Pfister et al. (2018) identify, the results of palaeoclimate research are often at a temporal and spatial scale that is not suitable for understanding the short-term and local impacts of climate variability upon economies and societies. To this end, historical climatologists work to reconstruct high-resolution – annual, seasonal, monthly and in some cases daily – series of past temperature and precipitation variability from the archives of societies, as these are the scales at which weather impacts upon individuals and communities (e.g. Allan et al., 2016; Brönnimann et al., 2019).
The archives of societies, used here in a broad sense to refer to both written records and evidence preserved in the built environment (e.g. historic flood markers, inscriptions), contain extensive information about past local weather and its repercussions for the natural environment and on daily lives. Information sources include, but are not limited to, annals; chronicles; inscriptions; letters; diaries/journals (including weather diaries); newspapers; financial, legal, and administrative documents; ships' logbooks; literature; poems; songs; paintings; and pictographic and epigraphic records (Brázdil et al., 2005, 2010, 2018; Pfister, 2018; Rohr et al., 2018). Three main categories of information appear in these sources that can be used independently or in combination for climate reconstruction: (i) early instrumental meteorological data; (ii) records of recurring physical and biological processes (e.g. dates of plant flowering, grape ripening, the freezing of lakes and rivers); and (iii) narrative descriptions of short-term atmospheric processes and their impacts on environments and societies (Brönnimann et al., 2018).
The heterogeneity of the archives of societies – in time, space and in the types of information included in individual sources – raises conceptual and methodological challenges for climate reconstruction. Historical meteorological data can be quality-checked and analysed using standard climatological methods, whereas records of recurrent physical and biological phenomena provide proxy information that may be assessed using a variety of palaeoclimatological approaches (see Brönnimann et al., 2018). Narrative descriptions, however, require different treatment to make local observations of weather and its impacts compatible with the statistical requirements of climatological research.
A common approach used in historical climatology for the analysis of descriptive (or narrative) evidence is the generation of ordinal-scale indices as a bridge between raw weather descriptions and climate reconstructions. A simple index might, for example, employ a three-point classification, with months classed as −1 (cold or dry), 0 (normal), or 1 (warm or wet) depending upon the prevailing conditions described within historical sources. As Pfister et al. (2018) note, this “index” approach provides a means of converting “disparate documentary evidence into continuous quantitative proxy data… but without losing the ability to get back to the short-term local information for critical inspection and analysis” (p. 116). Brázdil et al. (2010) provide a detailed account of the issues associated with the generation of indices.
The index approach to historical climate reconstruction over much of the world – an exception being China – has its roots in European scholarship. There is, however, considerable variability in the types of phenomena reconstructed using an index approach in different areas. There is also variability in practice, both in the way that historical evidence is treated to generate indices and in the number of ordinal categories in individual index series. Variability in the treatment of evidence arises, in part, from the extent to which analytical approaches have developed independently. In terms of categorisation, three-, five-, and seven-point index series are most widely used, but greater granularity (i.e. a greater number of index classes) may be achieved in different regions and for different climate phenomena depending upon the quantity, resolution, and/or richness of the original historical evidence.
This study arises from the work of the PAGES (Past Global Changes) CRIAS working group – a cooperative of climate historians and historical climatologists researching Climate Reconstructions and Impacts from the Archives of Societies. The first meeting of the working group in Bern, Switzerland, in September 2018 identified the need to understand variability and – ideally – harmonise practice in the use of indices to maximise the utility of historical climate reconstructions for climate change investigations. This study, written by regional experts in historical climatology with contributions from other CRIAS members, is intended to address this need.
The main aims of this paper are as follows: (i) the provision of a global state-of-the-art review of the development and use of the index approach as applied to descriptive evidence in historical climate reconstruction; and (ii) identification of best practice for future investigations. It does so through a continent-by-continent overview of practice, followed by a review of the use of indices in the reconstruction of climate variability over the oceans. Studies from northern polar regions are reviewed in Sects. 5 (the Americas) and 7 (the oceans), as appropriate. To the knowledge of the authors, no studies of the climate history of Antarctica have used an index approach.
Three caveats are necessary to frame the coverage of the review. First, the nature of documentary sources is well discussed in the climate history literature for most parts of the world. As such, we provide only limited commentary on sources for each continent, except for selected regions. These include China, where only a few overviews of documentary sources have been published (e.g. Wang, 1979; Wang and Zhang, 1988; Zhang and Crowley, 1989; Ge et al., 2018), and Japan and Russia where, to our knowledge, no detailed descriptions are available for Anglophone audiences. Second, there are instances in the literature where quantifiable data in documentary sources (e.g. sea-ice cover, phenological phenomena) and even instrumental meteorological data are converted to indices for climate reconstruction purposes. This occurs mainly in studies where such data are integrated with narrative evidence to generate longer, more continuous and homogenous series with a consistent (monthly or seasonal) resolution. We do not describe the generation of such index series in detail, but we do provide examples in Sects. 2–7, as appropriate. Third, the emphasis of the article is on the documentation of studies that have used an index approach to climate reconstruction, with critical review and comparison where appropriate. The number of instances where comparative analysis is possible is necessarily restricted by the limited number of studies that have undertaken either different approaches to index development for the same location or identical approaches for different regions.
2.1 Origins of documentary-based indices in Europe
The use of climate indices has a long tradition in Europe, with the earliest studies published during the 1920s. As in any area, the start date for meaningful index-based reconstructions is determined by the availability of source material. In central, western, and Mediterranean Europe, for example, sources containing narrative evidence are sufficiently dense from the 15th century (CE) onwards to enable seasonal index reconstruction for more than half of all covered years. Exceptionally, indices can be generated from the 12th century onwards but with greatest confidence from the 14th century when serial sources join the available historiographic information (Wozniak, 2020). The number of index-based climate reconstructions for Europe is large; as such, this section of the review focuses mainly upon studies that include original published series based on primary sources and that reconstruct meteorological entities. This excludes climate modelling and other studies that synthesise or reanalyse previously published historical index series.
Due to the dominance of references to winter conditions in European documentary sources, early investigations centred primarily on winter severity (Pfister et al., 2018). The first use of the index approach was by the Dutch journalist, astronomer, and later climatologist Cornelis Easton, who published his oeuvre on historical European winter severity in 1928 (Easton, 1928). In this monograph, Easton presented early instrumental data as well as a catalogue of descriptions of winter conditions dating back to the 3rd century (BCE) derived from narrative evidence. For the period prior to 1205 CE, this catalogue lists only remarkable winter seasons; however, after this date every winter up to 1916 is attributed to a 10-point classification, including a quantifiable coefficient and a descriptive category. Easton's classification appears as an adapted graph in the second edition of Charles E. P. Brooks (1949) book on Climate Through the Ages (Pfister et al., 2018).
An isolated attempt to quantify the evaluation of weather diaries (spanning from 1182 to 1780 CE) was proposed by the German meteorologist Fritz Klemm (1970), with a two-point scale for winter and summer temperature (cold/mild and mild/warm respectively) and precipitation (dry/wet). The Dutch meteorologist Folkert IJnsen also developed winter severity indices for the Netherlands (1200–1916 CE) but following a slightly different approach (IJnsen and Schmidt, 1974). However, one of the most important advances came in the late 1970s when British climatologist Hubert Horace Lamb published a three-point index series of winter severity and summer wetness for western Europe (1100–1969 CE) in his seminal book Climate: Past, Present and Future (Lamb, 1977). Lamb's methodology was more easily applicable compared with Easton's – a likely reason why successive studies refer to Lamb's method and why, in the aftermath of his publication, the index approach was applied in many different European regions.
In 1984, the Swiss historian Christian Pfister published his first temperature and precipitation indices for Switzerland in the volume Das Klima der Schweiz von 1525–1860, expanding his climate indices to cover all months and seasons of the year (Pfister, 1984). Pfister's work adapted Lamb's methods, extending Lamb's three-point scale into monthly seven-point ordinal-scale temperature and precipitation indices (Fig. 1). Shortly after Pfister's initial study, Pierre Alexandre (1987) developed a comprehensive overview of the climate of the European Middle Ages (1000–1425 CE), also using indices. Over a decade later, Van Engelen et al. (2001) published a nine-point index-based temperature reconstruction for the Netherlands and Belgium (764–1998 CE). Most research groups investigating European climate history – including those led by Rüdiger Glaser (Freiburg, Germany) and Rudolf Brázdil (Brno, Czech Republic) – now adopt Pfister's approach as the standard method for index development, at least for temperature and precipitation reconstructions. This is described in more detail in Sect. 8 as part of a global overview of approaches to index construction. The opportunity to combine narrative evidence with quantifiable information is one of the great advantages of the index approach (Pfister et al., 2018). As a result, many index-based series for Europe incorporate some quantitative data. Many series also contain data gaps; the earlier the epoch, the more likely there are to be breaks in series – this is common to almost all index-based series globally.
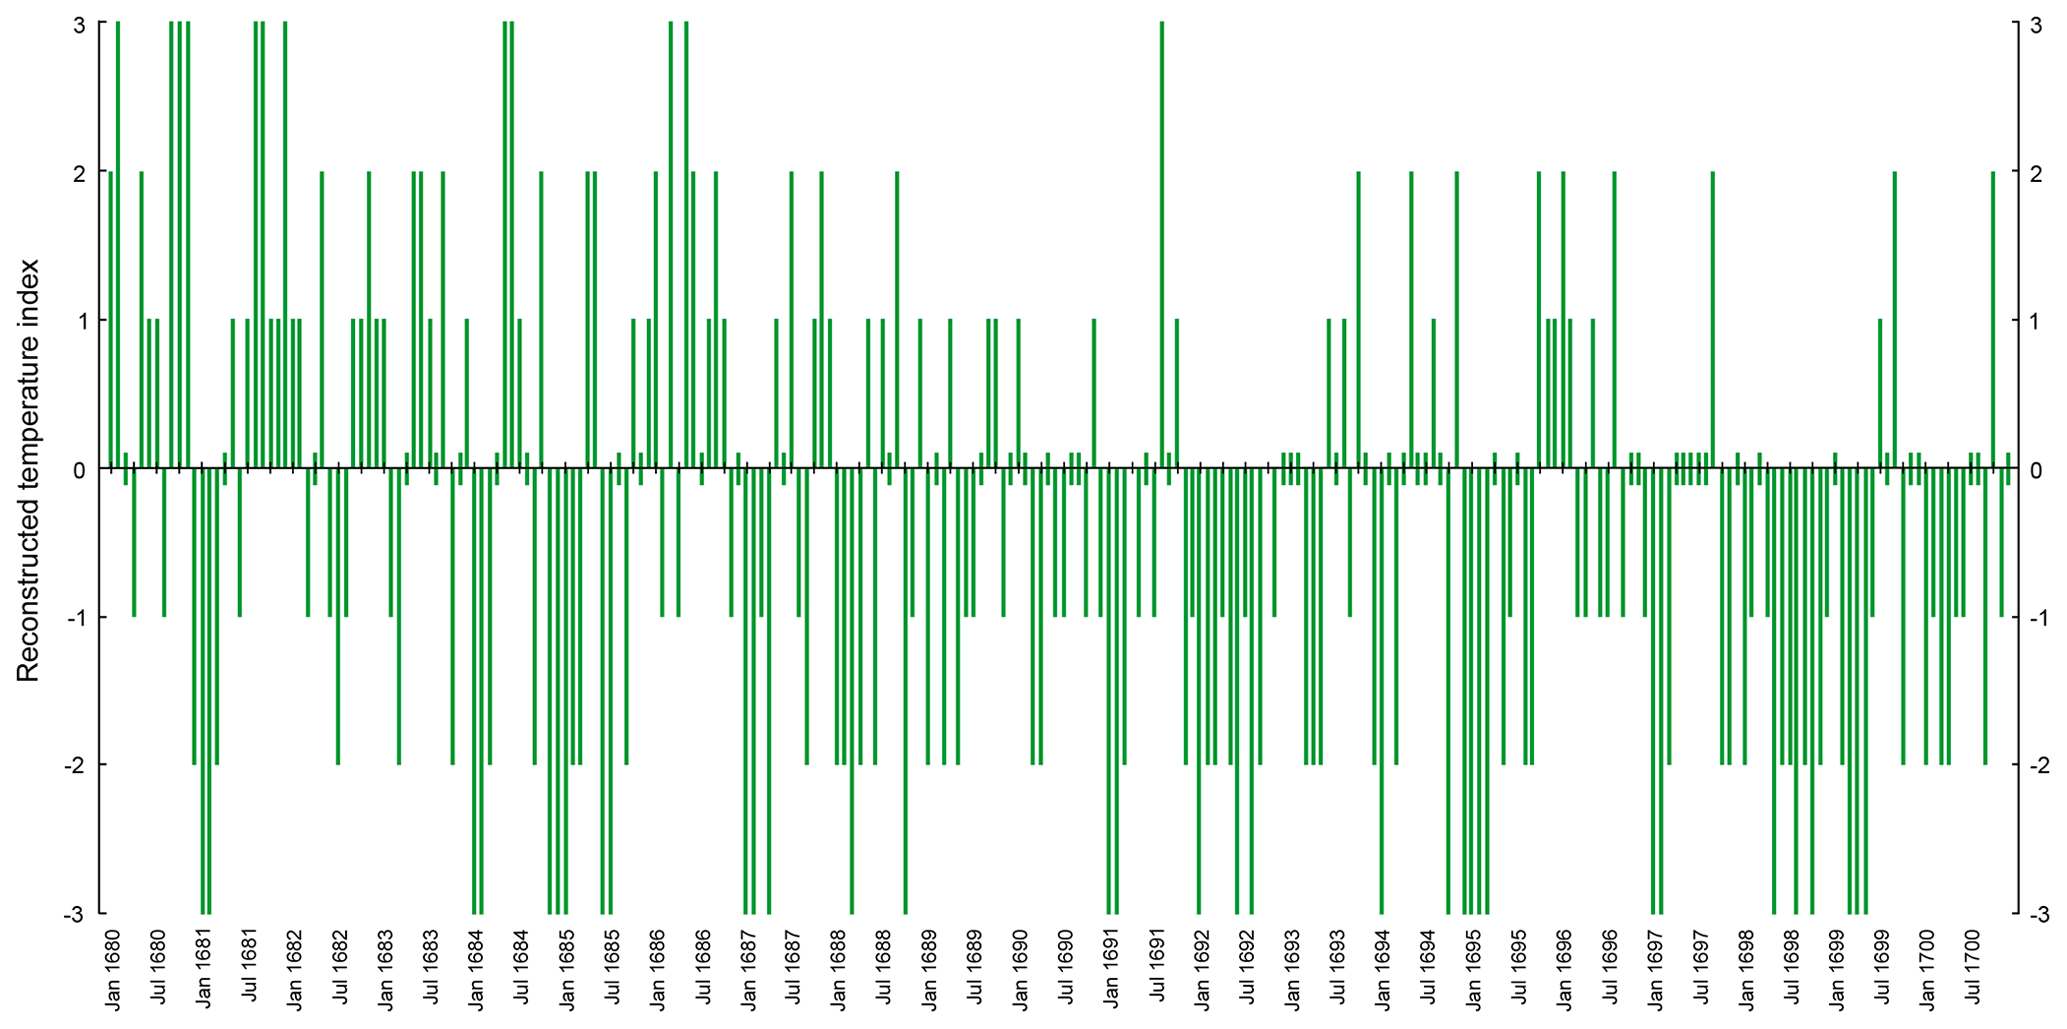
Figure 1Monthly seven-point temperature indices for the Swiss Plateau (1680–1700 CE), reconstructed using the Pfister index approach (data from Pfister, 1998). Zero values for specific months are indicated by a small green bar.
One area of Europe with a different research tradition is Russia (Jusupović and Bauch, 2020). Here, the earliest climate history research was by Konstantin Veselovskij (1857), who compared historical information from various source types against early 19th century statistical climate data (for more details of Veselovskij's work, see Zhogova, 2013). Mikhail Bogolepov later analysed climate-related information in published Cyrillic and Latin sources from the 10th century onwards (Bogolepov, 1907, 1908, 1911). Other studies have focused on accounts of anomalous weather in Russian sources (e.g. Borisenkov and Paseckij, 1983, 1988) and on reconstructing historical climate (Burchinskij, 1957; Liakhov, 1984; Borisenkov, 1988; Klimanov et al., 1995; Klimenko et al., 2001; Slepcov and Klimenko, 2005; Klimenko and Solomina, 2010), river flows (Oppokov, 1933), and famine years (Leontovich, 1892; Bozherianov, 1907).
The most important collection of Russian documentary sources is the
43-volume ![]() (“Complete Collection of Russian
Chronicles”, abbreviated to
(“Complete Collection of Russian
Chronicles”, abbreviated to ![]() ;
Borisenkov and Paseckij, 1988). These
chronicles document events including infestations of insects, droughts, wet
summers, wet autumns, unusual frost events, famine, floods, storms, and
earthquakes. The records have been used, in conjunction with other European
sources, by Borisenkov and Paseckij (1988) to reconstruct a qualitative
Russian climate history for the last 1000 years. More recent reconstructions
have extended beyond historical sources to include a variety of other
climate proxies (e.g. Klimenko and Solomina, 2010). The development of
index-based series from narrative evidence has yet to be attempted, although
reconstructions of specific meteorological extremes, including
wet/dry/warm/cold seasons and floods plus related socio-economic events such
as famines, have been published by Shahgedanova (2002) (based on Borisenkov
and Paseckij, 1983).
;
Borisenkov and Paseckij, 1988). These
chronicles document events including infestations of insects, droughts, wet
summers, wet autumns, unusual frost events, famine, floods, storms, and
earthquakes. The records have been used, in conjunction with other European
sources, by Borisenkov and Paseckij (1988) to reconstruct a qualitative
Russian climate history for the last 1000 years. More recent reconstructions
have extended beyond historical sources to include a variety of other
climate proxies (e.g. Klimenko and Solomina, 2010). The development of
index-based series from narrative evidence has yet to be attempted, although
reconstructions of specific meteorological extremes, including
wet/dry/warm/cold seasons and floods plus related socio-economic events such
as famines, have been published by Shahgedanova (2002) (based on Borisenkov
and Paseckij, 1983).
2.2 Temperature indices
Temperature is the most common meteorological phenomenon analysed using an index approach over northern and central Europe. Authors who have developed temperature index series include Christian Pfister (1984, 1992, 1999), Pierre Alexandre (1987), Rudolf Brázdil (e.g. Brázdil and Kotyza, 1995, 2000; Brázdil et al., 2013a; spanning periods from 1000 to 1830 CE), Rüdiger Glaser (e.g. Glaser et al., 1999; Glaser, 2001; Glaser and Riemann, 2009; 1000–2000 CE), Astrid Ogilvie and Graham Farmer (1997; 1200–1439 CE), Gabriela Schwarz-Zanetti (1998; 1000–1524 CE), Lajos Rácz (1999; 16th century onwards), the Dutch working group around Aryan Van Engelen (Van Engelen et al., 2001; Shabalova and van Engelen, 2003), Maria-João Alcoforado et al. (2000; 1675–1715 CE), Elena Xoplaki et al. (2001; 1675–1715 and 1780–1830 CE), Anita Bokwa et al. (2001; 16th and 17th centuries), Petr Dobrovolný et al. (2009), Dario Camuffo et al. (2010; 1500–2000 CE), Maria Fernández-Fernández et al. (2014; 2017; 1750–1840 CE), Laurent Litzenburger (2015; 1400–1530 CE), and Chantal Camenisch (2015a, b; 15th century). The basis of these reconstructions is mainly narrative evidence from multiple sources, or in the case of Brázdil and Kotyza (1995, 2000) and Fernández-Fernández et al. (2014), a single narrative source. However, depending on the epoch, evidence may be supplemented by information from early weather diaries, administrative records, and legislative sources. The majority of these studies (e.g. Pfister, 1984, 1992; Brázdil and Kotyza, 1995; Glaser et al., 1999; Pfister, 1999; Rácz, 1999; Brázdil and Kotyza, 2000; Glaser, 2001; Van Engelen et al., 2001; Shabalova and van Engelen, 2003; Dobrovolný et al., 2009; Glaser and Riemann, 2009; Camuffo et al., 2010) include an overlap with available instrumental data.
In Europe, different types of index scales have been used. As noted above, Christian Pfister (1984) developed a seven-point scale with a monthly resolution for temperature and precipitation (e.g. for temperature, −3 denotes extremely cold, −2 denotes very cold, −1 denotes cold, 0 denotes normal, 1 denotes warm, 2 denotes very warm, and 3 denotes extremely warm). Most historical climatologists follow this approach, though in some cases less granulated versions have had to be applied due to limited source density or quality. For instance, Glaser (2013) followed Pfister's indexing approach but used a three-point scale for the 1000–1500 CE period as information on weather appears only occasionally in documentary sources from this time. Schwarz-Zanetti (1998), Litzenburger (2015), and Camenisch (2015a) have also applied seven-point indices for the late Middle Ages, with the latter two series at a seasonal resolution (Fig. 2).
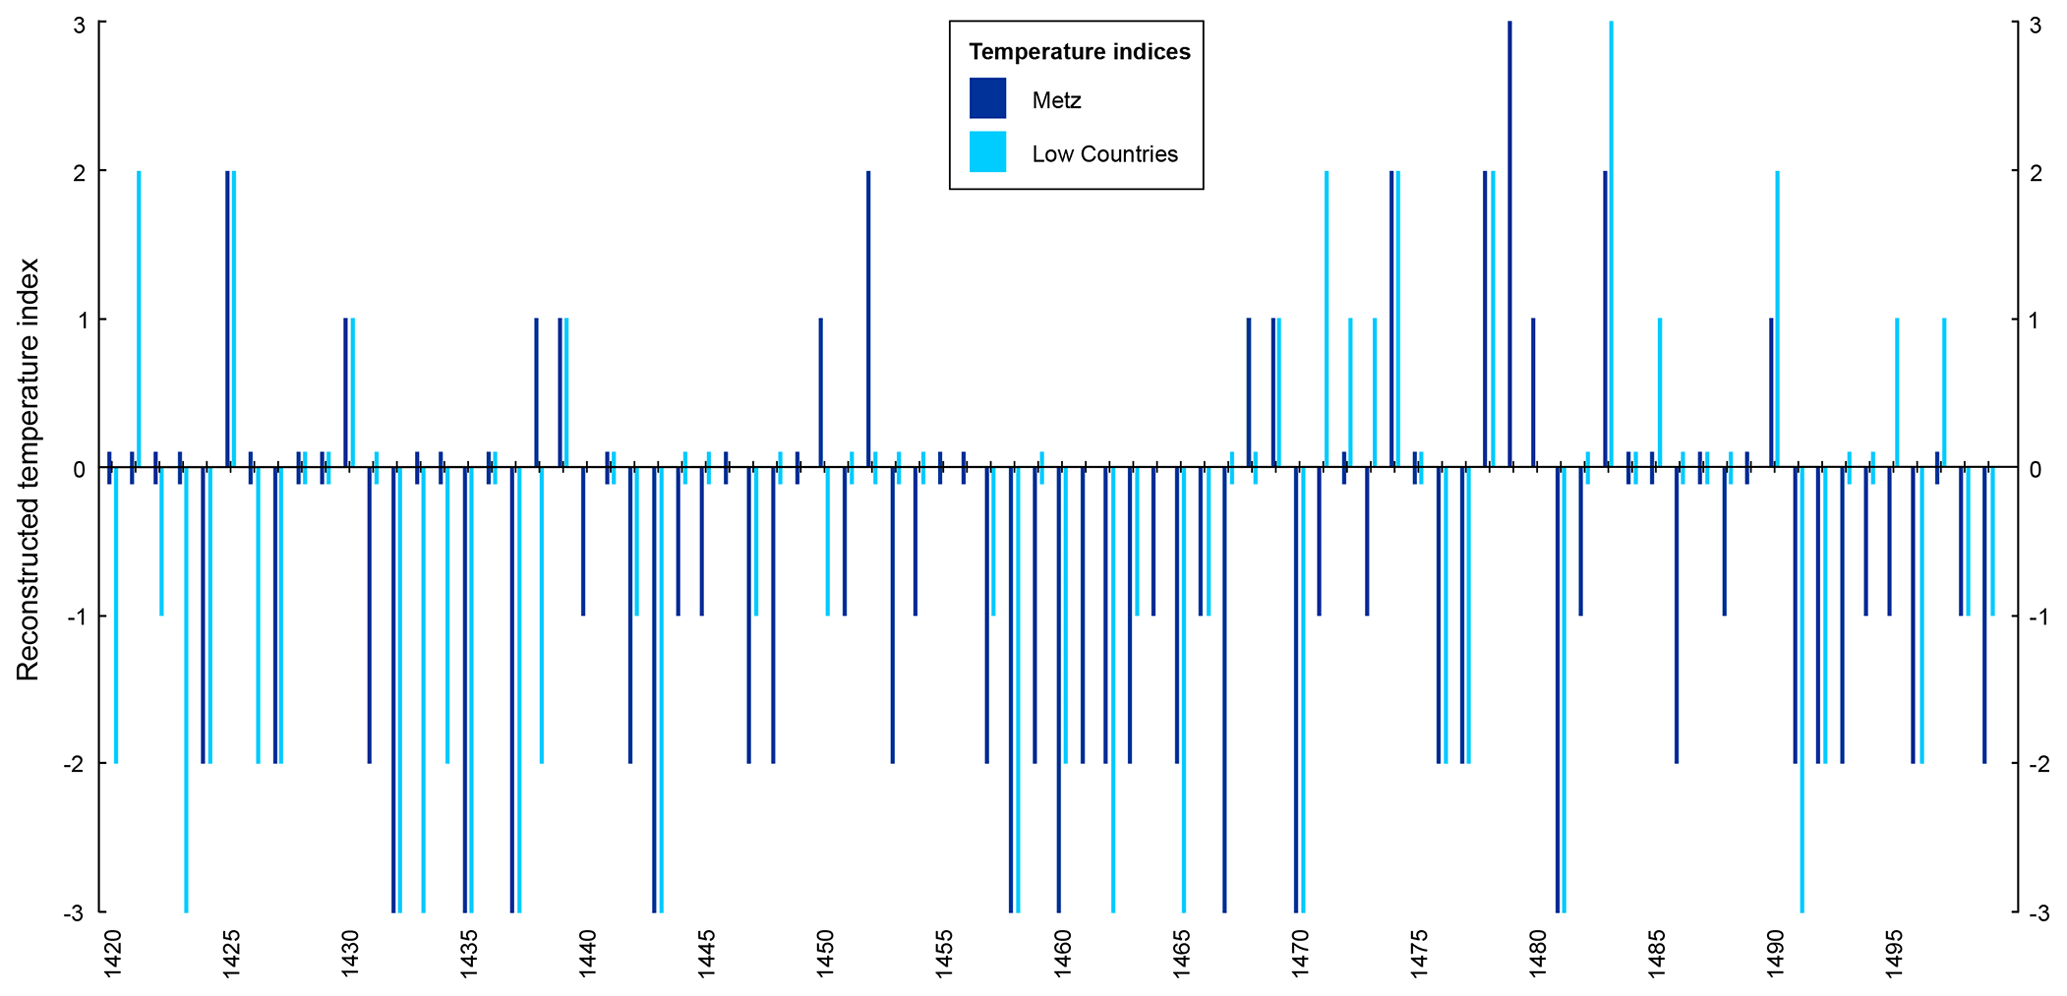
Figure 2Comparison of seven-point winter temperature indices for Metz (Litzenburger, 2015) and the Low Countries (Belgium, Luxembourg, and the Netherlands; Camenisch, 2015a) for the 1420–1500 CE period, reconstructed using the Pfister index approach. Zero values for specific years are indicated by a small bar.
In addition to these studies, four other approaches exist for Europe: (i) IJnsen's temperature index (IJnsen and Schmidt, 1974) consists of a nine-point scale, which was also adopted by Van Engelen et al. (2001); (ii) Alexandre (1987) used a five-point scale seasonal index, with categories from −2 (very warm) to +2 (very cold) and 0 being attributed to non-documented seasons; (iii) Fernández-Fernández et al. (2014, 2017) used a three-point-scale (with +1 being warmer than usual, 0 being normal, and −1 being colder than usual), and (iv) Domínguez-Castro et al. (2015) used a five-point index (with +2 being very hot, +1 being hot, 0 being normal, −1 being cold, and −2 being very cold). As noted in Sect. 2.1, Klemm (1970) proposed a two-point index (warm/cold) for winter conditions.
2.3 Precipitation indices
Many of the authors mentioned in Sect. 2.2 have also published precipitation indices. These reconstructions are usually based on the same source materials as the temperature indices (an exception being Dobrovolný et al., 2015). However, for certain regions, very specific source types exist that are more favourable for precipitation reconstructions than temperature – see, for example, the precipitation series for the Mediterranean based on the analysis of urban annals, religious chronicles, and books of church and city archives (e.g. Rodrigo et al., 1994, 1998, 1999; Rodrigo and Barriendos, 2008; Fernández-Fernández et al., 2014; Domínguez-Castro et al., 2015; Fernández-Fernández et al., 2015). These series span various periods of the 16th to 20th centuries and, in some cases, overlap with instrumental data.
Often the same scale is applied for both temperature and precipitation indices; however, in certain regions, precipitation indices may show more gaps than their temperature counterparts as data may be seasonal or more sporadic. The studies by Van Engelen et al. (2001), Alexandre (1987), Fernández-Fernández et al. (2014, 2017), and Domínguez-Castro et al. (2015) are exceptions, in that each adopted a different or more rudimentary scale for precipitation compared with their temperature reconstructions. Van Engelen et al. (2001) opted for a five-point scale for precipitation compared with a nine-point scale for temperature, and Alexandre (1987) opted for a three-point rather than a five-point index. The precipitation index of Alexandre (1987) is also relatively simple and separates events by their nature (1 represents snow, 2 represents rain, and 3 represents dry conditions) rather than intensity. Fernández-Fernández et al. (2014, 2017) used a two-point scale (with 0 being the total absence of rain and 1 being the occurrence of rain), and Domínguez-Castro et al. (2015) used a four-point scale.
Index series based on historical records of religious rogation ceremonies warrant separate discussion. Rogations are liturgical acts conducted to request either rainfall during a drought (termed pro-pluvia rogations) or an end to excessive or persistent precipitation (pro-serenitate rogations), and were used as an institutional mechanism to address social stress in response to such meteorological extremes (see Martín-Vide and Barriendos, 1995; Barriendos, 2005; Tejedor et al., 2019). Analyses of the occurrence and nature of rogation ceremonies have proven particularly valuable for western Mediterranean regions (most notably the Iberian Peninsula), where they have been used to create precipitation indices spanning the 16th to 19th centuries (e.g. Álvarez Vázquez, 1986; Martín-Vide and Vallvé, 1995; Barriendos, 1997, 2010; Gil-Guirado et al., 2019). In some cases, information about rogation ceremonies has been combined with climate-related narrative evidence to generate precipitation series (e.g. Fragoso et al., 2018). Useful evaluations of different indexing methods are provided by Domínguez-Castro et al. (2008) and Gil-Guirado et al. (2016). For a discussion of the use of rogation ceremonies as a proxy for drought, see Sect. 2.5, and for examples of rogation-based reconstructions in Mexico and South America, see Sect. 5.
2.4 Flood indices
Flood events – the result of short periods of heavy precipitation and/or prolonged rainfall – can also be classified using indices. The basis of European flood indices includes descriptive accounts, administrative records such as bridge master's accounts (e.g. those in Wels, Austria, which span the 1350–1600 CE period; Rohr, 2006, 2007, 2013), historic flood marks, and river profiles (Wetter et al., 2011; spanning 1268 CE to present and overlapping with instrumental data). In some regions, the availability and characteristics of sources may vary, and certain source types may be more important for flood reconstruction than others. This is, for instance, the case in Hungary, where charters play a particularly important role in flood reconstruction (Kiss, 2019; for the 1001–1500 CE period).
The scales used for flood reconstruction differ slightly from those used for the reconstruction of temperature and precipitation. Drawing on Brázdil et al. (1999; which spans the 16th century), scholars mainly from central Europe (e.g. Sturm et al., 2001 – for the 1500 CE–present period; Glaser and Stangl, 2003, 2004 – 1000 CE–present; Kiss, 2019), and France (Litzenburger, 2015) have applied a three-point scale. In contrast, Pfister (1999), Wetter et al. (2011), and Salvisberg (2017; 1550–2000 CE) used a five-point scale for floods of the river Rhine in Basel and the river Gürbe in the vicinity of Bern. The French historian Emmanuel Garnier also developed a five-point scale to reconstruct flood time series from 1500 to 1850 CE, taking the spatial extent and economic consequences of each event into consideration (Garnier, 2009, 2015). A novel feature of the Garnier index is that it includes a −1 value for events where intensity cannot be estimated through documentary sources. Rohr (2006, 2007, 2013) chose a four-point scale for his flood reconstruction of the river Traun in Wels (Austria). In many cases, the index values express the amount of flood damage and/or the duration of flooding in combination with the geographical extent (e.g. Pfister and Hächler, 1991 – covering the 1500–1989 CE period; Salvisberg, 2017; Kiss, 2019). Comprehensive overviews of flood reconstruction, including the index method, are given in Glaser et al. (2010), Brázdil et al. (2012), and recent work by the PAGES Floods Working Group synthesised in Wilhelm et al. (2018).
2.5 Drought indices
Drought events are closely linked to precipitation variability. As a result, many analyses of historical European droughts use indices adapted from precipitation reconstructions. Evidence of past droughts can be found in administrative sources, diaries, newspapers, religious sources, and epigraphic evidence (see Brázdil et al., 2005, 2018; Erfurt et al., 2019 – which spans the 1800 CE–present period). Different approaches exist in historical climatology to express the severity of droughts in index form. Brázdil and collaborators (2013b) proposed a three-point scale (with −1 being dry, −2 being very dry, and −3 being extremely dry) adapted from the precipitation indices described in Sect. 2.3. Dry periods appear only in the drought index if they last for at least 2 successive months. A similar approach is used by Pfister et al. (2006), Camenisch and Salvisberg (2020; covering 1315–1715 CE), and Bauch et al. (2020; 1200–1400 CE). However, Garnier (2018) applies a five-point scale with an additional sixth category for known drought years with insufficient evidence for a more precise classification.
Drought indices have also been derived for the western Mediterranean using records of rogation ceremonies, with specific methodologies developed to estimate the length, severity, and continuity of drought episodes (see Domínguez-Castro et al., 2008). A number of studies have used evidence of pro-pluvia ceremonies (see Sect. 2.3) as a drought proxy (Piervitali and Colacino, 2001; Domínguez-Castro et al., 2008, 2010; Garnier, 2010; Domínguez-Castro et al., 2012b; Tejedor et al., 2019), sometimes in combination with other narrative evidence (e.g. Fragoso et al., 2018; Gil-Guirado et al., 2019). Readers are referred to Brázdil et al. (2018) for a detailed discussion of the different types of drought indices.
2.6 Other indices
In Europe, the index method has only rarely been applied in contexts other than for temperature, precipitation, flood, and drought reconstruction. For example, Pichard and Roucaute (2009) developed an index for snowfall in the French Mediterranean region since 1715 CE, including ordinal categories escalating from 1 to 3 depending on the event duration and quantity of snow fallen. This study is based on information from diaries and other urban documentary sources. Marie-Luise Heckmann (2008, 2015), coming from the field of historical seismology and seemingly unconnected to discussions in historical climatology, developed a combined temperature–precipitation index that differentiates winters and summers by weather description and phenological phenomena; this index was applied to documentary data from late-medieval Prussia and Livonia (1200–1500 CE). Pro-pluvia rogation ceremonies have been analysed as a proxy for the winter North Atlantic Oscillation between 1824 and 1931 CE in the Extremedura region of Spain (Bravo-Paredes et al., 2020).
Sea-ice reconstructions for the seas around Iceland have been developed by Astrid Ogilvie, the pioneer of Icelandic climate history (Ogilvie, 1984, 1992; Ogilvie and Jónsson, 2001). She developed a monthly resolution sea-ice index based on historical observations in 37 sectors of the sea around Iceland (Ogilvie, 1996), including sightings of sea ice in ships' logbooks, whalers' and sealers' charts, diaries, letters, books, and newspapers. Hence, the index values vary from 1 to (theoretically) 37, with data weighed by source reliability. Pre-1900 CE records report single observations of icebergs, and varying concepts of sea ice have to be taken into consideration. The record is presented as a 5-year summarised value for the 1600–1784 CE period, with monthly and annual values given from 1785 to present.
3.1 Origins of documentary-based indices in Asia
The use of the index approach in Asia is limited to research in China and India. With the exception of Japan, historical climatology research is either in its infancy or completely absent in other parts of the continent (Adamson and Nash, 2018). Very little work to reconstruct climate from documentary sources has occurred in southeast Asia, for example, and efforts to utilise records from the Byzantine Empire (Telelis, 2008; Haldon et al., 2014) and Muslim world (e.g. Vogt et al., 2011; Domínguez-Castro et al., 2012a) have only recently been emerging. In Korea, only Kong and Watts (1992) have developed anything resembling climate indices, categorising individual years as warm/cold or dry/humid using information from diaries and histories.
Climate reconstruction work in China has developed largely independently from European historical climatology traditions. The Central Meteorological Bureau of China has published several fundamental works on Chinese wet/dry series. In 1981, a milestone work showed 120 cities with a five-point wet/dry series for the whole of China spanning the 1470 to 1979 CE period (Central Meteorological Bureau of China, 1981). Nowadays, most reconstructions (including coldness, drought, frost, hail, and others) are based on the Compendium of Chinese Meteorological Records of the Last 3,000 Years edited by Zhang De'er (2004). This compendium provides details of a wide range of historical meteorological phenomena from across China at a daily level. However, due to an imbalance in population distribution, records are more abundant for eastern than western China (Ge et al., 2013). In India, the only study to use an index approach (Adamson and Nash, 2014) was developed from Nash and Endfield's work in southern Africa (see Sect. 4); there were, however, several differences in approach, notably the inclusion of calibration tables.
One country where the field of historical climatology is relatively well-developed is Japan. Japan has weather data recorded in documents dating back to at least 55 CE (Ingram et al., 1981), and diaries in particular have been utilised to reconstruct climate conditions (e.g. Mikami, 2008; Zaiki et al., 2012; Ichino et al., 2017; Shō et al., 2017). Access to documentary data on past weather phenomena is provided by detailed collections that evaluate historical sources (Mizukoshi, 2004–2014; Fujiki, 2007). However, Japanese historical climatology has no tradition of using indices, instead tending to use information in documentary sources to reconstruct units of meteorological measurement, such as temperature and precipitation, directly. For example, Mikami (2008) correlated mean monthly summer temperature with number of rain days. Mizukoshi (1993) and Hirano and Mikami (2008) used historical records to provide detailed reconstructions of weather patterns. Mizukoshi (1993) divided rainy seasons into three types – “heavy rain type”, “light rain type”, and “clear rainy season type” – although these are not indices per se. In a similar way, Itō (2014) distinguished precipitation in categories such as “persisting rainfall” or “long downpour”, depending on seven keywords for each category. He used a similar approach to define indicators for cold spells, using keywords such as “cold”, “frost”, and “put on cotton (clothes)”. This keyword method for climatic conditions is also applied by Tagami (2015). There has also been much effort to reconstruct climate from climate-dependent phenomena such as cherry blossom or lake freezing dates (e.g. Aono and Kazui, 2008; Mikami, 2008; Aono and Saito, 2010).
3.2 Types of documentary evidence used to create index series
Historical climate index development in India has used a similar range of sources to those noted above for Europe – specifically newspapers and private diaries spanning the period from 1781 to 1860 CE, supplemented by government records, missionary materials, and some reports (Adamson and Nash, 2014). The sources used for the development of climate indices in China, however, are very different and require further explanation.
The earliest known written weather records in China, inscribed onto oracle bones, bronzes, and wooden scripts, date to the Shang dynasty (∼1600 BCE). These records were intended for weather forecasting but later included actual weather observations (Wang and Zhang, 1988). Emperors of succeeding dynasties compiled more systematic records to allow them to better understand the weather, forecast harvests, and, hence, maintain social stability (Tan et al., 2014). Some scholars use an old Chinese concept of Tien (or Tian, meaning Heaven) to explain the tradition. Tien was viewed as a medium used by gods and divinities to forward messages. Natural hazards (e.g. droughts and floods) were regarded as displaying Tien's displeasure with the emperor and his court and were often followed by uprisings and rebellions (Perry, 2001; Pei and Forêt, 2018). To help them understand the long-term pattern of such hazards, imperial governments appointed specialists such as Taishi (imperial historians) or Qintian Jian (imperial astronomers) to record unusual and/or extreme weather events. Later, related environmental and socio-economic events, such as early or late blossoming, agricultural conditions, famine, plagues, and locust outbreaks, were also recorded (see Wang et al., 2018, for further details). This long tradition of chronicling has resulted in an exceptional range of materials for understanding and reconstructing past climates. It is worth noting, however that – due to a desire in imperial China to generalise details (Hansen, 1985) – phenomena were often only recorded as narrative descriptions with magnitude categorised as large, medium, or small.
The earliest official chronicle was Han Shu (“The Book of Han”) written by Ban Gu (32–92 CE). However, many earlier historical books incorporate climate observations, including Shi Ji (“Records of the Grand Historian”) by Sima Qian (145–86 BCE) and Chun Qiu (“Spring and Autumn Annals”) compiled by Confucius (551–479 BCE) for the history of the Lu Kingdom (722–481 BCE) (Wang and Zhang, 1988). Classic literature called Jing Shi Zi Ji was compiled in Si Ku Quan Shu (“Complete Library in Four Branches of Literature”) published in 1787 (full-text digital versions are accessible at websites including Scripta Sinica: http://hanchi.ihp.sinica.edu.tw/ihp/hanji.htm, last access: 3 June 2021). The Shi (meaning “history”) branch contains, but is not limited to, the “Twenty-Four Histories” (later expanded to “Twenty-Five Histories” by adding Qing Shi Gao, the “Draft History of Qing”), other historical books, documents of the central administration, local gazettes, and private diaries (Ge et al., 2018).
While providing consistency in recording practices, the spatial coverage of official historical books was often limited to national capitals or other important locations. However, the writing of Fang Zhi – local chronicles or gazettes, popular in the Ming (1368–1643 CE) and especially Qing (1644–1911 CE) dynasties – substantively expanded the availability of documentary sources. Local gazettes contain unusual weather- and climate-related statements like those in the official chronicles, but they incorporate additional details at provincial, prefectural, county, or township levels depending on the local administrative unit. For more information, see Ge et al. (2018) and a database of local gazettes at http://lcd.ccnu.edu.cn/#/index (last access: 3 June 2021).
In the 1980s, the Central Meteorological Bureau of China initiated a massive project for the compilation of weather- and climate-related records. The work resulted in the most influential publication in contemporary Chinese climate literature, the Compendium of Chinese Meteorological Records of the Last 3,000 Years edited by Zhang De'er (2004); this contains more than 150 000 records quoted from 7930 historical documents, mostly local gazettes. To maximise the availability of the compendium, Wang et al. (2018) have digitised the records into the Reconstructed East Asian Climate Historical Encoded Series (REACHES) database (Fig. 3). The quantity of records peaks in the last 600 years, during the Ming and Qing dynasties. This is due to a large number of local gazettes spread across the country; however, only a few are available for the Tibetan Plateau and arid western regions. The Institute of Geographic Sciences and Natural Resources Research (Chinese Academy of Sciences) has also collated phenological records from historical documents (Zhu and Wang, 1973; Ge et al., 2003).
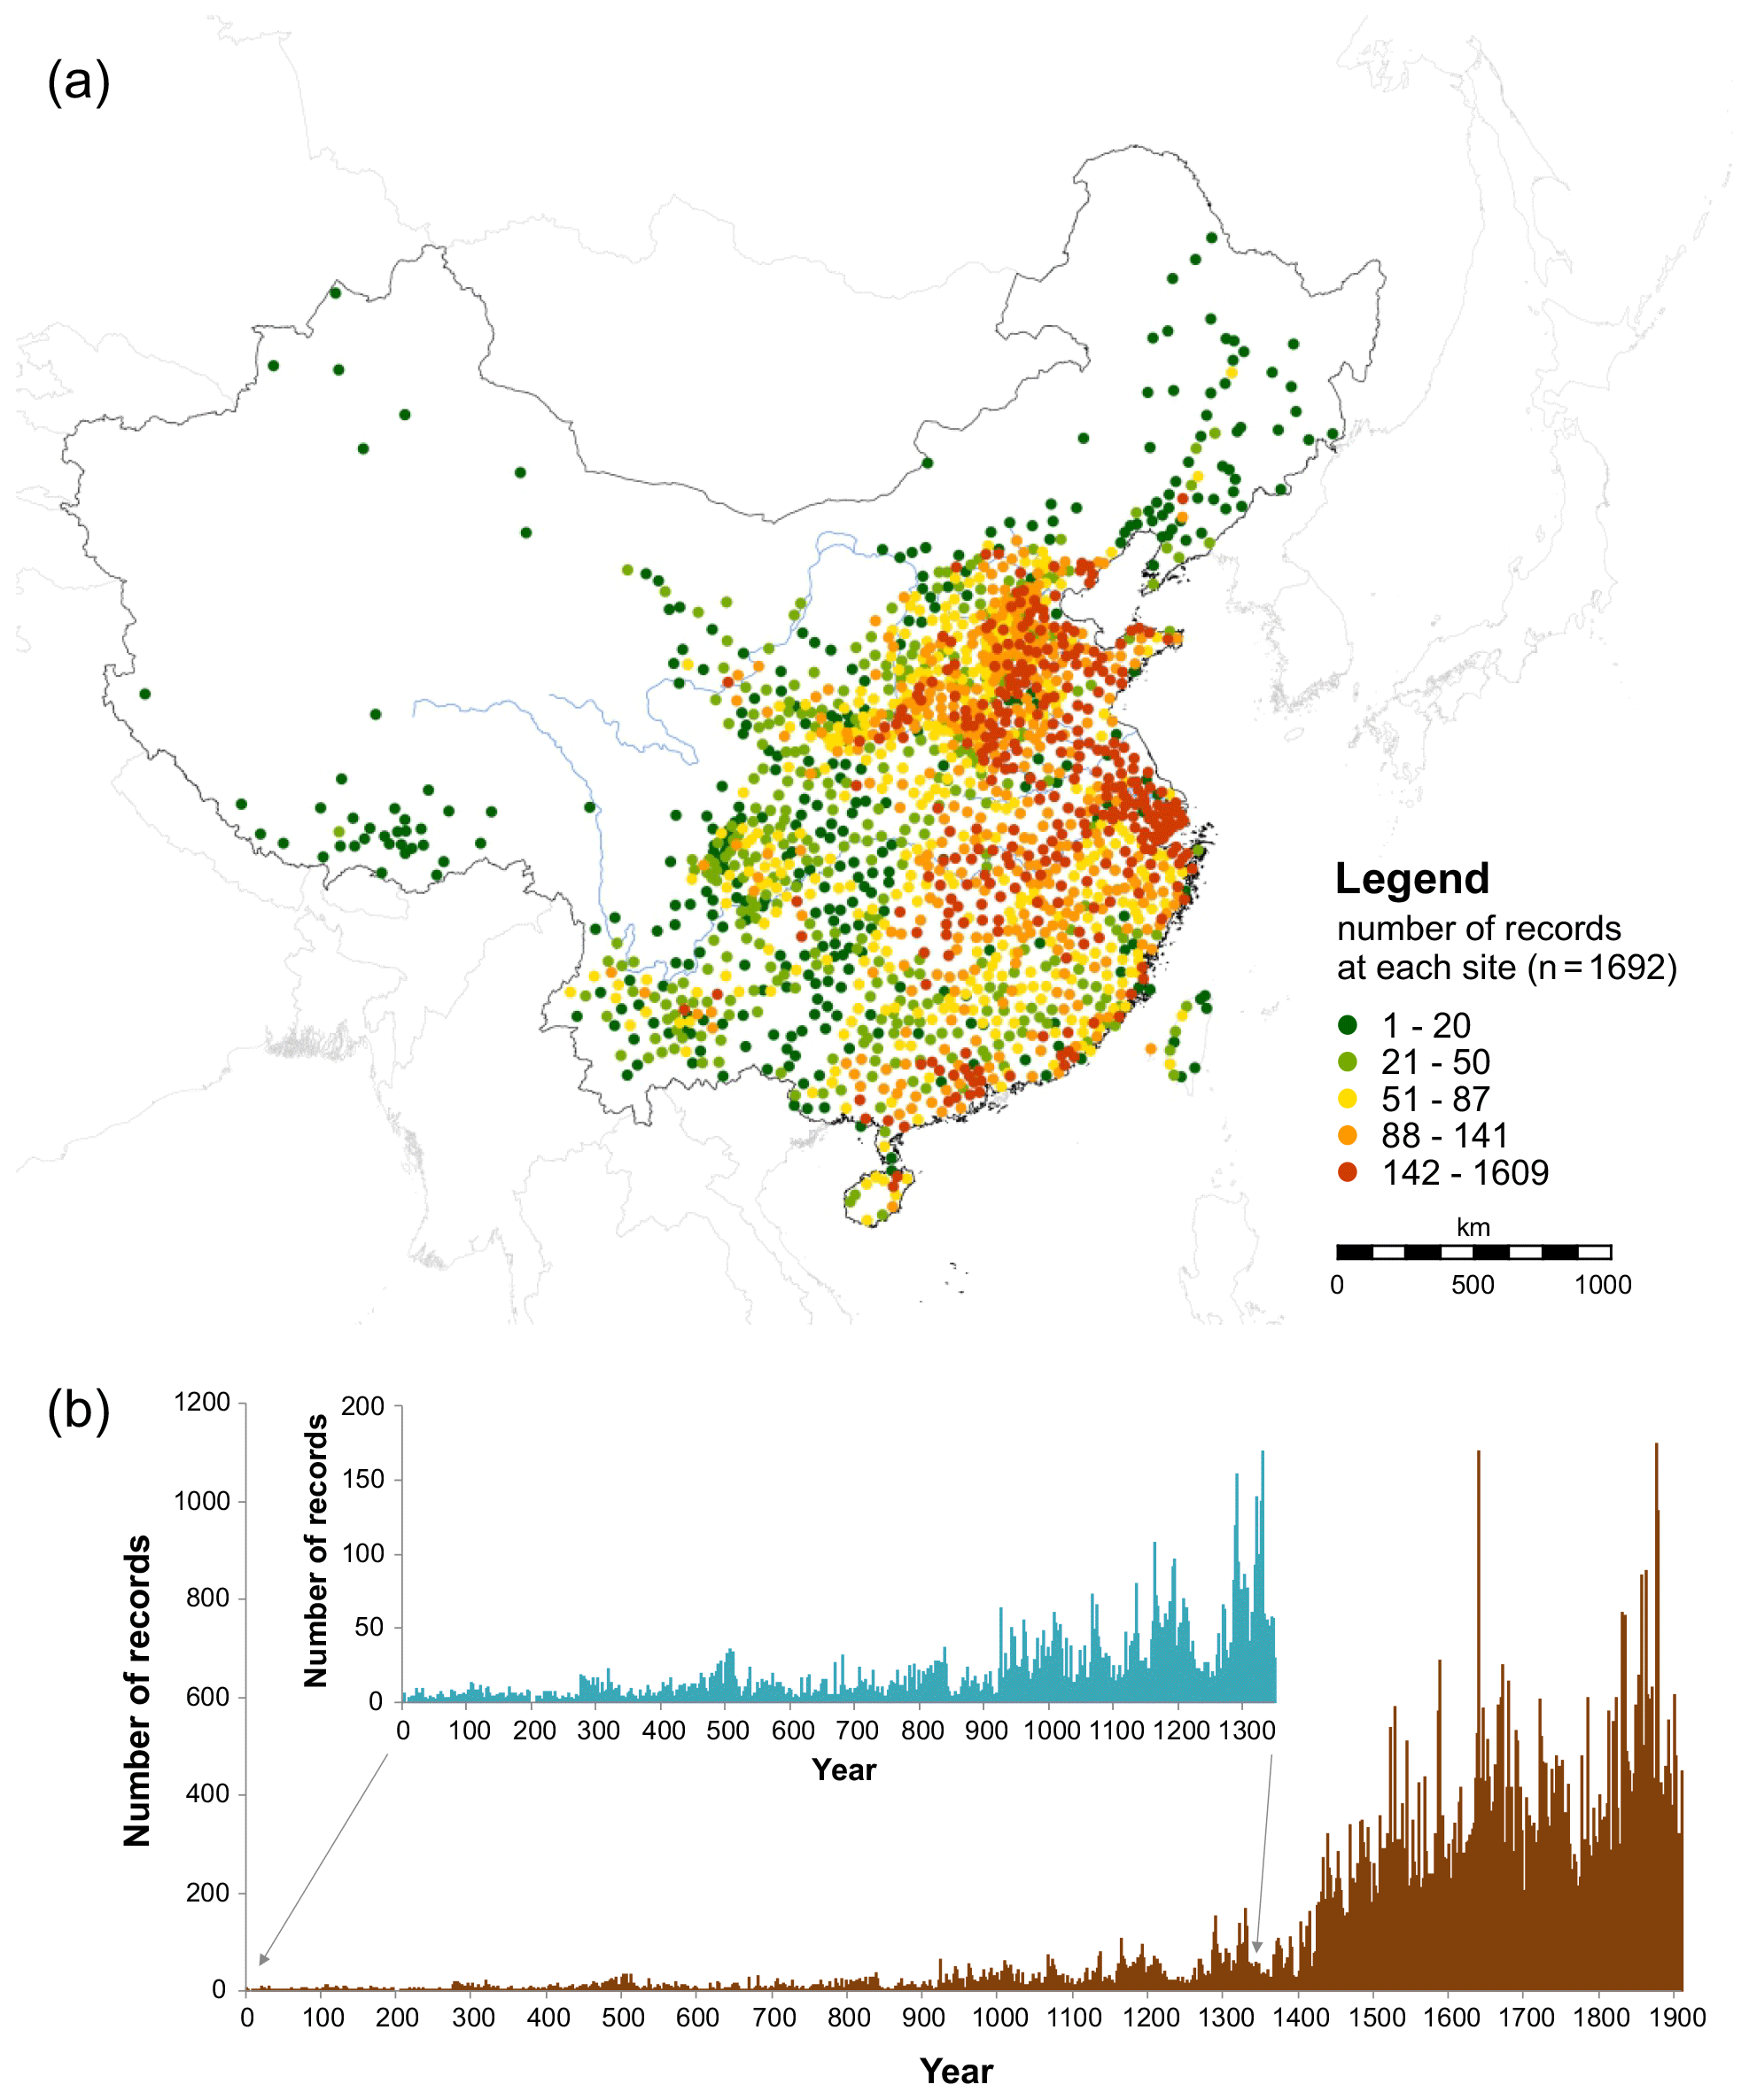
Figure 3Numbers of historical documentary records in the REACHES database for China. (a) Spatial distribution of records at 1692 geographical sites across China. (b) Temporal evolution of the records in the database from 1 to 1911 CE (brown series); the inset (blue series) shows the same data for 1 to 1350 CE but with an expanded vertical axis.
Two sources of documentary evidence are of particular importance for historical climate reconstruction in China. Daily observations of sky conditions, wind directions, and precipitation types and duration are recorded in Qing Yu Lu (“Clear and Rain Records”) (Wang and Zhang, 1988). The records, however, are descriptive and are only available for selected areas; these include Beijing (1724–1903 with 6 missing years), Nanjing (1723–1798), Suzhou (1736–1806), and Hangzhou (1723–1773). Yu Xue Fen Cun (“Depth of Rain and Snow”) reported the measured depth of rainfall infiltration into the soil or depth of snow accumulation above ground in the Chinese units fen (∼3.2 mm) and cun (∼3.2 cm). From 1693 to the end of the Qing dynasty in 1911, these measurements were taken in 18 provinces; however, many records include imprecise measurements and/or dates (Ge et al., 2005, 2011). Despite their descriptive and semi-quantitative nature, the two documentary sources are valuable for reconstructing past climate, especially for summer precipitation (Gong et al., 1983; Zhang and Liu, 1987; Zhang and Wang, 1989; Ge et al., 2011) and meiyu (or “plum rains”, marking the beginning of the rainy season; see Wang and Zhang, 1991) in different cities depending on the record length as described above. They are also useful for cross-checking and/or validating climate indices derived from other documentary sources.
3.3 Temperature indices
The availability of documentary temperature indices for Asia is restricted to China. Zhu (1973) was the first Chinese scholar to use historical weather records and phenological evidence to identify temperature variability over the last 5000 years (∼3000 BCE to 1955 CE). He consulted a range of data sources for his reconstruction, including the dates of lake/river freezing/thawing; the start/end dates of snow and frost seasons; arrival dates of migrating birds; the distribution of plants such as bamboo, lychee, and orange; the blossoming dates of cherry trees; and harvest records. However, the study did not clearly indicate his methodology.
Winter temperature anomalies were initially regarded as key indicators of temperature changes in China (Zhang and Gong, 1979; Zhang, 1980; Gong et al., 1983; R. S. Wang and Wang, 1990; Shen and Chen, 1993; Ge et al., 2003), as (i) there were more temperature-related descriptions in winter than in other seasons and (ii) winter temperatures have higher regional uniformity than summer temperatures (Wang and Zhang, 1992). However, this uniformity mainly reflects changes in the Siberian High system, so reconstructions of summer (and other season) temperature and precipitation anomalies to reflect other aspects of monsoon circulation soon received increasing attention (see, for example, Zhang and Liu, 1987; S. W. Wang and Wang, 1990; Yi et al., 2012).
The pioneering work of Zhu (1973) has had a great influence upon the development of historical climatology in China. Successive studies used a similar approach to reconstruct winter temperature indices for every decade from the 1470s to the 1970s by counting the frequency of years with cold- or warm-related records (Zhang and Gong, 1979; Zhang, 1980; Shen and Chen, 1993; Zheng and Zheng, 1993). Zhang (1980) adopted binary (cold/warm) categories and further developed an equation to derive decadal temperature indices for the 1470–1970 CE period (see Sect. 8.2); this approach was applied in several studies (Gong et al., 1983; S. W. Wang and Wang, 1990; Zheng and Zheng, 1993; Man, 1995).
The formal development of an ordinal-scale temperature index was first introduced by S. W. Wang and Wang (1990) who used a four-point scale to build decadal winter cold index series for the 1470–1979 CE period in eastern China (with 0 being no or light snow or no frost, 1 being heavy snow over several days, 2 being heavy snow over months, and 3 being heavy snow and frozen ground until the following spring). This approach was widely applied in subsequent series in different regions, for different seasons, and at differing temporal resolutions (R. S. Wang and Wang, 1990; S. W. Wang and Wang, 1990; Wang et al., 1998; Wang and Gong, 2000; Tan and Liao, 2012; Tan and Wu, 2013). For example, Wang and Gong (2000) developed a 50-year resolution winter cold index for eastern China spanning the 800–2000 CE period. Tan and colleagues adapted the approach to reconstruct decadal temperature index series (with −2 being rather cold, −1 being cold, 0 being normal, and 1 being warm) in the Ming (1368–1643 CE; Tan and Liao, 2012) and Qing dynasties (1644–1911 CE; Tan and Wu, 2013) in the Yangtze River Delta region.
3.4 Drought–flood and moisture indices
China has a particularly rich legacy of documents describing historical floods and droughts, and using such records to define drought–flood series has a long tradition. Zhu (1926) and Yao (1943) presented the earliest drought–flood series for all of eastern China (206 BCE–1911 CE), although their temporal and spatial resolutions are vague. Due to the higher number of available records for the last several hundred years, reconstructions using frequency counts were avoided in their series; instead, the ratio between flood and drought events was used to build moisture indices (see Sect. 8.2). Examples of other early studies include Yao (1982), Zhang and Zhang (1979), Zheng et al. (1977), and Gong and Hameed (1991).
Beginning in the 1970s, the Central Meteorological Administration initiated a project to reconstruct historic annual precipitation. This adopted a five-point ordinal scale (with 1 being very wet, 2 being wet, 3 being normal, 4 being dry, and 5 being very dry) to form drought–flood indices for 120 locations in China spanning the 1470–1979 CE period (Academy of Meteorological Science of China Central Meteorological Administration, 1981). The indices were compiled based on the evaluation of historical descriptions (Sect. 8.2), with the series later extended to 2000 CE (Zhang and Liu, 1993; Zhang et al., 2003). Most reconstructions in China now use this five-point index (Zheng et al., 2006; Tan and Wu, 2013; Tan et al., 2014; Ge et al., 2018). For example, Zhang et al. (1997) used the approach to establish six regional series of drought–flood indices for eastern China (from the North China Plain to the Lower Yangtze Plain) spanning the 960–1992 CE period. Zheng et al. (2006) developed a dataset covering 63 stations across the North China Plain and the middle and lower reaches of the Yangtze Plain and reconstructed a drought–flood index series spanning from 137 BCE to 1469 CE.
Adamson and Nash (2014) also adopted a five-point index series when reconstructing monsoon precipitation in western India (Fig. 4). Where data quality allowed, indices were derived for individual “monsoon months” (May/June, July, August, and September/October) and summed to produce an index value for each entire monsoon season. Where monthly level indices could not be constructed, indices pertaining to the whole monsoon were generated directly from narrative evidence. The five-point index was chosen to correspond to the terminology currently used by the Indian Meteorological Department for their seasonal forecasts (from “deficient” to “excess” rainfall) and regular reports of rainfall conditions (a four-point scale from “scanty” to “excess”, with a fifth category “heavy” added by the authors). As each of these correspond to percentage deviations from a rainfall norm, this allowed the generation of calibration tables within an instrumental overlap period, to assign descriptive terms to specific index points (e.g. the term “seasonable rain” to the category +1 “excess”). This should allow the same methodology to be repeated elsewhere in India but limits the methodology to the subcontinent.
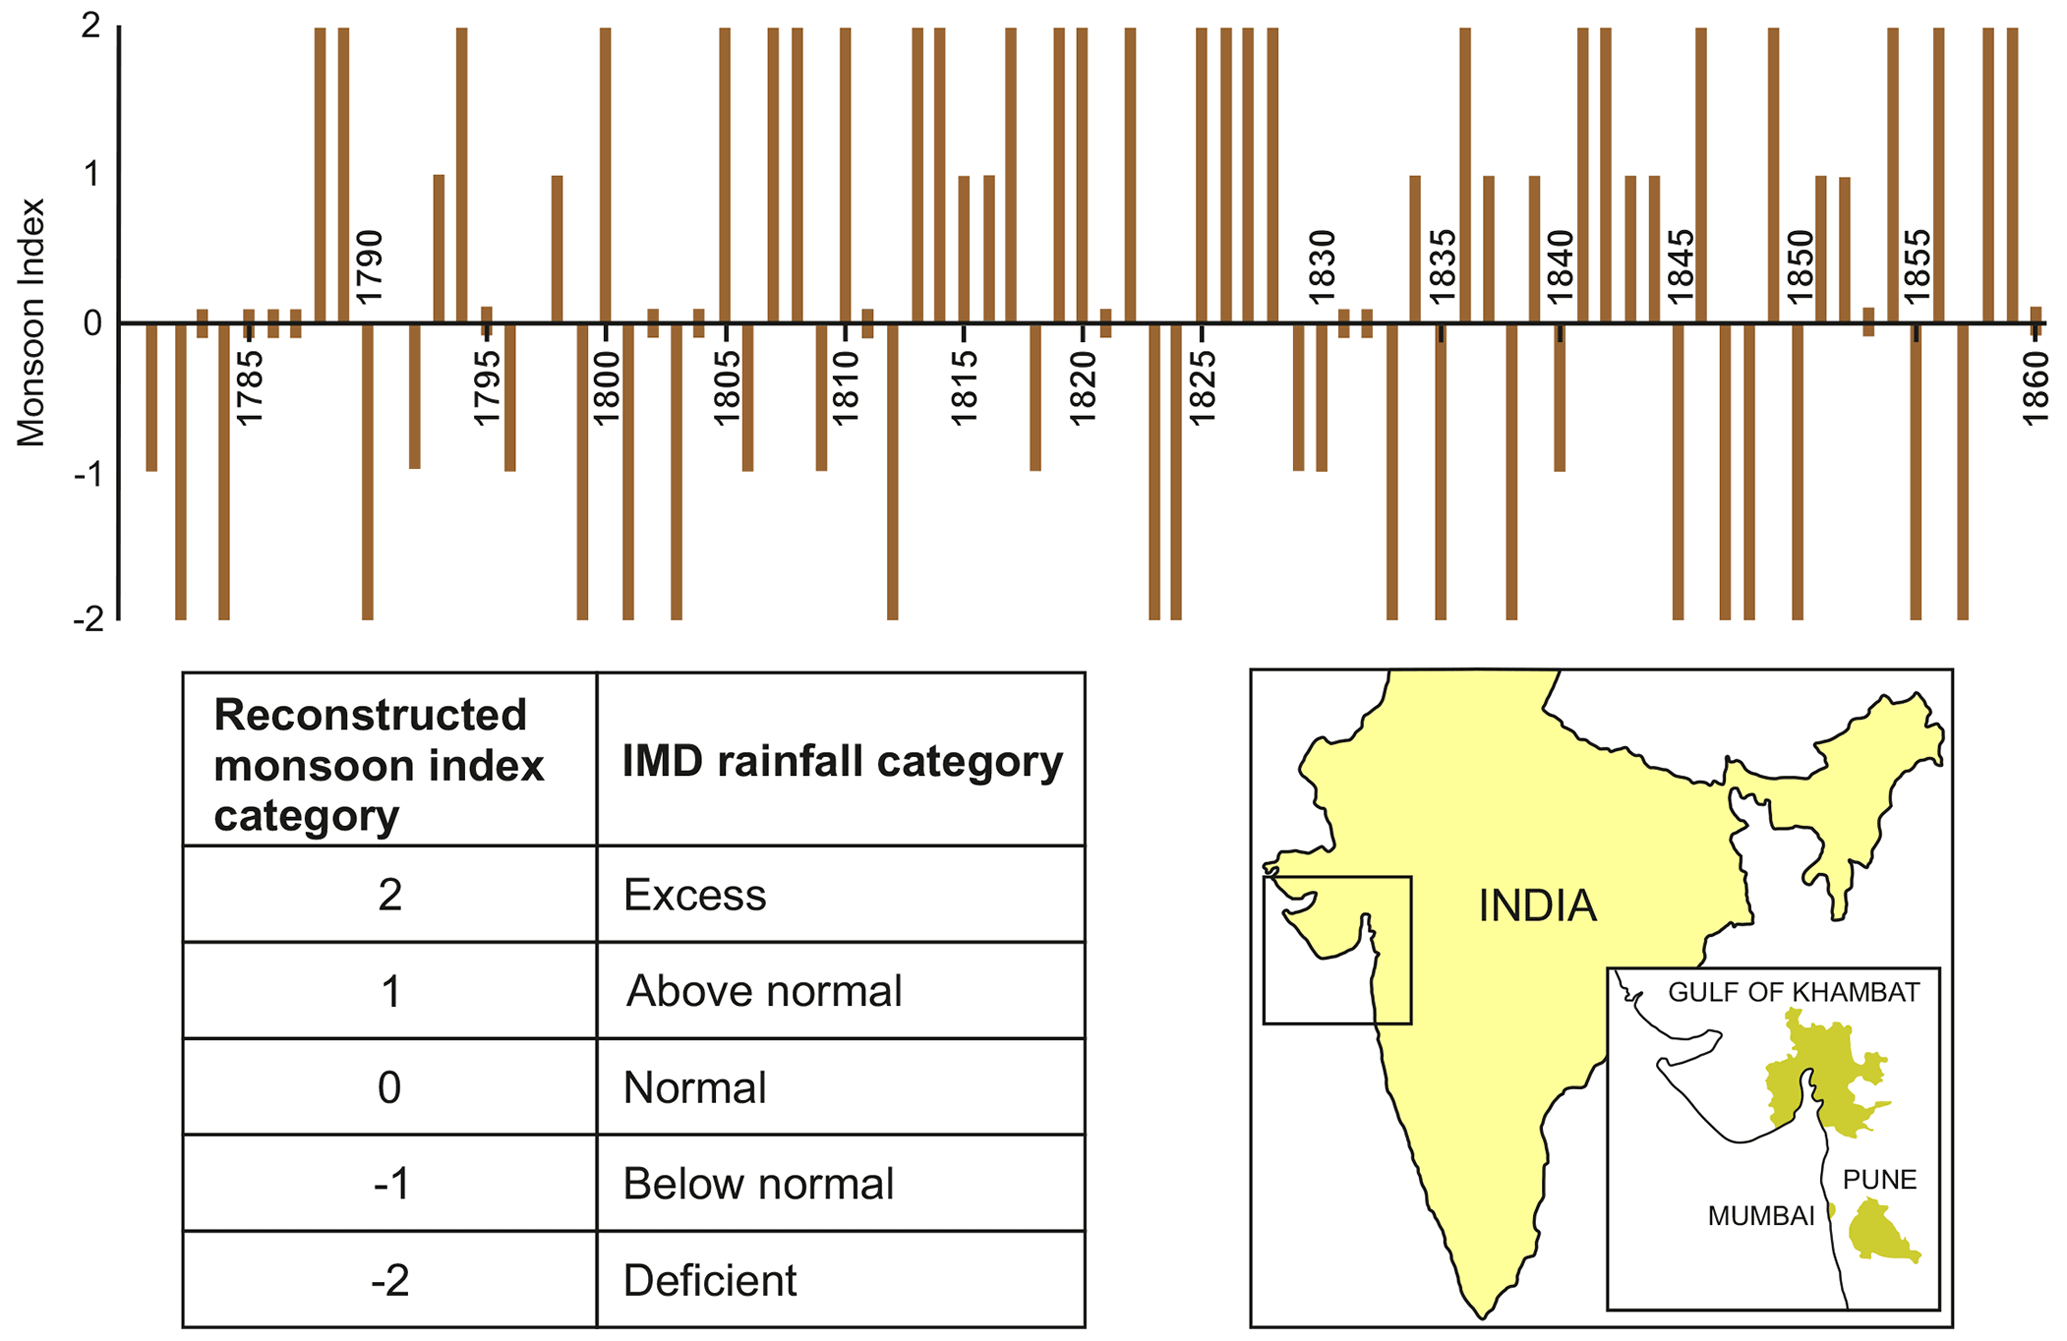
Figure 4Five-point western India monsoon rainfall reconstruction for 1780–1860. The reconstruction is a combination of separate series for Mumbai, Pune, and the Gulf of Khambat (now the Gulf of Khambhat; see inset). Monsoon index categories map broadly onto Indian Meteorological Department (IMD) descriptors of seasonal monsoon rainfall (data for reconstruction from Adamson and Nash, 2014). Zero values are shown as small bars; years with insufficient data to generate an index value are left blank.
3.5 Other series
Several other studies have used weather descriptions within documentary records to reconstruct past climate series in China. These include reconstructed winter thunderstorm frequency (Wang, 1980, spanning 250 BCE–1900 CE), dust fall (Zhang, 1984, 1860–1898 CE; Fei et al., 2009, for the past 1700 years), and typhoon series in Guangdong (Liu et al., 2001, 1000–1909 CE) and coastal China (Chen et al., 2019, 0–1911 CE). Many scholars have also used information in Qing Yu Lu and Yu Xue Fen Cun to count and build winter snowfall days series (Zhou et al., 1994; Ge et al., 2003), while Hao et al. (2012) further used the series to regress annual winter temperatures over the middle and lower reaches of the Yangtze River since 1736 CE.
Phenology-related phenomena have also been widely used in China to indicate past climate variability (Liu et al., 2014). Flower blossom dates in Hunan between 1888 and 1916 CE (Fang et al., 2005) and in the Yangtze Plain from 1450 to 1649 CE (Liu, 2017) were used to indicate temperature change. The date of the first recorded “song” of the adult cicada has also been used to reconstruct precipitation change during the rainy season in Hunan from the late 19th to early 20th century (on the principle that cicada growth to adulthood requires sufficient humidity, and this coincides with the peak rainy season; Xiao et al., 2008). In recent years, researchers have been able to reconstruct various series including typhoons (Chen et al., 2019; Lin et al., 2019) and droughts (Lin et al., 2020) from the compendium of Chinese records compiled by Zhang (2004).
Using descriptions of agricultural outputs in the Twenty-Four Histories and Qing History, Yin et al. (2015) developed a grain harvest yield index and used this to infer temperature variations from 210 BCE to 1910 CE. Details of outbreaks of Oriental migratory locusts in these same histories have been used by Tian et al. (2011) to construct a 1910-year-long locust index through which precipitation and temperature variations can be inferred. The History of Natural Disasters and Agriculture in Each Dynasty of China, published by the Chinese Academy of Social Science (1988), includes details of disasters such as famines to reconstruct indices of climate variability during the imperial era.
4.1 Origins of documentary-based indices in Africa
Compared with the wealth of documentary evidence available for Europe and China, there are relatively few collections of written materials through which to explore the historical climatology of Africa (Nash and Hannaford, 2020). The bulk of written evidence stems from the late 18th century onwards, with a proliferation of materials for the 19th century following the expansion of European missionary and other colonial activity.
Most historical rainfall reconstructions for Africa use evidence from one or more source type. A small number of studies are based exclusively upon early instrumental meteorological data. Of these, some (e.g. the continent-wide analysis by Nicholson et al., 2018) combine early rain gauge data with more systematically collected precipitation data from the 19th to 21st centuries, to produce quantitative time series. Others, such as Hannaford et al. (2015) for southeast Africa, use data digitised from ships' logbooks to generate quantitative regional rainfall chronologies. Most climate reconstructions, however, make use of narrative accounts to develop relative rainfall chronologies based on ordinal indices, either for the whole continent or for specific regions.
While drawing upon European traditions and sharing many similar elements, methodologies for climate index development in Africa have evolved largely in isolation from approaches in Europe (see Sect. 8.3). The earliest work by Sharon Nicholson, for example, was published around the same time that Hubert Lamb was developing his index approach (Nicholson, 1978a, 1978b, 1979, 1980). Her early methodological papers on precipitation reconstruction (Nicholson, 1979, 1981, 1996) use a qualitative approach to identify broadly wetter and drier periods in African history. A seven-point index (+3 to −3) integrating narrative evidence with instrumental precipitation data was introduced in Nicholson (2001) and expanded upon in Nicholson et al. (2012a) and Nicholson (2018).
The many regional studies in southern Africa owe their approach to the work of Coleen Vogel (Vogel, 1988, 1989), who drew on Nicholson's research but advocated the use of a five-point index to classify rainfall levels in the Cape region of South Africa (with +2 being very wet, severe floods; +1 being wet, good rains; 0 being seasonal rains; −1 being dry, months of no rain reported; and −2 being very dry, severe drought). Subsequent regional studies, starting with Endfield and Nash (2002) and Nash and Endfield (2002), have adopted the same five-point approach.
4.2 Precipitation indices
The main continent-wide index-based series for Africa originates from research undertaken by Sharon Nicholson (e.g. Nicholson et al., 2012a). This series uses a seven-point scale and has been used to explore both temporal (Fig. 5) and spatial (Fig. 6) variations in historical rainfall across Africa during the 19th century. One regional rainfall reconstruction is available for West Africa (Norrgård, 2015, spanning 1750–1800 CE and using a seven-point scale) and one is available for Kenya (Mutua and Runguma, 2020, spanning 1845–1976 CE with a five-point scale). The greatest numbers of regional reconstructions – all using a five-point scale – are available for southern Africa. These include chronologies covering all or part of the 19th century for the Kalahari (Endfield and Nash, 2002; Nash and Endfield, 2002, 2008) and Lesotho (Nash and Grab, 2010), and – most recently – Malawi (Nash et al., 2018) and Namibia (Grab and Zumthurm, 2018). Several reconstructions are available for South Africa, including separate 19th century series for the Western and Eastern Cape, Namaqualand, and present-day KwaZulu-Natal (Vogel, 1988, 1989; Kelso and Vogel, 2007; Nash et al., 2016). Most studies, including the continent-wide series, reconstruct rainfall at an annual level, but, where information density permits, it has been possible to construct rainfall at seasonal scales (e.g. Nash et al., 2016). Regional studies from southern Africa have recently been combined with instrumental data and other annually resolved proxies (including sea surface temperature data derived from analyses of fossil coral) to produce two multi-proxy reconstructions of rainfall variability (Neukom et al., 2014a; Nash et al., 2016).
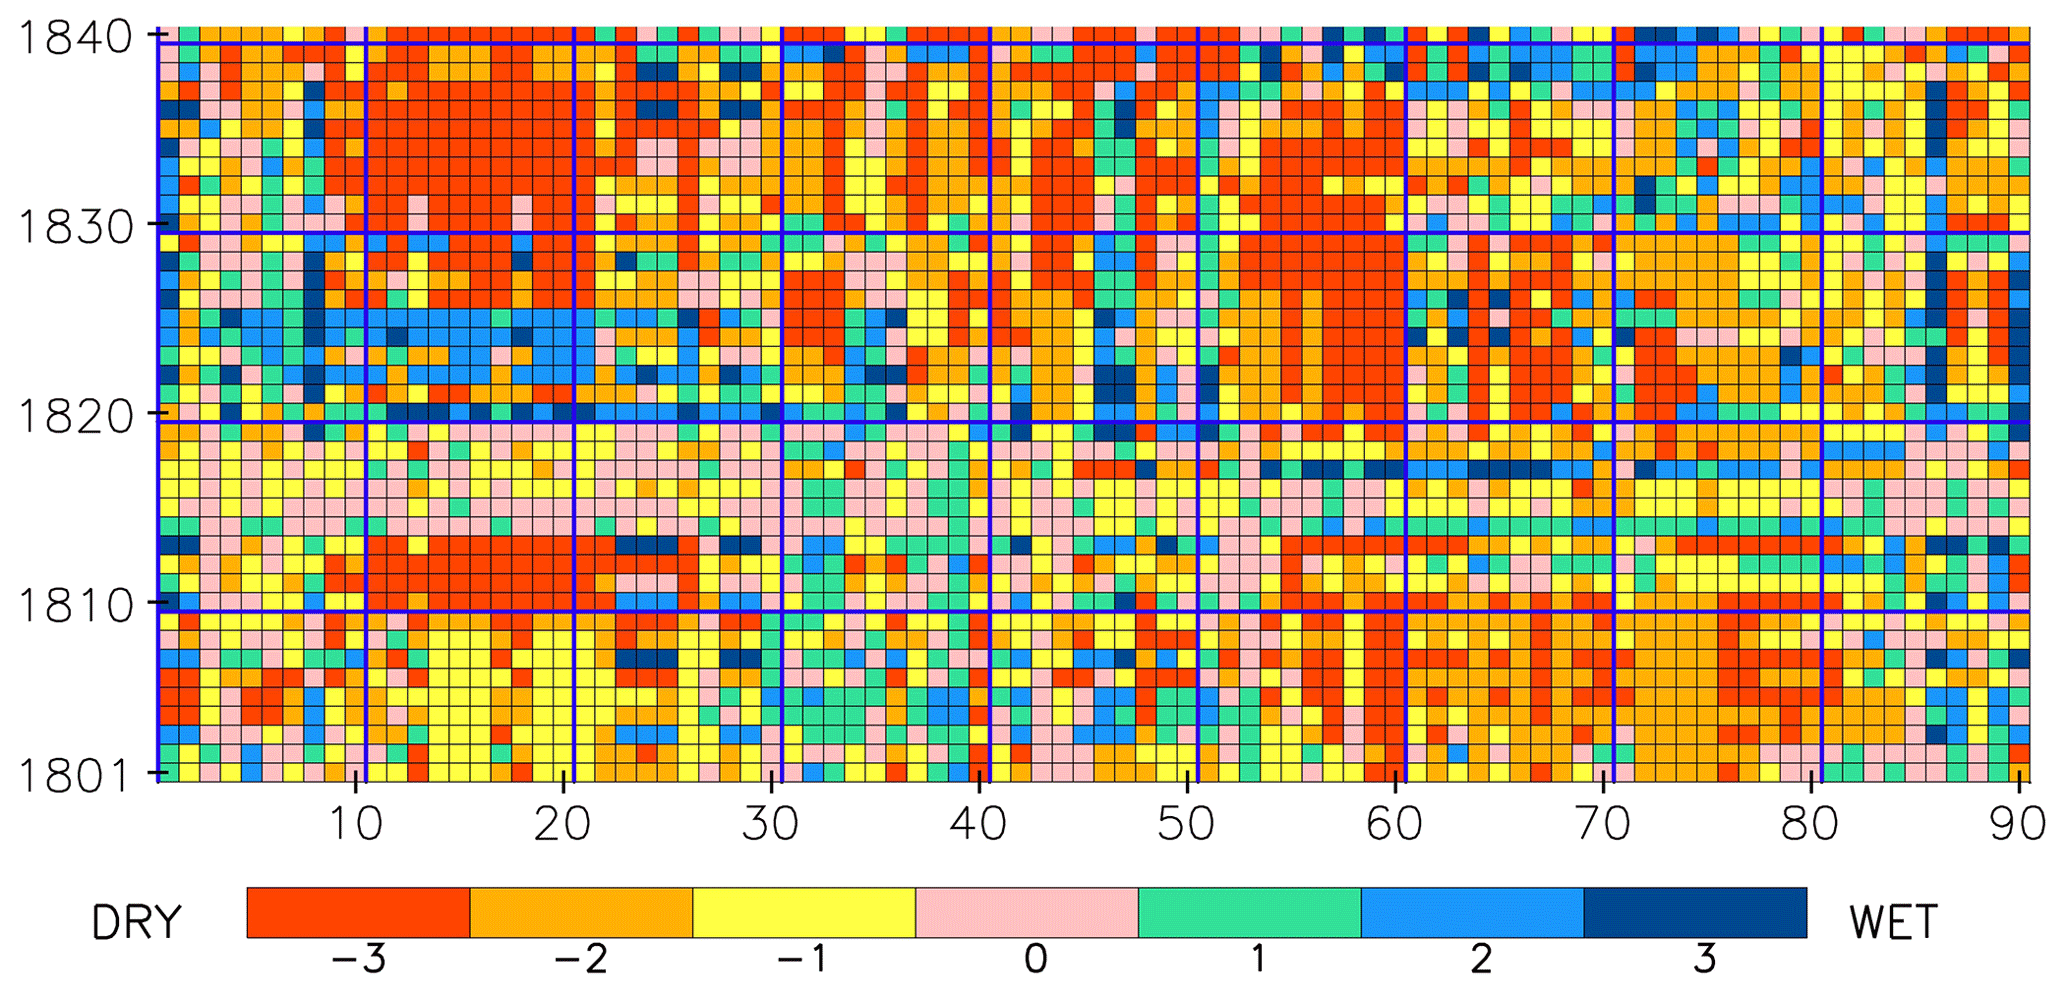
Figure 5Seven-point “wetness” index series for 1801–1840 for the 90 homogenous rainfall regions of Africa indicated across the x axis. This series is reconstructed using documentary and instrumental data, with data gaps infilled using substitution and statistical inference (see Sect. 8.3 and Nicholson et al., 2012a). From left to right, the regions approximately extend by latitude from the northern (region 1 – northern Algeria/Tunisia) to southern (region 84 – Western Cape, South Africa) extremes of the continent. Anomalies in the numbering sequence are regions 85, 86, 90 (all equatorial Africa), 87 (eastern Africa), and 88 and 89 (Horn of Africa).
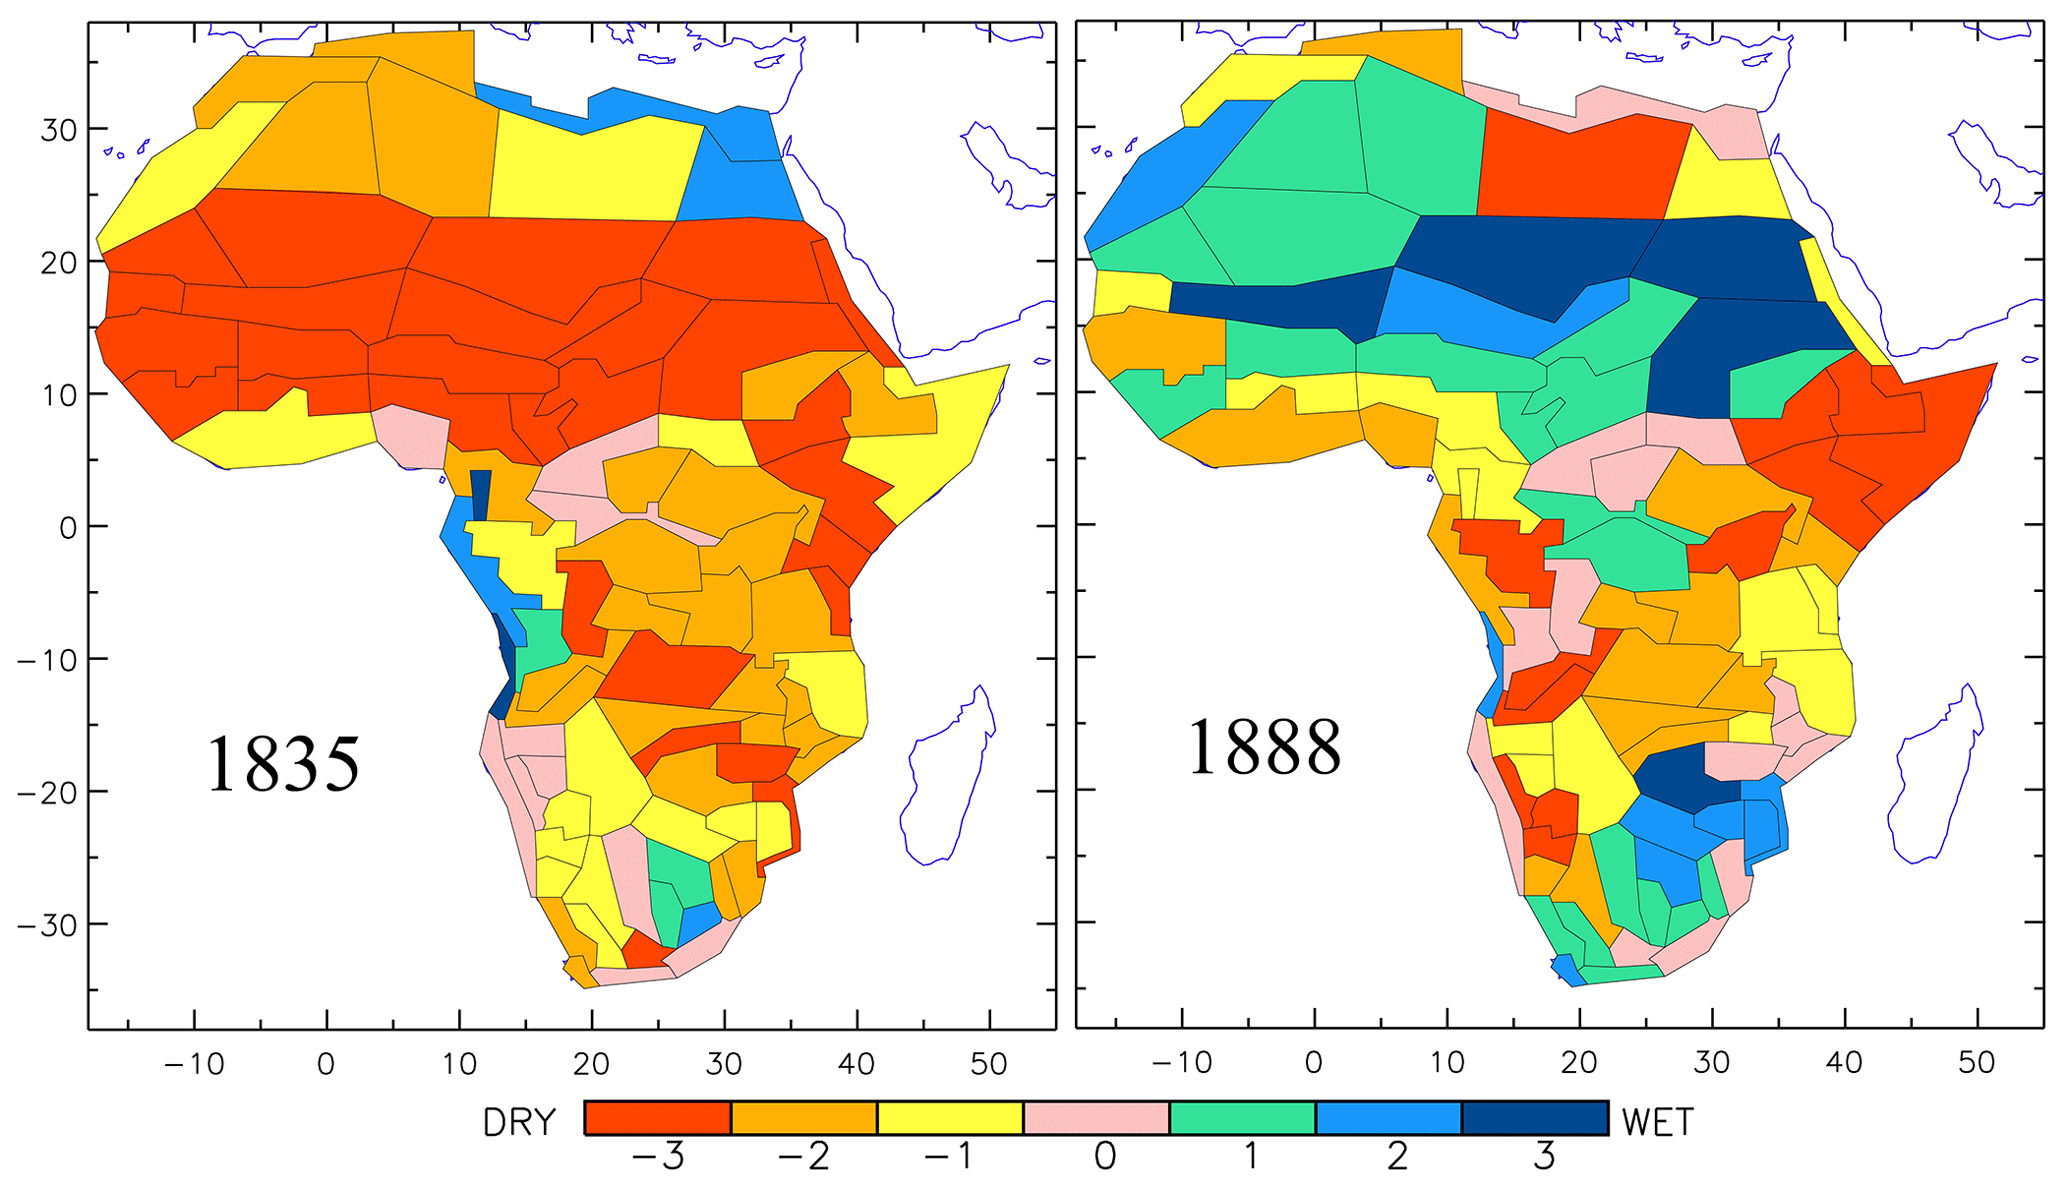
Figure 6Rainfall anomaly patterns for 1835 and 1888 for the 90 homogenous rainfall regions of Africa delineated on the maps (modified after Nicholson et al., 2012b).
4.3 Temperature indices
To date, the only study exploring temperature variations in Africa using an index approach is an annually resolved chronology of cold season variability spanning 1833–1900 CE for the high-altitude kingdom of Lesotho in southern Africa (Grab and Nash, 2010). This uses a three-point index for winter severity (normal/mild; severe; very severe) and identifies more severe and snow-rich cold seasons during the early- to mid-19th century (1833–1854) compared with the latter half of the 19th century (Fig. 7). A reduction in the duration of the frost season by over 20 d during the 19th century is also identified.
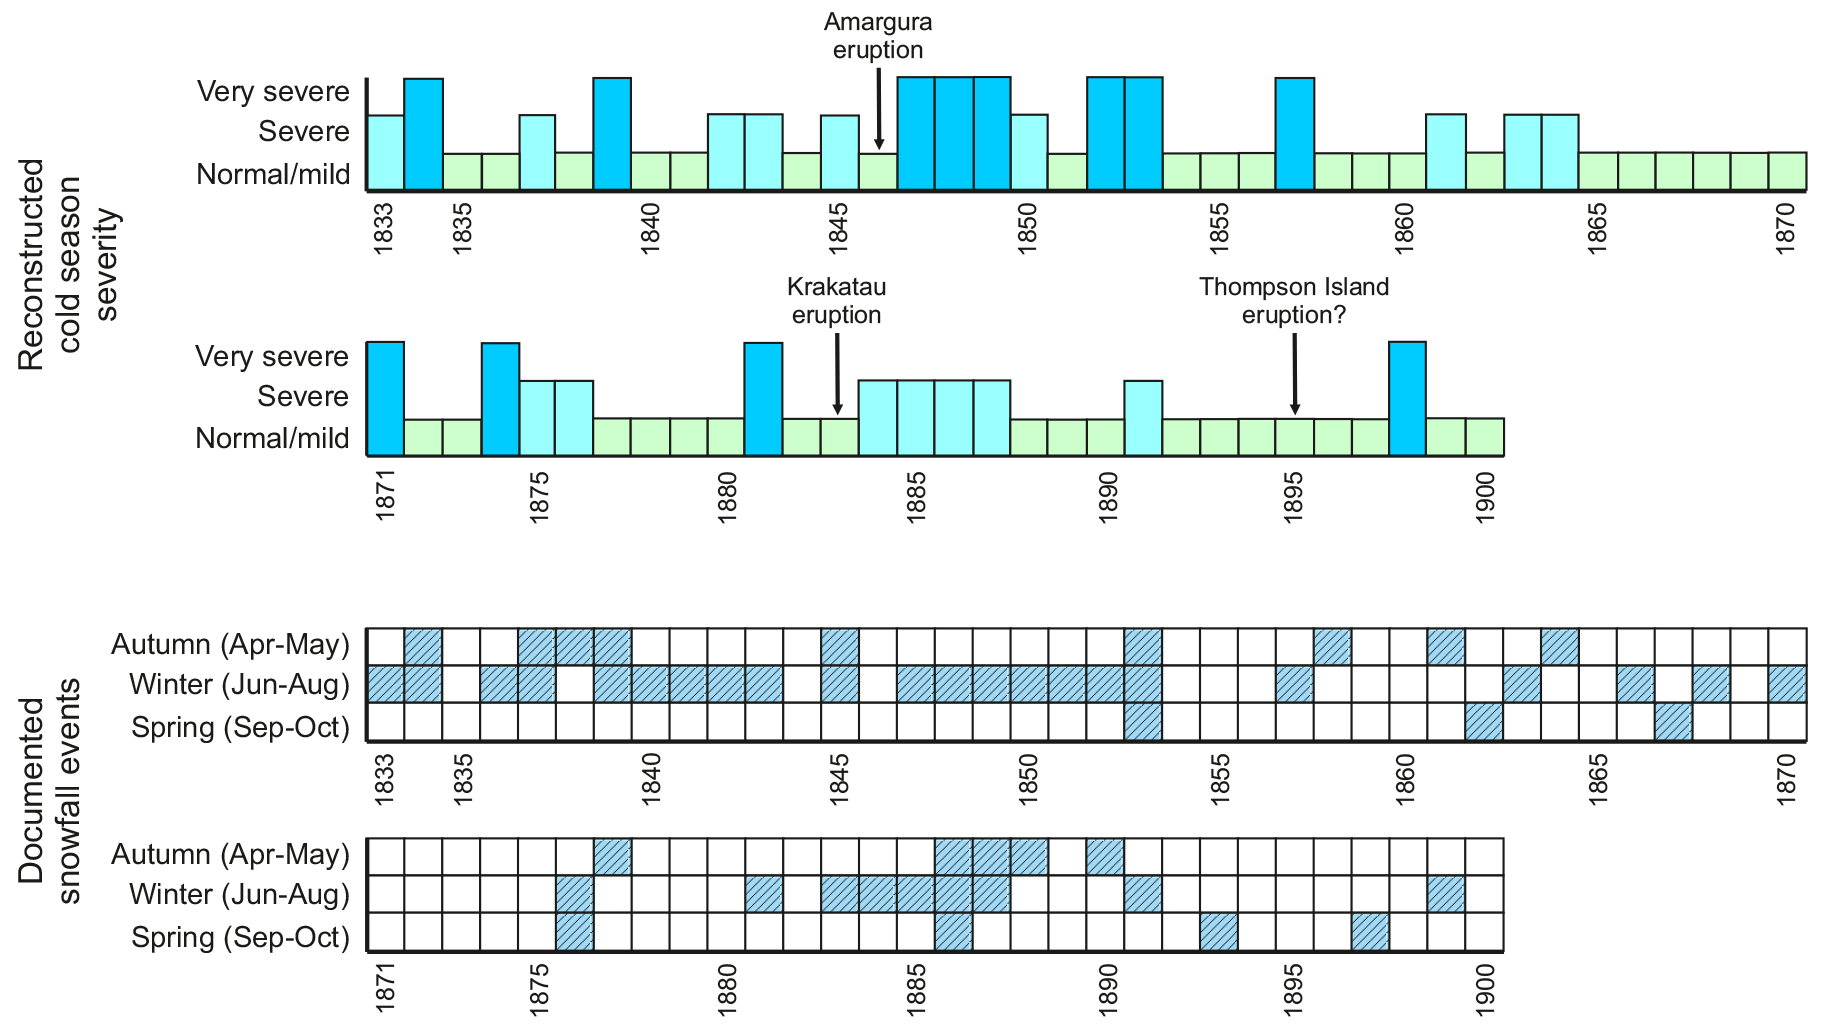
Figure 7Three-point “cold season severity” index for Lesotho and surrounding areas during the 19th century (top), with major volcanic eruptions indicated. The occurrence of snowfall events (bottom) during the same period is also shown (modified after Grab and Nash, 2010).
5.1 Origins of documentary-based indices in the Americas
The use of the index approach in climate reconstruction is variable across the Americas. Although sufficient historical records exist in some regions, particularly the northeastern USA since the 18th century, few researchers have generated climate indices for the USA or Canada (White, 2018). Mexico, in contrast, has produced pioneering studies in climate history, especially on extreme droughts (see Prieto and Rojas, 2018; Prieto et al., 2019). In South America, documentary evidence is generally lower in quality and quantity compared with Europe, so more complex indices have been replaced by simpler ones, which extend to the 1500s (CE).
5.2 Temperature, precipitation and river flow indices
The only index-based temperature and precipitation reconstructions for the USA and Canada are those produced by William Baron and collaborators. Although influenced by the work of Pfister, Baron (1980, 1982) used a distinct content analysis of weather diaries (see Sect. 8.4) to produce open-ended seasonal indices of New England temperature and precipitation for 1620–1800 CE, a period overlapping with the first local instrumental temperature series (which began in the 1740s). He later combined seasonal indices, early instrumental records, and phenological observations to create annual temperature and precipitation series and reconstruct frost-free periods (Baron et al., 1984; Baron, 1989, 1995).
There are a number of valuable compilations of extreme droughts in Mexico (e.g. Florescano, 1969; Jáuregui, 1979; Castorena et al., 1980; Endfield, 2007) and research that has identified climate trends across the country for 1450–1977 CE (Metcalfe, 1987; Garza Merodio, 2002). Garza Merodio systemised the frequency and duration of climatic anomalies in the Basin of Mexico for 1530–1869 CE. García-Acosta et al. (2003) developed an unprecedented catalogue of historic droughts in central Mexico for 1450–1900 CE. Later work compared this information with a tree-ring series and found a significant correlation between major droughts and El Niño–Southern Oscillation (ENSO) years over the same period (Mendoza et al., 2005). Mendoza et al. (2007) constructed a similar series of droughts on the Yucatán Peninsula for the 16th to 19th centuries. Garza Merodio (2017) improved this index and extended it back in time (see Hernández and Garza Merodio, 2010), based on the frequency and complexity of rogation ceremonies (16th to 20th centuries). This approach identified droughts in bishoprics and towns of Mexico. Most recently, Domínguez-Castro et al. (2019) developed series for rainfall, temperature, and other meteorological phenomena for Mexico City using information recorded in the books of Felipe de Zúñiga and Ontiveros; these volumes provide meteorological data with daily resolution for the 12 years spanning from 1775 to 1786 CE.
In South America, the most detailed available historical information is on the scarcity or abundance of water. For investigations into historical rainfall and river flow rates, most studies construct 5–7 classes of data with annual or seasonal resolution. For example, a number of flood series have been compiled for rivers in Argentina (Prieto et al., 1999; Herrera et al., 2011; Prieto and Rojas, 2012, 2015; Gil-Guirado et al., 2016) – see Fig. 8. In Bolivia, Gioda and Prieto (1999) and Gioda et al. (2000) developed a precipitation series for Potosí beginning in 1574 CE. In northern Chile, Ortlieb (1995) also compiled a detailed precipitation series for the 1800s (CE). In Colombia, Mora Pacheco developed a drought series for the Altiplano Cundiboyacense spanning the 1778–1828 CE period (Mora Pacheco, 2018). Finally, Domínguez-Castro et al. (2018) present a precipitation instrumental series from Quito (1891–2015 CE) and a series of wet and dry extremes from rogation ceremonies from 1600 to 1822 CE. In contrast, temperature records are less reliable and generally begin with the earliest instrumental data in the late 1800s (CE) (Prieto and García-Herrera, 2009; Prieto and Rojas, 2018), but there are exceptions (e.g. Prieto, 1983, which covers the 17th and 18th centuries). Most temperature-related indices use three classes.
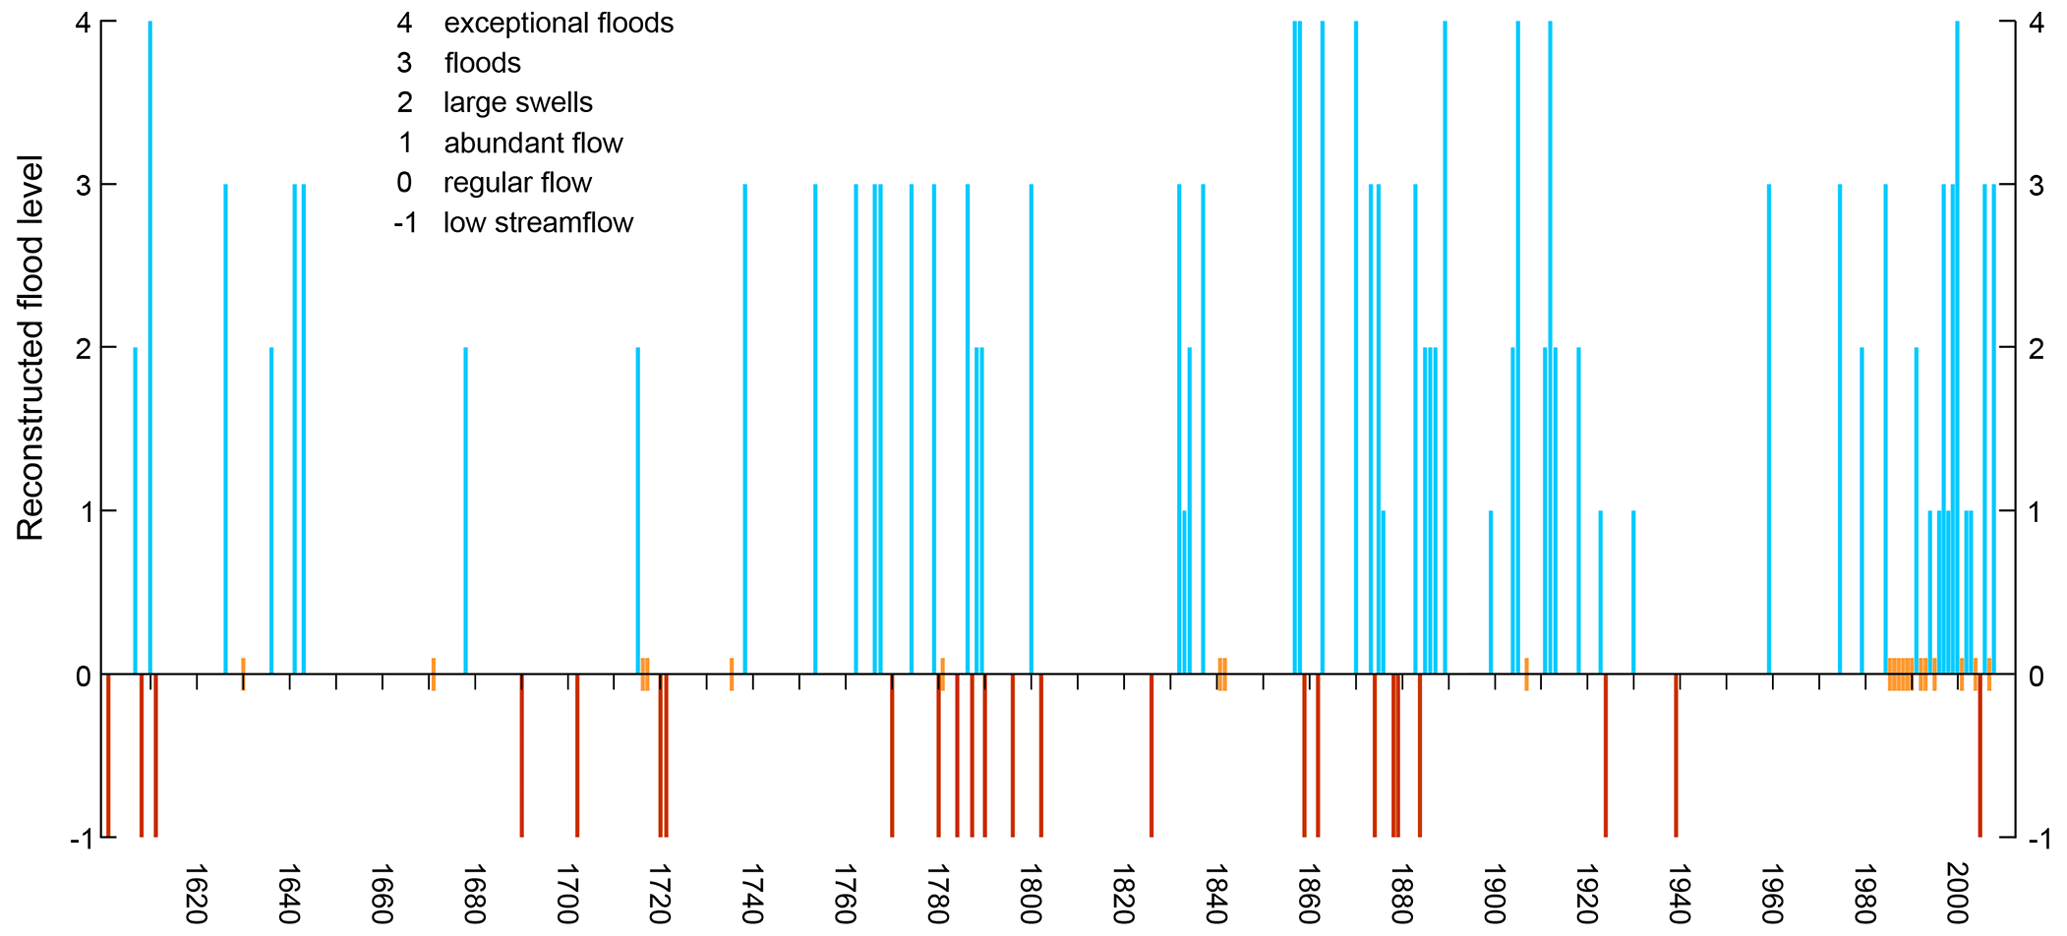
Figure 8Six-point index series of historical flow in the Bermejo River (northern Argentina) between 1600 and 2008 CE based on documentary evidence. These annual-level data were used to create the decadal-scale flood series in Prieto and Rojas (2015). Zero values are indicated by short orange bars.
Some of the world's most important index-based chronologies of ENSO derive from the analysis of ENSO-related impacts recorded in South American documentary evidence. This area of research was pioneered by William Quinn and colleagues (Quinn et al., 1987; Quinn and Neal, 1992), with Quinn's chronologies revised and improved by various authors using additional primary documentary sources (e.g. Ortlieb, 1994, 1995, 2000; García-Herrera et al., 2008).
5.3 Sea-ice and snowfall indices
Relatively few studies have developed indices of winter conditions for the Americas. Building on their content analysis approach and that of Astrid Ogilvie in Iceland (see Sect. 2.6), Catchpole and Faurer (1983) and Catchpole (1995) produced open-ended annual sea-ice indices for the western and eastern Hudson Bay, spanning the 1751–1869 CE period. A different type of three-class index was developed for snowfall in the Andes at 33∘ S spanning 1600–1900 CE, based on the number of months per year that the main mountain pass between Argentina and Chile was closed (Prieto, 1984).
6.1 Origins of documentary-based indices in Australia
Like Africa, Australia has a limited history of using documentary records for developing regional climate indices. Aside from early compilations of 19th century colonial documents and newspaper records (Jevons, 1859; Russell, 1877), or climate almanacs published by the Australian Bureau of Meteorology (Hunt, 1911, 1914, 1918; Watt, 1936; Warren, 1948), few attempts were made in the 20th century to use historical sources to develop climate indices. Those that were developed focused predominantly on drought conditions (see, for example, Foley, 1957; McAfee, 1981; Nicholls, 1988). However, considerable effort has been given in recent years to reconstruct climate variability in southeastern Australia since British colonisation in 1788 CE using both historical documents and instrumental observations (e.g. Gergis et al., 2009; Fenby, 2012; Fenby and Gergis, 2013; Gergis and Ashcroft, 2013; Ashcroft et al., 2014a, b; Gergis et al., 2018; Ashcroft et al., 2019; Gergis et al., 2020). There have also been attempts to reconstruct storms and tropical cyclones along the east coast of Australia (e.g. Callaghan and Helman, 2008; Callaghan and Power, 2011, 2014; Power and Callaghan, 2016), although these are not index-based.
Documentary-based indices for Australia have focused on regional rainfall histories, primarily using material from previously published drought and/or rainfall compilations (Fenby and Gergis, 2013). These compilations contained a vast collection of primary source material including newspaper reports, unpublished diaries and letters, almanacs, observatory reports, 19th century Australian publications, and official government reports. For example, the seminal 19th century sources of Jevons (1859) and Russell (1877), which formed the foundation of the Fenby and Gergis (2013) analysis, contain 79 primary sources, including 40 accounts from personal diaries, letters, and correspondence between a range of people in the colony with the authors. Most recently, Gergis et al. (2020) compiled colonial newspaper and government reports to identify daily temperature extremes of snowfall and heatwaves from South Australia back to 1838. Although a temperature index has not yet been developed from this material, there is great potential to do so alongside recently homogenised 19th century instrumental temperature observations from the Adelaide region.
6.2 Precipitation and drought indices
The most extensive analysis of documentary records was compiled by Fenby (2012) and Fenby and Gergis (2013) as part of a large-scale project to reconstruct climate in southeastern Australia using palaeoclimate, early instrumental, and documentary data (Gergis et al., 2018). Fenby and Gergis (2013) used 12 secondary source compilations to collate monthly summaries of drought conditions experienced in five modern states in southeastern Australia between 1788 and 1860 CE into a three-point index (wet, normal, and drought). As explained in Sect. 8.5, agreement between sources and several months of dry conditions was required before a period was considered a drought, rather than just “normal” low summer rainfall. In coastal New South Wales, months of above-average rainfall were only compiled where sufficiently detailed rainfall information was available (Fenby and Gergis, 2013). Given that Australian rainfall has high spatial variability, and many of the secondary sources only contained descriptions of localised floods or severe storm events, there were insufficient local reports from other regions to reconstruct larger-scale rainfall conditions using the sources considered.
To combine instrumental and documentary data into a single series spanning European settlement of Australia (1788 CE–present), Gergis and Ashcroft (2013) developed a three-point drought and wet year index based on instrumental rainfall observations from a 5-station network in the Sydney region (spanning 1832–1859) and a 45-station rainfall network from across southeastern Australia (1860–2008). As with the “wetness” index for Africa (Fig. 5), the instrumental data were converted to an index so they could be combined with the documentary-based index of Fenby and Gergis (2013) to create a single, complete rainfall reconstruction. Good agreement was found during the overlapping period between instrumental and documentary-derived indices (1832–1860), and between the eastern New South Wales index and the wider southeastern Australian indices. This provides some confidence that the two indices could be combined, and that data from the very early period, when only eastern New South Wales records are available, are indicative of conditions experienced in the broader region.
Given the exploratory nature of this work in southeastern Australia, the aim of these studies was to use documentary and instrumental data to simply identify the occurrence of wet and dry years in the first instance, rather than develop a more finely resolved scale of the magnitude of the rainfall anomalies. The recent digitisation and analysis of daily instrumental rainfall data from Sydney, Melbourne, and Adelaide (Ashcroft et al., 2019) provides an excellent opportunity to develop indices combining documentary and instrumental data from these regions in the future.
7.1 Challenges in generating documentary-based indices for the world's oceans
The oceans constitute a challenging environment for historical climatologists. Written evidence of past weather at sea is generally local in scope, especially before the 17th century, and direct weather observations scarcely extend beyond the coast before the 15th century. Historical climatologists can use two categories of information to create reconstructions of past oceanic climate: (i) direct observations of weather, water, and sea-ice conditions; and (ii) records of activities that were influenced by weather and water conditions. Such information can be found in documents written at sea (on ships, boats or, from the 20th century, submarines; Fig. 9), documents written on the coast within sight of the sea, and documents written inland that record weather or activities at sea.
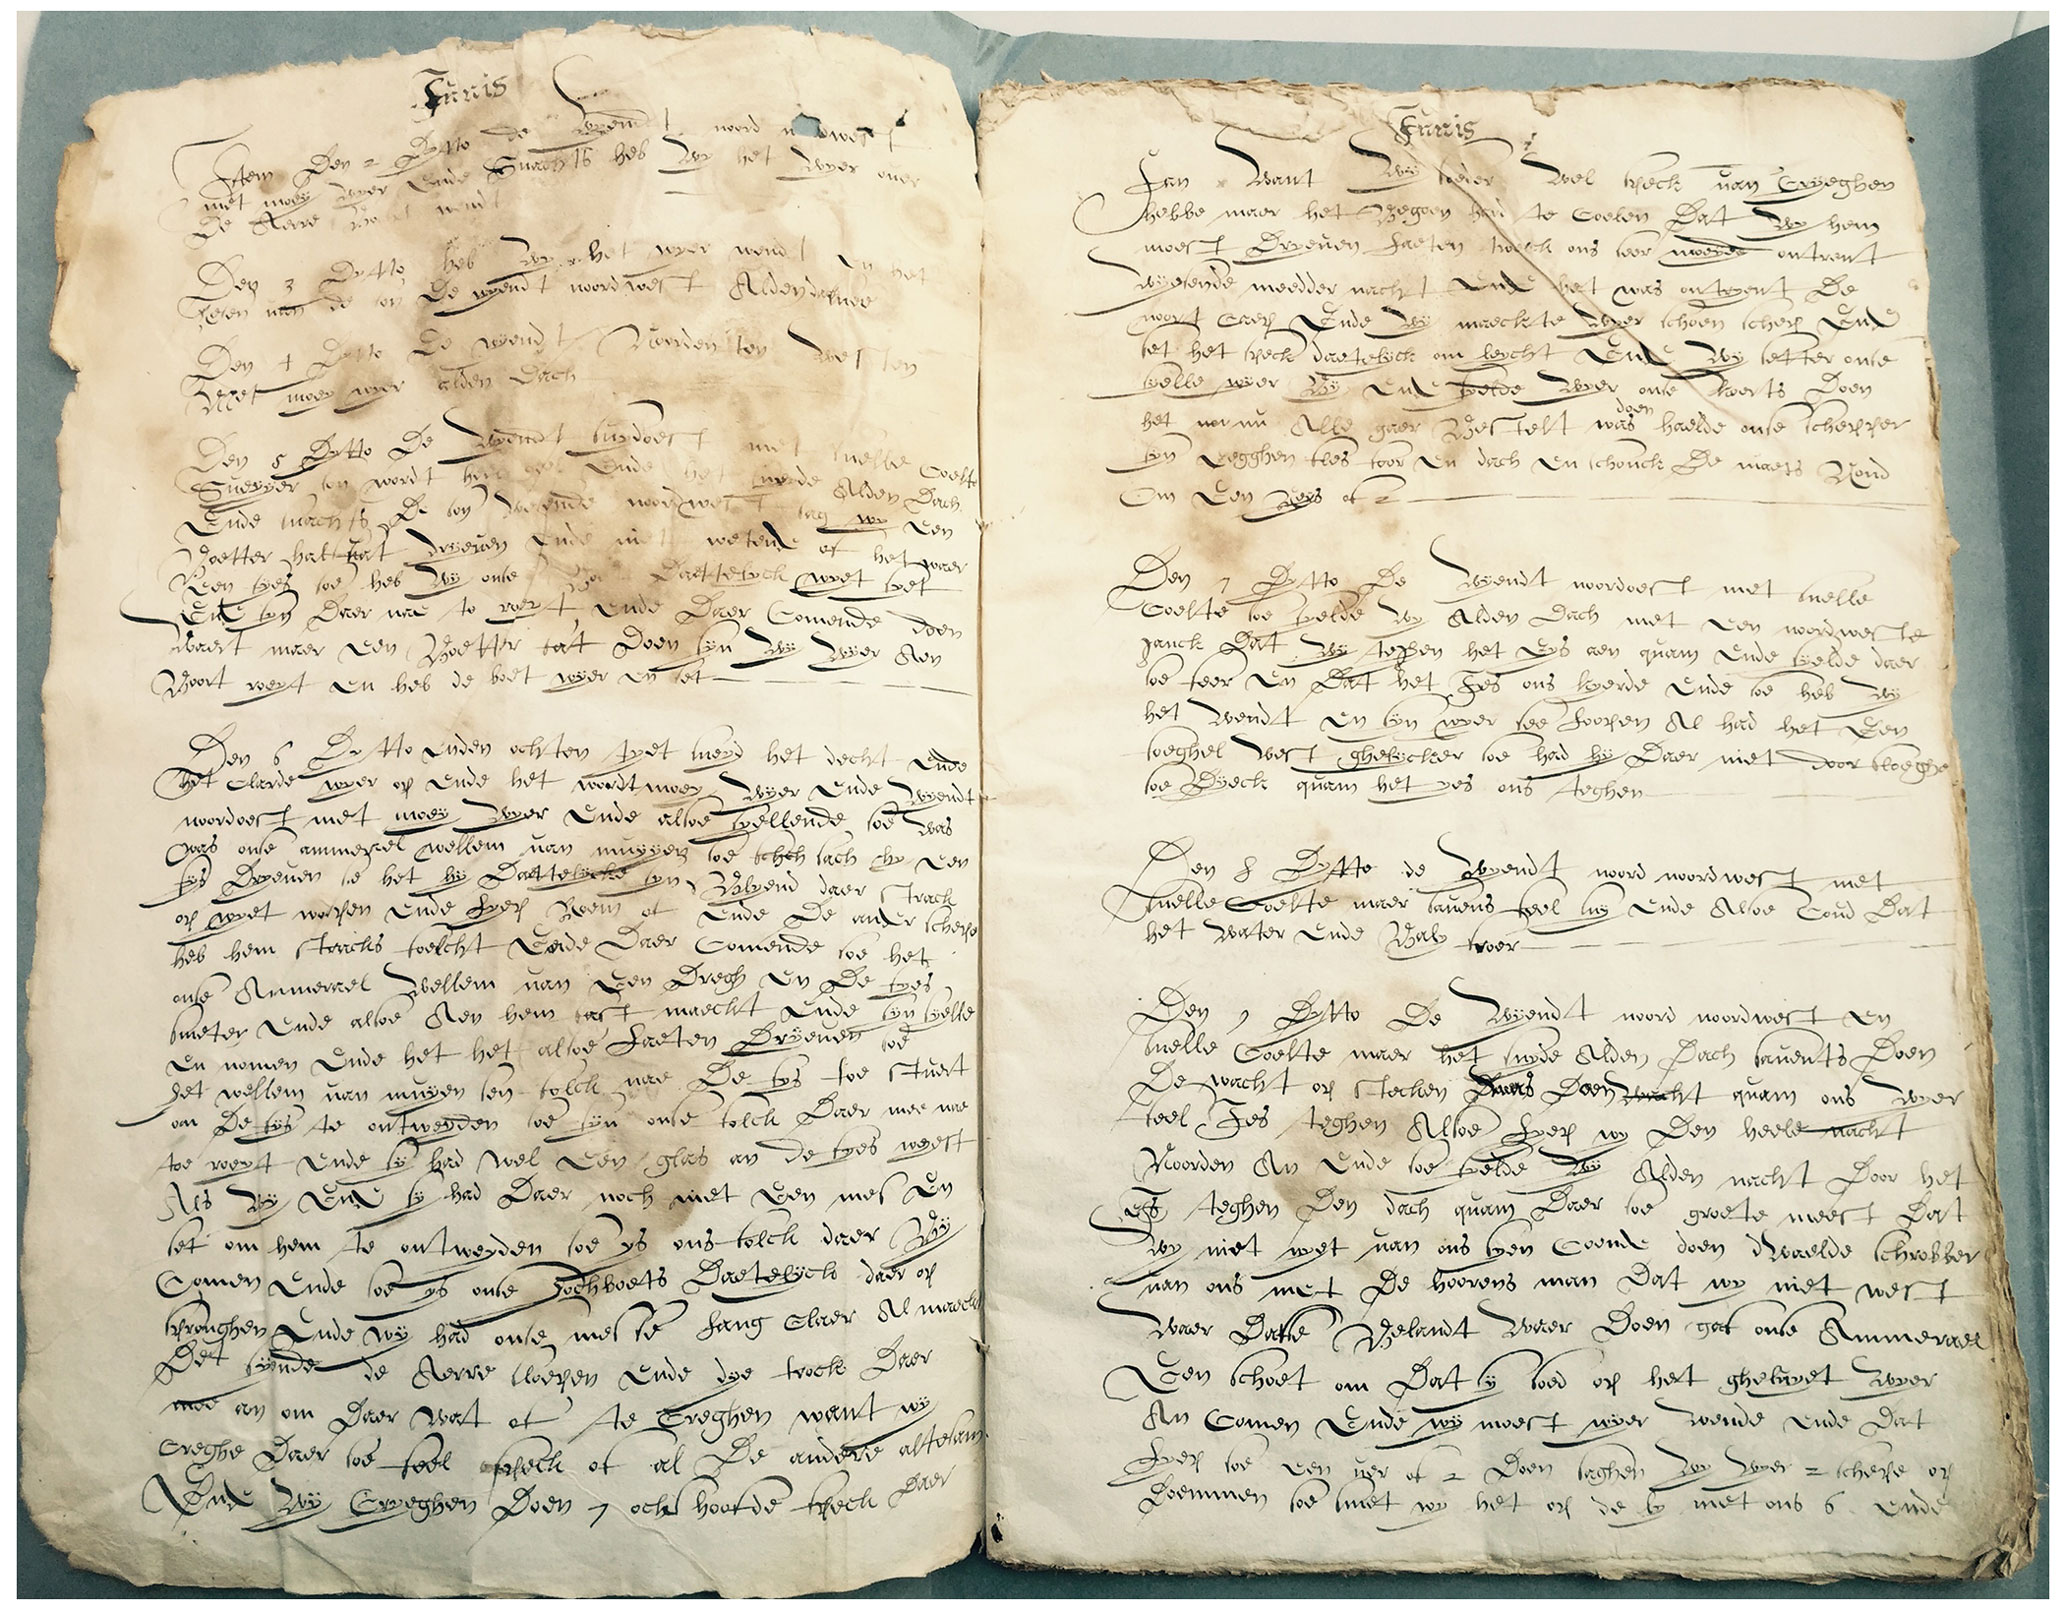
Figure 9Journal written by a Dutch whaler during a voyage to the “Greenland Fishery”, between Jan Mayen and Svalbard, 1615. Source: 0120 Oud archief stad Enkhuizen 1353–1815 (1872), Westfries Archief, Hoorn.
Between the 16th and 20th centuries, ships' logbooks are perhaps the most useful source type (see Wheeler, 2005a, b; Wheeler and Garcia-Herrera, 2008; Ward and Wheeler, 2012; García-Herrera and Gallego, 2017; Degroot, 2018). Sailors originally recorded the speed and direction of the wind in order to calculate their location, and their compass-aided measurements of wind direction are often assumed to be true instrumental observations (Gallego et al., 2015). Yet naval officers on different ships in the same fleet could record slightly different measurements, and they did not always accurately estimate their longitude, or consistently describe whether recorded wind directions related to real or magnetic north (Wilkinson, 2009; García-Herrera et al., 2018). Logs kept by flag officers – which survive in larger quantities in early periods than logs kept by subordinate officers – may not include systematic weather observations. Ships did not sail in sufficient numbers prior to the 18th and 19th centuries for scholars to use surviving logbooks for comprehensive regional weather reconstructions, and many logbooks have been lost. Finally, logbooks written aboard some ships copied wind measurements earlier recorded in simple tables and should therefore be considered secondary sources for the purpose of climate reconstruction (Norrgård, 2017).
Logbooks of the 16th and 17th centuries, in particular, are most valuable when used alongside other documentary evidence. Journals kept during exceptional voyages may provide similar environmental data but in a narrative format. Accounts of the passage of ships through ports and toll houses; the annual catch brought in by fishermen or whalers; or the duration of voyages may provide evidence of changes in the distribution of sea ice or patterns of prevailing wind. Correspondence, diary entries, intelligence reports, newspaper articles, and chronicles may describe weather at sea, or weather blown in from the sea, often at high resolution and occasionally for decades. Paintings, illustrations, and even literature may provide insights into the changing frequency or severity of weather events at sea. These sources can supplement other human records of the oceanic climate, including oral histories, or shipwrecks distributed in areas of heavy trade (Chenoweth, 2006; Trouet et al., 2016).
7.2 Indices of wind direction and velocity
If carefully contextualised, information in written records of oceanic weather – especially ships' logbooks and accounts of naval voyages – can be quantified and entered into databases. The Climatological Database for the World's Oceans (CLIWOC; Fig. 10), for example, quantified nearly 300 000 logbooks from 1750 to 1850 CE, and their data are now among 456 million marine reports within the International Comprehensive Ocean-Atmosphere Data Set (ICOADS) (García-Herrera et al., 2005b; Koek and Konnen, 2005; García-Herrera et al., 2006). By using such datasets or by creating databases of their own, scholars have reconstructed aspects of past climate at sea, in many cases verifying or extending reconstructions compiled by scientists using other means. High-resolution reconstructions of regional trends in the frequency of winds from different directions, for example, reveal broadscale atmospheric circulation changes associated with stratovolcanic eruptions, ENSO, the North Atlantic Oscillation (NAO), or the monsoons of the Northern and Southern hemispheres (e.g. Garcia et al., 2001; Küttel et al., 2010; Barriopedro et al., 2014; Barrett, 2017; Barrett et al., 2018; García-Herrera et al., 2018).
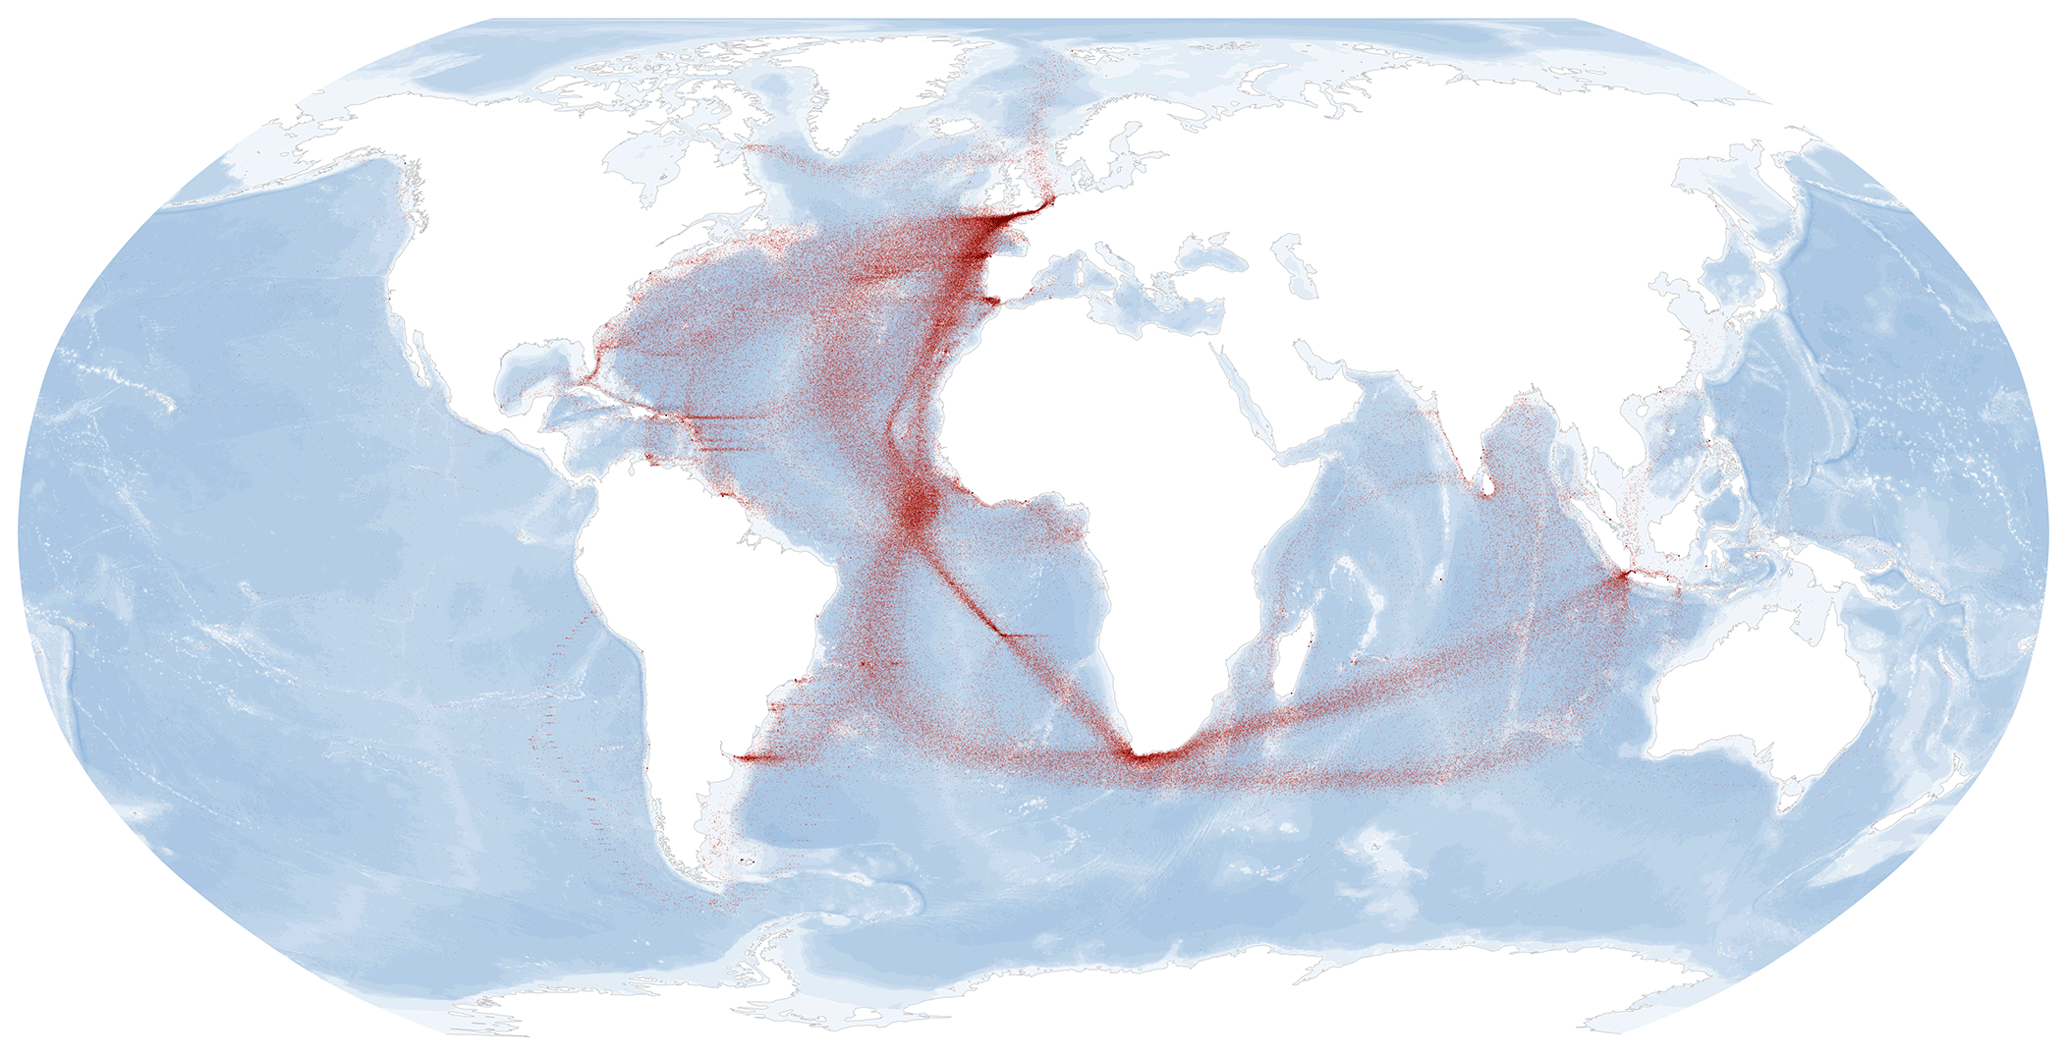
Figure 10Plot of the position of all ships' logbook entries in the CLIWOC database (Degroot and Ottens, 2021). The map is derived from the open-source variant of the CLIWOC database (García-Herrera et al., 2005b) held at https://www.historicalclimatology.com (last access: 3 June 2021).
7.3 Indices of sea-ice extent
Records of sea ice in harbours and heavily trafficked waterways – or records of dues paid at ports and toll houses – yield easily quantified data. However, reports of sea ice at high latitudes in correspondence, logbooks, or journals written before the 19th century often give unclear descriptions of sea-ice density, which makes it harder to determine how much sea ice there might have been in different regions from year to year (Prieto et al., 2004). The resolution and precision of Arctic index-based sea-ice or iceberg reconstructions that rely on early modern documents is accordingly quite low (Catchpole and Faurer, 1983; Catchpole and Halpin, 1987; Catchpole and Hanuta, 1989). An emerging way to circumvent this issue is to focus on particular regions where warm and cold ocean currents mixed and areas that were sensitive to (a) changes in sea and air surface temperatures and (b) current strength, for example, around western Svalbard or the Yugorsky Strait (Degroot, 2015). Logbook reports of the presence of sea ice in these target areas can be quantified, indexed, and used to develop reconstructions that suggest broadscale shifts in the strength of marine currents (Degroot, 2020).
7.4 Indices of precipitation and storms
Some ships' logbooks note the occurrence of precipitation at sea, and most record winds that must have influenced precipitation on land. Therefore, historical climatologists have used logbooks to classify and graph precipitation at or near the sea (e.g. Wheeler, 2005b; Hannaford et al., 2015). Moreover, most documents that directly describe weather at sea or blown in from the sea faithfully report storms and at least approximately note their severity (Lamb, 1992; García-Herrera et al., 2004; García-Herrera et al., 2005a; Chenoweth and Divine, 2008; Wheeler et al., 2010). Reconstructions based on written evidence of damage inflicted along the coast, however, can be more problematic, as damage reflected both complex social conditions and environmental circumstances beyond the severity of storms (de Kraker, 2011; Degroot, 2018).
The preceding sections have highlighted the variable number of classes used in index-based climate reconstructions and hinted at the variety of different approaches to index development. This section summarises the main methodological approaches used to derive indices on the different continents, with an emphasis on temperature and rainfall series.
8.1 Climate index development in Europe – “Pfister indices”
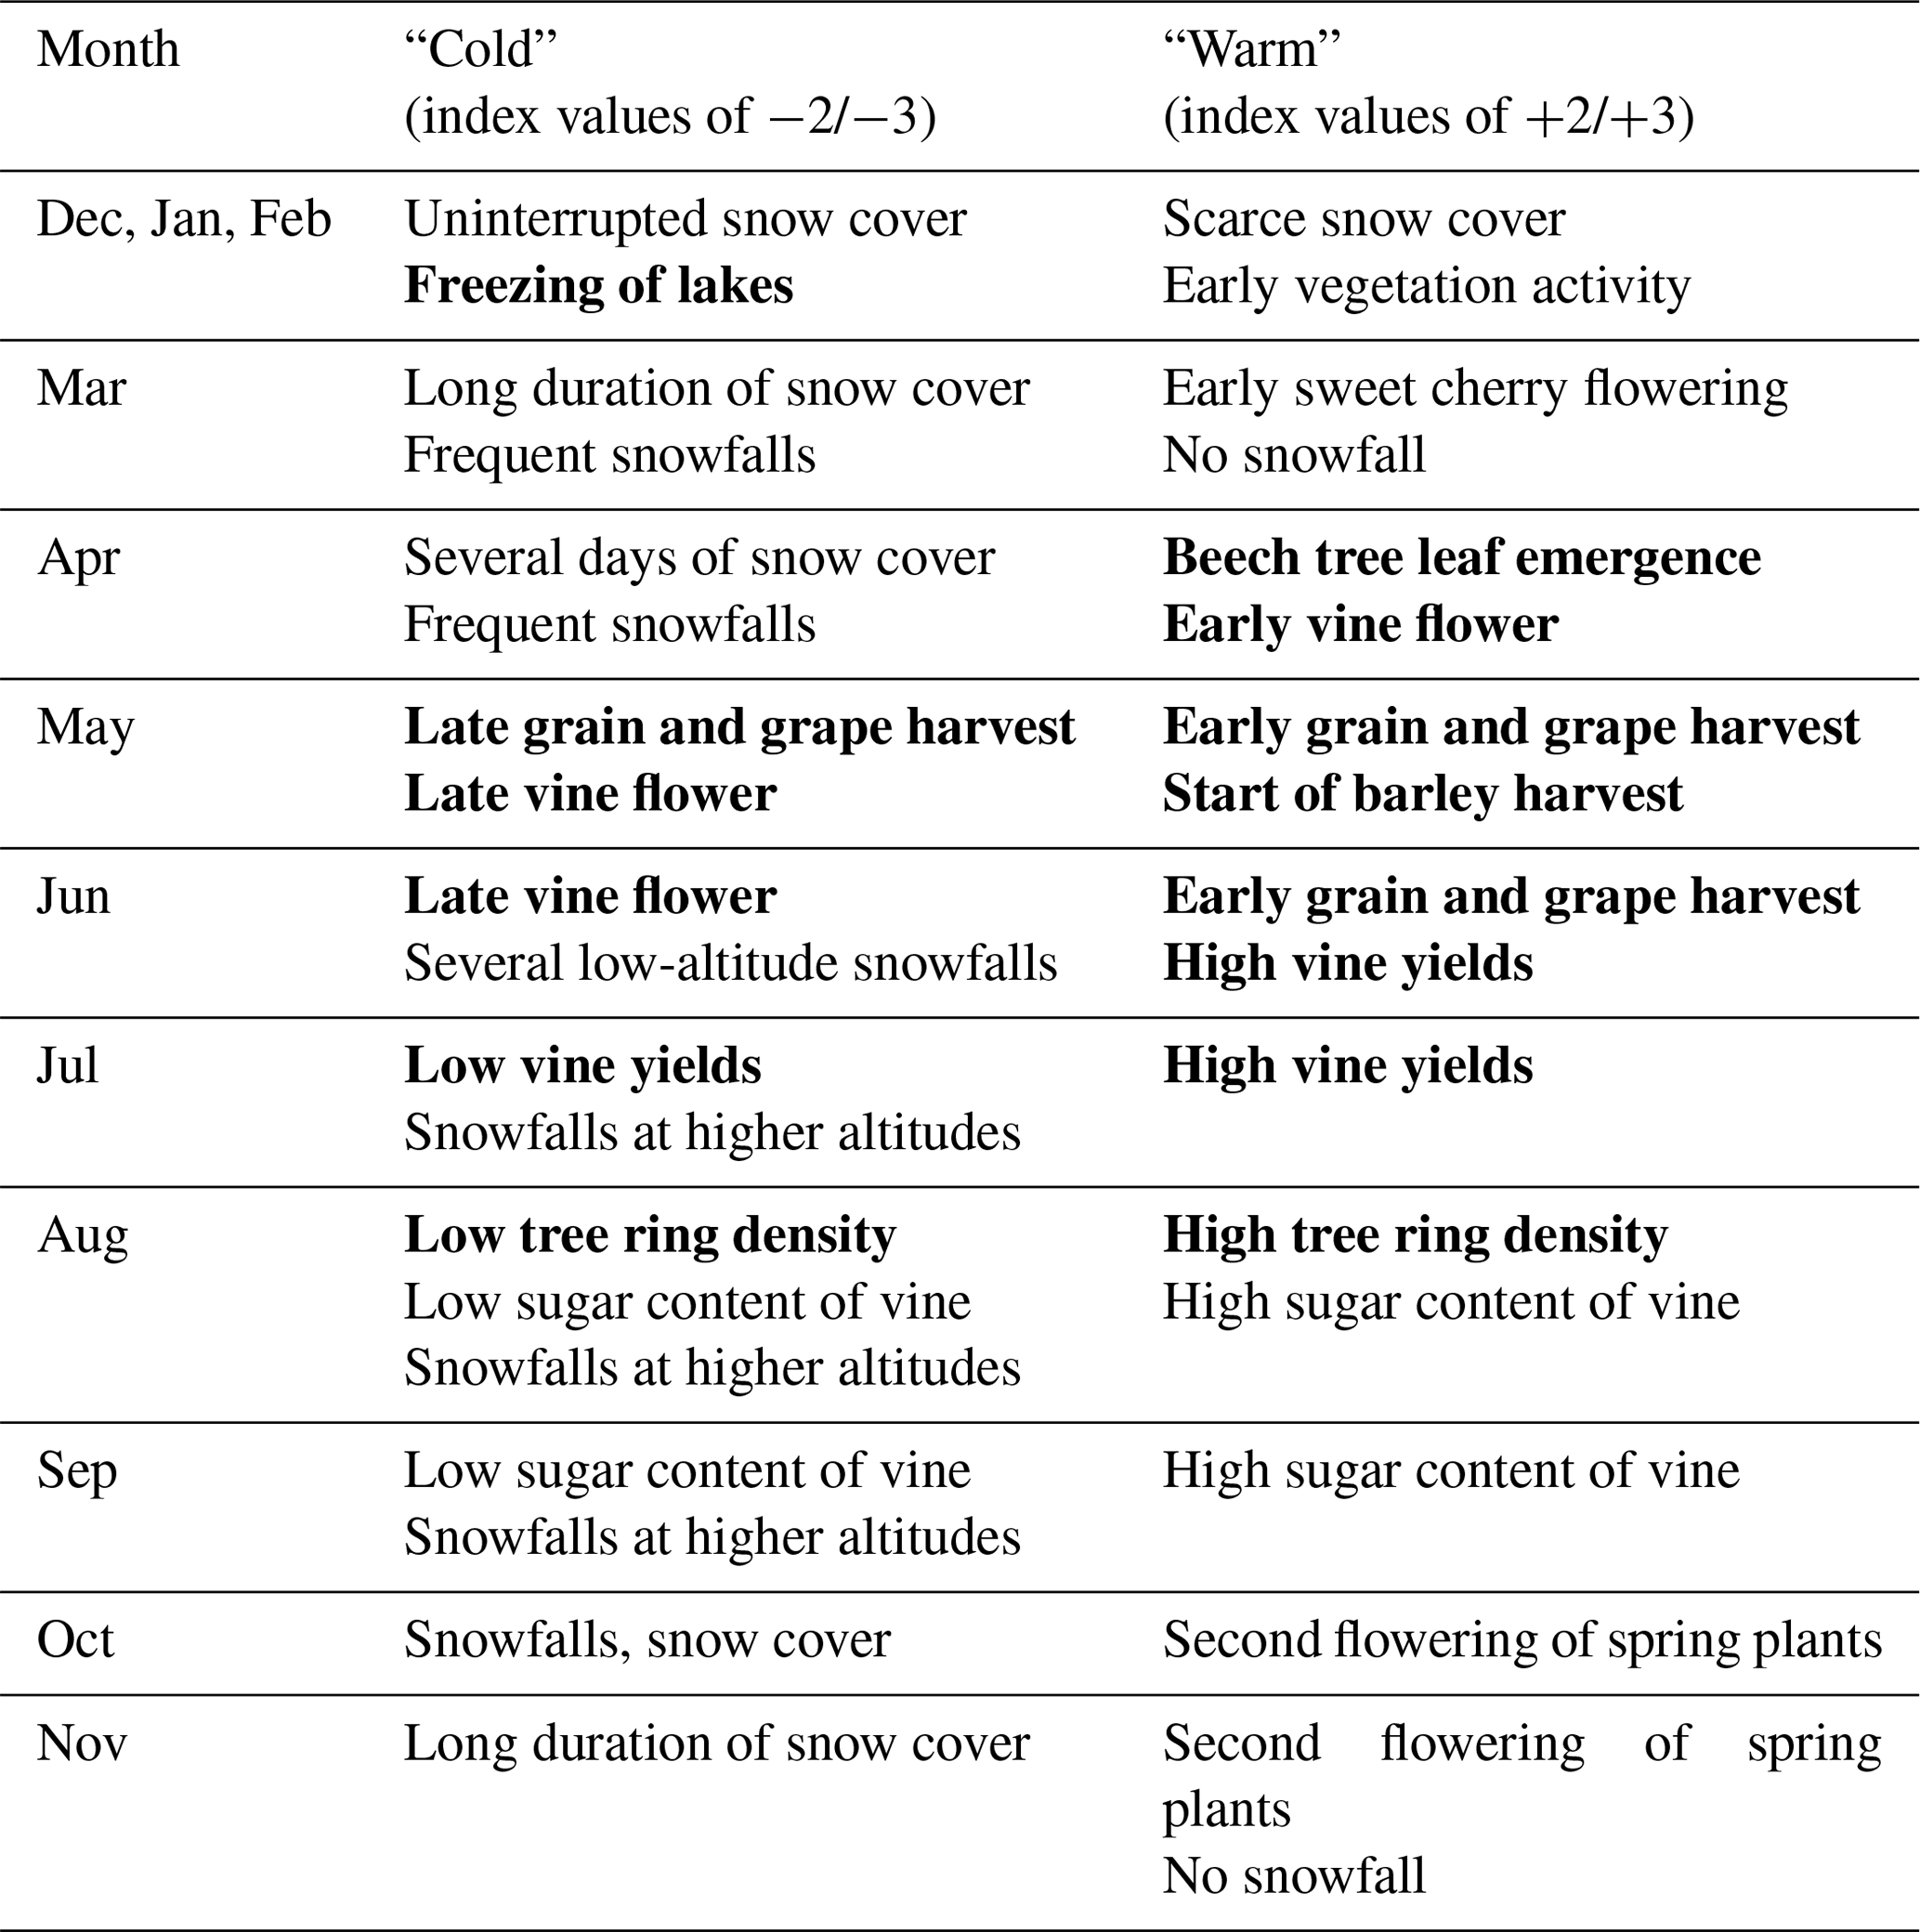
In Europe, the most widely adopted approach to the reconstruction of temperature and rainfall variability for climatically homogenous regions is through the development of seven-point ordinal indices (Pfister, 1984; Pfister et al., 2018), which the climate historian Franz Mauelshagen has termed “Pfister indices” (Mauelshagen, 2010). These indices are normally generated at a monthly level through the analysis of (bio)physically based proxies and contemporary reports of climate and related conditions. This is not without its challenges, and it requires a source-critical understanding of the evidence-base in addition to a knowledge of regional climates (Brázdil et al., 2010). To aid interpretation, any contemporary report should be accompanied by a range of information, including details of the date, time, location affected, author, and source quality (see Brázdil et al., 2010; Pfister et al., 2018). The criteria used to allocate a specific month to a specific index category will vary from place to place according to regional climatic variability. Table 1, for example, illustrates the indicators used to classify individual months as either “warm” (+2/+3) or “cold” (−2/−3) in a temperature reconstruction for Switzerland (Pfister, 1992); these include regionally relevant phenomena such as the timing and duration of snowfall and various plant-phenological indicators. Pfister et al. (2018) recommend that monthly rankings of above +1 and below −1 should only be attributed based on proxy data such as phenological evidence, with values of −3 and +3 reserved only for exceptional months. An index value of 0 should only be used where reports of climate suggest normal conditions – an absence of data should be reported as a gap in the time series rather than a 0 value.
Table 1Criteria used in the generation of seven-point temperature indices for “warm” (+2/+3) or “cold” (−2/−3) months in Switzerland (after Pfister, 1992, and Pfister et al., 2018). Bold text indicates criteria grounded in statistical analyses.
Once monthly index values have been generated, these are then summed to produce seasonal or annual classifications where required. Three-month seasonal values can, as a result, fluctuate from −9 to +9 and annual values from −36 to +36 (see Pfister, 1984). It should be remembered, however, that indexation generates ordinal data, with no guarantee that the intervals between each index level are equal, so that the sum for a specific season or year can only approximate the magnitude of a meteorological phenomenon. The process of summation may result in positive index values for relatively warmer/wetter months during the year being cancelled out by negative index values for relatively colder/drier months. For example, a year containing a run of extremely dry months followed by a run of extremely wet months may produce a summed index value close to zero – even though the year includes two periods of “extreme” climate. Careful assessment is therefore required when reporting summed indices to avoid any loss of information, particularly concerning extreme events. The approach used by Nicholson et al. (2012a) for African precipitation series may be helpful here, where individual years were flagged if documentary sources suggested wetter and drier extremes across the year that differed by more than two index classes.
Implicit in this methodological approach is that runs of monthly indices are available with almost no gaps (e.g. Litzenburger, 2015) or that, where gaps occur, there is a high probability that conditions during a given month reflect the longer-term average for that month (e.g. Dobrovolný et al., 2009). Variations in source density, however, mean that it may not always be possible to define indices at a monthly level. Such variations could simply be due to a scarcity of available sources, or could be the product of seasonal variability that results in observations of a climate phenomenon being concentrated in specific parts of the year (e.g. observations of rainfall in areas of Europe with a Mediterranean climate are likely to be concentrated between September and April). In these situations, researchers should (i) choose an appropriate temporal resolution (i.e. seasonal or annual) based on the number and quality of available records, and (ii) develop specific seasonal- or annual-level criteria – see, for example, the temperature and precipitation reconstructions for Belgium, Luxembourg, and the Netherlands generated by Camenisch (2015a) or the Mediterranean temperature series by Camuffo et al. (2010). The methods used for calibration and verification are outlined in the following section.
In the development of his seven-point scale, Pfister assumed that monthly temperature and precipitation followed a Gaussian distribution. Initially, Pfister (1984) developed “duodecile” classes based on the frequency distribution of monthly temperature/precipitation means for the 60-year reference period from 1901 to 1960 as the standard of comparison (Table 2). The most extreme months (i.e. those given an index value of −3/+3) were those that fell into duodecile classes 1 and 12, representing the 8.3 % driest (or coldest) or 8.3 % wettest (or warmest) months respectively. Other index categories were defined using 16.6 % intervals. In the later version of his indices, Pfister (1999 and onwards) discontinued the use of duodecile classes, instead using the standard deviation from the mean temperature/precipitation for the 1901–1960 reference period to define index categories: ±180 % (of the standard deviation from the mean of the reference period) for index values −3/+3, ±130 % for values −2/+2, and ±65 % for values +1/−1.
Table 2The definition of the weighted temperature and precipitation index values used in the creation of initial (pre-1999) seven-point “Pfister” indices (after Pfister, 1992).
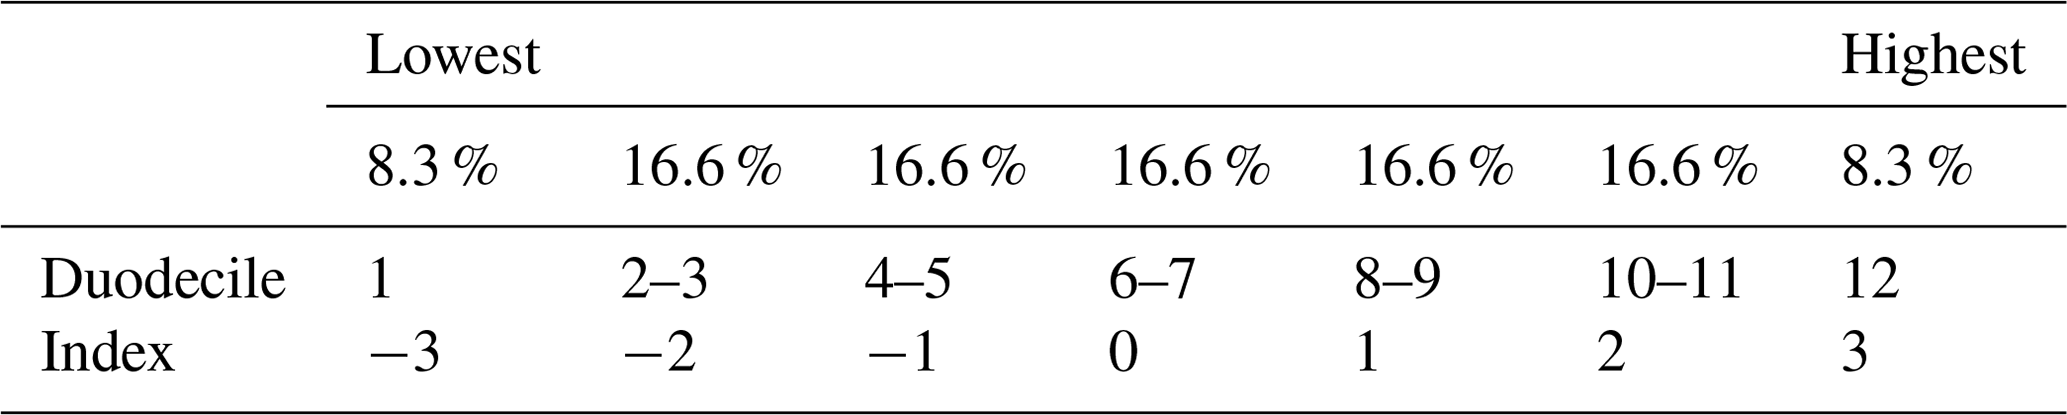
8.2 Climate index development in Asia
In China, the quantification of historical records to reconstruct climate change originated with a semantic differential method based on an analysis of each record's content (see Central Meteorological Bureau of China, 1981; Su et al., 2014; Yin et al., 2015). Temperature series were traditionally established at a decadal scale only. In creating a series, each year was first defined as “cold”, “warm”, or “normal” according to direct weather descriptions or environmental and phenological evidence. In contrast to the Pfister method (see Sect. 8.1), “normal” was also used when there was insufficient information available to determine temperature abnormalities. This approach reflects the nature of most Chinese documents, where the primary mission of the recorders was to detail abnormal or extreme events; fewer descriptions of abnormal events are therefore interpreted as indicating conditions closer to normal. After each year had been defined as cold, warm, or normal, an equation was then used to derive the decadal indices. The earliest example was published by Zhang (1980): , where Ti is the decadal winter temperature index, n1 is the number of cold years, n2 is the number of warm years, and 0.3 is the empirical coefficient (see also Zhang and Crowley, 1989). The resulting value is always negative; the lower the value, the more severe the coldness.
A second approach to the construction of ordinal scale indices was developed by other researchers in the 1990s (e.g. R. S. Wang and Wang, 1990; S. W. Wang and Wang, 1990; Wang et al., 1998). This used a four-point scale (0, 1, 2, 3) (Table 3). As in Europe, indices were generated through the analysis of phenological descriptions and contemporary reports of climate and related phenomena. Like Europe, criteria for individual index categories could also be adjusted for specific places at specific seasons according to geographical and climatic attributes. However, unlike the Pfister method, an index value of 0 could be used where there were missing data. S. W. Wang and Wang (1990) further introduced a statistical method to compare phenological evidence with modern (1951–1985 CE) and early instrumental data (1873–1972 CE in Shanghai) and allocate temperature ranges to ordinal scales. An index value of −0.5 corresponded to a −0.5 to −0.9 ∘C temperature anomaly, a value of −1.0 to a −1.0 to −1.9 ∘C anomaly, and a value of −2.0 to an anomaly of ∘C; values of 1.5 were added to indicate warm temperatures, and values of −3.0 were added to capture extreme cold periods. These cold indices were then regressed with the decadal mean temperature (1873–1972 CE) to derive a coefficient through which the index value could be transferred into a “real” temperature.
Table 3Criteria used in the development of temperature indices in China.
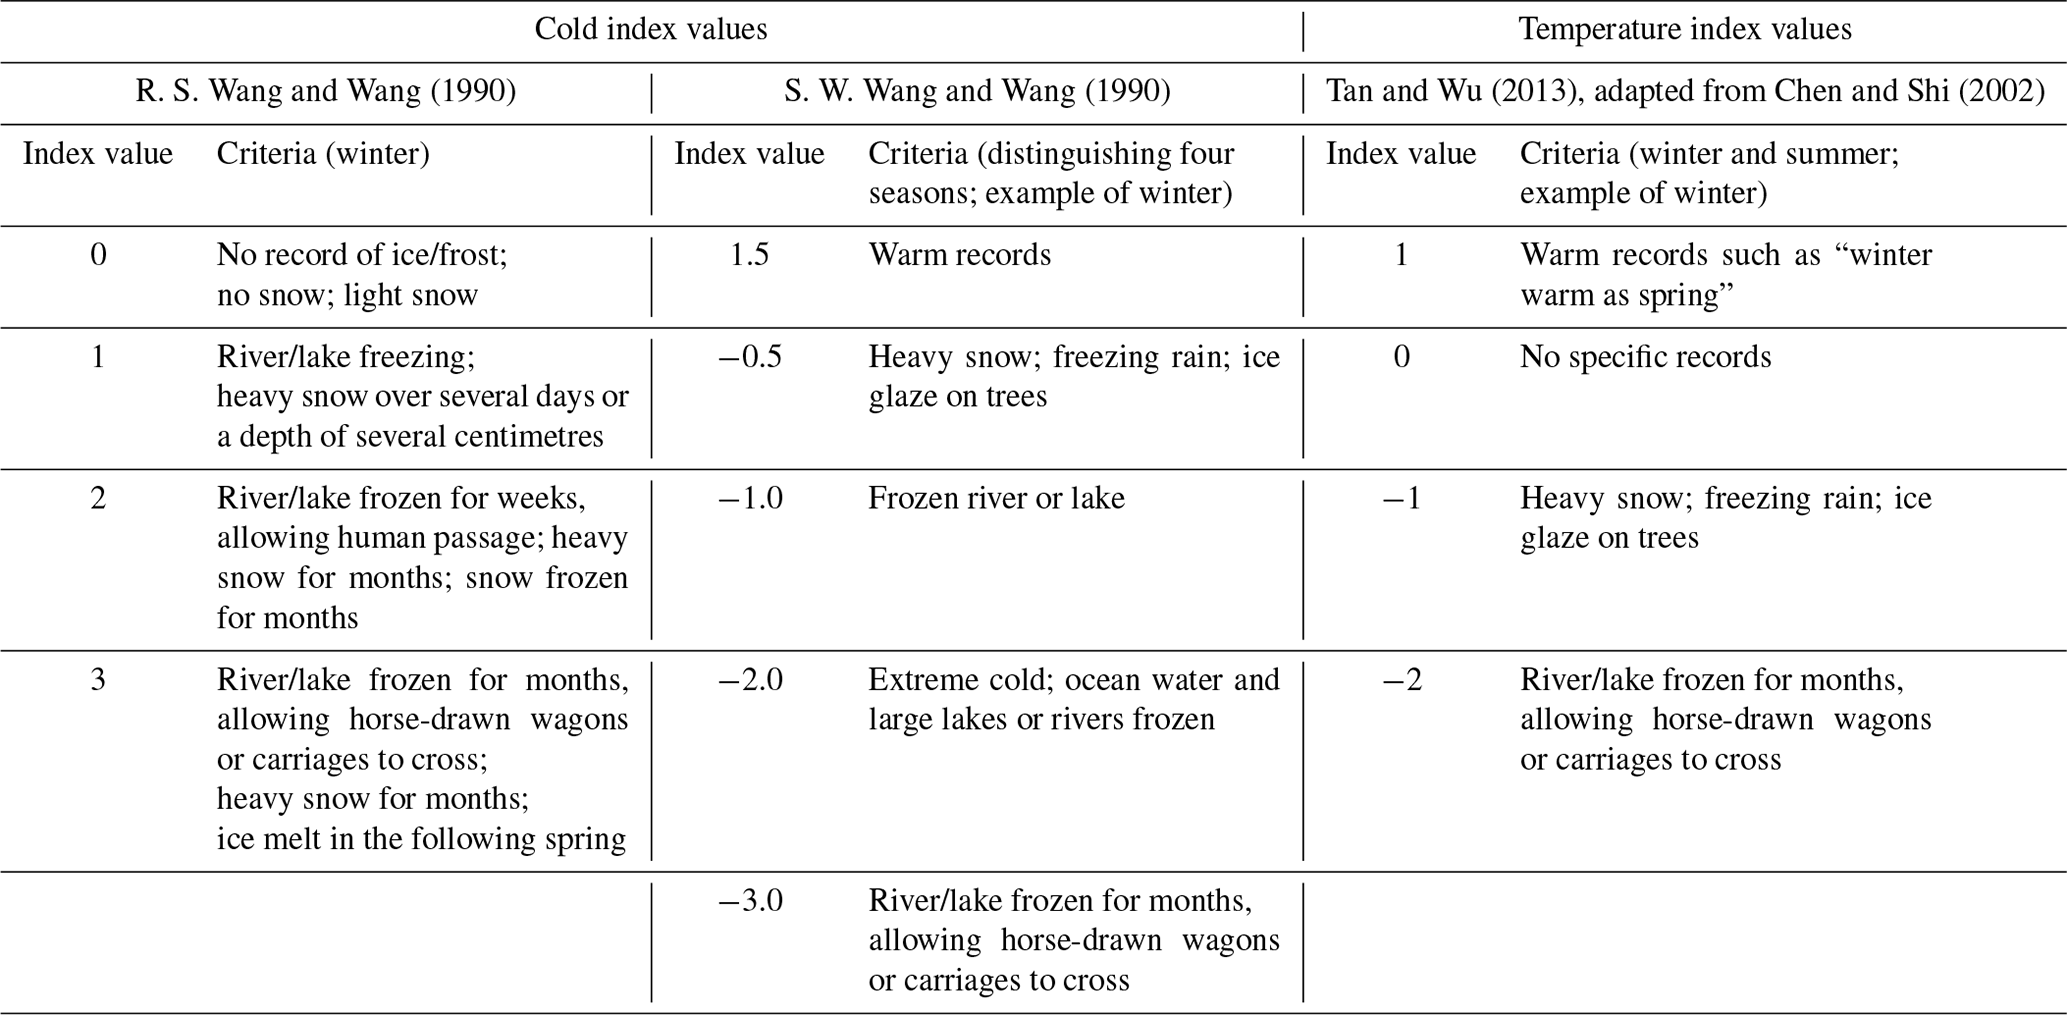
Chen and Shi (2002) built upon the approaches of Zhang (1980) and R. S. Wang and Wang (1990) in developing an equation to calculate decadal temperature indices: , where n1 is the number of extremely cold years, n2 is the number of cold years, and n3 is the number of warm years. A resulting decadal temperature index value of 10 denotes average conditions; <10 denotes anomalous cold; and >10 denotes anomalous warm. Successive work (Tan and Liao, 2012; Tan and Wu, 2013) adopted the Chen and Shi (2002) approach with a slight modification of the index criteria while retaining the four-point ordinal scale. The temperature series generated using this approach have been incorporated into multi-proxy temperature reconstructions (e.g. Yi et al., 2012; Ge et al., 2013). Zheng et al. (2007) and Ge et al. (2013) provide useful reviews of the approach used to generate temperature indices in China.
As noted in Sect. 3.2, drought–flood index reconstruction in China has a long tradition. Two main approaches are used. Earlier studies adopted a proportionality index approach (Zhu, 1926; Yao, 1943). As explained by Gong and Hameed (1991), Zhu used the equation to calculate the index, where D represents the number of droughts and F the number of floods in a given time period. This equation is poorly defined if F or D is zero. Brooks (1949) modified the equation and used the flood percentage, , to derive moisture conditions in Britain and some European regions from 100 BCE onwards at a 50-year resolution. Gong and Hameed (1991) further modified the equation as to derive indices at a 5-year resolution. Their index takes the values , with larger values reflecting wetter conditions. Zhang and Zhang (1979) adopted a slightly different approach by counting the number of places with reported drought events: , where D represents the number of places having extreme drought (grade 5) and drought (grade 4) events in a given year (see Table 4), and N is the total number of places.
Table 4Criteria used in the generation of five-point drought–flood indices in China (Academy of Meteorological Science of China Central Meteorological Administration, 1981). For more details, see Zhang and Crowley (1989), Zhang et al. (1997), and Yi et al. (2012).
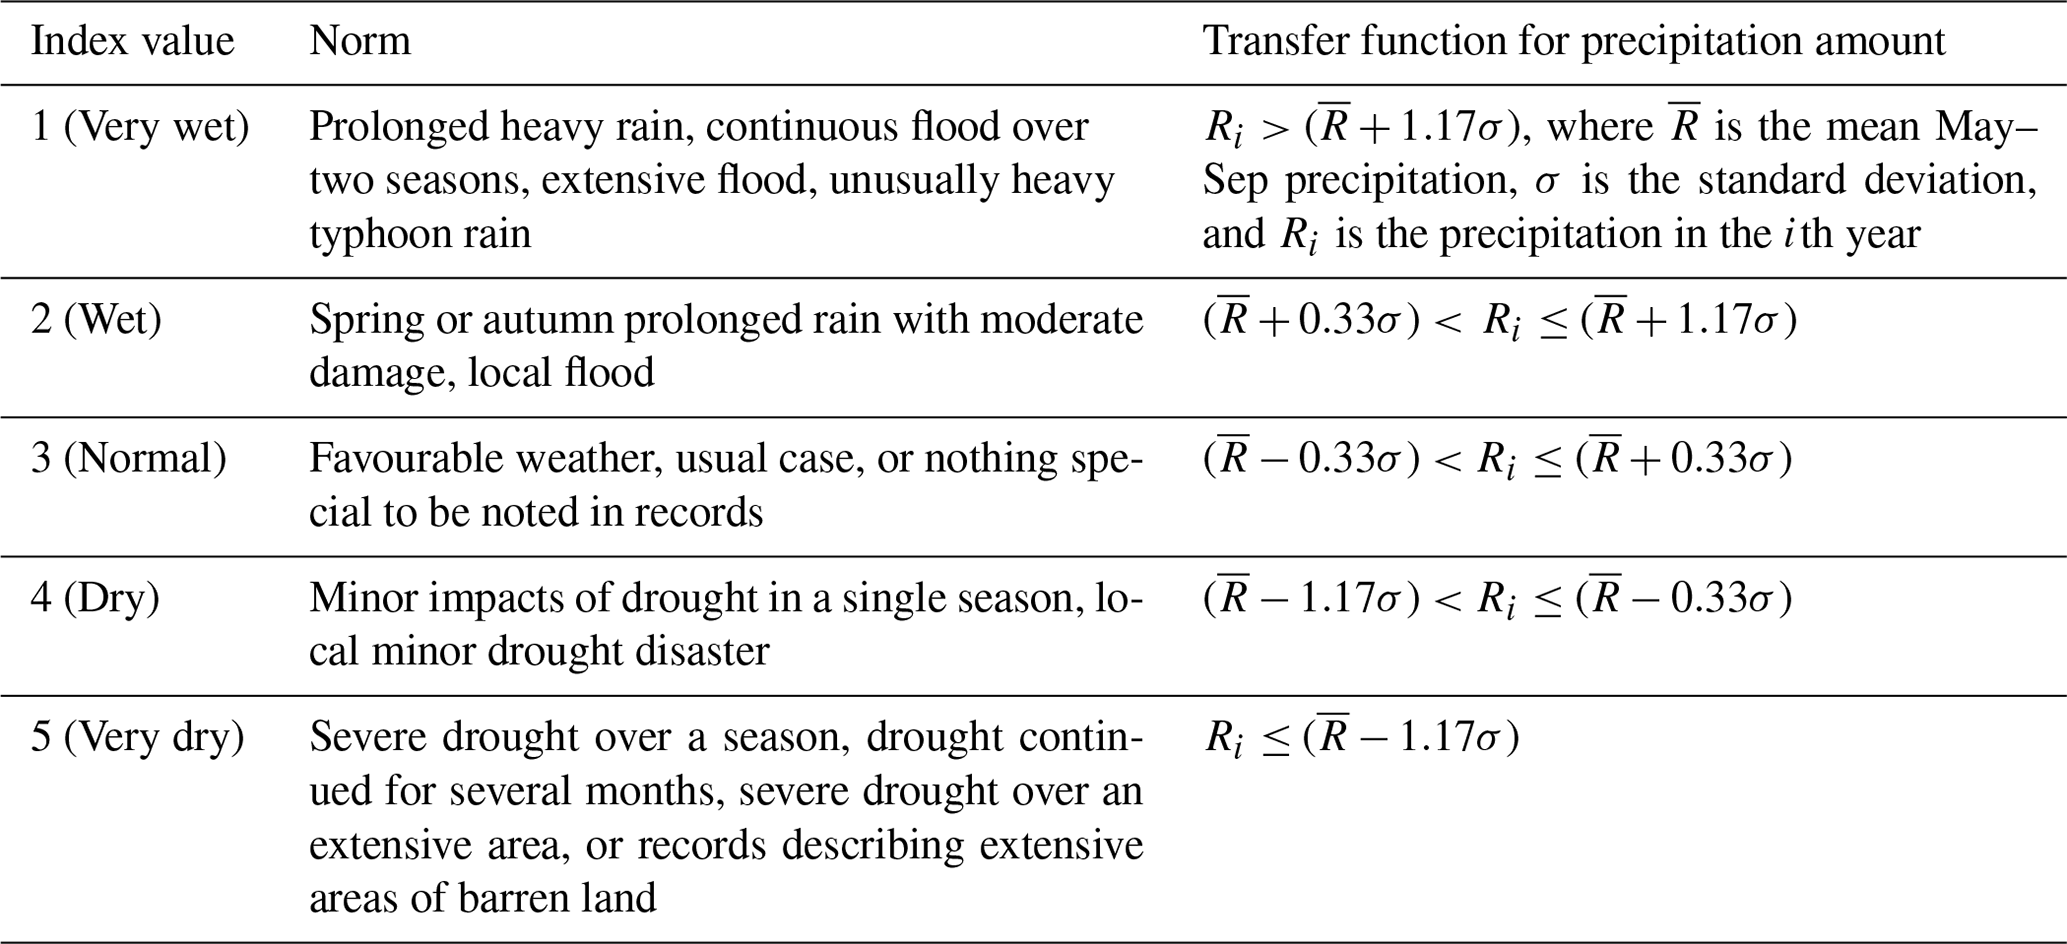
The Academy of Meteorological Science of China Central Meteorological Administration (1981) adopted a five-point ordinal scale approach to reconstruct annually resolved drought–flood indices in China. The key descriptors for each classification (see Table 4) are mainly based on accounts of the onset, duration, areal extent, and severity of each drought or flood event in each location. They then assume a probability distribution of the five grades following a normal distribution: 1 (10 %), 2 (25 %), 3 (30 %), 4 (25 %), and 5 (10 %). For the period of overlap between written and instrumental records (after 1950 CE), the graded series were compared against the observed May–September (major rainy season) precipitation and regressed to transform the indices into numerical series (Table 4). Based on the five-point ordinal scale, Wang et al. (1993) and Zheng et al. (2006) developed further formulae to calculate decadal drought–flood indices that can be applied to earlier periods (i.e. before 1470 CE) when less information is available.
8.3 Climate index development in Africa
Historical climate reconstructions for Africa use two different approaches to index development. The continent-wide rainfall reconstruction by Nicholson et al. (2012a) is based upon 90 regions that are homogeneous with respect to interannual rainfall variability. An underpinning assumption is that historical information for any location within a region – be it narrative or instrumental – can be used to produce a precipitation time series representing that region. Instrumental rainfall data are converted into seven “wetness” classes (−3 to +3) based on standard deviations from the long-term mean. A wetness index value of zero corresponds to annual rainfall totals within ±0.25 standard deviations of the mean. Index values of −1/+1 are assigned to annual values between −0.25/+0.25 and −0.75/+0.75 standard deviations. Values of −2/+2 are given to annual totals between −0.75/+0.75 and −1.25/+1.25 standard deviations, with more extreme departures classed as −3/+3.
Documentary data are integrated by first assigning individual pieces of narrative evidence to a specific region; each piece of evidence is then classified into one of the seven “wetness” categories. Like the approach used by Pfister, the presence of key descriptors of climate conditions is used to distinguish these categories. The scores for each item of evidence for a specific region/year are summed and averaged. Where there are several sources, a “0 index” value represents an average of conditions. Where only single sources are available, some contain so much climate-related information that, as in China, absence of evidence for a specific season is taken to infer “normal” conditions; such cases are indicated in the original data file accompanying the Nicholson et al. (2012a) reconstruction. Algorithms are then used to weight and combine documentary and instrumental data for each region and year. These are defined subjectively according to the accuracy of the quantitative versus qualitative indicators. For example, when one of each type is available, the qualitative indicator is weighted twice as much as the gauge because of the inherent spatial variability within African rainfall. A second assumption is that when the correlation between rainfall in two regions is >0.5, the regions are appropriate substitutes for each other (Nicholson, 2001). In this way, classifications for regions without evidence for a given year can be derived by substitution. Statistical inference (termed “spatial reconstruction” by Nicholson) is then used to generate classifications for any remaining regions. The cut-off of 0.5 was selected based on examination of time series that correlate with each other at various levels. Those with a correlation of 0.5 showed marked similarity, though it should be noted that, in most cases, the correlation was much higher, with the statistical significance being >0.001.
Regional rainfall reconstructions in southern Africa use an approach much closer to the Pfister method to classify documentary evidence into one of five rainfall classes (−2 to +2); these classes are ordinal rather than based on statistical distributions. Like the Pfister method, a “0 index” value is only awarded where narrative evidence suggests normal conditions – years with inconclusive or no data are left unclassified. Owing to the relatively paucity of documentary data for Africa compared with Europe, conditions for specific rainy seasons are categorised at a quarterly (e.g. Nash et al., 2016) or, more commonly, annual level. Again, key descriptors are used to distinguish the various index classes. The main point of divergence with the approach used by Nicholson is that – rather than assigning individual pieces of evidence to wetness classes and averaging – qualitative analysis is undertaken of all quotations describing weather and related conditions for an entire quarter/year (see Nash, 2017). These different methodological approaches, as well as the type of documentary evidence used, can introduce discrepancies between rainfall series for overlapping regions. Hannaford and Nash (2016) and Nash et al. (2018) note, for example, that the reconstructions in Nicholson et al. (2012a) for KwaZulu-Natal during the first decade of the 19th century and Malawi for the 1880s–1890s show generally drier conditions than overlapping series generated using different methods.
8.4 Climate index development in the Americas
Temperature, precipitation, and phenological indices for North America have been based on a distinctive content analysis approach. This method was first applied to historical climatology in the 1970s to reconstruct freeze and break-up dates around Hudson Bay for the 1714–1871 CE period by quantifying the frequency and co-occurrence of key weather descriptors in Hudson's Bay Company records (Catchpole et al., 1970; Moodie and Catchpole, 1975). The resulting indices are open-ended, as more and stronger descriptors in the sources could generate indefinitely larger (positive or negative) values. Baron (1980) adapted content analysis to analyse historical New England diaries, by ranking and then numerically weighting descriptors of several types of weather found in those sources. In subsequent publications, he and collaborators adopted different scales for annual and seasonal temperature and precipitation depending on the level of detail in the underlying sources (e.g. Baron, 1995).
In Mexico, Mendoza et al. (2007) constructed a series of historical droughts for the Yucatán Peninsula using the method of Holmes and Lipo (2003). In this investigation, historical drought data were transformed into a series of pulse width modulation types (1 drought, 0 no drought) and linked to the Atlantic Multidecadal Oscillation and Southern Oscillation Index. Other studies have used key descriptors as the basis for index development. Garza Merodio (2017), for example, classified rogation ceremonies into five ordinal levels based on Garza and Barriendos (1998), creating drought series for México, Puebla, Morelia, Guadalajara, Oaxaca, Durango, Sonora, Chiapas, and Yucatán. Domínguez-Castro et al. (2019) generated binary series (presence or absence) for precipitation, frost, hail, fog, thunderstorm, and wind in Mexico City. Temperature indices for Mexico have been developed using the applied content analysis approach of Baron (1982) and Prieto et al. (2005).
In South America, the methodology used to analyse historical sources for climate reconstruction initially followed the content analysis approach of Moodie and Catchpole (1975), but it was later adapted in a number of papers by María del Rosario Prieto (e.g. Prieto et al., 2005). As noted in Sect. 5, most historical rainfall and river flow index series use five to seven annually resolved or seasonally resolved classes based on key descriptors, whereas most temperature-related series use three classes. To date, all South American rainfall and temperature series are ordinal in nature and do not make background assumptions about the statistical distribution of climate-related phenomena. However, the method used to derive “0 index” values is not always clearly stated, and many series do not discriminate between “no data” and “normal” years (both of which are expressed as zero values). For example, in many studies that use rogation ceremonies as the basis for rainfall index development, months when there are no ceremonies are categorised as zero. There are exceptions, e.g. Domínguez-Castro et al. (2018), who explicitly identify an absence of ceremonies as “no data”, and Prieto and Rojas (2015), who clearly differentiate between normal years and no data. A systematic reanalysis of many series would be useful to determine exactly how each was constructed.
The approach used by Quinn et al. (1987) and Quinn and Neal (1992) to construct El Niño series over the past 4.5 centuries is slightly different. The relative strengths of individual El Niño events were based on a range of subjective and objective measures in documentary sources from coastal Peru. These include descriptions of relative rainfall, the extent of flooding, and the degree of physical damage and destruction associated with each event, alongside accounts of impacts on shipping (e.g. wind and current effects on travel times between ports), fisheries (e.g. changes to fish catches, changes in fish meal production), and marine life (e.g. mass mortality of endemic marine organisms and guano birds, extent of invasion by tropical nekton) (Quinn et al., 1987). This broad approach was continued in subsequent studies by Ortlieb (1994, 1995, 2000), García-Herrera et al. (2008), and others.
8.5 Climate index development in Australia
Australian efforts have largely been based on the Pfister approach (Sect. 8.1) and regional-scale historical climatology investigations in southern Africa (Sect. 8.3), although instrumental and documentary sources have been analysed separately. Fenby and Gergis (2013) and Gergis and Ashcroft (2013) converted documentary and instrumental data into a three-point scale of wet, normal, and drought conditions. Historical data availability along with high spatial variability and known non-linearities in Australian rainfall meant that wet and dry conditions were assessed differently. Years were classified as “normal” if they failed to reach either wet or dry criteria. To avoid introducing errors or biases in the record, years with missing data were marked as missing, rather than given a value of zero.
For droughts, agreement between a minimum of 3 of the 12 documentary sources used was required for drought conditions to be identified in a given month. Droughts were identified regionally in one of five modern southeastern Australian states. To avoid issues associated with exaggerated accounts of dry conditions and/or localised drought, a year was classified as a “drought year” only when at least 40 % of historical sources indicated dry conditions for at least 6 consecutive months during the May-April “ENSO” year (the period with strongest association between southeastern Australian rainfall variations and ENSO; Fenby and Gergis, 2013). Dry conditions were defined as times where a lack of rainfall was perceived as severe by society, or negatively impacted upon agriculture or water availability.
Months of above-average rainfall in coastal New South Wales were identified using the annual rainfall summaries of Russell (1877), as this was the only source with consistent yearly information about rainfall events and impacts. Along with specific reports of good rainfall, monthly classifications of wet conditions were also based on accounts of flooding, abundant crops, excellent pasture, and the occurrence of insect plagues (Fenby and Gergis, 2013). Six months of high rainfall were required for a year (May–April) to be defined as wet.
Combining the documentary-based indices with an instrumentally derived index enabled the development of a single index of wet and dry conditions for eastern New South Wales from 1788 to 2008 CE. Each year of the instrumental rainfall datasets – the nine-station network for the Sydney region (1832–1860 CE) and a larger 45-station network representing the wider southeastern Australian region – was assigned an index value of wet (1), normal (0), or dry (−1) based on normalised precipitation anomalies. Years with a normalised precipitation anomaly greater than the 70th percentile were counted as wet for that station, whereas those with an anomaly below the 30th percentile were counted as dry. Overall, a year was classified as wet or dry for the region if at least 40 % of the stations with data available were in agreement, in line with the documentary classification of Fenby and Gergis (2013). Similar methods were employed by Ashcroft et al. (2014a), who used half a standard deviation above or below the 1835–1859 CE mean to build three-point indices of temperature, rainfall, and pressure variability in southeastern Australia before 1860 CE using early instrumental data.
8.6 Climate index development in the oceans
The most common indices for marine climate reconstruction quantify shifts in prevailing wind direction. Most convert directional measurements from the 32-point system used by mariners in logbooks to 1-, 4- or (very recently) 8-point indices – in part, because sailors were biased towards 4, 8, and 16-point compass readings (Wheeler, 2004, 2005a). These “directional indices” resemble the ordinal scales used to quantify qualitative temperature and rainfall observations on land. Few calculate error or confidence in their reconstructions, in part because those considerations are difficult to quantify (see García-Herrera et al., 2018). Recent studies have quantified the uncertainty involved in connecting logbook observations to broadscale circulation changes by using a calibration process that correlates wind directions in a target area traversed by ships to, for example, the strength of a monsoon (Gallego et al., 2015, 2017).
Wind velocity and storm intensity or frequency indices have also made use of observations recorded in logbooks. Beginning in the 19th century, mariners made these measurements using the 12-point Beaufort wind force scale. Before that, measurements refer to the sails that mariners needed to furl or unfurl in winds of different velocity. Thus, the measurements are more subjective than those of wind direction, yet they can still be roughly translated into Beaufort indices (see García-Herrera et al., 2003; Koek and Konnen, 2005). Hence, it is possible to use these indices to develop high-resolution reconstructions of trends in average wind velocities and storm frequency and intensity (Degroot, 2014). Yet, as shifts in wind direction were more objectively recorded by sailors than changes in wind velocity, and are equally indicative of broadscale circulation changes, directional reconstructions are generally favoured by historical climatologists (Ordóñez et al., 2016).
9.1 Calibration and verification in index development
There are several approaches for calibrating and verifying index series used globally. Where overlapping meteorological data are available, long series of temperature and precipitation indices can be converted into quantitative meteorological units by using statistical climate reconstruction procedures; some of these have been inherited from fields such as dendroclimatology (see Brázdil et al., 2010, for a full discussion of statistical methods). For regions of the world lacking long instrumental records, simple cross-checking of climate indices against shorter periods of overlapping data is often used.
In Europe, Pfister (1984) was the first to use a calibration and verification process in the development of his indices. His approach – an example of best practice for regions where there is a lengthy period of instrumental overlap with the documentary record – is summarised by Brázdil et al. (2010) and Dobrovolný (2018) and illustrated in Fig. 11. However, even where a period of overlap is lacking, indices from documentary sources can still be used to cross-check reconstructions from proxy data (e.g. Bauch et al., 2020) or modelling results and observations (e.g. Bothe et al., 2019). The aim of calibration is to develop a transfer function between an index series and the measured climate variable, with verification against an independent period or subset of the overlapping meteorological data used to check the validity of this transfer function. In studies where there is a multi-decadal period of overlap, the instrumental data are normally divided into two sub-periods; the index series is first calibrated to the earlier sub-period and then verified against the later sub-period (Dobrovolný, 2018). If only a short period of overlap is available, then cross-validation procedures are required.
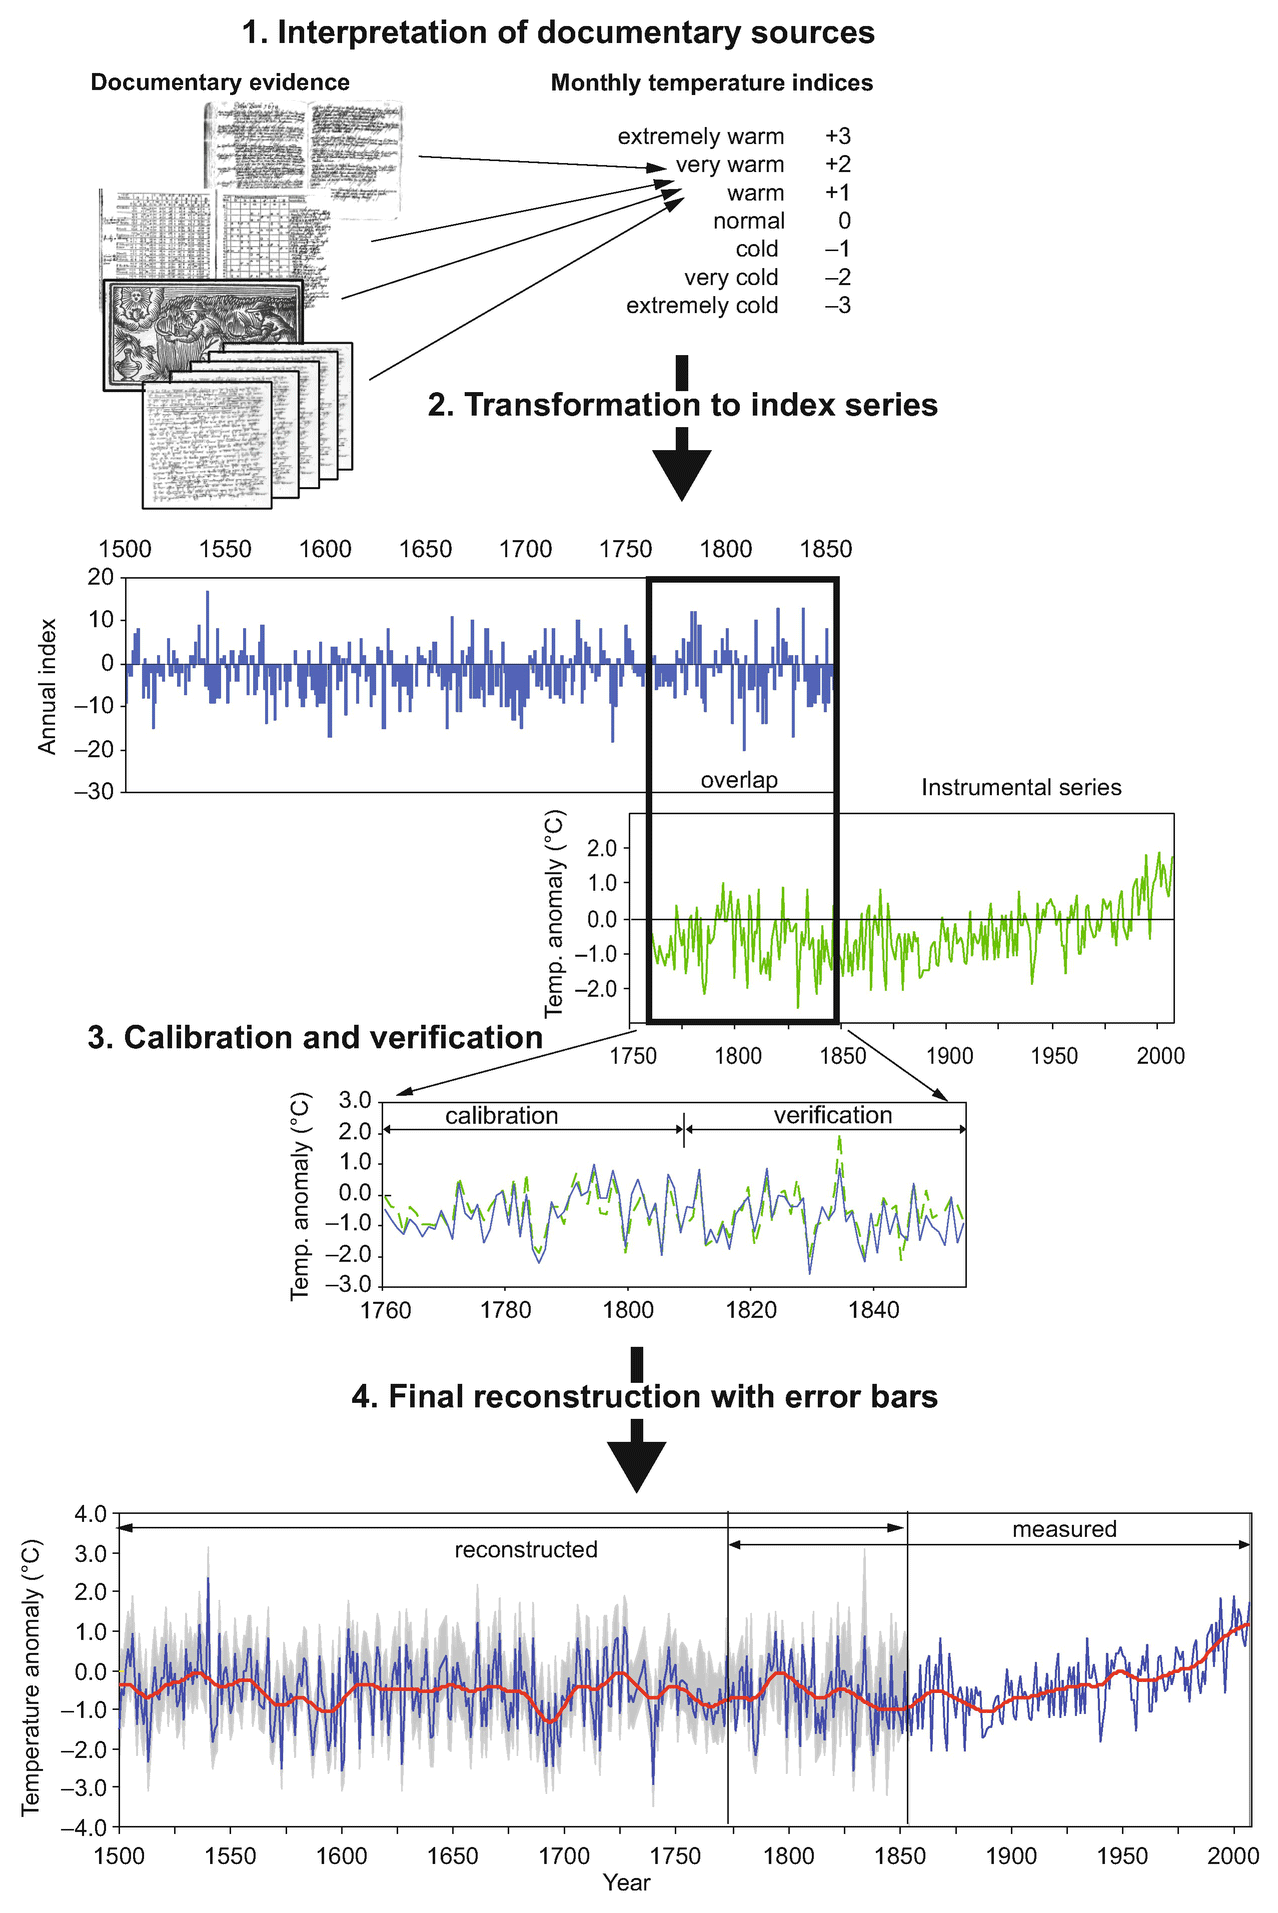
Figure 11The main steps in quantitative climate reconstruction based on temperature or precipitation indices derived from documentary evidence. Historical documentary sources are analysed to generate seven-point monthly indices (step 1), which are then summed to produce annual index series (step 2). Calibration and verification are carried out on periods of overlapping instrumental data (step 3), with statistical results from verification used to define error bars for the final reconstruction (step 4). Reprinted with permission from Brázdil et al. (2010)(© Springer 2010).
The transfer function derived from a calibration period is normally evaluated by statistical measures (e.g. squared correlation r2, standard error of the estimate) before being applied in the verification period. During verification, index values calibrated to physical units (e.g. temperature degrees or precipitation amount) are compared with the instrumental data and, again, evaluated statistically using r2, reduction of error, and the coefficient of efficiency (see Cook et al., 1994; Wilson et al., 2006). If the calibrated data series, derived by applying the transfer function obtained for the calibration period, expresses the variability of the climate factor under consideration with satisfactory accuracy in the verification period, then the index series can be considered as useful for climate reconstruction back beyond the instrumental period (Brázdil et al., 2010). Caution is needed, however, as transfer functions, which are usually derived from relatively modern periods, may not be stable through time (e.g. where phenological series have been influenced by the introduction of new varieties or different harvesting technologies; Pfister, 1984; Meier et al., 2007).
Like the European approach, calibration and verification methods in China are applied to reconstructed temperature and drought–flood indices by comparing the series overlap between instrumental and documentary periods. Shanghai has the longest instrumental data coverage (1873 CE onwards), with Beijing, Suzhou, Nanjing, and Hangzhou also having century-long data series (Chen and Shi, 2002; Zhang and Liu, 2002). As a result, most calibration is performed with reference to these cities. R. S. Wang and Wang (1990) compared their temperature series to these instrumental data to estimate correlation coefficients and allocate corresponding values to their indices. A transfer function was also estimated between the number of snow days (or number of lake freezing days) and observed temperatures by using multiple regression methods (Zhang, 1980; Gong et al., 1983; Zhang and Liu, 1987; Wang and Gong, 2000; Ge et al., 2003). However, the statistical correlation reports in these earlier studies appear incomplete.
The Academy of Meteorological Science of China Central Meteorological Administration (1981) have used precipitation data (1951–2000 CE) to validate drought–flood indices. However, the approach used focused on determining the probability distribution function of their five index classes to make the series comparable with instrumental data, rather than calibration per se (Yi et al., 2012; Shi et al., 2017). A special feature of calibration and verification in China is the utilisation of records in the Qing Yu Lu and Yu Xue Fen Cun (Hao et al., 2018; see Sect. 3.2), where comparisons can be made between reconstructed drought–flood indices and observed precipitation patterns (Zhang and Wang, 1990). Such correlations can further be compared and calibrated using instrumental data, for example for Beijing (Zhang and Liu, 2002), Suzhou, Nanjing, and Hangzhou (Zhang and Wang, 1990).
Validation within the Nicholson et al. (2012a) rainfall reconstruction for continental Africa was carried out by comparing time series based on those entries with instrumental rainfall data available for the same time and region. Quality control in the final seven-class combined instrumental-historical reconstruction was provided by comparing the spread of estimates from the various sources. If more than a two-class spread existed among the entries for an individual region and year, each of those entries was re-evaluated. In most, it was found that an error was made in determining the location or year of a piece of documentary evidence. Only eight “conflicts” in the Nicholson series could not be resolved in this way. The various regional studies in southern Africa employ a simpler approach, using short periods of overlap with available instrumental data for qualitative cross-checking/validation purposes (e.g. Nash and Endfield, 2002; Kelso and Vogel, 2007; Nash and Grab, 2010; Nash et al., 2016).
The content analysis method developed for North American historical climatology uses replication by other researchers to test the reliability of the quantification process and compared results from multiple independent sources to test validity (Baron, 1980, pp. 150–170). Subsequent studies have elaborated on this method, but many also draw on the Pfister index approach as summarised in Sect. 8.1. For South America, Neukom et al. (2009) created “pseudo-documentary” series to quantify the relationship between document-derived precipitation indices and instrumental data (see also Mann and Rutherford, 2002; Pauling et al., 2003; Xoplaki et al., 2005; Küttel et al., 2007). Following European conventions, index series were transformed to instrumental units by linear regression with overlapping instrumental data. The skill measures were quantified based on two calibration/verification intervals, using the first and second half of the overlap periods as calibration and verification period respectively and vice versa (Neukom et al., 2009). A similar approach has been used in southern Africa to integrate documentary-derived index series with other annually resolved proxy data for the 19th century as part of multiproxy rainfall reconstructions (Neukom et al., 2014a; Nash et al., 2016).
Calibration and verification of indices in Australia (Fig. 12) have been conducted using overlapping and largely independent instrumental data products, similar to approaches used in African reconstructions. In an example of good practice for future studies, independent high-resolution palaeoclimate reconstructions and records of water availability, such as lake levels, were also used for verification (Gergis and Ashcroft, 2013). Disagreements between these different sources were examined closely and often attributed to spatial variability in individual sources. For example, the 1820s in southeastern Australia were identified as wetter than average in a regional palaeoclimate reconstruction (Gergis et al., 2012), but drier than average in a documentary-derived index and in historical information about water levels in Lake George, New South Wales (Gergis and Ashcroft, 2013). This was put down to geographical differences between the datasets – the palaeoclimate reconstruction was biased towards rainfall variability in southern parts of southeastern Australia whereas the lake records and documentary index represented the east.
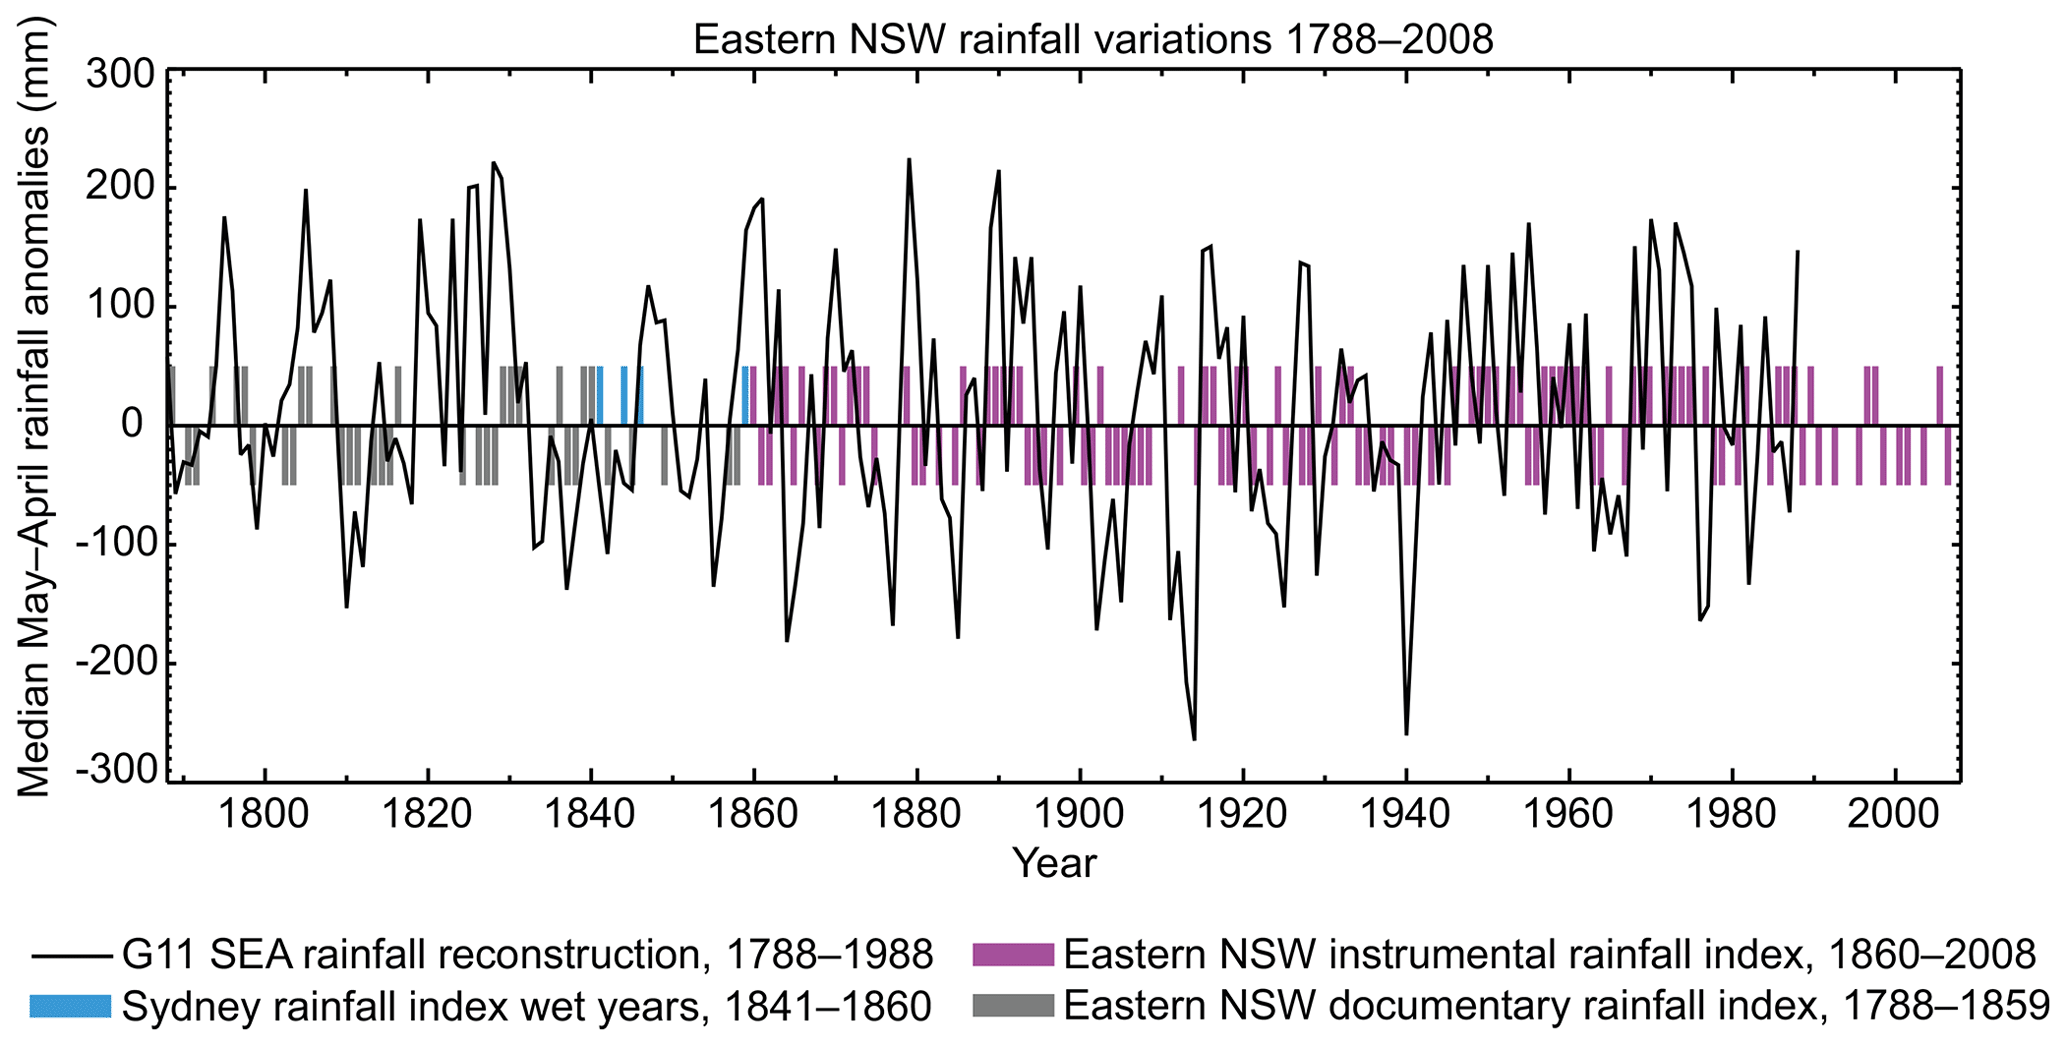
Figure 12Wet and dry years for eastern New South Wales (Australia) identified using the nine-station network (1860–2008 CE, purple) and a documentary index (1788–1860 CE, grey). The median rainfall reconstruction (1788–1988) from Gergis et al. (2012) is also plotted as anomalies (mm) relative to a 1900–1988 base period. Note that 1841, 1844, 1846, and 1859 have been classified as wet, in accordance with a rainfall index derived from observations in the Sydney region (blue). Adapted from Gergis and Ashcroft (2013).
It is a long-standing best practice in marine historical climatology to verify weather observations by comparing different kinds of documentary evidence or alternative different examples of the same evidence (e.g. multiple logbooks in the same fleet). Despite the very real challenges of interpreting measurements even in logbooks, there are indications that reconstructions that use these sources are reliable. There appears to be a high consistency and homogeneity both within wind measurements derived entirely from ships' logbooks, and between such measurements and data obtained from diverse sources that register the marine climate. Therefore, researchers have linked documentary weather observations in, for example, the CLIWOC database, with datasets that homogenise and synthesise evidence from both textual and natural proxies, such as the National Oceanic and Atmospheric Administration's International Comprehensive Ocean-Atmosphere Data Set (ICOADS) (Jones and Salmon, 2005; Barriopedro et al., 2014).
9.2 Reporting confidence and uncertainty in index-based climate series
Two forms of uncertainty are encountered when developing index-based climate series: (i) uncertainties related to the compilation of the index series themselves from documentary evidence and (ii) uncertainties within any resulting index-based climate reconstruction. The first form of uncertainty relates mainly to the nature of information contained within specific source types. A detailed discussion is beyond the scope of this review. However, where indices are compiled from a unique documentary source – such as a private diary or diaries (e.g. Brázdil et al., 2008; Adamson, 2015; Domínguez-Castro et al., 2015), a series of correspondence (e.g. Rodrigo et al., 1998; Nash and Endfield, 2002; Fernández-Fernández et al., 2014) or a series of acts of municipal and ecclesiastical institutions for a location (e.g. Barriendos, 1997; Domínguez-Castro et al., 2018) – it is easier to identify and correct unexpected bias or homogeneity problems. Other index series draw together information from many different documentary sources (e.g. Camuffo et al., 2010; Nash and Grab, 2010; Fenby and Gergis, 2013; Brázdil et al., 2016), allowing the analysis of longer periods or larger regions but at the risk of incorporating non-homogeneities. Methodological differences – for example in the way in which “0 index” values are derived (see Sect. 8) – may also mask uncertainties introduced by data gaps.
While compiling this review, it became apparent that relatively few index-based climate series provide an assessment of the degree of uncertainty in the compilation of their indices – in effect, something akin to the error bars used in quantitative climate reconstructions (e.g. Dobrovolný et al., 2010). Further, very few studies report directly on potential biases in their series due to the well-known tendency for documentary evidence to better record extreme events. The incorporation of statistical error is achievable where index-based series have been subject to full calibration and verification (Sect. 9.1). However, it is less straightforward for climate reconstructions in regions (or for time periods) where a lack of overlapping instrumental data renders full calibration impossible.
To overcome this issue, Australian studies include some assessment of confidence by showing details of the number of sources in agreement as well as the proportion of the study regions affected (see Fenby and Gergis, 2013). Independent high-resolution palaeoclimate and historical records were also used to verify each year of the reconstruction to assess confidence in the results (Fenby and Gergis, 2013; Gergis and Ashcroft, 2013).
One innovation from African historical climatology is the introduction by Clare Kelso and Coleen Vogel (2007) of a qualitative three-point “confidence rating” (CR) for the classification of each rainy season in their climate history of Namaqualand (South Africa). The rating for each season (Fig. 13) was derived from the number of sources consulted combined with the number of references to that particular climatological condition. A CR of 1 was awarded where there was only one source referring to the climatic condition. In contrast, years awarded a CR of 3 were those that had more than three date- and place-specific references describing climatic conditions. This approach has been adopted in subsequent studies in southern Africa by Nash et al. (2016, 2018) and Grab and Zumthurm (2018), with slight variations in the criteria used to award specific ratings according to source density.
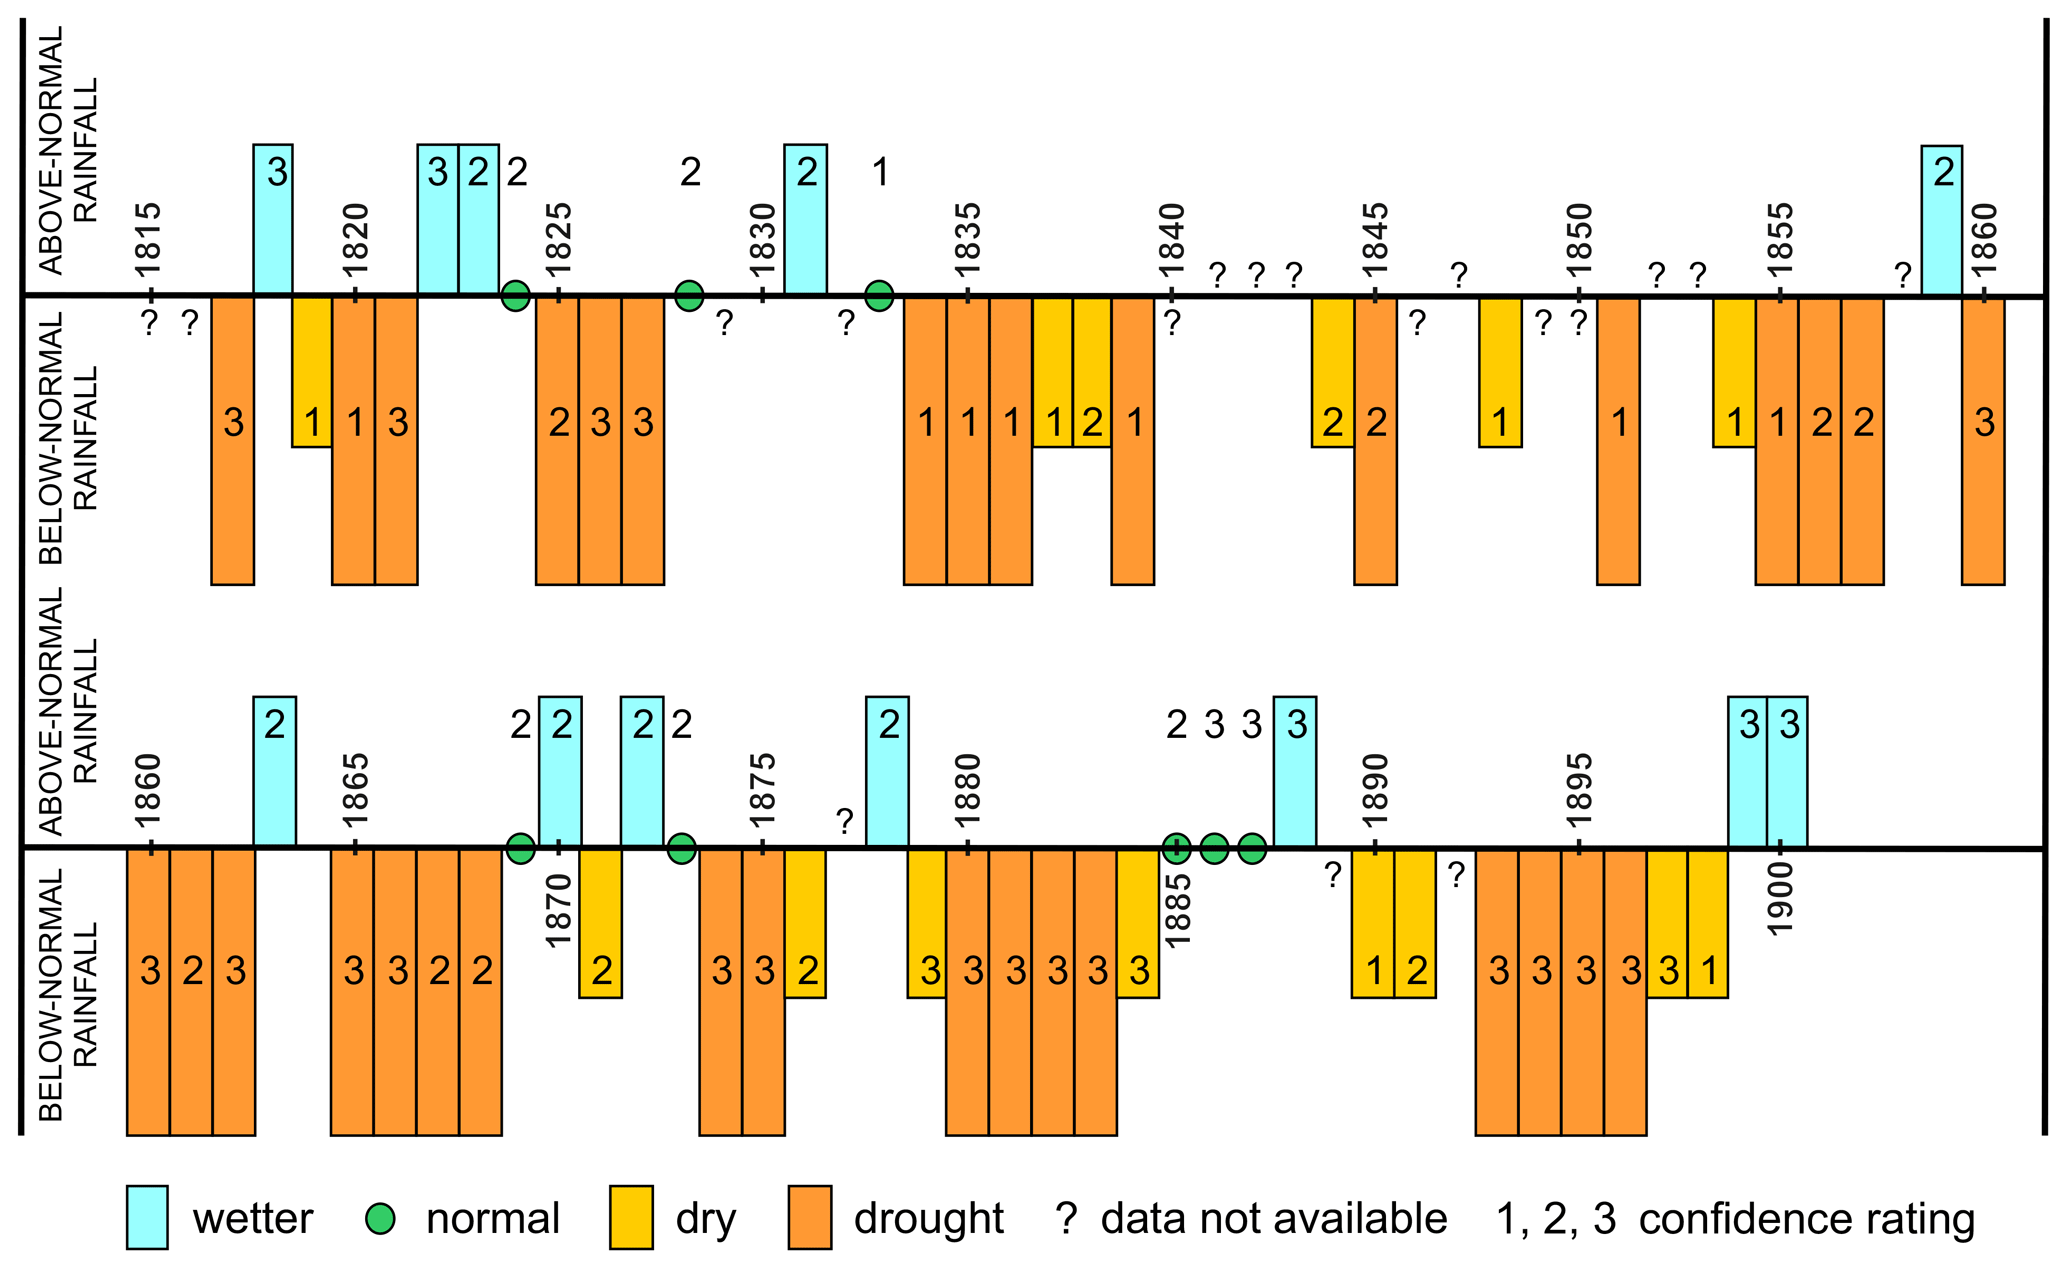
Figure 13Five-point index of rainfall variability in Namaqualand (South Africa) during the 1800s, including the first use of confidence ratings in relation to annual classifications in a documentary-derived index series (1 denotes low confidence and 3 denotes high confidence). Data from Kelso and Vogel (2007).
A similar approach was adopted by Quinn et al. (1987) and Quinn and Neal (1992) in their development of El Niño indices for Peru. El Niño events with a confidence rating of 1 were those that lacked a source reference or informational basis; these were not incorporated into the final list of reconstructed events. A CR of 2 was awarded when an event was based on limited or circumstantial evidence; a CR of 3 was awarded when additional information was needed to confirm the time of occurrence or intensity of an event; a CR of 4 was awarded when the occurrence time and intensity information was generally satisfactory, but additional evidence was needed to confirm the spatial extent of the event; and a CR of 5 was awarded when the available information concerning the occurrence and intensity of the event was considered to be satisfactory.
The second form of uncertainty relates specifically to index-based climate reconstruction. Where uncertainties can be quantified (either formally with statistics or less formally by comparison with other reconstructions), index-based reconstructions can be made fully comparable to natural proxy-based quantitative reconstructions. One example of this approach is the central Europe temperature series by Dobrovolný et al. (2010), the only documentary series used as part of the PAGES 2k Consortium (2013) continent-by-continent temperature reconstruction. Calibrated temperature series from China, including Zhang (1980) and R. S. Wang and Wang (1990), are also incorporated into the PAGES 2k Consortium (2017) community-sourced database of temperature-sensitive proxy records.
10.1 Regional variations in the development and application of climate indices
This review has shown that there are multiple approaches globally to the development and application of indices for historical climate reconstruction. Returning to the themes identified in the introduction, three categories of variability can be recognised. First, there is variability in the types of climate phenomena reconstructed in different regions (Table 5). Studies of the historical climatology of Europe and Asia span the greatest range of climate phenomena. This is partly a product of the range of climate zones present in these continents and, therefore, the diversity of weather phenomena to which observers might be exposed and document. However, it also reflects the relative abundance of documentary materials available for analysis and the richness of the climate-related information they contain. Where smaller volumes of documentary evidence are available, reconstructions naturally tend to be skewed towards the climate parameters that were of sufficient importance to people that they captured them in writing or as artefacts – hence the emphasis on precipitation reconstructions for Africa and Australia and on winds and storm events over the oceans.
Table 5Types of historical environmental phenomena reconstructed using an index approach in different parts of the world, with a qualitative indication of the relative emphasis of studies in each region (3 indicates a large number of studies, 1 a small number of studies, and “–” indicates no studies).

Second, there is variability in the way that historical evidence is treated to develop individual index series. Such variability arises, in part, from the extent to which analytical methods have developed independently. Thus, approaches to index-based climate reconstruction in parts of Asia are very different to those used in Europe. Chains of influence in practice can also be identified with, for example, elements of the “Pfister method” from Europe being adopted by regional studies in southern Africa from the 1980s and then feeding into more recent precipitation reconstructions in Australia. There are common features of most historical treatments, regardless of tradition. These include the use of key descriptors or indicator criteria to match either individual observations (e.g. the continent-wide precipitation series for Africa developed by Nicholson) or sets of monthly, seasonal, or annual observations (as per the Pfister method) to specific index classes. Most reconstructions are ordinal but, particularly where long runs of overlapping instrumental data are available, many are grounded in statistical distributions and present semi- or fully quantified climate series.
The final source of variability across index-based investigations is in the number of index points used in individual reconstructions. A snapshot of this variability can be seen from investigations in Europe (Table 6). While most index-based reconstructions of European temperature and precipitation published since the 1990s employ the seven-point Pfister approach, some use up to nine classes. The number of classes used in European flood and drought reconstruction is usually smaller but, even here, may extend to seven-point classifications. There are also some commonalities. For example, most temperature and precipitation reconstructions use an odd number of classes – to allow the mid-point of the reconstruction to reflect “normal” conditions – whereas open-ended unidirectional climate-related phenomena such as droughts and floods may be classified using either an even or odd number of classes. Similar patterns can be seen in other parts of the world (Table 7). In the rare instances where authors justify the number of index categories they use, most point to limitations in the quantity and/or richness of the historical evidence available for reconstruction as the reason for a smaller number of index categories.
Table 6Variability in the number of index classes used in index-based historical climate reconstructions across Europe.
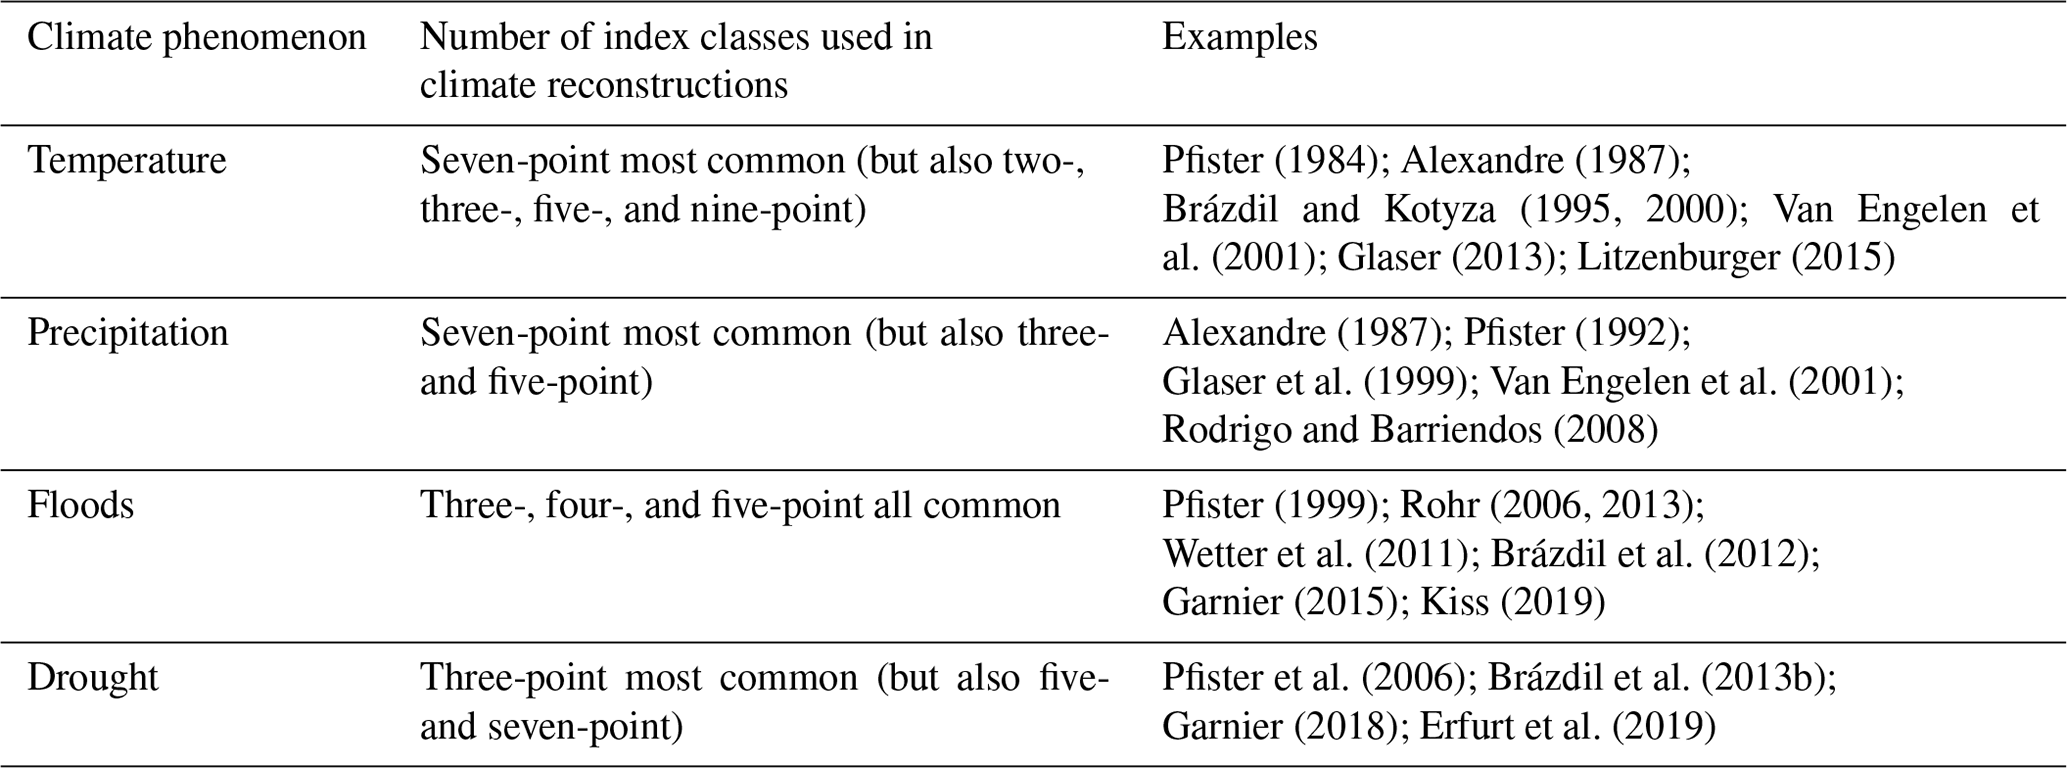
Table 7Variability in the number of index classes used in index-based historical climate reconstructions in Africa, the Americas, Asia, Australia, and over the oceans.

10.2 Guidelines for generating future documentary-based indices
The diversity of practice revealed in this review raises two issues. First, different approaches to index development make it harder for climate historians and historical climatologists working in different parts of the world to compare their climate indices directly, as each will include indices with differing climatological boundaries. Second, they make it harder for (palaeo)climatologists to use the resulting time series in synthesis and modelling studies without recourse to the methodology used in each original study. As noted in Sect. 9.2, fully calibrated series have been included within global climate compilations such as the PAGES 2k Consortium (2013, 2017) temperature syntheses. Non-calibrated index series have also been incorporated into multi-proxy reconstructions using the “Pseudo proxy” approach of Mann and Rutherford (2002) – see, for example, Neukom et al. (2014a, b) – but these types of reconstruction are relatively rare.
Having a standard approach to index-based climate reconstruction would clearly have its benefits. However, we recognise that a one-size-fits-all approach is neither appropriate for all climate phenomena nor for all source types. The reconstruction of historical wind patterns over the oceans from ships' logbooks and the identification of precipitation variability through the analysis of descriptions of rogation ceremonies, for example, already have well-developed methodologies and protocols. We further recognise that the most widely used approaches such as the Pfister method would require modification to be useful for temperature and/or rainfall reconstruction in all regions, as climates with strong seasonality may not have documentary evidence available year-round. Their use would, in some areas, also override the legacy of decades of methodological effort and require the reanalysis of enormous volumes of documentary evidence.
Rather than suggest a prescriptive method, we instead offer a series of guidelines as best practice for generating indices from collections of historical evidence. The guidelines are of greatest relevance to index-based reconstructions of temperature and precipitation from multiple source types but also have resonance for other climate phenomena (e.g. winter severity) and for many single source types (e.g. annals, chronicles, letters, diaries/journals, newspapers). The guidelines are based, in part, on the excellent reviews by Brázdil et al. (2010) and Pfister et al. (2018) but also incorporate insights from this study:
-
Researchers should be familiar with the climatology of their study region, as this may influence the temporal distribution of documentary evidence. Indices should, ideally, be based on collections of historical records that overlap with a climatically homogenous region with respect to the phenomena to be reconstructed.
-
Researchers should be familiar with the strengths and weaknesses of each of their historical sources prior to their use in climate reconstruction.
-
Researchers should select an appropriate temporal resolution for their index series according to the quantity, quality, and richness (in terms of climate information) of available historical sources. This may be monthly, seasonal, annual, or longer. For information-rich areas, a monthly resolution is optimal as it offers the greatest potential for comparison with early instrumental series (which may be published as monthly averages prior to the wider availability of daily data) and the greatest flexibility for comparison with more coarsely resolved sources, such as palaeoclimate reconstructions. For regions with marked variations in the quantity and quality of climate information across the year, the choice of resolution may be dictated by the length of period during the year when information is most sparse.
-
Whether a three-, five-, or seven- (or more) point index series should be developed may also be influenced by the legacy of previous studies in a region if direct comparisons are required; however, following guideline 3, researchers should only generate series with higher numbers of index classes if source density and richness permit.
-
Transforming the information in historical documents to numbers on a scale requires a high degree of expertise to minimise subjectivity and should, ideally, be undertaken by experienced researchers with a good knowledge of the climate of a region and an understanding of the language of the time period in which sources were written.
-
Historical records should ideally be sorted chronologically prior to analysis, with indices developed in a stepwise manner. Pfister et al. (2018, p. 120) recommend that indexing begin with the most recent period (a process referred to by Brázdil et al., 2010, as “hind-casting”), which for most studies will also be the period with the greatest volume of documentary evidence. This allows researchers to become familiar with the vagaries of their evidence during well-documented periods before working backwards to periods where information may be less complete.
-
For regions and periods where large volumes of historical information are available, indices should always be generated using evidence from more than one independent contemporary observer or record. If weather in a region is documented within a single contemporary record, appropriate levels of uncertainty should be noted in the final reconstruction (see Pfister et al., 2018).
-
It is advisable to sum up index series – either in time (i.e. from monthly to seasonal or annual) or in space (i.e. by combining several index series from a climatologically homogeneous region). Careful assessment is needed, however, to avoid any loss of information during the process of summation, particularly for extreme events (see Sect. 8.1). Potential seasonal biases within documentary sources should also be considered as these will influence annual totals.
-
Where possible, index series should be developed independently from the same set of historical sources by more than one researcher to minimise subjectivity. The final index series for southeast Africa produced by Nash et al. (2016), for example, was first developed independently by two members of the research team who then met to agree the final series.
-
To maximise their wider usefulness, index series should, ideally, overlap with runs of local or regional instrumental data to permit calibration and verification. Where instrumental data are not available, overlaps with independent high-resolution palaeoclimate records may be useful for comparison and testing, noting that palaeoclimate records may have their own biases.
-
If fully calibrated, statistical measures of error should be incorporated into the presentation of any reconstruction.
-
Where insufficient overlapping instrumental data are available to permit full calibration and verification, some form of “confidence rating” (see Sect. 9.2 and Kelso and Vogel, 2007) should be incorporated into the presentation of any reconstruction.
-
Finally, as Pfister et al. (2018, p. 121) identify, the purpose and process of index development should be “fully transparent and open to critical evaluation”, with the method of index development described in detail and a source-critical evaluation of the underlying evidence included.
Vast collections of documentary evidence from all parts of the globe remain that have yet to be explored for information about past climate. We hope that, if such collections are scrutinised following these guidelines, they will lead to index-based reconstructions of climate variability that can be used to both extend climate records and contextualise studies of climate–society relationships to the wider benefit of humankind.
This paper is dedicated to the memory of María del Rosario Prieto, a pioneer in historical climatology and active promoter of climate history studies in South America, who sadly passed away in 2020 during the preparation of the first draft of this paper. Rest in peace, María.
No new data were created during the compilation of this review article.
DJN, MB, CC, and TL conceived the original study. The overall paper development, compilation, and editing was led by DJN. All authors contributed to the writing of the first draft of the paper and to the preparation of the final article. DJN led the writing of Sects. 1, 4, 8.3, 9, and 10; MB, CC, and TL of Sects. 2 and 8.1; KHEL, GCDA, and QP of Sects. 3 and 8.2; MdRP, FR, and SW of Sects. 5 and 8.4; LA and JG of Sects 6 and 8.5; and DD of Sects. 7 and 8.6.
The authors declare that they have no conflict of interest.
This article is part of the special issue “International methods and comparisons in climate reconstruction and impacts from archives of societies”. It is not associated with a conference.
The authors would like to thank PAGES (Past Global Changes) for supporting the CRIAS working group meetings in Bern (2018) and Leipzig (2019) that led to the conception and subsequent development of this publication, and Lina Lerch (Leipzig) for help with Japanese climate-historical sources.
The meetings that underpinned this article were supported by PAGES (Past Global Changes). The article processing charges for this open-access publication were covered by the Freigeist Fellowship “The Dantean Anomaly (1309–1321)” (funded by the Volkswagen Foundation) and the Education University of Hong Kong.
This paper was edited by Rudolf Brazdil and reviewed by three anonymous referees.
Academy of Meteorological Science of China Central Meteorological Administration: Yearly Charts of Dryness/Wetness in China for the Last 500 Years, Cartographic Publishing House, Beijing, 1981.
Adamson, G. C. D.: Private diaries as information sources in climate research, WIRES Clim. Change, 6, 599–611, 2015.
Adamson, G. C. D. and Nash, D. J.: Documentary reconstruction of monsoon rainfall variability over western India, 1781–1860, Clim. Dynam., 42, 749–769, 2014.
Adamson, G. C. D. and Nash, D. J.: Climate history of Asia (excluding China), in: The Palgrave Handbook of Climate History, edited by: White, S., Pfister, C., and Mauelshagen, F., Palgrave Macmillan, London, 203–211, 2018.
Alcoforado, M. J., Nunes, M. D., Garcia, J. C., and Taborda, J. P.: Temperature and precipitation reconstruction in southern Portugal during the late Maunder Minimum (AD 1675–1715), Holocene, 10, 333–340, 2000.
Alexandre, P.: Le climat en Europe au moyen âge: contribution à l'histoire des variations climatiques de 1000 à 1425, d'après les narratives de l'Europe Occidentale, Recherches d'histoire et de sciences sociales 24, Éditions de l'École des hautes études en sciences sociales, Paris, 1987.
Allan, R. J., Endfield, G. H., Damodaran, V., Adamson, G. C. D., Hannaford, M. J., Carroll, F., MacDonald, N., Groom, N., Jones, J., Williamson, F., Hendy, E., Holper, P., Arroyo-Mora, J. P., Hughes, L., Bickers, R., and Bliuc, A. M.: Toward integrated historical climate research: the example of Atmospheric Circulation Reconstructions over the Earth, WIRES Clim. Change, 7, 164–174, 2016.
Álvarez Vázquez, J. A.: Drought and rainy periods in the Province of Zamora in the 17th, 18th, and 19th centuries, in: Quaternary Climate in Western Mediterranean, edited by: López-Vera, F., Universidad Autonoma de Madrid, Madrid, 221–233, 1986.
Aono, Y. and Kazui, K.: Phenological data series of cherry tree flowering in Kyoto, Japan, and its application to reconstruction of springtime temperatures since the 9th century, Int. J. Climatol., 28, 905–914, 2008.
Aono, Y. and Saito, S.: Clarifying springtime temperature reconstructions of the medieval period by gap-filling the cherry blossom phenological data series at Kyoto, Japan, Int. J. Biometeorol., 54, 211–219, 2010.
Ashcroft, L., Gergis, J., and Karoly, D. J.: A historical climate dataset for southeastern Australia, 1788–1859, Geosci. Data J., 1, 158–178, 2014a.
Ashcroft, L., Karoly, D. J., and Gergis, J.: Southeastern Australian climate variability 1860–2009: a multivariate analysis, Int. J. Climatol., 34, 1928–1944, 2014b.
Ashcroft, L., Karoly, D. J., and Dowdy, A. J.: Historical extreme rainfall events in southeastern Australia, Weather and Climate Extremes, 25, 100210, https://doi.org/10.1016/j.wace.2019.100210, 2019.
Baron, W. R.: Tempests, Freshets and Mackerel Skies; Climatological Data from Diaries Using Content Analysis, Unpublished PhD thesis, University of Maine at Orono, Orono ME, USA, 1980.
Baron, W. R.: The reconstruction of 18th-century temperature records through the use of content-analysis, Climatic Change, 4, 384–398, 1982.
Baron, W. R.: Retrieving American climate history – a bibliographic essay, Agricultural History, 63, 7–35, 1989.
Baron, W. R.: Historical climate records from the northeastern United States, 1640 to 1900, in: Climate since A.D. 1500, edited by: Bradley, R. S. and Jones, P. D., Routledge, London, 74–91, 1995.
Baron, W. R., Gordon, G. A., Borns, H. W., and Smith, D. C.: Frost-free record reconstruction for eastern Massachusetts, 1733–1980, J. Clim. Appl. Meteorol., 23, 317–319, 1984.
Barrett, H. G.: El Niño Southern Oscillation from the pre-instrumental era: Development of logbook-based reconstructions; and evaluation of multi-proxy reconstructions and climate model simulations, Unpublished PhD thesis, University of Sheffield, Sheffield, UK, 2017.
Barrett, H. G., Jones, J. M., and Bigg, G. R.: Reconstructing El Nino Southern Oscillation using data from ships' logbooks, 1815–1854. Part II: Comparisons with existing ENSO reconstructions and implications for reconstructing ENSO diversity, Clim. Dynam., 50, 3131–3152, 2018.
Barriendos, M.: Climatic variations in the Iberian Peninsula during the late Maunder Minimum (AD 1675–1715): An analysis of data from rogation ceremonies, Holocene, 7, 105–111, 1997.
Barriendos, M.: Climate and culture in Spain. Religious responses to extreme climatic events in the Hispanic Kingdoms (16th–19th Centuries), in: Cultural Consequences of the Little Ice Age, edited by: Behringer, W., Lehmann, H., and Pfister, C., Vandenhoeck and Ruprecht, Göttingen, 379–414, 2005.
Barriendos, M.: Climate change in the Iberian Peninsula: Indicator of rogation ceremonies (16th–19th centuries), Revue d'Histoire Moderne et Contemporaine, 57, 131–159, 2010.
Barriopedro, D., Gallego, D., Alvarez-Castro, M. C., Garcia-Herrera, R., Wheeler, D., Pena-Ortiz, C., and Barbosa, S. M.: Witnessing North Atlantic westerlies variability from ships' logbooks (1685–2008), Clim. Dynam., 43, 939–955, 2014.
Bauch, M., Labbé, T., Engel, A., and Seifert, P.: A prequel to the Dantean Anomaly: the precipitation seesaw and droughts of 1302 to 1307 in Europe, Clim. Past, 16, 2343–2358, https://doi.org/10.5194/cp-16-2343-2020, 2020.
Bogolepov, M. A.: Climate fluctuations in European Russia in the historical age, Geology, Kushnerev and Co., Moscow, 1907.
Bogolepov, M. A.: Climate fluctuations in Western Europe from 1000 to the year 1500, Geology, Kushnerev and Co., Moscow, 1908.
Bogolepov, M. A.: Climate fluctuations and history, Kushnerev and Co., Moscow, 1911.
Bokwa, A., Limanówka, D., and Wibig, J.: Pre-instrumental weather observations in Poland in the 16th and 17th century, in: History and Climate, edited by: Jones, P. D., Springer, Boston, 9–27, 2001.
Borisenkov, E. P. (Ed.): Climate fluctuations over the past millennium, Gidrometeoizdat, Leningrad, 1988.
Borisenkov, E. P. and Paseckij, V. M.: Extreme natural phenomena in the Russian chronicles of the 11–17 centuries, Gidrometeoizdat, Leningrad, 1983.
Borisenkov, E. P. and Paseckij, V. M.: Millennial chronicle of extraordinary natural phenomena, Mysl', Moscow, 1988.
Bothe, O., Wagner, S., and Zorita, E.: Inconsistencies between observed, reconstructed, and simulated precipitation indices for England since the year 1650 CE, Clim. Past, 15, 307–334, https://doi.org/10.5194/cp-15-307-2019, 2019.
Bozherianov, I. N.: Starving of the Russian nations from 1024 to year 1906, Gannibal, Saint Petersburg, 1907.
Bravo-Paredes, N., Gallego, M. C., Domínguez-Castro, F., García, J. A., and Vaquero, J. M.: Pro-pluvia rogation ceremonies in Extremadura (Spain): Are they a good proxy of winter NAO?, Atmosphere, 11, 282, https://doi.org/10.3390/atmos11030282, 2020.
Brázdil, R. and Kotyza, O.: History of Weather and Climate in the Czech Lands I. Period 1000–1500, Zürcher Geographische Schriften, 62, Zürich, 1995.
Brázdil, R. and Kotyza, O.: History of Weather and Climate in the Czech Lands II. Utilisation of Economic Sources for the Study of Climate Fluctuation in the Louny Region in the Fifteenth-Seventeenth Centuries, Masaryk University, Brno, 2000.
Brázdil, R., Glaser, R., Pfister, C., Dobrovolný, P., Antoine, J. M., Barriendos, M., Camuffo, D., Deutsch, M., Enzi, S., Guidoboni, E., Kotyza, O., and Rodrigo, F. S.: Flood events of selected European rivers in the sixteenth century, Climatic Change, 43, 239–285, 1999.
Brázdil, R., Pfister, C., Wanner, H., von Storch, H., and Luterbacher, J.: Historical climatology in Europe – the state of the art, Climatic Change, 70, 363–430, 2005.
Brázdil, R., Černušák, T., and Řezníčková, L.: Weather information in the diaries of the Premonstratensian Abbey at Hradisko, in the Czech Republic, 1693–1783, Weather, 63, 201–207, 2008.
Brázdil, R., Dobrovolný, P., Luterbacher, J., Moberg, A., Pfister, C., Wheeler, D., and Zorita, E.: European climate of the past 500 years: new challenges for historical climatology, Climatic Change, 101, 7–40, 2010.
Brázdil, R., Kundzewicz, Z. W., Benito, G., Demarée, G., MacDonald, N., and Roald, L. A.: Historical floods in Europe in the past millennium, in: Changes in Flood Risk in Europe, edited by: Kundzewicz, Z. W., IAHS Press, Wallingford, 121–166, 2012.
Brázdil, R., Kotyza, O., Dobrovolný, P., Řezníčková, L., and Valášek, H.: Climate of the Sixteenth Century in the Czech Lands (History of Weather and Climate in the Czech Lands 10), Masaryk University, Brno, 2013a.
Brázdil, R., Dobrovolný, P., Trnka, M., Kotyza, O., Řezníčková, L., Valášek, H., Zahradníček, P., and Štěpánek, P.: Droughts in the Czech Lands, 1090–2012 AD, Clim. Past, 9, 1985–2002, https://doi.org/10.5194/cp-9-1985-2013, 2013b.
Brázdil, R., Dobrovolný, P., Trnka, M., Büntgen, U., Řezníčková, L., Kotyza, O., Valášek, H., and Štěpánek, P.: Documentary and instrumental-based drought indices for the Czech Lands back to AD 1501, Clim. Res., 70, 103–117, 2016.
Brázdil, R., Kiss, A., Luterbacher, J., Nash, D. J., and Řezníčková, L.: Documentary data and the study of past droughts: a global state of the art, Clim. Past, 14, 1915–1960, https://doi.org/10.5194/cp-14-1915-2018, 2018.
Brönnimann, S., Pfister, C., and White, S.: Archives of nature and archives of society, in: The Palgrave Handbook of Climate History, edited by: White, S., Pfister, C., and Mauelshagen, F., Palgrave Macmillan, London, 27–36, 2018.
Brönnimann, S., Martius, O., Rohr, C., Bresch, D. N., and Lin, K.-H. E.: Historical weather data for climate risk assessment, Ann. NY Acad. Sci., 1436, 121–137, 2019.
Brooks, C. E. P.: Climate through the ages, 2nd revised edition, Ernest Benn Ltd, London, 1949.
Burchinskij, I. E.: On the climate of the past of the Russian Plain, Gidrometeoizdat, Leningrad, 1957.
Callaghan, J. and Helman, P.: Severe Storms on the East Coast of Australia, 1770–2008, Griffith Centre for Coastal Management, Griffith University, Southport, 2008.
Callaghan, J. and Power, S. B.: Variability and decline in the number of severe tropical cyclones making land-fall over eastern Australia since the late nineteenth century, Clim. Dynam., 37, 647–662, 2011.
Callaghan, J. and Power, S. B.: Major coastal flooding in southeastern Australia 1860–2012, associated deaths and weather systems, Aust. Meteorol. Ocean., 64, 183–214, 2014.
Camenisch, C.: Endless cold: a seasonal reconstruction of temperature and precipitation in the Burgundian Low Countries during the 15th century based on documentary evidence, Clim. Past, 11, 1049–1066, https://doi.org/10.5194/cp-11-1049-2015, 2015a.
Camenisch, C.: Endlose Kälte: Witterungsverlauf und Getreidepreise in den Burgundischen Niederlanden im 15. Jahrhundert, Wirtschafts-, Sozial- und Umweltgeschichte 5, Schwabe, Basel, 2015b.
Camenisch, C. and Salvisberg, M.: Droughts in Bern and Rouen from the 14th to the beginning of the 18th century derived from documentary evidence, Clim. Past, 16, 2173–2182, https://doi.org/10.5194/cp-16-2173-2020, 2020.
Camuffo, D., Bertolin, C., Barriendos, M., Domínguez-Castro, F., Cocheo, C., Enzi, S., Sghedoni, M., della Valle, A., Garnier, E., Alcoforado, M. J., Xoplaki, E., Luterbacher, J., Diodato, N., Maugeri, M., Nunes, M. F., and Rodriguez, R.: 500-year temperature reconstruction in the Mediterranean Basin by means of documentary data and instrumental observations, Climatic Change, 101, 169–199, 2010.
Castorena, G., Sánchez Mora, E., Florescano, E., Padillo Ríos, G., and Rodríguez Viqueira, L.: Análisis histórico de las sequías en México Documentación de la Comisión del Plan Nacional Hidráulico, Secretaría de Agricultura y Recursos Hidráulicos (SARH), Comisión del Plan Nacional Hidráulico, Mexico, 1980.
Catchpole, A. J. W.: Hudson's Bay Company ships' log-books as sources of sea ice data, 1751–1870, in: Climate since A.D. 1500, edited by: Bradley, R. S. and Jones, P. D., Routledge, London, 17–39, 1995.
Catchpole, A. J. W. and Faurer, M. A.: Summer sea ice severity in Hudson Strait, 1751–1870, Climatic Change, 5, 115–139, 1983.
Catchpole, A. J. W. and Halpin, J.: Measuring summer sea ice severity in Eastern Hudson Bay, 1751–1870, Can. Geogr., 31, 233–244, 1987.
Catchpole, A. J. W. and Hanuta, I.: Severe summer sea ice in Hudson Strait and Hudson Bay following major volcanic eruptions, 1751–1889 A.D., Climatic Change, 14, 61–79, 1989.
Catchpole, A. J. W., Moodie, D. W., and Kaye, B.: Content analysis: A method for the identification of dates of first freezing and first breaking from descriptive accounts, Prof. Geogr., 22, 252–257, 1970.
Central Meteorological Bureau of China: Atlas of Drought and Flood Distribution in China over the Last 500 Years, China Cartographic Publishing House, Beijing, 1981.
Chen, H.-F., Liu, Y.-C., Chiang, C.-W., Liu, X., Chou, Y.-M., and Pan, H.-J.: China's historical record when searching for tropical cyclones corresponding to Intertropical Convergence Zone (ITCZ) shifts over the past 2 kyr, Clim. Past, 15, 279–289, https://doi.org/10.5194/cp-15-279-2019, 2019.
Chen, J. Q. and Shi, Y. F.: The comparison between 1000-yr winter temperature change in the Yangtze river delta and ice core record of Guliya, Journal of Glaciology and Geocryology, 24, 32–39, 2002.
Chenoweth, M.: A reassessment of historical Atlantic basin tropical cyclone activity, 1700–1855, Climatic Change, 76, 169–240, 2006.
Chenoweth, M. and Divine, D.: A document-based 318-year record of tropical cyclones in the Lesser Antilles, 1690–2007, Geochem. Geophy. Geosy., 9, Q08013, https://doi.org/10.1029/2008GC002066, 2008.
Chinese Academy of Social Science: The history of natural disasters and agriculture in each dynasty of China, Agriculture Press, Beijing, 1988.
Cook, E. R., Briffa, K. R., and Jones, P. D.: Spatial regression methods in dendroclimatology – a review and comparison of two techniques, Int. J. Climatol., 14, 379–402, 1994.
Degroot, D.: “Never such weather known in these seas”: Climatic fluctuations and the Anglo-Dutch wars of the seventeenth century, 1652–1674, Environment and History, 20, 239–273, 2014.
Degroot, D.: Testing the limits of climate history: The quest for a northeast passage during the Little Ice Age, 1594–1597, J. Interdiscipl. Hist., 45, 459–484, 2015.
Degroot, D.: The Frigid Golden Age: Climate Change, the Little Ice Age, and the Dutch Republic, 1560–1720, Cambridge University Press, New York, USA, 2018.
Degroot, D.: War of the whales: Climate change, weather and Arctic conflict in the early seventeenth century, Environment and History, 26, 549–577, 2020.
Degroot, D. and Ottens, S.: Climatological Database for the World's Oceans, available at: https://www.historicalclimatology.com/cliwoc.html#, last access: 3 June 2021.
de Kraker, A. M. J.: Reconstruction of storm frequency in the North Sea area of the pre-industrial period, 1400–1625 and the connection with reconstructed time series of temperatures, History of Meteorology, 2, 51–69, 2011.
Dobrovolný, P.: Analysis and interpretation: Calibration-verification, in: The Palgrave Handbook of Climate History, edited by: White, S., Pfister, C., and Mauelshagen, F., Palgrave Macmillan, London, 107–113, 2018.
Dobrovolný, P., Brázdil, R., Valášek, H., Kotyza, O., Macková, J., and Halíčková, M.: A standard paleoclimatological approach to temperature reconstruction in historical climatology: an example from the Czech Republic, AD 1718–2007, Int. J. Climatol., 29, 1478–1492, 2009.
Dobrovolný, P., Moberg, A., Brázdil, R., Pfister, C., Glaser, R., Wilson, R., van Engelen, A., Limanówka, D., Kiss, A., Halíčková, M., Macková, J., Riemann, D., Luterbacher, J., and Böhm, R.: Monthly, seasonal and annual temperature reconstructions for Central Europe derived from documentary evidence and instrumental records since AD 1500, Climatic Change, 101, 69–107, 2010.
Dobrovolný, P., Brázdil, R., Trnka, M., Kotyza, O., and Valašek, H.: Precipitation reconstruction for the Czech Lands, AD 1501–2010, Int. J. Climatol., 35, 1–14, 2015.
Domínguez-Castro, F., Santisteban, J. I., Barriendos, M., and Mediavilla, R.: Reconstruction of drought episodes for central Spain from rogation ceremonies recorded at the Toledo Cathedral from 1506 to 1900: A methodological approach, Global Planet. Change, 63, 230–242, 2008.
Domínguez-Castro, F., García-Herrera, R., Ribera, P., and Barriendos, M.: A shift in the spatial pattern of Iberian droughts during the 17th century, Clim. Past, 6, 553–563, https://doi.org/10.5194/cp-6-553-2010, 2010.
Domínguez-Castro, F., Vaquero, J. M., Marin, M., Cruz Gallego, M., and Garcia-Herrera, R.: How useful could Arabic documentary sources be for reconstructing past climate?, Weather, 67, 76–82, 2012a.
Domínguez-Castro, F., Ribera, P., García-Herrera, R., Vaquero, J. M., Barriendos, M., Cuadrat, J. M., and Moreno, J. M.: Assessing extreme droughts in Spain during 1750–1850 from rogation ceremonies, Clim. Past, 8, 705–722, https://doi.org/10.5194/cp-8-705-2012, 2012b.
Domínguez-Castro, F., García-Herrera, R., and Vaquero, J. M.: An early weather diary from Iberia (Lisbon, 1631–1632), Weather, 70, 20–24, 2015.
Domínguez-Castro, F., Garcia-Herrera, R., and Vicente-Serrano, S. M.: Wet and dry extremes in Quito (Ecuador) since the 17th century, Int. J. Climatol., 38, 2006–2014, 2018.
Domínguez-Castro, F., Gallego, M. C., Vaquero, J. M., Herrera, R. G., Pena-Gallardo, M., El Kenawy, A., and Vicente-Serrano, S. M.: Twelve years of daily weather descriptions in North America in the eighteenth century (Mexico City, 1775–86), B. Am. Meteorol. Soc., 100, 1531–1547, 2019.
Easton, C.: Les hivers dans l'Europe occidentale, E. J. Brill, Leiden, Netherlands,, 1928.
Endfield, G. H.: Climate and crisis in eighteenth century Mexico, Mediev. Hist. J., 10, 99–125, 2007.
Endfield, G. H. and Nash, D. J.: Drought, desiccation and discourse: missionary correspondence and nineteenth-century climate change in central southern Africa, Geogr. J., 168, 33–47, 2002.
Erfurt, M., Glaser, R., and Blauhut, V.: Changing impacts and societal responses to drought in southwestern Germany since 1800, Reg. Environ. Change, 19, 2311–2323, https://doi.org/10.1007/s10113-019-01522-7, 2019.
Fang, X., Xiao, L., Ge, Q., and Zheng, J.: Changes of plants phenophases and temperature in spring during 1888–1916 around Changsha and Hengyang in Hunan Province, Quaternary Sciences, 25, 74–79, 2005.
Fei, J., Hu, H., Zhang, Z., and Zhou, J.: Research on dust weather in Beijing during 1860–1898: Inferred from the diary of Tonghe Weng, Journal of Catastrophology (Zaihai Xue), 24, 116–122, 2009.
Fenby, C. D.: Experiencing, understanding and adapting to climate in south-eastern Australia, 1788–1860, unpublished PhD Thesis, School of Earth Sciences and School of Historical and Philosophical Studies, University of Melbourne, Australia, 2012.
Fenby, C. D. and Gergis, J.: Rainfall variations in south-eastern Australia part 1: consolidating evidence from pre-instrumental documentary sources, 1788–1860, Int. J. Climatol., 33, 2956–2972, 2013.
Fernández-Fernández, M. I., Gallego, M. C., Domínguez-Castro, F., Trigo, R. M., Garcia, J. A., Vaquero, J. M., Gonzalez, J. M. M., and Duran, J. C.: The climate in Zafra from 1750 to 1840: history and description of weather observations, Climatic Change, 126, 107–118, 2014.
Fernández-Fernández, M. I., Gallego, M. C., Domínguez-Castro, F., Trigo, R. M., and Vaquero, J. M.: The climate in Zafra from 1750 to 1840: precipitation, Climatic Change, 129, 267–280, 2015.
Fernández-Fernández, M. I., Gallego, M. C., Domínguez-Castro, F., Trigo, R. M., and Vaquero, J. M.: The climate in Zafra from 1750 to 1840: temperature indexes from documentary sources, Climatic Change, 141, 671–684, 2017.
Florescano, E.: Precios del maíz y crisis agrícolas en México, El Colegio de México, Mexico, 1969.
Foley, J. C.: Droughts in Australia: Review of records from earliest years of settlement to 1955, Bulletin No. 43, Bureau of Meteorology, Melbourne, 1957.
Fragoso, M., Carraça, M. D. G., and Alcoforado, M. J.: Droughts in Portugal in the 18th century: A study based on newly found documentary data, Int. J. Climatol., 38, 5522–5541, 2018.
Fujiki, H.: Nihon chūsei kishō saigaishi nenpyōkō [Draft of a Chronological Timeline for the History of Japanese Medieval Catastrophes], Kōshi Shoin, Tokyo, 2007.
Gallego, D., Ordóñez, P., Ribera, P., Peña-Ortiz, C., and García-Herrera, R.: An instrumental index of the West African Monsoon back to the 19th century, Q. J. Roy. Meteor. Soc., 141, 3166–3176, 2015.
Gallego, D., García-Herrera, R., Peña-Ortiz, C., and Ribera, P.: The steady increase of the Australian Summer Monsoon in the last 200 years, Scientific Reports, 7, 16166, https://doi.org/10.1038/s41598-017-16414-1, 2017.
Garcia, R. R., Diaz, H. F., Herrera, R. G., Eischeid, J., Prieto, M. D., Hernandez, E., Gimeno, L., Duran, F. R., and Bascary, A. M.: Atmospheric circulation changes in the tropical Pacific inferred from the voyages of the Manila galleons in the sixteenth-eighteenth centuries, B. Am. Meteorol. Soc., 82, 2435–2455, 2001.
García-Acosta, V., Pérez Zevallos, J. M., and Molina Del Villar, A.: Desastres Agrícolas en México. Catálogo histórico, Tomo I: Épocas prehispánica y colonial (958–1822), Fondo de Cultura Económica (FCE), Centro de Investigaciones y Estudios Superiores en Antropología Social (CIESAS), Mexico, 2003.
García-Herrera, R. and Gallego, D.: Ship logbooks help to understand climate variability. In: Advances in Shipping Data Analysis and Modeling, edited by: Ducruet, C., Routledge, London, 37–51, 2017.
García-Herrera, R., Prieto, L., Gallego, D., Hernández, E., Gimeno, L., Können, G., Koek, F. B., Wheeler, D., Wilkinson, C., Prieto, M. R., Báez, C., and Woodruff, S.: CLIWOC Multilingual Meteorological Dictionary: An English-Spanish-Dutch-French dictionary of wind force terms used by mariners from 1750 to 1850, Koninklijke Nederlands Meteorologisch Instituut, Den Haag, 2003.
García-Herrera, R., Durán, F. R., Wheeler, D., Martín, E. H., Prieto, M. R., and Gimeno, L.: The use of Spanish and British documentary sources in the investigation of Atlantic hurricane incidence in historical times, in: Hurricanes and Typhoons: Past, Present, and Future, edited by: Murnane, R. J. and Liu, K.-B., Columbia University Press, New York, 149–176, 2004.
García-Herrera, R., Gimeno, L., Ribera, P., and Hernandez, E.: New records of Atlantic hurricanes from Spanish documentary sources, J. Geophy. Res.-Atmos., 110, D03109, https://doi.org/10.1029/2004JD005272, 2005a.
García-Herrera, R., Konnen, G. P., Wheeler, D. A., Prieto, M. R., Jones, P. D., and Koek, F. B.: CLIWOC: A climatological database for the world's oceans 1750–1854, Climatic Change, 73, 1–12, 2005b.
García-Herrera, R., Können, G. P., Wheeler, D. A., Prieto, M. R., Jones, P. D., and Koek, F. B.: Ship logbooks help analyze pre-instrumental climate, Eos, Transactions of the American Geophysical Union, 87, 173–180, 2006.
García-Herrera, R., Díaz, H. F., García, R. R., Prieto, M. R., Barriopedro, D., Moyano, R., and Hernández, E.: A chronology of El Niño events from primary documentary sources in Northern Peru, J. Climate, 21, 1948–1962, 2008.
García-Herrera, R., Barriopedro, D., Gallego, D., Mellado-Cano, J., Wheeler, D., and Wilkinson, C.: Understanding weather and climate of the last 300 years from ships' logbooks, WIRES-Clim. Change, 9, e544, https://doi.org/10.1002/wcc.544, 2018.
Garnier, E.: Le renversement des saisons. Climats et sociétés en France (vers 1500 – vers 1850), Mémoire d'étude our l'obtention de l'Habilitation à diriger des recherches, Université de Franche-Comté, Besançon, France, 2009.
Garnier, E.: Bassesses extraordinaires et grandes chaleurs. 500 ans de sécheresses et de chaleurs en France et dans les pays limitrophes, Houille Blanche, 4, 26–42, 2010.
Garnier, E.: At the risk of floodwaters: historical flood risk and its social impacts in the area of the Wash in eastern England (Cambridgeshire, Norfolk, Lincolnshire), mid 17th century – end of the 19th century, Hydrology and Earth System Sciences Discussions, 12, 6541–6573, https://doi.org/10.5194/hessd-12-6541-2015, 2015.
Garnier, E.: Historic drought from archives. Beyond the instrumental record, in: Drought. Science and Policy, edited by: Iglesias, A., Assimacopoulos, D., and Van Lanen, H. A. J., John Wiley & Sons, Hoboken NJ, USA, 45–67, 2018.
Garza, G. M. and Barriendos, M.: El Clima en la historia, Ciencias, 51, 22–25, 1998.
Garza Merodio, G. G.: Frecuencia y duración de sequías en la Cuenca de México de fines del siglo XVI a mediados del XIX, Investigaciones Geográficas, 2002, 106–115, 2002.
Garza Merodio, G. G.: Variabilidad climática en México a través de fuentes documentales (siglos XVI al XIX), UNAM, Instituto de Geografía, Mexico City, Mexico, 2017.
Ge, Q.-S., Zheng, J. Y., Fang, X. Q., Man, Z. M., Zhang, X. Q., Zhang, P. Y., and Wang, W. C.: Winter half-year temperature reconstruction for the middle and lower reaches of the Yellow River and Yangtze River, China, during the past 2000 years, Holocene, 13, 933–940, 2003.
Ge, Q.-S., Zheng, J. Y., Hao, Z. X., Zhang, P. Y., and Wang, W. C.: Reconstruction of historical climate in China – High-resolution precipitation data from Qing dynasty archives, B. Am. Meteorol. Soc., 86, 671–680, 2005.
Ge, Q.-S., Ding, L.-L., and Zheng, J.-Y.: Research on methods of starting date of pre-summer rainy season reconstruction in Fuzhou derived from Yu-Xue-Fen-Cun records, Advances in Earth Science, 26, 1200–1207, 2011.
Ge, Q., Hao, Z., Zheng, J., and Shao, X.: Temperature changes over the past 2000 yr in China and comparison with the Northern Hemisphere, Clim. Past, 9, 1153–1160, https://doi.org/10.5194/cp-9-1153-2013, 2013.
Ge, Q.-S., Hao, Z.-X., Zheng, J.-Y., and Liu, Y.: China: 2000 years of climate reconstruction from historical documents, in: The Palgrave Handbook of Climate History, edited by: White, S., Pfister, C., and Mauelshagen, F., Palgrave Macmillan, London, 189–201, 2018.
Gergis, J. and Ashcroft, L.: Rainfall variations in south-eastern Australia, Part 2: a comparison of documentary, early instrumental and palaeoclimate records, 1788–2008, Int. J. Climatol., 33, 2973–2987, 2013.
Gergis, J., Karoly, D. J., and Allan, R. J.: A climate reconstruction of Sydney Cove, New South Wales, using weather journal and documentary data, 1788–1791, Aust. Meteorol. Ocean., 58, 83–98, 2009.
Gergis, J., Gallant, A., Braganza, K., Karoly, D. J., Allen, K., Cullen, L., D'Arrigo, R. D., Goodwin, I., Grierson, P., and McGregor, S.: On the long-term context of the 1997–2009 “Big Dry” in south-eastern Australia: insights from a 206-year multi-proxy rainfall reconstruction, Climatic Change, 111, 923–944, 2012.
Gergis, J., Ashcroft, L., and Garden, D.: Recent developments in Australian climate history, in: The Palgrave Handbook of Climate History, edited by: White, S., Pfister, C., and Mauelshagen, F., Palgrave Macmillan, London, 237–245, 2018.
Gergis, J., Ashcroft, L., and Whetton, P.: A historical perspective on Australian temperature extremes, Clim. Dynam., 55, 843–868, 2020.
Gil-Guirado, S., Espin-Sanchez, J. A., and Prieto, M. D.: Can we learn from the past? Four hundred years of changes in adaptation to floods and droughts. Measuring the vulnerability in two Hispanic cities, Climatic Change, 139, 183–200, 2016.
Gil-Guirado, S., Gómez-Navarro, J. J., and Montávez, J. P.: The weather behind words – new methodologies for integrated hydrometeorological reconstruction through documentary sources, Clim. Past, 15, 1303–1325, https://doi.org/10.5194/cp-15-1303-2019, 2019.
Gioda, A. and Prieto, M. R.: Histoire des sécheresses andines. Potosí, El Niño et le Petit Âge Glaciaire. La Météorologie, Revue de la Société Météorologique de France, 8, 33–42, 1999.
Gioda, A., Prieto, A. R., and Forenza, A.: Archival climate history survey in the Central Andes (Potosí, 16th–17th Centuries), in: Prace Geograficzne, zeszyt 107, Instytut Geografii UJ, Kraków, 107–112, 2000.
Glaser, R.: Klimageschichte Mitteleuropa. 1000 Jahre Wetter, Klima, Katastrophen, Primus Verlag, Darmstadt, 2001.
Glaser, R.: Klimageschichte Mitteleuropas, 1200 Jahre Wetter, Klima, Katastrophen: Mit Prognosen für das 21 Jahrhundert, 3rd edn., Primus, Darmstadt, 2013.
Glaser, R. and Riemann, D.: A thousand-year record of temperature variations for Germany and Central Europe based on documentary data, J. Quaternary Sci., 24, 437–449, 2009.
Glaser, R. and Stangl, H.: Historical floods in the Dutch Rhine Delta, Nat. Hazards Earth Syst. Sci., 3, 605–613, https://doi.org/10.5194/nhess-3-605-2003, 2003.
Glaser, R. and Stangl, H.: Climate and floods in Central Europe since AD 1000: Data, methods, results and consequences, Surv. Geophys., 25, 485–510, 2004.
Glaser, R., Brazdil, R., Pfister, C., Dobrovolný, P., Vallve, M. B., Bokwa, A., Camuffo, D., Kotyza, O., Limanowka, D., Racz, L., and Rodrigo, F. S.: Seasonal temperature and precipitation fluctuations in selected parts of Europe during the sixteenth century, Climatic Change, 43, 169–200, 1999.
Glaser, R., Rieman, D., Schönbein, J., Barriendos, M., Brázdil, R., Bertolin, C., Camuffo, D., Deutsch, M., Dobrovolný, P., van Engelen, A., Enzi, S., Halickova, M., Koenig, S. J., Kotyza, O., Limanowka, D., Mackova, J., Sghedoni, M., Martin, B., and Himmelsbach, I.: The variability of European floods since AD 1500, Climatic Change, 101, 235–256, 2010.
Gong, G. F. and Hameed, S.: The variation of moisture conditions in China during the last 2000 years, Int. J. Climatol., 11, 271–283, 1991.
Gong, G. F., Zhang, P. Y., and Zhang, J. Y.: A study on the climate of the 18th century of the Lower Changjiang Valley in China, Geographic Research, 2, 20–33, 1983.
Grab, S. W. and Nash, D. J.: Documentary evidence of climate variability during cold seasons in Lesotho, southern Africa, 1833–1900, Clim. Dynam., 34, 473–499, 2010.
Grab, S. W. and Zumthurm, T.: The land and its climate knows no transition, no middle ground, everywhere too much or too little: a documentary-based climate chronology for central Namibia, 1845–1900, Int. J. Climatol., 38, e643–e659, 2018.
Haldon, J., Roberts, N., Izdebski, A., Fleitmann, D., McCormick, M., Cassis, M., Doonan, O., Eastwood, W., Elton, H., Ladstatter, S., Manning, S., Newhard, J., Nicoll, K., Telelis, I., and Xoplaki, E.: The climate and environment of Byzantine Anatolia: Integrating science, history, and archaeology, J. Interdiscipl. Hist., 45, 113–161, 2014.
Hannaford, M. J. and Nash, D. J.: Climate, history, society over the last millennium in southeast Africa, WIRES-Clim. Change, 7, 370–392, 2016.
Hannaford, M. J., Jones, J. M., and Bigg, G. R.: Early-nineteenth-century southern African precipitation reconstructions from ships' logbooks, Holocene, 25, 379–390, 2015.
Hansen, C.: Chinese language, Chinese philosophy, and “Truth”, J. Asian Stud., 44, 491–519, 1985.
Hao, Z.-X., Zheng, J.-Y., Ge, Q.-S., and Wang, W.-C.: Winter temperature variations over the middle and lower reaches of the Yangtze River since 1736 AD, Clim. Past, 8, 1023–1030, https://doi.org/10.5194/cp-8-1023-2012, 2012.
Hao, Z.-X., Yu, Y. Z., Ge, Q.-S., and Zheng, J. Y.: Reconstruction of high-resolution climate data over China from rainfall and snowfall records in the Qing Dynasty, WIRES-Clim. Change, 9, e517, https://doi.org/10.1002/wcc.517, 2018.
Heckmann, M.-L.: Zwischen Weichseldelta, Großer Wildnis und Rigaischem Meerbusen. Ökologische Voraussetzungen für die Landnahme im spätmittelalterlichen Baltikum, in: Von Nowgorod bis London. Studien zu Handel, Wirtschaft und Gesellschaft im mittelalterlichen Europa. Festschrift für Stuarg Jenks zum 60. Geburtstag, edited by: Heckmann, M.-L. and Röhrkasten, J., V&R Unipress, Göttingen, 255–295, 2008.
Heckmann, M.-L.: Wetter und Krieg – im Spiegel erzählender Quellen zu Preußen und dem Baltikum aus dem 13. und 14. Jahrhundert, in: Piśmienność pragmatyczna – Edytorstwo źródełhistorycznych-archiwistyka. Studia ofiarowane Profesorowi Januszowo Tandeckiemu w sześćdziesiątą piątą rocznicę urodzin, edited by: Czaia, R. and Kopińský, K., TNT, Toruń, 191–212, 2015.
Hernández, M. E. and Garza Merodio, G. G.: Rainfall variability in Mexico's Southern Highlands (instrumental and documentary phases), 17th to 21st centuries, in: Environmental quality in the large cities and industrial zones: problems and management. Ecology and hydrometeorology of big cities and industrial zones (Russia-Mexico), Vol. I, Analysis of the environment, edited by: Karlin, N. L. and Shelutko, A. V., Russian State Hydrometeorology, University of St. Petersburg, St. Petersburg, Russia, 94–113, 2010.
Herrera, R., Prieto, M. R., and Rojas, F.: Lluvias, sequías e inundaciones en el Chaco semiárido argentino entre 1580 y 1900, Revista de la Junta de Estudios Históricos de Santa Fe, LXIX, 173–200, 2011.
Hirano, J. and Mikami, T.: Reconstruction of winter climate variations during the 19th century in Japan, Int. J. Climatol., 28, 1423–1434, 2008.
Holmes, D. G. and Lipo, T. A.: Pulse width modulation for power converters: principles and practice, Wiley-IEEE Press, Piscataway NJ, USA, 2003.
Hunt, H. A.: Results of rainfall observations made in Victoria during 1840–1910. Including all available annual rainfall totals from 1,114 stations; together with maps and diagrams, Bureau of Meteorology, Melbourne, 1911.
Hunt, H. A.: Results of rainfall observations made in Queensland including all available annual rainfall totals from 1040 stations for all years of record up to 1913; together with maps and diagrams, Bureau of Meteorology, Melbourne, 1914.
Hunt, H. A.: Results of rainfall observations made in South Australia and the Northern Territory, including all available annual rainfall totals from 829 stations for all years of record up to 1917, with maps and diagrams; also, appendices, presenting monthly and yearly meteorological elements for Adelaide and Darwin, Bureau of Meteorology, Melbourne, 1918.
Ichino, M., Masuda, K., Kitamoto, A., Hirano, J., and Shō, K.: Experience of historical climatology as a material in Digital Humanities, in: Computers and the Humanities Symposium (December 2017), Information Processing Society of Japan, Tokyo, 139–146, 2017.
IJnsen, F. and Schmidt, F. H.: Onderzoek naar het Optreden van Winterweer in Nederland, Scientific report, Royal Netherlands Meteorological Institute, de Bilt, 1974.
Ingram, M. J., Farmer, G., and Wigley, T. M. L.: The use of documentary sources for the study of past climates, in: Climate and History: Studies in Past Climates and their Impact on Man, edited by: Wigley, T. M. L., Ingram, M. J., and Farmer, G., Cambridge University Press, Cambridge, UK, 180–213, 1981.
Itō, K.: Fujiki Hisashi nihon chūsei saigaishi nenpyōkō wo riyōshita kikōhendō to saigai shiryō no kankei no kentō. Daikikin no jiki wo chūshin ni [Research on historical weather sources using Hisashi Fujiki's “Draft of a Chronological Timeline for the History of Medieval Japanese Catastrophes”. Focussing on “Great Famine” Periods]. Kikō tekiōshi project. Kekka hōkokusho 1 [Historical Adaptation Project, Working Papers 1], 65–75, 2014.
Jáuregui, E.: Algunos aspectos de las fluctuaciones pluviométricas en México en los últimos cien años, Boletín del Instituto de Geografía, 9, 39–64, 1979.
Jevons, W. S.: Some data concerning the climate of Australia & New Zealand, in: Waugh's Australian Almanac for the year 1859, James William Waugh, Sydney, Australia, 47–98, 1859.
Jones, P. D. and Salmon, M.: Preliminary reconstructions of the North Atlantic Oscillation and the Southern Oscillation Index from measures of wind strength and direction taken during the CLIWOC period, Climatic Change, 73, 131–154, 2005.
Jusupović, A. and Bauch, M.: Surprising eastern perspectives: Historical climatology and Russian narrative sources, PAGES News, 28, 48–49, https://doi.org/10.22498/pages.28.2.48, 2020.
Kelso, C. and Vogel, C. H.: The climate of Namaqualand in the nineteenth century, Climatic Change 83, 257–380, 2007.
Kiss, A.: Floods and Long-Term Water-Level Changes in Medieval Hungary, Springer, Cham, 2019.
Klemm, F.: Witterungschronik des Barfüßerklosters Thann im Oberelsaß von 1182–1700, Meteorologische Rundschau, 23/1, 15–18, 1970.
Klimanov, V. A., Khotinskij, N. A., and Blagoveshchenskaia, N. V.: Climate fluctuations over the historical period in the centre of the Russian Plain, Bulletin of the Russian Academy of Sciences: Geographic Series, 1, 89–96, 1995.
Klimenko, V. and Solomina, O.: Climatic variations in the East European Plain during the last millennium: State of the art, in: The Polish Climate in the European Context: An Historical Overview, edited by: Przybylak, R., Majorowicz, J., Brázdil, R., and Kejan, M., Springer, Dordrecht, 71–101, 2010.
Klimenko, V. V., Klimanov, V. A., Sirin, A. A., and Slepcov, A. M.: Climate change in the west of European part of Russia in the late Holocene, Proceedings of the Russian Academy of Sciences, 376, 679–683, 2001.
Koek, F. B. and Konnen, G. P.: Determination of wind force and present weather terms: The Dutch case, Climatic Change, 73, 79–95, 2005.
Kong, W. S. and Watts, D.: A unique set of climatic data from Korea dating from 50 BC, and its vegetational implications, Global Ecol. Biogeogr., 2, 133–138, 1992.
Küttel, M., Luterbacher, J., Zorita, E., Xoplaki, E., Riedwyl, N., and Wanner, H.: Testing a European winter surface temperature reconstruction in a surrogate climate, Geophys. Res. Lett., 34, L07710, https://doi.org/10.1029/2006GL027907, 2007.
Küttel, M., Xoplaki, E., Gallego, D., Luterbacher, J., Garcia-Herrera, R., Allan, R., Barriendos, M., Jones, P., Wheeler, D., and Wanner, H.: The importance of ship log data: reconstructing North Atlantic, European and Mediterranean sea level pressure fields back to 1750, Clim. Dynam., 34, 1115–1128, 2010.
Lamb, H. H.: Climate. Past, Present and Future, vol. 2, Methuen, London, 1977.
Lamb, H. H.: Historic Storms of the North Sea, British Isles and Northwest Europe, Cambridge University Press, Cambridge, UK, 1992.
Leontovich, F. I.: Famine in Russia until the end of the last century, Northern Herald, March, 2–35, 1892.
Liakhov, M. E.: Climatic extremes in the central part of the European territory of the USSR in the 13th–20th centuries, Bulletin of the Academy of Sciences of the USSR: Geographic Series, 6, 68–74, 1984.
Lin, K.-H. E., Hsu, C. T., Wang, P. K., Hsu, S. M., Lin, Y. S., Wan, C. W., Tseng, W. L., Wu, W. C., and Pan, W.: Reconstructing historical typhoon series and spatiotemporal characteristics from REACHES documentary records, J. Geogr. Sci., 93, 81–107, 2019.
Lin, K.-H. E., Wang, P. K., Pai, P.-L., Lin, Y.-S., and Wang, C.-W.: Historical droughts in the Qing dynasty (1644–1911) of China, Clim. Past, 16, 911–931, https://doi.org/10.5194/cp-16-911-2020, 2020.
Litzenburger, L.: Une ville face au climat. Metz à la fin du Moyen Age (1400–1530), Presses Universitaires de Nancy, Nancy, 2015.
Liu, B.: Phenological change in Yangtze Plain during late Ming Dynasty (1450–1649), Historical Geography, 35, 22–33, 2017.
Liu, K. B., Shen, C. M., and Louie, K. S.: A 1,000-year history of typhoon landfalls in Guangdong, southern China, reconstructed from Chinese historical documentary records, Ann. Assoc. Am. Geogr., 91, 453–464, 2001.
Liu, Y., Wang, H., Dai, J., Li, T. S., Wang, H., and Tao, Z.: The application of phenological methods for reconstructing past climate change, Geogr. Res., 33, 603–613, 2014.
Man, Z. M.: Some fundamentals in research on changes of warm and cold climate making use of historical records, Historical Geography, 12, 21–31, 1995.
Mann, M. E. and Rutherford, S.: Climate reconstruction using “Pseudoproxies”, Geophys. Res. Lett., 29, 139-1–139-4, https://doi.org/10.1029/2001GL014554, 2002.
Martín-Vide, J. and Barriendos, M.: The use of rogation ceremony records in climatic reconstruction: a case study from Catalonia (Spain), Climatic Change, 30, 201–221, 1995.
Martín-Vide, J. and Vallvé, M. B.: The use of rogation ceremony records in climatic reconstruction: a case study from Catalonia (Spain), Climatic Change, 30, 201–221, 1995.
Mauelshagen, F.: Klimageschichte der Neuzeit 1500–1900 (Geschichte kompakt), Wissenschaftliche Buchgesellschaft, Darmstadt, 2010.
McAfee, R. J.: The fires of summer and the floods of winter: towards a climatic history for southeastern Australia, 1788–1860, Macquarie University Library, Sydney, Australia, 1981.
Meier, N., Rutishauser, T., Pfister, C., Wanner, H., and Luterbacher, J.: Grape harvest dates as a proxy for Swiss April to August temperature reconstructions back to AD 1480, Geophys. Res. Lett., 34, L20705, https://doi.org/10.1029/2007GL031381, 2007.
Mendoza, B., Jauregui, E., Diaz-Sandoval, R., Garcia-Acosta, V., Velasco, V., and Cordero, G.: Historical droughts in central Mexico and their relation with El Nino, J. Appl. Meteorol., 44, 709–716, 2005.
Mendoza, B., Garcia-Acosta, V., Velasco, V., Jauregui, E., and Diaz-Sandoval, R.: Frequency and duration of historical droughts from the 16th to the 19th centuries in the Mexican Maya lands, Yucatan Peninsula, Climatic Change, 83, 151–168, 2007.
Metcalfe, S. E.: Historical data and climatic change in Mexico – a review, Geogr. J., 153, 211–222, 1987.
Mikami, T.: Climatic variations in Japan reconstructed from historical documents, Weather, 63, 190–193, 2008.
Mizukoshi, M.: Climatic reconstruction in central Japan during the Little Ice Age based on documentary sources, Chigaku Zasshi [Journal of Geography], 102, 152–166, 1993.
Mizukoshi, M.: Kokiroku ni yoru 11/12/13/14/15/16 seiki no tenkōkiroku [Weather Documentation in Historical Sources of the 11th/12th/13th/14th/15th/16th Century], 6 volumes, Tōkyōdō Shuppan, Tokyo, 2004–2014.
Moodie, D. W. and Catchpole, A. J. W.: Environmental Data from Historical Documents by Content Analysis: Freeze-up and Break-up of Estuaries on Hudson Bay, 1714–1871, Department of Geography, University of Manitoba, Winnipeg, Canada, 1975.
Mora Pacheco, K.: Conmociones bajo un “cielo conspirador”. Sequías en el Altiplano Cundiboyacense, 1778–1828, in: VII Simposio de Historia Regional y Local, Universidad Industrial de Santander, Colombia, 2018.
Mutua, T. M. and Runguma, S. N.: Documentary driven chronologies of rainfall variability for Kenya, 1845–1976, Journal of Climatology and Weather Forecasting, 8, 255, available at: https://www.longdom.org/open-access/documentary-driven-chronologies-of-rainfall-variability-for-kenya–18451976.pdf (last access: 10 June 2021), 2020.
Nash, D. J.: Changes in precipitation over southern Africa during recent centuries, in: Oxford Research Encyclopedia of Climate Science, Oxford University Press, Oxford, UK, 2017.
Nash, D. J. and Endfield, G. H.: A 19th century climate chronology for the Kalahari region of central southern Africa derived from missionary correspondence, Int. J. Climatol., 22, 821–841, 2002.
Nash, D. J. and Endfield, G. H.: “Splendid rains have fallen”: links between El Nino and rainfall variability in the Kalahari, 1840–1900, Climatic Change, 86, 257–290, 2008.
Nash, D. J. and Grab, S. W.: “A sky of brass and burning winds”: documentary evidence of rainfall variability in the Kingdom of Lesotho, Southern Africa, 1824–1900, Climatic Change, 101, 617–653, 2010.
Nash, D. J. and Hannaford, M. J.: Historical climatology in Africa: A state of the art, PAGES News, 28, 42–43, 2020.
Nash, D. J., Pribyl, K., Klein, J., Neukom, R., Endfield, G. H., Adamson, G. C. D., and Kniveton, D. R.: Seasonal rainfall variability in southeast Africa during the nineteenth century reconstructed from documentary sources, Climatic Change, 134, 605–619, 2016.
Nash, D. J., Pribyl, K., Endfield, G. H., Klein, J., and Adamson, G. C. D.: Rainfall variability over Malawi during the late 19th century, Int. J. Climatol., 38 (Suppl. 1), e629–e642, 2018.
Neukom, R., Prieto, M. D., Moyano, R., Luterbacher, J., Pfister, C., Villalba, R., Jones, P. D., and Wanner, H.: An extended network of documentary data from South America and its potential for quantitative precipitation reconstructions back to the 16th century, Geophys. Res. Lett., 36, L12703, https://doi.org/10.1029/2009GL038351, 2009.
Neukom, R., Nash, D. J., Endfield, G. H., Grab, S. W., Grove, C. A., Kelso, C., Vogel, C. H., and Zinke, J.: Multi-proxy summer and winter precipitation reconstruction for southern Africa over the last 200 years, Clim. Dynam., 42, 2713–2716, 2014a.
Neukom, R., Gergis, J., Karoly, D. J., Wanner, H., Curran, M., Elbert, J., Gonzalez-Rouco, F., Linsley, B. K., Moy, A. D., Mundo, I., Raible, C. C., Steig, E. J., van Ommen, T., Vance, T., Villalba, R., Zinke, J., and Frank, D.: Inter-hemispheric temperature variability over the past millennium, Nat. Clim. Change, 4, 362–367, 2014b.
Nicholls, N.: More on early ENSOs – evidence from Australian documentary sources, B. Am. Meteorol. Soc., 69, 4–6, 1988.
Nicholson, S. E.: Climatic variations in the Sahel and other African regions during the past five centuries, J. Arid Environ., 1, 3–24, 1978a.
Nicholson, S. E.: Comparison of historical and recent African rainfall anomalies with late Pleistocene and early Holocene, Palaeoecol. Afr., 10, 99–123, 1978b.
Nicholson, S. E.: The methodology of historical climate reconstruction and its application to Africa, J. Afr. Hist., 20, 31–49, 1979.
Nicholson, S. E.: Saharan climates in historic times, in: The Sahara and the Nile, edited by: Williams, M. A. J. and Faure, H., Balkema, Rotterdam, 173–200, 1980.
Nicholson, S. E.: The historical climatology of Africa, in: Climate and History, edited by: Wigley, T. M. L., Ingram, M. J., and Farmer, G., Cambridge University Press, Cambridge, UK, 249–270, 1981.
Nicholson, S. E.: Environmental change within the historical period, in: The Physical Geography of Africa, edited by: Goudie, A. S., Adams, W. M., and Orme, A., Oxford University Press, Oxford, UK, 60–75, 1996.
Nicholson, S. E.: A semi-quantitative, regional precipitation data set for studying African climates of the nineteenth century, part 1. Overview of the data set, Climatic Change, 50, 317–353, 2001.
Nicholson, S. E.: A multi-century history of drought and wetter conditions in Africa, in: The Palgrave Handbook of Climate History, edited by: White, S., Pfister, C., and Mauelshagen, F., Palgrave Macmillan, London, 225–236, 2018.
Nicholson, S. E., Klotter, D., and Dezfuli, A. K.: Spatial reconstruction of semi-quantitative precipitation fields over Africa during the nineteenth century from documentary evidence and gauge data, Quaternary Res., 78, 13–23, 2012a.
Nicholson, S. E., Dezfuli, A. K., and Klotter, D.: A two-century precipitation dataset for the continent of Africa, B. Am. Meteorol. Soc., 93, 1219–1231, 2012b.
Nicholson, S. E., Funk, C., and Fink, A.: Rainfall over the African continent from the 19th through the 21st century, Global Planet. Change, 165, 114–127, 2018.
Norrgård, S.: Practising historical climatology in West Africa: a climatic periodisation 1750–1800, Climatic Change, 129, 131–143, 2015.
Norrgård, S.: Royal Navy logbooks as secondary sources and their use in climatic investigations: introducing the log-board, Int. J. Climatol., 37, 2027–2036, 2017.
Ogilvie, A. E. J.: The past climate and sea-ice record from Iceland. Part 1: Data to A.D. 1780, Climatic Change, 6, 131–152, 1984.
Ogilvie, A. E. J.: Documentary evidence for changes in the climate of Iceland, A.D. 1500–1800, in: Climate since A.D. 1500, edited by: Bradley, R. S. and Jones, P. D., Routledge, London, 92–117, 1992.
Ogilvie, A. E. J.: Sea-ice conditions off the coasts of Iceland A.D. 1601–1850 with special reference to part of the Maunder Minimum period (1675–1715), AmS-Varia, 25, 9–12, 1996.
Ogilvie, A. E. J. and Farmer, G.: Documenting the Medieval climate, in: Climates of the British Isles. Present, Past and Future, edited by: Hulme, M. and Barrow, E., Routledge, London, 1997.
Ogilvie, A. E. J. and Jónsson, T.: “Little Ice Age” research: A perspective from Iceland, Climatic Change, 48, 9–52, 2001.
Oppokov, E. V.: Fluctuations in river flow in historical time, in: Research on Rivers of the USSR, vol. 4, State Institute of Hydrology, Leningrad, 1933.
Ordóñez, P., Gallego, D., Ribera, P., Peña-Ortiz, C., and García-Herrera, R.: Tracking the Indian Summer Monsoon onset back to the pre-instrumental period, J. Climate, 29, 8115–8127, 2016.
Ortlieb, L.: Las mayores precipitaciones históricas en Chile central y la cronología de eventos ENOS en los siglos XVI–XIX, Rev. Chil. Hist. Nat., 67, 463–485, 1994.
Ortlieb, L.: Eventos El Niño y episodios lluviosos en el desierto de Atacama: el registro de los dos últimos siglos, Bulletin de l'Institut Français d'Études Andines, 24, 519–537, 1995.
Ortlieb, L.: The documentary historical record of El Niño events in Peru: An update of the Quinn record, in: El Niño and the Southern Oscillation: Multiscale Variability and Global and Regional Impacts, edited by: Diaz, H. F. and Markgraf, V., Cambridge University Press, Cambridge, UK, 207–297, 2000.
PAGES 2k Consortium: Continental-scale temperature variability during the past two millennia, Nat. Geosci., 6, 339–346, 2013.
PAGES 2k Consortium: A global multiproxy database for temperature reconstructions of the Common Era, Scientific Data, 4, 170088, https://doi.org/10.1038/sdata.2017.88, 2017.
Pauling, A., Luterbacher, J., and Wanner, H.: Evaluation of proxies for European and North Atlantic temperature field reconstructions, Geophys. Res. Lett., 30, 1787, https://doi.org/10.1029/2003GL017589, 2003.
Pei, Q. and Forêt, P.: Introduction to the climate records of Imperial China, Environ. Hist., 23, 863–871, 2018.
Perry, E. J.: Challenging the Mandate of Heaven – Popular protest in modern China, Crit. Asian Stud., 33, 163–180, 2001.
Pfister, C.: Klimageschichte der Schweiz 1525–1860. Das Klima der Schweiz und seine Bedeutung in der Geschichte von Bevölkerung und Landwirtschaft, Paul Haupt, Bern, 1984.
Pfister, C.: Monthly temperature and precipitation patterns in Central Europe from 1525 to the present. A methodology for quantifying man-made evidence on weather and climate, in: Climate Since A.D. 1500, edited by: Bradley, R. S. and Jones, P. D., Routledge, London, 118–142, 1992.
Pfister, C.: Raum-zeitliche Rekonstruktion von Witterungsanomalien und Naturkatastrophen 1496–1995. In cooperation with Daniel Brändli. Schlussbericht zum Projekt 4031-33198 des NFP 31, vdf Hochschulverlag AG and ETH Zürich, Zurich, 1998.
Pfister, C.: Wetternachhersage. 500 Jahre Klimavariationen und Naturkatastrophen (1496–1995), Paul Haupt, Bern, Stuttgart, Wien, 1999.
Pfister, C.: Evidence from the archives of societies: Documentary evidence – overview, in: The Palgrave Handbook of Climate History, edited by: White, S., Pfister, C., and Mauelshagen, F., Palgrave Macmillan, London, 37–47, 2018.
Pfister, C. and Hächler, S.: Überschwemmungskatastrophen im Schweizer Alpenraum seit dem Spätmittelalter. Raumzeitliche Rekonstruktion von Schadensmustern auf der Basis historischer Quellen, in: Historical Climatology in Different Climatic Zones, Würzburger Geographische Arbeiten 80, edited by: Glaser, R. and Walsh, R. P. D., Institut für Geographie/Geographische Gesellschaft, Würzburg, 127–148, 1991.
Pfister, C., Weingartner, R., and Luterbacher, J.: Hydrological winter droughts over the last 450 years in the Upper Rhine basin: a methodological approach, Hydrolog. Sci. J., 51, 966–985, 2006.
Pfister, C., Camenisch, C., and Dobrovolný, P.: Analysis and Interpretation: Temperature and Precipitation Indices, in: The Palgrave Handbook of Climate History, edited by: White, S., Pfister, C., and Mauelshagen, F., Palgrave-Macmillan, London, 115–129, 2018.
Pichard, G. and Roucaute, E.: Une déclinaison régionale du Petit Âge Glaciaire. Apport des archives historiques en Provence, Archéologie du Midi Medieval 27, 237–247, 2009.
Piervitali, E. and Colacino, M.: Evidence of drought in western Sicily during the period 1565–1915 from liturgical offices, Climatic Change, 49, 225–238, 2001.
Power, S. B. and Callaghan, J.: The frequency of major flooding in coastal southeast Australia has significantly increased since the late 19th century, Journal of Southern Hemisphere Earth Systems Science, 66, 2–11, 2016.
Prieto, M. R.: El clima de Mendoza durante los siglos XVII y XVIII, Meteorológica, XIV, 165–174, 1983.
Prieto, M. R.: Métodos para derivar información sobre precipitaciones nivales de fuentes históricas en la Cordillera de los Andes, Zbl. Geo. Pal., 11/12, 1615–1624, 1984.
Prieto, M. R. and García-Herrera, R.: Documentary sources from South America: Potential for climate reconstruction, Palaeogeogr. Palaeocl., 281, 196–209, 2009.
Prieto, M. R. and Rojas, F.: Documentary evidence for changing climatic and anthropogenic influences on the Bermejo Wetland in Mendoza, Argentina, during the 16th–20th century, Clim. Past, 8, 951–961, https://doi.org/10.5194/cp-8-951-2012, 2012.
Prieto, M. R. and Rojas, F.: Determination of droughts and high floods of the Bermejo River (Argentina) based on documentary evidence (17th to 20th century), J. Hydrol., 529, 676–683, 2015.
Prieto, M. R. and Rojas, F.: Climate history in Latin America, in: The Palgrave Handbook of Climate History, edited by: White, S., Pfister, C., and Mauelshagen, F., Palgrave Macmillan, London, 213–224, 2018.
Prieto, M. R., Herrera, R., and Dussel, P.: Historical evidences of streamflow fluctuations in the Mendoza River, Argentina, and their relationship with ENSO, Holocene, 9, 473–481, 1999.
Prieto, M. R., Garcia-Herrera, R., and Hernández, E.: Early records of icebergs in the South Atlantic Ocean from Spanish documentary sources, Climatic Change, 66, 29–48, 2004.
Prieto, M. R., Gallego, D., Garcia-Herrera, R., and Calvo, N.: Deriving wind force terms from nautical reports through content analysis. The Spanish and French cases, Climatic Change, 73, 37–55, 2005.
Prieto, M. R., Rojas, F., and Castillo, L.: La climatología histórica en Latinoamérica. Desafíos y perspectivas, Bulletin de l'Institut français d'études andines, 47, 141–167, 2019.
Quinn, W. H. and Neal, V. T.: The historical record of El Niño events, in: Climate Since A.D. 1500, edited by: Bradley, R. S. and Jones, P. D., Routledge, London, 623–648, 1992.
Quinn, W. H., Neal, V. T., and Antunez de Mayolo, S.E.: El Nino occurrences over the past four and a half centuries, J. Geophys. Res., 92, 14449–14461, 1987.
Rácz, L.: Climate history of Hungary since 16th Century. Past, present and future, Centre for Regional Studies of the Hungarian Academy of Sciences, Pécs, 1999.
Rodrigo, F. S. and Barriendos, M.: Reconstruction of seasonal and annual rainfall variability in the Iberian peninsula (16th–20th centuries) from documentary data, Global Planet. Change, 63, 243–257, 2008.
Rodrigo, F. S., Estebanparra, M. J., and Castro-Diez, Y.: An attempt to reconstruct the rainfall regime of Andalusia (southern Spain) from 1601 ad to 1650 AD using historical documents, Climatic Change, 27, 397–418, 1994.
Rodrigo, F. S., Esteban-Parra, M. J., and Castro-Diez, Y.: On the use of the Jesuit order private correspondence records in climate reconstructions: A case study from Castille (Spain) for 1634–1648 AD, Climatic Change, 40, 625–645, 1998.
Rodrigo, F. S., Esteban-Parra, M. J., Pozo-Vazquez, D., and Castro-Diez, Y.: A 500-year precipitation record in Southern Spain, Int. J. Climatol., 19, 1233–1253, 1999.
Rohr, C.: Measuring the frequency and intensity of floods of the Traun River (Upper Austria), 1441–1574, Hydrolog. Sci. J., 51, 834–847, 2006.
Rohr, C.: Extreme Naturereignisse im Ostalpenraum. Naturerfahrung im Spätmittelalter und am Beginn der Neuzeit, Umwelthistorische Forschungen 4, Böhlau, Cologne, Weimar, Vienna, 2007.
Rohr, C.: Floods of the Upper Danube River and Its tributaries and their impact on urban economies (c. 1350–1600): The examples of the towns of Krems/Stein and Wels (Austria), Environment and History, 19, 133–148, 2013.
Rohr, C., Camenisch, C., and Pribyl, K.: European Middle Ages, in: The Palgrave Handbook of Climate History, edited by: White, S., Pfister, C., and Mauelshagen, F., Palgrave-Macmillan, London, 247–263, 2018.
Russell, H. C.: Climate of New South Wales: Descriptive, historical, and tabular, Charles Potter, Government Printer, Sydney, Australia, 1877.
Salvisberg, M.: Der Hochwasserschutz an der Gürbe. Eine Herausforderung für Generationen (1855–2010), Wirtschafts-, Sozial- und Umweltgeschichte 7, Schwabe, Basel, 2017.
Schwarz-Zanetti, G.: Grundzüge der Klima- und Umweltgeschichte des Hoch- und Spätmittelalters in Mitteleuropa, Studentendruckerei, Zürich, 1998.
Shabalova, M. V. and van Engelen, A. G. V.: Evaluation of a reconstruction of winter and summer temperatures in the low countries, AD 764–1998, Climatic Change, 58, 219–242, 2003.
Shahgedanova, M. (Ed.): The physical geography of northern Eurasia, Oxford University Press, Oxford, 2002.
Shen, X. Y. and Chen, J. Q.: Grain production and climatic variation in Taihu Lake Basin, Chinese Geogr. Sci., 3, 173–178, 1993.
Shi, F., Zhao, S., Guo, Z., Goosse, H., and Yin, Q.: Multi-proxy reconstructions of May–September precipitation field in China over the past 500 years, Clim. Past, 13, 1919–1938, https://doi.org/10.5194/cp-13-1919-2017, 2017.
Shō, K., Shibuya, K., and Tominaga, A.: Examination of long-term changes in the rainy season by comparing diary weather records with meteorological observation data, Journal of Hydrology and Water Resources, 30, 294–306, 2017.
Slepcov, A. M. and Klimenko, V. V.: Generalization of paleoclimatic data and reconstruction of the climate of Eastern Europe for the last 2000 years, History and Modernity, 1, 118–137, 2005.
Sturm, K., Glaser, R., Jacobeit, J., Deutsch, M., Brázdil, R., Pfister, C., Luterbacher, J., and Wanner, H.: Hochwasser in Mitteleuropa seit 1500 und ihre Beziehung zur atmosphärischen Zirkulation, Petermanns Geographische Mittelungen, 145, 14–23, 2001.
Su, Y., Fang, X. Q., and Yin, J.: Impact of climate change on fluctuations of grain harvests in China from the Western Han Dynasty to the Five Dynasties (206 BC–960 AD), Sci. China Earth Sci., 57, 1701–1712, 2014.
Tagami, Y.: Shōhyōki chūki no nihonrettō no kikōhendō [Climate variation of Japanese Islands in the middle Little Ice Age], Ningen hattatsu kagakubu kiyō [Bulletin of the Faculty of Human Development University of Toyama], 10, 161–173, 2015.
Tan, L. C., Ma, L., Mao, R. X., and Tsai, Y. J.: Past climate studies in China during the last 2000 years from historical documents, Journal of Earth Environment, 5, 434–440, 2014.
Tan, P.-H. and Liao, H.-M.: Reconstruction of temperature, precipitation and weather characteristics over the Yangtze River Delta Area in Ming Dynasty, J. Geogr. Sci., 57, 61–87, 2012.
Tan, P.-H. and Wu, B.-L.: Reconstruction of climatic and weather characteristics in the Shanghai area during the Qing dynasty, J. Geogr. Sci., 71, 1–28, 2013.
Tejedor, E., de Luis, M., Barriendos, M., Cuadrat, J. M., Luterbacher, J., and Saz, M. Á.: Rogation ceremonies: a key to understanding past drought variability in northeastern Spain since 1650, Clim. Past, 15, 1647–1664, https://doi.org/10.5194/cp-15-1647-2019, 2019.
Telelis, I. G.: Climatic fluctuations in the Eastern Mediterranean and the Middle East AD 300–1500 from Byzantine documentary and proxy physical paleoclimatic evidence – A comparison, Jahrbuch der Österreichischen Byzantinistik, 58, 167–207, 2008.
Tian, H., Stige, L. C., Cazelles, B., Kausrud, K. L., Svarverud, R., Stenseth, N. C., and Zhang, Z.: Reconstruction of a 1910-y-long locust series reveals consistent associations with climate fluctuations in China, P. Natl. Acad. Sci. USA, 108, 14521–14526, 2011.
Trouet, V., Harley, G. L., and Domínguez-Delmas, M.: Shipwreck rates reveal Caribbean tropical cyclone response to past radiative forcing, P. Natl. Acad. Sci. USA, 113, 3169–3174, 2016.
Van Engelen, A. F. V., Buisman, J., and IJnsen, F.: A millennium of weather, winds and water in the Low Countries, in: History and Climate. Memories of the Future?, edited by: Jones, P. D., Ogilvie, A. E. J., Davies, T. D., and Briffa, K. R., Kluwer Academic/Plenum Publishers, New York, 101–123, 2001.
Veselovskij, K. S.: O klimate Rossii [About Russian climate], Publishing House of the Imperial Academy of Sciences, Saint Petersburg, 1857.
Vogel, C. H.: 160 years of rainfall in the Cape – has there been a change?, S. Afr. J. Sci., 84, 724–726, 1988.
Vogel, C. H.: A documentary-derived climatic chronology for South Africa, 1820–1900, Climatic Change, 14, 291–307, 1989.
Vogt, S., Glaser, R., Luterbacher, J., Riemann, D., Al Dyab, G., Schönbein, J., and Garcia-Bustamente, E.: Assessing the Medieval Climate Anomaly in the Middle East: The potential of Arabic documentary sources, PAGES News, 19, 28–29, 2011.
Wang, P. K.: Meteorological records from ancient chronicles of China, B. Am. Meteorol. Soc., 60, 313–317, 1979.
Wang, P. K.: On the relationship between winter thunder and the climatic change in China in the past 2200 years, Climatic Change, 3, 37–46, 1980.
Wang, P. K. and Zhang, D.: An introduction to some historical governmental weather records of China, B. Am. Meteorol. Soc., 69, 753–758, 1988.
Wang, P. K. and Zhang, D.: A study on the reconstruction of the 18th century meiyu (plum rains) activity of Lower Yangtze region of China, Sci. China Ser. B, 34, 1237–1245, 1991.
Wang, P. K. and Zhang, D.: Recent studies of the reconstruction of east Asian monsoon climate in the past using historical literature of China, Meteorological Society of Japan, 70, 423–446, 1992.
Wang, P. K., Lin, K.-H. E., Liao, Y. C., Liao, H. M., Lin, Y. S., Hsu, C. T., Hsu, S. M., Wan, C. W., Lee, S. Y., Fan, I. C., Tan, P. H., and Ting, T. T.: Construction of the REACHES climate database based on historical documents of China, Scientific Data, 5, 180288, https://doi.org/10.1038/sdata.2018.288, 2018.
Wang, R. S. and Wang, S. W.: Reconstruction of winter temperature in Eastern China during the past 500 years using historical documents, Acta Meteorol. Sin., 48, 379–386, 1990.
Wang, S. L., Ye, J. L., and Gong, D. Y.: Climate in China during the Little Ice Age, Quaternary Sci. 1, 54–64, 1998.
Wang, S. W. and Gong, D. Y.: Climate in China during the four special periods in Holocene, Prog. Nat. Sci., 10, 379–386, 2000.
Wang, S. W. and Wang, R. S.: Variations of seasonal and annual temperatures during 1470–1979 in eastern China, Meteorological Bulletin, 48, 26–35, 1990.
Wang, S. W., Wang, K. S., Zhang, Z. M., and Ye, J. L.: The change of drought and flood disasters over the areas of Yangtze and Yellow rivers during 1380–1989, in: Diagnosis Research of Frequency and Economic Effect for Drought and Flood Disasters over Yangtze and Yellow Rivers, edited by: Wang, S. W. and Huang, Z. I., China Meteorological Press, Beijing, 41–54, 1993.
Ward, C. and Wheeler, D. A.: Hudson's Bay Company ship's logbooks: a source of far North Atlantic weather data, Polar Rec., 48, 165–176, 2012.
Warren, H. N.: Results of rainfall observations made in New South Wales, Sections I – VI, Districts 46 – 75, including rainfall tables (monthly and annual), discussion of rainfall and its relation to primary industries, also temperature and humidity tables, records of floods, cyclones, and local storms, etc., Bureau of Meteorology, Canberra, 1948.
Watt, W. S.: Results of rainfall observations made in Tasmania including all available annual rainfall totals from 356 stations for all years of record up to 1934, with maps and diagrams; and record of severe floods., Bureau of Meteorology, Melbourne, 1936.
Wetter, O., Pfister, C., Weingartner, R., Luterbacher, J., Reist, T., and Trösch, J.: The largest floods in the High Rhine basin since 1268 assessed from documentary and instrumental evidence, Hydrolog. Sci. J., 56, 733–758, 2011.
Wheeler, D. A.: Understanding seventeenth-century ships' logbooks: An exercise in historical climatology, Journal for Maritime Research, 6, 21–36, 2004.
Wheeler, D. A.: An examination of the accuracy and consistency of ships' logbook weather observations and records, Climatic Change, 73, 97–116, 2005a.
Wheeler, D. A.: British naval logbooks from the late seventeenth century: New climatic information from old sources, History of Meteorology, 2, 133–145, 2005b.
Wheeler, D. A. and Garcia-Herrera, R.: Ships' logbooks in climatological research: Reflections and prospects, in: Trends and Directions in Climate Research, edited by: Gimeno, L., Garcia-Herrera, R., and Trigo, R. M., Ann. NY Acad. Sci., 1146, 1–15, 2008.
Wheeler, D. A., Garcia-Herrera, R., Wilkinson, C., and Ward, C.: Atmospheric circulation and storminess derived from Royal Navy logbooks: 1685 to 1750, Climatic Change, 101, 257–280, 2010.
White, S.: North American climate history (1500–1800), in: The Palgrave Handbook of Climate History, edited by: White, S., Pfister, C., and Mauelshagen, F., Palgrave Macmillan, London, 297–308, 2018.
Wilhelm, B., Ballesteros Canovas, J. A., Corella Aznar, J. P., Kämpf, L., Swierczynski, T., Stoffel, M., Søren, E., and Tonen, W.: Recent advances in paleoflood hydrology: From new archives to data compilation and analysis, Water Security, 3, 1–8, 2018.
Wilkinson, C.: British logbooks in UK archives, 17th–19th centuries – a survey of the range, selection and suitability of British logbooks and related documents for climatic research, Climatic Research Unit, School of Environmental Sciences, University of East Anglia, Norwich, 2009.
Wilson, R., Tudhope, A., Brohan, P., Briffa, K. R., Osborn, T., and Tett, S. F. B.: Two-hundred-fifty years of reconstructed and modeled tropical temperatures, J. Geophys. Res., 111, C10007, https://doi.org/10.1029/2005JC003188, 2006.
Wozniak, T.: Naturereignisse im frühen Mittelalter: Das Zeugnis der Geschichtsschreibung vom 6. bis 11 Jahrhundert, De Gruyter, Berlin, 2020.
Xiao, L., Fang, X., and Zhang, X.: Location of rainbelt of Meiyu during second half of 19th Century to early 20th Century, Scientia Geographica Sinica, 28, 385–389, 2008.
Xoplaki, E., Maheras, P., and Luterbacher, J.: Variability of climate in Meridional Balkans during the periods 1675–1715 and 1780–1830 and its impact on human life, Climatic Change, 48, 581–615, 2001.
Xoplaki, E., Luterbacher, J., Paeth, H., Dietrich, D., Steiner, N., Grosjean, M., and Wanner, H.: European spring and autumn temperature variability and change of extremes over the last half millennium, Geophys. Res. Lett., 32, L15713, https://doi.org/10.1029/2005GL023424, 2005.
Yao, C. S.: A statistical approach to historical records of flood and drought, J. Appl. Meteorol., 21, 588–594, 1982.
Yao, S. Y.: The geographical distribution of floods and droughts in Chinese history, 206 B.C.–A.D. 1911, The Far Eastern Quarterly, 2, 357–378, 1943.
Yi, L., Yu, H. J., Ge, J. Y., Lai, Z. P., Xu, X. Y., Qin, L., and Peng, S. Z.: Reconstructions of annual summer precipitation and temperature in north-central China since 1470 AD based on drought/flood index and tree-ring records, Climatic Change, 110, 469–498, 2012.
Yin, J., Su, Y., and Fang, X. Q.: Relationships between temperature change and grain harvest fluctuations in China from 210 BC to 1910 AD, Quatern. Int., 355, 153–163, 2015.
Zaiki, M., Grossman, M. J., and Mikami, T.: Document-based reconstruction of past climate in Japan, PAGES News, 20, 82–83, 2012.
Zhang, D.: Winter temperature changes during the last 500 years in South China, Chinese Sci. Bull., 25, 497–500, 1980.
Zhang, D.: Preliminary analyses of the weather and climate during dust storms in the historical time, Sci. China Ser. B, 24, 278–288, 1984.
Zhang, D.: A Compendium of Chinese Meteorological Records of the Last 3,000 Years, Jiangsu Education Press, Nanjing, 2004.
Zhang, D. and Liu, C. J.: Continuation (1980–1992) to “Yearly Charts of Dryness/Wetness in China for the Last 500-year Period”, Meteorological Monthly, 19, 41–46, 1993.
Zhang, D. and Liu, C. Z.: Reconstruction of summer temperature series (1724–1903) in Beijing, Kexue Tongbao, 32, 1046–1049, 1987.
Zhang, D. and Liu, Y.: A new approach to the reconstruction of temporal rainfall sequences from 1724–1904 Qing dynasty weather records for Beijing, Quaternary Sci., 22, 199–208, 2002.
Zhang, D. and Wang, P.-K.: Reconstruction of the eighteenth century summer monthly precipitation series of Nanjing, Suzhou, and Hangzhou using the Clear and Rain Records of Qing Dynasty, J. Meteorol. Res.-PRC, 3, 261–278, 1989.
Zhang, D. and Wang, P.-K.: Reconstruction of the 18th century summer monthly precipitation series of Nanjing, Suzhou and Hangzhou using Clear and Rain Records of Qing dynasty, Quarterly Journal of Appled Meteorology, 1, 260–270, 1990.
Zhang, D., Liu, C., and Jiang, J.: Reconstruction of six regional dry/wet series and their abrupt changes during the last 1000 years in East China, Quaternary Sci., 17, 1–11, 1997.
Zhang, D., Lee, X. C., and Liang, Y. Y.: Continuation (1993–2000) to “Yearly Charts of Dryness/Wetness in China for the Last 500-year Period”, Journal of Applied Meteorological Science, 14, 379–384, 2003.
Zhang, J. C. and Crowley, T. J.: Historical climate records in China and reconstruction of past climates, J. Climate, 2, 833–849, 1989.
Zhang, J. C. and Zhang, X. G.: Climatic fluctuations during the last 500 years in China and their interdependence, Acta Meteorological Sinica, 37, 49–57, 1979.
Zhang, P. Y. and Gong, G. F.: Some characteristics of climate fluctuations in China since 16th century, Acta Geographica Sinica, 46, 238–247, 1979.
Zheng, J. Y. and Zheng, S. Z.: An analysis on cold/warm and dry/wet in Shandong Province during historical times, Acta Geographica Sinica, 48, 348–357, 1993.
Zheng, J. Y., Wang, W. C., Ge, Q.-S., Man, Z. M., and Zhang, P. Y.: Precipitation variability and extreme events in eastern China during the past 1500 years, Terr. Atmos. Ocean. Sci., 17, 579–592, 2006.
Zheng, J. Y., Ge, Q. S., Fang, Z. Q., and Zhang, X. Z.: Comparison on temperature series reconstructed from historical documents in China for the last 2000 years, Acta Meteorologica Sinica, 65, 428–439, 2007.
Zheng, S. Z., Zhang, F. C., and Gong, G. F.: Preliminary analysis of moisture condition in southeastern China during the last two thousand years, in: Proceedings of Symposium on Climatic Variations and Long-term Forecasting, Science Press, Beijing, 1977.
Zhogova, M. L.: Klimaticheskie zakonomernosti na territorii Rossii v Trudah K.S. Veselovskogo [Climate Regularities of Russia in the Works of K. S. Veselovsky], Natural Sciences: History of Natural Science, 1, 160–167, 2013.
Zhou, Q., Zhang, P., and Wang, Z.: Reconstruction of annual winter mean temperature series in Hefei area during 1973–1991, Acta Geographica Sinica, 49, 332–337, 1994.
Zhu, C.: Climate pulsations during historical times in China, Geogr. Rev., 16, 274–281, 1926.
Zhu, C. and Wang, M.: Phenology, Science Press, Beijing, 1973.
Zhu, K.: A preliminary study on climate change in China in the last 5000 years, Scientia Sinica Mathematica, 16, 168–189, 1973.
- Abstract
- Introduction
- Climate indices in Europe
- Climate indices in Asia
- Climate indices in Africa
- Climate indices in the Americas
- Climate indices in Australia
- Climate indices and the world's oceans
- Methods for the derivation of climate indices
- Calibration, verification, and dealing with uncertainty
- Towards best practice in the use of climate indices for historical climate reconstruction
- Dedication
- Code and data availability
- Author contributions
- Competing interests
- Special issue statement
- Acknowledgements
- Financial support
- Review statement
- References