the Creative Commons Attribution 4.0 License.
the Creative Commons Attribution 4.0 License.
 | 11 Nov 2020
A 2600-year summer climate reconstruction in central Japan by integrating tree-ring stable oxygen and hydrogen isotopes
Takeshi Nakatsuka
Masaki Sano
Zhen Li
Chenxi Xu
Akane Tsushima
Yuki Shigeoka
Kenjiro Sho
Keiko Ohnishi
Minoru Sakamoto
Hiromasa Ozaki
Noboru Higami
Nanae Nakao
Misao Yokoyama
Takumi Mitsutani
Oxygen isotope ratios (δ18O) of tree-ring cellulose are a novel proxy for summer hydroclimate in monsoonal Asia. In central Japan, we collected 67 conifer wood samples, mainly Chamaecyparis obtusa, with ages encompassing the past 2600 years. The samples were taken from living trees, archeological wood, architectural wood, and buried logs. We analyzed stable isotope ratios of oxygen (δ18O) and hydrogen (δ2H) in tree-ring cellulose in these samples (more than 15 000 rings in total) without using a pooling method and constructed a statistically reliable tree-ring cellulose δ18O time series for the past 2500 years. However, there were distinct age trends and level offsets in the δ18O record, and cellulose δ18O values showed a gradual decrease as an individual tree matures. This suggested it is difficult to establish a cellulose δ18O chronology for low-frequency signals by simple averaging of all the δ18O time series data. In addition, there were opposite age trends in the cellulose δ2H, and δ2H gradually increased with tree age. There were clear positive correlations in the short-periodicity variations between δ18O and δ2H, probably indicating a common climate signal. A comparison of the δ18O and δ2H time series in individual trees with tree-ring width suggested that the opposite age trends of δ18O and δ2H are caused by temporal changes in the degree of post-photosynthetic isotope exchange with xylem water (physiological effect), accompanied by changes in stem growth rate that are influenced by human activity in the forests of central Japan. Based on the assumptions that cellulose δ18O and δ2H vary positively and negatively with constant proportional coefficients due to climatological and physiological effects, respectively, we solved simultaneous equations for the climatological and physiological components of variations in tree-ring cellulose δ18O and δ2H in order to remove the age trend. This enabled us to evaluate the climatic record from cellulose δ18O variations. The extracted climatological component in the cellulose δ18O for the past 2600 years in central Japan was well correlated with numerous instrumental, historical, and paleoclimatological records of past summer climate at various spatial and temporal scales. This indicates that integration of tree-ring cellulose δ18O and δ2H data is a promising method to reconstruct past summer climate variations on annual to millennial timescales, irrespective of the growth environment. However, analytical and statistical methods need to be improved for further development of this climate proxy.
- Article
(11306 KB) - Full-text XML
-
Supplement
(4979 KB) - BibTeX
- EndNote


In general, it is not straightforward to extract low-frequency climate signals from tree-ring time series because there are typically age trends in tree-ring width. To overcome this, the regional curve standardization (RCS) method is used to determine the typical growth curve in a region for a tree species, which is subtracted from the tree-ring width time series of individual trees to explicitly estimate climatological influences (Esper et al., 2003), but it is difficult to fully preserve low-frequency climate signals of tree-ring width and density.
Tree-ring cellulose oxygen isotope ratios (δ18O) are a novel proxy for past summer hydroclimate, and it has been reported that such data are not affected by age trends (Young et al., 2011; Kilroy et al., 2016; Xu et al., 2016; Büntgen et al; 2020) or only show short-lived juvenile effects of higher δ18O values (Szymczak et al., 2012; Duffy et al., 2017). These juvenile effects are interpreted to be related to the less-developed root system of young trees and the evaporative enrichment of 18O in soil water in the near surface. However, Esper et al. (2010) demonstrated the presence of long-term age trends, whereby δ18O gradually decreases for hundreds of years after germination, as well as significant level offsets between different individual trees, in a conifer species. This requires three analytical criteria to evaluate the age trends and level offsets in the tree-ring cellulose δ18O data: (1) well-replicated data, (2) non-pooled data, and (3) composite chronologies from multiple species and regions. However, given that subsequent studies of tree-ring cellulose δ18O have reported that age trends are negligible, the mechanisms responsible for long-term age trends remain unclear.
In Japan, it has been difficult to establish millennial-scale tree-ring chronologies applicable to reconstructing past changes in summer climate, even though such information is critical for rice paddy cultivation and for historical and archeological studies in Japan. Although there are ancient archeological and architectural woods that have been used for dendrochronological analysis of wooden artifacts with ages of 1000–2000 years (Mitsutani, 2000; NNRICP, 1990), these have not been utilized for past climate reconstructions. This is because tree-ring widths measured in trees from normal Japanese forests do not have a high sensitivity to climate. Moreover, the ecological and artificial disturbance of tree growth in dense Japanese forests prevents reconstructions of past climate based on the relatively small number of old sub-fossil wood samples that are available.
However, tree-ring cellulose δ18O data are sensitive to summer hydroclimate in Asia (Treydte et al., 2006; Grießinger et al., 2011; Li et al., 2011; Xu et al., 2011; Sano et al., 2012; Liu et al., 2017), including in Japan (Nakatsuka et al., 2004; Tsuji et al., 2008; Yamaguchi et al., 2010; Li et al., 2015). High correlation coefficients for tree-ring cellulose δ18O data amongst different individual trees and species make it possible to reconstruct past summer climate using only a small number of sub-fossil trees. Therefore, during the past decade we have analyzed tree-ring cellulose δ18O in various types of conifer wood with large tree-ring numbers (mainly Chamaecyparis obtusa), including from living trees, archeological wood, architectural wood, and buried logs, in order to reconstruct past variations in summer hydroclimate in central Japan (Nakatsuka, 2015, 2018).
We do not use the pooling method (Szymczak et al., 2012; Loader et al., 2013) for the tree-ring isotope measurements. Instead, we analyze all the tree rings in the wood samples using a novel method, involving direct cellulose extraction from 1 mm thick wood sections (Kagawa et al., 2015). This allows us to evaluate age trends in individual trees and offsets between different individuals in the tree-ring cellulose δ18O data, following the criteria proposed by Esper et al. (2010). This approach has shown that most old trees in Japan (mainly Chamaecyparis obtusa) are significantly affected by long-term age trends and level offsets such that it is not possible to reconstruct long-term summer climate variations without taking these effects into accounts.
However, we have also found that hydrogen isotope ratios (δ2H) of tree-ring cellulose, which have been measured simultaneously with the δ18O data, have age trends opposite to those of δ18O and that δ2H is positively and negatively correlated with δ18O in terms of short- and long-periodicity variations, respectively. This δ18O and δ2H relationship provides insights into the mechanisms responsible for age trends in tree-ring cellulose δ18O data and makes it possible to remove the age trends in such data.
Here, we compare δ18O and δ2H data for tree-ring cellulose and elucidate the mechanisms responsible for age trends in tree-ring cellulose δ18O data. We then propose and apply a new method to the tree-ring cellulose δ18O and δ2H time series for reconstructing climate over the past 2600 years in central Japan. This enables us to remove the age trend and extract the climatological component of the tree-ring cellulose δ18O data using many ecologically and artificially disturbed trees that are available for the last several thousand years, even in Japan.
2.1 Collection of tree-ring samples
A total of 67 tree samples covering the past 2600 years were collected in central Japan (Fig. 1). These samples consist of living trees, architectural wood, archeological wood, and buried logs (Table S1 in the Supplement). Most of the trees are Japanese cypress (Chamaecyparis obtusa), but there are some samples of other conifer species (Chamaecyparis pisifera, Sciadopitys verticillata, and Cryptomeria japonica). All samples contain hundreds of rings. Although some samples have already been dated by traditional dendrochronological methods using tree-ring width (Mitsutani, 2000; NNRICP, 1990), the new tree-ring δ18O time series were used in the final dendrochronological determination of their ages (Roden, 2008; Yamada et al., 2018), which provided results consistent with the tree-ring width dating results (Fig. S1).
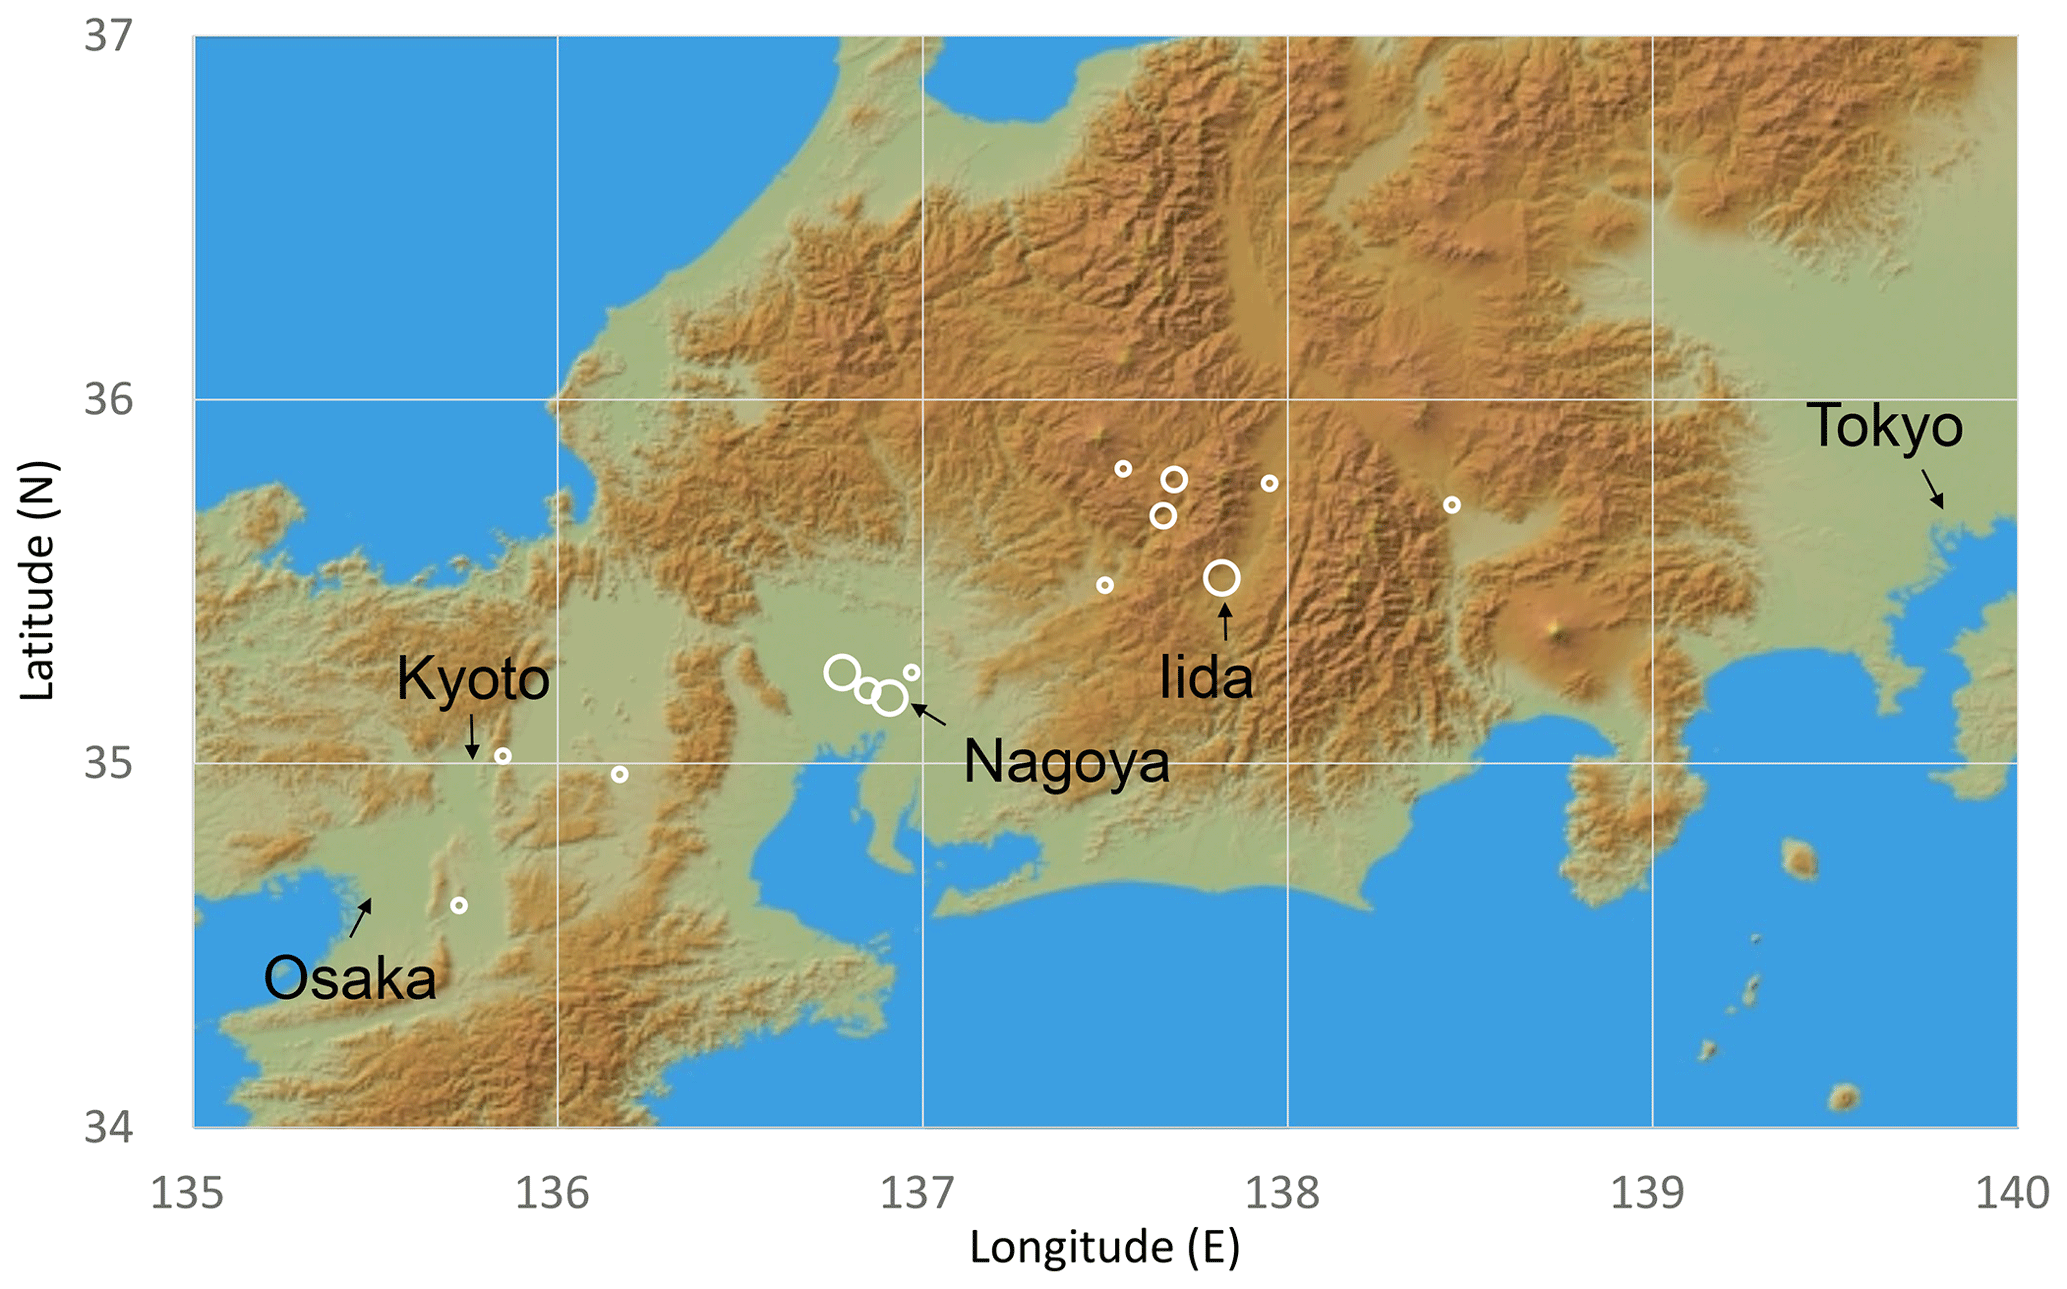
Figure 1Sample sites of this study. Open circles indicate locations of wood samples, shown by the latitude and longitude of governmental offices in the municipalities where samples were collected because most samples were not living trees for which the actual growth location can be identified. The size of the open circles indicates the sample numbers for each site (large 10–15; medium 4–9; small 1–3). This figure was constructed using the JAXA AW3D30 DSM data map.
2.2 Measurement of tree-ring cellulose δ18O and δ2H
Here, we analyzed cellulose δ18O and δ2H for all tree rings in all wood samples using a novel method, involving direct cellulose extraction from 1 mm thick wood laths (Kagawa et al., 2015), without using the pooling method. Firstly, 1 mm thick cross-sectional laths perpendicular to the cellulose fibers were sliced from all wood samples regardless of ring width and age and directly subjected to chemical treatment to remove components other than cellulose. In order to keep the original shape of samples during chemical treatments, 1 mm thick wood laths were put between two Teflon punching sheets and set into test tubes. Given that buried wood sometimes shows extraordinary δ18O values due to alteration of chemical components and/or deposition of iron oxides (Savard et al., 2012; Yapp, 2001), we carefully selected less-degraded wood segments and completely removed all components other than cellulose. A 100–300 µg fragment of cellulose representing the whole annual layer was then cut from the cellulose lath year by year using a fine blade under a microscope (Fig. S2). Each sample was wrapped in silver foil for δ18O and δ2H measurements using a mass spectrometer combined with a pyrolysis elemental analyzer (TCEA/Delta V Advantage; ThermoFisher Scientific, Bremen, Germany). In this study, we analyzed both δ18O and δ2H values for each cellulose sample simultaneously by making the focus of the mass spectrometer automatically jump between outflows of H2 and CO gases from the pyrolysis elemental analyzer. After measurements of every eight samples, a cellulose standard (cellulose reagent; Merck) with known δ18O and δ2H was analyzed to calibrate analytical drift and calculate the δ18O and δ2H of samples against the international standard of VSMOW, following Eqs. (1) and (2). Analytical reproducibility (1σ) based on repeated measurements of homogeneous cellulose samples is ca. ± 0.15 and ± 1.5 ‰ for δ18O and δ2H, respectively. Absolute accuracies of δ18O and δ2H may be a little bit worse because we use only one working standard to minimize the memory effect in the δ2H measurement. However, it does not influence the discussion of this study because we do not utilize absolute isotope values but focus only on their temporal variations.
Given that cellulose contains 30 % OH-group hydrogen that is exchangeable with experimental water during chemical treatment, it is necessary to remove the OH group by nitration of the cellulose (synthesis of nitrocellulose) before the isotope measurements (Epstein et al., 1976; DeNiro, 1981). However, it was nearly impossible to nitrate all the cellulose samples analyzed in this study due to the very small sample amount (Fig. S2) and the extremely large sample number (15 924 rings for isotopic measurements). Moreover, it was desirable to measure both δ18O and δ2H simultaneously for each sample, not only to reduce the sample number to half, but also to treat the δ18O and δ2H data as completely originating from the same sample, as discussed later, but the nitration of cellulose makes it impossible to measure its δ18O together with δ2H due to the contamination of oxygen in the NO2 group. However, we can expect that all OH-group hydrogen in a cellulose lath will have a unique δ2H value, as it would have been replaced by the hydrogen of homogeneous water in the test tube during the process of cellulose extraction such that the measured tree-ring cellulose δ2H time series will retain the original isotopic variations, although the amplitude of these variations will decrease by up to 70 % and the absolute values will have been modified (Filot et al., 2006). We confirmed that there are consistent correlations in δ2H variations between cellulose and nitrocellulose produced using the traditional nitration method (Epstein et al., 1976; DeNiro, 1981) for two tree samples (Fig. 2), although the correlation coefficients are lower than that from a more sophisticated method to fix the δ2H value of the OH group in cellulose (Filot et al., 2006). This demonstrates that it is possible to reconstruct original variations in tree-ring cellulose δ2H data without nitrating the cellulose to a certain degree. However, considering the possible analytical uncertainties in cellulose δ2H data of this study, we restrict the usage of δ2H data to the calibration of long-term age trends in cellulose δ18O, as discussed later.

Figure 2Correlations between hydrogen isotope ratios (δ2H) of tree-ring cellulose and nitrocellulose in two Japanese cypress trees. (a) No. 65 and (b) no. 64 in Table S1. Red lines indicate the slope observed when all OH-group hydrogen in cellulose is exchanged with hydrogen with a unique δ2H value.
3.1 Variations in the tree-ring cellulose δ18O and δ2H data
After constraining the exact dates for all the tree rings by the cross-dating method using δ18O data (Fig. S1; Bunn, 2008), we compared all tree-ring cellulose δ18O and δ2H time series (Fig. 3a and c).
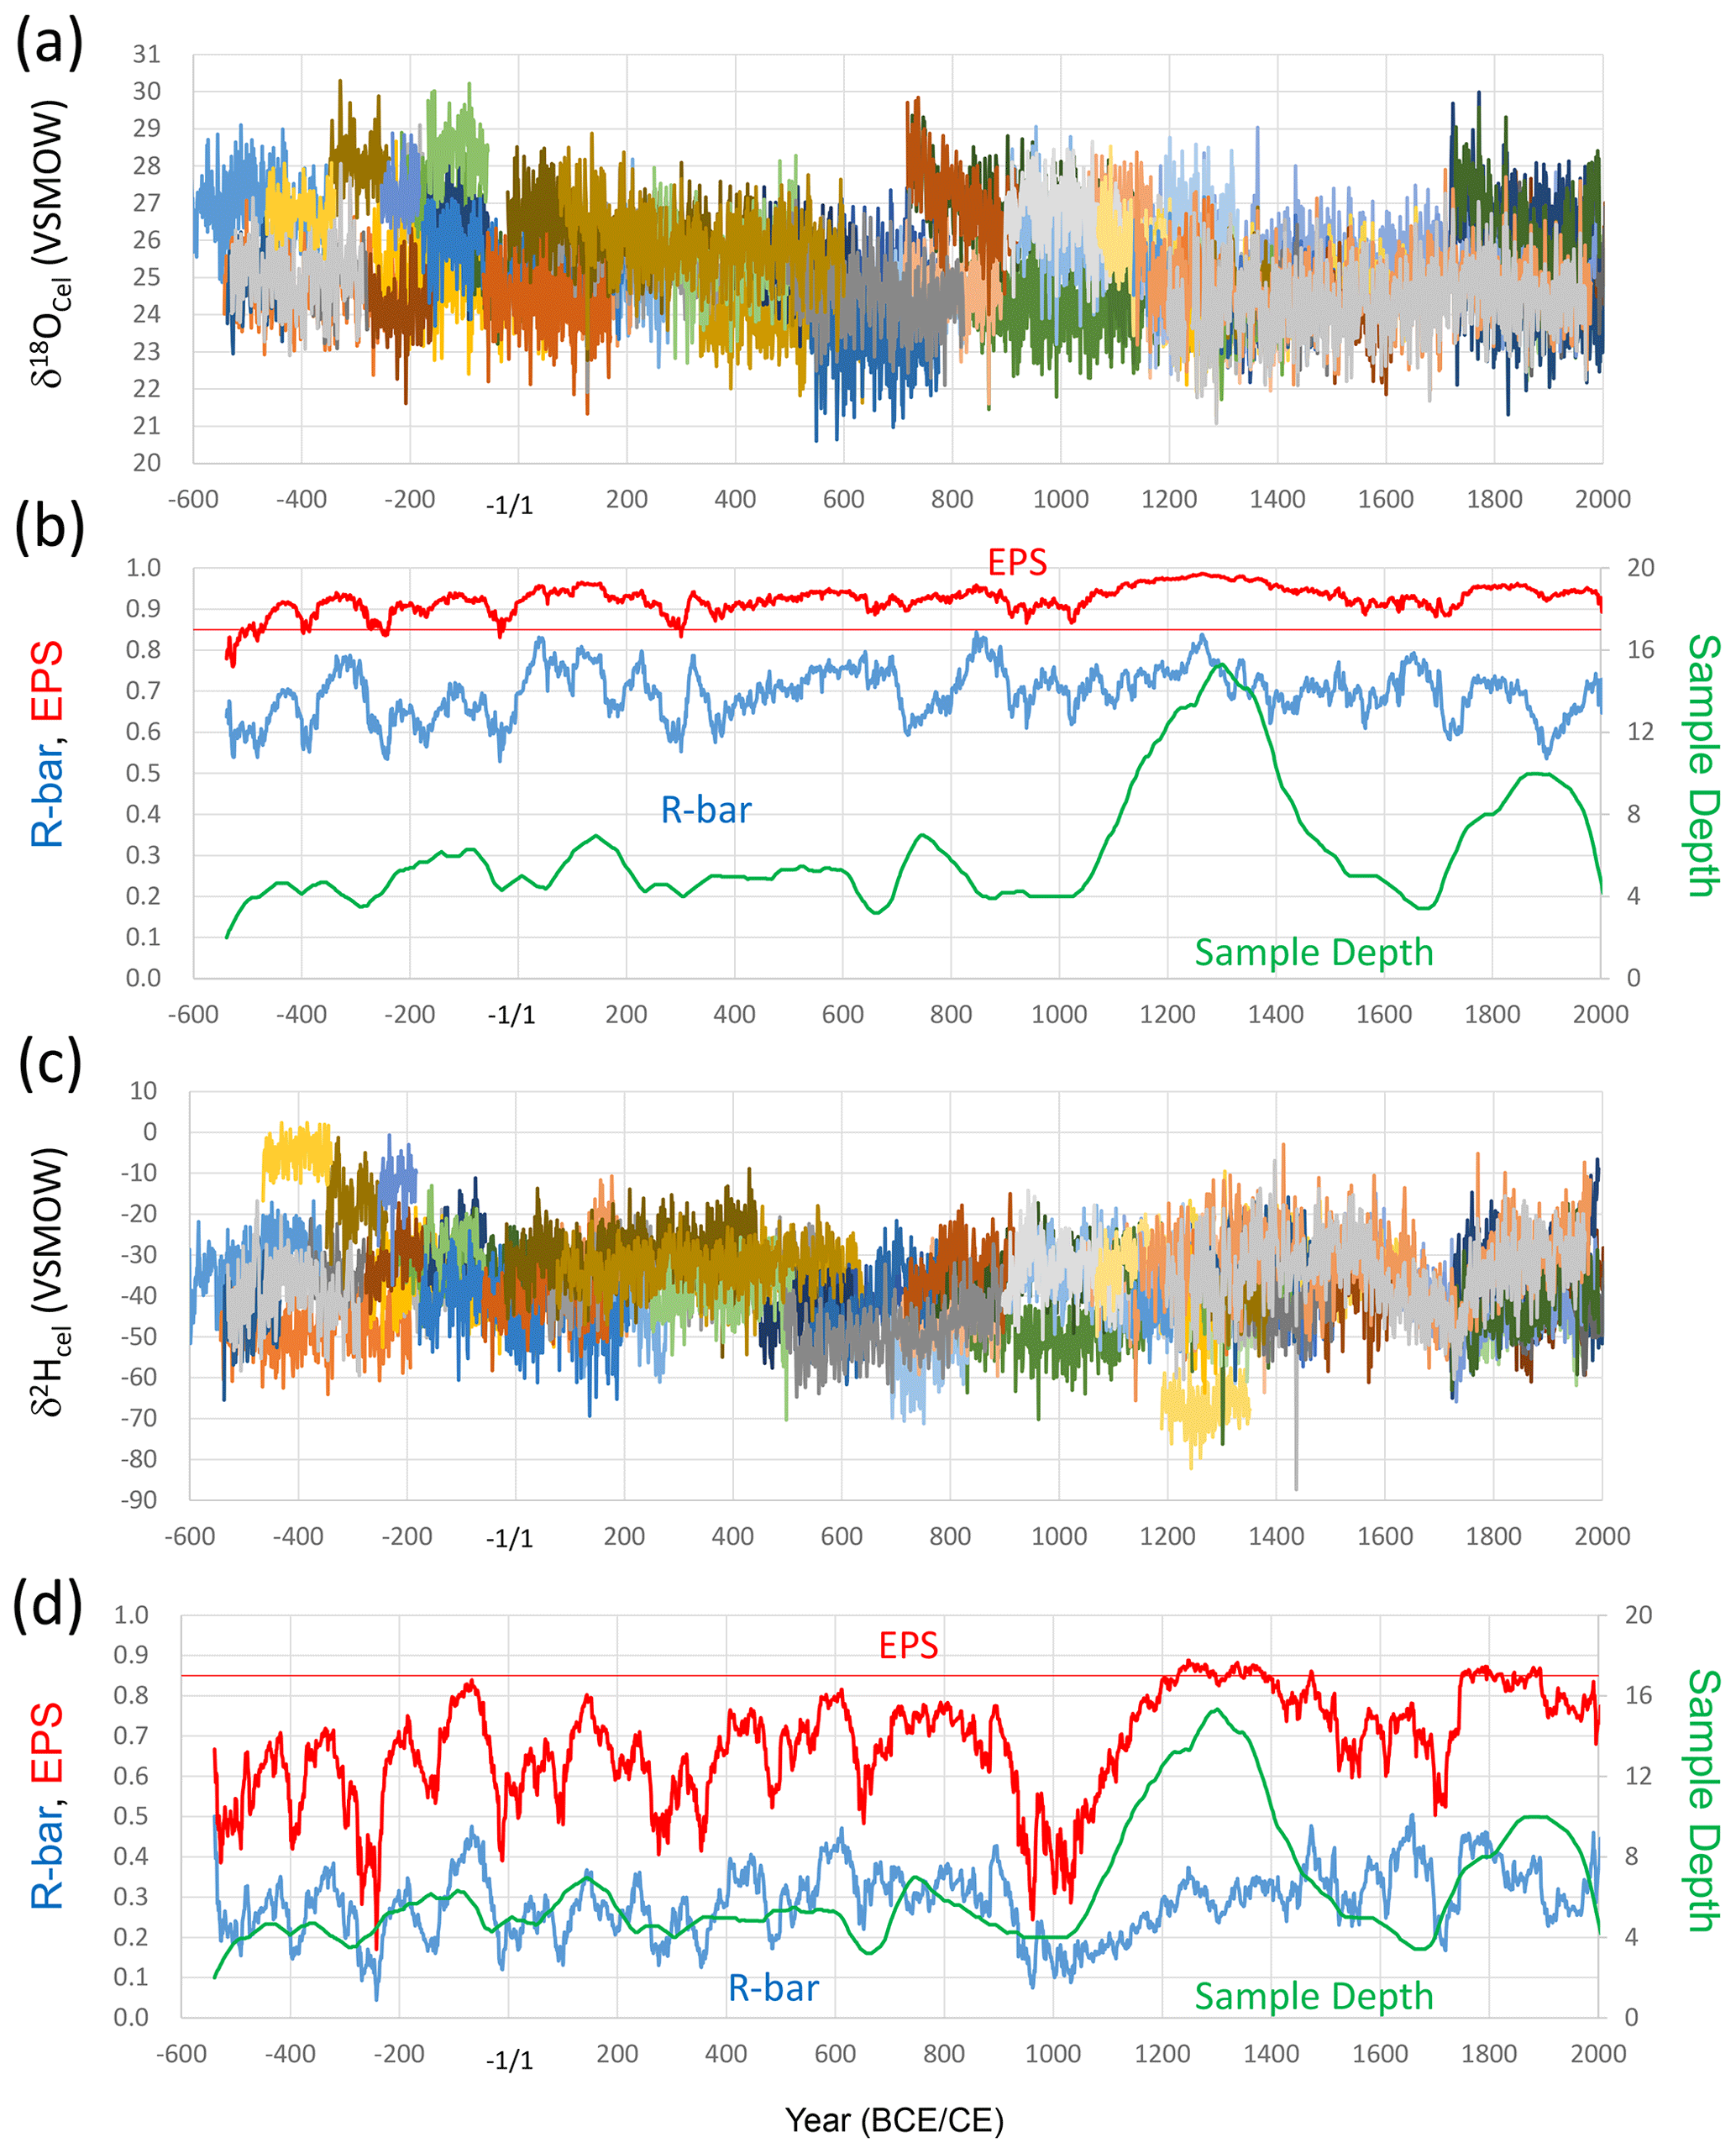
Figure 3The tree-ring cellulose δ18O and δ2H time series and their statistical properties. (a) Tree-ring cellulose δ18O time series of the 67 analyzed trees. (b) R bar (average correlation coefficients between different individual trees), EPS (see text), and sample depth (tree sample numbers) in the corresponding periods for the tree-ring cellulose δ18O dataset. (c) Tree-ring cellulose δ2H time series of the 67 analyzed trees. (d) R bar, EPS, and sample depth for the tree-ring cellulose δ2H dataset. All data in panels (b) and (d) were calculated for a total period of 51 years, including 25 years before and after the year shown.
Given that the average correlation coefficient (R bar) amongst the different δ18O time series is ca. 0.6–0.8, the expressed population signal (EPS) (Wigley et al., 1984), defined as , where the N and R values are the number of time series and R bar, respectively, is > 0.85 for almost all periods during the past 2500 years (Fig. 3b), indicating that the δ18O data in Fig. 3a are sufficient to establish accurate δ18O chronologies. However, there are distinct long-term age trends in that the δ18O values gradually decrease as the trees mature, as also noted by Esper et al. (2010). These effects must be detrended in order to reconstruct long-term climate variations using the δ18O data. There are also significant offsets in absolute δ18O values for each year amongst different trees, probably reflecting differences in the sample location and magnitude of the age trend. Given that the original locations of the trees cover a wide region from coastal to inland areas and low to high altitudes (Fig. 1), this would result in different precipitation δ18O values and relative humidity (Waseda and Nakai, 1983; Araguás-Araguás et al., 2000; Shu et al., 2005). This would account for the offset absolute δ18O values of tree-ring cellulose in different trees.
The R bar for the different δ2H time series is ca. 0.2–0.4, resulting in lower EPS values (Fig. 3d), which must reflect more complicated post-photosynthetic changes in isotopic ratios in hydrogen than in oxygen (Roden et al., 2000), as discussed later, but may be partly owing to the analytical uncertainty from the direct measurement of cellulose hydrogen including the OH group in the δ2H measurements. However, there are also distinct age trends, which are opposite to those exhibited by δ18O in that δ2H values gradually increase as the trees mature.
3.2 Relationship between short- and long-periodicity δ18O and δ2H variations
To investigate the environmental causes of the age trends in tree-ring cellulose δ18O and δ2H data, we decomposed the δ18O and δ2H time series into short- and long-periodicity variations (Figs. 4, S3, S4, and S5). These trees (no. 65 and nos. 43, 49, 40; Table S1) are Japanese cypress (Chamaecyparis obtusa) from Nagano and Gifu Prefectures. In all cases, short-periodicity variations (i.e., < 11 years) in the tree-ring cellulose δ18O and δ2H data show a clear positive correlation, indicating that both the δ18O and δ2H variations reflect a common climatological signal (i.e., precipitation isotope ratios and relative humidity) as reported in previous studies (e.g., An et al., 2014). However, the long-periodicity variations (i.e., > 11 years) in the tree-ring cellulose δ18O and δ2H data show negative correlations (Figs. 4b and S3b), suggesting the influence of opposite age trends in Fig. 3. However, the negative correlations are not very clear in Figs. S4b and S5b, probably because the climatological signals also overlap the long-periodicity variations and make the correlation between the tree-ring cellulose δ18O and δ2H positive to a certain degree.
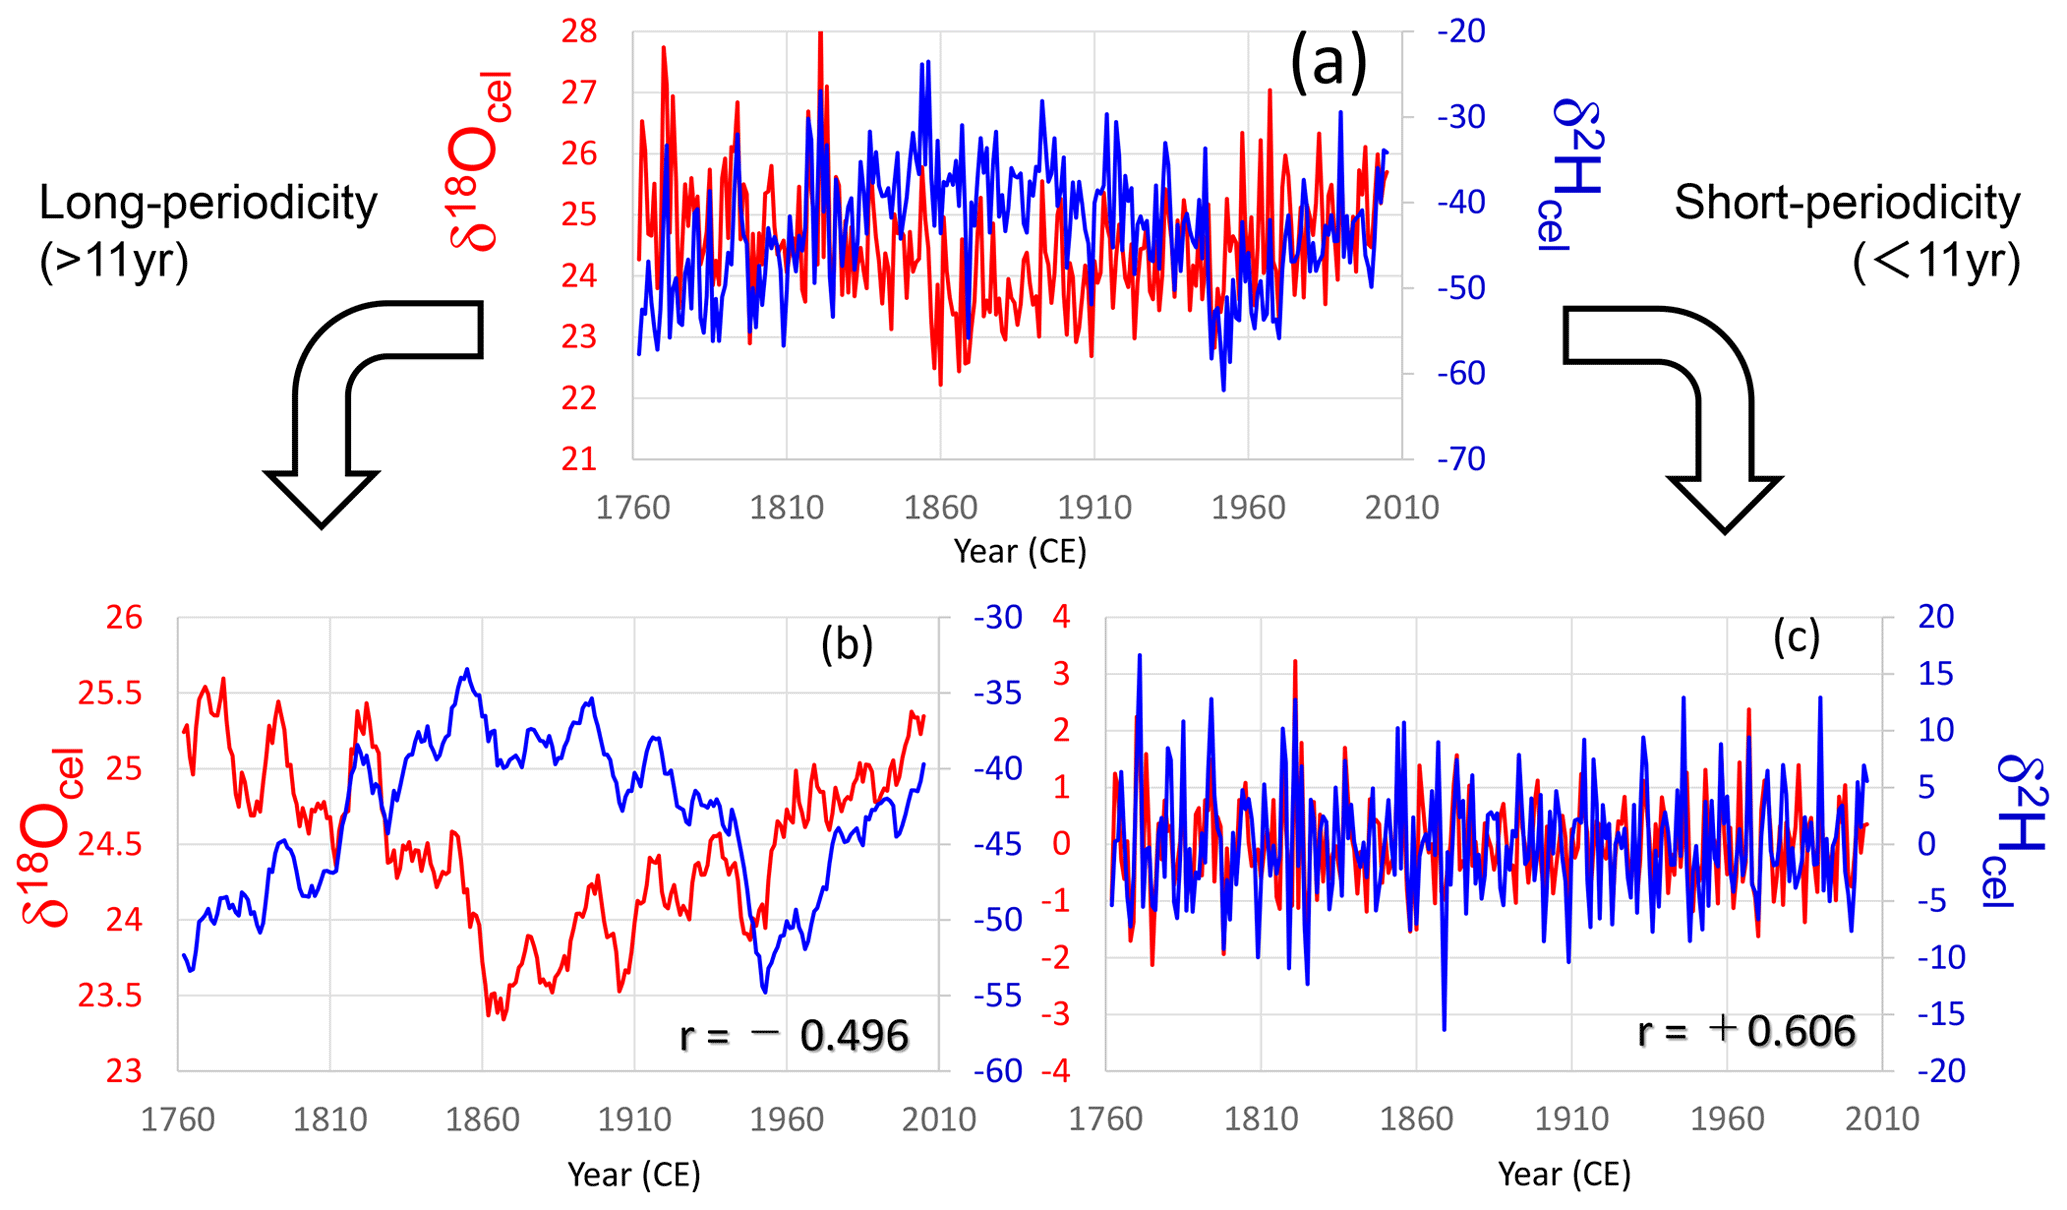
Figure 4Comparison between tree-ring cellulose δ18O (red) and δ2H (blue) time series in tree sample no. 65. (a) Raw data, (b) long-periodicity components (> 11 years; 11-year running mean), and (c) short-periodicity components (< 11 years; deviation from the 11-year running mean).
Figures 4b, S3b, S4b, and S5b show that δ18O and δ2H often changed oppositely in the long-periodicity variations, regardless of the tree age. Therefore, the long-term opposite variations in the tree-ring cellulose δ18O and δ2H data are not a simple age trend. As such, it is impossible to apply the RCS or negative exponential curve proposed by Esper et al. (2010) to remove the apparent age trend of tree-ring cellulose δ18O in central Japan.
To date, the age trend in tree-ring cellulose δ18O data has been explained by the relatively shallow root system of juvenile trees and the evaporative enrichment of 18O in soil water at the near surface. However, this cannot explain the long-term variations in tree-ring cellulose δ18O and δ2H data in this study (Figs. 4, S3, S4, and S5) because the soil water evaporation must increase both δ18O and δ2H. As illustrated in Sect. S1 and Fig. S6, the long-term opposite variations in tree-ring cellulose δ18O and δ2H are tightly related to changes in tree-ring width (growth rate of trees), suggesting that they are influenced by some physiological effect corresponding to long-term changes in tree growth rate.
3.3 Mechanical model of cellulose δ18O and δ2H
What physiological mechanism can explain the long-term opposite variations in the δ18O and δ2H values? Tree-ring cellulose δ18O and δ2H values can be expressed using the following equations, which are modified and simplified from Roden et al. (2000):
where cel and rain indicate the tree-ring cellulose and precipitation, respectively; h is the relative humidity during photosynthesis; f is the proportion of oxygen atoms in carbohydrate exchanged with xylem water during post-photosynthetic processes before cellulose synthesis, which is assumed to be equal to that of the hydrogen atoms; εeo (εeh) and εko (εkh) are isotopic fractionation factors for oxygen (hydrogen) during equilibrium water vapor evaporation from water and kinetic water vapor diffusion through leaf stomata, respectively; and εao (εah) and εho (εhh) are isotopic fractionation factors for oxygen (hydrogen) between water and carbohydrates during photosynthesis in the leaf and the post-photosynthetic processes before cellulose synthesis, respectively. Values of εeo, εko, εao, and εho are +9, +29, +27, and +27, respectively, while εeh and εkh are +80 and +25, respectively, and εah and εhh are approximately −150 and +150, respectively (Roden et al., 2000).
Given that we can assume that all the isotopic fractionation factors are constant, δ18Ocel and δ2Hcel are determined only by climatological factors (δ18Orain, δ2Hrain, and h) when f is constant. Because there are always positive correlations between δ18Orain and δ2Hrain (Dansgaard, 1964) and any change in h produces changes in δ18Ocel and δ2Hcel in Eqs. (3) and (4) in the same direction, we can expect that there are also positive correlations between δ18Ocel and δ2Hcel when f is constant. In fact, even in trees that have negative correlations between δ18Ocel and δ2Hcel for the long-periodicity variations, we observe clear positive correlations in the short-periodicity variations (Figs. 4c, S3c, S4c, and S5c), suggesting that f does not change on annual timescales and the short-periodicity variations in δ18Ocel and δ2Hcel are controlled solely by climatological factors.
However, if f increases over the long term due to some physiological reason, it can be inferred from Eqs. (3) and (4) that δ18Ocel decreases while δ2Hcel increases. This is because, for oxygen, the magnitude of isotopic fractionation between water and carbohydrates is the same (+27) for photosynthesis (εao) and post-photosynthesis processes (εho), and the increase in f reduces the effect of leaf water 18O enrichment, in Eq. (3), resulting in lower δ18Ocel. However, for hydrogen, the magnitude of isotopic fractionation between water and carbohydrates during post-photosynthesis processes () is significantly larger than that during photosynthesis () such that the increase in f results in higher δ2Hcel. This causes long-term opposite trends in δ18Ocel and δ2Hcel data (Figs. 3, 4b, S3b, S4b, and S5b), which can be interpreted as a long-term change in the rate of post-photosynthetic isotopic exchange between carbohydrates and xylem water (f). Possible physiological mechanisms for this include an increase in the rate of utilization of stored carbohydrates for stem cellulose synthesis (Nabeshima et al., 2018), rather than directly using photosynthetic products for rapid tree growth during the juvenile period. The change in the f value could also occur in the period following an abrupt improvement in the growth environment due to logging of neighboring trees (see Sect. S1 and Fig. S6).
Although the long-periodicity variations in δ18Ocel and δ2Hcel are influenced by predominant physiological effects (Figs. 4b, S3b, S4b, and S5b), this does not mean that the long-periodicity variations in δ18Ocel and δ2Hcel do not contain climatological components. In fact, climate varies at all timescales such that long-term variations in δ18Ocel and δ2Hcel inevitably include climatological components. It is therefore challenging to resolve the climatic signals from the physiological effects. In dendrochronological studies based on tree-ring width, RCS is used to separate and estimate climatological components in tree-ring width time series (Esper et al., 2002; Grudd et al., 2002; Büntgen et al., 2005). However, it is difficult to create a regional standardized δ18Ocel curve like the RCS for the samples analyzed in this study because the physiological effects on δ18Ocel are not solely an age trend and also reflect past human disturbances to the trees such as logging activity (see Sect. S1; Totman, 1989).
3.4 Classification of δ18O and δ2H variations into climatological and physiological components
To extract the climatological component of the variations in the tree-ring cellulose δ18O data, we modified the model of cellulose δ18O and δ2H in Eqs. (3) and (4) into climatological and physiological components. Given there are four variables (δ18Orain, δ2Hrain, h, and f) in Eqs. (3) and (4), we first define their variations as follows:
where δ18Orain(0), δ2Hrain(0), h(0), and f(0) are δ18Orain, δ2Hrain, h, and f in a fixed year (0), respectively, and Δδ18Orain, Δδ2Hrain, Δh, and Δf are deviations in δ18Orain, δ2Hrain, h, and f from the fixed year (0) to an arbitrary year, respectively. By substituting Eqs. (5)–(8) into Eqs. (3)–(4) and neglecting the second-order minor terms (ΔfΔh, ΔfΔδ18Orain, and ΔfΔδ2Hrain), Eqs. (3) and (4) can be rewritten as follows:
We can now introduce new equations for the climatological and physiological components in the tree-ring cellulose δ18O and δ2H time series, as follows:
where Δδ18Ocel(climate), Δδ18Ocel(physiol), Δδ2Hcel(climate), and Δδ2Hcel(physiol) are variations in the tree-ring cellulose δ18O and δ2H from the fixed year (0) with respect to an arbitrary year due to climatological and physiological factors, respectively. We can then reformulate δ18Ocel and δ2Hcel as the sum of climatological and physiological components, as follows:
where δ18Ocel(0) and δ2Hcel(0) are δ18Ocel and δ2Hcel at the fixed year (0), respectively.
3.5 A method to extract the climatological component from cellulose δ18O
Here we propose a new method to calculate the climatological component in variations of tree-ring cellulose δ18O (Δδ18Ocel(climate)) by solving simultaneous equations consisting of Eqs. (15)–(16), with two additional equations based on the relationship between Δδ18Ocel(climate) and Δδ2Hcel(climate) and between Δδ18Ocel(physiol) and Δδ2Hcel(physiol) (i.e., Eqs. 17–18). This is based on the theoretical and observational understanding that tree-ring cellulose δ18O and δ2H data correlate positively and negatively due to climatological and physiological factors, respectively. (Note that we restrict the physiological effects to the change in the rate of post-photosynthesis isotope exchange with xylem water here. If there are other types of ecophysiological effects generating a positive relationship between δ18Ocel and δ2Hcel, such as root deepening or growth season shift, they are counted as parts of the climatological effects here.)
where A and B are positive proportional coefficients, as shown in Eqs. (19)–(20) and defined by Eqs. (11)–(14).
If A and B are constant, we can solve the simultaneous Eqs. (15)–(18) in order to cancel out the physiological component (Δδ18Ocel(physiol)) and extract the climatological component (Δδ18Ocel(climate)), as follows:
In fact, A might not be constant because there are three variables (Δδ18Orain, Δδ2Hrain, and Δh) in Eq. (19). Δδ18Orain and Δδ2Hrain may change somewhat independently from each other over a wide spatiotemporal range, and the relationship between Δδ18Orain (Δδ2Hrain) and Δh may not be simple in Eq. (19). However, the significant positive correlations in the short-periodicity variations between δ18Ocel and δ2Hcel (Figs. 4c, S3c, S4c, and S5c) suggest there may be an empirical constant value for A in a restricted study area such as central Japan. In contrast to A, B may be nearly constant because there are no variables in Eq. (20).
Although the assumption that A and B are constant might not be valid, this assumption is needed to explicitly calculate Δδ18Ocel(climate) using Eq. (21). Hence, we tentatively assumed that A and B are constant and calculated Δδ18Ocel(climate) over the past 2600 years using Eq. (21). We then verify this by comparison with numerous local, regional, and global meteorological, historical, and paleoclimatological records of past summer climate over various timescales in order to judge whether the simplest assumption, that A and B in Eq. (21) are constant, is practically useful or not for paleoclimatological studies.
3.6 Method to determine the proportional coefficients A and B
To utilize Eq. (21), we need to determine the proportional coefficients A and B in Eqs. (17)–(20). In principle, there are two ways to determine A and B: a theoretical approach based on Eqs. (19)–(20) and an empirical approach based on Eqs. (17)–(18).
We first consider the feasibility of the theoretical approach. It is not easy to determine A using Eq. (19) because there are three variables (Δδ18Orain, Δδ2Hrain, and Δh). If the rainwater isotope ratios do not change (both Δδ18Orain and Δδ2Hrain=0), then A is equal to , which is (Roden and Ehleringer, 2000). However, if relative humidity does not change (Δh=0), A=Δδ2Hrain∕Δδ18Orain, which is equal to 8 if the meteoric waterline is followed (Dansgaard, 1964). Given the wide range of potential A values from 2.76 to 8, we cannot easily theoretically define A. On the other hand, B may be easier to determine theoretically because there are no variables in Eq. (20). For example, if the relative humidity h(0) is 0.5, B=13 because εeo, εko, εao, εho, εeh, εkh, εah, and εhh are +9, +29, +27, +27, +80, +25, ca. −150, and +150, respectively (Roden et al., 2000). However, in fact, it is not easy to fix h(0) because the relative humidity typically shows large diurnal variations, and the timing of δ18O incorporation into leaf carbohydrates is unknown. Moreover, the εah and εhh values of −150 and +150 are just approximations. For example, while Yakir and DeNiro (1990) obtained values of −171 and +158 for εah and εhh, respectively, Estep and Hoering (1981) obtained values of −100 to −120 for εah, and Luo and Sternberg (1992) reported values of +144 to +166 for εhh.
Therefore, we used the empirical approach to estimate A and B. The A value in Eq. (17) can be estimated from the relationship between δ18Ocel and δ2Hcel in the short-periodicity variations because they are positively correlated due to the climate variations shown in Figs. 4c, S3c, S4c, and S5c. In the case of the B value in Eq. (18), the situation is more complex. Although there are apparent negative correlations between δ18Ocel and δ2Hcel in the long-periodicity variations (Figs. 4b and S3b), these are also affected by long-term climate signals such that it is difficult to resolve the physiological component. Here we propose a practical method to determine the B value. After fixing A, we first set various B values in order to calculate the temporal variations in the climatological component of the tree-ring cellulose δ18O data (Δδ18Ocel(climate)) for all 67 tree samples by substituting individual δ18Ocel and δ2Hcel time series in Fig. 3a and c into Eq. (21). We then combine the Δδ18Ocel(climate) time series of all 67 trees calculated from each B value using the method described below (Sect. 3.7). Finally, we compare the overall trend of the combined time series of Δδ18Ocel(climate) data with that of a simple average of all 67 raw δ18Ocel time series in Fig. 3a in order to find the B value that produced the best match between the two time series. This procedure assumes that, although individual trees possess different age trends and level offsets, averaging of all data from all trees covering all periods and all locations in this study may cancel out these effects and allow climate variations to be discerned, at least in terms of “the overall trend”.
3.7 Method to combine individual tree-ring time series with large level offsets
To reconstruct multi-millennial variations in the climatological component of the tree-ring cellulose δ18O data (Δδ18Ocel(climate)), we must combine individual time series from different trees with variable level offsets due to different sample locations. As such, we cannot simply average all data for individual trees because this produces steps in the composite record at both ends of the time series of individual trees. Numerous procedures have been proposed to combine tree-ring time series (e.g., Hangartner et al., 2012); here we propose a new iterative calculation method (Fig. 5).
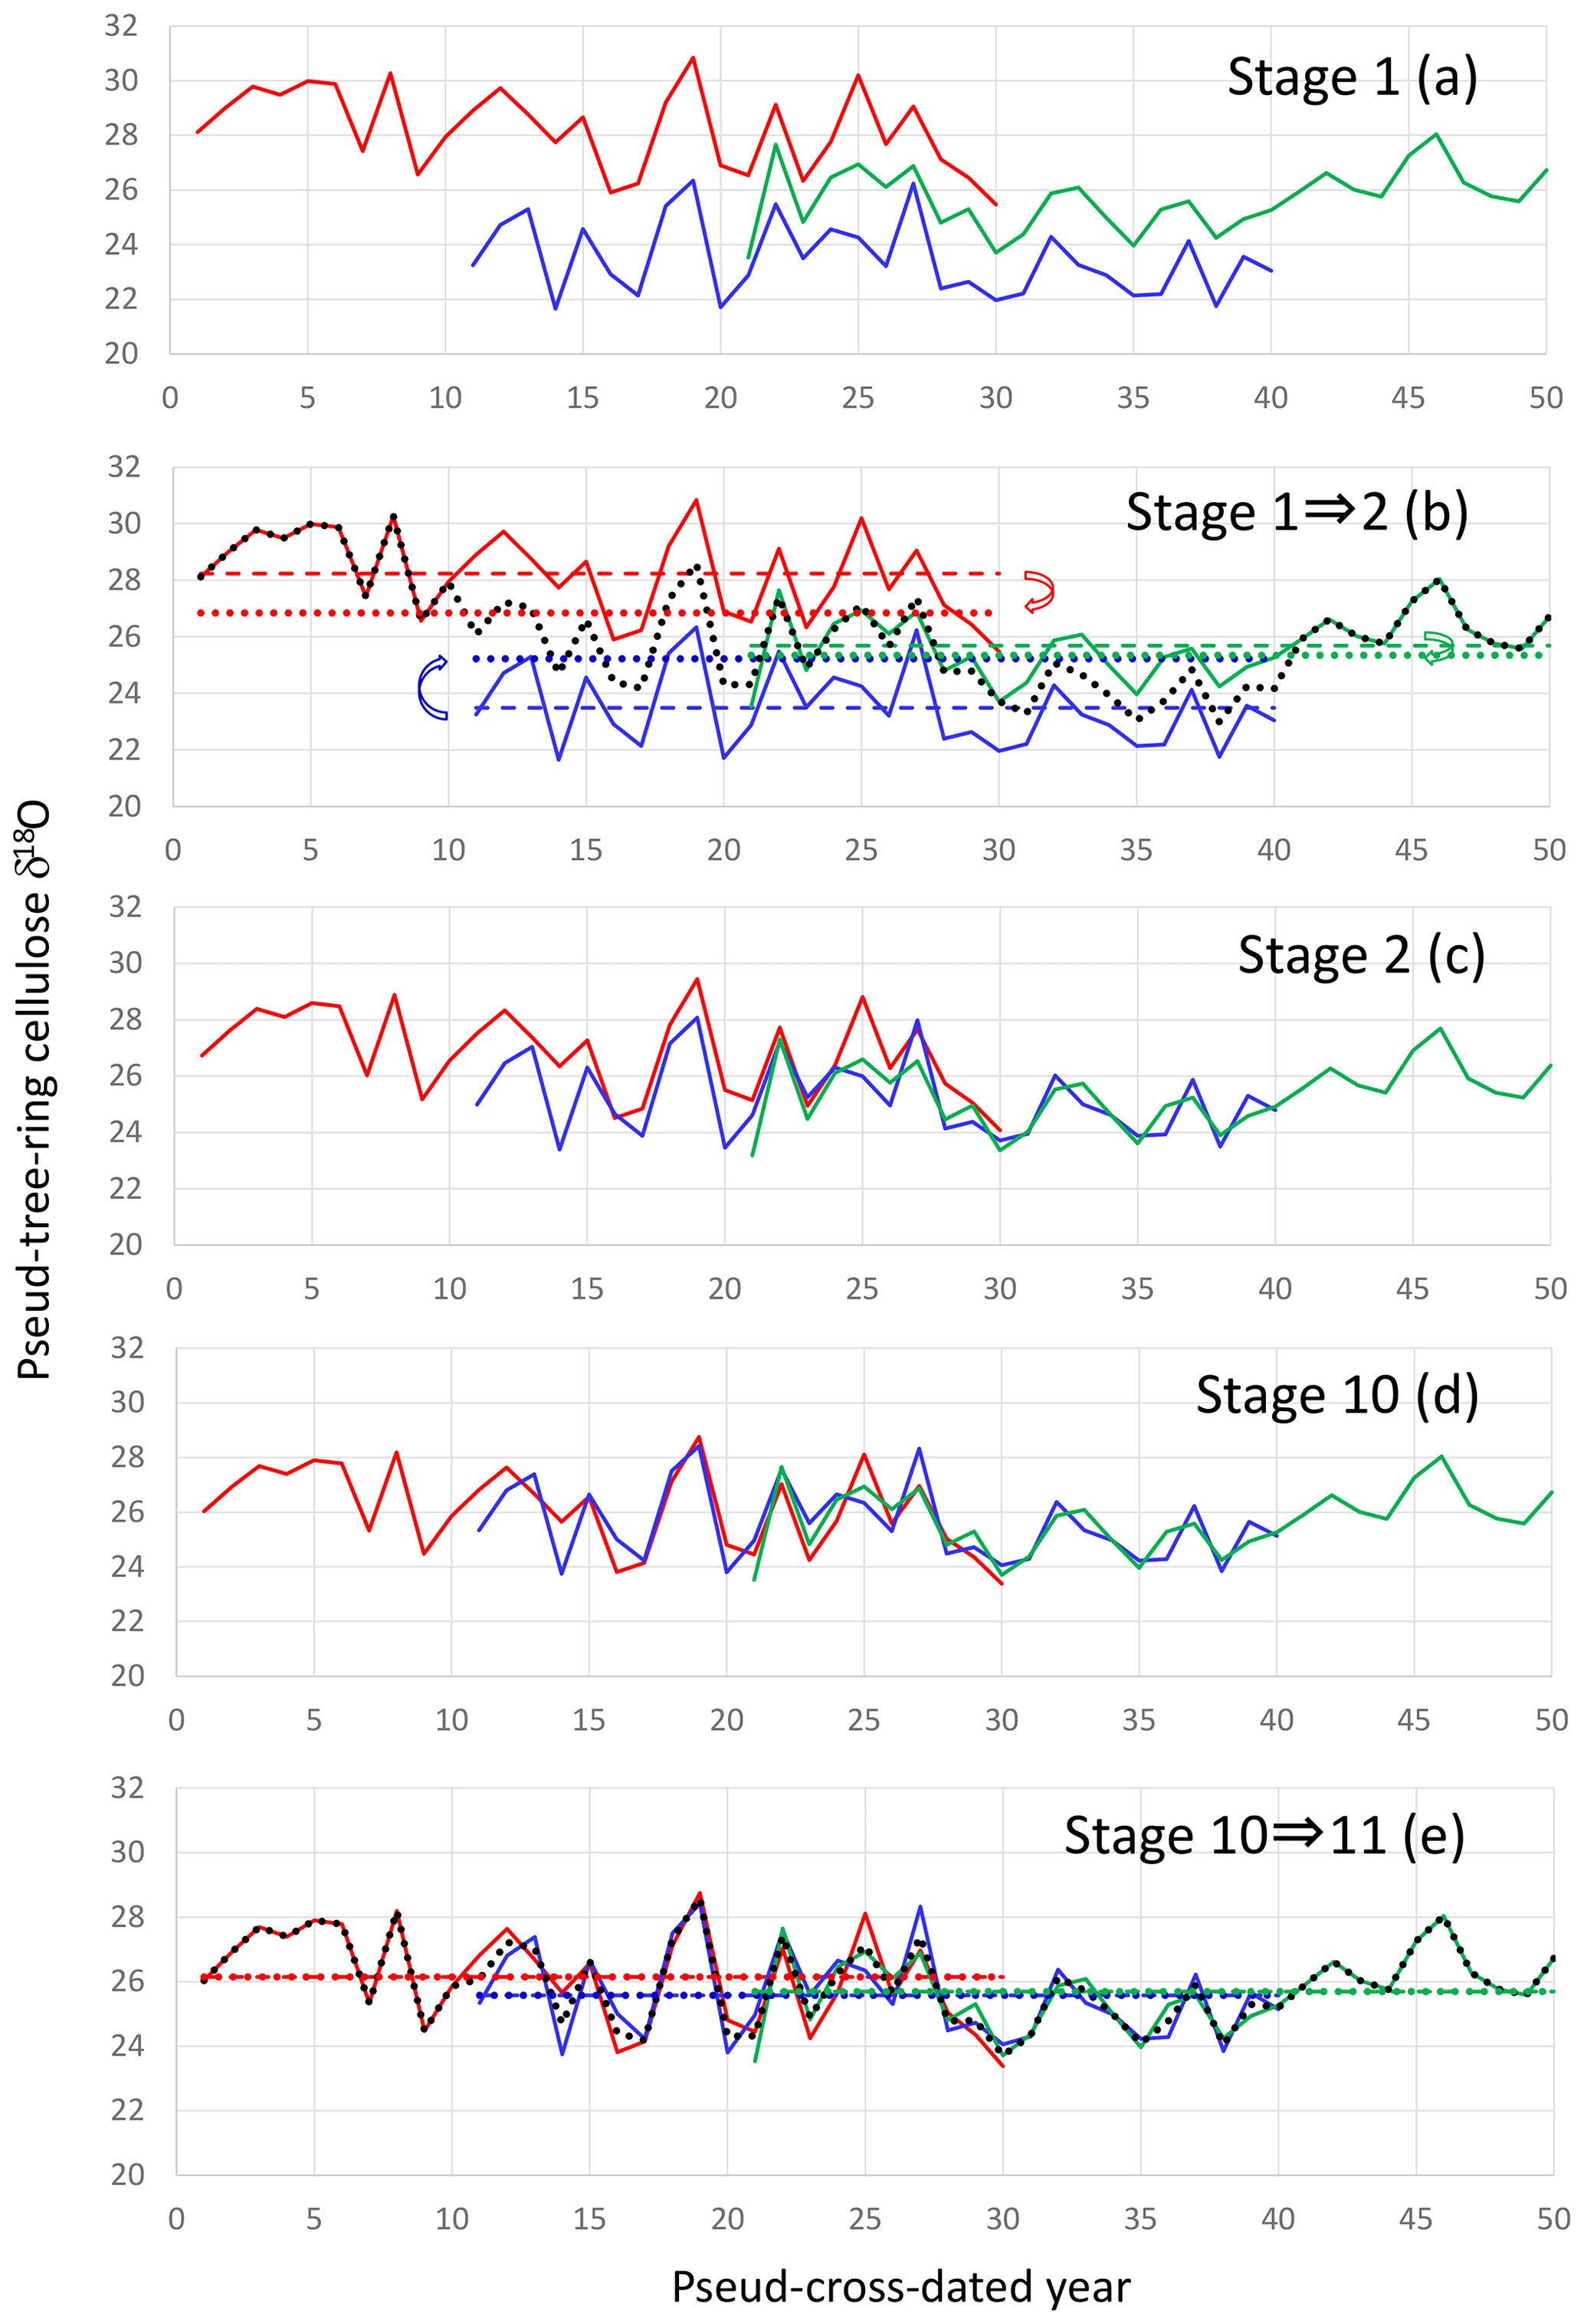
Figure 5The iterative calculation method used to smoothly combine many individual tree-ring time series with large level offsets. (a) Pseudo-cross-dated tree-ring cellulose δ18O time series (Stage 1). (b) Averaging of all time series in Stage 1 (black dotted line) and offsetting individual time series in Stage 1 to the position where the average of the individual time series (colored dashed lines) becomes equal to the average of the black dotted line during the corresponding period (colored dotted lines) by retaining the original temporal patterns. (c) Result of offsetting of individual time series from Stage 1 (Stage 2). (d) Result of nine iterative calculations from Stage 1 (Stage 10). (e) Procedure from Stages 10 to 11. We obtain a unique combined time series when the dotted lines become equal to the dashed lines within a finite number of iterations.
Firstly, we simply average all the individual time series to make a preliminary combined time series. Secondly, we offset each individual time series up or down, retaining their original patterns of temporal variations, to the position where the temporal average of the individual time series becomes equal to that of the preliminary combined time series for the corresponding period of the individual tree. Thirdly, we average all the offset individual time series to make a refined combined time series. We iterate this procedure until the temporal average of the individual time series becomes equal to that of the combined time series for the corresponding period, without any further offsetting of the individual time series. If you start from the same original dataset on δ18O variations of stem segments, the pattern of relative variation in the final combined δ18O time series is mathematically unique although its absolute value has no meaning. That is, there is no room for artifacts to influence resultant time series. This method assumes that the tree-ring absolute isotope ratios of individual trees are not important because they depend on the sample locations but that the temporal variations are well correlated amongst different trees due to a common regional climate signal.
3.8 Procedure to calculate the climatological component in tree-ring δ18O (Δδ18Ocel(climate)) data
Figure 6a shows how the combined time series for Δδ18Ocel(climate) is constructed. Firstly, we determine A from the short-periodicity variations between δ18Ocel and δ2Hcel in individual trees. Secondly, we use δ18Ocel and δ2Hcel to calculate Δδ18Ocel(climate) for individual trees using various B values in Eq. (21). Thirdly, we combine the Δδ18Ocel(climate) time series of all trees for each case of different B values. Fourthly, we select the best B value by comparison of the overall trends in the combined Δδ18Ocel(climate) and average δ18Ocel data. Finally, we reintegrate the long-periodicity variations in Δδ18Ocel(climate) calculated using the best B value and short-periodicity variations in δ18Ocel for all individual trees at an adequate threshold periodicity and combine all individual data again because the physiological factors do not appear to affect the short-periodicity δ18Ocel variation so that we should keep the original δ18Ocel variations in the high-frequency domain. In this procedure (Fig. 6a), the iterative calculation used to combine many tree-ring time series in the third step is the most time-consuming because various B values are tested.
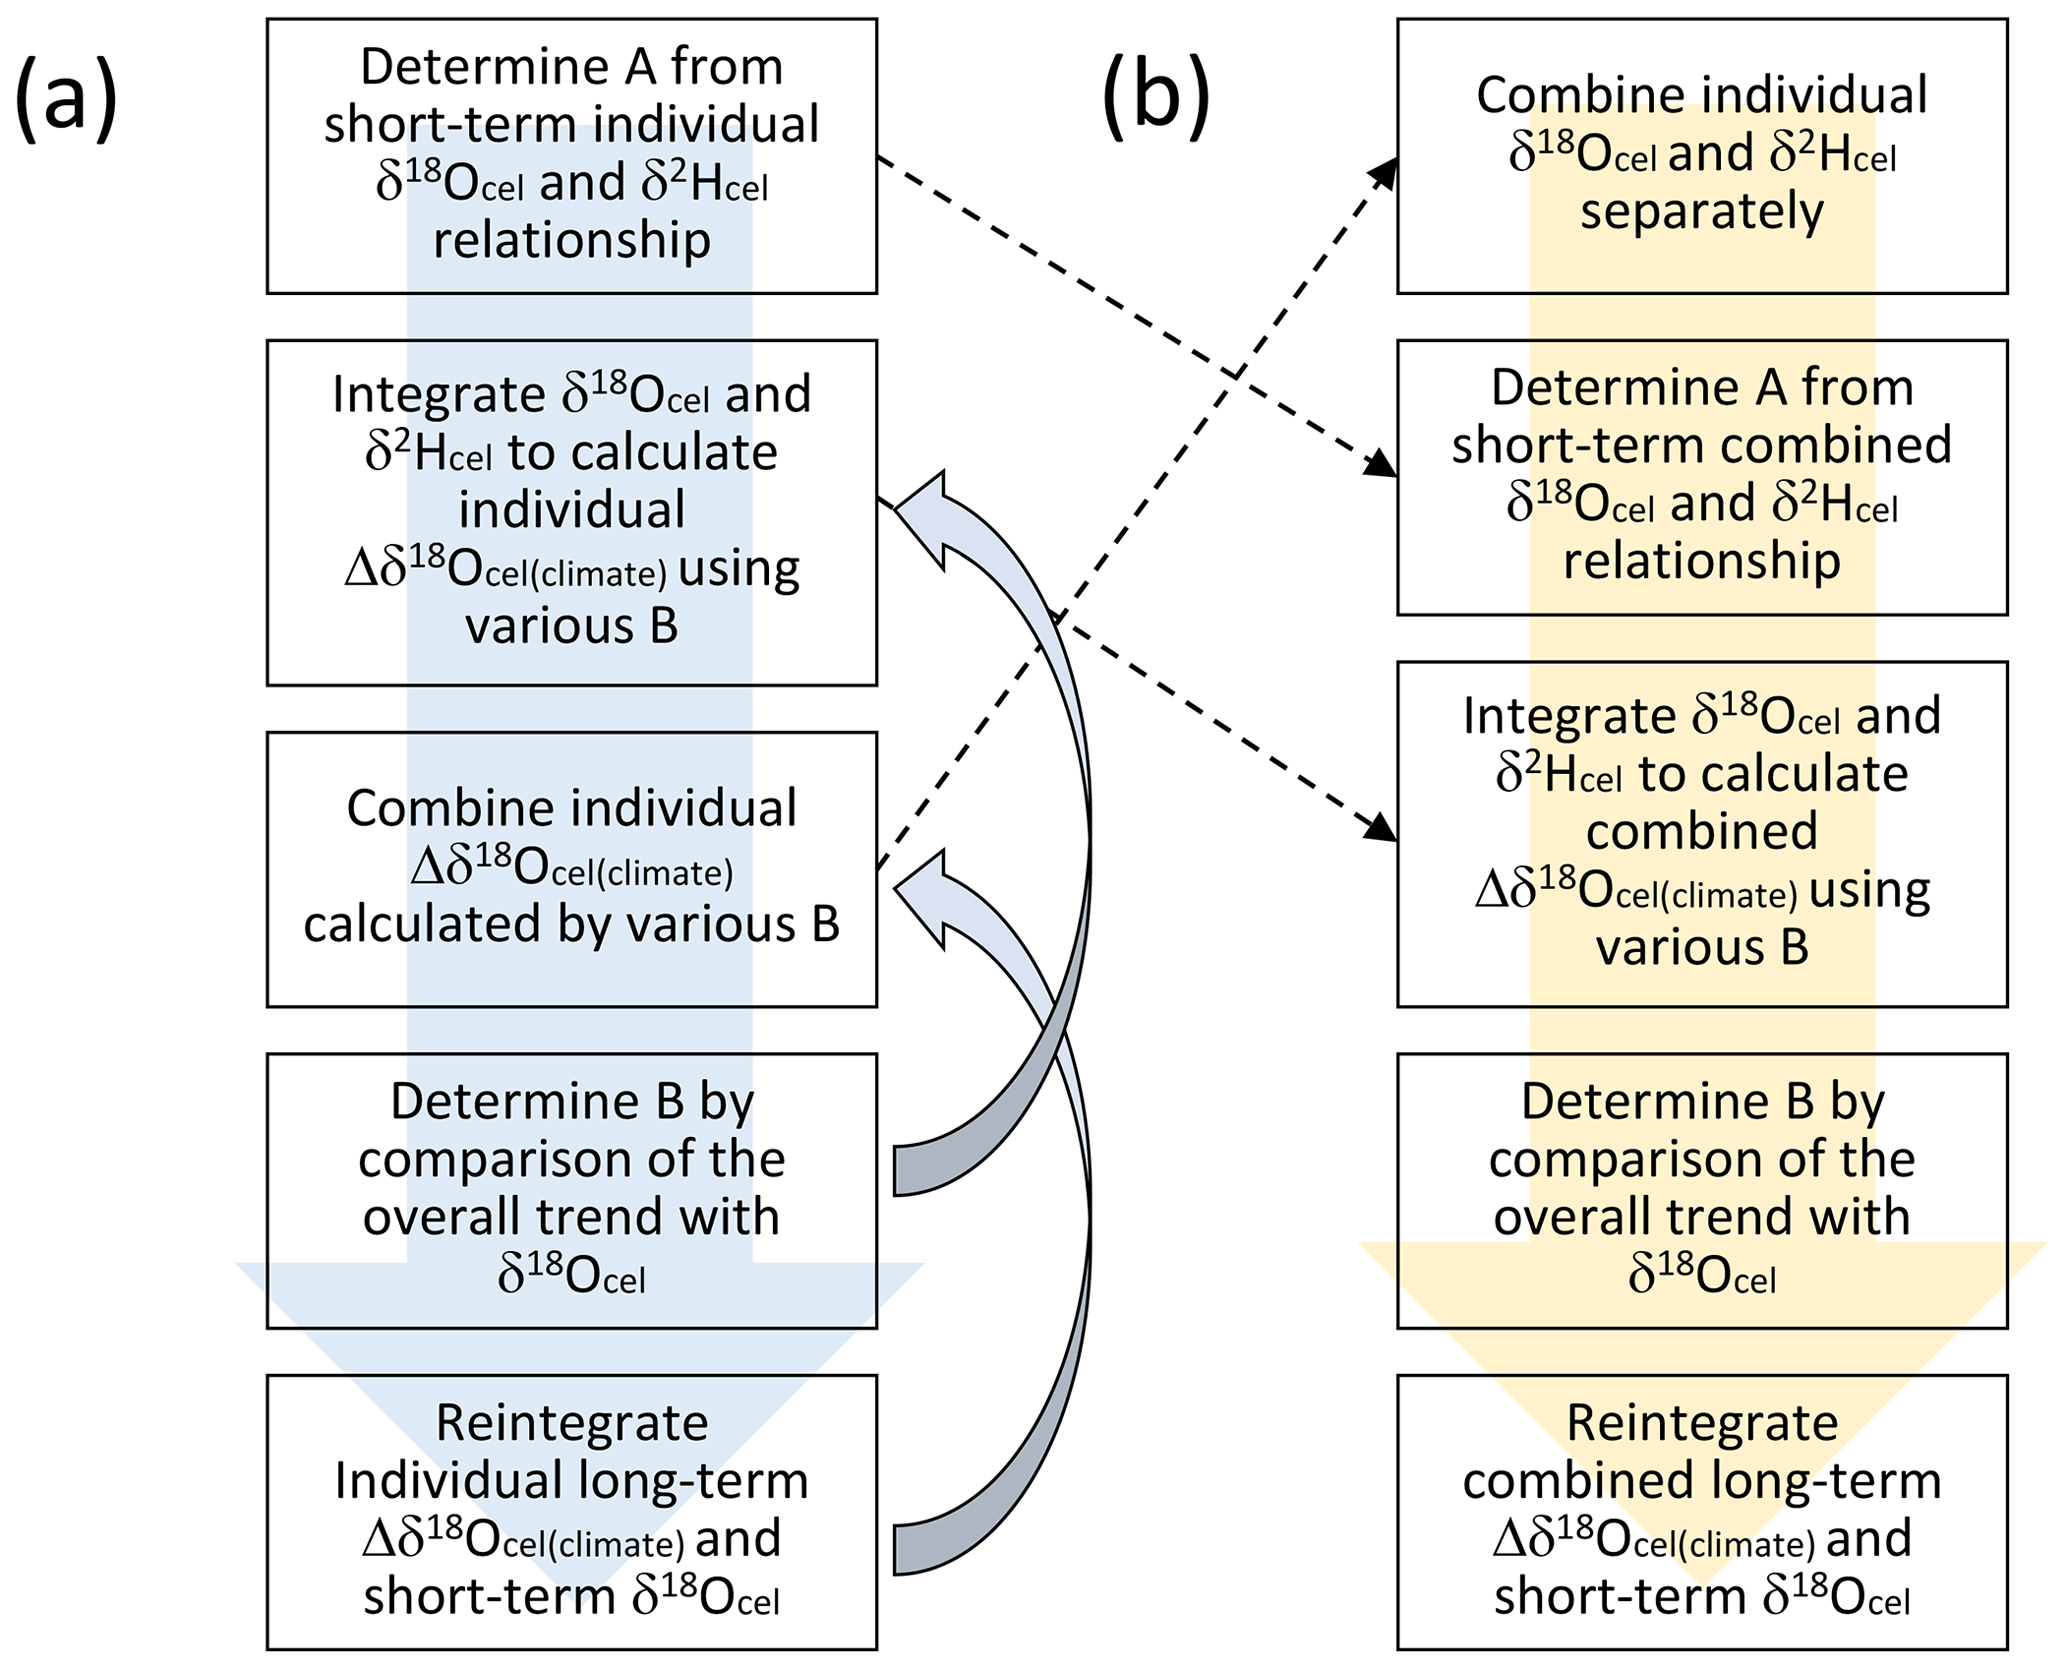
Figure 6The two procedures used to establish the smoothly combined climatological component of the variations in the tree-ring cellulose δ18O data (Δδ18Ocel(climate)). Although the order of procedures is different in panels (a) and (b), the results are the same if we assume unique A and B values for all individual trees.
Although A can be determined independently for each tree, we can only obtain one B value for all the trees. In a practical sense, it is not meaningful to determine A separately for each tree because all the trees were collected within central Japan (Fig. 1). If we assume that A and B are unique for all trees in this study, we can simplify the procedure as shown in Fig. 6b to reduce the time required for the iterative calculation. Considering that all the calculations used to combine and integrate the time series in Fig. 6 are linear, we can change the order of calculation between combination and integration. In fact, if we use common A and B values, the resultant combined time series for Δδ18Ocel(climate) does not change when using the two procedures (Fig. 6a and b). In Fig. 6b, we first combine the δ18Ocel and δ2Hcel time series of all trees in Fig. 3 using the method shown in Fig. 5. Secondly, we determine A by investigating the relationship between short-periodicity variations of δ18Ocel and δ2Hcel in their combined time series. Thirdly, we integrate the combined δ18Ocel and δ2Hcel records to show temporal variations in Δδ18Ocel(climate) using various B values. Fourthly, we select the best B value by comparison of the overall trends of the Δδ18Ocel(climate) time series and average δ18Ocel. Finally, we reintegrate the long-periodicity variations in Δδ18Ocel(climate) and short-periodicity variations in combined δ18Ocel at an adequate threshold periodicity to keep the original δ18Ocel variation in the high-frequency domain.
3.9 Determination of the climatological and physiological proportional coefficients (A and B)
We combined all the time series for δ18Ocel and δ2Hcel shown in Fig. 3 using the method illustrated in Fig. 5. The final combined δ18Ocel and δ2Hcel time series after 1000 iterations are shown in Fig. 7. The long-term variations in the combined δ18Ocel and δ2Hcel time series obviously reflect the accumulated age trends, in which the δ18Ocel and δ2Hcel tend to decrease and increase over a long timescale, respectively.
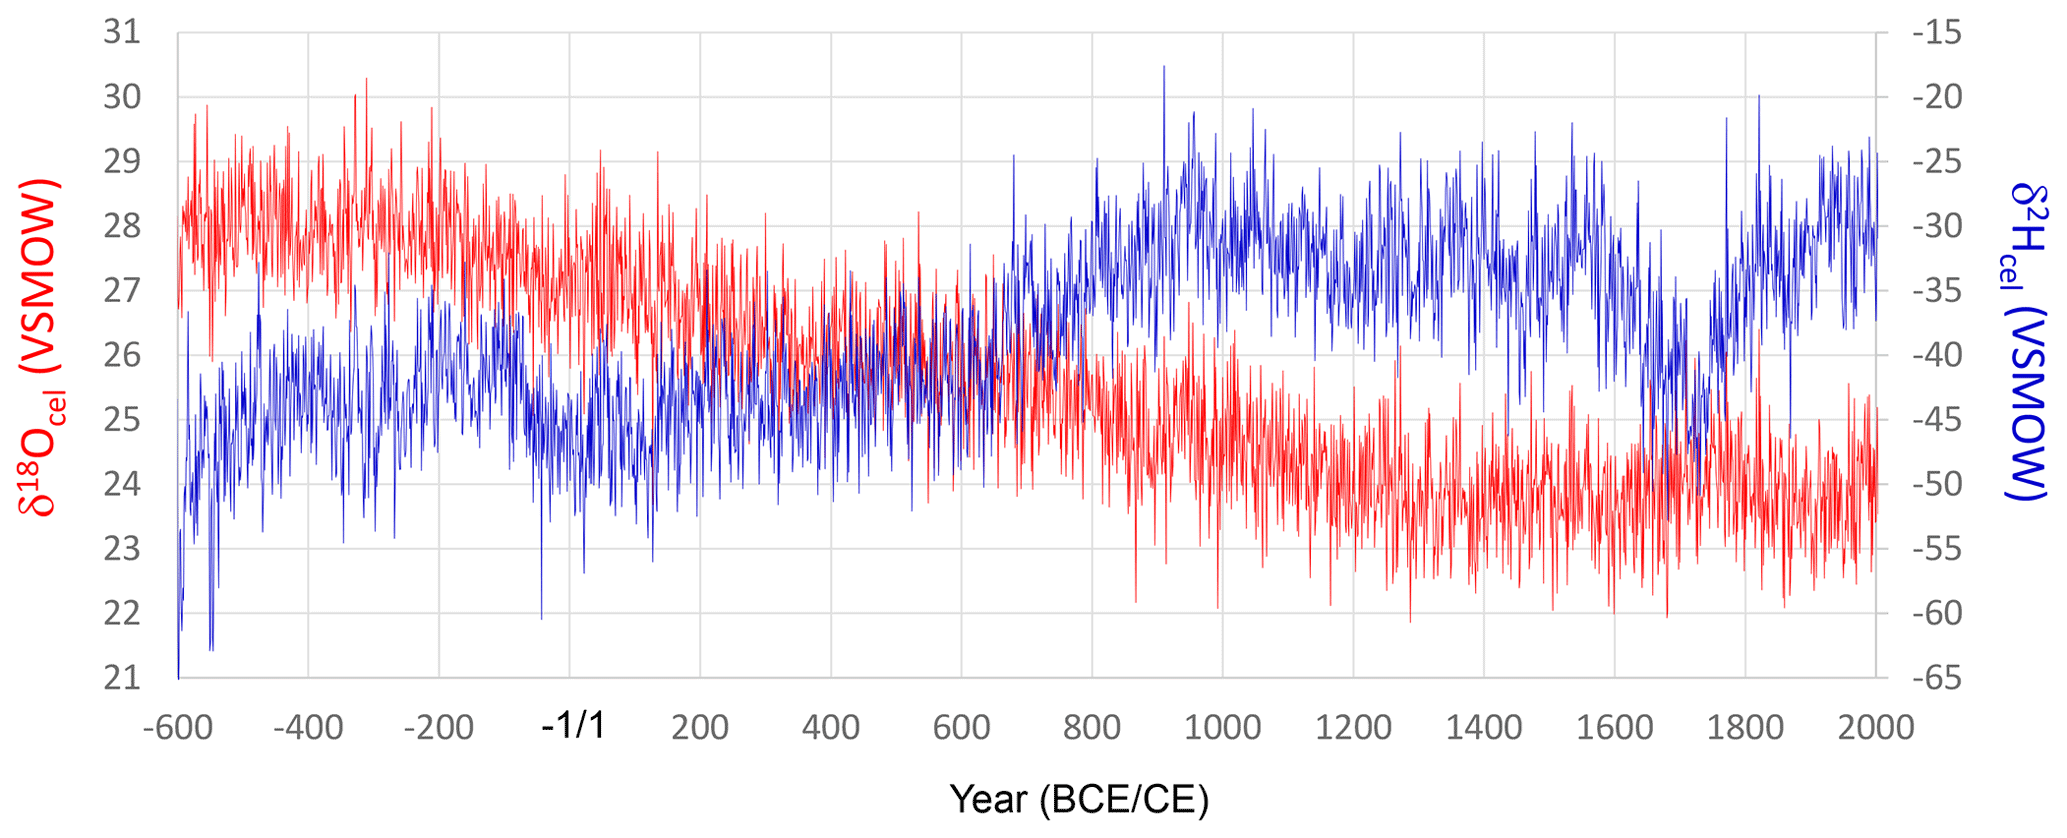
Figure 7Smoothly combined individual time series of δ18Ocel and δ2Hcel from Fig. 3a and c using the iterative calculation method shown in Fig. 5. The combined time series is after 1000 iterations (Stage 1000).
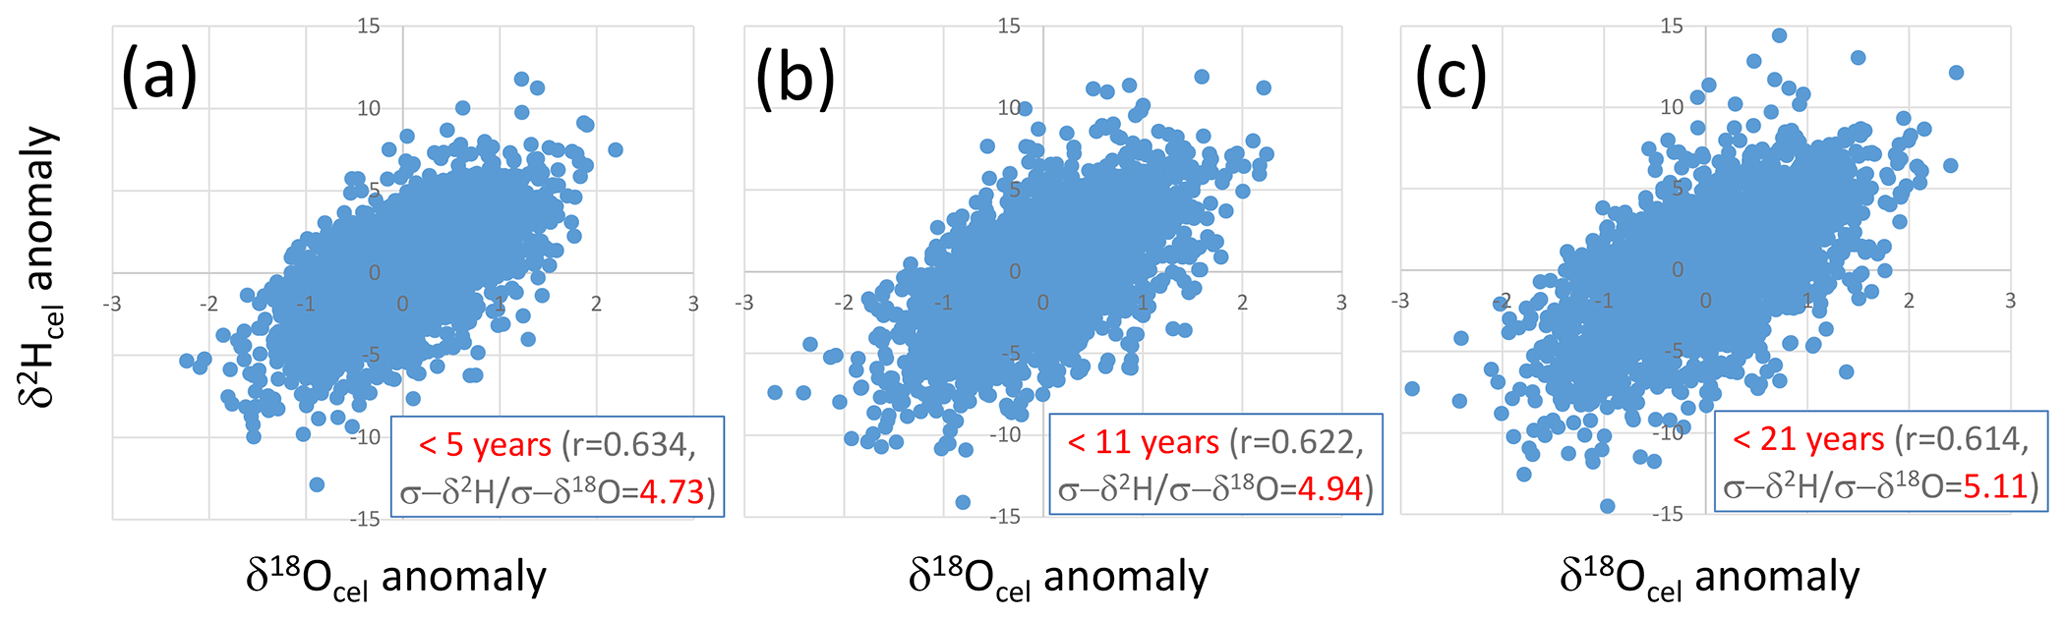
Figure 8Relationships between short-periodicity components of δ18Ocel and δ2Hcel that are (a) < 5 years, (b) < 11 years, and (c) < 21 years, defined as the anomalies from the 5-, 11-, and 21-year running means of the combined δ18Ocel and δ2Hcel time series in Fig. 7, respectively.
We found that the climatological proportional coefficient A in Eq. (17) can be set to 5 because there are positive correlations in the short-periodicity variations of the combined δ2Hcel and δ18Ocel records with a slope of ca. 5 (Fig. 8), irrespective of the threshold year for extracting the short-periodicity variations (i.e., 5, 11, or 21 years). A value of 5 is within the theoretical range of A of 2.76 to 8 obtained from Eq. (19). We used the δ2Hcel data directly for the calculation of A, although the amplitude of variations in δ2Hcel is reduced to 70 % of that of the original cellulose such that a value of 5 is equivalent to about 7 in the theoretical range.
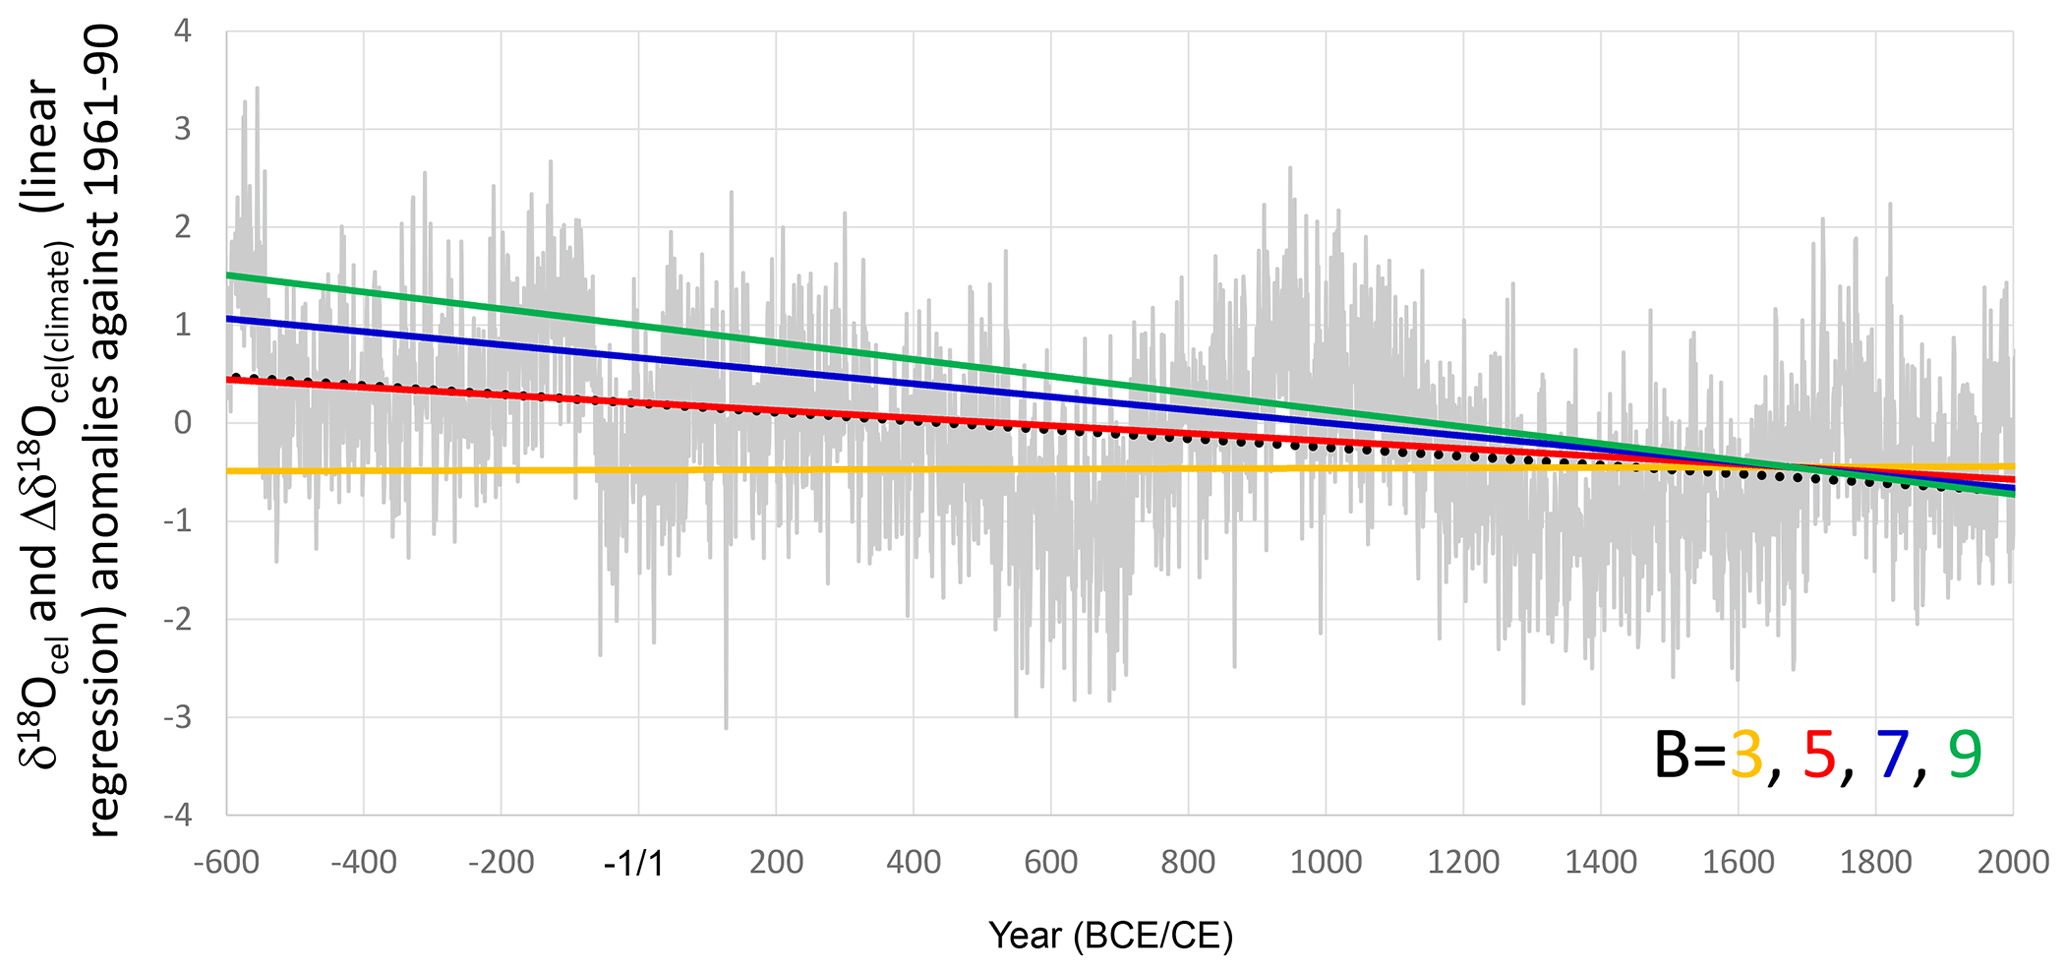
Figure 9Linear regressions of Δδ18Ocel(climate) calculated using 3 (orange line), 5 (red line), 7 (blue line), and 9 (green line) as B values, with A = 5 in Eq. (21), and the simple averages of all tree-ring cellulose δ18O data in Fig. 3a (gray line) with a linear regression (black dotted line).
To determine the most appropriate value for the physiological proportional coefficient B in Eq. (18), we integrated the combined δ18Ocel and δ2Hcel time series in Fig. 9 using Eq. (21) in order to calculate Δδ18Ocel(climate) with B values of 3, 5, 7, and 9, as well as an A value 5. We then examined the overall trend in Δδ18Ocel(climate) and found that it became equal to the overall trend of the average δ18Ocel (Fig. 3a) when B = 5.4 (Fig. 9). Given the 70 % amplitude reduction of Δδ2Hcel, 5.4 is equivalent to 7.7 from the theoretical estimation. If we assume that εeo, εko, εao, εho, εeh, εkh, εah, and εhh are +9, +29, +27, +27, +80, +25, −150, and +150, respectively, then B = 7.7 means that h(0) is 0.25 in Eq. (20). Given that 0.25 is too low for the relative humidity in central Japan, the values of −150 and +150 for εah and εhh, respectively, may be overestimated. However, because the overall trend of the integrated Δδ18Ocel(climate) using B = 5.4 is equal to that of the average of raw δ18Ocel values, we use this value of B hereafter.
3.10 Calculation of temporal variations in the climatological component (Δδ18Ocel(climate))
We calculated the temporal variation in the climatological component (Δδ18Ocel(climate)) of tree-ring cellulose δ18O (Fig. 10a) by using A = 5 and B = 5.4, as well as the smoothly combined δ18Ocel and δ2Hcel time series in Fig. 7 and Eq. (21). We used the temporal average of (δ2Hcel+Bδ18O during the 30 years from 1961 to 1990 for (δ2Hcel(0)+Bδ18O in Eq. (21) so as to make Δδ18Ocel(climate) the climatological variation in δ18Ocel from the period between 1961 and 1990.

Figure 10Calculation of the climatological component of the tree-ring cellulose δ18O data (Δδ18Ocel(climate)). (a) Time series of Δδ18Ocel(climate) calculated using Eq. (21), with A = 5.0 and B = 5.4, and the smoothly combined time series of δ18Ocel and δ2Hcel in Fig. 7. (b) EPS values for the individually calculated time series of Δδ18Ocel(climate) (gray line) and the individually calculated and reintegrated time series between the long-periodicity component of Δδ18Ocel(climate) and short-periodicity component of δ18Ocel, with 21 years (red line) and 51 years (blue line) as the thresholds between long and short periodicity. (c) 11-year running mean of the time series of Δδ18Ocel(climate) in Fig. 10a (gray line) and those of the reintegrated time series between the long-periodicity component in Δδ18Ocel(climate) in Fig. 10a and short-periodicity component in the combined δ18Ocel in Fig. 7, with 21 years (red line) and 51 years (blue line) as the threshold between long and short periodicity. EPS values in panel (b) were calculated for a total period of 51 years, including 25 years before and after the year shown.
The Δδ18Ocel(climate) variation shown in Fig. 10a was influenced by the δ2Hcel time series, not only for the long-periodicity variation, but also for the short-periodicity variation for which it is not necessary to integrate δ2Hcel. In fact, when we calculated EPS values for all individual Δδ18Ocel(climate) time series from Eq. (21), we found that the EPS values are significantly lower (Fig. 10b), reflecting the low EPS value of the original δ2Hcel time series (Fig. 3d). The purpose of introducing the δ2Hcel signal into the δ18Ocel time series is to remove the physiological effects from the long-periodicity variations in δ18Ocel. Therefore, at two threshold periodicities (21 and 51 years), we tentatively separated the long-periodicity component (21- and 51-year running means) from the integrated Δδ18Ocel(climate) time series in Fig. 10a and short-periodicity component (deviations from 21- and 51-year running means) from the original combined δ18Ocel in Fig. 7, and we reintegrated these into a new time series for Δδ18Ocel(climate) to remove the influence of the δ2Hcel data from the short-periodicity component. We also applied this reintegration procedure between the long-periodicity (Δδ18Ocel(climate)) and short-periodicity (δ18Ocel) components to the data for individual trees and calculated the EPS values for the reintegrated Δδ18Ocel(climate) datasets (Fig. 10b). The resultant EPS values were > 0.85 and much higher than the original Δδ18Ocel(climate) for almost all periods during last 2500 years when either 21 or 51 years was used as the threshold.
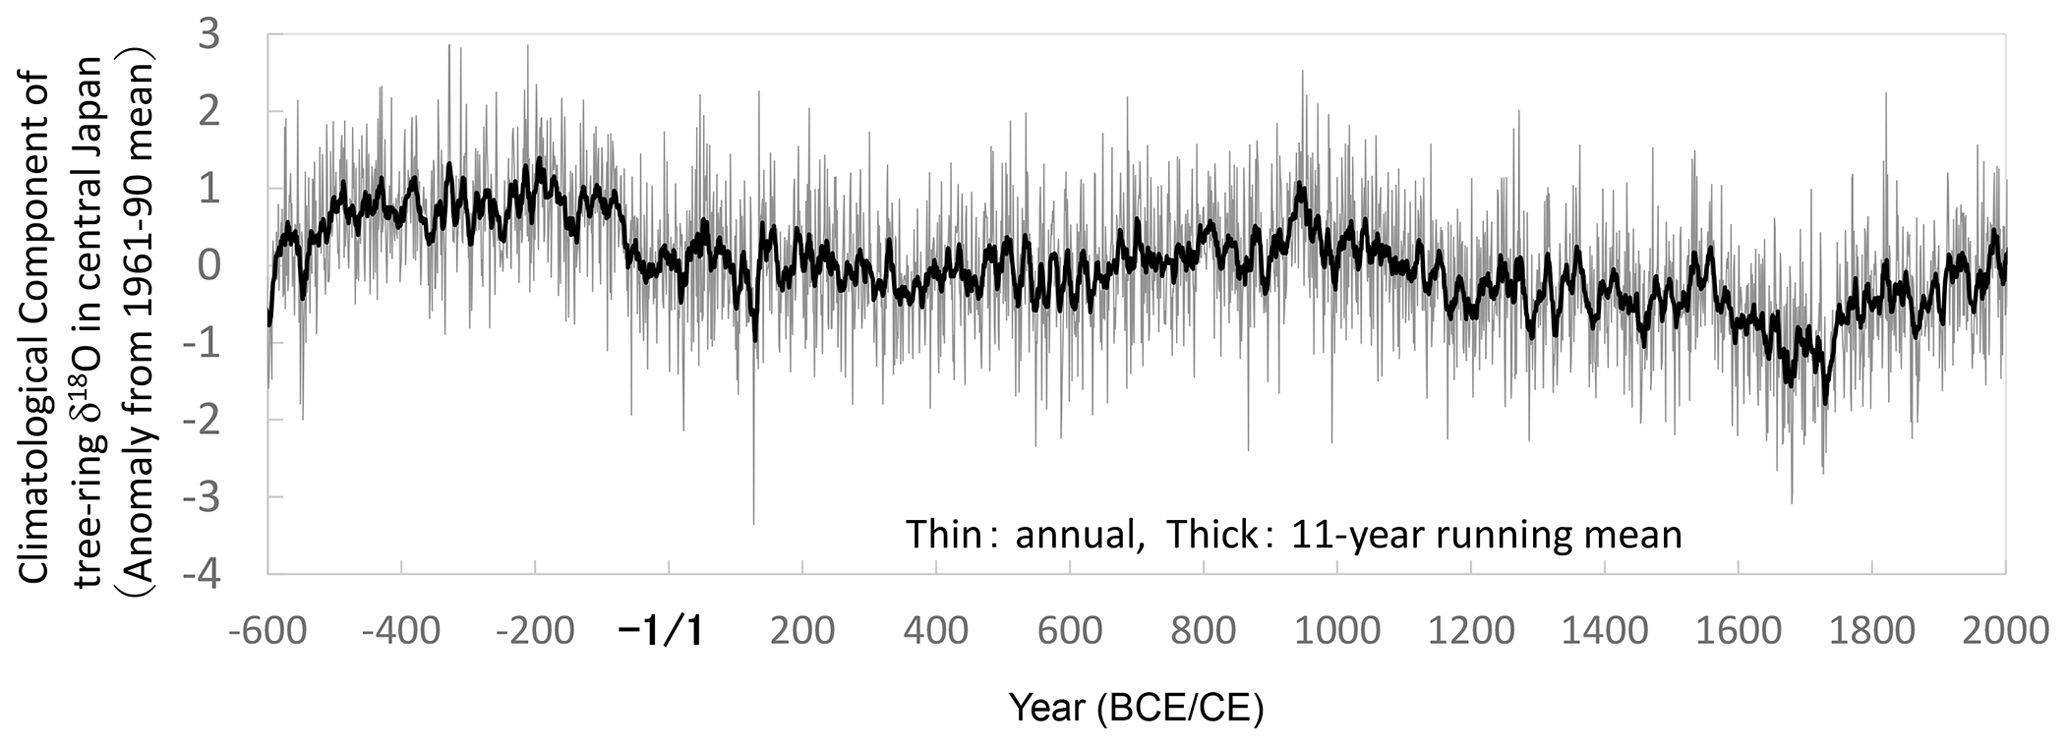
Figure 11The final combined time series of the climatological component in variations of tree-ring cellulose δ18O data (Δδ18Ocel(climate)). This is the reintegrated time series between the long-periodicity component in the original Δδ18Ocel(climate) data in Fig. 10a and the short-periodicity component in the combined δ18Ocel data in Fig. 7, with 21 years as the threshold between long and short periodicity.
However, this reintegration procedure may recover potential physiological effects with intermediate periodicities of less than 21 and 51 years. Hence, we compared the long-term variations (periodicity > 11 years) of the two reintegrated Δδ18Ocel(climate) time series using 21 and 51 years as the thresholds and the original Δδ18Ocel(climate) time series (Fig. 10a) in Fig. 10c to investigate whether there are significant differences. Each of the three time series shown in Fig. 10c almost coincide over all timescales, indicating there are no significant physiological effects with a periodicity between 11 and 51 years. However, we used 21 years as the threshold for the reintegration of the long- and short-periodicity components in order to robustly remove the influence of physiological effects. It does not result in a lower-quality reintegrated Δδ18Ocel(climate) record, given the nearly equal EPS values using the 21- and 51-year thresholds in Fig. 10b. We utilized the reintegrated Δδ18Ocel(climate) time series between the long-periodicity (> 21 years) domain of Δδ18Ocel(climate) in Fig. 10a and short-periodicity (< 21 years) domain of δ18Ocel in Fig. 7 as the final time series of the climatological component in the tree-ring cellulose δ18O data (Fig. 11). (You can see the effects of the integration and reintegration procedures more directly in Fig. S7.)
In contrast to the combined δ2Hcel record (Fig. 7), the multi-centennial variation in the combined δ18Ocel record (Fig. 7) does not appear to be very similar to that of the climatological component Δδ18Ocel(climate) (Fig. 11). This is partly because there is an apparent age trend in the combined δ18Ocel record, which overlaps the multi-millennial climatological decrease in Fig. 9. This means the multi-centennial variations are ambiguous in the combined δ18Ocel record (Fig. 7). However, there may be an anthropogenic explanation for this, whereby in wetter and cooler periods, the number of trees in Japanese forests might have decreased due to logging for fuel. Rapid tree growth in the resultant more open and lighter forest would have increased δ18Ocel and decreased δ2Hcel values due to physiological effects (see Sect. S1). The wetter and cooler climate may have also lowered δ18O and δ2H in leaf water. The combined effects of climate variations and anthropogenic factors on Japanese forests might have reduced and enhanced the multi-centennial variations in δ18Ocel and δ2Hcel, respectively (Fig. 7). However, we can robustly extract the climatological component Δδ18Ocel(climate) independently of the local forest history by integrating δ18Ocel and δ2Hcel data. This is the most important paleoclimatological innovation of our study.
3.11 Comparison of Δδ18Ocel(climate) with other summer climate records
In dendroclimatological studies focused on interannual variability, statistical methods to calibrate and verify the relationship between tree-ring data and instrumental meteorological observations have been well established. However, there is no commonly accepted statistical method to validate the reliability of long-periodicity (i.e., centennial or millennial) climate reconstructions. In the case of low-frequency data recovered from speleothems, ice cores, and sediments, climate reconstructions are typically not based on correlations with meteorological observations. These reconstructions are verified by different methods, such as mechanical models based on the relationship between oxygen isotope ratios and environmental factors, empirical knowledge of the relationship between pollen assemblages and climate, and experimental studies between biomarker compositions and water temperature. The reconstruction of Δδ18Ocel(climate) variations is principally based on the mechanical model developed in Eqs. (3)–(21), but it is necessary to validate our results by comparison with other past summer climate records.
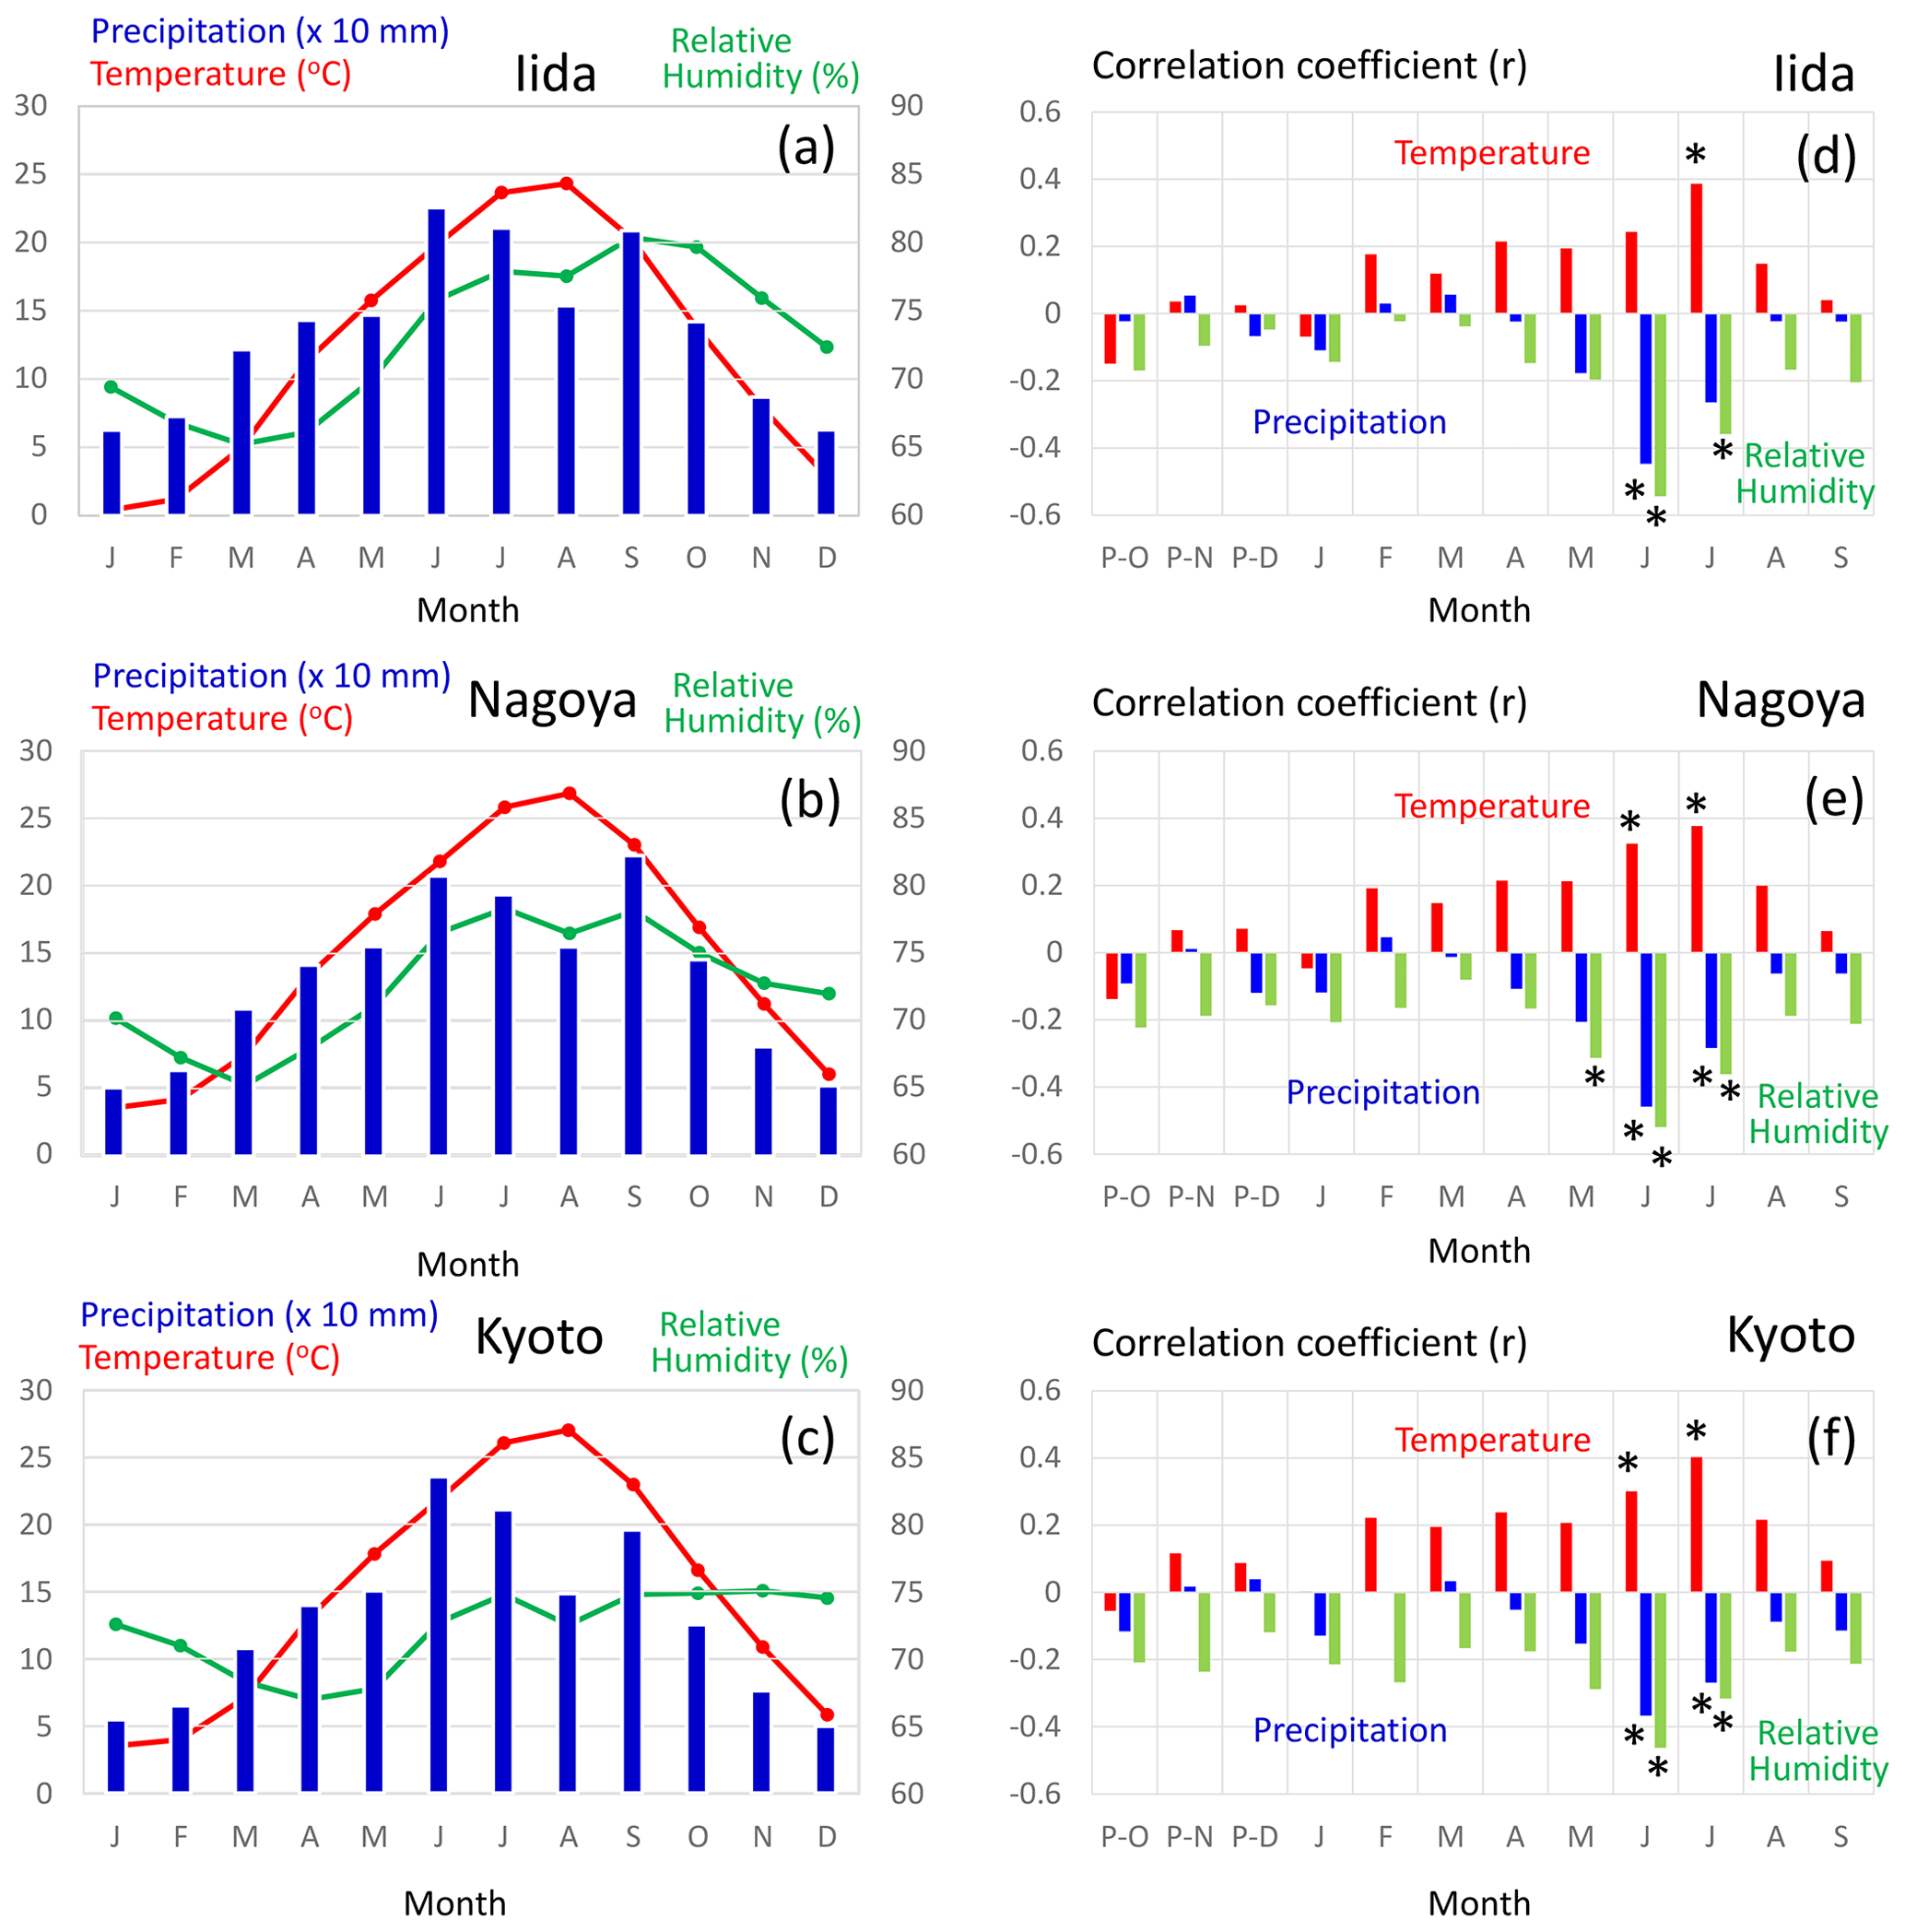
Figure 12(a–c) Average values of the monthly mean temperature (red), precipitation (blue), and mean relative humidity (green) from 1901 to 2005 CE. (d–f) Correlation coefficients of variations between Δδ18Ocel(climate) in Fig. 11 and the monthly mean temperature (red), precipitation (blue), and mean relative humidity (green) from 1901 to 2005 CE. The meteorological data were observed at Iida (a, d), Nagoya (b, e), and Kyoto (c, f) (see Figs. 1 and 13b) and recorded in the database of the Japan Meteorological Agency. Asterisks in panels (d), (e), and (f) indicate statistical significance at the > 99 % level (p < 0.01).
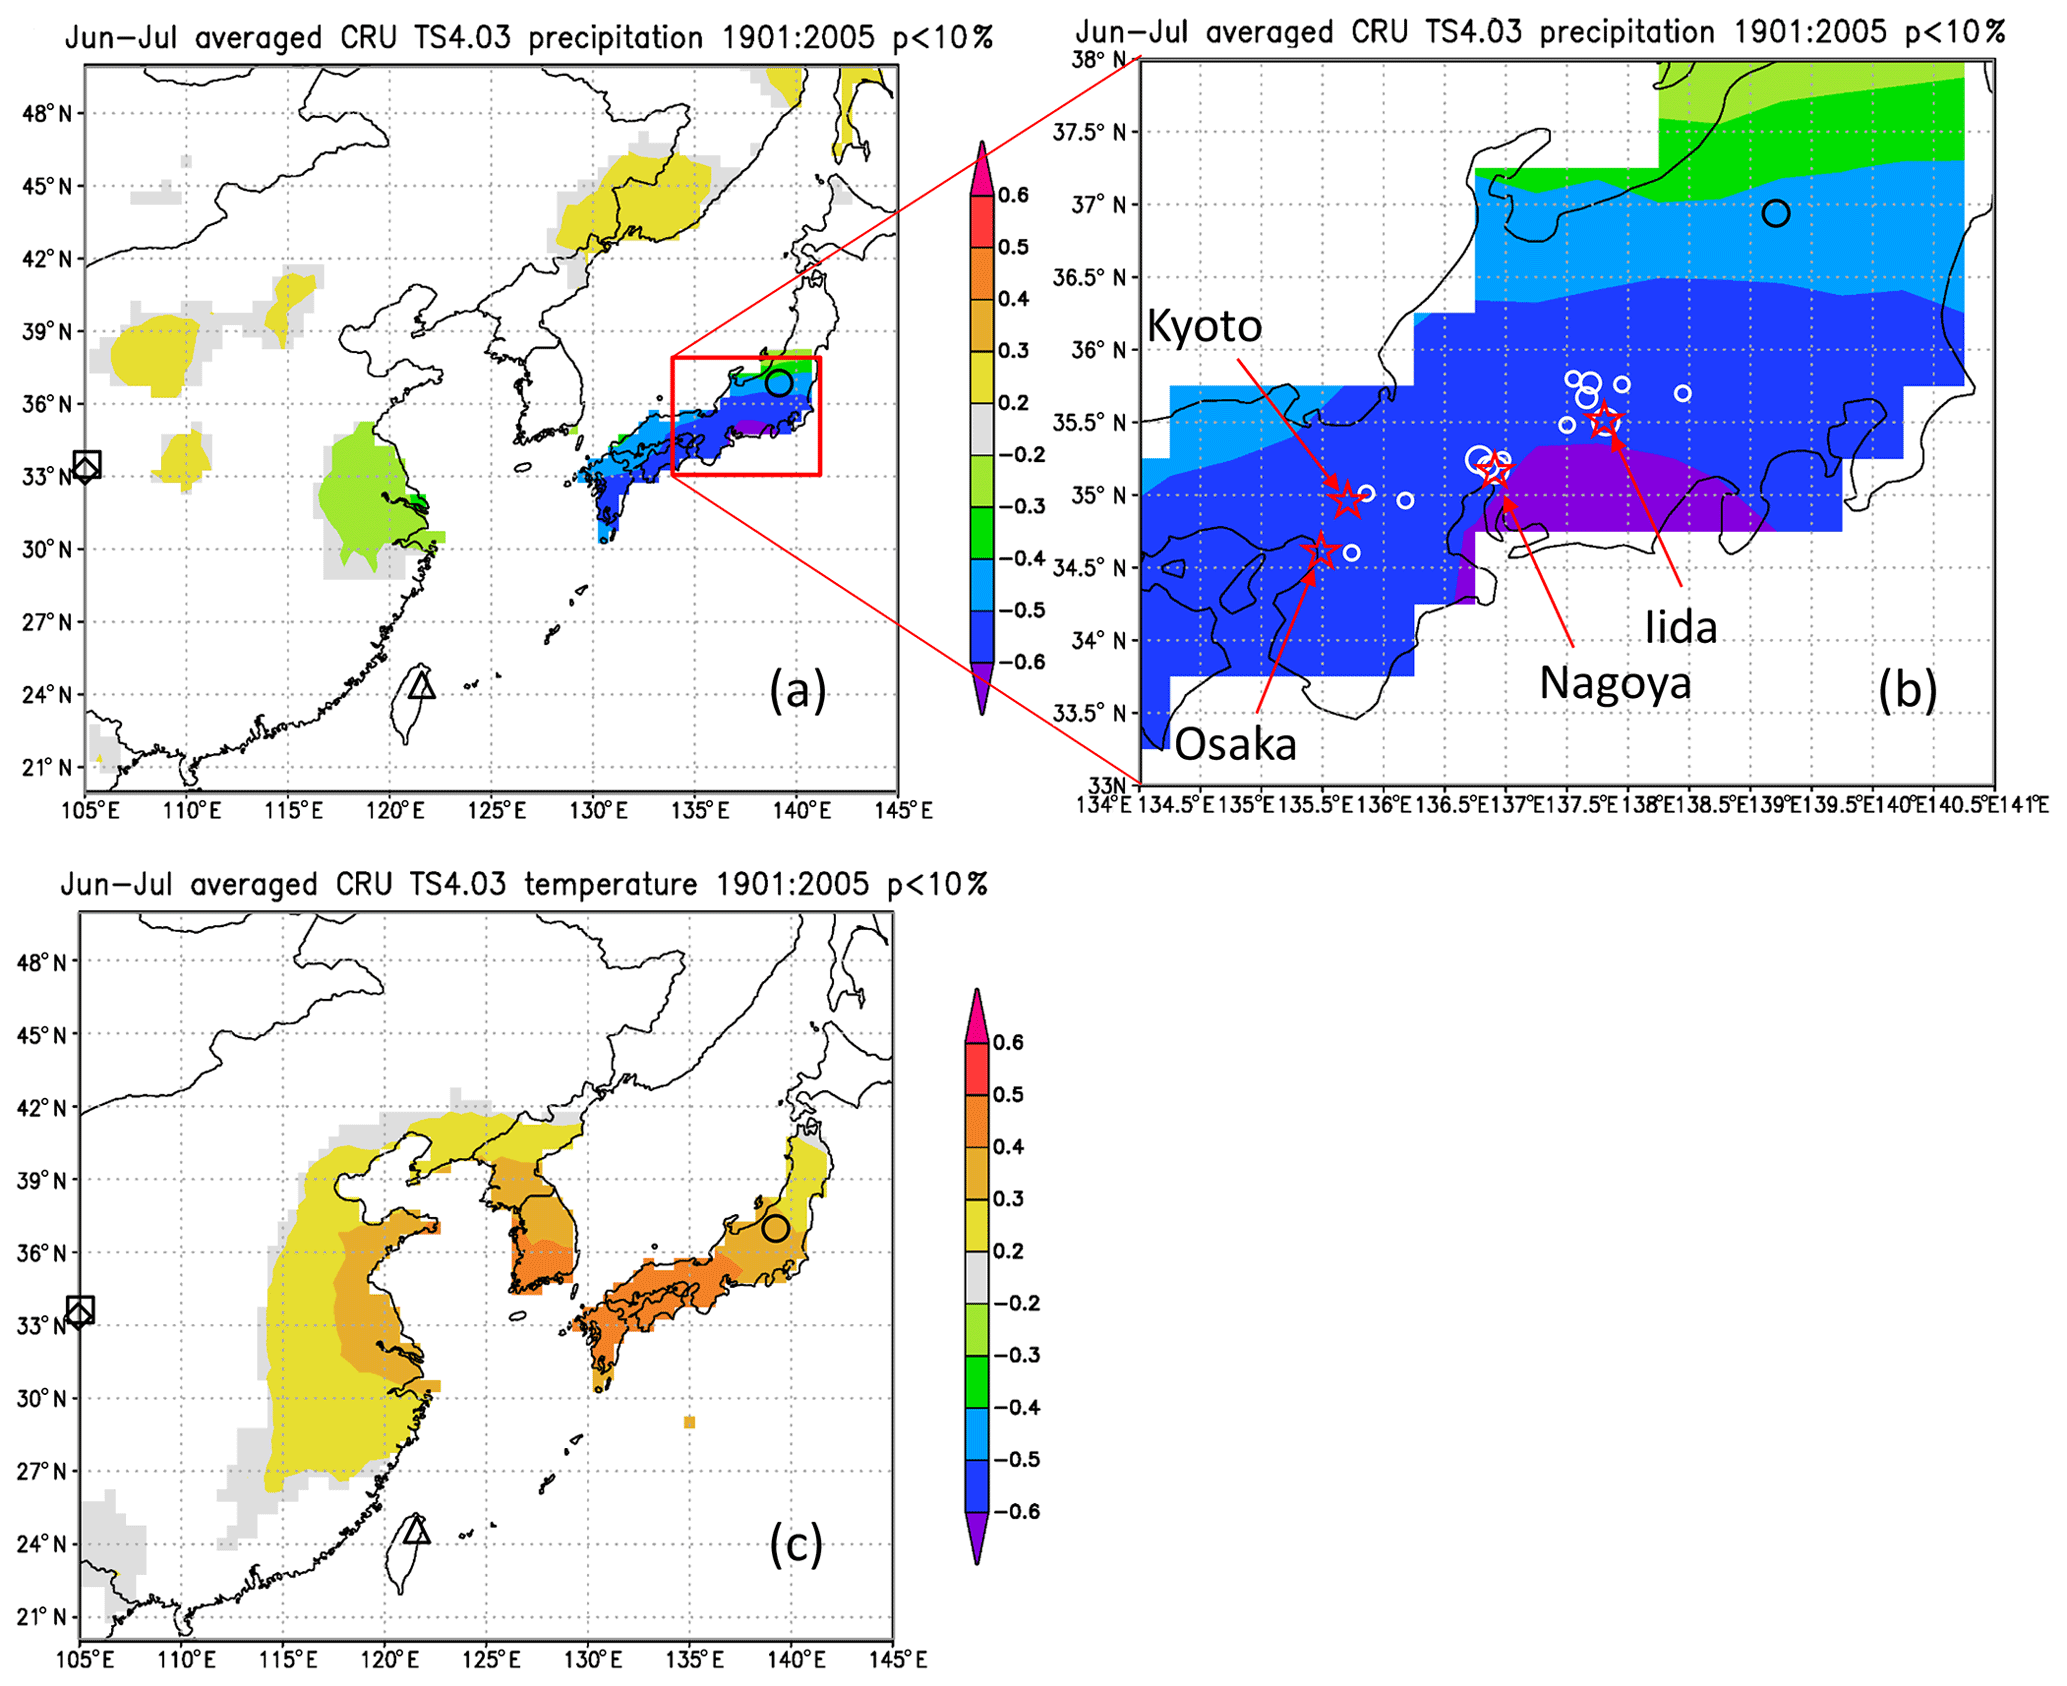
Figure 13Maps of the spatial correlation (p < 10 %) of Δδ18Ocel(climate) in Fig. 11 with (a–b) June–July precipitation and (c) June–July mean temperature for 1901–2005 from CRU TS4.03, with sites of reference studies shown as an open square (Huangye Cave), diamond (Wanxiang Cave), triangle (Tsuifong Lake), and circle (Ozegahara peatland). For this analysis, we used Climate Explorer (http://www.knmi.nl/, last access: 21 January 2020) of the Royal Netherlands Meteorological Institute (KNMI) (van Oldenborgh and Burgers, 2005). Sample locations and numbers (Table S1) are shown as white circles (large 10–15; medium 4–9; small 1–3) in panel (b).
Figure 12 shows the sensitivity of Δδ18Ocel(climate) to local monthly mean temperature, mean relative humidity, and precipitation during the period 1901–2005 at Kyoto, Nagoya, and Iida in central Japan. Δδ18Ocel(climate) shows significant negative correlations with precipitation and relative humidity and a positive correlation with temperature during summer (Fig. 12d–f) when annual precipitation is at its maximum (Fig. 12a–c), as demonstrated by previous studies of monsoonal Asia (Li et al., 2015; Liu et al., 2017; Pumijumnong et al., 2019; Sano et al., 2012, 2013, 2017; Seo et al., 2019; Xu et al., 2013, 2018, 2019). Spatial correlations of Δδ18Ocel(climate) with June–July precipitation in East Asia (Fig. 13) indicate that Δδ18Ocel(climate) in central Japan reflects precipitation in an extended region from the lower reaches of the Yangtze River in China to southern Honshu in Japan, corresponding to the baiu–meiyu front, which is an early summer stagnant rain belt characteristic of the East Asian summer monsoon (Fig. 13a). Δδ18Ocel(climate) has a significant positive correlation with June–July mean temperature across a wide region of Japan, Korea, and China, suggesting that Δδ18Ocel(climate) may be a good proxy for the East Asian summer monsoon (Fig. 13c).
The negative correlations of Δδ18Ocel(climate) with relative humidity and precipitation can be explained by the direct negative relationship between Δδ18Ocel(climate) and relative humidity in Eq. (11) as well as the amount effect, whereby δ18Orain becomes lower when precipitation increases (Dansgaard, 1964; Araguás-Araguás et al., 1998). The highest correlation (< 0.6) area of June–July precipitation is located just to the south of the sample sites (Fig. 13b). This is because, in the summer season, water vapor usually comes from the south (Pacific Ocean) to the sample sites and δ18Orain becomes lower when heavy rainfall occurs just before the arrival of the air mass carrying the water vapor. The positive correlation between Δδ18Ocel(climate) and temperature must be caused by the meteorologically reverse relationship between summer precipitation and temperature in humid monsoonal Asia, including Japan. In fact, the center of the highest correlation area of June–July mean temperature is located slightly to the west of the sample site (Fig. 13c). As such, when the temperature in western Japan is high and characterized by high pressure, the wind blows from the north to the sample site, resulting in dry conditions and low rainfall.
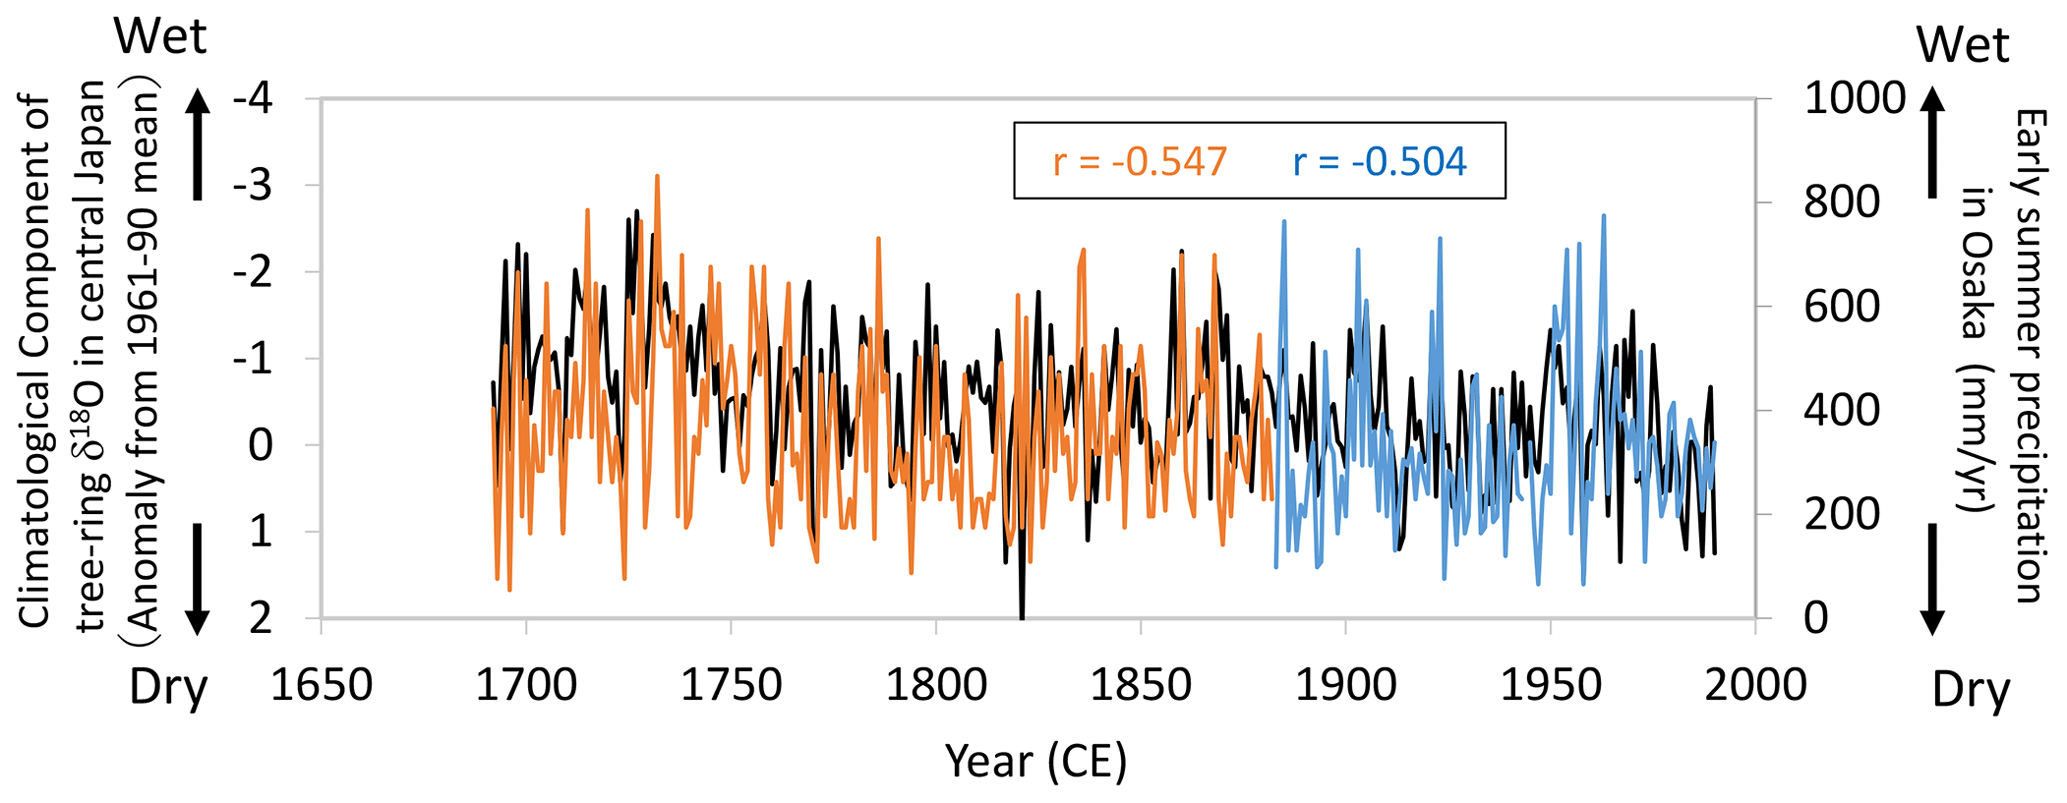
Figure 14Comparisons of the climatological component of the tree-ring cellulose δ18O (Δδ18Ocel(climate)) record in Fig. 11 (black line) with diary-based annual reconstructions (orange line) and meteorological observations (blue line) of early summer precipitation at Osaka (Mizukoshi, 1993). Note that the y axis of Δδ18Ocel(climate) is inverted to indicate higher precipitation toward the top of the figure.
Given the relationship between Δδ18Ocel(climate) and modern meteorological observations evident in Figs. 12 and 13, we compared Δδ18Ocel(climate) in central Japan with long-term historical and paleoclimatological records of summer climate before the 19th century. During the Edo era (1603–1868 CE), people wrote numerous diaries throughout Japan in which daily weather conditions were routinely described. Mizukoshi (1993) compiled many diary weather descriptions for central Japan and reconstructed interannual variations in early summer precipitation for Osaka since 1692 CE (Fig. 14). The diary-based (1692–1882) and instrumentally observed (1883–1990) precipitation reconstructions for Osaka are negatively correlated with Δδ18Ocel(climate) in central Japan, not only at an interannual timescale, but also at a multi-decadal timescale, indicating that Δδ18Ocel(climate) records long-term variations in summer climate.
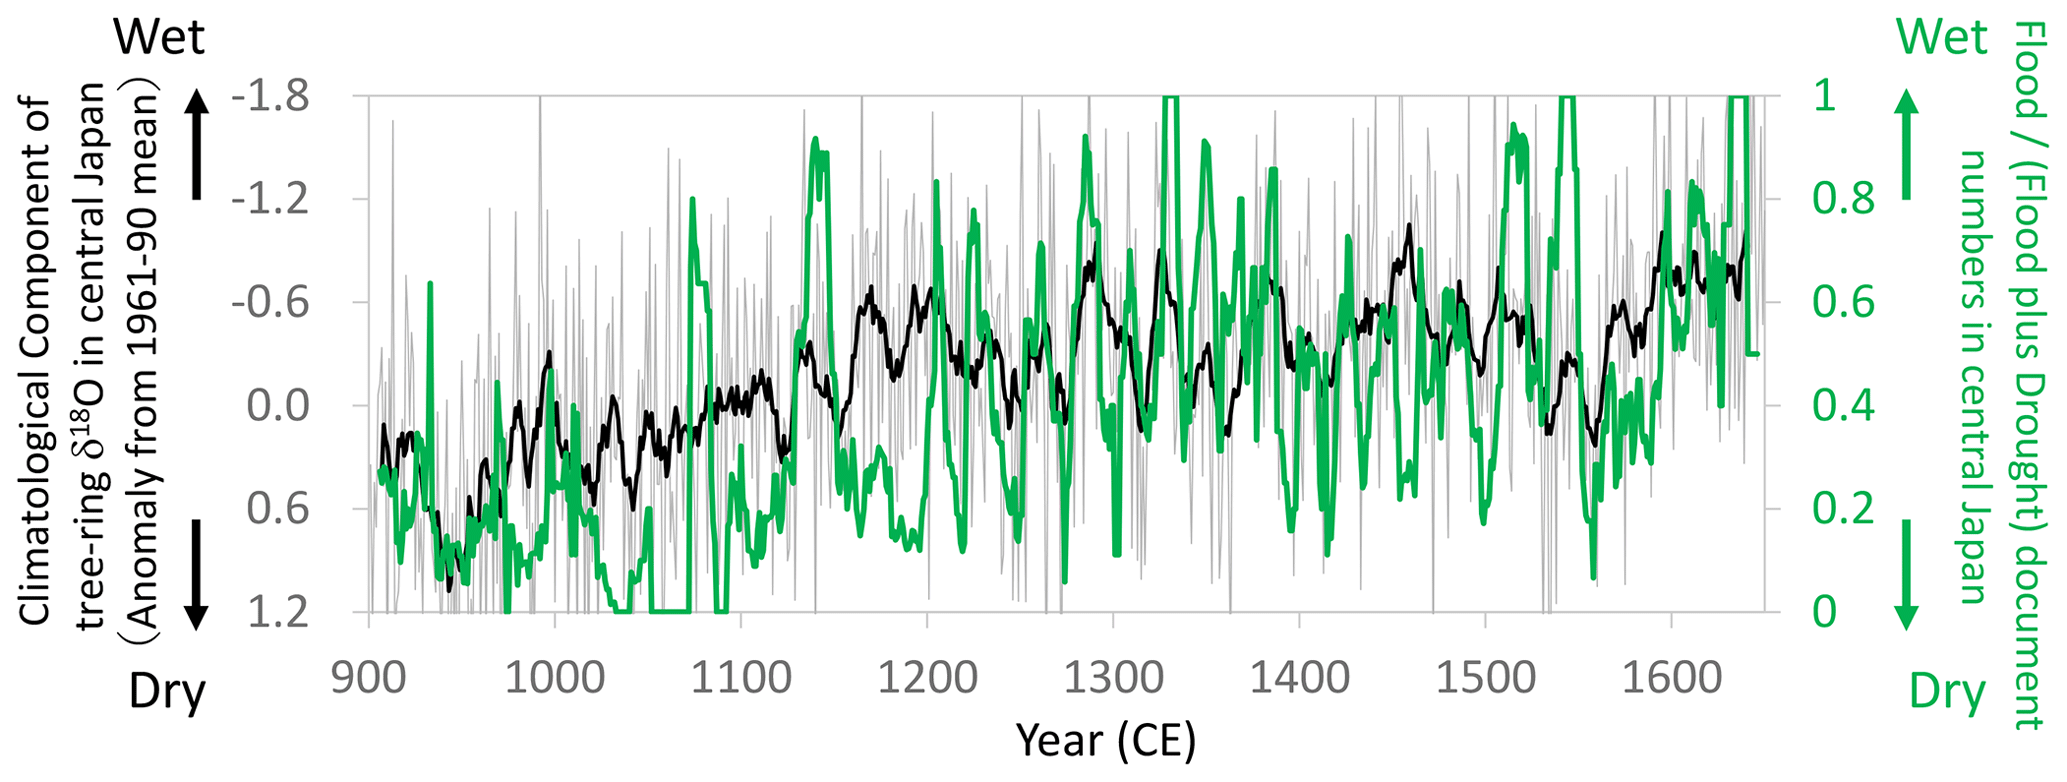
Figure 15Comparisons of the climatological component of the tree-ring cellulose δ18O (Δδ18Ocel(climate)) record in Fig. 11 (gray line: annual; black line: 11-year running mean) with the proportion of flood-related documents (11-year running mean) of total flood- and drought-related documents (11-year running mean) during the summer season (JJA) in central Japan (mostly in and around Kyoto) (Fujiki, 2007). Note that the y axis of Δδ18Ocel(climate) is inverted to indicate higher precipitation toward the top of the figure.
During the Medieval period from the 11th to 16th centuries in Japan, there were numerous extreme meteorological events (Fujiki, 2007). We used flood- and drought-related disaster records during the summer season (June–August) to construct an index of the “flood disaster ratio”, which is the proportion of flood-related documents to total flood- and drought-related documents. Given that documents are scarcer in the older period, we calculated an 11-year running mean of the flood disaster ratio and compared it with Δδ18Ocel(climate) (Fig. 15). In the 10th and 11th centuries during the Medieval Climate Anomaly, there were numerous droughts in Japan, corresponding to the highest values of Δδ18Ocel(climate). After the 11th century, both the documentary records and Δδ18Ocel(climate) values demonstrate that climate became progressively wetter towards the Edo era in the 17th century.
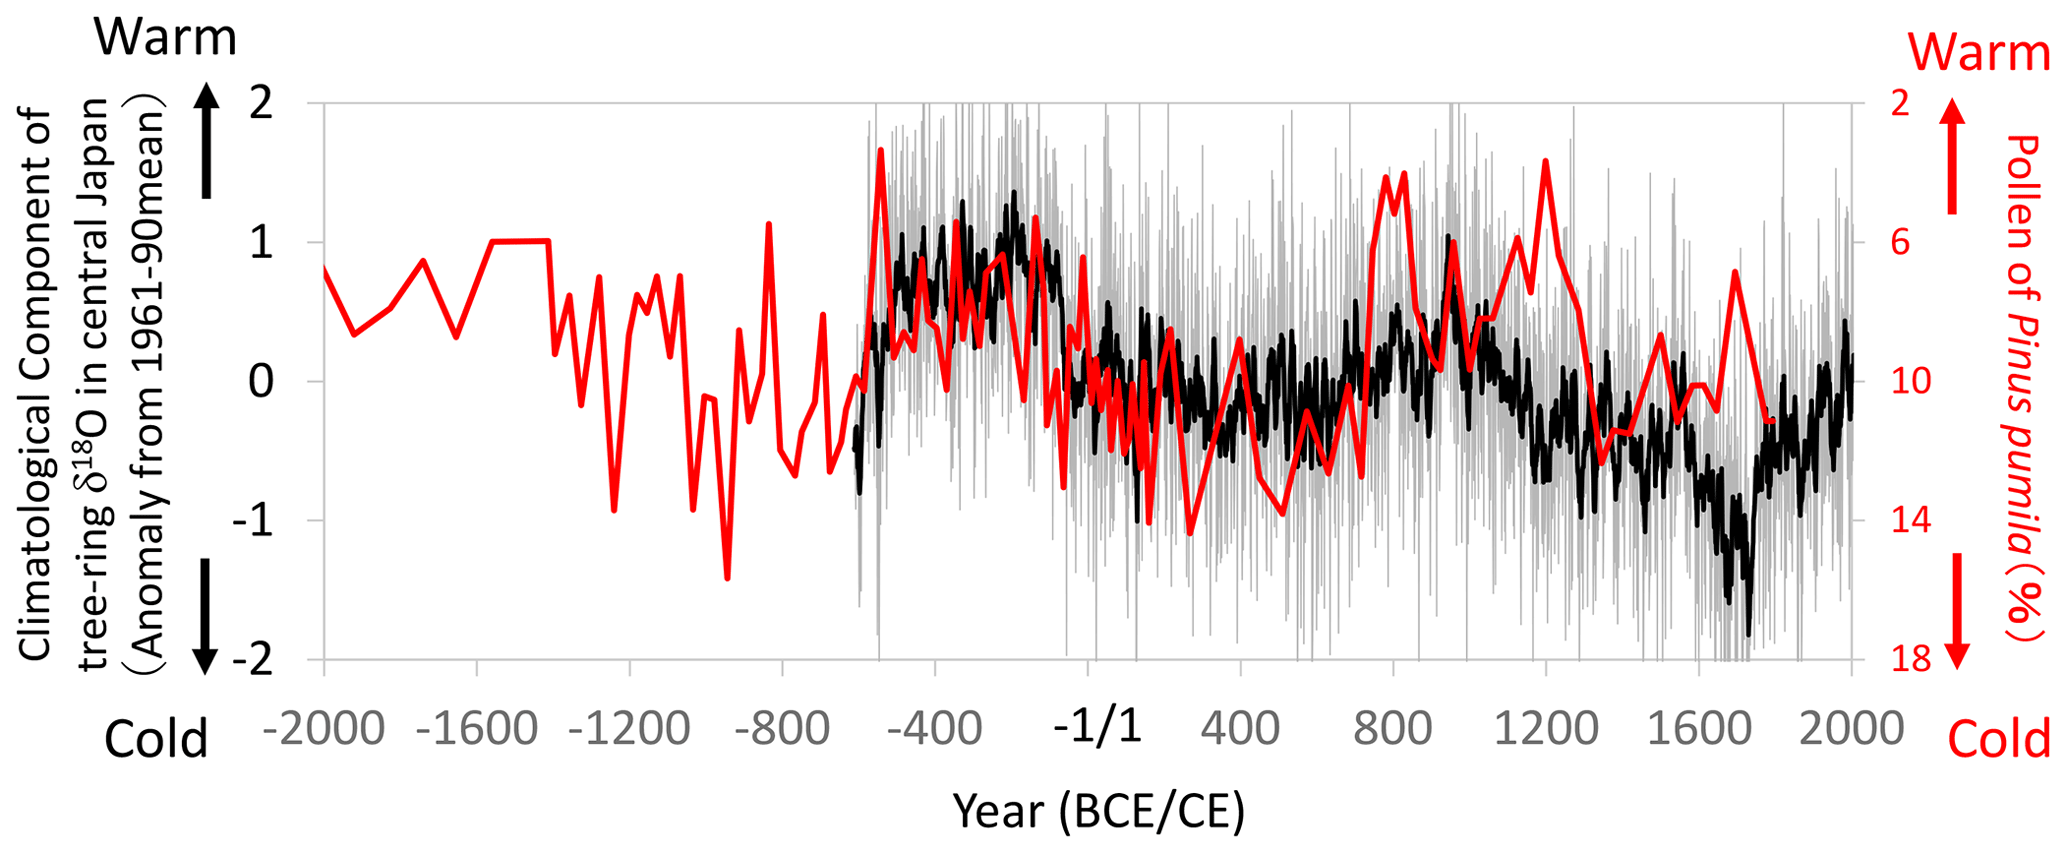
Figure 16Comparisons of the climatological component of the tree-ring cellulose δ18O (Δδ18Ocel(climate)) record in Fig. 11 (gray line: annual; black line: 11-year running mean) with the pollen percentage of a cold-region pine (Pinus pumila) in the Ozegahara peatland (Sakaguchi, 1983, 1989). Location of the pollen record is shown in Fig. 13. Given that P. pumila becomes dominant during cold periods, the y axis for the pollen percentage is inverted to indicate warmer conditions toward the top of the figure.
Although we could not find historical records of extreme climate events prior to the 10th century CE in Japan, Sakaguchi (1983, 1989) reconstructed long-term summer temperature variations using the pollen percentage of a cold-region pine (Pinus pumila) in the Ozegahara peatland of east Japan (Fig. 16). Although the pollen data after the 3rd century CE are not very reliable due to the lower sedimentation rate and human disturbance, the high sedimentation rate before the 2nd century CE enabled us to compare it with Δδ18Ocel(climate). Both the pollen and Δδ18Ocel(climate) records show similar variations from the 6th century BCE to 2nd century CE, indicating a warmer and drier climate from the 5th to 2nd century BCE and a cooler and wetter climate after the 1st century BCE (Fig. 16). After the 3rd century CE, both datasets show similar millennial variations, although the temporal resolution of the pollen data is not high.
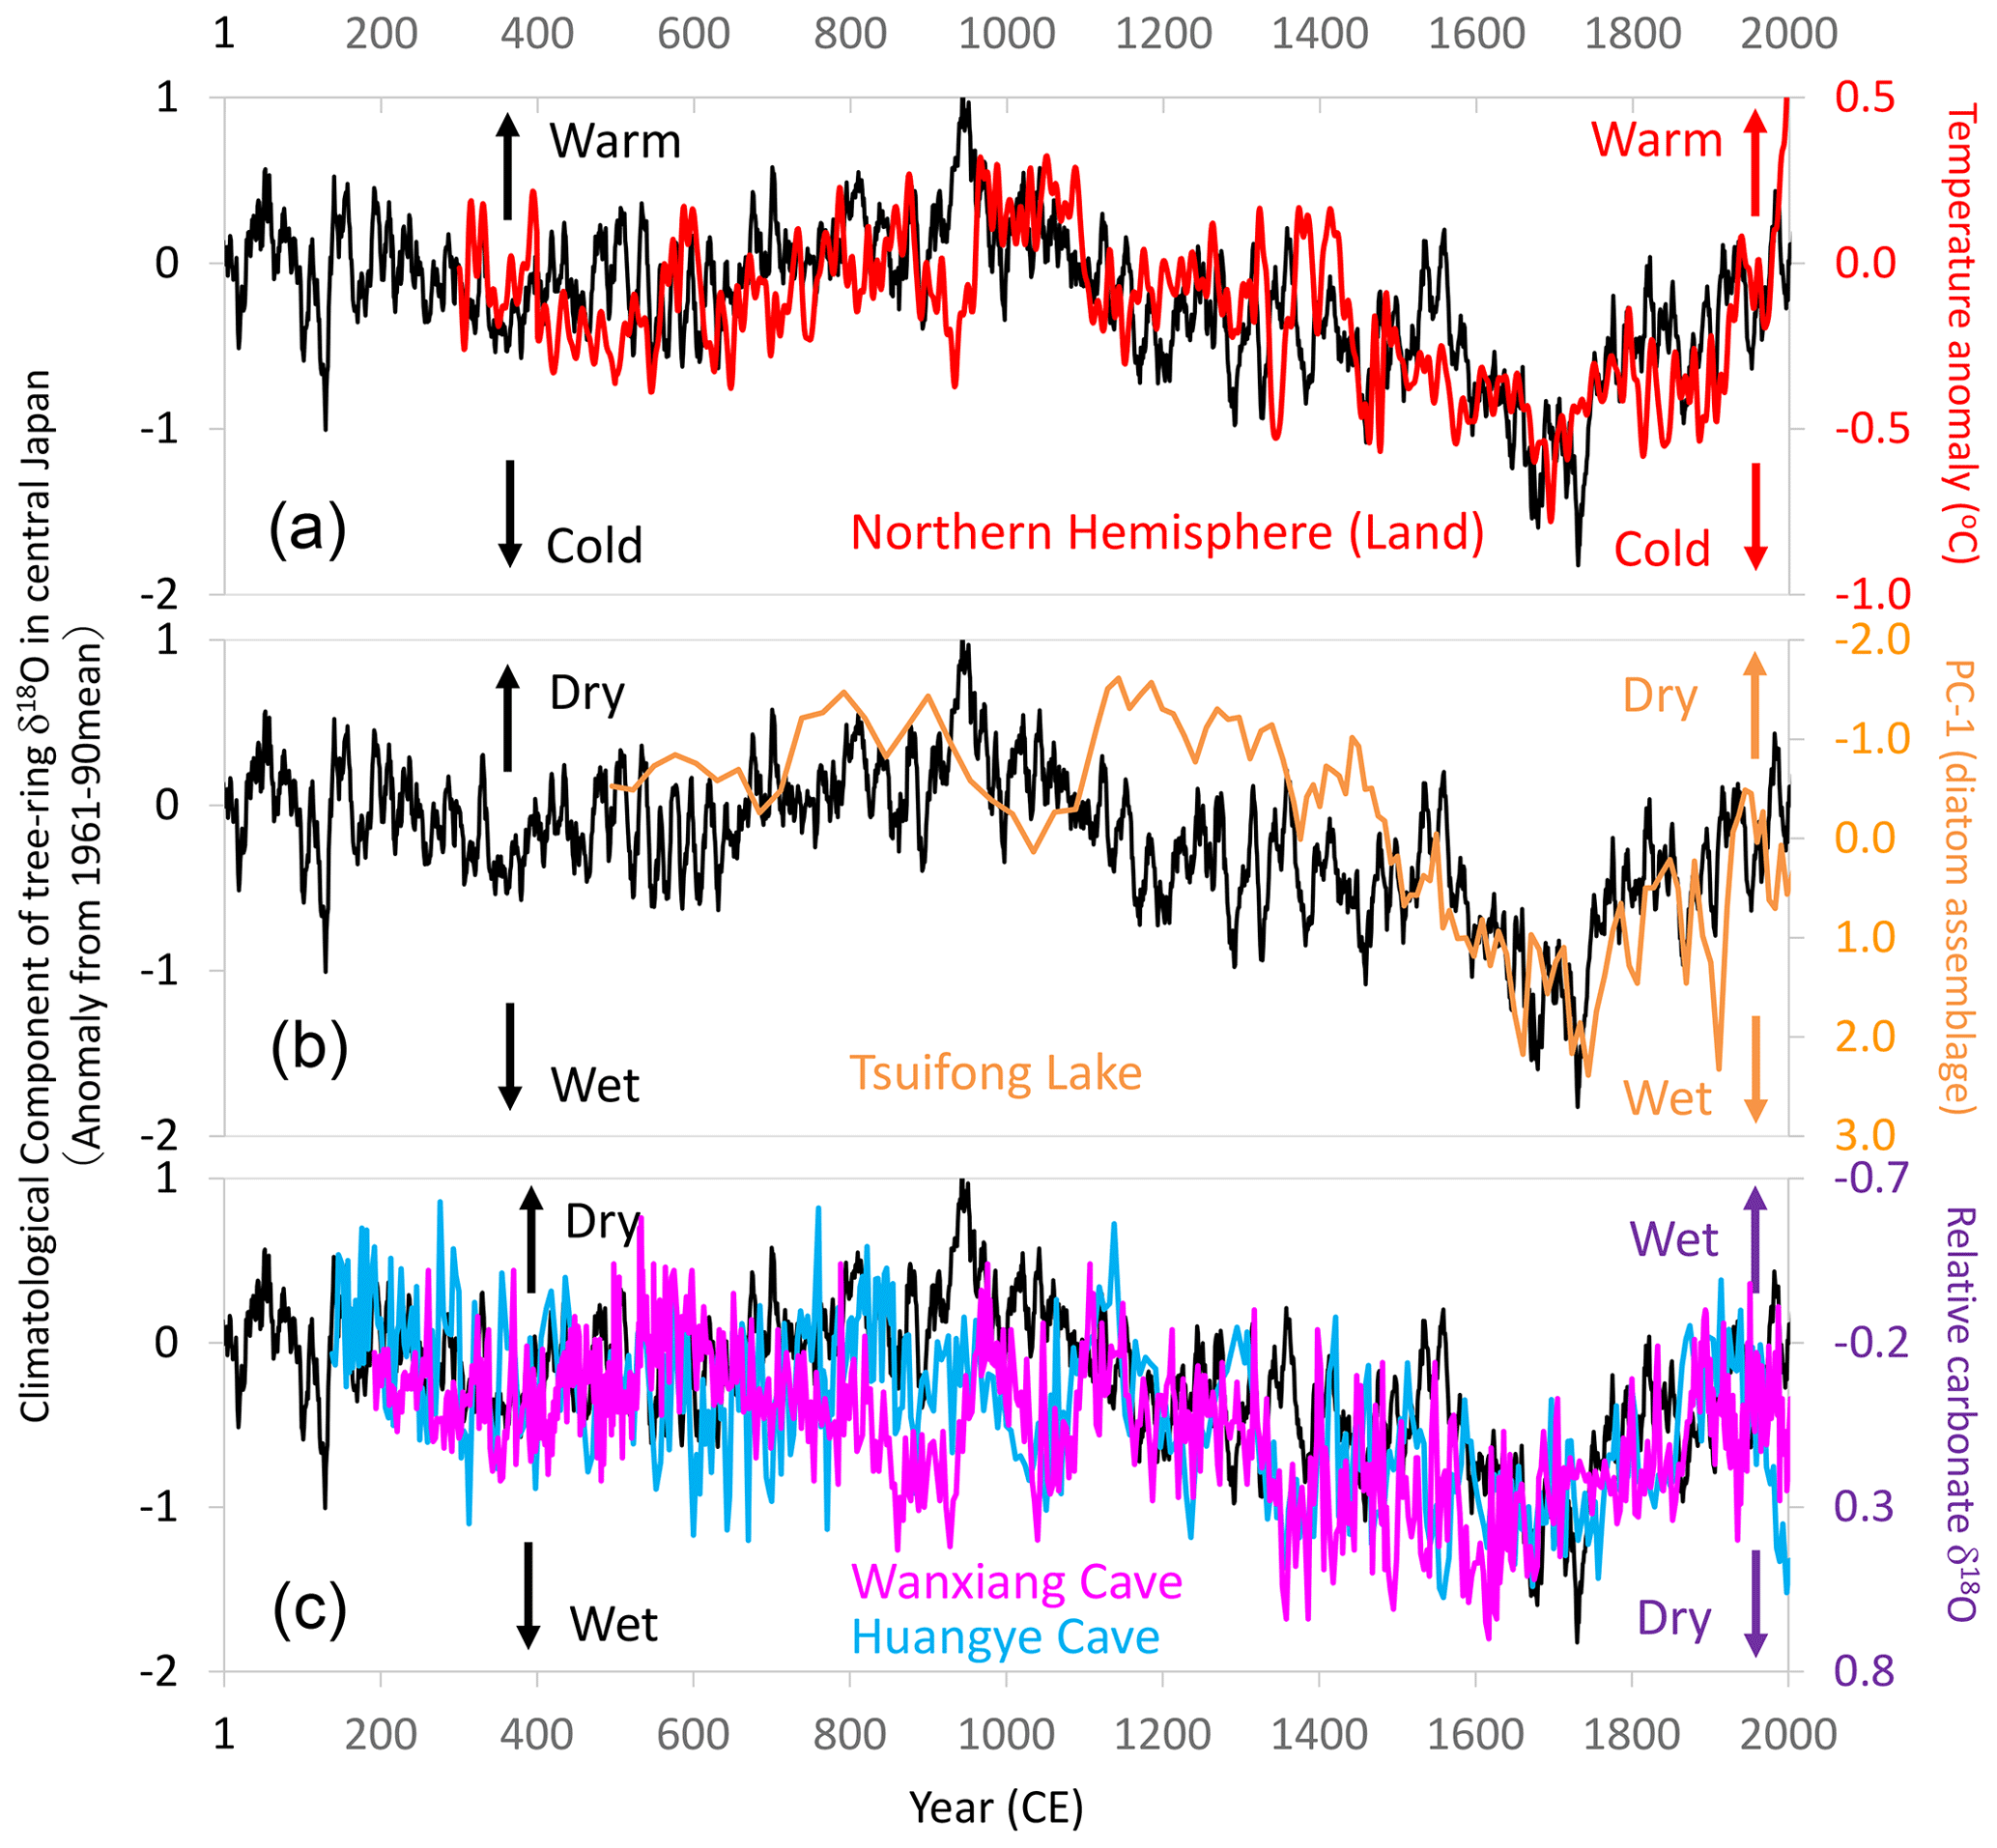
Figure 17Comparison of centennial- to millennial-scale variations of the climatological component of tree-ring cellulose δ18O (Δδ18Ocel(climate)) in central Japan with global and East Asian climate reconstructions. The time series of 11-year running means for Fig. 11 (black line) with (a) air temperature over the Northern Hemisphere defined as NH EIV-land (Mann et al., 2008) (red line), (b) precipitation inferred from a principal component analysis (PC1) of diatom assemblages from Tsuifong Lake in southeastern China (Taiwan) (Wang et al., 2013) (orange line), and (c) precipitation inferred from carbonate δ18O values of speleothems from Wanxiang (pink line) and Huangye (blue line) caves in northwestern China (Zhang et al., 2008; Tan et al., 2010). Note that the y axes are reversed between the speleothem data and Δδ18Ocel(climate) in panel (c). Locations of the records in panels (b) and (c) are shown in Fig. 13.
The climatological component of the variations in tree-ring cellulose δ18O (Δδ18Ocel(climate)) correlates well with meteorological, historical, and vegetation data over various timescales in central Japan, and it also shows similar long-term patterns as paleoclimatological global temperature and East Asian precipitation data. Figure 17a shows that Δδ18Ocel(climate) exhibits variations almost identical to air temperature reconstructions for land areas in the Northern Hemisphere (Mann et al., 2008), except for the period of the Medieval Climate Anomaly. Variations in summer precipitation reconstructed from diatom assemblages in lake sediments in Taiwan (Wang et al., 2013) are also similar to the variations in Δδ18Ocel(climate) in central Japan (Fig. 17b). Two time series of carbonate δ18O values in speleothems from northwest China (Zhang et al., 2008; Tan et al., 2010) also match the variations in Δδ18Ocel(climate) (Fig. 17c). Note that the directions of the y axis are reversed between the speleothem and Δδ18Ocel(climate) data, reflecting the meridional disparity of precipitation patterns in East Asia (Fig. 13a), as demonstrated by Liu et al. (2014) and Chen et al. (2015).
The climatological component of the variations in the tree-ring cellulose δ18O data (Δδ18Ocel(climate)) in central Japan (Fig. 11) corresponds well over various timescales with summer precipitation and temperature records in central Japan, which have been derived from various meteorological, historical, and paleo-vegetation archives (Figs. 12–16). This indicates that Δδ18Ocel(climate) is a reliable proxy for summer climate, such as the activity of the East Asian summer monsoon. Multi-centennial and millennial Δδ18Ocel(climate) variations are similar to those of paleoclimatological reconstructions of global temperatures and East Asian precipitation (Fig. 17), indicating a drier climate during the Medieval Climate Anomaly and wetter climate during the Little Ice Age in central Japan. As such, Δδ18Ocel(climate) can be utilized in climatological, historical, and archeological studies.
We constructed a statistically reliable multi-millennial tree-ring dataset of cellulose δ18O in central Japan by analyzing tree rings of 67 trees without using a pooling method. We found that there are distinct age trends in the δ18O time series. By comparison with the δ2H time series, we showed that the age trend in δ18O is caused by an increase in the degree of post-photosynthesis isotopic exchange with xylem water before cellulose synthesis as the trees mature. Because the physiological conditions of the post-photosynthesis isotopic exchange are not simply controlled by tree age, but also related to the tree growth environment randomly influenced by human activity, it was not possible to remove the age trend by application of the negative exponential curve or RCS.
Given that tree-ring cellulose δ18O and δ2H are correlated positively and negatively due to climatological and physiological factors, respectively, we formulated simultaneous equations for the climatological and physiological components of the tree-ring cellulose δ18O and δ2H data. We solved these equations to cancel out the physiological effects and established a multi-millennial record of the climatological component of tree-ring cellulose δ18O (Δδ18Ocel(climate)). The Δδ18Ocel(climate) time series is well correlated with local, regional, and global variations in summer climate reconstructed by instrumental, historical, and paleoclimatological methods. This suggests that Δδ18Ocel(climate) has recorded summer climate variations in central Japan during the past 2600 years on annual to millennial timescales.
However, further research is needed to make Δδ18Ocel(climate) a more reliable index of summer climate. In this study we utilized δ2Hcel as supplementary data just to remove the long-term physiological effects in δ18Ocel. This is partly because the EPS of δ2Hcel is lower than that of δ18Ocel, reflecting the larger and more complicated post-photosynthetic isotope fractionations (physiological effects) in hydrogen than in oxygen and the possible analytical uncertainties in δ2Hcel owing to direct measurements of cellulose including the OH group. Therefore, we must further improve our understanding of cellulose hydrogen isotope ratios. Firstly, the analytical procedure of the tree-ring cellulose δ2H measurements needs to be improved. It is desirable to fix the δ2H in the OH group by some sophisticated method (Filot et al., 2006). Secondly, more global tree-ring cellulose δ2H data need to be acquired to expand the δ18O and δ2H datasets (and Δδ18Ocel(climate) time series) for different regions and tree species as well as to validate its usefulness. Thirdly, it remains challenging to calibrate long-term Δδ18Ocel(climate) variations because there are few long-term datasets of meteorological observations.
Although Δδ18Ocel(climate) is a promising proxy for summer climate that can remove the age trend, previous δ18O-based dendrochronological reconstructions of past summer climate may still be robust. Most tree-ring δ18O studies utilized samples collected from natural forests where human disturbance was insignificant in comparison with forests in central Japan. In contrast to the conifer trees studied here and reported by Esper et al. (2010), hardwoods may be intrinsically free from long-term age trends (Duffy et al., 2017; Büntgen et al., 2020). Therefore, in most isotopic dendrochronological studies, the cellulose δ2H data will be a supplementary index to ensure there are no significant age trends (An et al., 2014). However, when such studies are based on a small amount of conifer wood collected from archeological artifacts and/or architectural material, and where the growth environments may have been disturbed by human activities, the simultaneous measurement of δ2H and δ18O allows Δδ18Ocel(climate) variations to be used as a proxy for past climate.
The data obtained in this research are available at https://www.ncdc.noaa.gov/paleo/study/28832 (Nakatsuka et al., 2020).
The supplement related to this article is available online at: https://doi.org/10.5194/cp-16-2153-2020-supplement.
TN designed the research and wrote the paper; TN, MaS, KS, TM, MiS, HO, NH, NN, and MY collected tree-ring samples; TN, MaS, KS, ZL, CX, and KO extracted cellulose from tree rings; TN, MaS, ZL, CX, KO, and AT measured isotope ratios of tree-ring cellulose; TN, MaS, and YS analyzed isotopic data mathematically; all authors discussed the results and provided input to the paper.
The authors declare that they have no conflict of interest.
We thank Kyohei Oishi, Masataka Okabe, and Akira Ishida for their support with the analysis of the tree-ring cellulose isotopic ratios, as well as Jiro Akatsuka and Masataka Hakozaki for their assistance in collecting important tree-ring samples. We are grateful to the Nagoya University Museum, Iida-Kamisato Archaeological Museum, and Akazawa Forest Museum in the Kiso Forest Management Office for providing samples.
This research has been supported by the Research Institute for Humanity and Nature (project no. 14200077) and the Grants-in-Aid for Scientific Research from the Japanese Society for the Promotion of Science (grant nos. 23242047, 26244049, and 17H06118).
This paper was edited by Hans Linderholm and reviewed by two anonymous referees.
An, W., Liu, X., Leavitt, S. W., Xu, G., Zeng, X., Wang, W., Qin, D., and Ren, J.: Relative humidity history on the Batang–Litang Plateau of western China since 1755 reconstructed from tree-ring δ18O and δD, Clim. Dynam., 42, 2639–2654, https://doi.org/10.1007/s00382-013-1937-z, 2014.
Araguás-Araguás, L., Froehlich, K., and Rozanski, K.: Stable isotope composition of precipitation over southeast Asia, J. Geophys. Res., 103, 28721–28742, 1998.
Araguás-Araguás, L., Froehlich, K., and Rozanski, K.: Deuterium and oxygen-18 isotope composition of precipitation and atmospheric moisture, Hydrol. Process., 14, 1341–1355, 2000.
Bunn, A. G.: A dendrochronology program library in R (dplR), Dendrochronol., 26, 115–124, 2008.
Büntgen, U., Esper, J., Frank, D. C., Nicolussi, K., and Schmidhalter, M.: A 1052-year tree-ring proxy for Alpine summer temperatures, Clim. Dynam., 25, 141–153, 2005.
Büntgen, U., Kolář, T., Rybníček, M., Koňasová, E., Trnka, M., Ač, A., Krusic, P., Esper, J., Treydte, K., Reinig, F., Kirdyanov, A., Herzig, F., and Urban, O.: No age trends in oak stable isotopes, Paleoceanogr. Paleoclimatol., 35, e2019PA003831, https://doi.org/10.1029/2019PA003831, 2020.
Chen, J., Chen, F., Feng, S., Huang, W., Liu, J., and Zhou, A.: Hydroclimatic changes in China and surroundings during the Medieval Climate Anomaly and Little Ice Age: spatial patterns and possible mechanisms, Quaternary Sci. Rev., 107, 98–111, 2015.
Dansgaard, W.: Stable isotopes in precipitation, Tellus, 16, 436–468, 1964.
DeNiro, M. J.: The effects of different methods of preparing cellulose nitrate on the determination of the D∕H ratios of non-exchangeable hydrogen of cellulose, Earth Planet Sc. Lett. 54, 177–185, 1981.
Duffy, J. E., McCarroll, D., Barnes, A., Ramsey, C. B., Davies, D., Loader, N. J., Miles, D., and Young, G. H. F.: Young Short-lived juvenile effects observed in stable carbon and oxygen isotopes of UK oak trees and historic building timbers, Chem. Geol., 472, 1–7, 2017.
Epstein S., Yapp C. J., and Hall J. H.: The determination of the D/H ratios of non-exchangeable hydrogen in cellulose extracted from aquatic and land plants, Earth Planet Sc. Lett., 30, 241–251, 1976.
Esper, J., Cook, E. R., and Schweingruber, F. H.: Low-frequency signals in long tree-ring chronologies for reconstructing past temperature variability, Science, 295, 2250–2253, https://doi.org/10.1126/science.1066208, 2002.
Esper, J., Cook, E. R., Krusic, P. J., Peters, K., and Schweingruber, F. H.: Tests of the RCS method for preserving low-frequency variability in long tree-ring chronologies, Tree-Ring Res., 59, 81–98, 2003.
Esper, J., Frank, D. C., Battipaglia, G., Büntgen, U., Holert, C., Treydte, K., Siegwolf, R., and Saurer, M.: Low-frequency noise in δ13C and δ18O tree ring data: A case study of Pinus uncinata in the Spanish Pyrenees, Global Biogeochem. Cy., 24, GB4018, https://doi.org/10.1029/2010GB003772, 2010.
Estep M. F. and Hoering T. C.: Stable isotope fractionation during autotrophic and mixotrophic growth of microalgae, Plant Physiol., 67, 474–477, 1981.
Filot, M. S., Leuenberger, M., Pazdur A., and Boettger, T.: Rapid online equilibration method to determine the D∕H ratios of non-exchangeable hydrogen in cellulose, Rapid Commun. Mass Spectrom., 20, 3337–3344, 2006.
Fujiki, H. (Ed.): “Chronological table of medieval climate disasters in Japan”, Koshi-Shoin, Tokyo, Japan, 427 pp., 2007 (in Japanese).
Grießinger, J., Bräuning, A., Helle, G., Thomas, A., and Schleser, G.: Late Holocene Asian summer monsoon variability reflected by δ18O in tree-rings from Tibetan junipers, Geophys. Res. Lett., 38, L03701, https://doi.org/10.1029/2010GL045988, 2011.
Grudd, H., Briffa, K. R., Karlen, W., Bartholin, T. S., Jones, P. D., and Kromer, B.: A 7400-year tree-ring chronology in northern Swedish Lapland: natural climatic variability expressed on annual to millennial timescales, Holocene, 12, 657–665, 2002.
Hangartner, S., Kress, A., Saurer, M., Frank, D., and Leuenberger, M.: Methods to merge overlapping tree-ring isotope series to generate multi-centennial chronologies, Chem. Geol., 294–295, 127–134, 2012.
Kagawa, A., Sano, M., Nakatsuka, T., Ikeda, T., and Kubo, S.: An optimized method for stable isotope analysis of tree rings by extracting cellulose directly from cross-sectional laths, Chem. Geol., 393–394, 16–25, 2015.
Kilroy, E., McCarroll, D., Young, G. H. F., Loader, N. J., and Bale, R. J.: Absence of juvenile effects confirmed in stable carbon and oxygen isotopes of European larch trees, Acta Silvae Ligni, 111, 27–33, 2016.
Li, Q., Nakatsuka, T., Kawamura, K., Liu, Y., and Song H.: Hydroclimate variability in the North China Plain and its link with El Niño–Southern Oscillation since 1784 A.D. Insights from tree-ring cellulose δ18O, J. Geophys. Res. 116, D22106, https://doi.org/10.1029/2011JD015987, 2011.
Li, Z., Nakatsuka, T., and Sano, M.: Tree-ring cellulose δ18O variability in pine and oak and its potential to reconstruct precipitation and relative humidity in central Japan, Geochem. J., 49, 125–137, 2015.
Liu, J., Chen, F., Chen, J., Zhang, X., Liu, J., and Bloemendal, J.: Weakening of the East Asian summer monsoon at 1000–1100 A.D. within the Medieval Climate Anomaly: Possible linkage to changes in the Indian Ocean-western Pacific, J. Geophys. Res., 119, 2209–2219, 2014.
Liu, Y., Cobb, K. M., Song, H., Li, Q., Li, C-Y., Nakatsuka, T., An, Z., Zhou, W., Cai, Q., Li, J., Leavitt, S. W., Sun, C., Mei, R., Shen, C-C., Chan, M-H., Sun, J., Yan, L., Lei, Y., Ma, Y., Li, X., Chen, D., and Linderholm, H. W.: Recent enhancement of central Pacific El Niño variability relative to last eight centuries, Nat. Commun., 8, 15386, https://doi.org/10.1038/ncomms15386, 2017.
Loader, N. J., Young, G. H. F., McCarroll, D., and Wilson, R. J. S.: Quantifying uncertainty in isotope dendroclimatology, Holocene, 23, 1221–1226, 2013.
Luo Y. H. and Sternberg L.: Hydrogen and oxygen isotope fractionation during heterotrophic cellulose synthesis, J. Exp. Bot., 43, 47–50, 1992.
Mann, M. E., Zhang, Z., Hughes, M. K., Bradley, R. S., Miller, S. K., Rutherford, S., and Ni, F.: Proxy-based reconstructions of hemispheric and global surface temperature variations over the past two millennia, P. Natl Acad. Sci. USA, 105, 13252–13257, 2008.
Mitsutani, T.: Present situation of dendrochronology in Japan, in: “Proceedings of the International Dendrochronological Symposium, 18–19 February 2000, Nara, Japan, 2000.
Mizukoshi, M.: Climatic reconstruction in central Japan during the Little Ice Age based on documentary sources, J. Geography, 102, 152–166, 1993 (in Japanese).
Nabeshima, E., Nakatsuka, T., Kagawa, A., Hiura, T., and Funada, R.: Seasonal changes of δD and δ18O in tree-ring cellulose of Quercus crispula suggest a change in post-photosynthetic processes during earlywood growth, Tree Physiol., 38, 1829–1840, https://doi.org/10.1093/treephys/tpy068, 2018.
Nakatsuka, T.: New possibilities in archaeological research enabled by oxygen isotope dendrochronology, Kokogaku Kenkyu (Quarterly of Archaeological Studies), 62, 17–30, 2015 (in Japanese with English abstract).
Nakatsuka, T.: Establishment and development of oxygen isotopic dendrochronology, Kokogaku to Shizenkagaku (Archaeology and Natural Sciences), 76, 1–13, 2018 (in Japanese with English abstract).
Nakatsuka, T., Ohnishi, K., Hara, T., Sumida, A., Mitsuishi, D., Kurita, N., and Uemura, S.: Oxygen and carbon isotopic ratios of tree-ring cellulose in a conifer-hardwood mixed forest in northern Japan, Geochem. J., 38, 77–88, 2004.
Nakatsuka, T., Sano, M., Li, Z., Xu, C., Tsushima, A., Shigeoka, Y., Sho, K., Ohnishi, K., Sakamoto, M., Ozaki, H., Higami, N., Nakao, N., Yokoyama, M., and Mitsutani, T.: Central Japan 2,600 Year Composite Tree-Ring Oxygen Isotope Data, National Centers for Environmental Information (NCEI), available at: https://www.ncdc.noaa.gov/paleo/study/28832, last access: 7 November 2020.
NNRICP (Nara National Research Institute for Cultural Properties) (Ed.): Reading history in tree rings – Formation of dendrochronology in Japan, NNRICP report No.48, NNRICP, Nara, Japan, 195 pp., 1990 (in Japanese with English table of contents and summary).
Pumijumnong, N., Muangsong, C., Buajan, S., Sano, M., and Nakatsuka, T.: Climate variability over the past 100 years in Myanmar derived from tree-ring stable oxygen isotope variations in Teak, Theor. Appl. Climatol., 139, 1401–1414, https://doi.org/10.1007/s00704-019-03036-y, 2019.
Roden, J. S.: Cross-dating of tree ring δ18O and δ13C time series, Chem. Geol., 252, 72–79, 2008.
Roden, J. S. and Ehleringer, J. R.: Hydrogen and oxygen isotope ratios of tree ring cellulose for field-grown riparian trees, Oecologia, 123, 481–489, 2000.
Roden, J. S., Lin, G., and Ehleringer, J. R.: A mechanistic model for interpretation of hydrogen and oxygen isotope ratios in tree-ring cellulose, Geochim. Cosmochim. Ac., 64, 21–35, 2000.
Sakaguchi, Y.: Warm and cold stages in the past 7600 years in Japan and their global correlation, Bull. Dept. Geography, Univ. Tokyo, Tokyo, Japan, 15, 1–31, 1983.
Sakaguchi, Y.: Natural History of Ozegahara, Chuokoron-Shinsya, Tokyo, Japan, 229 pp., 1989 (in Japanese).
Sano, M., Xu, C., and Nakatsuka, T.: A 300-year Vietnam hydroclimate and ENSO variability record reconstructed from tree-ring δ18O, J. Geophys. Res., 117, D12115, https://doi.org/10.1029/2012JD017749, 2012.
Sano, M., Tshering, P., Komori, J., Fujita, K., Xu, C., and Nakatsuka, T.: May–September precipitation in the Bhutan Himalaya since 1743 as reconstructed from tree-ring cellulose δ18O. J. Geophys. Res.-Atmos., 118, 8399–8410, https://doi.org/10.1002/jgrd.50664, 2013.
Sano, M., Dimri, A. P., Ramesh, R., Xu, C., Li, Z., and Nakatsuka, T.: Moisture source signals preserved in a 242-year tree-ring δ18O chronology in the western Himalaya, Global Planet. Change, 157, 73–82, https://doi.org/10.1016/j.gloplacha.2017.08.009, 2017.
Savard, M. M., Bégin, C., Marion, J., Arseneault, D., and Bégin, Y.: Evaluating the integrity of C and O isotopes in sub-fossil wood from boreal lakes, Palaeogeogr. Palaeocl., 348–349, 21–31, 2012.
Seo, J.-W., Sano, M., Jeong, H.-M., Lee, K.-H., Park, H.-C., Nakatsuka, T., and Shin, C.-S.: Oxygen isotope ratios of subalpine conifers in Jirisan National Park, Korea and their dendroclimatic potential, Dendrochronologia, 57, 125626, https://doi.org/10.1016/j.dendro.2019.125626, 2019.
Shu, Y., Feng, X., Gazis, C., Anderson, D., Faiia, A. M., Tang, K., and Ettl, G. J.: Relative humidity recorded in tree rings: A study along a precipitation gradient in the Olympic Mountains, Washington, USA, Geochim. Cosmochim. Ac., 69, 791–799, 2005.
Szymczak, S., Joachimski, M. M., Bräuning, A., Hetzer, T., and Kuhlemann, J.: Are pooled tree ring δ13C and δ18O series reliable climate archives? – A case study of Pinus nigra spp. laricio (Corsica/France), Chem. Geol., 308, 40–49, 2012.
Tan, L., Cai, Y., An, Z., Edwards, R. L., Cheng, H., Shen, C-C., and Zhang, H.: Centennial- to decadal-scale monsoon precipitation variability in the semi-humid region, northern China during the last 1860 years: Records from stalagmites in Huangye Cave, Holocene, 21, 287–296, 2010.
Totman, C. D.: The Green Archipelago: Forestry in Preindustrial Japan, University of California Press, Berkeley, USA, 297 pp., 1989.
Treydte, K. S., Schleser, G. H., Helle, G., Frank, D. C., Winiger, M., Haug, G. H., and Esper, J.: The 20th century was the wettest period in northern Pakistan over the past millennium, Nature, 440, 1179–1182, 2006.
Tsuji, H., Nakatsuka, T., Yamazaki, K., and Takagi, K.: Summer relative humidity in northern Japan inferred from tree-ring δ18O (1776–2002 AD) – Influence of paleoclimate indices of atmospheric circulation, J. Geophys. Res., 113, D18103, https://doi.org/10.1029/2007JD009080, 2008.
van Oldenborgh, G. J. and Burgers, G.: Searching for decadal variations in ENSO precipitation teleconnections, Geophys. Res. Lett. 32, L15701, https://doi.org/10.1029/2005GL023110, 2005.
Wang, L.-C., Behling, H., Lee, T.-Q., Li, H.-C., Huh, C.-A., Shiau, L.-L., Chen, S.-H., and Wu, J.-T.: Increased precipitation during the Little Ice Age in northern Taiwan inferred from diatoms and geochemistry in a sediment core from a subalpine lake, J. Paleolimnol., 49, 619–631, 2013.
Waseda, A. and Nakai, N.: Isotopic compositions of meteoric and surface waters in Central and Northeast Japan, Chikyukagaku, 17, 83–91, 1983 (in Japanese with English abstract).
Wigley, T. M. L., Briffa, K. R., and Jones, P. D.: On the average value of correlated time series, with applications in dendroclimatology and hydrometeorology, J. Clim. Appl. Meteorol., 23, 201–213, 1984.
Xu, C., Sano, M., and Nakatsuka, T.: Tree ring cellulose δ18O of Fokienia hodginsii in northern Laos: A promising proxy to reconstruct ENSO?, J. Geophys. Res., 116, D24109, https://doi.org/10.1029/2011JD016694, 2011.
Xu, C., Sano, M., and Nakatsuka, T.: A 400-year hydroclimate variability and local ENSO history in northern Southeast Asia inferred from tree-ring δ18O, Palaeogeogr. Palaeocl., 386, 588–598, 2013.
Xu, C., Ge, J., Nakatsuka, T., Yi, L., Zheng, H., and Sano, M.: Potential utility of tree ring δ18O series for reconstructing precipitation records from the lower reaches of the Yangtze River, southeast China, J. Geophys. Res., 121, 3954–3968, 2016.
Xu, C., Pumijumnong, N., Nakatsuka, T., Sano, M., and Guo, Z.: Inter-annual and multi-decadal variability of monsoon season rainfall in central Thailand during the period of 1804–1999-inferred from tree ring oxygen isotopes, Int. J. Climatol., 38, 5766–5776, doi.org/10.1002/joc.5859, 2018.
Xu, C., Shi, J., Zhao, Y., Nakatsuka, T., Sano, M., Shi S., and Guo, G.: Early summer precipitation in the lower Yangtze River basin for AD 1845–2011 based on tree-ring cellulose oxygen isotopes, Clim. Dynam., 52, 1583–1594, https://doi.org/10.1007/s00382-018-4212-5, 2019.
Yakir, D. and DeNiro, M. J.: Oxygen and hydrogen isotope fractionation during cellulose metabolism in Lemna gibba L., Plant Physiol., 93, 325–332, 1990.
Yamada, R., Kariya, Y., Kimura, T., Sano, M., Li, Z., and Nakatsuka, T.: Age determination on a catastrophic rock avalanche using tree-ring oxygen isotope ratios – the scar of a historical gigantic earthquake in the Southern Alps, central Japan, Quat. Geochronol., 44, 47–54, 2018.
Yamaguchi, Y., Yokoyama, Y., Miyahara, H., Sho, K., and Nakatsuka, T.: Synchronized Northern Hemisphere Climate Change and Solar Magnetic Cycles during the Maunder Minimum, P. Nat. Acad. Sci. USA, 107, 20697–20702, 2010.
Yapp, C.: Rusty relics of earth history: iron(III) oxides, isotopes, and surficial environments, Annu. Rev. Earth Pl. Sc., 29, 165–199, 2001.
Young, G. H. F., Demmler, J. C., Gunnarson, B. E., Kirchhefer, A. J., Loader, N. J., and McCarroll, D.; Age trends in tree ring growth and isotopic archives: A case study of Pinus sylvestris L. from northwestern Norway, Global Biogeochem. Cy., 25, GB2020, https://doi.org/10.1029/2010GB003913, 2011.
Zhang, P., Cheng, H., Edwards, R. L., Chen, F., Wang, Y., Yang, X., Liu, J., Tan, M., Wang, X., Liu, J., An, C., Dai, Z., Zhou, J., Zhang, D., Jia, J., Jin, L., and Johnson, K. R.: A Test of climate, sun, and culture relationships from an 1810-year Chinese cave record, Science, 322, 940–942, 2008.