the Creative Commons Attribution 4.0 License.
the Creative Commons Attribution 4.0 License.
 | 23 Jan 2020
Distorted Pacific–North American teleconnection at the Last Glacial Maximum
Zhengyu Liu
Yuchen Wang
Zhengyao Lu
The Pacific–North American (PNA) teleconnection is one of the most important climate modes in the present climate condition, and it enables climate variations in the tropical Pacific to exert a significant influence on North America. Here, we show climate simulations in which the PNA teleconnection was largely distorted or broken at the Last Glacial Maximum (LGM). The distorted PNA is caused by a split in the westerly jet stream, which is ultimately forced by the large, thick Laurentide ice sheet that was present at the LGM. Changes in the jet stream greatly alter the extratropical waveguide, distorting wave propagation from the North Pacific to North America. The distorted PNA suggests that climate variability in the tropical Pacific, notably El Niño–Southern Oscillation (ENSO), would have little direct impact on North American climate at the LGM.
- Article
(13253 KB) - Full-text XML
-
Supplement
(1071 KB) - BibTeX
- EndNote


The Pacific–Northern American (PNA) teleconnection is the major atmospheric teleconnection mode that links climate variations in the tropical Pacific to climate in North America for the present-day climate state (Horel and Wallace, 1981; Wallace and Gutzler, 1981). Climate variability associated with El Niño–Southern Oscillation (ENSO) exerts an especially great influence on North American climate through the PNA teleconnection (Henderson and Robinson, 1994; Lau, 1997; Leathers et al., 1991; and Straus and Shukla, 2002). It is well known that the PNA is largely constrained by extratropical atmospheric flows, notably the extratropical waveguide (Held, 1983; Held et al., 2002; Hoskins and Karoly, 1981; and Jin and Hoskins, 1995). Thus, changes in extratropical atmospheric flows should alter the PNA under different climate conditions.
It has been shown that greenhouse warming leads to a strengthening and shift in the PNA due to altered extratropical atmospheric flows (Allan et al., 2014; Chen et al., 2017). There has also been a large body of work that demonstrates significant differences in extratropical atmospheric circulations in cold climates, notably the Last Glacial Maximum (LGM). It was shown that during the LGM the Aleutian low pressure system was enhanced in winter, the Pacific high pressure system was weakened in summer (Yanase and Abe-Ouchi, 2007, 2010), the westerly jet shifted southward (Braconnot et al., 2007; Otto-Bliesner et al., 2006), and transient waves were weakened over the North Pacific and strengthened over the North Atlantic (Justino and Peltier, 2005; Justino et al., 2005). These works suggest that the PNA could change in different climate regimes. Therefore, a natural question is whether the PNA is also significantly altered due to atmospheric circulation changes during the LGM.
The LGM occurred between 23 000 and 19 000 years ago (Clark et al., 2009; Clark and Mix, 2002). One of the most significant climatic characteristics of the LGM is the maximum expansion of midlatitude ice sheets. Extensive ice sheets grew over North America and northwestern Europe, with the Laurentide ice sheet over North America, in particular, having an ice thickness of 3 to 4 km (Marshall et al., 2002). Early simulations have shown that the large, thick Laurentide ice sheet forced the extratropical westerly jet stream to split into northern and southern branches (Cohmap, 1988; Kutzbach and Wright, 1985; and Rind, 1987), and the jet split led to regional climate changes over the globe, especially over North America. Proxy records show that there were more storms and precipitation associated with the southern branch, causing high lake levels and increased woodland areas in the southwestern United States (Cohmap, 1988; Kutzbach and Wright, 1985).
Recent modeling studies have shown that the Arctic Oscillation and storm tracks at the LGM differ significantly from the present (Justino and Peltier, 2005; Laîné et al., 2009; Li and Battisti, 2008; Lü et al., 2010; and Rivière et al., 2010), and the Laurentide ice sheet could influence the Southern Hemisphere atmospheric teleconnection and climate variability in West Antarctica (Jones et al., 2018). Therefore, it is possible that changed atmospheric circulations at the LGM might also significantly alter the PNA and thus the climatic linkage between the tropical Pacific and North America.
In the present paper, using climate simulation results, we show that the PNA was largely distorted or even broken by the Laurentide ice sheet at the LGM, and ENSO had little direct impact on North American climates. We will also address how the PNA was altered by the Laurentide ice sheet.
The simulation results from the Paleoclimate Modeling Intercomparison Project 2 (PMIP2) (Braconnot et al., 2012, 2007) and 3 (PMIP3) (Abe-Ouchi et al., 2015) are utilized in this study. By comparing the PNA patterns in the preindustrial condition (PIC) with LGM simulations, as well as our own sensitivity simulations, the changes in the PNA pattern at the LGM are identified. The horizonal resolution of the models we use are listed in Table S1 in the Supplement. For comparison, we also use the NCEP/NCAR Reanalysis 1 data from 1988 to 2017 (Kistler et al., 2001), with a horizontal resolution of . We shall mainly focus on the simulation results from the Community Climate System Model version 3 (CCSM3) (Collins et al., 2006; Jones et al., 2018; Otto-Bliesner et al., 2006; and Yeager et al., 2006), since our sensitivity simulations are performed with the same model.
To understand the impact of the topography of glacial ice sheets in the Northern Hemisphere on the PNA, we performed a series of sensitivity simulations with different ice sheet thicknesses, which are 0 %, 20 %, 40 %, 60 %, 80 %, 100 % and 150 % of the ice sheet thickness that was used in PMIP2. Note that different ice sheet reconstructions were used in PMIP2 and PMIP3 simulations. PMIP2 simulations used the ICE-5G (VM2) reconstruction (Peltier, 2004), while PMIP3 simulations used the ICE-6G reconstruction. In general, the ice sheet thickness used in the ICE-6G reconstruction is approximately equal to 80 % of the value used in ICE-5G for most parts of the North American region (Fig. S1 in the Supplement). In our sensitivity simulations, the case of 0 % ice sheet thickness means that the thickness of the ice sheet is set to zero, but the surface albedo value remains the same as the ice albedo value. All other conditions are the same as those in LGM simulations using the PMIP2 model . The model for our sensitivity simulations is a lower-resolution version of CCSM3 (T31), with a horizontal resolution of . It differs from the PMIP2 models (T42) with a horizontal resolution of . Although the horizontal resolution in CCSM3 T31 is lower, it can reproduce the present-day PNA pattern in the PIC simulation well, consistent with the results in Magnusdottir and Haynes (1999) and Löfverström et al. (2016). Therefore, the results here are not sensitive to model resolutions.
Following Horel and Wallace (1981) and Wallace and Gutzler (1981), the PNA teleconnection is characterized by the pointwise correlation method. The four base points that represent the centers of action are located near Hawaii (20∘ N, 160∘ W), the North Pacific (45∘ N, 165∘ W), Alberta (55∘ N, 115∘ W) and the Gulf Coast (30∘ N, 85∘ W). The four base points were objectively derived using a teleconnectivity analysis (Sherriff-Tadano and Itoh, 2013; Wallace and Gutzler, 1981). To examine whether models can reasonably simulate the PNA in PIC simulations and whether the PNA pathway is altered in LGM simulations, we loosely define a circular region, with a radius of 10∘, around three of the centers, the North Pacific, North America and the Gulf Coast (the base point is near Hawaii). For PIC simulations, if a model cannot generate statistically significant correlations (coefficients greater than 0.35) within the circular regions, the model is considered to have had a poor performance while simulating the PNA. For the models with a good performance while simulating the PNA in their PIC simulations, if their LGM simulations show an absence of significant correlations in the three circular regions, the PNA pathway is considered to be distorted or broken at the LGM. Because the PNA is most active in December–January–February (DJF), our analysis below will mainly focus on the DJF season.
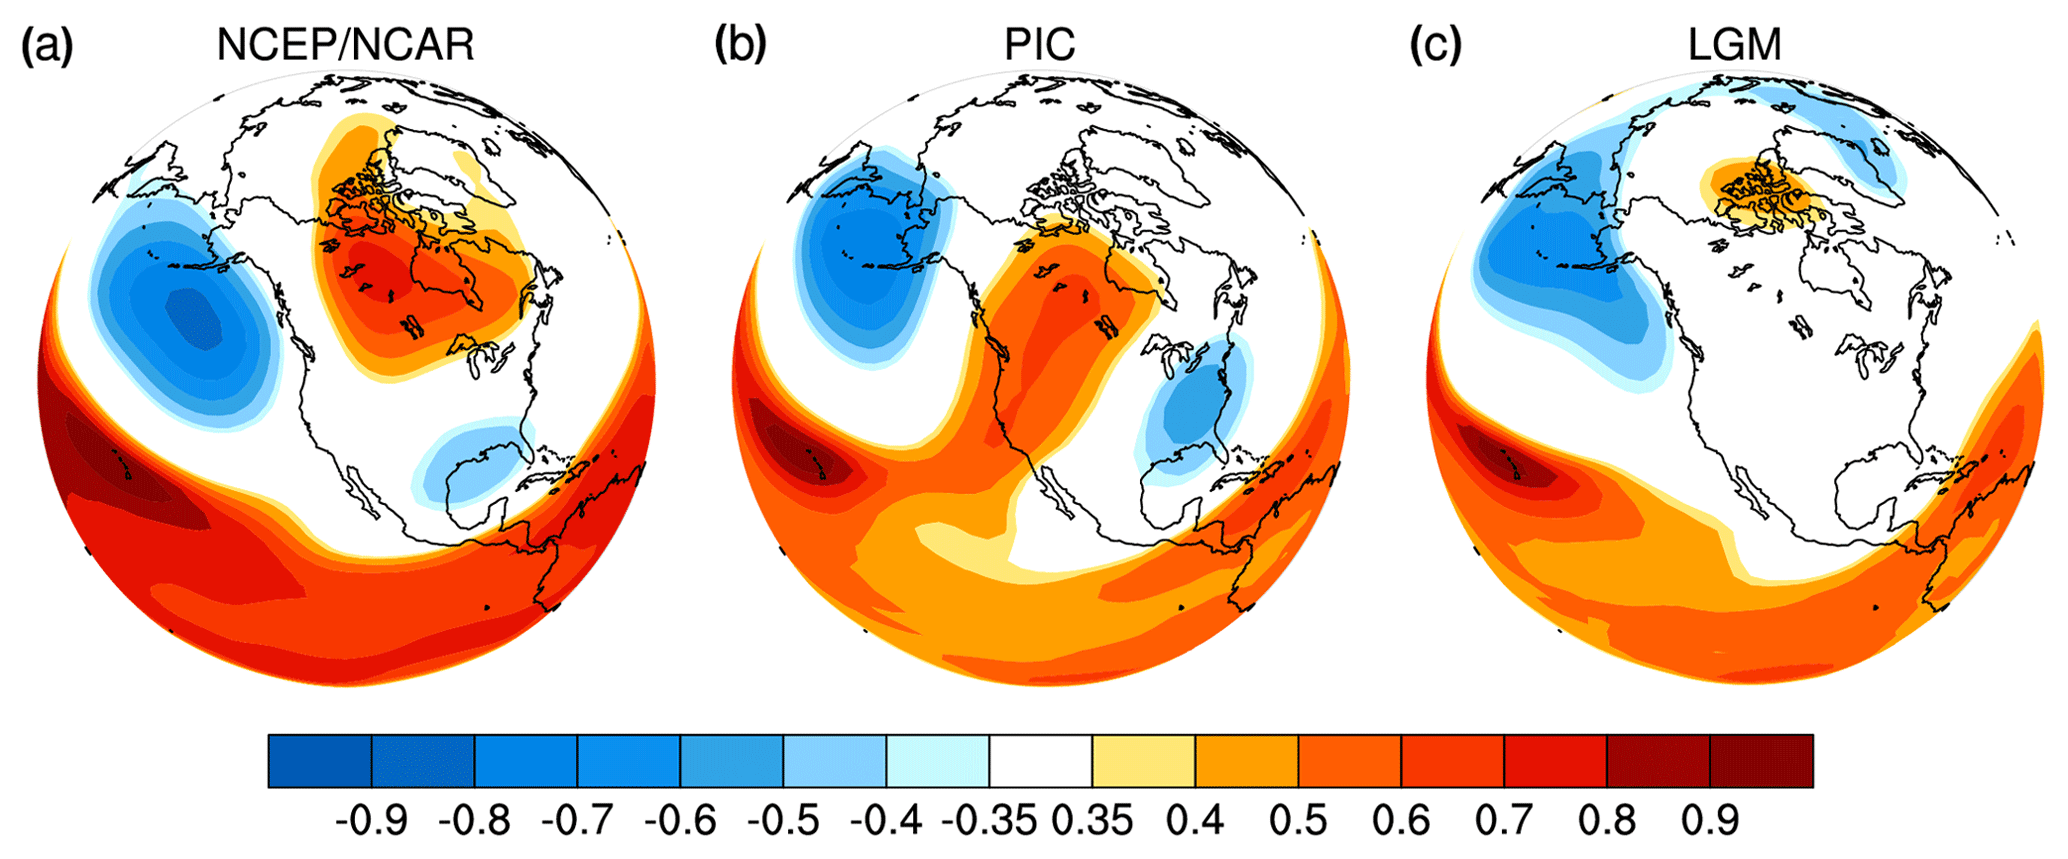
Figure 1One-point correlation maps of 500 hPa geopotential heights in DJF from NCEP/NCAR reanalysis and PMIP2 CCSM3 simulations. (a) NCEP/NCAR, (b) PIC and (c) LGM. The base point is near Hawaii. The correlation coefficient of 0.35 corresponds to the 95 % confidence level for 30-year correlations.
In the present paper, all correlation analyses are conducted with monthly-mean model outputs for simulations of the last 30 years. A correlation coefficient 0.35 corresponds to the 95 % confidence level for 30-year correlations.
Figure 1 shows one-point correlation maps of 500 hPa geopotential heights in DJF, with the base point near Hawaii. The correlation maps in Fig. 1a and b exhibit similar wave-train patterns, with negative correlations, followed by centers of positive correlations, and finishing with negative correlations, extending from Hawaii to the North Pacific, Alberta and the Gulf Coast. Hence, the present-day PNA is reproduced reasonably well in CCSM3. In contrast, this PNA pattern is altered dramatically in the LGM simulation using CCSM3 (Fig. 1c). The negative correlation over the North Pacific is reduced, and the center of positive correlation is rather weak and shifted to the Arctic. The most striking feature in Fig. 1c is that the center of negative correlation near the Gulf Coast completely disappears. The results in Fig. 1 indicate that the PNA teleconnection is largely distorted at the LGM. This is the most important point of the present paper.
This distorted PNA at the LGM can also be seen from correlation maps of the other three base points. When the base point is located over the North Pacific (Fig. S2c), the center of positive correlation over North America is shifted to northern Canada. For the base point over North America (Fig. S2f), the negative correlations over the North Pacific and the Gulf Coast are all largely reduced, and the center of positive correlation near Hawaii disappears. This result indicates a disconnection between North America and the tropical Pacific. For the base point near the Gulf Coast (Fig. S2i), a wave train is established from the North Pacific to the Gulf Coast, while the center of positive correlation over North America is largely reduced, and the center of positive correlation near Hawaii is absent.
The PNA teleconnection at the LGM is completely broken in other PMIP2 models. There are seven PMIP2 models that have simulations available online. According to our definition, CCSM3, ECBILTCLIO, HadCM3M2 and CNRM-CM33 can reasonably reproduce the PNA in their PIC simulations (Figs. 1b and S3a–c), whereas IPSL-CM4-V1-MR, FGOALS-1.0g and MIROC3.2 had a poor simulation performance. In LGM simulations, the center of negative correlation over the North Pacific still exists in ECBILTCLIO, HadCM3M2 and CNRM-CM33 (Fig. S3d–f), although the centers in these models all shift away from the North Pacific base point and are largely reduced. However, the center of positive correlation over North America completely disappears in these plots. Moreover, the center of negative correlation near the Gulf Coast also disappears in these three models.
PMIP3 simulations are also used to demonstrate the changes in the PNA teleconnection at the LGM. There are eight PMIP3 models that have LGM simulations available online. Again, according to our definition, CCSM4, MRI-CGCM3 and MIROC-ESM can reasonably reproduce the PNA in their PIC simulations (Fig. S4a–c). The LGM simulations in CCSM4 and MRI-CGCM3 show the absence of the center of positive correlation over North America (Fig. S4d and e). The center of positive correlation in MIROC-ESM is weak and biased toward the Arctic (Fig. S4f). The center of negative correlation near the Gulf Coast is absent in MRI-CGCM3 and MIROC-ESM. Although there is a negative center in CCSM4 (Fig. S4d), it is more likely a result of the subtropical wave train, rather than a part of the PNA. Thus, the LGM simulations in PMIP3 models demonstrate that the PNA is either distorted or completely broken.
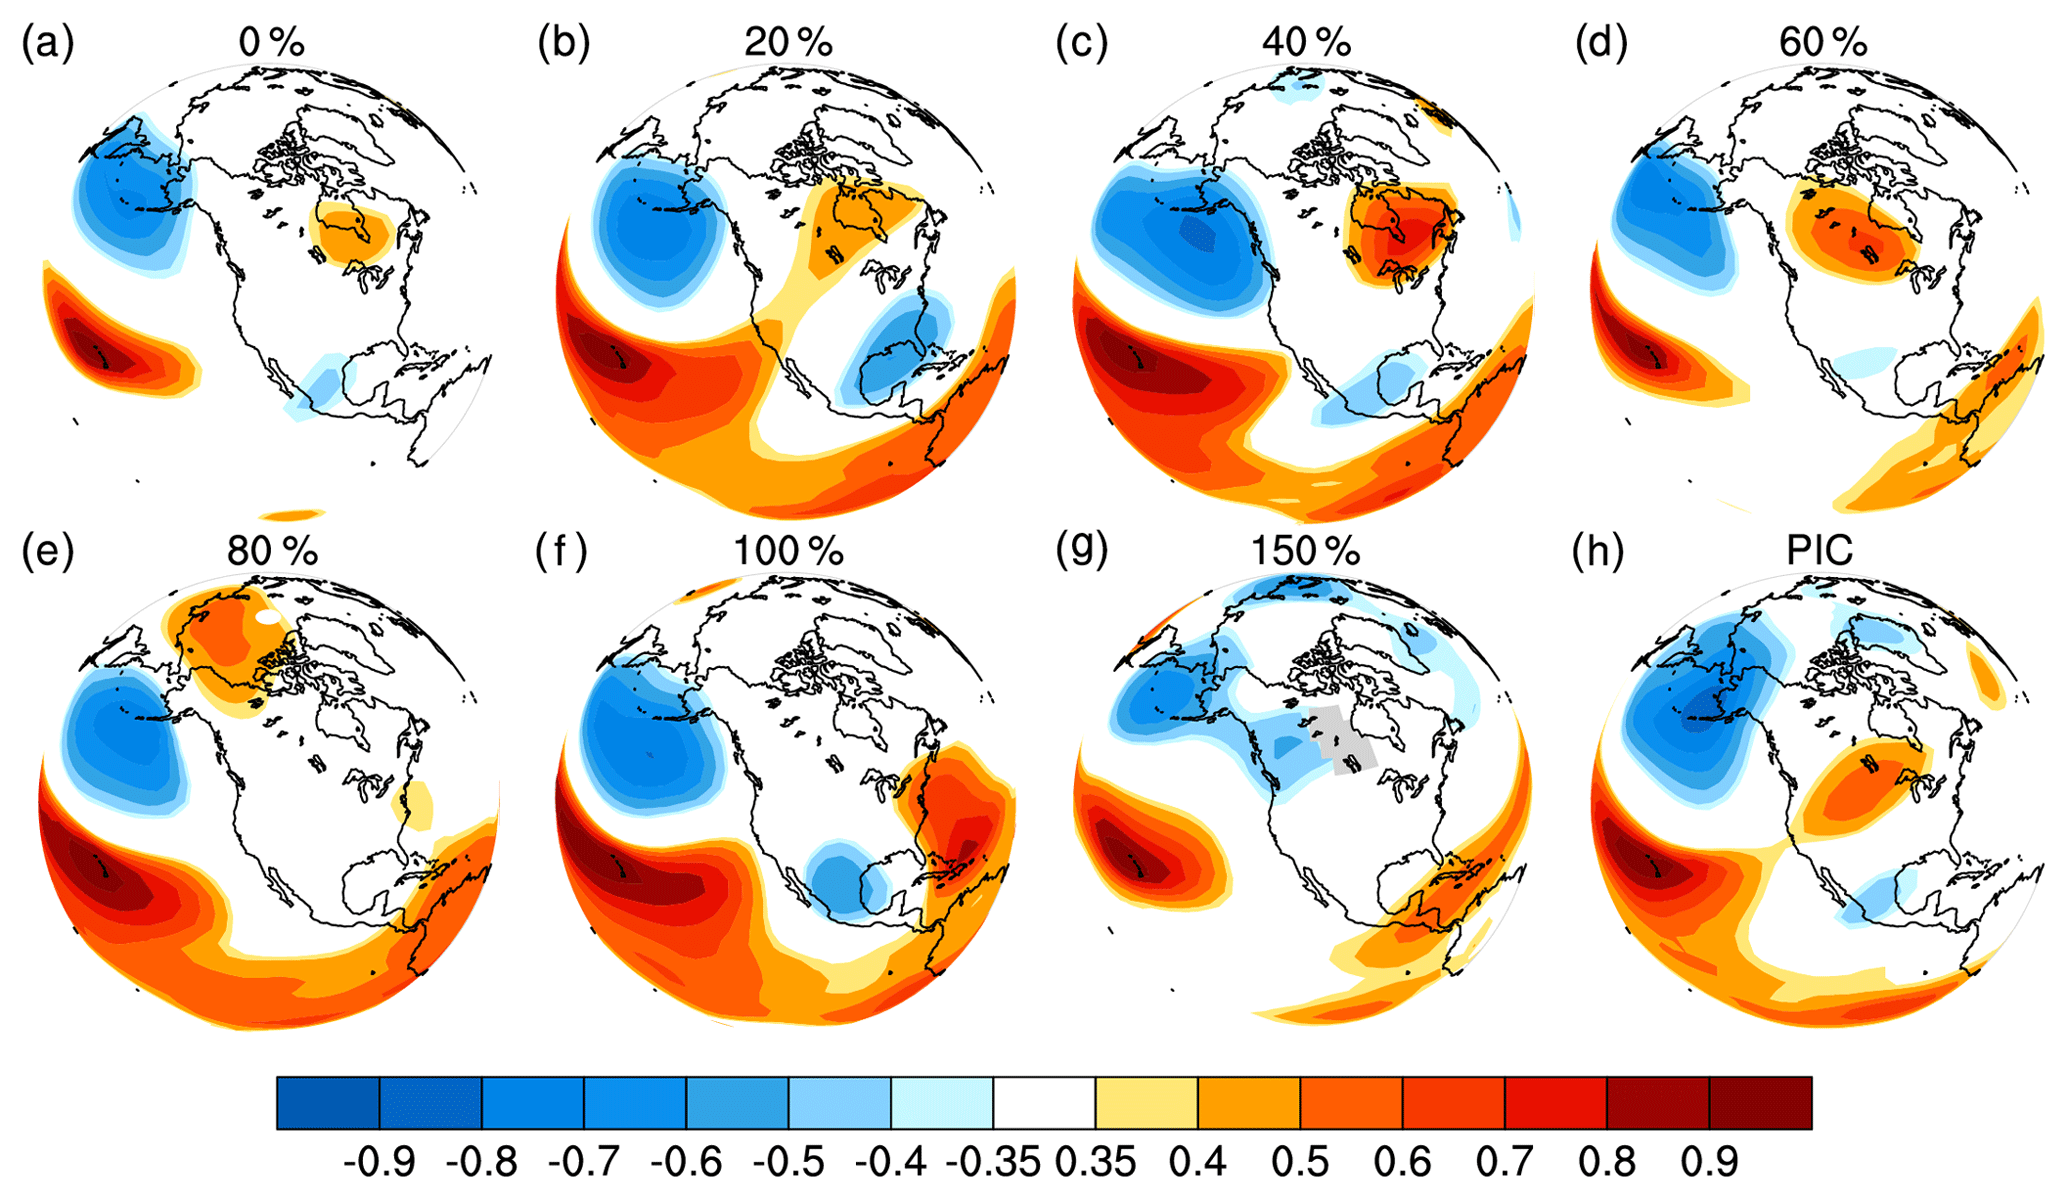
Figure 2One-point correlation maps of 500 hPa geopotential heights in DJF in sensitivity simulations, with different ice sheet thicknesses. The base point is near Hawaii. (a) 0 %, (b) 20 %. (c) 40 %, (d) 60 %, (e) 80 %, (f) 100 %, (g) 150 % and (h) PIC. The correlation coefficient of 0.35 corresponds to the 95 % confidence level for 30-year correlations.
We have also done empirical orthogonal function (EOF) and rotated EOF (REOF) analysis to examine the PNA pattern for both LGM and PIC simulations (figures not shown here). It was found that the second REOF modes in both the NCEP reanalysis and the CCSM3 PIC simulation all represent the loading pattern of the present-day PNA well. However, the second REOF in the CCSM3 LGM simulation does not show the PNA pattern. The third and fourth REOFs in the LGM simulation show teleconnections between the North Pacific and the Arctic as well as between the North Pacific and the southern part of North America.
Figure 2 illustrates PNA responses to different ice sheet thicknesses in the sensitivity simulations. The PNA pattern remains for ice sheet thicknesses no more than 60 % of that in PMIP2 (Fig. 2a–d). In contrast, the PNA is distorted as ice sheet thickness is increased to 80 %. The center of positive correlation is shifted to the Arctic, and the center of negative correlation near the Gulf Coast disappears (Fig. 2e). As ice sheet thickness is further increased to 100 % and 150 % (Fig. 2f–g), the center of positive correlation over North America disappears. Again, the center of negative correlation is more likely a part of the subtropical wave train. These results from the sensitivity simulations suggest that the PNA is distorted or even broken if the Laurentide ice sheet is sufficiently thick.

Figure 3Correlation coefficients at the four PNA action centers in PIC and LGM simulations using PMIP2 and PMIP3 models, with the base point near Hawaii. The negative values over the North Pacific and the Gulf Coast are reversed to positive. The dashed lines correspond to 0.35, which represents the 95 % confidence level. (a) CCSM3 and CCSM4, (b) sensitivity simulations, (c) PIC simulations using PMIP2 models, (d) PIC simulations in PMIP3 models, (e) LGM and PIC simulations using well-performing PMIP2 models, and (f) LGM and PIC simulations using well-performing PMIP3 models.
Figure 3 summarizes the correlation coefficients around the four base points for PMIP2, PMIP3 and our sensitivity simulations, according to our definition in Sect. 2. In Fig. 3a, both CCSM3 and CCSM4 show statistically significant correlations at all the four base points in the PIC simulations. In contrast, they all demonstrate insignificant correlations near Alberta in the LGM simulations. The significant correlation in the CCSM4 LGM simulation near the Gulf Coast is a result of the subtropical wave train (Fig. S4d), as mentioned above. In Fig. 3b, the correlation coefficient for the area near Alberta becomes less significant as ice sheet thickness reaches 80 %. Correlation coefficients near the Gulf Coast are insignificant for 80 % and 150 % ice sheet thickness. The significant correlation near the Gulf Coast, with 100 % ice sheet thickness, is a result of the subtropical wave train, as shown in Fig. 2f.
Figure 3c and d show that most PMIP2 and PMIP3 models, except for FGOALS-1.0g, are able to reproduce the center of negative correlations over the North Pacific in their PIC simulations. FGOALS-1.0g generates insignificant correlations near both the North Pacific and Alberta. CNRM-CM33 and MIROC3.2 do not generate significant correlations near the Gulf Coast. Figure 3d shows that CCSM4, MRI-CGCM3 and MIROC-ESM are able to reproduce significant correlations at all four base points in their PIC simulations, whereas the other five models have insignificant correlations near either Alberta or the Gulf Coast. Figure 3e and f show that all of the PMIP2 and PMIP3 models, which performed well while simulating the PNA teleconnection in PIC simulations, cannot reproduce significant positive correlations near Alberta or negative correlations near the Gulf Coast in the LGM simulations. These results all suggest that the PNA was distorted or broken at the LGM.
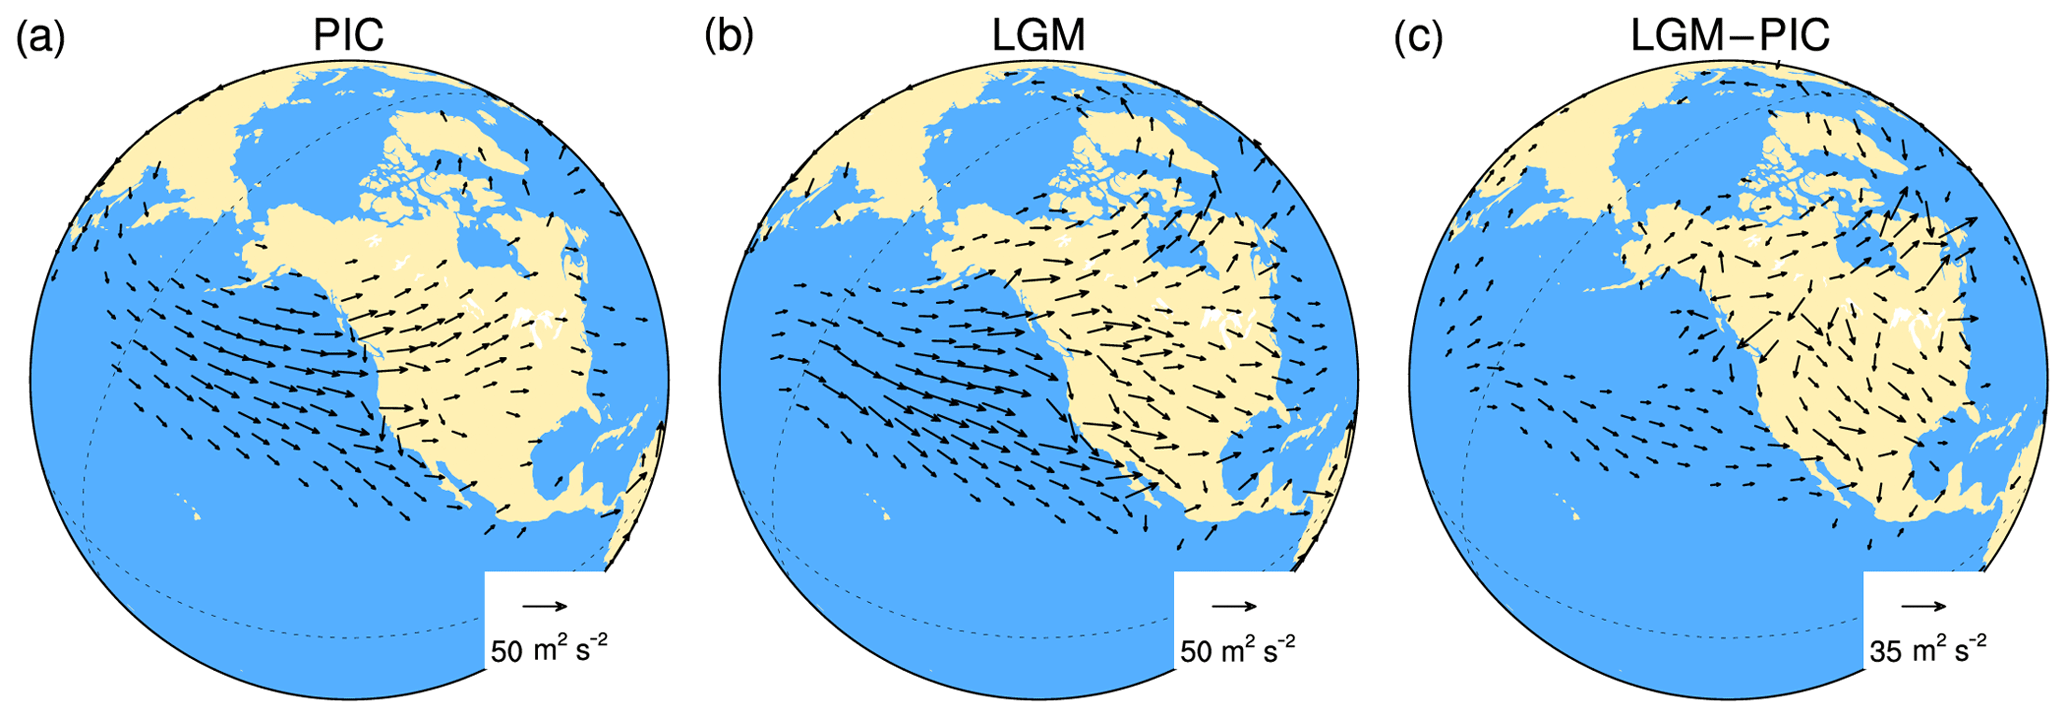
Figure 4Stationary wave activity fluxes in PMIP2 CCSM3 simulations at 500 hPa. (a) PIC, (b) LGM and (c) LGM–PIC. Length scales of wave activity vectors are marked in plots. Wave activity vectors are plotted if their length scales are greater than 12 m2 s−2 in plots (a) and (b) and greater than 6.5 m2 s−2 in plot (c). Here, stationary wave activity fluxes are calculated with monthly-mean data.
Because the PNA pattern is characterized by a quasi-stationary wave train from the tropical Pacific to North America, the above simulation results suggest that the PNA wave-train propagation is largely altered at the LGM. This can be confirmed by stationary wave activity fluxes at 500 hPa (Fig. 4), which represent the propagation direction of stationary waves, calculated using Eq. (7.1) in Plumb (1985) . At present, the wave activity fluxes have two branches of wave propagation from the North Pacific toward North America (Fig. 4a). The major branch propagates northeastward, forming the PNA teleconnection, while the minor branch propagates southeastward. At the LGM, however, wave propagation is altered drastically. Wave propagation is deflected toward the subtropics (Fig. 4b and c). This is consistent with the correlation map in Fig. S2i that shows a wave train from the North Pacific to the Gulf Coast. Therefore, the distorted or broken PNA at the LGM is mainly due to the deflection of wave propagation toward the southeast.
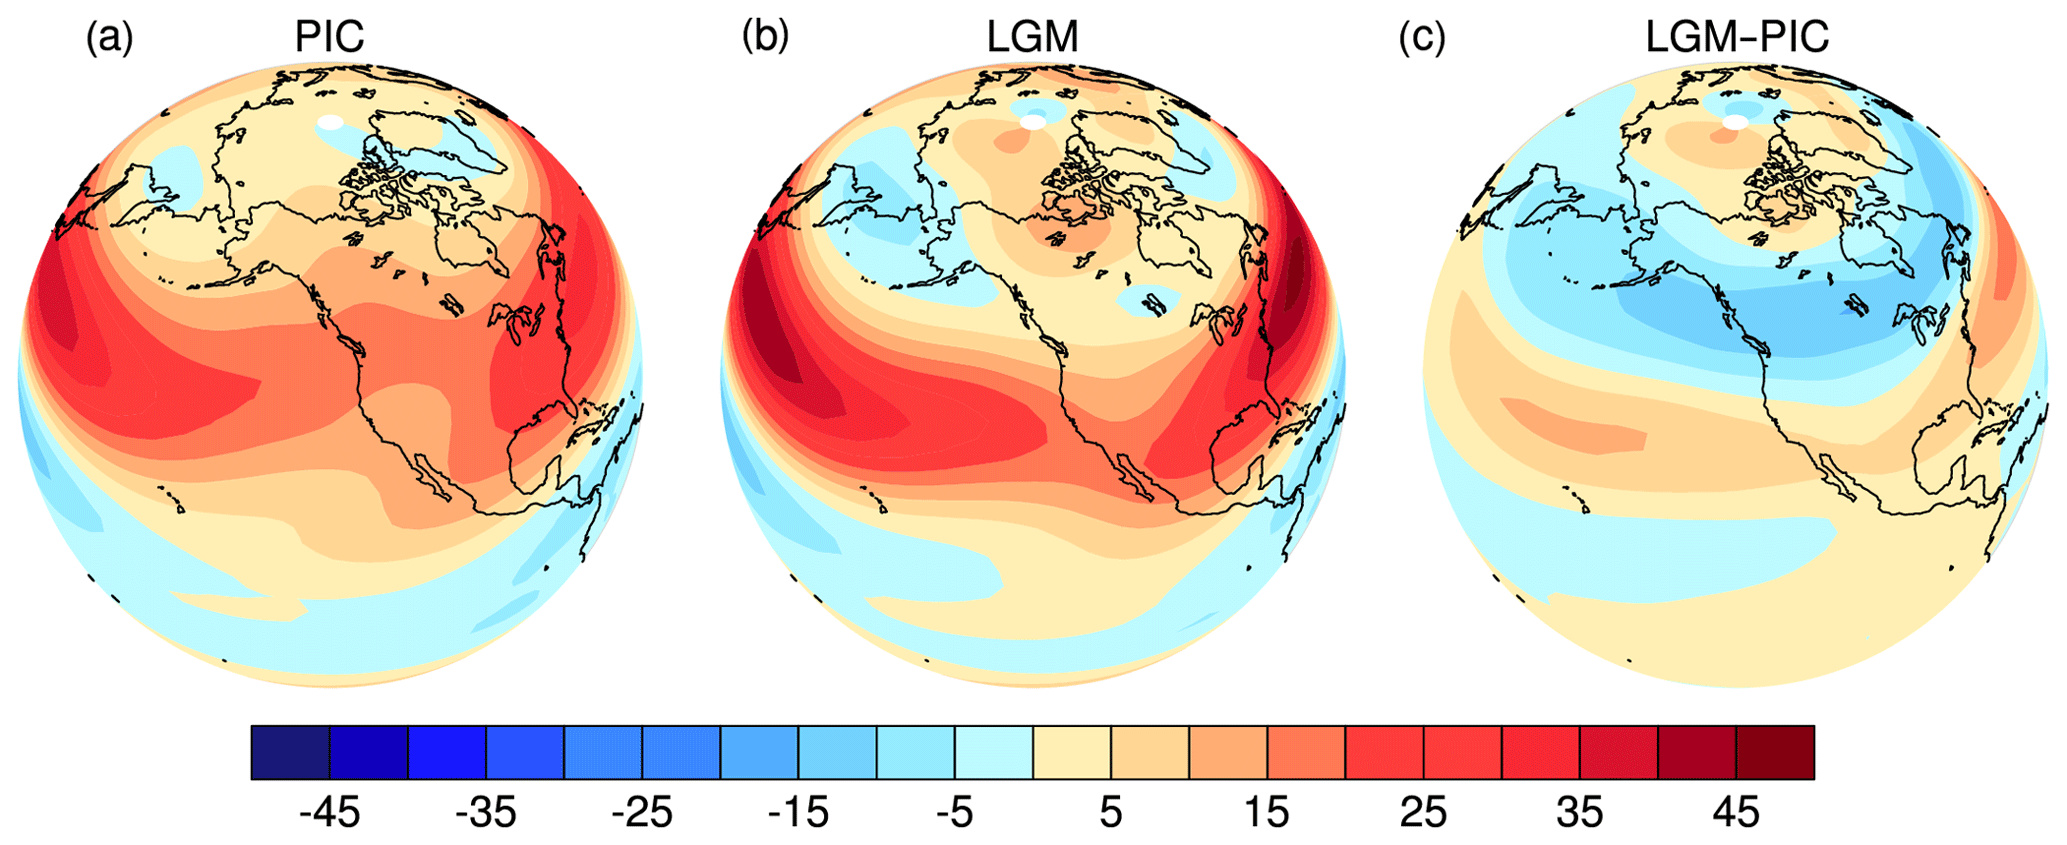
Figure 5Maps of 500 hPa zonal winds in DJF in PMIP2 CCSM3 simulations. (a) PIC, (b) LGM and (c) LGM–PIC. Color interval: 5 m s−1.
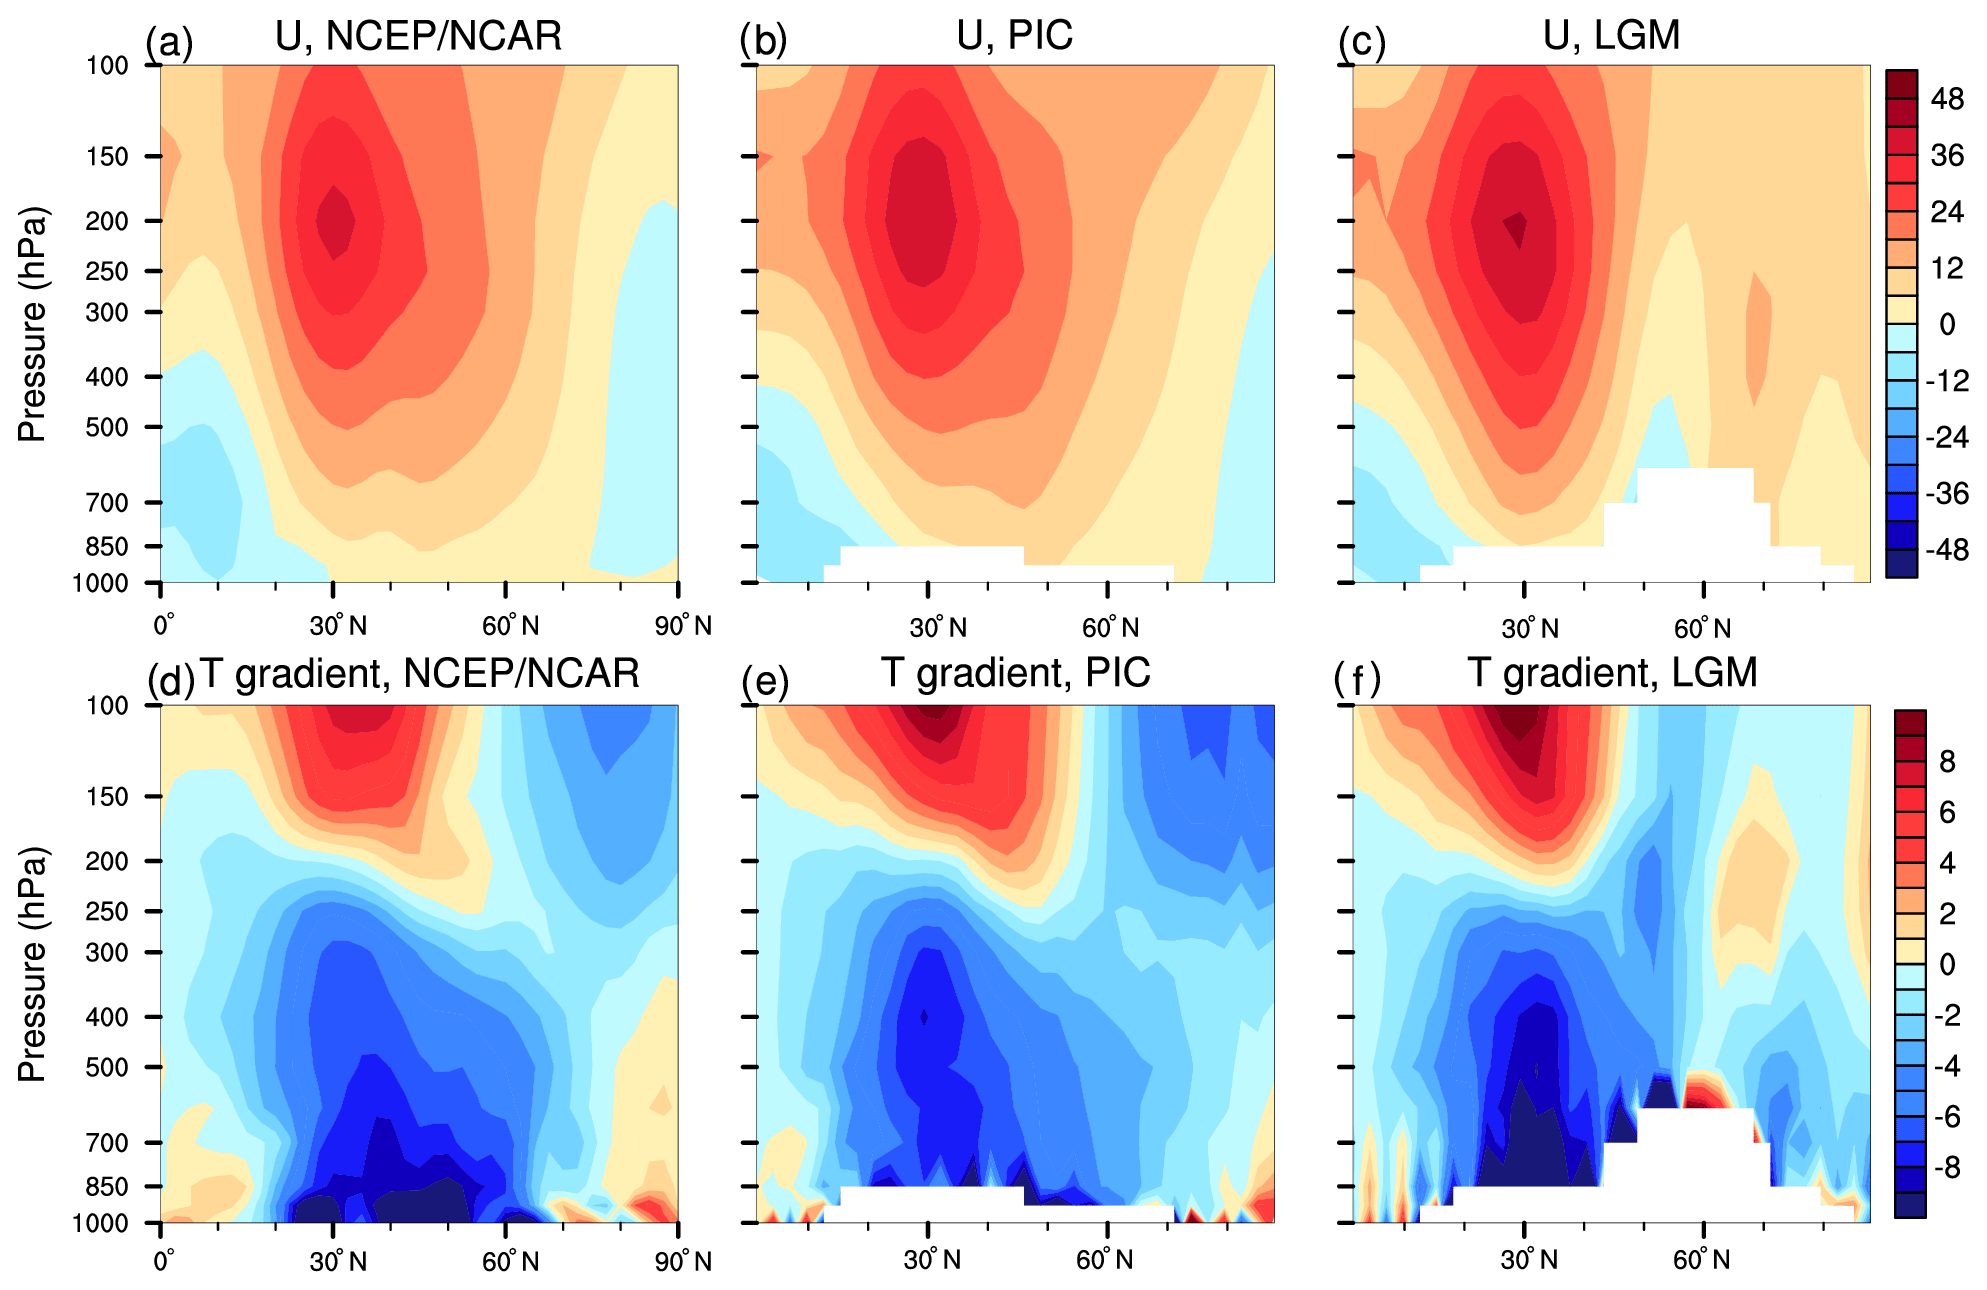
Figure 6Vertical cross sections of DJF zonal winds and meridional temperature gradients along the 100∘ W longitude in the NCEP/NCAR reanalysis and PMIP2 CCSM3 simulations. (a, b, c) Zonal winds and (d, e, f) temperature gradients. (a, d) NCEP/NCAR, (b, e) PIC and (c, f) LGM. The zonal-wind unit is meters per second and the temperature gradient unit is kelvin per 1000 km.
Wave propagation is oriented by the extratropical waveguide, which in turn is determined by extratropical zonal flows (Hoskins and Karoly, 1981; Jin and Hoskins, 1995). Therefore, the deflection of stationary wave propagation at the LGM is caused by changes in extratropical zonal flows. A comparison of zonal winds between PIC and LGM simulations shows several major differences (Fig. 5a vs. Fig. 5b). First, the zonal jet stream was much stronger at the LGM than at present. Second, the jet was shifted equatorward at the LGM, and the jet turned southeastward as it approached the North American continent, in contrast to the northeastern orientation at present. Third, as was the case in early studies (Cohmap, 1988; Kutzbach and Wright, 1985; and Rind, 1987), the jet splits over North America, with the much stronger branch located in the subtropics, leaving the much weaker branch over northern Canada. These features can be seen more clearly in differences between zonal winds in the LGM and PIC simulations (Fig. 5c).
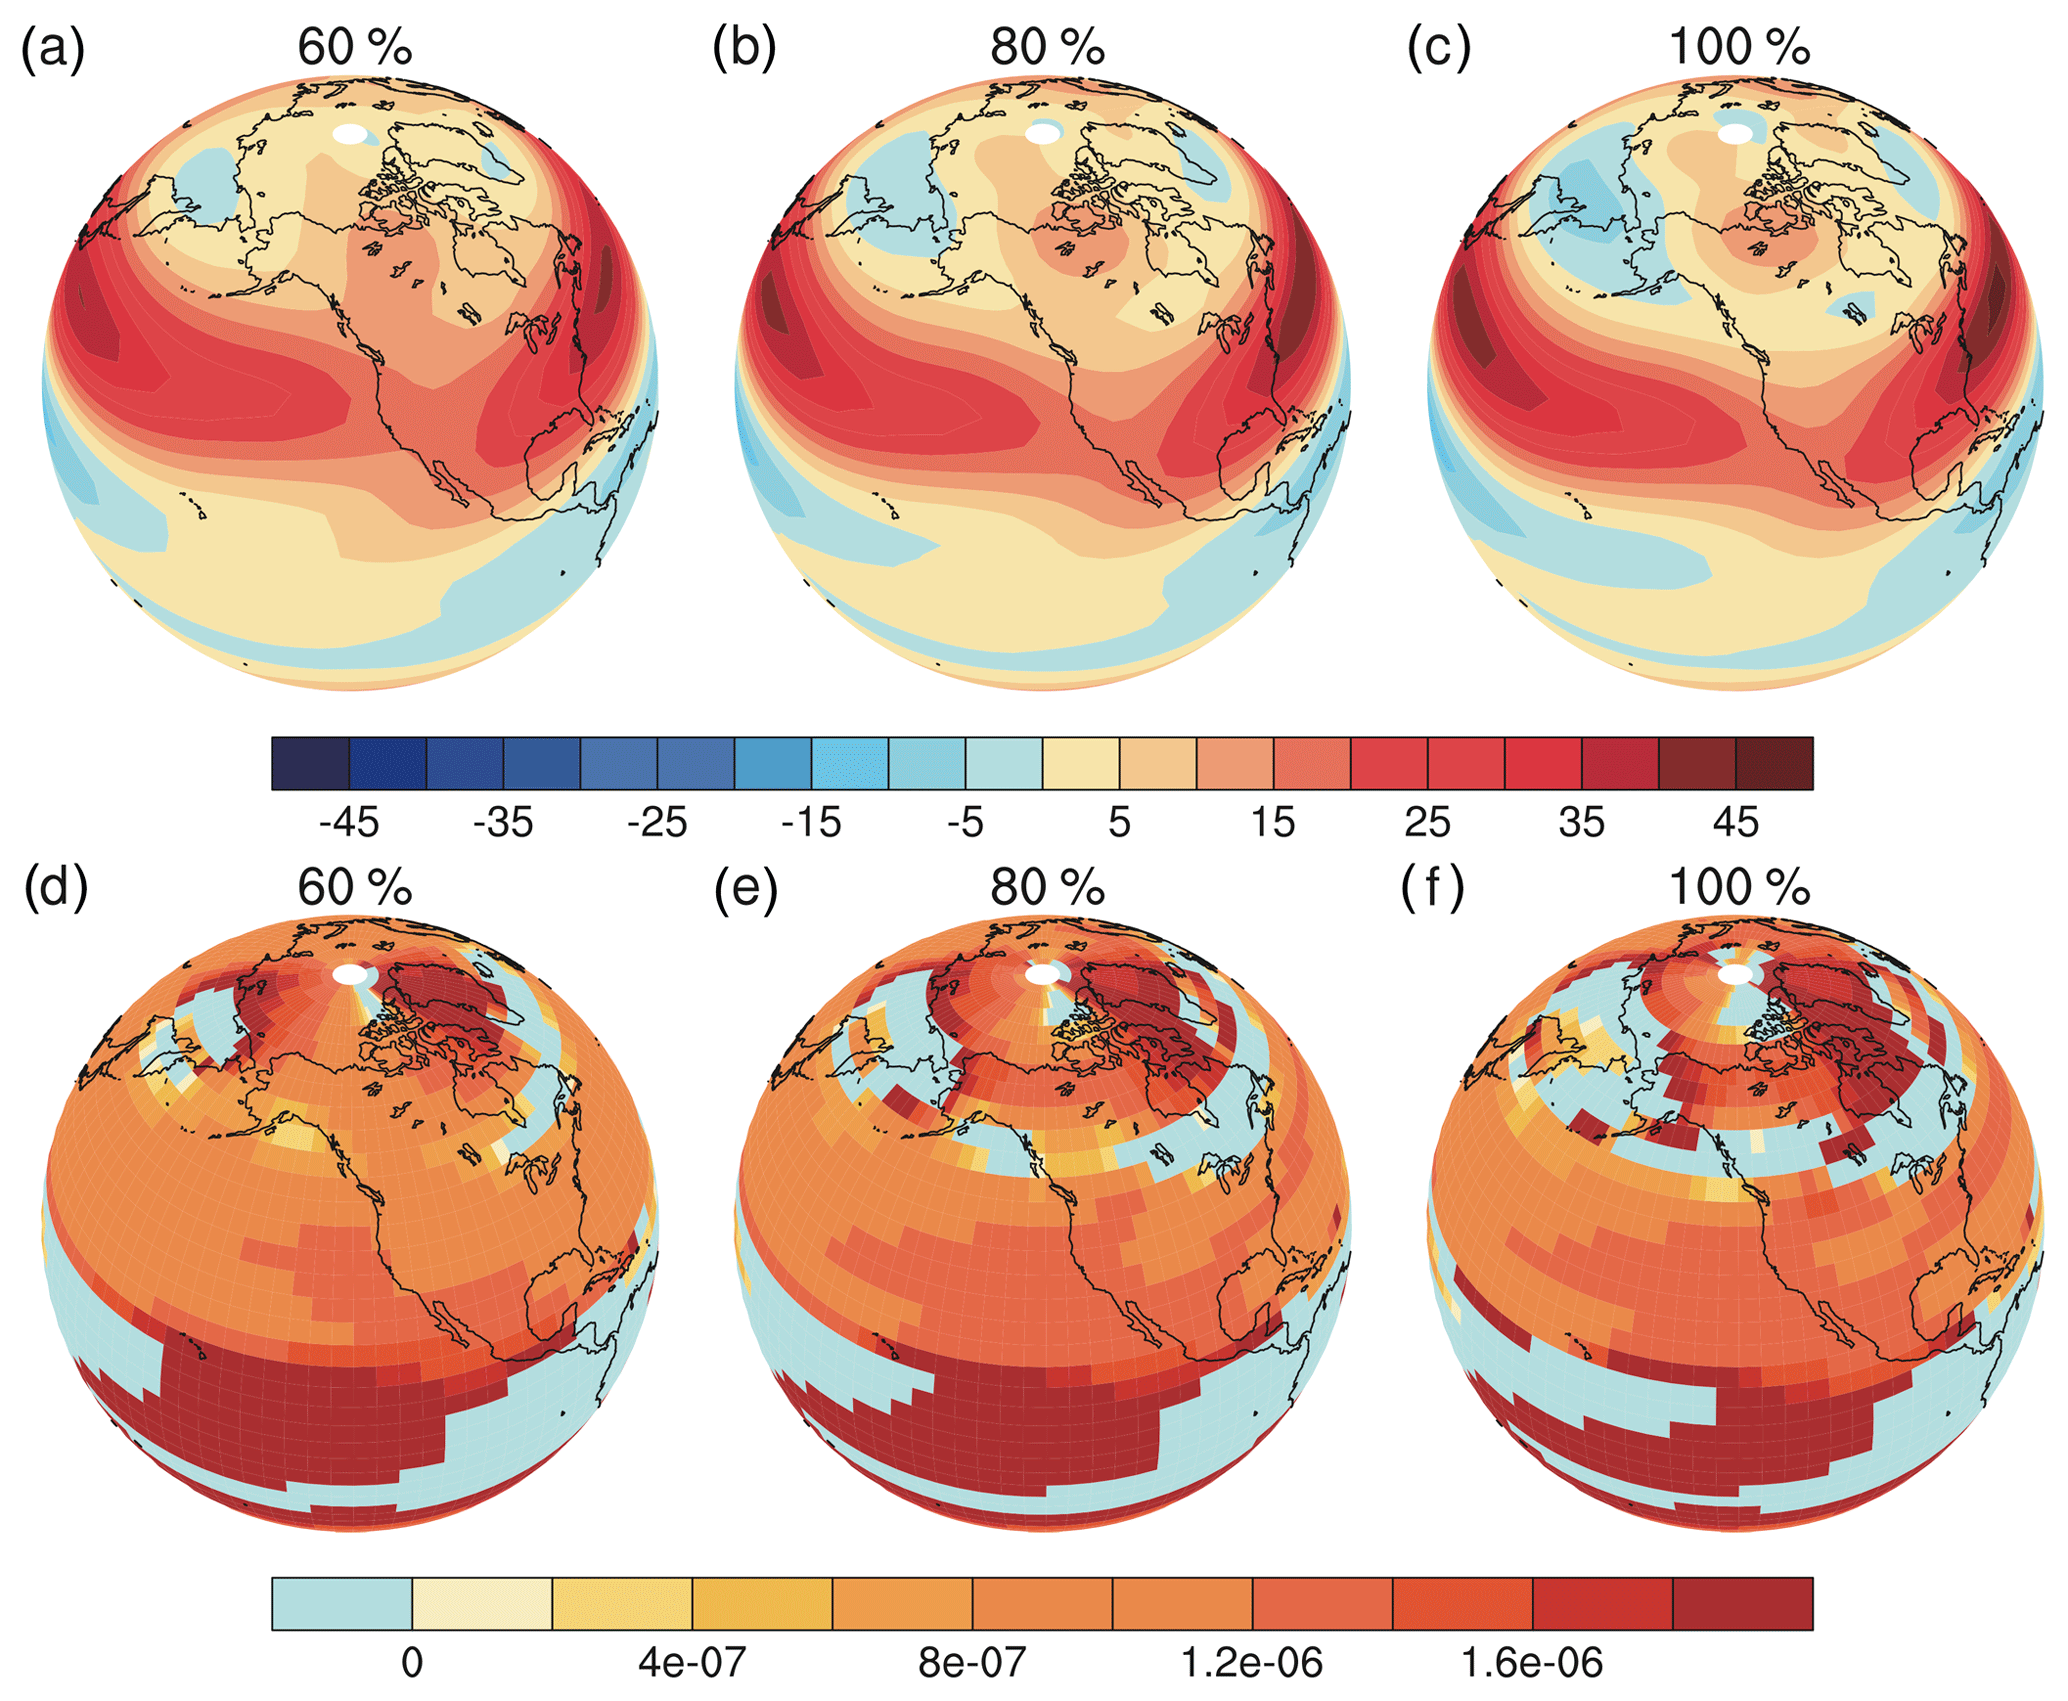
Figure 7Distributions of zonal winds and stationary wave numbers for different ice sheet thicknesses in sensitivity simulations in DJF. (a–c): Zonal winds; (d–f): stationary wave numbers. (a, d) 60 %, (b, e) 80 % and (c, f) 100 %. The zonal-wind unit is meters per second and the stationary wave number unit is per meter. The light-blue areas in (d-f) have imaginary wave numbers.
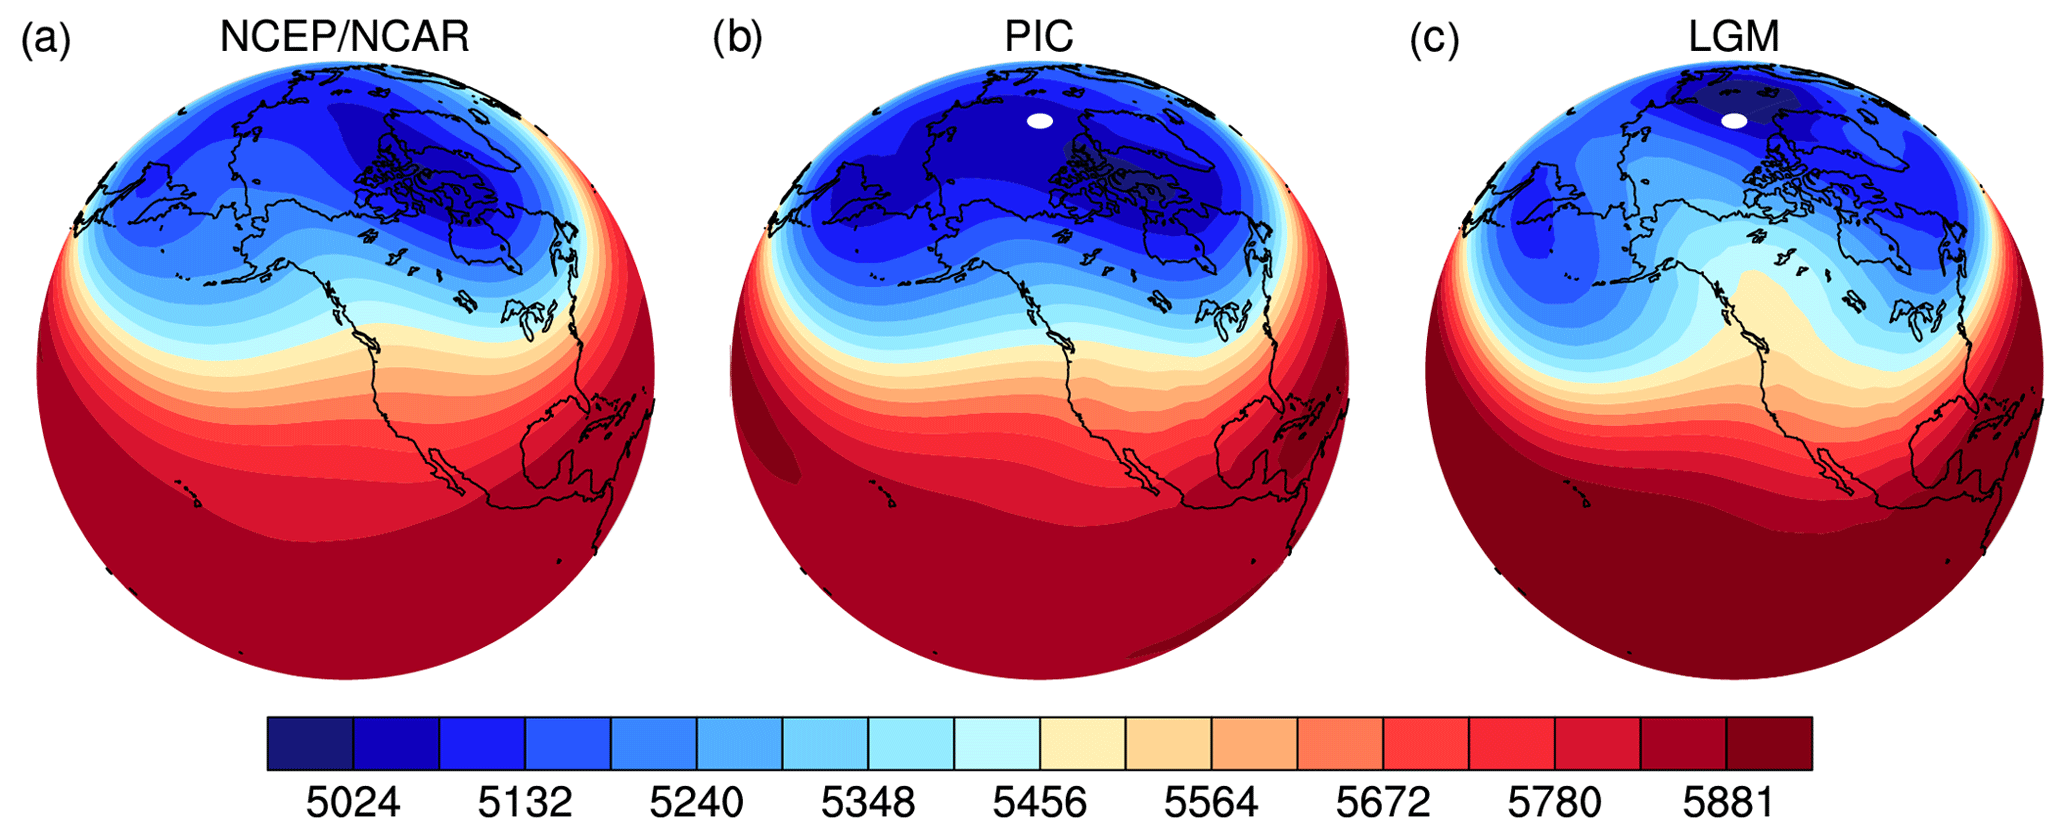
Figure 8Climatological mean 500 hPa geopotential heights in DJF in NCEP/NCAR reanalysis and PMIP2 CCSM3 simulations. (a) NCEP/NCAR, (b) PIC and (c) LGM. The height unit is meters.
Differences in zonal winds over North America can also be illustrated by the vertical cross sections along 100∘ W (Fig. 6). The single subtropical westerly jet in the PIC simulation (Fig. 6b) is split into two jets at the LGM (Fig. 6c) as follows: (1) a subtropical jet at 30∘ N and 200 hPa; (2) a subpolar jet at 63∘ N and between 400 and 300 hPa. The subtropical jet intensifies to a maximum wind speed of 40 m s−1, is located at a lower latitude, and it is much stronger than that in the PIC simulation (∼30 m s−1). The subpolar jet is much weaker, with a maximum speed of about 12 m s−1. The differences in zonal winds are associated with the difference in thermal structures between the LGM and PIC simulations. A comparison of Fig. 6f with Fig. 6e shows that latitudinal temperature gradients in the subtropics are sharper at the LGM than at present. Thus, the stronger subtropical jet is associated with the sharper temperature gradient.
The jet split and the equatorward shift in the major jet branch are caused by the orographic forcing of the large, thick Laurentide ice sheet. Figure S5 shows how the westerly jet responds to the ice sheet thickness in the sensitivity simulations. In the case with 0 % ice sheet thickness, there is only a single jet in the subtropics (Fig. S5a), almost the same as that in the PIC simulation. As ice sheet thickness is increased, the jet is strengthened, as it is associated with the sharper meridional temperature gradient (Fig. S6), and the core of the jet becomes narrower. Significant jet splitting occurs as the ice sheet thickness reaches 80 % (Fig. S5e). This is the reason why the distortion of the PNA occurs as ice sheet thickness reaches 80 %. As the ice sheet thickness is increased to 100 % and 150 %, the jet split becomes more significant, and easterly winds begin to develop over the ice sheet.
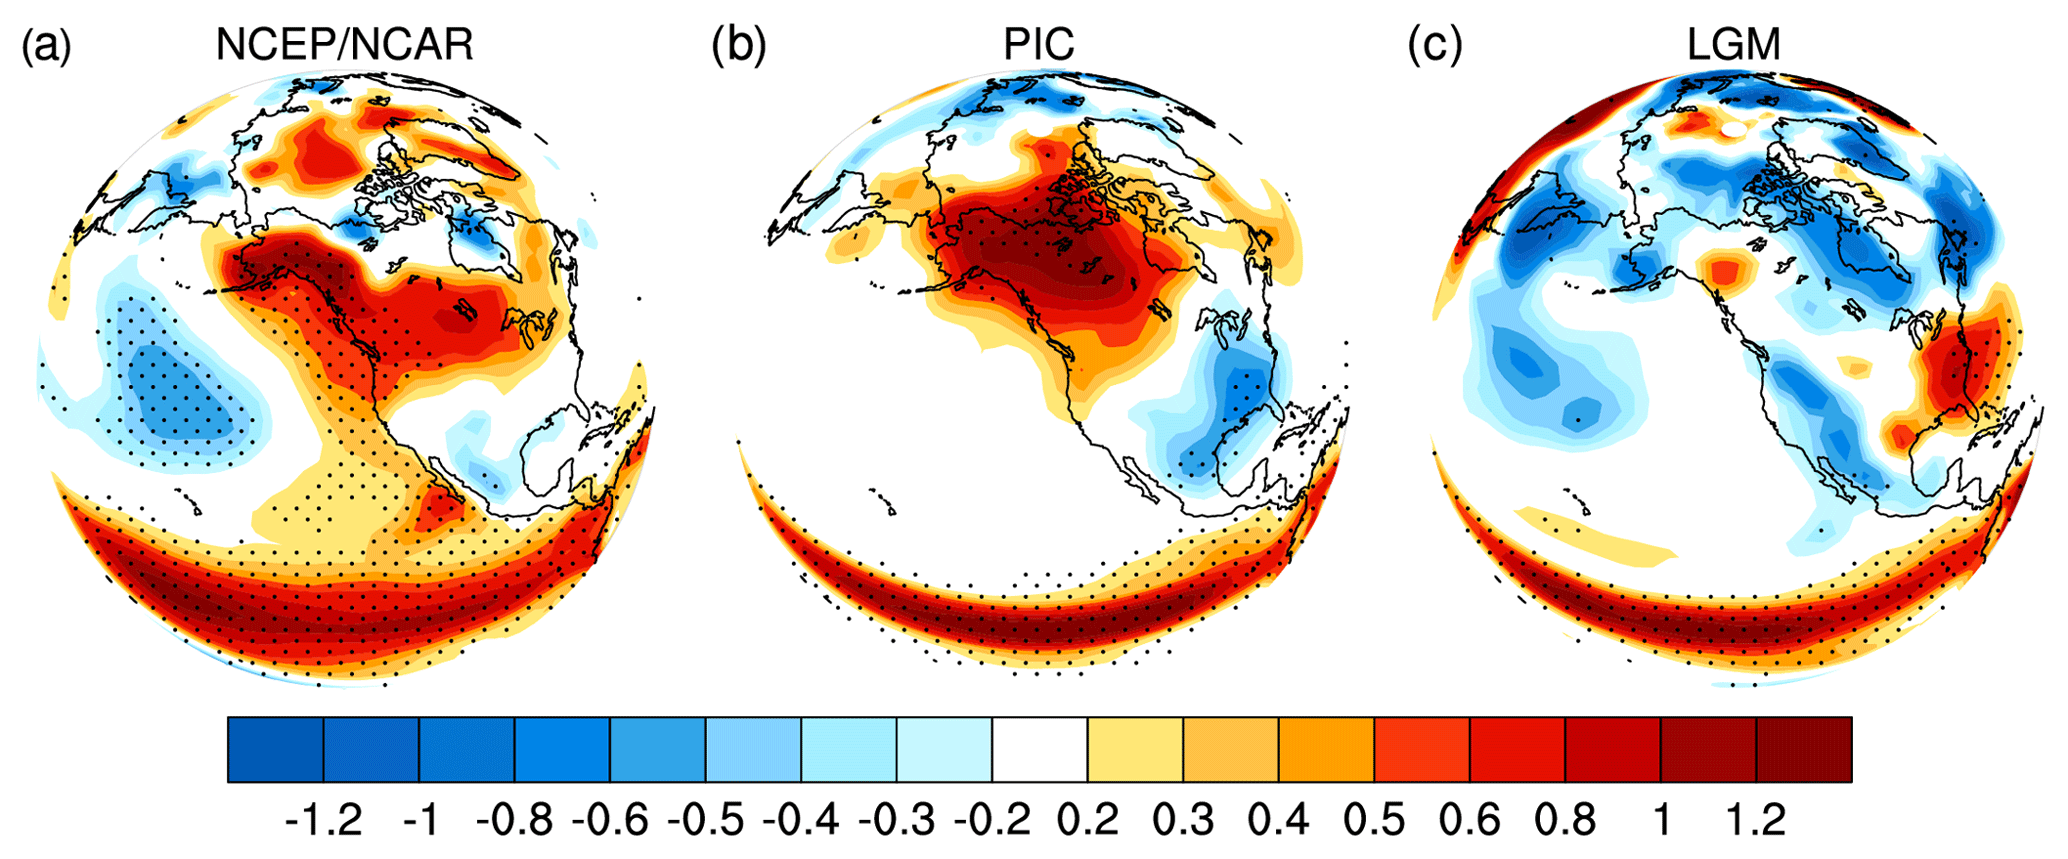
Figure 9DJF SAT regressions on the Nino3.4 index in the NCEP/NCAR reanalysis and PMIP2 CCSM3 simulations. (a) NCEP/NCAR reanalysis, (b) PIC and (c) LGM. The regression value of 0.21 corresponds to the 95 % confidence level for 30-year regressions.
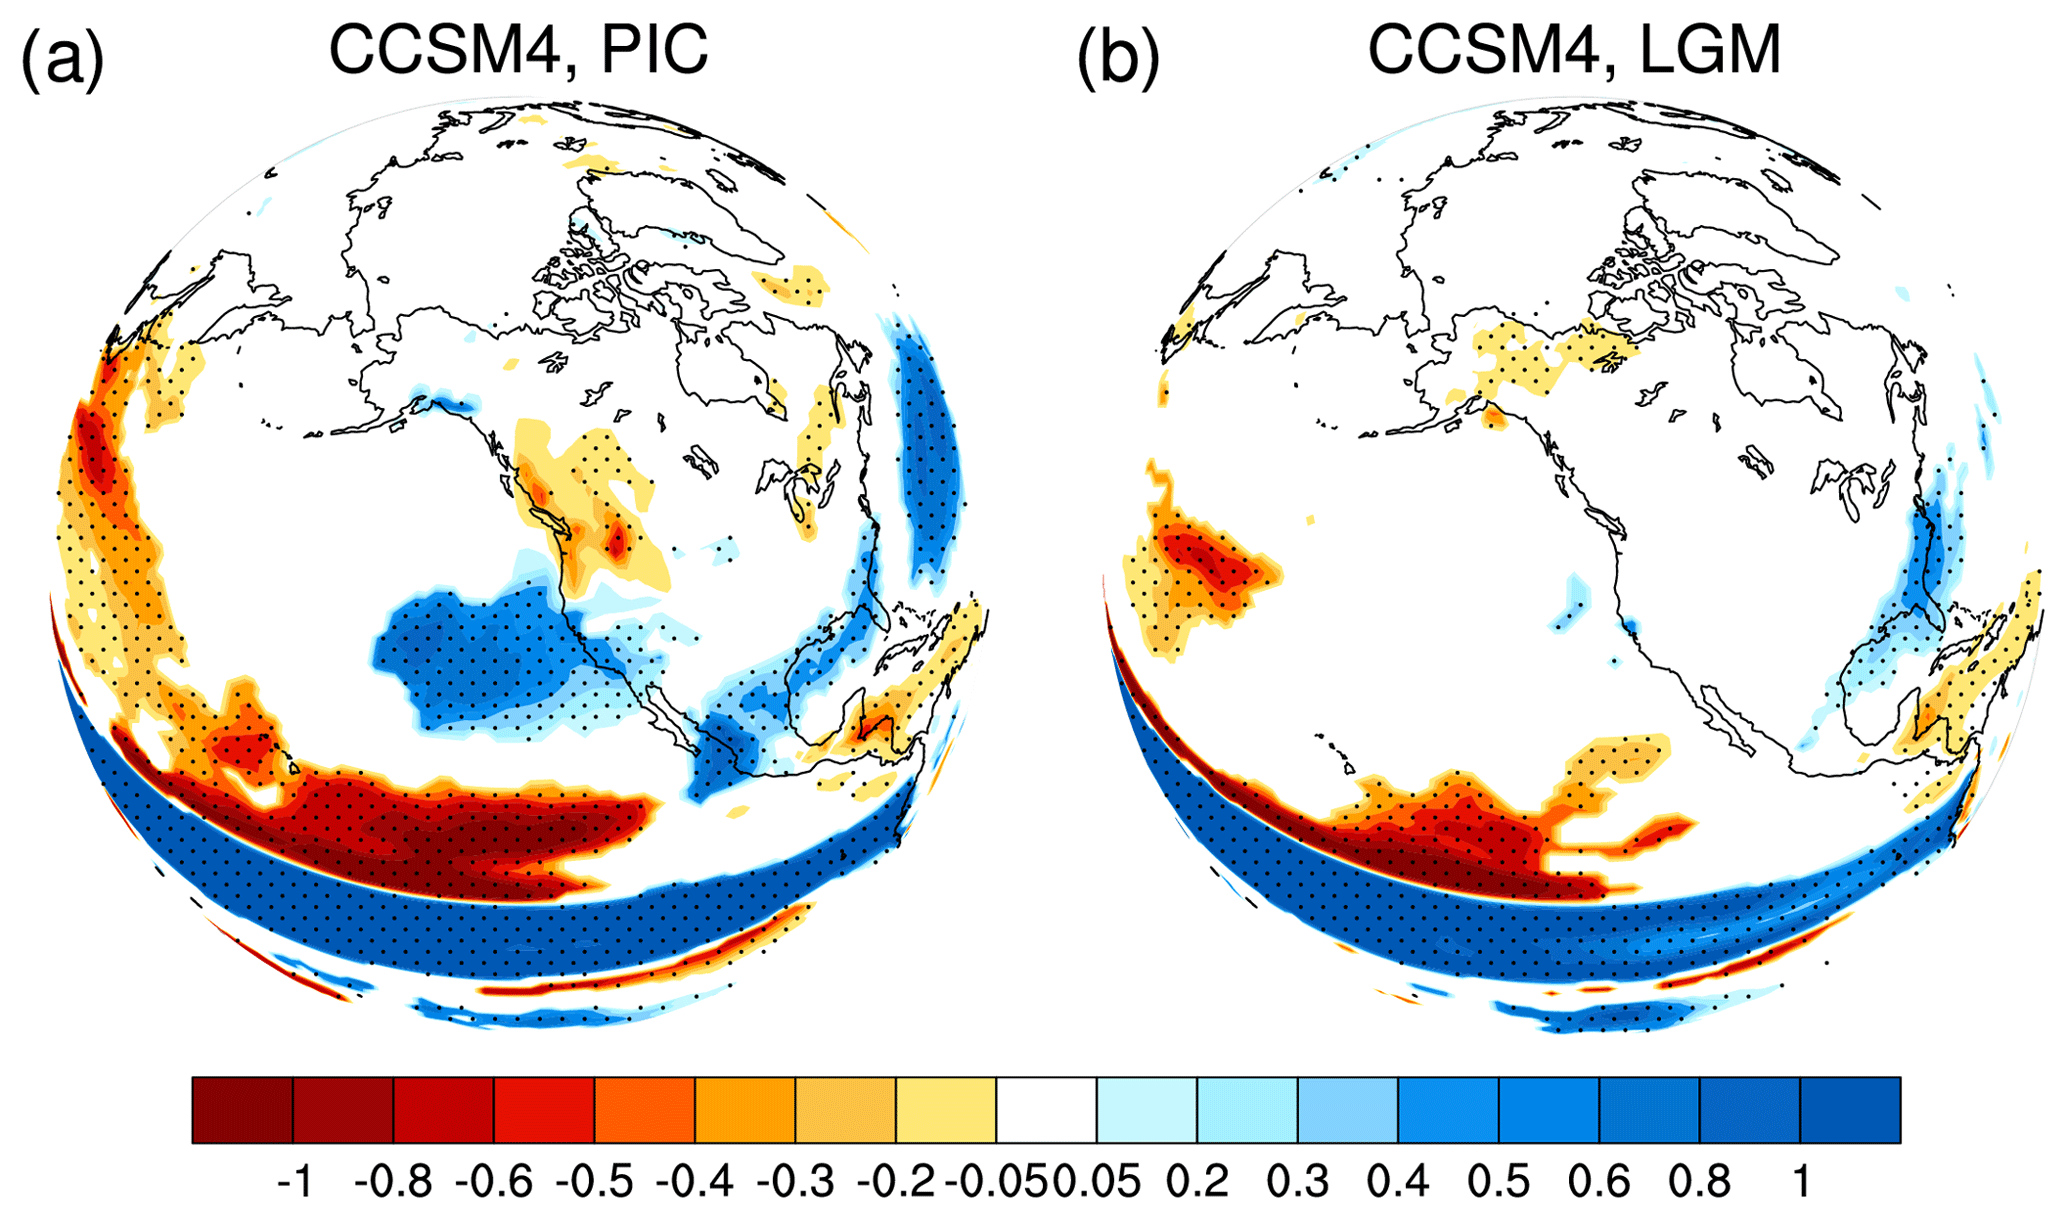
Figure 10Precipitation regressions on the Nino3.4 index in the CCSM4 PMIP3 simulations. (a) PIC and (b) LGM. Dotted areas indicate significant regressions for the 95 % confidence level for 30-year regressions.
Note that the orographic forcing is further reinforced by the thermal forcing of the large ice sheet (Liakka, 2012). The high albedo of the ice sheet causes cold air to rise aloft, resulting in sharper latitudinal temperature gradients in the subtropics at the LGM. Thus, this enhanced temperature gradient causes a stronger subtropical jet through the thermal wind relation. Our sensitivity simulations also show that subtropical temperature gradients become sharper with increasing ice sheet thicknesses.
The two branches of the westerly jet split, acting as waveguides, orient wave propagation as shown in Fig. 4. The major path of wave propagation is associated with the major jet branch. Both Fig. S2c and i show that a southern wave train is established along the southern jet branch from the North Pacific sweeping across to the southern US. This wave train would lead to more storms and precipitation in the southwestern US, consistent with proxy records and previous modeling studies (Cohmap, 1988). The minor path of wave propagation toward the Arctic occurs along the northern branch (Fig. 1c) but has a much reduced strength. In summary, a southern waveguide is established along the subtropical jet, while the northern waveguide is either distorted toward the Arctic or completely broken.
Our sensitivity simulations demonstrate dramatic changes in the PNA wave train between simulations with 80 % and 100 % ice sheet thickness (Fig. 2e vs. Fig. 2f). These dramatic changes are associated with the occurrence of easterly winds over the Laurentide ice sheet (Fig. 7a–c). For the case of 80 % ice sheet thickness, westerly winds remain between the two jet streams (Fig. 7b). In contrast, easterly winds appear over the ice sheet as the ice sheet thickness is increased to 100 % (Fig. 7c). The zero wind line between easterly and westerly winds acts as the critical layer in the reflection of stationary waves (Held, 1983). This can be addressed with calculations of critical stationary wave numbers (Fig. 7d–f) (Eq. 6.29 in Held, 1983). The orange and red shading indicates areas where stationary waves can propagate, while the light-blue shading indicates areas with imaginary wave numbers in which the propagation of stationary waves is prohibited. These light-blue areas are associated with the easterly winds. When the ice sheet thickness is 60 % (Fig. 7d), the North Pacific and North America are dominated by positive wave numbers, and the PNA remains. For 80 % ice sheet thickness, imaginary wave numbers occur in the northeast Pacific and North America (Fig. 7e), and it forces the distorted PNA wave train toward the Arctic. For 100 % ice sheet thickness, the subpolar region is dominated by imaginary wave numbers (Fig. 7f). It causes stationary waves to be reflected southeastward, leading to the establishment of the southern wave train and breaking up of the northern wave train.
The occurrence of easterly winds can be further illustrated with the geopotential heights at 500 hPa (Fig. 8). In both the NCEP/NCAR reanalysis and PIC simulation, there is only a weak ridge along the west coast of North America (Fig. 8a and b). In contrast, this ridge is largely enhanced at the LGM and shows tilting toward the northwest (Fig. 8c). It is this strong ridge that leads to altered zonal flows. The major branch moves equatorward, and the minor branch flows around the ridge northward, resulting in the formation of easterly winds over the ice sheet and the North Pacific. It can also be seen in the sensitivity simulations that the west-coast ridge increases with increasing ice sheet thickness (Fig. S7).
The distorted or broken PNA teleconnection at the LGM suggests a disconnection between climate variability in the tropical Pacific and the North American continent, such that ENSO would have little direct influence on North American climates. Figure 9 shows regression maps of surface air temperatures (SATs) on the Nino3.4 index in DJF. At present, the remote impact of ENSO on North American SATs through the PNA teleconnection can be identified clearly (Fig. 9a and b); it is characterized by an anomalously warm climate over northwestern North America and an anomalously cold climate over the southeastern United States. However, there are no significant regressions of SATs over North America at the LGM (Fig. 9c), except for the positive values near the east coast.
At present, ENSO also has an important influence on North American precipitation. Similar features can also be seen from regression maps of precipitation (Fig. 10). Figure 10a shows a precipitation regression on the Nino3.4 index in the PIC simulation. The wave-train pattern of precipitation is clearly shown in the plot. However, this wave train of precipitation is absent in the LGM simulations (Fig. 10b).
We have shown using climate simulations that the large, thick Laurentide ice sheet forced jet splitting and the formation of easterly winds over North America at the LGM. It, consequently, caused altered waveguides and a distorted or broken PNA. It appears that the PNA was separated into two teleconnections at the LGM. One is from the North Pacific to the Arctic, and the other one is from the North Pacific to the southern part of North America.
This result suggests that ENSO would have little direct influence on North American climates at the LGM. Our study provides a dynamic framework for understanding the PNA teleconnection not only at the LGM but also in other glacial periods. This understanding may help us to interpret proxy records of the past. For example, a previous study on varve records in New England linked the change in intensity of the interannual variability in the northeastern US during the early glacial period to the change in ENSO intensity (Rittenour et al., 2000). Our study suggests that this interannual variability is unlikely to be caused by climate variability in the tropical Pacific because of the distorted or broken PNA teleconnection; instead, it mainly reflects changes in local climate variability (Liu et al., 2014). Much further work is needed to develop proxy records with high temporal resolutions that can be used to identify the PNA change in paleoclimate records.
Previous work has shown weaker ENSO variability at the LGM (Merkel et al., 2010; Zhu et al., 2017) and that the weaker ENSO leads to altered teleconnection patterns. How the weaker tropical variability would impact climates over extratropics and high latitudes, through the altered atmospheric teleconnections, deserves future study.
The PMIP2 database is available on the website: https://pmip2.lsce.ipsl.fr/ (Braconnot et al., 2007). The model outputs from the CMIP3 are available on the web page: http://www-pcmdi.llnl.gov/ipcc/info_for_analysts.php (Meehl et al., 2007). The PMIP3 and CMIP5 can be freely download online at https://esgf-node.llnl.gov/search/cmip5/ (Braconnot et al., 2012; Taylor et al., 2012). NCEP reanalysis data are provided by the NOAA OAR ESRL PSD, Boulder, Colorado, USA, from their website at http://www.cdc.noaa.gov/ (Kistler et al., 2001).
The supplement related to this article is available online at: https://doi.org/10.5194/cp-16-199-2020-supplement.
YH and ZL designed the study. YX analyzed the model outputs and generated figures. ZL designed the experiments and performed the simulations. YH wrote the paper with contributions from all coauthors. Correspondence should be addressed to YH.
The authors declare that they have no conflict of interest.
We thank the international modeling groups from the PMIP2 and PMIP3 projects who make the simulation data available. We also thank modeling groups from CMIP3 and CMIP5 whose pre-industry simulation data are used here. Yongyun Hu and Yan Xia are supported by the National Natural Science Foundation of China (NSFC) under grants 41888101 and 41761144072, and Zhengyu Liu is supported by the NSFC under grant 41630527. We thank the editor and two anonymous reviewers for their insightful comments on the paper.
This research has been supported by the National Natural Science Foundation of China (grant nos. 70 41888101, 41761144072 and 41630527) and the Second Tibetan Plateau Scientific Expedition and Research Program (STEP), Grand No. 2019QZKK0604.
This paper was edited by Qiuzhen Yin and reviewed by two anonymous referees.
Abe-Ouchi, A., Saito, F., Kageyama, M., Braconnot, P., Harrison, S. P., Lambeck, K., Otto-Bliesner, B. L., Peltier, W. R., Tarasov, L., Peterschmitt, J.-Y., and Takahashi, K.: Ice-sheet configuration in the CMIP5/PMIP3 Last Glacial Maximum experiments, Geosci. Model Dev., 8, 3621–3637, https://doi.org/10.5194/gmd-8-3621-2015, 2015.
Allan, A. M., Hostetler, S. W., and Alder, J. R.: Analysis of the present and future winter Pacific-North American teleconnection in the ECHAM5 global and RegCM3 regional climate models, Clim. Dynam., 42, 1671–1682, 2014.
Braconnot, P., Otto-Bliesner, B., Harrison, S., Joussaume, S., Peterchmitt, J.-Y., Abe-Ouchi, A., Crucifix, M., Driesschaert, E., Fichefet, Th., Hewitt, C. D., Kageyama, M., Kitoh, A., Laîné, A., Loutre, M.-F., Marti, O., Merkel, U., Ramstein, G., Valdes, P., Weber, S. L., Yu, Y., and Zhao, Y.: Results of PMIP2 coupled simulations of the Mid-Holocene and Last Glacial Maximum – Part 1: experiments and large-scale features, Clim. Past, 3, 261–277, https://doi.org/10.5194/cp-3-261-2007, 2007 (data available at: https://pmip2.lsce.ipsl.fr/, last access: 21 January 2020).
Braconnot, P., Harrison, S. P., Kageyama, M., Bartlein, P. J., Masson-Delmotte, V., Abe-Ouchi, A., Otto-Bliesner, B., and Zhao, Y.: Evaluation of climate models using palaeoclimatic data, Nat. Clim. Change, 2, 417, https://doi.org/10.1038/nclimate1456, 2012 (data available at: https://esgf-node.llnl.gov/search/cmip5/, last access: 21 January 2020).
Chen, Z., Gan, B., Wu, L., and Jia, F.: Pacific-North American teleconnection and North Pacific Oscillation: historical simulation and future projection in CMIP5 models, Clim. Dynam., 50, 4379–4403, https://doi.org/10.1007/s00382-017-3881-9, 2017. 2017.
Clark, P. U. and Mix, A. C.: Ice sheets and sea level of the Last Glacial Maximum, Quaternary Sci. Rev., 21, 1–7, 2002.
Clark, P. U., Dyke, A. S., Shakun, J. D., Carlson, A. E., Clark, J., Wohlfarth, B., Mitrovica, J. X., Hostetler, S. W., and McCabe, A. M.: The Last Glacial Maximum, Science, 325, 710–714, 2009.
Cohmap, M.: Climatic Changes of the Last 18,000 Years: Observations and Model Simulations, Science, 241, 1043–1052, 1988.
Collins, W. D., Bitz, C. M., Blackmon, M. L., Bonan, G. B., Bretherton, C. S., Carton, J. A., Chang, P., Doney, S. C., Hack, J. J., Henderson, T. B., Kiehl, J. T., Large, W. G., McKenna, D. S., Santer, B. D., and Smith, R. D.: The Community Climate System Model Version 3 (CCSM3), J. Climate, 19, 2122–2143, 2006.
Held, I. M.: Stationary and Quasi-stationary Eddies in the Extratropical Troposphere: Theory, in: Large-scale Dynamical Processes in the Atmosphere, edited by: Hoskins, B. J. and Pearce, R. P., Academic Press, 1983.
Held, I. M., Ting, M., and Wang, H.: Northern Winter Stationary Waves: Theory and Modeling, J. Climate, 15, 2125–2144, 2002.
Henderson, K. G. and Robinson, P. J.: Relationships between the pacific/north american teleconnection patterns and precipitation events in the south-eastern USA, Int. J. Climatol., 14, 307–323, 1994.
Horel, J. D. and Wallace, J. M.: Planetary-Scale Atmospheric Phenomena Associated with the Southern Oscillation, Mon. Weather Rev., 109, 813–829, 1981.
Hoskins, B. J. and Karoly, D. J.: The Steady Linear Response of a Spherical Atmosphere to Thermal and Orographic Forcing, J. Atmos. Sci., 38, 1179–1196, 1981.
Jin, F. and Hoskins, B. J.: The Direct Response to Tropical Heating in a Baroclinic Atmosphere, J. Atmos. Sci., 52, 307–319, 1995.
Jones, T. R., Roberts, W. H. G., Steig, E. J., Cuffey, K. M., Markle, B. R., and White, J. W. C.: Southern Hemisphere climate variability forced by Northern Hemisphere ice-sheet topography, Nature, 554, 351, https://doi.org/10.1038/nature24669, 2018.
Justino, F. and Peltier, W. R.: The glacial North Atlantic Oscillation, Geophys. Res. Lett., 32, L21803, https://doi.org/10.1029/2005GL023822, 2005.
Justino, F., Timmermann, A., Merkel, U., and Souza, E. P.: Synoptic Reorganization of Atmospheric Flow during the Last Glacial Maximum, J. Climate, 18, 2826–2846, 2005.
Kistler, R., Kalnay, E., Collins, W., Saha, S., White, G., Woollen, J., Chelliah, M., Ebisuzaki, W., Kanamitsu, M., Kousky, V., van den Dool, H., Jenne, R., and Fiorino, M.: The NCEP-NCAR 50-year reanalysis: Monthly means CD-ROM and documentation, B. Am. Meteorol. Soc., 82, 247–267, 2001 (data avialable at: http://www.cdc.noaa.gov/, last access: 21 Januart 2020).
Kutzbach, J. E. and Wright, H. E.: Simulation of the climate of 18,000 years BP: Results for the North American/North Atlantic/European sector and comparison with the geologic record of North America, Quaternary Sci. Rev., 4, 147–187, 1985.
Laîné, A., Kageyama, M., Salas-Mélia, D., Voldoire, A., Rivière, G., Ramstein, G., Planton, S., Tyteca, S., and Peterschmitt, J. Y.: Northern hemisphere storm tracks during the last glacial maximum in the PMIP2 ocean-atmosphere coupled models: energetic study, seasonal cycle, precipitation, Clim. Dynam., 32, 593–614, 2009.
Lau, N.-C.: Interactions between Global SST Anomalies and the Midlatitude Atmospheric Circulation, B. Am. Meteorol. Soc., 78, 21–34, 1997.
Leathers, D. J., Yarnal, B., and Palecki, M. A.: The Pacific/North American Teleconnection Pattern and United States Climate. Part I: Regional Temperature and Precipitation Associations, J. Climate, 4, 517–528, 1991.
Li, C. and Battisti, D. S.: Reduced Atlantic Storminess during Last Glacial Maximum: Evidence from a Coupled Climate Model, J. Climate, 21, 3561–3579, 2008.
Liakka, J.: Interactions between topographically and thermally forced stationary waves: implications for ice-sheet evolution, Tellus A, 64, 11088, https://doi.org/10.3402/tellusa.v64i0.11088,, 2012.
Liu, Z., Lu, Z., Wen, X., Otto-Bliesner, B. L., Timmermann, A., and Cobb, K. M.: Evolution and forcing mechanisms of El Niño over the past 21,000 years, Nature, 515, 550, https://doi.org/10.1038/nature13963,, 2014.
Löfverström, M., Caballero, R., Nilsson, J., and Messori, G.: Stationary Wave Reflection as a Mechanism for Zonalizing the Atlantic Winter Jet at the LGM, J. Atmos. Sci., 73, 3329–3342, 2016.
Lü, J.-M., Kim, S.-J., Abe-Ouchi, A., Yu, Y., and Ohgaito, R.: Arctic Oscillation during the Mid-Holocene and Last Glacial Maximum from PMIP2 Coupled Model Simulations, J. Climate, 23, 3792–3813, 2010.
Magnusdottir, G. and Haynes, P. H.: Reflection of Planetary Waves in Three-Dimensional Tropospheric Flows, J. Atmos. Sci., 56, 652–670, 1999.
Marshall, S. J., James, T. S., and Clarke, G. K.: North American ice sheet reconstructions at the Last Glacial Maximum, Quaternary Sci. Rev., 21, 175–192, 2002.
Meehl, G. A., C. Covey, T. Delworth, M. Latif, B. McAvaney, J. F. B. Mitchell, R. J. Stouffer, and Taylor, K. E.: The WCRP CMIP3 multi-model dataset: A new era in climate change research, B. Am. Meteorol. Soc., 88, 1383–1394, 2007 (data available at: http://www-pcmdi.llnl.gov/ipcc/info_for_analysts.php, last access: 21 January 2020)
Merkel, U., Prange, M., and Schulz, M.: ENSO variability and teleconnections during glacial climates, Quaternary Sci. Rev., 29, 86–100, 2010.
Otto-Bliesner, B. L., Brady, E. C., Clauzet, G., Tomas, R., Levis, S., and Kothavala, Z.: Last Glacial Maximum and Holocene Climate in CCSM3, J. Climate, 19, 2526–2544, 2006.
Peltier, W. R.: Global glacial isostasy and the surface of the ice-age Earth: The ICE-5G (VM2) model and GRACE, Annu. Rev. Earth Planet. Sc., 32, 111–149, 2004.
Plumb, R. A.: On the Three-Dimensional Propagation of Stationary Waves, J. Atmos. Sci., 42, 217–229, 1985.
Rind, D.: Components of the ice age circulation, J. Geophys. Res.-Atmos., 92, 4241–4281, 1987.
Rittenour, T. M., Brigham-Grette, J., and Mann, M. E.: El Niño-Like Climate Teleconnections in New England During the Late Pleistocene, Science, 288, 1039–1042, 2000.
Rivière, G., Laîné, A., Lapeyre, G., Salas-Mélia, D., and Kageyama, M.: Links between Rossby Wave Breaking and the North Atlantic Oscillation–Arctic Oscillation in Present-Day and Last Glacial Maximum Climate Simulations, J. Climate, 23, 2987–3008, 2010.
Sherriff-Tadano, S. and Itoh, H.: Teleconnection Patterns Appearing in the Streamfunction Field, SOLA, 9, 115–119, 2013.
Straus, D. M. and Shukla, J.: Does ENSO Force the PNA?, J. Climate, 15, 2340–2358, 2002.
Taylor, K. E., Stouffer, R. J., and Meehl, G. A.: An Overview of CMIP5 and the Experiment Design, B. Am. Meteorol. Soc., 93, 485–498, https://doi.org/10.1175/BAMS-D-11-00094.1, 2012.
Wallace, J. M. and Gutzler, D. S.: Teleconnections in the Geopotential Height Field during the Northern Hemisphere Winter, Mon. Weather Rev., 109, 784–812, 1981.
Yanase, W. and Abe-Ouchi, A.: The LGM surface climate and atmospheric circulation over East Asia and the North Pacific in the PMIP2 coupled model simulations, Clim. Past, 3, 439–451, https://doi.org/10.5194/cp-3-439-2007, 2007.
Yanase, W. and Abe-Ouchi, A.: A Numerical Study on the Atmospheric Circulation over the Midlatitude North Pacific during the Last Glacial Maximum, J. Climate, 23, 135–151, 2010.
Yeager, S. G., Shields, C. A., Large, W. G., and Hack, J. J.: The Low-Resolution CCSM3, J. Climate, 19, 2545–2566, 2006.
Zhu, J., Liu, Z., Brady, E., Otto-Bliesner, B., Zhang, J., Noone, D., Tomas, R., Nusbaumer, J., Wong, T., Jahn, A., and Tabor, C.: Reduced ENSO variability at the LGM revealed by an isotope-enabled Earth system model, Geophys. Res. Lett., 44, 6984–6992, 2017.