the Creative Commons Attribution 4.0 License.
the Creative Commons Attribution 4.0 License.
 | 19 Oct 2020
Sampling density and date along with species selection influence spatial representation of tree-ring reconstructions
Grant L. Harley
Trevis J. Matheus
Brandon M. Strange
Kayla Van Aken
Tsun Fung Au
Joshua C. Bregy
Our understanding of the natural variability of hydroclimate before the instrumental period (ca. 1900 CE in the United States) is largely dependent on tree-ring-based reconstructions. Large-scale soil moisture reconstructions from a network of tree-ring chronologies have greatly improved our understanding of the spatial and temporal variability in hydroclimate conditions, particularly extremes of both drought and pluvial (wet) events. However, certain regions within these large-scale network reconstructions in the US are modeled by few tree-ring chronologies. Further, many of the chronologies currently publicly available on the International Tree-Ring Data Bank (ITRDB) were collected in the 1980s and 1990s, and thus our understanding of the sensitivity of radial growth to soil moisture in the US is based on a period that experienced multiple extremely severe droughts and neglects the impacts of recent, rapid global change. In this study, we expanded the tree-ring network of the Ohio River valley in the US, a region with sparse coverage. We used a total of 72 chronologies across 15 species to examine how increasing the density of the tree-ring network influences the representation of reconstructing the Palmer Meteorological Drought Index (PMDI). Further, we tested how the sampling date and therefore the calibration period influenced the reconstruction models by creating reconstructions that ended in the year 1980 and compared them to reconstructions ending in 2010 from the same chronologies. We found that increasing the density of the tree-ring network resulted in reconstructed values that better matched the spatial variability of instrumentally recorded droughts and, to a lesser extent, pluvials. By extending the calibration period to 2010 compared to 1980, the sensitivity of tree rings to PMDI decreased in the southern portion of our region where severe drought conditions have been absent over recent decades. We emphasize the need of building a high-density tree-ring network to better represent the spatial variability of past droughts and pluvials. Further, chronologies on the ITRDB need updating regularly to better understand how the sensitivity of tree rings to climate may vary through time.
- Article
(5760 KB) - Full-text XML
-
Supplement
(554 KB) - BibTeX
- EndNote


Understanding the mechanisms that drive climate variability, particularly before the modern instrumental record (ca. 1900 CE in the United States), depends on proxy-based reconstructions of climate. Precisely dated tree-ring chronologies are one of the primary proxies that can reconstruct interannual climate variability over recent centuries to millennia (Fritts, 1976). Tree rings provide robust historical and prehistorical context for droughts and pluvials (wet periods) captured in the instrumental record throughout the midlatitudes (e.g., Stahle and Cleaveland, 1994; Woodhouse and Overpeck, 1998; Cook et al., 2010; Fang et al., 2010; Chen et al., 2013; Pederson et al., 2013; Güner et al., 2017; Oliver et al., 2019; Morales et al., 2020). Most of our understanding of past drought severity and variability in North America is the result of the North American Drought Atlas (NADA; Cook et al., 1999). The NADA comprises a network of tree-ring chronologies across North America from the International Tree-Ring Data Bank (ITRDB; https://www.ncdc.noaa.gov/data-access/paleoclimatology-data/datasets/tree-ring) (last access: 6 September 2020) creating a reconstruction of summer (average of June, July, and August; JJA) Palmer Drought Severity Index values (Palmer, 1965). The NADA produced multiple centuries of spatial drought variability, providing essential context for extreme soil moisture conditions witnessed in the most recent centuries. More recently, the Living Blended Drought Atlas (LBDA; Cook et al., 2010) updated the NADA using additional tree-ring chronologies from the ITRDB and higher spatial resolution climate data to calibrate models, creating a reconstruction of the Palmer Meteorological Drought Index (PMDI; Palmer, 1965).
While the NADA and LBDA have provided invaluable information of past droughts and pluvials in North America, they were generated to compare large, sub-continental events. The reconstruction at each grid cell uses tree-ring data that are within a 450 km radius of that grid point. By pulling from such a wide range of predictors, the NADA and LBDA models excel at representing large-scale hydroclimate variability as they tend to average out smaller-scale features. However, these drought atlases may not represent local conditions in areas with sparse coverage of tree-ring chronologies, such as certain regions of the midwestern US (Maxwell and Harley, 2017; Strange et al., 2019). The tree-ring chronologies from the ITRDB can have biases related to tree species used and the spatial density of the tree-ring network (Zhao et al., 2019; Coulthard et al., 2020). When collecting tree-ring data for the purpose of reconstructing climate, the general goal is to target long-lived species that are sensitive to the climate variable to be reconstructed while also maximizing the length of the reconstruction. However, inclusion of multiple species in a reconstruction can improve model performance and skill (Pederson et al., 2001, 2013; Frank and Esper, 2005; Cook and Pederson, 2011; Maxwell et al., 2011, 2015). In the US, the ITRDB has excellent spatial replication in certain regions, such as the American Southwest, but other regions are poorly represented, such as the Ohio River valley (ORV; Zhao et al., 2019). Due to changes in the density of the tree-ring network of the ITRDB and the use of a large radius (450 km) to reconstruct drought for the LBDA, soil moisture variability at local scales is potentially absent in areas that are underrepresented in the tree-ring network. Further, many of the chronologies that are available on the ITRDB were collected in the 1980s and have not been updated, limiting the range of climatic conditions to calibrate reconstruction models (Larson et al., 2013; Zhao et al., 2019).
The wealth of climate information derived from tree rings is based on the key assertion that their physiological development is related to specific climatic conditions. An explicit relationship between climate and tree growth can be estimated during the instrumental period. Yet, developing a reconstruction assumes that this climate–tree growth relationship is stationary over time. This assumption was generally true in the early development of the field of dendrochronology (Fritts, 1976). However, as human activities drive the Earth's climate system into historically unprecedented and potentially non-stationary and non-analogous conditions (Milly et al., 2008), exceptions to this assumption have emerged. Changes in the drought signal recorded by tree rings have been established only recently in the eastern US (Larson et al., 2013; Maxwell et al., 2015, 2016, 2019; Helcoski et al., 2019), making an investigation of its causes essential to ensuring the interpretability of tree-ring-based hydroclimate reconstructions. Of these recent studies, Maxwell et al. (2016) provided the first documentation of an apparent deteriorating relationship between radial tree growth and summer soil moisture that is not accompanied by an increase in signal strength during another season. The declining relationship – referred to as the “Fading Drought Signal” – was consistent across multiple species and sites within the Central Hardwoods Forest region of the midwestern US. However, Maxwell et al. (2019) found that Acer (maple) species had a stable relationship, implying that including species from this genus in reconstructions could improve model performance. In this paper, we test the hypothesis that increasing the spatial density of the tree-ring network results in reconstructions that better replicate the local variation of the instrumental data despite a fading drought signal. We also examine if the period in which the tree-ring data are calibrated with climate data influences the climate reconstruction. Using the new, dense tree-ring network of the ORV, we calibrate the reconstruction with recent (post-1980) radial growth and climate data and compare it to reconstructions generated using data only from pre-1980. We test the hypothesis that including recent data could reduce the amount of variance explained in tree-ring reconstruction of soil moisture in the ORV.
2.1 Living blended drought atlas
For the LBDA, Cook et al. (2010) created a gridded instrumental dataset of PMDI to calibrate tree-ring reconstruction models. The instrumental data were created using observations for temperature and precipitation from over 5000 and 7000 weather stations, respectively, which were spatially interpolated with a trivariate thin-plate spline in the ANUSPLIN program (Hutchinson, 1995). Cook et al. (2010) derived the reconstructions by gathering standardized tree-ring chronologies within 450 km of each instrumental grid point center. However, because the LBDA was developed across North America, Cook et al. (2010) used a dynamic search radius, with the requirement of having a minimum of five chronologies as possible predictors; so in certain regions, the radius was larger than 450 km. Therefore, in sparsely covered areas such as the ORV, the actual search radius for the LBDA could be larger than 450 km. Chronologies that were significantly (p<0.05) correlated with PMDI were retained and used in a principal component analysis (PCA). The resulting principal components (PCs) that had eigenvalues greater than one were then used as predictors in the reconstruction model. For the LBDA, we gathered both the instrumental and reconstructed gridded PMDI data for the ORV region (Fig. 1) from the National Oceanic and Atmospheric Administration, National Center for Environmental Information (https://www.ncdc.noaa.gov/paleo-search/study/19119; Cook et al., 2010) (last access: 6 September 2020).
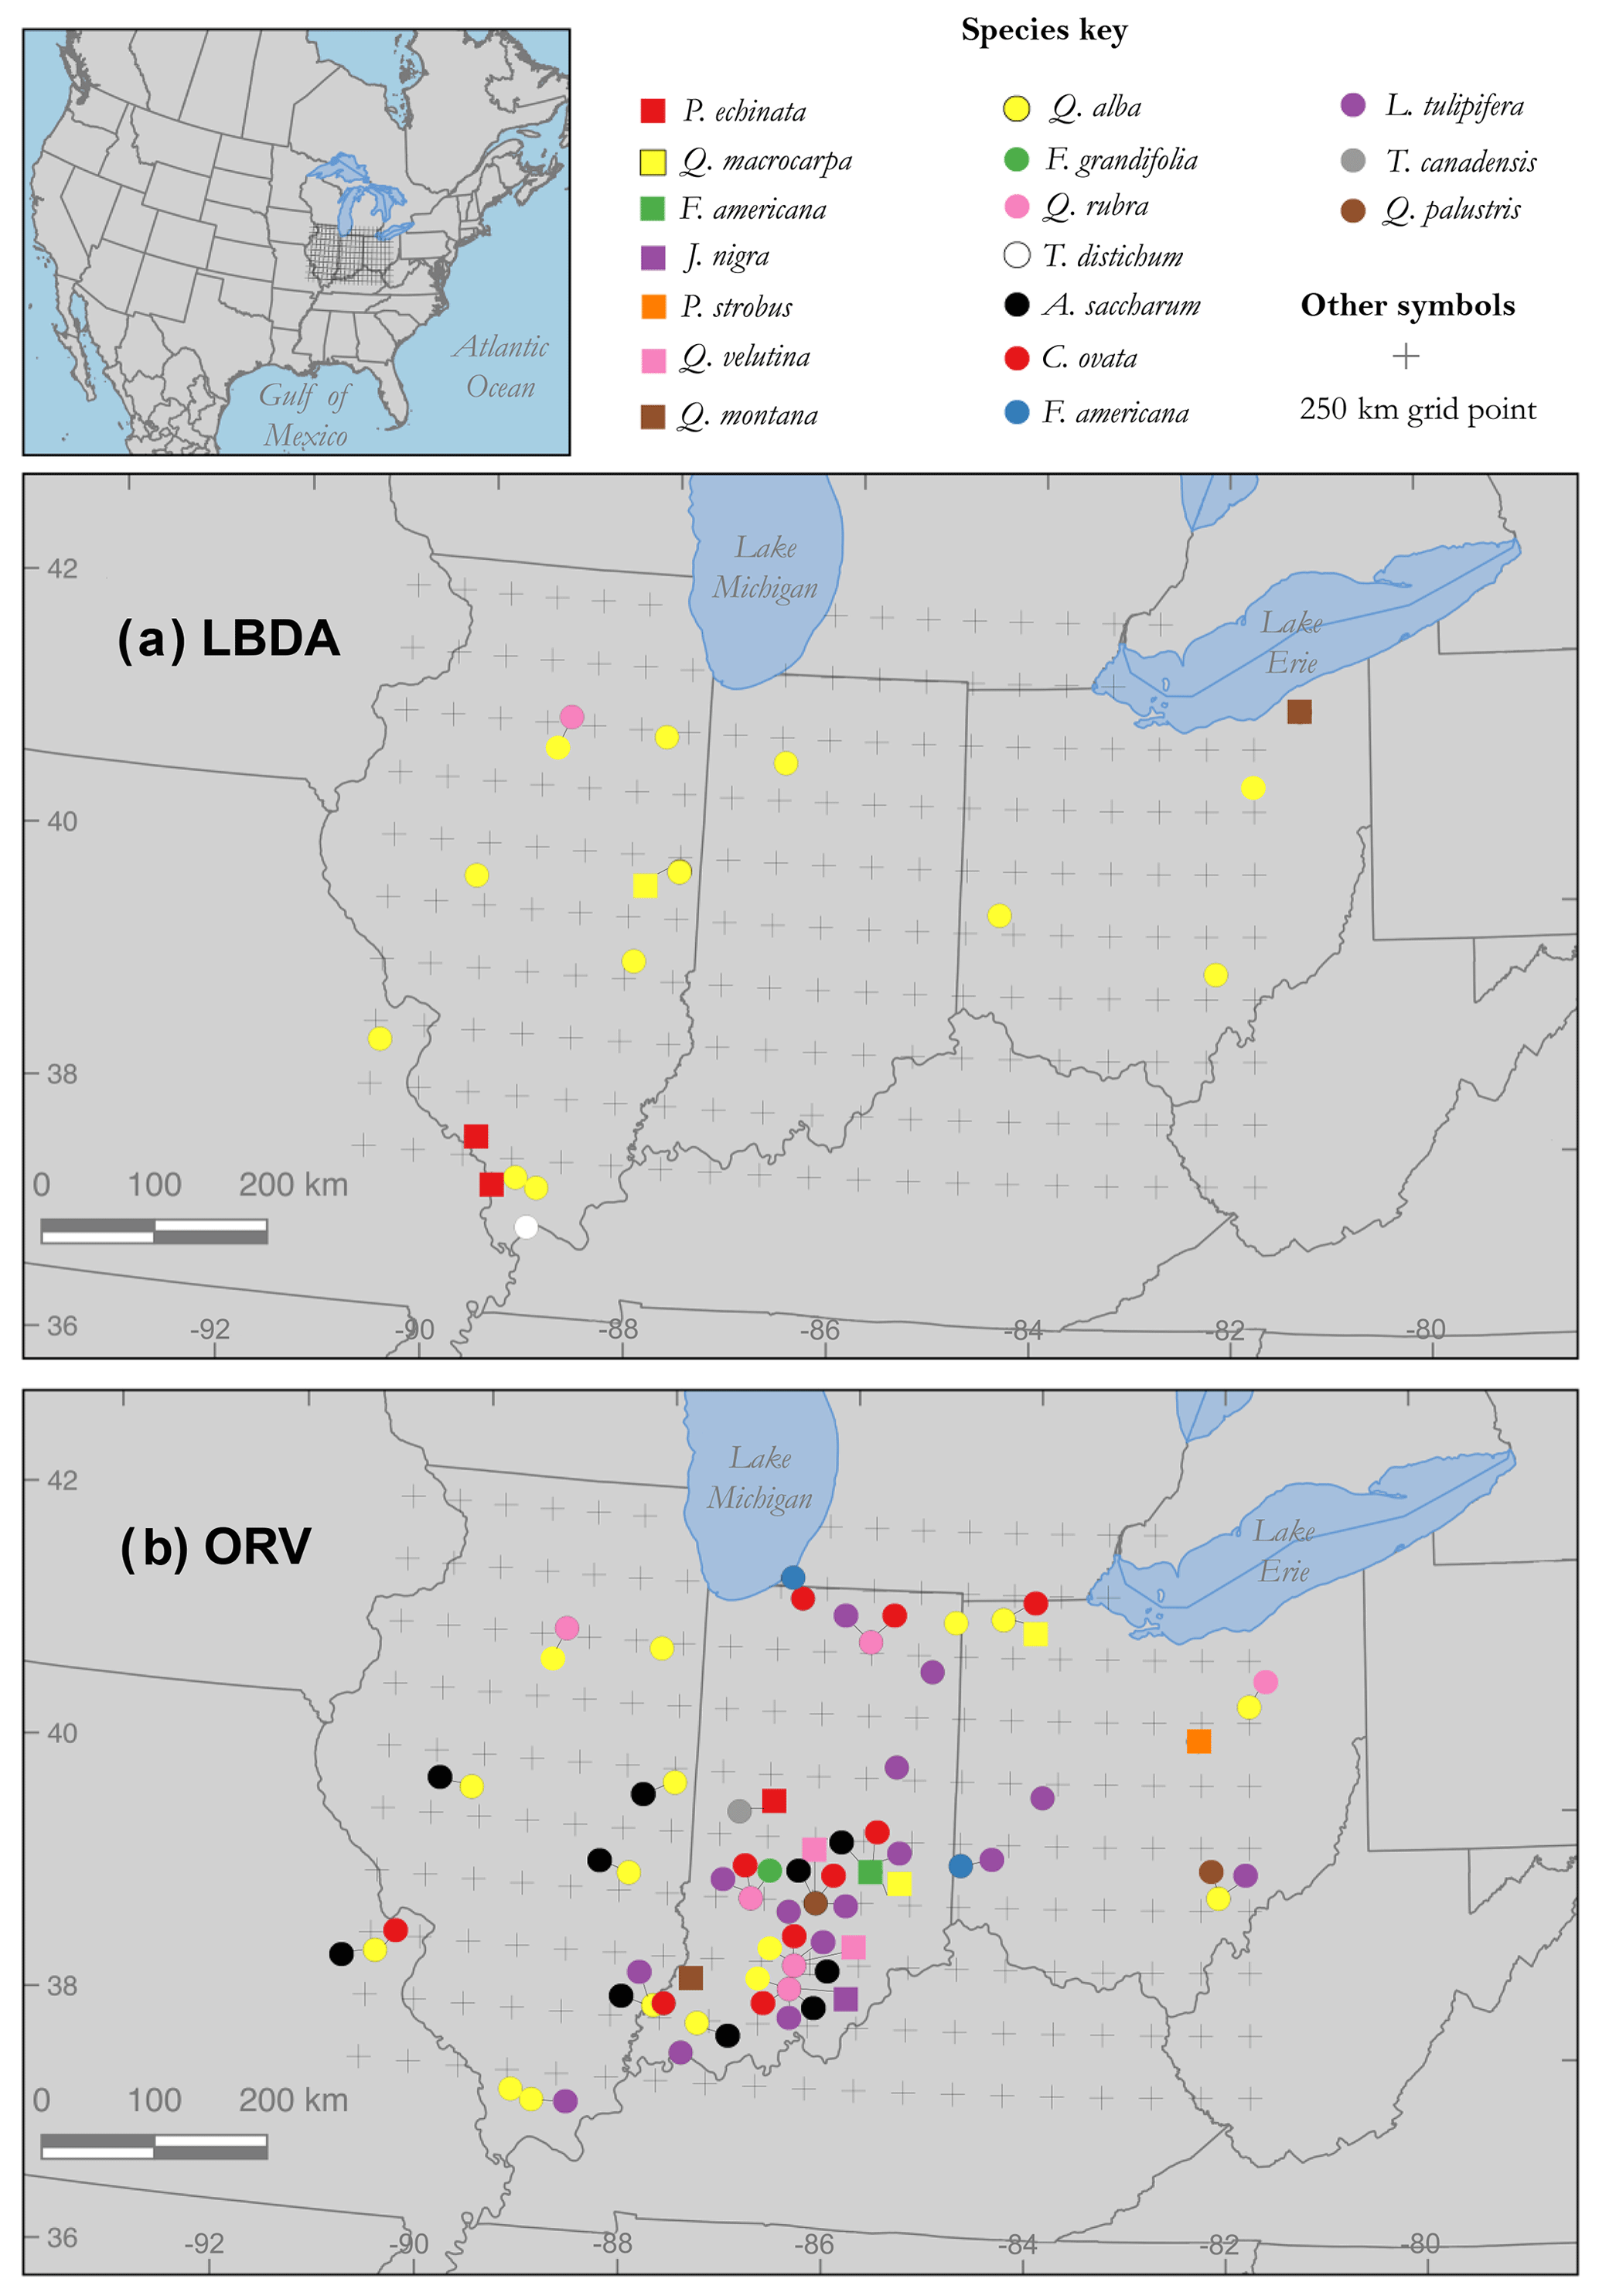
Figure 1Map of PMDI grid points (n=181) across the Ohio River valley (ORV) region, Midwest US, defined as 37.75–42.25∘ N, 90.75–82.25∘ W, plotted with tree-ring chronology sites included from the (a) ITRDB and (b) ORV networks. Sites with single-species and multiple-species data are denoted by symbol shape and color (see Table S1 in the Supplement). Note that most ITRDB sites consist of single-species data in the LBDA but multiple species are represented in the ORV.
2.2 Ohio River valley tree-ring network
To examine how the density of the tree-ring network could impact the reconstruction, we gathered recently published chronologies and collected new chronologies across the ORV to fill the spatial gaps of the ITRDB (Fig. 1; Table S1 in the Supplement). For the new chronologies, we either (1) updated existing chronologies from the ITRDB, (2) sampled new co-occurring species at an ITRDB site, or (3) created new chronologies from previously unsampled sites. For this study, we used a total of 72 chronologies across 15 species. Of these chronologies, 37 were published, 3 were newly updated ITRDB records, and 32 were new collections (Fig. 1; Table S1 in the Supplement). For the new (n=32) and updated (n=3) chronologies, we used standard field methods to target at least 10 old growth trees for each species using morphological characteristics (Pederson, 2010). We used a handheld 4.3 mm diameter increment borer to extract two samples from each tree at breast height from opposite sides of the tree (Stokes and Smiley, 1968) All newly collected samples were mounted and sanded with progressively finer sandpaper to reveal ring structure. We used the list method to visually cross-date all samples (Yamaguchi, 1991), and then the program COFECHA (Holmes, 1983) to statistically verify the cross-dating. For the three updated chronologies, we cross-dated the new sampled series with those previously sampled and available through the ITRDB.
2.3 Detrending tree-ring series
For all chronologies, we removed both age-related growth trends and non-climatic influences of tree growth (e.g., forest dynamics or insect outbreaks) by using signal-free standardization (Melvin and Briffa, 2008) with a two-thirds smoothing spline applied to each measured series (Cook and Peters, 1981). To ensure we achieved the desired spline flexibility of the two-thirds spline in the standardization, we used the approximation suggested by Bussberg et al. (2020) and used an 83 % spline to account for endpoint adjustments. We stabilized the variance of the standardized chronologies using the data-adaptive power transformation (Cook and Peters, 1997). Signal-free standardization can reduce “trend distortion” problems near the ends of the record (Melvin and Briffa, 2008). We trimmed each chronology to remove the portion of the record where low sample depth inflated the variance in standardized growth using an expressed population signal (EPS) value of 0.80 (Wigley et al., 1984).
2.4 Point-by-point regression
We replicated the point-by-point regression procedure for the LBDA in Cook et al. (2010) and described in Cook et al. (1999) for the ORV tree-ring network. We developed a network of grid points reconstructions (n=181) across the ORV region, defined as 37.75–42.25∘ N, 82.25–90.75∘ W (Fig. 1). Similar to the LBDA, we produced PMDI reconstructions at each grid point by first screening standardized tree-ring chronologies through correlation analysis with PMDI from 1895 to 2010, where only the chronologies with significant (p<0.05) correlations were retained. Both the tree-ring chronologies and the climate data were prewhitened during this screening procedure to remove the influence of short-term autocorrelation.
To examine how increasing the density of the tree-ring network influences the reconstruction, we gathered tree-ring chronologies within a 250 km radius from the center of each grid point instead of the 450 km minimum radius used for LBDA. For the ORV gridded reconstructions, the use of a 250 km radius ensured that each gridded reconstruction could have at least five chronologies as possible predictors (Fig. S1 in the Supplement). For each grid point, we built a reconstruction model by taking the screened standardized chronologies and using both the current year (t) and the following year (t+1) as possible predictors due to current year climate conditions impacting growth both during the current and the proceeding year, which doubled the number of predictors. We then took all the t and the t+1 chronologies that passed the screening and conducted a PCA. Per the Kaiser–Guttman rule (Guttman, 1954; Kaiser, 1960), we then used the PCs with eigenvalues greater than 1 as predictors in a regression model to predict mean JJA PMDI. To ensure that our ORV reconstruction was comparable to the LBDA, we added the autocorrelation of the instrumental data back into the final tree-ring reconstructions of PMDI as was done for the NADA and LBDA.
We used Pearson's correlation to compare the reconstructed PMDI values from the LBDA to the ORV reconstruction at each grid point. We further chose well-known drought and pluvial years in the instrumental period to examine how the ORV and LBDA compared spatially. Specifically, we examined the droughts of 1988, 1954, 1936, 1816, and 1774 and the pluvials of 1945–1951, 1882–1883, and 1811 (Trenberth et al., 1988; Stambaugh et al., 2011; Heim, 2017). To compare the reconstructions with the instrumental data, we calculated the mean absolute error for each extreme event. We also correlated the instrumental PMDI at each grid point to every other grid point and then examined those correlations as a function of distance. Similarly, the reconstructed PMDI values were correlated for each grid point for the ORV and LBDA and compared across distance. To examine the species contribution to the overall ORV reconstruction, we gathered the correlation of each species chronology to the PMDI for each grid reconstruction that the given species were included.
2.5 Droughts and pluvials
To determine if the ORV and LBDA reconstructions had differences in the amount of extreme hydroclimatic conditions, we calculated the number of years in each gridded reconstruction that had a JJA PMDI value of ≥2.0 or to represent at least moderately wet and dry conditions, respectively. We further examined how the volatility in extreme conditions compared between the two reconstructions by calculating “flips” from one extreme to the other in consecutive years (Loecke et al., 2017; Oliver et al., 2019; Harley et al., 2020). We specifically used an index developed by Loecke et al. (2017) to quantify large “whiplashes” (termed flips here) interannually. The flip index is defined as follows:
where the index (i) equals the PMDI value of a given year (t) subtracted from the PMDI value of the following year (t+1), divided by the sum of the PMDI values over the 2-year period (). Positive index values indicate that conditions shifted from dry to wet over the 2-year period. Similarly, negative values represent a shift from wet to dry conditions. We used an index value >75th percentile to define an abnormally wet period and <25th percentile an extremely dry period. We then calculated wet flip events as years that were abnormally dry followed directly by extreme wet years. Dry flips were calculated as abnormally wet years followed by extreme drought years. Lastly, we summed the wet and dry flips to calculate the total flips. These flips were calculated for each grid point in the ORV reconstruction where sample depth was determined by an EPS value of 0.80 to reproduce the variance in the instrumental data (Wigley et al., 1984). We limited the calculation of flips to the period 1658–2005, which was the common period of overlap between the longest gridded ORV reconstruction and the LBDA.
2.6 Model validation comparisons
To examine the temporal stability of the relationship between tree growth and PMDI, we followed the same validation procedures used for the LBDA (Cook et al., 2010). We used the early half of the common period (1901–1955) to calibrate a model between tree growth and PMDI to validate the late half (1956–2010). We used two tests of fit, the reduction of error statistic (RE) and the coefficient of efficiency (CE; Fritts, 1976; Cook et al., 1999), to validate our calibration models. RE and CE both range from −∞ to +1, with positive values indicating robust predictive skill. However, RE is compared to the mean of the instrumental data, while CE relies on the verification period mean and therefore is a more conservative verification metric. We then compared the variance explained (R2), RE, and CE values between the LBDA and the ORV PMDI reconstructions for each grid point. We also mapped the gridded reconstructed PMDI values from extreme years in the observation period and well-known years in the historical record for both the LBDA and the ORV reconstructions to provide examples of the spatial differences between the two reconstructions.
To examine how validation statistics may change based on when the trees were sampled, we created a second ORV reconstruction where the most recent year was 1980. This year was chosen because several chronologies available on the ITRDB were sampled in the 1980s, and this marked the beginning of a weakening relationship between radial growth and soil moisture in this region (Maxwell et al., 2016). We used the same validation process described above except the early period was from 1901 to 1940 and the late period was from 1941 to 1980. We then calculated the difference between the 1980 and the 2010 reconstruction for R2, RE, and CE values for each grid point.
3.1 ORV vs. LBDA
Our first comparisons of chronologies distributed for the LBDA and ORV networks revealed broad spatial discrepancies. PMDI point-by-point regressions for the LBDA included 20 chronologies from 6 species over the study region, whereas the ORV network included 72 chronologies from 15 tree species. Not only is the spatial density of sites sparser for the LBDA network, but it mostly only included single-chronology sites, whereas 18 of the sites included in the ORV are multiple-species sites (two to six co-occurring species) (Figs. 1a and b). Although site coverage is sparse for both networks along the west-central, northwest, and southeast sectors, the ORV network included major spatial coverage improvements in other sectors (Fig. 1). The ORV particularly increased spatial coverage in south-central Indiana, where many of the sites included four to six co-occurring species chronologies (n=27 total chronologies). The PMDI reconstructions from the ORV network and the LBDA demonstrated strong and positive correlations, with r values ranging from 0.50 to 0.90 (Fig. 2). These correlations were calculated for the period of overlap between the two gridded reconstructions, 1830–2005 CE. The highest correlations were found along the western portion of the gridded region, while the lowest agreement was found in the southeast (Fig. 2).

Figure 2Map of correlation values between the LBDA and ORV reconstruction during the period of 1830–2005 CE. The correlations of each grid shown in the map are all significant at the 0.05 level. The black cells represent locations over the Great Lakes, and therefore no data are available for correlation analysis.
The ORV reconstructions were shorter in length (maximum of 343 years) compared to the LBDA reconstructions (maximum of 1645 years) due to needing numerous old chronologies to load into each grid reconstruction. While this is true for the LBDA, having a larger search radius allows a longer chronology to be included in many gridded reconstructions. A smaller search radius for chronology inclusion requires a denser network of longer chronologies to reach a similar length as the LBDA. Secondly, we focused on increasing the spatial density of the network, which resulted in sampling younger sites (e.g., the earliest years are in the early to late 19th century). While the ORV reconstructions were shorter, comparing certain well-known extreme climatic years during the period of the overlap between the LBDA shows some important differences.
3.2 ORV and LBDA extreme year comparisons
We chose a series of well-known drought and pluvial years (events) to compare the reconstructions between ORV and LBDA. In general, the increased spatial density of tree-ring chronologies used in the ORV reconstruction displayed more local variation in the reconstructions of extreme climatic events (Fig. 3). However, in a few examples, such as those of 1774 and 1816, the spatial pattern of where extreme drought was located changed between the two reconstructions (Fig. 3). Using extreme events in the observed record (three droughts and one pluvial), both the ORV and LBDA underestimated wet and dry extremes. However, the ORV reconstruction better matched the distribution of soil moisture values and the spatial patterns of the instrumental data, particularly for the extreme values, compared to the LBDA reconstruction (Fig. 4; Figs. S2–4 in the Supplement). For droughts, the ORV consistently had lower mean absolute errors (differences ranging from 0.21 to 0.41) compared to the LBDA (Fig. 4; Figs. S2–S4 in the Supplement). However, for the pluvial event, the two reconstructions had similar mean absolute errors (difference of 0.03) with the LBDA being slightly smaller (Fig. S4 in the Supplement). When examining the correlation in PMDI (instrumental or reconstructed) between all grid points as a function of distance, the ORV better matched the instrumental PMDI with a steeper decline in correlation across distance compared to the LBDA (Fig. 5). The LBDA showed the most spatial autocorrelation with a gradual decrease in correlation across distance, while the instrumental had the least spatial autocorrelation with a lower correlation between close grid points and more variability (Fig. 5). The ORV better matched the overall pattern and variability of the instrumental PMDI across distance but had more spatial autocorrelation (Fig. 5).
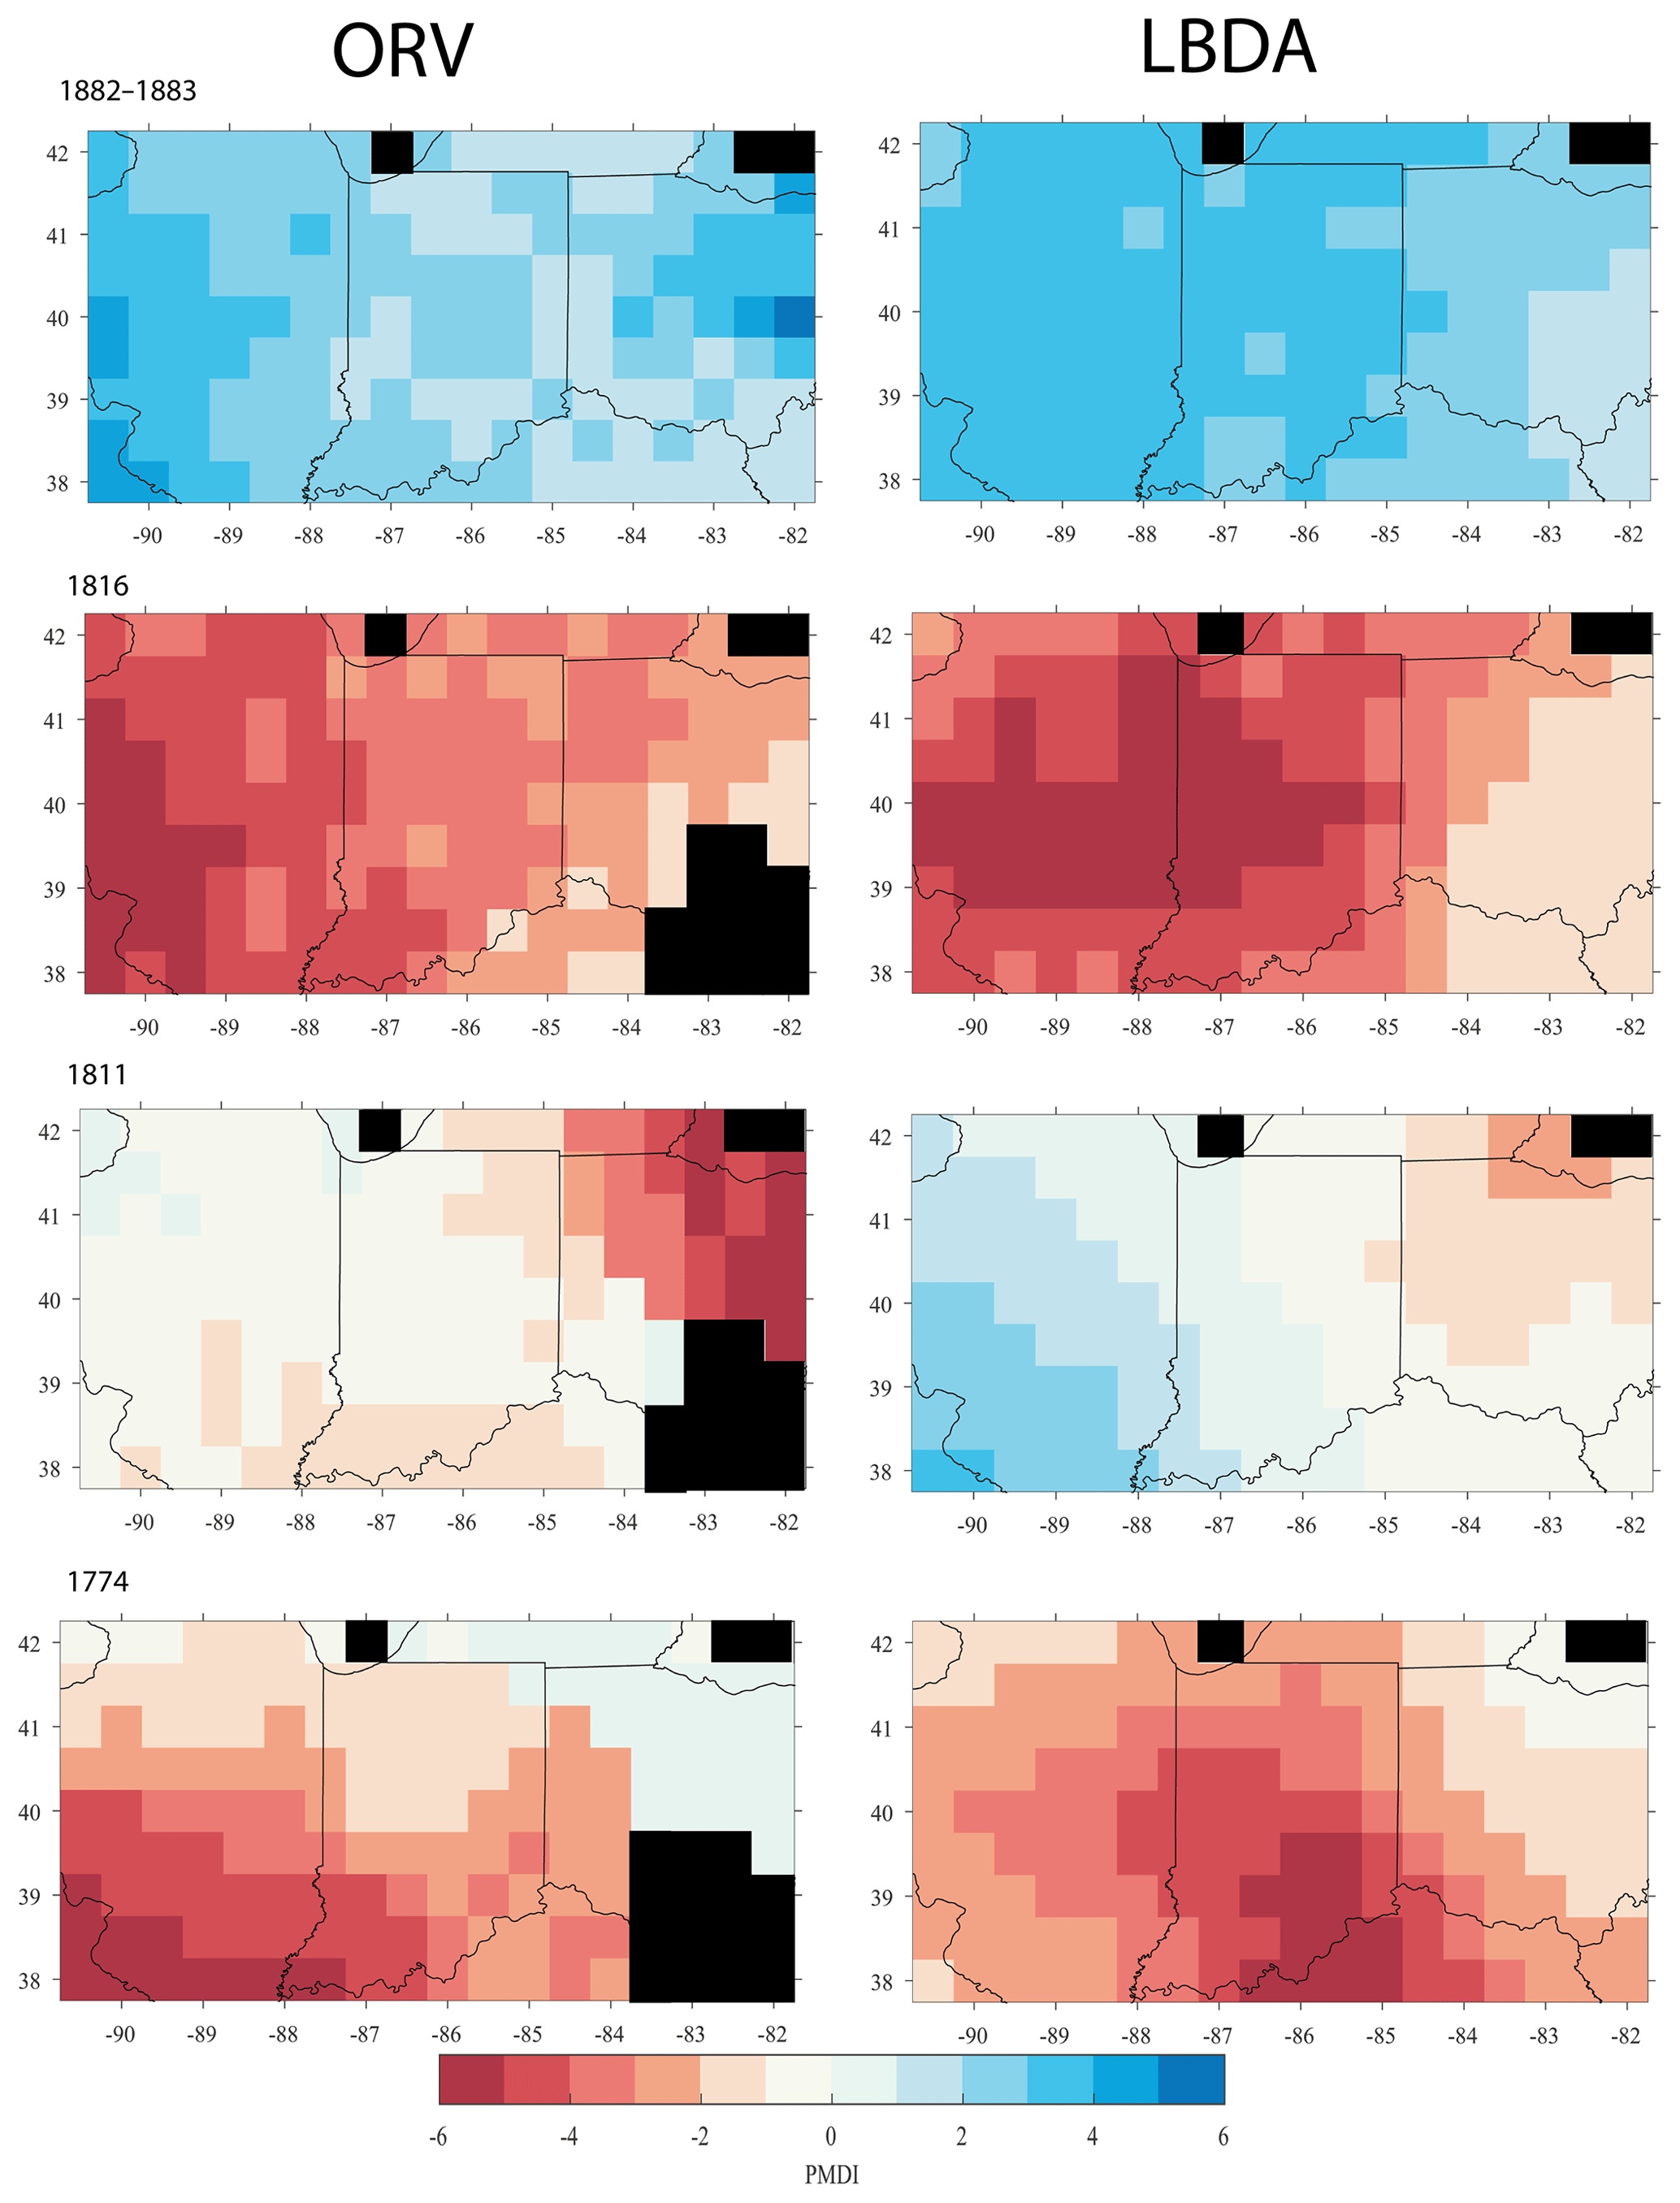
Figure 3Spatial comparison of the ORV (left column) and the LBDA (right column) of reconstructed PMDI during years that experienced hydroclimatic extremes. Red cells represent below-average PMDI and blue cells represent above-average PMDI. Black cells represent no data, either due to being over water or from not having at least five chronologies to create a reconstruction.
In general, the probability distribution function (PDF) of the ORV reconstruction had a lower occurrence (densities of 0.17 compared to 0.23) of near-average years but higher densities (differences ranging from 0.01 to 0.05) for extremes, particularly drought, compared to the LBDA (Fig. 6). The ORV distribution was nearly identical to the instrumental, while the LBDA had lower densities of extremes (Fig. 6). Similarly, the ORV had a larger number of reconstructed drought (median difference of 9 years) conditions that better matched the instrumental record. The pluvial conditions were closer between the three datasets, with the LBDA having the highest median and the instrumental the lowest median (Fig. 6). Due to the larger number of extreme drought years, the ORV reconstructions had more frequent flips according to the flip index values compared to the LBDA (Fig. 7). The central and southeastern portions of the region, in particular, showed a greater number of wet, dry, and total flips, resulting in ∼30 more wet and dry flips and ∼60 more total flips (Fig. 7).
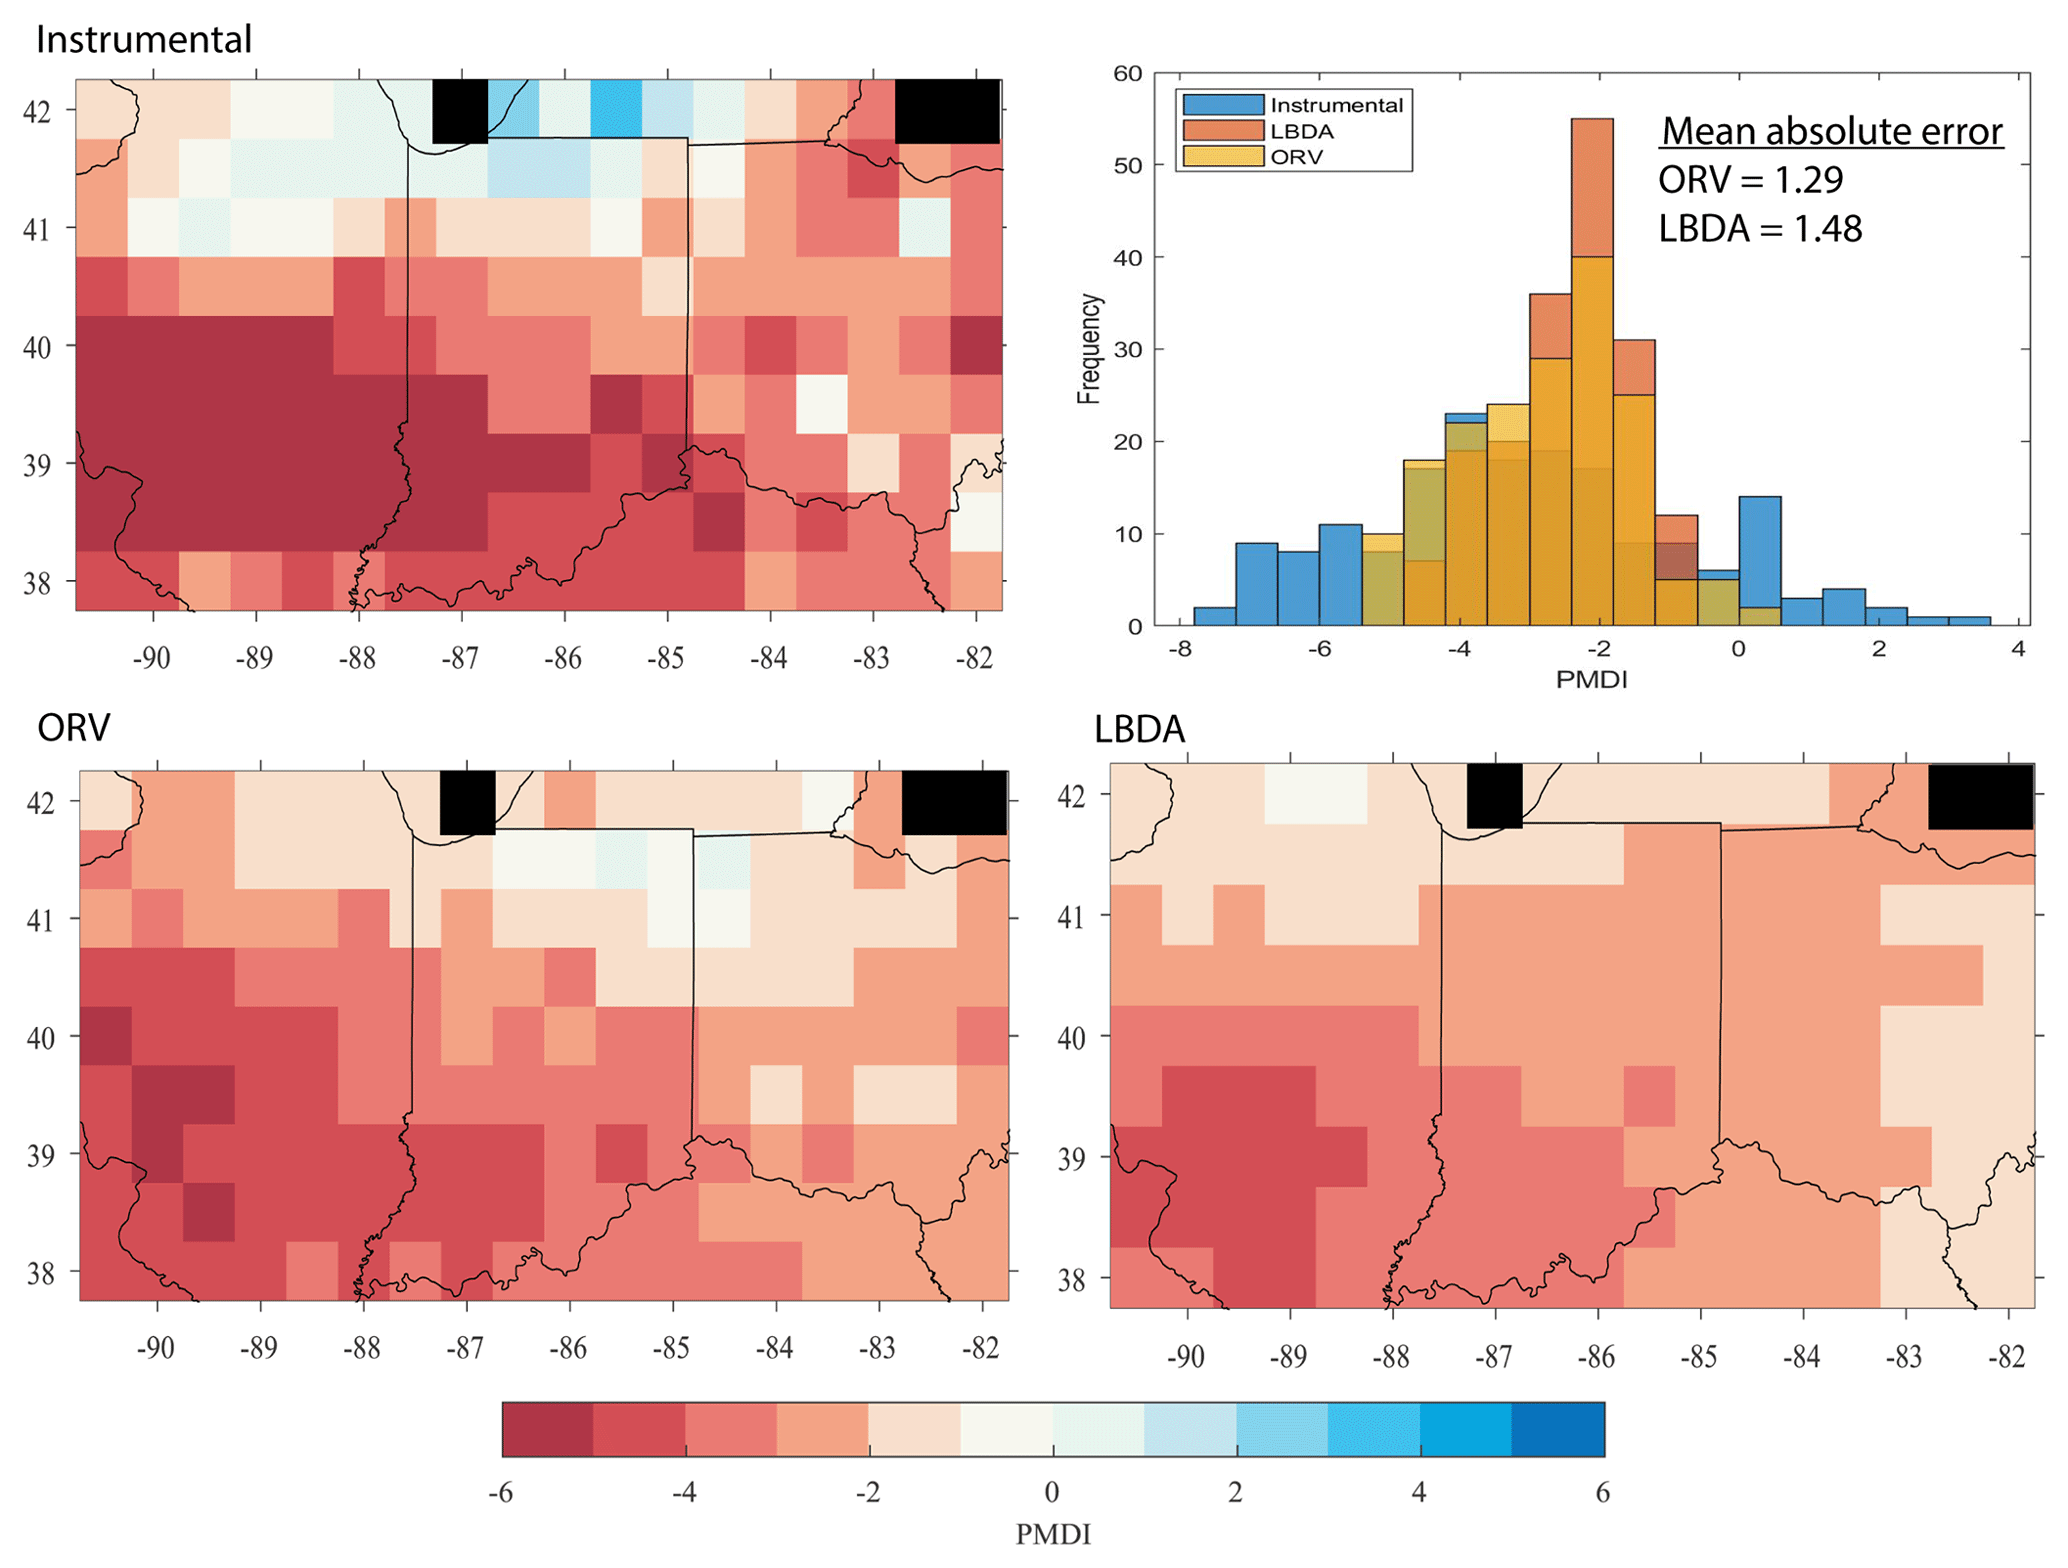
Figure 4Maps showing PMDI values for the instrumental data, ORV, and LBDA reconstructions for the year 1954. The histogram represents the frequency of PMDI values for the instrumental, ORV, and LBDA PMDI values. The mean absolute error values show that the ORV reconstruction more accurately matches the instrumental data compared to the LBDA reconstruction. Black grids represent areas over water and therefore, no data.
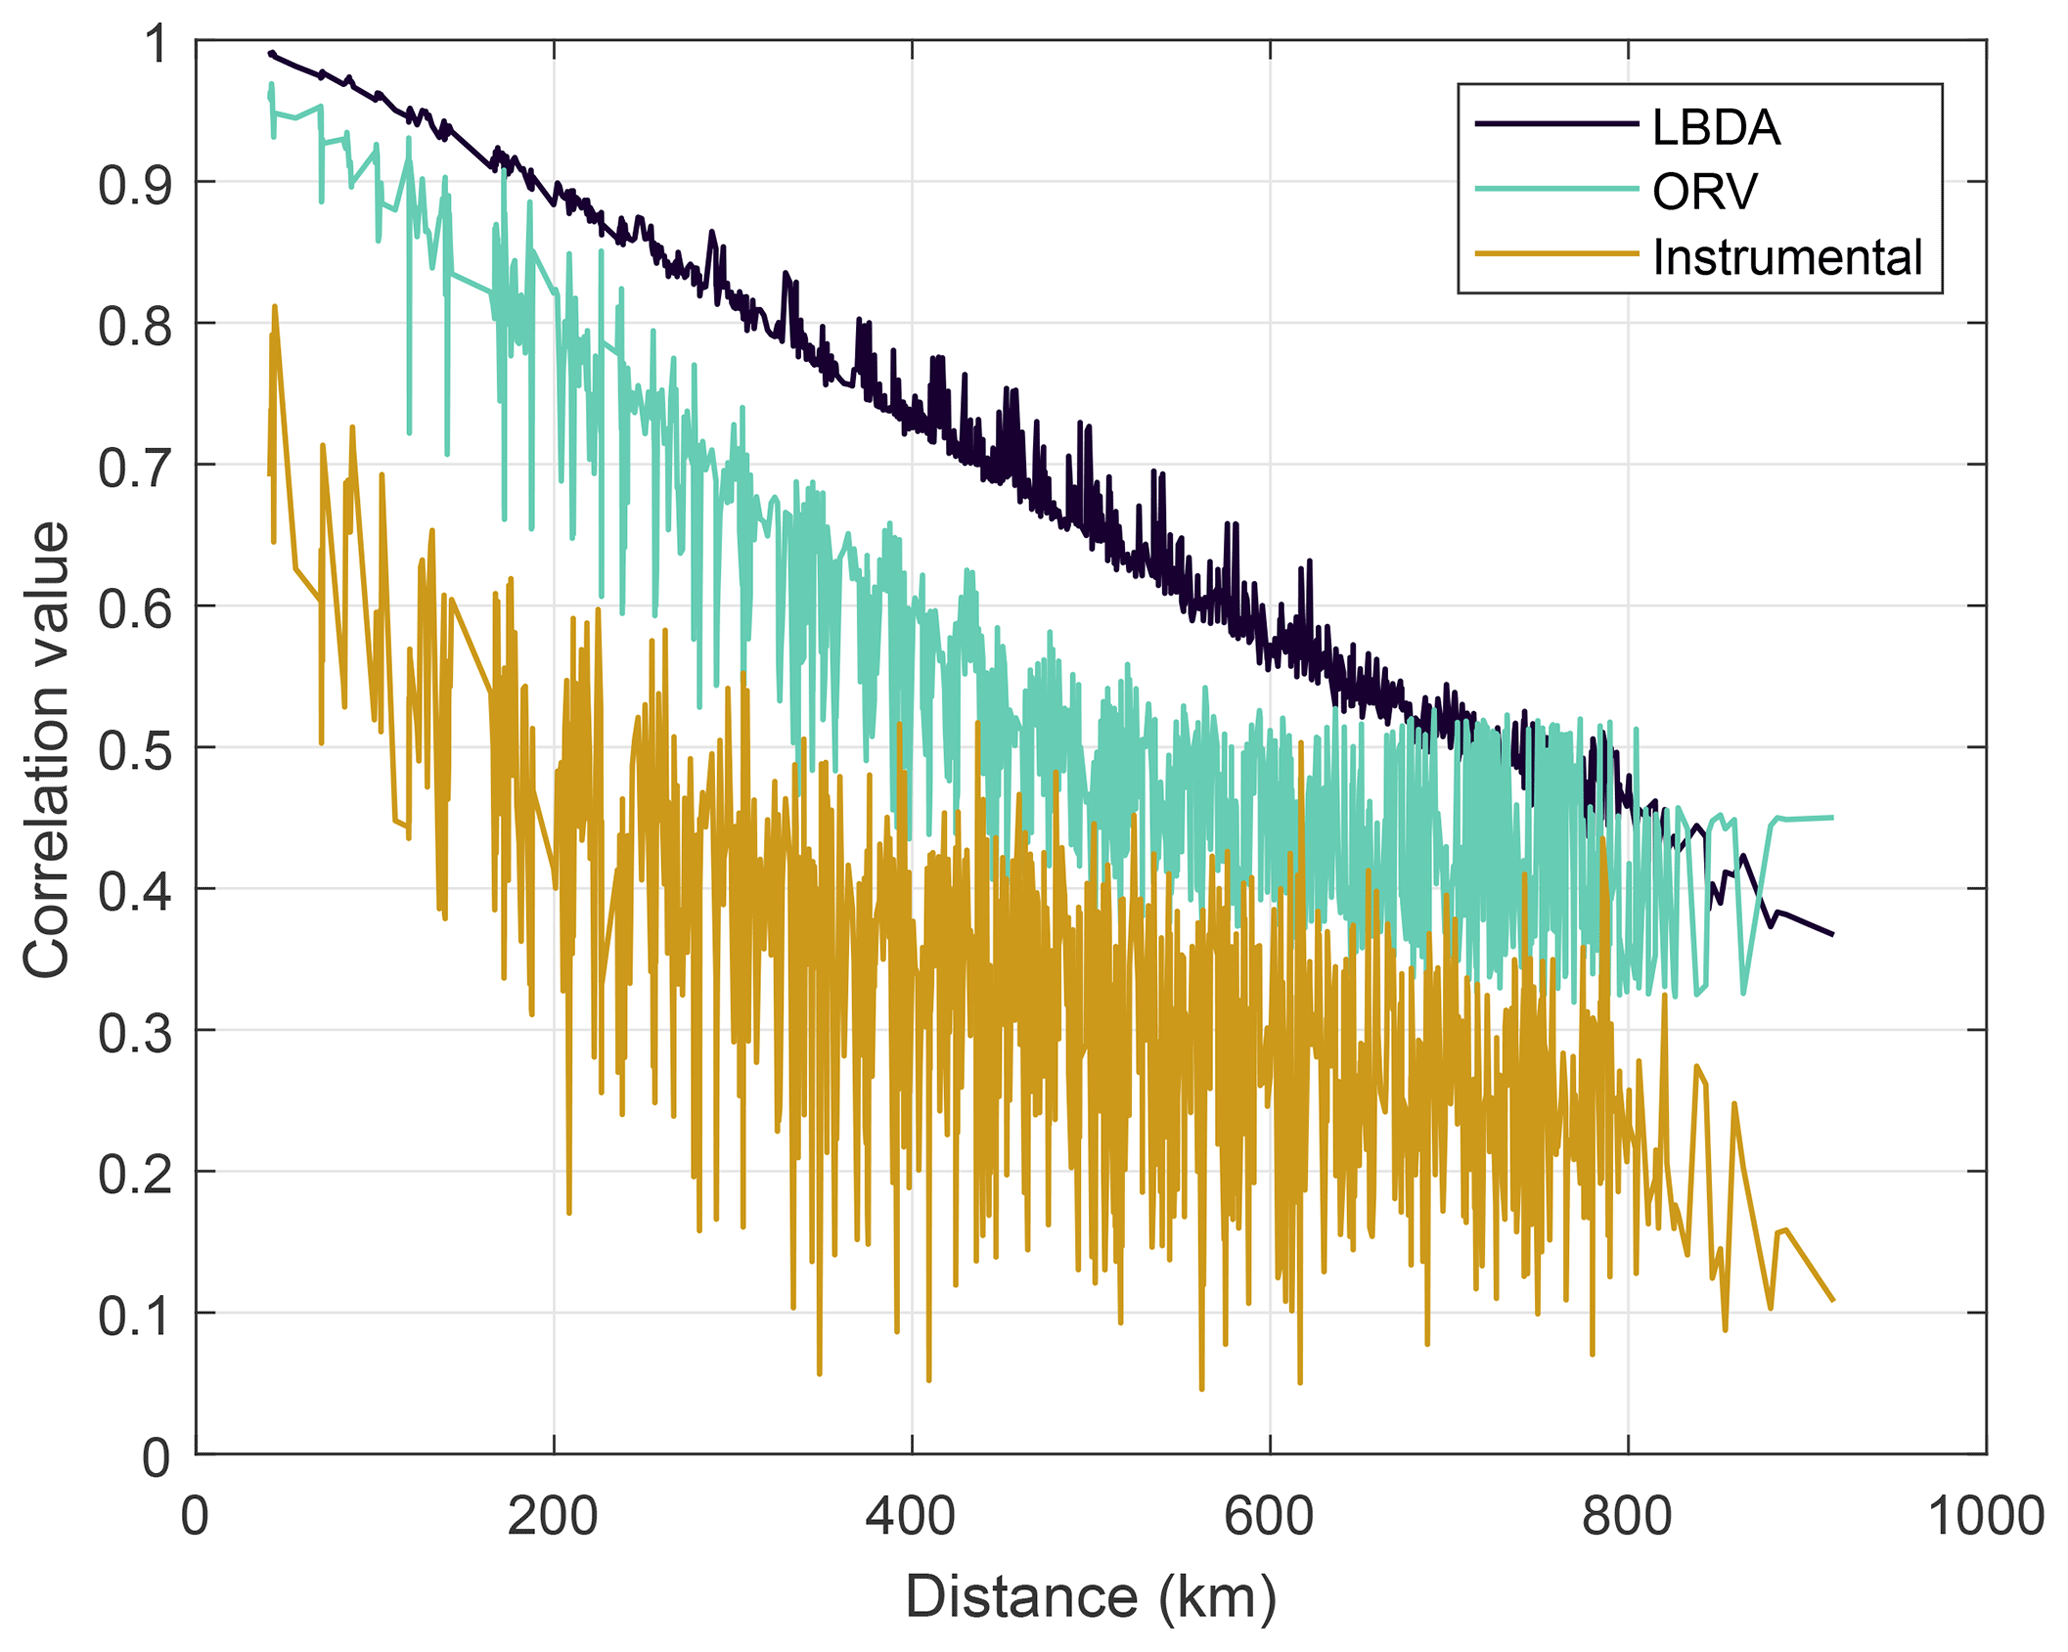
Figure 5Average correlation coefficients between PMDI values across all grid points as a function of distance. LBDA and ORV are reconstructed PMDI values.
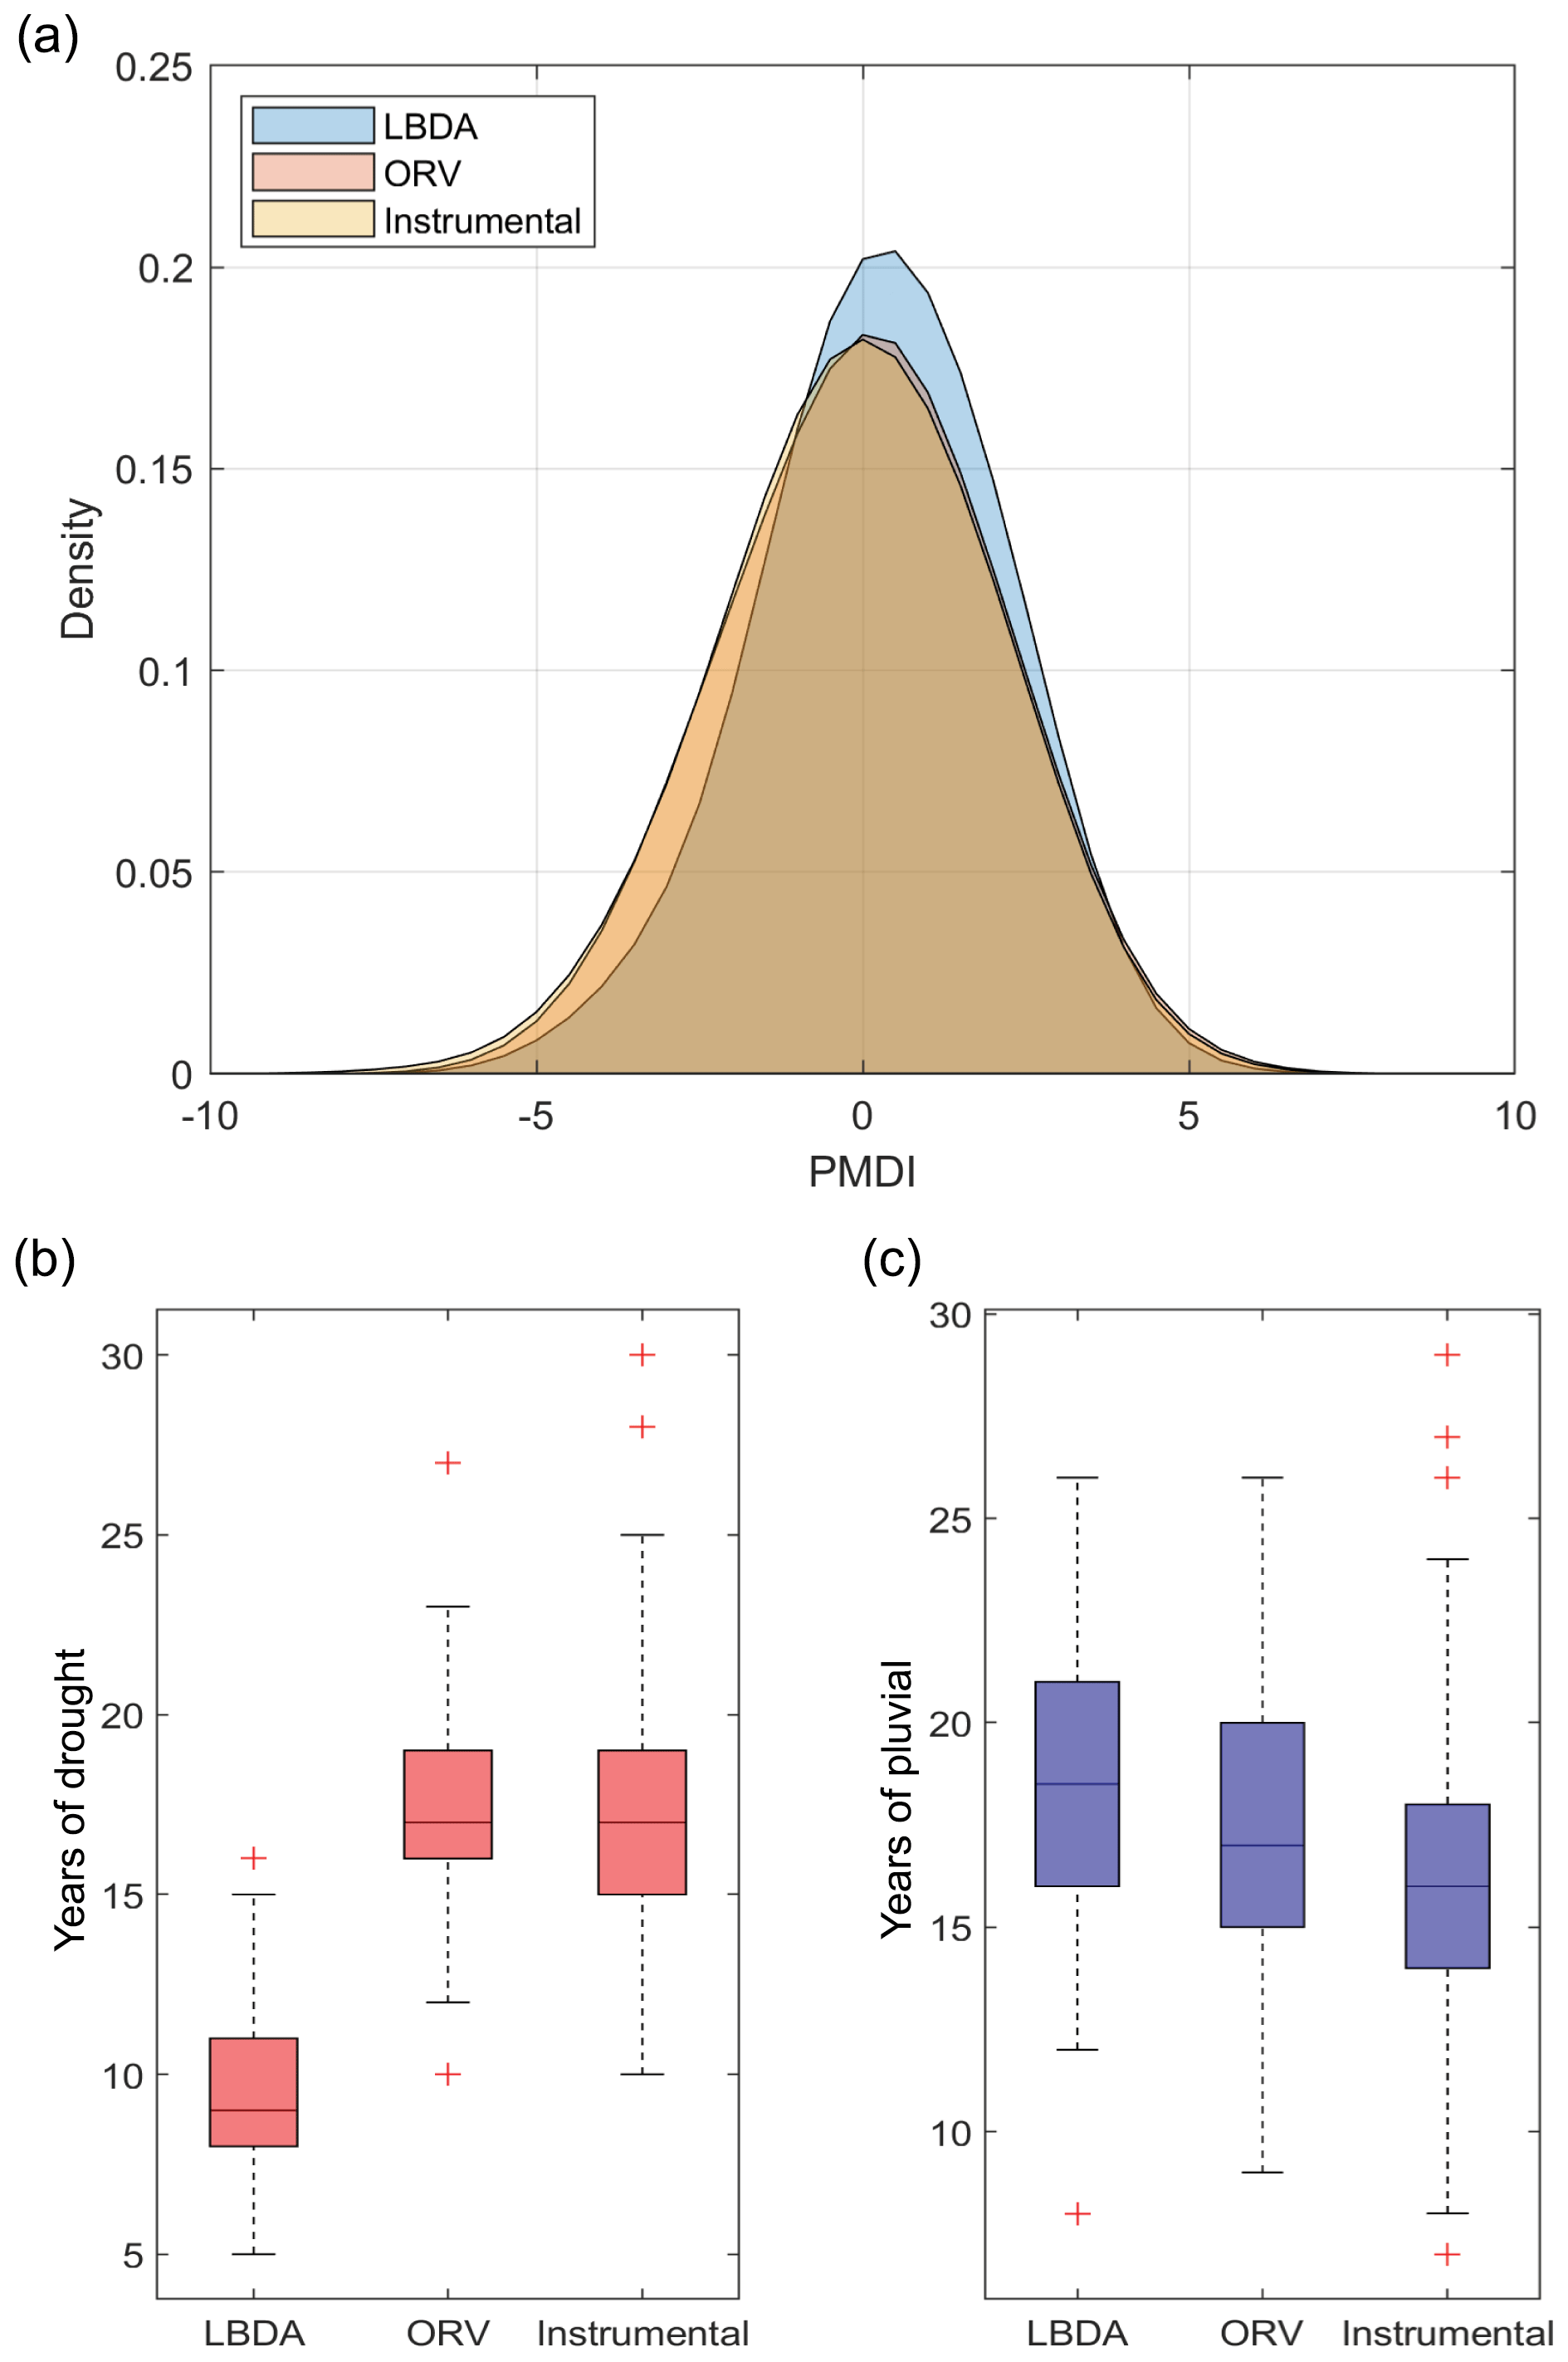
Figure 6(a) Probability distribution functions for all gridded reconstructed PMDI values for the ORV and LBDA networks. (b) Boxplot of the number of drought () years between LBDA and ORV. (c) Boxplot of the number of pluvial (PMDI≥2.0) years between LBDA and ORV.
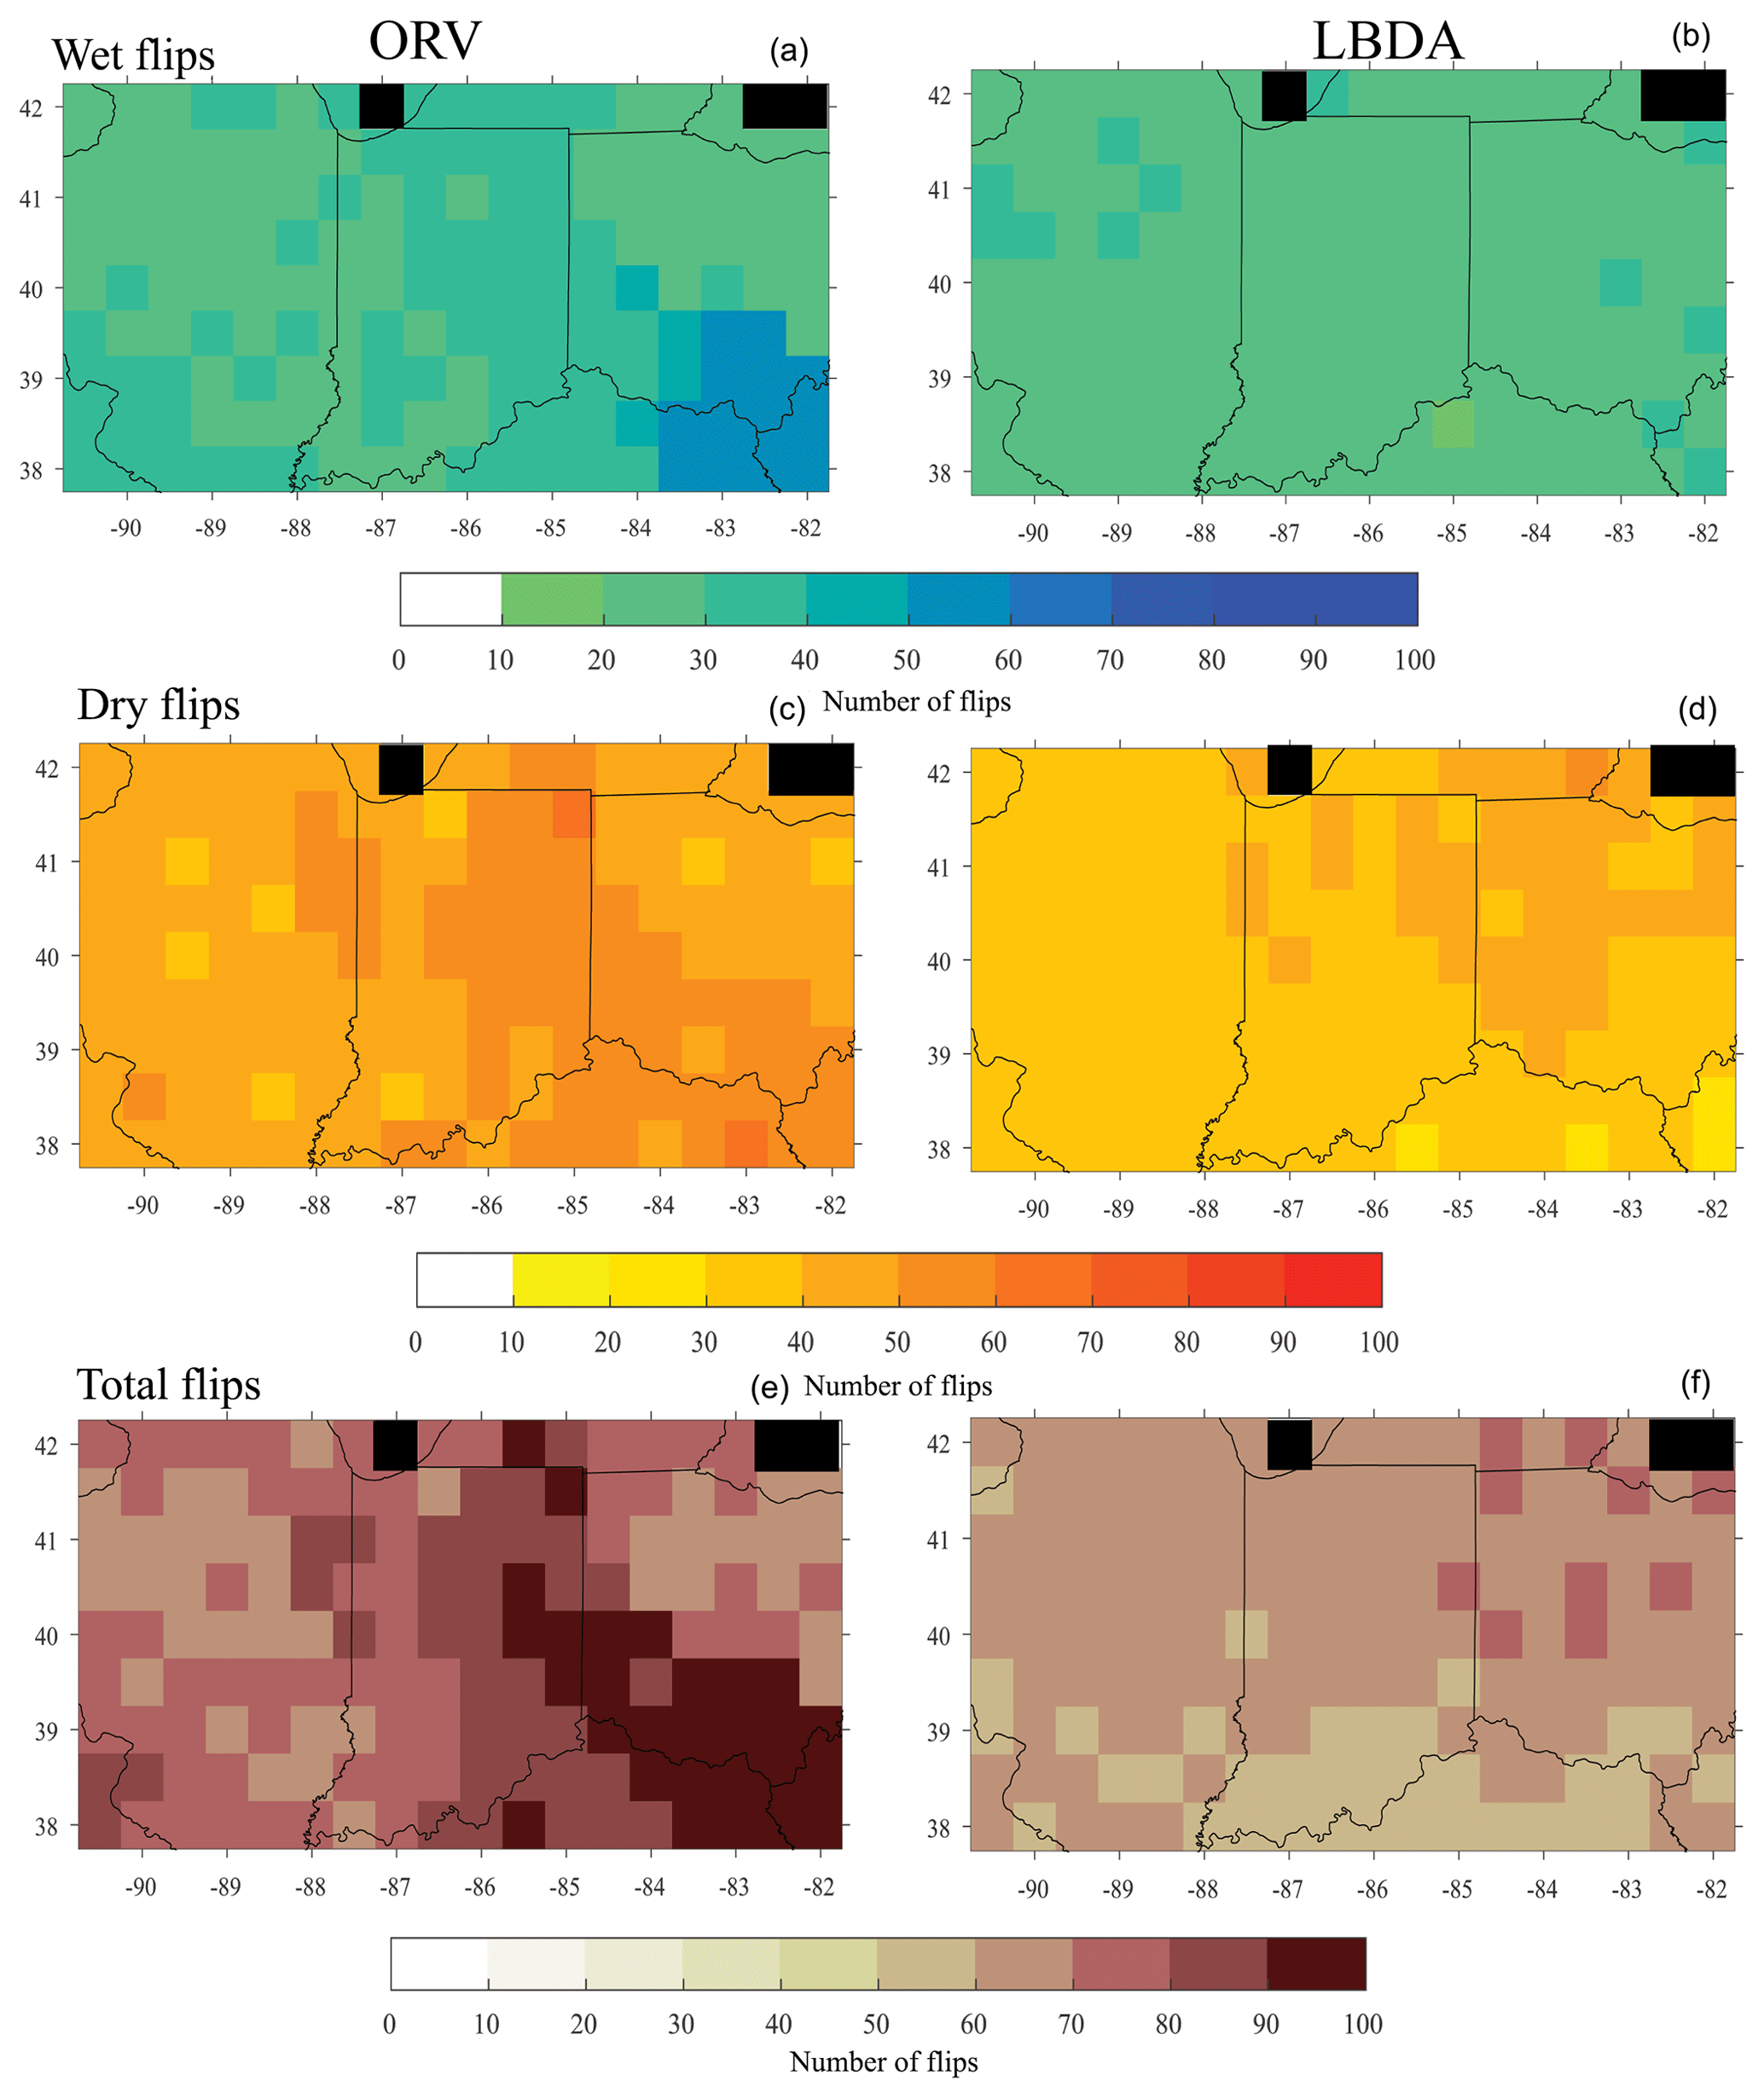
Figure 7Maps of the number of wet flips (a, b), dry flips (c, d), and total flips (e, f), for the ORV (a, c, e) and the LBDA (b, d, f). Black cells represent values over water and therefore no data.
3.3 Species Contributions
With the highest average correlation values, Quercus spp. chronologies were consistently the strongest contributors to reconstruction models (Fig. 8). The white oak (Q. alba) chronology from Lincoln's New Salem in Illinois had the highest JJA correlation value of 0.749, and as a species Q. alba was the strongest species contributor (Fig. 8). In addition to Quercus spp., black walnut (Juglans nigra) had an exceptionally high average correlation value, ranking the third highest. White ash (Fraxinus nigra), tulip tree (Liriodendron tulipifera), and sugar maple (Acer saccharum) were also strong contributors to drought models, with median correlation values >0.38 (Fig. 8).
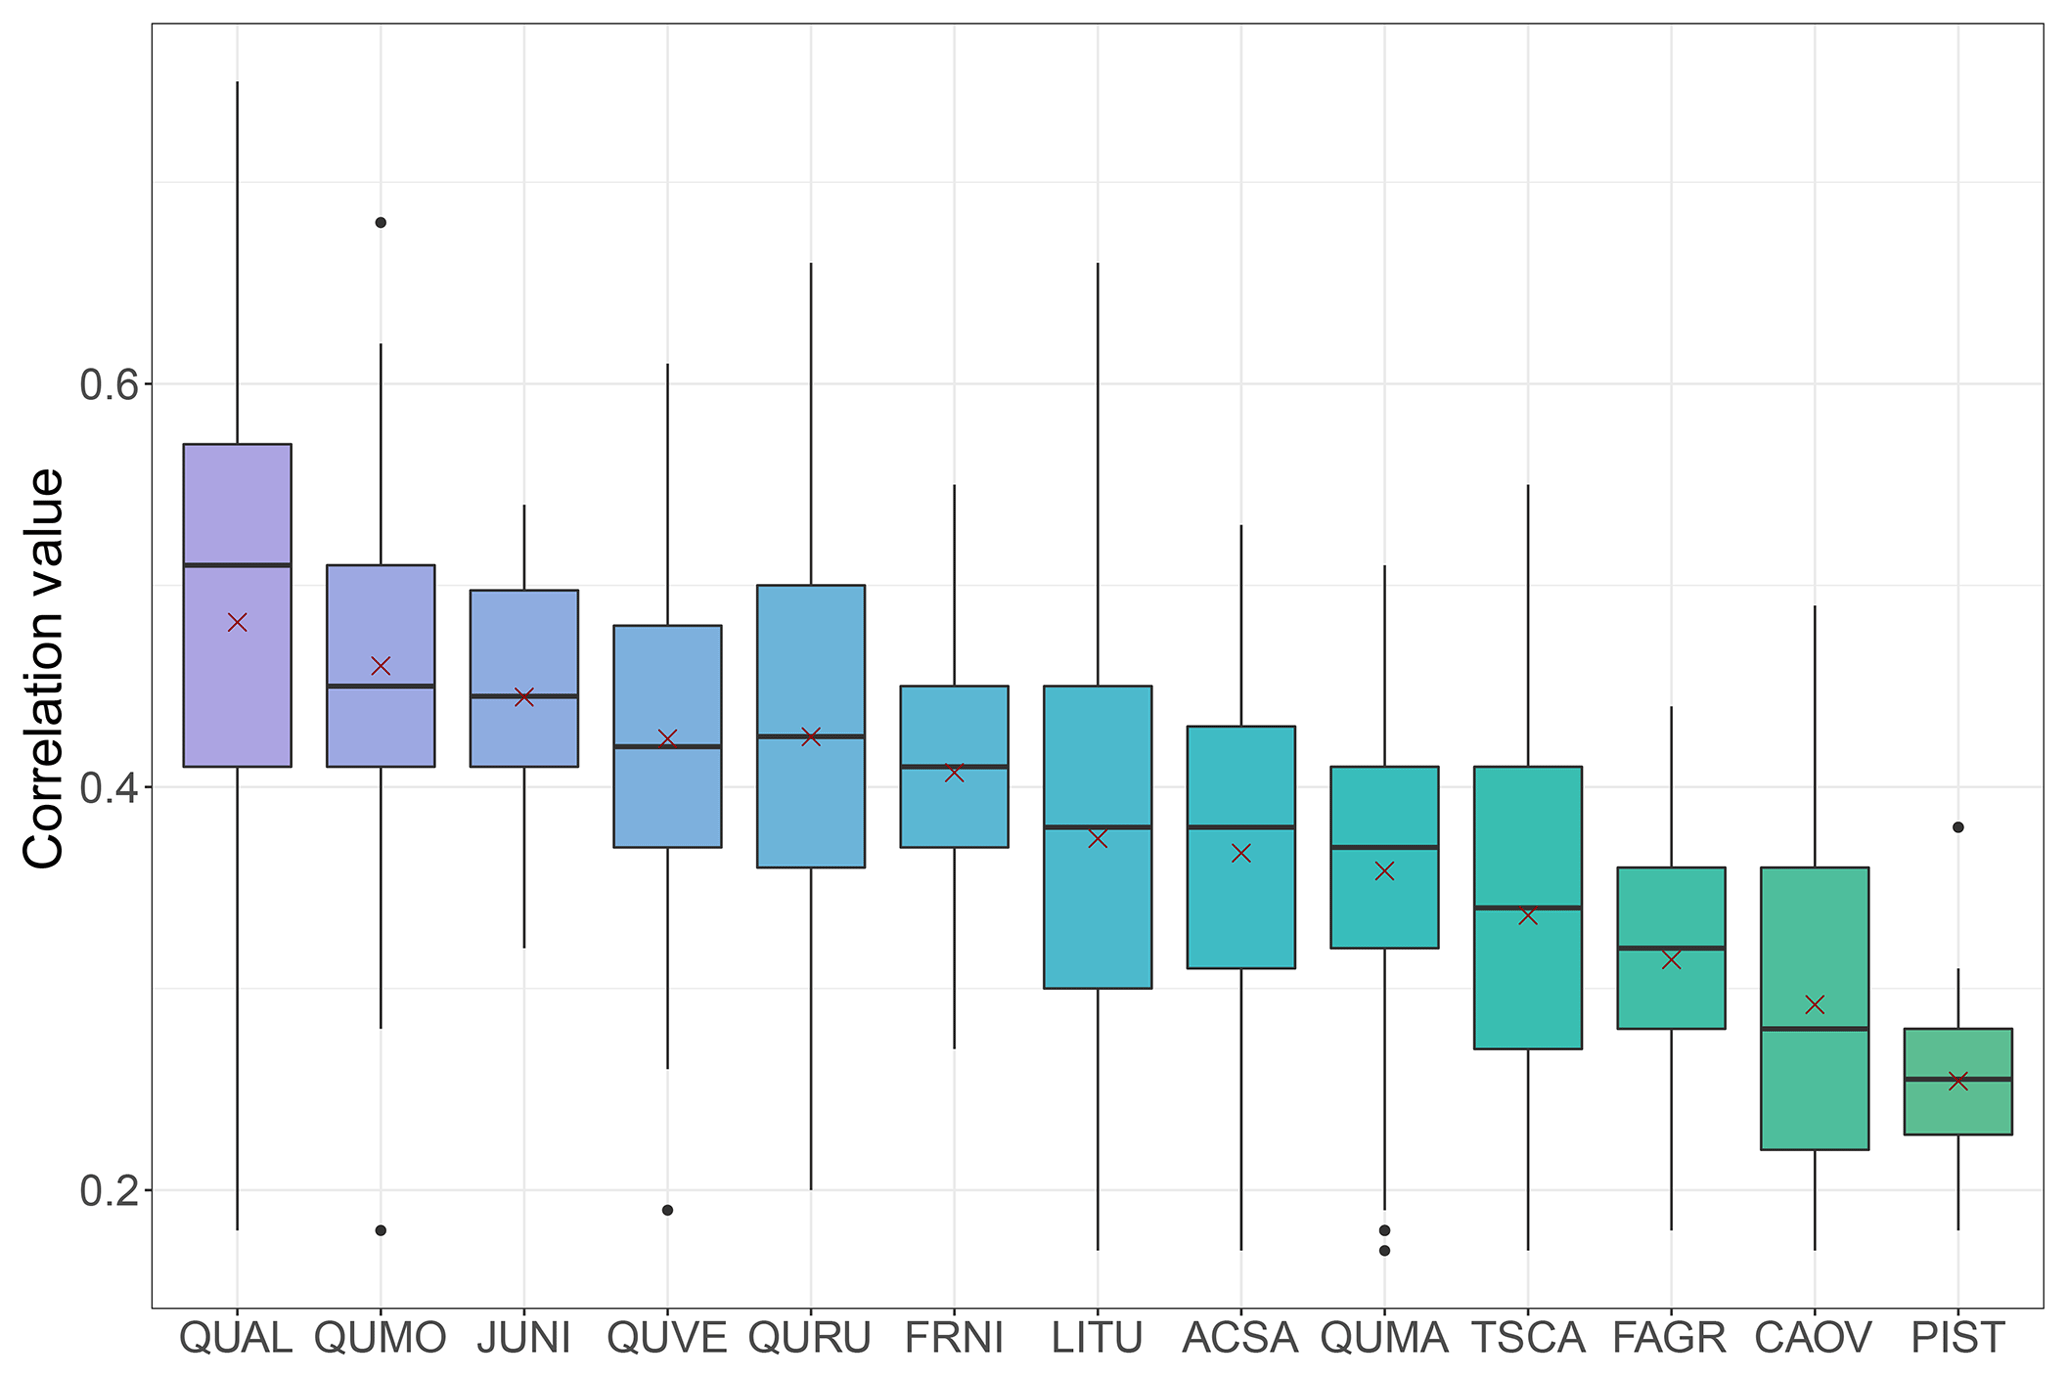
Figure 8Correlation values between species chronologies and PMDI for the gridded reconstruction models. The “x” represents the mean beta weight for the species: QUAL is Q. alba, QUMO is Quercus montana, JUNI is Juglans nigra, QUVE is Q. velutina, QURU is Q. rubra, FRNI is Fraxinus nigra, LITU is Liriodendron tulipifera, ACSA is Acer saccharum, QUMA is Q. macrocarpa, TSCA is Tsuga canadensis, FAGR is Fagus grandifolia, CAOV is Carya ovata, and PIST is Pinus strobus. The species are ranked by their mean correlation values from highest to lowest.
3.4 ORV and LBDA validation statistics
Comparing how well each reconstruction model represented the instrumental data, we find that the variance explained (R2 values) in the calibration and verification periods match well for the northern portion of the network, with values ranging from 40 to 60 % variance explained (Fig. 8). However, the ORV models for the southern half of the region generally explain less variance compared to the LBDA (Fig. 9). Interestingly, the RE and CE values between the two reconstructions are generally more similar, with the ORV having poorer validation statistics in the southernmost portion of the region and the LBDA having weaker statistics in the central portion of the region (Fig. 9).
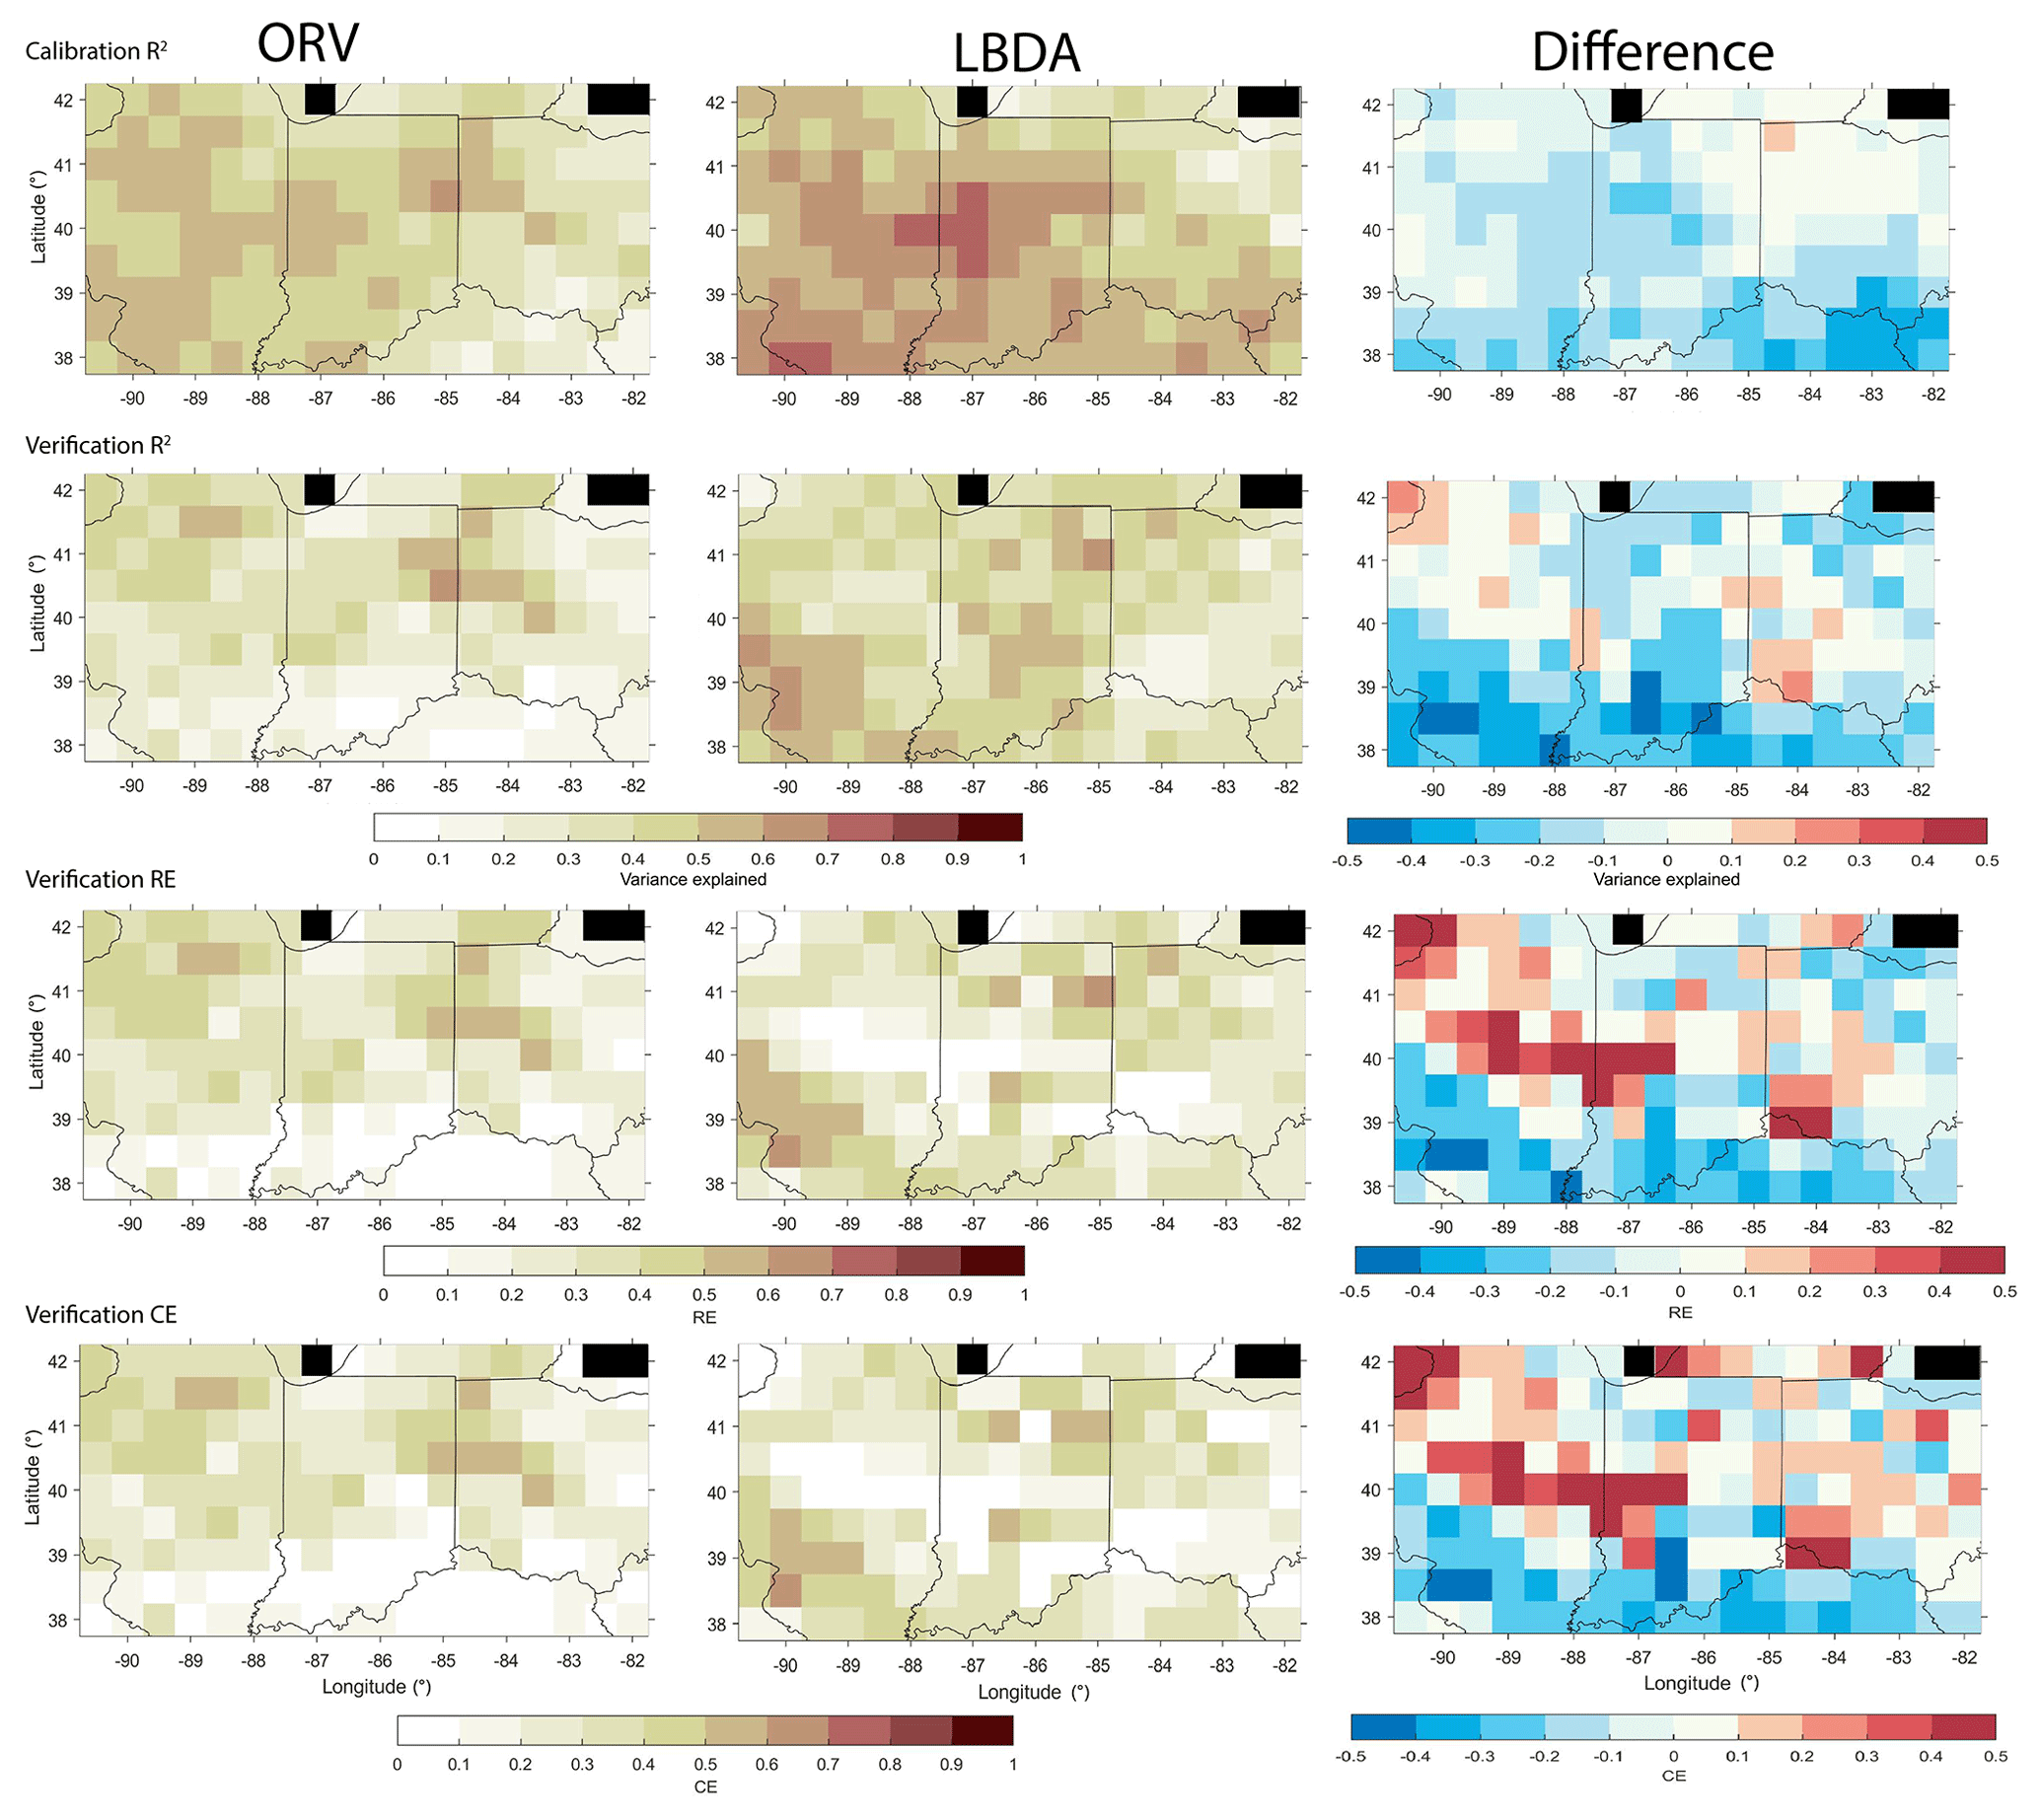
Figure 9Comparison of the calibration (1901–1955) and validation (1956–2010) statistics between the ORV (left column) and LBDA (right column) reconstructions. Difference represents LBDA values subtracted from ORV. Black cells represent values over water and therefore no data.
Previous work has shown that radial growth from trees in the south-central portion of the region are becoming less sensitive to soil moisture compared to earlier time periods (Maxwell et al., 2016). The comparison between a point-by-point reconstruction that ended in 1980 to a reconstruction that ended in 2010 demonstrates that while the calibration R2 values are similar, the 2010 verification models explain much less variance in the southern portion of the ORV (Fig. 10). These are the same regions in the ORV reconstruction that explain less variance than the same gridded reconstructions of the LBDA. Importantly, the ORV 1980 and 2010 reconstructions used the same tree-ring chronologies (Fig. 10). Therefore, our results indicate that tree rings in the southern portion of our study region have become less responsive to soil moisture.

Figure 10Maps of the difference between the ORV reconstruction when ending the calibration period in 2010 compared to 1980 (i.e., ORV2010–ORV1980) for calibration R2, verification R2, RE, and CE. Black cells represent values over water and therefore no data.
4.1 ORV and LBDA extreme year comparisons
Tree rings have long been used to provide an historical context to hydroclimatic extremes (Stahle and Cleaveland, 1994; Woodhouse and Overpeck, 1998; Cook et al., 1999, 2010; Pederson et al., 2013). However, in some regions of the US, the tree-ring sites are sparsely distributed, and it is unknown what kind of impact that has on the representation of past climate. Due to the higher density of tree-ring chronologies and the smaller search radius (250 km for the ORV compared to 450+ km for LBDA) of the PC regression models when determining the pool of predictors, the ORV better replicates the spatial variability of the instrumental data compared the LBDA (Figs. 4 and 5; Figs. S2 and 3 in the Supplement). By using a ≥450 km radius for potential tree-ring chronologies, the LBDA was successful at reconstructing soil moisture even in areas that have a limited number of tree-ring chronologies. However, this approach results in the use of the same tree-ring chronologies in multiple grid points, spatially smoothing the variability of the reconstructed PMDI compared to the instrumental data (Fig. 5). The same is true of the ORV; however, the increase in the spatial density of the chronologies allows a smaller search radius and therefore can increase the spatial variability in the ORV (Fig. 5). The increase in spatial variability in PMDI values of the ORV better matches the instrumental data while still providing a statistically valid reconstruction model (Figs. 4 and 5; Figs. S2–S4 in the Supplement). These findings have important implications, particularly in regions with a sparse tree-ring network where the LBDA or other drought atlases likely underestimate localized droughts and pluvials. Increasing the spatial density of the tree-ring network will allow a more accurate spatial representation of extreme events nearly anywhere where trees are sensitive to climate.
In addition to the increase in spatial variability of extremes that we find, previous work suggests that increasing the density of the tree-ring network can uncover previously unknown droughts and pluvials at more local scales (Maxwell and Harley, 2017; Strange et al., 2019; Pearl et al., 2020). Here, we find the support of better-localized representations of extremes by increasing the density of the tree-ring network, with the ORV having a larger number of droughts and pluvials compared to the LBDA (Fig. 6). The increase in extremes has important implications on the long-term variability of past hydroclimate and to the interannual volatility of PMDI. Recent work has shown increases in interannual volatility has important impacts on agriculture (Locke et al., 2017) and social and ecological systems (Casson et al., 2019). Our finding suggests that in areas with a sparse tree-ring network, such as in the ORV, tree-ring reconstructions underestimate extremes, and therefore volatility in extremes is also underestimated. By increasing the density of the network and better representing localized extremes, we find a higher number of flips (Fig. 7). The better representation of localized extremes results in a more accurate representation of past climatic volatility and can be used to better place current and future projected changes into context. With gridded reconstructions of both soil moisture and temperature becoming more common with the increase in available tree-chronologies (e.g., Anchukaitis et al., 2017; Morales et al., 2020; Pearl et al., 2020), we show the importance of valuing higher density from a larger range of species within the network in addition to the length of the chronologies.
4.2 Species contributions
Historically, soil moisture reconstructions from tree rings in the eastern US have been dominated by a few species, such as Q. alba, bald cypress (Taxodium distichum), and eastern hemlock (Tsuga canadensis) (Zhao et al., 2019). In addition to increasing the spatial density of the network, the ORV reconstruction has increased the number of species used, many of which are co-occurring. The use of multiple species has been shown to increase model performance (Pederson et al., 2001, 2012; Frank and Esper, 2005; Cook and Pederson, 2011; Maxwell et al., 2011, 2015). Examining the correlation values of the species used in the reconstructions models, Quercus (oak) species in general, contribute more to the models (Fig. 8), which is part of the reason why they have been traditionally used so frequently. However, we find that several species, including J. nigra, L. tulipifera, and A. saccharum, make strong contributions to the model as well (Fig. 8), further supporting that these species are sensitive to hydroclimate variability (LeBlanc et al., 2020; Au et al., 2020). These findings agree with recent studies that suggest less commonly used species can increase the representativeness of tree-ring reconstructions of climate (Pederson et al., 2012; Maxwell, 2016; Maxwell and Harley, 2017; Alexander et al., 2019).
4.3 ORV and LBDA validation statistics
While increasing the spatial density of the tree-ring network allowed the reconstructions to more accurately capture the spatial variability of extreme conditions, the reconstruction models of the ORV have less predictive skill compared to those of the LBDA, especially during the verification period (Fig. 9). The two networks have some overlap in chronologies, but while the ORV has a higher density of chronologies within the Ohio River valley region, the LBDA can draw from more chronologies across a larger region. While the larger radius increases the number of samples in the model and could lead to more explained variance for the LBDA, the ORV reconstruction better spatially replicates extremes in the instrumental period (Fig. 4; Figs. S2–S4 in the Supplement).
Interestingly, the decrease in variance explained in the southern portion of the region may not be attributable to differences in sample depth in the tree-ring network. When using the same chronologies while ending the calibration period at 1980 instead of 2010 for the ORV reconstruction, the validation statistics compare very well with the LBDA. However, by updating the chronologies to 2010, the R2 and the validation statistics drop dramatically for the grid reconstructions in the southern portion of the region (Fig. 10). These findings support Maxwell et al. (2016), where they found trees in this region to have a weakening signal to soil moisture, termed the “Fading Drought Signal.” The recent decrease in sensitivity of tree growth to soil moisture has also been documented outside of the ORV, in the mid-Atlantic US (Helcoski et al., 2019), indicating the impact of a changing climate could influence the representation of tree rings to climate in mid-latitude locations. Drought in the Midwest during the instrumental period (1901–2010) was temporally clustered in the 1930s and 1950s. The only recent droughts in the study period were in 1988 and 2002. In both cases, the northern portions of the region experienced severe drought (in excess of −4.0 PMDI values for 1988), but the southern portion of the region only experienced moderate dryness (PMDI values of ). Maxwell et al. (2016) attributed the weakening signal to a recent period without severe drought; however, Helcoski et al. (2019) discussed the possibility of increases in carbon dioxide concentrations in addition to a long period of wetness interacting to weaken tree growth responses to soil moisture. However, recent work examining the simultaneous influence of water availability, carbon dioxide concentrations, and acidic deposition found that water availability was the leading influence on tree growth (Levesque et al., 2017; Maxwell et al., 2019), suggesting a wet period is likely driving the weakening signal. The decreasing performance of the southern reconstructions support these findings as this region has been generally wet and absent of severe drought. While Maxwell et al. (2019) found that Acer species had a more stable relationship with soil moisture and that A. saccharum was a strong performing species in the reconstructions models, the inclusion of multiple co-occurring A. saccharum records did not dramatically influence the validation statistics of the reconstruction models in the southern portion of the region. Our findings demonstrate the complexity of tree species responses to rapidly changing climate regimes and stress the need to better understand species responses to changing climate and determine what impact those responses could have on reconstructions of soil moisture.
By increasing the density of the tree-ring network in a region that is poorly represented in the LBDA, we created a gridded PMDI reconstruction for the ORV region. We compared our gridded reconstruction with the LBDA and found that increasing the density of the tree-ring network resulted in an increase in localized hydroclimatic extremes that better match the spatial and temporal patterns of the instrumental data. However, calibrating our models with more recent data (up to the year 2010) resulted in a decrease in variance explained and validation statistics for the southern portion of the region. This region has not experienced extreme droughts recently, which is likely driving the decrease in model performance. Increasing spatial density of the tree-ring network is important to better represent localized extremes in the past, indicating that researchers should continue to target previously unsampled old-growth forests. Similarly, the time in which the trees are sampled is also important to model performance. Long periods without extreme hydroclimate variability can result in reconstruction models that are less representative of climatic conditions. We stress the need to update previously sampled chronologies to the current period so that longer calibration models can have the chance to better represent the range of sensitivity of trees rings to climate. Further, more work is needed to extend more of the ORV chronologies to better represent climate further in the past. Targeting wood from historical structures and combining with surrounding living chronologies of the same species could be one way of achieving longer chronologies in this region (Harley et al., 2011; Matheus et al., 2017). Overall, we find that a higher spatial density of the tree-ring network will improve the local representation of reconstructed climate. However, more work is needed to better quantify how the strength of the relationship between tree growth and climate varies through time.
All reconstructions will be uploaded onto the NOAA paleoclimate page. All tree-ring chronologies used in this paper will be uploaded to the International Tree-Ring Databank.
The supplement related to this article is available online at: https://doi.org/10.5194/cp-16-1901-2020-supplement.
JTM and GLH designed the methods of the paper. JTM performed analyses with feedback from GLH. TJM, BMS, KVK, and TFA helped develop tree-ring chronologies with assistance from JTM and GLH. All authors contributed to data collection and the preparation of the manuscript.
The authors declare that they have no conflict of interest.
We would like to thank James Dickens, James McGee, Josh Oliver, Karly Schmidt-Simard, Brynn Taylor, Michael Thornton, Senna Robeson, Matt Wenzel, and Luke Wylie for their assistance in the field and the laboratory.
This research has been supported by the USDA Agriculture and Food Research Initiative grant (grant no. 2017-67013-26191) and the Indiana University Vice-Provost for Research Faculty Research Program (FRSP grant).
This paper was edited by Hans Linderholm and reviewed by two anonymous referees.
Alexander, M. R., Pearl, J. K., Bishop, D. A., Cook, E. R., Anchukaitis, K. J., and Pederson, N.: The potential to strengthen temperature reconstructions in ecoregions with limited tree line using a multispecies approach, Quaternary Res., 92, 583–597, https://doi.org/10.1017/qua.2019.33, 2019.
Anchukaitis, K. J., Wilson, R., Briffa, K. R., Büntgen, U., Cook, E. R., D'Arrigo, R., Davi, N., Esper, J., Frank, D., Gunnarson, B. E., Hegerl, G., Helama, S., Klesse, S., Krusic, P. J., Linderholm, H. W., Myglan, V., Osborn, T. J., Zhang, P., Rydval, M., Schneider, L., Schurer, A., Wiles, G., and Zorita, E.: Last millennium Northern Hemisphere summer temperatures from tree rings: Part II, spatially resolved reconstructions, Quaternary Sci. Rev., 163, 1–22, https://doi.org/10.1016/j.quascirev.2017.02.020, 2017.
Au, T. F., Maxwell, J. T., Novick, K. A., Robeson, S. M., Warner, S. M., Lockwood, B. R., Phillips, R. P., Harley, G. L., Telewski, F. W., Therrell, M. D., and Pederson, N.: Demographic shifts in eastern US forests increase the impact of late-season drought on forest growth, Ecography, 43, 1475–1486, https://doi.org/10.1111/ecog.05055, 2020.
Bussberg, N. W., Maxwell, J. T., Robeson, S. M., and Huang, C.: The effect of end-point adjustments on smoothing splines used for tree-ring standardization, Dendrochronologia, 60, 125665, https://doi.org/10.1016/j.dendro.2020.125665, 2020.
Casson, N. J., Contosta, A. R., Burakowski, E. A., Campbell, J. L., Crandall, M. S., Creed, I. F., Eimers, M. C., Garlick, S., Lutz, D. A., Morison, M. Q., Morzillo, A. T., and Nelson, S. J.: Winter Weather Whiplash: Impacts of Meteorological Events Misaligned With Natural and Human Systems in Seasonally Snow-Covered Regions, Earth's Future, 7, 1434–1450, https://doi.org/10.1029/2019EF001224, 2019.
Chen, F., Yuan, Y., Chen, F.-H., Wei, W., Yu, S., Chen, X., Fan, Z., Zhang, R., Zhang, T., Shang, H., and Qin, L.: A 426-year drought history for Western Tian Shan, Central Asia, inferred from tree rings and linkages to the North Atlantic and Indo–West Pacific Oceans, The Holocene, 23, 1095–1104, https://doi.org/10.1177/0959683613483614, 2013.
Cook, E. R. and Pederson, N.: Uncertainty, Emergence, and Statistics in Dendrochronology, in: Dendroclimatology: Progress and Prospects, edited by: Hughes, M. K., Swetnam, T. W., and Diaz, H. F., pp. 77–112, Springer Netherlands, Dordrecht, 2011.
Cook, E. R. and Peters, K.: The Smoothing Spline: A New Approach to Standardizing Forest Interior Tree-Ring Width Series for Dendroclimatic Studies, (online), available at: https://repository.arizona.edu/handle/10150/261038 (last access: 21 February 2020), 1981.
Cook, E. R. and Peters, K.: Calculating unbiased tree-ring indices for the study of climatic and environmental change, The Holocene, 7, 361–370, https://doi.org/10.1177/095968369700700314, 1997.
Cook, E. R., Meko, D. M., Stahle, D. W., and Cleaveland, M. K.: Drought Reconstructions for the Continental United States, J. Climate, 12, 1145–1162, https://doi.org/10.1175/1520-0442(1999)012<1145:DRFTCU>2.0.CO;2, 1999.
Cook, E. R., Seager, R., Heim, R. R., Vose, R. S., Herweijer, C., and Woodhouse, C.: Megadroughts in North America: placing IPCC projections of hydroclimatic change in a long-term palaeoclimate context, J. Quaternary Sci., 25, 48–61, https://doi.org/10.1002/jqs.1303, 2010.
Coulthard, B. L., St. George, S., and Meko, D. M.: The limits of freely-available tree-ring chronologies, Quaternary Sci. Rev., 234, 106264, https://doi.org/10.1016/j.quascirev.2020.106264, 2020.
Fang, K., Davi, N., Gou, X., Chen, F., Cook, E., Li, J., and D’Arrigo, R. Spatial drought reconstructions for central High Asia based on tree rings, Clim. Dyn., 35, 941–951, https://doi.org/10.1007/s00382-009-0739-9, 2010
Frank, D., Wilson, R., and Esper, J.: Synchronous variability changes in Alpine temperature and tree-ring data over the past two centuries, Boreas, 34, 498–505, https://doi.org/10.1080/03009480500231443, 2005.
Fritts, H.: Tree Rings and Climate, Academic Press, New York, ISBN 978-1-9306-6539-2, pp. 567, 1976.
Güner, H. T., Köse, N., and Harley, G. L.: A 200-year reconstruction of Kocasu River (Sakarya River Basin, Turkey) streamflow derived from a tree-ring network, Int. J. Biometeorol., 61, 427–437, 2017.
Guttman, L.: Some necessary conditions for common-factor analysis, Psychometrika, 19, 149–161, https://doi.org/10.1007/BF02289162, 1954.
Harley, G. L., Grissino-Mayer, H. D., LaForest, L. B., and McCauley, P.: Dendrochronological dating of the Lund-Spathelf House, Ann Arbor, Michigan, USA, Tree-Ring Res., 67, 117–121, 2011.
Harley, G. L., Maxwell, R. S., Black, B. A., and Bekker, M. F.: A multi-century, tree-ring-derived perspective of the North Cascades (USA) 2014–2016 snow drought, Climatic Change, 162, 127–143, 2020.
Heim, R. R.: A Comparison of the Early Twenty-First Century Drought in the United States to the 1930s and 1950s Drought Episodes, Bull. Amer. Meteor. Soc., 98, 2579–2592, https://doi.org/10.1175/BAMS-D-16-0080.1, 2017.
Helcoski, R., Tepley, A. J., Pederson, N., McGarvey, J. C., Meakem, V., Herrmann, V., Thompson, J. R., and Anderson-Teixeira, K. J.: Growing season moisture drives interannual variation in woody productivity of a temperate deciduous forest, New Phytol., 223, 1204–1216, https://doi.org/10.1111/nph.15906, 2019.
Holmes, R. L.: Computer-assisted quality control in tree-ring dating and measurement, Tree-Ring Bull., 43, 51–67, 1983.
Hutchinson, M. F.: Interpolating mean rainfall using thin plate smoothing splines, Int. J. Geogr. Inf. Sys., 9, 385–403, https://doi.org/10.1080/02693799508902045, 1995.
Kaiser, H. F.: The Application of Electronic Computers to Factor Analysis, Educ. Psychol. Meas., 20, 141–151, https://doi.org/10.1177/001316446002000116, 1960.
Larson, E. R., Allen, S., Flinner, N. L., Labarge, S. G., and Wilding, T. C.: The Need and Means To Update Chronologies In A Dynamic Environment, Tree-Ring Res., 69, 21–27, https://doi.org/10.3959/1536-1098-69.1.21, 2013.
LeBlanc, D. C., Maxwell, J. T., Pederson, N., Berland, A., and Mandra, T. E. Radial growth responses of tulip poplar (Liriodendron tulipifera) to climate in the eastern United States, Ecosphere, accepted, 2020.
Levesque, M., Andreu-Hayles, L., and Pederson, N.: Water availability drives gas exchange and growth of trees in northeastern US, not elevated CO2 and reduced acid deposition, Sci. Rep., 7, 1–9, https://doi.org/10.1038/srep46158, 2017.
Loecke, T. D., Burgin, A. J., Riveros-Iregui, D. A., Ward, A. S., Thomas, S. A., Davis, C. A., and Clair, M. A. St.: Weather whiplash in agricultural regions drives deterioration of water quality, Biogeochemistry, 133, 7–15, https://doi.org/10.1007/s10533-017-0315-z, 2017.
Matheus, T. J., Maxwell, J. T., Oliver, J., Thornton, M., Hess, M., and Harley, G. L.: A dendrochronological evaluation of three historic pioneer cabins at Spring Mill Village, Indiana, Dendrochronologia, 43, 12–19, https://doi.org/10.1016/j.dendro.2016.11.004, 2017.
Maxwell, J. T.: The Benefit of Including Rarely-Used Species in Dendroclimatic Reconstructions: A Case Study Using Juglans nigra in South-Central Indiana, USA, Tree-Ring Res., 72, 44–52, https://doi.org/10.3959/1536-1098-72.01.44, 2016.
Maxwell, J. T. and Harley, G. L.: Increased tree-ring network density reveals more precise estimations of sub-regional hydroclimate variability and climate dynamics in the Midwest, USA, Clim. Dyn., 49, 1479–1493, https://doi.org/10.1007/s00382-016-3396-9, 2017.
Maxwell, J. T., Harley, G. L., and Matheus, T. J.: Dendroclimatic reconstructions from multiple co-occurring species: a case study from an old-growth deciduous forest in Indiana, USA, Int. J. Climatol., 35, 860–870, https://doi.org/10.1002/joc.4021, 2015.
Maxwell, J. T., Harley, G. L., and Robeson, S. M.: On the declining relationship between tree growth and climate in the Midwest United States: the fading drought signal, Climatic Change, 138, 127–142, https://doi.org/10.1007/s10584-016-1720-3, 2016.
Maxwell, J. T., Harley, G. L., Mandra, T. E., Yi, K., Kannenberg, S. A., Au, T. F., Robeson, S. M., Pederson, N., Sauer, P. E., and Novick, K. A.: Higher CO2 Concentrations and Lower Acidic Deposition Have Not Changed Drought Response in Tree Growth But Do Influence iWUE in Hardwood Trees in the Midwestern United States, J. Geophys. Res.-Biogeosc., 124, 3798–3813, https://doi.org/10.1029/2019JG005298, 2019.
Maxwell, R. S., Hessl, A. E., Cook, E. R., and Pederson, N.: A multispecies tree ring reconstruction of Potomac River streamflow (950–2001), Water Resour. Res., 47, W05512, https://doi.org/10.1029/2010WR010019, 2011.
Melvin, T. M. and Briffa, K. R.: A “signal-free” approach to dendroclimatic standardisation, Dendrochronologia, 26, 71–86, https://doi.org/10.1016/j.dendro.2007.12.001, 2008.
Milly, P. C. D., Betancourt, J., Falkenmark, M., Hirsch, R. M., Kundzewicz, Z. W., Lettenmaier, D. P., and Stouffer, R. J.: Stationarity Is Dead: Whither Water Management?, Science, 319, 573–574, https://doi.org/10.1126/science.1151915, 2008.
Morales, M. S., Cook, E. R., Barichivich, J., Christie, D. A., Villalba, R., LeQuesne, C., Srur, A. M., Ferrero, M. E., González-Reyes, Á., Couvreux, F., Matskovsky, V., Aravena, J. C., Lara, A., Mundo, I. A., Rojas, F., Prieto, M. R., Smerdon, J. E., Bianchi, L. O., Masiokas, M. H., Urrutia-Jalabert, R., Rodriguez-Catón, M., Muñoz, A. A., Rojas-Badilla, M., Alvarez, C., Lopez, L., Luckman, B. H., Lister, D., Harris, I., Jones, P. D., Williams, A. P., Velazquez, G., Aliste, D., Aguilera-Betti, I., Marcotti, E., Flores, F., Muñoz, T., Cuq, E., and Boninsegna, J. A.: Six hundred years of South American tree rings reveal an increase in severe hydroclimatic events since mid-20th century, P. Natl. Acad. Sci., 117, 16816–16823, https://doi.org/10.1073/pnas.2002411117, 2020.
Oliver, J. S., Harley, G. L., and Maxwell, J. T.: 2500 Years of Hydroclimate Variability in New Mexico, USA, Geophys. Res. Lett., 46, 4432–4440, https://doi.org/10.1029/2019GL082649, 2019.
Palmer, W. C.: Meteorological Drought, US Department of Commerce, Weather Bureau Research Paper, 45, 55 pp., 1965.
Pearl, J. K., Anchukaitis, K. J., Pederson, N., and Donnelly, J. P.: Multivariate Climate Field Reconstructions Using Tree Rings for the Northeastern United States, J. Geophys. Res.-Atmos., 125, e2019JD031619, https://doi.org/10.1029/2019JD031619, 2020.
Pederson, N.: External Characteristics of Old Trees in the Eastern Deciduous Forest, Nat. Area J., 30, 396–407, https://doi.org/10.3375/043.030.0405, 2010.
Pederson, N., Jacoby, G. C., D'Arrigo, R. D., Cook, E. R., Buckley, B. M., Dugarjav, C., and Mijiddorj, R.: Hydrometeorological Reconstructions for Northeastern Mongolia Derived from Tree Rings: 1651–1995, J. Climate, 14, 872–881, https://doi.org/10.1175/1520-0442(2001)014<0872:HRFNMD>2.0.CO;2, 2001.
Pederson, N., Bell, A. R., Knight, T. A., Leland, C., Malcomb, N., Anchukaitis, K. J., Tackett, K., Scheff, J., Brice, A., Catron, B., Blozan, W., and Riddle, J.: A long-term perspective on a modern drought in the American Southeast, Environ. Res. Lett., 7, 014034, https://doi.org/10.1088/1748-9326/7/1/014034, 2012.
Pederson, N., Bell, A. R., Cook, E. R., Lall, U., Devineni, N., Seager, R., Eggleston, K., and Vranes, K. P.: Is an Epic Pluvial Masking the Water Insecurity of the Greater New York City Region?, J. Climate, 26, 1339–1354, https://doi.org/10.1175/JCLI-D-11-00723.1, 2013.
Stahle, D. W. and Cleaveland, M. K.: Tree-Ring Reconstructed Rainfall Over the Southeastern USA. During the Medieval Warm Period and Little Ice Age, in: The Medieval Warm Period, edited by: Hughes, M. K. and Diaz, H. F., pp. 199–212, Springer Netherlands, Dordrecht, 1994.
Stambaugh, M. C., MGuyette, R. McMurry, R., Cook, E. R., Meko, D. M., and Lupo, A. R.: Drought duration and frequency in the US Corn Belt during the last millennium (AD 992–2004), Agr. Forest Meteorol., 151, 154–162, https://doi.org/10.1016/j.agrformet.2010.09.010, 2011.
Stokes, M. A. and Smiley, T. L.: Introduction to tree-ring dating. University of Chicago, 1968.
Strange, B. M., Maxwell, J. T., Robeson, S. M., Harley, G. L., Therrell, M. D., and Ficklin, D. L.: Comparing three approaches to reconstructing streamflow using tree rings in the Wabash River basin in the Midwestern, US, J. Hydrol., 573, 829–840, https://doi.org/10.1016/j.jhydrol.2019.03.057, 2019.
Trenberth, K. E., Branstator, G. W., and Arkin, P. A.,: Origins of the 1988 North American drought, Science, 242, 1640–1645, 1988.
Wigley, T. M. L., Briffa, K. R., and Jones, P. D.: On the Average Value of Correlated Time Series, with Applications in Dendroclimatology and Hydrometeorology, J. Clim. Appl. Meteorol., 23, 201–213, https://doi.org/10.1175/1520-0450(1984)023<0201:OTAVOC>2.0.CO;2, 1984.
Woodhouse, C. A. and Overpeck, J. T.: 2000 Years of Drought Variability in the Central United States, B. Am. Meteorol. Soc., 79, 2693–2714, https://doi.org/10.1175/1520-0477(1998)079<2693:YODVIT>2.0.CO;2, 1998.
Yamaguchi, D. K.: A simple method for cross-dating increment cores from living trees, Can. J. For. Res., 21, 414–416, https://doi.org/10.1139/x91-053, 1991.
Zhao, S., Pederson, N., D'Orangeville, L., HilleRisLambers, J., Boose, E., Penone, C., Bauer, B., Jiang, Y., and Manzanedo, R. D.: The International Tree-Ring Data Bank (ITRDB) revisited: Data availability and global ecological representativity, J. Biogeogr., 46, 355–368, https://doi.org/10.1111/jbi.13488, 2019.