the Creative Commons Attribution 4.0 License.
the Creative Commons Attribution 4.0 License.
 | 22 Sep 2020
Influence of temporally varying weatherability on CO2-climate coupling and ecosystem change in the late Paleozoic
Isabel P. Montañez
Yves Goddéris
Cindy V. Looy
Neil P. Griffis
William A. DiMichele
Earth's penultimate icehouse period, the late Paleozoic ice age (LPIA), was a time of dynamic glaciation and repeated ecosystem perturbation, which was under conditions of substantial variability in atmospheric pCO2 and O2. Improved constraints on the evolution of atmospheric pCO2 and O2∕CO2 ratios during the LPIA and its subsequent demise to permanent greenhouse conditions are crucial for better understanding the nature of linkages between atmospheric composition, climate, and ecosystem perturbation during this time. We present a new and age-recalibrated pCO2 reconstruction for a 40 Myr interval (∼313 to 273 Ma) of the late Paleozoic that (1) confirms a previously hypothesized strong CO2–glaciation linkage, (2) documents synchroneity between major pCO2 and O2∕CO2 changes and compositional turnovers in terrestrial and marine ecosystems, (3) lends support for a modeled progressive decrease in the CO2 threshold for initiation of continental ice sheets during the LPIA, and (4) indicates a likely role of CO2 and O2∕CO2 thresholds in floral ecologic turnovers. Modeling of the relative role of CO2 sinks and sources active during the LPIA and its demise on steady-state pCO2 using an intermediate-complexity climate–carbon cycle model (GEOCLIM) and comparison to the new multi-proxy CO2 record provides new insight into the relative influences of the uplift of the Central Pangean Mountains, intensifying aridification, and increasing mafic rock to granite rock ratio of outcropping rocks on the global efficiency of CO2 consumption and secular change in steady-state pCO2 through the late Paleozoic.
- Article
(7280 KB) - Full-text XML
-
Supplement
(1666 KB) - BibTeX
- EndNote


Earth's penultimate and longest-lived icehouse period (340 to 290 Ma) occurred under the lowest atmospheric CO2 concentrations of the last half-billion years (Foster et al., 2017) and, potentially, the highest atmospheric pO2 of the Phanerozoic (Glasspool et al., 2015; Krause et al., 2018; Lenton et al., 2018). Anomalous atmospheric composition, along with 3 % lower solar luminosity (Crowley and Baum, 1992), may have primed the planet for a near-miss global glaciation (Feulner, 2017). Notably, Earth's earliest tropical forests assembled and expanded during this icehouse period (the late Paleozoic ice age; LPIA), leading to the emergence of large-scale wildfire. Paleotropical terrestrial ecosystems underwent repeated turnovers in composition and architecture, culminating in the collapse of wetland (coal) forests throughout tropical Pangea at the close of the Carboniferous (Cleal and Thomas, 2005; DiMichele, 2014), possibly promoting the diversification and ultimate dominance of amniotes (Pardo et al., 2019). In the marine realm, global rates of macroevolution (origination, extinction) decreased, in particular among tropical marine invertebrates, and genera with narrow latitudinal ranges went extinct at the onset of the LPIA (Stanley, 2016; Balseiro and Powell, 2019; Powell, 2005). Low marine macroevolutionary rates continued through to the demise of the LPIA in the early Permian (Stanley and Powell, 2003; McGhee, 2018).
Reconstructions of late Paleozoic atmospheric pCO2 document a broad synchroneity between shifts in CO2, glaciation history, glacioeustasy, and restructuring of paleotropical biomes, underpinning the hypothesized greenhouse gas forcing of sub-million-year glacial–interglacial cycles (Montañez et al., 2016) and the terminal demise of the LPIA (Montañez et al., 2007). For late Paleozoic pCO2 (and pO2) reconstructions, however, broad intervals of low temporal resolution and significant uncertainties limit the degree to which mechanistic linkages between atmospheric composition, climate, and ecosystem change can be further evaluated. Moreover, the potential impact of large-magnitude fluctuations in atmospheric O2∕CO2, which characterized the late Paleozoic, on the biosphere has been minimally addressed. On longer timescales (≥106 years), the relative roles of potential CO2 sinks and sources on secular changes in late Paleozoic atmospheric CO2, and in turn as drivers of glaciation and its demise, remain debated (McKenzie et al., 2016; Goddéris et al., 2017; Macdonald et al., 2019).
Here, we present a multiproxy atmospheric pCO2 reconstruction for a 40 Myr interval (313 to 273 Ma) of the late Paleozoic, developed using new leaf-fossil-based estimates integrated with recently published age-recalibrated Pennsylvanian pCO2 estimates of 105-year resolution (Montañez et al., 2016) and re-evaluated fossil-soil-based (paleosol) CO2 estimates for the early Permian (Montañez et al., 2007). Our new multiproxy record offers higher temporal resolution than existing archives while minimizing and integrating both temporal and CO2 uncertainties. This pCO2 reconstruction, together with new O2∕CO2 estimates of similar temporal resolution, permits refined interrogation of the potential links between fluctuations in atmospheric composition, climate shifts, and ecosystem events through Earth's penultimate icehouse period. Moreover, comparison of the new 40 Myr CO2 record with modeled steady-state pCO2 and seawater 87Sr∕86Sr over the same interval provides new insight into the relative importance and evolution of CO2 sinks and sources during late Paleozoic glaciation and its turnover to a permanent greenhouse state.
A brief account of the methods is presented here; more details are presented in the Supplement. Primary data generated or used in this study are deposited in the Dryad Digital Repository (Richey et al., 2020) and can be accessed at https://doi.org/10.25338/B8S90Q.
2.1 Sample collection and analysis
To build the pCO2 record, 15 plant cuticle fossil species/morphotypes were used, which were collected from eight localities in Illinois, Indiana, Kansas, and Texas, USA, including four well-studied Pennsylvanian interglacial floras (Sub-Minshall (313 Ma; Šimůnek, 2018), Kinney Brick (305.7 Ma; DiMichele et al., 2013), Lake Sarah Limestone (303.7 Ma; Šimůnek, 2018), and Hamilton Quarry (302.7 Ma; Hernandez-Castillo et al., 2009a, b, c); Figs. 1a and S2–4 in the Supplement; Richey et al., 2020; https://doi.org/10.25338/B8S90Q). The Pennsylvanian estimates were integrated into a previously published pCO2 reconstruction (313 to 296 Ma; Montañez et al., 2016) of 105-year resolution built using pedogenic carbonates and wet-adapted seed fern fossils (Figs. 2b, S1b). The Permian estimates were integrated with previously published latest Carboniferous and early Permian pedogenic carbonate-based CO2 estimates (Montañez et al., 2007), derived from paleosols from successions throughout Arizona, New Mexico, Oklahoma, Texas, and Utah, USA (Fig. 1a; Richey et al., 2020; https://doi.org/10.25338/B8S90Q). The pedogenic carbonates and leaf cuticle fossils span a broad region of Pennsylvanian and early Permian tropical Euramerica (Fig. 1b). Ages of samples used in Montañez et al. (2007, 2016) were recalibrated and assigned uncertainties using the latest geologic timescale (Ogg et al., 2016) and biostratigraphic and geochronologic controls (see the Supplement; Richey et al., 2020; https://doi.org/10.25338/B8S90Q).
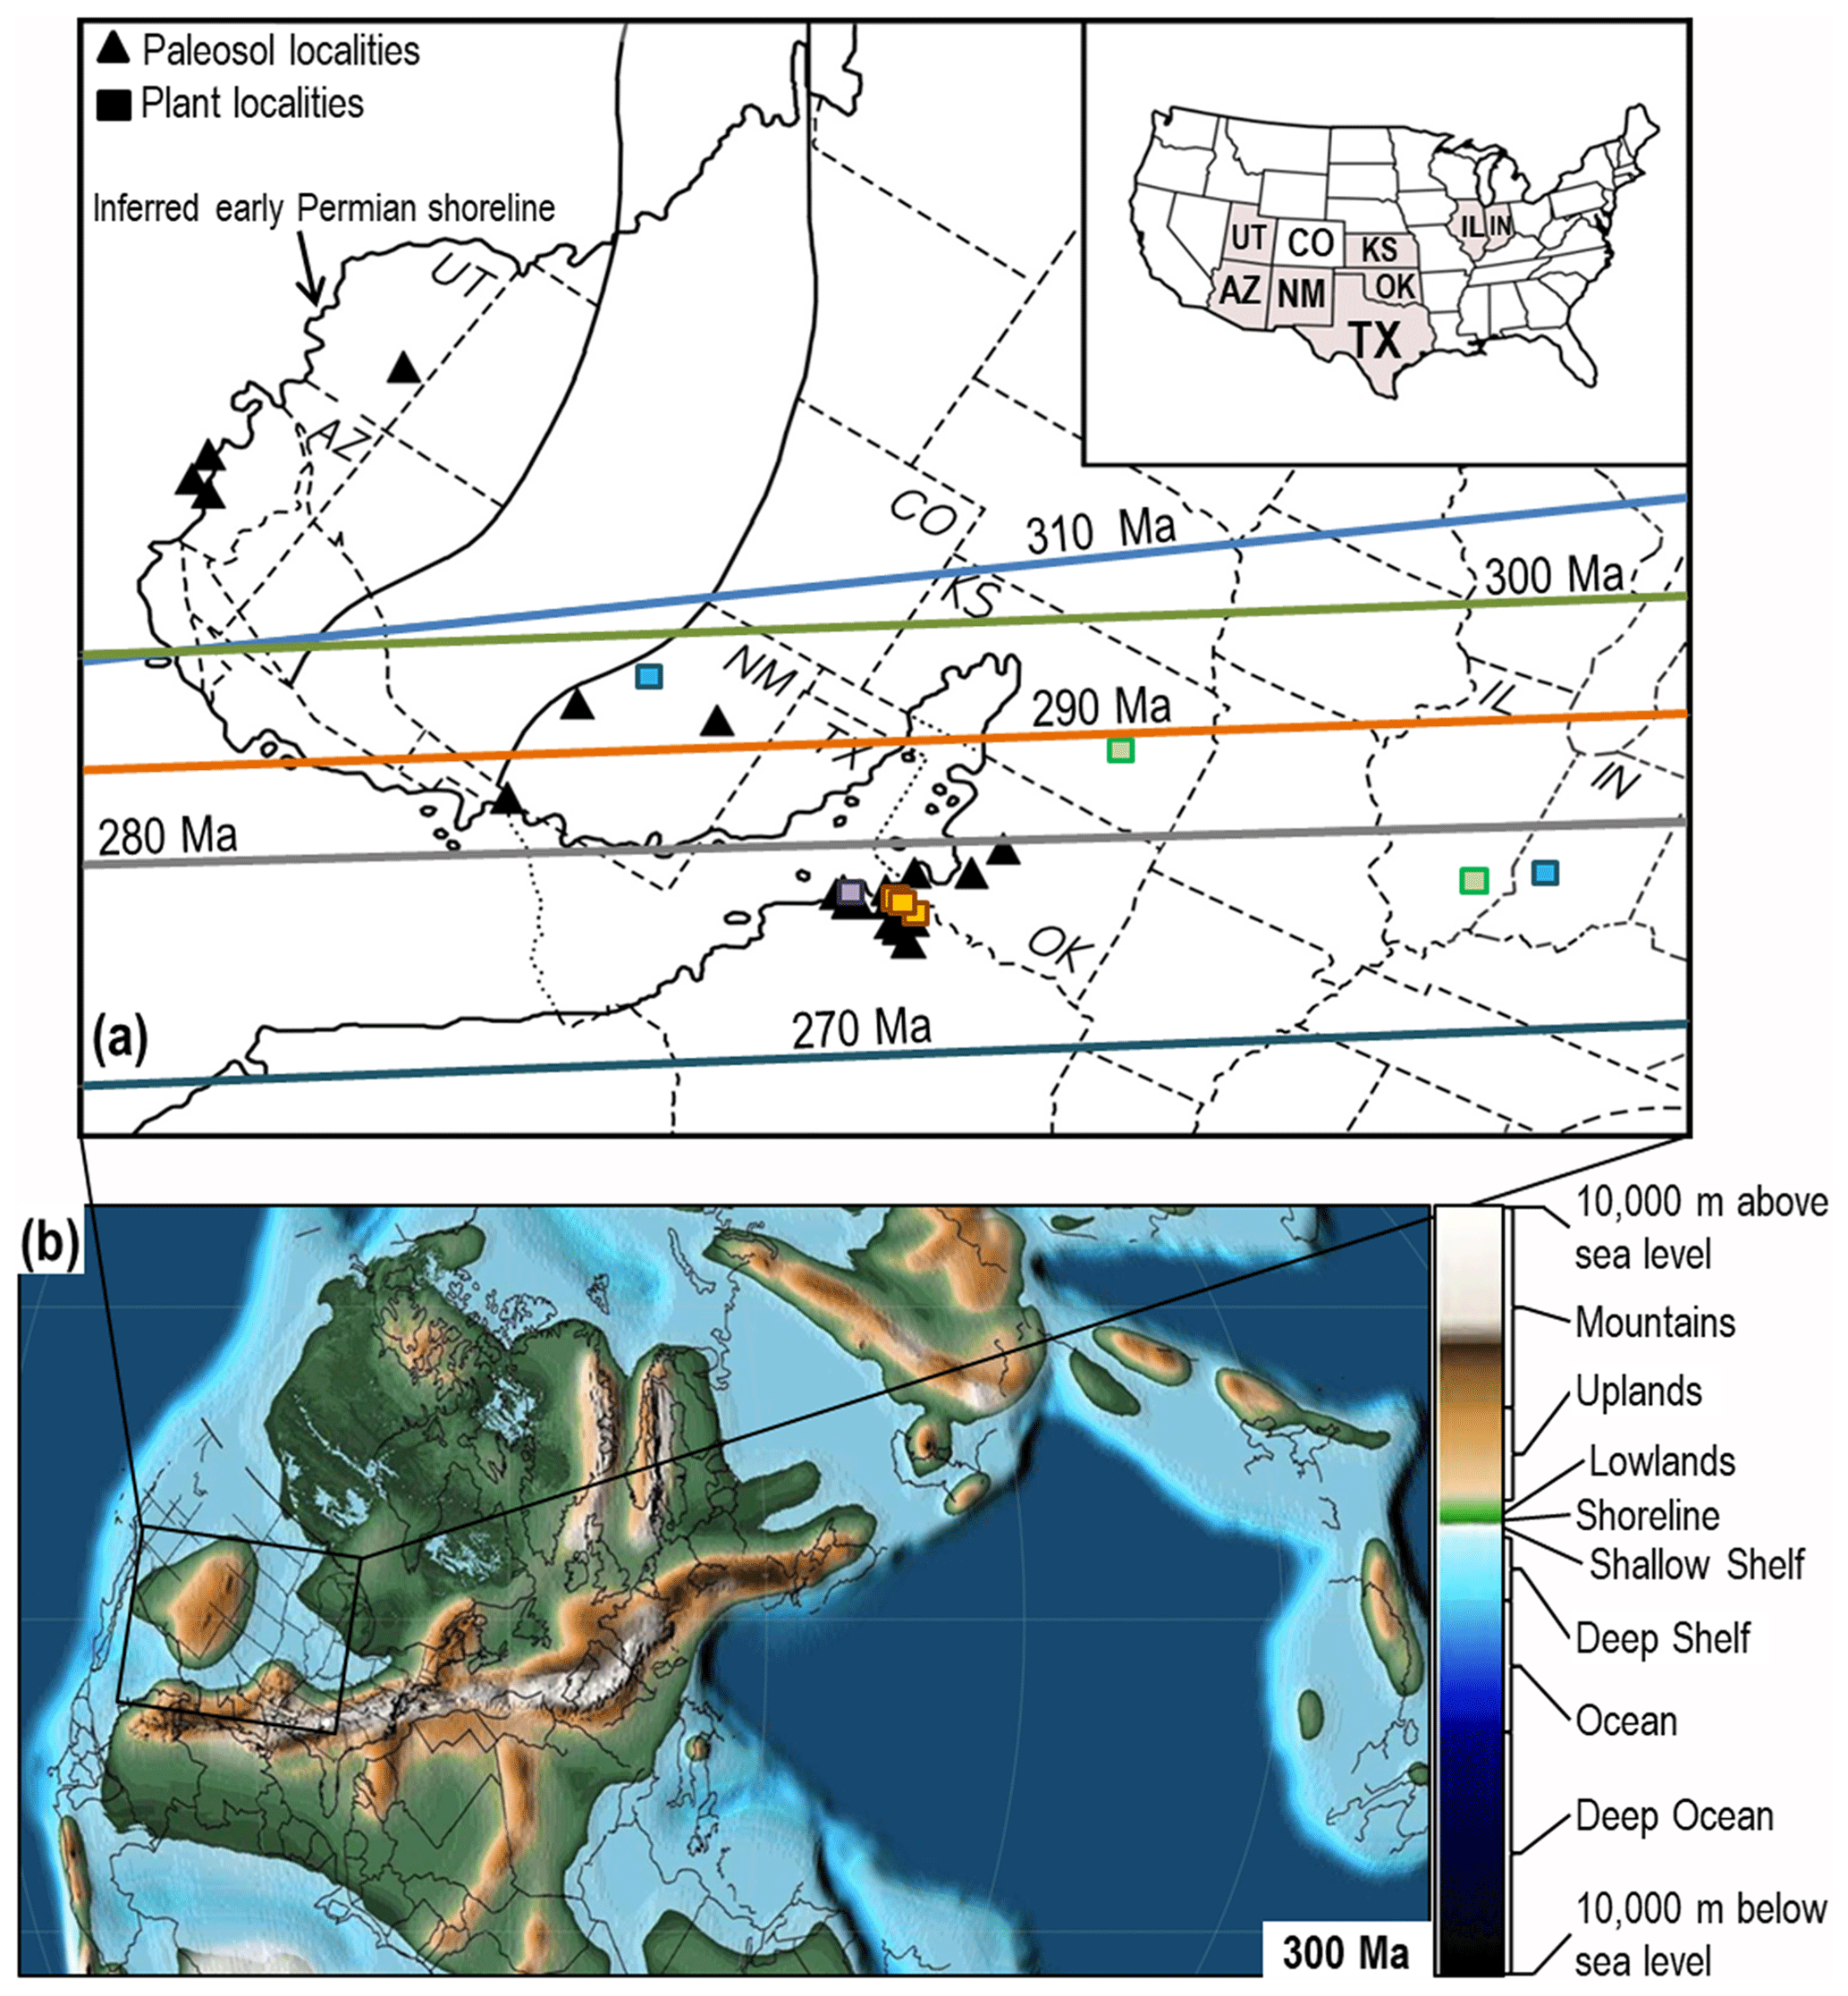
Figure 1Sampling localities in present-day and late Paleozoic geographic context. (a) Sampling locations of pedogenic carbonates and plant fossils and their position relative to the late Pennsylvanian (310 and 300 Ma) and early Permian (290 to 270 Ma) equator (the colors of the flora localities correspond to that of the paleo-equator at that time). White band traversing NM (New Mexico) and CO (Colorado) is the area of inferred shortening during the Laramide and Sevier orogenies. Map modified from Montañez et al. (2007). (b) Earliest Permian (290 Ma) paleogeography (Scotese, 2016); shading corresponds to paleotopographic/bathymetric scale on the right. Inset box is the location of panel (a).

Figure 2Late Paleozoic CO2 estimates. (a) New and revised (Montañez et al., 2007) pCO2 estimates, bootstrapped LOESS trend, and 75 % confidence interval (CI). Revised pedogenic carbonate-based estimates were made using δ13COOM (blue filled circles; n=28; Fig. S1) and δ13CPOM (open black circles; n=16; Fig. S1). Trend line is the median of 1000 bootstrapped LOESS analyses; dashed intervals indicate low data density and higher uncertainty. See Fig. S1 for error bars on individual CO2 estimates and the 95 % CI, and see Richey et al. (2020) (http://doi.org/10.25338/B8S90Q) for the full dataset. (b) Multiproxy CO2 record and individual estimates (this study and age-recalibrated values by Montañez et al., 2016; n=165), documented glacial deposits (Soreghan et al., 2019), occurrence of peats (coal), and best estimate of timing (and uncertainties) of magmatic episodes: 1a = Tarim 1, China (∼300 Ma); 1b = Tarim 2 (292–287, peak ∼290 Ma); 1c = Tarim 3 (284–272, peak ∼280 Ma; Chen and Xu, 2019); 2 = Skagerrak-centered, NW Europe (297.5±3.8 Ma; Torsvik et al., 2008); 3a = Panjal Traps, NW India (289±3 Ma; Shellnutt, 2018); 3b = Qiangtang Traps, Tibet (283±2 Ma; Zhai et al., 2013); 4 = Choiyoi, W Argentina (beginning 286.5±2.3 Ma, continuing for up to 39 Myr; Sato et al., 2015). Trend lines are as in (a); dashed intervals across the Carboniferous–Permian boundary (298.9 Ma) indicate overlap of the two LOESS trend lines.
Plant cuticle and organic matter occluded within pedogenic carbonates (OOM) were rinsed in 3 M HCl to remove carbonates and analyzed at the Stable Isotope Facility, University of California, Davis, using a PDZ Europa ANCA-GSL elemental analyzer interfaced to a PDZ Europa 20-20 IRMS (isotope-ratio mass spectrometer). External precision, based on repeated analysis of standards and replicates, is ‰. For Hamilton Quarry (HQ), all material was previously mounted on slides for taxonomic analysis (Hernandez-Castillo et al., 2009a, b, c). Because of this, biomarker δ13C values of bulk stratigraphic sediment samples were used (Richey et al., unpublished data; see the Supplement). HQ n-C27−31 n-alkane δ13C was analyzed using a Thermo Scientific GC Isolink gas chromatograph connected to a Thermo Scientific MAT 253 mass spectrometer. Standard deviation of n-alkane δ13C was ±0.3 ‰. For biomarker δ13C, a +4 ‰ correction was used to account for fractionation during biosynthesis (Diefendorf et al., 2015), and the standard deviation of all values was used as the uncertainty (1.6 ‰, which is five times the analytical precision).
2.2 Models
The MATLAB model Paleosol Barometer Uncertainty Quantification (PBUQ; Breecker, 2013), which fully propagates uncertainty in all input parameters, was used to derive pedogenic carbonate-based CO2 estimates (Figs. 2a, S1a). For each locality, paleosols of inferred different soil orders were modeled separately. We applied improved soil-specific values for soil-respired CO2 concentrations (S(z); Montañez, 2013) and the δ13C of organic matter occluded within carbonate nodules (δ13COOM; Fig. S5) as a proxy of soil-respired CO2 δ13C. For samples where OOM was not recovered, estimates were revised using PBUQ and the plant fossil organic matter δ13C used in Montañez et al. (2007) (δ13CPOM; Fig. S5). Because of the limited amount of carbonate nodules remaining after study by Montañez et al. (2007), δ13COOM was substituted for δ13CPOM for localities that occur in the same geologic formation, and a large error (±2 ‰) was used to account for the uncertainty in this approach. PBUQ model runs conducted in this study resulted in a small subpopulation of biologically untenable CO2 estimates (i.e., ≤170 ppm; Gerhart and Ward, 2010). To limit estimates below that threshold, two changes to the PBUQ MATLAB code were made (see the Supplement for details). All other input parameters remained unchanged from Montañez et al. (2007).
For cuticle fossil-based (Figs. S2–4) CO2 estimates (Figs. 2a, S1a), we utilized a mechanistic (non-taxon-specific) gas-exchange model (Franks et al., 2014). For some fossil cuticles, pore length (PL) was measured directly; for others, PL was inferred from guard cell length (GCL; Table S1 in the Supplement). Guard cell width was estimated via GCL using the prescribed gymnosperms and ferns scaler (0.6; Franks et al., 2014; Table S1).
For both stomatal- and pedogenic carbonate-based CO2 modeling, we calculated δ13C of atmospheric CO2 using the carbonate δ13C record generated from an open-water carbonate slope succession (Naqing succession, southern China; Buggisch et al., 2011), contemporaneous estimates of mean annual temperature (Tabor and Montañez 2005; Tabor et al., 2013), and temperature-sensitive fractionation between low-Mg calcite and atmospheric CO2 (Romanek et al., 1992; Eq. S2; Table S1).
We used the spatially resolved intermediate-complexity GEOCLIM model (Goddéris et al., 2014) to quantitatively evaluate how steady-state atmospheric CO2 may have responded to changes in weatherability and the relative influences of different CO2 sources and sinks. The spatial distributions of the mean annual runoff and surface temperature were calculated offline for five time increments (Goddéris et al., 2017), covering the period of interest, and for various atmospheric CO2 levels using the 3-D ocean–atmosphere climate model FOAM and the approach as described in Donnadieu et al. (2006). GEOCLIM uses generated lookup tables to calculate steady-state atmospheric CO2 for a given continental configuration and to account for paleogeography and relief. Although the GEOCLIM model does not include an explicit surface distribution of lithology, the weathering rate of mafic rocks and continental granites are calculated using different methods, and the impact of physical erosion on granite weathering is accounted for (Goddéris et al., 2017). For mafic surfaces, a simple parametric law is used, linking the surface of the considered grid cell, local runoff, and mean annual temperature to the local mafic weathering rate. The calibration of the GEOCLIM model was performed at the continental-scale by tuning the parameters of the model so that 30 % of the alkalinity generated by the weathering of silicates originates from the weathering of mafic rocks (GEOCLIM REG; Dessert et al., 2001; Goddéris et al., 2014).
2.3 O2∕CO2 ratio
O2∕CO2 ratios (Fig. 3a) were calculated using the 10 000 CO2 estimates produced by our modeling and combined with O2 estimates obtained using geochemical mass balance and biogeochemical models (Krause et al., 2018; Lenton et al., 2018). Unreasonably high O2∕CO2 ratios (generally those that correspond to CO2≲200 ppm) were removed from the resulting O2∕CO2 dataset.
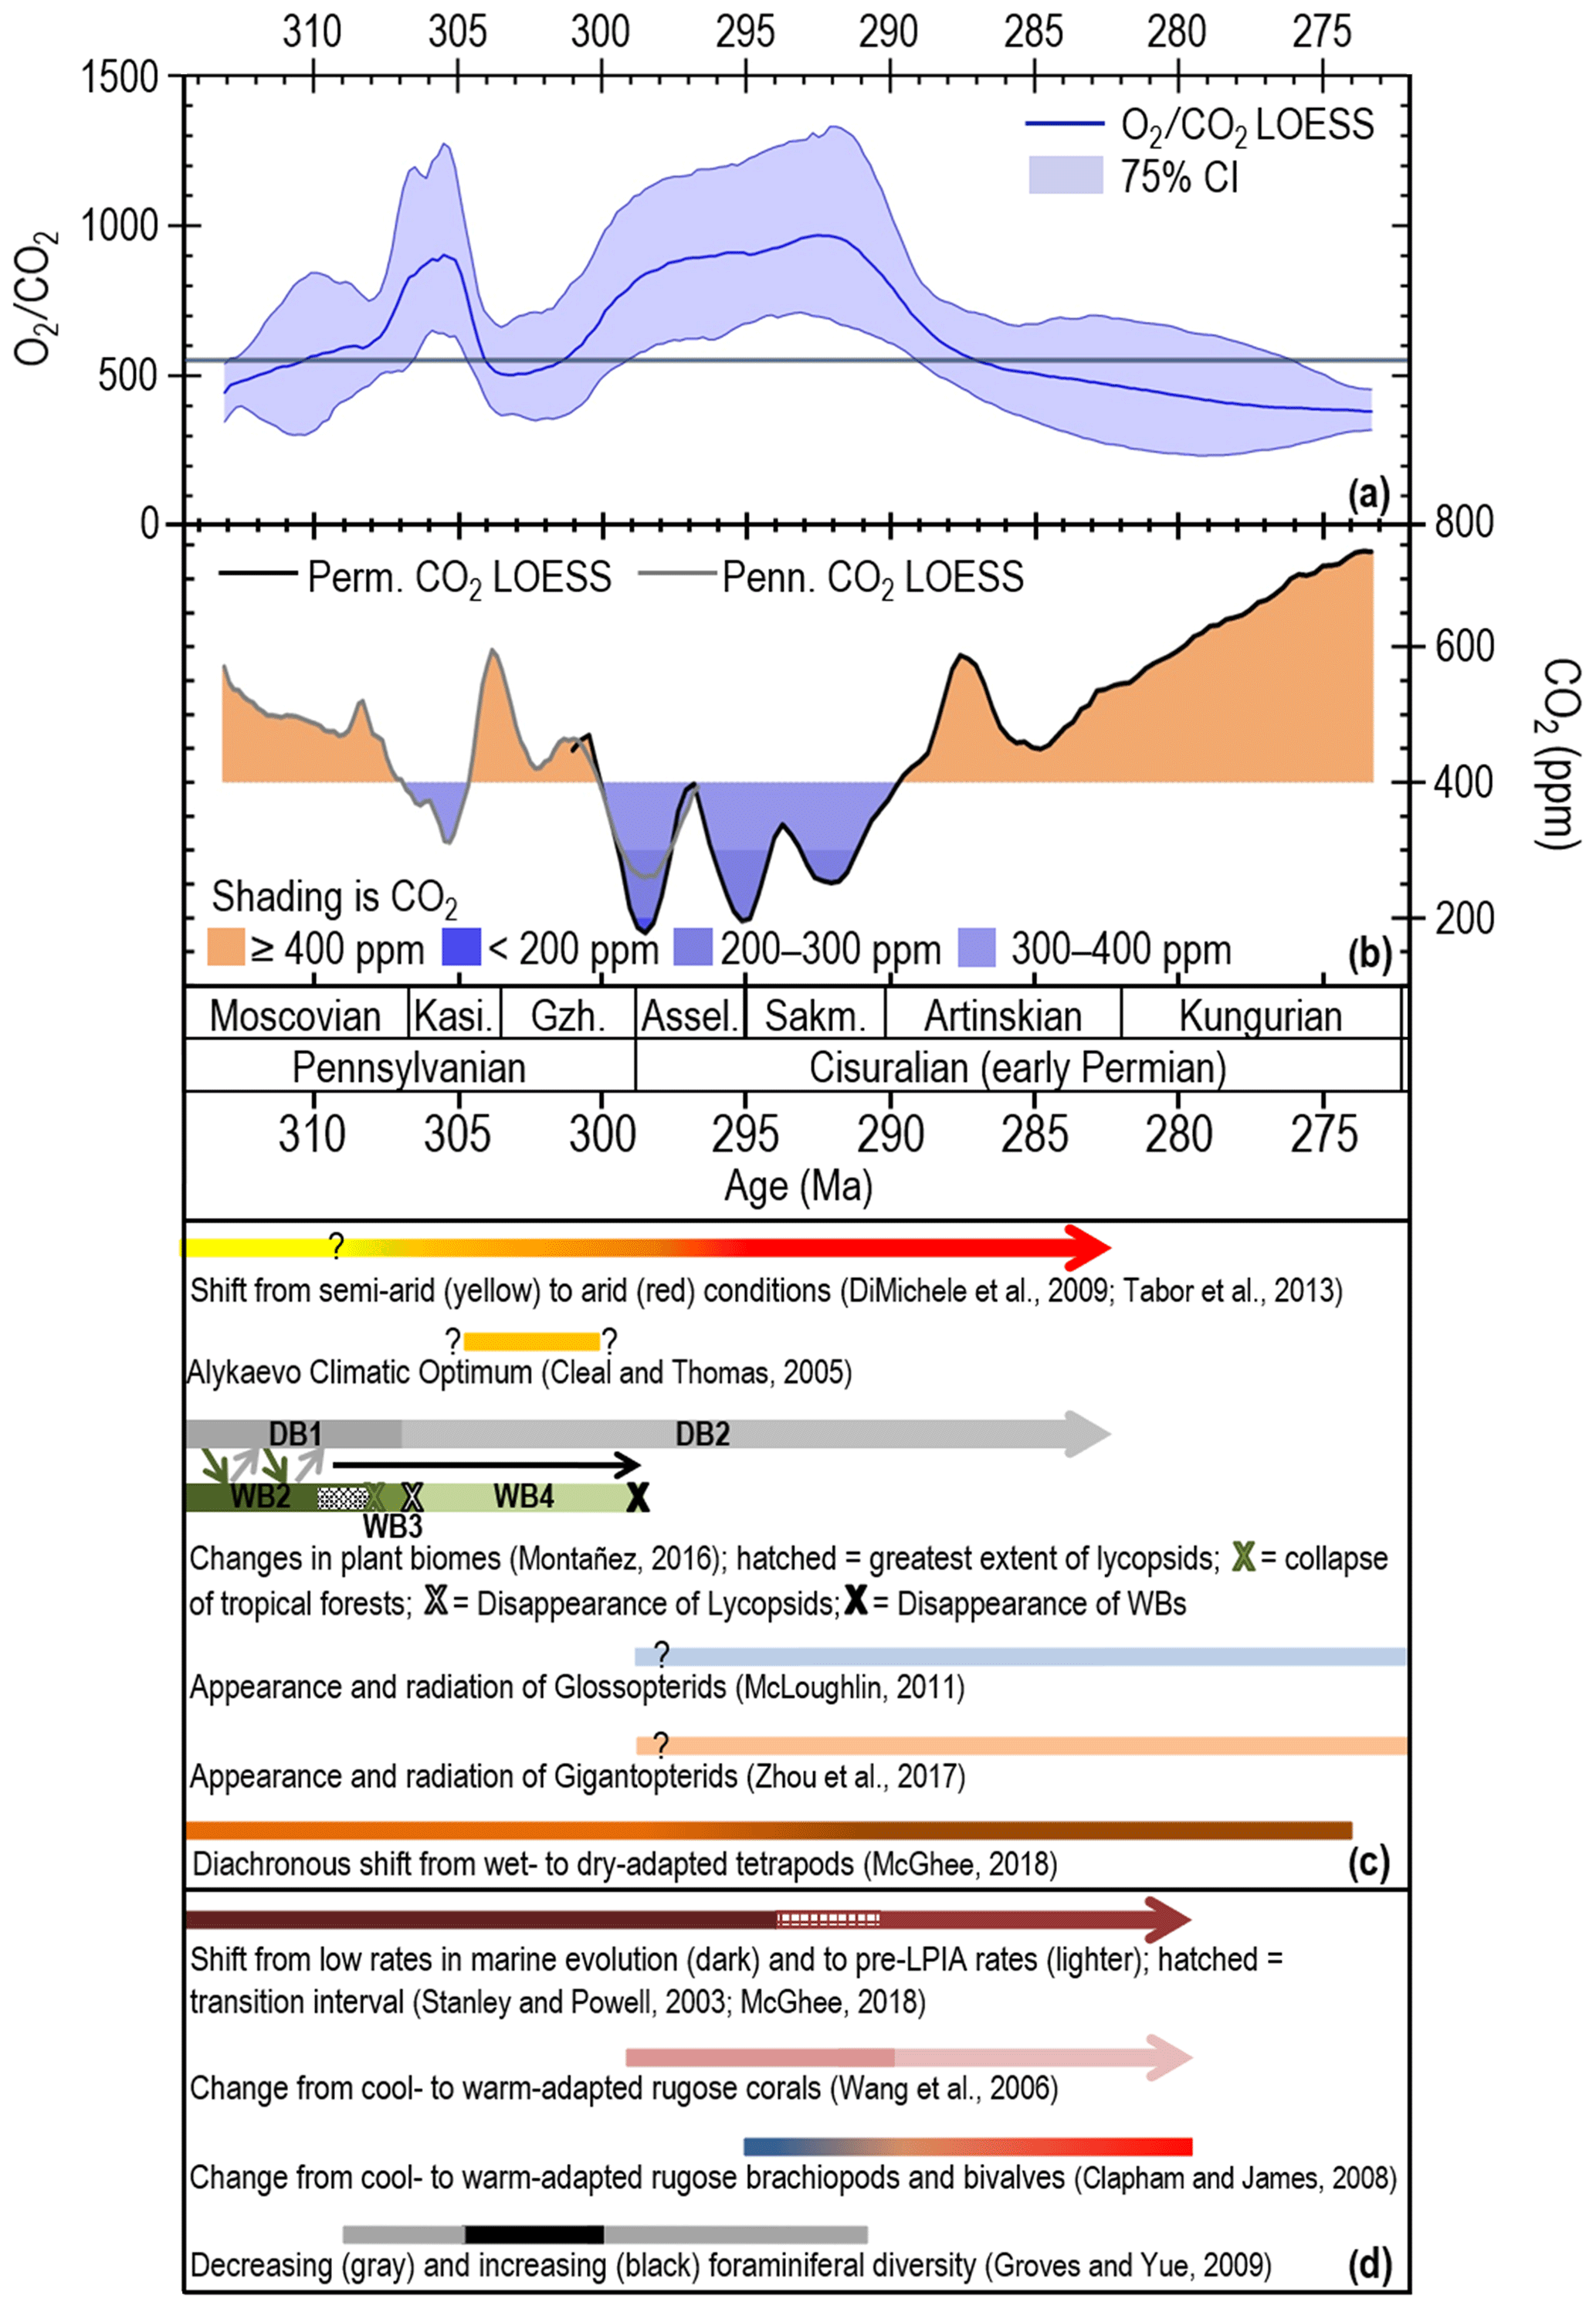
Figure 3Late Paleozoic O2∕CO2 ratios and pCO2, as well as a comparison to environmental and biotic events. (a) O2∕CO2 estimates made using CO2 values of this study and averaged time-equivalent modeled O2 (Krause et al., 2018; Lenton et al., 2018). Trend line is the median of 1000 bootstrapped LOESS analyses; gray horizontal line is present-day O2∕CO2. (b) Bootstrapped Pennsylvanian and Permian LOESS analyses (from Fig. 2a), with significant overlap across the Pennsylvanian–Permian boundary interval. The shading indicates CO2 above (orange) and below (shades of blue) the mean value for the 16×106-year record through the late Pennsylvanian reported in Montañez et al. (2016). Temporal changes in terrestrial (c) and marine (d) ecosystems. Plant biomes from Montañez (2016): wetland biome (WB) 2 (i.e., cordaitalean/lycopsid co-dominance), WB 3 (i.e., lycopsid dominated with cordaitaleans decreasing and tree ferns increasing in occurance and prominence), WB 4 (i.e., tree fern dominated), dryland biome (DB) 1 (i.e., cordaitalean dominated), DB 2 (i.e., walchian dominated). Diagonal arrows indicate 105-year glacial–interglacial shifts between wet- and dry-adapted floras.
2.4 Statistical analyses
We utilize a bootstrap approach that assesses uncertainties of both CO2 (or O2∕CO2) and age. Each age uncertainty was truncated to ensure no overlap in locality ages, which were constrained by their relative stratigraphic position to one another (Richey et al., 2020; https://doi.org/10.25338/B8S90Q). The 10 000 modeled CO2 estimates were trimmed by 28 % to remove anomalously high or low values. The means of the resulting 7200 CO2 estimates were compared to the trimmed means of the 10 000 CO2 estimates to ensure that trimming did not alter the central tendency of the data. Locality ages were resampled and perturbed, assuming that the individual ages and truncated age uncertainties represent the mean and standard deviation of the ages. Similarly, the trimmed CO2–O2∕CO2 datasets were resampled with replacement, and the resampled ages and estimates were used to build 1000 resampled datasets. Each resampled dataset was subjected to LOESS analysis (0.25 smoothing), and the median and 95 % and 75 % confidence intervals of the LOESS analyses were calculated (Figs. 2, 3a, b, S1). The Pennsylvanian and Permian portions of the record were analyzed separately due to differing data density, with significant overlap across the Pennsylvanian–Permian boundary interval (Figs. 2b, 3b, S1b).
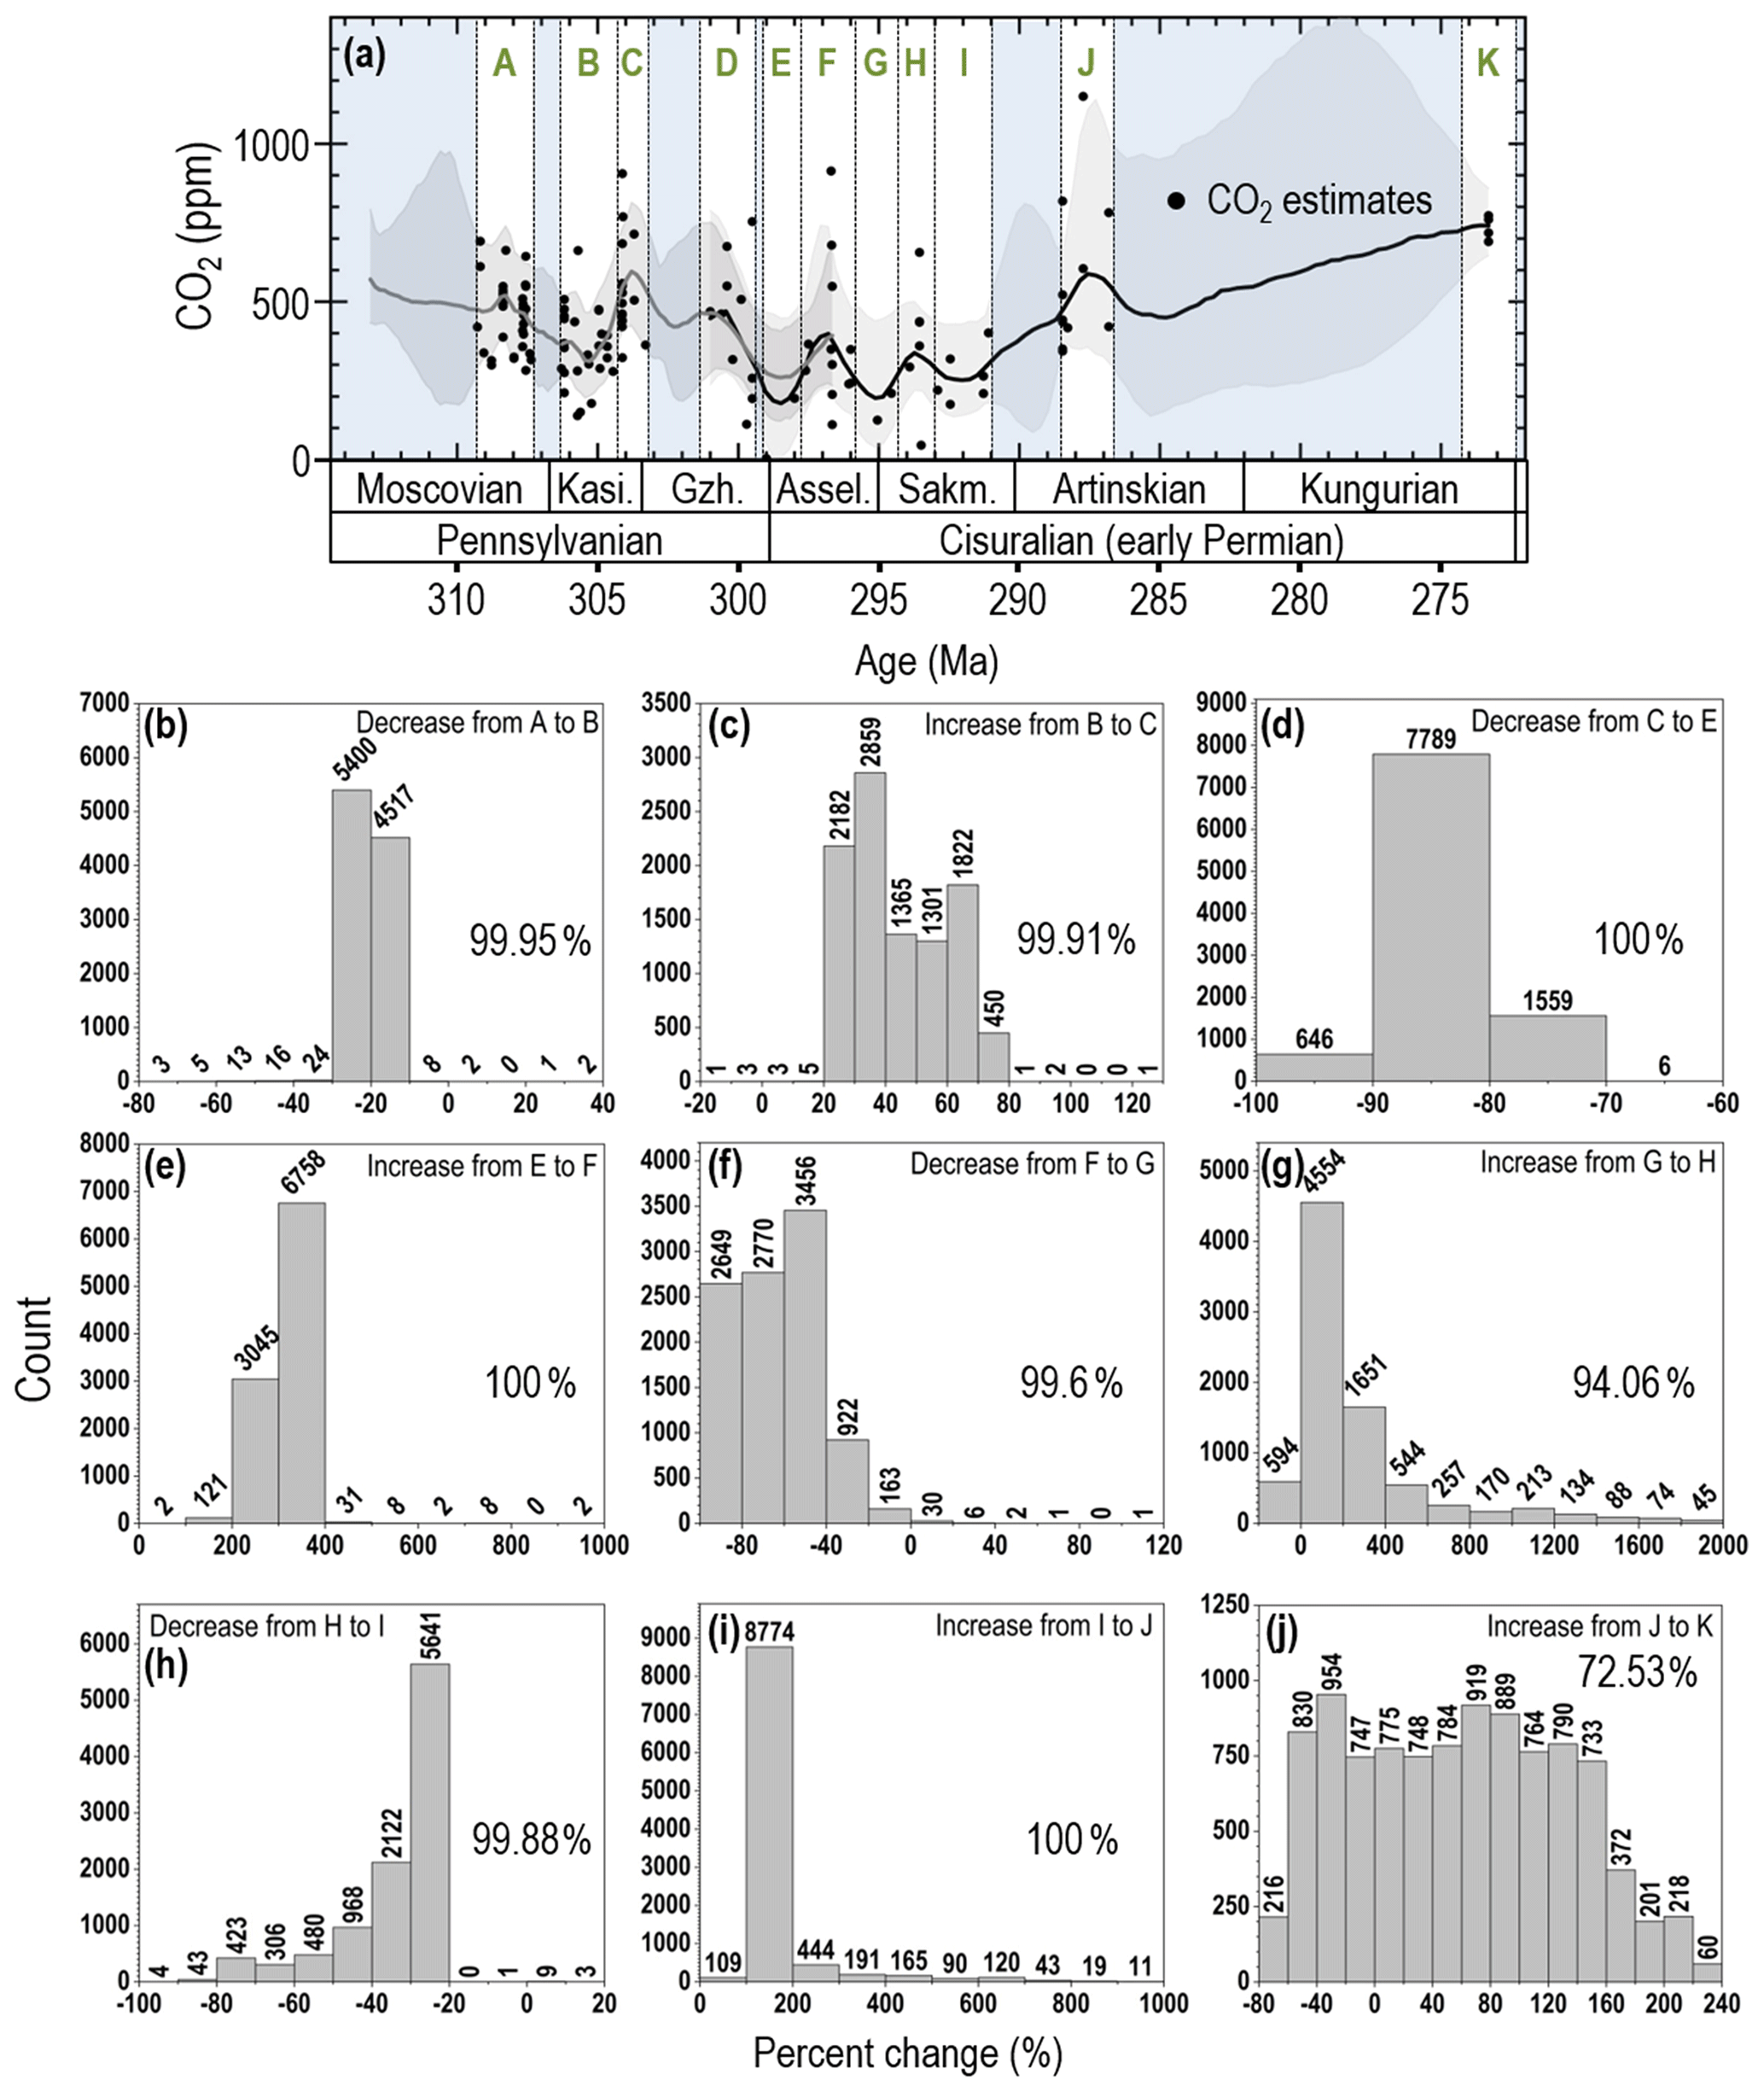
Figure 4Analysis of the statistical significance of short-term CO2 fluctuations. (a) White intervals (A–K) delineate short-term highs or lows in the CO2 LOESS trend used for binning (n=11; bins ±0.5 to 1 Myr resolution). Raw stomatal-based and pedogenic carbonate-based CO2 estimates generated by Monte Carlo analysis (10 000 model runs per CO2 estimate; data in shaded intervals were not used). CO2 between bins was compared by calculating the mean of the lowest through to the 10 000th (highest) Monte Carlo values for all CO2 points in each bin and comparing the means of the two bins sequentially. (b–h) Histograms of the percent change between each of the 10 000 Monte Carlo means of the adjacent bins. Negative values indicate a decrease in value between bins and positive values an increase. The number above each histogram bar is the “percent change” values represented in each bar. The percent of the 10 000 model runs that confirm a given increase or decrease in the LOESS trend is indicated by the % value shown on the right side of each panel. See Sect. 2 for further details.
To test the validity of short-term fluctuations in the LOESS CO2 trend, we undertook further analysis of the raw Monte Carlo data produced by PBUQ and the mechanistic stomatal model in several short-term increments. Eleven short-term highs or lows (A–K in Fig. 4a) were designated and used to form bins of ±0.5 to ±1 Myr. Within an individual bin, each shown “bootstrapped” CO2 data point is the trimmed mean of 10 000 Monte Carlo model runs. The Monte Carlo model runs for each data point were sorted from lowest to highest CO2 value, and the lowest CO2 values for each data point within the bin were averaged. This averaging was repeated sequentially for each of the 10 000 values creating 10 000 means for each bin (n=11). To evaluate whether a visually perceived rise or fall (e.g., A to B decrease or B to C increase) is statistically valid, the 10 000 means of two adjacent bins were compared sequentially with one another (i.e., the mean of the lowest values of one bin was compared to the mean of the lowest values of the adjacent bin) in order to calculate a percent change for each of the 10 000 model runs, resulting in 10 000 percent changes for each set of adjacent bins. The percent of the 10 000 comparisons that confirm an increase or decrease between bins is reported (Fig. 4b–j) as a measure of the statistical significance of the short-term fluctuations in CO2 concentration visually observed on the LOESS trend.
Revised early Permian mineral-based CO2 estimates define a substantially narrower range (45–1150 ppm; Fig. 2a) than previous estimates (175–3500 ppm) made using the same pedogenic carbonate sample set (Montañez et al., 2007) while maintaining the original trends and including fewer photosynthetically untenable concentrations (≤170 ppm; Gerhart and Ward, 2010). New early Permian cuticle-based estimates show a high level of congruence by locality and broad plant functional type, falling within the revised pedogenic carbonate-based CO2 range (Figs. 2a, S1a). Similarly, stomatal-based estimates for the four Pennsylvanian interglacial floras are within the estimated pCO2 range defined by the pedogenic carbonates (Figs. 2a, S1a) and late-glacial wetland plant fossils (Montañez et al., 2016). Notably, the newly integrated record confirms elevated atmospheric CO2 concentrations (482 to 713 ppm ( ppm)) during Pennsylvanian interglacials in comparison to pCO2 during glacial periods (161 to 299 ppm ( ppm)), with interglacial durations on the order of thousands to tens of thousands of years given the inferred eccentricity scale duration of the glacial–interglacial cycles (Horton et al., 2012; Montañez et al., 2016; Fielding et al., 2020).
Overall, the new pCO2 record documents declining CO2 through the final 13 Myr of the Pennsylvanian into the earliest Permian, including a 2.5 Myr interval (307 to 304.5 Ma) of minimum CO2 values (less than 400 ppm to as low as 200 ppm) in the Kasimovian (Figs. 2b, S1b). Declining pCO2 in the late Carboniferous coincides with rising atmospheric pO2 (Glasspool et al., 2015; Krause et al., 2018; Lenton et al., 2018); thus, O2∕CO2 ratios in the interval of minimum Pennsylvanian CO2 are nearly 2 times those of present-day values (∼515; gray line in Fig. 3a). A 10 Myr CO2 nadir (∼180 to <400 ppm) characterizes the first two stages (Asselian and Sakmarian; 298.9 to 290.1 Ma) of the early Permian, overlaps with the peak occurrence of glacial deposits in the LPIA (gray boxes in Fig. 2b; Soreghan et al., 2019), and defines a second interval of anomalously high O2∕CO2 ratios (up to 970 ppm; Fig. 3a). A subsequent long-term rise (∼17 Myr) in pCO2 to peak values up to ∼740 ppm defines the remainder of the early Permian and coincides with multiple episodes of extensive and long-lived volcanism (Fig. 2b; Torsvik et al., 2008; Zhai et al., 2013; Sato et al., 2015; Shellnutt, 2018; Chen and Xu, 2019). This pCO2 rise is also coincident with a decline in O2∕CO2 to below present-day values (Fig. 3a, b).
Short-term intervals of rising or falling CO2 in the LOESS trend, within dating uncertainties, coincide with a brief but acute glaciation in the Kasimovian and with repeated deglaciations in south-central Gondwana in the early Permian (Griffis et al., 2018, 2019), as well as with restructuring of marine and terrestrial ecosystems (Fig. 3b–d). The statistical significance of these short-term rises and falls in CO2 was evaluated by analyzing the raw Monte Carlo estimates (10 000 model runs per data point shown on the LOESS trend) generated by the aforementioned CO2 models (Breecker, 2013; Franks et al., 2014), from which the bootstrapped CO2 estimates for 11 increments of short-term rise or fall were subsequently determined (Fig. 4a). The analysis of the Monte Carlo CO2 estimates within these short-term intervals of rising or falling CO2 indicates that 72.5 % to 100 % of the data confirm a visually observed increasing or decreasing trend (Fig. 4).
4.1 Declining CO2 through the main phase of the LPIA
Atmospheric CO2 concentrations in the final 13 Myr of the Carboniferous (the Pennsylvanian portion of our record) are generally higher than those of the earliest Permian (Fig. 2b) and overall decline through the later part of the Carboniferous. Higher pCO2 in the latter half of the Pennsylvanian is compatible with the hypothesized waning of large early-to-middle Pennsylvanian glaciers in the late Pennsylvanian (cf. Fielding et al., 2008), including widespread terminal deglaciation in a major glacial depocenter in south-central Gondwana (Parana Basin, Brazil) toward the close of the Carboniferous (Griffis et al., 2018, 2019). Declining pCO2 toward a nadir in the earliest Permian is also consistent with a renewed increase in the geographic distribution of glacial deposits in Gondwana beginning in the late Pennsylvanian and peaking in the earliest Permian (Fig. 2b; Soreghan et al., 2019).
A tectonically driven increase in CO2 consumption via a strengthening of the silicate weathering (“climate stabilizing”) negative feedback (Walker et al., 1981; Berner and Caldeira, 1997) has been proposed as the driver of the Pennsylvanian decline in pCO2 (Goddéris et al., 2017). The strength of the negative feedback varies with the degree of “weatherability” (i.e., the susceptibility to weathering), which, in turn, is predominantly controlled by the intensity of the hydrologic cycle (precipitation and surface runoff), with further influence by surface temperature and vascular plants (Dessert et al., 2001; Donnadieu et al., 2004; West, 2012; Maher and Chamberlain, 2014; Caves et al., 2016; Ibarra et al., 2016). Uplift of the Central Pangean Mountains (CPM) through the Pennsylvanian would have increased weatherability in the tropics by inducing orographic precipitation and creating steeper slopes (Goddéris et al., 2017), thus providing a greater supply of fresh mineral surfaces and enhanced surface runoff with longer fluid travel paths (cf. Maher and Chamberlain, 2014). Consequently, CPM-induced increased weatherability and CO2 consumption would have enhanced the global efficiency of weathering and created a tighter coupling between CO2 and climate at this time (cf. Maher and Chamberlain, 2014; Caves et al., 2016).
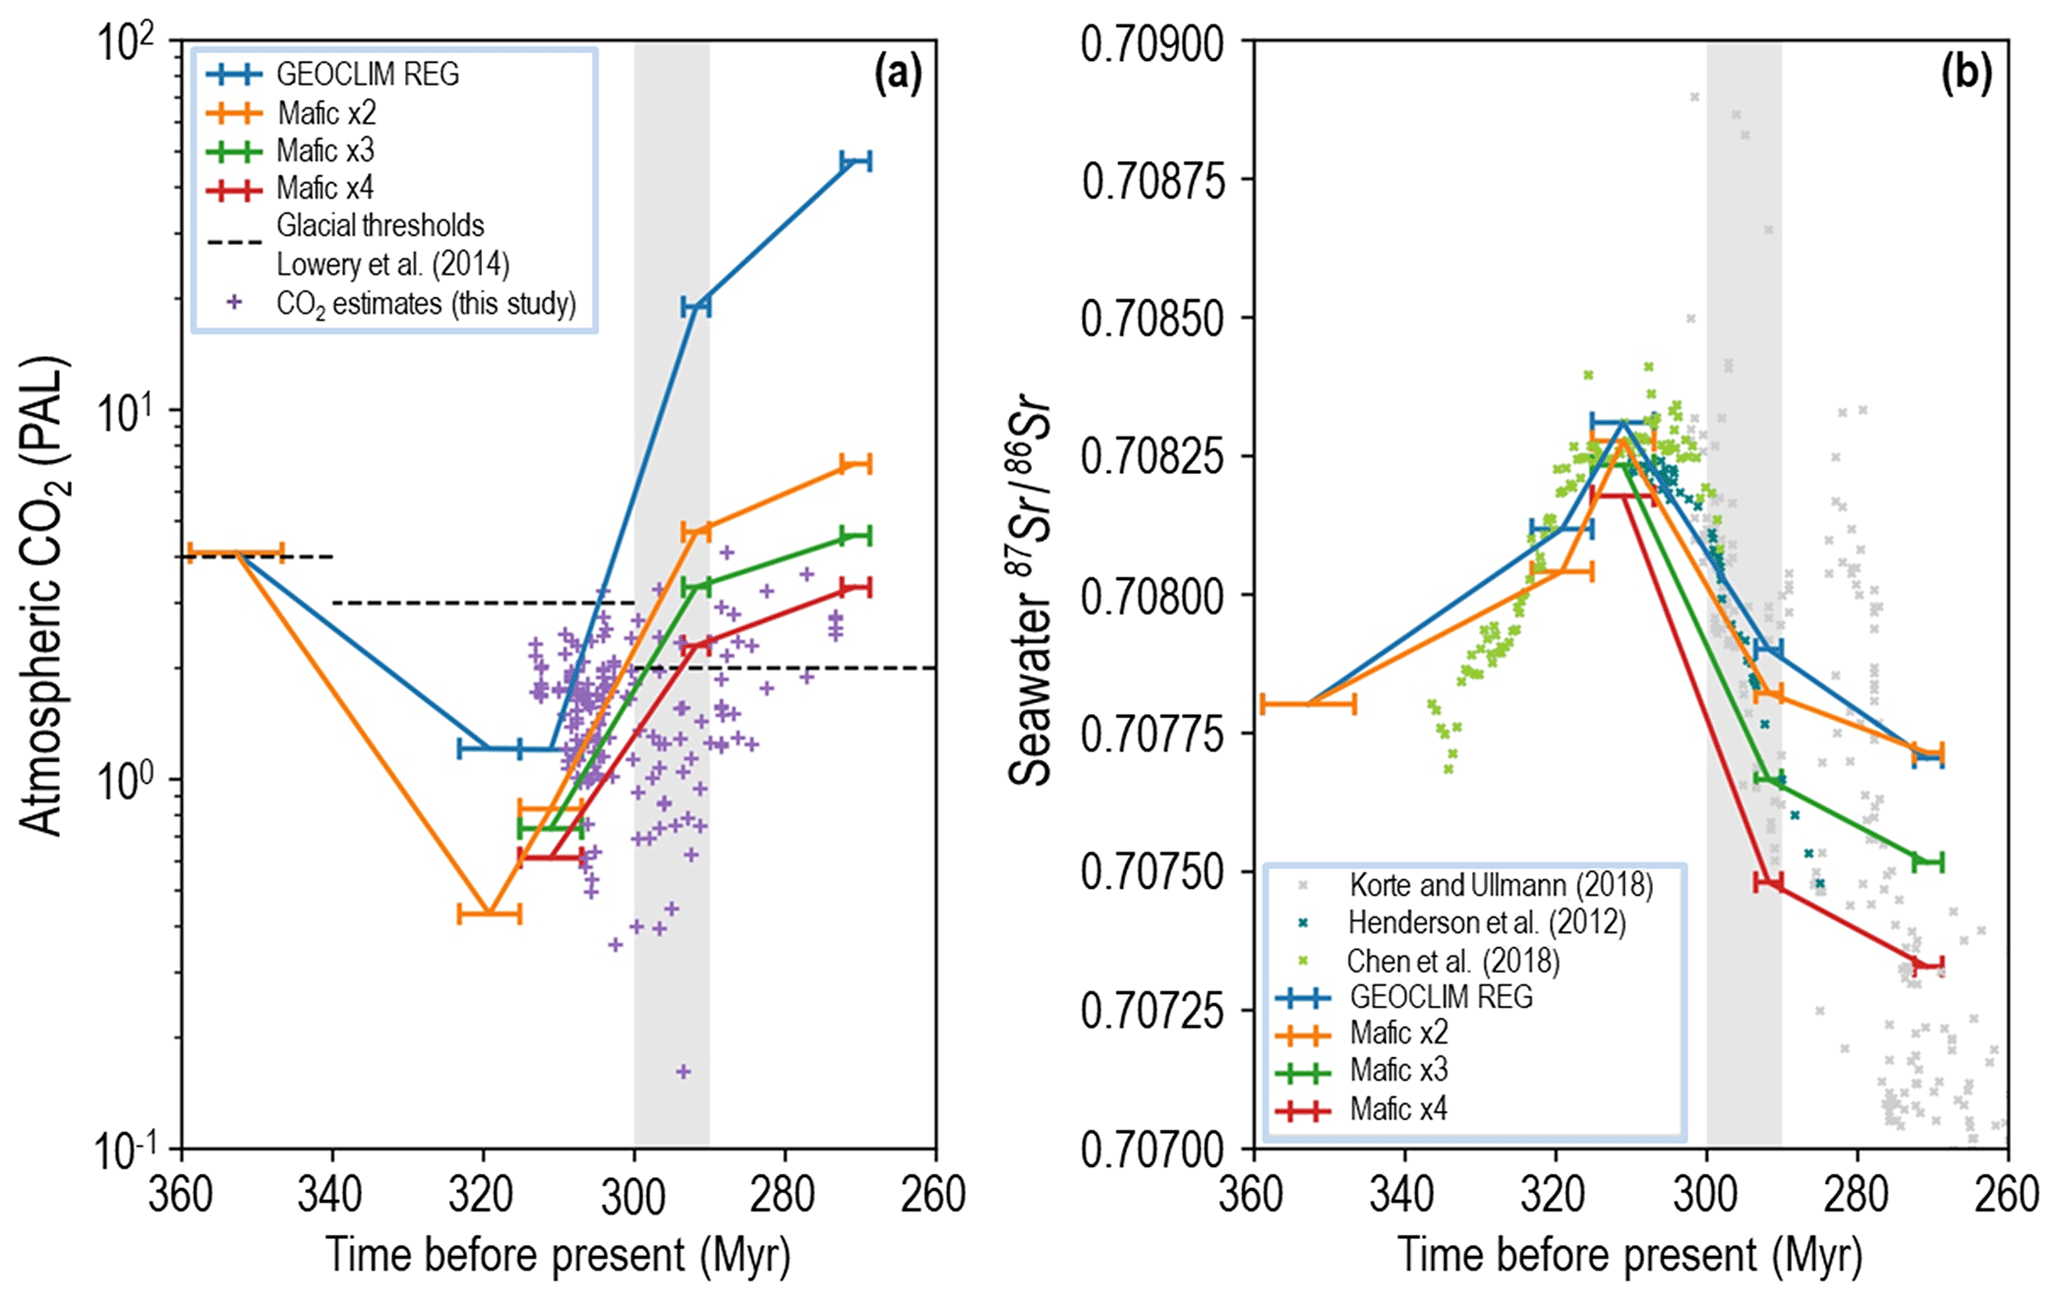
Figure 5Carboniferous through early Permian modeled (GEOCLIM) steady-state atmospheric CO2 and seawater 87Sr∕86Sr for different surface areas of mafic rocks available for silicate weathering. In the model, maximum geographic extent and altitude (5000 m) of the CPM is reached in the Moscovian (320 Ma), with altitude decreasing to 3000 m at 290 Ma and 2000 m at 270 Ma. (a) Simulated (color lines) and proxy pCO2 estimates (purple crosses, this study) are shown. Horizontal error bars on the colored lines represent the temporal uncertainty for simulated pCO2 estimates. CO2 thresholds for continental ice sheet initiation (360–340 Ma = 1120 ppm; 340–300 Ma = 840 ppm; 300–260 Ma = 560 ppm from Lowry et al., 2014) decrease in response to equatorward drift of Gondwana, favoring an overall reduction in ice sheet size through time. The reference surface area of outcropping mafic rocks (GEOCLIM REG) maintains steady-state atmospheric CO2 below the ice initiation threshold from 350 to ∼304 Ma. Steady-state atmospheric CO2 for a 2-fold, 3-fold, or 4-fold increase in outcropping area of mafic rocks remains below the ice initiation threshold (560 ppm) up to ∼300 Ma, crossing over at progressively later times in the early Permian. Threshold crossover of steady-state CO2 at ∼290 Ma for a 4-fold increase in mafic rock exposure coincides with the termination of the 10 Myr CO2 nadir (gray vertical bar; both panels). (b) Seawater 87Sr∕86Sr modeled for the same set of varying surface areas of outcropping mafic rocks and 87Sr∕86Sr values of well-preserved biogenic calcites (gray X's) and conodont bioapatites (green and blue X's). Horizontal error bars on the colored lines represent the temporal uncertainty for modeled seawater 87Sr∕86Sr.
We model a Himalayan-type mountain range (an analog for the CPM) using GEOCLIM, with the model parameterized such that 30 % of the alkalinity generated by silicate weathering originates from weathering of mafic rocks. This is referred to as the “reference” continental silicate weathering mineral assemblage or GEOCLIM REG. That modeling indicates steady-state CO2 concentrations (blue lines in Fig. 5a) that are well below the middle-to-late Carboniferous (340 to 300 Ma) threshold for initiation of continental ice sheets (840 ppm; Lowry et al., 2014). A hypothesized primary influence of the CPM on CO2 consumption through increased weatherability is further supported by the coincidence of modeled seawater and marine proxy 87Sr∕86Sr values that define a plateau of peak radiogenic values that is sustained for 15 Myr of the late Carboniferous (318 to 303 Ma; Fig. 5b). The proxy-based seawater 87Sr∕86Sr plateau has been long interpreted to record exposure and weathering of uplifted and metamorphosed crustal rocks of the CPM that had radiogenic Sr isotope compositions (Chen et al., 2018, 2020). Additionally, the burial of substantial organic matter as peat in swamp environments prone to preservation (ultimately as coal) during the Pennsylvanian would have partitioned global CO2 consumption between silicate weathering and organic carbon burial, further driving steady-state pCO2 lower (D'Antonio et al., 2019; Ibarra et al., 2019). Our modeling, however, assumes a constant pre-Hercynian solid Earth degassing through the study interval, and it does not account for increased magmatic CO2 during Hercynian arc-continent collision and potential widespread eruptive volcanism in the late Carboniferous (Soreghan et al., 2019), both of which could have increased steady-state CO2.
Short-term fluctuations in pCO2 are superimposed on the long-term decline through the latter portion of the Carboniferous. These short-term fluctuations have been confirmed as statistically significant (99.9 % to 100 % of estimates; Fig. 4b–d) and coincide with major environmental and biotic events. The brief interval of minimum pCO2 (an average of ∼300 ppm but as low as 180 ppm) in the late Carboniferous (Kasimovian stage, 307 to 304.5 Ma; Fig. 3b) coincides with a short-lived but acute glaciation (306.5 to 305 Ma) recorded by prominent valley incision and large-scale regression recorded by cyclothemic successions in the US Appalachian Basin and Midcontinent basin, as well as Donets Basin, Ukraine (Belt et al., 2011; Eros et al., 2012; Montañez et al., 2016). Significant and repeated restructuring of wetland forests throughout tropical Euramerica, involving quantitative changes in floral composition and dominance, occurred during this 2.5 Myr pCO2 minimum (and O2∕CO2 maximum; Fig. 3a–c). Before the short-term pCO2 low, Euramerican tropical forests had expanded to their maximum aerial extent ( km2) under CO2 concentrations of ∼500 ppm (Moscovian stage, Fig. 3b). The aerial extent of these forests dropped by half (green X in Fig. 3c; Cleal and Thomas, 2005) coincident with the decline in pCO2 and near doubling of O2∕CO2 (Fig. 3a, b). Moreover, within this pCO2 low (Fig. 3b), arborescent lycopsids of the wetland forests went extinct throughout Euramerica (white X in Fig. 3c) and seasonally dry tropical floras shifted from cordaitalean dominance to walchian dominance (∼307–306.8 Ma; Fig. 3c; DiMichele et al., 2009; Falcon-Lang et al., 2018). These restructuring events occurred at or proximal to CO2 falling below 400 ppm, supporting a previously hypothesized but untested CO2 threshold for the Pennsylvanian ecologic turnovers (Fig. 3b, c; Beerling et al., 1998; Beerling and Berner, 2000; Montañez et al., 2016). In the oceans, foraminiferal diversity decreased substantially during the Kasimovian pCO2 low with the loss of ∼200 species (∼58 % of all taxa; first gray bar in Fig. 3d; Groves and Yue, 2009), presumably due to decreasing seawater temperatures.
The interval of CO2 minima was terminated by a rapid rise across the Kasimovian–Gzhelian boundary (303.7 Ma) to CO2 concentrations above 600 ppm (Figs. 2b; S1b). The short-term interval of elevated pCO2 (304 to 302.5 Ma) is coincident with a ∼1.5 ‰ decline in seawater δ13C (Grossman et al., 2008; Chen et al., 2020), which is compatible with a decline in the CO2 sink provided by terrestrial organic C (peats) burial (gray bar in Fig. 2b) and∕or a peak in pyroclastic volcanism between ∼310 and 301 Ma (Soreghan et al., 2019). This period of increased pCO2 overlaps with the Alykaevo Climatic Optimum (orange bar in Fig. 3c), defined by the invasion of tropical Euramerican vegetation into the Rufloria-dominated midlatitude Angaran floral province (Cleal and Thomas, 2005). Terminal deglaciation in south-central Gondwana (Parana Basin, Brazil), U–Pb dated to between ∼302 and 298 Ma (Cagliari et al., 2016; Griffis et al., 2018), may have been linked to the late Pennsylvanian interval of elevated CO2, although this requires further testing (Figs. 2b, 3b). Conversely to the Kasimovian CO2 low, a significant change in global diversity of foraminifera involving a doubling of species occurred during this subsequent period of elevated CO2 and presumed increase in seawater temperatures (black bar in Fig. 3d; Groves and Yue, 2009).
4.2 An early Permian CO2 nadir
Atmospheric pCO2 dropped substantially across the Carboniferous–Permian boundary (i.e., 298.9 Ma) to a 10 Myr interval (300–290 Ma) of the lowest concentrations (175 to <400 ppm) of the 40 Myr record (Fig. 2b). The CO2 nadir, which spans the Asselian and Sakmarian stages, coincides with renewed glaciation and maximum ice sheet extent, marking the apex of LPIA glaciation (Fig. 2b; Fielding et al., 2008; Isbell et al., 2012; Montañez and Poulsen, 2013; Soreghan et al., 2019), as well as with a large-magnitude eustatic fall archived in paleotropical successions worldwide (Koch and Frank, 2011; Eros et al., 2012). Widespread glacial expansion temporally linked to this interval of lowest overall pCO2 argues for CO2 as the primary driver of glaciation rather than recently proposed mechanisms, such as the influence of the closing of the Precaspian Isthmus (Davydov, 2018) or a decrease in the radiative forcing resulting from increased atmospheric aerosols by explosive volcanism at this time (Soreghan et al., 2019). The very low greenhouse radiative forcing associated with this low CO2 interval would have been amplified by 2.5 % lower solar luminosity (Crowley and Baum, 1992), reduced transmission of shortwave radiation (Poulsen et al., 2015) by the high pO2 atmosphere of the early Permian (Krause et al., 2018; Lenton et al., 2018), and by increased atmospheric aerosols at this time (Soreghan et al., 2019).
The 10 Myr pCO2 nadir raises a paradox as to what was the primary CO2 sink(s) at the time given that the CO2 sinks of the Pennsylvanian were no longer prevalent. This paradox reflects the waning denudation rates of the CPM by the early Permian (Goddéris et al., 2017), intensifying pantropical aridification, possibly driven by increasing continentality (yellow-to-red bar in Fig. 3c; DiMichele et al., 2009; Tabor et al., 2013) and the demise of the wetland tropical forests and associated loss of peats before the close of the Carboniferous (black-to-gray bar in Fig. 2b; Hibbett et al., 2016). In turn, surface runoff would have been inhibited and the supply of fresh silicate minerals decreased, thus lowering overall weatherability. Atmospheric CO2 under the influence of these environmental factors should have equilibrated in the earliest Permian at a new higher steady-state level, even if solid Earth degassing did not increase (cf. Gibbs et al., 1999), thus raising a paradox. If volcanism was increasing by this time (Fig. 2b and associated references; Soreghan et al., 2019), then this paradox is even greater.
Two mechanisms have the potential to resolve this paradox. The first, referred to as a delayed climate-controlled capacitor (Joshi et al., 2019), leads to a multi-million-year delay between the timing of peak orogenic uplift and maximum chemical weathering potential and CO2 drawdown due to substantial differences in chemical weathering rates during the different phases of an orogenic cycle. In their study, the highest intensity of chemical weathering and capacity for CO2 consumption occurs when mountains have been somewhat denuded rather than during peak uplift, reflecting the disproportionate influence of runoff temperature over hydrology and erosion on weathering potential. Notably, the coupled climate and geochemical modeling of the late Paleozoic ice age by Joshi et al. (2019) yields an evolution of simulated pCO2 over the period of uplift and denudation of the CPM that corresponds to both absolute CO2 concentrations and the magnitude of change over this period (∼320 to 290 Ma). That said, in Joshi et al. (2019), the physical erosion parameter is not dependent on climate but rather is defined by the prescribed altitude. Thus, physical erosion is an external forcing in their model. The absence of runoff dependence for physical erosion (as is the case for GEOCLIM) and the strong dependence of weathering on temperature may be the trigger for their simulated delay between maximum uplift and the highest intensity of CO2 consumption by silicate weathering. In GEOCLIM, the dependence of physical erosion on runoff does not allow for millions of years delay between maximum uplift of the CPM and lowest simulated pCO2. Further study is needed to interrogate the influence of this approach on the results.
The second mechanism, proposed here, is a substantial shift in the ratio of mafic-to-granite rocks available for weathering from the latest Carboniferous to the early Permian. This reflects the doubling or greater increase in weatherability of mafic mineral assemblages over granitic assemblages (Gaillardet et al., 1999; Dessert et al., 2003; Ibarra et al., 2016), thus enhancing weathering efficiency and CO2 drawdown and creating a tighter coupling between CO2 and climate. In turn, with tighter coupling between CO2 and climate, the global silicate weathering flux needed to maintain homeostatic balance in the carbon cycle for a given scenario can be attained at a lower pCO2 level.
Macdonald et al. (2019) hypothesized that increased weatherability provided by the exhumation of ophiolites along the ∼10 000 km long Hercynian arc-continent suture zone, primarily situated in the paleotropics, was capable of lowering pCO2 below the ice initiation threshold in the Carboniferous (i.e., Pennsylvanian), thus instigating the late Paleozoic ice age. Here, we used the GEOCLIM model to, first, interrogate this Carboniferous hypothesis further and, second, to evaluate the potential of increased weatherability provided by increasing the ratio of outcropping mafic rocks to granite rocks available for weathering, as the predominant driver of the early Permian CO2 nadir. Figure 5 illustrates the influence of a successive increase in the surface area of outcropping mafic rocks beginning with the reference continental silicate mineral assemblage (GEOCLIM REG), which was used to evaluate the influence of Pennsylvanian uplift of the CPM to an up to 4-fold increase in the outcropping of mafic rocks. In the GEOCLIM context, the weathering of mafic rocks is dependent on the surface of each grid cell (and on the associated local runoff and air temperature) multiplied by a calibration constant. Increasing the exposure area of mafic rocks is mathematically equivalent to multiplying by the calibration constant.
Between 300 and 290 Ma, when predominant Pennsylvanian CO2 sinks were lost (terrestrial organic C burial) or waning (decreased precipitation and denudation rates of the CPM), modeled steady-state atmospheric CO2 was maintained at or below the CO2 threshold for initiation of continental ice sheets (560 ppm; Lowry et al., 2014) when the surface area of outcropping mafic rocks was greater than 2-fold that of GEOCLIM REG (Fig. 5a). Conversely, steady-state CO2 rises well above the glacial threshold (to 3500 pm) for the reference continental silicate rock assemblage (Fig. 5a). Although volcanism remained geographically extensive through the 10 Myr CO2 nadir (Soreghan et al., 2019), the impact on atmospheric CO2 would have been short lived (≤105 kyr; Lee and Dee, 2019) and eclipsed on the longer term by the increased weatherability provided by increased exposure of mafic rocks along the Hercynian arc-continent suture zone, lowering steady-state CO2 to, potentially, pre-volcanism levels (cf. Dessert et al., 2001).
Independent evidence for a substantial shift in the partitioning of silicate weathering to more mafic mineral assemblages in the earliest Permian exists in the late Paleozoic proxy-based seawater Sr isotope record, which documents a rapid (0.000043 Myr−1) and near-linear decrease in seawater 87Sr∕86Sr beginning in the latest Carboniferous (∼303 Ma) and continuing into the middle Permian (Fig. 5b; Chen et al., 2020). The simulated trends in seawater 87Sr∕86Sr for GEOCLIM REG (blue line on Fig. 5b) through a 2- to 4-fold increase in the area of exposed mafic rocks capture the rapid rise through the upper Carboniferous to peak values in the latter half of the Pennsylvanian and subsequent decline through the early Permian. The rapid rate of decline in proxy 87Sr∕86Sr values post-300 Ma, however, is best bracketed by simulated 87Sr∕86Sr for a 2- to 4-fold increase in mafic rock exposure. Moreover, the best fit of the simulated trends to the geochronologically well-constrained bioapatite data (blue and green crosses in Fig. 5b) suggests a progressive increase in mafic-to-granite ratio through the 10 Myr CO2 nadir. This finding, together with the hypothesized need (the aforementioned second mechanism) for minimally a 4-fold increase in mafic-rock outcropping in order to maintain CO2 concentrations below the ice initiation threshold for a sustained period longer than that of hysteresis (i.e., throughout the interval of minimum CO2 and apex of glaciation; Fig. 5), supports a change in weatherability through time. That is, the modeling results argue for a substantial increase in weatherability from the Carboniferous to early Permian driven by a compositional shift in outcropping rocks available for weathering from that of the reference continental silicate assemblage to one of higher mafic-to-granite ratio.
If peak ophiolite exhumation and maximum CO2 consumption by their weathering occurred in the late Carboniferous, thus initiating the LPIA (∼330 to 300 Ma) as has been suggested (Table S1 of Macdonald et al., 2019), then our modeling results suggest that a substantial increase in solid Earth degassing rate at this time would have been necessary. In our simulation, increasing the surface area of outcropping mafic rocks (2- to 4-fold) during the Pennsylvanian results in steady-state atmospheric CO2 levels approaching “Snowball Earth” conditions given other operating influences on weatherability and CO2 sequestration at the time and no change in degassing rate (Fig. S6). Such conditions are not compatible with proxy-inferred moderate surface conditions of the late Carboniferous (Montañez and Poulsen, 2013) and the radiation of forest ecosystems throughout the tropics (DiMichele, 2014). Rather, we hypothesize that the sustained CO2 nadir and expansion of ice sheets in the first 10 Myr of the Permian record a major reorganization of the predominant factors influencing weatherability in the tropics across the Carboniferous–Permian transition, in particular a substantial shift in the ratio of mafic-to-granitic rocks available for weathering.
Similar to the short-term fluctuations superimposed on the later Carboniferous long-term decline in CO2, two statistically significant (94 % to 100 % in Fig. 4e–h) short-term increases in pCO2 are superimposed on the early Permian nadir (Fig. 3b). The first (298 to 296 Ma) coincides, within age uncertainty, with a major deglaciation event in the Karoo (southern Africa) and Kalahari (Namibia) basins of south-central Gondwana (296.41 Ma Ma; Griffis et al., 2019). The second short-term rise in pCO2 (294.5 to 292.5 Ma) overlaps with the onset of widespread ice loss in several southern Gondwanan ice centers (Fig. 2b; Soreghan et al., 2019). This CO2–deglaciation link suggests that continental ice stability in the early Permian dropped substantially when pCO2 rose above ∼300 to 400 ppm and thus raises the question as to whether the ice sheet CO2 threshold was even lower than modeled (560 ppm; Lowry et al., 2014) during the earliest Permian.
Notably, the early Permian pCO2 minimum (Figs. 2b, S1b), as well as the associated anomalously high O2∕CO2 ratios (700 to 960; Fig. 3a), is an interval of major ecosystem changes. The geologically rapid and large-magnitude drop in pCO2 prior to and across the Carboniferous–Permian boundary interval (Figs. 2b, S1b) coincides with a permanent shift in plant dominance from swamp-community floras to seasonally dry vegetation (black X in Fig. 3c). That shift in plant dominance has been long attributed to intensification of an aridification trend that began in the mid-Pennsylvanian (yellow-to-red bar in Fig. 3c; DiMichele et al., 2009; Tabor et al., 2013). Analogous to the vegetation turnover and extinction during the Pennsylvanian CO2 minimum, this permanent shift to seasonally dry vegetation is coincident with the earliest Permian drop in pCO2 to concentrations below 400 ppm, suggesting a possible ecophysiological advantage of these plants over the wetland floral dominants that they replaced (Fig. 3a–c; cf., Wilson et al., 2017). The high water use efficiency of the seasonally dry plants would have made them water-stress tolerant and, in turn, would have amplified aridification through a modeled ∼50 % decrease in canopy-scale transpiration (Wilson et al., 2017, 2020). The extreme habitat restriction of wetland floras was particularly consequential for tetrapods, leading to the acquisition of terrestrial adaptions in crown tetrapods and the radiation and eventual dominance of dryland-adapted amniotes, possibly shaping the phylogeny of modern terrestrial vertebrates (Fig. 3c; Pardo et al., 2019).
Moreover, the CO2 decline at the Carboniferous–Permian boundary into the 10 Myr nadir and associated peak in O2∕CO2 also corresponds to the evolution and radiation of glossopterids and gigantopterids (McLoughlin, 2011; Zhou et al., 2017), with increasing vein density in the former (Fig. 3a–c; Srivastava, 1991). These plant groups had complex angiosperm-like venation (Melville, 1983; Srivastava, 1991), with gigantopterids having the only known pre-Cretaceous vessels in their stems (Li et al., 1996). The increased hydraulic capacity provided by these morphological characteristics would have conferred a significant ecological advantage to these plants under the low CO2, high O2, and elevated aridity conditions in which they evolved (cf. Gerhart and Ward, 2010; de Boer et al., 2016). In the oceans, a marked collapse in foraminiferal diversity with a notable fall in species to a minimum from a Pennsylvanian zenith (425 to 110 species; Fig. 3d, e; Groves and Yue, 2009) spanned the 10 Myr pCO2 nadir, analogous to the diversity drop during the Pennsylvanian low-CO2 interval.
4.3 CO2-forced demise of the LPIA
The 10 Myr CO2 nadir terminated at 290 Ma with the onset of a protracted CO2 rise that persisted to the highest levels of the record (∼740 ppm ()) by the close of the early Permian (Fig. 2b). The onset of this protracted CO2 rise overlaps with initiation of a period of large-magnitude magmatism (red bars in Fig. 2b). Widespread volcanism began around 297.4 Ma (±3.8 Ma) in northern Europe (Skagerrak-centered large igneous province), extending well into Germany (Rotliegend) (Torsvik et al., 2008; Käßner et al., 2019). The multistage Tarim magmatic episodes in China (292–272 Ma; with peaks at ∼290 and 280 Ma; Fig. 2b; Chen and Xu, 2019), were likely associated with large-magnitude CO2 emissions given that the magma, which distributed basalt (400 m thick) over a 2.5×10⁵ km2 region (Yang et al., 2013), intruded a thick succession of early Paleozoic marine carbonates (Gao et al., 2017). The Panjal Traps, NW India (289±3 Ma; Shellnutt, 2018), and the compositionally similar Qiangtang dikes (283±2 Ma; Fig. 2b; Zhai et al., 2013), albeit relatively small in extent, were an additional potential volcanic CO2 source, along with contemporaneous volcanism in Oman. Furthermore, protracted Choiyoi volcanism, which began at 286.5±2.3 Ma (Sato et al., 2015) and continued over ∼39 Myr in western Argentina, may have contributed substantial pulses of greenhouse gases in the early Permian (Spalletti and Limarino, 2017). Once each magmatic episode waned, however, the mafic-dominated magmatic deposits would have served as longer-term regional sinks, leading to increased global CO2 consumption (cf. Lee et al., 2015). Thus, for steady-state CO2 to have increased through the remainder of the early Permian, the relative influence of CO2 inputs must have outpaced that of these, and other, outputs (CO2 sinks).
Our modeled (GEOCLIM) steady-state CO2 for a 4-fold increase in outcropping of mafic rocks surpasses the ice-sheet initiation threshold at the termination of the CO2 nadir (∼290 Ma; red line in Fig. 5a) despite no change in solid Earth degassing. The fact that low CO2 concentrations could no longer be maintained, despite a 4-fold increase in mafic rock exposure, reflects overall intensifying aridification, denudation of the CPM, and a shift from dense forests to savanna-like vegetation in Euramerica at this time. However, given that the magmatic CO2 flux likely increased already by the earliest Permian (summarized in Fig. 2b), our model results indicate that maintaining low steady-state CO2 concentrations during the earliest Permian 10 Myr CO2 nadir would have required an increasingly greater proportion of mafic rock weathering over the reference continental silicate mineral assemblage of the Pennsylvanian, possibly well beyond a 4-fold increase.
A CO2-forced demise of the late Paleozoic ice age after 290 Ma is supported by the loss of continental ice from the main ice depocenters in south-central Gondwana by Ma (Griffis et al., 2018, 2019) and a 6-fold drop in documented glacial deposits overall between the Sakmarian and Artinskian stages (Fig. 2b; Soreghan et al., 2019). The long-term CO2 rise through the remainder of the early Permian coincided with substantial marine and terrestrial ecosystem perturbation (Fig. 3b–d; Chen and Xu, 2019). In the marine biosphere, the uniformly low rates of global macroevolution in marine organisms (brown bar in Fig. 3d) were reversed, and narrowly adapted and distributed genera reappeared, thus restoring marine ecosystems to their pre-LPIA rates (Stanley and Powell, 2003; Powell, 2005). Pennsylvanian rugose corals (pink bar in Fig. 3d) underwent a major turnover in composition to those that dominated until the end-Permian extinction, and cold-adapted marine bivalves and brachiopods turned over to warm-adapted forms synchronous with the onset of the long-term increase in pCO2 (290.1 Ma; blue to red bar across the Sakmarian–Artinskian boundary in Fig. 3d; Wang et al., 2006; Clapham and James, 2008). On land, the loss of pelycosaur families (three in the late Artinskian and four in the early Kungurian; Kemp, 2006) coincided with CO2 sustained at >500 ppm. By the close of the Kungurian and the time of highest CO2 (740 ppm), basal synapsids largely disappeared and were replaced by more derived therapsids, tetrapod diversity decreased significantly (Benton, 2012; McGhee, 2018), plant extinction rates reached a level comparable to that associated with the extinction of arborescent lycopsids in the early Kasimovian (Cascales-Miñana et al., 2016), and extinction and origination rates increased in fishes (Friedman and Sallan, 2012).
Glacial–interglacial climate cycles and large-scale glacioeustasy, as well as repeated ecosystem change analogous to that of the Pleistocene, characterized Earth's penultimate icehouse period in the late Paleozoic. The dynamic glaciation history of this icehouse period (the late Paleozoic ice age – LPIA) came to a close by the end of the early Permian with turnover to permanent greenhouse conditions. Thus, improved constraints on how atmospheric pCO2 evolved during the LPIA and its subsequent demise is crucial for better understanding the role of greenhouse gas forcing on Earth system processes during this time. The new and age-recalibrated pCO2 reconstruction presented here for a 40 Myr interval (∼313 to 273 Ma) of the late Paleozoic substantially refines existing Permian CO2 estimates and provides perhaps the highest temporal resolution protracted pCO2 record prior to the Cenozoic. The multiproxy record confirms the previously hypothesized CO2–glaciation linkage, including documenting the coincidence of a 10 Myr period of minimum pCO2 with inferred maximum ice extent during the earliest Permian. A long-term decline in pCO2 through the late Carboniferous period of glaciation, culminating in the earliest Permian CO2 nadir, lends support for a previously modeled progressive decrease in the CO2 threshold for continental ice sheets through the LPIA.
Our new pCO2 record provides the first stomatal-based evidence for elevated (up to 700 ppm) atmospheric CO2 concentrations during short-term (104-year) interglacials. Together with new O2∕CO2 estimates of similar temporal resolution to pCO2, the new atmospheric trends indicate a close temporal relationship to repeated ecosystem restructuring in the terrestrial and marine realms. In terrestrial ecosystems, the appearance and∕or rise to dominance of plants with physiological and anatomical mechanisms for coping with CO2 starvation and marked aridity correspond to drops in CO2 below 400 ppm (as low as ∼180 ppm), and O2∕CO2 ratios nearly doubled those of late Paleozoic background values. Similarly, decreasing rates of macroevolution and diversity in the low-latitude oceans corresponded to falling CO2 to below 400 ppm. These CO2–ecosystem relationships lead us to hypothesize that 400 ppm was an important threshold for ecosystem resilience during the late Paleozoic.
Modeling of steady-state pCO2 during the late Paleozoic using an intermediate-complexity climate–carbon cycle model (GEOCLIM) and comparison to the new multiproxy CO2 record provides new insight into the relative influences of uplift of the Central Pangean Mountains, intensifying aridification, and increasing mafic to granite ratio of outcropping rocks on the global efficiency of CO2 consumption and secular change in steady-state pCO2 through the late Paleozoic. The simulations confirm that, for the Carboniferous, enhanced weatherability and CO2 consumption provided by the influence of uplift on surface hydrology and erosion could have lowered atmospheric pCO2 well below the threshold for ice sheet initiation. Increasing the availability of mafic rocks for weathering drives CO2 levels toward Snowball Earth conditions in the Carboniferous. Conversely, a substantial increase (up to a 4-fold increase) in the surface outcropping of mafic rocks over those modeled for the Carboniferous is needed to maintain the 10 Myr CO2 nadir in the earliest Permian and is compatible with maximum exhumation of the Hercynian orogenic belt at this time, as well as with a rapid decline in proxy-based seawater 87Sr∕86Sr. Although these findings support the hypothesis of atmospheric pCO2 response to uplift of the CPM as the primary driver for Carboniferous initiation of the LPIA (Goddéris et al., 2017), they argue for a major reorganization of the predominant surface factors influencing weatherability in the tropics across the Carboniferous–Permian in order for pCO2 values to have fallen to well below 300 ppm. The demise of the LPIA was greenhouse gas forced, reflecting the increasing importance of magmatic degassing and likely decreased weathering efficiency driven by intensifying aridification, denudation of the CPM, and the loss of the wetland forests throughout tropical Euramerica.
Underlying primary data are deposited in the Dryad Digital Repository (Richey et al., 2020) and can be accessed at https://doi.org/10.25338/B8S90Q.
The supplement related to this article is available online at: https://doi.org/10.5194/cp-16-1759-2020-supplement.
JDR and IPM designed the study. JDR collected the data, wrote the article, and drafted the figures; IPM and YG carried out the GEOCLIM modeling, wrote relevant parts of the article, and drafted Fig. 5. All co-authors provided comments on the article.
The authors declare that they have no conflict of interest.
We thank Carol Hotton (National Museum of Natural History Smithsonian Institute) and Thomas Taylor (RIP), Edith Taylor, and Rudolph Serbert (University of Kansas) for access to plant cuticle data used in this study. We also thank Benjamin Mills (University of Leeds) and Duncan Temple-Lang and co-workers at the UC Davis Data Science Initiative for guidance with statistical analyses. Finally, we thank Joseph White (Baylor University) for useful comments on the article.
This research has been supported by the National Science Foundation, Division of Earth Sciences (grant no. EAR-1338281), the National Science Foundation, Directorate for Biological Sciences (grant no. 1148897), and the University of California, Davis (Graduate Research Mentorship Fellowship).
This paper was edited by Yannick Donnadieu and reviewed by two anonymous referees.
Balseiro, D. and Powell, M. G.: Carbonate collapse and the late Paleozoic ice age marine biodiversity crisis, Geology, 48, 118–122, https://doi.org/10.1130/G46858.1, 2019.
Beerling, D. J. and Berner, R. A.: Impact of a Permo-Carboniferous high O2 event on the terrestrial carbon cycle, P. Natl. Acad. Sci. USA, 97, 12428–12432, https://doi.org/10.1073/pnas.220280097, 2000.
Beerling, D. J., Woodward, F. I., Lomas, M. R., Wills, M. A., Quick, W. P., and Valdes, P. J.: The influence of Carboniferous palaeoatmospheres on plant function: an experimental and modelling assessment, Philos. T. R. Soc. Lon. B, 353, 131–140, https://doi.org/10.1098/rstb.1998.0196, 1998.
Belt, E. S., Heckel, P. H., Lentz, L. J., Bragonier, W. A., and Lyons, T. W.: Record of glacial–eustatic sea-level fluctuations in complex middle to late Pennsylvanian facies in the Northern Appalachian Basin and relation to similar events in the Midcontinent basin, Sediment. Geol., 238, 79–100, https://doi.org/10.1016/j.sedgeo.2011.04.004, 2011.
Benton, M. J.: No gap in the Middle Permian record of terrestrial vertebrates, Geology, 40, 339–342, https://doi.org/10.1130/G32669.1, 2012.
Berner, R. A. and Caldeira, K.: The need for mass balance and feedback in the geochemical carbon cycle, Geology, 25, 955–956, https://doi.org/10.1130/0091-7613(1997)025{<}0955:TNFMBA{>}2.3.CO;2, 1997.
Breecker, D. O.: Quantifying and understanding the uncertainty of atmospheric CO2 concentrations determined from calcic paleosols, Geochem. Geophys. Geosy., 14, 3210–3220, https://doi.org/10.1002/ggge.20189, 2013.
Buggisch, W., Wang, X., Alekseev, A. S., and Joachimski, M. M.: Carboniferous–Permian carbon isotope stratigraphy of successions from China (Yangtze platform), USA (Kansas) and Russia (Moscow Basin and Urals), Palaeogeogr. Palaeocl., 301, 18–38, https://doi.org/10.1016/j.palaeo.2010.12.015, 2011.
Cagliari, J., Philipp, R. P., Buso, V. V., Netto, R. G., Klaus Hillebrand, P., da Cunha Lopes, R., Stipp Basei, M. A., and Faccini, U. F.: Age constraints of the glaciation in the Paraná Basin: evidence from new U–Pb dates, J. Geol. Soc. London, 173, 871–874, https://doi.org/10.1144/jgs2015-161, 2016.
Cascales-Miñana, B., Diez, J. B., Gerrienne, P., and Cleal, C. J.: A palaeobotanical perspective on the great end-Permian biotic crisis, Hist. Biol., 28, 1066–1074, https://doi.org/10.1080/08912963.2015.1103237, 2016.
Caves, J. K., Jost, A. B., Lau, K. V., and Maher, K.: Cenozoic carbon cycle imbalances and a variable weathering feedback, Earth Planet. Sc. Lett., 450, 152–163, https://doi.org/10.1016/j.epsl.2016.06.035, 2016.
Chen, J. and Xu, Y.-g.: Establishing the link between Permian volcanism and biodiversity changes: Insights from geochemical proxies, Gondwana Res., 75, 68–96, https://doi.org/10.1016/j.gr.2019.04.008, 2019.
Chen, J., Montañez, I. P., Qi, Y., Shen, S., and Wang, X.: Strontium and carbon isotopic evidence for decoupling of pCO2 from continental weathering at the apex of the late Paleozoic glaciation, Geology, 46, 395–398, https://doi.org/10.1130/G40093.1, 2018.
Chen, J., Chen, B., and Montañez, I. P.: Carboniferous isotope stratigraphy, in: The Carboniferous Timescale, edited by: Lucas, S. G., Schneider, J. W., Wang, X., and Nikolaeva, S., Geological Society of London, London, in press, 2020.
Clapham, M. E. and James, N. P.: Paleoecology Of Early–Middle Permian Marine Communities In Eastern Australia: Response To Global Climate Change In the Aftermath Of the Late Paleozoic Ice Age, Palaios, 23, 738–750, https://doi.org/10.2110/palo.2008.p08-022r, 2008.
Cleal, C. J. and Thomas, B. A.: Palaeozoic tropical rainforests and their effect on global climates: is the past the key to the present?, Geobiology, 3, 13–31, https://doi.org/10.1111/j.1472-4669.2005.00043.x, 2005.
Crowley, T. J. and Baum, S. K.: Modeling late Paleozoic glaciation, Geology, 20, 507–510, https://doi.org/10.1130/0091-7613(1992)020{<}0507:MLPG{>}2.3.CO;2, 1992.
D'Antonio, M. P., Ibarra, D. E., and Boyce, C. K.: Land plant evolution decreased, rather than increased, weathering rates, Geology, 48, 29–33, https://doi.org/10.1130/G46776.1, 2019.
Davydov, V. I.: Precaspian Isthmus emergence triggered the Early Sakmarian glaciation: Evidence from the Lower Permian of the Urals, Russia, Palaeogeogr. Palaeocl., 511, 403–418, https://doi.org/10.1016/j.palaeo.2018.09.007, 2018.
de Boer, H. J., Drake, P. L., Wendt, E., Price, C. A., Schulze, E.-D., Turner, N. C., Nicolle, D., and Veneklaas, E. J.: Apparent Overinvestment in Leaf Venation Relaxes Leaf Morphological Constraints on Photosynthesis in Arid Habitats, Plant Physiol., 172, 2286–2299, https://doi.org/10.1104/pp.16.01313, 2016.
Dessert, C., Dupré, B., François, L. M., Schott, J., Gaillardet, J., Chakrapani, G., and Bajpai, S.: Erosion of Deccan Traps determined by river geochemistry: impact on the global climate and the 87Sr/86Sr ratio of seawater, Earth Planet. Sc. Lett., 188, 459–474, https://doi.org/10.1016/S0012-821X(01)00317-X, 2001.
Dessert, C., Dupré, B., Gaillardet, J., François, L. M., and Allègre, C. J.: Basalt weathering laws and the impact of basalt weathering on the global carbon cycle, Chem. Geol., 202, 257–273, https://doi.org/10.1016/j.chemgeo.2002.10.001, 2003.
Diefendorf, A. F., Leslie, A. B., and Wing, S. L.: Leaf wax composition and carbon isotopes vary among major conifer groups, Geochim. Cosmochim. Ac., 170, 145–156, https://doi.org/10.1016/j.gca.2015.08.018, 2015.
DiMichele, W. A.: Wetland-dryland vegetational dynamics in the Pennsylvanian ice age tropics, Int. J. Plant Sci., 175, 123–164, https://doi.org/10.1086/675235, 2014.
DiMichele, W. A., Montañez, I. P., Poulsen, C. J., and Tabor, N. J.: Climate and vegetational regime shifts in the late Paleozoic ice age earth, Geobiology, 7, 200–226, https://doi.org/10.1111/j.1472-4669.2009.00192.x, 2009.
DiMichele, W. A., Wagner, R. H., Bashforth, A. R., and Álvárez-Vazquez, C.: An update on the flora of the Kinney Quarry of central New Mexico (Upper Pennsylvanian), its preservational and environmental significance, in: Carboniferous-Permian transition in central New Mexico, edited by: Lucas, S. G., Nelson, W. J., DiMichele, W. A., Speilmann, J. A., Krainer, K., Barrick, J. E., Elrick, S., and Voigt, S., New Mexico Museum of Natural History and Science, Bulletin, New Mexico Museum of Natural History and Science, Albuquerque, New Mexico, 289–325, 2013.
Donnadieu, Y., Goddéris, Y., Ramstein, G., Nédélec, A., and Meert, J.: A “snowball Earth” climate triggered by continental break-up through changes in runoff, Nature, 428, 303–306, https://doi.org/10.1038/nature02408, 2004.
Donnadieu, Y., Goddéris, Y., Pierrehumbert, R., Dromart, G., Fluteau, F., and Jacob, R.: A GEOCLIM simulation of climatic and biogeochemical consequences of Pangea breakup, Geochem. Geophys. Geosy., 7, Q11019, https://doi.org/10.1029/2006GC001278, 2006.
Eros, J. M., Montañez, I. P., Osleger, D. A., Davydov, V. I., Nemyrovska, T. I., Poletaev, V. I., and Zhykalyak, M. V.: Sequence stratigraphy and onlap history of the Donets Basin, Ukraine: insight into Carboniferous icehouse dynamics, Palaeogeogr. Palaeocl., 313, 1–25, https://doi.org/10.1016/j.palaeo.2011.08.019, 2012.
Falcon-Lang, H. J., Nelson, W. J., Heckel, P. H., DiMichele, W. A., and Elrick, S. D.: New insights on the stepwise collapse of the Carboniferous Coal Forests: Evidence from cyclothems and coniferopsid tree-stumps near the Desmoinesian–Missourian boundary in Peoria County, Illinois, USA, Palaeogeogr. Palaeocl., 490, 375–392, https://doi.org/10.1016/j.palaeo.2017.11.015, 2018.
Feulner, G.: Formation of most of our coal brought Earth close to global glaciation, P. Natl. Acad. Sci. USA, 114, 11333–11337, https://doi.org/10.1073/pnas.1712062114, 2017.
Fielding, C. R., Frank, T. D., Birgenheier, L. P., Rygel, M. C., Jones, A. T., and Roberts, J.: Stratigraphic imprint of the Late Palaeozoic Ice Age in eastern Australia: a record of alternating glacial and nonglacial climate regime, J. Geol. Soc. London, 165, 129–140, https://doi.org/10.1144/0016-76492007-036, 2008.
Fielding, C. R., Nelson, W. J., and Elrick, S. D.: Sequence stratigraphy of the late Desmoinesian to early Missourian (Pennsylvanian) succession of southern Illinois: Insights into controls on stratal architecture in an icehouse period of Earth history, J. Sediment. Res., 90, 200–227, https://doi.org/10.2110/jsr.2020.10, 2020.
Foster, G. L., Royer, D. L., and Lunt, D. J.: Future climate forcing potentially without precedent in the last 420 million years, Nat. Commun., 8, 14845, https://doi.org/10.1038/ncomms14845, 2017.
Franks, P. J., Royer, D. L., Beerling, D. J., Van de Water, P. K., Cantrill, D. J., Barbour, M. M., and Berry, J. A.: New constraints on atmospheric CO2 concentration for the Phanerozoic, Geophys. Res. Lett., 41, 4685–4694, https://doi.org/10.1002/2014GL060457, 2014.
Friedman, M. and Sallan, L. C.: Five hundred million years of extinction and recovery: a phanerozoic survey of large-scale diversity patterns in fishes, Palaeontology, 55, 707–742, https://doi.org/10.1111/j.1475-4983.2012.01165.x, 2012.
Gaillardet, J., Dupré, B., Louvat, P., and Allègre, C. J.: Global silicate weathering and CO2 consumption rates deduced from the chemistry of large rivers, Chem. Geol., 159, 3–30, https://doi.org/10.1016/S0009-2541(99)00031-5, 1999.
Gao, Z., Tian, W., Wang, L., Shi, L., and Pan, M.: Emplacement of intrusions of the Tarim Flood Basalt Province and their impacts on oil and gas reservoirs: A 3D seismic reflection study in Yingmaili fields, Tarim Basin, northwest China, Interpretation, 5, SK51–SK63, https://doi.org/10.1190/INT-2016-0165.1, 2017.
Gerhart, L. M. and Ward, J. K.: Plant responses to low [CO2] of the past, New Phytol., 188, 674–695, https://doi.org/10.1111/j.1469-8137.2010.03441.x, 2010.
Gibbs, M. T., Bluth, G. J., Fawcett, P. J., and Kump, L. R.: Global chemical erosion over the last 250 my; variations due to changes in paleogeography, paleoclimate, and paleogeology, Am. J. Sci., 299, 611–651, https://doi.org/10.2475/ajs.299.7-9.611, 1999.
Glasspool, I., Scott, A., Waltham, D., Pronina, N., and Shao, L.: The impact of fire on the Late Paleozoic Earth system, Front. Plant Sci., 6, 756, https://doi.org/10.3389/fpls.2015.00756, 2015.
Goddéris, Y., Donnadieu, Y., Le Hir, G., Lefebvre, V., and Nardin, E.: The role of palaeogeography in the Phanerozoic history of atmospheric CO2 and climate, Earth-Sci. Rev., 128, 122–138, https://doi.org/10.1016/j.earscirev.2013.11.004, 2014.
Goddéris, Y., Donnadieu, Y., Carretier, S., Aretz, M., Dera, G., Macouin, M., and Regard, V.: Onset and ending of the late Palaeozoic ice age triggered by tectonically paced rock weathering, Nat. Geosci., 10, 382–386, https://doi.org/10.1038/ngeo2931, 2017.
Griffis, N. P., Mundil, R., Montañez, I. P., Isbell, J., Fedorchuk, N., Vesely, F., Iannuzzi, R., and Yin, Q.-Z.: A new stratigraphic framework built on U-Pb single-zircon TIMS ages and implications for the timing of the penultimate icehouse (Paraná Basin, Brazil), Geol. Soc. Am. Bull., 130, 848–858, https://doi.org/10.1130/B31775.1, 2018.
Griffis, N. P., Montañez, I. P., Mundil, R., Richey, J. D., Isbell, J., Fedorchuk, N., Linol, B., Iannuzzi, R., Vesely, F., Mottin, T., de Rosa, E., Keller, C. B., and Yin, Q.-Z.: Coupled stratigraphic and U-Pb zircon age constraints on the late Paleozoic icehouse-to-greenhouse turnover in south-central Gondwana, Geology, 47, 1146–1150, https://doi.org/10.1130/G46740.1, 2019.
Grossman, E. L., Yancey, T. E., Jones, T. E., Bruckschen, P., Chuvashov, B., Mazzullo, S. J., and Mii, H.-s.: Glaciation, aridification, and carbon sequestration in the Permo-Carboniferous: The isotopic record from low latitudes, Palaeogeogr. Palaeocl., 268, 222–233, https://doi.org/10.1016/j.palaeo.2008.03.053, 2008.
Groves, J. R. and Yue, W.: Foraminiferal diversification during the late Paleozoic ice age, Paleobiology, 35, 367–392, https://doi.org/10.1666/0094-8373-35.3.367, 2009.
Henderson, C. M., Wardlaw, B. R., Davydov, V. I., Schmitz, M. D., Schiappa, T. A., Tierney, K. E., and Shen, S.: Proposal for base-Kungurian GSSP, Permophiles, 56, 8–21, 2012.
Hernandez-Castillo, G. R., Stockey, R. A., Mapes, G. K., and Rothwell, G. W.: A new voltzialean conifer Emporia royalii sp. nov. (Emporiaceae) from the Hamilton Quarry, Kansas, Int. J. Plant Sci., 170, 1201–1227, https://doi.org/10.1086/605874, 2009a.
Hernandez-Castillo, G. R., Stockey, R. A., Rothwell, G. W., and Mapes, G. K.: Reconstruction of the Pennsylvanian-age walchian conifer Emporia cryptica sp. nov. (Emporiaceae: Voltziales), Rev. Palaeobot. Palyno., 157, 218–237, https://doi.org/10.1016/j.revpalbo.2009.05.003, 2009b.
Hernandez-Castillo, G. R., Stockey, R. A., Rothwell, G. W., and Mapes, G. K.: Reconstructing Emporia lockardii (Voltziales: Emporiaceae) and initial thoughts on Paleozoic conifer ecology, Int. J. Plant Sci., 170, 1056–1074, https://doi.org/10.1086/605115, 2009c.
Hibbett, D., Blanchette, R., Kenrick, P., and Mills, B.: Climate, decay, and the death of the coal forests, Curr. Biol., 26, R563–R567, https://doi.org/10.1016/j.cub.2016.01.014, 2016.
Horton, D. E., Poulsen, C. J., Montañez, I. P., and DiMichele, W. A.: Eccentricity-paced late Paleozoic climate change, Palaeogeogr. Palaeocl., 331, 150–161, https://doi.org/10.1016/j.palaeo.2012.03.014, 2012.
Ibarra, D. E., Caves, J. K., Moon, S., Thomas, D. L., Hartmann, J., Chamberlain, C. P., and Maher, K.: Differential weathering of basaltic and granitic catchments from concentration–discharge relationships, Geochim. Cosmochim. Ac., 190, 265–293, https://doi.org/10.1016/j.gca.2016.07.006, 2016.
Ibarra, D. E., Rugenstein, J. K. C., Bachan, A., Baresch, A., Lau, K. V., Thomas, D. L., Lee, J.-E., Boyce, C. K., and Chamberlain, C. P.: Modeling the consequences of land plant evolution on silicate weathering, Am. J. Sci., 319, 1–43, https://doi.org/10.2475/01.2019.01, 2019.
Isbell, J. L., Henry, L. C., Gulbranson, E. L., Limarino, C. O., Fraiser, M. L., Koch, Z. J., Ciccioli, P. L., and Dineen, A. A.: Glacial paradoxes during the late Paleozoic ice age: Evaluating the equilibrium line altitude as a control on glaciation, Gondwana Res., 22, 1–19, https://doi.org/10.1016/j.gr.2011.11.005, 2012.
Joshi, M. M., Mills, B. J. W., and Johnson, M.: A Capacitor-Discharge Mechanism to Explain the Timing of Orogeny-Related Global Glaciations, Geophys. Res. Lett., 46, 8347–8354, https://doi.org/10.1029/2019GL083368, 2019.
Käßner, A., Tichomirowa, M., Lützner, H., and Gaupp, R.: New high precision CA-ID-TIMS U-Pb zircon ages from the Thuringian Forest Rotliegend section, in: Geophysical Research Abstracts, European Geophysical Union, Vienna, Austria, 2019,
Kemp, T. S.: The origin and early radiation of the therapsid mammal-like reptiles: a palaeobiological hypothesis, J. Evolution. Biol., 19, 1231–1247, https://doi.org/10.1111/j.1420-9101.2005.01076.x, 2006.
Koch, J. T. and Frank, T. D.: The Pennsylvanian–Permian transition in the low-latitude carbonate record and the onset of major Gondwanan glaciation, Palaeogeogr. Palaeocl., 308, 362–372, https://doi.org/10.1016/j.palaeo.2011.05.041, 2011.
Korte, C. and Ullmann, C. V.: Permian strontium isotope stratigraphy, Geol. Soc. Spec. Publ., 450, 105–118, https://doi.org/10.1144/sp450.5, 2018.
Krause, A. J., Mills, B. J. W., Zhang, S., Planavsky, N. J., Lenton, T. M., and Poulton, S. W.: Stepwise oxygenation of the Paleozoic atmosphere, Nat. Commun., 9, 4081, https://doi.org/10.1038/s41467-018-06383-y, 2018.
Lee, C.-T. A., Thurner, S., Paterson, S., and Cao, W.: The rise and fall of continental arcs: Interplays between magmatism, uplift, weathering, and climate, Earth Planet. Sc. Lett., 425, 105–119, https://doi.org/10.1016/j.epsl.2015.05.045, 2015.
Lee, C.-T. A. and Dee, S.: Does volcanism cause warming or cooling?, Geology, 47, 687–688, https://doi.org/10.1130/focus072019.1, 2019.
Lenton, T. M., Daines, S. J., and Mills, B. J. W.: COPSE reloaded: An improved model of biogeochemical cycling over Phanerozoic time, Earth-Sci. Rev., 178, 1–28, https://doi.org/10.1016/j.earscirev.2017.12.004, 2018.
Li, H., Taylor, E. L., and Taylor, T. N.: Permian Vessel Elements, Science, 271, 188–189, https://doi.org/10.1126/science.271.5246.188, 1996.
Lowry, D. P., Poulsen, C. J., Horton, D. E., Torsvik, T. H., and Pollard, D.: Thresholds for Paleozoic ice sheet initiation, Geology, 42, 627–630, https://doi.org/10.1130/G35615.1, 2014.
Macdonald, F. A., Swanson-Hysell, N. L., Park, Y., Lisiecki, L., and Jagoutz, O.: Arc-continent collisions in the tropics set Earth's climate state, Science, 364, 181–184, https://doi.org/10.1126/science.aav5300, 2019.
Maher, K. and Chamberlain, C. P.: Hydrologic Regulation of Chemical Weathering and the Geologic Carbon Cycle, Science, 343, 1502–1504, https://doi.org/10.1126/science.1250770, 2014.
McGhee, G. R.: Carboniferous Giants and Mass Extinction: The Late Paleozoic Ice Age World, Columbia University Press, New York, 2018.
McKenzie, N. R., Horton, B. K., Loomis, S. E., Stockli, D. F., Planavsky, N. J., and Lee, C.-T. A.: Continental arc volcanism as the principal driver of icehouse-greenhouse variability, Science, 352, 444–447, https://doi.org/10.1126/science.aad5787, 2016.
McLoughlin, S.: Glossopteris – insights into the architecture and relationships of an iconic Permian Gondwanan plant, Journal of the Botanical Society of Bengal, 65, 93–106, 2011.
Melville, R.: Glossopteridae, Angiospermidae and the evidence for angiosperm origin, Bot. J. Linn. Soc., 86, 279–323, https://doi.org/10.1111/j.1095-8339.1983.tb00975.x, 1983.
Montañez, I. P.: Modern soil system constraints on reconstructing deep-time atmospheric CO2, Geochim. Cosmochim. Ac., 101, 57–75, https://doi.org/10.1016/j.gca.2012.10.012, 2013.
Montañez, I. P.: A Late Paleozoic climate window of opportunity, P. Natl. Acad. Sci. USA, 113, 2234–2336, https://doi.org/10.1073/pnas.1600236113, 2016.
Montañez, I. P. and Poulsen, C. J.: The Late Paleozoic Ice Age: An Evolving Paradigm, Annu. Rev. Earth Pl. Sc., 41, 629–656, https://doi.org/10.1146/annurev.earth.031208.100118, 2013.
Montañez, I. P., Tabor, N. J., Niemeier, D., DiMichele, W. A., Frank, T. D., Fielding, C. R., Isbell, J. L., Birgenheier, L. P., and Rygel, M. C.: CO2-forced climate and vegetation instability during Late Paleozoic deglaciation, Science, 315, 87–91, https://doi.org/10.1126/science.1134207, 2007.
Montañez, I. P., McElwain, J. C., Poulsen, C. J., White, J. D., Dimichele, W. A., Wilson, J. P., Griggs, G., and Hren, M. T.: Climate, pCO2 and terrestrial carbon cycle linkages during late Palaeozoic glacial–interglacial cycles, Nat. Geosci., 9, 824–828, https://doi.org/10.1038/ngeo2822, 2016.
Ogg, J. G., Ogg, G., and Gradstein, F. M.: A concise geologic time scale: 2016, Elsevier, New York, 2016.
Pardo, J. D., Small, B. J., Milner, A. R., and Huttenlocker, A. K.: Carboniferous–Permian climate change constrained early land vertebrate radiations, Nat. Ecol. Evol., 3, 200–206, https://doi.org/10.1038/s41559-018-0776-z, 2019.
Poulsen, C. J., Tabor, C., and White, J. D.: Long-term climate forcing by atmospheric oxygen concentrations, Science, 348, 1238–1241, https://doi.org/10.1126/science.1260670, 2015.
Powell, M. G.: Climatic basis for sluggish macroevolution during the late Paleozoic ice age, Geology, 33, 381–384, https://doi.org/10.1130/G21155.1, 2005.
Richey, J. D., Montañez, I. P., Goddéris, Y., Looy, C. V., Griffis, N. P., and DiMichele, W. A.: Primary Data from Richey et al., 2020 (Climate Of The Past), v8, UC Davis, https://doi.org/10.25338/B8S90Q, 2020.
Romanek, C. S., Grossman, E. L., and Morse, J. W.: Carbon isotopic fractionation in synthetic aragonite and calcite: Effects of temperature and precipitation rate, Geochim. Cosmochim. Ac., 56, 419–430, https://doi.org/10.1016/0016-7037(92)90142-6, 1992.
Sato, A. M., Llambías, E. J., Basei, M. A. S., and Castro, C. E.: Three stages in the Late Paleozoic to Triassic magmatism of southwestern Gondwana, and the relationships with the volcanogenic events in coeval basins, J. S. Am. Earth Sci., 63, 48–69, https://doi.org/10.1016/j.jsames.2015.07.005, 2015.
Scotese, C.: PALEOMAP PaleoAtlas for GPlates and the PaleoData Plotter Program, PALEOMAP Project, available at: https://www.earthbyte.org/paleomap-paleoatlas-for-gplates/ (last access: 17 August 2019), 2016.
Shellnutt, J. G.: The Panjal Traps, in: Large Igneous Provinces from Gondwana and Adjacent Regions, edited by: Sensarma, S., and Storey, B. C., Special Publications, 1, Geological Society, London, 59–86, 2018. Šimůnek, Z.: Cuticular analysis of new Westphalian and Stephanian Cordaites species from the USA, Rev. Palaeobot. Palyno., 253, 1–14, https://doi.org/10.1016/j.revpalbo.2018.03.001, 2018.
Soreghan, G. S., Soreghan, M. J., and Heavens, N. G.: Explosive volcanism as a key driver of the late Paleozoic ice age, Geology, 47, 600–604, https://doi.org/10.1130/G46349.1, 2019.
Spalletti, L. A. and Limarino, C. O.: The Choiyoi magmatism in south western Gondwana: implications for the end-permian mass extinction-a review, Andean Geol., 44, 328–338, https://doi.org/10.5027/andgeoV44n3-a05, 2017.
Srivastava, A. K.: Evolutionary tendency in the venation pattern of Glossopteridales, Geobios, 24, 383–386, https://doi.org/10.1016/S0016-6995(06)80235-4, 1991.
Stanley, S. M.: Estimates of the magnitudes of major marine mass extinctions in earth history, P. Natl. Acad. Sci. USA, 113, E6325–E6334, https://doi.org/10.1073/pnas.1613094113, 2016.
Stanley, S. M. and Powell, M. G.: Depressed rates of origination and extinction during the late Paleozoic ice age: a new state for the global marine ecosystem, Geology, 31, 877–880, https://doi.org/10.1130/G19654R.1, 2003.
Tabor, N. J. and Montañez, I. P.: Oxygen and hydrogen isotope compositions of Permian pedogenic phyllosilicates: development of modern surface domain arrays and implications for paleotemperature reconstructions, Palaeogeogr. Palaeocl., 223, 127–146, https://doi.org/10.1016/j.palaeo.2005.04.009, 2005.
Tabor, N. J., DiMichele, W. A., Montañez, I. P., and Chaney, D. S.: Late Paleozoic continental warming of a cold tropical basin and floristic change in western Pangea, Int. J. Coal. Geol., 119, 177–186, https://doi.org/10.1016/j.coal.2013.07.009, 2013.
Torsvik, T. H., Smethurst, M. A., Burke, K., and Steinberger, B.: Long term stability in deep mantle structure: Evidence from the ∼300 Ma Skagerrak-Centered Large Igneous Province (the SCLIP), Earth Planet. Sc. Lett., 267, 444–452, https://doi.org/10.1016/j.epsl.2007.12.004, 2008.
Walker, J. C. G., Hays, P. B., and Kasting, J. F.: A negative feedback mechanism for the long-term stabilization of Earth's surface temperature, J. Geophys. Res.-Oceans, 86, 9776–9782, https://doi.org/10.1029/JC086iC10p09776, 1981.
Wang, X.-D., Wang, X.-J., Zhang, F., and Zhang, H.: Diversity patterns of Carboniferous and Permian rugose corals in South China, Geol. J., 41, 329–343, https://doi.org/10.1002/gj.1041, 2006.
West, A. J.: Thickness of the chemical weathering zone and implications for erosional and climatic drivers of weathering and for carbon-cycle feedbacks, Geology, 40, 811–814, https://doi.org/10.1130/g33041.1, 2012.
Wilson, J. P., Montañez, I. P., White, J. D., DiMichele, W. A., McElwain, J. C., Poulsen, C. J., and Hren, M. T.: Dynamic Carboniferous tropical forests: new views of plant function and potential for physiological forcing of climate, New Phytol., 215, 1333–1353, https://doi.org/10.1111/nph.14700, 2017.
Wilson, J. P., White, J. D., Montañez, I. P., DiMichele, W. A., McElwain, J. C., Poulsen, C. J., and Hren, M. T.: Carboniferous plant physiology breaks the mold, New Phytol., https://doi.org/10.1111/nph.16460, 2020.
Yang, S., Chen, H., Li, Z., Li, Y., Yu, X., Li, D., and Meng, L.: Early Permian Tarim Large Igneous Province in northwest China, Sci. China Earth Sci., 56, 2015–2026, https://doi.org/10.1007/s11430-013-4653-y, 2013.
Zhai, Q.-G., Jahn, B.-M., Su, L., Ernst, R. E., Wang, K.-l., Zhang, R.-Y., Wang, J., and Tang, S.: SHRIMP zircon U–Pb geochronology, geochemistry and Sr–Nd–Hf isotopic compositions of a mafic dyke swarm in the Qiangtang terrane, northern Tibet and geodynamic implications, Lithos, 174, 28–43, https://doi.org/10.1016/j.lithos.2012.10.018, 2013.
Zhou, W., Wan, M., Koll, R. A., and Wang, J.: Occurrence of the earliest gigantopterid from the basal Permian of the North China Block and its bearing on evolution, Geol. J., 53, 500–509, https://doi.org/10.1002/gj.2907, 2017.