the Creative Commons Attribution 4.0 License.
the Creative Commons Attribution 4.0 License.
 | 02 Sep 2020
An 83 000-year-old ice core from Roosevelt Island, Ross Sea, Antarctica
Edward J. Brook
Nancy A. N. Bertler
Christo Buizert
Troy Baisden
Thomas Blunier
V. Gabriela Ciobanu
Howard Conway
Dorthe Dahl-Jensen
Tyler J. Fudge
Richard Hindmarsh
Elizabeth D. Keller
Frédéric Parrenin
Jeffrey P. Severinghaus
Paul Vallelonga
Edwin D. Waddington
Mai Winstrup
In 2013 an ice core was recovered from Roosevelt Island, an ice dome between two submarine troughs carved by paleo-ice-streams in the Ross Sea, Antarctica. The ice core is part of the Roosevelt Island Climate Evolution (RICE) project and provides new information about the past configuration of the West Antarctic Ice Sheet (WAIS) and its retreat during the last deglaciation. In this work we present the RICE17 chronology, which establishes the depth–age relationship for the top 754 m of the 763 m core. RICE17 is a composite chronology combining annual layer interpretations for 0–343 m (Winstrup et al., 2019) with new estimates for gas and ice ages based on synchronization of CH4 and δ18Oatm records to corresponding records from the WAIS Divide ice core and by modeling of the gas age–ice age difference.
Novel aspects of this work include the following: (1) an automated algorithm for multiproxy stratigraphic synchronization of high-resolution gas records; (2) synchronization using centennial-scale variations in methane for pre-anthropogenic time periods (60–720 m, 1971 CE to 30 ka), a strategy applicable for future ice cores; and (3) the observation of a continuous climate record back to ∼65 ka providing evidence that the Roosevelt Island Ice Dome was a constant feature throughout the last glacial period.
- Article
(7697 KB) - Full-text XML
-
Supplement
(280 KB) - BibTeX
- EndNote


The Roosevelt Island Climate Evolution (RICE) project seeks to combine geophysical measurements with climate information from a well-dated ice core to improve constraints of the glacial history of the eastern Ross Sea (Conway et al., 1999). With this motivation, the RICE project drilled and recovered a 763 m long ice core from Roosevelt Island. Here, we first present new data sets from the RICE ice core and then describe the development of the RICE17 age-scale, a composite age-scale which combines annual layer counts (Winstrup et al., 2019) with new age constraints and spans the top 753.75 m.
The most precise chronologies for ice cores have been constructed by combining absolute age markers, for example volcanic ash layers, with annual layers counts from visual stratigraphy and from variations in chemical concentrations, stable isotope ratios of the ice, and electrical properties. Examples include the Greenlandic ice cores composite chronology (GICC05) which extends to 60 ka (Svensson et al., 2008) and the Antarctic WAIS Divide WD2014 chronology through the last 31 ka (Sigl et al., 2016). For the RICE ice core this strategy was only applicable above 165.02 m, the depth of the oldest absolute age marker, at 1251 CE (Winstrup et al., 2019). Annual layer interpretations were extended to 343.7 m (2649 years BP; all ages are reported as years before present, BP, where present is defined as 1950 CE; Winstrup et al., 2019). Below this depth, annual layers became too thin to reliably interpret the seasonal signals.
For the 343.7–754 m section of the RICE ice core, the best age constraints are from measurements of methane and the isotopic composition of molecular oxygen (δ18Oatm). Variations in these parameters are globally synchronous (Bender et al., 1994; Blunier et al., 1998), meaning that, to a first order, different ice cores will record the same atmospheric history. We establish the gas-phase depth–age relationship by matching the new RICE records to corresponding records from other ice cores with established chronologies. From the gas age-scale, an ice-phase age-scale was obtained by modeling the ice age–gas age offset (Δage). Δage is constrained by measurements of the isotopic composition of molecular nitrogen (δ15N-N2) and estimates of temperature based on δD of ice. For overlapping depths, the gas-based ice age estimates are in excellent agreement with the annual-layer-counted age estimates. A final age-scale for the entire core, named RICE17, is presented and is a composite of the annual-layer-based age-scale for 0–343.7 m depth and the gas-based age-scale for deeper sections of the core.
The approach used for RICE17 is not unique but includes several refinements that improve the dating accuracy. Primarily, the RICE17 chronology benefited from the availability of high-resolution gas records from both the RICE ice core and the WAIS Divide ice core. Centennial-scale variability in methane was well captured for the last 30 ka in both data sets. Additionally, an automated matching routine, adapted from Huybers and Wunsch (2004) and novel in the application to ice cores, simultaneously matched methane and δ18Oatm records for ice up to 30 ka (0–720 m). The multiproxy approach to synchronization leads to strengthened age estimates. Using an automated routine resulted in a more objective match of the RICE gas records to the reference records and a Monte Carlo-based estimate of age uncertainty.
RICE17 is a continuous chronology with age monotonically increasing with depth until at least 64.6 ka. At 746.00 m, folding of the ice is observed, and the age-scale is segmented and no longer continuous. The oldest ice near the bottom of the core has a minimum age of 83 ka. We use these observations, with support from measurements of total air content (TAC), to interpret that the Roosevelt Island ice dome was stable throughout the last glacial maximum.
Understanding the stability of the West Antarctic Ice Sheet (WAIS) is important for predicting future sea level rise (Church et al., 2013; Jevrejeva et al., 2014; Golledge et al., 2014; Pollard et al., 2015; DeConto and Pollard, 2016). Much of the ice sheet is grounded below sea level with the bed deepening towards the center of the ice sheet. This configuration is thought to be unstable and prone to rapid disintegration due to physical forces related to buoyancy (Hughes, 1973; Weertman, 1974; Schoof, 2007; Feldmann and Levermann, 2015), vulnerability to undercutting by “warm” subsurface currents (Robin and Adie, 1964; Shepherd et al., 2004), and ice cliff instability (DeConto and Pollard, 2016). Vulnerability of WAIS to future warming can be assessed by investigating how it has responded to different climate regimes in the past. Unfortunately, geologic evidence of the past size and extent of Antarctic ice sheets is spatially sparse, tends to have large chronological uncertainty, and is sometimes contradictory (Whitehouse et al., 2012; Anderson et al., 2014; Bentley et al., 2014; Clark and Tarasov, 2014; Halberstadt et al., 2016; McKay et al., 2016).
The Ross Embayment is the largest drainage of WAIS, both in terms of area and mass loss (Halberstadt et al., 2016). Historically, two scenarios have been proposed for the configuration of WAIS in the Ross Embayment during the Last Glacial Maximum (LGM) (Stuiver et al., 1981). In the “maximum scenario,” a thick and grounded ice sheet in the Ross Sea extended to the continental shelf break (Denton et al., 1989). Details of this scenario are supported by geomorphic features including grounding-zone wedges, which form at the terminus of marine-based glaciers (Shipp et al., 1999), and over-compressed diamictons, which are the result of thick overlying ice (Anderson et al., 1984, 1992). Evidence of high stands in the Transantarctic Mountains and the islands of the western Ross Sea (Denton and Marchant, 2000) as well as cosmogenic exposure dates on nunataks in Marie Byrd Land (Stone et al., 2003) also support this idea. In an alternate scenario, Denton et al. (1989) proposed that grounded ice in the Ross Sea was kept thin by fast-flowing ice streams. In this scenario, the retreat of WAIS during the last deglaciation may not have contributed significantly to sea level change. Studies of ice cores from Byrd Station (Steig et al., 2001) and Siple Dome (Waddington et al., 2005), glacial modeling (Parizek and Alley, 2004), and cosmogenic exposure dates from the Ohio Range (Ackert et al., 1999, 2007) all support this “minimal scenario.”
Roosevelt Island is an ice dome located in the eastern Ross Sea in West Antarctica (79.36∘ S, 161.71∘ W; elev. 550 m above sea level, Fig. 1). It is grounded on a submarine plateau (∼200 m b.s.l.) dividing the Whales Deep and Little America basins (Fig. 1). During the LGM these troughs were presumably occupied by the extension of the modern Bindschadler and MacAyeal ice streams (Ice Streams D and E, respectively) (Shipp et al., 1999), and Roosevelt Island would have been located along the main ice flow of WAIS.

Figure 1Map of bedrock elevation in the Ross Sea Sector of Antarctica (referenced to WGS84 datum) (Fretwell et al., 2013). Gray dashed lines indicate ice sheet grounding lines and ice margins. Locations of the RICE (Roosevelt Island), Siple Dome, Byrd Station, WAIS Divide, and Taylor Dome ice cores are marked with black stars.
The 763 m long RICE ice core was drilled to bedrock near the summit of Roosevelt Island. In addition to the main deep core, a shallow core was drilled to 20 m, and several snow pits were sampled to understand recent climate (Bertler et al., 2018). Local mean annual air temperature is −23.5 ∘C, and annual snow accumulation is estimated to be ∼0.22 m ice equivalent, based on annual layers in snow pits (Bertler et al., 2018). A cooler estimate of modern temperature, ∘C, based on ERA interim data from 1979 to 2012 was presented in Bertler et al. (2018), but this estimate is cooler than borehole thermometry measurements and previously published estimates for Roosevelt Island (Herron and Langway, 1980; Conway et al., 1999; Martín et al., 2006) and does not provide a good fit to the density profile in the firn model. Other estimates of recent accumulation at the RICE drill site range from 0.18 to 0.27 m ice per year, depending on method and time period (Winstrup et al., 2019; Bertler et al., 2018; Herron and Langway, 1980; Conway et al., 1999; Kingslake et al., 2014).
3.1 Methane concentrations
The RICE discrete methane record was measured at Oregon State University (OSU) following methods described by Mitchell et al. (2011, 2013) with updates described in Appendix A. A total of 702 samples were measured at 583 distinct depths between 60 and 753 m (Fig. 2a, f). Samples from 406 depths were measured between 60 and 670 m, dating from ∼1970 CE to 11.87 ka, with a mean sample spacing of 28.75 years. Between 670 and 718.13 m the record spans 11.87 to 29.9 ka; 96 samples in this interval provide age resolution of 189 years. Age resolution decreases significantly for deeper depths. The interval from 718.53 to 746.00 m corresponds to 30.1–64.6 ka with a mean resolution of 548 years. The deepest dated ice is at 752.95 m with an age of 83 ka (±2 ka).
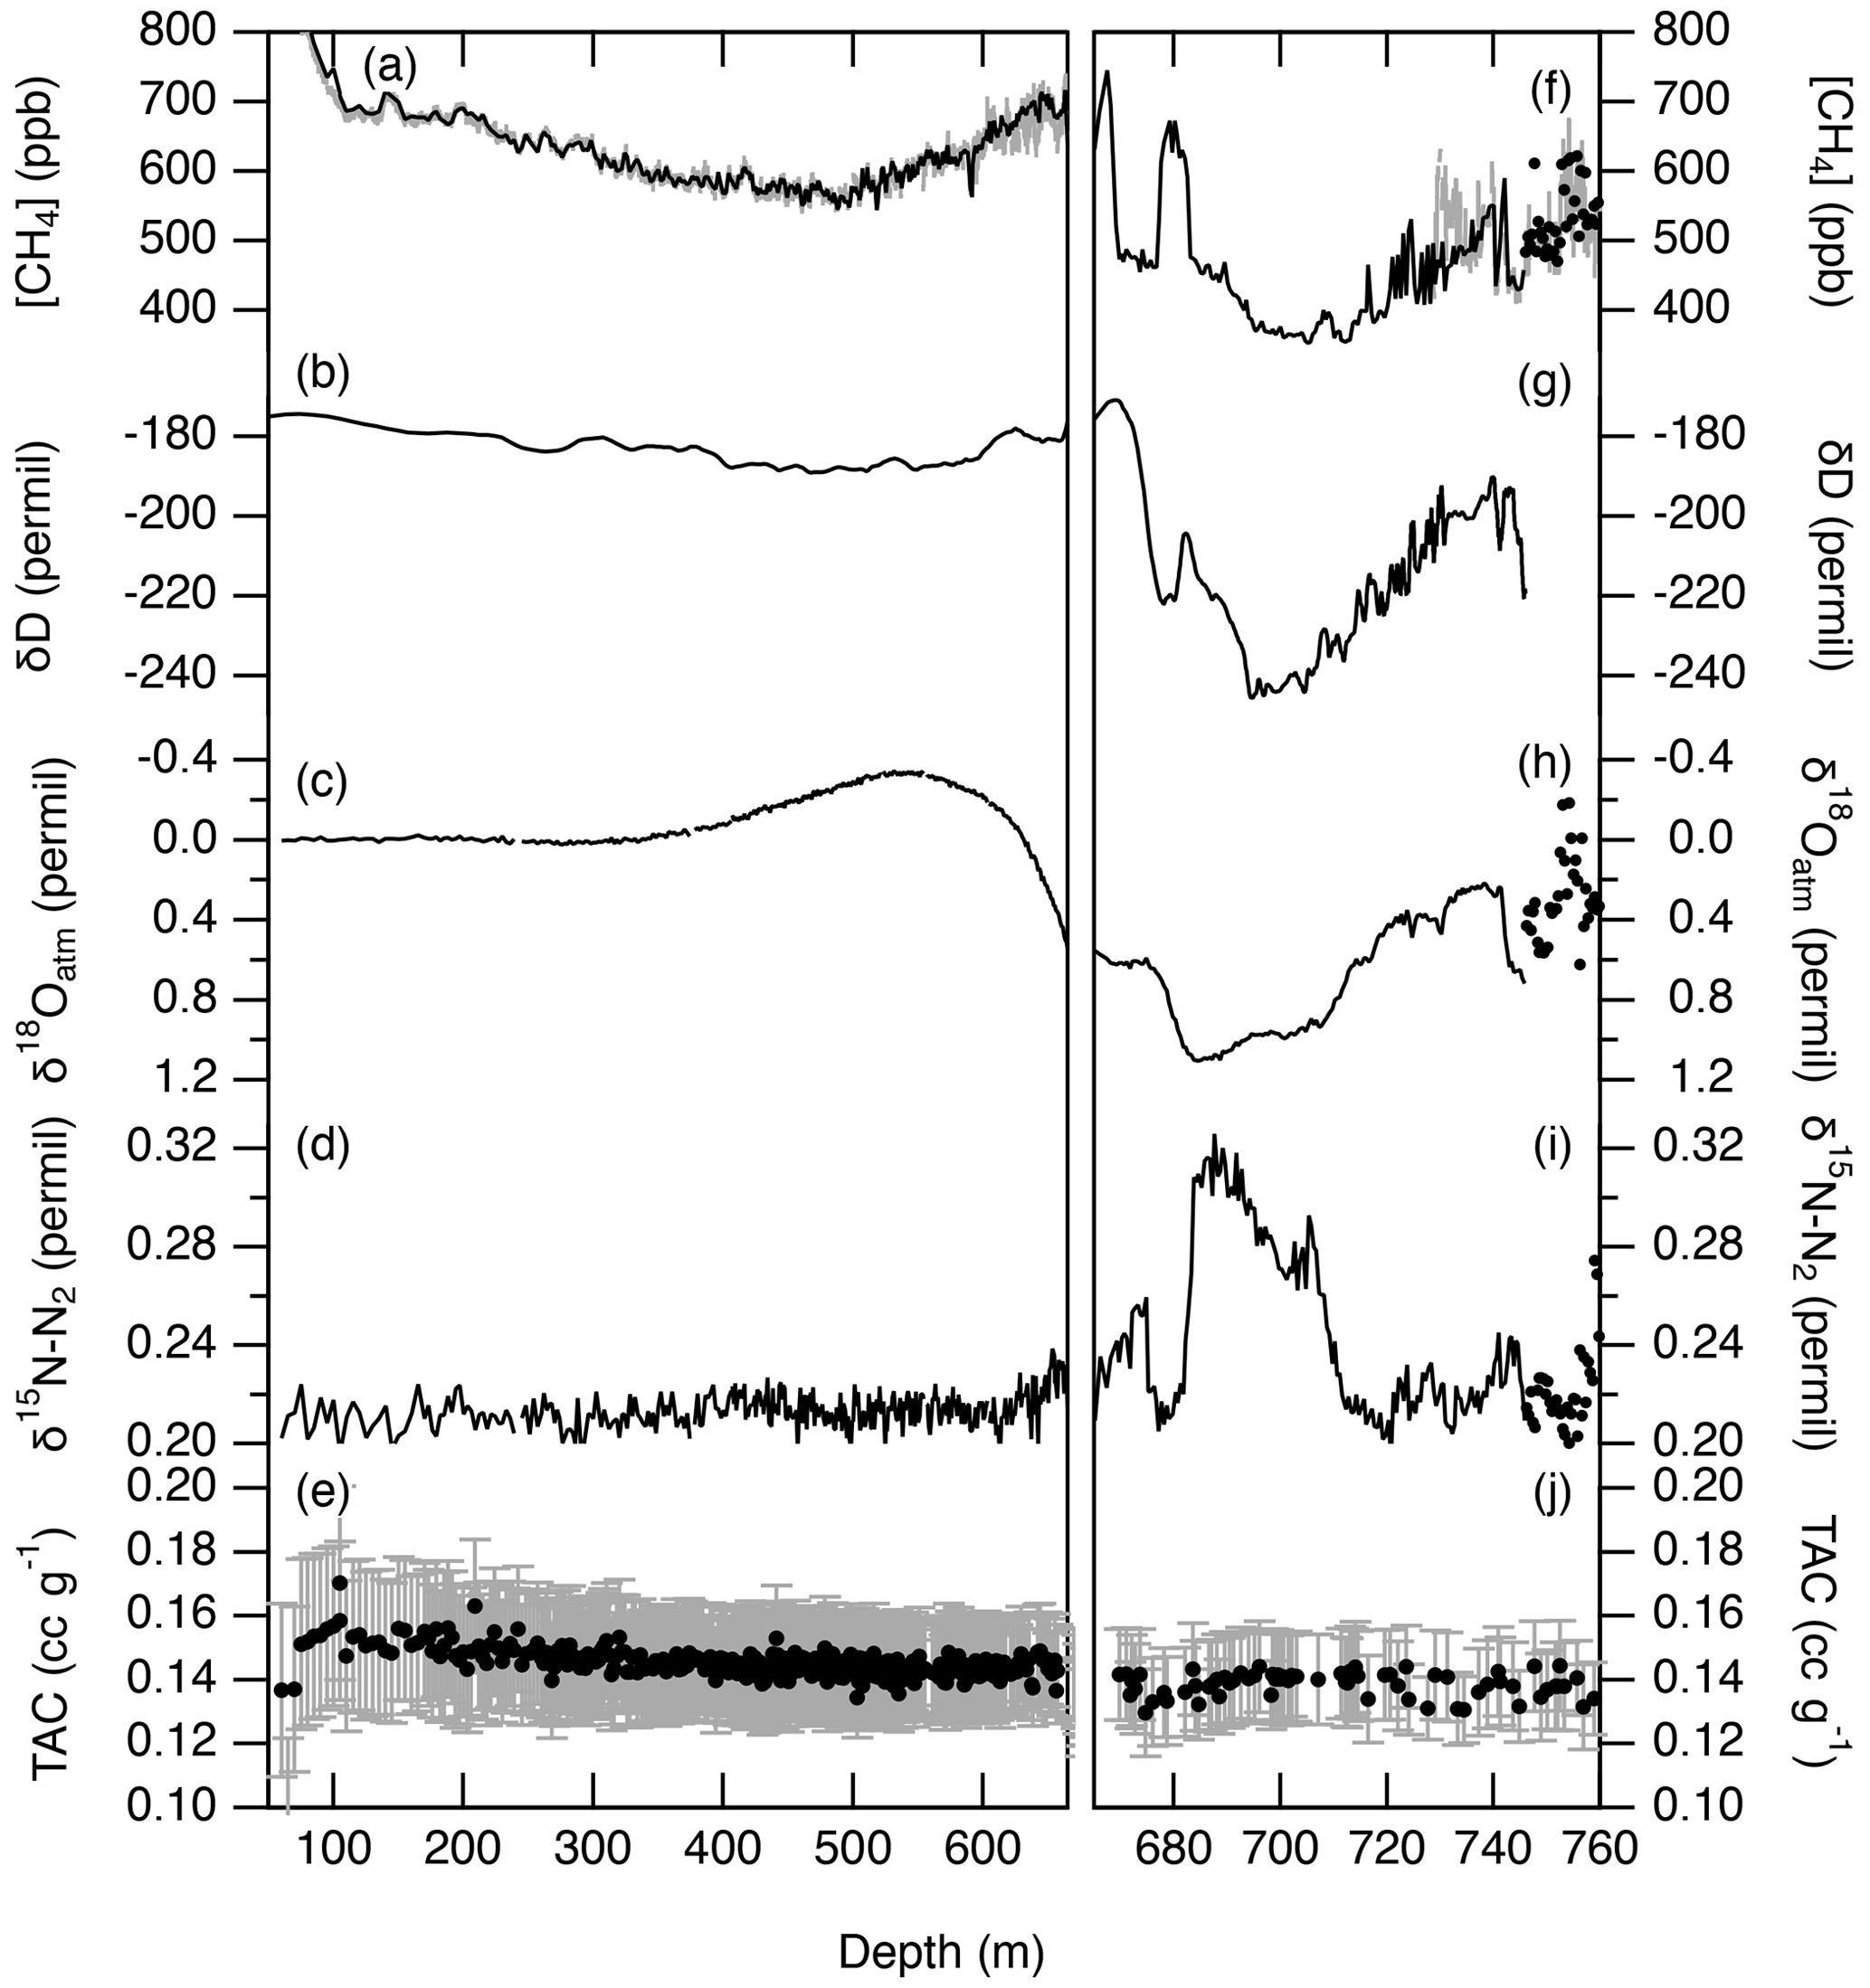
Figure 2Data from the RICE ice core. Left panels (a–e) (60–665 m) cover the last 11.26 ka; right panels (f–j) (665–760 m) cover measurements from 11.26 to 83 ka and measurements from the 9 m of ice below the dated section. (a, f) Continuous methane measurements, gray, between 0 and 726 m depth are calibrated to discrete methane measurements, black. Beyond 726 m depth, raw CFA methane measurements are plotted. (b, g) Continuously measured δD smoothed with a 500-year LOESS filter and subsampled at 50-year spacing. (c, h) δ18Oatm measurements are corrected for gravitational enrichment in the firn layer using δ15N-N2 (d, i). (e, j) Total air content (TAC) was measured in conjunction with discrete methane.
Methane was also measured continuously with a laser spectroscopy technique (Stowasser et al., 2012; Rhodes et al., 2013) during two separate continuous flow analysis (CFA) campaigns at GNS Science (Gracefield, New Zealand) in 2013 and 2014 (Pyne et al., 2018). The CFA methane record was affected by variability in airflow to the measurement instrument and fractures that allowed drill fluid and modern air into the melt head. Exclusion of these artifacts caused significant gaps in the record, particularly at depths below 676 m (12.6 ka). We consider the CFA record to be a supplement to the more robust but lower-resolution discrete data. Between 29.9 and 59.1 ka, the CFA record is critical for establishing age control. Below ∼746 m (64.6 ka), the CFA data are difficult to interpret because of gaps in the record, uncertainty in measurement depth, and uncertainty in methane calibration (Appendix B).
Several anomalously high discrete methane measurements appear between 44.6 and 50.9 ka (729.05–736.05 m) and below 64.6 ka (746 m) (Fig. 3a). In the former interval, methane is enriched by ∼30 ppb compared with the WAIS Divide CFA data (Rhodes et al., 2015). This is likely due to healed fractures that include modern air (Aydin et al., 2010). All RICE samples deeper than 500 m were visually inspected for fractures as they were prepared for measurement and for drill fluid during air extraction. In fractured ice it was common to see drill fluid in the flask as the samples were melted. However, neither observation was a strong indicator that a sample would have an elevated methane concentration. None of these high-concentration results were rejected.
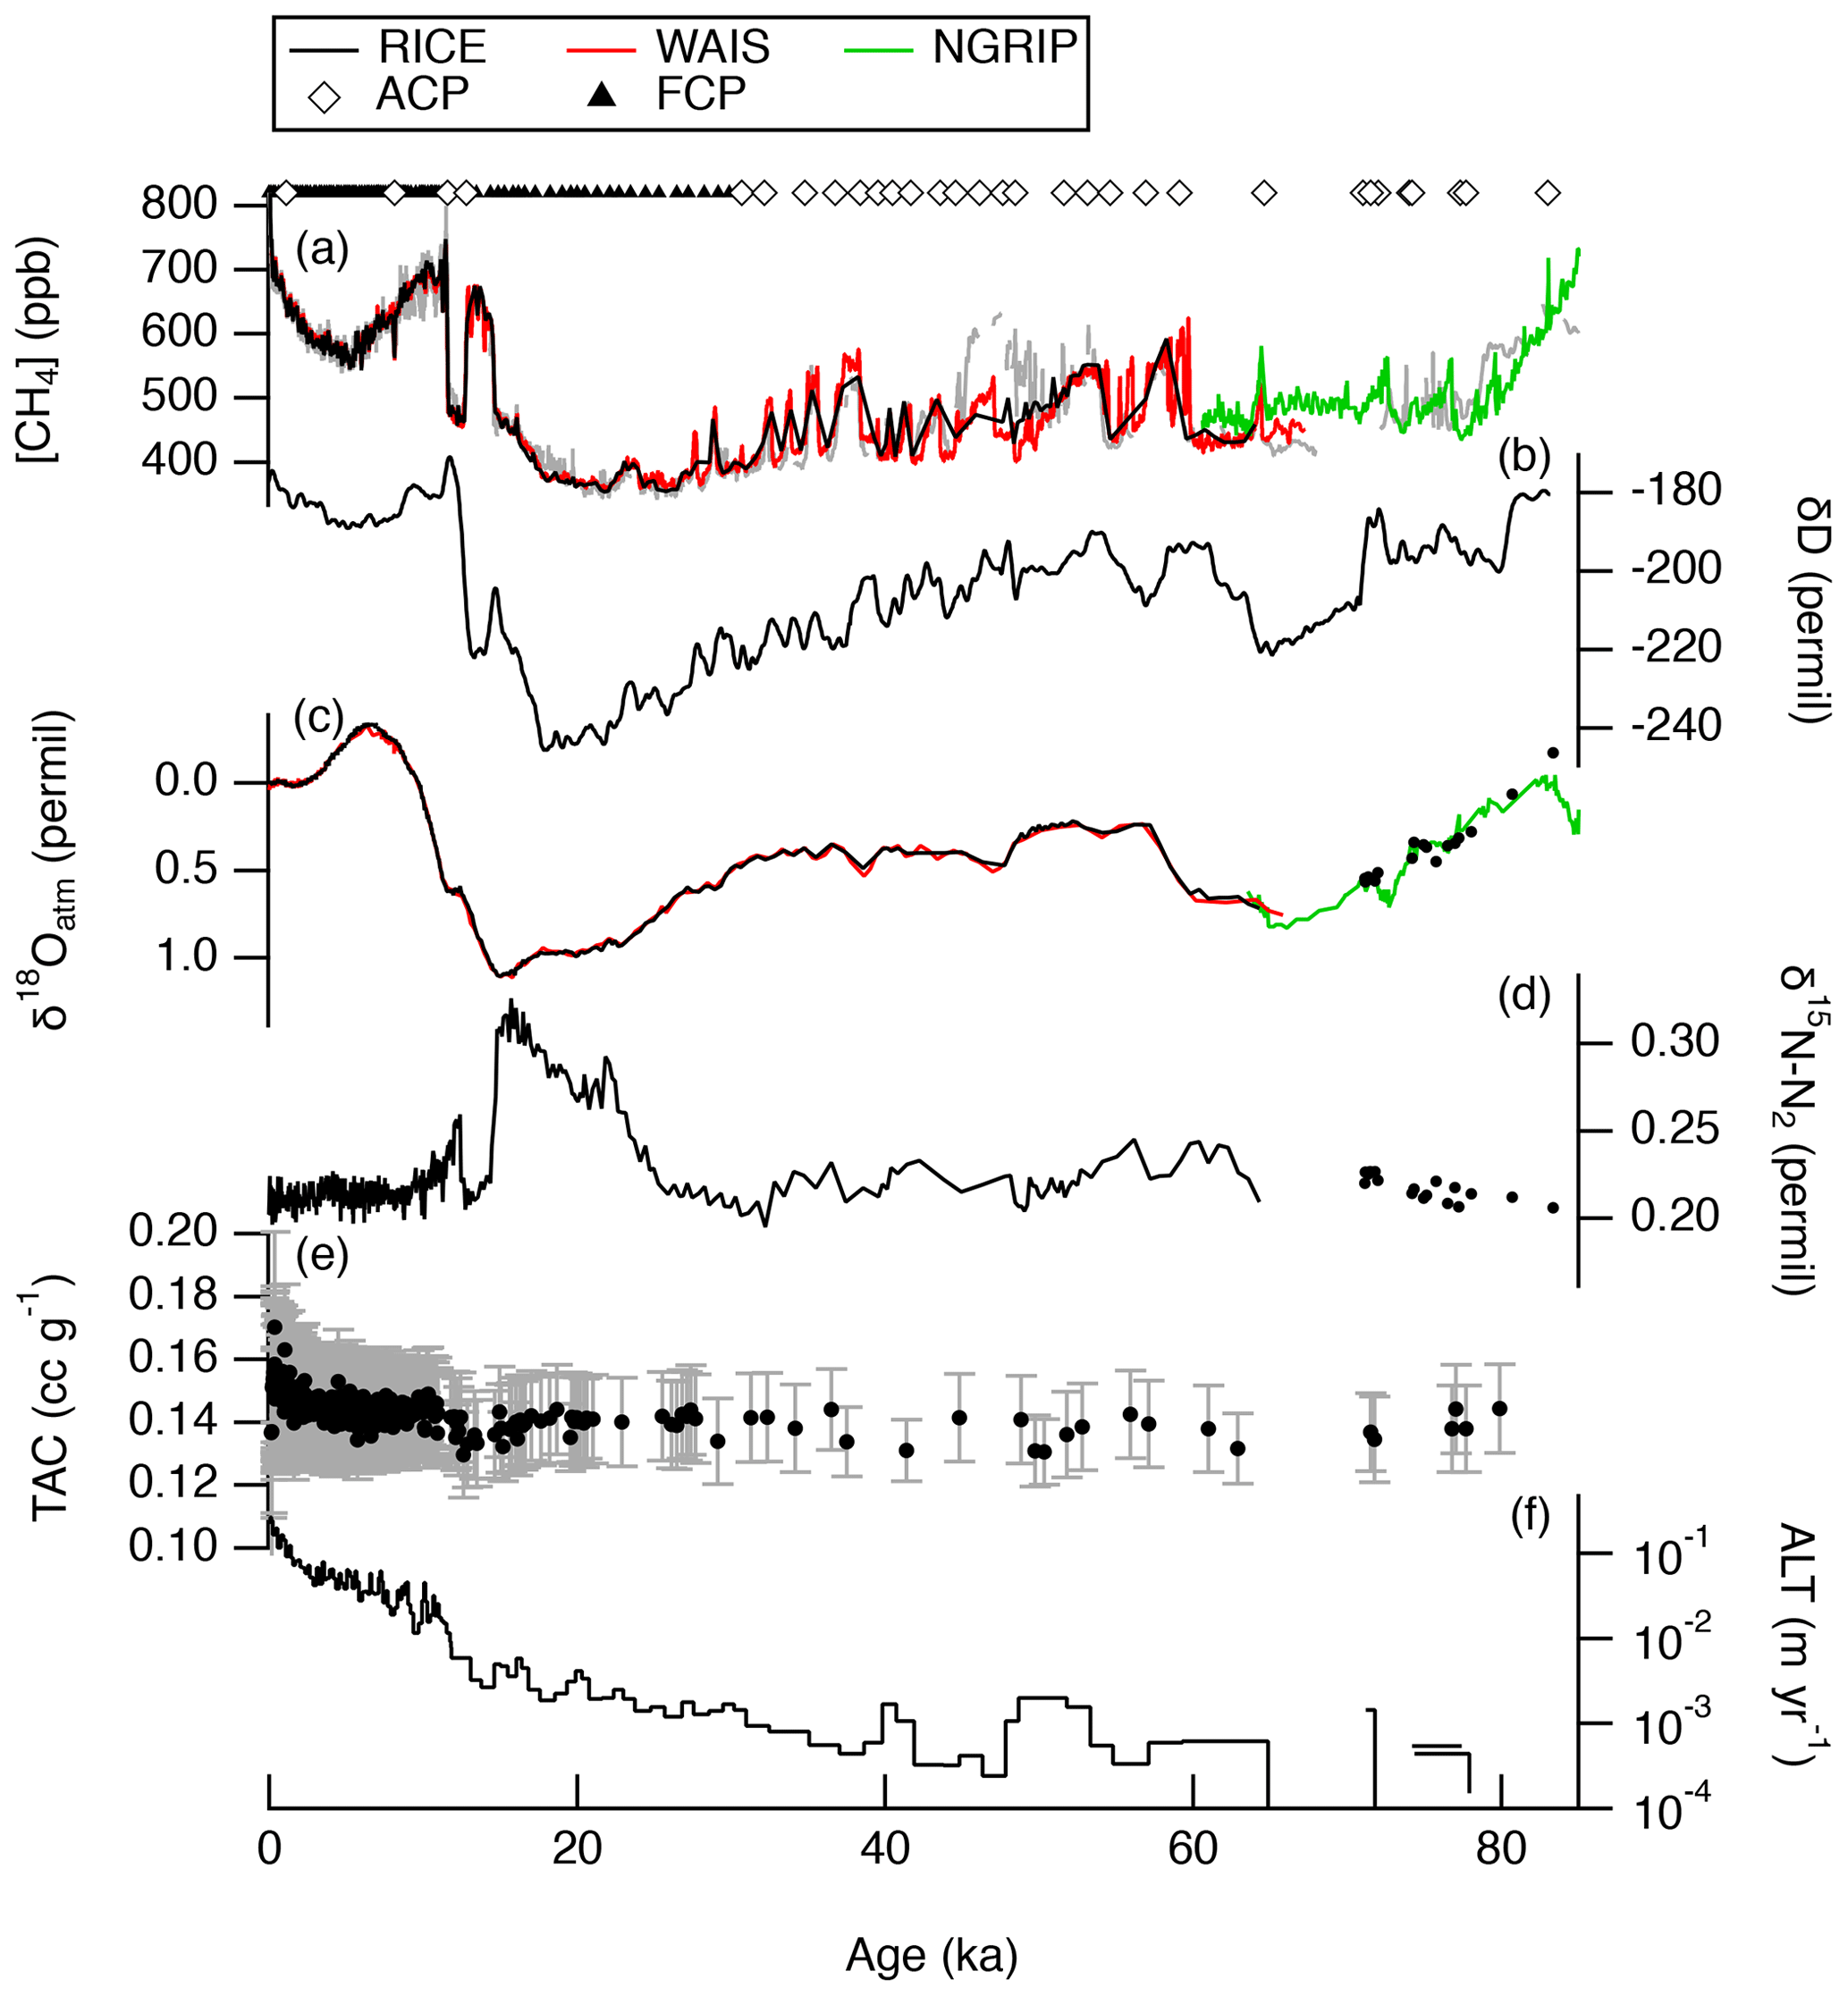
Figure 3Data from the RICE ice core plotted on the RICE17 age-scale. (a) RICE methane and (c) δ18Oatm records (gray) shown in comparison to target records from the WAIS Divide ice core on the WD2014 age-scale (Rhodes et al., 2015; Buizert et al., 2015b) (red) and NGRIP ice core (Baumgartner et al., 2014; Landais et al., 2007) on a modified GICC05modelext chronology (Wolff et al., 2010) (green). Solid triangles above panel (a) are gas age constraints from a Monte Carlo analysis; open diamonds are prior ACPs from visual matching (see text). (b) δD and (d) δ15N-N2 used in a firn densification model to estimate the ice age–gas age offset. (e) RICE TAC measurements. (f) Mean annual layer thickness calculated from gas age control points adjusted for Δage.
3.2 Total air content
Total air content (TAC) is defined as the amount trapped air in a sample, reported here in units of cubic centimeters of air at STP per gram of ice (cm3 g−1). TAC (Fig. 2e, j) was measured at OSU as part of the methane concentration measurement following methodology of Mitchell et al. (2015). TAC is influenced by accumulation and temperature, total summer insolation (Raynaud et al., 2007), thermal gradients in the firn from multiannual climate trends, and surface air pressure (Martinerie et al., 1992; Raynaud and Whillans, 1982).
Preparation of ice samples causes loss of air from bubbles which intersect the surface of the sample, an effect known as the cut-bubble effect (Martinerie et al., 1990). The amount of air lost due to the cut-bubble effect depends on the geometry of the sample and the bubble size. For bubble size, we assume that the bubble diameter at the bubble-close-off depth is the same as at the bubble-close-off depth at WAIS Divide and that the diameter shrinks exponentially to zero at the bubble–clathrate-transition depth (763 m). Ice samples were cut to uniform shapes to limit variability in TAC related to the cut-bubble effect so that TAC can be directly compared between samples. However, inclusion of some fractures was often unavoidable, and their contribution to gas loss is potentially large. TAC data were rejected when gas loss was believed to greatly impact the results, such as in samples with visible fractures or samples which consisted of multiple pieces. Of the 706 samples measured at OSU for TAC, 165 results were rejected based upon visual inspection of the sample. Many of these came from the 670 to 752.95 m (11.7–83 ka) interval where only 58 of 177 TAC measurements are considered reliable. Reproducibility of replicate TAC measurements is 0.7 % after application of a correction for the cut-bubble effect (reproducibility of 0.6 % without correction). Estimate of relative uncertainty in TAC measurements is 28 % with the largest contributions to the uncertainty from the shape of the sample and the assumed bubble diameter used for the cut-bubble correction.
The TAC record from the RICE ice core without the cut-bubble correction appears remarkably consistent (age weighted mean =0.1182 cm3 g−1; age weighted standard deviation =0.0023 cm3 g−1; n=410). After application of the cut-bubble correction, the TAC record shows a trend to higher values at more recent ages (Fig. 3e). This trend reflects the decrease in bubble size with depth and therefore a larger cut-bubble correction for shallower samples. Although this trend has a physical explanation, it is not statistically significant due to the uncertainty in the cut-bubble correction. We advise caution when interpreting the absolute values of TAC from the RICE ice core due to the potential artifacts caused by gas loss through fractures and the large uncertainty in the cut-bubble correction.
3.3 δ18Oatm and δ15N-N2
δ18Oatm and δ15N-N2 were measured on samples adjacent to the discrete methane samples (Fig. 2c, h and d, i, respectively). Analysis was conducted at Scripps Institution of Oceanography following Petrenko et al. (2006) and Severinghaus et al. (2009). Pooled standard deviation of replicate measurements is 0.006 ‰ for δ18Oatm and 0.0027 ‰ for δ15N-N2 (both scales are relative to modern atmospheric composition).
Variations in δ18Oatm are primarily caused by changes in location and intensity of low-latitude rainfall that affect the δ18O of leaf water used in photosynthesis (Severinghaus et al., 2009; Landais et al., 2007, 2010; Seltzer et al., 2017) and changes in seawater δ18O caused by ice sheets on glacial cycles (Horibe et al., 1985; Bender et al., 1985, 1994; Sowers et al., 1993). Importantly, these variations are well known in independently dated ice cores, and the atmosphere is well mixed on the relevant timescales, so δ18Oatm variability may be used as a chronostratigraphic marker (Bender et al., 1994). These variations are well sampled in the RICE record until ∼64.6 ka (746.00 m), beyond which the chronology is no longer continuous.
Atmospheric N2 is isotopically stable over very long timescales (Hattori, 1983; Sowers et al., 1989; Schwander, 1989). Variability in δ15N-N2 in the ice core records primarily reflects changes in gravitational fractionation and thermal fractionation within the firn due to changes in surface temperature and accumulation rate (Schwander, 1989; Sowers et al., 1989). In Antarctica, temperature changes gradually, and the effect of thermal separation is minimal.
3.4 δD
The RICE δD record (Fig. 2b, g) was measured using off-axis integrated cavity output spectroscopy (OA-ICOS) using a Los Gatos Research (LGR) isotope water analyzer (IWA-35EP) in combination with a modified LGR water vapor isotope standard source (WVISS) evaporation unit (Emanuelsson et al., 2015). The data were calibrated using a time-weighted, two-point linear calibration with two standards. The cumulative uncertainty is calculated as the quadrature sum of Allan variance error, scatter over the averaging (15 s) interval (error of the variance) and calibration error (error of the mean). Final mean total uncertainty for the RICE δD record is 0.74 ‰ (Keller et al., 2018). The record shown in Fig. 3b has been smoothed with a 500-year low-pass filter (LOESS filter) and sampled at 50-year intervals. The smoothed δD record is provided in the Supplement to this paper.
In this section, we describe how the RICE17 age-scale is developed. We start with age constraints in the gas-phase based on well-recorded variations in δ18Oatm and methane. We then discuss how the gas age-scale is used to estimate the gas-phase ice-phase age offset and thus the ice age-scale. Finally, we compare the ice age-scale to the age-scale derived from annual layer interpretations.
All age control points (ACPs), additional control points from the synchronization routine (floating control points, discussed below), and gas and ice ages interpolated to more closely spaced depths are provided in the Supplement.
4.1 An automated matching algorithm for synchronizing ice core records: 0–30 ka
An automated matching algorithm was adapted from Huybers and Wunsch (2004) to synchronize between gas records. Prior ACPs, shown as open triangles in Figs. 3 and 4, all correspond to well-defined increases or decreases in either methane or δ18Oatm. We assume that the uncertainty (2 standard deviations) for an ACP corresponds to the time elapsed between 25 % and 75 % of the change in either methane or δ18Oatm (Table 1). The goal of the routine is to iteratively adjust the interpolation between ACPs to improve a goodness of fit parameter by following steps 1–9 described below.
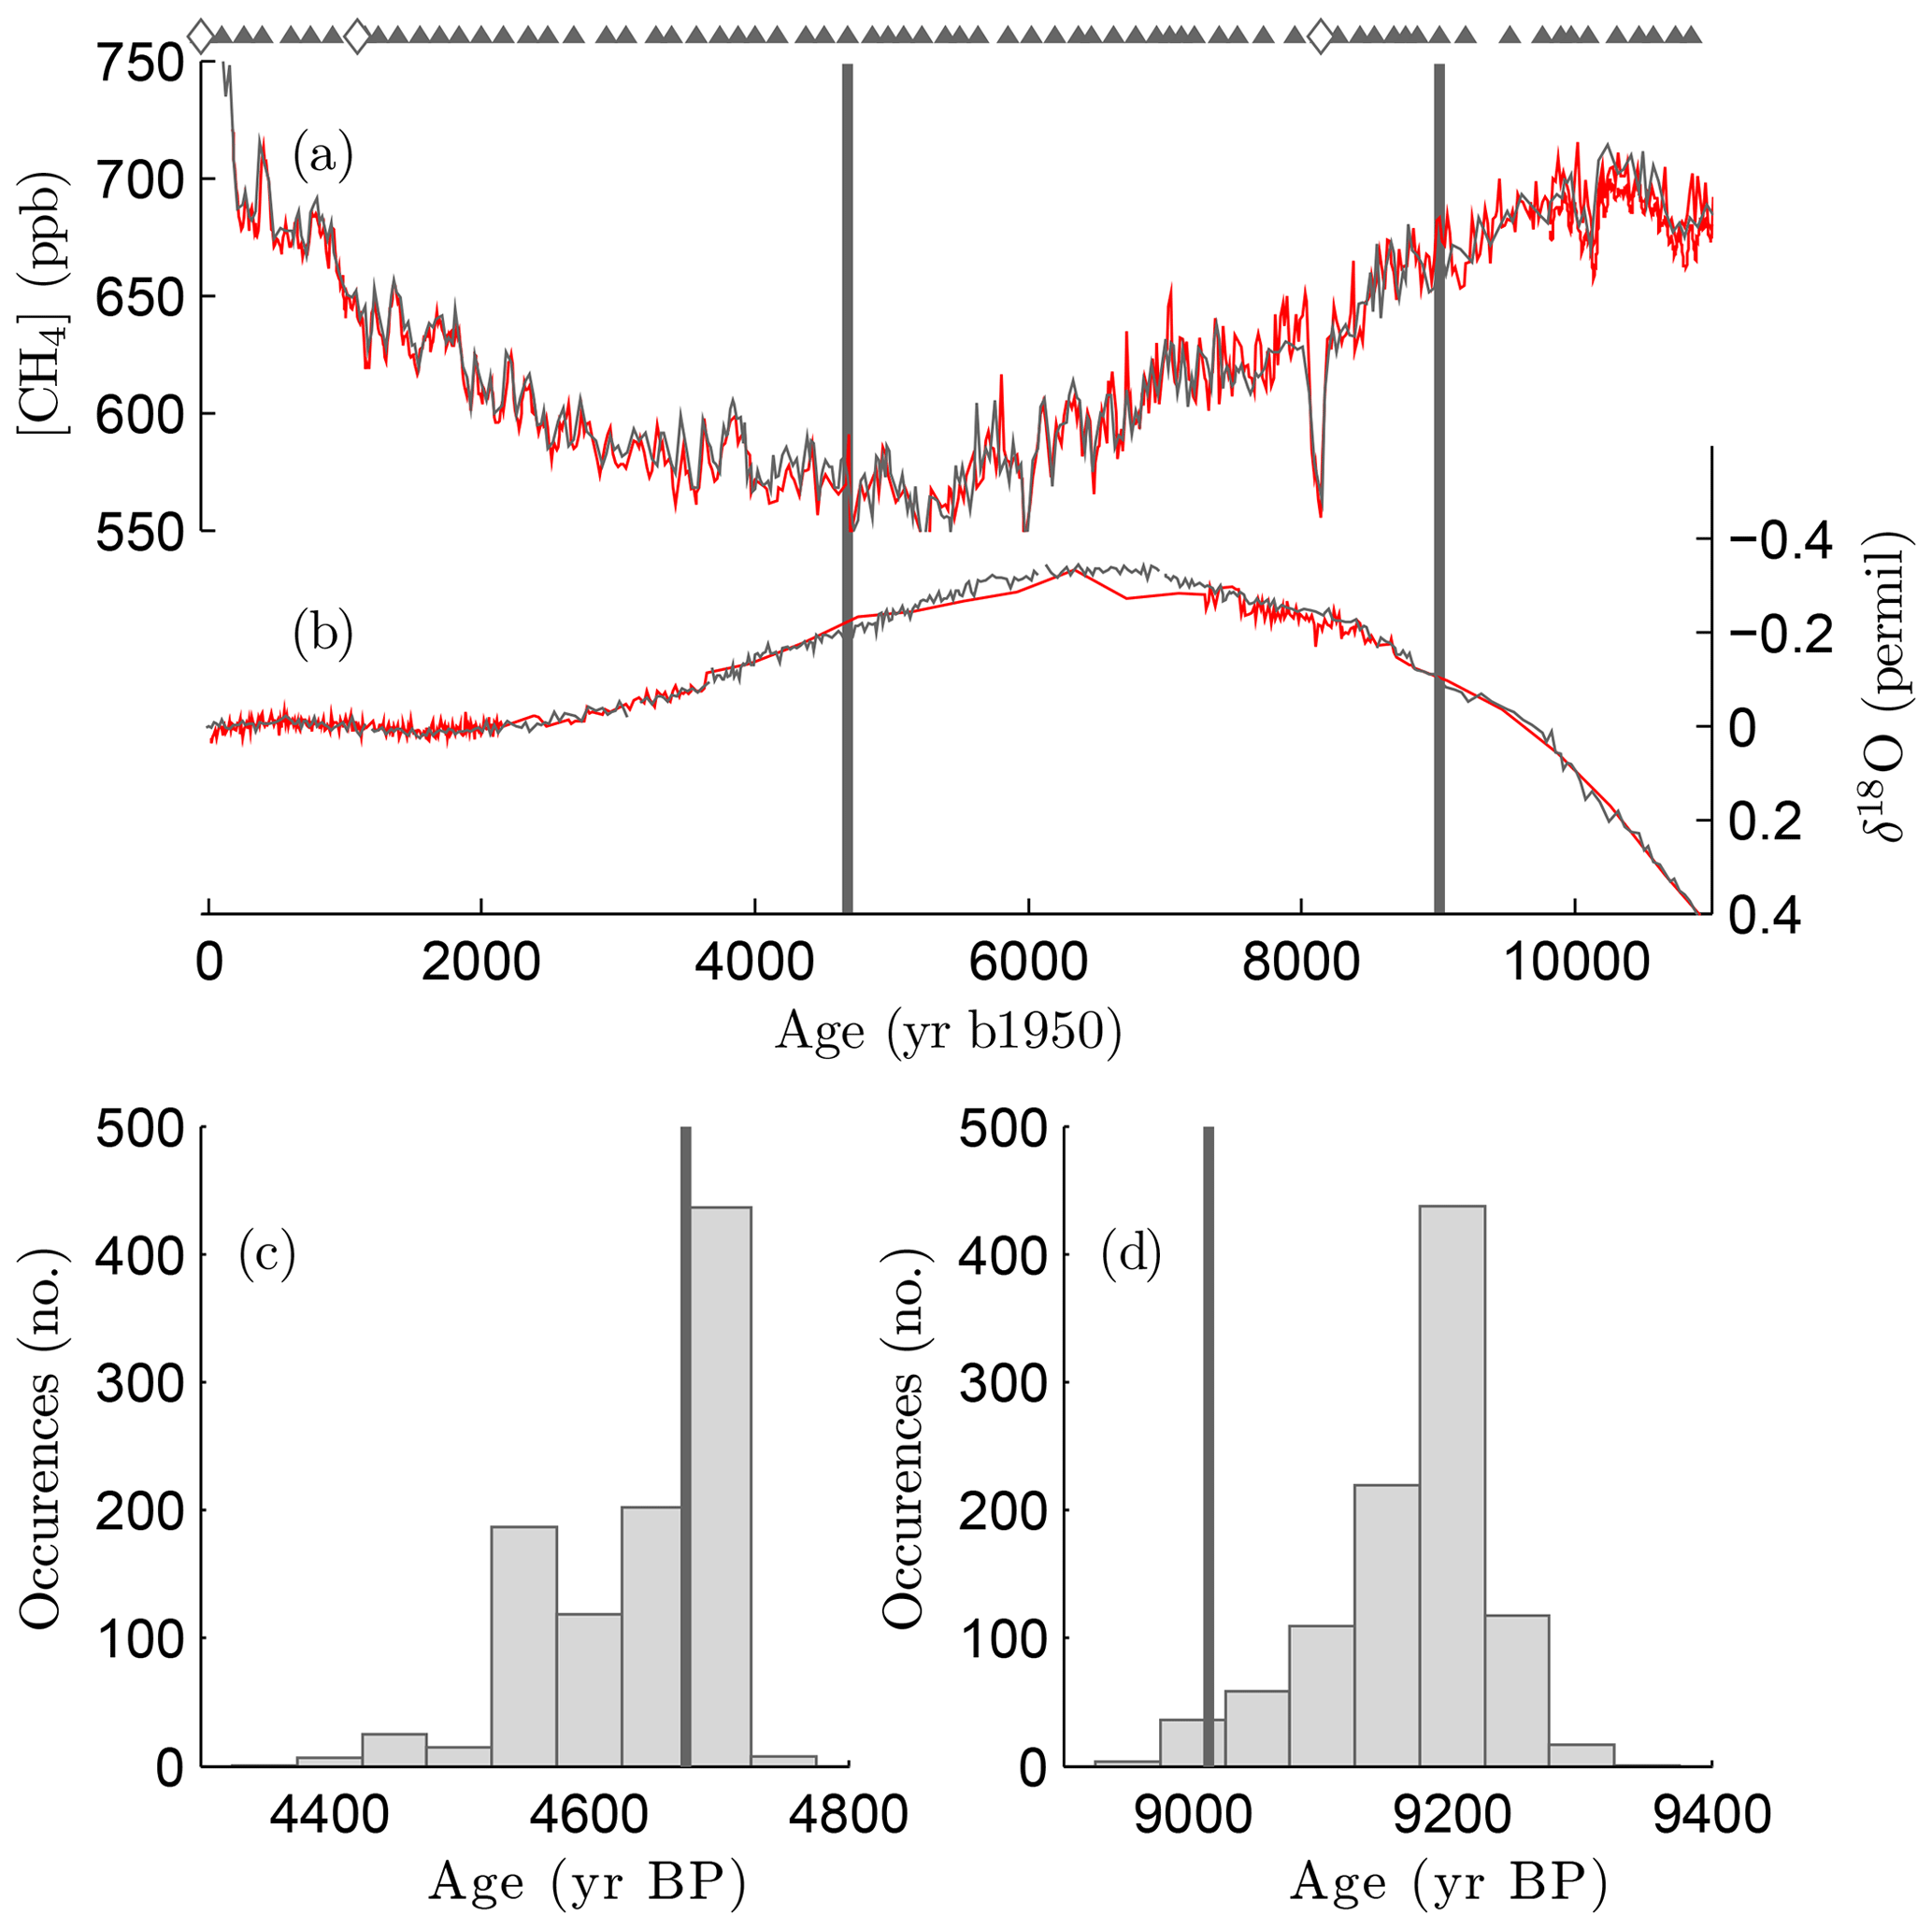
Figure 4(a) RICE methane and (b) δ18Oatm records matched to those from the WAIS Divide ice core (Rhodes et al., 2015; Buizert et al., 2015b) (red lines) for the last 11.7 ka. FCPs from Monte Carlo routine are shown as solid triangles; prior constraints are shown as open diamonds. Lower panels (c, d) show the distribution of the gas ages for two particular depths, 459.05 m (4675 years BP; c) and 621.28 m (9012 years BP; d), resulting from the Monte Carlo analysis. The final age of these depths, resulting from the best realization, are shown as vertical gray lines.
Table 1Prior gas age constraints and uncertainty are based on matching of features in the atmospheric history of methane and δ18Oatm. Name or description of feature are given in the notes and the primary parameter used to identify the feature is provided as the identifying variable. Age uncertainty is related to the duration of the feature; see text.

“Goodness of fit” is calculated as the χ2 value comparing the normalized methane record from the RICE ice core to expectant values interpolated from the WAIS Divide ice core plus the analogous χ2 value comparing the normalized δ18Oatm records. The algorithm can accept additional parameters for synchronization, such as CO2 or N2O, if available. In this analysis we normalized both the methane and δ18Oatm records to have the same mean (5) and variance (1) in order to equally weight their χ2 values and their importance to the synchronization.
A realization starts by randomly perturbing the age of ACPs within their prescribed uncertainty (Table 1) to define an initial depth–age scale. The perturbed ACPs remain fixed throughout the realization. ACPs are given the subscript k, where k=1 is the shallowest (youngest) ACP. The records are then broken into N subsections which are distributed between ACPs. Subsections are designated with a subscript i, where . Floating control points (FCPs) are defined as the bounding depths (ages) of these subsections, which will include the initial ACPs. Prior to any perturbations, the durations of the subsections (Δt) are approximately the same. We have chosen Δt to roughly match the recurrence interval of variations in methane in the reference record and so that each subsection contains about five methane and five δ18Oatm samples. The following steps are repeated to optimize goodness of fit:
-
Random scaling factors (pi), which perturb the durations of the subsections, are drawn for each subsection from a normal distribution of μ=1 and σ1=0.25.
-
Because random perturbations will change the length of time between the initial ACPs, we apply a second scaling so the perturbed chronology remains consistent with the prior ACPs. In this case, ACPk and ACPk+1 are the nearest gas ACPs bounding subsection i, respectively. ACP′ is the perturbed age of the gas age constraint after step 1, and is the duration of the subsection after the second scaling:
-
Mean “accumulation rate” of each subsection () is calculated following Nye (1963), which assumes that the thickness of annual layers () is the product of their original thickness and their relative depth ():
where is the mid-depth of the subsection i, H is the thickness of the ice sheet, and both and H are in ice equivalent units.
Because the assumptions about thinning from Nye (1963) are too simple to describe the flow conditions at Roosevelt Island, we do not consider this result to be representative of the true accumulation history. The assumption is necessary for the purposes of interpolating age versus depth to ensure that annual layer thickness decreases smoothly between FCPs. An accumulation history that we believe is more accurate is calculated below with an alternative method, using a dynamic firn model (Sect. 4.4).
-
A perturbed chronology is only accepted if the following are true:
- a.
Intervals between FCPs () are within a factor of 10 of the initial durations,
- b.
Mean accumulation rates inferred in step 3 are realistic (0 cm ice equivalent per year; cm ice equivalent per year), and
- c.
Mean accumulation rates of adjacent subsections are within a factor of 2 of each other.
These conditions provide loose restrictions for continuity in the depth–age relationship although they may not be physically realistic for the site.
- a.
-
Ages for all RICE sample depths are interpolated from the perturbed FCPs (Step 3), assuming piecewise constant accumulation between FCPs and a linearly decreasing thinning function (Nye, 1963).
-
Goodness of fit is calculated on the perturbed age-scale (goodness of fit = ).
-
When a perturbation improves the goodness of fit, that iteration becomes the base for subsequent perturbations.
-
The cycle is repeated until 20 sequential perturbations fail to improve the goodness of fit in step 6.
-
Starting with the FCPs from step 8, the above steps (1–8) are repeated 13 times, reducing the size of perturbations in step 1 from to .
Table 2Model Parameters used for optimized correlation routine. Code for routine can be found in the Supplement.
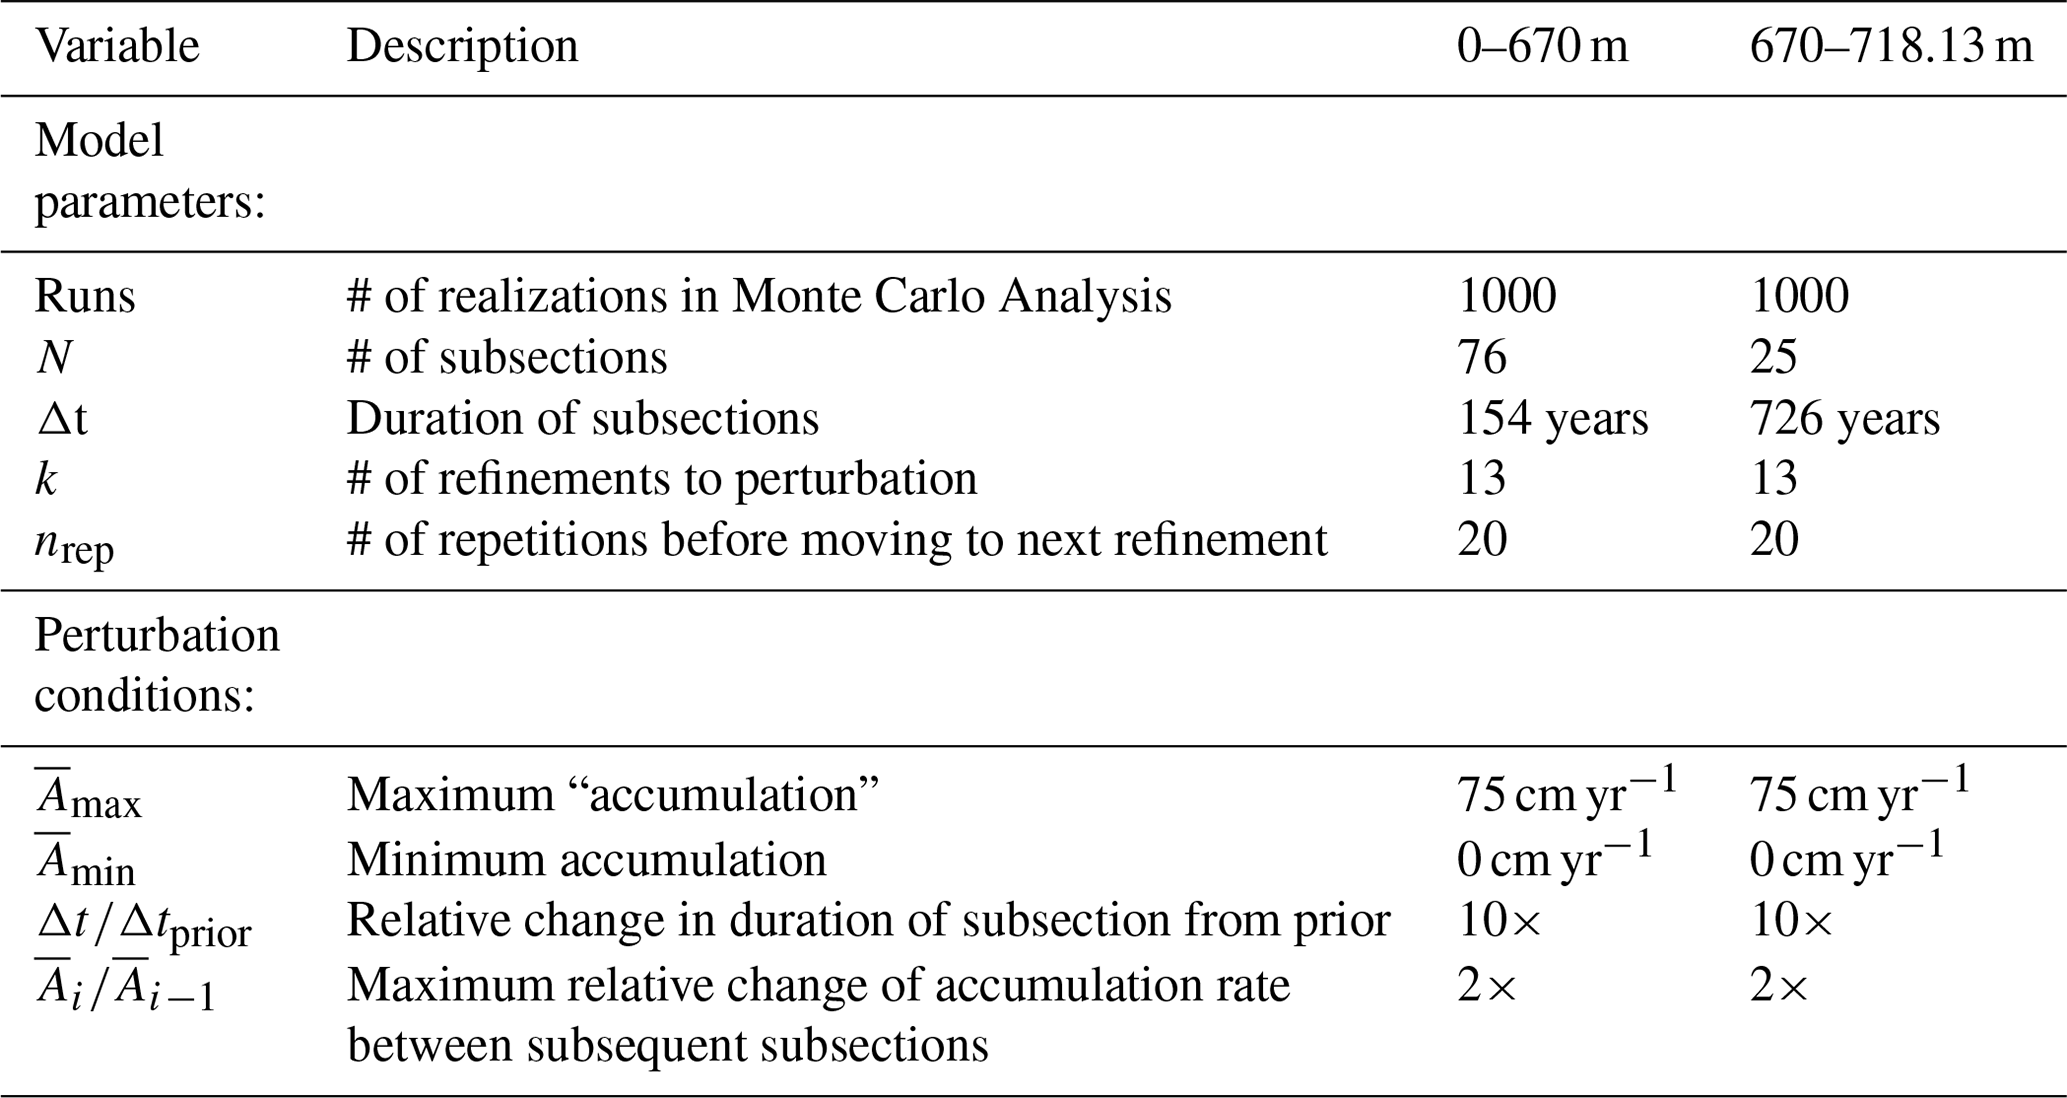
A Monte Carlo analysis repeats these steps (Steps 1–9) 1000 times, initiated from a different prior depth–age relationship by randomly perturbing ACPs within their age uncertainty (Table 1). Parameters used for the synchronization are given in Table 2 for the 60.05–670.13 m and 670.13–719.30 m intervals. Code for the synchronization routine is provided in the Supplement.
We choose the best realization for gas age constraints for the RICE17 gas age-scale. The best age estimate (realization) is not necessarily the most frequent age estimate. Figure 4d shows an example from sample depth 621.28 m where there is a large difference between these two age estimates. Large differences can occur because the prior age estimate (i.e., the age estimate based only on prior ACPs) differs by a large amount from the “true” age of that sample and because the goodness-of-fit parameter considers the fit over the whole record. For depth 621.28 m most realizations resulted in an age estimate of 9200 years BP, similar to its prior age estimate of 9240 years BP, but the best realization estimated the age to be 9012 years BP. There are two possible reasons for this type of result: (1) this realization is the best because it managed to push the age of this sample by >200 years towards younger ages while not significantly changing the ages of nearby sections which already fit well or (2) no significant improvement in the goodness of fit was found by adjusting the age of this depth, and the goodness of fit was dictated by other sections of the record.
Uncertainty in gas age constraints is calculated as the root-mean-square error of FCP ages from the 1000 Monte Carlo realizations (Fig. 5d), although we acknowledge that this can overly simplify the empirical distribution of possible ages for a given depth (Fig. 4). Assessing uncertainty in this way integrates two types of error. The first is the ability to exactly match timing of two features. This uncertainty is determined by how well features are resolved in the records, measurement error, and the limited degrees of freedom in synchronization (i.e., the synchronization routine assumes constant accumulation during each subsections in a piecewise manner, although the true accumulation history is more likely to smoothly vary). The second type of error is analogous to deciding which feature in the reference record is the correct match. For example, the methane peak centered at 459.05 m (4675 years BP) is, in some realizations, matched to a peak at ∼4550 years BP in the WAIS Divide record, providing two distinct age possibilities (Fig. 4c).
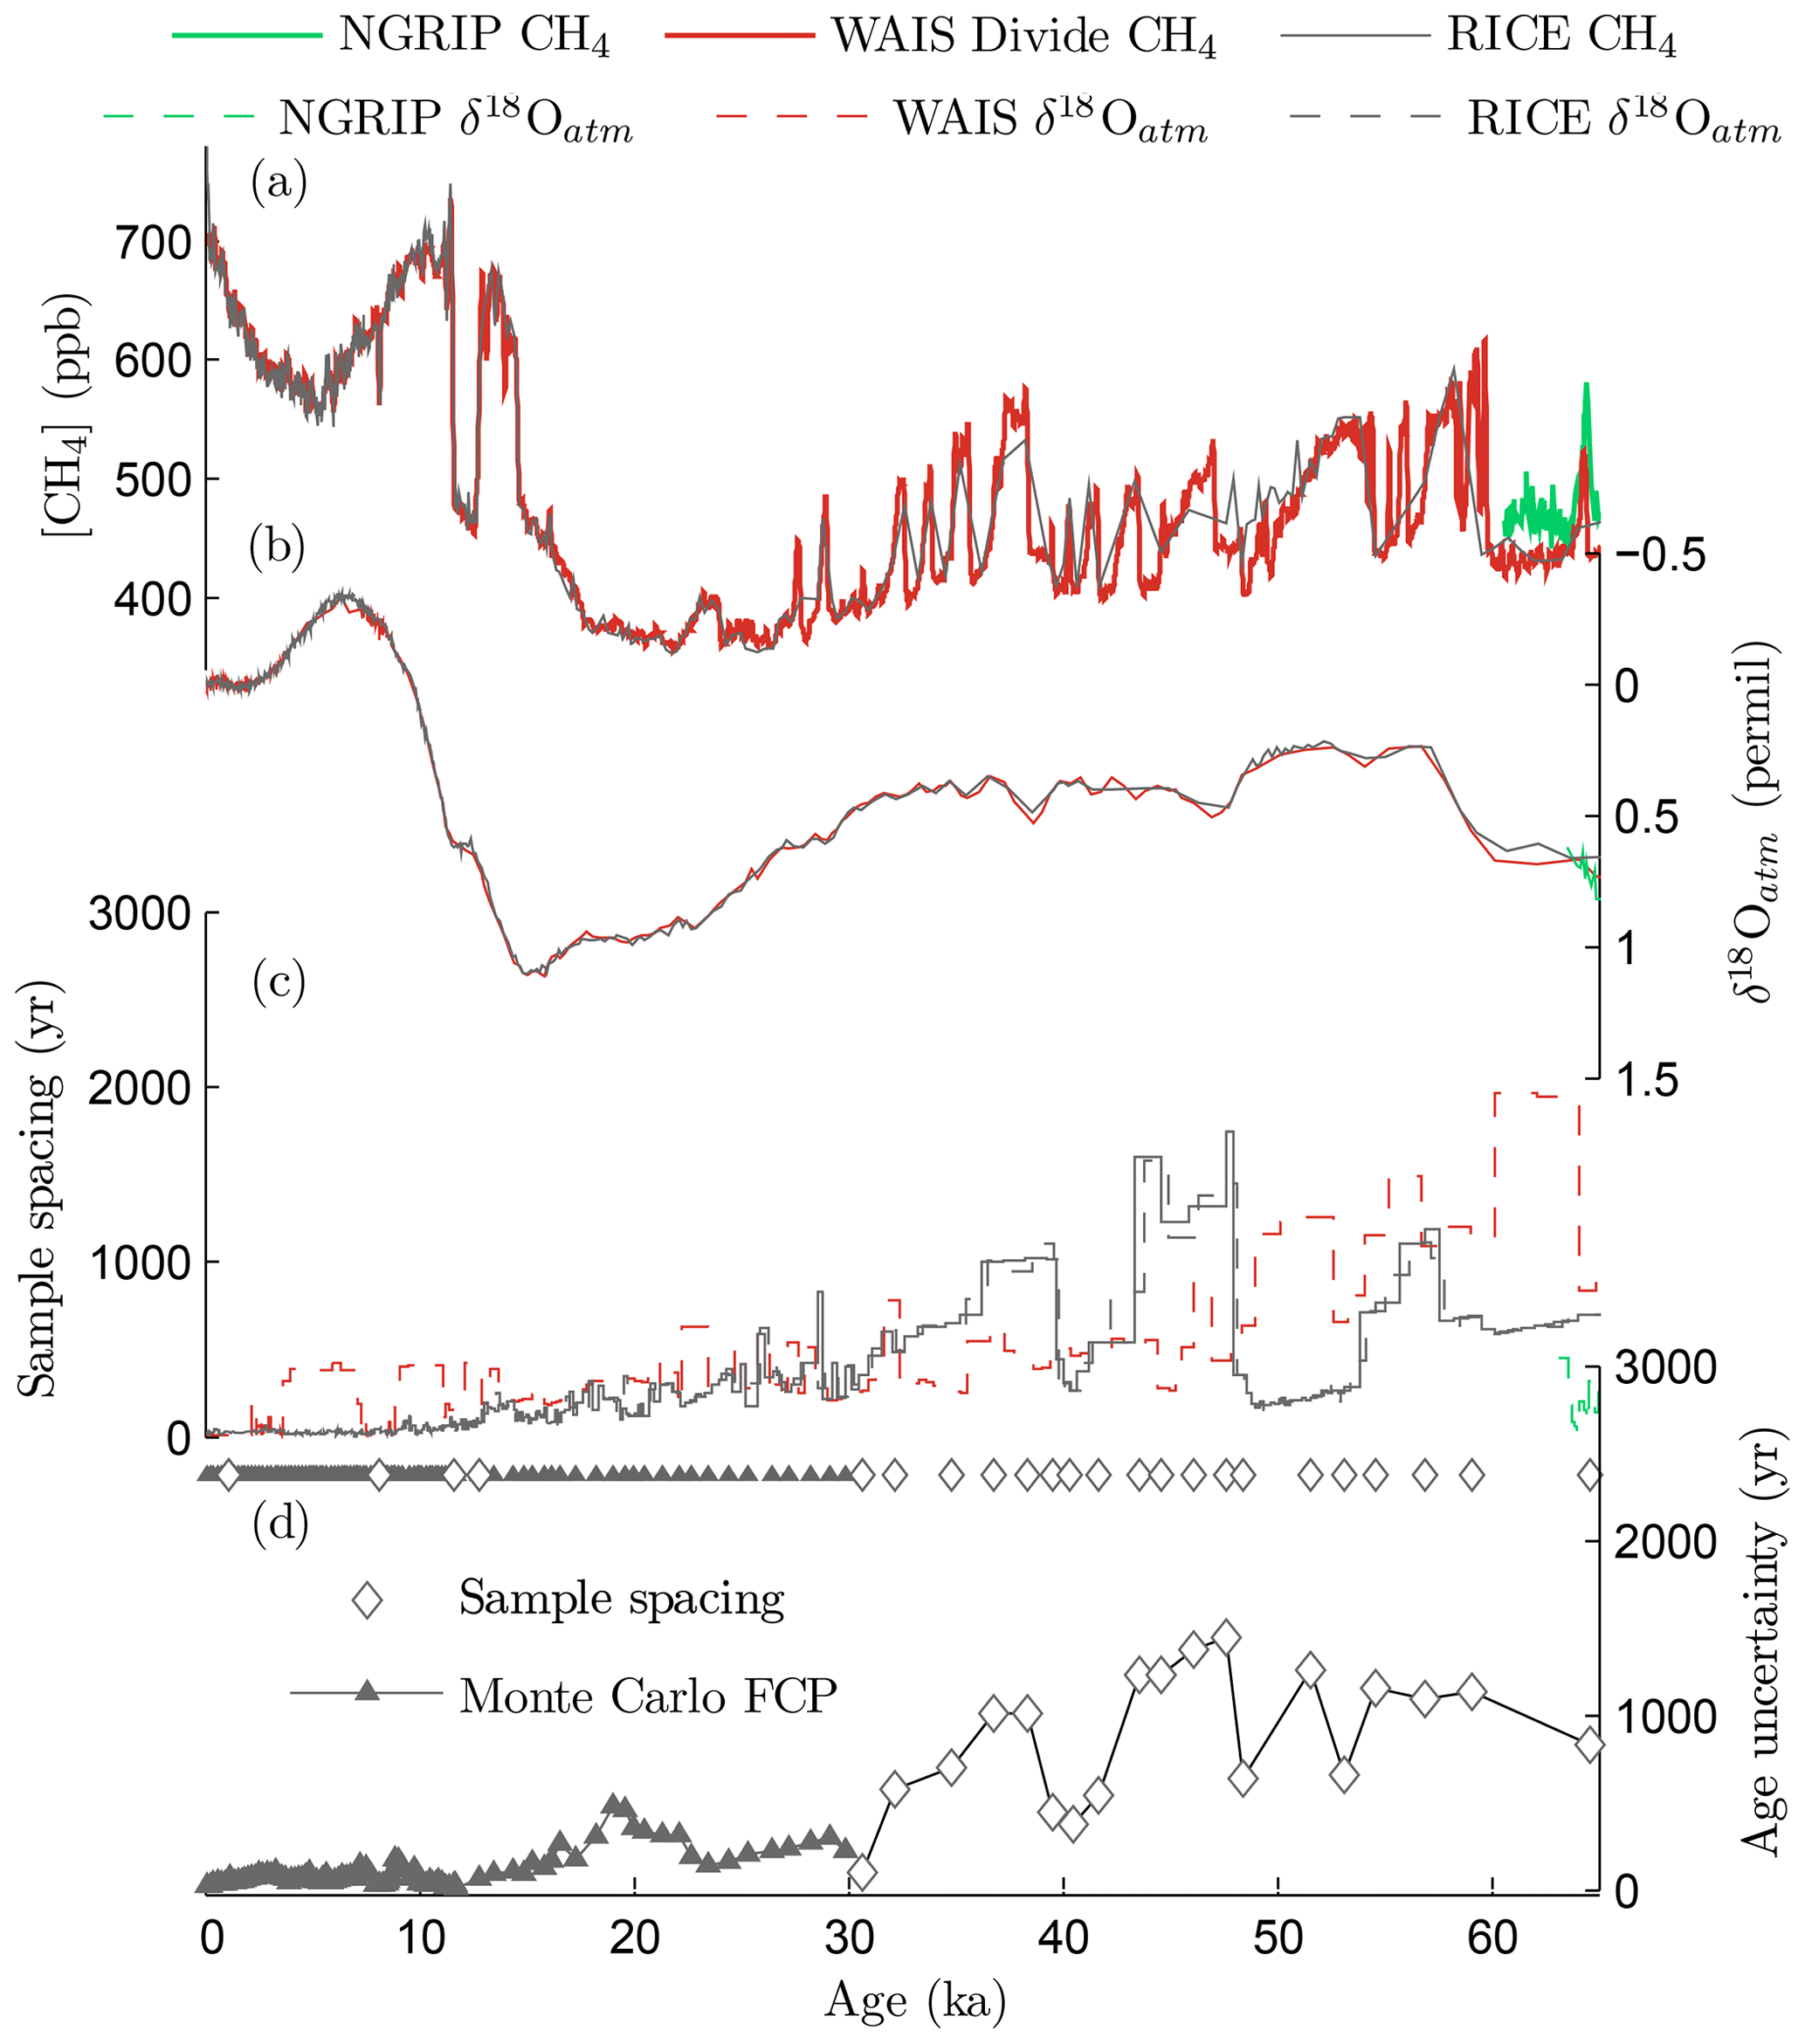
Figure 5RICE ice core age uncertainty. (a) Methane and (b) δ18Oatm records from the RICE (gray), WAIS Divide (Rhodes et al., 2015; Buizert et al., 2015b) (red), and NGRIP ice cores (Baumgartner et al., 2014) (green). (c) Sample spacing for methane (solid lines) and δ18Oatm (dashed lines) for the various cores. (d) Gas age uncertainty, relative to WD2014, for ages determined from a Monte Carlo analysis (solid triangles) and for extended gas age control points (open diamonds).
4.2 Extending the chronology with visually matched gas age control points: 30–83 ka
The more limited resolution of the RICE methane record below 719.3 m (30.66 ka) prevented use of the automated synchronization routine. Gas age control points were visually chosen between 719.30 m (30.66 ka) and 746.00 m (65.6 ka) and between 746.00 and 752.95 m (∼83 ka) (Table 1). Between 719.30 (30.66 ka) and 746.00 m (65.6 ka), ACPs were visually chosen by comparing the RICE discrete and CFA methane records and the δ18Oatm record to the WAIS Divide methane (Rhodes et al., 2015) and δ18Oatm records (Buizert et al., 2015b).
The WAIS Divide records and the WD2014 chronology end at 67.8 ka. For the deeper (older) section of the RICE ice core, between 746.00 and 752.95 m, we build target records from records of methane and δ18Oatm from the NGRIP ice core (Baumgartner et al., 2014; Landais et al., 2007, 2010). Using the NGRIP ice core is internally consistent with the WD2014 chronology, which is tied to a modified GICC05modelext age-scale between 30 and 67.8 ka (Buizert et al., 2015b). Because NGRIP is in the Northern Hemisphere the methane concentration is higher than that in the RICE record. To account for this interpolar difference, we scale the NGRIP target methane record (Baumgartner et al., 2014) to Antarctic values using an empirical least-squares fit between WAIS and NGRIP records between 55 and 67.8 ka.
Buizert et al. (2015b) found that the annual-layer-counted portion of the GICC05modelext chronology (0–60 ka) (Andersen et al., 2006; Svensson et al., 2008) is systematically younger than ages of corresponding features found in the U–Th absolute dated Hulu speleothem record (Reimer et al., 2013; Southon et al., 2012). A fit to Hulu ages was optimized by scaling the GICC05modelext ages linearly by 1.0063. This suggests that on average 6.3 out of every 1000 annual layers were not counted. For our NGRIP-based target records we adjust the NGRIP age-scale by adopting the scaling of Buizert et al. (2015b). Older ages in the GICC05modelext chronology are derived from the ss09sea Dansgaard–Johnsen model (Johnsen et al., 2001; NGRIP Community Members, 2004). We have added a constant 378 years (0.0063×60 000) for depths older than 60 ka in the target GICC05modelext ages to make this section continuous with the adjusted annual-layer-counted section.
Synchronization requires well-sampled identifiable features in both records. We estimate age uncertainty for visually matched ACPs (ACPs older than 29.9 ka) as the larger of the sample spacing of the two records being synchronized, following methods of Brook et al. (2005). Gas age uncertainty is plotted in Fig. 5d. The largest uncertainty is ∼1500–1700 years and occurs between 41.7 and 47.6 ka, where the age-scale is very compressed, and the RICE records are coarsely sampled.
4.3 Age control points in the disturbed ice: 746–753 m
Continuity of the RICE ice core appears to end at 746.00 m below surface, where a discontinuity of 20 ‰ is observed in the δD record (746.00–746.10 m) (Fig. 6b), and a 0.35 ‰ change is observed between sequential δ18Oatm samples (745.81 and 746.20 m) (Fig. 6c). The continuous chronology described in the previous section dates this ice to the end of DO-18 (∼64.6 ka). This age is supported by very negative δD values and a trend to more enriched values at shallower depths, which is consistent with warming trends observed in other Antarctic ice cores at this time period (Buizert et al., 2015b; EPICA Community Members, 2006; Petit et al., 1999; Parrenin et al., 2013) (Fig. 6f).
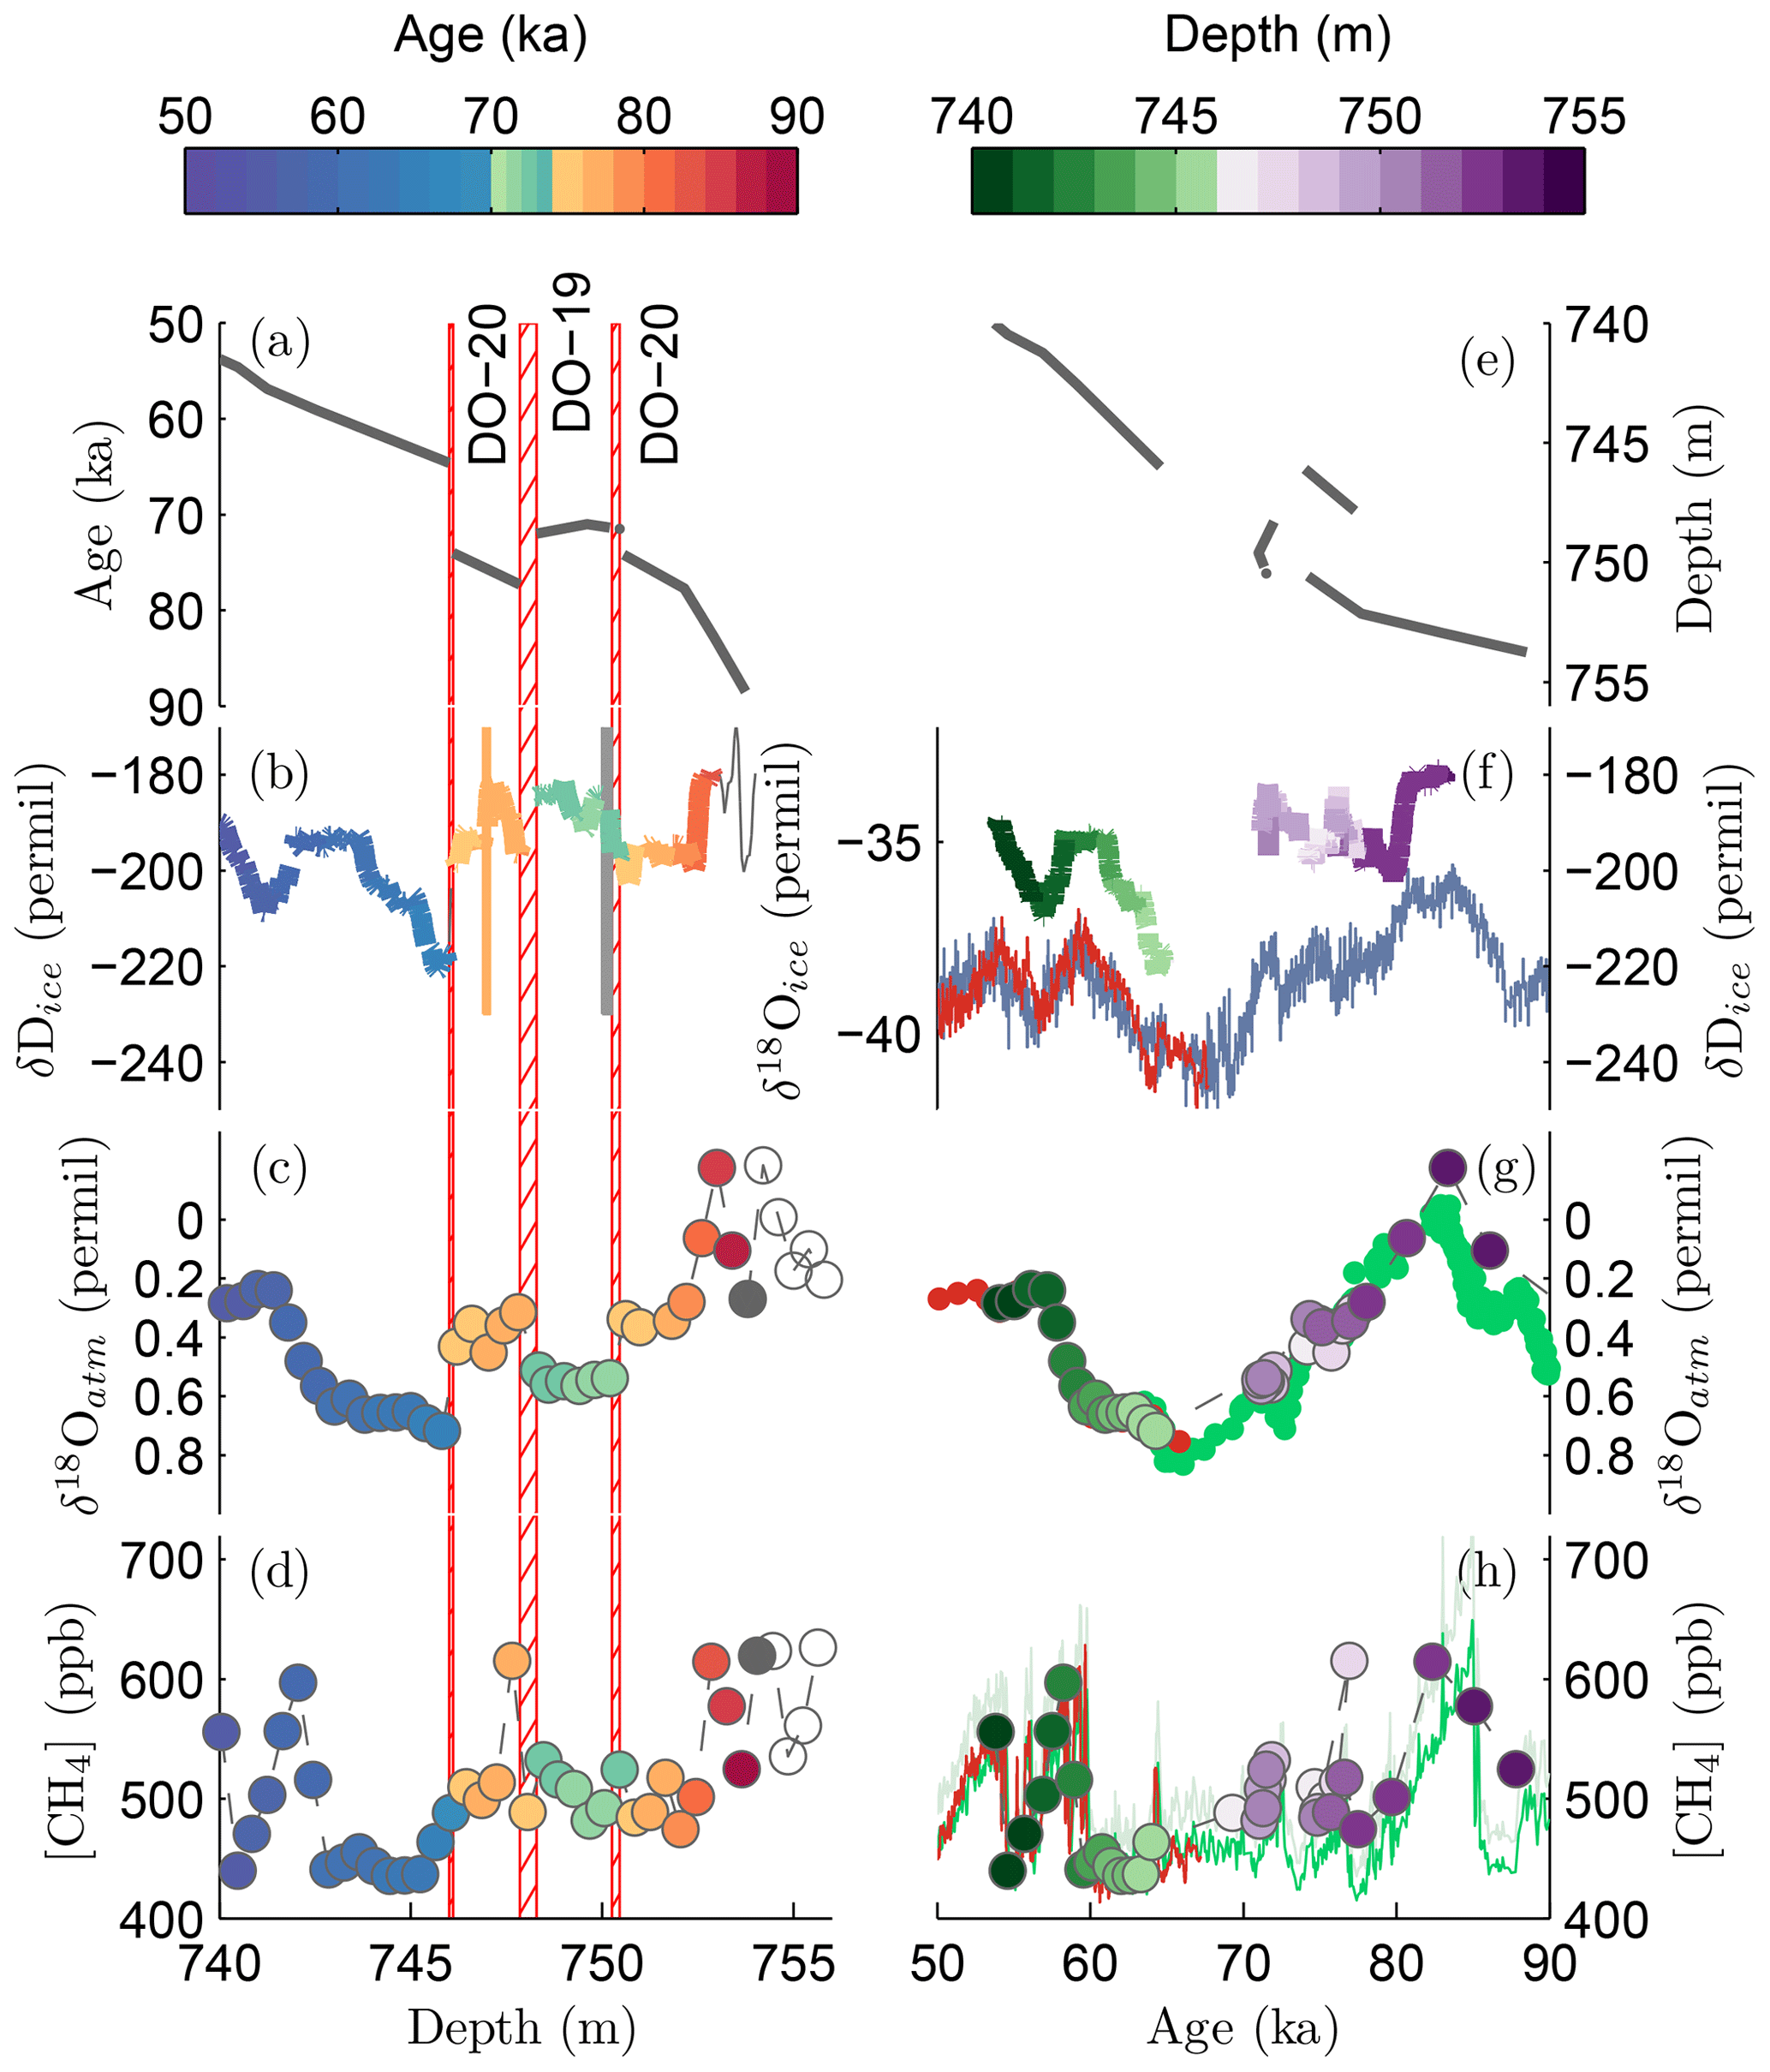
Figure 6(a) Depth–age relationship from 740 to 756 m and evidence of an age reversal within the RICE ice core from (b) δD, (c) δ18Oatm, and (d) methane data. (b–d) Measurements are plotted against depth and color coded according to the age of the sample. Open circles represent samples for which an age could not be determined. (a–d) Red hatched bars represent discontinuities, where periods of climate history appear to be missing. Solid gray bars in panel (b) are measurement gaps in the δD record associated with large changes in δD. (e–h) The depth–age relationship and measurements are plotted against the age of the sample and color coded according to depth. WAIS Divide data (red), NGRIP (green), and the EDML δ18Oice record (blue).
Figure 6 presents our best effort to date the ice in the disturbed section, between 746.00 and 752.95 m. The left panel of Fig. 6 shows the data as a function of depth, color-coded by age. The right panel shows the reconstructed time history of these variables, color-coded by depth. Below, we discuss how the ages are assigned to different depth sections (divided by vertical red lines in the left side of Fig. 6), starting with the shallowest portion. Dating folded ice remains challenging, and the solution we found may not be unique.
Immediately below the discontinuity, between 746.10 and 747.85 m, methane and δ18Oatm values best match our target records during DO-20 between 74.5 and 77.3 ka (Fig. 6), although the RICE methane record appears ∼30 ppb too high. Dating of this section to DO-20 implies either that 9.4 ka of climate history is absent from the RICE ice core because climate was not recorded or that 9.4 ka is compressed into ∼10 cm of ice. Extremely thin layers can be explained by ice flow or by an absence of accumulation, but the latter scenario would cause a collapse of the firn and δ15N-N2 values approaching 0 ‰, which is not observed.
A cluster of samples between 747.85 and 750.46 m are ∼ 0.16 ‰ more enriched in δ18Oatm than was observed in the shallower section dated to DO-20 (Fig. 6c). In the NGRIP, EDML, and Siple Dome ice cores, a long-term trend in δ18Oatm towards more enriched values is observed from 80 to 65 ka (Capron et al., 2010; Severinghaus et al., 2009; Landais et al., 2007) (Fig. 6g). The enriched values between 748.34 and 750.46 m most likely indicate that this ice is younger than the adjacent shallower depths and that the stratigraphic order is reversed. This depth range is best matched to DO-19 between 71.8 and 74.3 ka (Fig. 6). Below 750.46 m, methane and δ18Oatm return to values that best match DO-20.
We note that two significant measurement gaps exist in the δD record, at 746.89–747.07 and at 750.00–750.25 m (vertical bars in Fig. 6b). A 12 ‰ shift in δD accompanies both of these gaps. The second measurement gap (750.46–750.56 m) is at nearly the same depth which separates the samples dating to DO-19 from the grouping immediately below dated to DO-20. The discontinuity of the δD record at these gaps may signify another hiatus in the climate record or highly contorted layers that are typically found around folds (Cunningham and Waddington, 1990; Alley et al., 1997; Thorsteinsson and Waddington, 2002; Waddington et al., 2001).
Below 750.46 meters, trends in methane and δ18Oatm indicate that the age of ice increases with depth until at least 753 m (∼83 ka). Age of this depth is constrained by a measured δ18Oatm value of −0.175 ‰. Such a depleted value is rare and only occurs during periods of high sea level and small ice sheets, the most recent time period prior to the Holocene being MIS-5a (80–85 ka) (Severinghaus et al., 2009; Capron et al., 2010; Petit et al., 1999; Landais et al., 2007; Kawamura et al., 2007). Negative values were observed at two other depths below 753 m (Fig. 2h), but the stratigraphic order of these depths is difficult to assess.
4.4 Firn modeling to determine Δage
Air transport in the firn causes an age difference between ice and air trapped in the ice, commonly referred to as Δage. Firn densification models are typically used to simulate past Δage (Schwander et al., 1997; Goujon et al., 2003). Input parameters (for example, temperature, accumulation rate, and surface density) are normally the largest sources of uncertainty. Using δ15N-N2 as a proxy for past firn column thickness and assuming δD records past site temperature faithfully, firn densification models can be run in an inverse mode to estimate both past Δage and accumulation rates (Buizert et al., 2014, 2015b), which is the approach we employ here.
We use a dynamic version of the Herron–Langway model (Herron and Langway, 1980), which was also used for construction of the WD2014 chronology (Buizert et al., 2015b). The model simulates firn compaction rates and vertical heat diffusion and advection. The model domain is the full 763 m ice column at 0.5 m resolution; a time step of 1 year is used. The model simulates both gravitational enrichment of δ15N-N2 and fractionation in the presence of thermal gradients. The model is forced with a temperature history derived from the δD record assuming a constant isotope sensitivity of 6 ‰ K−1 (Brook et al., 2005). A smoothed (500 years LOESS filter) version of the δD data is shown in Fig. 3b and provided in the Supplement. The Δage model uses a heat diffusion model to determine firn temperatures. Differences between patterns of modeled temperature variation and that assumed from the smoothed δD record are minor (equivalent to Δage variations of decades, within model uncertainty). The assumed isotope-temperature sensitivity is similar to that observed for West Antarctica (Stenni et al., 2017; Cuffey et al., 2016; Masson-Delmotte et al., 2008) but somewhat higher than that obtained by comparing the RICE isotope record to ERA interim data (Bertler et al., 2018). The dependency of Δage on the assumed isotope sensitivity was explored in a model sensitivity test (Appendix C) and is incorporated into the Δage uncertainty estimates. The model further assumes a constant ice thickness, a constant 2 m convective zone similar to other high-accumulation dome sites with low mean wind speeds (Kawamura et al., 2006; Landais et al., 2006), surface firn density of 400 kg m−3 to match the modern surface firn density, and geothermal heat flux of 78 mW m−2.
In a first iteration, we assume a prior ice age-scale for the temperature history by adding a constant 150 years to the gas chronology (Sect. 4.1 and 4.2). A new Δage solution is then calculated using the dynamic firn densification model. The Δage solution (and thereby the ice age-scale) is refined iteratively until it no longer changes appreciably (consistent within ∼1 year).
The climate at Roosevelt Island, with high accumulation and relatively warm temperatures, results in small Δage values and consequently relatively low absolute uncertainty in Δage compared to most Antarctic sites. Modern Δage (estimated at 60 m depth, the shallowest measurement of δ15N-N2) is 146 years with a reconstructed lock-in depth (LID) of 48 m, consistent with the modern density profile (Bertler et al., 2018; Winstrup et al., 2019). Holocene Δage is small, ranging between 140 and 182 years. During the last glacial period, simulated Δage values fluctuate between ∼150 and 350 years.
Uncertainties in past Δage include the uncertainty in model inputs as well as the model itself. The uncertainty in the Herron–Langway model is conservatively estimated to be 20 %, based on differences between firn models (Lundin et al., 2017). We assessed the uncertainty due to model inputs using a steady-state Herron–Langway model that approximates the dynamic version but requires less computational time (Appendix C). In a sensitivity test, we randomly perturb the parameterizations of temperature and LID and assumptions of convective-zone thickness, surface firn density, and geothermal heat flux and recalculate the Δage solution (model parameters and their base values and ranges used in the sensitivity test are provided in Table C1). A total of 6000 iterations were run. The sensitivity tests include a wide range of temperature histories to account for the possibility that some variations in δD were caused by nonthermal effects such as variability in precipitation seasonality, moisture sources and pathways, and post-depositional vapor exchange. Model sensitivity is reported as the root-mean-square error of Δage calculations for each depth. Combined Δage uncertainty, provided in the included age-scale, is the root sum squares of the model uncertainty and the model sensitivity.
4.5 Comparison of gas-derived and layer counted chronologies: 0–2649 years BP
The gas-derived ice age-scale provides a chronology from 60 to 753 m depth (Fig. 2) that is independent of but overlaps the annual-layer-counted section (0–343.7 m; Winstrup et al., 2019). Figure 7 shows both chronologies and differences between them (positive values indicate that the annual layer counts are older than the gas-derived ages). The gas-derived ice age-scale agrees well with the annual-layer-counted age-scale, within 33 years, with similar trends in the implied annual layer thickness (Fig. 7c). Differences between chronologies can result from error in the synchronization of gas records, calculation of Δage for either the RICE or WAIS Divide ice cores, interpolation between ACPs, or annual layer counts in either core (because the WAIS Divide age-scale is used as a reference for the gas age-scale).
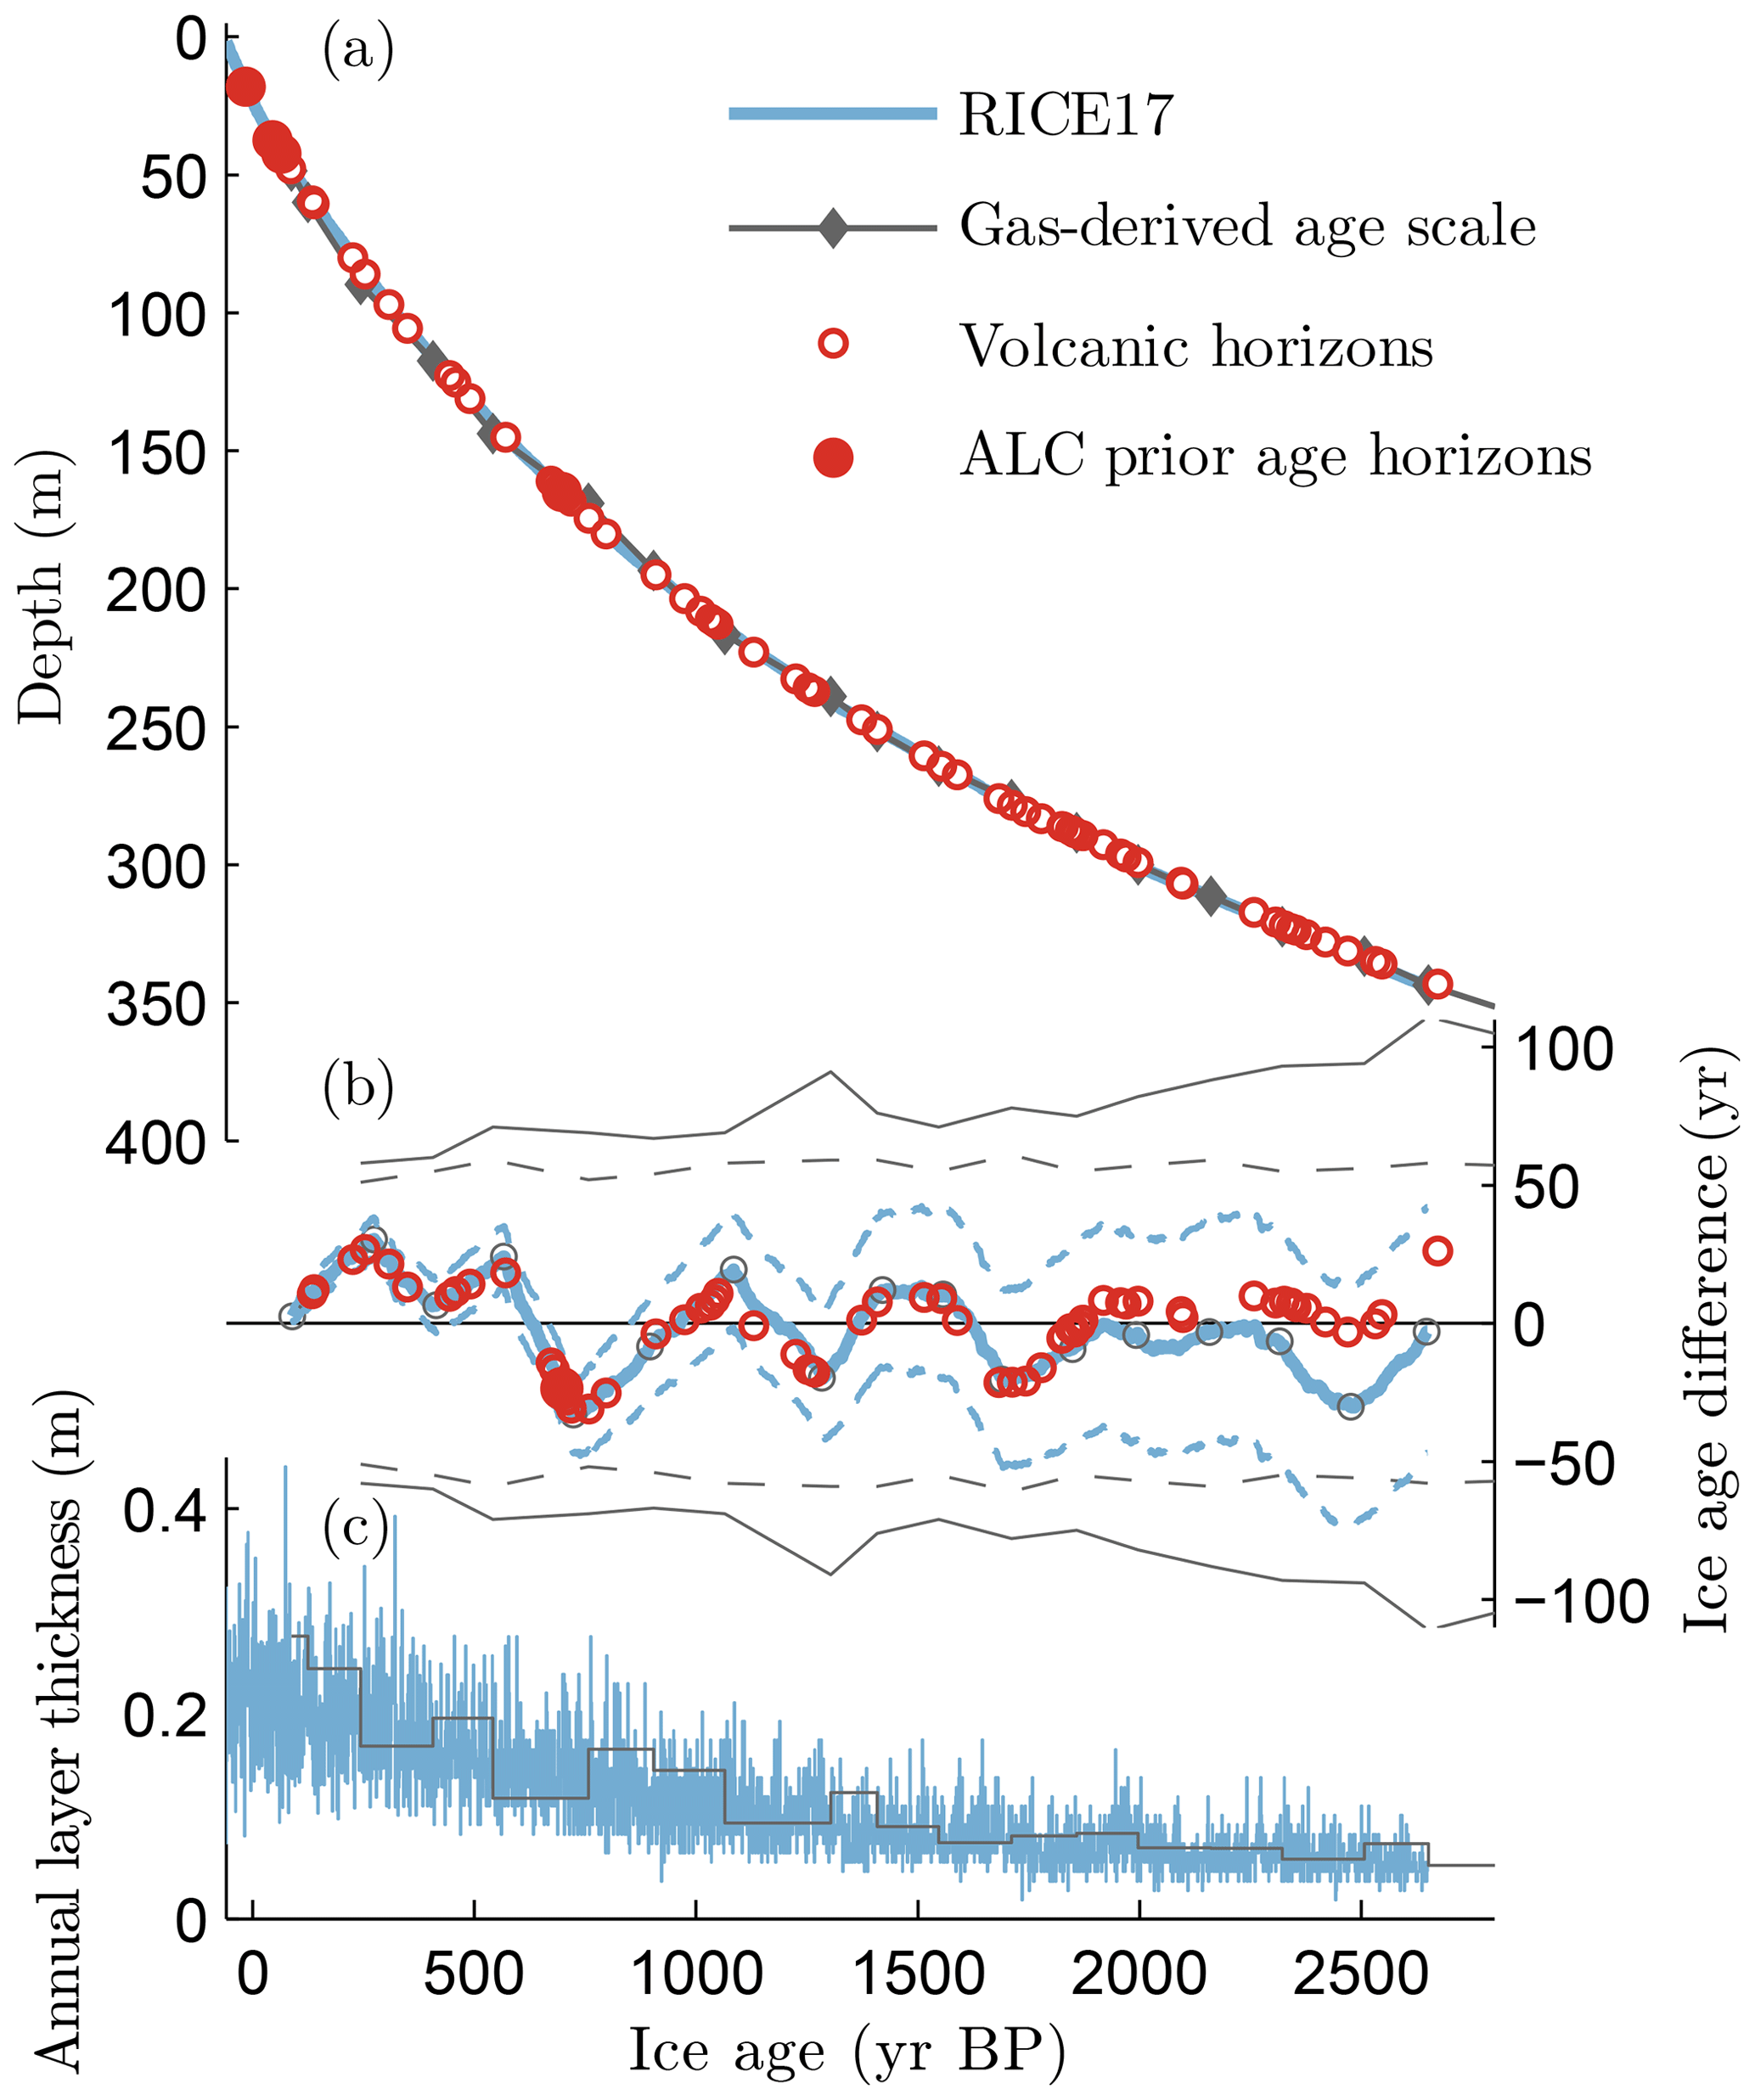
Figure 7Comparison of the gas-derived (gray) and the annual-layer-counted ice age-scale (blue; Winstrup et al., 2019). Six absolute age markers (closed red circles) were identified, and an additional 67 volcanic horizons were cross correlated to volcanic horizons in the WAIS Divide core (plotted on WD2014 ice age-scale, open red circles; Winstrup et al., 2019). (b) Difference in ice age between the gas-derived ice age-scale and annual layer counts; positive values indicate that at the same depth the annual layer counts are older than in the gas-derived age-scale. Uncertainty estimates of the gas-derived ice age-scale (solid gray lines), the Δage estimate only (dashed gray lines), and the annual-layer-counted age-scale (blue dashed lines). (c) Interpretations of annual layer thickness from the gas-derived ice age-scale and annual layer interpretations.
The average age difference at depths of FCPs is −1 years (n=18, implied age from gas-derived ice age-scale being older than the layer counted chronology). Root mean square of the age difference is 17.3 years. Discrete points in the gas-derived ice age-scale can also be compared to the age of 67 volcanic peaks identified in the RICE ice core and correlated to peaks identified in the WAIS Divide ice core (open red circles in Fig. 7; Winstrup et al., 2019). Compared to these volcanic peaks, the root-mean-square ice age difference in the gas-derived ice age-scale is 13.6 years from their WD2014 ages. Good agreement between the two approaches gives confidence in the methodology used for the deeper section of the RICE17 chronology. The two largest differences occur at 89.72 m (243 years BP) and at 169.11 m (757 years BP) and are +30 and −33 years, respectively (Fig. 7b). These offsets are similar in magnitude to the individual uncertainties in calculating Δage or in synchronizing the gas records. The small age differences between the two ice chronologies also indicate that our approach to calculating uncertainty is likely conservative.
The RICE17 timescale transitions between the annual-layer-counted and gas-derived age-scales at 343.7 m, the deepest (oldest) FCP for which annual layers were identifiable (Sect. 4.1). The age difference at this depth is 3 years, with the gas-derived ice age implying an older age than the annual-layer-counted chronology. This age difference is much less than the respective age uncertainties of 45 and 111 years (2σ) for the annual layer counts and gas-derived ice age-scale, respectively. Because of the good agreement between the two ice age-scales, no correction is made for the 3-year offset, and the annual-layer-counted age is used.
5.1 Implied accumulation history of Roosevelt Island
From 65 to 32 ka, the low variability in δ15N-N2, ranging from 0.20 ‰ to 0.24 ‰, and the cooling trend observed for Antarctica for this time period suggest a decreasing trend in accumulation (Fig. 3).
While δ15N-N2 values appear steady from 65 to 32 ka and during the Holocene (Fig. 3d), they exhibit large variability between 32 and 10 ka (Fig. 8a). δ15N-N2 generally trends to heavier values beginning at 32 until 14.71 ka, indicating a growing firn column. An inflection point is observed at 25.3 ka, which is interpreted as an acceleration of firn thickening concluding in a peak of 0.293 ‰ at 21.8 ka. After a short depletion the steep trend resumed with a second δ15N-N2 maximum of 0.326 ‰ reached at 15.7 ka. Following this maximum, δ15N-N2 abruptly decreased from 0.308 ‰ to 0.220 ‰ at 14.71 ka, which corresponds with the beginning of the Antarctic Cold Reversal (ACR). At 12.38 ka, after the ACR, δ15N-N2 partially recovers to pre-ACR values with an abrupt increase to 0.260 ‰.
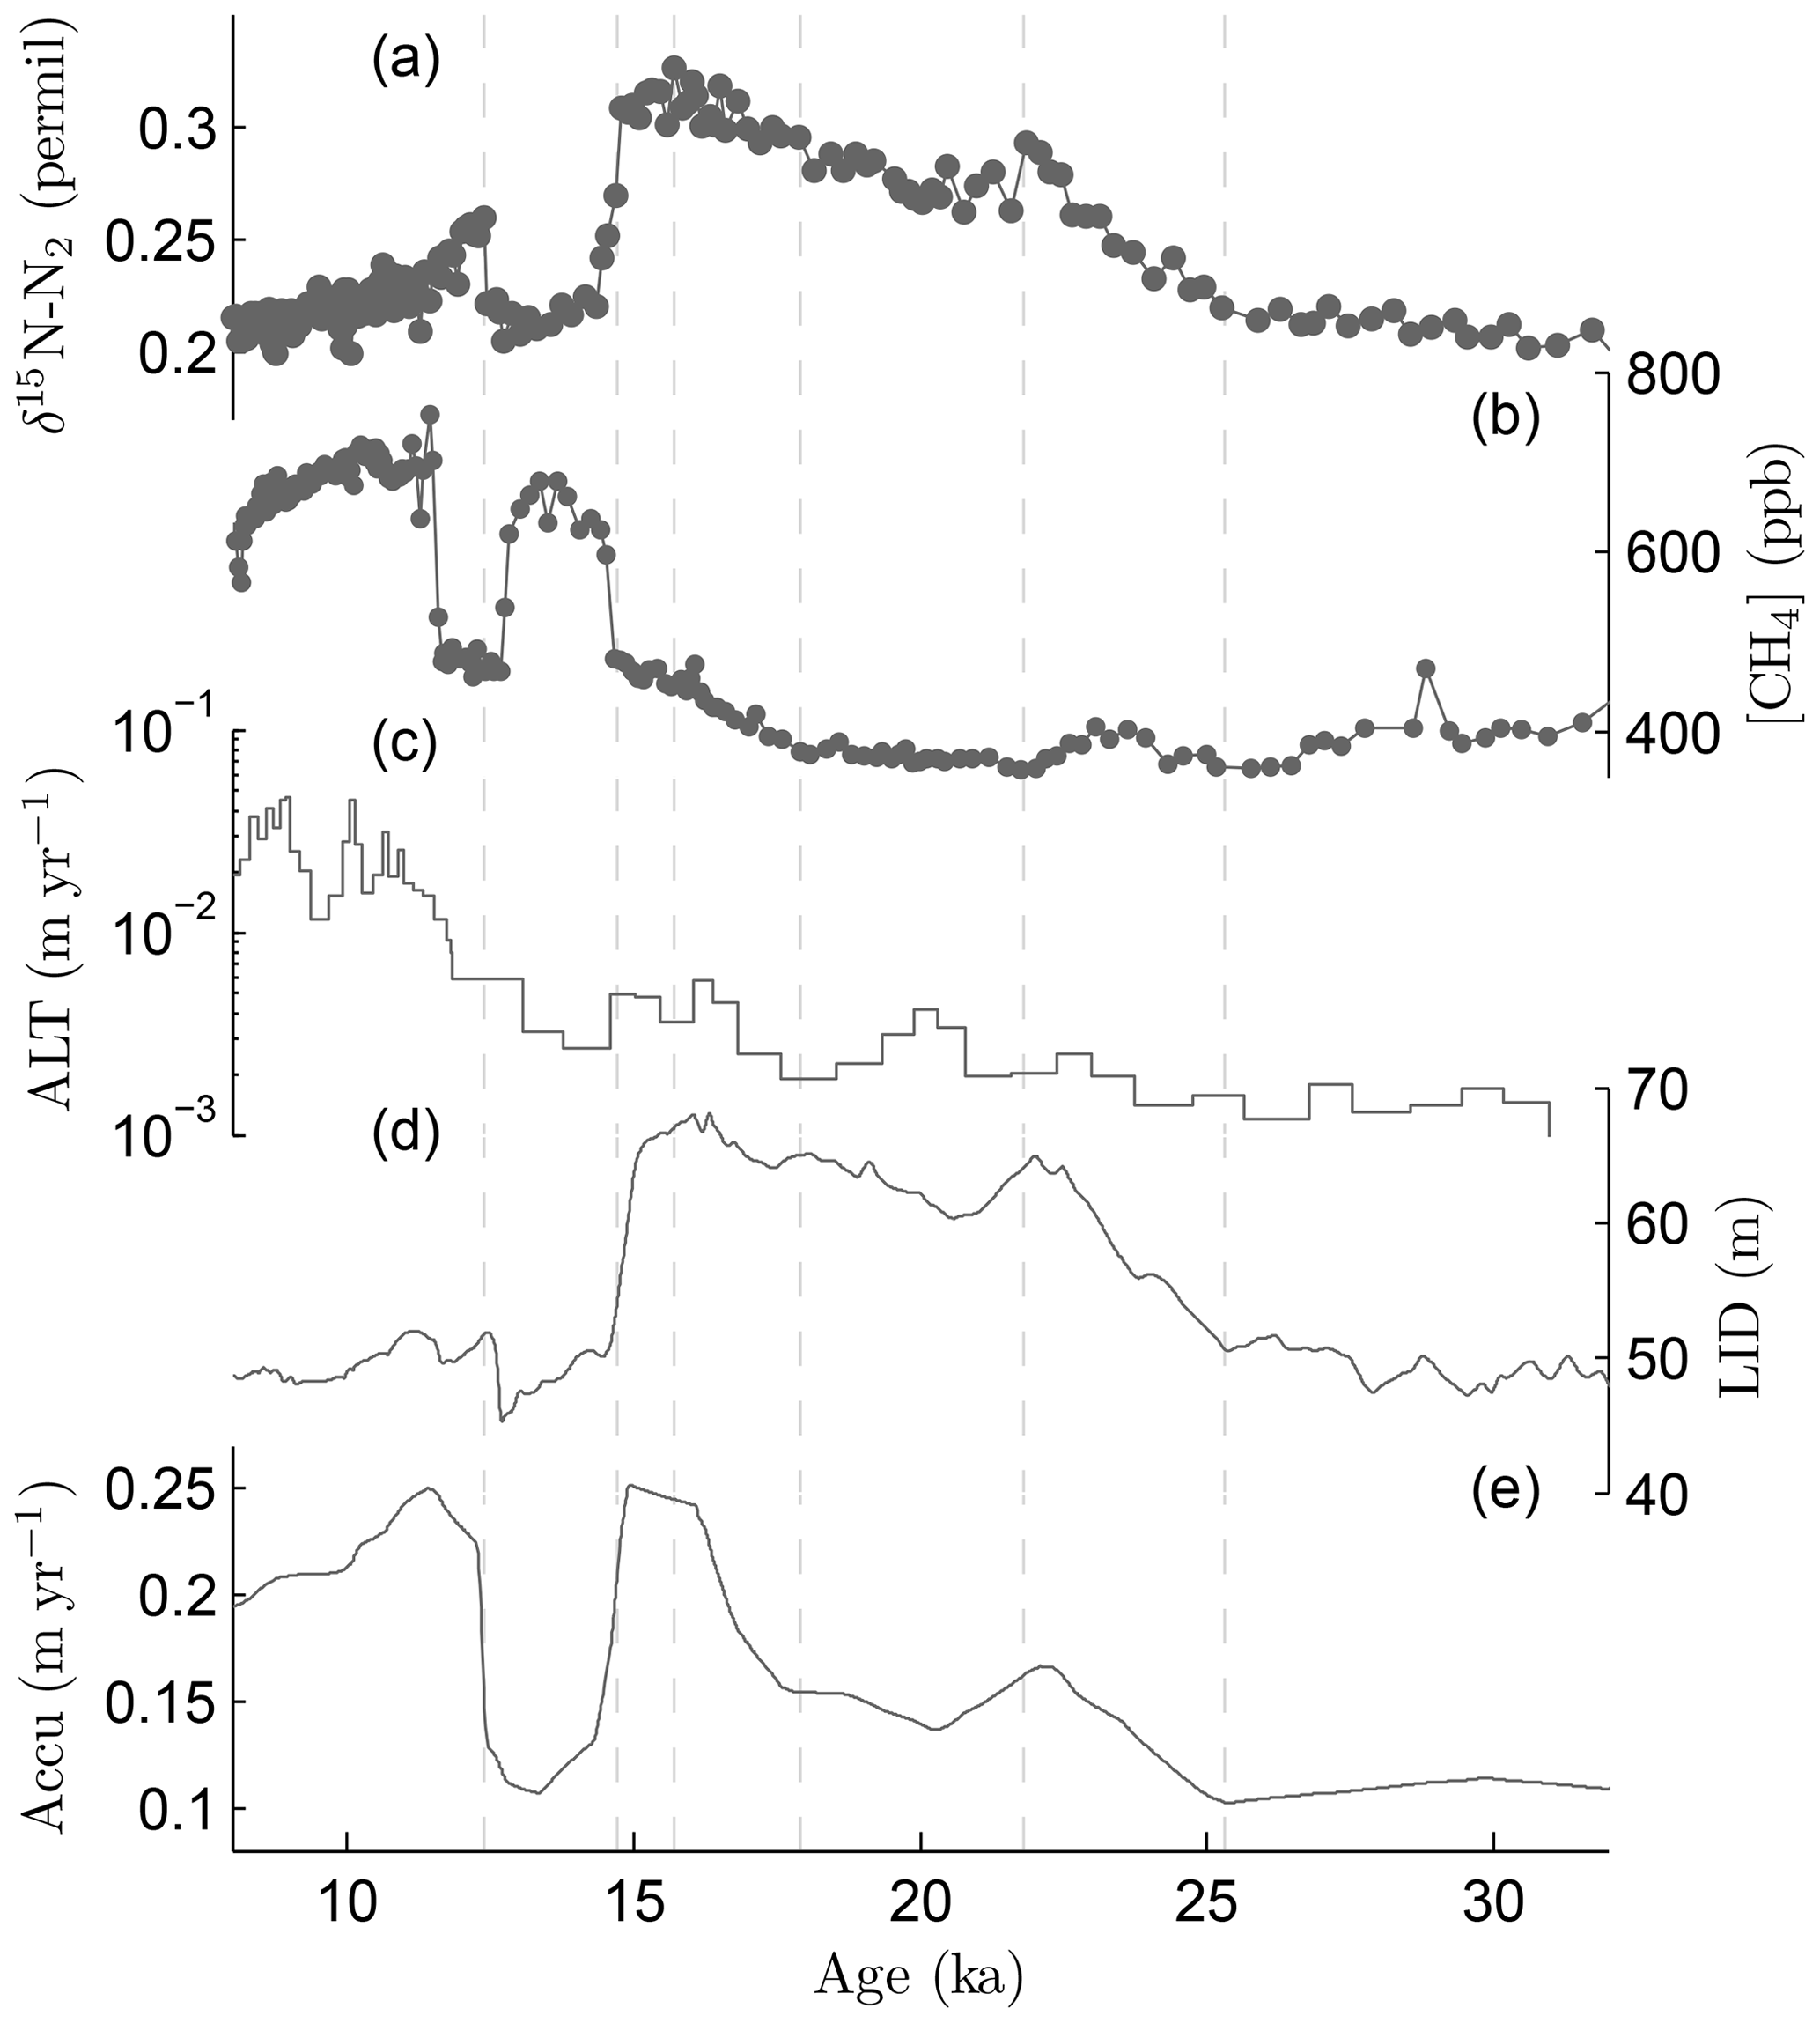
Figure 8Comparison of (a) δ15N-N2, (b) CH4, (c) annual layer thickness implied from depth–age scale, (d) lock-in depth (LID), and (e) accumulation reconstructions from the RICE ice core. Lock-in depth and accumulation are calculated with a dynamic Herron–Langway firn densification model.
Between 25.3 and 32 ka, accumulation is estimated to be ∼ 10 cm ice equivalent per year (Fig. 8e), and the increasing firn thickness is largely attributable to decreasing temperature. After 25.3 ka accumulation starts to increase, and by the first δ15N-N2 maximum (21.8 ka), accumulation had increased to ∼17 cm ice equivalent per year. This feature is not apparent in other ice cores from the Ross Sea region, but those records tend to be difficult to interpret because of chronological uncertainties, such as in the case of Taylor Dome (Baggenstos et al., 2017), or because of unexplained jumps in δ15N-N2, such as in the case of Siple Dome (Severinghaus et al., 2009). By the second maximum (15.7 ka), accumulation increased to ∼25 cm ice equivalent per year, similar to accumulation rates observed during the Holocene. An accumulation peak at the end of glacial terminations is consistent with evidence from trimlines in interior WAIS (Ackert et al., 2013) and is also observed in the accumulation histories from WAIS Divide and Siple Dome (WAIS Divide Project Members, 2013; Waddington et al., 2005) but to a smaller degree. The early accumulation peak at 21.8 ka is unique to the RICE ice core.
A large, rapid depletion in δ15N-N2 is observed at 14.71 ka with low values lasting until 12.38 ka. Analysis of the lead–lag relationship between δ15N-N2 and methane has been used to infer near-synchronous climate changes throughout the tropics and Northern Hemisphere (Rosen et al., 2014). These climate events are believed to originate in the Northern Hemisphere and propagate to the Southern Hemisphere (Blunier et al., 1998; Blunier and Brook, 2001; Buizert et al., 2015a, 2018). Curiously, the abrupt decrease in δ15N-N2 at 14.71 ka (0.088 ‰, 683.70–681.80 m) is observed in samples deeper than the increase in methane marking the onset of the Bølling-Allerød (14.66–14.52 ka, 683.13–682.52 m), meaning that this climate event unambiguously precedes the Northern Hemisphere event (Fig. 9). Where as Rosen et al. (2014) specifically considered the thermal component of δ15N-N2, the thermal component is considered to be negligible in Antarctic cores because air temperature only changes gradually. At Roosevelt Island, this period of low δ15N-N2 values is interpreted to represent shallow firn thickness which in the firn model is caused by low snow accumulation (< 10 cm yr−1; Fig. 8e). Low accumulation during this period is consistent with thin annual layers interpreted from the age–depth relationship (Fig. 3f), i.e., 0.3–0.6 cm yr−1 annual layer thickness compared with 1.6–3.2 cm yr−1 between 10.09 and 11.01 ka (642.75–661.07 m). Following the ACR, the modeled accumulation rate fully recovers to the ∼25 cm yr−1 observed before the ACR.
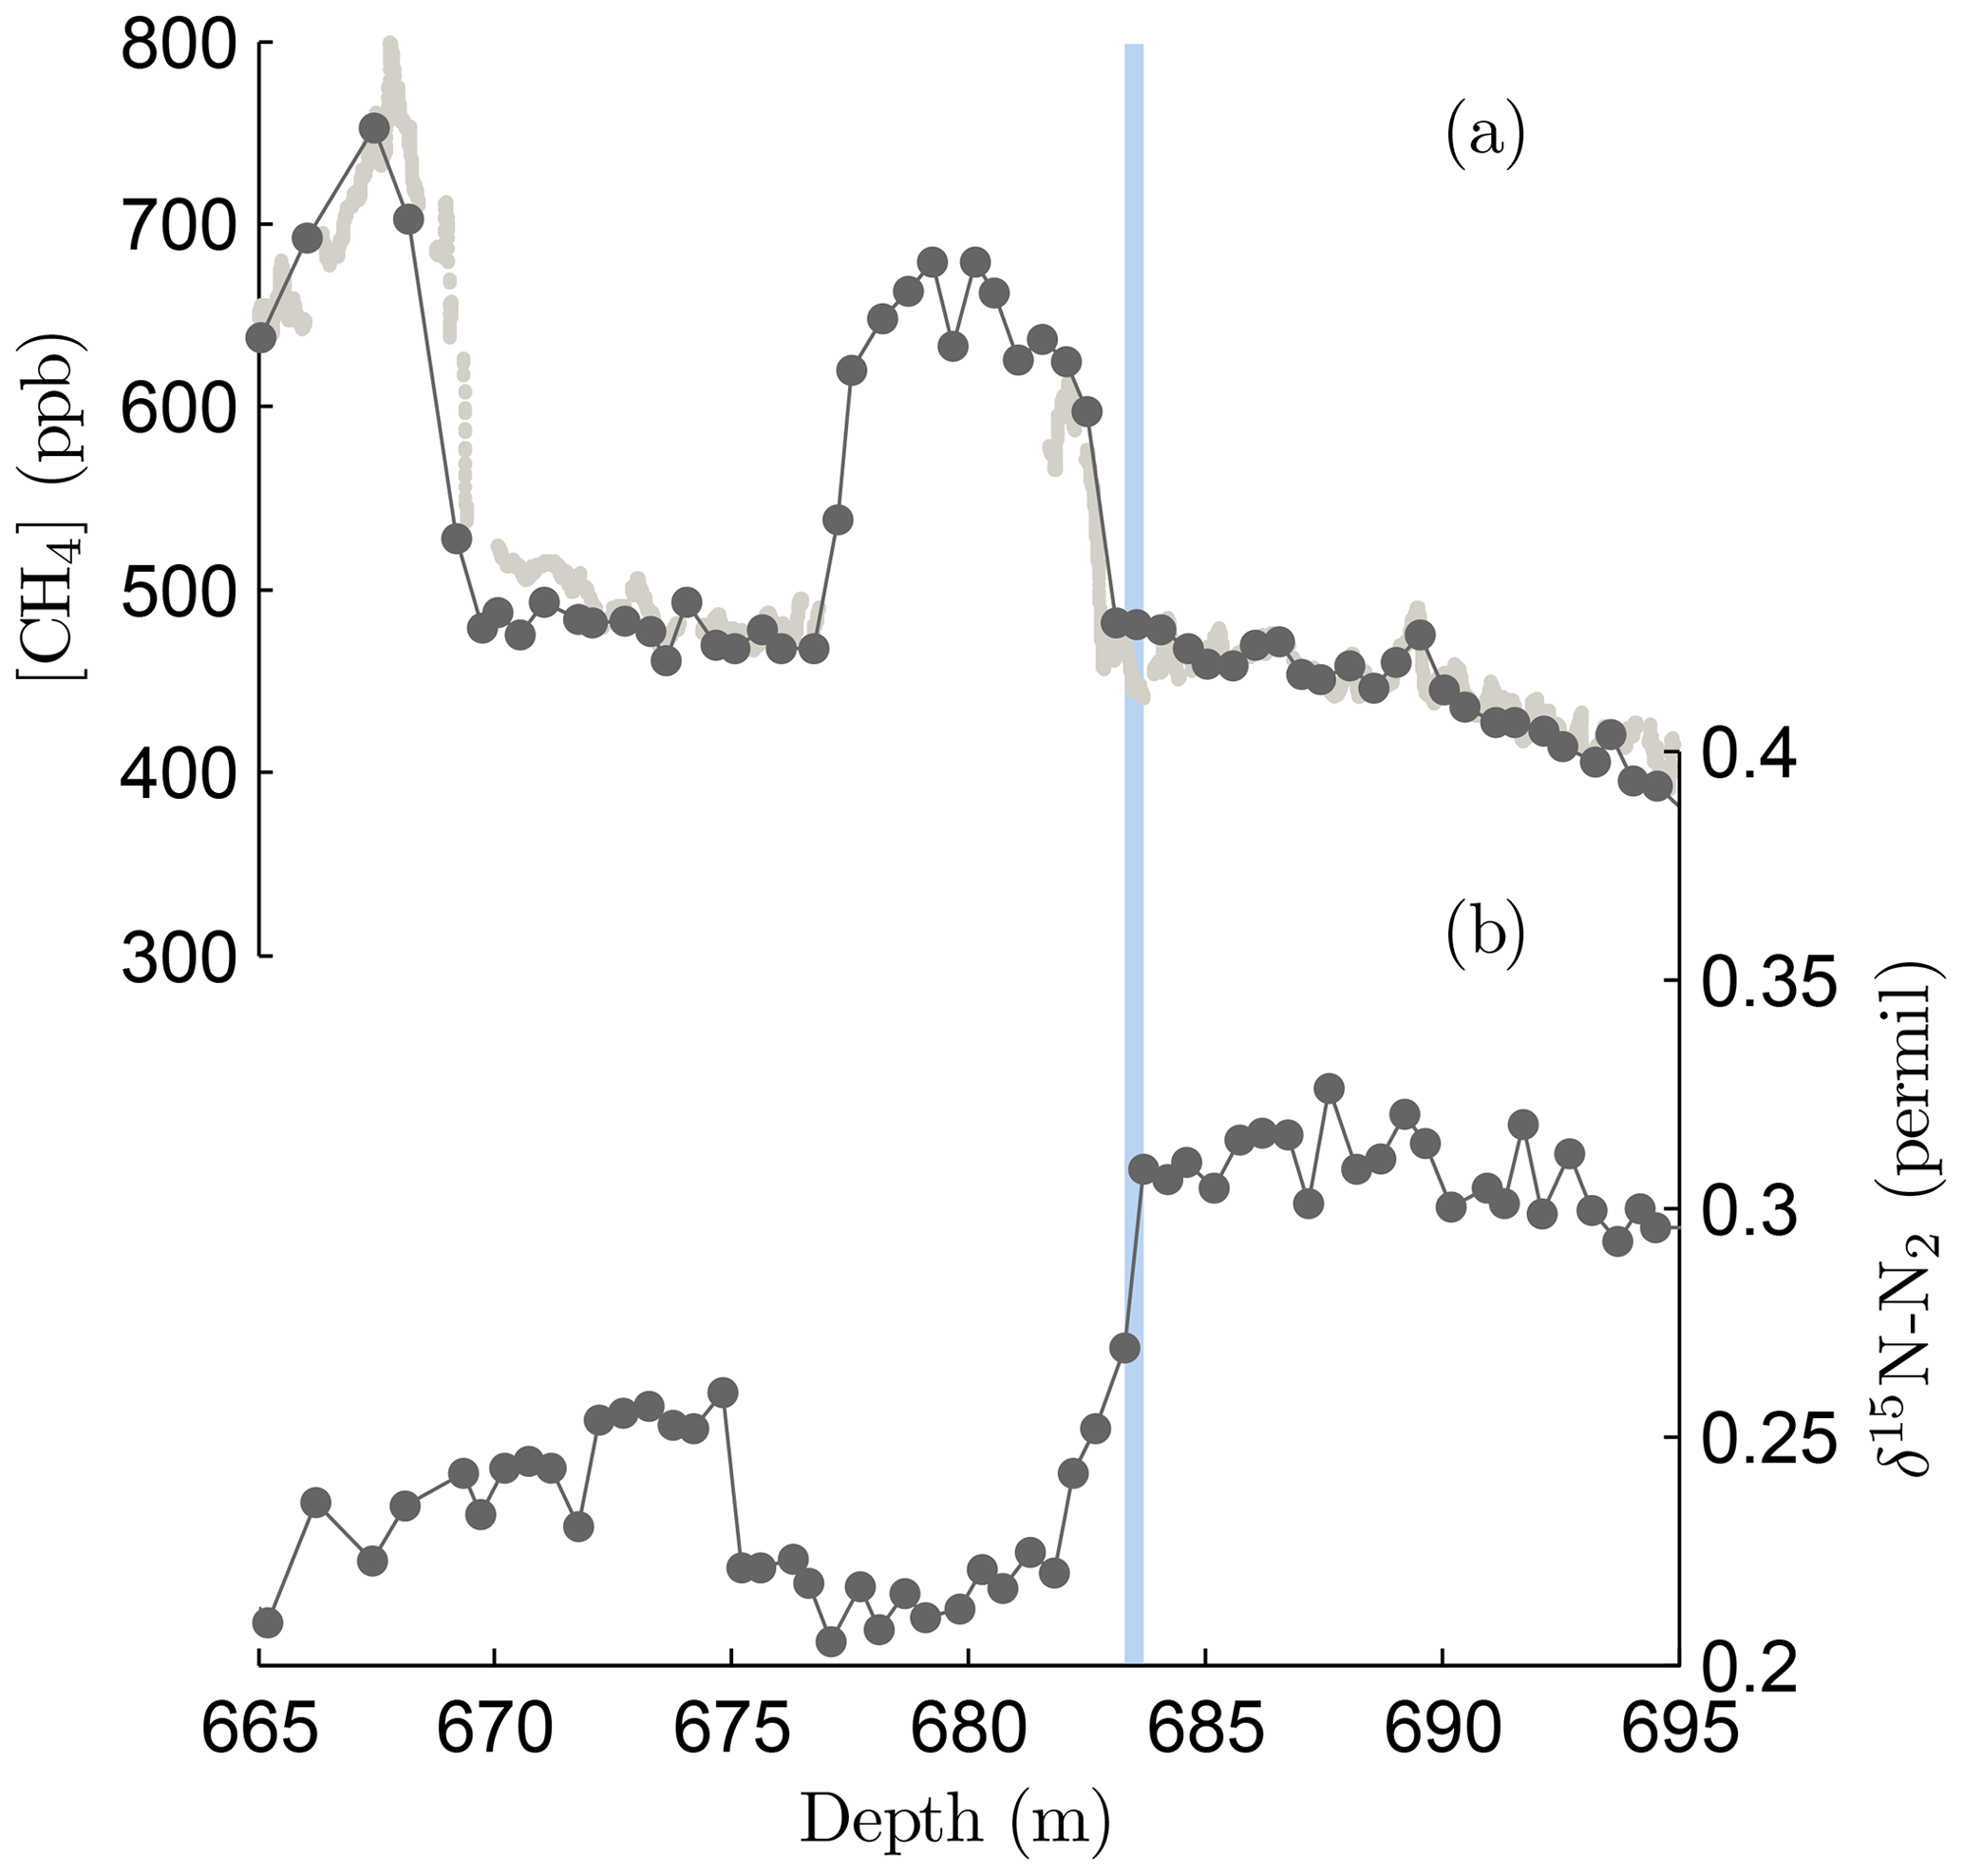
Figure 9Comparison of (a) methane and (b) δ15N-N2 from the RICE ice core plotted on depth. Vertical blue bar highlights the onset of a large decrease in δ15N-N2.
We propose three potential explanations for the thin annual layers and low accumulation rate observed during the ACR, with the last explanation being our preferred. (1) A large accumulation gradient is observed across the Roosevelt Island ice dome (Winstrup et al., 2019), which implies that a period of low accumulation at the RICE site may be the result of changes to the geometry of the Roosevelt Island ice dome. However, ice divide migration typically occurs over long timescales. (2) Accelerated ice flow may also cause thin annual layers and could potentially even affect layers within the firn. This flow could be the result of the ice streams which surrounded and buttressed Roosevelt Island ice dome suddenly being removed (Ackert et al., 1999, 2013; Halberstadt et al., 2016). The timing of the low-accumulation interval is similar to when dust records from the Taylor Dome ice core, a site located in the Transantarctic Mountains near the Ross Sea (Fig. 1), show an increase in dust diameter and a change in radiogenic isotope composition, which implies that the provenance of dust changed to a local source (Aarons et al., 2016). Aarons et al. (2016) interpreted this source as newly exposed land created by the withdrawal of Ross Ice Shelf. The timing of the low-accumulation period is also similar to some estimates of the timing of retreat of the WAIS based on sediment facies succession and radiocarbon dating (minimum date of 8.6 ka; McKay et al., 2016) and ice-sheet modeling (Golledge et al., 2014; McKay et al., 2016). Although annual layer thickness immediately above the ACR section is observed to be nearly 5 times as thick as the ACR section, this large change in thickness, if solely the result of changes in ice flow, would require an unrealistic change in the thickness of the dome or its ice flow which is not supported by TAC measurements or ice-flow modeling.
(3) Our preferred explanation is that an interval of low accumulation between 12.38 and 14.71 ka resulted in a shallow firn structure and depleted δ15N-N2 values. In recent times, moisture arriving at Roosevelt Island is frequently related to enhanced cyclonic airflow in the Ross Sea and a strong Amundsen Sea Low (Tuohy et al., 2015; Emanuelsson et al., 2018). This period of low accumulation may indicate a changed atmospheric structure in the South Pacific where southward airflow is blocked by a persistent low-pressure zone north of the Ross Sea such as observed in more recent periods in the accumulation record from RICE (Bertler et al., 2018; Emanuelsson et al., 2015) and potentially related to the past ice shelf extent. Such a pronounced minimum in accumulation is not observed in the Siple Dome ice core, where annual layers are observed to thicken during the ACR (Brook et al., 2005; Waddington et al., 2005). If nonthermal effects influenced the RICE δD record, which is interpreted as temperature in our firn model, then the magnitude of accumulation change during this period may not be as large as reconstructed from the firn model. While not currently available, measurements of dexcess, dust particle size distributions, and dust geochemistry may be helpful in explaining the temperature and accumulation history of RICE.
5.2 Implications for climate and ice sheet history
Early reconstructions of the Ross Ice sheet during the LGM were based on glacial geological constraints from the western margin of the embayment. Denton and Hughes (2002) describe a maximum scenario in which thick ice in the Ross Embayment overrode both Siple Dome and Roosevelt Island. However, more recent observations and model experiments indicate a “fast and thin” scenario in which Siple Dome was not overrun by the interior ice sheet during the LGM (Waddington et al., 2005; Price et al., 2007), and although the Ross ice streams likely slowed down during the LGM, they remained active, maintaining a low elevation profile of the ice sheet in the Ross Sea (Parizek and Alley, 2004).
Our results further support the fast and thin scenario and add a key new constraint on ice thickness and thinning in the eastern Ross Sea. Specifically, our results suggest that ice deposited on Roosevelt Island originated as accumulation local to the drilling site, which may not be true if WAIS was thick during the LGM and overrode Roosevelt Island. If remnants of WAIS were stranded on Roosevelt Island, this would likely result in a hiatus in the gas and ice chronology, in values of δD or TAC characteristic of more continental precipitation or much higher elevations, or in discontinuities in the δ15N-N2 record, indicating a much different firn structure.
While the RICE ice core chronology does exhibit an abrupt shift in δ15N-N2 and TAC during the ACR (Fig. 3), no discontinuity in δD was observed, meaning that it is unlikely that any of this ice originated as part of WAIS. At least one age discontinuity (at 64.6 ka) as well as an age reversal was observed deeper in the core, but these depths do not coincide with the timing of the retreat of WAIS in the Ross Sea (McKay et al., 2016). The largest discontinuity, at 746.00–746.10 m, is accompanied a 20 ‰ change in δD. Methane and δ18Oatm indicate that this discontinuity represents a 9.4 ka age gap. Over the same age range, the EDML ice core records a similar change in δD (Fig. 6f), indicating that this change in δD is explained by Antarctic climate patterns alone and without invoking large changes in ice sheet configuration. A possible second discontinuity is observed at 747.00 m depth at a small gap in measurements of 2.7 cm. Ice immediately below 747.00 m is interpreted as being warmer, meaning that this is probably not derived from somewhere upstream in WAIS or from a higher elevation (Fig. 6b). Additionally, no dramatic or sudden change in δ15N-N2 or TAC was observed in association with either of these discontinuities (Fig. 6). We conclude that it is highly unlikely that the accumulation site of the RICE ice core changed during the deglaciation and that Roosevelt Island ice dome probably remained independent of an advanced WAIS during the LGM. A similar conclusion was reached about Siple Dome during the LGM (Waddington et al., 2005; Nereson et al., 1998; Price et al., 2007; Parizek and Alley, 2004).
Geomorphological features on the Ross Sea bed do provide evidence of grounded ice north of Roosevelt Island during the LGM (Shipp et al., 1999; Anderson et al., 1984, 1992, 2014; Halberstadt et al., 2016). If these features were formed by an extended WAIS, it would imply that ice flowed around Roosevelt Island and Siple Dome and therefore was limited in thickness. These conditions would indicate that ice streams were active throughout the last glacial period. Alternatively, these geomorphic features may be the result of ice from a different origin. Price et al. (2007) proposed that during the LGM, an ice dome may have existed on Mary Byrd Land. In this scenario, thick, grounded ice could exist north of Roosevelt Island without flowing over or around the Roosevelt Island sea rise. The RICE records can not distinguish between these scenarios.
We present the RICE17 gas and ice chronologies for the RICE ice core. These timescales date the gas and ice records for the last ∼83 ka. Between 0 and 30 ka an automated synchronization routine is used to identify gas age control points that best match the RICE methane and δ18Oatm records to the respective records from the WAIS Divide ice core (WAIS Divide Project Members, 2013; Buizert et al., 2015b). This technique requires few prior constraints, accommodates simultaneous synchronization of multiple parameters, and allows assessment of age uncertainty. Unique in this approach is the use of centennial-scale variability in methane for chronostratigraphic matching for ages older than the last ∼2000 years. Synchronization between ice cores for the time period between 30 and 83 ka (719–753 m) was accomplished by manually choosing tie points. Below 753 m the ice could not be dated with the currently available data. The RICE17 ice age-scale is based on annual layer counts between −62 and 2649 years BP (0–343.7 m), and for depths below 343.7 m, a separate ice age-scale was derived from the synchronized gas age-scale by adding Δage estimated from a firn model.
A key contribution from the development of the RICE17 age-scale is evidence of active ice streams in the eastern Ross Sea during the last glacial cycle. This is supported by the continuous age-scale and continuous records of climate from RICE which imply that the Roosevelt Island ice dome remained stable and independent of WAIS for at least the last 64.6 ka and likely for the last 83 ka.
The RICE ice core provides records of climate, with precise dating, for a scarcely sampled region of Antarctica. Future work will investigate regional climate of the eastern Ross Sea in comparison to climate records from other sites to better understand spatial patterns around Antarctica, such as during the ACR when Roosevelt Island experienced an interval of particularly low accumulation, and to study the glacial retreat of WAIS in the Ross Sea.
The methodology used at Oregon State University for measuring methane concentration in ice cores was described in Grachev et al. (2009) and Mitchell et al. (2013). Briefly, 40–60 g ice samples are trimmed and placed in glass flasks. The glass flasks are then attached to a high vacuum line and immersed in a chilled ethanol bath set to −63 ∘C to keep the samples frozen. Since Mitchell et al. (2013), insulation has been added around the ethanol bath and above where the flasks are mounted. The added insulation reduced the temperature and water vapor content of gas in the headspace of the flasks and decreased sample-to-sample temperature variability. Both can affect methane measurements by changing the pressure reading or the retention time of methane in the gas chromatograph (GC) column. We also made efforts to more carefully regulate the amount of ethanol in the chilled bath and temperature of the hot water bath during melting. These steps improved stability of gas extraction and of measurements between sampling days.
After laboratory air has been evacuated, the flask valves are closed, and the samples are melted in a hot water bath for 30 min to liberate air. Samples are refrozen by immersing the flasks in the cold ethanol bath. Once the samples are completely refrozen and the sample flask temperature has stabilized (approximately 1 h after refreezing begins), methane measurement is performed by expanding sample air from the flask headspace into a gas chromatograph (GC).
Calibration measurements are made on an internal standard which is referenced to several compressed air standards externally calibrated on the NOAA scale (Dlugokencky et al., 2005). Calibration runs of systematically varying pressures are made both before and after samples are measured. The calibration curve is a least-squares linear regression between pressure and peak area for both sets of calibration runs described by a slope mcal and intercept bcal.
Methane concentration (C) was previously calculated by comparing the sample pressure (Pmeas) and the peak area (PAmeas) from GC analysis to the predicted peak area of the standard gas of equal pressure.
Four measurements can be made on each ice sample. If the two sets of calibration runs are taken individually, interpretation of sample concentrations typically differ by <3 ppb.
In this calculation, the sample pressure is used to quantify the number of moles of air in the sample assuming that the sample temperature remains constant and equal to standard air temperature during calibration runs. However, in a series of dry blank experiments it was determined that sample gas temperature is cooler than the standard gas temperature. We estimate the relative temperature difference to be 0.42 % of the standard air temperature and thus the sample pressure needs to be corrected upwards by that amount. We call this the GC-thermal effect. We now apply the correction to the previous concentration calculation.
Results from typical wet blank samples, in which we add standard air over bubble-free ice made from Milli-Q ultrapure water, had shown that these samples are typically 2–3 ppb enriched compared to the standard concentration using the old method for calculating concentration. This agrees with the predicted magnitude of enrichment from the GC-thermal effect of 2.1 ppb.
Several wet blank samples are measured each day and are interspersed between ice core samples. The offset between the measured concentration of the wet blank and the known concentration of the standard gas added is called the “blank” correction. This represents any effects during the sample analysis process which may alter the measured concentration. We bin the wet blank results over the time period for which samples were measured to establish a single blank correction value with an estimated blank correction uncertainty. RICE ice core samples were measured during two separate periods and have separate blank correction values.
Since the OSU analytical methods use a wet extraction technique to liberate ice core air, effects of gas solubility must be accounted for. Methane is more soluble than the major components of air and is preferentially dissolved during the extraction step. This leads to a decrease in the measured concentration compared to the true ice core concentration. Mitchell et al. (2013) empirically derived a solubility correction (S) which we repeated several times for the RICE samples. S is defined as the total amount of methane (gas + dissolved) divided by the amount in gas phase. A solubility value of 1.0165 was used for ice core samples and 1.0079 for bubble-free ice. We believe the difference in S for the different ice samples results from the differences between how blank ice and ice containing air behave during melting. Specifically,
-
Bubble-free ice melts slowly in comparison to glacial ice, which sometimes melts rapidly and cracks violently. This, along with bubbles rising and breaching the meltwater surface, causes disturbances in the water–air interface and promotes exchange of CH4 into the meltwater. This should lead to greater mixing and homogenization of air and water.
-
Bubbles released into the meltwater will be at higher pressures than the overlaying air because of surface tension. The higher partial pressure of CH4 in those bubbles, in comparison to the standard gas added over the bubble-free ice, will cause air to go into solution faster.
-
Because glacial ice tends to be melted sooner than blank ice, a longer time period for liquid–gas exchange is available.
The blank and “solubility” corrections are applied in the following way:
This formula differs from that used by Mitchell et al. (2013). In Mitchell et al. (2013) no solubility correction was applied to the bubble-free ice samples. The difference results in a constant offset of −7.4 ppb compared to Mitchell et al. (2013).
The RICE CFA methane record is qualitatively used for synchronization to the WAIS Divide methane record, and thus careful calibration was not required. Regardless, we present an ad hoc calibration of the RICE CFA methane record based on comparison to the RICE discrete methane record measured at Oregon State University (OSU). The RICE CFA methane record was measured in multiple campaigns, and major adjustments to the analytical system occurred during both of those periods. Calibration of the RICE CFA record is done in a piecewise manner to reflect these changes.
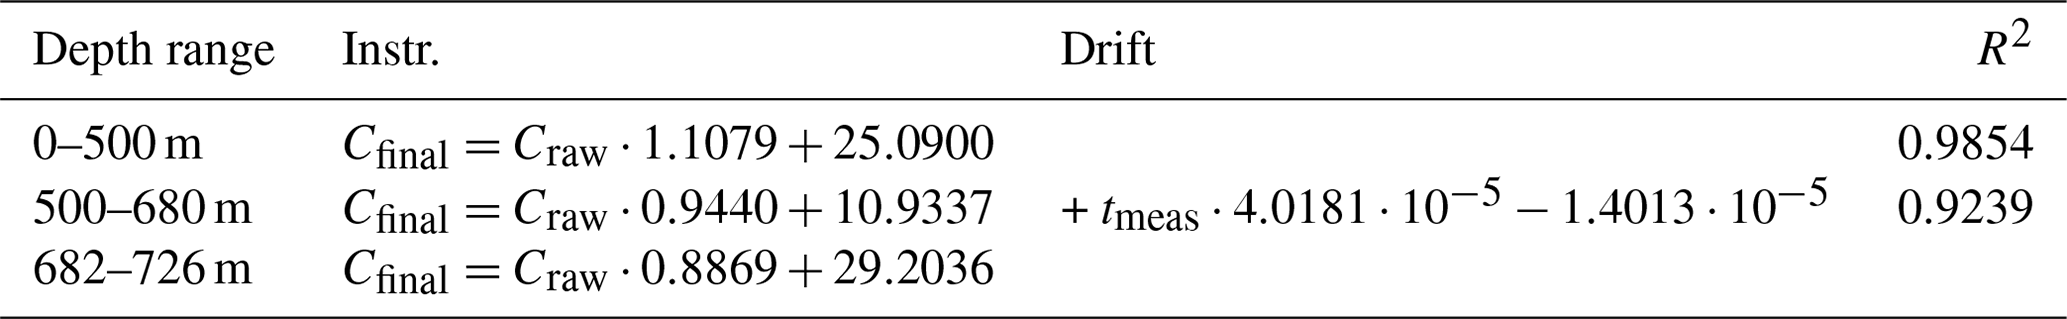
Our calibration scheme accounts for instrument calibration, a concentration-based correction due to instrument sensitivity, and measurement drift, a sampling-time-dependent correction. For comparison between data sets, we subsample the CFA data at depths where discrete measurements were made. We first apply the concentration calibration by regressing the subsampled CFA methane concentration against the discrete measurement. Drift was accounted for by a second regression comparing the residual of the concentration calibration against either the measurement time or sample depth, which ever provided the better correlation to the discrete data set. Drift was only a significant factor between 500 and 680 m depth. Calibration values are given in Table B1.
Table B1Calibration of the RICE CFA methane data set is performed by comparison to the RICE discrete methane data set with corrections for instrument sensitivity and instrument drift. Calibration is done for different segments of the core. Quality of the fit is described by the R2 statistic comparing calibrated values of the subsampled CFA methane record to discrete measurements.
Uncertainty in the relationship may be caused by measurement uncertainty, which is relatively small, or the uncertainty in the depth registration of the continuous measurements. Uncertainty in the depth registration is relatively unimportant in the top ∼670 m of core. In this section annual layers are relatively thick, and methane variability is relatively low, which results in only minor uncertainty in methane concentration from an error in depth. However, for the deeper section of core, methane concentrations vary rapidly with depth, and small errors in the depth registry represent large differences in methane concentration. Because of errors in the depth registry and the sensitivity of the inferred methane concentration, we restrict our calibration scheme to the last ∼39.66 ka (725.63 m) ending after the inclusion of GIS-8.
The gas age–ice age offset (Δage) for the RICE ice core was estimated with a dynamic Herron–Langway model (Buizert et al., 2015b). The model is constrained by measurements of δ15N-N2 (a proxy for firn thickness) and δD (a proxy for past temperature). The dynamic model also assumes a convective zone of 2 m, surface firn density of 400 kg m−3, and geothermal heat flux of 78 mW m−2.
A steady-state version of the Herron–Langway model mimics the dynamic version following a similar iterative methodology. A constant Δage estimate is assumed as a prior to assume an ice age-scale for the temperature history. The model then calculates a new Δage solution from the temperature and firn thickness histories. This process is repeated until iterations no longer change appreciably.
While the dynamic version is used to establish the Δage history for RICE, the steady-state version has the advantage of being computationally faster and is used in a sensitivity test. In this test, we vary prior assumptions about the isotopic temperature sensitivity used to infer past temperature, the convective zone thickness, surface firn density, and assumptions about geothermal induced temperature gradient in the firn. In a Monte Carlo approach, each parameter is given a range of acceptable values from which the steady-state Herron–Langway model calculates the Δage history (Table C1). This is repeated for 6000 realizations. Realizations are rejected if any of the following points are true:
Table C1Model Parameters used for steady-state Herron–Langway model.

-
The modeled modern ice age at lock-in depth (LID) is more than 25 years different than the annual-layer-counted age of that depth (48.57 m, 89 years BP).
-
The modeled modern accumulation is less than 0.15 or greater than 0.35 m ice per year.
-
The isotopic sensitivity is less than 3.2 or greater than 9.6 ‰ K−1, similar to the range of values observed for West Antarctica (Masson-Delmotte et al., 2008; Cuffey et al., 2016; Stenni et al., 2017). This parameter is randomly chosen from a normal distribution at the beginning of each realization and can fall outside of this range.
-
The minimum temperature is less than −60∘C.
-
The maximum estimated Δage is more than 1000 years.
-
The maximum modeled accumulation exceeds 1.0 m ice per year or minimum accumulation is negative.
Δage is calculated for each depth that δ15N-N2 was measured. Uncertainty in Δage is assumed to be the root-mean-square error of accepted realizations and is estimated for each sample depth.
The following are included in the Supplement: RICE prior age control points; RICE final age control points; RICE17 age-scale interpolated at higher resolution; RICE CH4, δD, δ18O-O2, and δ15N-N2 data; and code for the gas synchronization routine. The RICE CH4, δD, δ18O-O2, and δ15N-N2 data and RICE17 age-scale for interpolation are also archived at the USAP Data Center (https://doi.org/10.15784/601359, Brook and Lee, 2020).
The supplement related to this article is available online at: https://doi.org/10.5194/cp-16-1691-2020-supplement.
JEL measured CH4 at OSU on RICE samples. JEL, NANB, TBa, TBl, VGC, EDK, and PV participated in the 2013 or 2014 continuous flow analysis campaigns. JPS measured δ15N-N2 and δ18O-O2 at SIO. JEL, CB, TJF, MW, EJB, DDJ, FP, JPS, and EDW contributed to methods and discussion leading to the development of the RICE17 age-scale. JEL, HC, TJF, RH, JPS, and EDW contributed with discussion of glaciological interpretations of the ice core record. All authors provided valuable feedback and made helpful contributions to writing the paper.
The authors declare that they have no conflict of interest.
This work is a contribution to the Roosevelt Island Climate Evolution (RICE) Program, with contributions from the USA, the UK, Sweden, New Zealand, Italy, Germany, Australia, China, and Denmark. The US contribution was funded by grants from the US National Science Foundation Office of Polar Programs (0944021, 0837883, 0944307, 1042883, & 1643394). The NZ contribution was funded through New Zealand Ministry of Business, Innovation, and Employment grants issued through Victoria University (RDF-VUW-1103, 15-VUW-131), GNS Science (540GCT32, 540GCT12), and Antarctica New Zealand (K049). The Danish contribution was funded by the Carlsberg Foundation’s North–South Climate Connections project grant. The research also received funding from the European Research Council under the European Commission's Seventh Framework Programme (FP7/2007-2013) ERC grant agreement 610055 as part of the Ice2Ice project.
We thank Micheal Rebarchik and Will Patterson for laboratory assistance at Oregon State University. We thank Ross Beaudette for laboratory assistance at Scripps Institution of Oceanography. We thank Marius Simonsen, Helle Kjær, Rebecca Pyne, Daniel Emanuelsson, Bernadette Proemse, Ross Edwards, Darcy Mandeno, and the rest of the RICE team for participation in preparing ice samples and operating instruments during the continuous melting campaigns at GNS. We thank the US Antarctic Support Contractor, Antarctica NZ, the US Air Force, the Air National Guard, and Kenn Borek Air for logistical and field support.
This research has been supported by the US National Science Foundation (grant nos. 0944021, 0837883, 0944307, 1042883, and 1643394), the New Zealand Ministry of Business, Innovation, and Employment (grant nos. RDF-VUW-1103, 15-VUW-131, 540GCT32, 540GCT12, and K049), the Carlsberg Foundation, and the European Research Council (ICE2ICE (grant no. 610055)).
This paper was edited by Barbara Stenni and reviewed by two anonymous referees.
Aarons, S., Aciego, S., Gabrielli, P., Delmonte, B., Koornneef, J., Wegner, A., and Blakowski, M.: The impact of glacier retreat from the Ross Sea on local climate: Characterization of mineral dust in the Taylor Dome ice core, East Antarctica, Earth Planet. Sc. Lett., 444, 34–44, https://doi.org/10.1016/j.epsl.2016.03.035, 2016. a, b
Ackert, R. P., Barclay, D. J., Borns, H. W., Calkin, P. E., Kurz, M. D., Fastook, J. L., and Steig, E. J.: Measurements of Past Ice Sheet Elevations in Interior West Antarctica, Science, 286, 276–280, https://doi.org/10.1126/science.286.5438.276, 1999. a, b
Ackert, R. P., Mukhopadhyay, S., Parizek, B. R., and Borns, H. W.: Ice elevation near the West Antarctic Ice Sheet divide during the last glaciation, Geophys. Res. Lett., 34, L21506, https://doi.org/10.1029/2007GL031412, 2007. a
Ackert, R. P., Putnam, A. E., Mukhopadhyay, S., Pollard, D., DeConto, R. M., Kurz, M. D., and Borns, H. W.: Controls on interior West Antarctic Ice Sheet Elevations: inferences from geologic constraints and ice sheet modeling, Quaternary Sci. Rev., 65, 26–38, https://doi.org/10.7916/D8CG010P, 2013. a, b
Alley, R. B., Shuman, C. A., Meese, D. A., Gow, A. J., Taylor, K. C., Cuffey, K. M., Fitzpatrick, J. J., Grootes, P. M., Zielinski, G. A., Ram, M., Spinelli, G., and Elder, B.: Visual-stratigraphic dating of the GISP2 ice core: Basis, reproducibility, and application, J. Geophys. Res.-Oceans, 102, 26367–26381, https://doi.org/10.1029/96jc03837, 1997. a
Andersen, K. K., Svensson, A., Johnsen, S. J., Rasmussen, S. O., Bigler, M., Röthlisberger, R., Ruth, U., Siggaard-Andersen, M.-L., Steffensen, J. P., Dahl-Jensen, D., Vinther, B. M., and Clausen, H. B.: The Greenland Ice Core Chronology 2005, 15–42 ka. Part 1: constructing the time scale, Quaternary Sci. Rev., 25, 3246–3257, https://doi.org/10.1016/j.quascirev.2006.08.002, 2006. a
Anderson, J. B., Brake, C. F., and Myers, N. C.: Sedimentation on the Ross Sea continental shelf, Antarctica, Mar. Geol., 57, 295–333, https://doi.org/10.1016/0025-3227(84)90203-2, 1984. a, b
Anderson, J. B., Shipp, S. S., Bartek, L. R., and Reid, D. E.: Evidence for a grounded ice sheet on the Ross Sea continental shelf during the late Pleistocene and preliminary paleodrainage reconstruction, Contributions to Antarctic Research III, 39–62, https://doi.org/10.1029/AR057p0039, 1992. a, b
Anderson, J. B., Conway, H., Bart, P. J., Witus, A. E., Greenwood, S. L., McKay, R. M., Hall, B. L., Ackert, R. P., Licht, K., Jakobsson, M., and Stone, J. O.: Ross Sea paleo-ice sheet drainage and deglacial history during and since the LGM, Quaternary Sci. Rev., 100, 31–54, https://doi.org/10.1016/j.quascirev.2013.08.020, 2014. a, b
Aydin, M., Montzka, S. A., Battle, M. O., Williams, M. B., De Bruyn, W. J., Butler, J. H., Verhulst, K. R., Tatum, C., Gun, B. K., Plotkin, D. A., Hall, B. D., and Saltzman, E. S.: Post-coring entrapment of modern air in some shallow ice cores collected near the firn-ice transition: evidence from CFC-12 measurements in Antarctic firn air and ice cores, Atmos. Chem. Phys., 10, 5135–5144, https://doi.org/10.5194/acp-10-5135-2010, 2010. a
Baggenstos, D., Bauska, T. K., Severinghaus, J. P., Lee, J. E., Schaefer, H., Buizert, C., Brook, E. J., Shackleton, S., and Petrenko, V. V.: Atmospheric gas records from Taylor Glacier, Antarctica, reveal ancient ice with ages spanning the entire last glacial cycle, Clim. Past, 13, 943–958, https://doi.org/10.5194/cp-13-943-2017, 2017. a
Baumgartner, M., Kindler, P., Eicher, O., Floch, G., Schilt, A., Schwander, J., Spahni, R., Capron, E., Chappellaz, J., Leuenberger, M., Fischer, H., and Stocker, T. F.: NGRIP CH4 concentration from 120 to 10 kyr before present and its relation to a δ15N temperature reconstruction from the same ice core, Clim. Past, 10, 903–920, https://doi.org/10.5194/cp-10-903-2014, 2014. a, b, c, d
Bender, M., Labeyrie, L., Raynaud, D., and Lorius, C.: Isotopic composition of atmospheric O2 in ice linked with deglaciation and global primary productivity, Nature, 318, 349–353, https://doi.org/10.1038/318349a0, 1985. a
Bender, M. L., Sowers, T., Barnola, J., and Chappellaz, J.: Changes in the O2∕N2 ratio of the atmosphere during recent decades reflected in the composition of air in the firn at Vostok Station, Antarctica, Geophys. Res. Lett., 21, 189–192, https://doi.org/10.1029/93gl03548, 1994. a, b, c
Bentley, M. J., Cofaigh, C. Ó., Anderson, J. B., Conway, H., Davies, B., Graham, A. G., Hillenbrand, C.-D., Hodgson, D. A., Jamieson, S. S., Larter, R. D.,Mackintosh, A., Smith, J. A., Verleyen, E., Ackert, R. P., Bart, P. J., Berg, S., Brunstein, D., Canals, M., Colhoun, E. A., Crosta, X., Dickens, W. A., Domack, E., Favier, V., Fink, D., Fogwill, C. J., Glasser, N. F., Gohl, K., Golledge, N. R., Goodwin, I., Gore, D. B., Greenwood, S. L., Hall, B. L., Hall, K. Hedding, D. W., Hein, A. S., Hocking, E. P., Jakobsson, M., Jonson, J. S., Jomeli, V., Jones, R. S., Klages, J. P., Kristoffersen, Y., Huhn, G., Leventer, A., Licht, K., Lilly, K., Lindow, J., Livingstone, S. J., Massé, G., McGlone, M. S., McKay, R. M., Melles, M., Miura, H., Mulvaney, R., Nel, W., Nitsche, F. O., O'Brien, P. E., Post, A. L., Roberts, S. J., Saunders, K. M., Selkirk, P. M., Simms, A. R., Spiegel, C., Stolldorf, T. D., Sugden, D. E., van der Putten, N., van Ommen, T., Verfaillie, D., Vyverman, W., Wagner, B., White, D. A., Witus, A. E., and Zwartz, D.: A community-based geological reconstruction of Antarctic Ice Sheet deglaciation since the Last Glacial Maximum, Quaternary Sci. Rev., 100, 1–9, https://doi.org/10.1016/j.quascirev.2014.06.025, 2014. a
Bertler, N. A. N., Conway, H., Dahl-Jensen, D., Emanuelsson, D. B., Winstrup, M., Vallelonga, P. T., Lee, J. E., Brook, E. J., Severinghaus, J. P., Fudge, T. J., Keller, E. D., Baisden, W. T., Hindmarsh, R. C. A., Neff, P. D., Blunier, T., Edwards, R., Mayewski, P. A., Kipfstuhl, S., Buizert, C., Canessa, S., Dadic, R., Kjær, H. A., Kurbatov, A., Zhang, D., Waddington, E. D., Baccolo, G., Beers, T., Brightley, H. J., Carter, L., Clemens-Sewall, D., Ciobanu, V. G., Delmonte, B., Eling, L., Ellis, A., Ganesh, S., Golledge, N. R., Haines, S., Handley, M., Hawley, R. L., Hogan, C. M., Johnson, K. M., Korotkikh, E., Lowry, D. P., Mandeno, D., McKay, R. M., Menking, J. A., Naish, T. R., Noerling, C., Ollive, A., Orsi, A., Proemse, B. C., Pyne, A. R., Pyne, R. L., Renwick, J., Scherer, R. P., Semper, S., Simonsen, M., Sneed, S. B., Steig, E. J., Tuohy, A., Venugopal, A. U., Valero-Delgado, F., Venkatesh, J., Wang, F., Wang, S., Winski, D. A., Winton, V. H. L., Whiteford, A., Xiao, C., Yang, J., and Zhang, X.: The Ross Sea Dipole – temperature, snow accumulation and sea ice variability in the Ross Sea region, Antarctica, over the past 2700 years, Clim. Past, 14, 193–214, https://doi.org/10.5194/cp-14-193-2018, 2018. a, b, c, d, e, f, g
Blunier, T. and Brook, E. J.: Timing of millennial-scale climate change in Antarctica and Greenland during the last glacial period, Science, 291, 109–112, https://doi.org/10.1126/science.291.5501.109, 2001. a
Blunier, T., Chappellaz, J., Schwander, J., Dällenbach, A., Stauffer, B., Stocker, T. F., Raynaud, D., Jouzel, J., Clausen, H. B., Hammer, C. U., and Johnsen, S. J.: Asynchrony of Antarctic and Greenland climate change during the last glacial period, Nature, 394, 739–743, https://doi.org/10.1038/29447, 1998. a, b
Brook, E. J. and Lee, J. E.: Roosevelt Island Ice Core Time Scale and Associated Data, U.S. Antarctic Program (USAP) Data Center, https://doi.org/10.15784/601359, 2020. a
Brook, E. J., White, J. W. C., Schilla, A. S. M., Bender, M. L., Barnett, B., Severinghaus, J. P., Taylor, K. C., Alley, R. B., and Steig, E. J.: Timing of millennial-scale climate change at Siple Dome, West Antarctica, during the last glacial period, Quaternary Sci. Rev., 24, 1333–1343, https://doi.org/10.1016/j.quascirev.2005.02.002, 2005. a, b, c
Buizert, C., Gkinis, V., Severinghaus, J. P., He, F., Lecavalier, B. S., Kindler, P., Leuenberger, M., Carlson, A. E., Vinther, B., Masson-Delmotte, V., White, J. W. C., Liu, Z., Otto-Bliesner, B., and Brook, E. J.: Greenland temperature response to climate forcing during the last deglaciation, Science, 345, 1177–1180, https://doi.org/10.1126/science.1254961, 2014. a
Buizert, C., Adrian, B., Ahn, J., Albert, M., Alley, R. B., Baggenstos, D., Bauska, T. K., Bay, R. C., Bencivengo, B. B., Bentley, C. R., Brook, E. J., Chellman, N. J., Clow, G. D., Cole-Dai, J., Conway, H., Cravens, E., Cuffey, K. M., Dunbar, N. W., Edwards, J. S., Fegyveresi, J. M., Ferris, D. G., Fitzpatrick, J. J., Fudge, T. J., Gibson, C. J., Gkinis, V., Goet, J. J., Gregory, S., Hargreaves, G. M., Iverson, N., Johnson, J. A., Jones, T. R., Kalk, M. L., Kippenhan, M. J., Koffman, B. G., Kreutz, K., Kuhl, T. W., Lebar, D. A., Lee, J. E., Marcott, S. A., Markle, B. M., Maselli, O. J., McConnell, J. R., McGwire, K. C., Mitchell, L. E., Mortensen, N. B., Neff, P. D., Nishiizumi, K., Nunn, R. M., Orsi, A. J., Pasteris, D. R., Pedro, J. B., Pettit, E. C., Price, P. B., Priscu, J. C., Rhodes, R. H., Rosen, J. L., Schauer, A. J., Schoenemann, S. W., Sendelbach, P. J., Severinghaus, J. P., Shturmakov, A. J., Sigl, M., Slawny, K. R., Souney, J. M., Sowers, T. A., Spencer, M. K., Steig, E. J., Taylor, K. C., Twickler, M. S., Vaughn, B. H., Voigt, D. E., Waddington, E. D., Welten, K. C., Wendricks, A. W., White, J. W. C., Winstrup, M., Wong, G. J., and Woodruff, T. E.: Precise interpolar phasing of abrupt climate change during the last ice age, Nature, 520, 661–665, https://doi.org/10.1038/nature14401, 2015a. a
Buizert, C., Cuffey, K. M., Severinghaus, J. P., Baggenstos, D., Fudge, T. J., Steig, E. J., Markle, B. R., Winstrup, M., Rhodes, R. H., Brook, E. J., Sowers, T. A., Clow, G. D., Cheng, H., Edwards, R. L., Sigl, M., McConnell, J. R., and Taylor, K. C.: The WAIS Divide deep ice core WD2014 chronology – Part 1: Methane synchronization (68–31 ka BP) and the gas age–ice age difference, Clim. Past, 11, 153–173, https://doi.org/10.5194/cp-11-153-2015, 2015b. a, b, c, d, e, f, g, h, i, j, k, l
Buizert, C., Sigl, M., Severi, M., Markle, B., Wettstein, J. J., McConnell, J. R., Pedro, J. B., Sodemann, H., Goto-Azuma, K., Kawamura, K., Fujita, S., Motoyama, H., Hirabayashi, M., Uemura, R., Stenni, B., Parrenin, F., He, F., Fudge, T. J., and Steig, E. J.: Abrupt ice-age shifts in southern westerly winds and Antarctic climate forced from the north, Nature, 563, 681–685, https://doi.org/10.1038/s41586-018-0727-5, 2018. a
Capron, E., Landais, A., Chappellaz, J., Schilt, A., Buiron, D., Dahl-Jensen, D., Johnsen, S. J., Jouzel, J., Lemieux-Dudon, B., Loulergue, L., Leuenberger, M., Masson-Delmotte, V., Meyer, H., Oerter, H., and Stenni, B.: Millennial and sub-millennial scale climatic variations recorded in polar ice cores over the last glacial period, Clim. Past, 6, 345–365, https://doi.org/10.5194/cp-6-345-2010, 2010. a, b
Church, J. A., Clark, P. U., Cazenave, A., Gregory, J. M., Jevrejeva, S., Levermann, A., Merrifield, M. A., Milne, G. A., Nerem, R. S., Nunn, P. D., Payne, A. J., Pfeffer, W. T., Stammer, D., and Unnikrishnan, A. S.: Sea-level rise by 2100, Science, 342, 1445–1445, https://doi.org/10.1126/science.342.6165.1445-a, 2013. a
Clark, P. U. and Tarasov, L.: Closing the sea level budget at the Last Glacial Maximum, P. Natl. Acad. Sci. USA, 111, 15861–15862, https://doi.org/10.1073/pnas.1418970111, 2014. a
Conway, H., Hall, B., Denton, G., Gades, A., and Waddington, E.: Past and future grounding-line retreat of the West Antarctic Ice Sheet, Science, 286, 280–283, https://doi.org/10.1126/science.286.5438.280, 1999. a, b, c
Cuffey, K. M., Clow, G. D., Steig, E. J., Buizert, C., Fudge, T., Koutnik, M., Waddington, E. D., Alley, R. B., and Severinghaus, J. P.: Deglacial temperature history of West Antarctica, P. Natl. Acad. Sci. USA, 113, 14249–14254, https://doi.org/10.1073/pnas.1609132113, 2016. a, b
Cunningham, J. and Waddington, E.: Boudinage: a source of stratigraphic disturbance in glacial ice in central Greenland, J. Glaciol., 36, 269–272, 1990. a
DeConto, R. M. and Pollard, D.: Contribution of Antarctica to past and future sea-level rise, Nature, 531, 591–597, https://doi.org/10.1038/nature17145, 2016. a, b
Denton, G. H. and Hughes, T. J.: Reconstructing the Antarctic Ice Sheet at the Last Glacial Maximum, Quaternary Sci. Rev., 21, 193–202, https://doi.org/10.1016/S0277-3791(01)00090-7, 2002. a
Denton, G. H. and Marchant, D. R.: The geologic basis for a reconstruction of a grounded ice sheet in McMurdo Sound, Antarctica, at the last glacial maximum, Geogr. Ann. A, 82, 167–211, https://doi.org/10.1111/j.0435-3676.2000.00121.x, 2000. a
Denton, G. H., Bockheim, J. G., Wilson, S. C., and Stuiver, M.: Late Wisconsin and early Holocene glacial history, inner Ross embayment, Antarctica, Quaternary Res., 31, 151–182, https://doi.org/10.1016/0033-5894(89)90004-5, 1989. a, b
Dlugokencky, E., Myers, R., Lang, P., Masarie, K., Crotwell, A., Thoning, K., Hall, B., Elkins, J., and Steele, L.: Conversion of NOAA atmospheric dry air CH4 mole fractions to a gravimetrically prepared standard scale, J. Geophys. Res.-Atmos., 110, D18306, https://doi.org/10.1029/2005JD006035, 2005. a
Emanuelsson, B. D., Baisden, W. T., Bertler, N. A. N., Keller, E. D., and Gkinis, V.: High-resolution continuous-flow analysis setup for water isotopic measurement from ice cores using laser spectroscopy, Atmos. Meas. Tech., 8, 2869–2883, https://doi.org/10.5194/amt-8-2869-2015, 2015. a, b
Emanuelsson, B. D., Bertler, N. A., Neff, P. D., Renwick, J. A., Markle, B. R., Baisden, W. T., and Keller, E. D.: The role of Amundsen–Bellingshausen Sea anticyclonic circulation in forcing marine air intrusions into West Antarctica, Clim. Dynam., 51, 3579–3596, https://doi.org/10.1007/s00382-018-4097-3, 2018. a
EPICA Community Members: One-to-one coupling of glacial climate variability in Greenland and Antarctica, Nature, 444, 195–198, https://doi.org/10.1038/nature05301, 2006. a
Feldmann, J. and Levermann, A.: Collapse of the West Antarctic Ice Sheet after local destabilization of the Amundsen Basin, P. Natl. Acad. Sci. USA, 112, 14191–14196, https://doi.org/10.1073/pnas.1512482112, 2015. a
Fretwell, P., Pritchard, H. D., Vaughan, D. G., Bamber, J. L., Barrand, N. E., Bell, R., Bianchi, C., Bingham, R. G., Blankenship, D. D., Casassa, G., Catania, G., Callens, D., Conway, H., Cook, A. J., Corr, H. F. J., Damaske, D., Damm, V., Ferraccioli, F., Forsberg, R., Fujita, S., Gim, Y., Gogineni, P., Griggs, J. A., Hindmarsh, R. C. A., Holmlund, P., Holt, J. W., Jacobel, R. W., Jenkins, A., Jokat, W., Jordan, T., King, E. C., Kohler, J., Krabill, W., Riger-Kusk, M., Langley, K. A., Leitchenkov, G., Leuschen, C., Luyendyk, B. P., Matsuoka, K., Mouginot, J., Nitsche, F. O., Nogi, Y., Nost, O. A., Popov, S. V., Rignot, E., Rippin, D. M., Rivera, A., Roberts, J., Ross, N., Siegert, M. J., Smith, A. M., Steinhage, D., Studinger, M., Sun, B., Tinto, B. K., Welch, B. C., Wilson, D., Young, D. A., Xiangbin, C., and Zirizzotti, A.: Bedmap2: improved ice bed, surface and thickness datasets for Antarctica, The Cryosphere, 7, 375–393, https://doi.org/10.5194/tc-7-375-2013, 2013. a
Golledge, N., Menviel, L., Carter, L., Fogwill, C., England, M., Cortese, G., and Levy, R.: Antarctic contribution to meltwater pulse 1A from reduced Southern Ocean overturning, Nat. Commun., 5, 5107, https://doi.org/10.1038/ncomms6107, 2014. a, b
Goujon, C., Barnola, J. M., and Ritz, C.: Modeling the densification of polar firn including heat diffusion: Application to close-off characteristics and gas isotopic fractionation for Antarctica and Greenland sites, J. Geophys. Res.-Atmos., 108, 4792, https://doi.org/10.1029/2002jd003319, 2003. a
Grachev, A. M., Brook, E. J., Severinghaus, J. P., and Pisias, N. G.: Relative timing and variability of atmospheric methane and GISP2 oxygen isotopes between 68 and 86 ka, Global Biogeochem. Cy., 23, 2009, https://doi.org/10.1029/2008GB003330, 2009. a
Halberstadt, A. R. W., Simkins, L. M., Greenwood, S. L., and Anderson, J. B.: Past ice-sheet behaviour: retreat scenarios and changing controls in the Ross Sea, Antarctica, The Cryosphere, 10, 1003–1020, https://doi.org/10.5194/tc-10-1003-2016, 2016. a, b, c, d
Hattori, A.: Denitrification and dissimilatory nitrate reduction, Academic Press, New York, USA, 191–232, 1983. a
Herron, M. M. and Langway, C. C.: Firn densification: An empirical model, J. Glaciol., 25, 373–385, https://doi.org/10.3189/S0022143000015239, 1980. a, b, c
Horibe, Y., Shigehara, K., and Langway, C. C.: Chemical and isotopic composition of air inclusions in a Greenland ice core, Earth Planet. Sc. Lett., 73, 207–210, https://doi.org/10.1016/0012-821X(85)90069-X, 1985. a
Hughes, T.: Is the West Antarctic ice sheet disintegrating?, J. Geophys. Res., 78, 7884–7910, https://doi.org/10.1029/JC078i033p07884, 1973. a
Huybers, P. and Wunsch, C.: A depth-derived Pleistocene age model: Uncertainty estimates, sedimentation variability, and nonlinear climate change, Paleoceanography, 19, PA1028, https://doi.org/10.1029/2002PA000857, 2004. a, b
Jevrejeva, S., Grinsted, A., and Moore, J. C.: Upper limit for sea level projections by 2100, Environ. Res. Lett., 9, 104008, https://doi.org/10.1088/1748-9326/9/10/104008, 2014. a
Johnsen, S. J., Dahl-Jensen, D., Gundestrup, N., Steffensen, J. P., Clausen, H. B., Miller, H., Masson-Delmotte, V., Sveinbjörnsdottir, A. E., and White, J.: Oxygen isotope and palaeotemperature records from six Greenland ice-core stations: Camp Century, Dye-3, GRIP, GISP2, Renland and NorthGRIP, J. Quaternary Sci., 16, 299–307, https://doi.org/10.1002/jqs.622, 2001. a
Kawamura, K., Severinghaus, J. P., Ishidoya, S., Sugawara, S., Hashida, G., Motoyama, H., Fujii, Y., Aoki, S., and Nakazawa, T.: Convective mixing of air in firn at four polar sites, Earth Planet. Sc. Lett., 244, 672–682, https://doi.org/10.1016/j.epsl.2006.02.017, 2006. a
Kawamura, K. Parrenin, F., Lisiecki, L., Uemura, R., Vimeux, F., Severinghaus, J. P., Hutterli, M. A., Nakazawa, T., Aoki, S., Jouzel, J., Raymo, M. E., Matsumoto, K., Nakata, H., Motoyama, H., Fujita, S., Goto-Azuma, K., Fujii, Y., and Watanabe, O.: Northern Hemisphere forcing of climatic cycles in Antarctica over the past 360,000 years, Nature, 448, 912–916, https://doi.org/10.1038/nature06015, 2007. a
Keller, E. D., Baisden, W. T., Bertler, N. A. N., Emanuelsson, B. D., Canessa, S., and Phillips, A.: Calculating uncertainty for the RICE ice core continuous flow analysis water isotope record, Atmos. Meas. Tech., 11, 4725–4736, https://doi.org/10.5194/amt-11-4725-2018, 2018. a
Kingslake, J., Hindmarsh, R. C., Aðalgeirsdóttir, G., Conway, H., Corr, H. F., Gillet-Chaulet, F., Martín, C., King, E. C., Mulvaney, R., and Pritchard, H. D.: Full-depth englacial vertical ice sheet velocities measured using phase-sensitive radar, J. Geophys. Res.-Earth, 119, 2604–2618, https://doi.org/10.1002/2014JF003275, 2014. a
Landais, A., Barnola, J. M., Kawamura, K., Caillon, N., Delmotte, M., Van Ommen, T., Dreyfus, G., Jouzel, J., Masson-Delmotte, V., Minster, B., Freitag, J., Leuenberger, M., Schwander, J., Huber, C., Etheridge, D., and Morgan, V.: Firn-air δ15N in modern polar sites and glacial-interglacial ice: a model-data mismatch during glacial periods in Antarctica?, Quaternary Sci. Rev., 25, 49–62, https://doi.org/10.1016/j.quascirev.2005.06.007, 2006. a
Landais, A., Masson-Delmotte, V., Combourieu Nebout, N., Jouzel, J., Blunier, T., Leuenberger, M., Dahl-Jensen, D., and Johnsen, S.: Millenial scale variations of the isotopic composition of atmospheric oxygen over Marine Isotopic Stage 4, Earth Planet. Sc. Lett., 258, 101–113, https://doi.org/10.1016/j.epsl.2007.03.027, 2007. a, b, c, d, e
Landais, A., Dreyfus, G., Capron, E., Masson-Delmotte, V., Sanchez-Goñi, M. F., Desprat, S., Hoffmann, G., Jouzel, J., Leuenberger, M., and Johnsen, S.: What drives the millennial and orbital variations of δ18Oatm?, Quaternary Sci. Rev., 29, 235–246, https://doi.org/10.1016/j.quascirev.2009.07.005, 2010. a, b
Lundin, J. M., Stevens, C. M., Arthern, R., Buizert, C., Orsi, A., Ligtenberg, S. R., Simonsen, S. B., Cummings, E., Essery, R., Leahy, W., Harris, P., Helsen, M. M., and Waddington, E. D.: Firn Model Intercomparison Experiment (FirnMICE), J. Glaciol., 63, 401–422, https://doi.org/10.1017/jog.2016.114, 2017. a
Martín, C., Hindmarsh, R. C., and Navarro, F. J.: Dating ice flow change near the flow divide at Roosevelt Island, Antarctica, by using a thermomechanical model to predict radar stratigraphy, J. Geophys. Res.-Earth, 111, F01011, https://doi.org/10.1029/2005JF000326, 2006. a
Martinerie, P., Lipenkov, V. Y., and Raynaud, D.: Correction of air-content measurements in polar ice for the effect of cut bubbles at the surface of the sample, J. Glaciol., 36, 299–303, https://doi.org/10.3189/002214390793701282, 1990. a
Martinerie, P., Raynaud, D., Etheridge, D. M., Barnola, J. M., and Mazaudier, D.: Physical and climatic parameters which influence the air content in polar ice, Earth Planet. Sc. Lett., 112, 1–13, https://doi.org/10.1016/0012-821X(92)90002-D, 1992. a
Masson-Delmotte, V., Hou, S., Ekaykin, A., Jouzel, J., Aristarain, A., Bernardo, R. T., Bromwich, D., Cattani, O., Delmotte, M., Falourd, S., Frezzotti, M., Gallée, H., Genoni, L., Isaksson, E., Landais, A., Helsen, M. M., Hoffmann, G., Lopez, J., Morgan, V., Motoyama, H., Noone, D., Oerter, H., Petit, J. R., Royer, A., Uemura, R., Schmidt, G. A., Schlosser, E., Simões, J. C., Steig, E. J., Stenni, B., Stievenard, M., van den Broeke, M. R., van de Wal, R. S. W., van de Berg, W. J., Vimeux, F., and White, J. W. C.: A review of Antarctic surface snow isotopic composition: Observations, atmospheric circulation, and isotopic modeling, J. Climate, 21, 3359–3387, https://doi.org/10.1175/2007JCLI2139.1, 2008. a, b
McKay, R., Golledge, N. R., Maas, S., Naish, T., Levy, R., Dunbar, G., and Kuhn, G.: Antarctic marine ice-sheet retreat in the Ross Sea during the early Holocene, Geology, 44, 7–10, https://doi.org/10.1130/G37315.1, 2016. a, b, c, d
Mitchell, L. E., Brook, E. J., Sowers, T., McConnell, J. R., and Taylor, K.: Multidecadal variability of atmospheric methane, 1000–1800 C.E., J. Geophys. Res., 116, G02007, https://doi.org/10.1029/2010jg001441, 2011. a
Mitchell, L. E., Brook, E., Lee, J. E., Buizert, C., and Sowers, T.: Constraints on the Late Holocene Anthropogenic Contribution to the Atmospheric Methane Budget, Science, 342, 964–966, https://doi.org/10.1126/science.1238920, 2013. a, b, c, d, e, f, g
Mitchell, L. E., Buizert, C., Brook, E. J., Breton, D. J., Fegyveresi, J., Baggenstos, D., Orsi, A., Severinghaus, J., Alley, R. B., Albert, M., Rhodes, R. H., McConnell, J. R., Sigl, M., Maselli, O., Gregory, S., and Ahn, J.: Observing and modeling the influence of layering on bubble trapping in polar firn, J. Geophys. Res.-Atmos., 120, 2558–2574, https://doi.org/10.1002/2014JD022766, 2015. a
Nereson, N., Raymond, C., Waddington, E., and Jacobel, E.: Migration of the Siple Dome ice divide, West Antarctica, J. Glaciol., 44, 643–652, https://doi.org/10.3189/S0022143000002148, 1998. a
NGRIP Community Members: High-resolution record of Northern Hemisphere climate extending into the last interglacial period, Nature, 431, 147–151, https://doi.org/10.1038/nature02805, 2004. a
Nye, J.: Correction factor for accumulation measured by the thickness of the annual layers in an ice sheet, J. Glaciol., 4, 785–788, https://doi.org/10.3189/S0022143000028367, 1963. a, b, c
Parizek, B. R. and Alley, R. B.: Ice thickness and isostatic imbalances in the Ross Embayment, West Antarctica: model results, Global Planet. Change, 42, 265–278, https://doi.org/10.1016/j.gloplacha.2003.09.005, 2004. a, b, c
Parrenin, F., Masson-Delmotte, V., Köhler, P., Raynaud, D., Paillard, D., Schwander, J., Barbante, C., Landais, A., Wegner, A., and Jouzel, J.: Synchronous change of atmospheric CO2 and Antarctic temperature during the last deglacial warming, Science, 339, 1060–1063, https://doi.org/10.1126/science.1226368, 2013. a
Petit, J. R., Jouzel, J., Raynaud, D., Barkov, N. I., Barnola, J. M., Basile, I., Bender, M., Chappellaz, J., Davis, M., Delaygue, G., Delmotte, M., Kotlyakov, V. M., Legrand, M., Lipenkov, V. Y., Lorius, C., Pepin, L., Ritz, C., Saltzman, E., and Stievenard, M.: Climate and atmospheric history of the past 420,000 years from the Vostok ice core, Antarctica, Nature, 399, 429–436, https://doi.org/10.1038/20859, 1999. a, b
Petrenko, V. V., Severinghaus, J. P., Brook, E. J., Reeh, N., and Schaefer, H.: Gas records from the West Greenland ice margin covering the Last Glacial Termination: a horizontal ice core, Quaternary Sci. Rev., 25, 865–875, https://doi.org/10.1016/j.quascirev.2005.09.005, 2006. a
Pollard, D., DeConto, R. M., and Alley, R. B.: Potential Antarctic Ice Sheet retreat driven by hydrofracturing and ice cliff failure, Earth Planet. Sc. Lett., 412, 112–121, https://doi.org/10.1016/j.epsl.2014.12.035, 2015. a
Price, S., Conway, H., and Waddington, E.: Evidence for late Pleistocene thinning of Siple Dome, West Antarctica, J. Geophys. Res.-Earth, 112, F03021, https://doi.org/10.1029/2006JF000725, 2007. a, b, c
Pyne, R. L., Keller, E. D., Canessa, S., Bertler, N. A., Pyne, A. R., Mandeno, D., Vallelonga, P., Semper, S., Kjær, H. A., Hutchinson, E., and Baisden, W. T.: A novel approach to process brittle ice for continuous flow analysis of stable water isotopes, J. Glaciol., 64, 289–299, https://doi.org/10.1017/jog.2018.19, 2018. a
Raynaud, D. and Whillans, I.: Air content of the Byrd core and past changes in the West Antarctic ice sheet, Ann. Glaciol., 3, 269–273, https://doi.org/10.3189/S0260305500002901, 1982. a
Raynaud, D., Lipenkov, V., Lemieux-Dudon, B., Duval, P., Loutre, M. F., and Lhomme, N.: The local insolation signature of air content in Antarctic ice. A new step toward an absolute dating of ice records, Earth Planet. Sc. Lett., 261, 337–349, https://doi.org/10.1016/j.epsl.2007.06.025, 2007. a
Reimer, P. J., Bard, E., Bayliss, A., Beck, J. W., Blackwell, P. G., Ramsey, C. B., Grootes, P. M., Guilderson, T. P., Haflidason, H., and Hajdas, I.: IntCal13 and Marine13 radiocarbon age calibration curves 0–50,000 years cal BP, Radiocarbon, 55, 1869–1887, 2013. a
Rhodes, R. H., Faïn, X., Stowasser, C., Blunier, T., Chappellaz, J., McConnell, J. R., Romanini, D., Mitchell, L. E., and Brook, E. J.: Continuous methane measurements from a late Holocene Greenland ice core: Atmospheric and in-situ signals, Earth Planet. Sc. Lett., 368, 9–19, https://doi.org/10.1016/j.epsl.2013.02.034, 2013. a
Rhodes, R. H., Brook, E. J., Chiang, J. C., Blunier, T., Maselli, O. J., McConnell, J. R., Romanini, D., and Severinghaus, J. P.: Enhanced tropical methane production in response to iceberg discharge in the North Atlantic, Science, 348, 1016–1019, https://doi.org/10.1126/science.1262005, 2015. a, b, c, d, e
Robin, G. d. Q. and Adie, R. J.: The ice cover, in: Antarctic research: a review of British scientific achievement in Antarctica, edited by: Priestley, R. E., Adie, R. J., and Robin, G. d. Q., Butterworth & Co Publishers Ltd, London, UK, 100–117, 1964. a
Rosen, J. L., Brook, E. J., Severinghaus, J. P., Blunier, T., Mitchell, L. E., Lee, J. E., Edwards, J. S., and Gkinis, V.: An ice core record of near-synchronous global climate changes at the Bolling transition, Nat. Geosci., 7, 459–463, https://doi.org/10.1038/ngeo2147, 2014. a, b
Schoof, C.: Ice sheet grounding line dynamics: Steady states, stability, and hysteresis, J. Geophys. Res.-Earth, 112, F03S28, https://doi.org/10.1029/2006JF000664, 2007. a
Schwander, J.: The transformation of snow to ice and the occlusion of gases, in: The Environmental Record in Glaciers and Ice Sheets, edited by: Oescher, H. and Langway, C., John Wiley, New York, USA, 53–67, 1989. a, b
Schwander, J., Sowers, T., Barnola, J. M., Blunier, T., Fuchs, A., and Malaize, B.: Age scale of the air in the summit ice: Implication for glacial-interglacial temperature change, J. Geophys. Res.-Atmos., 102, 19483–19493, https://doi.org/10.1029/97JD01309, 1997. a
Seltzer, A. M., Buizert, C., Baggenstos, D., Brook, E. J., Ahn, J., Yang, J.-W., and Severinghaus, J. P.: Does δ18O of O2 record meridional shifts in tropical rainfall?, Clim. Past, 13, 1323–1338, https://doi.org/10.5194/cp-13-1323-2017, 2017. a
Severinghaus, J. P., Beaudette, R., Headly, M. A., Taylor, K., and Brook, E. J.: Oxygen-18 of O2 Records the Impact of Abrupt Climate Change on the Terrestrial Biosphere, Science, 324, 1431–1434, https://doi.org/10.1126/science.1169473, 2009. a, b, c, d, e
Shepherd, A., Wingham, D., and Rignot, E.: Warm ocean is eroding West Antarctic ice sheet, Geophys. Res. Lett., 31, L23402, https://doi.org/10.1029/2004GL021106, 2004. a
Shipp, S., Anderson, J., and Domack, E.: Late Pleistocene-Holocene retreat of the West Antarctic Ice Sheet system in the Ross Sea: part 1 – geophysical results, Geol. Soc. Am. Bull., 111, 1486–1516, 1999. a, b, c
Sigl, M., Fudge, T. J., Winstrup, M., Cole-Dai, J., Ferris, D., McConnell, J. R., Taylor, K. C., Welten, K. C., Woodruff, T. E., Adolphi, F., Bisiaux, M., Brook, E. J., Buizert, C., Caffee, M. W., Dunbar, N. W., Edwards, R., Geng, L., Iverson, N., Koffman, B., Layman, L., Maselli, O. J., McGwire, K., Muscheler, R., Nishiizumi, K., Pasteris, D. R., Rhodes, R. H., and Sowers, T. A.: The WAIS Divide deep ice core WD2014 chronology – Part 2: Annual-layer counting (0–31 ka BP), Clim. Past, 12, 769–786, https://doi.org/10.5194/cp-12-769-2016, 2016. a
Southon, J., Noronha, A. L., Cheng, H., Edwards, R. L., and Wang, Y.: A high-resolution record of atmospheric 14C based on Hulu Cave speleothem H82, Quaternary Sci. Rev., 33, 32–41, 2012. a
Sowers, T., Bender, M., and Raynaud, D.: Elemental and isotopic composition of occluded O2 and N2 in polar ice, J. Geophys. Res.-Atmos., 94, 5137–5150, https://doi.org/10.1029/JD094iD04p05137, 1989. a, b
Sowers, T., Bender, M., Labeyrie, L., Martinson, D., Jouzel, J., Raynaud, D., Pichon, J. J., and Korotkevich, Y. S.: A 135,000-year Vostok-Specmap Common temporal framework, Paleoceanography, 8, 737–766, https://doi.org/10.1029/93PA02328, 1993. a
Steig, E. J., Fastook, J. L., Zweck, C., Goodwin, I. D., Licht, K. J., White, J. W., and Ackert, R. P.: West Antarctic ice sheet elevation changes, in: The West Antarctic Ice Sheet: Behavior and Environment, edited by: Alley, R. B. and Bindschadle, R. A., Antarctic Research Series, Wiley Online Library, 75–90, https://doi.org/10.1029/AR077p0075, 2001. a
Stenni, B., Curran, M. A. J., Abram, N. J., Orsi, A., Goursaud, S., Masson-Delmotte, V., Neukom, R., Goosse, H., Divine, D., van Ommen, T., Steig, E. J., Dixon, D. A., Thomas, E. R., Bertler, N. A. N., Isaksson, E., Ekaykin, A., Werner, M., and Frezzotti, M.: Antarctic climate variability on regional and continental scales over the last 2000 years, Clim. Past, 13, 1609–1634, https://doi.org/10.5194/cp-13-1609-2017, 2017. a, b
Stone, J. O., Balco, G. A., Sugden, D. E., Caffee, M. W., Sass, L. C., Cowdery, S. G., and Siddoway, C.: Holocene deglaciation of Marie Byrd land, West Antarctica, Science, 299, 99–102, https://doi.org/10.1126/science.1077998, 2003. a
Stowasser, C., Buizert, C., Gkinis, V., Chappellaz, J., Schüpbach, S., Bigler, M., Faïn, X., Sperlich, P., Baumgartner, M., Schilt, A., and Blunier, T.: Continuous measurements of methane mixing ratios from ice cores, Atmos. Meas. Tech., 5, 999–1013, https://doi.org/10.5194/amt-5-999-2012, 2012. a
Stuiver, M., Denton, G. H., Hughes, T. J., and Fastook, J. L.: History of the marine ice sheet in West Antarctica during the last glaciation: a working hypothesis, in: The Last Great Ice Sheets, edited by: Denton, G. H. and Hughes, T. J., John Wiley & Sons, New York, USA, 319–436, 1981. a
Svensson, A., Andersen, K. K., Bigler, M., Clausen, H. B., Dahl-Jensen, D., Davies, S. M., Johnsen, S. J., Muscheler, R., Parrenin, F., Rasmussen, S. O., Röthlisberger, R., Seierstad, I., Steffensen, J. P., and Vinther, B. M.: A 60 000 year Greenland stratigraphic ice core chronology, Clim. Past, 4, 47–57, https://doi.org/10.5194/cp-4-47-2008, 2008. a, b
Thorsteinsson, T. and Waddington, E. D.: Folding in strongly anisotropic layers near ice-sheet centers, Ann. Glaciol., 35, 480–486, https://doi.org/10.3189/172756402781816708, 2002. a
Tuohy, A., Bertler, N., Neff, P., Edwards, R., Emanuelsson, D., Beers, T., and Mayewski, P.: Transport and deposition of heavy metals in the Ross Sea Region, Antarctica, J. Geophys. Res.-Atmos., 120, 10996–11011, https://doi.org/10.1002/2015JD023293, 2015. a
Waddington, E. D., Bolzan, J. F., and Alley, R. B.: Potential for stratigraphic folding near ice-sheet centers, J. Glaciol., 47, 639–648, https://doi.org/10.3189/172756501781831756, 2001. a
Waddington, E. D., Conway, H., Steig, E., Alley, R., Brook, E., Taylor, K., and White, J.: Decoding the dipstick: Thickness of Siple Dome, West Antarctica, at the last glacial maximum, Geology, 33, 281–284, https://doi.org/10.1130/G21165.1, 2005. a, b, c, d, e
WAIS Divide Project Members: Onset of deglacial warming in West Antarctica driven by local orbital forcing, Nature, 500, 440–444, https://doi.org/10.1038/nature12376, 2013. a, b
Weertman, J.: Stability of the junction of an ice sheet and an ice shelf, J. Glaciol., 13, 3–11, https://doi.org/10.3189/S0022143000023327, 1974. a
Whitehouse, P. L., Bentley, M. J., and Le Brocq, A. M.: A deglacial model for Antarctica: geological constraints and glaciological modelling as a basis for a new model of Antarctic glacial isostatic adjustment, Quaternary Sci. Rev., 32, 1–24, https://doi.org/10.1016/j.quascirev.2011.11.016, 2012. a
Winstrup, M., Vallelonga, P., Kjær, H. A., Fudge, T. J., Lee, J. E., Riis, M. H., Edwards, R., Bertler, N. A. N., Blunier, T., Brook, E. J., Buizert, C., Ciobanu, G., Conway, H., Dahl-Jensen, D., Ellis, A., Emanuelsson, B. D., Hindmarsh, R. C. A., Keller, E. D., Kurbatov, A. V., Mayewski, P. A., Neff, P. D., Pyne, R. L., Simonsen, M. F., Svensson, A., Tuohy, A., Waddington, E. D., and Wheatley, S.: A 2700-year annual timescale and accumulation history for an ice core from Roosevelt Island, West Antarctica, Clim. Past, 15, 751–779, https://doi.org/10.5194/cp-15-751-2019, 2019. a, b, c, d, e, f, g, h, i, j, k
Wolff, E. W., Chappellaz, J., Blunier, T., Rasmussen, S. O., and Svensson, A.: Millennial-scale variability during the last glacial: The ice core record, Quaternary Sci. Rev., 29, 2828–2838, https://doi.org/10.1038/ngeo442, 2010. a
- Abstract
- Introduction
- The Roosevelt Island ice core and glaciological history
- New data sets from the RICE ice core
- Strategy for developing the RICE17 chronology
- Results and key observations from the RICE17 chronology and gas data sets
- Conclusions
- Appendix A: Methane measurements
- Appendix B: Calibration of RICE CFA methane
- Appendix C: Steady-state Herron–Langway sensitivity test
- Code and data availability
- Author contributions
- Competing interests
- Acknowledgements
- Financial support
- Review statement
- References
- Supplement