the Creative Commons Attribution 4.0 License.
the Creative Commons Attribution 4.0 License.
 | 04 Aug 2020
Paleobotanical proxies for early Eocene climates and ecosystems in northern North America from middle to high latitudes
Christopher K. West
David R. Greenwood
Tammo Reichgelt
Alexander J. Lowe
Janelle M. Vachon
James F. Basinger
Early Eocene climates were globally warm, with ice-free conditions at both poles. Early Eocene polar landmasses supported extensive forest ecosystems of a primarily temperate biota but also with abundant thermophilic elements, such as crocodilians, and mesothermic taxodioid conifers and angiosperms. The globally warm early Eocene was punctuated by geologically brief hyperthermals such as the Paleocene–Eocene Thermal Maximum (PETM), culminating in the Early Eocene Climatic Optimum (EECO), during which the range of thermophilic plants such as palms extended into the Arctic. Climate models have struggled to reproduce early Eocene Arctic warm winters and high precipitation, with models invoking a variety of mechanisms, from atmospheric CO2 levels that are unsupported by proxy evidence to the role of an enhanced hydrological cycle, to reproduce winters that experienced no direct solar energy input yet remained wet and above freezing. Here, we provide new estimates of climate and compile existing paleobotanical proxy data for upland and lowland midlatitude sites in British Columbia, Canada, and northern Washington, USA, and from high-latitude lowland sites in Alaska and the Canadian Arctic to compare climatic regimes between the middle and high latitudes of the early Eocene – spanning the PETM to the EECO – in the northern half of North America. In addition, these data are used to reevaluate the latitudinal temperature gradient in North America during the early Eocene and to provide refined biome interpretations of these ancient forests based on climate and physiognomic data.
- Article
(11483 KB) - Full-text XML
- BibTeX
- EndNote


The early Eocene (56–47.8 million years ago) was a globally warm interval in Earth's history, which resulted from a warming trend correlated with elevated greenhouse gas levels that began in the late Paleocene (Zachos et al., 2008; Carmichael et al., 2016). This warming was punctuated by a series of episodic hyperthermal events (e.g., the Paleocene–Eocene Thermal Maximum and the Eocene Thermal Maximum 2), which caused global climatic perturbations and ultimately culminated in the early Eocene Climatic Optimum (EECO) (Zachos et al., 2008; Littler et al., 2014; Laurentano et al., 2015; Westerhold et al., 2018). During the early Eocene, the climate of much of northern North America was warm and wet, with mean annual temperatures (MATs) as high as 20 ∘C, mean annual precipitation (MAP) of 100–150 cm a−1, mild frost-free winters (coldest month mean temperature > 5 ∘C), and climatic conditions that supported extensive temperate forest ecosystems (e.g., Wing and Greenwood, 1993; Wing, 1998; Shellito and Sloan, 2006; Smith et al., 2012; Breedlovestrout et al., 2013; Herold et al., 2014; Greenwood et al., 2016).
These warm and wet conditions extended poleward in North America despite extreme photoperiodism, promoting the establishment of temperate forest ecosystems and thermophilic biota (e.g., mangroves, palm trees, and alligators) (Eldrett et al., 2009, 2014; Sluijs et al., 2009; Huber and Caballero, 2011; Eberle and Greenwood, 2012; Littler et al., 2014; West et al., 2015, 2019; Salpin et al., 2019) and providing evidence for a shallow latitudinal temperature gradient in contrast to the much higher gradient of modern North America (Greenwood and Wing, 1995; Naafs et al., 2018). The reconstructed paleoclimatic and biotic similarity between the middle and high latitudes of Eocene North America may be counterintuitive given the limited photic seasonality of midlatitude sites and the extreme seasonal photic regime of high-latitude environments. In spite of similar thermal regimes, one would expect that the Arctic ecosystems would have experienced unparalleled abiotic stress from the extended period of winter darkness (West et al., 2015) and, as a result, would have had a substantially different climate and biota from those of contemporaneous midlatitude sites. Fossil evidence from both the middle and high latitudes, however, demonstrates little to no discernable effect.
The early Eocene geological record preserves evidence of biota living during a globally warm “greenhouse” interval with elevated atmospheric CO2 relative to modern levels and, as such, offers an opportunity to explore the global response of physical and biological systems to global climate change (Zachos et al., 2008; Smith et al., 2010; Hollis et al., 2019). Fossil plants are among the best proxies for terrestrial paleoclimates, as plants are sessile organisms that interact directly with their environment and whose phenotype is highly moderated by variables such as temperature, moisture, and atmospheric carbon availability. Despite this, paleobotanical proxy reconstructions of temperature and precipitation are often mismatched with general circulation model (GCM) simulation output, and models struggle to reproduce the warm high-latitude regions and reduced latitudinal temperature gradient of the early Eocene as evidenced from the fossil record (Huber and Caballero, 2011; Huber and Goldner, 2012; Herold et al., 2014; Carmichael et al., 2016; Lunt et al., 2017, 2020; Keery et al., 2018; Naafs et al., 2018; Hollis et al., 2019). This suggests that some atmospheric processes related to heat transfer may be missing from GCM simulations (Carmichael et al., 2018, and references cited therein). Furthermore, there are far fewer compilations of terrestrial temperature proxy data compared to marine-based data compilations of sea surface temperature (SST) (Hollis et al., 2019). This results in spatial, or geographic, gaps in proxy data – essentially the paucity of data requires that proxy climate data separated by considerable distance must be used to interpolate climate over large geographic areas – that impede the efficacy of GCM simulations (Hollis et al., 2019). However, concerted efforts have been made to fill the geographic gaps through the development of new, targeted compilations and additional proxy data (e.g., DeepMIP, Hollis et al., 2019; Lunt et al., 2020). In addition, models do not typically incorporate potential vegetative feedbacks (Lunt et al., 2012), although advances in defining functional plant types have been made (Loptson et al., 2014).
Therefore, there is a need to refine the quality and consistency of physiognomic and nearest living relative (NLR) paleobotanical proxy data estimates, provide new physiognomic and NLR proxy data to help fill regional and temporal gaps, and provide more reliable forest biome interpretations. An emphasis needs to be placed on multi-proxy studies that evaluate an ensemble of proxy estimates, which allows for identifying strongly congruent paleoclimate proxy reconstructions wherein the results agree and inconsistencies wherein the failures of individual proxy estimates can be identified. Thus, the purpose of this study is to reconsider reported, and introduce new, early Eocene paleobotanical climate data from northern North America utilizing a refined methodology whereby a bootstrapping approach is applied to the data to produce ensemble climate estimates. Paleobotanical-based paleoclimate reconstructions from northern North America are reviewed, and new paleoclimate estimates are provided for British Columbia and the Canadian Arctic through the application of a multi-proxy ensemble approach. Our multi-proxy ensemble analysis utilizes both new and previously published leaf physiognomic as well as new nearest living relative data, as recommended by Hollis et al. (2019) and others (e.g., Reichgelt et al., 2018, Lowe et al., 2018; Willard et al., 2019) in order to mitigate potential errors resulting from variations between methods.
Paleobotanical assemblages from four distinct regions in northern North America are considered here: midlatitude lowland sites, midlatitude upland sites, low polar lowland sites, and high polar lowland sites. Comparison of lowland sites allows for reevaluation of the terrestrial latitudinal temperature gradient in northern North America. Furthermore, the distribution of vegetation, as potentially moderated by climate, elevation, continentality, and photoperiod, is evaluated through comparisons of the midlatitude upland and high-latitude lowland fossil localities. This is achieved by plotting climate data on biome diagrams, as well as principal component analysis (PCA) and hierarchical cluster analysis (HCA) of leaf physiognomy. This provides a more robust interpretation of these ancient forested ecosystems, which will contribute to the refinement of modeling simulations by providing reliable insight for prescribing early Eocene boundary conditions for high-latitude vegetation and environments.
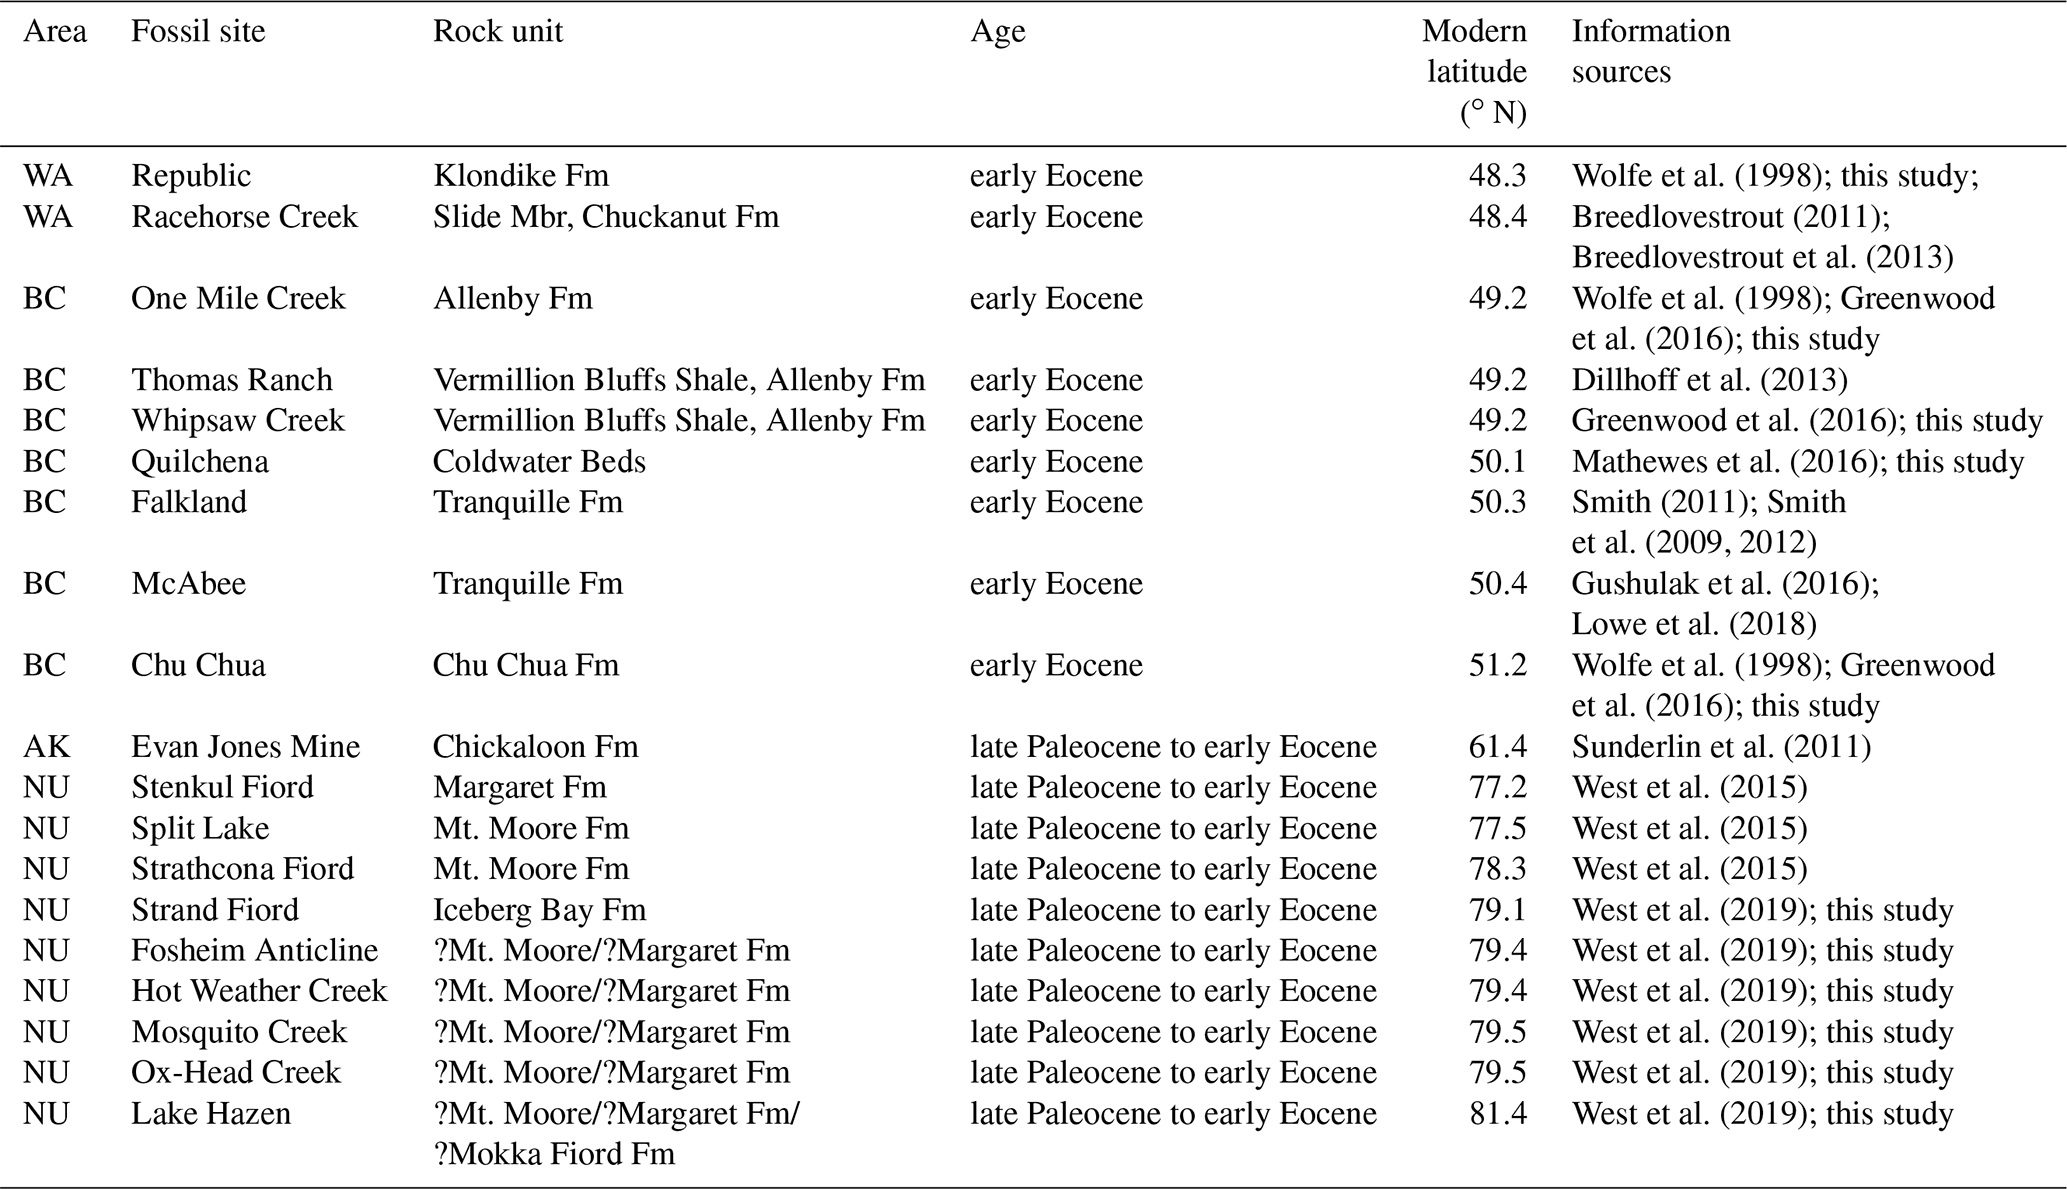
Table 1Locality information for fossil sites discussed in this study. BC – British Columbia, Canada; NU – Nunavut, Canada; WA – Washington, USA; AK – Alaska, USA.
2.1 Fossil plant localities
Early Eocene paleobotanical proxy data used for this study are sourced from fossil megaflora (i.e., fossil leaves and other organs) from multiple fossil localities from the northern midlatitudes (48.3–51.2∘ N) and high latitudes (61.4–81.4∘ N) of North America, primarily within Canada but also including sites from Washington state and Alaska (Table 1). In general, the majority of the fossil localities used for this study were within a few degrees latitude of their present position, as North America has moved obliquely past the rotational pole since the Eocene (McKenna, 1980; van Hinsbergen et al., 2015). As the resulting slight poleward displacement is not significant for the present work, we report modern latitudes for the compilation of fossil localities within this study to avoid discrepancies in differing methods of estimating paleolatitudes. These localities represent both lowland and upland ecosystems. Prior physiognomic analyses of fossil megaflora from both the midlatitudes and high latitudes of North America indicate that these ancient forests were growing under similar thermal regimes (e.g., MAT 10–15 ∘C and MAP 100–150 cm a−1) (Wing and Greenwood, 1993; Greenwood and Wing, 1995; Smith et al., 2012; West et al., 2015; Gushulak et al., 2016; Greenwood et al., 2016; Lowe et al., 2018). The Canadian fossil localities (e.g., British Columbia and Nunavut) are stratigraphically correlated, placing all the fossil study sites into a chronological sequence spanning the early Eocene (McIver and Basinger, 1999; Greenwood et al., 2016; Eberle and Greenwood, 2017; West et al., 2019). Other localities within our dataset (e.g., Evan Jones Mine, AK, Racehorse Creek, and Republic, WA) are also considered equivalent in age, and the stratigraphic relationships for these floras may be found in the respective publications for these localities (Table 1).
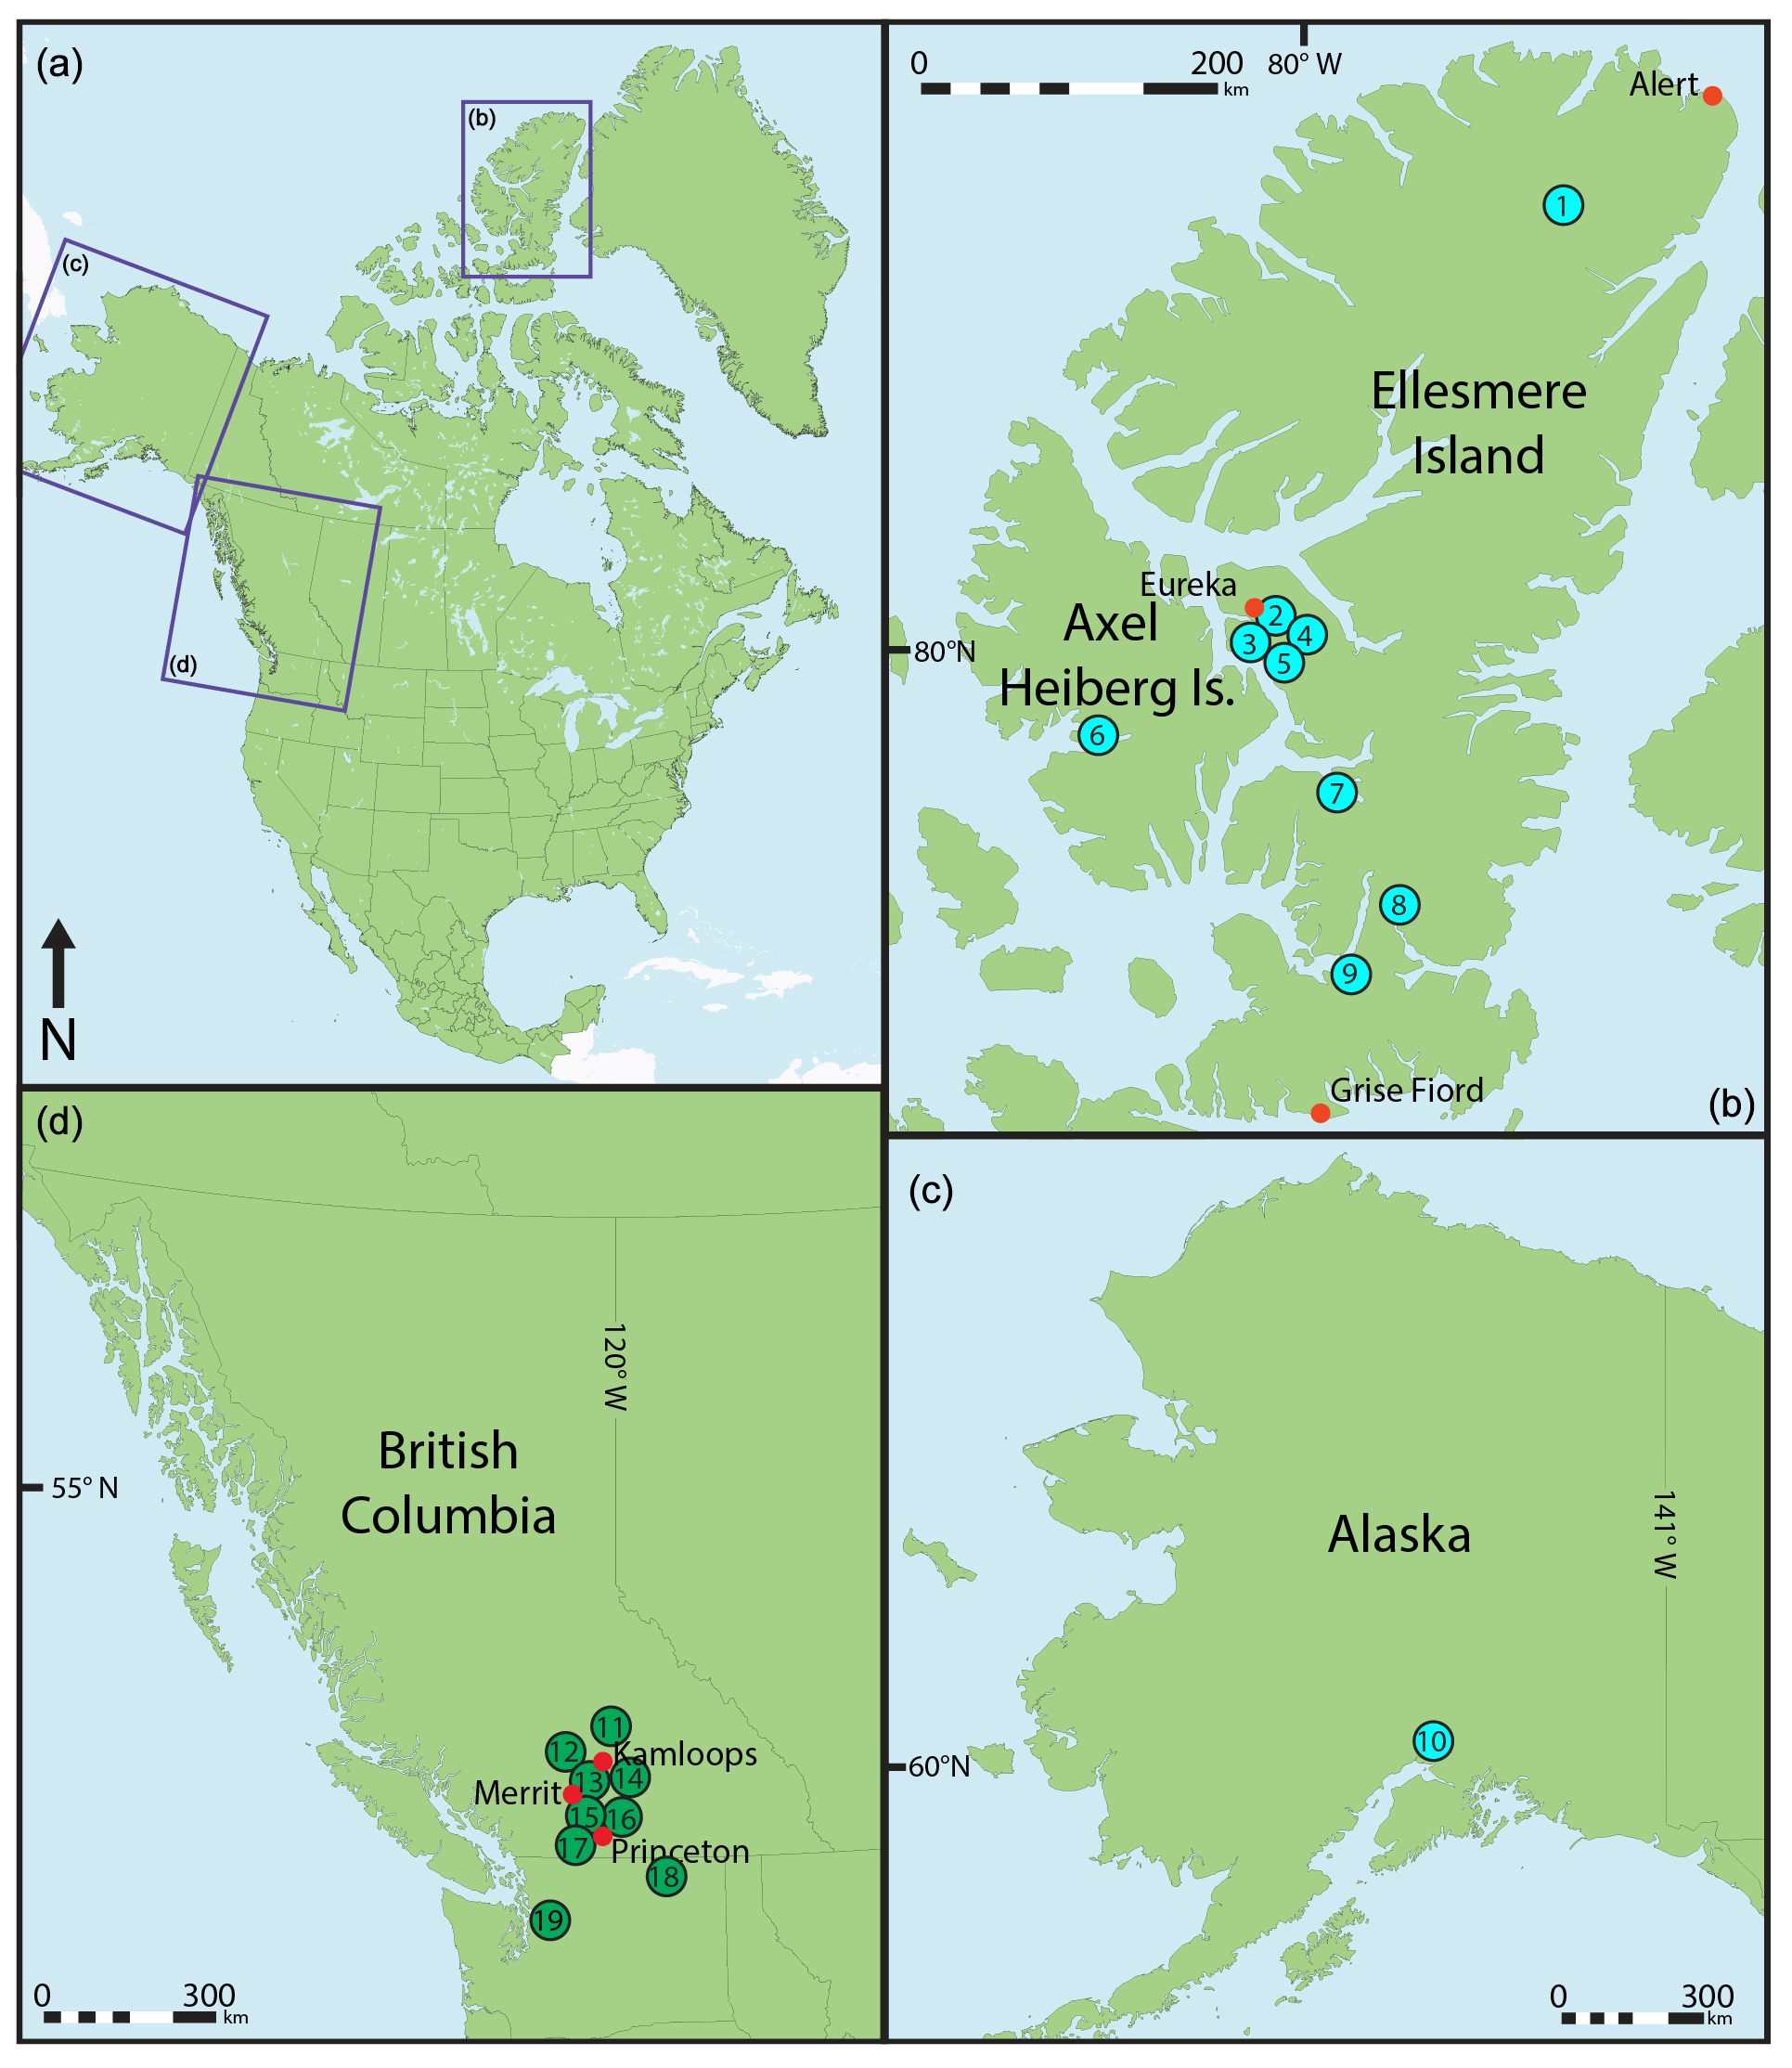
Figure 1Map showing the location of the fossil localities used in this study. (1) Lake Hazen, (2) Mosquito Creek, (3) Ox-Head Creek, (4) Hot Weather Creek, (5) Fosheim Anticline, (6) Strand Fiord), (7) Strathcona Fiord, (8) Split Lake, (9) Stenkul Fiord, (10) Evan Jones Mine, (11) Chu Chua, (12) McAbee, (13) Quilchena, (14) Falkland, (15) Thomas Ranch, (16) One Mile Creek, (17) Whipsaw Creek, (18) Republic, (19) Racehorse Creek.
2.1.1 Midlatitude upland fossil plant localities
The Okanagan Highlands host a suite of midlatitude upland fossil floras from British Columbia and Washington (Archibald et al., 2011; Greenwood et al., 2016) (Table 1, Fig. 1d). These fossil localities have been dated radiometrically as early Eocene, likely occurring within the EECO (Moss et al., 2005; Smith et al., 2009; Greenwood et al., 2016; Mathewes et al., 2016; Lowe et al., 2018). Okanagan Highlands floras are broadly similar in floristic composition, comprised of a high diversity of plant genera typical of modern temperate deciduous and subtropical evergreen forests (DeVore and Pigg, 2010; Smith et al., 2012; Gushulak et al., 2016; Lowe et al., 2018). Detailed discussions regarding the composition of the midlatitude upland fossil floral assemblages can be found in the primary resources describing these fossil sites (see Smith et al., 2012; Greenwood et al., 2016; Lowe et al., 2018). These forests were regionally extensive, occupying north–south-oriented and arc-related volcanic highlands (Mathewes, 1991; Lowe et al., 2018). The paleoelevation of these sites has been reconstructed to be between 500 and 1500 m based on both paleobotanical and geochemical proxies (Wolfe et al., 1998; Greenwood et al., 2005, 2016; Tribe, 2005; Smith et al., 2012), and as a result of this altitude, these forests would have experienced cooler temperatures than the coastal lowlands to the west (Wolfe et al., 1998; Greenwood et al., 2016; Lowe et al., 2018). In addition to plants, fossil insect diversity is high, similar to modern-day tropical forests (Archibald et al., 2010, 2013)
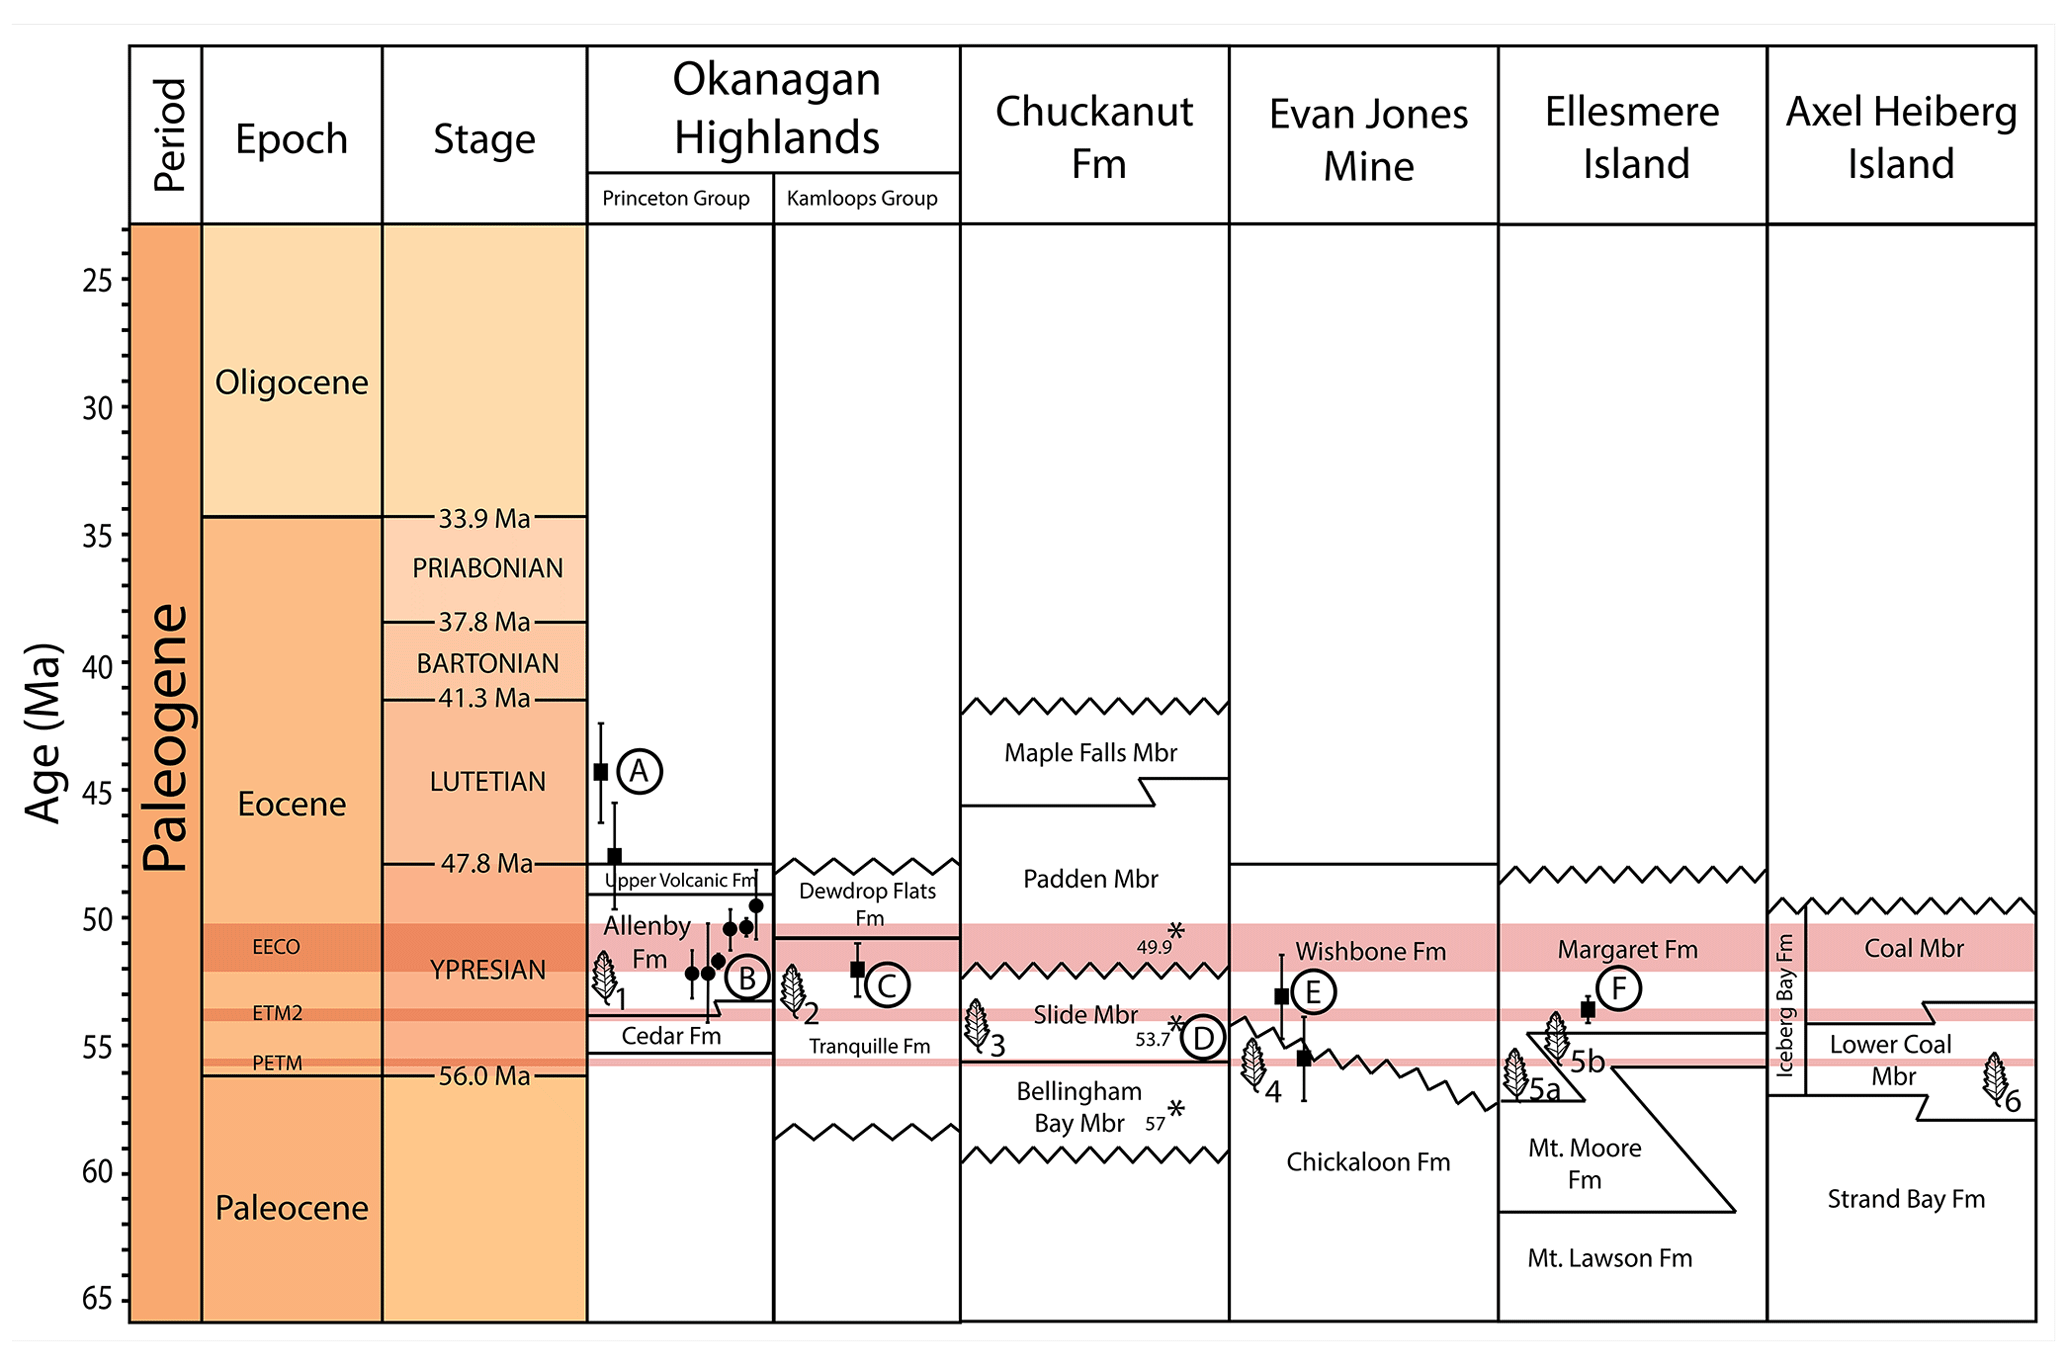
Figure 2Stratigraphic compilation of corresponding formations for the fossil localities used in this study. A–F represent the corresponding radiometric data for those formations, and leaf images numbered 1–6 represent approximate stratigraphic positions of the floras used for this study. Fm: formation; Mbr: member. Data compiled from Sunderlin et al. (2011), Breedlovestrout et al. (2013), Greenwood et al. (2016), and West et al. (2015). Modified from West et al. (2019) and Greenwood et al. (2016).
2.1.2 Midlatitude lowland fossil plant localities
The uppermost Paleocene to middle Eocene Chuckanut Formation of western Washington state (Fig. 1c) contains several fossil floras representing subtropical coastal lowland ecosystems, including palms and many other thermophilic plant taxa (Breedlovestrout et al., 2013; Mathewes et al., 2020). The Chuckanut floras used for this study are the Racehorse Creek fossil localities, which are found within the Slide Member (Fig. 2), a thick terrestrial deposit that has been radiometrically dated to the early Eocene (Breedlovestrout et al., 2013). See Breedlovestrout et al. (2013) for additional details regarding the composition of the Chuckanut fossil megaflora assemblage.
2.1.3 High-latitude low polar lowland fossil localities
The Chickaloon Formation in south–central Alaska (Fig. 1c) preserves a fossil flora known from the Evan Jones Mine (Sunderlin et al., 2011), herein referred to as the Evan Jones Mine flora. Wolfe et al. (1966) assigned a Paleocene age to the Chickaloon Formation based on K–Ar dating. However, fission-track zircon dating shows that the Paleocene–Eocene boundary occurs within the upper 150 m of the Chickaloon Formation (Triplehorn et al., 1984), stratigraphically near the fossil flora (Fig. 2), and therefore the Chickaloon Formation straddles the Paleocene–Eocene boundary (sensu Sunderlin et al., 2011). The Evan Jones Mine flora represents a lowland warm temperate to subtropical floodplain forest, as fossil palms are present and a high proportion of the flora exhibits leaves with untoothed margins (Wolfe et al., 1966; Sunderlin et al., 2011). See Sunderlin et al. (2011) for additional details regarding the composition of the Evan Jones Mine fossil megaflora assemblage.
2.1.4 High-latitude high polar lowland fossil localities
Fossil floras from Ellesmere and Axel Heiberg islands in Nunavut, Canada, are from the most northerly fossil sites included in this study (Fig. 1b). These fossil floras have been sampled extensively from formations within the Eureka Sound Group, primarily from the Mount Lawson, Mount Moore, and Margaret (Iceberg Bay) formations (Fig. 2) (McIver and Basinger, 1999; West et al., 2019). The Margaret Formation at Stenkul Fiord and the Mount Lawson Formation at Split Lake have been radiometrically dated to the early Eocene (Reinhardt et al., 2013, 2017). Additional age controls (i.e., vertebrate fossils, palynology, paleomagnetic dating) suggest late Paleocene, early Eocene, or both for all three formations at various localities (Eberle and Greenwood, 2012; West et al., 2019). The fossil floras of the Canadian Arctic are therefore considered to represent the late Paleocene to early Eocene time interval, with some localities capturing the PETM and ETM-2 hyperthermal events (e.g., Stenkul Fiord) (Sudermann et al., 2020). These high-latitude fossil floras represent lowland environments that are considered warm temperate floodplain or swamp forests (McIver and Basinger, 1999; Greenwood et al., 2010; West et al., 2019). Although this high Arctic assemblage as a whole is of a high taxonomic richness (see West et al., 2019), the site-to-site diversity (β diversity) is the lowest within the compilation for this study. See West et al. (2019) for a detailed discussion regarding the composition of the high-latitude polar lowland fossil megaflora assemblages.
2.2 Sampling
At the majority of the fossil sites from British Columbia, fossil leaves were comprehensively sampled along bedding planes using census sampling (i.e., collecting > 300 leaf morphotype specimens; Wilf, 2000; Lowe et al., 2018). Some sites, such as those from the Canadian Arctic (i.e., Ellesmere and Axel Heiberg islands) and others from British Columbia (i.e., Chu Chua, Driftwood Canyon, One Mile Creek, Thomas Ranch), represent leaf collections from prior work by earlier researchers for which sampling was selective to yield a representative sample of the leaf taxa present. Some localities reported in this study were not sampled by the authors (e.g., Evan Jones Mine, Alaska; Chu Chua, One Mile Creek, Quilchena and Thomas Ranch, BC; Racehorse Creek and Republic, WA); therefore, the details of the sampling protocols for those floras may differ from the sampling methods outlined above. The sampling methods for those fossil sites can be found in their original respective publications (Table 1).
2.3 Paleoclimate analyses
2.3.1 Leaf physiognomy
Leaf physiognomy methods, such as climate leaf analysis multivariate program (CLAMP) and leaf area analysis (LAA), utilize correlations between leaf architecture and climate variables derived from modern global vegetation databases to provide estimates of paleoclimate variables (Greenwood, 2007; Peppe et al., 2011; Yang et al., 2015; Hollis et al., 2019). Hollis et al. (2019) noted the potential for disparity between fossil-plant-based climate proxies and calibrations within individual proxies that can contribute to differences in climate estimates; this represents a challenge for model–data comparisons for the Eocene.
We primarily report physiognomically derived paleoclimate estimates from CLAMP, as these were readily available from some localities from prior studies (e.g., Wolfe et al., 1998; Sunderlin et al., 2011; Smith et al., 2012; Breedlovestrout et al., 2013; Dillhoff et al., 2013; West et al., 2015; Gushulak et al., 2016; Mathewes et al., 2016; Lowe et al., 2018), and because CLAMP provides estimates of seasonal temperatures and precipitation. The use of CLAMP estimates allows for comparisons between the paleontological proxy estimates of winter temperatures and the seasonality of precipitation with climate model output, parameters that are of interest in understanding early Eocene climates at middle and high latitudes (Huber and Caballero, 2011; Huber and Goldner, 2012; Carmichael et al., 2016; Hollis et al., 2019). For sites where the original published CLAMP estimates were incomplete or run early in the development of CLAMP (e.g., Chu Chua, One Mile Creek and Republic; Wolfe et al., 1998), we have rerun the CLAMP analyses using the original score sheets archived on the CLAMP Online website. The Physg3brcAZ vegetation and the GRIDMet3brcAZ meteorological datasets were used for the analyses run for this study (Wolfe, 1993; Yang et al., 2011, 2015). For CLAMP estimates sourced from existing studies, the vegetation and meteorological datasets are reported in those sources (Table 1).
The estimates from CLAMP are supplemented with estimates using leaf area analysis (LAA) for mean annual precipitation (Wilf et al., 1998; Peppe et al., 2011), a climate parameter not typically provided by CLAMP, as well as leaf margin analysis (LMA) for mean annual temperature (Wilf, 1997; Greenwood, 2007; Peppe et al., 2011). Estimates for Falkland, Quilchena, and Thomas Ranch in British Columbia, Evan Jones Mine in Alaska, and three sites from Ellesmere Island in Nunavut are reported from the original analyses of those localities (Wolfe et al., 1998; Breedlovestrout, 2011; Smith, 2011; Sunderlin et al., 2011; Smith et al., 2012; Breedlovestrout et al., 2013; Dillhoff et al., 2013; West et al., 2015) but are supplemented with previously unreported CLAMP, LAA, and LMA paleoclimate estimates (Tables A1 and A2) from British Columbia (i.e., Whipsaw Creek) and the Canadian Arctic (i.e., Strand Fiord, Fosheim Anticline, Hot Weather Creek, Mosquito Creek, Ox-Head Creek).
2.3.2 Bioclimatic analysis
In addition to physiognomic analyses, we employ bioclimatic analysis (BA) (Greenwood et al., 2005), which extracts paleoclimatic information from fossil assemblages based on the modern-day distribution of nearest living relatives (NLRs) of the taxa found in the fossil assemblage. New paleoclimate estimates from BA were produced for all fossil localities used for this study (Table A3). Here, BA was performed by calculating probability density functions (e.g., Greenwood et al., 2017; Hyland et al., 2018; Willard et al., 2019) for each site and each climatic variable: mean annual temperature (MAT), summer mean temperature (ST), winter mean temperature (WT), and mean annual precipitation (MAP).
ST and WT represent the average temperature for the three warmest and coldest months, respectively. This is in contrast with the warm month mean temperature (WMMT) and cold month mean temperature (CMMT) output of CLAMP, which represent the mean temperature during the warmest and coldest month, respectively. This is the result of the gridded climate data used in these approaches; BA relies on Hijmans et al. (2005), whereas CLAMP relies on gridded climate data from New et al. (2002). Modern-day plant distributions were derived from the Global Biodiversity Information Facility, which were then cross-plotted with gridded climatic maps using the “dismo” package in R (Hijmans et al., 2005) in order to calculate means (μ) and standard deviations (σ) for each taxon and each climatic variable. The geodetic records were first filtered in order to remove recorded occurrences with uncertain taxonomic assignments, as well as exotic and duplicate occurrences. Additionally, a random subset of the geodetic data was created that filtered out all but three occurrences in every grid cell and all but 10 in every grid cell. This is to avoid the overrepresentation of oversampled regions of the world.
Grimm and Potts (2016) pointed out that assessing the bioclimatic range of plant taxa for each climatic variable separately may create an “apparent bioclimatic envelope”, whereby none of the occurrences fall within a certain combination of temperature and precipitation, but the climatic combination is still possible due to this apparent overlap. To circumvent this problem, we assess the likelihood (f) of a taxon (t) occurring at a combination of climatic variables, in this case MAT, ST, WT, and MAP.
Any combination of climatic variables can be assessed in this way. The likelihood of each taxon is then combined to create an overall probability density function (z) for each climatic variable representative of the most likely bioclimatic range of the taxa in the assemblage.
This method creates highly variable probability densities, dependent on both the number of taxa and the disparity of the climatic range of the NLRs. The climatic values reported here represent the value with the highest absolute probability, and the 95 % confidence interval represents the minimum and maximum values at which the absolute probability was ≥5 % of the maximum probability.
2.3.3 Ensemble climate analysis
We apply an ensemble climate analysis approach that avoids choosing one method over another so that we can present the results from each method as well as the consensus reconstruction based on all methods (Greenwood, 2007; Gushulak et al., 2016; Greenwood et al., 2017; Lowe et al., 2018; Willard et al., 2019; Hollis et al., 2019). The ensemble approach also highlights potential disparity between different proxy reconstructions. This approach is applied to both physiognomic and BA climate data compilations (see above). Statistically assessed ensemble estimates of mean annual temperature (MAT), CMMT, WMMT, and mean annual precipitation (MAP) were produced by bootstrapping the results of midlatitude and high-latitude fossil site physiognomic and BA data. The mean and standard deviations were resampled using n=1000 Monte Carlo simulations for each proxy reconstruction at each site. A probability density function was then calculated for each climatic variable for each site. The BA-based ST and WT estimates were transformed to WMMT and CMMT, respectively, using a method described in Reichgelt et al. (2018), whereby a linear regression function between ST and WMMT and between WT and CMMT is used to calculate values in NLR that can be directly compared to physiognomic proxy results (Fig. A1). This method is in line with the recommendations of Hollis et al. (2019), according to which a statistically assessed multi-proxy consensus approach should be utilized when feasible for reconstructing terrestrial climate.
2.4 Biome and physiognomic character analysis
The physiognomic, BA, and ensemble climate estimates of each fossil locality were plotted on a Whittaker (1975) biome diagram, modified from Woodward et al. (2004), in order to determine the corresponding modern biome classification for each paleoforest based on paleoclimatic estimates. In addition, the CLAMP-derived physiognomic data for each fossil locality were analyzed using principal component analysis (PCA) against a comprehensive global compilation of modern physiognomic data (Yang et al., 2015; Hinojosa et al., 2011; Reichgelt et al., 2019) to determine the most similar modern physiognomic analogs of the fossil sites. Finally, the physiognomic characteristics of fossil, and a subset of modern, sites were compared using a hierarchical cluster analysis to determine similarity. This was achieved by calculating a Euclidean dissimilarity matrix without scaling using the “cluster” package in R (Maechler et al., 2019) and the “Ward D2” method for hierarchical clustering (R Core Team, 2019).
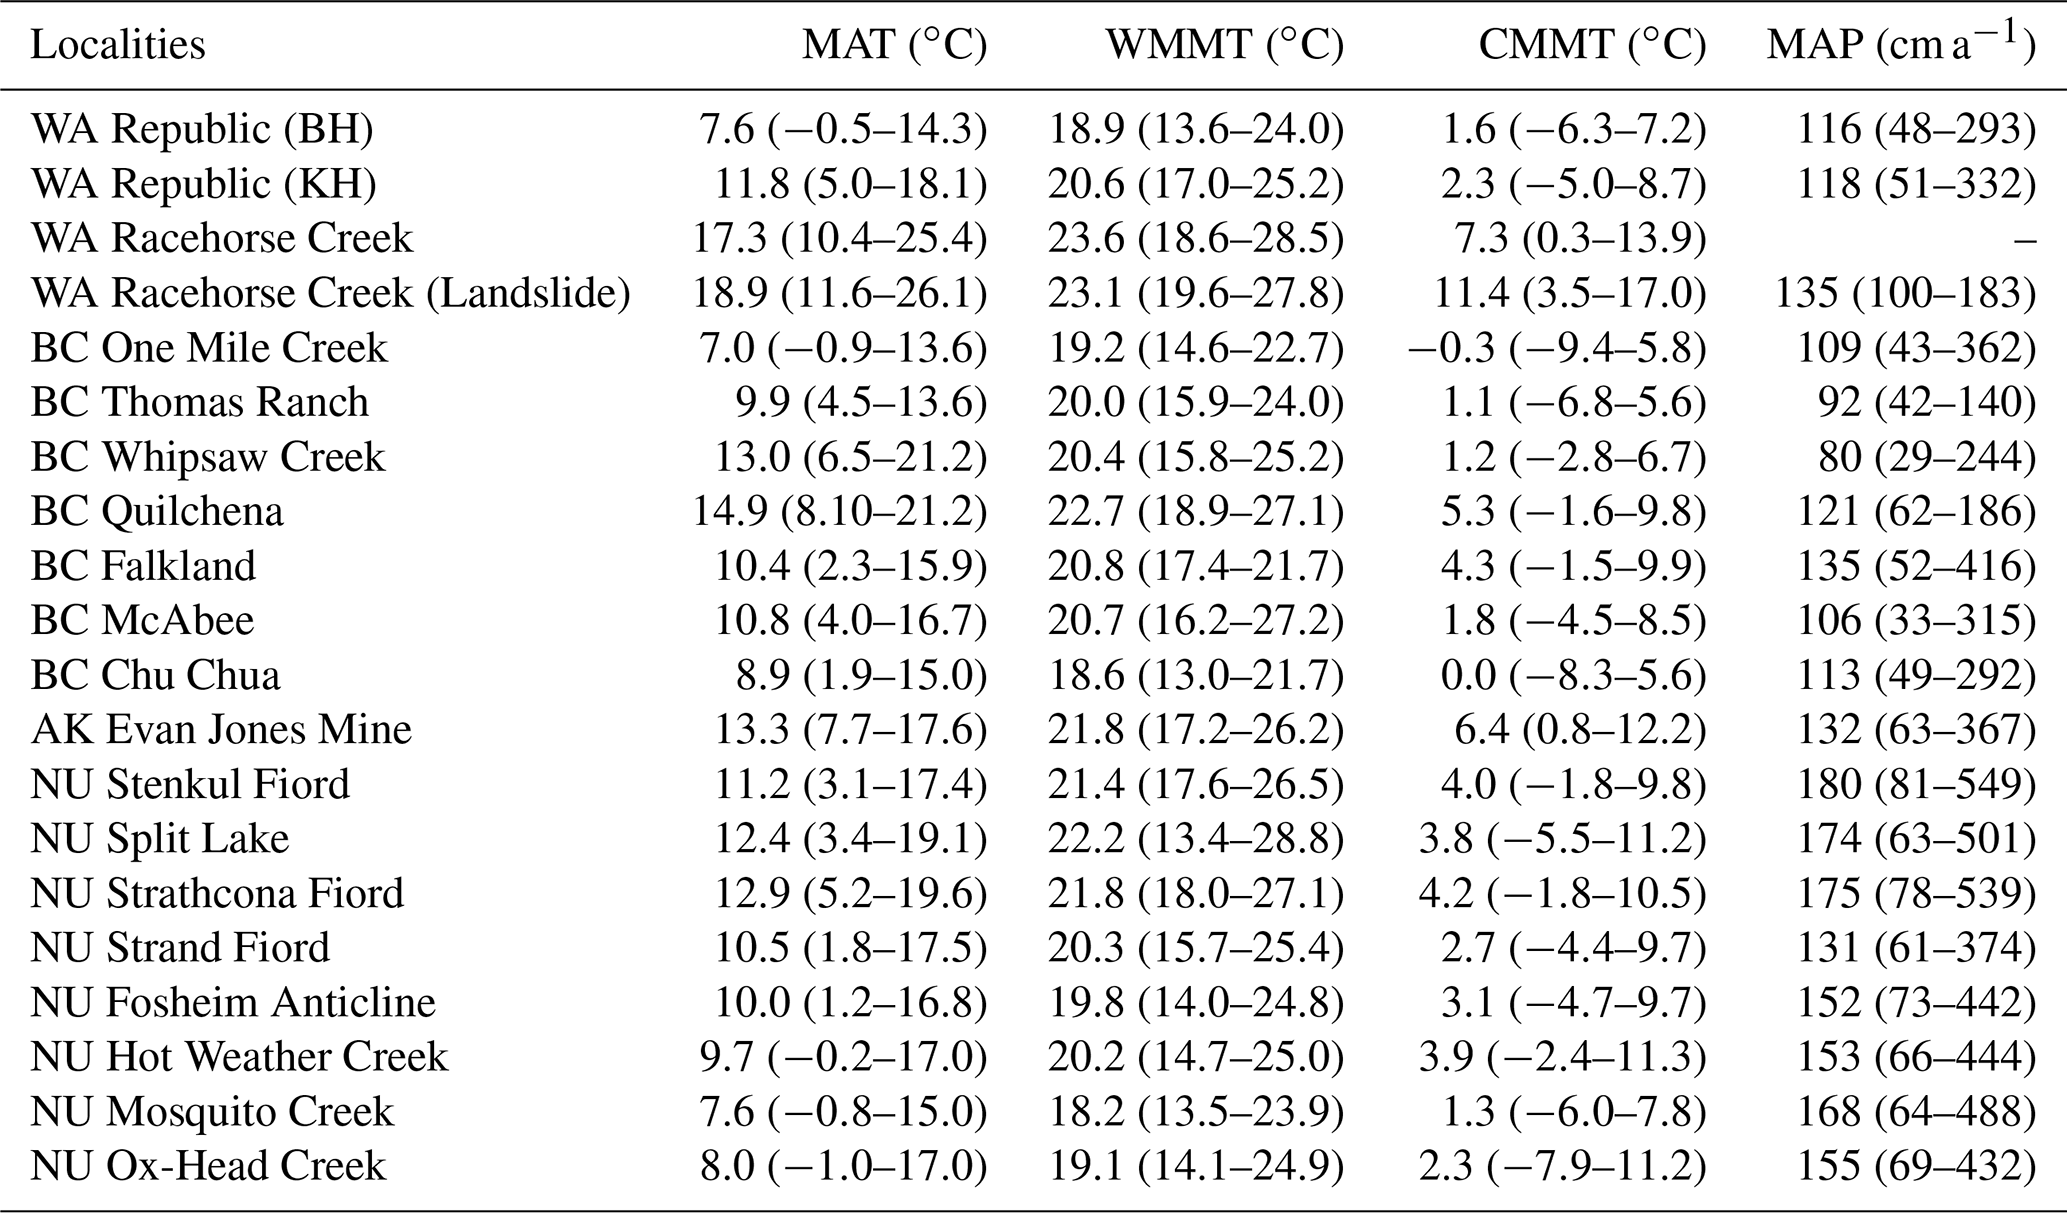
Table 2Proxy ensemble climate estimates for fossil plant localities. The bracketed range indicates the 95 % confidence interval of the bootstrapped paleobotanical proxy estimates. BC – British Columbia, Canada; NU – Nunavut, Canada; WA – Washington, USA; AK – Alaska, USA; BH – Boot Hill; KH – Knob Hill.
3.1 Quantitative paleoclimate analysis from paleobotanical proxies
3.1.1 Midlatitude upland fossil plant localities
Ensemble estimates of MAT for the midlatitude upland fossil localities of British Columbia and Washington ranged between 7.0 and 14.9 ∘C, with the range of mean temperatures for the coldest (CMMT) and warmest months (WMMT) between −0.3 and 4.3 and between 18.6 and 22.7 ∘C, respectively (Table 2). Ensemble MAP estimates for these localities ranged between 80 and 135 cm a−1 (Table 2), while CLAMP estimates for the three wettest and three driest months (3WET and 3DRY) for these localities ranged between 40 and 66 cm (error ±23 cm) and between 12 and 29 cm (error ±6 cm), respectively (Table A1). The complete compilation of site-specific physiognomic and BA data for midlatitude upland fossils sites of British Columbia and Washington is provided in Tables A1–A3.
3.1.2 Midlatitude lowland fossil plant locality
Ensemble estimates of MAT for the midlatitude lowland Racehorse Creek fossil sites from western Washington ranged between 17.3 and 18.9 ∘C, with the mean temperatures for the coldest (CMMT) and warmest months (WMMT) between 7.3 and 11.4 and between 23.1 and 23.6 ∘C, respectively (Table 2). The ensemble MAP estimate for Racehorse Creek was 135 cm a−1 (Table 2), while CLAMP estimates for the three wettest and three driest months (3WET and 3DRY) for this locality were 59 cm (error ±23 cm) and a range of 23–26 cm (error ±6 cm), respectively (Table A1). The complete compilation of site-specific physiognomic and BA data for Racehorse Creek is provided in Tables A1–A3.
3.1.3 High-latitude low polar lowland fossil locality
The ensemble estimate of MAT for the Chickaloon Formation Evan Jones Mine fossil flora was 13.7 ∘C, with estimates of CMMT and WMMT of 6.4 and 21.8 ∘C, respectively (Table 2). The ensemble MAP estimate for the Evan Jones Mine flora was 132 cm a−1 (Table 2), while reported CLAMP estimates for the three wettest and three driest months (3WET and 3DRY) from Sunderlin et al. (2011) for this locality were 64 cm (error ±23 cm) and 37 cm (error ±6 cm), respectively (Table A1). The complete compilation of site-specific physiognomic and BA data for the Evans Jones Mine flora from Alaska is provided in Tables A1–A3.
3.1.4 High-latitude high polar lowland fossil localities
Ensemble estimates of MAT for the high-latitude fossil localities in Arctic Canada ranged from 7.6 to 12.9 ∘C, with the range of CMMT and WMMT from 1.3 to 4.2 and 18.2 to 22.2 ∘C, respectively (Table 2). Ensemble MAP estimates for Ellesmere and Axel Heiberg islands ranged between 131 and 180 cm a−1 (Table 2), while CLAMP estimates for the three wettest and three driest months (3WET and 3DRY) for the Arctic Canada fossil localities ranged between 37 and 54 cm (error ±23 cm) and between 20 and 31 cm (error ±6 cm), respectively (Table A1). The complete compilation of site-specific physiognomic and BA data for Ellesmere and Axel Heiberg islands fossil plant localities is provided in Tables A1–A3. In addition, climate estimates for Lake Hazen are produced using BA (Table A3), as taxonomic data for this site recently became available (West et al., 2019). Lake Hazen represents the most northerly (∼81∘ N) terrestrial plant fossil sites available in North America, and as such climate data from this site help fill important geographic gaps. Although the number of broadleaf taxa identified at this locality (n=11) was comparable to other Ellesmere Island fossil localities (e.g., Split Lake), many specimens were fragmentary and incomplete. This limited the number of taxa that could be reliably scored to an insufficient number (n=6) to run leaf physiognomic analyses with meaningful precision and accuracy (Greenwood, 2007; Peppe et al., 2011; Yang et al., 2015), and as such this site could not be included in the site-specific ensemble analysis.
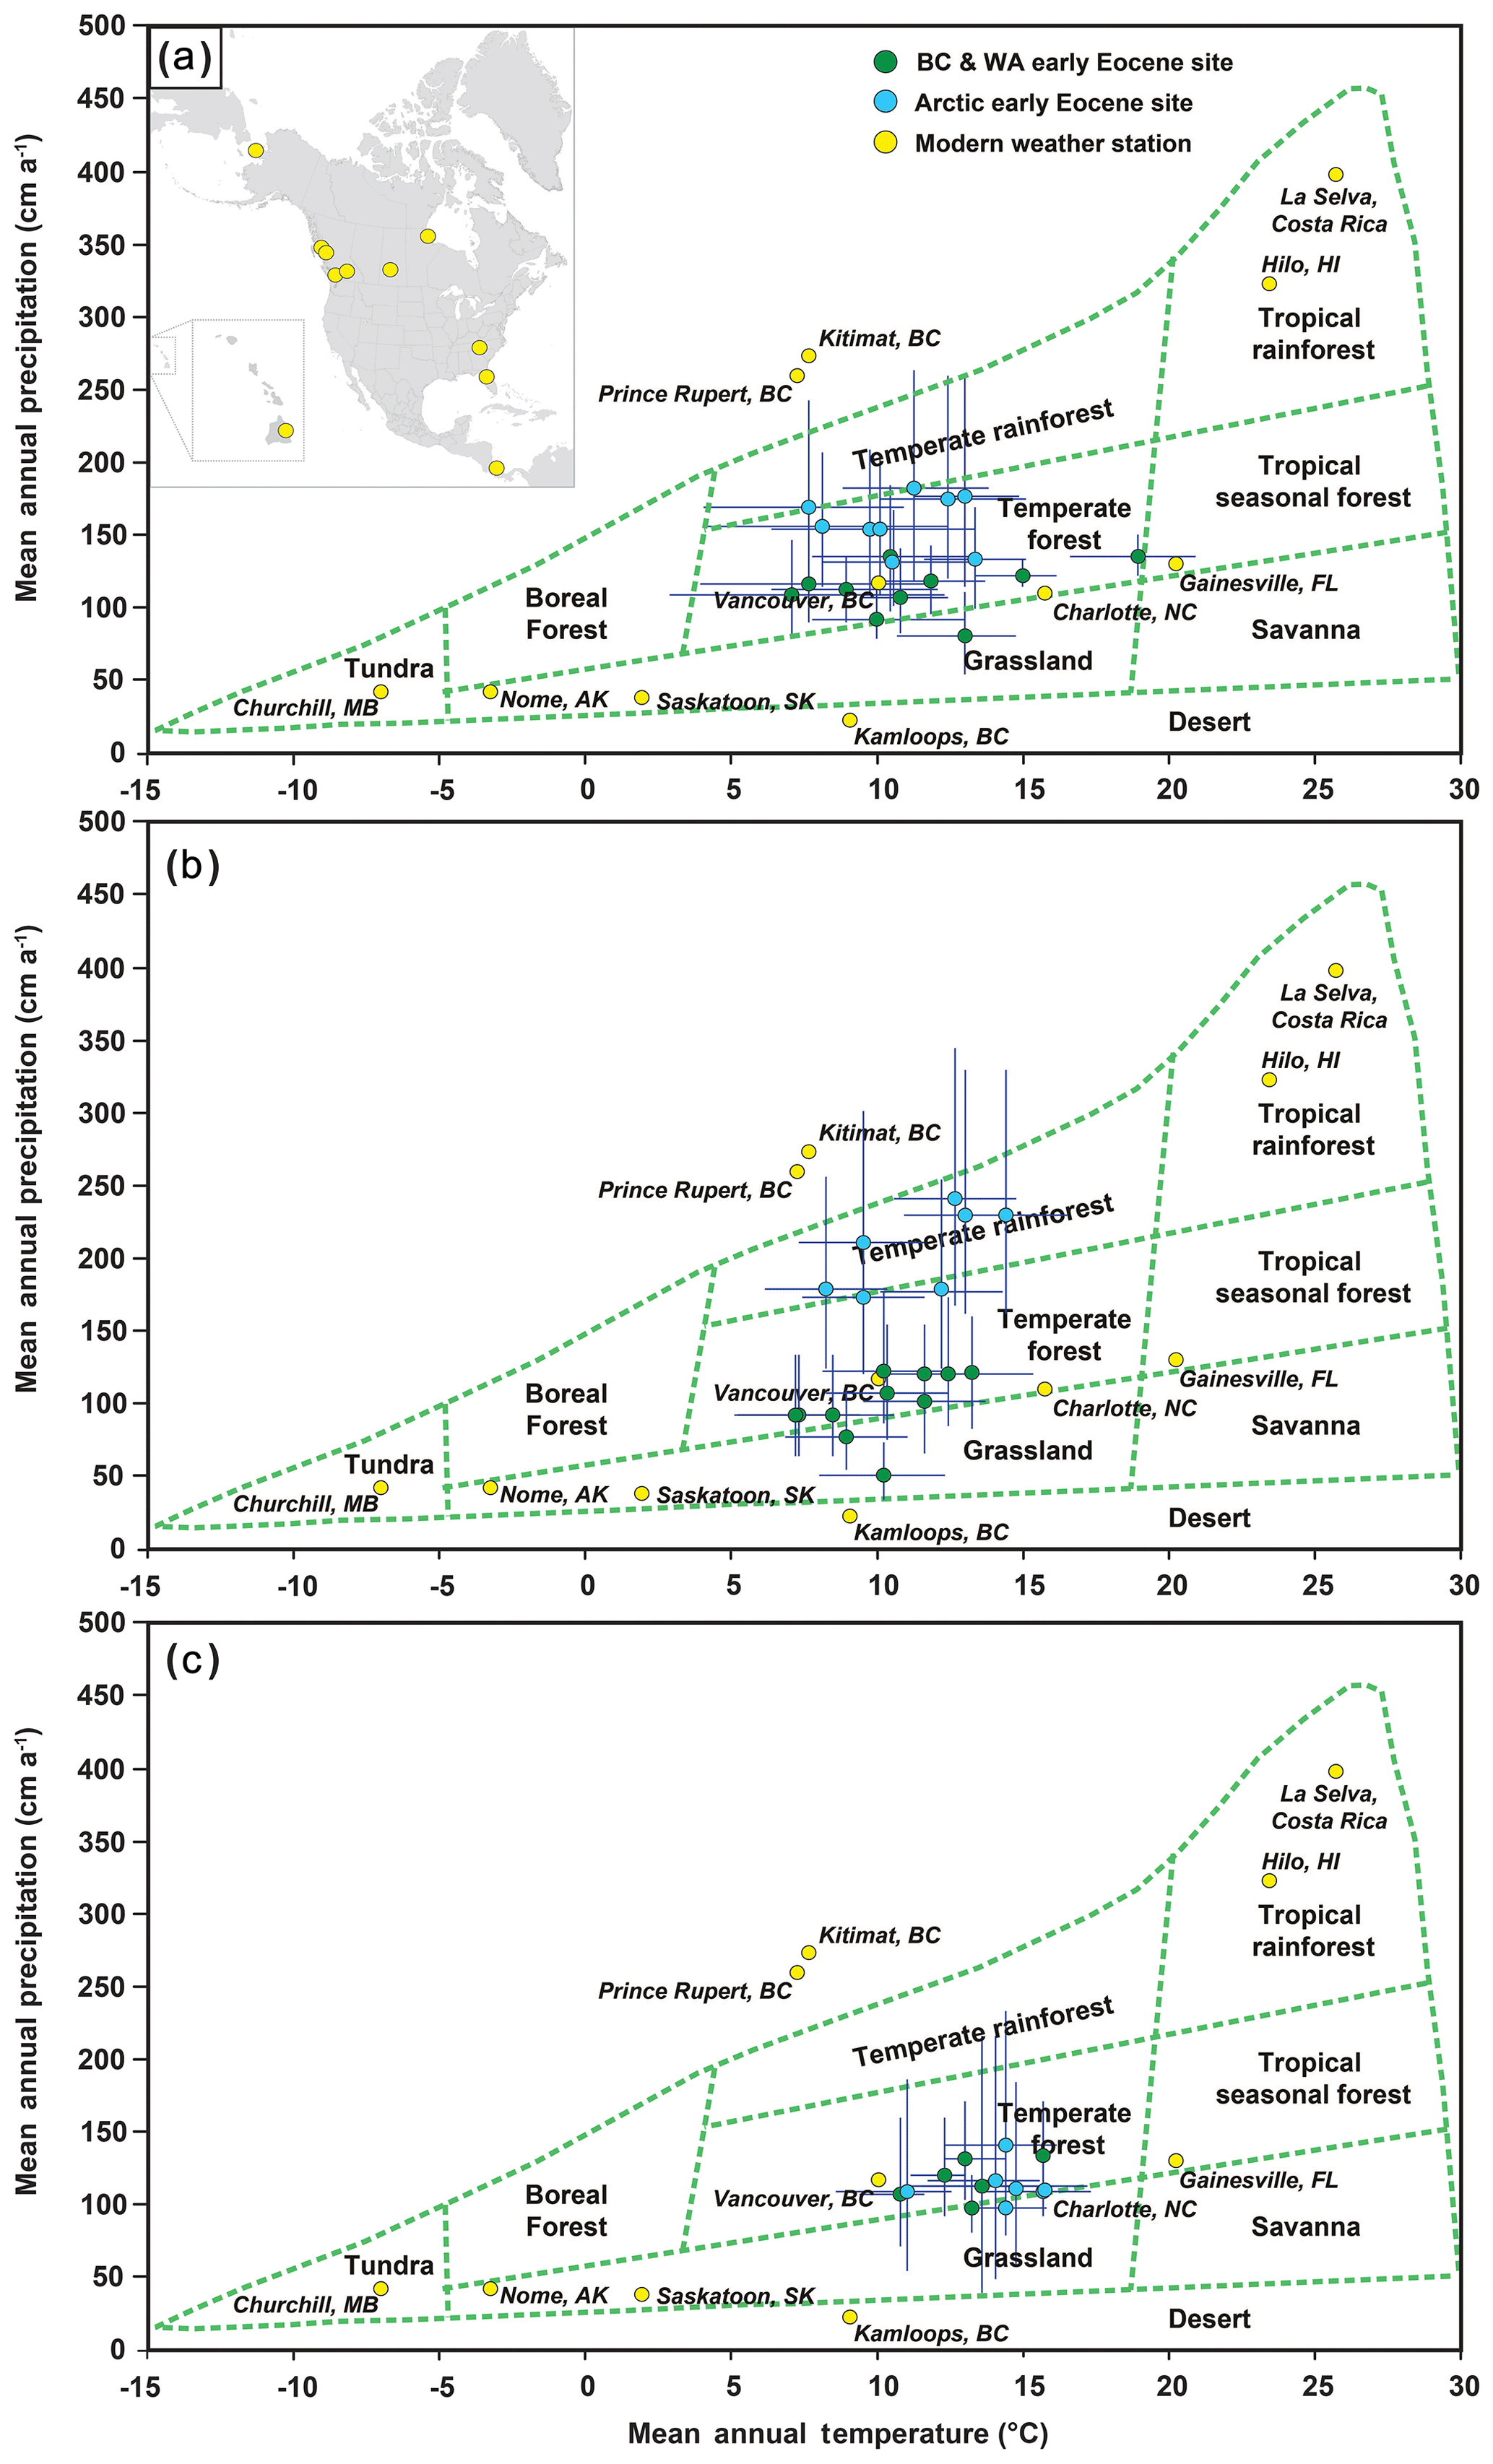
Figure 3Biome charts showing the paleoclimate data plotted against modern climate parameters defining modern biomes. (a) Ensemble climate estimates including an inset map of North America showing the locations of modern weather stations, (b) leaf physiognomy estimates, and (c) BA estimates.
3.2 Biome types, principal component analysis (PCA), and hierarchical cluster analysis (HCA) using leaf physiognomy
The ensemble climate data for all fossil localities plotted within the temperate forest space; however, the high polar lowland Arctic sites plot along the boundary between temperate forest and temperate rainforest (Fig. 3a). The midlatitude lowland and upland fossil sites, as well as the low polar lowland site from Alaska, plotted as temperate forests using the physiognomic climate estimates from CLAMP and LAA (Fig. 3b). The high polar lowland fossil localities plot as temperate rainforests when the CLAMP and LAA climate estimates are plotted on biome diagrams (Fig. 3b). However, when the BA climate data are plotted, all fossil localities plot closely within the temperate forest space (Fig. 3c). Results from PCA show that the midlatitude upland and the Canadian Arctic fossil localities generally plot with modern North American floras (Fig. 4b). The HCA, however, shows the high polar Arctic floras, which group on their own branch, to be dissimilar from modern North American floras (Fig. 4c), whereas the midlatitude upland floras share some physiognomic characteristics with both the Arctic fossil floras and modern floras from the North American west coast (e.g., Oregon, Washington) and east coast (e.g., Florida, South Carolina). The physiognomic datasets of the Racehorse Creek fossil flora from western Washington and Evan Jones Mine, Alaska, are not published and as such were not included in the PCA and HCA of leaf physiognomy.

Figure 4Principal component analysis (PCA) and hierarchical cluster analysis (HCA) using CLAMP-derived physiognomic data from fossil floras sites from this study and modern sites from http://clamp.ibcas.ac.cn (last access: 18 January 2020). (a) Map with location of modern sites in North America (squares), South America (crosses), southern Africa (diamonds), Eurasia (circles), and Oceania (pyramids). (b) PCA showing grouping of fossil and modern floras, including the Eocene Arctic (blue pyramids) and the Okanagan Highlands localities (green circles). (c) HCA with selected modern sites, showing the relative similarity between fossil sites from the Eocene Arctic (1. Ox-Head Creek, 2. Fosheim Peninsula, 3. Mosquito Creek, 4. Split Lake, 5. Hot Weather Creek, 6. Stenkul Fiord, 7. Strathcona Fiord, 8. Strand Fiord), the Eocene Okanagan Highlands (9. Quilchena, 10. Whipsaw Creek, 11. McAbee, 12. Falkland, 13. Republic Knob Hill, 14. Chu Chua, 15. Republic Boot Hill, 16. One Mile Creek), modern North America including Florida (FL), South Carolina (SC), North Carolina (NC), Georgia (GA), Pennsylvania (PA), New York (NY), California (CA), Oregon (OR), Washington (WA), Arizona (AZ), Alaska (AK), New Mexico (NM), and Colorado (CO), 17. Lake George, 18. Simmonsville, 19. Kure Beach, 20. Brunswick, 21. Frederic, 22. SIERC, 23. New Bern, 24. Mt. Pocono, 25. Wanakena, 26. Tunkhannock, 27. Lake Placid, 28. Lakeport, 29. Bandon, 30. Port Orford, 31. Nestucca River, 32. Talkeetna, 33. Seward, 34. Greer, 35. Tierra Amarilla, 36. Hasayampa, 37. Blue Canyon, 38. Soda Springs, 39. Eklutna Lake, 40. Sheep Mtn, 41. Wolf Creek, 42. Grand Lake, 43. Bumping Lake, 44. Laurel Mtn, 45. Pt Grenville, 46. Hood River, 47. Troutdale, 48. Wind River, 49. Rimrock Lake and modern Eurasia including Europe (Eur), Siberia (Sib), and Yakutsk (Yak) (50. Mys Martian, 51. Vagai River, 52. Pogostische, 53. Khartyryk-Khomo, 54. Viluisk, 55. Khanty-Manslisk, 56. Suklyom River, 57. Zozu-san, 58. Higani Shrine, 59. Yakusugi 1080 m, 60. Moscow, 61. Akagawa Spa, 62. Kidogawa 2, 63. Toya-ko, 64. Hanawa-Obono, 65. Kidogawa 1, 66. Suganuma, 67. Forge Valley, 68. Monks Wood).
4.1 Climate reconstruction
The ensemble climate analysis approach provides a consensus reconstruction based on all proxy methods utilized for the paleoclimate reconstruction (Lowe et al., 2018; Willard et al., 2019; Hollis et al., 2019). The ensemble approach has two advantages: (1) it avoids preferentially choosing one method over another by combining the results from all methods to produce a statistically robust assessment; and (2) disparate, potentially anomalous values produced by competing methods are muted as a result of the ensemble approach.
4.1.1 Midlatitude upland climate reconstruction
The ensemble MAT estimates of 7.0–14.9 ∘C correlate with a cooler to warm temperate climate and agree with previous studies of these upland paleofloras of British Columbia and Washington (Greenwood et al., 2005, 2016, Smith et al., 2011; Lowe et al., 2018). However, temperatures below 10 ∘C imply winters that would have experienced periods of sustained frost, a climate feature that is inconsistent with fossil data (Greenwood et al., 2016). The mean of ensemble MAT estimates, however, suggests an average regional temperature for the Okanagan Highlands of ∼10 ∘C and is more in line with fossil evidence from previous studies (Archibald et al., 2014; Greenwood et al., 2016). The mean ensemble CMMT and WMMT estimates indicate regional temperatures of ∼2 and ∼20 ∘C, respectively. These estimates suggest that the midlatitude upland regions in British Columbia and Washington experienced mild winter temperatures (> 0 ∘C) and moderate seasonal changes in temperature. The mean of the ensemble MAP estimates for the Okanagan Highlands suggests average precipitation of ∼110 cm a−1, which indicates mesic conditions (MAP > 100 cm a−1) and aligns with fossil evidence that suggests these high-altitude forests were wet–temperate ecosystems (Greenwood et al., 2016). These temperature and precipitation estimates, as well as the compilation of climate data (Tables 2 and A1–A3), indicate that the upland regions of British Columbia and Washington experienced a climate during the Eocene similar to the modern-day North Pacific coast of North America (e.g., Vancouver, British Columbia: MAT 10.1 ∘C, CMMT 3.3 ∘C, WMMT 17.6 ∘C, MAP 120 cm a−1, 3WET 51 cm, 3DRY 13 cm, Environment Canada, 2020; Portland, Oregon: MAT 11.7 ∘C, CMMT 4.6 ∘C, WMMT 19 ∘C, MAP 119 cm a−1, 3WET 47 cm, 3DRY 10 cm; NOAA, 2020).
In some cases, site-specific leaf-physiognomic-based estimates of MAT were significantly lower than nearby MAT estimates from contemporaneous neighboring fossil localities and are considered anomalous (e.g., LMA estimates of MAT 2.4 ∘C from One Mile Creek, BC; see Table A2). However, as a result of applying our ensemble approach, these anomalous values are muted, as that particular proxy estimate is not weighed as heavily. It is important to note that the early Eocene Okanagan Highlands floras of British Columbia and Washington were upland ecosystems; as such, these higher-elevation ecosystems would have experienced cooler temperatures than the neighboring lowland fossil localities (e.g., Racehorse Creek) due to temperature lapse with altitude (Wolfe et al., 1998; Smith et al., 2009, 2012; Greenwood et al., 2016; Lowe et al., 2018).
4.1.2 Midlatitude lowland climate reconstruction
The ensemble MAT estimates of 17.3–18.9 ∘C from the lowland Racehorse Creek fossil localities in western Washington indicate a significantly warmer temperature regime compared to the nearby Okanagan Highlands upland floras. These MAT estimates, as well as the ensemble CMMT estimates of 7.3–11.4 ∘C, for Racehorse Creek are in line with thermophilic fossil evidence from the region, including coryphoid palm leaf fossils found in the Chuckanut and Huntingdon formations (Breedlovestrout et al., 2013; Greenwood and Conran, 2020). The palm tribe Coryphoideae, while somewhat cold hardy, is restricted (−2σ) to climates with MAT ≥10.3 ∘C and CMMT ≥3.9 ∘C (Reichgelt et al., 2018). The most recent investigations of the Racehorse Creek fossil flora reported a MAP estimate of 250–360 cm a−1 (see Breedlovestrout et al., 2013, and references therein). This is considerably wetter than our ensemble MAP estimate of 135 cm a−1 or even the upper 95 % confidence interval value of 183 cm a−1 (Table 2). These ensemble estimates should potentially be considered minimum MAP values, as the Racehorse Creek floras were in lowland coastal environments (Breedlovestrout et al., 2013) and may have experienced more precipitation than estimated here. The compilation of estimated climate data (Tables 2 and A1–A3) suggests the lowland regions of western Washington experienced a warm and wet climate during the Eocene similar to regions of the southeast of North America (e.g., Augusta, Georgia: MAT 18.4 ∘C, CMMT 9.2 ∘C, WMMT 26.0 ∘C, MAP ∼118 cm a−1, 3WET 36 cm, 3DRY 26 cm; NOAA, 2020).
4.1.3 High-latitude low polar climate reconstruction
The ensemble MAT estimates of 13.3 ∘C for the Evan Jones Mine flora align with previous studies (e.g., Sunderlin et al., 2011) that indicated these low polar lowland floras were growing under a cooler to warm temperate climate, similar to a MAT (12.3 ∘C) estimate by Wolfe (1994). Previously, MAP of the Evan Jones Mine flora had been estimated to be 155 cm a−1 (Sunderlin et al., 2011). Our ensemble estimate for MAP of 132 cm a−1 is a little drier than these prior estimates; however, the upper bound of the 95 % confidence interval for the ensemble MAP estimates suggests precipitation could have been considerably wetter (367 cm a−1; Table 2). The ensemble MAT and MAP estimates, coupled with the ensemble CMMT (6.4 ∘C) and WMMT (21.8 ∘C) estimates, indicate that Alaska experienced some thermal seasonality, mild winter temperatures (> 0 ∘C), and typically wetter conditions than the midlatitude upland floras of the Okanagan Highlands but drier than the coastal lowland Racehorse Creek site. The early Eocene climate reconstruction for Alaska is considerably different from the modern-day climate of Alaska, as modern Alaska experiences a cold and dry climate (e.g., Anchorage, AK: MAT 2.8 ∘C, CMMT −8.2 ∘C, WMMT 14.9 ∘C, MAP 42 cm a−1, 3WET 21 cm, 3DRY 5 cm; NOAA, 2020).
4.1.4 High-latitude high polar climate reconstruction
The range of ensemble MAT estimates of 7.6–12.9 ∘C for the Canadian High Arctic sites agrees with previous estimates that indicated these polar lowland floras were growing under a cooler to warm temperate climate. However, similar to the MAT estimates for the upland Okanagan Highlands floras, the cooler range of MAT estimates (< 10 ∘C) would suggest that these high-latitude forests would have experienced periods of sustained frost, an interpretation inconsistent with fossil evidence (e.g., alligators, tortoises, Glyptostrobus, and plants possibly affiliated with the tropical monocot family Strelitziaceae; see McIver and Basinger, 1999; Eberle and Greenwood et al., 2012; West et al., 2019, for additional details). The mean of the ensemble MAT estimates of ∼10 ∘C, however, is a more in line with the other proxy evidence for a MAT minimum in the polar regions during the early Eocene and indicates a thermal regime supported by the fossil evidence mentioned above (McIver and Basinger, 1999; Eberle and Greenwood, 2012; West et al., 2019).
The mean values of the ensemble CMMT and WMMT estimates, ∼3 and ∼18 ∘C, respectively, indicate that the Canadian Arctic experienced moderate thermal seasonality and mild winter temperatures (> 0 ∘C). Previously, MAP for three fossil localities from Ellesmere Island had been estimated to be > 200 cm a−1 (e.g., West et al., 2015). New physiognomic estimates of MAP for additional sites from Ellesmere and Axel Heiberg islands produced somewhat drier estimates (∼175 cm a−1; Table A2). The ensemble MAP estimates for the Canadian Arctic, ranging from 131 to 180 cm a−1 with a mean value of 162 cm a−1 (Table 2), are also drier than the West et al. (2015) physiognomic estimates. These MAP values, though drier than the most recent physiognomic estimates, are still indicative of a wet climate similar to, or wetter than, the Evan Jones Mine flora of Alaska and wetter still than the midlatitude lowland and upland floras.
It is important to note that the Eocene polar forests would have experienced periods of 24 h night and day during the respective polar winter and summers, just as modern high-latitude ecosystems do. It has been suggested that due to the low-angle solar radiation prevalent at these latitudes during the polar summer, the leaves of dicotyledonous angiosperm trees would have increased in size (Wolfe, 1985, and references therein) – effectively eliciting a similar response observed in sun and shade leaves of broadleaf trees (e.g., Lichtenthaler et al., 1981) and thus introducing a potential source of bias in physiognomic-based precipitation estimates from high-latitude ecosystems. However, this hypothesis, and the scale of the potential bias it introduces into physiognomic precipitation estimates, remains untested. Furthermore, data on modern plants across latitudinal bands of 38.1–71.25∘ N are equivocal, with increases in mean leaf size, decreases in mean leaf size, or no change recorded for broadleaf trees and shrubs (Betula and Ledum) and the herbaceous Arabidopsis (Kudo, 1995; Hopkins et al., 2008; Migalina et al., 2010).
Table 3Compiled Arctic temperature proxy data from additional early Eocene sources.
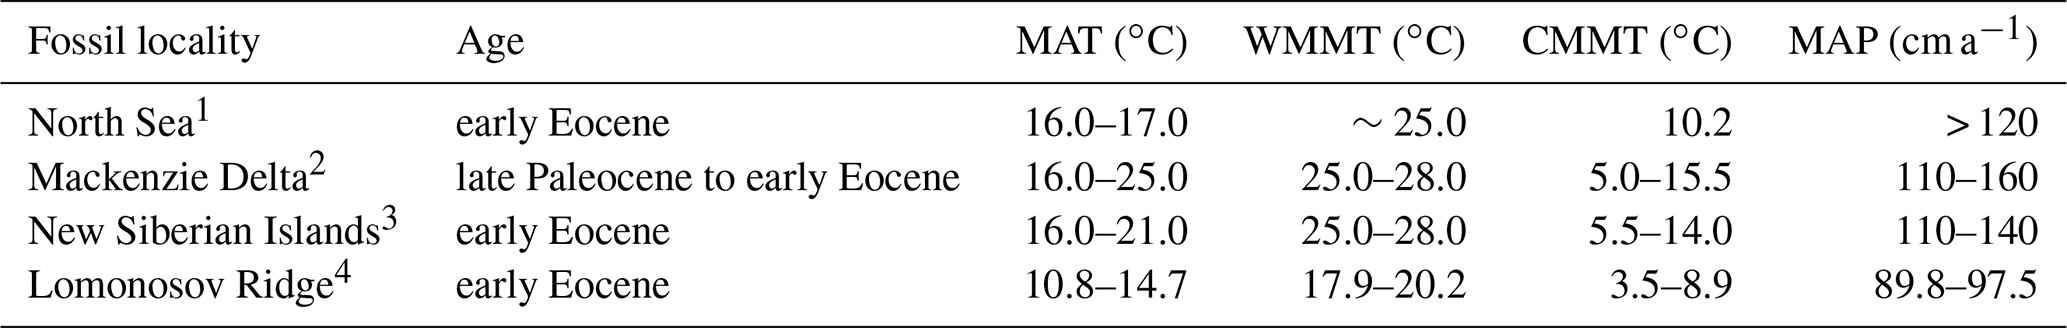
1 Eldrett et al. (2014). 2 Salpin et al. (2018). 3 Suan et al. (2017). 4 Willard et al. (2019).
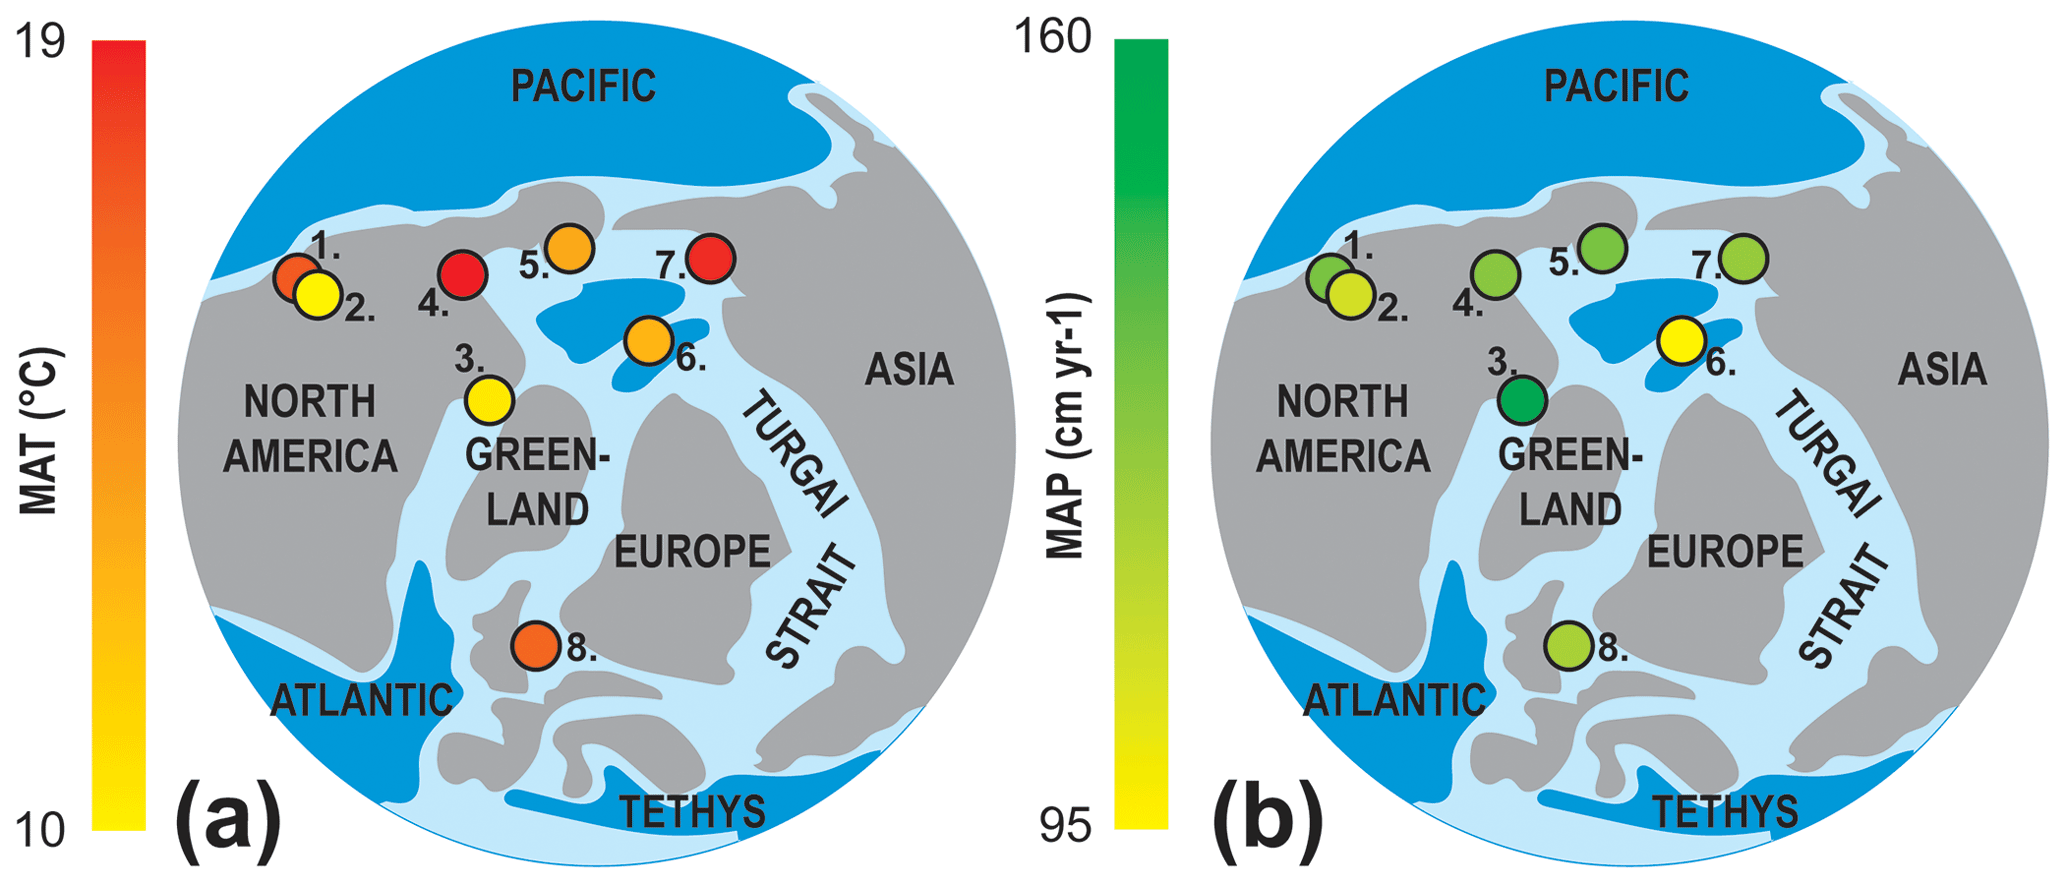
Figure 5Early Eocene proxy ensemble data from fossil localities showing (a) MAT and (b) MAP estimates from this study and the prior studies compiled in Table 3. 1. Racehorse Creek, Washington, 2. Okanagan Highlands, British Columbia and Washington, 3. Canadian Arctic, Ellesmere and Axel Heiberg islands, Nunavut, 4. Mackenzie Delta, Northwest Territories, 5. Evan Jones Mine, Alaska, 6. Lomonosov Ridge, 7. New Siberian Islands, Russia 8. North Sea.
The climate reconstruction for the Canadian Arctic is in stark contrast to the modern-day climate of Ellesmere and Axel Heiberg islands. Ellesmere Island currently experiences a harsh Arctic desert climate (e.g., Eureka, Nunavut: MAT −19.7 ∘C, CMMT −38.4 ∘C, WMMT 5.7 ∘C, MAP 8 cm a−1, 3WET 4 cm, 3DRY < 1 cm; Environment Canada, 2020). These high-latitude paleoclimate estimates for the Canadian Arctic generally agree with previous high-latitude proxy climate data from similarly aged deposits (Table 3, Fig. 5). However, the physiognomic, BA, and ensemble estimates of this study typically have cooler MAT values and wetter MAP values than estimates based on stable isotopes or palynofloras (Table 3). Nevertheless, the temperature estimates of this and previous studies indicate that MAT remained relatively homogenous across the high latitudes throughout the late Paleocene and into the early Eocene (Fig. 5).
4.2 The latitudinal temperature gradient in northern North America
The latitudinal temperature gradient is considered a defining characteristic of the climate system both past and present (Zhang et al., 2019) and is one of the principal factors that control the distribution of vegetation. As such, the persistence of a shallow latitudinal temperature gradient during the early Eocene would have been instrumental in supporting the expansive forest ecosystems that stretched from the middle to high latitudes (Greenwood and Wing, 1995). An understanding of the latitudinal temperature gradient during warm periods in Earth's history remains an integral component of paleoclimate modeling, as is the relevance of past megathermal intervals as useful analogs for modern global warming (Greenwood and Wing, 1995; Naafs et al., 2018).
However, climate models have had difficulty replicating the shallow latitudinal temperature gradient of the early Eocene (Hollis et al., 2019), with temperatures either unrealistically hot in the tropics or too cold at the poles and continental interiors. The most successful of these models required pCO2 of 4480 ppm, which is on the extreme upper end of early Eocene estimates, although CO2 calibrations tend to lose sensitivity at high values, making quantification difficult (Huber and Caballero, 2011). Paleobotanical proxy methods have been criticized, as differing methods can produce different results (Hollis et al., 2019); however, the ensemble climate estimate method offers considerable improvements for estimating past temperature and precipitation regimes over any single method (e.g., Reichgelt et al., 2018; Lowe et al., 2018; Willard et al., 2019). Therefore, it is important to reevaluate the latitudinal temperature gradient for northern North America as methodological improvements are made and new data become available.
The modern latitudinal temperature gradient for northwestern North America is approximately 1.2 ∘C per 1∘ latitude (Greenwood and Wing, 1995). Previously, paleobotanical data from the western interior of North America had been used to estimate the latitudinal temperature gradient, which suggested a latitudinal temperature change of 0.30–0.40 ∘C per 1∘ latitude for the late Paleocene and early Eocene (Greenwood and Wing, 1995; Davies-Vollum, 1997). In addition, prior studies used δ18O data from coastal marine bivalves to estimate a latitudinal temperature change of 0.28 ∘C per 1∘ latitude for the late Paleocene and early Eocene in North America (Tripati et al., 2001; Quan et al., 2012, and references therein). Recently, a temperature data compilation of terrestrial climate proxies for the late Paleocene and early Eocene was used to reconstruct a global average latitudinal temperature gradient of 0.16 ∘C per 1∘ between 30 and 60∘ paleolatitude (Zhang et al., 2019).
As the Okanagan Highlands floras introduce an altitudinal influence, they are not included in an evaluation of the latitudinal temperature gradient. Rather, the temperature estimates from the coastal lowland Racehorse Creek floras are more appropriate for comparison to the lowland floras of higher latitudes. The ensemble estimates of the lowland Racehorse Creek fossil flora (∼48∘ N) provide a MAT value of ∼19 ∘C. The mean of the ensemble MAT estimates from Ellesmere Island (∼80∘ N), NU, Canada, is ∼10 ∘C. The difference in latitude between the two lowland regions is about 31∘, which results in a temperature change per degree of latitude of 0.28 ∘C per 1∘ latitude. The Evan Jones Mine flora (MAT ∼13 ∘C) is located geographically between the lowland fossil localities of Racehorse Creek and Ellesmere Island, and as such it appears to indicate that the latitudinal temperature gradient is steeper from the midlatitudes and shallower in the polar latitudes. The latitudinal temperature gradient estimate of 0.28 ∘C per 1∘ latitude corroborates estimates previously derived from both paleobotanical and coastal marine sources (Davies-Vollum, 1997; Tripati et al., 2001; Quan et al., 2012). Similar Northern Hemisphere temperature gradients (0.27 ∘C per 1∘ latitude) have been estimated from fossil plants for the late Paleocene in China (Quan et al., 2012), which indicates that relatively similar temperature gradients may have been in place globally in the Northern Hemisphere during the late Paleocene and early Eocene.
4.3 Paleobiomes of northern North America
During the early Eocene, subtropical and temperate forests dominated the midlatitudes and were comprised of a high diversity of both temperate and thermophilic taxa – with thermophilic floral and faunal elements extending poleward in the Eocene, reaching 70∘ N or more (Eberle and Greenwood, 2012). Vegetation models suggest the midlatitudes were dominated by mixed deciduous and evergreen forests, which is in broad agreement with fossil evidence (Beerling and Woodward, 2001; Shellito and Sloan, 2006). The ability of models calibrated from modern vegetation dynamics to produce results that broadly agree with the fossil record may suggest that ecophysiological controls on plant distributions did not change markedly during the Cenozoic (Beerling and Woodward, 2001); however, there is still a need to provide a refined and evidence-based interpretation of the forest ecosystems that were in place in northern North America during the early Eocene.
CLAMP climate results for the midlatitude lowland and upland fossil localities, as well as the high-latitude lowland sites, plot as temperate forest and temperate rainforest biomes (Fig. 3b), respectively, but group more tightly within the temperate forest biome when BA climate data are plotted (Fig. 3c). Plotting the ensemble climate estimates from northern North America on biome diagrams (Fig. 3b), however, further demonstrates the similarity in both vegetation and climate throughout these regions. The majority of the fossil localities plot within the climate space to be classified as temperate forest ecosystems (Fig. 3), with two high-latitude localities plotting on the boundary between temperate forest and temperate rainforest ecosystems. Whipsaw Creek, a fossil locality in the Okanagan Highlands (Table 1), plots as a grassland biome; however, when the upper end of the errors is considered, this fossil locality overlaps the fossil localities plotted as temperate forests.
Temperature and precipitation correlate positively with the rate of productivity in a forest (Whittaker, 1975). Therefore, the standing biomass and annual net primary productivity of a forest will differ depending on the climatic zone. Typically, temperate forests have an average aboveground net primary productivity (ANPP) of about 9.5 Mg ha−1 a−1 (Saugier et al., 2001), but this value can differ based on the regional climate. For example, temperate rainforests from the Pacific Northwest with MAP values of > 150 cm a−1 have been shown to have an aboveground biomass of 467–1316 Mg ha−1 and an annual net primary productivity of 4.2–15 Mg ha−1 a−1 (Gholz, 1982), whereas wetland forests, such as the Taxodium-dominated (swamp cypress) forests of Florida, have been shown to have an aboveground biomass of 284 Mg ha−1 and an ANPP of 16.1 Mg ha−1 a−1 (Brown, 1981). Temperate broad-leaved forests from Tennessee typically have an aboveground biomass of 326–471 Mg ha−1 and an ANPP of 6.3–13.1 Mg ha−1 a−1 depending on the age of the forest stand (Busing, 2013). Biomass and ANPP have been previously reconstructed as 501–587 Mg ha−1 and 5.8–7.8 Mg ha−1 a−1, respectively, for the late Paleocene to early Eocene Metasequoia-dominated (dawn redwood) swamp forests of Stenkul Fiord (Williams et al., 2009). Aboveground biomass has also been reconstructed as 946 Mg ha−1 for the middle Eocene forests on Axel Heiberg Island (Basinger et al., 1994). These values fall within the range of values appropriate for modern temperate forests and the lower to middle range for the temperate rainforests of the Pacific Northwest, which suggests that modern values of biomass and ANNP may be useful approximations for model simulations if the forest biome is known.
Our data support previous studies that have described the upland fossil megaflora of British Columbia and Washington state as having a dominant temperate component or belonging to a temperate forest ecosystem with analogs from modern west coast temperate forest ecosystems (Greenwood et al., 2016; Lowe et al., 2018). These upland paleofloras reflect forests consisting of mixed temperate and tropical plants, with insects (e.g., lacewings and palm beetles), birds, and mammals (e.g., hedgehogs and tapirs) (Archibald et al., 2011; Greenwood et al., 2005, 2016; Eberle et al., 2014; Eberle and Greenwood, 2017). The ancient plant communities were diverse and are typically dominated by taxa such as Ginkgo, Pinaceae such as Pinus (pine), Cupressaceae such as Metasequoia (dawn redwood), Sassafras, Betula (birch), Alnus (alder), Ulmus (elm), Cercidiphyllum–Trochodendroides (katsura), and rare palms (Smith et al., 2009; DeVore and Pigg, 2007, 2010; Greenwood et al., 2005, 2016; Mathewes et al., 2016; Lowe et al., 2018). During the early Eocene, more southerly regions of North America hosted mainly tropical flora and fauna, supported by warmer climate conditions than those of the Okanagan Highlands (Archibald et al., 2010; Morley, 2011; Eberle and Greenwood, 2012) and more similar to the climate of the lowland Racehorse Creek flora from western Washington (DeVore and Pigg, 2010; Beedlovestrout et al., 2013) than, for example, fossil floras of the Green River Basin (Wolfe, 1994; Wilf, 2000) and floras to the southeast (Currano et al., 2010) in the USA.
The lowland Canadian Arctic megafloras have previously been described as representing a temperate rainforest based on leaf physiognomic climate estimates (e.g., Greenwood et al., 2010; West et al., 2015), an interpretation supported by the leaf physiognomic climate estimate biome plots (Fig. 3) and the fossil taxa present (McIver and Basinger, 1999; Eberle and Greenwood, 2012; West et al., 2019). The early Eocene polar broadleaf deciduous fossil forests of Alaska and those of Ellesmere and Axel Heiberg islands in Arctic Canada reflect a mixed temperate flora (Ulmus, Alnus, Tetracentron, Magnolia), with some rare tropical elements (palynological evidence for palms found in the ACEX cores; McIver and Basinger, 1999; Sluijs et al., 2009; Sunderlin et al., 2011; Salpin et al., 2018; West et al., 2015, 2019; Willard et al., 2019). Prior vertebrate paleontological studies from the region have shown that these polar environments were also host to a mix of fauna that included alligators and thermophilic forms of snakes, turtles, large mammals, terror birds, and early primates (Estes and Hutchinson, 1980; McKenna, 1980; Dawson et al., 1993; Eberle, 2005; Eberle et al., 2014).
Results from PCA show that the midlatitude and high-latitude lowland fossil localities generally plot with the North American and Eurasian floras (Fig. 4b). Despite this, the leaf-physiognomy-based HCA indicates that the Arctic fossil floras are physiognomically distinct from modern floras (Fig. 4c). The midlatitude floras appear to share some leaf physiognomic characteristics with both the Arctic fossil floras and modern floras from the North American west coast (e.g., Oregon, Washington) and east coast (e.g., Florida, South Carolina). The physiognomic distinctiveness of the Eocene Arctic floras from both modern floras and midlatitude Eocene floras may be due to an ancient environment with no modern analog due to the extreme abiotic stress from photic seasonality combined with high precipitation and relatively mild temperatures (e.g., West et al., 2015, and references therein). Forests cannot currently occur at such high latitudes, and therefore these physiognomic responses and adaptations have no modern analog; thus, these polar ecosystems can be referred to as fossil, or extinct, ecosystems (West et al., 2015, and references therein). These results, coupled with the ensemble climate estimates, suggest that considerable climatic overlap existed between the middle and high latitudes during the early Eocene. This suggests that the similar climatic regimes, facilitated by a shallow latitudinal temperature gradient, allowed for similar forest ecosystems – both floristically and vegetatively – to exist at both middle and high latitudes during the early Eocene, despite substantial differences in latitude and photic seasonality.
The results of our ensemble approach to climate reconstruction for the middle and high latitudes of northern North America describe a low latitudinal temperature gradient (0.28 ∘C per 1∘ latitude) and broad climatic similarity across a large latitudinal range (∼30∘) during the early Eocene, although variation in precipitation between the middle and high latitudes is evident (Fig. 5). This shallow latitudinal temperature gradient supported an extensive forest ecosystem that spanned most of northern North America from Washington, USA, to Ellesmere Island, NU, with several genera occurring throughout its entire extent (e.g., Metasequoia, Alnus, Ulmus; see West et al., 2019). The climate estimates derived from the upland fossil floras of the midlatitude sites in Washington and British Columbia, coupled with biome charts and physiognomic analysis, indicate that these ancient forests ecosystems share physiognomic features with modern temperate forests from the Pacific Northwest. The high-latitude lowland fossil localities from Arctic Canada plot as temperate forests, alongside fossil floras from the midlatitudes, but exist at the boundary between the climatic range for a temperate forest and temperate rainforest. Nevertheless, in the HCA, the physiognomic character of the Arctic forests was dissimilar from modern forest ecosystems, whereas the midlatitude fossil sites share more physiognomic qualities with modern forests and the early Eocene polar forests – potentially resulting from similar climatic conditions. Despite the antiquity of these forest ecosystems, the PCA of fossil site physiognomy for both the midlatitude and high-latitude sites demonstrates that these forests broadly group with modern floras from North America and Eurasia.
These results indicate that the climate of northern North America during the early Eocene was potentially more homogenous than previously appreciated and capable of supporting climatically, and taxonomically, similar forests at middle and high latitudes, supported by a shallow latitudinal temperature gradient. Although PCA of the physiognomic character of the Arctic forests broadly groups with modern forest ecosystems, the results of the HCA indicate that these ancient forests do not align physiognomically with any modern forest ecosystem. This is not unexpected, as these high-latitude ecosystems would have experienced pronounced photic seasonality and an enhanced hydrological cycle during Eocene warmth (see West et al., 2015, and references therein), which resulted in an ecosystem that has since become extinct.
Improved terrestrial climate estimates and vegetation resulting from an ensemble approach offer opportunities to better classify these ancient forest ecosystems, enhancing the utility of the paleobotanical record for paleoclimate modeling. This is a step towards meeting the goals recommended by Hollis et al. (2019) and the modeling community (e.g., DeepMIP; Hollis et al., 2019; Lunt et al., 2020) in striving to improve the quality and clarity of proxy data and derived climatic parameters.
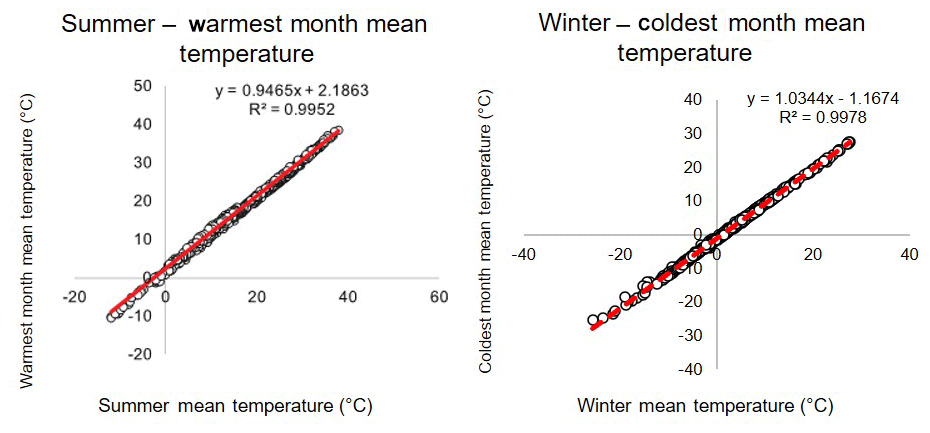
Figure A1Correlation between summer and warmest month mean temperature as well as winter and coldest month mean temperature (Reichgelt et al., 2018). This correlation was used to compare bioclimatic analysis results to CLAMP results, as the former uses the summer and winter mean, and the latter uses warmest and coldest month means.
Table A1CLAMP-derived paleoclimate estimates. Unless otherwise specified, data are original to this study. See Table 1 for locality data. Standard errors and units for climate parameters: MAT ±2.1 ∘C; CMMT ±3.4 ∘C; WMMT ±2.5 ∘C; LGS ±1.1 months; GSP ±32 cm; 3WET ±23 cm; 3DRY ±6 cm; RH ±8.6 %; SH ±1.7 g kg−1.

n: number of leaf morphotypes scored; MAT: mean annual temperature; CMMT: cold month mean temperature; WMMT: warm month mean temperature; LGS: length of growing season; GSP: growing season precipitation; 3WET: precipitation during the three consecutive wettest months; 3DRY: precipitation during the three consecutive driest months; RH: relative humidity. BC – British Columbia, Canada; NU – Nunavut, Canada; WA – Washington, USA; AK – Alaska, USA; LS – Landslide.
Table A2Paleoclimate estimates from leaf margin analysis (LMA: Wing and Greenwood, 1993; Wilf, 1997; Peppe et al., 2011) and leaf area analysis (LAA: Wilf et al., 1998; Peppe et al., 2011). Unless otherwise specified, data and estimates are original to this study. See Table 1 for locality data. Errors are stated within the table; errors for MAP are asymmetric as they are converted from loge. Where n has two values, different n applies to LMA and LAA due to overly incomplete leaves being excluded from LAA.
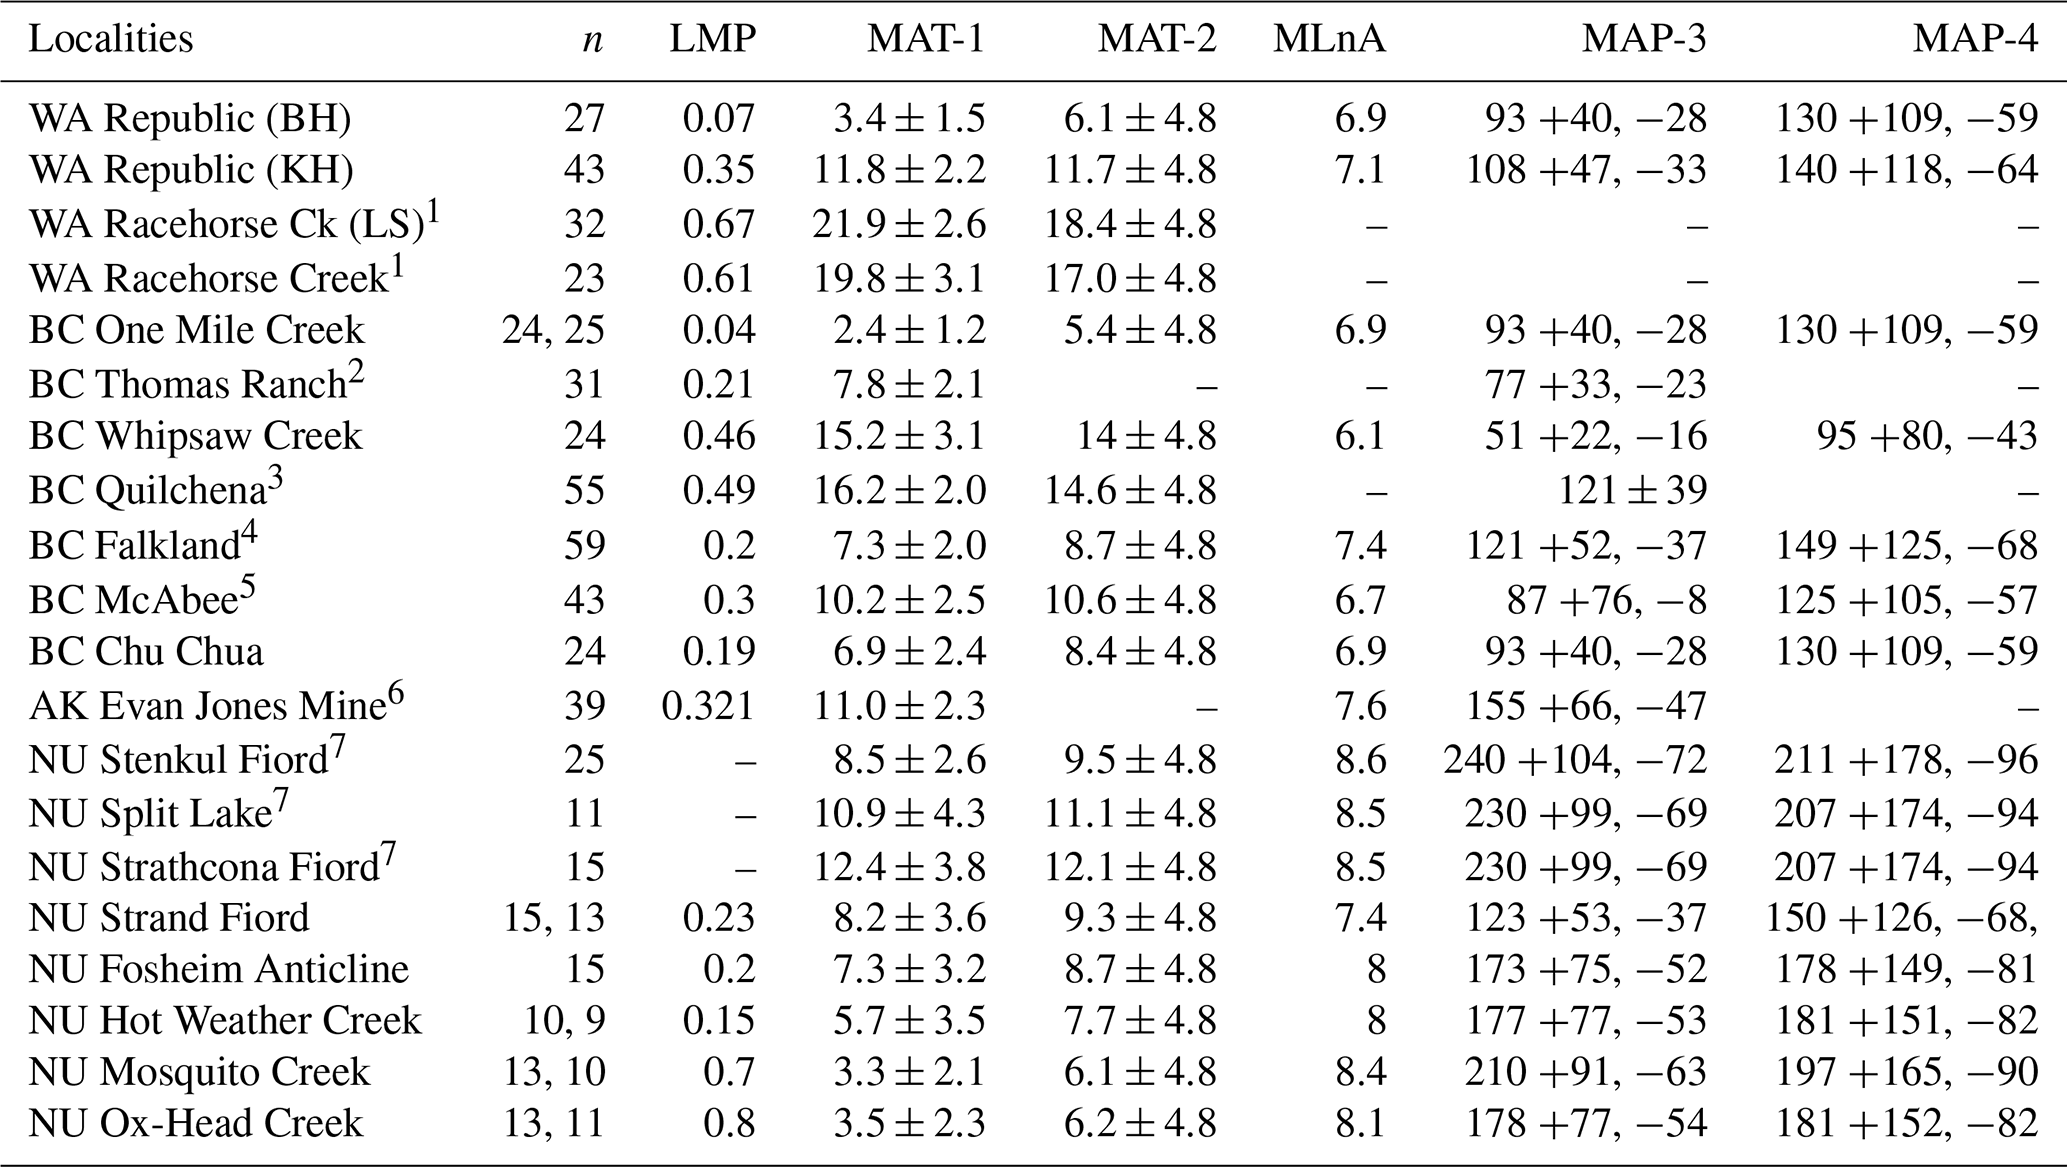
n: number of dicot leaf morphotypes scored; LMP: leaf margin proportion (number of non-toothed leaf morphotypes as a proportion of n: 0 > X≤1.0; Wilf, 1997); MAT: mean annual temperature; MAT-1: LMA equation of Wing and Greenwood (1993); MAT-2: LMA global equation of Peppe et al. (2011); MLnA: mean leaf size expressed as loge; MAP: mean annual precipitation, where MAP-3 is the LAA equation of Wilf et al. (1998); MAP-4: LAA global equation of Peppe et al. (2011). BC – British Columbia, Canada; NU – Nunavut, Canada; WA – Washington, USA; AK – Alaska, USA; BH – Boot Hill; KH – Knob Hill; LS – Landslide. 1 Breedlovestrout et al. (2013). 2 Dillhoff et al. (2013). 3 Mathewes et al. (2016). 4 Smith et al. (2011). 5 Lowe et al. (2018). 6 Sunderlin et al. (2011). 7 West et al. (2015).
Table A3Paleoclimate estimates using the NLR-based BA method. BC – British Columbia, Canada; NU – Nunavut, Canada; WA – Washington, USA; AK – Alaska, USA; LS – Landslide.
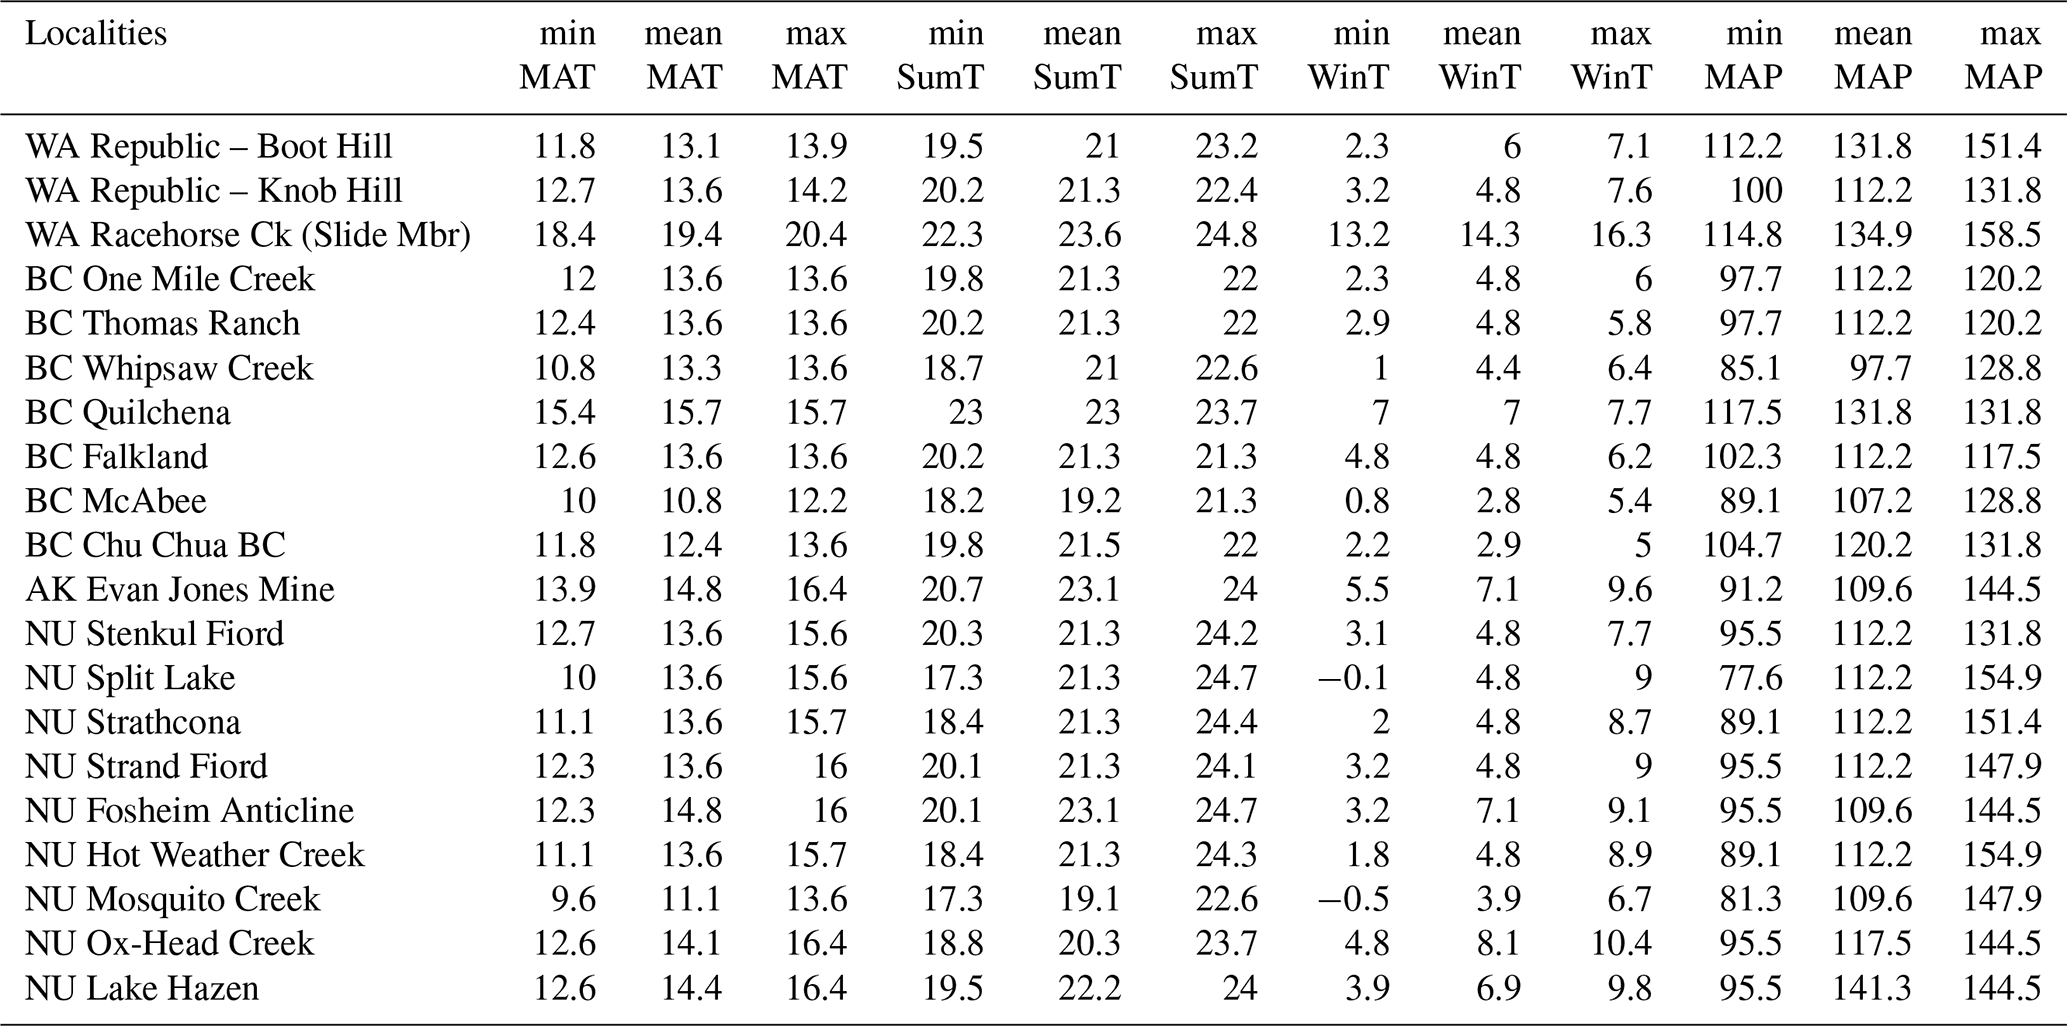
minMAT: minimum mean annual temperature; meanMAT: average mean annual temperature;
maxMAT: maximum mean annual temperature; minSumT: minimum summer temperature;
meanSumT: average summer temperature; maxSumT: maximum summer temperature; minWinT: minimum winter temperature; meanWinT: average winter
temperature;
maxWinT: maximum winter temperature; minMAP: minimum mean annual precipitation;
meanMAP: average mean annual precipitation; maxMAP: maximum mean annual
precipitation.
Previously published leaf measurement data used in this study are available from their original cited works (see Table 1 for a complete list). CLAMP data for Republic (Boot Hill), Republic (Knob Hill), and Chu Chua (Wolfe et al., 1998) are available at http://clamp.ibcas.ac.cn/CLAMP_Fossils_Paleogene.html (last access: 18 January 2020). New leaf measurement and NLR data used for this study are available on the Mendeley open-access data library at https://doi.org/10.17632/m8sgvhnc8n.1 (West et al., 2020).
CKW and DRG conceived the study. CKW led the writing and coordinated the analyses. CKW, JMV, AJL, and JFB collected the samples, and CKW, TR, AJL, and JMV collected and analyzed the data. CKW, DRG, and JFB wrote the paper with inputs from all of the authors.
The authors declare that they have no conflicts of interest.
Fieldwork in BC and Arctic Canada was under scientific and paleontological collection permits issued by the BC and Nunavut governments where required. David R. Greenwood and Janelle M. Vachon thank Ken Pugh for the loan of his Whipsaw Creek fossil collection and for site information. We thank Robin Y. Smith and Renee L. Love (formerly Breedlovestrout) for the provision of CLAMP analyses from their PhD work. This work includes research from the doctoral dissertation of Christopher K. West at the University of Saskatchewan and the Master of Science theses of Janelle M. Vachon and Alexander J. Lowe at Brandon University. David R. Greenwood, Christopher K. West, and Tammo Reichgelt thank Dan Lunt, Chris Hollis, and Matthew Huber for suggestions on the scope of the paper.
This work was substantially supported by the Natural Sciences and Engineering Research Council of Canada (NSERC) through Discovery Grants (DG 311934 and 2016-04337) to David R. Greenwood, a doctoral scholarship (Alexander Graham Bell Doctoral Scholarship) to Christopher K. West, a grant from the Brandon University Research Committee to David R. Greenwood for Arctic fieldwork, Geological Society of America student research grants to Christopher K. West (11816-17) and to Janelle M. Vachon (12565-19), Paleontological Society and SEPM graduate awards to Alexander J. Lowe, a National Geographic Society Exploration Grant (9652-15) to David R. Greenwood (S. Bruce Archibald and Jaelyn Eberle co-PIs), and a Vetlesen Foundation Climate Center grant to Tammo Reichgelt; this was all for fieldwork support in British Columbia. David R. Greenwood received support from the Canada Foundation for Innovation (project 31801) and Research Manitoba for laboratory facilities at Brandon University used in this study. The work was partially supported by the Brandon University Student Union for student employment grants for two BC field seasons. Arctic fieldwork by James F. Basinger was supported by NSERC (DG 1334) and the Polar Continental Shelf Program.
This paper was edited by Zhengtang Guo and reviewed by Suzanne Leroy and Lydie Dupont.
Archibald, S. B., Bossert, W. H., Greenwood, D. R., and Farrell, B. D.: Seasonality, the latitudinal gradient of diversity, and Eocene insects, Paleobiology, 36, 374–398, 2010.
Archibald, S. B., Greenwood, D. R., Smith, R. Y., Mathewes, R. W., and Basinger, J. F.: Great Canadian Lagerstätten 1. Early Eocene Lagerstätten of the Okanagan Highlands (British Columbia and Washington State), Geosci. Can., 38, 155–164, 2011.
Archibald, S. B., Greenwood, D. R., and Mathewes, R. W.: Seasonality, montane beta diversity, and Eocene insects: testing Janzen's dispersal hypothesis in an equable world, Palaeogeogr. Palaeocl., 371, 1–8, 2013.
Archibald, S. B., Morse, G. E., Greenwood, D. R., and Mathewes, R. W.: Fossil palm beetles refine upland winter temperatures in the Early Eocene Climatic Optimum, P. Natl. Acad. Sci. USA, 111, 8095–8100, 2014.
Basinger, J. F., Greenwood, D. R., and Sweda, T.: Early Tertiary vegetation of Arctic Canada and its relevance to paleoclimatic interpretation, in: Cenozoic plants and climates of the Arctic, Springer, Berlin, Heidelberg, 175–198, 1994.
Beerling, D. and Woodward, F. I.: Vegetation and the terrestrial carbon cycle: the first 400 million years, Cambridge University Press, 2001.
Breedlovestrout, R. L.: Paleofloristic studies in the Paleogene Chuckanut Basin, Western Washington, USA, PhD dissertation, University of Idaho, 189 pp., 2011.
Breedlovestrout, R. L., Evraets, B. J., and Parrish, J. T.: New Paleogene climate analysis of western Washington using physiognomic characteristics of fossil leaves, Palaeogeogr. Palaeocl., 392, 22–40, 2013.
Brown, S.: A comparison of the structure, primary productivity, and transpiration of cypress ecosystems in Florida, Ecol. Monogr., 51, 403–427, 1981.
Busing, R. T.: NPP Temperate Forest: Great Smoky Mountains, Tennessee, USA, 1968–1992, R1, Data set, Oak Ridge National Laboratory Distributed Active Archive Center, Oak Ridge, Tennessee, USA, https://doi.org/10.3334/ORNLDAAC/804, 2013.
Carmichael, M. J., Lunt, D. J., Huber, M., Heinemann, M., Kiehl, J., LeGrande, A., Loptson, C. A., Roberts, C. D., Sagoo, N., Shields, C., Valdes, P. J., Winguth, A., Winguth, C., and Pancost, R. D.: A model–model and data–model comparison for the early Eocene hydrological cycle, Clim. Past, 12, 455–481, https://doi.org/10.5194/cp-12-455-2016, 2016.
Carmichael, M. J., Pancost, R. D., and Lunt, D. J.: Changes in the occurrence of extreme precipitation events at the Paleocene–Eocene thermal maximum, Earth Planet Sc. Lett., 501, 24–36, 2018.
Currano, E. D., Labandeira, C. C., and Wilf, P.: Fossil insect folivory tracks paleotemperature for six million years, Ecol. Monogr., 80, 547–567, 2010.
Davies-Vollum, K. S.: Early Palaeocene palaeoclimatic inferences from fossil floras of the western interior, USA, Palaeogeogr. Palaeocl., 136, 145–164, 1997.
Dawson, M. R., McKenna, M. C., Beard, K. C., and Hutchison, J. H.: An early Eocene plagiomenid mammal from Ellesmere and Axel Heiberg islands, Arctic Canada, S Kaupia, 3, 179–192, 1993.
DeVore, M. L. and Pigg, K. B.: A brief review of the fossil history of the family Rosaceae with a focus on the Eocene Okanogan Highlands of eastern Washington State, USA, and British Columbia, Canada, Plant Syst. Evol., 266, 45–57, 2007.
DeVore, M. L. and Pigg, K. B.: Floristic composition and comparison of middle Eocene to late Eocene and Oligocene floras in North America, B. Geosci., 85, 111–134, 2010.
Dillhoff, R. M., Dillhoff, T. A., Greenwood, D. R., DeVore, M. L., and Pigg, K. B.: The Eocene Thomas Ranch flora, Allenby Formation, Princeton, British Columbia, Canada, Botany, 91, 514–529, 2013.
Eberle, J.J., A new “tapir” from Ellesmere Island, Arctic Canada – implications for Northern high-latitude palaeobiogeography and Tapir palaeobiology, Palaeogeogr. Palaeocl., 227, 311–322, 2005.
Eberle, J. J. and Greenwood, D. R.: Life at the top of the greenhouse Eocene world – a review of the Eocene flora and vertebrate fauna from Canada's High Arctic, Geol. Soc. Am. Bull., 124, 3–23, https://doi.org/10.1130/B30571.1, 2012.
Eberle, J. J. and Greenwood, D. R.: An Eocene brontothere and tillodonts (Mammalia) from British Columbia, and their paleoenvironments, Can. J. Earth Sci., 54, 981–992, 2017.
Eberle, J. J., Gottfried, M. D., Hutchison, J. H., and Brochu, C. A.: First record of Eocene bony fishes and crocodyliforms from Canada's Western Arctic, PLoS ONE, 9, e96079, https://doi.org/10.1371/journal.pone.0096079, 2014.
Eldrett, J. S., Greenwood, D. R., Harding, I. C., and Huber, M.: Increased seasonality through the Eocene to Oligocene transition in northern high latitudes, Nature, 459, 969–974, https://doi.org/10.1038/nature08069, 2009.
Eldrett, J. S., Greenwood, D. R., Polling, M., Brinkhuis, H., and Sluijs, A.: A seasonality trigger for carbon injection at the Paleocene–Eocene Thermal Maximum, Clim. Past, 10, 759–769, https://doi.org/10.5194/cp-10-759-2014, 2014.
Estes, R. and Hutchison, J. H.: Eocene lower vertebrates from Ellesmere Island, Canadian Arctic Archipelago, Palaeogeogr. Palaeocl., 30, 325–347, 1980.
Environment Canada: National Climate Data and Information Archive, available at: http://www.climate.weatheroffice.ec.gc.ca, last access: 18 January 2020.
Gholz, H. L.: Environmental limits on aboveground net primary production, leaf area, and biomass in vegetation zones of the Pacific Northwest, Ecology, 63, 469–481, 1982.
Greenwood, D. R.: Fossil angiosperm leaves and climate: from Wolfe and Dilcher to Burnham and Wilf, Cour. Forsch. Senck., 258, 95–108, 2007.
Greenwood, D. R. and Conran, J. G.: Fossil coryphoid palms from the Eocene of Vancouver, British Columbia, Canada, Int. J. Plant Sci., 181, 224–240, https://doi.org/10.1086/706450, 2020.
Greenwood, D. R. and Wing, S. L.: Eocene continental climates and latitudinal temperature gradients, Geology, 23, 1044–1048, 1995.
Greenwood, D. R., Archibald, S. B., Mathewes, R. W., and Moss, P. T.: Fossil biotas from the Okanagan Highlands, southern British Columbia and northeastern Washington State: climates and ecosystems across an Eocene landscape, Can. J. Earth Sci., 42, 167–185, https://doi.org/10.1139/E04-100, 2005.
Greenwood, D. R., Basinger, J. F., and Smith, R. Y.: How wet was the Arctic Eocene rainforest? Estimates of precipitation from Paleogene Arctic macrofloras, Geology, 38, 15–18, https://doi.org/10.1130/G30218.1, 2010.
Greenwood, D. R., Pigg, K. B., Basinger, J. F., and DeVore, M. L.: A review of paleobotanical studies of the Early Eocene Okanagan (Okanogan) Highlands floras of British Columbia, Canada and Washington, USA, Can. J. Earth Sci., 53, 548–564, https://doi.org/10.1139/cjes-2015-0177, 2016.
Greenwood, D. R., Keefe, R. L., Reichgelt, T., and Webb, J. A.: Eocene paleobotanical altimetry of Victoria's Eastern Uplands, Aust. J. Earth Sci., 64, 625–637, 2017.
Grimm, G. W. and Potts, A. J.: Fallacies and fantasies: the theoretical underpinnings of the Coexistence Approach for palaeoclimate reconstruction, Clim. Past, 12, 611–622, https://doi.org/10.5194/cp-12-611-2016, 2016.
Gushulak, C. A. C., West, C. K., and Greenwood, D. R.: Paleoclimate and precipitation seasonality of the Early Eocene McAbee megaflora, Kamloops Group, British Columbia, Can. J. Earth Sci., 53, 591–604, https://doi.org/10.1139/cjes-2015-0160, 2016.
Herold, N., Buzan, J., Seton, M., Goldner, A., Green, J. A. M., Müller, R. D., Markwick, P., and Huber, M.: A suite of early Eocene (∼55 Ma) climate model boundary conditions, Geosci. Model Dev., 7, 2077–2090, https://doi.org/10.5194/gmd-7-2077-2014, 2014.
Hijmans, R. J., Cameron, S. E., Parra, J. L., Jones, P. G., and Jarvis, A.: Very high re-solution interpolated climate surfaces for global land areas, Int. J. Climatol., 25, 1965–1978, https://doi.org/10.1002/joc.1276, 2005.
Hinojosa, L. F., Pérez, F., Gaxioloa, A., and Sandoval, I.: Historical and phylogenetic constraints on the incidence of entire leaf margins: insights from a new South American model, Global Ecol. Biogeogr., 20, 380–390, 2011.
Hollis, C. J., Dunkley Jones, T., Anagnostou, E., Bijl, P. K., Cramwinckel, M. J., Cui, Y., Dickens, G. R., Edgar, K. M., Eley, Y., Evans, D., Foster, G. L., Frieling, J., Inglis, G. N., Kennedy, E. M., Kozdon, R., Lauretano, V., Lear, C. H., Littler, K., Lourens, L., Meckler, A. N., Naafs, B. D. A., Pälike, H., Pancost, R. D., Pearson, P. N., Röhl, U., Royer, D. L., Salzmann, U., Schubert, B. A., Seebeck, H., Sluijs, A., Speijer, R. P., Stassen, P., Tierney, J., Tripati, A., Wade, B., Westerhold, T., Witkowski, C., Zachos, J. C., Zhang, Y. G., Huber, M., and Lunt, D. J.: The DeepMIP contribution to PMIP4: methodologies for selection, compilation and analysis of latest Paleocene and early Eocene climate proxy data, incorporating version 0.1 of the DeepMIP database, Geosci. Model Dev., 12, 3149–3206, https://doi.org/10.5194/gmd-12-3149-2019, 2019.
Hopkins, R., Schmitt, J., and Stinchcombe, J. R.: A latitudinal cline and response to vernalization in leaf angle and morphology in Arabidopsis thaliana (Brassicaceae), New Phytol., 179, 155–164, https://doi.org/10.1111/j.1469-8137.2008.02447.x, 2008.
Huber, M. and Caballero, R.: The early Eocene equable climate problem revisited, Clim. Past, 7, 603–633, https://doi.org/10.5194/cp-7-603-2011, 2011.
Huber, M. and Goldner, A.: Eocene monsoons, J. Asian Earth Sci., 44, 3–23, https://doi.org/10.1016/j.jseaes.2011.09.014, 2012.
Hyland, E. G., Huntington, K. W., Sheldon, N. D., and Reichgelt, T.: Temperature seasonality in the North American continental interior during the Early Eocene Climatic Optimum, Clim. Past, 14, 1391–1404, https://doi.org/10.5194/cp-14-1391-2018, 2018.
Keery, J. S., Holden, P. B., and Edwards, N. R.: Sensitivity of the Eocene climate to CO2 and orbital variability, Clim. Past, 14, 215–238, https://doi.org/10.5194/cp-14-215-2018, 2018.
Kudo, G.: Leaf traits and shoot performance of an evergreen shrub, Ledum palustre ssp. decumbens, in accordance with latitudinal change, Can. J. Botany, 73, 1451–1456, https://doi.org/10.1139/b95-157, 1995.
Lauretano, V., Littler, K., Polling, M., Zachos, J. C., and Lourens, L. J.: Frequency, magnitude and character of hyperthermal events at the onset of the Early Eocene Climatic Optimum, Clim. Past, 11, 1313–1324, https://doi.org/10.5194/cp-11-1313-2015, 2015.
Lichtenthaler, H. K., Buschmann, C., Döll, M., Fietz, H. J., Bach, T., Kozel, U., Meier, D., and Rahmsdorf, U., Photosynthetic activity, chloroplast ultrastructure, and leaf characteristics of high-light and low-light plants and of sun and shade leaves, Photosynth. Res., 2, 115–141, 1981.
Littler, K., Röhl, U., Westerhold, T., and Zachos, J. C.: A high resolution benthic stable-isotope record for the South Atlantic: Implications for orbital-scale changes in Late Paleocene-Early Eocene climate and carbon cycling, Earth Planet Sc. Lett., 401, 18–30, https://doi.org/10.1016/j.epsl.2014.05.054, 2014.
Loptson, C. A., Lunt, D. J., and Francis, J. E.: Investigating vegetation–climate feedbacks during the early Eocene, Clim. Past, 10, 419–436, https://doi.org/10.5194/cp-10-419-2014, 2014.
Lowe, A. J., Greenwood, D. R., West, C. K., Galloway, J. M., Reichgelt, T., and Sudermann, M.: Plant community ecology and climate on an upland volcanic landscape during the Early Eocene Climatic Optimum: McAbee fossil beds, British Columbia, Canada, Paleogeogr. Palaeocl., 511, 433–448, 2018.
Lunt, D. J., Dunkley Jones, T., Heinemann, M., Huber, M., LeGrande, A., Winguth, A., Loptson, C., Marotzke, J., Roberts, C. D., Tindall, J., Valdes, P., and Winguth, C.: A model–data comparison for a multi-model ensemble of early Eocene atmosphere–ocean simulations: EoMIP, Clim. Past, 8, 1717–1736, https://doi.org/10.5194/cp-8-1717-2012, 2012.
Lunt, D. J., Huber, M., Anagnostou, E., Baatsen, M. L. J., Caballero, R., DeConto, R., Dijkstra, H. A., Donnadieu, Y., Evans, D., Feng, R., Foster, G. L., Gasson, E., von der Heydt, A. S., Hollis, C. J., Inglis, G. N., Jones, S. M., Kiehl, J., Kirtland Turner, S., Korty, R. L., Kozdon, R., Krishnan, S., Ladant, J.-B., Langebroek, P., Lear, C. H., LeGrande, A. N., Littler, K., Markwick, P., Otto-Bliesner, B., Pearson, P., Poulsen, C. J., Salzmann, U., Shields, C., Snell, K., Stärz, M., Super, J., Tabor, C., Tierney, J. E., Tourte, G. J. L., Tripati, A., Upchurch, G. R., Wade, B. S., Wing, S. L., Winguth, A. M. E., Wright, N. M., Zachos, J. C., and Zeebe, R. E.: The DeepMIP contribution to PMIP4: experimental design for model simulations of the EECO, PETM, and pre-PETM (version 1.0), Geosci. Model Dev., 10, 889–901, https://doi.org/10.5194/gmd-10-889-2017, 2017.
Lunt, D. J., Bragg, F., Chan, W.-L., Hutchinson, D. K., Ladant, J.-B., Niezgodzki, I., Steinig, S., Zhang, Z., Zhu, J., Abe-Ouchi, A., de Boer, A. M., Coxall, H. K., Donnadieu, Y., Knorr, G., Langebroek, P. M., Lohmann, G., Poulsen, C. J., Sepulchre, P., Tierney, J., Valdes, P. J., Dunkley Jones, T., Hollis, C. J., Huber, M., and Otto-Bliesner, B. L.: DeepMIP: Model intercomparison of early Eocene climatic optimum (EECO) large-scale climate features and comparison with proxy data, Clim. Past Discuss., https://doi.org/10.5194/cp-2019-149, in review, 2020.
Maechler, M., Rousseeuw, P., Struyf, A., Hubert, M., and Hornik, K.: cluster: Cluster Analysis Basics and Extensions, R package version 2.1.0., 2019.
Mathewes, R. W.: Climatic conditions in the western and northern Cordillera during the last glaciation: paleoecological evidence, Geogr. Phys. Quatern., 45, 333–339, 1991.
Mathewes, R. W., Greenwood, D. R., and Archibald, S. B.: Paleoenvironment of the Quilchena flora, British Columbia, during the Early Eocene Climatic Optimum, Can. J. Earth Sci., 53, 574–590, 2016.
Mathewes, R. W., Greenwood, D. R., and Love, R. L.: The Kanaka Creek fossil flora (Huntingdon Formation), British Columbia, Canada–paleoenvironment and evidence for Paleocene age using palynology and macroflora, Can. J. Earth Sci., 57, 348–365, 2020.
McInerney, F. A. and Wing, S. L.: The Paleocene-Eocene Thermal Maximum: A perturbation of carbon cycle, climate, and biosphere with implications for the future, Annu. Rev. Earth Planet. Sc., 39, 489–516, 2011.
McIver, E. E. and Basinger, J. F.: Early Tertiary floral evolution in the Canadian high Arctic, Ann. Miss. Bot. Gard., 86, 523–545, 1999.
McKenna, M. C.: Eocene paleolatitude, climate, and mammals of Ellesmere Island, Palaeogeogr. Palaeocl., 30, 349–362, 1980.
Migalina, S. V., Ivanova, L. A., and Makhnev, A. K.: Changes of Leaf Morphology in Betula pendula Roth and B. pubescens Ehrh. along a Zonal–Climatic Transect in the Urals and Western Siberia, Russ. J. Ecol., 41, 293–301, https://doi.org/10.1134/S106741361004003X, 2010.
Moss, P. T., Greenwood, D. R., and Archibald, S. B.: Regional and local vegetation community dynamics of the Eocene Okanagan Highlands (British Columbia Washington State) from palynology, Can. J. Earth Sci., 42, 187–204, 2005.
Morley, R. J.: Cretaceous and Tertiary climate change and the past distribution of megathermal rainforests, in: Tropical rainforest responses to climatic change, Springer, Berlin, Heidelberg, 1–34, 2011.
Naafs, B. D. A., Rohrssen, M., Inglis, G. N., Lähteenoja, O., Feakins, S. J., Collinson, M. E., Kennedy, E. M., Singh, P. K., Singh, M. P., Lunt, D.J., and Pancost, R. D.: High temperatures in the terrestrial mid-latitudes during the early Palaeogene, Nat. Geosci., 11, 766–771, 2018.
National Oceanic and Atmospheric Administration: National Centers for Environmental Information: available at: https://www.ncdc.noaa.gov/cdo-web/datatools/normals, last access: 18 January 2020.
New, M., Lister, D., Hulme, M., and Mankin, I.: A high resolutiondata set of surface of surface climate over global landareas, Clim. Res., 21, 1–25, https://doi.org/10.3354/cr021001, 2002.
Peppe, D. J., Royer, D. L., Cariglino, B., Oliver, S. Y., Newman, S., Leight, E., Enikolopov, G., Fernandez-Burgos, M., Herrera, F., Adams, J. M., and Correa, E.: Sensitivity of leaf size and shape to climate: global patterns and paleoclimatic applications, New Phytol., 190, 724–739, 2011.
Quan, C., Liu, Y. S. C., and Utescher, T.: Paleogene temperature gradient, seasonal variation and climate evolution of northeast China, Palaeogeogr. Palaeocl., 313, 150–161, 2012.
R Core Team: R: a language and environment for statistical computing, version 3.0. 2. Vienna, Austria: R Foundation for Statistical Computing, 2019.
Reichgelt, T., West, C. K., and Greenwood, D. R.: The relation between the global distribution of palms and climate, Sci. Rep.-UK, 8, 4721, https://doi.org/10.1038/s41598-018-23147-2, 2018.
Reichgelt, T., Kennedy, E. M., Conran, J. G., Lee, W. G., and Lee, D. E.: The presence of moisture deficits in Miocene New Zealand, Global Planet. Change, 172, 268–277, 2019.
Reinhardt, L., Estrada, S., Andruleit, H., Dohrmann, R., Piepjohn, K., von Gosen, W., Davis, D. W., and Davis, B.: Altered volcanic ashes in Palaeocene and Eocene sediments of the Eureka Sound Group (Ellesmere Island, Nunavut, Arctic Canada), Z. Dtsch. Ges. Geowiss., 164, 131–147, 2013.
Reinhardt, L., von Gosen, W., Piepjohn, K., Lückge, A., and Schmitz, M.: The Eocene Thermal Maximum 2 (ETM-2) in a terrestrial section of the High Arctic: identification by U-Pb zircon ages of volcanic ashes and carbon isotope records of coal and amber (Stenkul Fiord, Ellesmere Island, Canada), in: EGU2017, Vinena, Austria, Proceedings, 19, 8145, 2017.
Salpin, M., Schnyder, J., Baudin, F., Suan, G., Suc, J. P., Popescu, S. M., Fauquette, S., Reinhardt, L., Schmitz, M. D., and Labrousse, L.: Evidence for subtropical warmth in the Canadian Arctic (Beaufort-Mackenzie, Northwest Territories, Canada) during the early Eocene, in: Circum-Arctic Structural Events: Tectonic Evolution of the Arctic Margins and Trans-Arctic Links with Adjacent Orogens, edited by: Piepjohn, K., Strauss, J. V., Reinhardt, L., and McClelland, W. C., Geol. S. Am. Sp., 541, 1–28, https://doi.org/10.1130/2018.2541(27), 2019.
Saugier B., Roy J., and Mooney H. A.: Estimations of global terrestrial productivity: converging toward a single number?, in: Terrestrial Global Productivity, edited by: Roy, J., Saugier, B., and Mooney, H. A., San Diego, Academic, 543–57, 2001.
Shellito, C. J. and Sloan, L. C.: Reconstructing a lost Eocene paradise: Part I. Simulating the change in global floral distribution at the initial Eocene thermal maximum, Global Planet. Change, 50, 1–17, 2006.
Sluijs, A., Schouten, S., Donders, T. H., Schoon, P. L., Röhl, U., Reichart, G. J., Sangiorgi, F., Kim, J. H., Sinninghe Damsté, J. S., and Brinkhuis, H.: Warm and wet conditions in the Arctic region during Eocene Thermal Maximum 2, Nat. Geosci., 2, 777–780, 2009.
Smith, R. Y.: The Eocene Falkland fossil flora, Okanagan Highlands, British Columbia: Paleoclimate and plant community dynamics during the Early Eocene Climatic Optimum, PhD dissertation, University of Saskatchewan, 190 pp., 2011.
Smith, R. Y., Basinger, J. F., and Greenwood, D. R.: Depositional setting, fossil flora, and paleoenvironment of the Early Eocene Falkland site, Okanagan Highlands, British Columbia, Can. J. Earth Sci., 46, 811–822, 2009.
Smith, R. Y., Greenwood, D. R., and Basinger, J. F.: Estimating paleoatmospheric pCO2 during the Early Eocene Climatic Optimum from stomatal frequency of Ginkgo, Okanagan Highlands, British Columbia, Canada, Paleogeogr. Palaeocl., 293, 120–131, https://doi.org/10.1016/j.palaeo.2010.05.006, 2010.
Smith, R. Y., Basinger, J. F., and Greenwood, D. R.: Early Eocene plant diversity and dynamics in the Falkland flora, Okanagan Highlands, British Columbia, Canada, Palaeobio. Palaeoenv., 92, 309–328, https://doi.org/10.1007/s12549-011-0061-5, 2012.
Sudermann, M., Galloway, J. M., Greenwood, D. R., West, C. K., and Reinhardt, L.: Palynostratigraphy of the lower Paleogene Margaret Formation at Stenkul Fiord, Ellesmere Island, Nunavut, Canada, Palynology, in review, 2020.
Sunderlin, D., Loope, G., Parker, N. E., and Williams, C. J.: Paleoclimatic and paleoecological implications of a Paleocene–Eocene fossil leaf assemblage, Chickaloon Formation, Alaska. Palaios, 26, 335–345, 2011.
Suan, G., Popescu, S. M., Suc, J. P., Schnyder, J., Fauquette, S., Baudin, F., Yoon, D., Piepjohn, K., Sobolev, N. N., and Labrousse, L.: Subtropical climate conditions and mangrove growth in Arctic Siberia during the early Eocene, Geology, 45, 539–542, 2017.
Tribe, S.: Eocene paleo-physiography and drainage directions, southern Interior Plateau, British Columbia, Can. J. Earth Sci., 42, 215–230, 2005.
Tripati, A., Zachos, J., Marincovich Jr., L., and Bice, K.: Late Paleocene Arctic coastal climate inferred from molluscan stable and radiogenic isotope ratios, Palaeogeogr. Palaeocl., 170, 101–113, 2001.
Triplehorn, D. M., Turner, D. L., and Naeser, C. W.: Radiometric age of the Chickaloon Formation of south-central Alaska: Location of the Paleocene-Eocene boundary, Geol. Soc. Am. Bull., 95, 740–742, 1984.
van Hinsbergen, D. J., de Groot, L. V., van Schaik, S. J., Spakman, W., Bijl, P. K., Sluijs, A., Langereis, C. G., and Brinkhuis, H.: A paleolatitude calculator for paleoclimate studies, PloS One, 10, 1–21, 2015.
West, C. K., Greenwood, D. R., and Basinger, J. F.: Was the Arctic Eocene “rainforest” monsoonal? Estimates of seasonal precipitation from early Eocene megafloras from Ellesmere Island, Nunavut, Earth Planet Sc. Lett., 427, 18–30, https://doi.org/10.1016/j.epsl.2015.06.036, 2015.
West, C. K., Greenwood, D. R., and Basinger, J. F.: The late Paleocene and early Eocene Arctic megaflora of Ellesmere and Axel Heiberg islands, Nunavut, Canada, Palaeontogr. Abt. B., 300, 47–163, 2019.
West, C. K., Greenwood, D. R., Reichgelt, T., Lowe, A. J., Vachon, J. M., and Basinger, J. F.: Data for: Paleobotanical proxies for early Eocene climates and ecosystems in northern North America from middle to high latitudes, Mendeley Data, v1, https://doi.org/10.17632/m8sgvhnc8n.1, 2020.
Westerhold, T., Röhl, U., Wilkens, R. H., Gingerich, P. D., Clyde, W. C., Wing, S. L., Bowen, G. J., and Kraus, M. J.: Synchronizing early Eocene deep-sea and continental records – cyclostratigraphic age models for the Bighorn Basin Coring Project drill cores, Clim. Past, 14, 303–319, https://doi.org/10.5194/cp-14-303-2018, 2018.
Whittaker, R. H.: Communities and Ecosystems, 2nd ed., Macmillan, New York, 1975.
Wilf, P.: When are leaves good thermometers? A new case for leaf margin analysis, Paleobiology, 23i, 373–390, 1997.
Wilf, P.: Late Paleocene–early Eocene climate changes in southwestern Wyoming: Paleobotanical analysis, Geol. Soc. Am. Bull., 112, 292–307, 2000.
Wilf, P., Wing, S. L., Greenwood, D. R., and Greenwood, C. L.: Using fossil leaves as paleoprecipitation indicators: an Eocene example, Geology, 26, 203–206, 1998.
Willard, D. A., Donders, T. H., Reichgelt, T., Greenwood, D. R., Sangiorgi, F., Peterse, F., Nierop, K. G., Frieling, J., Schouten, S., and Sluijs, A.: Arctic vegetation, temperature, and hydrology during Early Eocene transient global warming events, Global Planet. Change, 178, 139–152, 2019.
Williams, C. J., LePage, B. A., Johnson, A. H., and Vann, D. R.: Structure, biomass, and productivity of a late Paleocene Arctic forest, P. Acad. Nat. Sci. Phila., 158, 107–127, 2009.
Wing, S. L.: Tertiary vegetation of North America as a context for mammalian evolution, in: Evolution of Tertiary Mammals of North America, edited by: Janis, C. M., Scott, K. M., Jacobs, L. L., Gunnell, G. F., and Uhen, M. D., 1, 37–65, Cambridge University Press, 1998.
Wing, S. L. and Greenwood, D. R.: Fossils and fossil climates: the case for equable Eocene continental interiors, Philos. T. Roy. Soc. B., 341, 243–252, 1993.
Wolfe, J. A.: Distribution of Major Vegetational Types During the Tertiary, in: The Carbon Cycle and Atmospheric CO2: Natural Variations Archean to Present, edited by: Sundquist, E. and Broecker, W., 32, 357–375, 1985.
Wolfe, J. A.: Tertiary plants from the Cook Inlet region, Alaska, US Geol. Survey Prof. P., 398, 1–32, 1966.
Wolfe, J. A.: A method of obtaining climatic parameters from leaf assemblages, US Government Printing Office, No. 2040–2041, 1993.
Wolfe, J. A.: Tertiary climatic changes at middle latitudes of western North America, Palaeogeogr. Palaeocl., 108, 195–205, 1994.
Wolfe, J. A., Forest, C. E., and Molnar, P.: Paleobotanical evidence of Eocene and Oligocene paleoaltitudes in midlatitude western North America, Geol. Soc. Am. Bull., 110, 664–678, 1998.
Woodward, F. I., Lomas, M. R., and Kelly, C. K.: Global climate and the distribution of plant biomes, Philos. T. Roy. Soc. B., 359, 1465–1476, 2004.
Yang, J., Spicer, R. A., Spicer, T. E., and Li, C. S.: “CLAMP Online”: a new web-based palaeoclimate tool and its application to the terrestrial Paleogene and Neogene of North America, Palaeobio. Palaeoenv., 91, 163–183, https://doi.org/10.1007/s12549-011-0056-2, 2011.
Yang, J., Spicer, R. A., Spicer, T. E., Arens, N. C., Jacques, F. M., Su, T., Kennedy, E. M., Herman, A. B., Steart, D. C., Srivastava, G., Mehrotra, R. C., Valdes, P. J., Mehrotra, N. C., Zhou, Z., and Lai, J.: Leaf form – climate relationships on the global stage: An ensemble of characters, Global Ecol. Biogeogr., 24, 1113–1125, 2015.
Zachos, J. C., Dickens, G. R., and Zeebe, R. E.: An early Cenozoic perspective on greenhouse warming and carbon-cycle dynamics, Nature, 451, 279–283, 2008.
Zhang, L., Hay, W. W., Wang, C., and Gu, X.: The evolution of latitudinal temperature gradients from the latest Cretaceous through the Present, Earth Sci. Rev., 189, 147–158, 2019.
greenhouse world. We used an improved method for plant fossil climate reconstruction that provides a consensus reconstruction from all available proxies. Results show that the early Eocene climate in northern North America was similar across a broad range of latitudes.