the Creative Commons Attribution 4.0 License.
the Creative Commons Attribution 4.0 License.
 | 10 Apr 2019
A 2700-year annual timescale and accumulation history for an ice core from Roosevelt Island, West Antarctica
Paul Vallelonga
Helle A. Kjær
Tyler J. Fudge
James E. Lee
Marie H. Riis
Ross Edwards
Nancy A. N. Bertler
Thomas Blunier
Ed J. Brook
Christo Buizert
Gabriela Ciobanu
Howard Conway
Dorthe Dahl-Jensen
Aja Ellis
B. Daniel Emanuelsson
Richard C. A. Hindmarsh
Elizabeth D. Keller
Andrei V. Kurbatov
Paul A. Mayewski
Peter D. Neff
Rebecca L. Pyne
Marius F. Simonsen
Anders Svensson
Andrea Tuohy
Edwin D. Waddington
Sarah Wheatley
We present a 2700-year annually resolved chronology and snow accumulation history for the Roosevelt Island Climate Evolution (RICE) ice core, Ross Ice Shelf, West Antarctica. The core adds information on past accumulation changes in an otherwise poorly constrained sector of Antarctica.
The timescale was constructed by identifying annual cycles in high-resolution impurity records, and it constitutes the top part of the Roosevelt Island Ice Core Chronology 2017 (RICE17). Validation by volcanic and methane matching to the WD2014 chronology from the WAIS Divide ice core shows that the two timescales are in excellent agreement. In a companion paper, gas matching to WAIS Divide is used to extend the timescale for the deeper part of the core in which annual layers cannot be identified.
Based on the annually resolved timescale, we produced a record of past snow accumulation at Roosevelt Island. The accumulation history shows that Roosevelt Island experienced slightly increasing accumulation rates between 700 BCE and 1300 CE, with an average accumulation of 0.25±0.02 m water equivalent (w.e.) per year. Since 1300 CE, trends in the accumulation rate have been consistently negative, with an acceleration in the rate of decline after the mid-17th century. The current accumulation rate at Roosevelt Island is 0.210±0.002 m w.e. yr−1 (average since 1965 CE, ±2σ), and it is rapidly declining with a trend corresponding to 0.8 mm yr−2. The decline observed since the mid-1960s is 8 times faster than the long-term decreasing trend taking place over the previous centuries, with decadal mean accumulation rates consistently being below average.
Previous research has shown a strong link between Roosevelt Island accumulation rates and the location and intensity of the Amundsen Sea Low, which has a significant impact on regional sea-ice extent. The decrease in accumulation rates at Roosevelt Island may therefore be explained in terms of a recent strengthening of the ASL and the expansion of sea ice in the eastern Ross Sea. The start of the rapid decrease in RICE accumulation rates observed in 1965 CE may thus mark the onset of significant increases in regional sea-ice extent.
- Article
(9254 KB) - Full-text XML
-
Supplement
(1862 KB) - BibTeX
- EndNote


Accurate timescales are fundamental for reliable interpretation of paleoclimate archives, including ice cores. Ice-core chronologies can be produced in a variety of ways. Where annual snow deposition is sufficiently high and reasonably regular throughout the year, seasonal variations in site temperature and atmospheric impurity deposition lead to annual cycles in the ice-core water isotope and impurity records (Dansgaard, 1964; Hammer et al., 1978). By identifying and counting the annual cycles, an annual-layer-counted ice-core timescale can be produced (Steig et al., 2005; Svensson et al., 2008; Sigl et al., 2016). This technique is commonly employed for producing ice-core timescales at sites with moderate to high snow accumulation, including coastal Antarctica. Annual-layer-counted ice-core timescales have traditionally been obtained by manual counting, but this task can now be performed using machine-learning algorithms for pattern recognition (Winstrup et al., 2012).
Where possible, the identification of annual layers allows for the development of a high-resolution ice-core chronology, but unless constrained by other data, the uncertainty of such a timescale will increase with depth as the number of uncertain layers accumulate to produce some age uncertainty (Andersen et al., 2006; Rasmussen et al., 2006). Marker horizons found in the ice-core records can be used to evaluate the accuracy of a layer-counted timescale or, alternatively, to constrain the timescale. Such marker horizons carry evidence of events of global or regional nature and may be (a) layers of enhanced radioactivity resulting from nuclear bomb tests (Arienzo et al., 2016), (b) sulfuric acids (Hammer, 1980) and/or tephra (Abbott et al., 2012) from volcanic eruptions, or (c) enhanced flux of cosmogenic radionuclides caused by changes in solar activity, reduction of the Earth's magnetic field, or cosmic events (Muscheler et al., 2014; Sigl et al., 2015; Raisbeck et al., 2017).
Ice cores can also be stratigraphically matched using records of past atmospheric composition from trapped air in the ice (Blunier et al., 1998; Blunier and Brook, 2001; EPICA Community Members, 2006). Variations in atmospheric composition are globally synchronous. Accounting for the time required to sequester the air into the ice, the ice-core gas records can be used also for stratigraphic matching of records measured on the ice matrix. Even during periods of stable climate, the atmospheric composition displays multi-decadal fluctuations (Bender et al., 1994; Mitchell et al., 2011, 2013), allowing for synchronization on sub-centennial timescales.
Annually resolved ice-core chronologies provide long-term reconstructions of annual snow accumulation (Alley et al., 1993; Dahl-Jensen et al., 1993): annual-layer thicknesses can be converted to past accumulation rates by applying corrections due to density changes during the transformation from snow to ice (Herron and Langway, 1980) and thinning of annual layers caused by ice flow (Nye, 1963). Reconstructions of past accumulation rates are important for improving our understanding of the natural fluctuations in snow accumulation and their climate drivers. Such knowledge is essential to accurately evaluate the current and future surface mass balance of glaciers and ice sheets, a critical and currently under-constrained factor in sea level assessments (Shepherd et al., 2012).
Here we present an ice-core chronology (RICE17) and accumulation history for the last 2700 years from Roosevelt Island, an ice rise located in the eastern Ross Embayment, Antarctica (Fig. 1). The ice core was extracted as part of the Roosevelt Island Climate Evolution (RICE) project (2010–2014) (Bertler et al., 2018). RICE forms a contribution to the Antarctica2k network (Stenni et al., 2017; Thomas et al., 2017), which seeks to produce Antarctica-wide ice-core reconstructions of temperature and snow accumulation for the past 2000 years. The chronology presented here was produced by annual-layer counting. In a companion paper (Lee et al., 2018), we extend the timescale to cover the deeper core by gas matching to the WAIS Divide ice core on the WD2014 chronology (Buizert et al., 2015; Sigl et al., 2016).
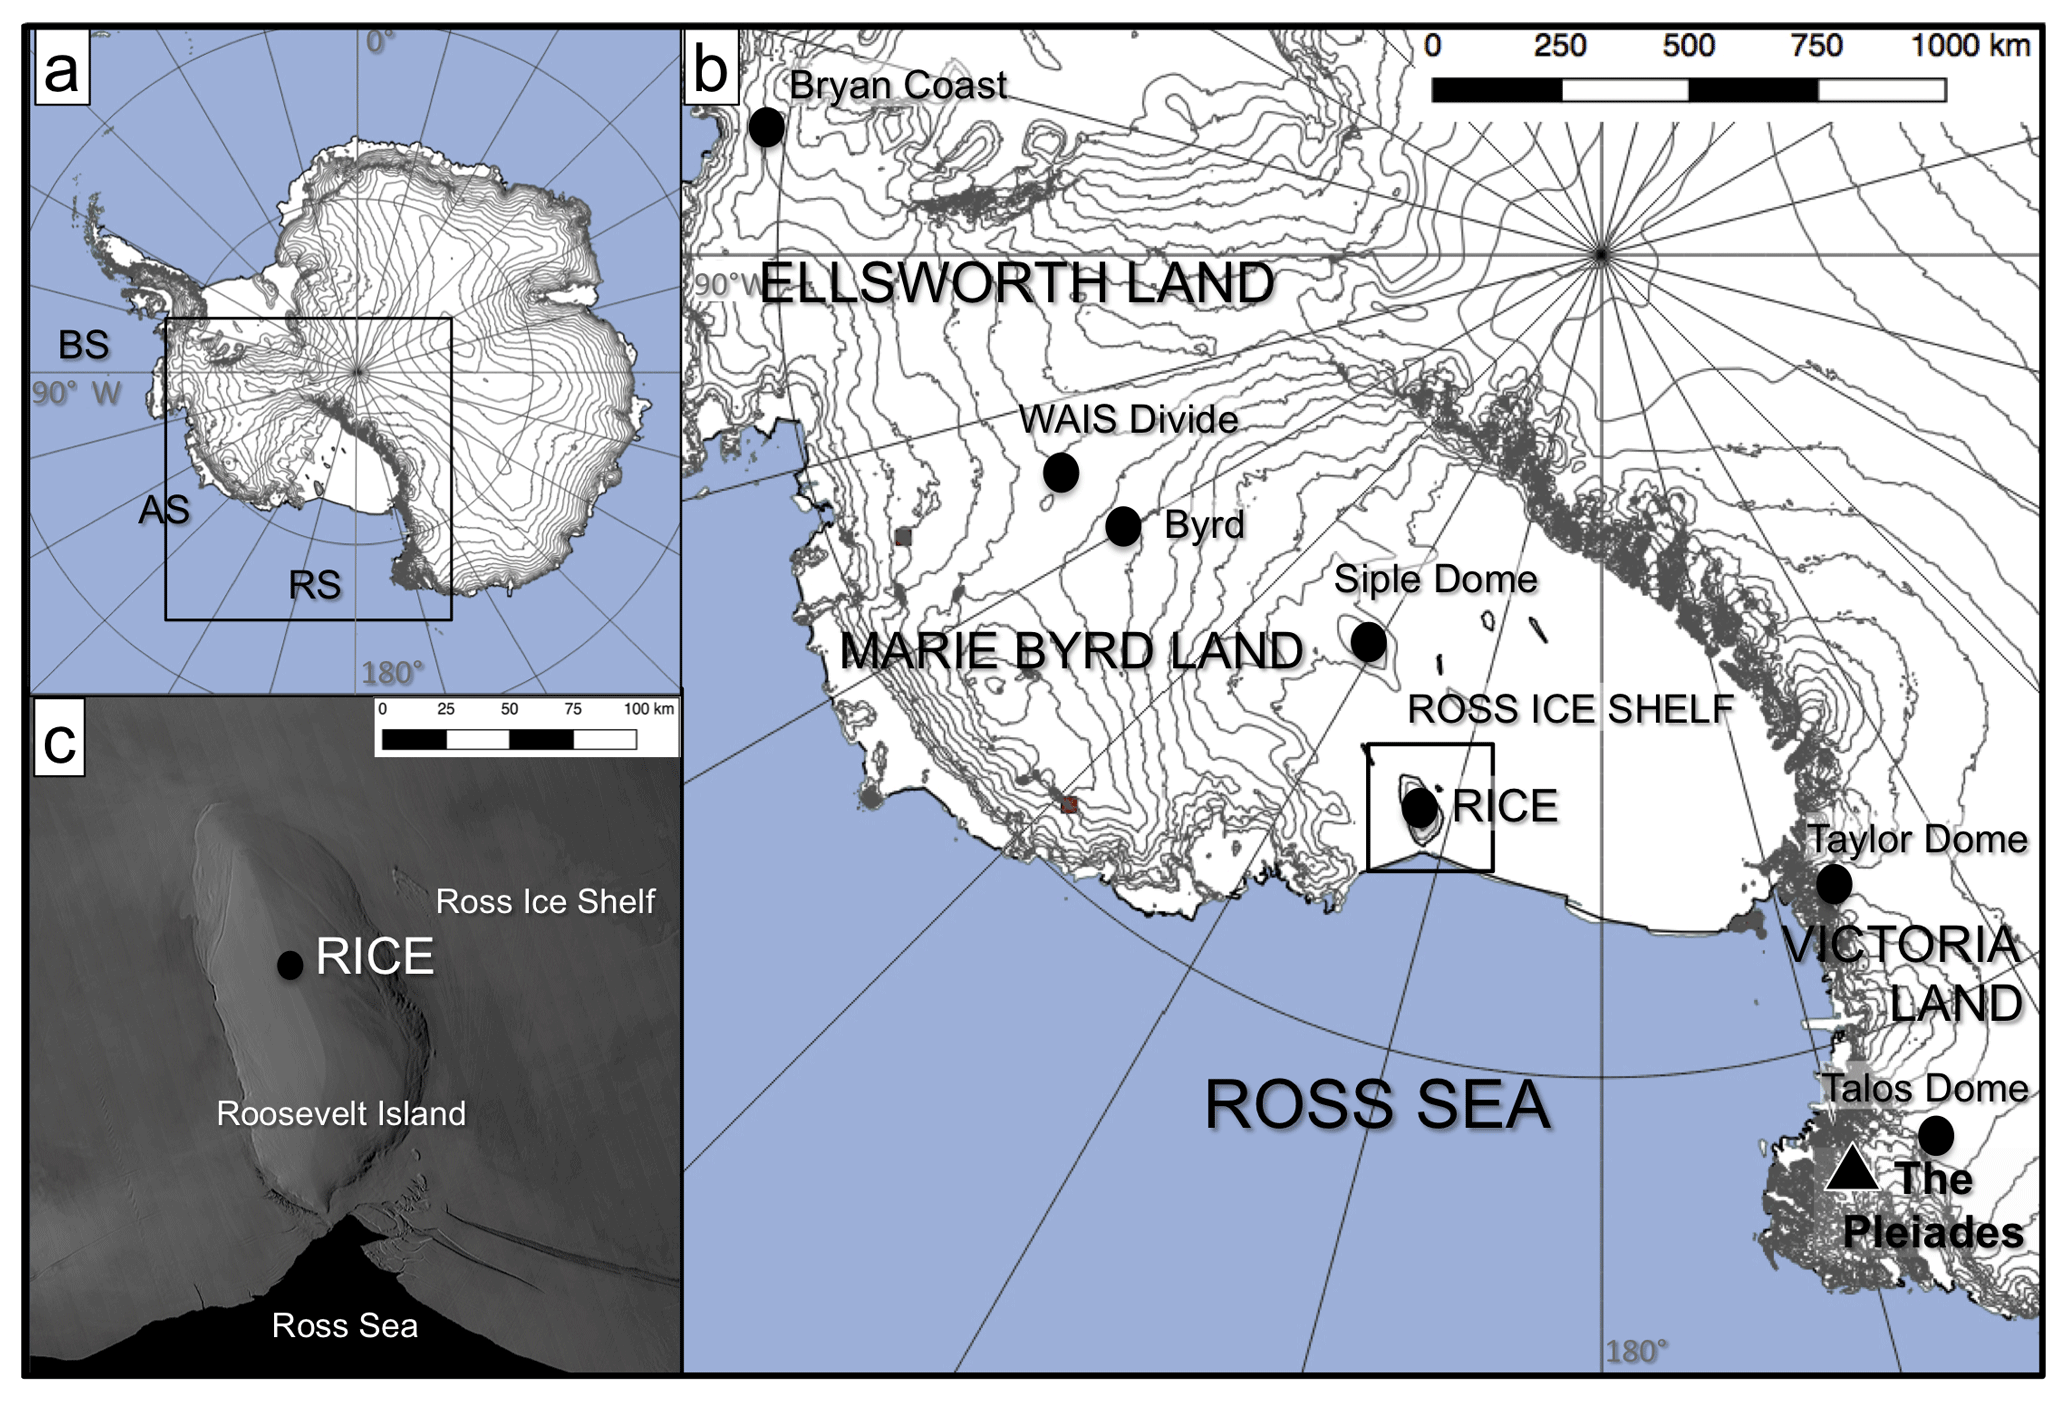
Figure 1(a, b) Roosevelt Island is located in the eastern sector of the Ross Ice Shelf embayment. Locations discussed in the text are represented by circles (ice cores) and a triangle (volcano). RS: Ross Sea; AS: Amundsen Sea; BS: Bellingshausen Sea. (c) MODIS image of Roosevelt Island (Haran et al., 2013), protruding as an ice dome from the surrounding Ross Ice Shelf. The RICE ice core was drilled on the ice divide of Roosevelt Island.
ECMWF ERA-Interim (ERAi) reanalysis fields (Dee et al., 2011) indicate that precipitation at Roosevelt Island is strongly influenced by the Amundsen Sea Low (ASL) and associated ridging (Raphael et al., 2016), and it is anticorrelated with precipitation in Ellsworth Land and the Antarctic Peninsula (Hosking et al., 2013; Bertler et al., 2018; Emanuelsson et al., 2018). These differences emphasize the need for high spatial and temporal coverage when reconstructing regional mass balance patterns. With few other ice cores from the Ross Sea region, the RICE accumulation history adds information on past changes in mass balance from an otherwise poorly constrained sector of the Antarctic continent.
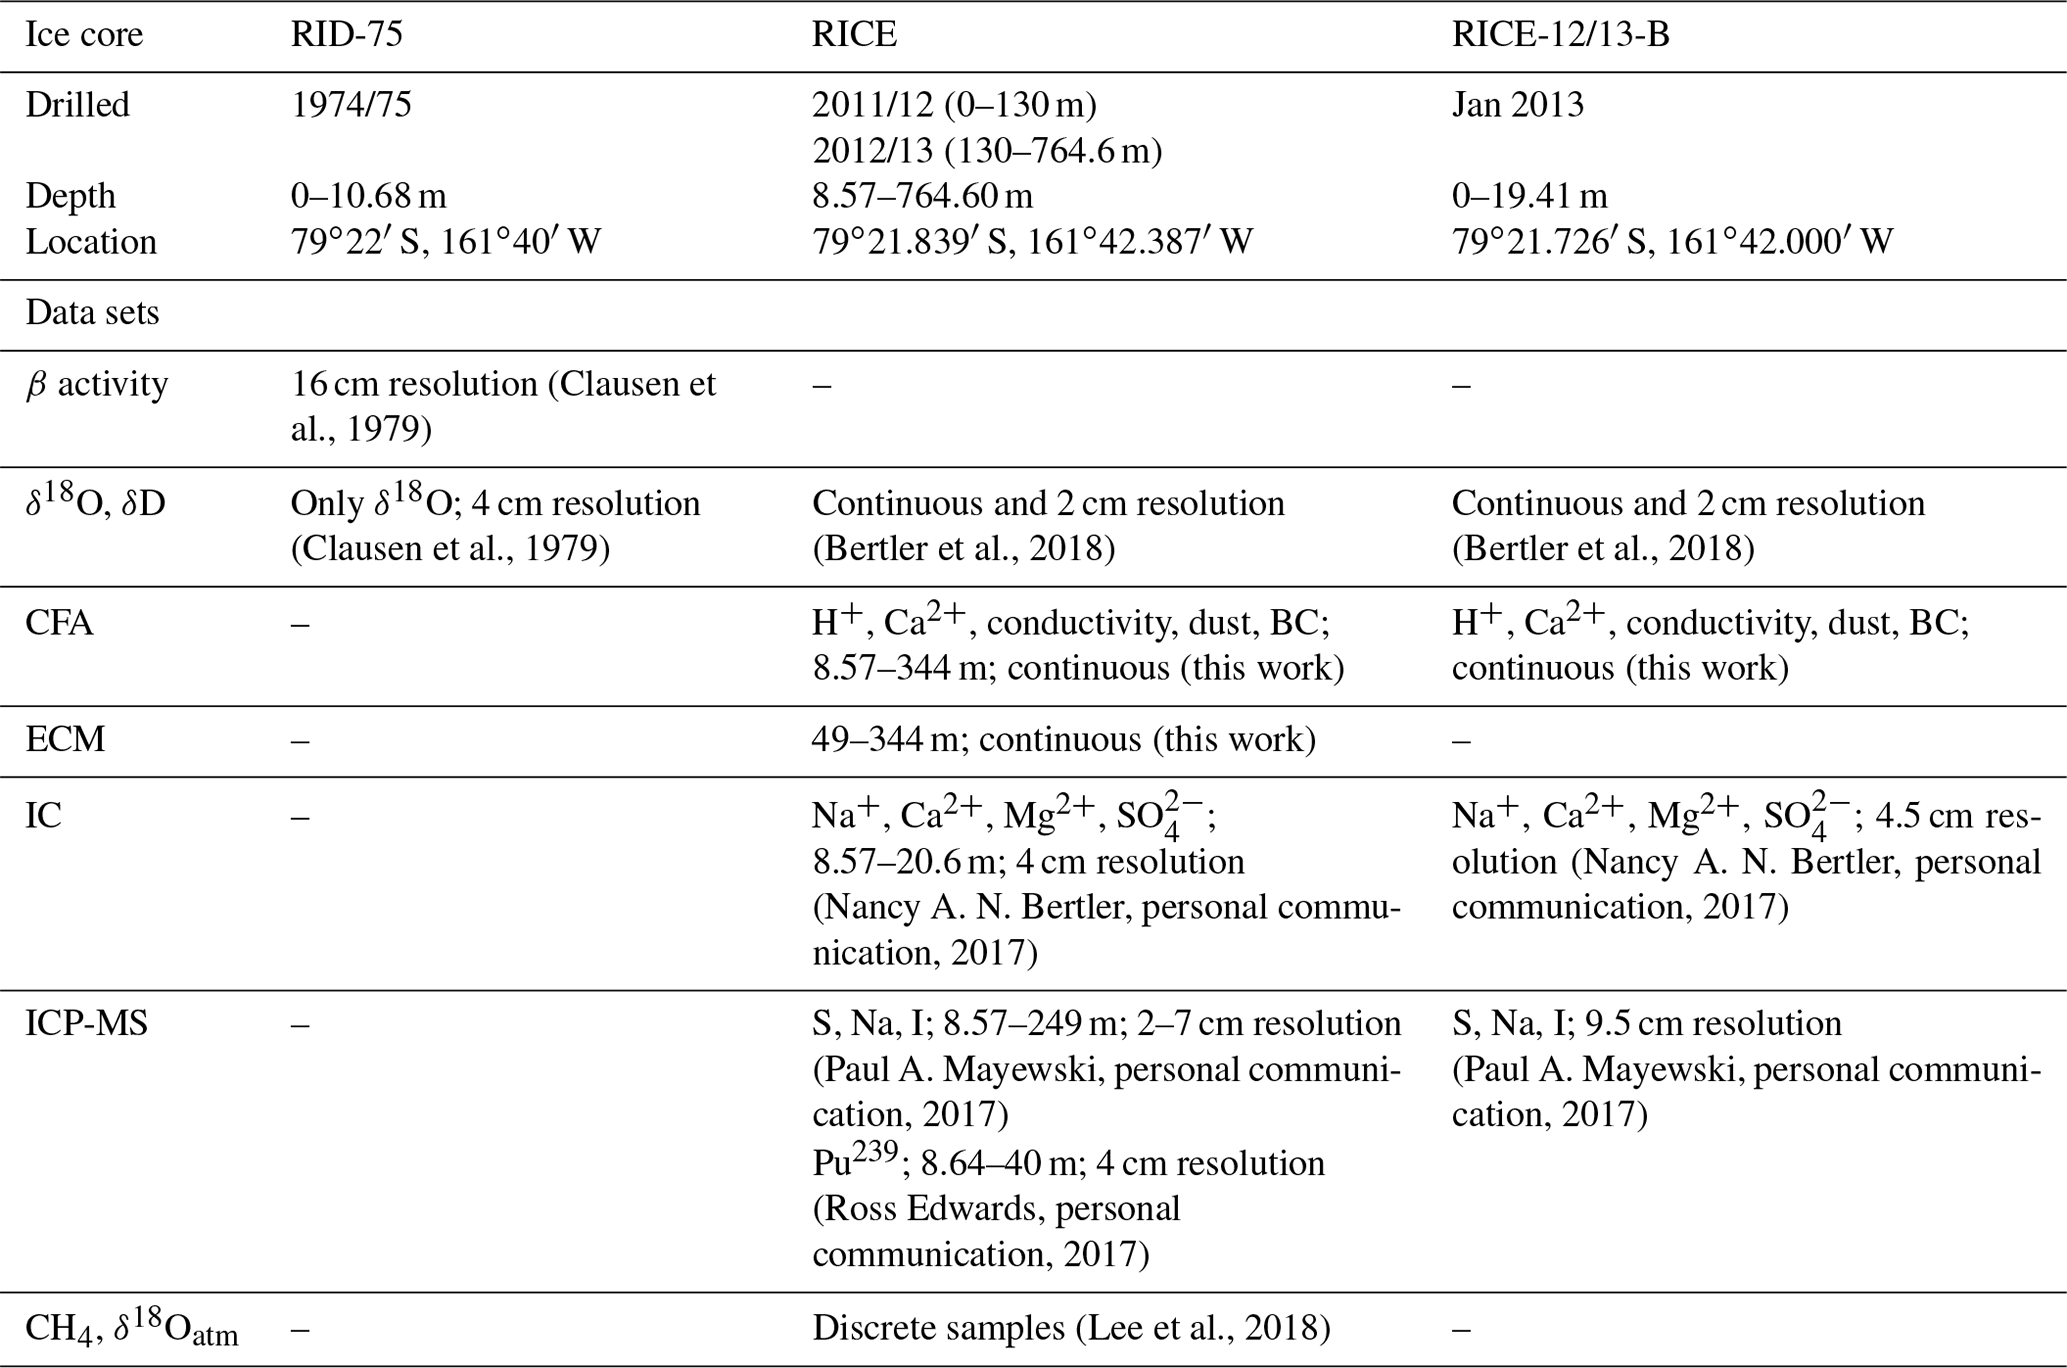
Roosevelt Island is located within the eastern part of the Ross Ice Shelf (Fig. 1), from which it protrudes as an independent ice dome that is grounded 214 m b.s.l. Snow accumulates locally on the ice dome, with ice originating from the Siple Coast ice streams flowing around the island in the Ross Ice Shelf. Geophysical and glaciological surveys across Roosevelt Island in the 1960s established ice thickness, surface topography, surface velocity, and accumulation rate (Bentley and Giovinetto, 1962; Clapp, 1965; Jiracek, 1967). The island was revisited during 1974–1975 as part of the Ross Ice Shelf Project. During this project, shallow cores (up to 70 m) were collected across the ice shelf (Clausen and Dansgaard, 1977), including two firn cores from Roosevelt Island summit (Clausen et al., 1979). The shortest (11 m) firn core from near the summit was measured for water isotopes and total β activity in high resolution; we refer to it here as RID-75 (Table 1). Results from the shallow cores show that seasonal signals of stable isotopes and ionic chemistry are well preserved in the ice (Langway et al., 1974; Clausen et al., 1979; Herron and Langway, 1979).
Table 1The Roosevelt Island ice- and firn-core records used in this study.
Ice-penetrating radar surveys of Roosevelt Island that took place in 1997 revealed a smoothly varying internal stratigraphy of isochronal reflectors (Conway et al., 1999). There was no evidence of disturbed internal layering that would indicate high strain rates or buried crevasses, suggesting the summit of the island to be a good place for an ice core. Of special interest was a distinctive arching pattern of the internal layers beneath the divide. This pattern has implications for the ice history, since isochronal layers arch upward beneath divides that are stable and frozen at the bed (Raymond, 1983). Analyses of the geometry of the internal layering indicate that the current divide-type ice-flow regime started about 3000 years ago (Conway et al., 1999; Martín et al., 2006), and it has thus been in existence throughout the time period investigated in this paper. Combined with recently measured vertical ice velocity profiles across the ice divide (Kingslake et al., 2014), the stability of the ice-flow regime at Roosevelt Island facilitates the interpretation of past accumulation rates from annual layers in the RICE ice core.
The RICE deep ice core was drilled at the summit of Roosevelt Island (79.364∘ S, 161.706∘ W; 550 m a.s.l.; Bertler et al., 2018), and it is located less than 1 km from the old RID-75 shallow core. It was drilled in the austral summers of 2011/12 and 2012/13. During the first season, the core was dry-drilled down to 130 m, and then the borehole was cased. An ESTISOL 240–COASOL drilling fluid mixture was used to maintain core quality during the second drilling season. The ice thickness is 764.6 m. The upper 344 m of the core spans the past 2700 years, the period for which an annual-layer-counted timescale can be constructed. In addition to the deep core, several shallow cores were drilled in the vicinity. During the 2012/13 field season, a 20 m firn core (RICE-12/13-B) was drilled near the main core, and it was used to extend the records up to the 2012/13 snow surface. Table 1 provides an overview of the relevant firn and ice cores collected at Roosevelt Island. An automated weather station near the RICE drill site recorded mean annual temperatures of −23.5 ∘C over the duration of the RICE project (2010–2014) and an average snow accumulation of approximately 0.20 m w.e. yr−1 (Bertler et al., 2018).
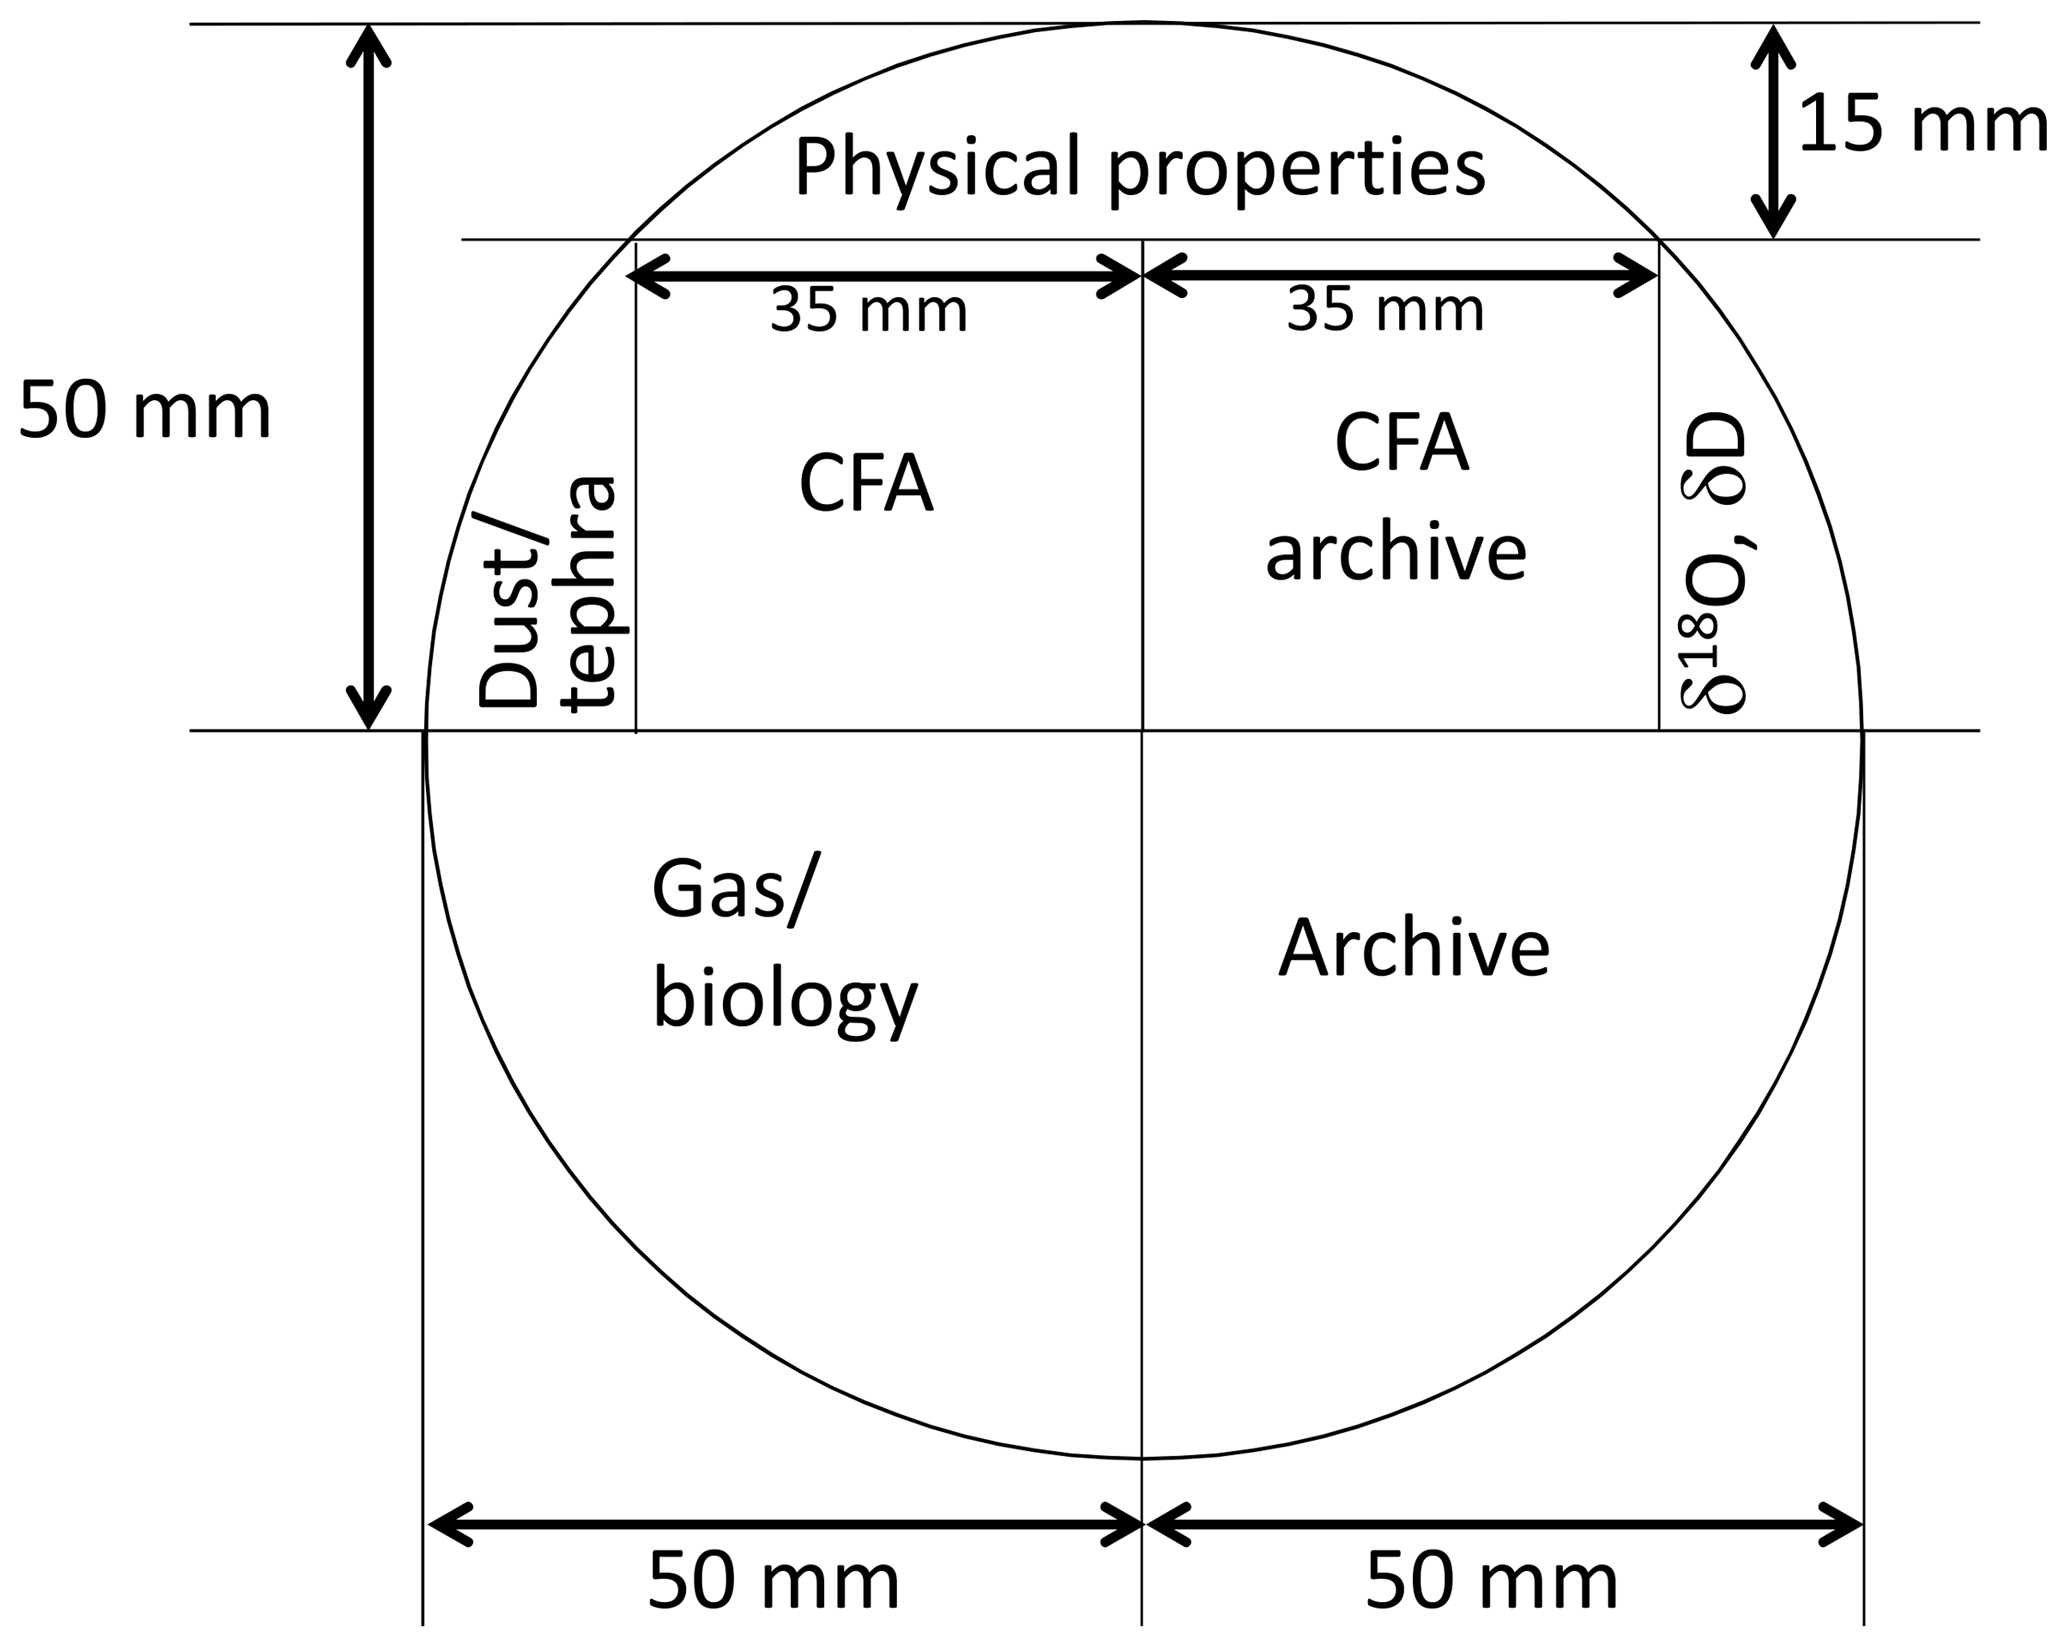
The RICE ice cores were processed and analyzed at the GNS Science National Ice Core Facility in Lower Hutt, New Zealand. The cores were cut longitudinally to produce a 15×35 mm triangular piece for water isotope analysis and two 35×35 mm square sticks for continuous-flow analysis (CFA) (Fig. 2). The second CFA piece was for use in case the core quality of the primary piece was compromised or for repeat measurements to test measurement accuracy and system stability.
In parallel with ice-core cutting and processing, CFA and electrical conductivity measurements (ECM; Hammer, 1980) were carried out. ECM was measured using a low-power handheld instrument from Icefield Instruments Inc. directly on the ice-core surfaces after the initial cutting of the core. In 2012, the uppermost section (8.57–40 m) of the RICE main core was processed and analyzed using the GNS Science melter system, with continuous measurements of stable water isotopes (δD, δ18O) and black carbon, as well as discrete sampling of major ion and trace element concentrations. The following year, this setup was replaced by an expanded version of the Copenhagen CFA system (Bigler et al., 2011), providing high-resolution continuous measurements of liquid conductivity, calcium (Ca2+), insoluble dust particles, acidity (H+), and black carbon (BC), as well as stable water isotopes (δD, δ18O) and methane gas concentrations (Table 1). The RICE-12/13-B firn core was analyzed using this system. Next, the RICE main core was melted and analyzed from 40 to 475 m, at which depth the ice brittle zone was reached. Subsequent repeat measurements of the top section (8.57–40 m) of the main core were made using the second, parallel CFA stick.
Primary adaptations to the Copenhagen CFA system involved (1) depth assignment via a digital encoder using a 1 s sampling rate (Keller et al., 2018), (2) continuous analysis of stable water isotopes (δ18O, δD) using a Los Gatos Research (LGR) analyzer (Emanuelsson et al., 2015), (3) black carbon analysis by a single-particle soot photometer (Droplet Measurement Technologies, Boulder, CO; DMT SP2) following the method reported by McConnell et al. (2007), (4) acidity measurements based on direct registration of H+ concentrations using an optical dye method (Kjær et al., 2016), (5) continuous methane concentration analysis using a Picarro cavity ring-down spectroscopy (CRDS) instrument (Stowasser et al., 2012), and (6) inclusion of three fraction collectors for discrete sample analyses by, respectively, ion chromatography (IC), inductively coupled plasma–mass spectrometry (ICP-MS), including measurements of 239Pu using an ICP-SFMS technique (Gabrieli et al., 2011), and measurements of stable water isotopes on the LGR. Figure 3 shows a diagram of the CFA system setup.
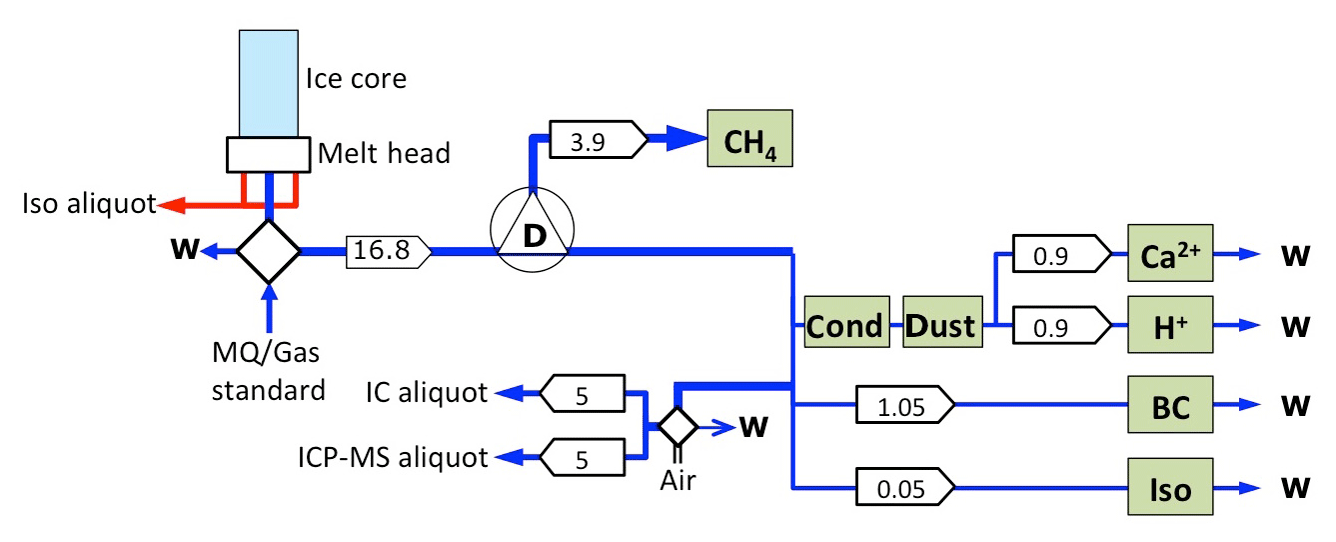
Figure 3The RICE CFA setup. A 1 m long ice-core rod (light blue) is placed on a melt head, which separates meltwater from the pristine inner part of the core from that of the more contaminated outer rim. Meltwater from the outer stream (red) is used for discrete measurements of water isotopes, while the meltwater stream from the inner core section (dark blue) passes through a debubbler (D), which separates air from the meltwater. The air composition is analyzed for methane concentration, while the meltwater stream is channeled to various analytical instruments for continuous impurity analysis of dust, conductivity (cond), calcium (Ca2+), acidity (H+), black carbon (BC), and water isotopes (Iso), as well as collected in vials for discrete aliquot sampling by IC and ICP-MS. W denotes wastewater. Diamonds represent injection valves used for introduction of air or water standards when the melter system is not in use. Arrow boxes indicate liquid flow rates in mL min−1. Green boxes represent analytical instruments.
The ice was melted at a rate of 3 cm min−1, producing approximately 16.8 mL of contamination-free water and gas mixture per minute of melting. Air bubbles were separated in a debubbler, dried, and sent to the Picarro CRDS instrument for methane analysis. Each minute, 5 mL of meltwater was directed to each of two fraction collectors (IC and ICP-MS aliquots) and 1.1 mL was used for continuous measurements of water isotopes (0.05 mL) and black carbon (1.05 mL) by the LGR and DMT SP2 instruments. The remaining 1.8 mL was sent to flow-through liquid conductivity and insoluble particle analyzers (Bigler et al., 2011) and then split for continuous analysis of soluble calcium (Traversi et al., 2007) and acidity (Kjær et al., 2016). A third fraction collector was used to collect discrete samples for water isotopes from the melt-head overflow lines originating from the outer core section, these being used for quality assurance of the continuous measurements.
On average, 20 m of ice were melted during a 24 h period, including measurements, calibrations, and routine maintenance. Calibrations for water isotopes, calcium, acidity, and black carbon were carried out before and after each melting run, which comprised the continuous analysis of 3×1 m long ice rods. Calibrations for methane, based on standard gases with methane concentrations corresponding to glacial and preindustrial Holocene levels, were carried out twice daily. Core breaks and/or contamination in the system caused some sections of missing data. The percentage of affected core varied between chemistry species, ranging from < 1 % (BC) to 17 % (H+) (see Table S1 in the Supplement), the majority being small sections of missing data that did not severely impact annual-layer interpretation.
The CFA chemistry records were very densely sampled (one data point per millimeter). Mixing in the tubing as the meltwater sample traveled from the melt head to the analytical systems caused individual measurements to be correlated, and hence the effective depth resolution of the system was significantly less than the sampling resolution. This was particularly important for the RICE CFA setup owing to the relatively small fraction of total meltwater directed to the continuous measurement systems. Following the technique used in Bigler et al. (2011), the effective depth resolution for the CFA measurements ranged from 0.8 cm (conductivity) to 2.5 cm (Ca2+) (Table S1).
The Roosevelt Island Ice Core Chronology 2017, RICE17, was constructed using multiple approaches, as necessitated by the changing properties and the availability of data with depth. Here we describe the methodology used to construct the most recent 2700 years of RICE17, the period for which annual-layer identification was feasible. For the deeper part of the core, RICE17 was constructed by gas matching to the WAIS Divide ice core on the WD2014 chronology, as reported in Lee et al. (2018).
4.1 Overview of the annual-layer-counting strategy
The uppermost section (0–42.34 m) of the core was dated by manual identification of annual cycles in records of water isotopes and chemical impurities from the RICE main core as well as the RICE-12/13-B shallow core. For this most recent period, several distinct marker horizons from well-known historical events were used to constrain the chronology (Sect. 4.2).
Below 42.34 m (1885 CE), the timescale was augmented using the StratiCounter layer-counting algorithm (Winstrup et al., 2012; Winstrup, 2016) applied to multiple CFA impurity records from the RICE main core (Sect. 4.3). A previously dated tephra layer at 165 m (Pleiades; 1251.6±2 CE according to WD2014) was used to optimize the algorithm settings, but other than that, RICE17 is a fully independent layer-counted ice-core chronology.
The layer-counted part of RICE17 stops at 343.72 m (700 BCE). At this depth, the annual layers became too thin (< 6 cm, i.e., fewer than eight independent data points per year in the best-resolved records) for reliable layer identification in data produced by the RICE CFA setup. The timescale was extended back to 83 000 years BP using the gas-derived timescale, which covers the entire core with lower resolution (Lee et al., 2018). Excellent agreement (±3 years) between the layer-counted timescale and the independent gas-derived age at 343.7 m allows us to produce the combined Roosevelt Island Ice Core Chronology 2017 (RICE17) by joining the the two without any further adjustments.
4.2 Manual layer interpretation with historical constraints (0–42.34 m; 2012–1885 CE)
The top 42.34 m of the RICE17 chronology was obtained by manually counting annual layers in the combined set of discretely measured IC and ICP-MS data, when available, as well as the continuous water isotope and chemistry records produced by the RICE CFA system. The RICE main core starts at 8.65 m of depth, so the top part of the timescale is based exclusively on the RICE-12/13-B shallow core. At 12.5 m, both cores display a distinct peak in their isotope profiles, showing that they can be spliced directly without the need for any depth adjustments. Layer marks for the top 12.5 m were placed according to the RICE-12/13-B shallow core; lower layer marks refer to the main core. In the overlap section (8.65–19.55 m), we used the combined data set from both cores to reduce the risk of timescale errors caused by core breaks or bad data sections.
Layer identification in this section of the core relied predominantly on annual signals in non-sea-salt sulfate (nss ), acidity (H+), and iodine (I), as these records displayed the most consistent annual signals (Fig. 4). Extreme sea-salt influx events occasionally caused large sulfate peaks, necessitating the removal of the sea-salt sulfate fraction before layer identification. For the top 20 m, the water isotope records also significantly strengthened the annual-layer interpretations. Smoothing due to the diffusion of water molecules in the firn, however, caused the annual signal in the water isotope records to diminish with depth, resulting in a loss of annual signals below 20 m.

Figure 4Manual assignment of annual layers in an upper section of the RICE core. All units are in ppb, except for δ18O (in ‰), H+ (in µeq L−1), and conductivity (in µS cm−1). The CFA chemistry records are smoothed with a 3 cm moving-average filter. The timescale is constrained by two tie points within this interval: the isotope match to RID-75 (blue bar; 14.6 m) and the Raoul tephra horizon (red bar; 18.1 m). At two locations, the annual layering is unclear (shorter bars) but can be mostly resolved based on the tie-point ages. As a result, the uncertain layer at 16.6 m (short grey bar) is included as a year in the timescale, whereas the uncertain layer at 19.7 m (short white bar) is not. For the second layer, the sulfate record suggests that it is an annual layer, but this is not supported by iodine and δ18O. As we assume an uncertainty of ±1 year for the tie-point ages, the layer at 16.6 m could possibly be removed from the timescale while still adhering to the age constraints. The existence of this uncertain layer therefore gives rise to a 1-year increase in the timescale uncertainty.
Summers could be identified as periods with high stable water isotope ratios, high concentrations of nss and associated acidity (originating from phytoplankton activity in the surrounding ocean during summer; Legrand et al., 1991; Udisti et al., 1998), and low iodine concentrations (due to summertime photolysis of iodine in the snowpack; Frieß et al., 2010; Spolaor et al., 2014). Layer marks were placed according to the depths of concurrent summer peaks in water isotope ratios, nss concentrations, and acidity levels and assigned a nominal date of 1 January.
The uppermost 42.34 m of the RICE17 chronology was tied to several identifiable marker horizons found in the ice-core records relating to well-known historical events (Sect. 4.2.1–4.2.3; Table 2). The timescale was obtained by identifying the most likely set of annual layers while accounting for age constraints from marker horizons (Fig. 4). We conservatively estimated the age uncertainty of the marker horizons to be ±1 year, thereby allowing for some uncertainty in the timing of deposition of, e.g., volcanic material. We further kept track of uncertain layers (i.e., layers that could possibly be added to or removed from the most likely set of layers while still adhering to the age constraints), thereby producing an uncertainty estimate for the timescale. We interpret it as the 95 % confidence interval for the age at a given depth, similar to that obtained from automated layer identification deeper in the core (Sect. 4.3).
4.2.1 The 1974/75 snow surface
The uppermost age constraint was established by successfully matching the RICE water isotope profile to that from the RID-75 firn core (Fig. 5). Drilled in austral summer 1974/75, the snow surface in RID-75 provided the first tie point for the RICE17 chronology at a depth of 14.62 m (Table 2).
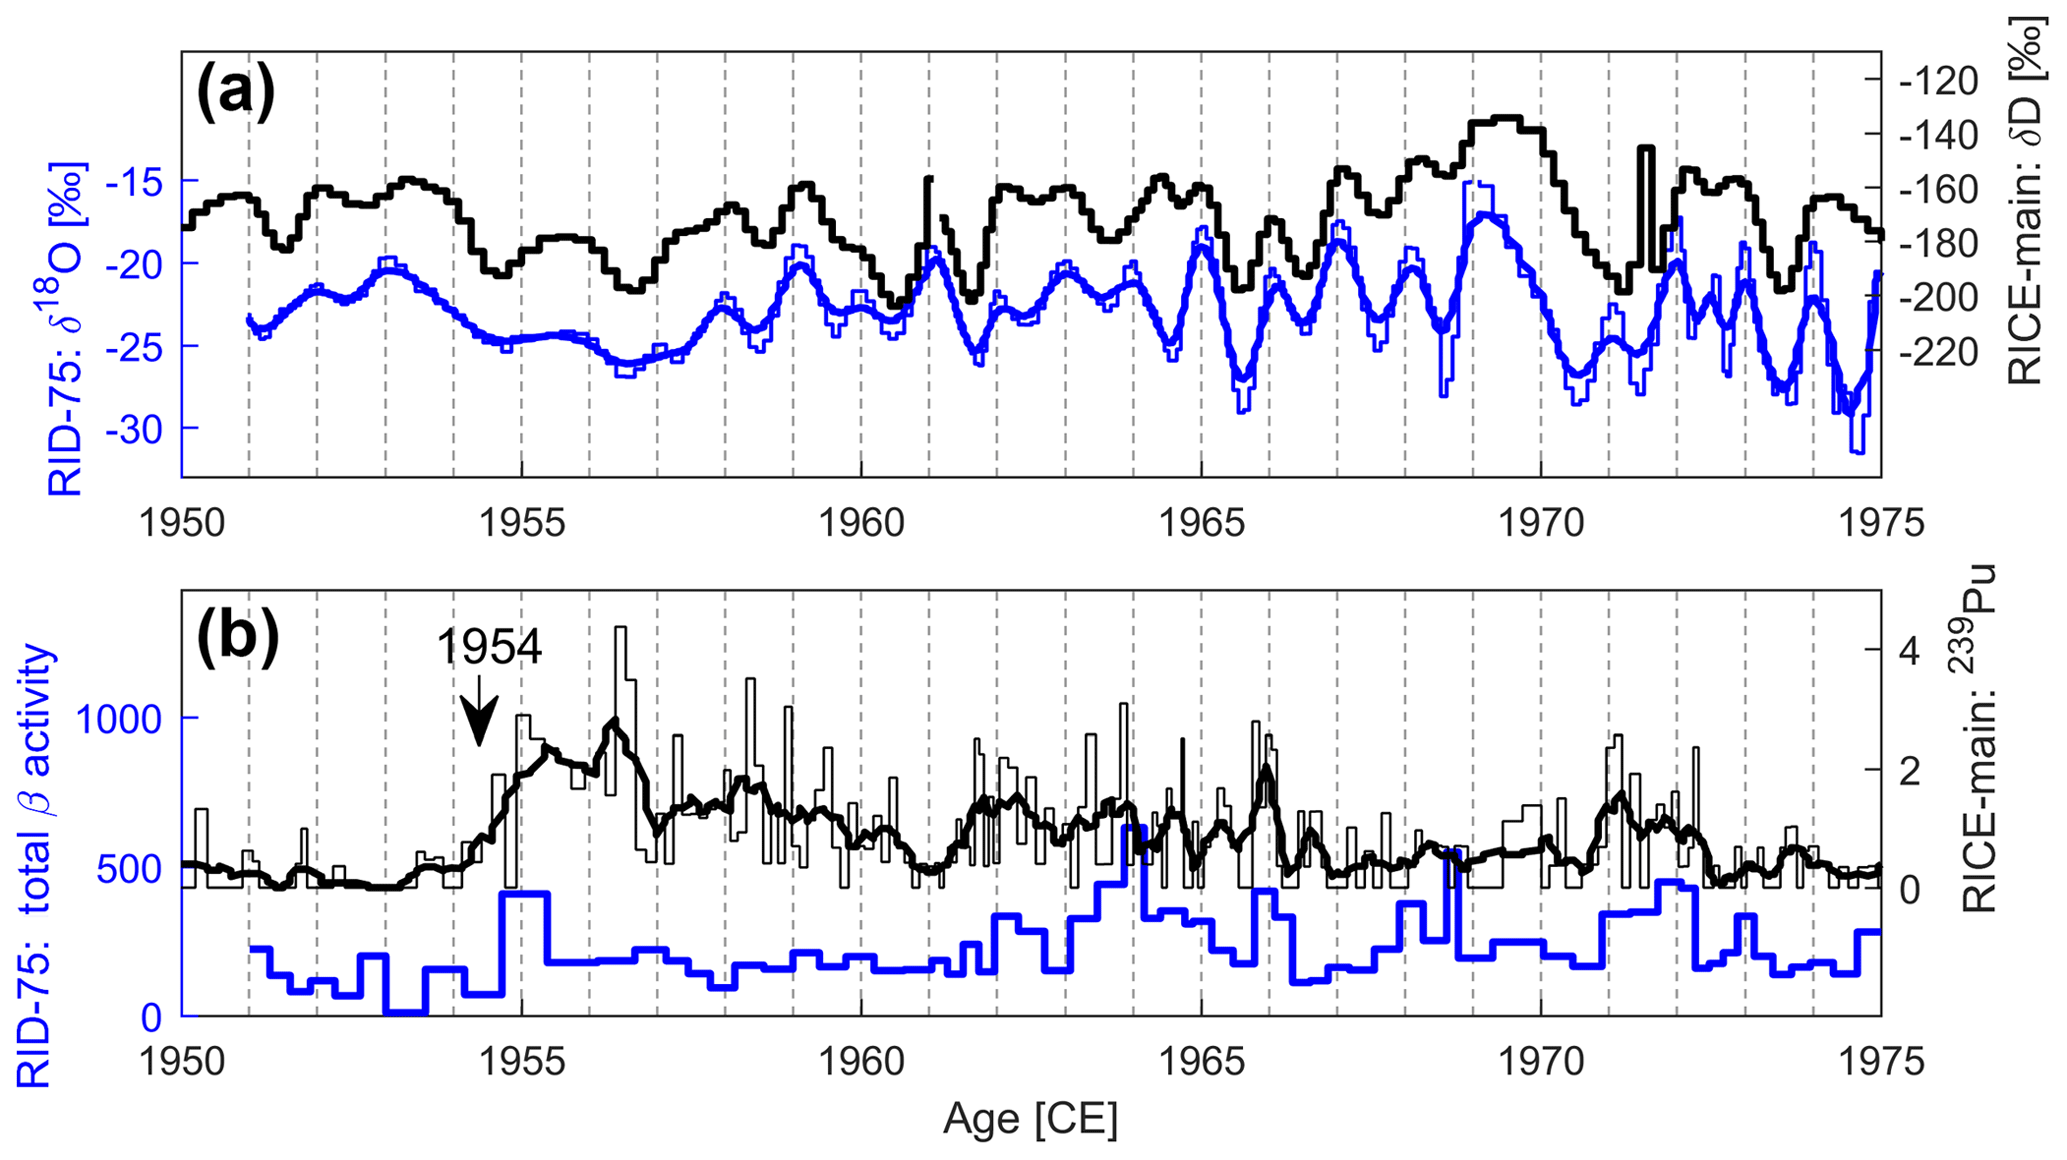
Figure 5(a) RICE water isotope profile (δD) compared to isotope data (δ18O) from the RID-75 core for the period 1950–1975. Diffusion causes the isotope record to smooth over time, and a smoothed version of the RID-75 isotope profile (thick blue) highlights its similarities to the RICE isotope record (black). (b) Total specific β activity (in disintegrations per hour, dph) for the RID-75 core compared to 239Pu measurements (normalized intensities) from the RICE main core. Both cores show a sharp increase in nuclear waste deposition starting in 1954 CE and several broader peaks hereafter.
4.2.2 Nuclear bomb peaks
High-resolution 239Pu measurements on the upper part of the RICE core show a significant rise in plutonium levels, starting from very low background levels at 22 m and reaching peak values at 21.6 m. This increase can be attributed to atmospheric nuclear bomb testing during the Castle Bravo Operation, Marshall Islands, in March 1954, which globally caused large amounts of nuclear fallout over the following year (e.g., Arienzo et al., 2016).
Total specific β-activity levels in the RID-75 core show the same evolution (Clausen et al., 1979), confirming both the isotopic matching between the two cores and the age attribution of this event (Fig. 5). The abrupt increase in 239Pu fallout at 22 m was used as an age constraint for the RICE17 chronology (Table 2). Subsequent peaks in the 239Pu and β-activity records can be attributed to successive nuclear tests and subsequent test ban treaties. These changes were much less distinct and were not used during development of the timescale.
4.2.3 Recent volcanic eruptions
A couple of volcanic horizons in RICE during this most recent part could be related to well-known volcanic eruptions. Rhyolitic tephra located between 18.1 and 18.2 m was found to have a geochemical composition similar to a tephra layer found in the WAIS Divide core deposited in late 1964 CE (Wheatley and Kurbatov, 2017). The tephra likely originates from Raoul Island, New Zealand, which erupted from November 1964 to April 1965. This is consistent with the RICE17 chronology, according to which the tephra is located in early 1965 CE (Table 2).
Only two volcanic eruptions could be unambiguously identified in the acidity records over this period: the historical eruptions of Santa Maria (1902 CE; 37.45 m) and Krakatau (1883 CE; 42.34 m) (Table 2). These two horizons were used to constrain the deeper part of the manually counted interval of RICE17, which terminates at the Krakatau acidity peak. The deposition age of volcanic material for these events was assumed identical to those observed in the WAIS Divide ice core (Sigl et al., 2013). Imprints from other large volcanic eruptions taking place during recent historical time, such as Agung and Pinatubo, did not manifest themselves sufficiently in the RICE records to be confidently identified.
4.3 Automated annual-layer identification (42.34–343.7 m; 1885 CE–700 BCE)
For the section 42.34–343.7 m (1885 CE–700 BCE), the RICE17 annual-layer-counted timescale was produced using the StratiCounter algorithm (Winstrup et al., 2012), extended to interpret the annual signal based on multiple chemistry series in parallel (Winstrup, 2016).
StratiCounter is a Bayesian algorithm built on machine-learning methods for pattern recognition using a hidden Markov model (HMM) framework (Rabiner, 1989; Yu, 2010). StratiCounter computes the most likely timescale and the associated uncertainty by identifying annual layers in overlapping data batches stepwise down the ice core. For each batch, the layering is inferred by combining prior information on layer appearance with the observed data, thereby obtaining a posteriori probability distributions for the age at a given depth. The output of StratiCounter is the most likely annual timescale, along with a 95 % confidence interval for the age as a function of depth. The confidence interval assumes the timescale errors to be unbiased, implying that uncertainties in layer identification partly cancel out over longer distances. Previous research has documented the skill of StratiCounter to produce accurate and unbiased layer-counted ice-core timescales (e.g., Sigl et al., 2015; Winstrup, 2016).
StratiCounter was applied to the full suite of CFA records: black carbon, acidity, insoluble dust particles (42.3–129 m), calcium, and conductivity. See Sect. S2 in the Supplement for the specifics of the algorithm setup. Figure 6 shows three depth sections of CFA data and resulting layer counts. Annual cycles in the high-resolution black carbon record became more distinct prior to 1900 CE, and it was one of the most reliable annual proxies in the core. As observed in the topmost part of the core, acidity also displayed an annual signal, although the lower effective depth resolution of the acidity record (Table S1) made it less useful with depth. The calcium and conductivity records frequently displayed multiple peaks per year but contained complementary information to the other proxies and were hence also useful for layer identification (Fig. 6). From 0 to 129 m, an irregular annual signal was also observed in the insoluble particle record, but data below 129 m were corrupted by the presence of drill fluid in the CFA system, which forced us to exclude the deeper part of this record. The discretely sampled ICP-MS data records did not have sufficient resolution to resolve annual layers.
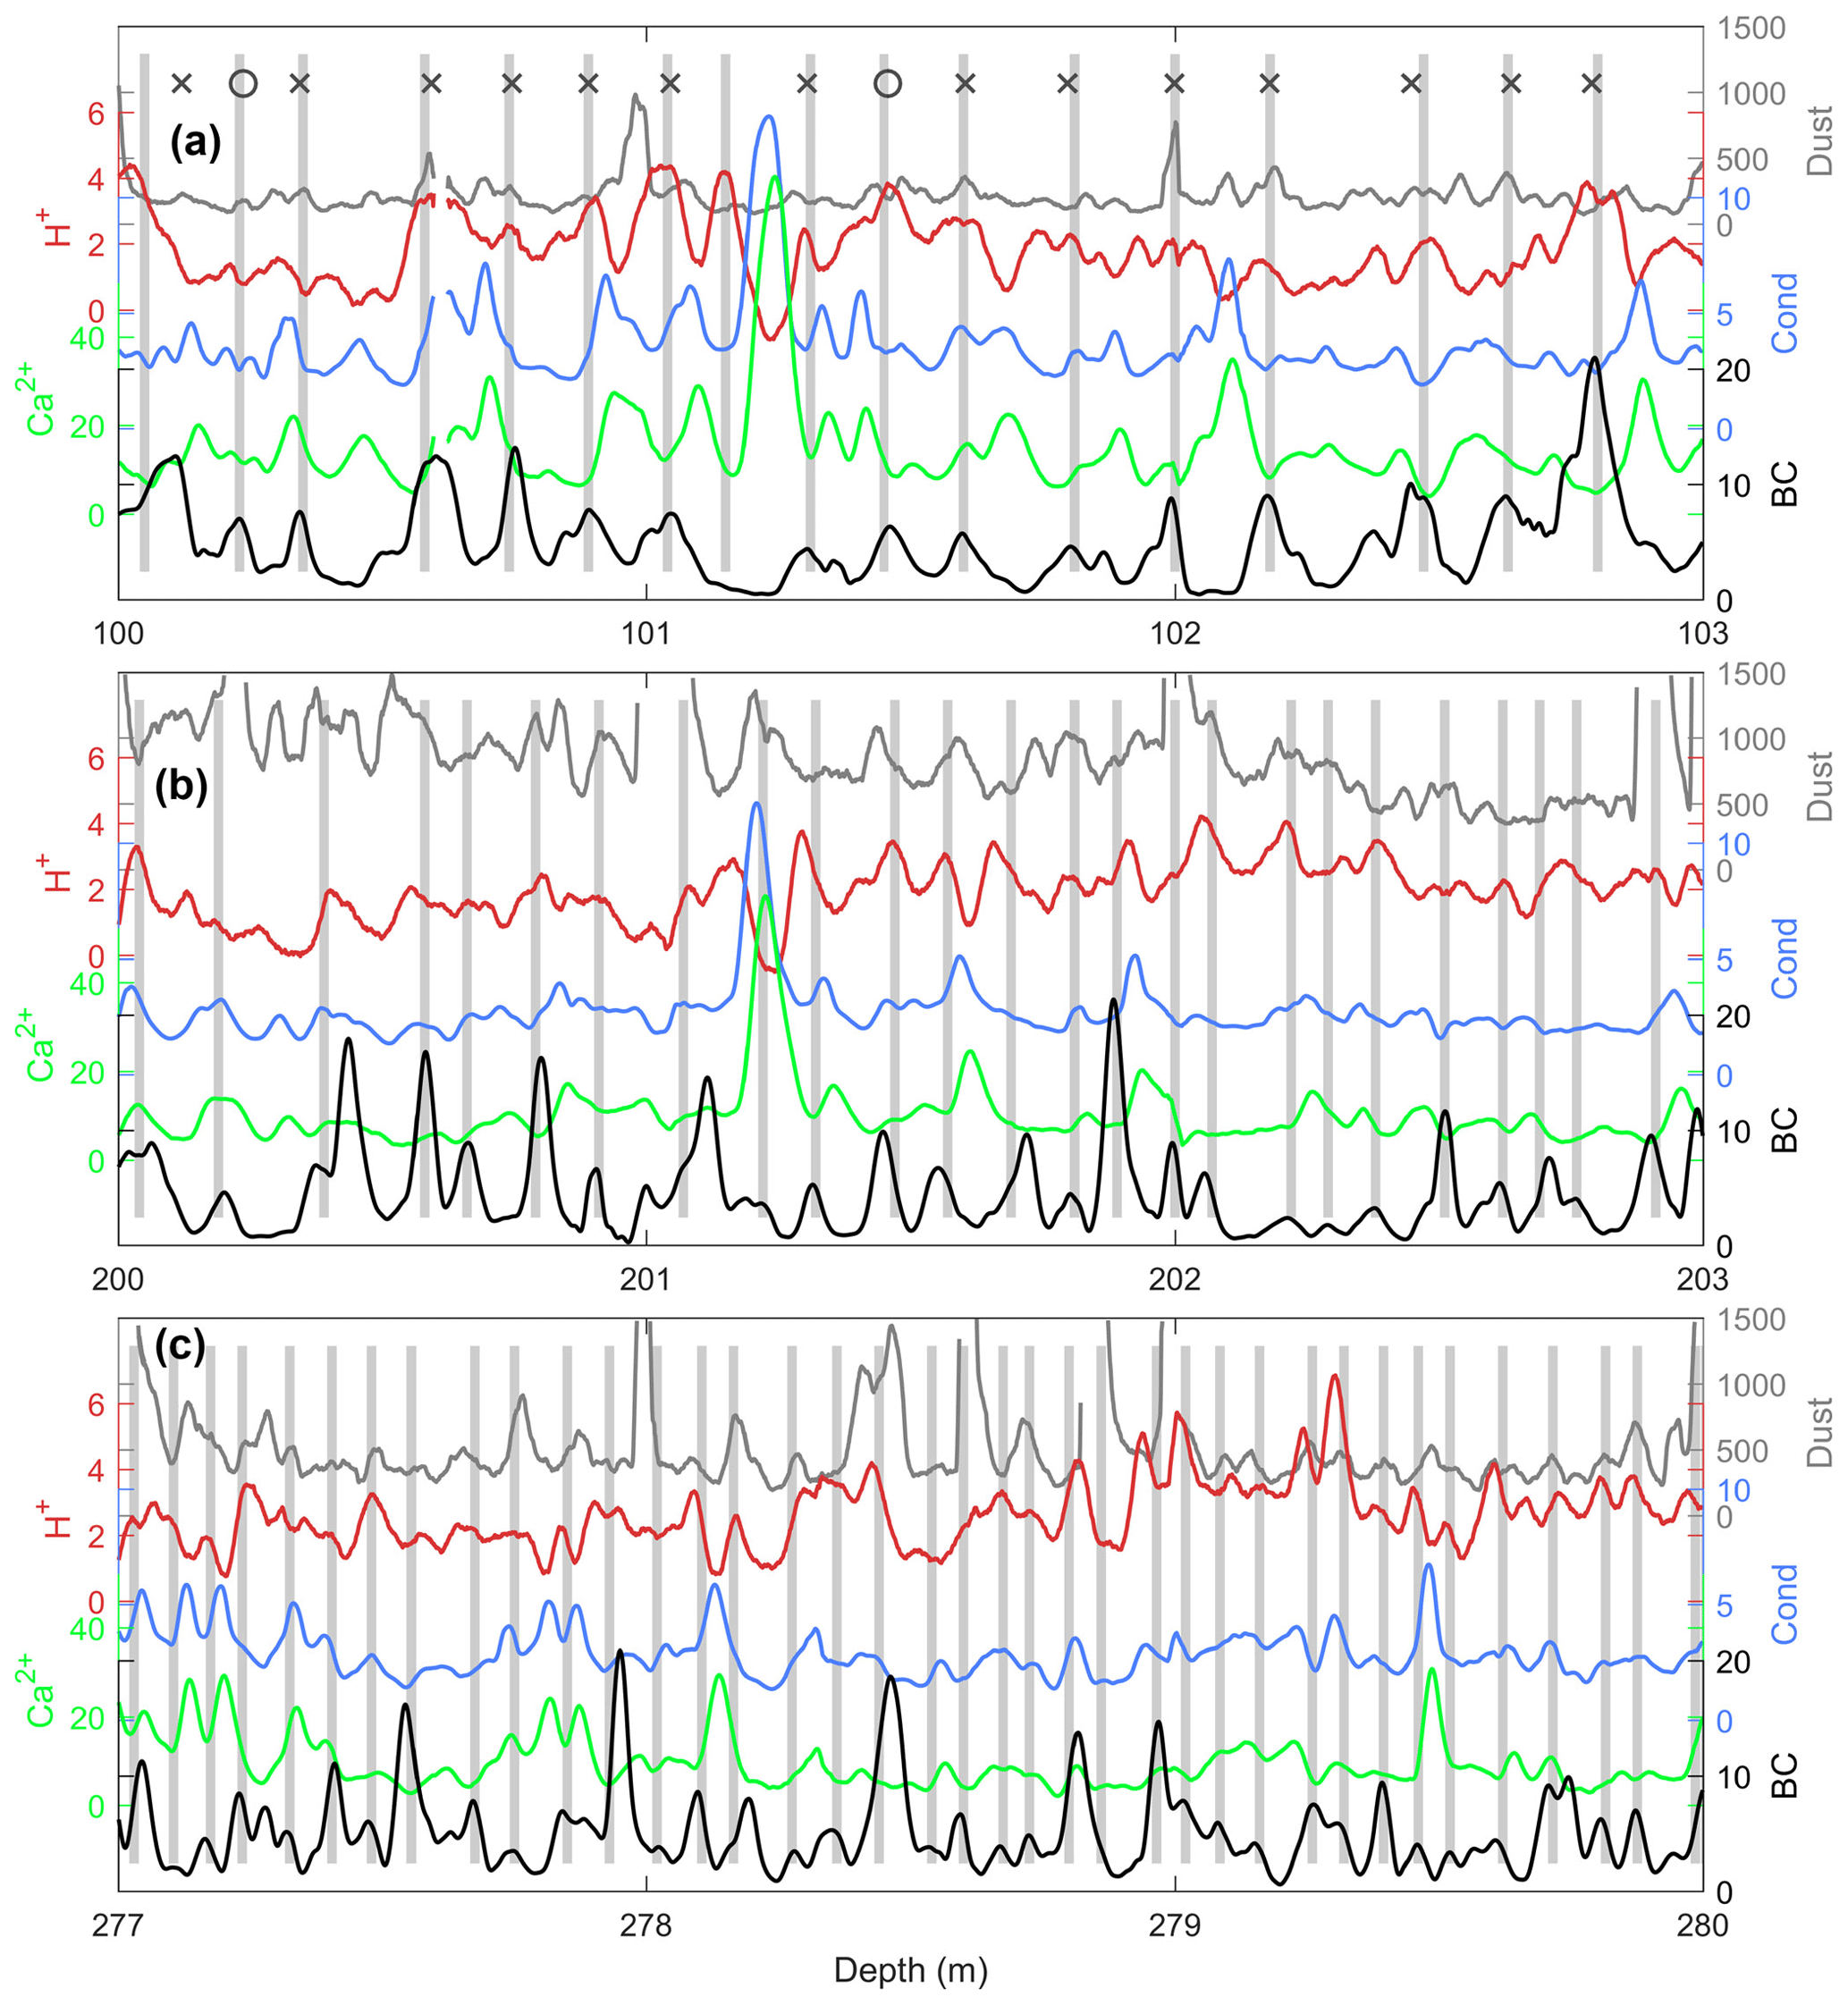
Figure 6CFA data and StratiCounter annual-layer counts (grey bars) in three 3 m long sections (a–c) of the RICE core. In general, the most distinct annual signal is found in the BC record, but the other records also contain valuable information on the annual layering. Due to contamination from drill fluid, the dust record was not used for layer counting below 129 m. For the top section (a), the preliminary set of manual layer counts used for initializing StratiCounter are shown: crosses (x) indicate certain layers and circles (o) indicate uncertain layers. For this section, the manual layer counts have a bias towards counting too few layers in total. This is a general tendency of the manual timescale, resulting in a manually counted age for the Pleiades tephra that is a few decades younger than observed in WAIS Divide.
Decreasing layer thicknesses caused the annual signal in the impurity records to become increasingly difficult to identify with depth, and the layer-counted timescale stops at 343.7 m (700 BCE).
The accumulation rate history at Roosevelt Island can be inferred from depth profiles of annual-layer thicknesses in the RICE core when corrected for firn densification and thinning of layers due to ice flow.
5.1 Changes in density with depth
Bag-mean densities were measured on the main RICE core for the interval 8–130 m, at which depth ice densities were reached (see Sect. S3 in the Supplement). A steady-state Herron–Langway density model (Herron and Langway, 1980) was used to extend the density profile to the surface. Using observed values for initial snow density (410 kg m−3), surface temperature (−23.5 ∘C), and accumulation rate (0.22 m w.e yr−1), the modeled density profile fits the observed values well, especially for the top 50 m (Fig. S1 in the Supplement). At 8 m of depth, the model agrees with the measured values, providing a smooth transition between observed and modeled densities.
5.2 Thinning of annual layers due to ice flow
To obtain past accumulation rates, the annual-layer thickness profile must be corrected for the cumulative effects of ice flow on the thickness of an ice layer since it was deposited at the surface (this being the ice equivalent accumulation rate at that time). The observed layer thickness relative to its initial thickness as a function of depth, i.e., the “thinning function”, depends on the history of vertical strain at the core site. The vertical strain rates can vary significantly over short distances near ice divides, with near-surface ice flow being more compressive at the divide than at the flanks (Raymond, 1983). As a result, the divide flow causes an upward arch in the internal layers beneath stable ice divides. This is termed a Raymond arch, and one is present beneath the Roosevelt Island ice divide (Fig. 7c; Conway et al., 1999). The vertical strain pattern was measured across Roosevelt Island (Kingslake et al., 2014) using repeat measurements of phase-sensitive radar (pRES). These measurements show significant spatial variation in the vertical velocity pattern and provide important constraints for developing the RICE thinning function.
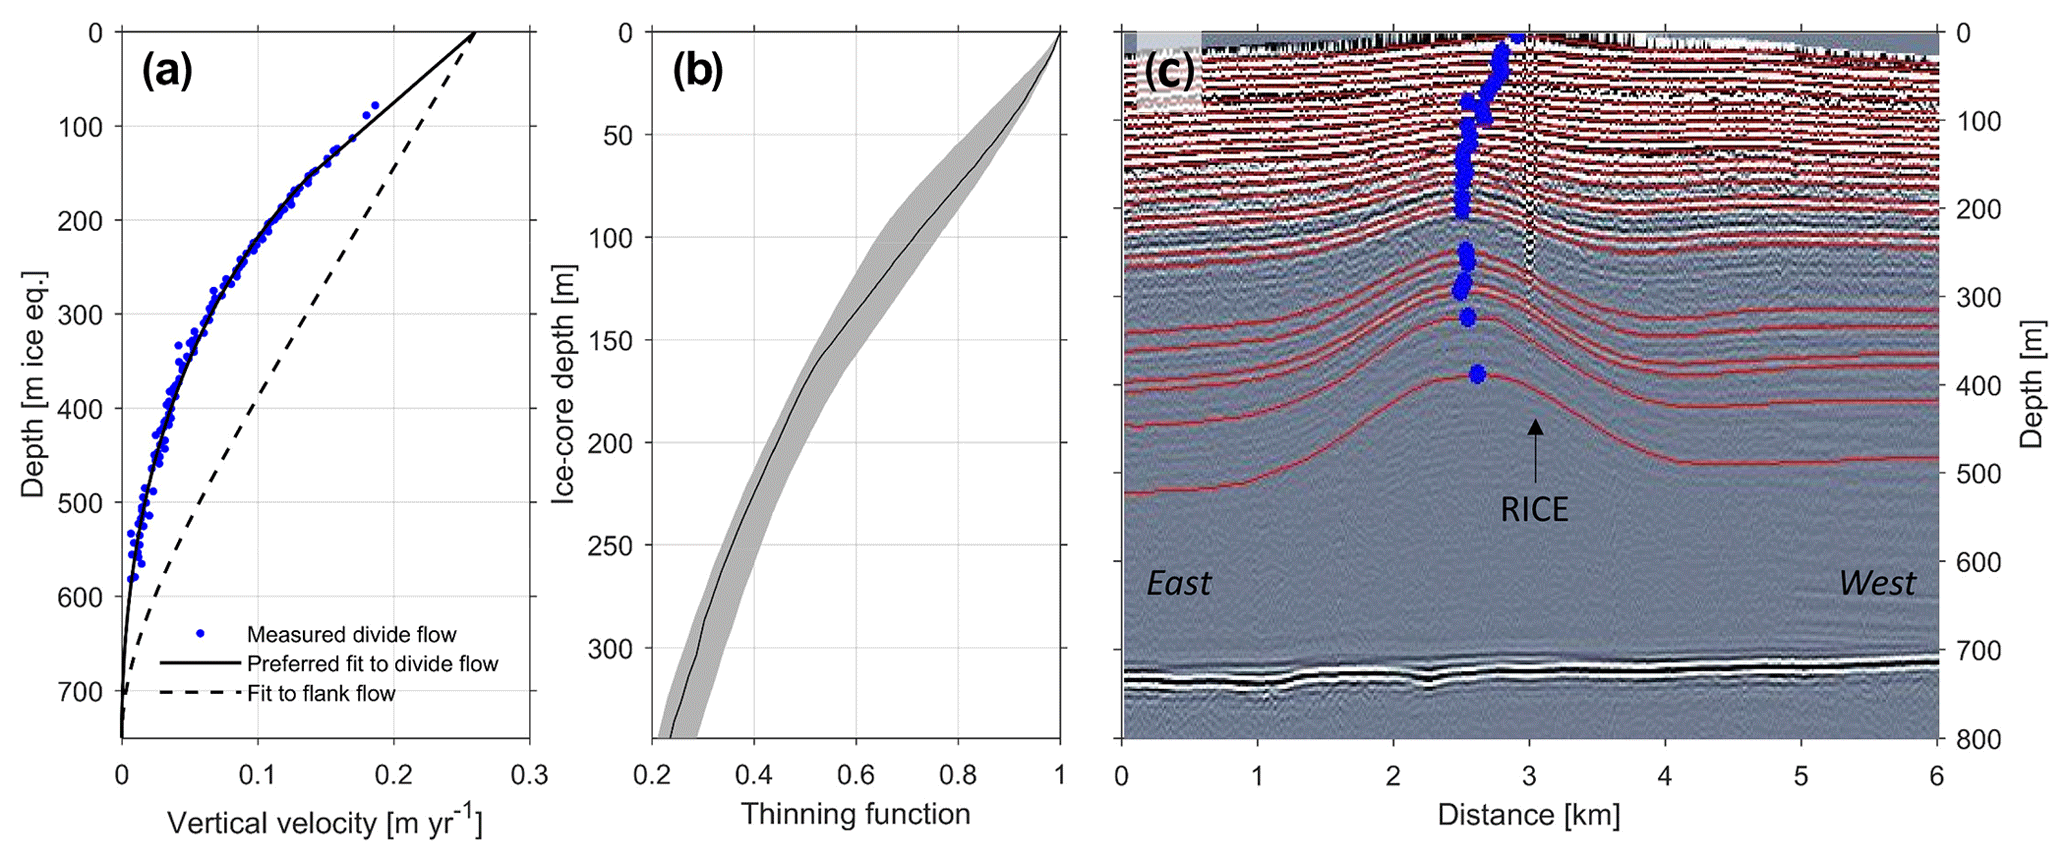
Figure 7(a) Vertical velocity profiles for divide-like flow and flank flow (Kingslake et al., 2014). For divide flow the preferred Lliboutry fit is plotted along with the measured vertical velocities (blue dots). (b) Thinning function with associated 95 % confidence interval. (c) Radar echogram (Kingslake et al., 2014) with traced layers (red) and location of maximum amplitudes of the stack of Raymond arches (blue circles). The location of the modern topographic ice divide (and the RICE drill site) is marked by the returns from a pole. The core site is located west of the maximum bump amplitudes at depth.
The RICE ice core was drilled at the topographic summit of Roosevelt Island. The shallowest layers in the Raymond arch peak below the current summit, but by mid-depth, the maximum bump amplitude of the arches is offset by approximately 500 m towards the east (Fig. 7c). Following Nereson and Waddington (2002), we interpret this slant in the Raymond arch position as a slight migration of the Roosevelt Island ice divide during recent centuries, with the divide previously being located 500 m east of its present position. The ice core intersects the Raymond arch at mid-depths (∼120 m; ∼1500 CE) at about 70 % of the maximum arch amplitude. Thus, it has experienced a transitional flow regime, i.e., a mixture between pure divide flow and flank flow, for much of the past 2700 years. We consider a recent migration of the ice divide towards its present position to be the most likely scenario, with ice flow at the core site becoming increasingly divide-like over recent centuries. For this scenario, we prescribe the following history of divide migration history: prior to 500 years before 2013 CE, the divide was located 500 m east of its present position. Since then, the divide migrated westward, arriving at its present position 250 years ago. During the migration period, the ice-flow regime linearly transitioned to full divide flow and subsequently remained as full divide flow until present. An alternative, although less likely, scenario is that the location of maximum divide flow has always been offset from the topographic summit, in which case the ice in the core has experienced transitional flow throughout the entire period. The uncertainty of the thinning function associated with the divide history is explained in detail in Sect. S4 in the Supplement.
We used a one-dimensional transient ice-flow model with annual time steps to integrate the vertical strain experienced by an ice layer and thereby track the cumulative layer thinning as a function of time and depth. At each time step, the full-depth vertical velocity profile was found by scaling the shape of the vertical profile (as discussed below) with the surface velocity: the vertical surface velocity was determined as the sum of the time-varying accumulation rate and the rate of change in ice-sheet thickness. The ice-sheet thickness change was prescribed and assumed constant in time. Model iterations were run to get an accumulation history consistent with the cumulative thinning computed by the model.
The shape of the vertical velocity profile was found by fitting an ice-flow parameterization (Lliboutry, 1979) to the measured englacial velocities (Kingslake et al., 2014) corresponding to divide flow and flank flow, respectively (Fig. 7a). Details are given in Sect. S4 in the Supplement. The present vertical velocity profile was constrained to match within uncertainty the current vertical velocity at the surface. During the period of transitional flow, the shape of the vertical velocity profile was taken as a linear combination of the velocity profiles for divide and flank flow, following Nereson and Waddington (2002). We used the relative amplitude of the Raymond arch as indicator for the importance of the two flow regimes, and during the early period of transitional flow, the vertical velocity profile was weighted as 70 % divide-type and 30 % flank-type flow.
Figure 7b shows the resulting thinning function derived for the RICE core site. It decreases from 1.0 at the surface (no strain thinning) to 0.24 at 344 m of depth. Past annual accumulation rates in water equivalents can be calculated as the annual-layer thicknesses divided by the thinning function and multiplied with the firn or ice density.
5.3 Uncertainties in the accumulation history
Uncertainties in the inferred accumulation history originate from three sources: (i) identification of the annual layers; (ii) the density profile; and (iii) the derived thinning function. Since the RICE17 timescale was found to have negligible bias (Sect. 7), average layer thicknesses are also not biased, and uncertainties in accumulation history due to layer identification are minor. Uncertainty associated with the density correction is also small. Hence, except for the uppermost part of the record (with essentially no strain thinning), uncertainty in the thinning function dominates the total uncertainty, and only this factor will be considered here.
At the surface, uncertainty in the thinning function is zero. Increasing uncertainty with depth (Fig. 7b; grey area) arises from (a) a lack of measurements in the upper 90 m of the ice sheet to better constrain the present near-surface vertical velocity, (b) variation of the vertical velocity profile over time as the divide may have migrated, and (c) the amount of ice-sheet thickness change that has occurred. Some of the uncertainty is mitigated by the information contained in the internal layering of the Roosevelt Island ice dome. The amplitudes of the Raymond stack indicate that the onset of divide flow was approximately 3000 years ago (Conway et al., 1999; Martín et al., 2006), i.e., prior to the period considered here, that there has been only modest ice-sheet thinning, and that flow conditions have been relatively stable.
We develop an estimate for the uncertainty by calculating the thinning function using an ensemble of model assumptions: two different parameterizations of the vertical velocity profiles, two assumptions about the divide migration history, and three values of ice-sheet thickness change. See Sect. S4 in the Supplement for an extended discussion. The uncertainty was defined as the full range of these 12 scenarios, which we suggest to be a 95 % confidence interval. The uncertainty of the thinning function is substantial for the older portion of the record as the layers have thinned to a quarter of their initial thickness.
Using the RICE17 timescale, we can quantify the seasonality of impurity influx to Roosevelt Island visible in the RICE CFA records. Figure 8 shows the average seasonal pattern of the various impurities at different depths, assuming constant snowfall through the year.
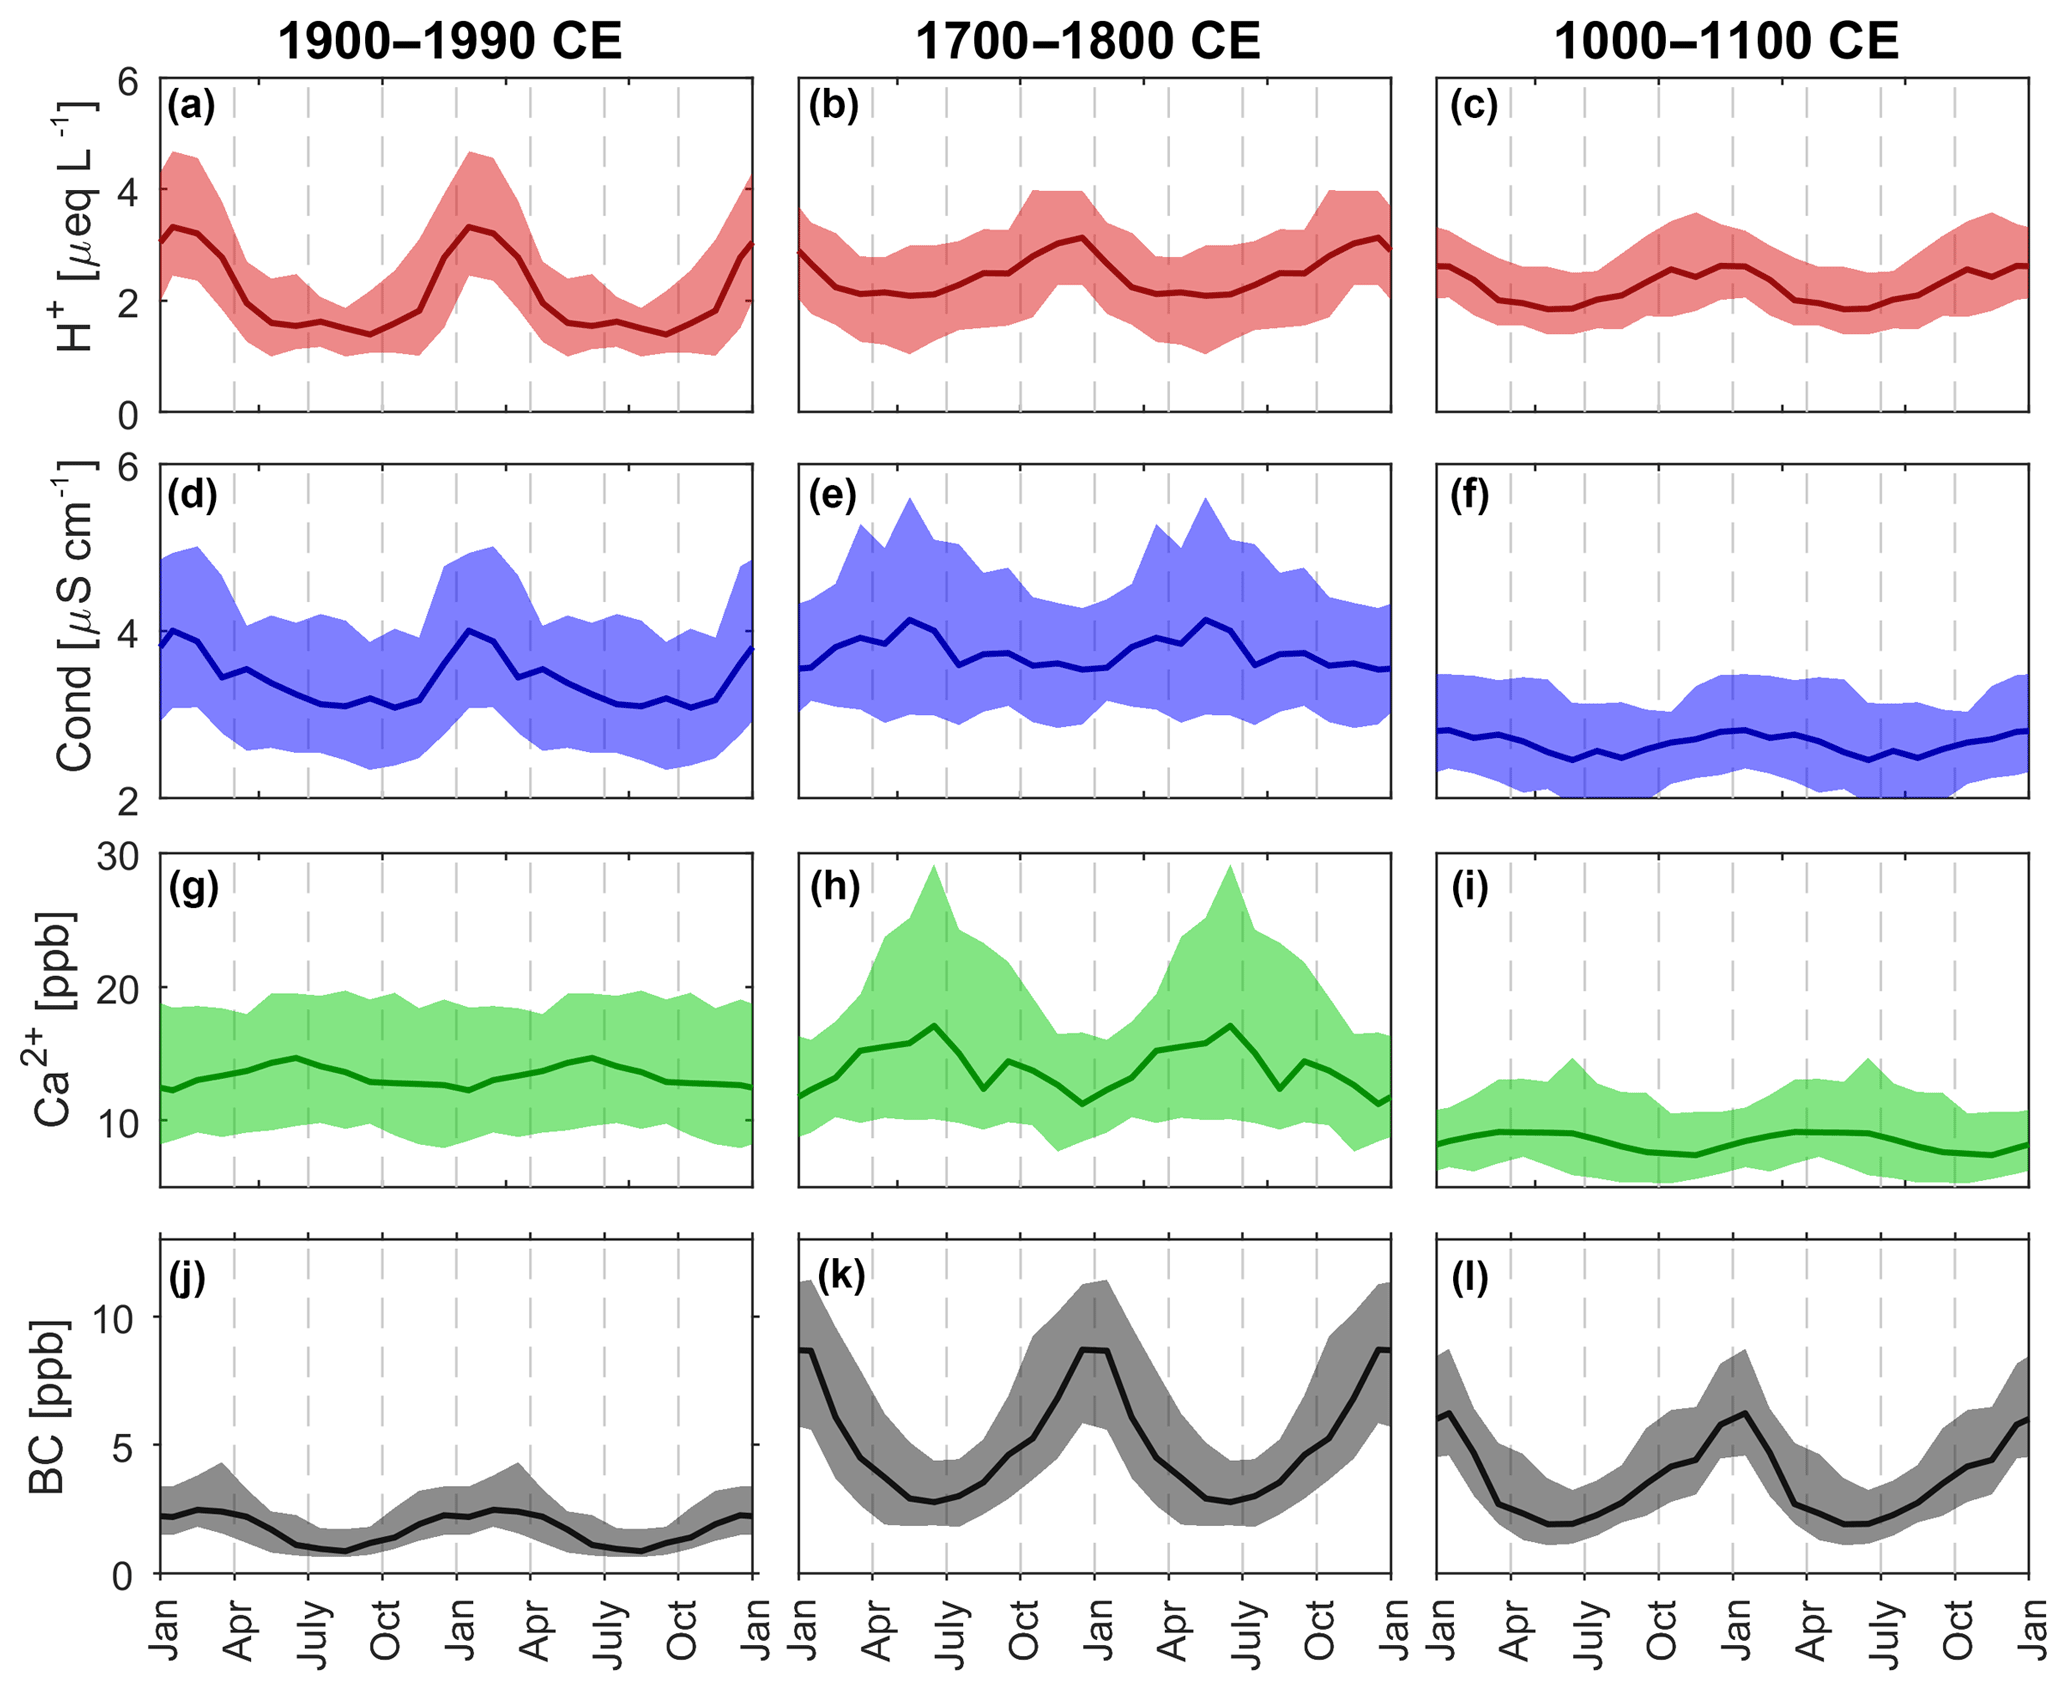
Figure 8Average annual signals of two successive years in (a–c) acidity (H+), (d–f) conductivity (Cond), (g–i) calcium (Ca2+), and (j–l) black carbon (BC) during three selected centuries, calculated under the assumption of constant snowfall through the year. The main RICE CFA data only extend to 1990 CE. The line shows the monthly averaged median value of measured concentrations, and the colored area signifies the 50 % quantile envelope of the value distribution.
Table 2Marker horizons used for development and validation of the RICE17 chronology. Strata in bold were used for constraining the timescale. The statistical significance of volcanic peaks in RICE (column 3) is given in terms of the average peak size in smoothed and standardized versions of the four volcanic records (ECM, H+, nss cond, nss S; down to 249 m) computed relative to a running mean and standard deviation. Volcanic matching to WAIS Divide allows for comparison between RICE17 ages (with 95 % confidence interval indicated) and the corresponding WD2014 ages with associated uncertainties (Sigl et al., 2015, 2016). Indicated depths and ages correspond to peaks in the volcanic proxies. Below 42.3 m, decimal ages have been calculated assuming BC to peak on 1 January. Historical eruption ages (column 4) indicate the starting date of the eruption. Column 4 also indicates whether the eruption has previously been observed to cause a bipolar signal based on the compilation in Sigl et al. (2013), here updated to the WD2014 timescale. Since this compilation only identifies bipolar volcanoes back to 80 CE, volcanoes prior to this are not classified. Three exceptionally large volcanic signals observed in the RICE core are indicated in italics.

a Age from Clausen et al. (1979). b Depths indicate the tephra sampling interval. c CFA acidity is missing for relevant interval, attribution is based on remaining records. d Significant peak only in nss conductivity. e Conductivity and Ca records missing for interval. f CFA and IC data missing, depth annotation based on ECM only. g Eruption not identified in existing compilation of volcanic eruptions in WAIS Divide (Sigl et al., 2013).
6.1 Acidity
The CFA acidity record is driven primarily by the influx of non-sea-salt sulfur-containing compounds, as evident by its high resemblance to the IC non-sea-salt sulfate and ICP-MS non-sea-salt sulfur records in the top part of the core (Fig. 4). Sulfur-containing compounds have a variety of sources, one of which is dimethylsulfide (DMS) emissions from phytoplankton activity during summer (Legrand et al., 1991; Udisti et al., 1998). Correspondingly, acidity displays a regular summer signal, with maximum values in late austral summer (January–February) and minimum values from June through October. This is similar in timing to the seasonal pattern of non-sea-salt sulfate at Law Dome (Curran et al., 1998) and WAIS Divide (Sigl et al., 2016). The acidity contains an annual signal even in the deepest part of the layer-counted timescale (Fig. 8a–c).
6.2 Sea-salt-derived species: calcium and conductivity
As previously noted by Kjær et al. (2016), the RICE conductivity record is almost identical to the mostly sea-salt-derived calcium record (see, e.g., Fig. 6), suggesting sea spray to also be responsible for peaks in liquid conductivity. We hence consider these two records to be representative of sea-salt deposition at Roosevelt Island.
Both records typically peak during early to middle winter (June–July) but with a large spread in magnitude and timing from year to year (Fig. 8d–i), and oftentimes there are multiple peaks per year. The timing of peak values is approximately similar to sea-salt tracers in WAIS Divide (Sigl et al., 2016) and a few months earlier than peak values in Law Dome (Curran et al., 1998). During the most recent period (1900–1990 CE), we observe a summer peak in the average seasonal conductivity signal, which is not present in the calcium record. This is likely the steady summer contribution from biogenic acidity, the seasonality of which is sufficiently prominent to show up in seasonal averages of conductivity in the top part of the core.
6.3 Black carbon
Seasonal deposition of black carbon in Antarctic snow is primarily driven by biomass burning and fossil fuel combustion in the Southern Hemisphere, modulated by changes in the efficiency of long-range atmospheric transport (Bisiaux et al., 2012). Southern hemispheric fossil fuel emissions have increased since the l950s (Lamarque et al., 2010) but are believed to be a minor contributor to total black carbon deposition in Antarctica (Bauer et al., 2013).
Biomass burning in the Southern Hemisphere peaks towards the end of the dry season, e.g., late summer (Schultz et al., 2008). Given the distinct annual signal in the black carbon record (Fig. 8j–l), StratiCounter was set up to assign peaks in BC a nominal date of 1 January (mid-summer). We note that peaks in BC approximately coincide with peaks in acidity (similar to observed in WAIS Divide), thus ensuring the consistency of nominal dates throughout the core. Minimum concentrations of BC are reached in austral winter (June–July).
The annual signal in black carbon changes with depth in the RICE core. During the 20th century, annual cycles exist but are not very prominent (Fig. 8j). Prior to 1900 CE, the signal is much more distinct, with larger seasonal amplitude and higher annual mean concentrations (Fig. 8k–l). A recent decrease in BC concentrations has also been observed in the WAIS Divide and Law Dome ice cores, where it has been attributed to a reduction in biofuel emissions from grass fires (Bisiaux et al., 2012). At WAIS Divide and Law Dome, however, the shift takes place several decades later than observed in RICE.
With increasing depth in the ice core, thinner annual layers cause the amplitude of the seasonal signal to slowly be reduced. Yet, aided by the high effective depth resolution of the black carbon record, the seasonal cycle persists to great depths in the RICE core, with the deepest part of the layer-counted RICE17 timescale primarily relying on the annual signal in this parameter.
6.4 Dust
The seasonal pattern in insoluble dust particle concentrations showed a weak annual signal with a tendency to peak in summer. The simultaneous deposition of black carbon and dust is consistent with both tracers arriving via long-range transport from southern hemispheric continental sources.
The layer-counted timescale was constructed back to 700 BCE (0–343.72 m), and it forms the most recent part of the Roosevelt Island Ice Core Chronology 2017 (RICE17). It is an independent timescale constrained only by a few well-known historical events over the last 100 years. Its independence is reflected in the timescale uncertainty: age confidence intervals show an approximately linear increase with depth (Fig. 9b), reaching a maximum age uncertainty of ±45 years (95 % confidence) at 700 BCE.
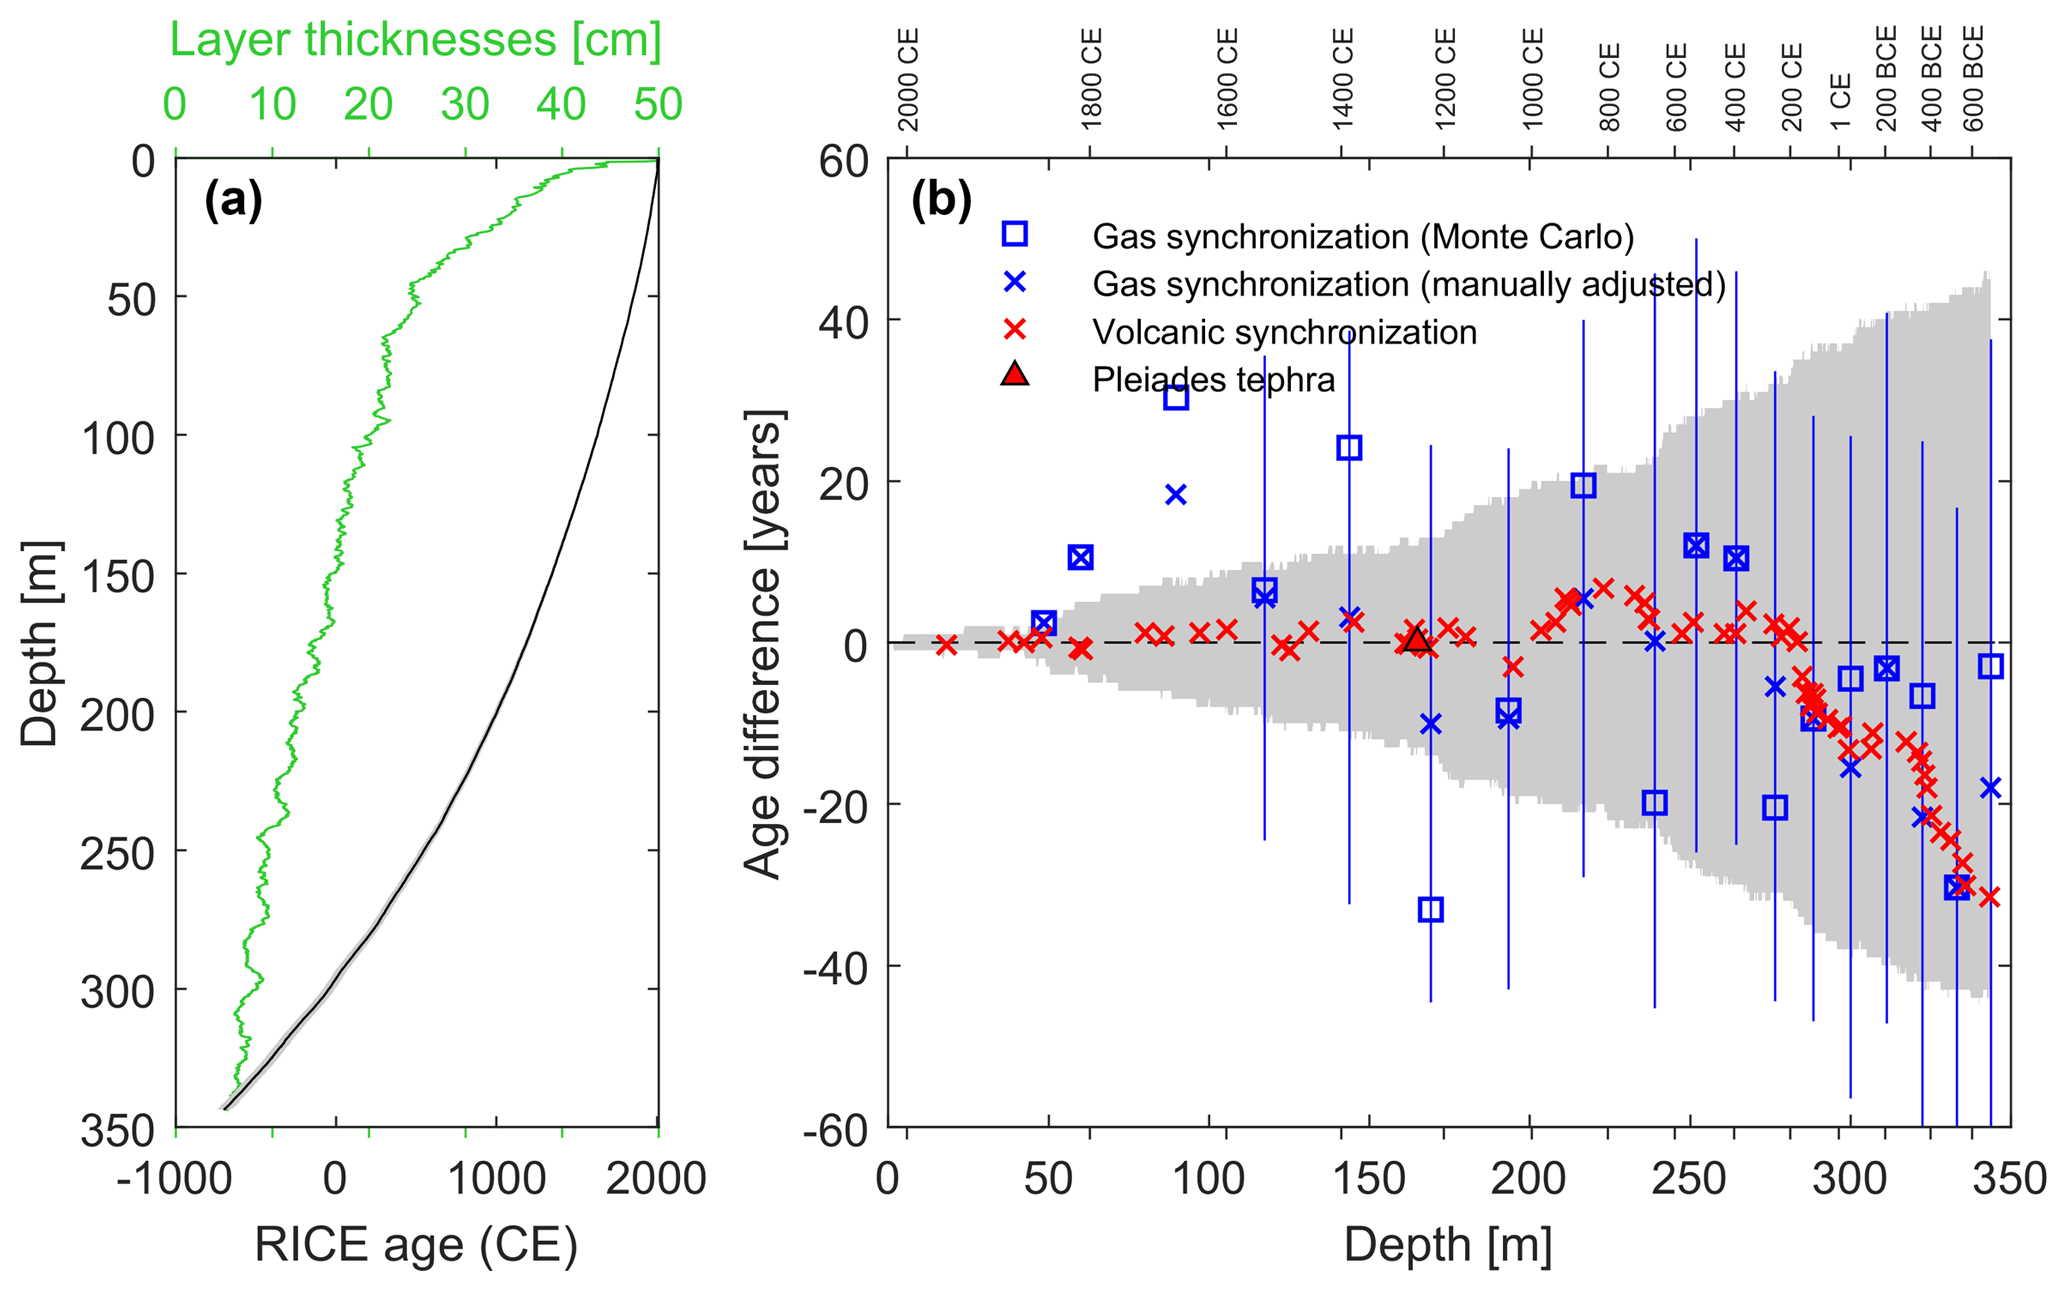
Figure 9(a) Depth evolution of RICE17 ages (black), including the associated 95 % confidence interval (grey area, almost invisible due to scale) and corresponding mean layer thicknesses (50-year running mean; green). (b) Comparison of RICE17 ages and confidence interval (grey area) to WD2014 from volcanic (red) and gas (blue) matching to WAIS Divide. A negative age difference implies fewer layers in RICE17 than in WD2014. Blue vertical lines represent 0.5σ age uncertainties on the ice age scale from Monte Carlo methane matches and delta-age modeling. The solid red triangle indicates the Pleiades tephra layer at 165 m of depth.
RICE17 was evaluated by comparing to the annual-layer-counted WD2014 chronology from WAIS Divide (Sigl et al., 2015, 2016). Timescale comparison was aided by the relative proximity of the two ice cores and accomplished using two complementary approaches: (1) matching multi-decadal variations in the RICE methane record to a similar record from WAIS Divide and (2) by matching volcanic marker horizons in the two cores. The two matching procedures were performed independently and are described in the following sections.
Volcanic matching allows for very precise age comparisons but suffers from the risk of incorrect event attribution. Erroneous alignment is less likely to occur when matching records of methane concentration variability. This approach does not allow for as high precision, however, due to the multi-decadal nature of the methane variations and the need to account for the gas-age–ice-age difference. Combining the two lines of evidence, the methane match points were used to confirm the independently obtained volcanic match points and to validate the absolute ages of the timescale (relative to WD2014). A high-precision comparison to WD2014 was achieved based on the volcanic matches, allowing for an in-depth quality assessment of the RICE17 chronology.
7.1 Timescale validation using multi-decadal variability in methane concentrations
Centennial-scale variations in methane concentrations observed in the RICE gas records can also be found in similar records from WAIS Divide (Mitchell et al., 2011; WAIS Divide Project Members, 2015). Stratigraphic matching of these records allowed for a comparison of the respective ice-core timescales.
The gas records from RICE and WAIS Divide were matched using a Monte Carlo technique reported in Lee et al. (2018). The feature-matching routine employed discretely measured records of methane and isotopic composition of molecular oxygen (δ18Oatm). Over recent millennia, however, the δ18Oatm concentrations have been stable and hence provided minimal matching constraints. An average spacing of 26 years between successive RICE methane samples contributed to the matching uncertainty. The matching routine identified 18 match points over the past 2700 years, i.e., an average spacing of 150 years. Subsequent visual comparison of the methane profiles suggested minor manual refinements of the match points (8 years on average, maximum 23 years; all within the uncertainty of the automated matching). These adjustments resulted in a slightly improved fit.
Through the methane feature matching, WAIS Divide ages could be transferred to the RICE gas records, i.e., provide an estimate for the RICE gas ages. During the snow densification process, there is a continuous transfer of contemporary air down to the gas lock-in depth, resulting in an offset (Δage) between the ages of ice and gas at a given depth (Schwander and Stauffer, 1984). To obtain the corresponding ice-core ice ages relevant for this study, Δage was calculated using a dynamic Herron–Langway firn densification model (Herron and Langway, 1980) following Buizert et al. (2015). The approach is described in detail in Lee et al. (2018). The model is forced using a site temperature history derived from the RICE stable water isotopes, and the firn column thickness is constrained by the isotopic composition of molecular nitrogen (δ15N of N2). In addition to Δage, this formulation of the Herron–Langway densification model produces as output a low-resolution accumulation rate history (Sect. 8.3).
Compared to most other Antarctic sites, the relatively high surface temperature and accumulation rate at Roosevelt Island give rise to low Δage values (averaging 160 years over recent millennia) associated with small uncertainties (∼57 years; 1σ). Combined with the feature matching uncertainty (average: 48 years), total age uncertainty (1σ) in the transfer of WD2014 to the RICE core is on average 80 years (maximum: 111 years) over the last 2700 years.
The RICE17 timescale is consistent with the WD2014 age of the methane match points (Fig. 9b). Based on the automatic matching routine, the agreement of RICE17 with the gas-matched WD2014 ages is better than 33 years for all age markers, with a root mean square (RMS) difference of 17 years. Agreement between the two timescales is even better when using the manually adjusted match points, for which the RMS difference is reduced to 13 years. We observe, however, that all methane match points below 275 m are associated with older ages in WD2014 than in RICE, suggesting a small bias in the deeper part of RICE17.
7.2 Timescale evaluation from volcanic matching
Using the layer counts in RICE17 as a guide, volcanic horizons identified in RICE could be linked to the WAIS Divide volcanic record (Sigl et al., 2013, 2015), allowing for a detailed comparison of their respective timescales. However, a high background level of marine biogenic sulfuric acids precluded a straightforward identification of volcanic eruptions in the RICE records. Based on multiple volcanic proxy records, including two new volcanic tracers described below, match points were found by identifying common sequential patterns of acidity spikes in the two cores.
7.2.1 New and conventional ice-core tracers for volcanic activity
With its coastal location and low altitude, the RICE drilling site receives a significant seasonal influx of sulfuric acids from biological oceanic sources. Biogenic peak values of up to 200 ppb of non-sea-salt sulfate are of the same order as the expected sulfate deposition from large volcanic eruptions, causing the seasonal signal to partly obscure the episodic deposition of sulfuric acids from volcanic eruptions. Volcanic signals appeared more distinct in the acidity record (Fig. S4), primarily due to the higher resolution of this record.
Traditional volcanic ice-core tracers, ECM and sulfur, were not sufficient for identifying volcanic horizons. The ECM record was very noisy, with few peaks extending above the noise level. The resolution of the discretely sampled sulfur record was low (below 67 m: 5 cm, i.e., < 4 samples yr−1), and it was therefore most valuable in the top. Even here, large volcanoes only left a vague imprint in the form of slightly increased sulfur levels over a multiyear period (e.g., Fig. 10a), with their most distinct feature being elevated sulfur concentrations also during winter. Detection of volcanic horizons in the RICE core therefore primarily relied on two new high-resolution tracers for volcanic activity: direct measurements of total acidity (Kjær et al., 2016) and estimated non-sea-salt liquid conductivity.
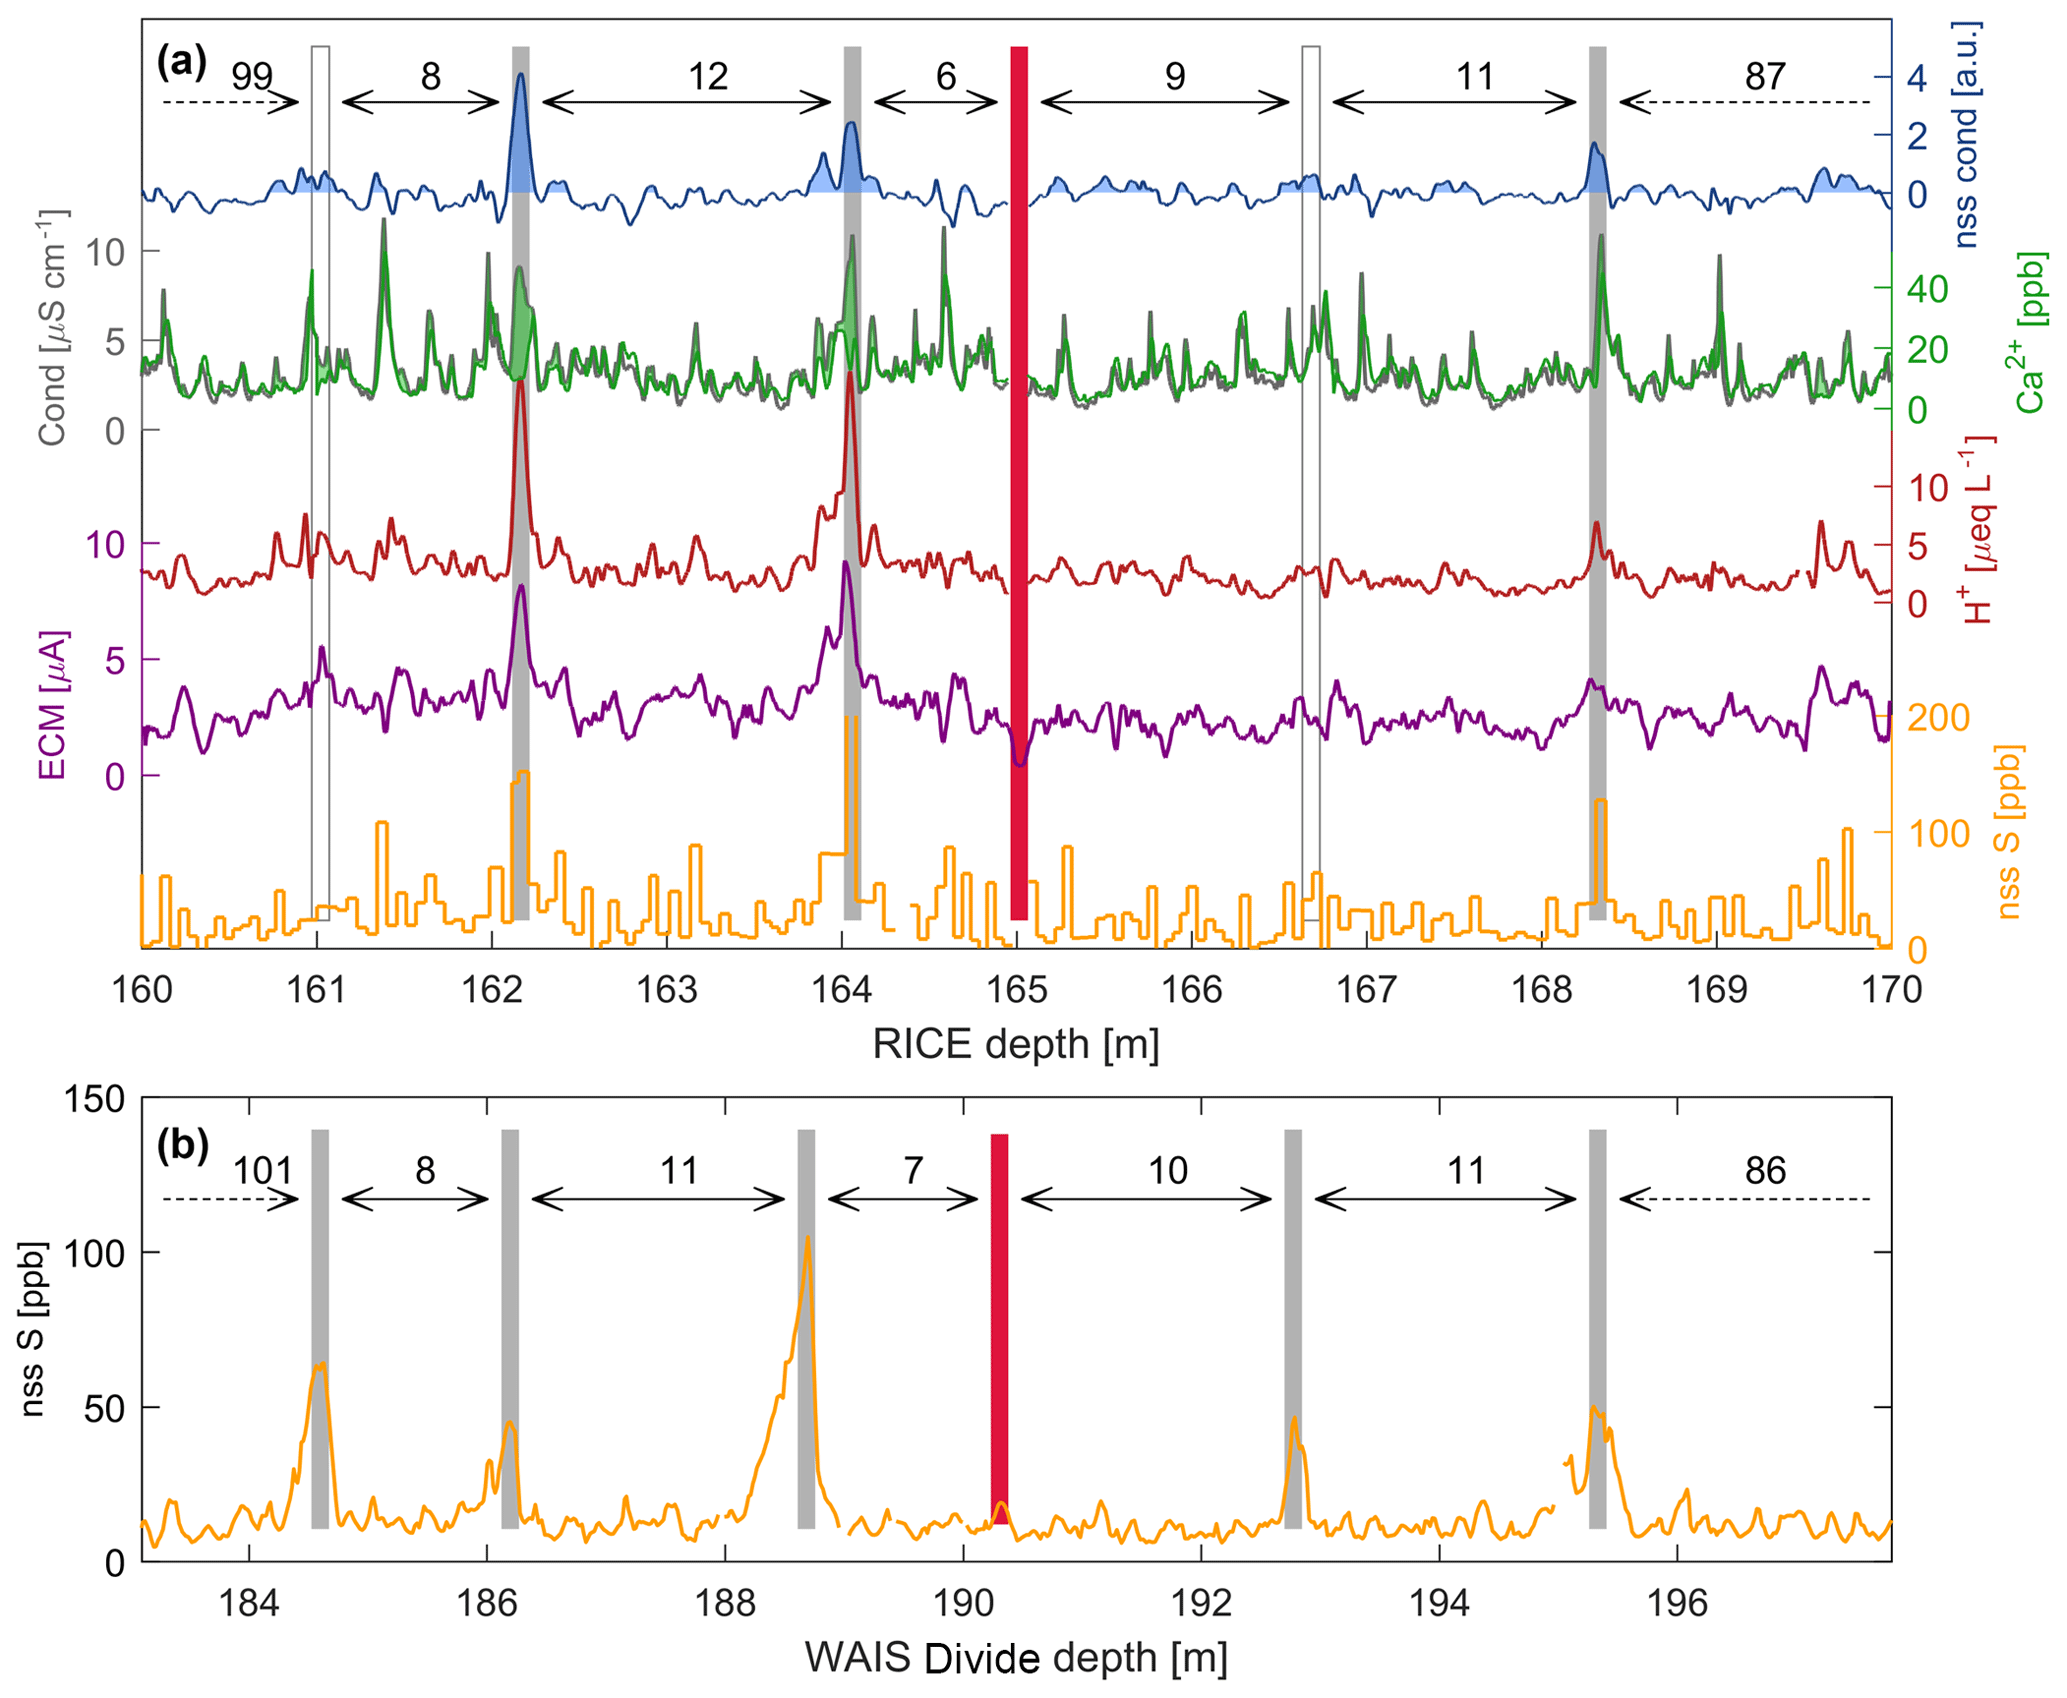
Figure 10(a) The RICE volcanic proxy records: non-sea-salt sulfur (nss S; orange), ECM (purple), acidity (H+; red), and non-sea-salt conductivity (nss cond; blue) based on the conductivity-to-calcium (grey, green) excess. Green and blue areas are sections of positive excess. (b) Matching of the RICE records to the WAIS Divide non-sea-salt sulfur record (Sigl et al., 2015). Vertical bars indicate volcanic match points (Table 2), with the number of annual layers between match points in the two records given according to their respective timescales. The red bar represents the Pleiades tephra horizon (1251 CE). Two match points (grey bars) had prominent peaks in most of the RICE volcanic records and had an average significance exceeding 2 standard deviations of the general variability of the signal, while the peaks corresponding to two other match points (white bars) were less significant. However, direct comparison of the calcium and conductivity records revealed significant conductivity excess also at these depths.
Peaks in the RICE liquid conductivity record were caused primarily by sea salts, and thus this record could not be used as a volcanic tracer on its own. However, from the close similarity of the conductivity and the mostly sea-salt-derived calcium record (e.g., Fig. 6), we could extract a signal of non-sea-salt conductivity, obtained as the conductivity-to-calcium excess (nss conductivity = conductivity − (a⋅ [Ca2+] +b), with a and b calculated from linear regression). As a secondary product, this tracer is prone to measurement errors, calibration and co-registration uncertainties, and is further complicated by differences in measurement resolution. We therefore always double-checked by direct comparison between the two records (Fig. 10a; green and grey lines), allowing peaks caused by misalignment and obvious measurement issues to be identified. We observed high consistency between peaks in the non-sea-salt conductivity and the total acidity records.
A sequence of volcanic signals is shown in Fig. 10a. Additional sections are found in Sect. S5 in the Supplement. Compared to acidic peaks resulting from unusually high biogenic summer activity, volcanic imprints could be distinguished as more prominent and/or broader features. Small and short-lived volcanic eruptions, however, were not easily identified.
7.2.2 The Pleiades: a tephra chronological marker horizon
A visible tephra layer was found in RICE at 165 m of depth with a RICE17 age of 1251.5±13 CE. The geochemistry of the tephra particles is consistent with an eruption from the Pleiades (Kurbatov et al., 2015), a volcanic group located in northern Victoria Land, Antarctica (Fig. 1). Tephra of similar geochemistry has been found in several other Antarctic cores dated to approximately the same age, including WAIS Divide (1251.6±2 CE; Dunbar et al., 2010) and Talos Dome–TALDICE (1254±2 CE; Narcisi et al., 2001, 2012). The Pleiades tephra horizon allowed for a firm volcanic matching of the RICE and WAIS Divide ice cores at this depth (Fig. 10).
The Pleiades tephra horizon was used to select the optimal settings for the StratiCounter algorithm, seeking to reproduce the WD2014 age of the tephra layer as well as possible. The observed compliance of the two age scales at this depth is therefore to be expected. However, we note that our use of this layer as a chronological marker had little impact on the resulting RICE17 timescale: all StratiCounter solutions produced very similar ages for the tephra horizon, and, within the age-scale uncertainties, all were in agreement with the WD2014 age of the tephra.
7.2.3 Volcanic matching to WAIS Divide
Based on the layer counts in RICE17, sequences of volcanic horizons in RICE were matched to the WAIS Divide volcanic record (Sigl et al., 2013, 2015). Using an approach similar to the one applied in, e.g., Svensson et al. (2013), the matching relied on identifying successive volcanic events in the two cores with similar age spacing (within the associated uncertainties) according to their respective timescales (Fig. 10; see also Sect. S5 in the Supplement). By taking advantage of the information contained within the annual-layer counting, we were able to identify common patterns of volcanic spikes in the two cores, allowing for a unique match between them (Table 2).
Taking this approach was especially important due to the risk of confounding volcanic and biogenic signals in the RICE records. Indeed, for some sections an unequivocal sequence could not be identified; sections with too few or too many closely spaced acidity spikes in either core were particular problematic. Most match points are associated with peaks exceeding 2 standard deviations of the overall variability of the record (Table 2). However, some smaller peaks were also useful when these formed part of a matching sequence of volcanic events. Multiple additional events in the RICE records of likely volcanic origin are not included in Table 2, since they could not be unambiguously matched to a peak in WAIS Divide.
The volcanic matching was in excellent agreement with the independently obtained methane matching, especially when using the manually adjusted match points (Fig. 9b). A majority of the volcanic links identified between the RICE and WAIS Divide ice cores have previously been classified as bipolar signals originating from large tropical volcanoes (Sigl et al., 2013, 2015). This further strengthens our trust in the volcanic matching, since these large eruptions usually deposit acids over an extended area and period, and they are therefore expected to also exist in the RICE volcanic records.
7.2.4 Quality assessment of RICE17
The volcanic matching to WAIS Divide allowed for a detailed evaluation of RICE17. The WD2014 counting uncertainty is merely 7 years over the last 2700 years, much less than the uncertainty associated with RICE17, and we hence consider it to be the more accurate of the two. Within their respective uncertainties, the RICE17 and WD2014 chronologies are in full agreement at all volcanic marker horizons (Table 2; Fig. 9b). Indeed, the age differences are much less than the accumulated RICE17 age uncertainties. We hence conclude that the inferred confidence bounds on the RICE17 chronology are reliable, if somewhat conservative.
Agreement between the two ice-core timescales is particularly remarkable down to 285 m (∼150 CE). For this most recent part of the RICE17 timescale, the age discrepancy is less than 7 years at all marker horizons, with an RMS age difference of 3 years. Below 285 m, the volcanic matches indicate that RICE17 has a slight (∼3 %) bias towards younger ages. This is corroborated by the methane match points (Sect. 7.1). At 285 m, the effective depth resolution of the CFA impurity records (1–2 cm) becomes marginal compared to the annual-layer thicknesses (7 cm at 285 m), and we suspect that this has caused the thinnest fraction of annual layers to be indiscernible in the ice-core records.
Table 3Mean value and trends in RICE accumulation rates during various time periods. Change points and trends are found using break-fit regression (Mudelsee, 2009). The most likely change points and trend values are provided, as are the associated confidence intervals (in parenthesis: median and median absolute deviation) determined from block bootstrap analysis. Uncertainties (95 % confidence intervals) of mean accumulation rates are calculated based on the uncertainty in the accumulation reconstruction. Accumulation trend estimates from the bootstrap analysis (in parenthesis) include uncertainties in the determination of the change point but not uncertainties associated with the derived accumulation rate history. The analysis does not account for a potential bias due to ice divide migration, which may slightly affect the mean accumulation rate values prior to 1750 CE and the trend during the period of divide migration (∼1500–1750 CE).
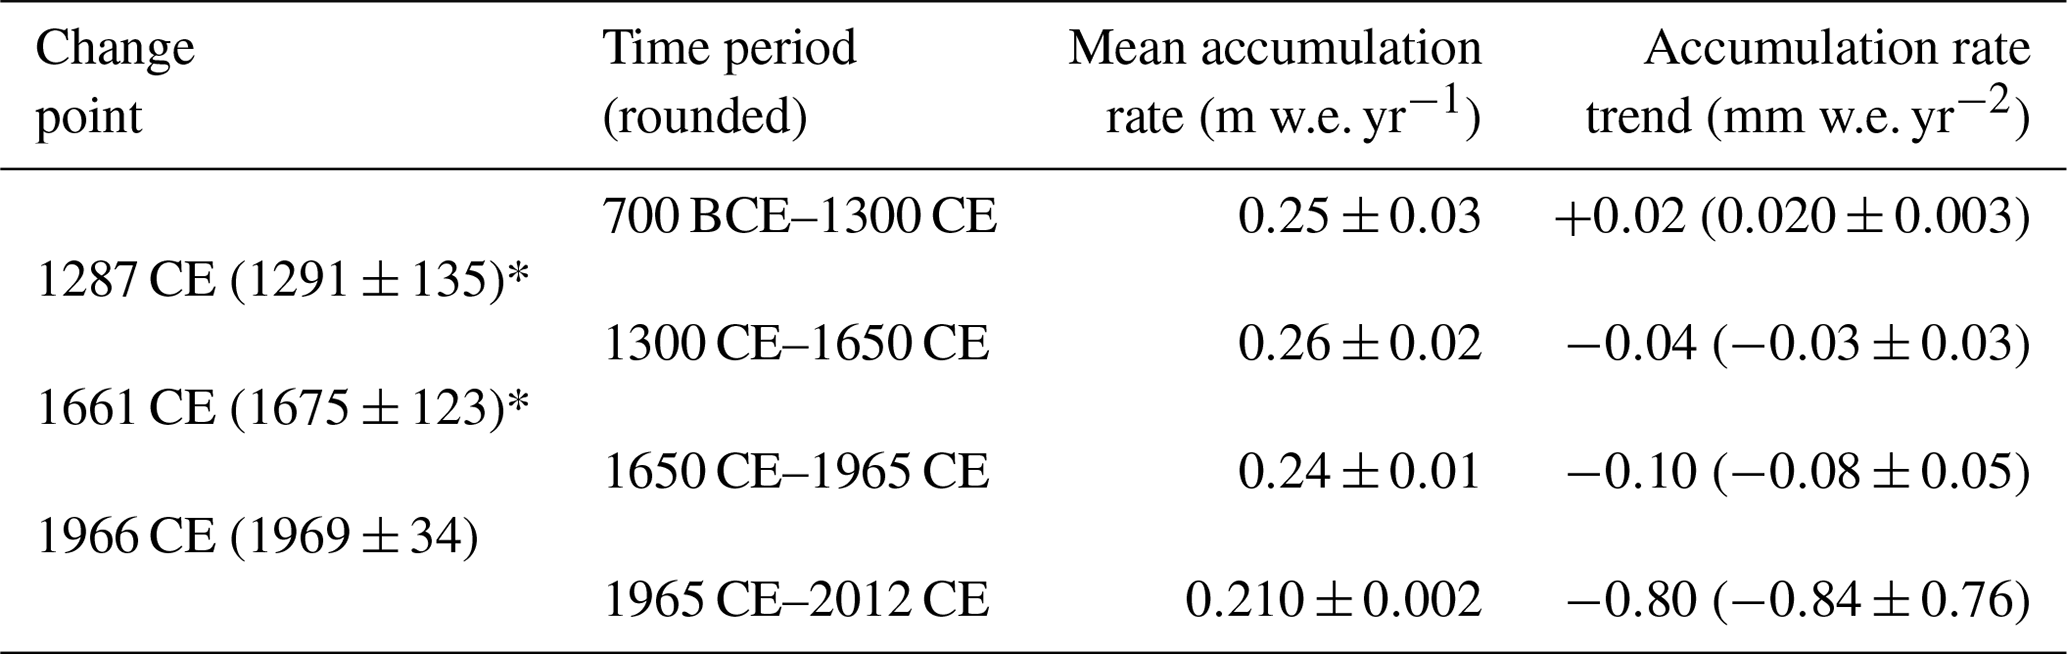
* Change point not well determined from bootstrap analysis.
Consequently, the deepest section of the layer-counted RICE17 chronology slowly diverges from WD2014, reaching a maximum age difference of 30 years at the oldest identified volcanic marker horizon (343.3 m, 691 BCE ± 45 years; Table 2). This age offset is of similar magnitude as the uncertainty of the methane-derived RICE17 ages at this depth.
Annual-layer thicknesses in the RICE ice core smoothly decrease with depth, starting from more than 40 cm at the surface to ∼6 cm at 344 m (Fig. 9a). After corrections for density changes and ice-flow thinning of annual layers with depth (Sect. 5), an annual accumulation rate history for Roosevelt Island over the last 2700 years was obtained (Fig. 11f).
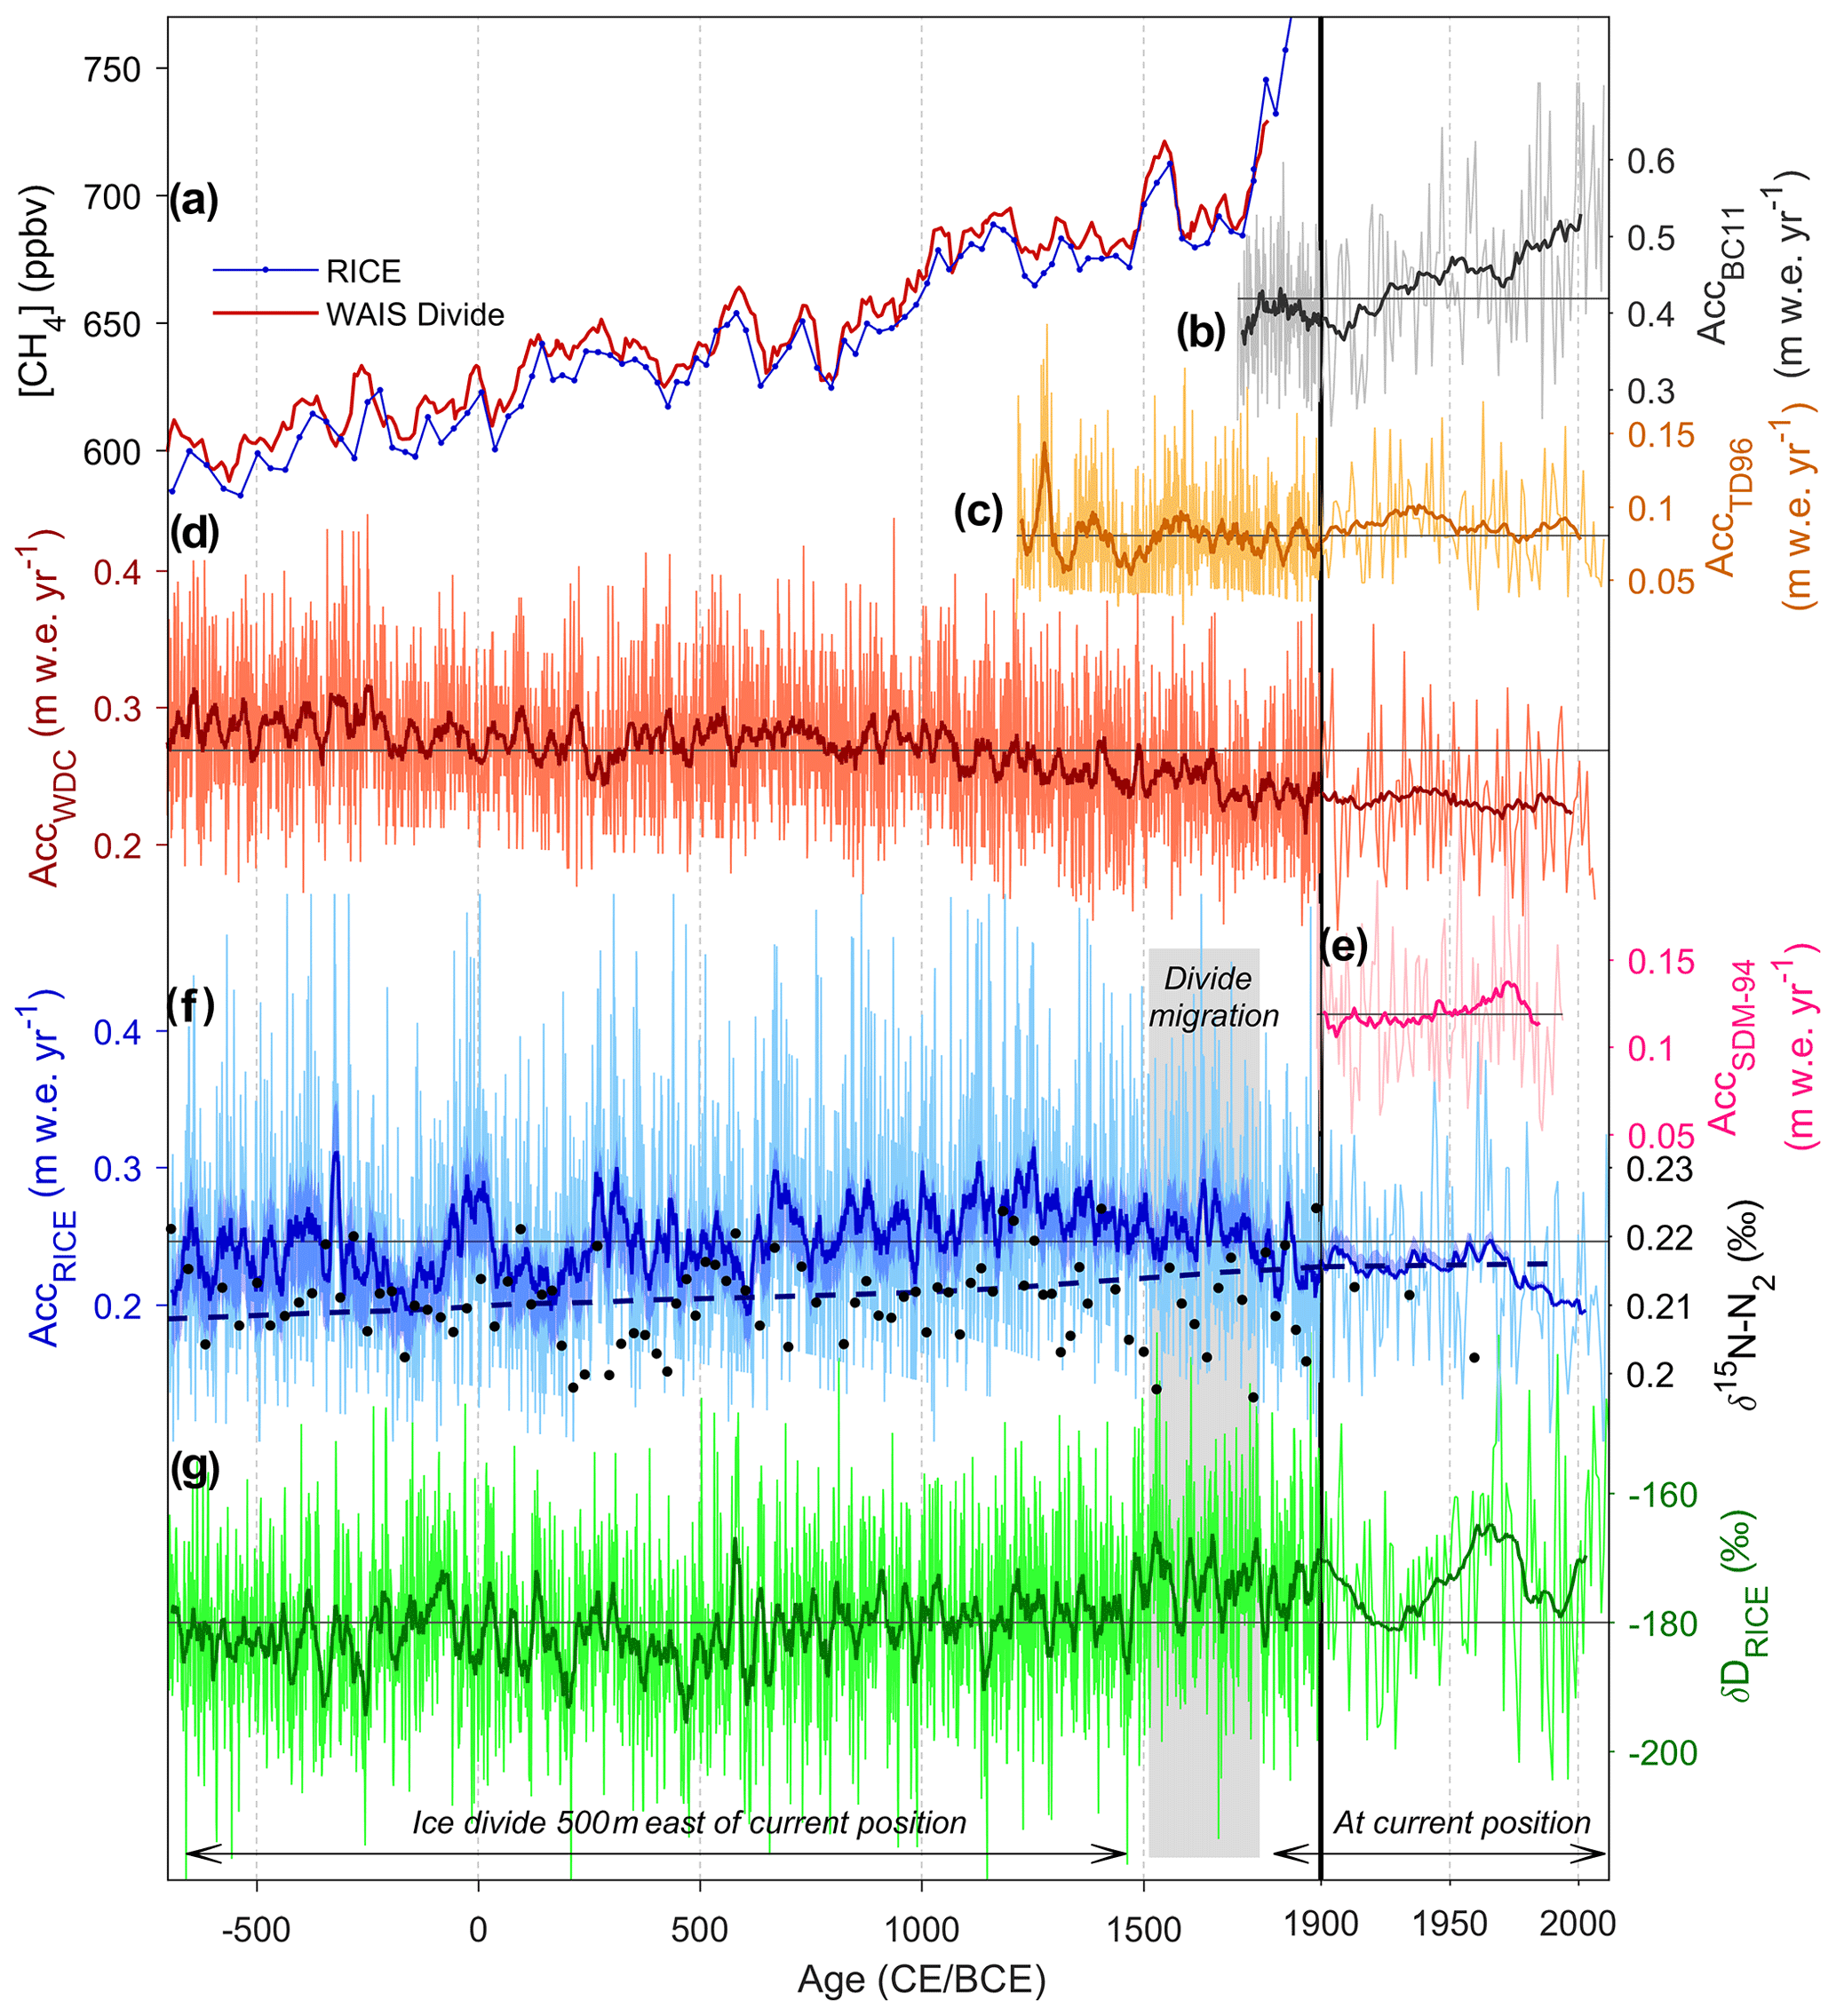
Figure 11(a) Measured methane concentrations from RICE (blue, on the RICE17 timescale) and from WAIS Divide (red, on the WD2014 timescale). (b) Bryan Coast (BC11, grey), Ellsworth Land (Thomas et al., 2015), (c) Talos Dome (TD96, orange), northern Victoria Land, (Frezzotti et al., 2007; Stenni et al., 2002) (no thinning function applied, extended to 2010 CE using stakes measurements), (d) WAIS Divide (WDC, red), central West Antarctica (Fudge et al., 2016) (corrected for ice advection), (e) Siple Dome (SDM-94, pink), Marie Byrd Land (Kaspari et al., 2004), and (f) RICE (blue) accumulation histories over the past 2700 years in annual resolution and 20-year smoothed versions (thick lines). The shaded blue area indicates the 95 % confidence interval of the RICE accumulation rates. The short-lived peak in accumulation rates around 320 BCE is likely to be an artifact caused by timescale inaccuracies in this period, during which RICE17 diverges from WD2014 (Fig. 9b). Also shown are the gas-derived accumulation rates for this time interval (f, blue dashed line) and measurements of δ15N of N2 providing information on past firn column thickness (f, black dots; on the RICE gas timescale). (g) RICE stable water isotope record (δD). Thick green line is a 20-year smoothed version of the isotope profile. Grey horizontal lines indicate mean values of the respective accumulation rates and δD over the displayed period. Note that the scale changes at 1900 CE (thick vertical line). The migration period of the Roosevelt Island ice divide is marked with a grey box.
8.1 Long-term accumulation trends
Mean accumulation rates at Roosevelt Island over the entire 2700-year period were 0.25±0.02 m w.e. yr−1. From 700 BCE to ∼1300 CE, the accumulation rate at Roosevelt Island shows a slightly increasing trend (Fig. 11f; Table 3), and in 1250 CE, the 20-year running mean accumulation rate reached its maximum over the last 2700 years (0.32 m w.e. yr−1). Since then, accumulation rates have decreased: very slowly until ∼1650 CE, then more rapidly (0.10 mm yr−2 from 1650–1965 CE; Table 3). A continued acceleration in the decline of accumulation rates is observed towards the present. Change points and trend estimates with their associated uncertainties were identified using a break-function regression analysis (Mudelsee, 2009). However, the high interannual variability in accumulation rates prohibited a very accurate determination of the break points.
8.2 Significant decrease in recent accumulation rates
The Roosevelt Island accumulation history reveals a distinct and rapid accumulation decrease in recent decades: since the mid-1960s, the annual accumulation has decreased with a rate corresponding to 0.8 mm yr−2, i.e., 8 times faster than over previous centuries. We note, however, that the relatively short time period for conducting the trend analysis, combined with the large interannual variability in accumulation rates, causes significant uncertainty in the precise timing of the change point and the trend estimate.
Considering the period since 1700 CE (Fig. 12), the lowest decadal mean value of the accumulation rate is observed in the 1990s (0.194±0.001 m w.e. yr−1). Except for very low accumulation rates during the 1850s and 1800s, the remaining top six decades of lowest mean accumulation take place after 1950 CE (Table 4). Indeed, over the last 50 years, only one decade (1960s) stands out as not having experienced below-average accumulation at Roosevelt Island.
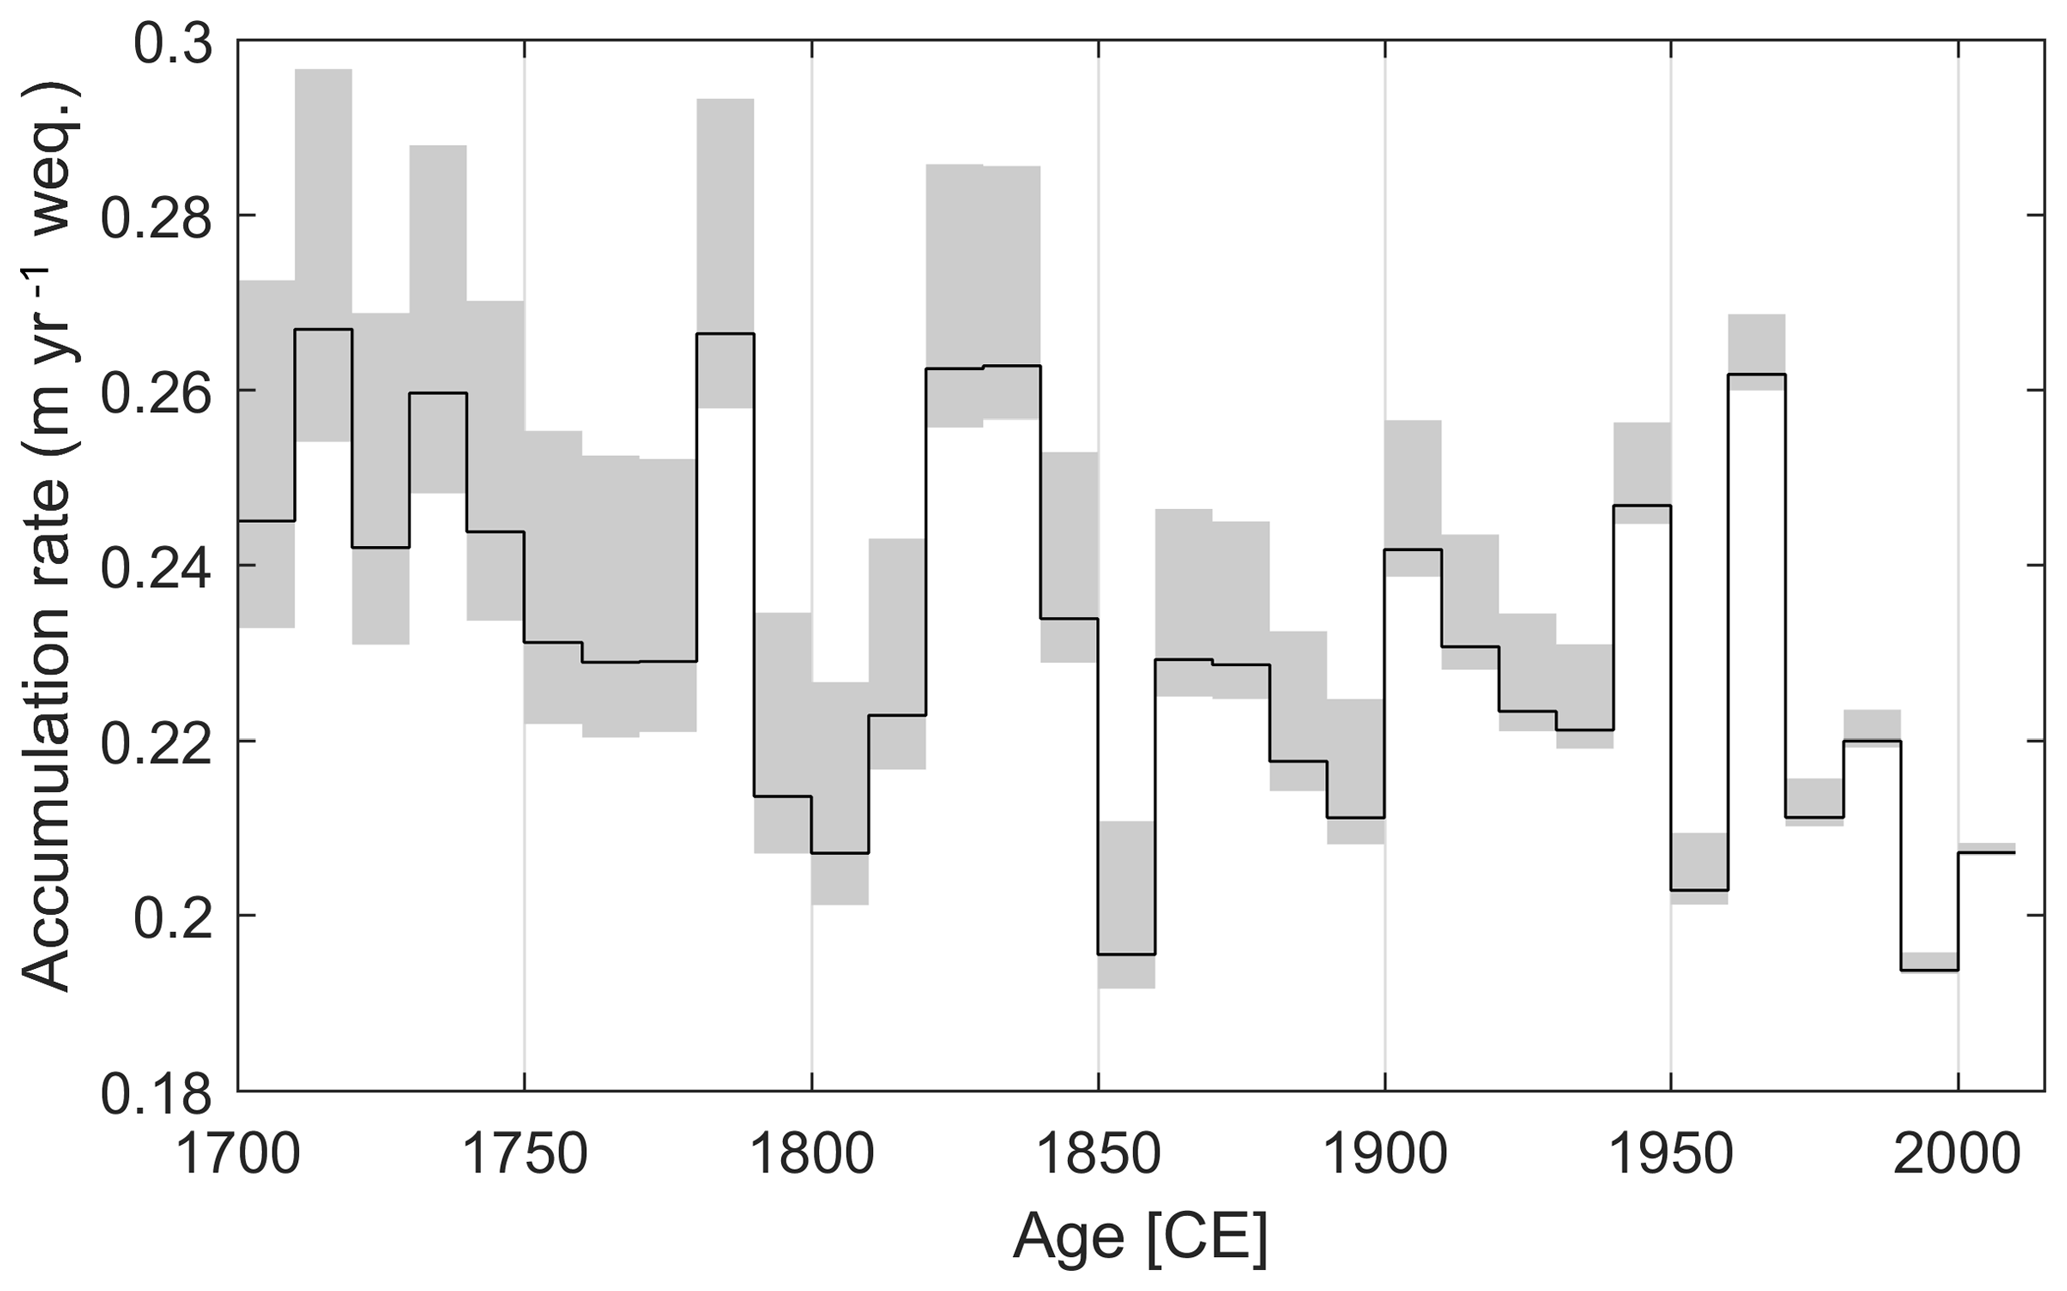
Figure 12Decadal accumulation rates at Roosevelt Island since 1700 CE. Grey shadows indicate the 95 % uncertainty bounds on the accumulation rate reconstruction due to uncertainties in the thinning function.
Table 4Ranking of decades since 1700 CE according to lowest mean accumulation. Uncertainties (95 % confidence interval) of the mean values are due to uncertainties in the accumulation reconstruction.

The current accumulation rate at Roosevelt Island of 0.210±0.002 m w.e. yr−1 (average since 1965 CE, ±2σ) is 34 % less than the peak accumulation rates around 1250 CE and 16 % below the average of the last 2700 years.
8.3 Comparison to the gas-based accumulation rates
The RICE17 accumulation history is in reasonable agreement with the low-resolution accumulation rate output from the dynamic Herron–Langway firn densification model (Fig. 11f, dashed line). The gas-based accumulation rate history does not resolve high-frequency variations, but it shows a slow increase in accumulation rates of 0.02 mm yr−2, similar to the trend obtained from the annual-layer thicknesses prior to 1300 CE. However, in contrast to the accumulation rate history derived here, the firn-based accumulation rates continue to increase until present. Further, the absolute values of the inferred gas-based accumulation rates tend to generally underestimate the accumulation rates by ∼0.04 m w.e. yr−1 (16 %).
We speculate that the discrepancies may have to do with the shift in RICE water isotope levels occurring around 1500 CE (Fig. 11g), which in the firn model is used to represent temperature change. It has been suggested that this shift is due to factors other than temperature, e.g., changes in atmospheric circulation patterns and/or regional sea-ice extent (Bertler et al., 2018), and the shift also coincides with commencement of the divide migration period. By using δD to estimate temperature change, the firn densification model will produce an increase in accumulation rates towards present in order to preserve a constant thickness of the firn column, as indicated by relatively steady values of δ15N–N2 (Fig. 11f, black dots). Further, the model showed a tendency to underestimate the firn column thickness during the earlier part of the period, which may explain the generally lower level of the modeled accumulation rates here.
8.4 Spatial consistency in recent accumulation rates
The spatial representativeness of the RICE accumulation rates was evaluated by comparing year-to-year profiles of layer thicknesses obtained for the overlap sections of the three available cores: RICE main core, RICE-12/13-B, and RID-75 (Fig. 13), with RID-75 located less than 1 km away from the two RICE cores. All cores were corrected for density changes and ice-flow thinning using the density and thinning profile from the main RICE core.
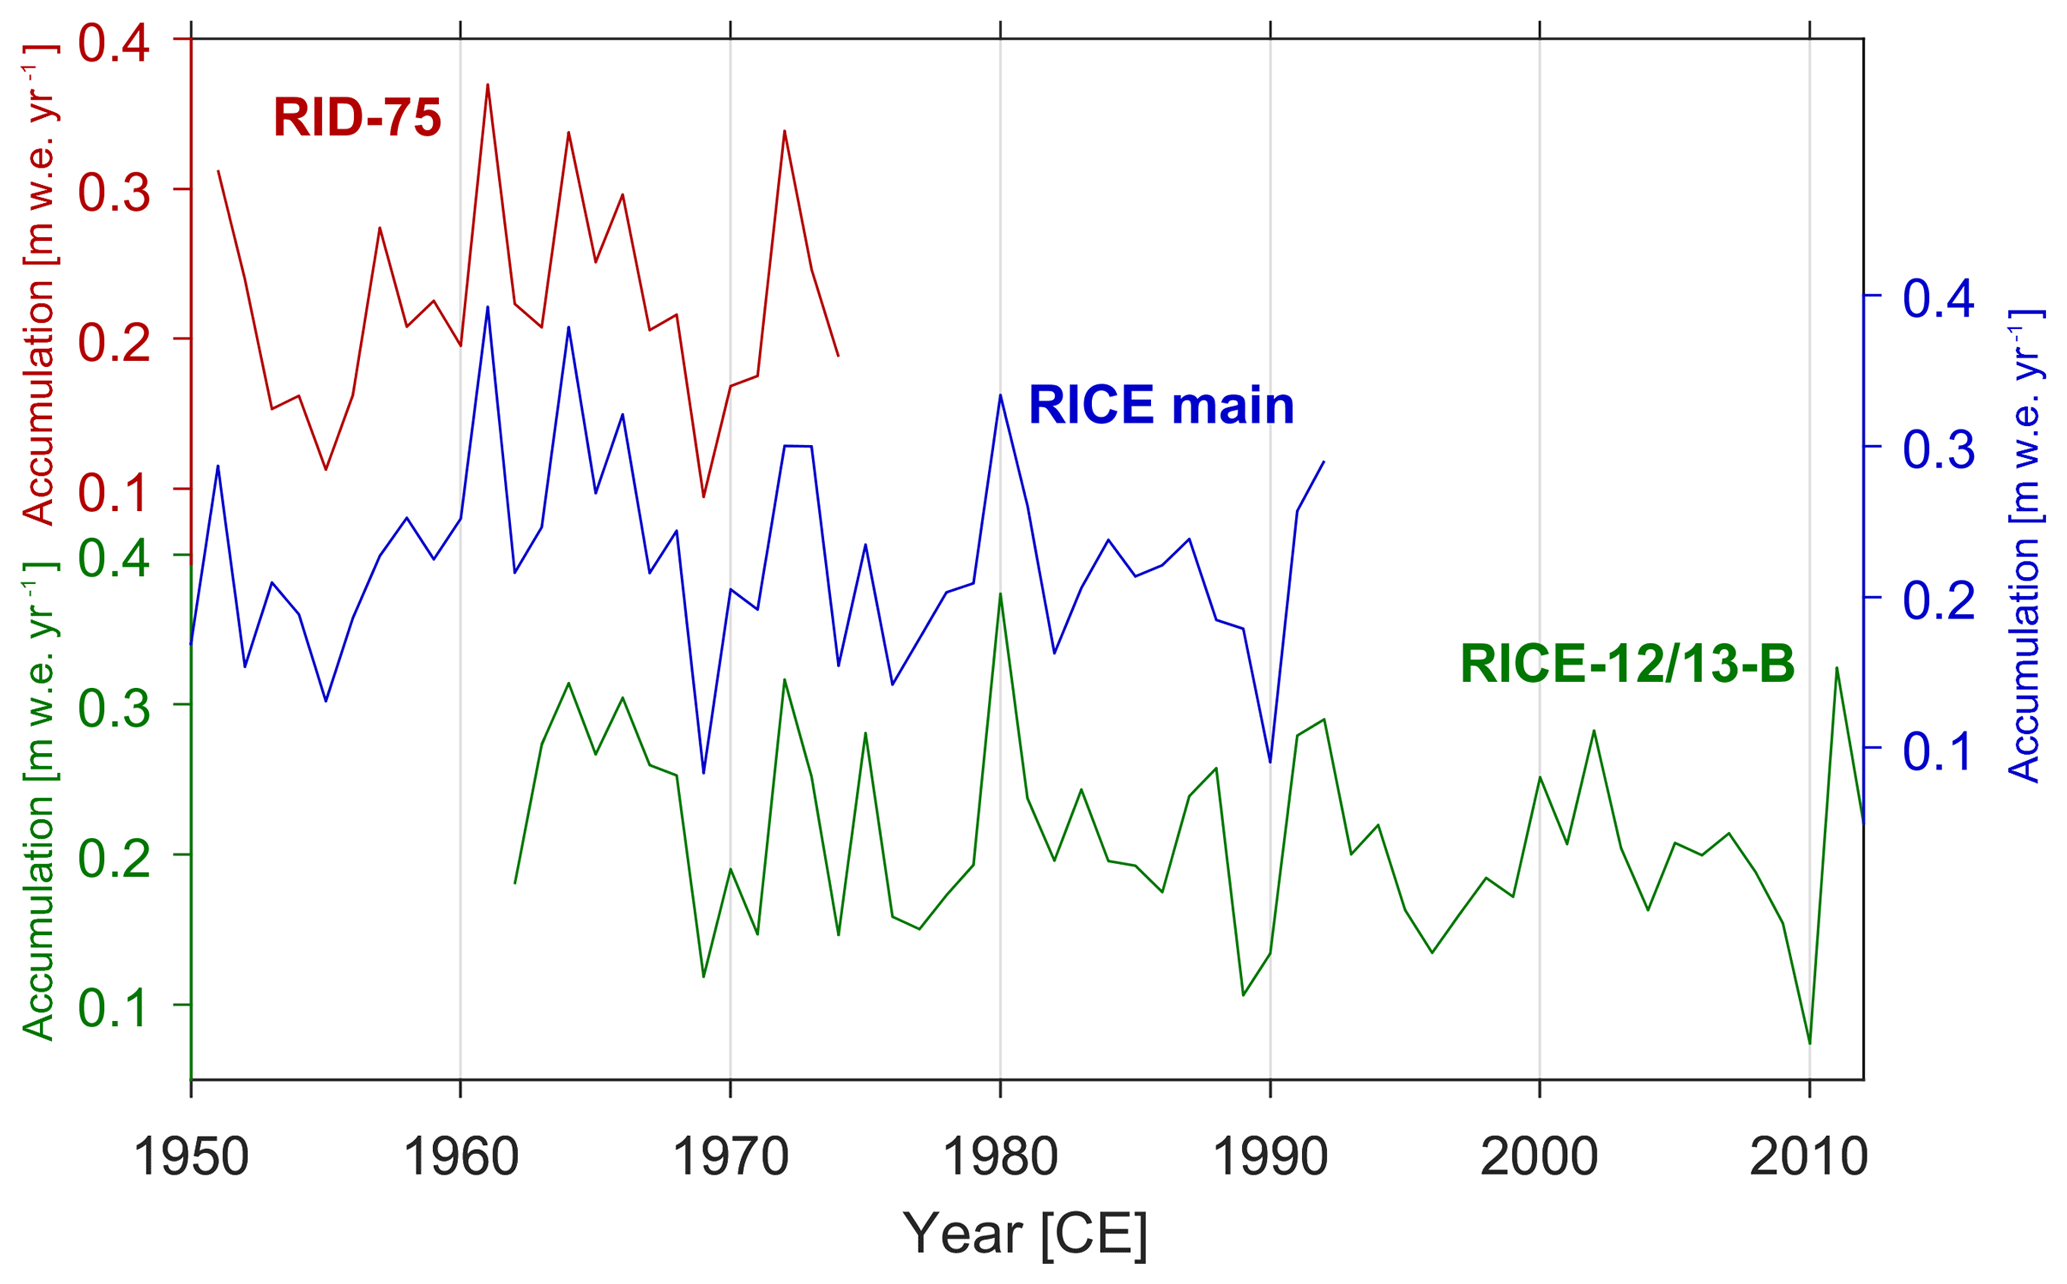
Figure 13Accumulation reconstructions since 1950 CE for the three Roosevelt Island ice cores described in Table 1.
Annual accumulation records from the three cores are very strongly correlated (correlation coefficients ranging between 0.85 and 0.87), indicating the spatial accumulation pattern across Roosevelt Island to be stable through recent time. The spatial consistency of snow deposition at Roosevelt Island is corroborated by the agreement between their measured water isotope records (Fig. 5a). We may therefore disregard depositional noise and consider the temporal variability in RICE annual-layer thicknesses as representative of local snow accumulation.
This consistency in accumulation history is in contrast to a high spatial variability in mean accumulation rates across Roosevelt Island ice divide. Repeat surveys over 3 years (2010–2013) of 144 survey stakes set across Roosevelt Island showed a strong spatial gradient in snow accumulation across the ice divide: accumulation rates of up to 0.32 m w.e. yr−1 were measured on the northeastern flank, decreasing to 0.09 m w.e. yr−1 on the southwestern flank (Bertler et al., 2018). In accordance with these stake measurements, the absolute accumulation rate is found to be significantly less (∼7 %) for RID-75 than for the RICE cores. Differences in accumulation rate between the two RICE cores were insignificant. Spatial variability in mean accumulation rates, combined with different averaging periods, may explain why previous estimates of Roosevelt Island accumulation rates have varied quite significantly (Herron and Langway, 1980; Conway et al., 1999; Kingslake et al., 2014; Bertler et al., 2018).
The representativeness of the Roosevelt Island accumulation rates is corroborated by the high spatial correlation of the RICE accumulation rates to gridded ERA-Interim precipitation data during recent decades (Bertler et al., 2018). These results suggest that precipitation variability at Roosevelt Island, as observed in RICE, is representative for an extended area, which includes the Ross Ice Shelf, the southern Ross Sea, and the western part of West Antarctica.
8.5 Influence of ice divide migration on the accumulation history
The recent period (∼1500–1750 CE) of divide migration at Roosevelt Island may impact the interpretation of climate records from the RICE core. Ice recovered in the deeper part of the RICE core, deposited before divide migration, originated west of the ice divide. Present accumulation rates show a distinct decrease on the downwind (western) side of the ice divide with a gradient of m w.e. yr−1 km−1 (Bertler et al., 2018), although it is muted around the summit area. Assuming a stable snowfall pattern through time relative to the divide, the divide migration would have caused reduced accumulation rates to be observed during the early part (until 1500 CE) of the RICE accumulation history. With the ice originating up to 500 m west of the divide at the time of deposition, our estimates of Roosevelt Island accumulation rates during this early period may therefore have a small negative bias of up to m w.e. yr−1.
Correcting for the influence of ice divide migration, the main impact on the Roosevelt Island accumulation history is an earlier onset of the period with a more rapid decrease in accumulation rates. The differences are small, however, and the overall pattern of trends in the accumulation rate through time remains the same. In particular, ice divide migration has no impact on accumulation rate trends observed before and after the migration period.
9.1 The RICE accumulation history in a regional perspective
9.1.1 Past accumulation trends across West Antarctica
Regional differences in accumulation, from northern Victoria Land across West Antarctica to Ellsworth Land, may be evaluated by accumulation reconstructions based on ice-core records (Fig. 11).
The RICE accumulation history (Fig. 11f) is much more variable on interannual and decadal scales than the accumulation rate reconstruction from, e.g., WAIS Divide (Fig. 11d). Snowfall at Roosevelt Island is dominated by large and episodic precipitation events (Emanuelsson et al., 2018), which likely contributes to the high interannual variability in RICE accumulation rates. A highly dynamic synoptic-scale system brings this precipitation to Roosevelt Island: positive RICE precipitation anomalies have been linked to the increased occurrence of eastern Ross Sea–Amundsen Sea blocking events associated with a weak state of the quasi-stationary Amundsen Sea Low (ASL) pressure system. These blocking events impede the prevailing westerly winds and direct onshore winds towards the eastern Ross Sea, thereby increasing the precipitation at Roosevelt Island and western Marie Byrd Land (Emanuelsson et al., 2018).
Only the WAIS Divide and RICE ice cores are available for evaluating multi-millennial-scale accumulation trends and corresponding change points in West Antarctica. Over the past 2700 years, WAIS Divide accumulation rates (Fudge et al., 2016) have continuously decreased from a level approximately 25 % higher than today (Fig. 11d). Accumulation rates declined slowly (−0.01 mm yr−2) until around 900 CE, after which the decline became more rapid (−0.04 mm yr−2). This change took place a few centuries before the trend in RICE accumulation rates turned from positive to negative (1300 CE). Covering the last 800 years, the Talos Dome accumulation record (Fig. 11c) shows a relatively constant level during this early period, albeit with large decadal variability (Stenni et al., 2002).
Considering accumulation changes over the last century, more ice-core accumulation records are available from across West Antarctica: from Victoria Land to Ellsworth Land. Most West Antarctic ice cores display decreasing accumulation rates over recent decades, but the timing and strength of the decrease are location dependent. The strongest and most recent decrease is observed at RICE (rate change at 1965 CE, this work), with Siple Dome accumulation rates starting to decrease slightly later (1970 CE, Fig. 11e; Kaspari et al., 2004). The WAIS Divide site displays the latest and weakest change in rate (ca. 1975 CE; estimated from nearby firn cores; Burgener et al., 2013). An extension of the Talos Dome accumulation record to 2010 CE using snow stakes (Fig. 11c) suggests a recent decrease in accumulation rate also at this location (Frezzotti et al., 2007). In contrast, significant increases in accumulation rates are observed in ice cores from Ellsworth Land, where accumulation rates have shown a steady and marked increase during the 20th century (Fig. 11b, Thomas et al., 2015).
The difference in accumulation rate trends across West Antarctica may to a large extent be explained by changes in the location and intensity of the ASL over time. The ASL influences precipitation rates in a dipole pattern: by reducing the number of blocking events, a strong state of the ASL leads to less precipitation over the Ross Ice Shelf area and greater precipitation over Ellsworth Land and the Antarctic Peninsula (Raphael et al., 2016; Emanuelsson et al., 2018). Thus, imposed on West Antarctic accumulation trends, the RICE accumulation history likely reflects the state of the ASL back in time. The precipitation dipole is centered at the West Antarctic ice divide. Hence, the WAIS Divide ice core should be minimally influenced by the strength of the ASL and may therefore be most representative for West Antarctica as a whole (Fudge et al., 2016). The northern Victoria Land region, located west of the Ross Ice Shelf, appears to be relatively unaffected by this ASL-induced dipole effect in precipitation that influences Ellsworth Land and West Antarctica. The recent accumulation decrease observed at Talos Dome has been suggested to be caused partly by increased wind-driven sublimation after deposition due to an increase in mean wind velocities associated with the deepened ASL (Frezzotti et al., 2007).
9.1.2 Connection to sea-ice variability in the Ross Sea
Throughout the satellite era, RICE accumulation rates are strongly correlated with sea-ice extent in the Ross–Amundsen Sea (Jones et al., 2016): years of reduced sea-ice extent are associated with higher accumulation of more isotopically enriched snow and above-normal air temperatures (Bertler et al., 2018).
The expansion of sea ice in the Ross Sea during recent decades has taken place concurrently with a marked reduction of sea ice in the Bellingshausen Sea (Comiso and Nishio, 2008), and both trends have been associated with a strengthening of the ASL: the deepened pressure system causes warm poleward-flowing air masses to cross the Bellingshausen Sea, while the returning cold air passes over the Ross Sea, creating conditions favorable for sea-ice expansion (Hosking et al., 2013; Raphael et al., 2016; Turner et al., 2016). The strength of the ASL affects RICE accumulation rates, with a deep pressure system causing less precipitation at Roosevelt Island. In addition, extended regional sea-ice cover reduces the availability of local moisture sources. With ∼40–60 % of the precipitation arriving to Roosevelt Island originating from local sources in the southern Ross Sea (Tuohy et al., 2015), the relationship between sea-ice extent and precipitation rate at Roosevelt Island may also be ascribed to a longer distillation pathway of moist air masses during periods of extended sea ice (Noone and Simmons, 2004; Kuttel et al., 2012).
The rapid recent decline in Roosevelt Island accumulation rates likely reflects the recent increase in regional sea-ice extent, and we hence suggest 1965 CE to mark the modern onset of rapid sea-ice expansion in the region. Further investigations are required to determine if the strong relationship between Roosevelt Island accumulation rates and eastern Ross Sea sea-ice extent holds over longer timescales. However, the decline in RICE accumulation rates observed since 1300 CE is consistent with previous research indicating that the present increase in sea-ice extent in the Ross–Amundsen Seas is part of a long-term trend that has lasted at least the past 300 years (Thomas and Abram, 2016).
9.1.3 Large-scale circulation changes and implications for recent and future trends in Roosevelt Island accumulation
The ASL is sensitive to large-scale circulation patterns, in particular the Southern Annual Mode (SAM; positive SAM: stronger ASL; e.g., Hosking et al., 2013), via teleconnections to the tropical El Niño–Southern Oscillation (ENSO; stronger ASL during La Niña phase; e.g., Yuan and Martinson, 2000), and the degree to which the two act in phase (Clem and Fogt, 2013). A recent strengthening of SAM has been reported (Marshall, 2003), consistent with the recent deepening of the ASL (Raphael et al., 2016).
It is not clear whether the recent trends in ASL and Ross Sea sea-ice extent can be ascribed to natural variability. Some studies have attributed the positive trend in SAM in recent decades to Antarctic stratospheric ozone depletion and/or global warming from greenhouse gas emissions (Kushner et al., 2001; Turner et al., 2009), thus suggesting that anthropogenic forcing may play a role. In the future, the competing effects of the two (Arblaster et al., 2011) may define the future state of the ASL and thereby the accumulation trends observed at Roosevelt Island and across West Antarctica.
Most other coastal Antarctic sites have experienced a significant increase (∼10 %) in accumulation rates since the 1960s (Frezzotti et al., 2013). The broad similarities and differences noted here raise the question of whether West Antarctic accumulation, as a whole, is decreasing or whether the observed trends merely represent a redistribution of precipitation. It highlights the issue that the current trend in total Antarctic mass balance can only be fully understood pending large spatial data coverage.
9.2 The RICE volcanic record
9.2.1 Bias towards regional volcanism
The volcanic proxy records from RICE were significantly different from those from, e.g., WAIS Divide. At Roosevelt Island, the high background levels of marine sulfate efficiently masked the presence of sulfate from volcanic eruptions. Furthermore, the RICE acidity records contained a large number of significant peaks without counterparts in WAIS Divide. While some of these may be caused by an extreme seasonal influx of marine biogenic sulfuric acids, others may have been produced by regional volcanism.
Apart from sulfate, many volcanoes emit acidic compounds based on halogens, e.g., bromine, chlorine, and fluoride. The halide acids are highly soluble and will be removed from the atmosphere relatively quickly during transport. Hence, they will contribute to increased ice acidity in ice cores located close to the eruption site, whereas only sulfate is deposited from distant volcanic eruptions (e.g., Clausen et al., 1997). By using acidity as the primary volcanic tracer (instead of sulfur), we would therefore expect the resulting volcanic record to be particularly sensitive to regional volcanism. This may be a disadvantage of using acidity as volcanic tracer, since a high number of regional volcanic horizons will tend to complicate volcanic matching to other cores.
Such geographical bias may be especially important for the Roosevelt Island ice-core records, since there is a prevalence of quiescent regional volcanism with a relatively high halogen content in West Antarctica (Zreda-Gostynska et al., 1997). Indeed, preliminary investigations suggest that the RICE volcanic records may be biased towards regional volcanism: comparing down-sampled acidity to the discrete sulfur measurements, we observed a tendency towards a larger relative size of peaks in acidity for volcanic horizons that were not classified as originating from far-field eruptions. Some of the peaks distinctly observed in the RICE acidity records, but not present in the WAIS Divide sulfur records, may therefore be due to regional volcanism. This may be part of the explanation for why the volcanic records from the two sites are so different.
9.2.2 Dipole effect in deposition of volcanic tracers across West Antarctica
Differences in snow deposition across West Antarctica, influenced by the ASL, may further complicate volcanic matching between ice cores in this region. The ASL dipole acts to direct storm systems either toward the Antarctic Peninsula–Ellsworth Land region or toward the western Marie Byrd Land–Ross Ice Shelf region. As these storm tracks are associated with snowfall and the wet deposition of ions, this is likely to favor the deposition and preservation of volcanic signals in one location (e.g., Antarctic Peninsula) at the expense of the other (RICE, Siple Dome).
An anti-phase in snow accumulation may thus be part of the explanation for the difference between the WAIS Divide and RICE volcanic records. While most of the major volcanic signals in WAIS Divide also exist in RICE, they are not necessarily associated with a prominent signal. The absence of a volcanic signal in the RICE core from large far-field volcanic eruptions may be due to a particularly strong ASL state at the time, directing precipitation and sulfate ions away from Roosevelt Island. A detailed comparison of volcanic records from multiple ice cores is required to evaluate the importance of the ASL for the deposition of volcanic tracers across West Antarctica.
9.2.3 Volcanic synchronization of low-elevation coastal ice cores
A range of obstacles were overcome to carry out volcanic identification in the RICE core. Similar difficulties will likely challenge volcanic synchronization for other low-elevation coastal Antarctic ice cores (e.g., Philippe et al., 2016), for which many drilling projects are planned within the near future. The methods proposed here may also be relevant for these cores.
Robust volcanic matching of RICE and WAIS Divide was possible only with the aid of accurate, high-resolution ice-core timescales for both cores. This demonstrates the importance of building an Antarctic-wide network of accurately dated volcanic reference horizons based on tephra, sulfate, and acidity. Particular emphasis should be placed on the production of annually counted timescales for Antarctic ice cores, especially as new and/or improved measurement methods allow for the production of high-resolution impurity records for relatively high-accumulation Antarctic sites, such as RICE.
The upper part of the RICE ice core from Roosevelt Island, Ross Ice Shelf, West Antarctica, was dated by annual-layer counting back to 700 BCE based on multiple high-resolution impurity records. The timescale covers a period of stable ice flow after the establishment of an ice divide at Roosevelt Island. The chronology was validated by comparison to the timescale from the WAIS Divide ice core, West Antarctica, by matching sequences of volcanic events visible primarily in direct measurements of ice-core acidity and non-sea-salt conductivity. The maritime environment at Roosevelt Island gave rise to challenging conditions for identifying volcanic signatures in the ice core, and the volcanic matching was confirmed by matching centennial-scale variability in atmospheric methane concentrations measured in the two ice cores. The RICE17 and WD2014 timescales were found to be in excellent agreement.
Based on the layer thickness profile, we produced an annual accumulation record for Roosevelt Island for the past 2700 years. Similar accumulation histories are observed in three Roosevelt Island ice cores covering recent times, giving confidence that RICE is a reliable climate archive suitable for further understanding of climate variability across West Antarctica.
Roosevelt Island accumulation rates were slightly increasing from 700 BCE until 1300 CE, after which accumulation rates have consistently decreased. Current accumulation trends at Roosevelt Island indicate a rapid decline of 0.8 mm yr−2, starting in the mid-1960s. The modern accumulation rate of 0.21 m w.e yr−1 (average since 1965 CE) is at the low extreme of observed values during the past several thousand years. The low present-day accumulation rate has been linked to a strengthening of the Amundsen Sea Low and the expansion of sea ice in the eastern Ross Sea. The current increase in sea ice in the Ross Sea is therefore likely part of a long-term increasing trend, although the rapid increase since the mid-1960s may have an anthropogenic origin.
The following data are available online.
-
RICE17 timescale and RICE accumulation rates (2012 CE–700 BCE) are archived at the PANGAEA database at https://doi.org/10.1594/PANGAEA.899147 (Winstrup et al., 2019) and are also available in the Supplement.
-
The complete RICE17 timescale (back to 83 000 yr BP) is archived at PANGAEA: https://doi.org/10.1594/PANGAEA.899571 (Lee et al., 2018; Winstrup et al., 2019).
-
Volcanic match points between RICE and WAIS Divide (2012 CE–700 BCE; Table 2) are available in the Supplement.
-
RID-75 isotope and beta-activity records have been archived at PANGAEA at https://doi.org/10.1594/PANGAEA.899157 (Clausen et al., 1979; Winstrup et al., 2019).
-
Separate timescales and accumulation rate histories from RICE, RICE-12/13-B, and RID-75 cores are available in the Supplement.
-
Roosevelt Island radar data are archived at the U.S. Antarctic Program Data Center, available at http://www.usap-dc.org/view/dataset/601070 and https://doi.org/10.15784/601070 (Kingslake et al., 2014; Matsuoka et al., 2015).
The supplement related to this article is available online at: https://doi.org/10.5194/cp-15-751-2019-supplement.
The paper was written by MW with contributions from PV, TJF, and JEL. The ice-core chemistry records were produced by HAK, MFS, PV, RE, AE, AT, and PAM; the water isotope measurements were made by BDE, EDK, and RLP; the ECM record was compiled by PDN; and the ice-core gas records were produced by JEL, TB, EJB, and GC. The layer-counted timescale was developed by MW, HAK, MHR, PV, and AS. Volcanic identification and synchronization to WAIS Divide were performed by MW, HAK, and PV. Tephra analysis was completed by AVK and SW. Delta-age modeling and methane matching to WAIS Divide were developed by JEL, CB, and EJB. TJF constructed the thinning function in dialogue with EDW, HC, JEL, MW, and RCAH. Interpretation of the accumulation rate history was performed by MW, PV, and HAK. NANB, DDJ, and HC led the RICE project. All authors contributed to improving the final paper.
The authors declare that they have no conflict of interest.
This work is a contribution to the Roosevelt Island Climate Evolution (RICE) Program, funded by national contributions from New Zealand, Australia, Denmark, Germany, Italy, China, Sweden, UK, and USA. The main logistic support was provided by Antarctica New Zealand (K049) and the US Antarctic Program. We thank all the people involved in the RICE logistics, fieldwork, sampling, and analytical programs. The Danish contribution to RICE was funded by the Carlsberg Foundation's North–South Climate Connections project grant. The research also received funding from the European Research Council under the European Community's Seventh Framework Programme (FP7/2007-2013) ERC grant agreement 610055 as part of the Ice2Ice project. The RICE Program was supported by funding from NSF grants (PLR-1042883, ANT-0837883, ANT-0944021, ANT-0944307, and ANT-1643394) and New Zealand Ministry of Business, Innovation, and Employment grants issued through Victoria University of Wellington (RDF-VUW-1103, 15-VUW-131), GNS Science (540GCT32, 540GCT12), and Antarctica New Zealand (K049). Figure 1 was made using Quantarctica2 (Norwegian Polar Institute) base maps and QGIS software. We acknowledge the WAIS Divide ice-core project and thank Joe McConnell, Jihong Cole-Dai, and the students and staff of the ice-core labs at the Desert Research Institute and at South Dakota State University for providing the WAIS Divide sulfate data. We have presented here ice-core data collected and analyzed by Henrik Clausen, Willi Dansgaard, Sigfus Johnsen, Steffen Bo Hansen, and Jan Nielsen under the Ross Ice Shelf Project (RISP) carried out between 1973 and 1978. We acknowledge the pioneering work conducted by these researchers and the ongoing international collaborations they established.
This paper was edited by Marit-Solveig Seidenkrantz and reviewed by four anonymous referees.
Abbott, P. M., Davies, S. M., Steffensen, J. P., Pearce, N. J. G., Bigler, M., Johnsen, S. J., Seierstad, I. K., Svensson, A., and Wastegård, S.: A detailed framework of Marine Isotope Stages 4 and 5 volcanic events recorded in two Greenland ice-cores, Quaternary Sci. Rev., 36, 59–77, https://doi.org/10.1016/j.quascirev.2011.05.001, 2012.
Alley, R. B., Meese, D. A., Shuman, C. A., Gow, A. J., Taylor, K. C., Grootes, P. M., White, J. W. C., Ram, M., Waddington, E. D., Mayewski, P. A., and Zielinski, G. A.: Abrupt increase in Greenland snow accumulation at the end of the Younger Dryas event, Nature, 362, 527–529, https://doi.org/10.1038/362527a0, 1993.
Andersen, K., Svensson, A., Johnsen, S., Rasmussen, S., Bigler, M., Röthlisberger, R., Ruth, U., Siggaard-Andersen, M.-L., Steffensen, J., Dahl-Jensen, D., Vinther, B., and Clausen, H.: The Greenland Ice Core Chronology 2005, 15–42ka. Part 1: constructing the time scale, Quaternary Sci. Rev., 25, 3246–3257, https://doi.org/10.1016/j.quascirev.2006.08.002, 2006.
Arblaster, J. M., Meehl, G. A., and Karoly, D. J.: Future climate change in the Southern Hemisphere: Competing effects of ozone and greenhouse gases, Geophys. Res. Lett., 38, 1–6, https://doi.org/10.1029/2010GL045384, 2011.
Arienzo, M. M., McConnell, J. R., Chellman, N., Criscitiello, A. S., Curran, M., Fritzsche, D., Kipfstuhl, S., Mulvaney, R., Nolan, M., Opel, T., Sigl, M., and Steffensen, J. P.: A Method for Continuous 239Pu Determinations in Arctic and Antarctic Ice Cores, Environ. Sci. Technol., 50, 7066–7073, https://doi.org/10.1021/acs.est.6b01108, 2016.
Bauer, S. E., Bausch, A., Nazarenko, L., Tsigaridis, K., Xu, B., Edwards, R., Bisiaux, M., and McConnell, J.: Historical and future black carbon deposition on the three ice caps: Ice core measurements and model simulations from 1850 to 2100, J. Geophys. Res.-Atmos., 118, 7948–7961, https://doi.org/10.1002/jgrd.50612, 2013.
Bender, M. L., Sowers, T., Barnola, J. M., and Chappellaz, J.: Changes in the O2∕N2 ratio of the atmosphere during recent decades reflected in the composition of air in the firn at Vostok Station, Antarctica, Geophys. Res. Lett., 21, 189–192, https://doi.org/10.1029/93GL03548, 1994.
Bentley, C. R. and Giovinetto, M. B.: Ice-flow studies on the ice dome of Roosevelt Island, Antarctica, EOS T. Am. Geophys. Un., 43, 369–372, 1962.
Bertler, N. A. N., Conway, H., Dahl-Jensen, D., Emanuelsson, D. B., Winstrup, M., Vallelonga, P. T., Lee, J. E., Brook, E. J., Severinghaus, J. P., Fudge, T. J., Keller, E. D., Baisden, W. T., Hindmarsh, R. C. A., Neff, P. D., Blunier, T., Edwards, R., Mayewski, P. A., Kipfstuhl, S., Buizert, C., Canessa, S., Dadic, R., Kjær, H. A., Kurbatov, A., Zhang, D., Waddington, E. D., Baccolo, G., Beers, T., Brightley, H. J., Carter, L., Clemens-Sewall, D., Ciobanu, V. G., Delmonte, B., Eling, L., Ellis, A., Ganesh, S., Golledge, N. R., Haines, S., Handley, M., Hawley, R. L., Hogan, C. M., Johnson, K. M., Korotkikh, E., Lowry, D. P., Mandeno, D., McKay, R. M., Menking, J. A., Naish, T. R., Noerling, C., Ollive, A., Orsi, A., Proemse, B. C., Pyne, A. R., Pyne, R. L., Renwick, J., Scherer, R. P., Semper, S., Simonsen, M., Sneed, S. B., Steig, E. J., Tuohy, A., Venugopal, A. U., Valero-Delgado, F., Venkatesh, J., Wang, F., Wang, S., Winski, D. A., Winton, V. H. L., Whiteford, A., Xiao, C., Yang, J., and Zhang, X.: The Ross Sea Dipole – temperature, snow accumulation and sea ice variability in the Ross Sea region, Antarctica, over the past 2700 years, Clim. Past, 14, 193–214, https://doi.org/10.5194/cp-14-193-2018, 2018.
Bigler, M., Svensson, A., Kettner, E., Vallelonga, P., Nielsen, M. E., and Steffensen, J. P.: Optimization of high-resolution continuous flow analysis for transient climate signals in ice cores, Environ. Sci. Technol., 45, 4483–4489, https://doi.org/10.1021/es200118j, 2011.
Bisiaux, M. M., Edwards, R., McConnell, J. R., Curran, M. A. J., Van Ommen, T. D., Smith, A. M., Neumann, T. A., Pasteris, D. R., Penner, J. E., and Taylor, K.: Changes in black carbon deposition to Antarctica from two high-resolution ice core records, 1850–2000 AD, Atmos. Chem. Phys., 12, 4107–4115, https://doi.org/10.5194/acp-12-4107-2012, 2012.
Blunier, T. and Brook, E. J.: Timing of Millennial-Scale Climate Change in Antarctica and Greenland During the Last Glacial Period, Science, 291, 109–112, https://doi.org/10.1126/science.291.5501.109, 2001.
Blunier, T., Chappellaz, J., Schwander, J., Dällenbach, A., Stauffer, B., Stocker, T. F., Raynaud, D., Jouzel, J., Clausen, H. B., Hammer, C. U., and Johnsen, S. J.: Asynchrony of Antarctic and Greenland climate change during the last glacial period, Nature, 394, 739–743, https://doi.org/10.1038/29447, 1998.
Buizert, C., Cuffey, K. M., Severinghaus, J. P., Baggenstos, D., Fudge, T. J., Steig, E. J., Markle, B. R., Winstrup, M., Rhodes, R. H., Brook, E. J., Sowers, T. A., Clow, G. D., Cheng, H., Edwards, R. L., Sigl, M., McConnell, J. R., and Taylor, K. C.: The WAIS Divide deep ice core WD2014 chronology – Part 1: Methane synchronization (68–31 ka BP) and the gas age–ice age difference, Clim. Past, 11, 153–173, https://doi.org/10.5194/cp-11-153-2015, 2015.
Burgener, L., Rupper, S., Koenig, L., Forster, R., Christensen, W. F., Williams, J., Koutnik, M., Miège, C., Steig, E. J., Tingey, D., Keeler, D., and Riley, L.: An observed negative trend in West Antarctic accumulation rates from 1975 to 2010: Evidence from new observed and simulated records, J. Geophys. Res.-Atmos., 118, 4205–4216, https://doi.org/10.1002/jgrd.50362, 2013.
Clapp, J. L.: Summary and Discussion of Survey Control for Ice Flow Studies on Roosevelt Island, Antarctica, University of Wisconsin, Geophysical and Polar Research Center, Research Report Series, 65-1, 98 pp., 1965.
Clausen, H. B. and Dansgaard, W.: Less surface accumulation on the Ross Ice Shelf than hitherto assumed, IAHS, 118, 172–176, 1977.
Clausen, H. B., Dansgaard, W., Nielsen, J. O., and Clough, J. W.: Surface accumulation on Ross Ice Shelf, Antarct. J. U.S., 14, 68–74, 1979.
Clausen, H. B., Hammer, C. U., Hvidberg, C. S., Dahl-Jensen, D., Steffensen, J. P., Kipfstuhl, J., and Legrand, M.: A comparison of the volcanic records over the past 4000 years from the Greenland Ice Core Project and Dye 3 Greenland ice cores, J. Geophys. Res.-Oceans, 102, 26707–26723, https://doi.org/10.1029/97JC00587, 1997.
Clem, K. R. and Fogt, R. L.: Varying roles of ENSO and SAM on the Antarctic Peninsula climate in austral spring, J. Geophys. Res.-Atmos., 118, 11481–11492, https://doi.org/10.1002/jgrd.50860, 2013.
Comiso, J. C. and Nishio, F.: Trends in the sea ice cover using enhanced and compatible AMSR-E, SSM/I, and SMMR data, J. Geophys. Res.-Oceans, 113, 1–22, https://doi.org/10.1029/2007JC004257, 2008.
Conway, H., Hall, B., Denton, G., Gades, A., and Waddington, E.: Past and future grounding-line retreat of the West Antarctic ice sheet, Science, 286, 280–283, https://doi.org/10.1126/science.286.5438.280, 1999.
Curran, M. A. J., van Ommen, T. D., and Morgan, V.: Seasonal characteristics of the major ions in the high-accumulation Dome Summit South ice core, Law Dome, Antarctica, Ann. Glaciol., 27, 385–390, https://doi.org/10.3189/1998AoG27-1-385-390, 1998.
Dahl-Jensen, D., Johnsen, S., Hammer, C., Clausen, H., and Jouzel, J.: Past accumulation rates derived from observed annual layers in the GRIP ice core from Summit, Central Greenland, in: Ice in the Climate System, NATO ASI Series, edited by: Peltier, W. R., Springer, Berlin, Heidelberg, Germany, vol. I-12, 517–532, https://doi.org/10.1007/978-3-642-85016-5_29, 1993.
Dansgaard, W.: Stable isotopes in precipitation, Tellus, 16, 436–468, https://doi.org/10.3402/tellusa.v16i4.8993, 1964.
Dee, D. P., Uppala, S. M., Simmons, A. J., Berrisford, P., Poli, P., Kobayashi, S., Andrae, U., Balmaseda, M. A., Balsamo, G., Bauer, P., Bechtold, P., Beljaars, A. C. M., van de Berg, L., Bidlot, J., Bormann, N., Delsol, C., Dragani, R., Fuentes, M., Geer, A. J., Haimberger, L., Healy, S. B., Hersbach, H., Hólm, E. V., Isaksen, L., Kållberg, P., Köhler, M., Matricardi, M., Mcnally, A. P., Monge-Sanz, B. M., Morcrette, J. J., Park, B. K., Peubey, C., de Rosnay, P., Tavolato, C., Thépaut, J. N., and Vitart, F.: The ERA-Interim reanalysis: Configuration and performance of the data assimilation system, Q. J. Roy. Meteor. Soc., 137, 553–597, https://doi.org/10.1002/qj.828, 2011.
Dunbar, N. W., Kurbatov, A. V., Koffman, B. G., and Kreutz, K. J.: Tephra Record of Local and Distal Volcanism in the WAIS Divide Ice Core, WAIS Divide Science Meeting, 30 September–1 October 2010, La Jolla, CA, USA, available at: https://geoinfo.nmt.edu/staff/dunbar/publications/abstracts/dakk2010.html (last access: 24 March 2019), 2010.
Emanuelsson, B. D., Baisden, W. T., Bertler, N. A. N., Keller, E. D., and Gkinis, V.: High-resolution continuous-flow analysis setup for water isotopic measurement from ice cores using laser spectroscopy, Atmos. Meas. Tech., 8, 2869–2883, https://doi.org/10.5194/amt-8-2869-2015, 2015.
Emanuelsson, B. D., Bertler, N. A. N., Neff, P. D., Renwick, J. A., Markle, B. R., Baisden, W. T., and Keller, E. D.: The role of Amundsen–Bellingshausen Sea anticyclonic circulation in forcing marine air intrusions into West Antarctica, Clim. Dynam., 51, 3579–3596, https://doi.org/10.1007/s00382-018-4097-3, 2018.
EPICA Community Members: One-to-one coupling of glacial climate variability in Greenland and Antarctica, Nature, 444, 195–198, https://doi.org/10.1038/nature05301, 2006.
Frezzotti, M., Urbini, S., Proposito, M., Scarchilli, C., and Gandolfi, S.: Spatial and temporal variability of surface mass balance near Talos Dome, East Antarctica, J. Geophys. Res.-Earth, 112, F02032, https://doi.org/10.1029/2006JF000638, 2007.
Frezzotti, M., Scarchilli, C., Becagli, S., Proposito, M., and Urbini, S.: A synthesis of the Antarctic surface mass balance during the last 800 yr, The Cryosphere, 7, 303–319, https://doi.org/10.5194/tc-7-303-2013, 2013.
Frieß, U., Deutschmann, T., Gilfedder, B. S., Weller, R., and Platt, U.: Iodine monoxide in the Antarctic snowpack, Atmos. Chem. Phys., 10, 2439–2456, https://doi.org/10.5194/acp-10-2439-2010, 2010.
Fudge, T. J., Markle, B. R., Cuffey, K. M., Buizert, C., Taylor, K. C., Steig, E. J., Waddington, E. D., Conway, H., and Koutnik, M.: Variable relationship between accumulation and temperature in West Antarctica for the past 31 000 years, Geophys. Res. Lett. 43, 3795–3803, https://doi.org/10.1002/2016GL068356, 2016.
Gabrieli, J., Cozzi, G., Vallelonga, P., Schwikowski, M., Sigl, M., Eickenberg, J., Wacker, L., Boutron, C., Gäggeler, H., Cescon, P., and Barbante, C.: Contamination of Alpine snow and ice at Colle Gnifetti, Swiss/Italian Alps, from nuclear weapons tests, Atmos. Environ., 45, 587–593, https://doi.org/10.1016/j.atmosenv.2010.10.039, 2011.
Hammer, C.: Acidity of polar ice cores in relation to absolute dating, past volcanism, and radio-echoes, J. Glaciol., 25, 359–372, https://doi.org/10.3189/S0022143000015227, 1980.
Hammer, C., Clausen, H. B., Dansgaard, W., Gundestrup, N., Johnsen, S., and Reeh, N.: Dating of Greenland ice cores by flow models, isotopes, volcanic debris, and continental dust, J. Glaciol., 20, 3–26, https://doi.org/10.3189/S0022143000021183, 1978.
Haran, T., Bohlander, J., Scambos, T., Painter, T., and Fahnestock, M.: MODIS Mosaic of Antarctica 2003–2004 (MOA2004) Image Map, National Snow and Ice Data Center, Boulder, Colorado, USA, 2013.
Herron, M. M. and Langway, C. C.: Dating of Ross Ice Shelf Cores by Chemical Analysis, J. Glaciol., 24, 345–356, https://doi.org/10.3189/S0022143000014866, 1979.
Herron, M. M. and Langway, C. C.: Firn densification: An empirical model, J. Glaciol., 25, 373–385, https://doi.org/10.3189/S0022143000015239, 1980.
Hosking, J. S., Orr, A., Marshall, G. J., Turner, J., and Phillips, T.: The Influence of the Amundsen-Bellingshausen Seas Low on the Climate of West Antarctica and Its Representation in Coupled Climate Model Simulations, J. Climate, 26, 6633–6648, https://doi.org/10.1175/JCLI-D-12-00813.1, 2013.
Jiracek, G. R.: Radio sounding of Antarctic ice, University of Wisconsin, Geophysical and Polar Research Center, Research Report Series 67-1, 127 pp., 1967.
Jones, J. M., Gille, S., Goosse, H., Abram, N. J., Canziani, P., Charman, D., Clem, K., Crosta, X., Lavergne, C. de, Eisenman, G., England, M. H., Fogt, R., Frankcombe, L. M., Marshall, G., Masson-delmotte, V., Morrison, A. K., Orsi, A., Raphael, M. N., Renwick, J. A., Schneider, D. P., Simpkins, G. R., Steig, E. J., Stenni, B., Swingedouw, D., and Vance, T. R.: Assessing recent trends in high-latitude Southern Hemisphere surface climate, Nat. Clim. Change, 6, 917–926, https://doi.org/10.1038/nclimate3103, 2016.
Kaspari, S., Mayewski, P. A., Dixon, D. A., Spikes, V. B., Sneed, S. B., Handley, M. J., and Hamilton, G. S.: Climate variability in West Antarctica derived from annual accumulation-rate records from ITASE firn/ice cores, Ann. Glaciol., 39, 585–594, https://doi.org/10.3189/172756404781814447, 2004.
Keller, E. D., Baisden, W. T., Bertler, N. A. N., Emanuelsson, B. D., Canessa, S., and Phillips, A.: Calculating uncertainty for the RICE ice core continuous flow analysis water isotope record, Atmos. Meas. Tech., 11, 4725–4736, https://doi.org/10.5194/amt-11-4725-2018, 2018.
Kingslake, J., Hindmarsh, R. C. A., Adalgeirsdottir, G., Conway, H., Pritchard, H. D., Corr, H. F. J., Gillet-Chaulet, F., Martin, C., King, E. C., Mulvaney, R., and Pritchard, H. D.: Full-depth englacial vertical ice sheet velocities measured using phase-sensitive radar, J. Geophys. Res.-Earth, 119, 2604–1618, https://doi.org/10.1002/2014JF003275, 2014.
Kjær, H. A., Vallelonga, P., Svensson, A., Elleskov Kristensen, M. L., Tibuleac, C., Winstrup, M., and Kipfstuhl, S.: An Optical Dye Method for Continuous Determination of Acidity in Ice Cores, Environ. Sci. Technol., 50, 10485–10493, https://doi.org/10.1021/acs.est.6b00026, 2016.
Kurbatov, A. V., Kalteyer, D. A., Dunbar, N. W., Yates, M. G., Iverson, N. A., and Bertler, N. A.: Major element analyses of visible tephra layers in the Roosevelt Island Climate Evolution Project ice core (Antarctica), Interdiscip. Earth Data Alliance, https://doi.org/10.1594/IEDA/100554, 2015.
Kushner, P. J., Held, I. M., and Delworth, T. L.: Southern Hemisphere Atmospheric Circulation Response to Global Warming, J. Climate, 14, 2238–2249, https://doi.org/10.1175/1520-0442(2001)014<0001:SHACRT>2.0.CO;2, 2001.
Kuttel, M., Steig, E. J., Ding, Q., Monaghan, A. J., and Battisti, D. S.: Seasonal climate information preserved in West Antarctic ice core water isotopes?: relationships to temperature, large-scale circulation, and sea ice, Clim. Dynam., 39, 1841–1857, https://doi.org/10.1007/s00382-012-1460-7, 2012.
Lamarque, J.-F., Bond, T. C., Eyring, V., Granier, C., Heil, A., Klimont, Z., Lee, D., Liousse, C., Mieville, A., Owen, B., Schultz, M. G., Shindell, D., Smith, S. J., Stehfest, E., Van Aardenne, J., Cooper, O. R., Kainuma, M., Mahowald, N., McConnell, J. R., Naik, V., Riahi, K., and van Vuuren, D. P.: Historical (1850–2000) gridded anthropogenic and biomass burning emissions of reactive gases and aerosols: methodology and application, Atmos. Chem. Phys., 10, 7017–7039, https://doi.org/10.5194/acp-10-7017-2010, 2010.
Langway, C. C., Herron, M., and Cragin, J. H.: Chemical Profile of the Ross Ice Shelf at Little America V, Antarctica, J. Glaciol., 13, 431–435, https://doi.org/10.3189/S0022143000023200, 1974.
Lee, J. E., Brook, E. J., Bertler, N. A. N., Buizert, C., Baisden, T., Blunier, T., Ciobanu, V. G., Conway, H., Dahl-Jensen, D., Fudge, T. J., Hindmarsh, R., Keller, E. D., Parrenin, F., Severinghaus, J. P., Vallelonga, P., Waddington, E. D., and Winstrup, M.: An 83 000 year old ice core from Roosevelt Island, Ross Sea, Antarctica, Clim. Past Discuss., https://doi.org/10.5194/cp-2018-68, in review, 2018.
Legrand, M., Feniet-Saigne, C., Saltzman, E. S., Germain, C., Barkov, N. I., and Petrov, V. N.: Ice-core record of oceanic emissions of dimethylsulphide during the last climate cycle, Nature, 350, 144–146, https://doi.org/10.1038/350144a0, 1991.
Lliboutry, L. A.: A critical review of analytical approximate solutions for steady state velocities and temperatures in cold ice sheets, Gletscherkd. Glazialgeol, 15, 135–148, 1979.
Marshall, G. J.: Trends in the Southern Annular Mode from Observations and Reanalyses, J. Climate, 16, 4134–4143, https://doi.org/10.1175/1520-0442(2003)016<4134:TITSAM>2.0.CO;2, 2003.
Martín, C., Hindmarsh, R. C. A., and Navarro, F. J.: Dating ice flow change near the flow divide at Roosevelt Island, Antarctica, by using a thermomechanical model to predict radar stratigraphy, J. Geophys. Res.-Earth., 111, 1–15, https://doi.org/10.1029/2005JF000326, 2006.
Matsuoka, K., Hindmarsh, R. C. A., Moholdt, G., Bentley, M. J., Pritchard, H. D., Brown, J., Conway, H., Drews, R., Durand, G., Goldberg, D., Hattermann, T., Kingslake, J., Lenaerts, J. T. M., Martín, C., Mulvaney, R., Nicholls, K. W., Pattyn, F., Ross, N., Scambos, T., and Whitehouse, P. L.: Earth-Science Reviews Antarctic ice rises and rumples: Their properties and signi fi cance for ice-sheet dynamics and evolution, Earth-Sci. Rev., 150, 724–745, https://doi.org/10.1016/j.earscirev.2015.09.004, 2015.
McConnell, J. R., Edwards, R., Kok, G. L., Flanner, M. G., and Zender, C. S.: 20th-century industrial black carbon emissions altered Arctic climate forcing, Science, 317, 1381–1384, https://doi.org/10.1126/science.1144856, 2007.
Mitchell, L. E., Brook, E. J., Sowers, T., McConnell, J. R., and Taylor, K.: Multidecadal variability of atmospheric methane, 1000–1800 CE, J. Geophys. Res.-Biogeo., 116, 1–16, https://doi.org/10.1029/2010JG001441, 2011.
Mitchell, L. E., Brook, E. J., Lee, J. E., Buizert, C., and Sowers, T.: Constraints on the Late Holocene Anthropogenic Contribution to the Atmospheric Methane Budget, Science, 342, 964–966, https://doi.org/10.1126/science.1238920, 2013.
Mudelsee, M.: Break function regression, Eur. Phys. J.-Spec. Top., 174, 49–63, https://doi.org/10.1140/epjst/e2009-01089-3, 2009.
Muscheler, R., Adolphi, F., and Knudsen, M. F.: Assessing the differences between the IntCal and Greenland ice-core time scales for the last 14 000 years via the common cosmogenic radionuclide variations, Quaternary Sci. Rev., 106, 81–87, https://doi.org/10.1016/j.quascirev.2014.08.017, 2014.
Narcisi, B., Proposito, M., and Frezzotti, M.: Ice record of a 13th century explosive volcanic eruption in northern Victoria Land, East Antarctica, Antarct. Sci., 13, 174–181, https://doi.org/10.1017/S0954102001000268, 2001.
Narcisi, B., Petit, J. R., Delmonte, B., Scarchilli, C., and Stenni, B.: A 16 000-yr tephra framework for the Antarctic ice sheet: A contribution from the new Talos Dome core, Quaternary Sci. Rev., 49, 52–63, https://doi.org/10.1016/j.quascirev.2012.06.011, 2012.
Nereson, N. A. and Waddington, E. D.: Isochrones and isotherms beneath migrating ice divides, J. Glaciol., 48, 95–108, https://doi.org/10.3189/172756502781831647, 2002.
Noone, D. and Simmons, I.: Sea ice control of water isotope transport to Antarctica and implications for ice core interpretation, J. Geophys. Res.-Atmos., 109, 1–13, https://doi.org/10.1029/2003JD004228, 2004.
Nye, J. F.: Correction Factor for Accumulation Measured by the Thickness of the Annual Layers in an Ice Sheet, J. Glaciol., 4, 785–788, https://doi.org/10.3189/S0022143000028367, 1963.
Philippe, M., Tison, J.-L., Fjøsne, K., Hubbard, B., Kjær, H. A., Lenaerts, J. T. M., Drews, R., Sheldon, S. G., De Bondt, K., Claeys, P., and Pattyn, F.: Ice core evidence for a 20th century increase in surface mass balance in coastal Dronning Maud Land, East Antarctica, The Cryosphere, 10, 2501–2516, https://doi.org/10.5194/tc-10-2501-2016, 2016.
Rabiner, L. R.: A Tutorial on Hidden Markov Models and Selected Applications in Speech Recognition, Proc. IEEE, 77, 257–286, https://doi.org/10.1109/5.18626, 1989.
Raisbeck, G. M., Cauquoin, A., Jouzel, J., Landais, A., Petit, J.-R., Lipenkov, V. Y., Beer, J., Synal, H.-A., Oerter, H., Johnsen, S. J., Steffensen, J. P., Svensson, A., and Yiou, F.: An improved north–south synchronization of ice core records around the 41 kyr 10Be peak, Clim. Past, 13, 217–229, https://doi.org/10.5194/cp-13-217-2017, 2017.
Raphael, M. N., Marshall, G. J., Turner, J., Fogt, R. L., Schneider, D., Dixon, D. A., Hosking, J. S., Jones, J. M., and Hobbs, W. R.: The Amundsen sea low: Variability, change, and impact on Antarctic climate, B. Am. Meteorol. Soc., 97, 111–121, https://doi.org/10.1175/BAMS-D-14-00018.1, 2016.
Rasmussen, S. O., Andersen, K. K., Svensson, A. M., Steffensen, J. P., Vinther, B. M., Clausen, H. B., Siggaard-Andersen, M. L., Johnsen, S. J., Larsen, L. B., Dahl-Jensen, D., Bigler, M., Röthlisberger, R., Fischer, H., Goto-Azuma, K., Hansson, M. E., and Ruth, U.: A new Greenland ice core chronology for the last glacial termination, J. Geophys. Res.-Atmos., 111, D06102, https://doi.org/10.1029/2005JD006079, 2006.
Raymond, C. F.: Deformation in the Vicinity of Ice Divides, J. Glaciol., 29, 357–373, https://doi.org/10.3189/S0022143000030288, 1983.
Schultz, M. G., Heil, A., Hoelzemann, J. J., Spessa, A., Thonicke, K., Goldammer, J. G., Held, A. C., Pereira, J. M. C., and van Het Bolscher, M.: Global wildland fire emissions from 1960 to 2000, Global Biogeochem. Cy., 22, 1–17, https://doi.org/10.1029/2007GB003031, 2008.
Schwander, J. and Stauffer, B.: Age difference between polar ice and the air trapped in its bubbles, Nature, 311, 45–47, https://doi.org/10.1038/311045a0, 1984.
Shepherd, A., Ivins, E. R., A, G., Barletta, V. R., Bentley, M. J., Bettadpur, S., Briggs, K. H., Bromwich, D. H., Forsberg, R., Galin, N., Horwath, M., Jacobs, S., Joughin, I., King, M. A., Lenaerts, J. T., Li, J., Ligtenberg, S. R. M., Luckman, A., McMillan, M., Meister, R., Milne, G., Mouginot, J., Muir, A., Nicolas, J., Paden, J., Payne, A. J., Pritchard, H. D., Rignot, E., Rott, H., Sørensen, L. S., Scambos, T. A., Scheuchl, B., Schrama, E. J. O., Smith, B., Sundal, A. V, Angelen, J. H. van, Berg, W. J. van der, Broeke, M. R. van der, Vaughan, D. G., Velicogna, I., Wahr, J., Whitehouse, P. L., Wingham, D. J., Yi, D., Young, D., and Zwally, H. J.: A Reconciled Estimate of Ice-Sheet Mass Balance, Science, 338, 1183–1189, https://doi.org/10.1126/science.1228102, 2012.
Sigl, M., McConnell, J. R., Layman, L., Maselli, O., McGwire, K., Pasteris, D., Dahl-Jensen, D., Steffensen, J. P., Vinther, B., Edwards, R., Mulvaney, R., and Kipfstuhl, S.: A new bipolar ice core record of volcanism from WAIS Divide and NEEM and implications for climate forcing of the last 2000 years, J. Geophys. Res.-Atmos., 118, 1151–1169, https://doi.org/10.1029/2012JD018603, 2013.
Sigl, M., Winstrup, M., McConnell, J. R., Welten, K. C., Plunkett, G., Ludlow, F., Büntgen, U., Caffee, M., Chellman, N., Dahl-Jensen, D., Fischer, H., Kipfstuhl, S., Kostick, C., Maselli, O. J., Mekhaldi, F., Mulvaney, R., Muscheler, R., Pasteris, D. R., Pilcher, J. R., Salzer, M., Schüpbach, S., Steffensen, J. P., Vinther, B. M., and Woodruff, T. E.: Timing and climate forcing of volcanic eruptions for the past 2500 years, Nature, 523, 543–549, https://doi.org/10.1038/nature14565, 2015.
Sigl, M., Fudge, T. J., Winstrup, M., Cole-Dai, J., Ferris, D., McConnell, J. R., Taylor, K. C., Welten, K. C., Woodruff, T. E., Adolphi, F., Bisiaux, M., Brook, E. J., Buizert, C., Caffee, M. W., Dunbar, N. W., Edwards, R., Geng, L., Iverson, N., Koffman, B., Layman, L., Maselli, O. J., McGwire, K., Muscheler, R., Nishiizumi, K., Pasteris, D. R., Rhodes, R. H., and Sowers, T. A.: The WAIS Divide deep ice core WD2014 chronology – Part 2: Annual-layer counting (0–31 ka BP), Clim. Past, 12, 769–786, https://doi.org/10.5194/cp-12-769-2016, 2016.
Spolaor, A., Vallelonga, P., Gabrieli, J., Martma, T., Björkman, M. P., Isaksson, E., Cozzi, G., Turetta, C., Kjær, H. A., Curran, M. A. J., Moy, A. D., Schönhardt, A., Blechschmidt, A.-M., Burrows, J. P., Plane, J. M. C., and Barbante, C.: Seasonality of halogen deposition in polar snow and ice, Atmos. Chem. Phys., 14, 9613–9622, https://doi.org/10.5194/acp-14-9613-2014, 2014.
Steig, E. J., Mayewski, P. A., Dixon, D. A., Kaspari, S. D., Frey, M. M., Schneider, D. P., Arcone, S. A., Hamilton, G. S., Spikes, V. B., Albert, M., Meese, D., Gow, A. J., Shuman, C. A., White, J. W. C., Sneed, S., Flaherty, J., and Wumkes, M.: High-resolution ice cores from US ITASE (West Antarctica): development and validation of chronologies and determination of precision and accuracy, Ann. Glaciol., 41, 77–84, https://doi.org/10.3189/172756405781813311, 2005.
Stenni, B., Proposito, M., Gragnani, R., Flora, O., Jouzel, J., Falourd, S., and Frezzotti, M.: Eight centuries of volcanic signal and climate change at Talos Dome (East Antarctica), J. Geophys. Res.-Atmos., 107, 1–13, https://doi.org/10.1029/2000JD000317, 2002.
Stenni, B., Curran, M. A. J., Abram, N. J., Orsi, A., Goursaud, S., Masson-Delmotte, V., Neukom, R., Goosse, H., Divine, D., van Ommen, T., Steig, E. J., Dixon, D. A., Thomas, E. R., Bertler, N. A. N., Isaksson, E., Ekaykin, A., Werner, M., and Frezzotti, M.: Antarctic climate variability on regional and continental scales over the last 2000 years, Clim. Past, 13, 1609–1634, https://doi.org/10.5194/cp-13-1609-2017, 2017.
Stowasser, C., Buizert, C., Gkinis, V., Chappellaz, J., Schüpbach, S., Bigler, M., Faïn, X., Sperlich, P., Baumgartner, M., Schilt, A., and Blunier, T.: Continuous measurements of methane mixing ratios from ice cores, Atmos. Meas. Tech., 5, 999–1013, https://doi.org/10.5194/amt-5-999-2012, 2012.
Svensson, A., Andersen, K. K., Bigler, M., Clausen, H. B., Dahl-Jensen, D., Davies, S. M., Johnsen, S. J., Muscheler, R., Parrenin, F., Rasmussen, S. O., Röthlisberger, R., Seierstad, I., Steffensen, J. P., and Vinther, B. M.: A 60 000 year Greenland stratigraphic ice core chronology, Clim. Past, 4, 47–57, https://doi.org/10.5194/cp-4-47-2008, 2008.
Svensson, A., Bigler, M., Blunier, T., Clausen, H. B., Dahl-Jensen, D., Fischer, H., Fujita, S., Goto-Azuma, K., Johnsen, S. J., Kawamura, K., Kipfstuhl, S., Kohno, M., Parrenin, F., Popp, T., Rasmussen, S. O., Schwander, J., Seierstad, I., Severi, M., Steffensen, J. P., Udisti, R., Uemura, R., Vallelonga, P., Vinther, B. M., Wegner, A., Wilhelms, F., and Winstrup, M.: Direct linking of Greenland and Antarctic ice cores at the Toba eruption (74 ka BP), Clim. Past, 9, 749–766, https://doi.org/10.5194/cp-9-749-2013, 2013.
Thomas, E. R. and Abram, N. J.: Ice core reconstruction of sea ice change in the Amundsen-Ross Seas since 1702 AD, Geophys. Res. Lett., 43, 5309–5317, https://doi.org/10.1002/2016GL068130, 2016.
Thomas, E. R., Hosking, J. S., Tuckwell, R. R., Warren, R. A., and Ludlow, E. C.: Twentieth century increase in snowfall in coastal West Antarctica, Geophys. Res. Lett., 42, 9387–9393, https://doi.org/10.1002/2015GL065750, 2015.
Thomas, E. R., van Wessem, J. M., Roberts, J., Isaksson, E., Schlosser, E., Fudge, T. J., Vallelonga, P., Medley, B., Lenaerts, J., Bertler, N., van den Broeke, M. R., Dixon, D. A., Frezzotti, M., Stenni, B., Curran, M., and Ekaykin, A. A.: Regional Antarctic snow accumulation over the past 1000 years, Clim. Past, 13, 1491–1513, https://doi.org/10.5194/cp-13-1491-2017, 2017.
Traversi, R., Becagli, S., Castellano, E., Maggi, V., Morganti, A., Severi, M., and Udisti, R.: Ultra-sensitive Flow Injection Analysis (FIA) determination of calcium in ice cores at ppt level, Anal. Chim. Acta, 594, 219–225, https://doi.org/10.1016/j.aca.2007.05.022, 2007.
Tuohy, A., Bertler, N., Neff, P., Edwards, R., Emanuelsson, D., Beers, T., and Mayewski, P.: Transport and deposition of heavy metals in the Ross Sea Region, Antarctica, J. Geophys. Res.-Atmos., 120, 10996–11011, https://doi.org/10.1002/2015JD023293, 2015.
Turner, J., Comiso, J. C., Marshall, G. J., Lachlan-cope, T. A., Bracegirdle, T., Maksym, T., Meredith, M. P., Wang, Z., and Orr, A.: Non-annular atmospheric circulation change induced by stratospheric ozone depletion and its role in the recent increase of Antarctic sea ice extent, Geophys. Res. Lett., 36, 1–5, https://doi.org/10.1029/2009GL037524, 2009.
Turner, J., Hosking, J. S., Marshall, G. J., Phillips, T., and Bracegirdle, T. J.: Antarctic sea ice increase consistent with intrinsic variability of the Amundsen Sea Low, Clim. Dynam., 46, 2391–2402, https://doi.org/10.1007/s00382-015-2708-9, 2016.
Udisti, R., Traversi, R., Becagli, S., and Piccardi, G.: Spatial distribution and seasonal pattern of biogenic sulphur compounds in snow from northern Victoria Land, Antarctica, Ann. Glaciol., 27, 535–542, https://doi.org/10.3189/1998AoG27-1-535-542, 1998.
WAIS Divide Project Members: Precise interpolar phasing of abrupt climate change during the last ice age, Nature, 520, 661–665, https://doi.org/10.1038/nature14401, 2015.
Wheatley, S. and Kurbatov, A. V.: Antarctic Ice Core Tephra Analysis, U.S. Antarct. Progr. Data Center, Dataset, https://doi.org/10.15784/601038, 2017.
Winstrup, M.: A Hidden Markov Model Approach to Infer Timescales for High-Resolution Climate Archives, in Proceedings of the 30th AAAI Conference on Artificial Intelligence and the 28th Innovative Applications of Artificial Intelligence Conference, 12–17 February 2016, AAAI Press, Palo Alto, California, Phoenix, Arizona, USA, 4053–4061, P28L94: available at: https://www.aaai.org/ocs/index.php/IAAI/IAAI16/paper/view/11993/12328 (last access: 31 March 2019), 2016.
Winstrup, M., Svensson, A. M., Rasmussen, S. O., Winther, O., Steig, E. J., and Axelrod, A. E.: An automated approach for annual layer counting in ice cores, Clim. Past, 8, 1881–1895, https://doi.org/10.5194/cp-8-1881-2012, 2012.
Yu, S. Z.: Hidden semi-Markov models, Artif. Intell., 174, 215–243, https://doi.org/10.1016/j.artint.2009.11.011, 2010.
Yuan, X. and Martinson, D. G.: Antarctic sea ice extent variability and its global connectivity, J. Climate, 13, 1697–1717, https://doi.org/10.1175/1520-0442(2000)013<1697:ASIEVA>2.0.CO;2, 2000.
Zreda-Gostynska, G., Kyle, P. R., Finnegan, D., and Meeker Prestbo, K.: Volcanic gas emissions from Mount Erebus and their impact on the Antarctic environment, J. Geophys. Res.-Sol. Ea., 102, 15039–15055, https://doi.org/10.1029/97JB00155, 1997.
- Abstract
- Introduction
- Site characteristics
- Ice-core processing and impurity analysis
- Constructing the Roosevelt Island Ice Core Chronology, RICE17, for the last 2700 years
- Reconstructing past accumulation rates
- Seasonality of impurity influx to Roosevelt Island
- The layer-counted RICE17 chronology
- Roosevelt Island accumulation history
- Discussion
- Conclusions
- Data availability
- Author contributions
- Competing interests
- Acknowledgements
- Review statement
- References
- Supplement