the Creative Commons Attribution 4.0 License.
the Creative Commons Attribution 4.0 License.
 | 09 Apr 2019
How dry was the Younger Dryas? Evidence from a coupled δ2H–δ18O biomarker paleohygrometer applied to the Gemündener Maar sediments, Western Eifel, Germany
Johannes Hepp
Lorenz Wüthrich
Tobias Bromm
Marcel Bliedtner
Imke Kathrin Schäfer
Bruno Glaser
Kazimierz Rozanski
Frank Sirocko
Roland Zech
Michael Zech
Causes of the Late Glacial to Early Holocene transition phase and particularly the Younger Dryas period, i.e. the major last cold spell in central Europe during the Late Glacial, are considered to be keys for understanding rapid natural climate change in the past. The sediments from maar lakes in the Eifel, Germany, have turned out to be valuable archives for recording such paleoenvironmental changes.
For this study, we investigated a Late Glacial to Early Holocene sediment core that was retrieved from the Gemündener Maar in the Western Eifel, Germany. We analysed the hydrogen (δ2H) and oxygen (δ18O) stable isotope composition of leaf-wax-derived lipid biomarkers (n-alkanes C27 and C29) and a hemicellulose-derived sugar biomarker (arabinose), respectively. Both δ2Hn-alkane and δ18Osugar are suggested to reflect mainly leaf water of vegetation growing in the catchment of the Gemündener Maar. Leaf water reflects δ2H and δ18O of precipitation (primarily temperature-dependent) modified by evapotranspirative enrichment of leaf water due to transpiration. Based on the notion that the evapotranspirative enrichment depends primarily on relative humidity (RH), we apply a previously introduced “coupled δ2Hn-alkane–δ18Osugar paleohygrometer approach” to reconstruct the deuterium excess of leaf water and in turn Late Glacial–Early Holocene RH changes from our Gemündener Maar record.
Our results do not provide evidence for overall markedly dry climatic conditions having prevailed during the Younger Dryas. Rather, a two-phasing of the Younger Dryas is supported, with moderate wet conditions at the Allerød level during the first half and drier conditions during the second half of the Younger Dryas. Moreover, our results suggest that the amplitude of RH changes during the Early Holocene was more pronounced than during the Younger Dryas. This included the occurrence of a “Preboreal Humid Phase”. One possible explanation for this unexpected finding could be that solar activity is a hitherto underestimated driver of central European RH changes in the past.
- Article
(5852 KB) - Full-text XML
-
Supplement
(132 KB) - BibTeX
- EndNote


In order to evaluate the relevance of man-made climate change in the future, it is of great importance to study and understand large and rapid climate fluctuations in the past. Many studies have focused on the Late Glacial to Early Holocene transition phase, a period with various expressions in temperature, atmospheric circulation and hydrology worldwide (Alley, 2000; Brauer et al., 2008; Denton et al., 2010; Partin et al., 2015; Wagner et al., 1999). Explanation for the Younger Dryas (YD) period, i.e. the major last cold spell in central Europe during the Late Glacial just before the onset of the Holocene warm period (Denton et al., 2010; Heiri et al., 2014; Isarin and Bohncke, 1999), has long been considered crucial for understanding rapid natural climate change in the past (Alley, 2000). The sediments from maar lakes in the Eifel, Germany, have turned out to be valuable archives for paleoenvironmental reconstruction by providing high-resolution palynological, sedimentological and geochemical records for climate, vegetation and landscape history (Brauer et al., 2008; Brunck et al., 2015; Litt et al., 2003; Litt and Stebich, 1999; Sirocko et al., 2013; Zolitschka, 1998).
Lacustrine sedimentary lipid biomarkers such as n-alkanes, originating either from leaf waxes of higher terrestrial plants (Eglinton and Hamilton, 1967) or from aquatic organisms (Volkman et al., 1998), and especially their hydrogen isotope composition (δ2Hleaf-wax∕n-alkane), are widely accepted as paleoclimate proxies (Huang et al., 2004; Mügler et al., 2008; Sachse et al., 2004, 2012; Sauer et al., 2001). It has been demonstrated that δ2Hleaf-wax∕n-alkane is well correlated with the hydrogen isotope composition of precipitation (δ2Hprec) (e.g. Hou et al., 2008; Rao et al., 2009). Similar to the well-known ice-core and speleothem records (Alley, 2000; Luetscher et al., 2015; Rasmussen et al., 2014), lacustrine δ2Hleaf-wax∕n-alkane records are therefore increasingly used to reconstruct δ2H of past precipitation and thus for deriving paleoclimatic information (cf. Araguás-Araguás et al., 2000; Dansgaard, 1964; Rozanski et al., 1993). However, the alteration of δ2Hprec either through evapotranspirative 2H enrichment of leaf or lake water can challenge a robust δ2Hprec reconstruction (e.g. Mügler et al., 2008; Zech et al., 2015). Apart from δ2Hn-alkane, the oxygen isotope composition of hemicellulose- or polysaccharide-derived sugars (δ18Osugar) was established as a tool in paleoclimate research during recent years (Zech et al., 2011, 2013a, 2014a). Analogous to δ2Hn-alkane, δ18Osugar is affected by the isotope composition of source water, which is closely related to the local precipitation (δ18Oprec) as well as by evapotranspirative 18O enrichment (Tuthorn et al., 2014; Zech et al., 2013b, 2014b). Moreover, it was suggested that the coupling of δ2H and δ18O results can help to disentangle δ2H/δ18Oprec changes and variable enrichment (Henderson et al., 2010; Hepp et al., 2015, 2017; Tuthorn et al., 2015; Voelker et al., 2014, 2015; Zech et al., 2013a). For instance, Voelker et al. (2014) presented a framework for using δ2H and δ18O of tree-ring cellulose in order to infer relative air humidity (RH). Tuthorn et al. (2015) validated a previously suggested “coupled δ2Hn-alkane–δ18Osugar paleohygrometer approach”. Accordingly, the application of that approach to an Argentinian topsoil transect yielded a highly significant correlation of actual and biomarker-based reconstructed RH values (R=0.79, p<0.001, n=20). Both approaches were successfully applied to loess–paleosol sequences (Hepp et al., 2017; Zech et al., 2013a) and subfossil wood (Voelker et al., 2015). By contrast, the application of the coupled δ2Hn-alkane–δ18Osugar paleohygrometer approach to a lacustrine archive is still missing.
Within this study, we aimed at applying the coupled δ2Hn-alkane–δ18Osugar paleohygrometer approach to the Late Glacial–Early Holocene sediment cores of the Gemündener Maar. More specifically, we addressed the following objectives: (i) source identification of the sedimentary organic matter and the investigated n-alkanes and sugars (aquatic vs. terrestrial), (ii) reconstructing leaf water isotope composition based on compound-specific δ2H and δ18O values of the n-alkane and sugar biomarkers, (iii) reconstructing RH changes using the coupled δ2Hn-alkane–δ18Osugar paleohygrometer approach, and (iv) inferring implications for central European paleoclimate history from the established Gemündener Maar RH record.
2.1 The Gemündener Maar and sampling
The Gemündener Maar is located in the Eifel volcanic fields in western Germany at an altitude of 407 m a.s.l. (50∘10′39.853′′ N, 6∘50′12.912′′ E; Fig. 1a and b; Sirocko et al., 2013). The maar was formed during a phreatomagmatic explosion within the local Devonian siltstone (greywacke) around 20–25 ka (Büchel, 1993). The lake is 39 m deep at its maximum and has a diameter of roughly 300 m. Due to its formation conditions the lake is almost circular with a lake surface area of 75 000 m2 and is surrounded by a small catchment (Fig. 1b), with an area of 430 000 m2 (Scharf and Menn, 1992). The lake is fed by precipitation and groundwater (no surface inflow and outflow present). The sediments are, accordingly, not affected by fluvial sediment input. The catchment area is furthermore steep and densely vegetated with broadleaved trees (Fig. 1c). The investigated samples were taken from the 8 m Gemündener Maar core (GM1), which was taken at approximately 20 m water depth near the centre of the maar (Fig. 1b) with a Livingston piston corer (UWITEC, Mondsee, Austria). The GM1 core was retrieved from a terrace on the steep slope of the maar exactly in a fan of an underwater erosion gully structure. The core is part of the Eifel Laminated Sediment Archive Project of the Institute for Geoscience at Johannes Gutenberg University Mainz (Sirocko et al., 2013, 2016).
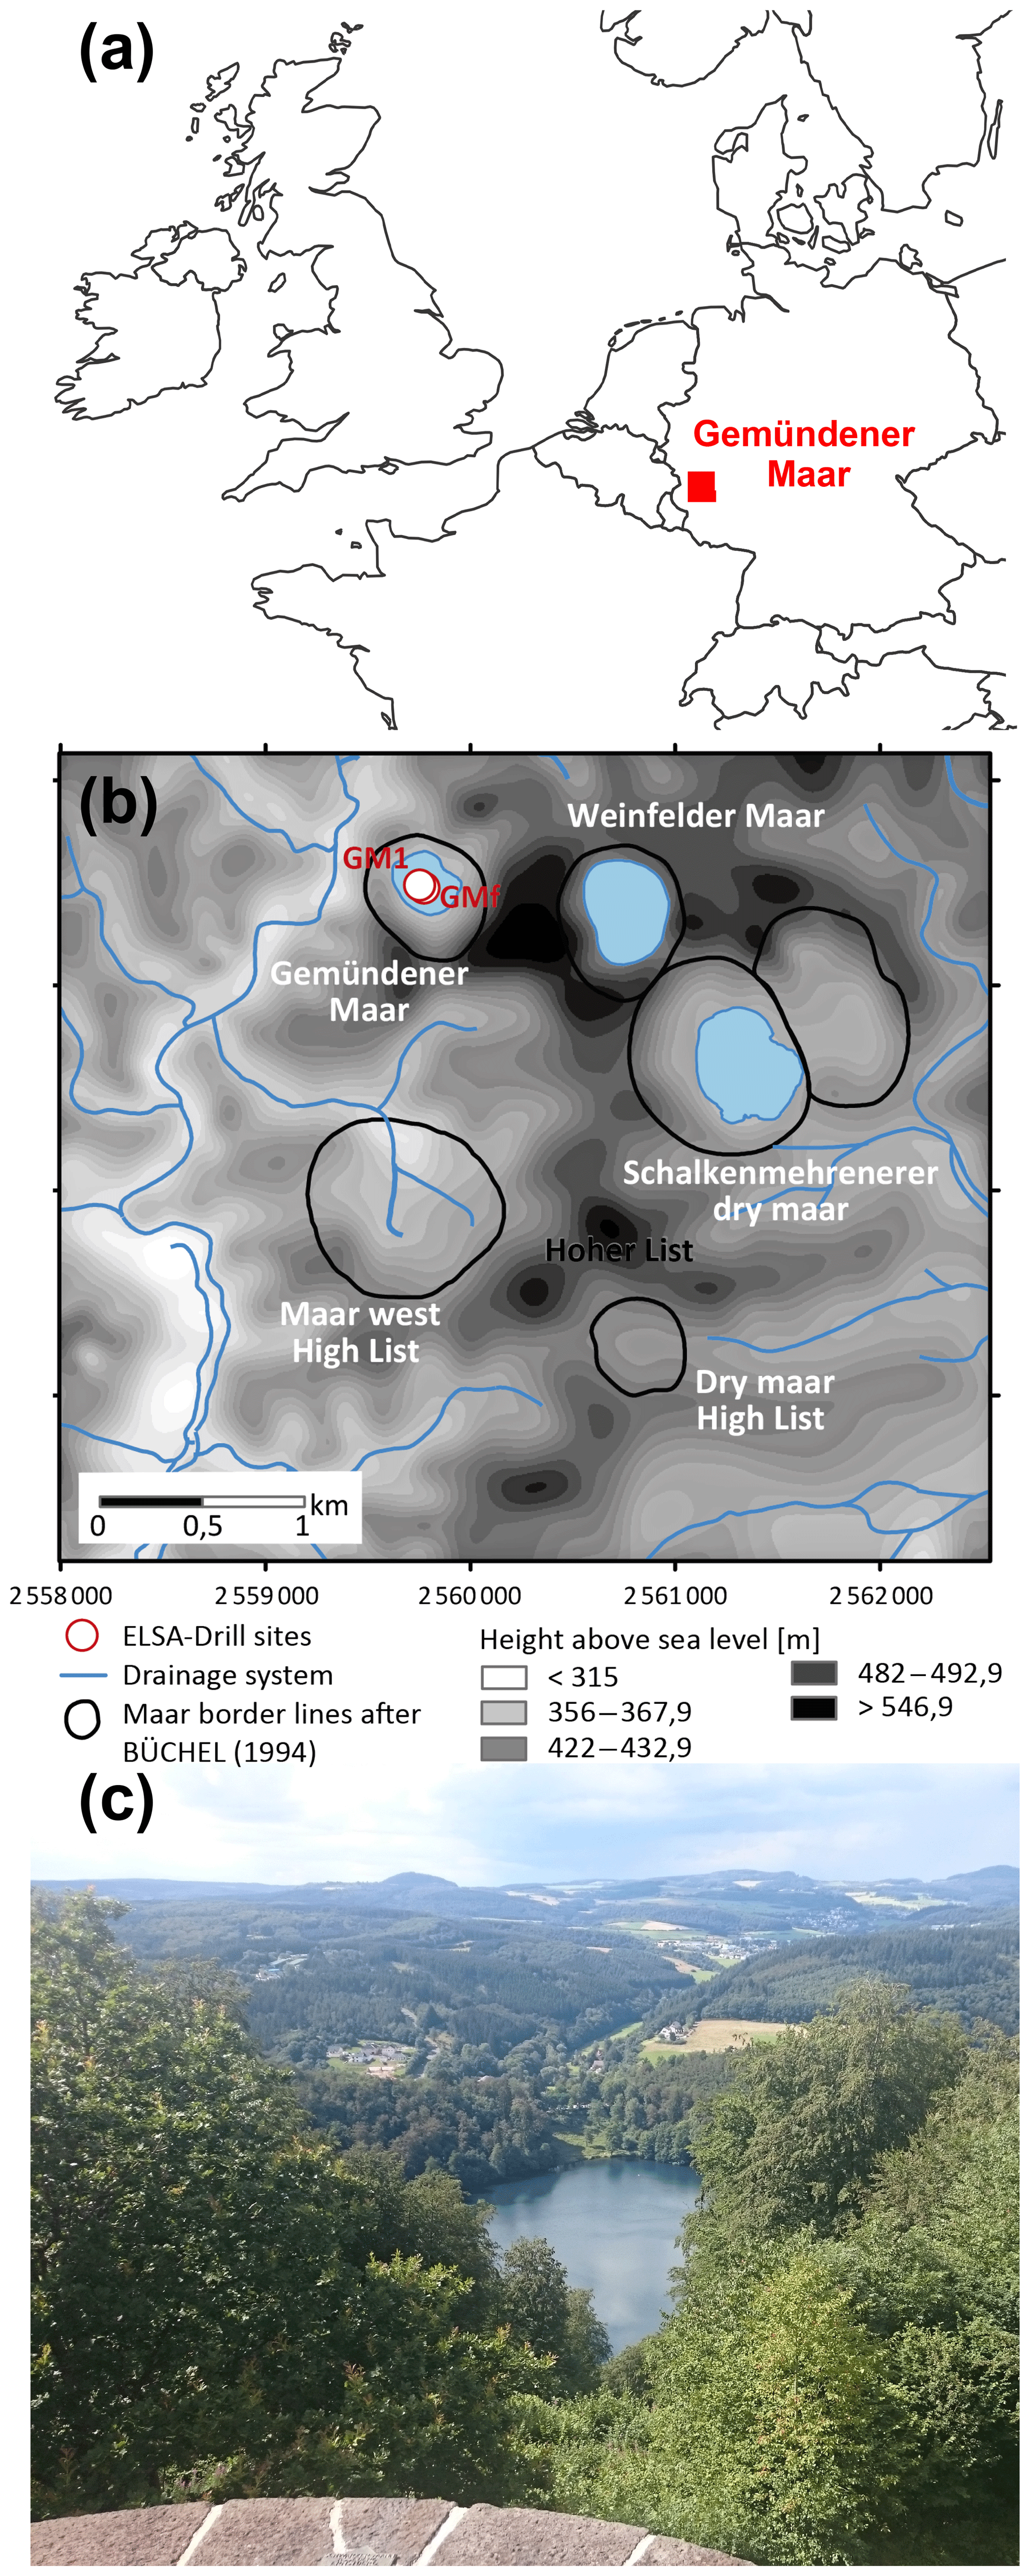
Figure 1(a) Location of the Gemündener Maar in the Eifel region in Germany (generated using OpenStreetMap homepage, ©OpenStreetMap contributors, https://www.openstreetmap.org, last access: 15 August 2016). (b) Digital terrain model and drainage system of the immediate surroundings of the Gemündener Maar, with maar borders according to Büchel (1994) representing the size of the crater. In addition, the core position is displayed (GM1; 50∘10′39.853′′ N, 6∘50′12.912′′ E) along with the short core named GMf (not part of this study) marked as ELSA drill sites. Both cores are part of the Eifel Laminated Sediment Archive Project (ELSA project). (c) Photo of Gemündener Maar showing the steep and densely forested catchment (by Michael Zech, reproduced with his permission).
2.2 Bulk analysis and pollen analysis
Bulk analyses were carried out on 112 samples, covering a section of 606 to 727 cm depth of the Gemündener Maar GM1 core. Total carbon (TC) and nitrogen (N), bulk carbon isotope composition (δ13CTC), and nitrogen isotope composition (δ15N) were determined at the Institute of Agronomy and Nutritional Sciences, Soil Biogeochemistry, Martin Luther University Halle-Wittenberg, using EuroVector EA 3000 elemental analyser (Hekatech, Wegberg, Germany) coupled via a Conflo III Interface to a Delta V Advantage isotope ratio mass spectrometer (IRMS; both from Thermo Fisher Scientific, Bremen, Germany). Additionally, total organic carbon (TOC) and bulk δ13C of the total organic carbon (δ13CTOC) were assessed after removal of carbonate with 32 % hydrochloric acid (HCl) fumigation followed by a neutralisation step with moist sodium hydroxide, both for 24 h under 60 ∘C and vacuum conditions. This allows calculating TOC∕N atomic ratios. Laboratory standards from the International Atomic Energy Agency (IAEA) as well as from the United States Geological Survey (USGS) with known total carbon, nitrogen, 13C and 15N contents (IAEA N2, IAEA CH6, IAEA NO3, IAEA CH7, IAEA 305A, USGS 41) were used for calibration. The 13C and 15N contents are expressed in the common δ notation as relative to an international standard (δ13C: Vienna Pee Dee Belemnite, VPDB; δ15N: atmospheric N2, air).
For pollen analysis, 16 samples were investigated covering the relevant depth section. Each sample covered a depth range of 1 cm. Preparation was conducted by Frank Dreher according to standard procedures at the laboratory of the Group of Climate and Sediments, Institute of Geosciences, Johannes Gutenberg University of Mainz, using potassium hydroxide, HCl and hydrofluoric acid (Sirocko et al., 2016). Afterwards, acetic acid and a mixture of acetic anhydride and sulfuric acid (9:1) were used for acetolysis. The samples were then centrifuged at 3000 to 3500 rpm for 5 min and then sieved over a 200 and a 10 µm sieve. Afterwards, the samples were fixed with anhydrous glycerol for reliable identification, and a maximum magnification of 600 was used for counting the remains. Pollen results are reported in relative percentages (%).
2.3 Age control
The investigated sediments are partially laminated. The first tie point to establish a chronology for the Gemündener Maar core is a radiocarbon-dated piece of charcoal in 727 cm core depth, which dates to 13 800±110 a cal BP (Fig. 2d). This age is derived from a 14C age of 11 950±65 a BP as part of the Supplement of Sirocko et al. (2013), calibrated using CalPal software (Weninger and Jöris, 2008) calculated with the IntCal13 calibration curve (Reimer et al., 2013). The uncertainty of the calibrated 14C age represents the 68 % probability range. The second tie point is the clearly visible Laacher See Tephra between 673 and 680 cm core depth (Fig. 2a and d). The latter can be used as chronological marker due to the varve-counted age of 12 880 a BP in the adjacent Meerfelder Maar (Brauer et al., 1999). The onset of the Younger Dryas period was set to 12 680 a BP (varve-counted in Meerfelder Maar sediments; Brauer et al., 1999; Litt et al., 2009) identified at a depth of 670 cm in the GM1 core due to a clear colour change (Fig. 2a and d). The onset of the Preboreal (Holocene) was found to date to 11 590 a BP in Meerfelder Maar by varve counting (Litt et al., 2009). This was used to wiggle-match the distinct changes in the pollen spectra (decreasing Poaceae, peaking Artemisia, increasing Pinus and Betula; Fig. 2b and c), the clear rise in TOC (Fig. 3a) and the colour change (Fig. 2a), which were identified at 643 cm depth (Fig. 2d). The Late Glacial to Preboreal (Holocene) transition is commonly well recorded in maar sediments from the Eifel region, i.e. clear changes in deposition as well as pollen pattern (Brauer et al., 1999; Litt et al., 2001, 2003; Litt and Stebich, 1999), dated to 11 600 a BP, e.g. in Holzmaar, by a combination of varve counting and 14C dating (Zolitschka, 1998). The last time marker used to constrain the age model is the middle of the sharp increase in Corylus (hazel) pollen at 622 cm depth (Fig. 2b, c and d). We used this sharp increase as a marker for the Preboreal to Boreal transition, which is varve-counted by Litt et al. (2009) to 10 740 a BP in the Meerfelder Maar sediments. The offset of 60 years to the varve-counted Holzmaar record of Zolitschka (1998), as it is presented by Litt et al. (2009), is within the uncertainty of placing the onset of the Preboreal in the Gemündener Maar Corylus curve.
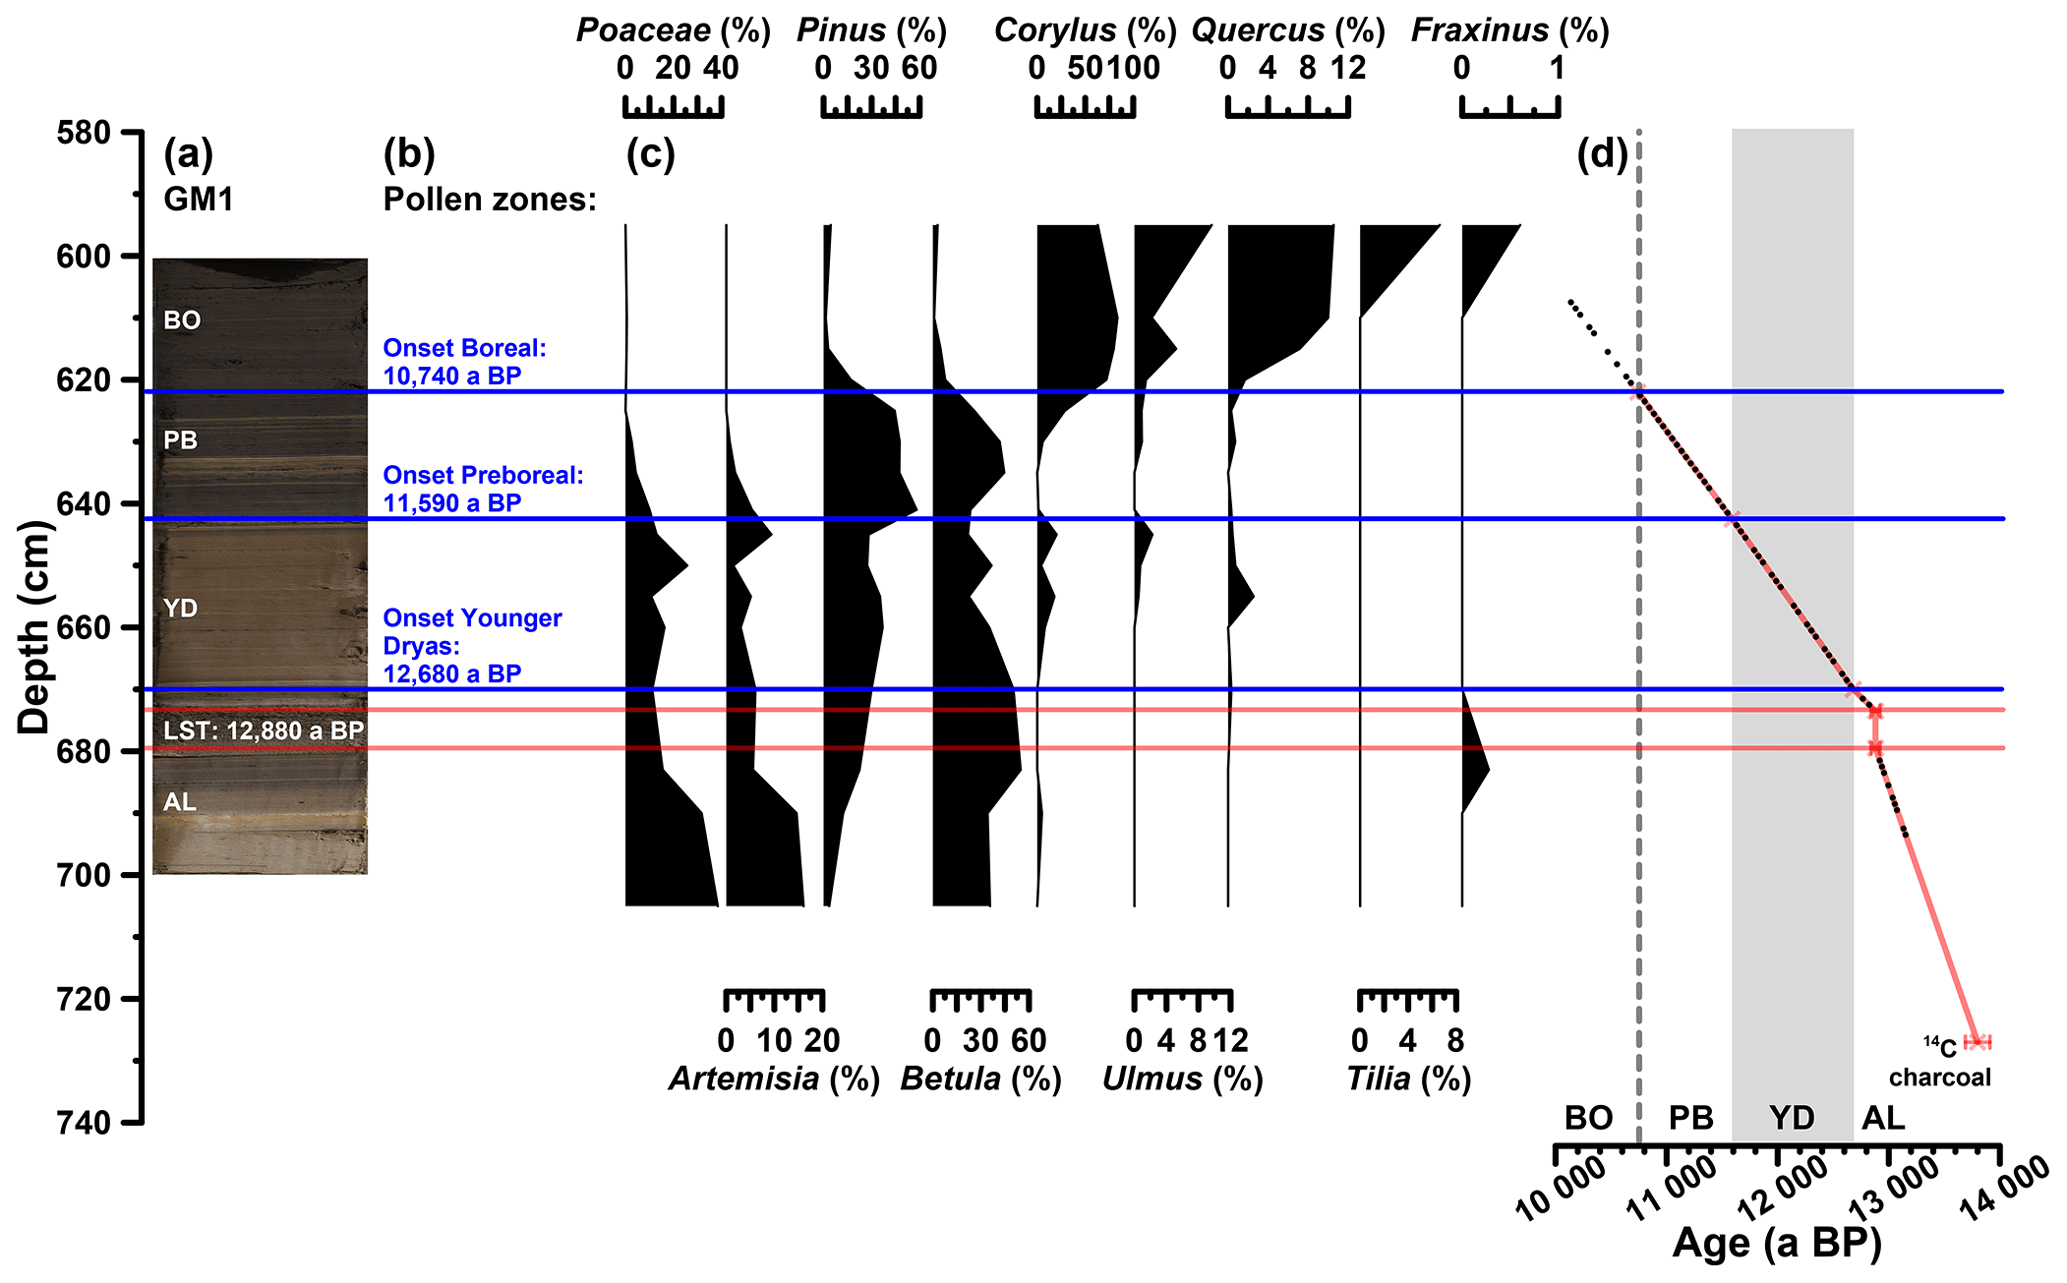
Figure 2(a) Photo of the investigated GM1 core section, with regard to the biomarkers (607 to 694 cm depth), displaying the position of the Laacher See Tephra (LST), varve-counted to 12 880 a BP in the adjacent Meerfelder Maar (cf. Brauer et al., 1999). (b) Defined pollen zones according to Brauer et al. (1999) and Litt et al. (2009). (c) Pollen profiles of pollen groups, which were used for defining the pollen zones. Pollen analysis was carried out by Frank Dreher (Johannes Gutenberg University of Mainz). (d) Age–depth model of the full investigated GM1 section (606 to 727 cm depth) consisting of a 14C-dated piece of charcoal, the LST and the onsets of the Younger Dryas, Preboreal and Boreal (Holocene). Additionally, the biomarker sampling points are displayed (black points). The error bars of the 14C age and the LST represent the uncertainty of the calibration (68 % probability range) and the error during of the varve counting (±40 a; Brauer et al., 1999), respectively.
The investigated core section from 607 to 694 cm depth therefore covers the time between ∼13 150 and 10 140 a BP, i.e. the Allerød, the Younger Dryas, the Preboreal, and the beginning of the Boreal, with regard to the biomarkers (Fig. 2a and d). Assuming constant sedimentation rates between the markers, an average resolution of 51 a cm−1 can be calculated; the minimum and maximum resolution are 19 and 124 a cm−1, respectively. The part above the Laacher See Tephra reveals a lower mean resolution (55 a cm−1) than the section below (30 a cm−1).
2.4 Biomarker and compound-specific isotope analysis
For δ2H analyses of n-alkanes as well as δ18O analyses of sugars, 59 samples were prepared from 607 to 694 cm depth of the Gemündener Maar GM1 core, in order to cover the core section with already high TOC content and the Late Glacial to Holocene transition (Figs. 2 and 3a). n-Alkanes were extracted from 1 to 6 g freeze-dried and ground samples by microwave extraction at 100 ∘C for 1 h, using 15 mL of solvent (dichloromethane and methanol, at a ratio of 9:1). The resultant total lipid extracts were separated over aminopropyl silica gel (Supelco 45 µm) filled pipette columns. Non-polar compounds (including n-alkanes) were eluted with n-hexane. The fraction was spiked with a known amount of 5α-androstanone, used as an internal standard. Identification and quantification was carried out on an Agilent MS 5975 (EI) interfaced with an Agilent 7890 GC equipped with a 30 m fused silica capillary column (HP5-MS 0.25 mm i.d., 0.25 µm film thickness) and a split–splitless injector operating in splitless mode at 320 ∘C. Carrier gas was helium and the temperature program was 1 min at 50 ∘C, from 50 to 200 ∘C at 30 ∘C min−1, from 200 to 320 ∘C at 7 ∘C min−1, and 5 min at 320 ∘C. Data recording comprised the total ion count (scan mode from m∕z 40 to 600) and single-ion monitoring (m∕z 57, 71, 85 and 99). Concentrations were calculated relative to the internal standard and to an external standard (n-C21 to n-C40 alkane mixture, Supelco), injected in different concentrations (40, 4, 1, 0.4 ng µL−1).
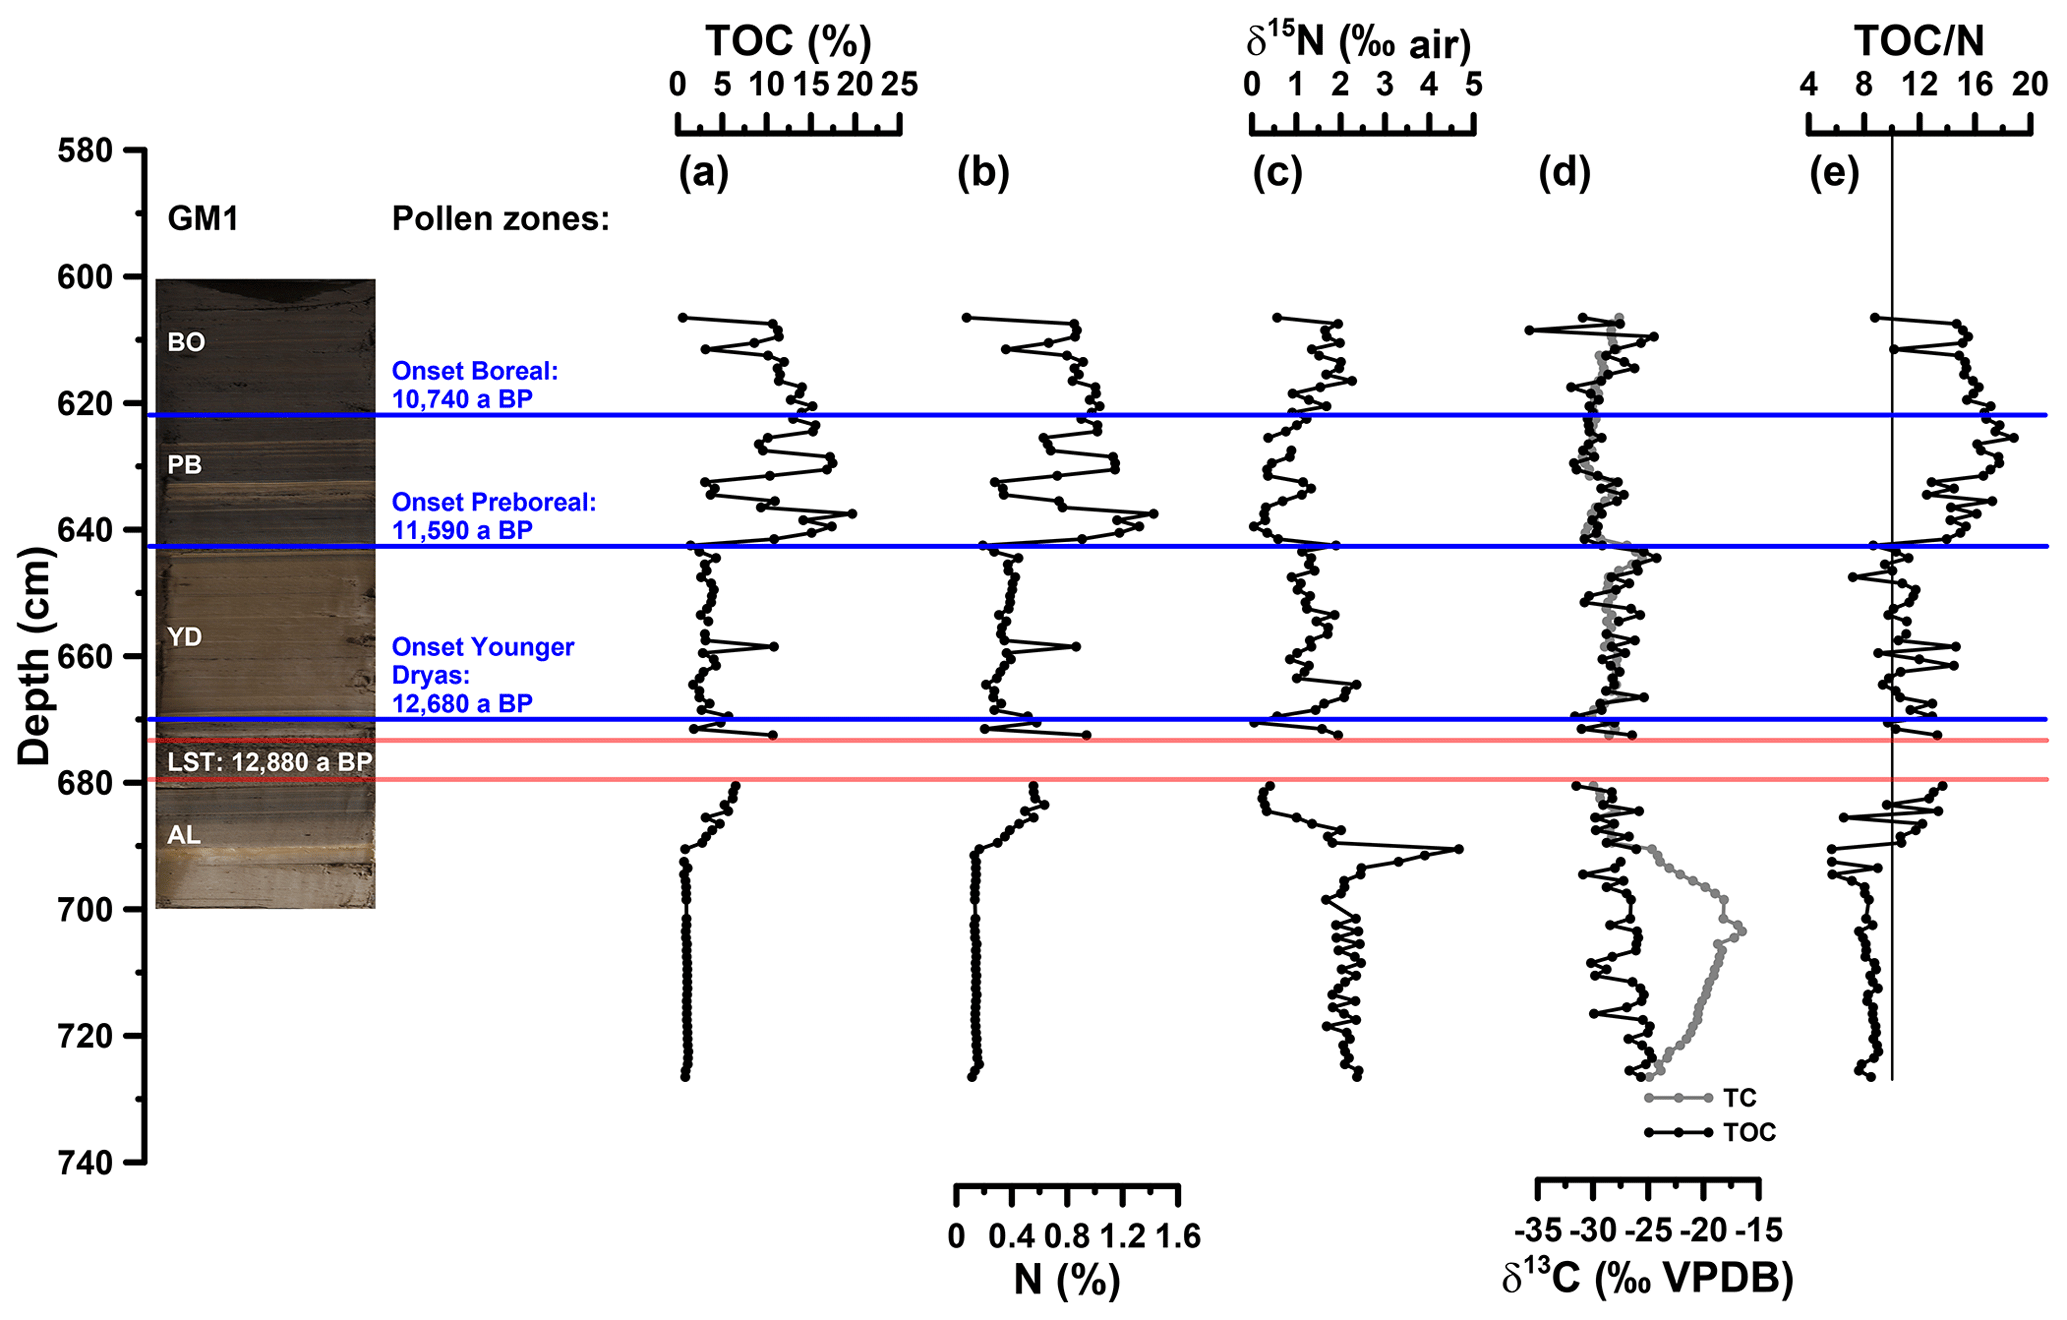
Figure 3(a) Depth profiles of total organic carbon (TOC), (b) total nitrogen (N), (c) bulk stable nitrogen isotope composition (δ15N), (d) stable carbon isotope composition of total carbon (TC) and TOC (δ13CTC, δ13CTOC) and (e) carbon to nitrogen atomic ratio (TOC∕N). The vertical line in (e) indicates a TOC∕N atomic ratio threshold of 10 (Meyers, 2003). AL: Allerød; YD: Younger Dryas; PB: Preboreal; BO: Boreal.
Prior to compound-specific isotope analyses, the n-alkanes were further purified. The non-polar fractions were passed over a pipette column filled with activated AgNO3 impregnated silica gel and a pipette column filled with zeolite (Geokleen). After drying, the zeolite was removed using hydrofluoric acid and the n-alkanes were recovered by liquid–liquid extraction with hexane. The purified n-alkane fractions were measured for their compound-specific stable hydrogen isotope composition (δ2H). The measurements were performed at the Institute of Geography, University of Bern on an IsoPrime 100 IRMS, coupled to an Agilent 7890A GC via a GC5 pyrolysis or combustion interface operating in pyrolysis modus with a Cr (ChromeHD) reactor at 1000 ∘C. Samples were injected with a split–splitless injector. The GC was equipped with 30 m fused silica column (HP5-MS, 0.32 mm inner diameter, 0.25 µm film thickness). The precision was checked by co-analysing a standard alkane mixture (n-C27, n-C29, n-C33) with known isotope composition (Arndt Schimmelmann, University of Indiana), injected twice every six runs. The samples were analysed in three repetitions (except from the samples in 622 and 672 cm depth), and the analytical precision was generally better than 5 ‰. The stable hydrogen isotope compositions are given in the δ notation (δ2Hn-alkane) versus Vienna Standard Mean Ocean Water (VSMOW). The -correction factor was checked every 2 days and stayed stable over the course of measurements at 3.14. The δ2Hn-alkane values refer to the area-weighted mean of the δ2H values of n-alkanes with 27 and 29 carbon atoms (n-C27, n-C29) because of their relatively high abundance in the samples (Fig. 4a).
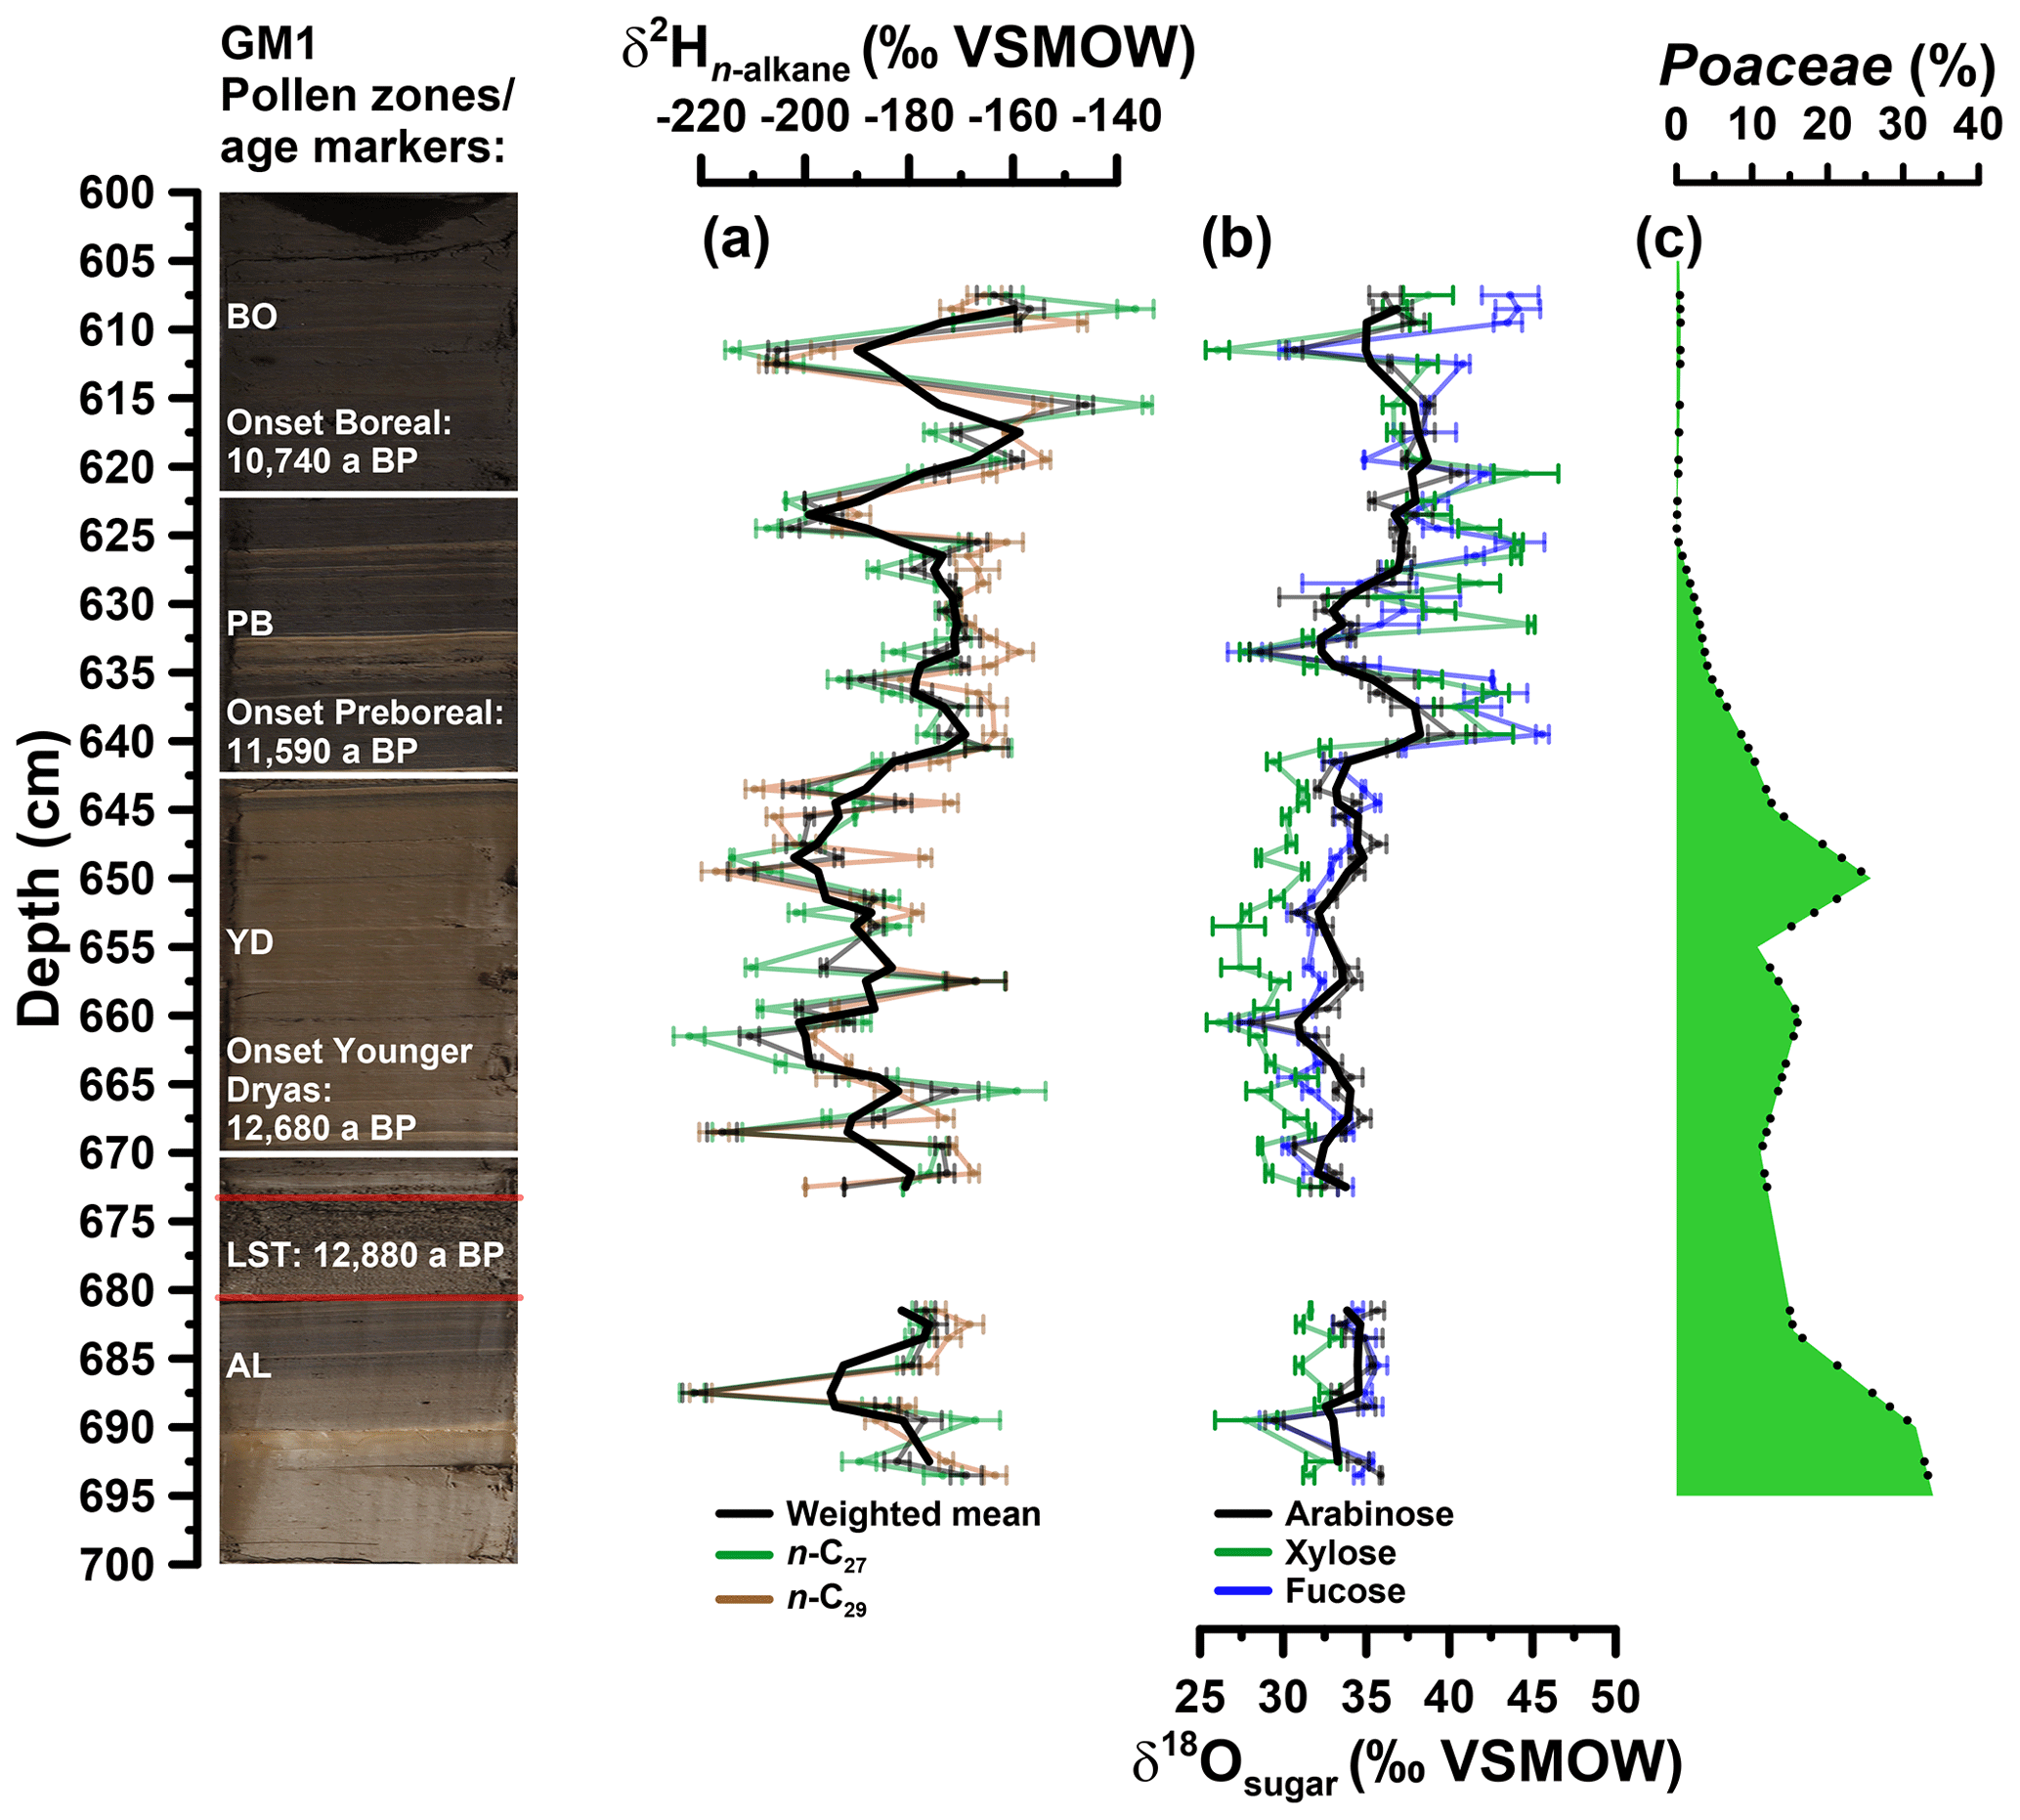
Figure 4(a) Depth profiles of compound-specific stable hydrogen isotope composition of the individual alkanes n-C27 and n-C29 and the weighted mean (δ2Hn-alkane). (b) Compound-specific stable oxygen composition of the individual sugars arabinose, xylose and fucose (δ18Osugar). Error bars show analytical standard errors; bold lines show three-point moving averages. (c) Depth profile of Poaceae pollen. Additionally, the resampled data points (black points) used for the grass correction procedures (Eqs. 10 and 11) are displayed. In addition, the GM1 core picture with the age markers used is displayed. AL: Allerød; LST: Laacher See Tephra; YD: Younger Dryas; PB: Preboreal; BO: Boreal.
The sample preparation for δ18O analyses of hemicellulose- or polysaccharide-derived sugars followed standard procedures at the Institute of Agronomy and Nutritional Sciences, Soil Biogeochemistry, Martin Luther University Halle-Wittenberg, according to the method of Zech and Glaser (2009). The monosaccharide sugars were hydrolytically extracted from samples containing approximately 10 mg total organic carbon with 10 mL of 4 M trifluoroacetic acid at 105 ∘C for 4 h, applying the method described by Amelung et al. (1996). After filtration over glass fibre filters, the extracted sugars were cleaned using XAD-7 (to remove humic-like substances) and Dowex 50WX8 columns (to remove interfering cations). Afterwards, the purified samples were freeze-dried and derivatised by adding methylboronic acid (4 mg in 400 µL pyridine) for 1 h at 60 ∘C.
The compound-specific δ18O measurements were performed using a Trace GC 2000 coupled to a Delta V Advantage IRMS via an 18O-pyrolysis reactor (GC IsoLink) and a ConFlo IV interface (all devices from Thermo Fisher Scientific, Bremen, Germany). Each sample was measured in threefold repetition, embedded in-between co-derivatised sugar standards at various concentrations and known δ18O values. The δ18O values of the samples are expressed in δ notation (δ18Osugar) versus VSMOW. The measured δ18Osugar values were corrected for drift, amount and area dependency and also for the hydrolytically introduced oxygen atoms that form carbonyl groups with the C1 atoms of the sugar molecules (Zech and Glaser, 2009). Mean standard errors for the triplicate measurements of all 59 samples are 0.6 ‰, 0.7 ‰ and 0.7 ‰ for arabinose, fucose and xylose, respectively. The δ18Osugar values refer to the δ18O values of the monosaccharides arabinose, fucose and xylose (Fig. 4b). Rhamnose areas, or concentrations, were too low for reliable isotope measurements in most samples.
2.5 Conceptual framework of the coupled δ2Hn-alkane–δ18Osugar paleohygrometer approach
The coupled δ2Hn-alkane–δ18Osugar paleohygrometer approach was described in detail by Tuthorn et al. (2015) and Zech et al. (2013a). The most fundamental assumption of the approach is that the isotope composition of leaf water can be reconstructed by applying biosynthetic fractionation factors on the measured δ2Hn-alkane and δ18Osugar values (Fig. 5). The concept is furthermore based on the observation that the isotope composition of global precipitation plots typically close to the global meteoric water line (GMWL; ; Dansgaard, 1964). In Germany, a local meteoric water line (LMWLGermany) slightly deviating from GMWL was described by Stumpp et al. (2014) (; Fig. 5), which we used as the baseline for our calculations. The quite similar LMWLs for Trier () and Koblenz () as well as the GMWL are additionally displayed in Fig. 5 for comparison. The local precipitation is the source for soil water and shallow groundwater, which in turn acts as source water for plants. During daytime, however, leaf water is typically 2H- and 18O-enriched compared to the source water due to evapotranspiration through the stomata (Fig. 5; Allison et al., 1985; Bariac et al., 1994; Walker and Brunel, 1990). The leaf water reservoir at the evaporative sites quickly achieves steady-state conditions (Allison et al., 1985; Bariac et al., 1994; Gat et al., 2007; Walker and Brunel, 1990). Thus, the isotope composition of the transpired water vapour is equal to the isotope composition of the source water utilised by the plants during the transpiration process. The evaporative enrichment of leaf water under steady-state conditions can be described via a Craig–Gordon model (e.g. Flanagan et al., 1991; Roden and Ehleringer, 1999) by the following expression (e.g. Barbour et al., 2004):
where δe, δs and δa are the hydrogen and oxygen isotope compositions of leaf water at the evaporative sites, in source water and in atmospheric water vapour, respectively; ε* is the equilibrium enrichment expressed as where αL∕V is the equilibrium fractionation between liquid and vapour in ‰; and εk is the kinetic fractionation parameters for water vapour diffusion from intracellular air space through the stomata and the boundary layer, both for 2H and 18O, respectively; and ea∕ei is the ratio of atmospheric vapour pressure to intracellular vapour pressure. When leaf temperature is equal to air temperature, the ea∕ei ratio represents the RH of the local atmosphere. If the plant source water and the local atmospheric water vapour are in isotopic equilibrium, the term δa−δs can approximated by . Thus, Eq. (1) can be reduced to
The kinetic fractionation parameters (εk) are typically related to stomatal and boundary layer resistances with respect to water flux (Farquhar et al., 1989). Since direct measurements of those plant physiological parameters can be hardly assessed in a paleo application, we used the kinetic enrichment parameters Ck instead, derived from a more generalised form of the Craig–Gordon model, for describing the kinetic isotope enrichment for 2H and 18O, which leads to Eq. (3) (Craig and Gordon, 1965; Gat and Bowser, 1991):
In a δ2H–δ18O diagram, the hydrogen and oxygen isotope composition of leaf and source water can be described as a local deuterium (d) excess = (Stumpp et al., 2014) in one equation by using the slope of the LMWLGermany (Eq. 4). This approach is comparable to the d excess definition from Dansgaard (1964), who used the equation for a measure of the parallel deviation between a given point in the δ2H–δ18O diagram from the GMWL.
where de and ds are the d excess values of the leaf water at the evaporative sites and the source water, respectively, and the equilibrium ( and ) and kinetic enrichment parameters ( and ) are expressed for both isotopes. From Eqs. (1) to (4) the primary control of RH on the isotope composition of the leaf water is demonstrated when stomata are open through transpiration. If de can be derived from compound-specific δ2H and δ18O measurements of the n-alkane and sugar biomarkers, which derive δ2He and δ18Oe values for the purpose of calculating de values via the equation , the ds can also be approximated from the d excess of the LMWLGermany (=4.9). Accordingly, Eq. (4) can be rearranged in order to calculate the RH of the local atmosphere normalised to leaf temperature as given by Eq. (5) (Hepp et al., 2017; Tuthorn et al., 2015; Zech et al., 2013a):
where Δd is the distance between de and ds, calculated as . Equilibrium fractionation parameters ( and ) are derived from empirical equations of Horita and Wesolowski (1994), with mean daytime growth-period temperature of 14.8 ∘C (from 06:00 to 19:00 CET and April to October, derived from the Nürburg-Barweiler station, approx. 25 km northeast of Gemündener Maar; hourly data from 1995 to 2015 from Deutscher Wetterdienst, 2016). Equilibrium fractionation factors equal 83.8 ‰ and 10.15 ‰ for 2H and 18O, respectively. The kinetic fractionation parameters ( and ) for 2H and 18O are set to 25.1 ‰ and 28.5 ‰, respectively, according to Merlivat (1978), who reported maximum values during the molecular diffusion process of water through a stagnant boundary layer. The assumption that maximum kinetic fractionation occurs seems to be most suitable for sedimentological application where a signal averaging over decades can be assumed (see above and discussion in Zech et al., 2013a). It should also be noted that εk values of broadleaf trees and shrubs over broad climatic conditions are well within the range of the and values used, revealing 23.9 ‰ (±0.9) and 26.7 ‰ (±1.0) for δ2H and δ18O, respectively (derived from the Supplement of Cernusak et al., 2016).
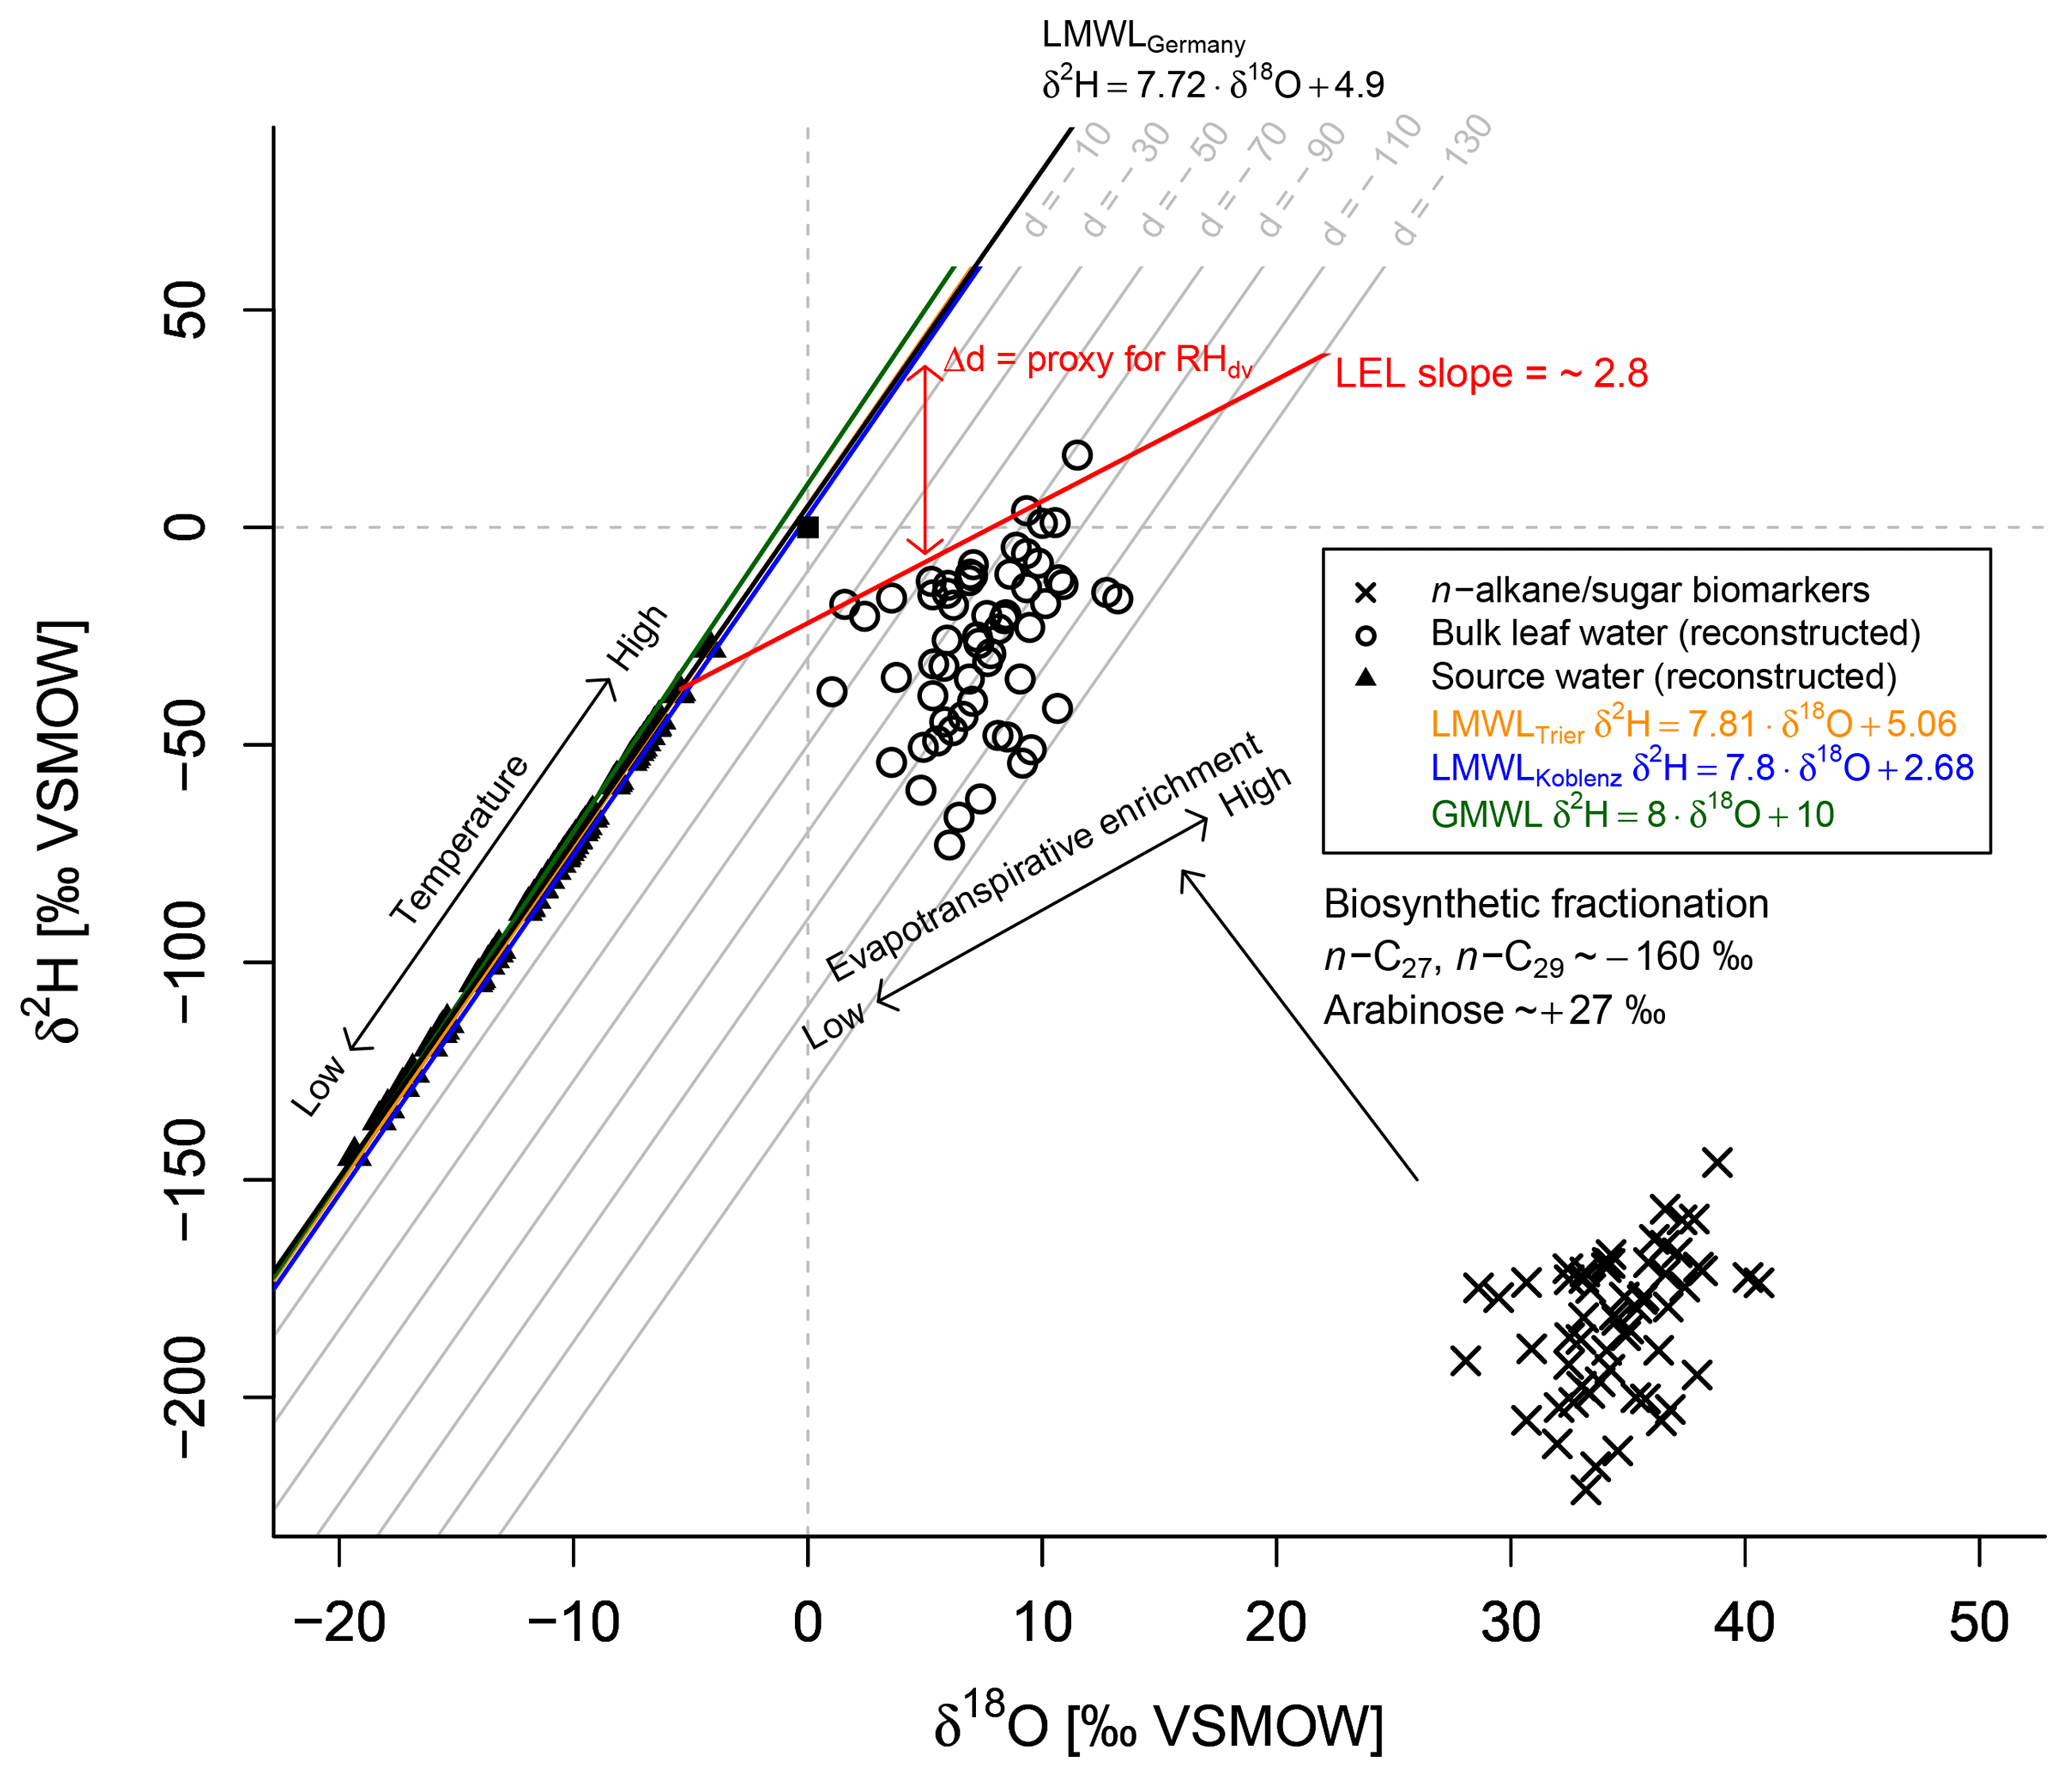
Figure 5Conceptual framework of the coupled δ2Hn-alkane–δ18Osugar paleohygrometer approach displayed as δ18O–δ2H diagram showing the measured n-alkanes (weighted mean of n-C27 and n-C29) and sugar (arabinose) biomarkers (black crosses), the reconstructed leaf water (open circles), the global meteoric water line (GMWL, green line), and the local meteoric water lines of Germany (LWMLGermany, black line), Trier (LWMLTrier, yellow line) and Koblenz (LWMLKoblenz, blue line). The black arrows indicate natural processes of evapotranspirative enrichment of leaf water along local evaporation lines (LELs), biosynthetic fractionation during biomarker synthesis and the temperature effect on the source water isotope composition (∼ precipitation). Grey lines indicate the parallel distance between the individual reconstructed evaporative site leaf water points and the LMWLGermany, expressed as . The difference between the d excesses of the leaf water and source water can serve as proxy for mean daytime vegetation period relative humidity (RHdv; red double arrow).
The numerator of Eq. (5) describes the parallel distance between the d excesses of LMWL and leaf water at the evaporative sites, which is converted into RH values, while the denominator is a combination of the slopes of LMWL and the local evaporation line (LEL). This means in turn that the quantification with Eq. (5) is done by obtaining the distance between the source water points, calculated via the intersects between the individual LELs and the LMWLGermany, and the leaf water points. The underlying slope of those LELs can be derived from Eq. (6) via the Craig–Gordon model using the same assumptions as outlined above in a rearranged form (Eq. 6; Zech et al., 2013a). When using the fractionation parameters from above, the slope of the LEL is constant over time, independent of RH and equal to ∼2.8 (Eq. 6). This agrees well with field and laboratory studies (Allison et al., 1985; Bariac et al., 1994; Gat et al., 2007; Tipple et al., 2013; Walker and Brunel, 1990).
In order to provide an uncertainty interval in terms of measurement precision covering the Gemündener Maar RH record, we calculated an error propagation for de values according to Eq. (7), by using the analytical standard errors (SEs). Maximum and minimum values were then applied to Eq. (5) resulting in a lower and upper RH limit (blue-shaded area in Fig. 7a).
3.1 Source identification of bulk organic matter and of the investigated n-alkane and sugar biomarkers
For basic sedimentological characterisation, TOC, N, δ15N, δ13CTC and δ13CTOC values as well as the TOC∕N atomic ratios (Fig. 3a to e) are displayed from 605 to 727 cm depth. TOC values range from 0.6 % to 19.7 %. N ranges from 0.1 % to 1.4 % and correlates highly significantly with TOC (r=0.99, p<0.001, n=110). Higher TOC contents during the Allerød, Preboreal and Boreal likely reflect warmer conditions being favourable for terrestrial and aquatic biomass production, whereas lower TOC values during the Younger Dryas likely reflect less favourable conditions for biomass production and possibly increasing minerogenic sedimentation. Interestingly, the Late Glacial–Early Holocene TOC patterns seem not to be the same for all maar lakes, because the Meerfelder Maar shows a clear TOC two-phasing during the Younger Dryas (Brauer et al., 1999) and the Holzmaar is lacking an Allerød TOC maximum (Lücke et al., 2003). The δ15N values of the Gemündener Maar record range from 0 ‰ to 5 ‰, showing the maximum and minimum within the Allerød period. δ13CTC and δ13CTOC reveal values between −31 ‰ and −17 ‰ and −36 ‰ and −24 ‰, respectively. While δ13CTC shows maximum values at 703 cm depth, δ13CTOC is decreasing continuously from the beginning to the end of the Allerød, followed by increasing values during the Younger Dryas and the Preboreal and Boreal, interrupted by a short decrease around the beginning of the Holocene. δ13CTC clearly shows the presence of carbonate between 690 and 727 cm depth with less negative δ13CTC values compared to δ13CTOC values. TOC∕N atomic ratios range from 6 to 19 with the end of the Allerød revealing increasing ratios, while the late Younger Dryas shows slightly decreasing ratios and the Preboreal is marked by the highest ratios.
The source of organic matter in lacustrine sediments of small lakes, as one of the most crucial questions and challenges when interpreting organic proxies from lacustrine sedimentary records (Meyers and Ishiwatari, 1993), can either be autochthonous (aquatic origin) or allochthonous (terrestrial origin). The TOC∕N ratio and δ13C values are the most common proxies for sedimentary source determination. While non-vascular aquatic organisms often reveal C∕N atomic ratios between 4 and 10 (due to low amounts of cellulose and lignin), vascular plants commonly show C∕N atomic ratios of 20 and higher (Meyers and Ishiwatari, 1993). According to Meyers (2003), a TOC∕N atomic ratio of 10 is often used as threshold for identifying aquatic versus terrestrial input (Fig. 3e). Accordingly, the input from terrestrial organic matter increased during the Allerød, decreased slightly during the Younger Dryas and was highest during the Holocene. The Gemündener Maar δ13CTOC values (Fig. 3d) are well within the range of C3 land plants and lacustrine algae (Meyers and Lallier-Vergés, 1999); evidence for the occurrence of C4 land plants is missing. Overall, no clear additional information about the sedimentary organic matter origin of the Gemündener Maar sediments can be inferred neither from δ13CTOC alone (cf. Lücke et al., 2003) nor by combining δ13CTOC with TOC∕N ratios (cf. Meyers and Lallier-Vergés, 1999). When considering that both δ13CTOC and TOC∕N values of terrestrial organic matter are additionally affected by mineralisation and degradation, resulting in more positive δ13CTOC values and lower TOC∕N ratios (e.g. Zech et al., 2007), a straightforward interpretation of those proxies seems to be challenging. Similarly, δ15N has been investigated as proxy for sedimentary organic matter origin (Meyers and Ishiwatari, 1993; Meyers and Lallier-Vergés, 1999; Wolfe et al., 1999). However, numerous processes that may have an influence, like nitrogen uptake by plants, various nitrogen sources, discrimination during denitrification and diagenesis, complicate the use of δ15N as a direct source determination proxy.
Despite the uncertainties presented above, concerning the origin of bulk sedimentary organic matter in the Gemündener Maar, the origin of the sedimentary biomarkers, namely n-alkanes and sugars, needs to be addressed. This is crucial because aquatic biomarkers incorporate the isotope composition of lake water, whereas terrestrial biomarkers incorporate the isotope composition of leaf water (Huang et al., 2004; Kahmen et al., 2013; Mügler et al., 2008; Sachse et al., 2004, 2012; Sauer et al., 2001; Tuthorn et al., 2014; Zech et al., 2013b, 2014b). With regard to the n-alkane biomarkers, high amounts of the chain lengths n-C27 and n-C29 are characteristic of the Gemündener Maar sediments. Such patterns are typical of epicuticular leaf wax layers of higher terrestrial plants (e.g. Eglinton and Hamilton, 1967). With regard to the sugar biomarkers, they were previously studied in detail by Hepp et al. (2016). According to the authors' own results and a compilation from the literature (including, e.g., Jia et al., 2008; Prietzel et al., 2013; Zech et al., 2012, 2014b), relatively high amounts of arabinose are a good indicator of a primarily terrestrial origin (higher vascular plants) of the sugars. This interpretation is in agreement with the Gemündener Maar being a small lake with densely forested steep crater walls (Fig. 1c). We therefore conclude and suggest that arabinose as well as n-C27 and n-C29 in our Gemündener Maar record are primarily of terrestrial rather than aquatic origin and thus reflect δ2H∕δ18Oleaf-water rather than δ2H∕δ18Olake-water.
3.2 Reconstructing leaf water isotope composition based on δ2Hn-alkane and δ18Osugar
The δ2H depth profiles reveal variations of −222 ‰ to −134 ‰ and −220 ‰ to −147 ‰ for n-C27 and n-C29, respectively (Fig. 4a). Their δ2H patterns correlate highly significantly with each other (r=0.7, p<0.001, n=59). Weighted mean δ2H values were calculated using the relative amounts of n-C27 and n-C29. The Younger Dryas is characterised by the most negative δ2H values (mean of −193 ‰), whereas the Allerød, the Preboreal and the Boreal yielded less negative values (−182 ‰, −178 ‰ and −171 ‰, respectively). Still, the Holocene part also reveals two pronounced δ2H minima. Overall, our Gemündener Maar δ2Hn-alkane resembles very well the δ2H n-C29 record of Rach et al. (2014) for Meerfelder Maar close by.
The δ18O values for arabinose, xylose and fucose range from 28 ‰ to 41 ‰, 26 ‰ to 45 ‰ and 27 ‰ to 46 ‰, respectively (Fig. 4b). They reveal similar trends overall (arabinose vs. xylose: r=0.7, p<0.001, n=59; arabinose vs. fucose: r=0.8, p<0.001, n=59; xylose vs. fucose: r=0.8, p<0.001, n=59). All sugar records show a clear shift to more positive values at the Younger Dryas–Holocene transition. While xylose and fucose exhibit a change of ∼8 ‰ and 7 ‰, arabinose δ18O values show a less pronounced shift of ∼3 ‰ (changes are based on the mean δ18O values for the Younger Dryas compared to the Preboreal/Boreal period). Xylose is however slightly more negative throughout the Allerød and Younger Dryas compared to arabinose and fucose. Consistently less pronounced changes can be observed for the Allerød–Younger Dryas transition of 1.9 ‰, 1.7 ‰ and 0.9 ‰ for xylose, fucose and arabinose, respectively (based on the mean δ18O values for the Allerød compared to the Younger Dryas). A distinct minimum during the early Preboreal (633 cm depth) characterises all three δ18O sugar records.
The isotope compositions of leaf wax n-alkanes and leaf (hemi-)celluloses from higher plants are known to be strongly related to the water in which they are biosynthesised. They basically reflect the isotope composition of leaf water during photosynthetic activity (Barbour and Farquhar, 2000; Cernusak et al., 2005; Kahmen et al., 2013; Sachse et al., 2012). Hence, the isotope signature of the paleo leaf water, δ18Ol and δ2Hl, respectively, can be reconstructed by using biosynthetic fractionation factors (Fig. 5; Eqs. 8 and 9). For this purpose, fractionation factors of −160 ‰ for the n-alkanes n-C27 and n-C29 (; Sachse et al., 2012; Sessions et al., 1999) and +27 ‰ for the hemicellulose sugar arabinose (; Cernusak et al., 2003; Schmidt et al., 2001; Sternberg et al., 1986; Yakir and DeNiro, 1990) seem to be appropriate (Eqs. 8 and 9).
From the study of tree rings, it is known that stem cellulose does not show the full leaf water 18O enrichment signal. Barbour and Farquhar (2000) related this signal dampening to the proportion of unenriched source water contributing to the local synthesis water (px) and to the proportion of exchangeable oxygen during cellulose synthesis (pex). The latter is often assumed to be rather constant around 0.40, as estimated from leaf and wood cellulose of Eucalyptus globulus and values compiled from the literature (Cernusak et al., 2005), meaning that around 40 % of the oxygens in the stem cellulose exchanged. Already Helliker and Ehleringer (2002) compared the signal transfer from leaf water to the cellulose of tree stems with the signal transfer occurring in grasses. And Liu et al. (2016) reported signal dampening in the range between 34 % and 53 % for the C4 grass Cleistogenes squarrosa.
Figure 4c illustrates that Poaceae pollen concentrations ranged between 11 % and 33 % during the Allerød and the Younger Dryas in the Gemündener Maar record. Hence, a correction for the 18O signal dampening may be required in order to take these vegetation changes into consideration. A respective correction procedure based on mass balance considerations is given in Eq. (10) in order to adjust δ18Ol to :
The correction presented in Eq. (10) is based on assumptions that 40 % (0.4) of the leaf water enrichment is lost during hemicellulose biosynthesis of grass leaves, which is well within the range of values presented in the literature for cellulose synthesis in tree rings and grasses (Cernusak et al., 2005; Liu et al., 2016). Furthermore, the Poaceae pollen concentration in percentage is used to calculate the fraction of non-grassy pollen () corresponding to the non-grassy biomarker contribution, which may serve as a rough approximation. For a paleo application, δ18Os remains a priori unknown. Therefore, the intercept between the individual LELs (Eq. 6) and the LMWL of Germany were used to generate δ18Os values. Note that the signal dampening effect described here for cellulose synthesis is likely not fully applicable to our approach using the sugar biomarker arabinose. In fact, pentoses like arabinose are biosynthesised via decarboxylation of the carbon at position six (C6) from glucose (Altermatt and Neish, 1956; Burget et al., 2003; Harper and Bar-Peled, 2002). Waterhouse et al. (2013) showed that the oxygens at C6 position in glucose moieties are most strongly affected by the exchange with a local water medium of 80 %, as indicated by heterotrophic cellulose synthesis. Thus, arabinose has lost a strongly exchanged (dampened) oxygen and the remaining pentose shows less 18O signal dampening.
Table 1Scenarios 1–4 used for reconstructing deuterium (d) excess of leaf water and corresponding RHdv values in order to assess/estimate the effect of variable grass contributions on the reconstructed Gemündener Maar RH record (see also Fig. 6).

With regard to the value of −160 ‰, this biosynthetic fractionation factor is confirmed by climate chamber studies of dicotyledonous plants (Kahmen et al., 2011, 2013; Tipple et al., 2015). However, the latter studies also reveal a range of ∼35 ‰, interpreted as species-specific effects during n-alkane biosynthesis. The difference between dicotyledonous and monocotyledonous C3 plants is much more pronounced the regarding the degree to which the leaf water isotope enrichment is transferred into leaf n-alkanes (Gamarra et al., 2016; Kahmen et al., 2013). While dicotyledonous plants show signal transfer rates of 96 % on average (Kahmen et al., 2013), a larger range of between 38 % and 61 % is found for monocotyledonous plants (Gamarra et al., 2016). The latter implies that 39 % to 62 % of the 2H leaf water enrichment is not recorded by the n-alkanes of grasses. Hence, like for δ18O, a correction may be requested to account for grass-derived n-alkanes:
where are the grass-corrected δ2Hl values. The δ2Hs values and the non-grassy pollen fraction are defined as in Eq. (10). The mass balance correction presented in Eq. (11) is based on assumptions that only 50 % of the leaf water enrichment is incorporated by the n-alkanes during biosynthesis in grass leaves.
In summary, the discussion outlined above allows reconstructing (and thus RH results with Eq. 5) for four scenarios (see also Table 1): (i) without signal dampening, (ii) with grass-corrected δ2H values, (iii) with grass-corrected δ18O values, and (iv) with grass-corrected δ2H and δ18O values.
3.3 Reconstructing relative humidity based on the coupled δ2Hn-alkane–δ18Osugar paleohygrometer approach
The biomarker-based leaf water values (δl=δ2Hl, δ18Ol via Eqs. 8 and 9) result in d excess values of leaf water (dl) ranging between −125 ‰ and −30 ‰ (Figs. 5 and 6a). This is well within the range that can be expected. For instance, Voelker et al. (2014) reported “deuterium deviations” (calculated as d excess of leaf water minus 10 ‰) ranging from 0 ‰ to −200 ‰. And Mayr (2002) conducted climate chamber experiments with Vicia, Brassica and Eucalyptus during his dissertation and measured δ2H and δ18O of leaf water (δ18Oleaf-water and δ18Osugars are published in Zech et al., 2014b). Accordingly, d excess of leaf water ranged from −38 ‰ to −171 ‰ and correlates highly significantly with RH (ranging from 21 % to 68 %).

Figure 6(a) Deuterium (d) excess depth profiles of reconstructed leaf water: dl (black line): no correction for grasses; (light blue line): δ2H corrected for grasses; (light red line): δ18O corrected for grasses; (light green line): δ2H and δ18O corrected for grasses. The error bars of dl values are calculated according to Eq. (7). (b) Reconstructed RHdv records. Modern RH variability during daytime and vegetation period (RHdv) is displayed as a box plot derived from the adjacent meteorological station Nürburg-Barweiler, using monthly means from April to October between 06:00 and 19:00 CET (based on hourly data from 1995 to 2015; Deutscher Wetterdienst, 2016). The numbers within the box plot represent the maximum, median and minimum values. (c) Depth profile of Poaceae pollen. Additionally, the resampled data points (black points) are displayed. The GM1 core picture with the used age markers are displayed on the left. AL: Allerød; LST: Laacher See Tephra; YD: Younger Dryas; PB: Preboreal; BO: Boreal.
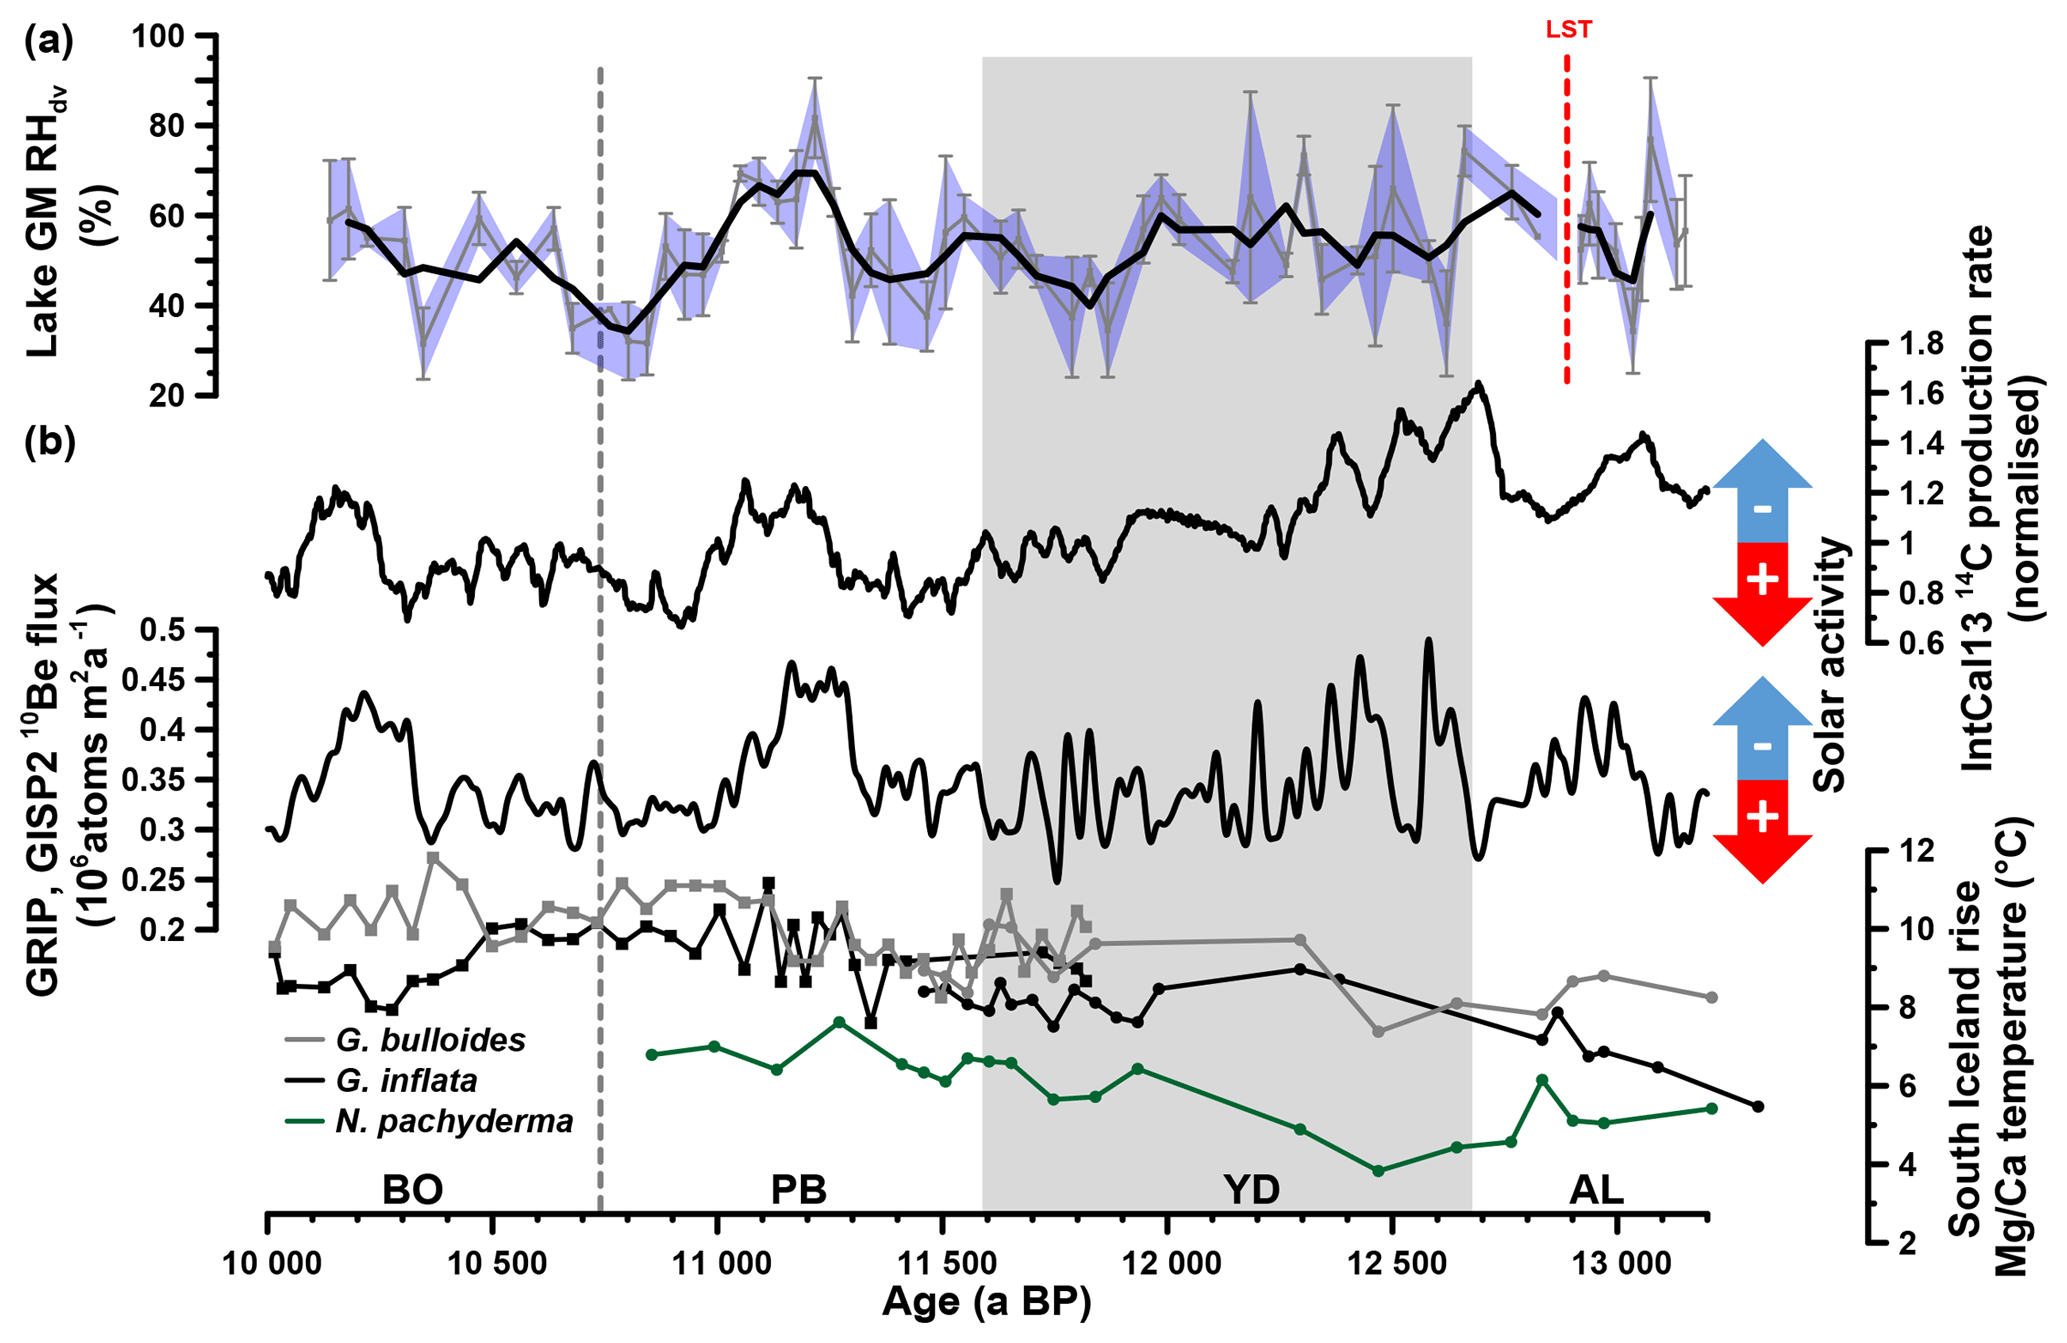
Figure 7(a) Reconstructed Gemündener Maar (GM) RHdv record. The bold line shows the three-point moving average. Error bars and the blue-shaded area indicate analytical uncertainties calculated according to error propagation (Eq. 7). (b) IntCal13 14C production rate, Greenland ice-core (GRIP, GISP2) 10Be flux record (both from Muscheler et al., 2014) and South Iceland Rise planktic Mg∕Ca-derived water temperatures from RAPiD-12-1K (squares; 10 000 to 11 800 a BP) and RAPiD-15-4P (circles; 10 900 to 13 200 a BP). RAPiD-12-1K and RAPiD-15-4P G. bulloides and G. inflata data from Thornalley et al. (2009) and Thornalley et al. (2010), respectively. RAPiD-15-4P N. pachyderma data from Thornalley et al. (2011). Note that each record is plotted on its own timescale (for planktonic Mg∕Ca data, see Thornalley et al., 2009, 2010; for 10Be data on GICC05, see Rasmussen et al., 2006; for 14C data on IntCal13 calibration curve, see Reimer et al., 2013; for RHdv data on GM age–depth model, see Fig. 2d). AL: Allerød, LST: Laacher See Tephra, YD: Younger Dryas, PB: Preboreal and BO: Boreal.
Using the Gemündener Maar dl values as input for Eq. (5), RH values during daytime and vegetation period (RHdv) can be calculated (scenario 1 in Table 1). Reconstructed RHdv values range from 32 % to 82 % (Fig. 6b). The error bars covering the Gemündener Maar RHdv record, calculated using pooled de standard errors ranging from 3.2 ‰ to 44.4 ‰ according Eq. (7), result in an RH uncertainty range of 1.7 % to 23.4 %. The RHdv record shows quite large variability with no clear trend during the Allerød and the first half of the Younger Dryas. The late Younger Dryas and the early and the middle Preboreal are characterised by lower RH values. By contrast, the middle Preboreal reveals the most pronounced RH maximum. The mean reconstructed RHdv value is 53 % (mean RHdv upper limit = 45 %; mean RHdv lower limit = 62 %; see Sect. 2.5). For comparison, the modern RHdv value (06:00 to 19:00 CET from April to October) from the adjacent meteorological station Nürburg-Barweiler (approx. 25 km northeast of Gemündener Maar (GM); hourly data from 1995 to 2015 from Deutscher Wetterdienst, 2016) is 67 % (Fig. 6b). In addition, the range of the reconstructed RHdv values of 50 % agrees well with the modern RHdv variability of 45 %, within a range of 48 % to 93 % (definition and meteorological station details as above). As proposed, in the previous chapter, three correction scenarios can be applied when reconstructing dl and RHdv values in order to account for 2H and 18O signal dampening occurring in grasses.
Accordingly, the full correction for grass-derived alkane and sugar biomarkers (scenario 4 in Table 1) results in 0.0 % to 6.3 % (mean 1.8 %) lower RHdv values (RHdv#* in Fig. 6b). This corresponds to dl decreases of 0.0 ‰ to −12.0 ‰ ( in Fig. 6a). Such small changes are still far below the pooled analytical standard errors. When only correcting for the 18O signal dampening (scenario 3 in Table 1), dl values decrease by 0.0 ‰ to −22.7 ‰, corresponding to RH decreases of 0.0 % to −12.0 % ( and RHdv# in Fig. 6a and b, respectively). By contrast, when only correcting for the 2H signal dampening (scenario 2 in Table 1), this leads to 0.0 ‰ to 10.6 ‰ more positive and 0.0 % to 5.6 % higher RHdv values ( and RHdv* in Fig. 6a and b). Overall, these results suggest that the reconstructed RHdv values are not strongly affected by 2H and 18O signal dampening of grasses.
We are aware that microclimatic conditions with higher RH values often develop in lower canopy levels of forests (Graham et al., 2014; Parker, 1995). This may result in RH overestimations when applying the coupled δ2Hn-alkane–δ18Osugar paleohygrometer approach. However, most leaf biomass is produced at higher canopy levels, which are exposed to sunlight and free-air RH values. This is in agreement with a study of Zech et al. (2015), who investigated n-alkanes in soils of the tropical montane rainforest of Mt Kilimanjaro. There, n-alkanes reflect δ2Hleaf-water as calculated from free-air RH rather than as calculated from nearly saturated ground-level RH.
A basic assumption of our coupled δ2Hn-alkane–δ18Osugar paleohygrometer approach is isotopic equilibrium between plant source water and water vapour. In order to test the robustness of this assumption and respective effects on reconstructed RH values, we used data of Jacob and Sonntag (1991), who measured the isotope composition of precipitation and of atmospheric water vapour in Heidelberg, Germany, during the period 1981 to 1989. The mean difference between the annual weighted means of precipitation (≈ plant source water) and the water vapour averaged over the vegetation period (April–October) was therefore calculated. Such derived apparent fractionation (εap) amounts to 18.3 ‰ and 1.57 ‰ on average for 2H and 18O, respectively. We used this εap in Eq. (1) instead of the difference δa−δs and recalculated the RH values. This recalculation leads to an average RH change of only −1.7 % (±0.9), which is far below the analytical errors of the d excess of leaf water.
Finally, the stability of the d excess and slope of the LMWLGermany through the past needs to be discussed. According to Stumpp et al. (2014), the long-term d excess of precipitation from 28 sites in Germany does not show pronounced relationships to local climate conditions of the site. All reported values are close to 10 ‰, which indicates that Atlantic air masses are the main moisture source for Germany (e.g. Rozanski et al., 1993). In addition, the d excess of precipitation from the stations Trier and Koblenz, which are close to the Gemündener Maar, reveal rather small variability on a monthly, annual and long-term basis. For Trier monthly averaged d excess values (March to October) range from 5.3 ‰ to 8.7 ‰. Annually weighted mean d excess values range from 1.9 ‰ to 10.6 ‰, and the long-term weighted mean is 6.7 ‰ (±2.2); for Koblenz the d excess values range between 2.1 ‰ and 6.4 ‰ and 1.4 ‰ and 8.7 ‰, and the long-term weighted mean is 4.1 ‰ (±1.8) (derived from IAEA/WMO, 2018). Finally, d excess variability in Greenland and Antarctic ice cores does not exceed 4 ‰ over the timescale relevant here (Masson-Delmotte et al., 2005; Stenni et al., 2010). In addition, paleowater samples from Europe suggest that the d excess of precipitation was rather constant throughout the past 35 000 years, which implies that the principle atmospheric circulation patterns over the European continent did not change substantially (Rozanski, 1985). In summary, the variations in the slope of the LMWL of Germany are assumed to be rather small over longer timescales.
The detailed discussions in the above three sections address numerous uncertainties when using the coupled δ2Hn-alkane–δ18Osugar paleohygrometer approach. Conclusively, the reconstructed RHdv history of the Gemündener Maar seems, however, robust enough to infer reliable paleoclimatic or hydrologic conclusions.
3.4 How dry was the Younger Dryas in western Europe?
While it is well known that the Younger Dryas was a cold spell occurring in the Northern Hemisphere during the Late Glacial (Denton et al., 2010; Heiri et al., 2014; Isarin and Bohncke, 1999), there is much less clear evidence concerning moisture supply or availability and RH changes during the Younger Dryas. The Gemündener Maar RHdv record suggests quite some variability but on average moderate RHdv conditions of ∼56 % during the end of the Allerød and the first half of the Younger Dryas. This is within the range of modern RHdv values (Fig. 6b). In the second half of the Younger Dryas, a clear RHdv decrease of ∼11 % occurred (Fig. 7a). Such a two phasing of the Younger Dryas has been suggested previously based on multiproxy climate data for western Europe (Isarin et al., 1998). In more detail, Isarin et al. (1998) reported a cold and humid first phase being followed by drier and warmer conditions. It is moreover speculated that a shift in the mean sea-ice margin during winter in the North Atlantic Ocean slightly to the north could have caused this two phasing. Reduced cyclonic activity and precipitation thereby primarily affected western Europe because this region was situated at the southern margin of the main storm tracks during the first Younger Dryas period (Isarin et al., 1998). The authors also presented evidence for the strengthening of the westerly winds in western Europe as consequence of northward-shifted North Atlantic Ocean sea-ice margin during the late Younger Dryas period. This contradicts, however, with the interpretation of the Meerfelder Maar sedimentary record. Here, the thicker varves during the early Younger Dryas (between 12 680 and 12 240 varve a BP) are used along with geochemical results as indicator of stronger winter winds (Brauer et al., 2008). In line with this, Brauer et al. (1999) interpreted high biogenic opal contents and Pediastrum remains concentrations during the early Younger Dryas as enhanced aquatic productivity due to an increased nutrient supply caused by soil erosion and the reworking of littoral sediments. The varve formation throughout the second Younger Dryas period (between 12 240 and 11 590 varve a BP) is interpreted to be mainly controlled by snowmelt-driven surface runoff (Brauer et al., 1999). Moreover, the authors speculate if during that time the Meerbach began to drain into the Meerfelder Maar, which could be possibly linked to enhanced precipitation amounts. In summary, the interpretations derived from the Younger Dryas sediments of the Meerfelder Maar by Brauer et al. (2008, 1999) seem neither to be in accordance with the results of Isarin et al. (1998) nor with the established RHdv record of the Gemündener Maar (Fig. 7a).
Recently, Rach et al. (2017) reconstructed RH changes and generally dry Younger Dryas climatic conditions by investigating δ2H of terrestrially versus aquatically derived n-alkanes (published in Rach et al., 2014) from the Meerfelder Maar archive. At the current state of research, it can only be speculated about the reasons for this discrepancy, with our Gemündener Maar RH record not corroborating an overall dry Younger Dryas. While the uncertainties of the coupled δ2Hn-alkane–δ18Osugar paleohygrometer approach were discussed in detail in the previous sections, in our opinion the most important uncertainties affecting the dual-biomarker approach of Rach et al. (2014, 2017) are the following. First, lake water is assumed to reflect δ2H of precipitation. Indeed, Holzmaar, which seems to be comparable to the Meerfelder Maar at least for the drainage conditions via one creek, shows a difference of 7.4 ‰ in δ2H between inflow and lake water (Sachse et al., 2004). This lake water enrichment is likely to have been variable in the past, especially when including the speculation concerning the drainage of the Meerbach during the Younger Dryas (Brauer et al., 1999). Second, n-C23 is interpreted to be of aquatic origin (from Potamogeton) and used for reconstructing δ2Hlake-water. However, there is increasing evidence that n-C23 is also of terrestrial origin (Rao et al., 2014). For instance, Aichner et al. (2018) have recently shown for a lake in Poland that n-C23 shows a variable mixture of aquatic and terrestrial origin in those Late Glacial and Early Holocene sediments. And birch as a pioneering and one of the dominant tree species during Late Glacial reforestation of central Europe is known to produce considerable amounts of mid-chain n-alkanes (Tarasov et al., 2013). Although they are not included in the latter publication, n-C23 concentrations of Betula exilis and Betula pendula reached 653 and even 2323 µg g−1 in that study. This is highly relevant, because the biosynthetic fractionation factor of aquatic n-alkanes is much smaller than the one of terrestrial n-alkanes. Minor changes in the contribution of terrestrial vs. aquatic n-alkanes will thus have a considerable impact on the reconstructed δ2H n-C23 record and in turn on reconstructed RH values when applying the dual-biomarker approach. Finally, it may worth acknowledging that Sachse et al. (2004) found no significant correlation for δ2H of n-C23 and lake water and precipitation along a European lake surface transect.
Also recently and also applying the dual-biomarker approach, Muschitiello et al. (2015) studied Younger Dryas lake sediments from Hässeldala Port in southern Sweden. Here, the authors used δ2H of n-C21 as a proxy for lake water and summer precipitation. The calculated difference between terrestrial and aquatic n-alkane δ2H values suggests more humid conditions at the beginning of the Younger Dryas followed by a more or less steady trend towards drier conditions, peaking around 11 700 a BP (Muschitiello et al., 2015). Within age uncertainties, this would be in line with the Gemündener Maar RHdv minimum between ∼11 700 and 11 900 a BP. Last but not least, Gázquez et al. (2018) analysed triple oxygen and hydrogen isotopes of gypsum in the southern Pyrenees and thus reconstructed RH changes. Again, more humid conditions are reported for the beginning of the Younger Dryas.
In search of possible drivers or mechanisms for the observed Gemündener Maar RHdv record, we came across the 14C production and 10Be flux rates (Fig. 7b), derived from IntCal13 and the Greenland ice cores (GRIP, GISP2), respectively (Muscheler et al., 2014). These records are commonly interpreted in terms of solar activity (and thus insolation) changes (Stuiver and Braziunas, 1988; Vonmoos et al., 2006) and reveal striking similarities with our Gemündener Maar RHdv record. For instance, all three records reveal quite high centennial-scale variability during the Allerød and the first half of the Younger Dryas. Generally low RHdv values during the second half of the Younger Dryas and the Early Preboreal coincide with high solar activity, whereas the pronounced RHdv maximum from 11 260 to 11 050 a BP coincides within age uncertainties with a pronounced solar activity minimum (Fig. 7). We dub this wet period the “Preboreal Humid Phase”, which should not be confused with the Preboreal Oscillation (Björck et al., 1997). The Preboreal Oscillation is a short cold event recorded in Greenland ice cores ∼11 400 ka (Rasmussen et al., 2007) and led to more arid conditions at least in the Netherlands according to palynological results (Bos et al., 2007; van der Plicht et al., 2004). These pollen records also show the existence of a pronounced humid phase thereafter, thus corroborating the Preboreal Humid Phase. Widespread glacial advances in the Alps are also attributed to the Preboreal Oscillation (Moran et al., 2017). However, given the dating uncertainties they may actually rather reflect increased precipitation during the Preboreal Humid Phase.
It should be emphasised, that the described similarities between the Gemündener Maar RHdv record and the solar activity records do not allow an a priori causality interpretation. It is widely accepted that the Younger Dryas and the Preboreal Oscillation are related to freshwater forcing in the North Atlantic (e.g. Fisher et al., 2002; Murton et al., 2010; Muschitiello et al., 2015). However, the causes and mechanisms responsible for climate and environmental changes during the rest of the Holocene remain vague, and more research including paleoclimate modelling is clearly needed and encouraged to investigate the possible influence of solar activity (Renssen et al., 2007; Rind, 2002). We propose that both the North Atlantic Ocean temperature and solar activity (the latter triggering solar insolation) were the two main drivers for the RHdv variability in central Europe. A key example might be the Preboreal Humid Phase. It can be expected that the North Atlantic Ocean, the main moisture source for central Europe, already had considerably higher temperatures during the Preboreal Humid Phase compared to the Younger Dryas, as indicated by a consistent ∼2 ∘C increase in Mg∕Ca temperatures derived from planktonic foraminifera (Globorotalia inflata, Globorotalia bulloides and Neogloboquadrina pachyderma) in a marine sediment core south of Iceland (Fig. 7b, Thornalley et al., 2009, 2010, 2011). This led to an enhanced moisture content of the atmosphere. When these wet air masses were transported onto continental Europe, where low solar insolation inhibited warming up and drying of these air masses, pronounced humid climate conditions were established.
Referring to the underlying research questions and based on the presented results and the outlined discussion (including the cited literature), the following conclusions have to be drawn.
The terrestrial vs. aquatic origin of bulk sedimentary organic matter cannot be determined unambiguously for the Gemündener Maar. This is caused by the bulk proxies (TOC∕N, δ13C and δ15N) not being straightforwardly interpretable. By contrast, the alkane biomarkers with the chain-length n-C27 and n-C29 and the sugar biomarker arabinose can be most likely associated with the epicuticular leaf wax layers and the hemicellulose structures of higher terrestrial plants, respectively. Therefore, they are interpreted as originating primarily from leaf material of the Gemündener Maar catchment.
δ2H∕δ18Oleaf-water could be reconstructed from δ2Hn-alkane (n-C27 and n-C29) and δ18Osugar (arabinose) by applying biosynthetic fractionation factors. We acknowledge that the assumption of constant fractionation factors introduces uncertainty as highlighted by the broad literature discussion. A correction for the signal dampening of leaf water 2H∕18O enrichment occurring in grasses is possible but seems negligible in the case of the Gemündener Maar record.
The detailed discussion of possible uncertainties of the applied coupled δ2Hn-alkane–δ18Osugar paleohygrometer approach suggests that robust RH reconstructions are possible for the Gemündener Maar record. The reconstructed RH values refer to daytime and vegetation period (RHdv).
The established Gemündener Maar RHdv record supports a two phasing of the Younger Dryas with moderate wet conditions at Allerød level during the first half and drier conditions during the second half of the Younger Dryas. Overall, dry climatic conditions characterising the Younger Dryas could not be corroborated. Unexpectedly, the amplitude of RHdv changes during the Early Holocene was more pronounced than during the Younger Dryas and includes a pronounced Preboreal Humid Phase occurring from ∼11 260 to 11 050 a BP. We propose North Atlantic Ocean temperature and solar activity (and thus insolation) as the main drivers for Late Glacial–Early Holocene RH changes in central Europe and encourage respective paleoclimate modelling studies in order to validate or falsify our proposition.
The data are available in the Supplement, including sampling depth, calculated ages, measured δ2Hn-alkane and δ18Osugar values, reconstructed δ2H∕δ18Oleaf-water, d excess of leaf water, RHdv, and δ2H∕δ18Osource-water values.
The supplement related to this article is available online at: https://doi.org/10.5194/cp-15-713-2019-supplement.
JH, LW and MZ wrote the paper; MZ and RZ acquired financial support. FS was responsible for lake coring and provided the chronology and stratigraphy. LW, JH, TB, MB and IKS carried out laboratory work and did data evaluation. MB, IKS, BG, KR, FS and RZ contributed to the discussion of the data and commented on the paper.
The authors declare that they have no conflict of interest.
We greatly acknowledge Raimund Muscheler (Lund University) for providing 10Be flux as well as 14C production rates data. We thank Marianne Benesch (Martin Luther University Halle-Wittenberg), Anna Kühnel (Technical University of Munich), Jana Zech (University of Bern), Frank Dreher (Johannes Gutenberg University of Mainz), Selina Lutz (University of Zurich), and Nevena Baltić and Paul Kretschmer (Martin Luther University Halle-Wittenberg) for their support during laboratory work and statistical analyses. We cordially thank Pieter M. Grootes (Kiel University) for valuable recommendations during paper preparation and Keely Mills, Philip Meyers and an anonymous reviewer for their great editorial support and constructive and encouraging reviews. Our paper also greatly profited from short comments provided by Bernd Zolitschka, Andreas Lücke, Enno Schefuß, Dirk Sachse and Frederik Schenk (see SCs on discussion paper and our replies). The Swiss National Science Foundation (PP00P2 150590) funded Lorenz Wüthrich, Marcel Bliedtner, Imke Kathrin Schäfer and Roland Zech. The involvement of Kazimierz Rozanski was supported by AGH UST statutory task no. 11.11.220.01/1 within a subsidy of the Ministry of Science and Higher Education. Johannes Hepp greatly acknowledges the support given by the German Federal Environmental Foundation. This publication was funded by the publication fund of the Martin Luther University and of the University Hospital Halle (Saale) through reimbursement.
This paper was edited by Keely Mills and reviewed by Philip Meyers and one anonymous referee.
Aichner, B., Ott, F., Slowinski, M., Noryskiewicz, A. M., Brauer, A., and Sachse, D.: Leaf wax n-alkane distributions record ecological changes during the Younger Dryas at Trzechowskie paleolake (northern Poland) without temporal delay, Clim. Past, 14, 1607–1624, https://doi.org/10.5194/cp-14-1607-2018, 2018.
Alley, R. B.: The Younger Dryas cold interval as viewed from central Greenland, Quaternary Sci. Rev., 19, 213–226, https://doi.org/10.1016/S0277-3791(99)00062-1, 2000.
Allison, G. B., Gat, J. R., and Leaney, F. W. J.: The relationship between deuterium and oxygen-18 delta values in leaf water, Chem. Geol., 58, 145–156, 1985.
Altermatt, H. A. and Neish, A. C.: The biosynthesis of cell wall carbohydrates: III. Further studies on formation of cellulose and xylan from labeled monosaccharides in wheat plants, Can. J. Biochem. Phys., 34, 405–413, https://doi.org/10.1139/o56-042, 1956.
Amelung, W., Cheshire, M. V., and Guggenberger, G.: Determination of neutral and acidic sugars in soil by capillary gas-liquid chromatography after trifluoroacetic acid hydrolysis, Soil Biol. Biochem., 28, 1631–1639, 1996.
Araguás-Araguás, L., Froehlich, K., and Rozanski, K.: Deuterium and oxygen-18 isotope composition of precipitation and atmospheric moisture, Hydrol. Process., 14, 1341–1355, https://doi.org/10.1002/1099-1085(20000615)14:8<1341::AID-HYP983>3.0.CO;2-Z, 2000.
Barbour, M. M. and Farquhar, G. D.: Relative humidity-and ABA-induced variation in carbon and oxygen isotope ratios of cotton leaves, Plant Cell Environ., 23, 473–485, 2000.
Barbour, M. M., Roden, J. S., Farquhar, G. D., and Ehleringer, J. R.: Expressing leaf water and cellulose oxygen isotope ratios as enrichment above source water reveals evidence of a Péclet effect, Oecologia, 138, 426–435, https://doi.org/10.1007/s00442-003-1449-3, 2004.
Bariac, T., Gonzalez-Dunia, J., Katerji, N., Béthenod, O., Bertolini, J. M., and Mariotti, A.: Spatial variation of the isotopic composition of water (18O, 2H) in the soil-plant-atmosphere system, 2. Assessment under field conditions, Chem. Geol., 115, 317–333, 1994.
Björck, S., Rundgren, M., Ingólfsson, O., and Funder, S.: The Preboreal oscillation around the Nordic Seas: terrestrial and lacustrine responses, J. Quaternary Sci., 12, 455–465, https://doi.org/10.1002/(SICI)1099-1417(199711/12)12:6<455::AID-JQS316>3.0.CO;2-S, 1997.
Bos, J. A. A., van Geel, B., van der Plicht, J., and Bohncke, S. J. P.: Preboreal climate oscillations in Europe: Wiggle-match dating and synthesis of Dutch high-resolution multi-proxy records, Quaternary Sci. Rev., 26, 1927–1950, https://doi.org/10.1016/j.quascirev.2006.09.012, 2007.
Brauer, A., Endres, C., Günter, C., Litt, T., Stebich, M., and Negendank, J. F. W.: High resolution sediment and vegetation responses to Younger Dryas climate change in varved lake sediments from Meerfelder Maar, Germany, Quaternary Sci. Rev., 18, 321–329, https://doi.org/10.1016/S0277-3791(98)00084-5, 1999.
Brauer, A., Haug, G. H., Dulski, P., Sigman, D. M., and Negendank, J. F. W.: An abrupt wind shift in western Europe at the onset of the Younger Dryas cold period, Nat. Geosci., 1, 520–523, https://doi.org/10.1038/ngeo263, 2008.
Brunck, H., Sirocko, F., and Albert, J.: The ELSA-Flood-Stack: A reconstruction from the laminated sediments of Eifel maar structures during the last 60,000 years, Global Planet. Change, 142, 136–146, https://doi.org/10.1016/j.gloplacha.2015.12.003, 2015.
Büchel, G.: Maars of the Westeifel, Germany, in: Paleolimnology of European Maar Lake, edited by: Negendank, L. and Zolitschka, B., Vol. 49, 1–13, Springer-Verlag, Berlin Heidelberg, 1993.
Büchel, G.: Vulkanologische Karte der West- und Hocheifel 1 : 50 000, Landesvermessungsamt Rheinland-Pfalz, Koblenz, 1994.
Burget, E. G., Verma, R., Mølhøj, M., and Reiter, W.-D.: The Biosynthesis of L-Arabinose in Plants: Molecular Cloning and Characterization of a Golgi-Localised UDP-D-Xylose 4-Epimerase Encoded by the MUR4 Gene of Arabidopsis, Plant Cell, 15, 523–531, https://doi.org/10.1105/tpc.008425, 2003.
Cernusak, L. A., Wong, S. C., and Farquhar, G. D.: Oxygen isotope composition of phloem sap in relation to leaf water in Ricinus communis, Funct. Plant Biol., 30, 1059–1070, 2003.
Cernusak, L. A., Farquhar, G. D., and Pate, J. S.: Environmental and physiological controls over oxygen and carbon isotope composition of Tasmanian blue gum, Eucalyptus globulus, Tree Physiol., 25, 129–146, https://doi.org/10.1093/treephys/25.2.129, 2005.
Cernusak, L. A., Barbour, M. M., Arndt, S. K., Cheesman, A. W., English, N. B., Feild, T. S., Helliker, B. R., Holloway-Phillips, M. M., Holtum, J. A. M., Kahmen, A., Mcinerney, F. A., Munksgaard, N. C., Simonin, K. A., Song, X., Stuart-Williams, H., West, J. B., and Farquhar, G. D.: Stable isotopes in leaf water of terrestrial plants, Plant Cell Environ., 39, 1087–1102, https://doi.org/10.1111/pce.12703, 2016.
Craig, H. and Gordon, L. I.: Deuterium and oxygen-18 variations in the ocean and the marine atmosphere, in: Proceedings of a Conference on Stable Isotopes in Oceanographic Studies and Palaeotemperatures, edited by: Tongiorgi, E., 9–130, Lischi and Figli, Pisa, 1965.
Dansgaard, W.: Stable isotopes in precipitation, Tellus, 16, 436–468, https://doi.org/10.1111/j.2153-3490.1964.tb00181.x, 1964.
Denton, G. H., Anderson, R. F., Toggweiler, J. R., Edwards, R. L., Schaefer, J. M., and Putnam, A. E.: The Last Glacial Termination, Science, 328, 1652–1656, https://doi.org/10.1126/science.1184119, 2010.
Deutscher Wetterdienst: Climate data center, Nürburg-Barweiler station, available at: ftp://ftp-cdc.dwd.de/pub/CDC/, last access: 10 August 2016.
Eglinton, G. and Hamilton, R. J.: Leaf Epicuticular Waxes, Science, 156, 1322–1335, https://doi.org/10.1126/science.156.3780.1322, 1967.
Farquhar, G. D., Hubick, K. T., Condon, A. G., and Richards, R. A.: Carbon Isotope Fractionation and Plant Water-Use Efficiency, in: Stable Isotopes in Ecological Research. Ecological Studies (Analysis and Synthesis), edited by: Rundel, P. W., Ehleringer, J. R., and Nagy, K. A., Vol. 68, 21–40, Springer-Verlag, New York, 1989.
Fisher, T. G., Smith, D. G., and Andrews, J. T.: Preboreal oscillation caused by a glacial Lake Agassiz flood, Quaternary Sci. Rev., 21, 873–878, https://doi.org/10.1016/S0277-3791(01)00148-2, 2002.
Flanagan, L. B., Comstock, J. P., and Ehleringer, J. R.: Comparison of Modeled and Observed Environmental Influences on the Stable Oxygen and Hydrogen Isotope Composition of Leaf Water in Phaseolus vulgaris L., Plant Physiol., 96, 588–596, 1991.
Gamarra, B., Sachse, D., and Kahmen, A.: Effects of leaf water evaporative 2H-enrichment and biosynthetic fractionation on leaf wax n-alkane δ2H values in C3 and C4 grasses, Plant Cell Environ., 39, 2390–2403, https://doi.org/10.1111/pce.12789, 2016.
Gat, J. R. and Bowser, C. J.: The heavy isotope enrichment of water in coupled evaporative systems, in: Stable Isotope Geochemistry: A Tribute to Samuel Epstein, edited by: Tayler, H. P., O'Neil, J. R., and Kaplan, I. R., Vol. 3, 159–168, The Geochemical Society, Lancester, 1991.
Gat, J. R., Yakir, D., Goodfriend, G., Fritz, P., Trimborn, P., Lipp, J., Gev, I., Adar, E., and Waisel, Y.: Stable isotope composition of water in desert plants, Plant Soil, 298, 31–45, https://doi.org/10.1007/s11104-007-9321-6, 2007.
Gázquez, F., Morellón, M., Bauska, T., Herwartz, D., Surma, J., Moreno, A., Staubwasser, M., Valero-Garcés, B., Delgado-Huertas, A., and Hodell, D. A.: Triple oxygen and hydrogen isotopes of gypsum hydration water for quantitative paleo-humidity reconstruction, Earth Planet. Sc. Lett., 481, 177–188, https://doi.org/10.1016/j.epsl.2017.10.020, 2018.
Graham, H. V., Patzkowsky, M. E., Wing, S. L., Parker, G. G., Fogel, M. L., and Freeman, K. H.: Isotopic characteristics of canopies in simulated leaf assemblages, Geochim. Cosmochim. Ac., 144, 82–95, https://doi.org/10.1016/j.gca.2014.08.032, 2014.
Harper, A. D. and Bar-Peled, M.: Biosynthesis of UDP-Xylose. Cloning and Characterization of a Novel Arabidopsis Gene Family, UXS, Encoding Soluble and Putative Membrane-Bound UDP-Glucuronic Acid Decarboxylase Isoforms, Gene, 130, 2188–2198, https://doi.org/10.1104/pp.009654, 2002.
Heiri, O., Koinig, K. A., Spötl, C., Barrett, S., Brauer, A., Drescher-Schneider, R., Gaar, D., Ivy-Ochs, S., Kerschner, H., Luetscher, M., Moran, A., Nicolussi, K., Preusser, F., Schmidt, R., Schoeneich, P., Schwörer, C., Sprafke, T., Terhorst, B., and Tinner, W.: Palaeoclimate records 60–8 ka in the Austrian and Swiss Alps and their forelands, Quaternary Sci. Rev., 106, 186–205, https://doi.org/10.1016/j.quascirev.2014.05.021, 2014.
Helliker, B. R. and Ehleringer, J. R.: Grass blades as tree rings: environmentally induced changes in the oxygen isotope ratio of cellulose along the length of grass blades, New Phytol., 155, 417–424, 2002.
Henderson, A. K., Nelson, D. M., Hu, F. S., Huang, Y., Shuman, B. N., and Williams, J. W.: Holocene precipitation seasonality captured by a dual hydrogen and oxygen isotope approach at Steel Lake, Minnesota, Earth Planet. Sc. Lett., 300, 205–214, https://doi.org/10.1016/j.epsl.2010.09.024, 2010.
Hepp, J., Tuthorn, M., Zech, R., Mügler, I., Schlütz, F., Zech, W., and Zech, M.: Reconstructing lake evaporation history and the isotopic composition of precipitation by a coupled δ18O-δ2H biomarker approach, J. Hydrol., 529, 622–631, 2015.
Hepp, J., Rabus, M., Anhäuser, T., Bromm, T., Laforsch, C., Sirocko, F., Glaser, B., and Zech, M.: A sugar biomarker proxy for assessing terrestrial versus aquatic sedimentary input, Organic Geochem., 98, 98–104, https://doi.org/10.1016/j.orggeochem.2016.05.012, 2016.
Hepp, J., Zech, R., Rozanski, K., Tuthorn, M., Glaser, B., Greule, M., Keppler, F., Huang, Y., Zech, W., and Zech, M.: Late Quaternary relative humidity changes from Mt. Kilimanjaro, based on a coupled 2H-18O biomarker paleohygrometer approach, Quaternary Int., 438, 116–130, https://doi.org/10.1016/j.quaint.2017.03.059, 2017.
Horita, J. and Wesolowski, D. J.: Liquid-vapor fractionation of oxygen and hydrogen isotopes of water from the freezing to the critical temperature, Geochim. Cosmochim. Ac., 58, 3425–3437, https://doi.org/10.1016/0016-7037(94)90096-5, 1994.
Hou, J., D'Andrea, W. J., and Huang, Y.: Can sedimentary leaf waxes record D/H ratios of continental precipitation? Field, model, and experimental assessments, Geochim. Cosmochim. Ac., 72, 3503–3517, https://doi.org/10.1016/j.gca.2008.04.030, 2008.
Huang, Y., Shuman, B., Wang, Y., and Iii, T. W.: Hydrogen isotope ratios of individual lipids in lake sediments as novel tracers of climatic and environmental change: a surface sediment test, J. Paleolimnol., 31, 363–375, 2004.
IAEA/WMO: Global Network of Isotopes in Precipitation, The GNIP Database, available at: https://nucleus.iaea.org/wiser, last access: 9 February 2018.
Isarin, R. F. B. and Bohncke, S. J. P.: Mean July Temperatures during the Younger Dryas in Northwestern and Central Europe as Inferred from Climate Indicator Plant Species, Quaternary Res., 51, 158–173, https://doi.org/10.1006/qres.1998.2023, 1999.
Isarin, R. F. B., Renssen, H., and Vandenberghe, J.: The impact of the North Atlantic Ocean on the Younger Dryas climate in northwestern and central Europe, J. Quaternary Sci., 13, 447–453, https://doi.org/10.1002/(sici)1099-1417(1998090)13:5<447::aid-jqs402>3.0.co;2-b, 1998.
Jacob, H. and Sonntag, C.: An 8-year record of the seasonal-variation of 2H and 18O in atmospheric water vapor and precipitation at Heidelberg, Tellus B, 43, 291–300, 1991.
Jia, G., Dungait, J. A. J., Bingham, E. M., Valiranta, M., Korhola, A., and Evershed, R. P.: Neutral monosaccharides as biomarker proxies for bog-forming plants for application to palaeovegetation reconstruction in ombrotrophic peat deposits, Org. Geochem., 39, 1790–1799, https://doi.org/10.1016/j.orggeochem.2008.07.002, 2008.
Kahmen, A., Dawson, T. E., Vieth, A., and Sachse, D.: Leaf wax n-alkane δD values are determined early in the ontogeny of Populus trichocarpa leaves when grown under controlled environmental conditions, Plant Cell Environ., 34, 1639–1651, https://doi.org/10.1111/j.1365-3040.2011.02360.x, 2011.
Kahmen, A., Schefuß, E., and Sachse, D.: Leaf water deuterium enrichment shapes leaf wax n-alkane δD values of angiosperm plants I: Experimental evidence and mechanistic insights, Geochim. Cosmochim. Ac., 111, 39–49, 2013.
Litt, T. and Stebich, M.: Bio- and chronostratigraphy of the lateglacial in the Eifel region, Germany, Quaternary Int., 61, 5–16, https://doi.org/10.1016/S1040-6182(99)00013-0, 1999.
Litt, T., Brauer, A., Goslar, T., Merkt, J., Balaga, K., Müller, H., Ralska-Jasiewiczowa, M., Stebich, M., and Negendank, J. F. W.: Correlation and synchronisation of Lateglacial continental sequences in northern central Europe based on annually laminated lacustrine sediments, Quaternary Sci. Rev., 20, 1233–1249, 2001.
Litt, T., Schmincke, H.-U., and Kromer, B.: Environmental response to climatic and volcanic events in central Europe during the Weichselian Lateglacial, Quaternary Sci. Rev., 22, 7–32, 2003.
Litt, T., Schölzel, C., Kühl, N., and Brauer, A.: Vegetation and climate history in the Westeifel Volcanic Field (Germany) during the past 11 000 years based on annually laminated lacustrine maar sediments, Boreas, 38, 679–690, https://doi.org/10.1111/j.1502-3885.2009.00096.x, 2009.
Liu, H. T., Gong, X. Y., Schäufele, R., Yang, F., Hirl, R. T., Schmidt, A., and Schnyder, H.: Nitrogen fertilization and δ18O of CO2 have no effect on 18O-enrichment of leaf water and cellulose in Cleistogenes squarrosa (C4) – is VPD the sole control?, Plant Cell Environ., 39, 2701–2712, https://doi.org/10.1111/pce.12824, 2016.
Lücke, A., Schleser, G. H., Zolitschka, B., and Negendank, J. F. W.: A Lateglacial and Holocene organic carbon isotope record of lacustrine palaeoproductivity and climatic change derived from varved lake sediments of Lake Holzmaar, Germany, Quaternary Sci. Rev., 22, 569–580, https://doi.org/10.1016/S0277-3791(02)00187-7, 2003.
Luetscher, M., Boch, R., Sodemann, H., Spötl, C., Cheng, H., Edwards, R. L., Frisia, S., Hof, F., and Müller, W.: North Atlantic storm track changes during the Last Glacial Maximum recorded by Alpine speleothems, Nat. Commun., 6, 6344, https://doi.org/10.1038/ncomms7344, 2015.
Masson-Delmotte, V., Jouzel, J., Landais, A., Stievenard, M., Johnson, S. J., White, J. W. C., Werner, M., Sveinbjornsdottir, A., and Fuhrer, K.: GRIP Deuterium Excess Reveals Rapid and Orbital-Scale Changes in Greenland Moisture Origin, Science, 309, 118–121, https://doi.org/10.1126/science.1108575, 2005.
Mayr, C.: Möglichkeiten der Klimarekonstruktion im Holozän mit δ13C- und δ2H-Werten von Baum-Jahrringen auf der Basis von Klimakammerversuchen und Rezentstudien, PhD thesis, GSF-Bericht 14/02, 152 pp., Ludwig-Maximilians-Universität, München, 2002.
Merlivat, L.: Molecular diffusivities of , HD16O, and in gases, J. Chem. Phys., 69, 2864–2871, https://doi.org/10.1063/1.436884, 1978.
Meyers, P. A.: Applications of organic geochemistry to paleolimnological reconstructions: a summary of examples from the Laurentian Great Lakes, Org. Geochem., 34, 261–289, 2003.
Meyers, P. A. and Ishiwatari, R.: Lacustrine organic geochemistry – an overview of indicators of organic matter sources and diagenesis in lake sediments, Org. Geochem., 20, 867–900, 1993.
Meyers, P. A. and Lallier-Vergés, E.: Lacustrine Sedimentary Organic Matter Records of Late Quaternary Paleoclimates, J. Paleolimnol., 21, 345–372, https://doi.org/10.1023/A:1008073732192, 1999.
Moran, A. P., Ivy-Ochs, S., Vockenhuber, C., and Kerschner, H.: First 36Cl exposure ages from a moraine in the Northern Calcareous Alps, E&G Quaternary Sci. J., 65, 145–155, https://doi.org/10.3285/eg.65.2.03, 2017.
Mügler, I., Sachse, D., Werner, M., Xu, B., Wu, G., Yao, T., and Gleixner, G.: Effect of lake evaporation on δD values of lacustrine n-alkanes: A comparison of Nam Co (Tibetan Plateau) and Holzmaar (Germany), Org. Geochem., 39, 711–729, 2008.
Murton, J. B., Bateman, M. D., Dallimore, S. R., Teller, J. T., and Yang, Z.: Identification of Younger Dryas outburst flood path from Lake Agassiz to the Arctic Ocean, Nature, 464, 740–743, https://doi.org/10.1038/nature08954, 2010.
Muscheler, R., Adolphi, F., and Knudsen, M. F.: Assessing the differences between the IntCal and Greenland ice-core time scales for the last 14,000 years via the common cosmogenic radionuclide variations, Quaternary Sci. Rev., 106, 81–87, https://doi.org/10.1016/j.quascirev.2014.08.017, 2014.
Muschitiello, F., Pausata, F. S. R., Watson, J. E., Smittenberg, R. H., Salih, A. A. M., Brooks, S. J., Whitehouse, N. J., Karlatou-Charalampopoulou, A., and Wohlfarth, B.: Fennoscandian freshwater control on Greenland hydroclimate shifts at the onset of the Younger Dryas, Nat. Commun., 6, 8939, https://doi.org/10.1038/ncomms9939, 2015.
Parker, G. G.: Structure and Mircoclimate of Canopies, in: Forest Canopies, edited by: Lowman, M. D. and Nadkarni, N. M., 73–106, Academic Press, San Diego, 1995.
Partin, J. W., Quinn, T. M., Shen, C.-C., Okumura, Y., Cardenas, M. B., Siringan, F. P., Banner, J. L., Lin, K., Hu, H.-M., and Taylor, F. W.: Gradual onset and recovery of the Younger Dryas abrupt climate event in the tropics, Nat. Commun., 6, 8061, https://doi.org/10.1038/ncomms9061, 2015.
Prietzel, J., Dechamps, N., and Spielvogel, S.: Analysis of non-cellulosic polysaccharides helps to reveal the history of thick organic surface layers on calcareous Alpine soils, Plant Soil, 365, 93–114, https://doi.org/10.1007/s11104-012-1340-2, 2013.
Rach, O., Brauer, A., Wilkes, H., and Sachse, D.: Delayed hydrological response to Greenland cooling at the onset of the Younger Dryas in western Europe, Nat. Geosci., 7, 109–112, 2014.
Rach, O., Kahmen, A., Brauer, A., and Sachse, D.: A dual-biomarker approach for quantification of changes in relative humidity from sedimentary lipid D∕H ratios, Clim. Past, 13, 741–757, https://doi.org/10.5194/cp-13-741-2017, 2017.
Rao, Z., Zhu, Z., Jia, G., Henderson, A. C. G., Xue, Q., and Wang, S.: Compound specific δD values of long chain n-alkanes derived from terrestrial higher plants are indicative of the δD of meteoric waters: Evidence from surface soils in eastern China, Org. Geochem., 40, 922–930, https://doi.org/10.1016/j.orggeochem.2009.04.011, 2009.
Rao, Z., Jia, G., Qiang, M., and Zhao, Y.: Assessment of the difference between mid- and long chain compound specific δDn-alkanes values in lacustrine sediments as a paleoclimatic indicator, Org. Geochem., 76, 104–117, https://doi.org/10.1016/j.orggeochem.2014.07.015, 2014.
Rasmussen, S. O., Andersen, K. K., Svensson, A. M., Steffensen, J. P., Vinther, B. M., Clausen, H. B., Siggaard-Andersen, M.-L., Johnsen, S. J., Larsen, L. B., Dahl-Jensen, D., Bigler, M., Röthlisberger, R., Fischer, H., Goto-Azuma, K., Hansson, M. E., and Ruth, U.: A new Greenland ice core chronology for the last glacial termination, J. Geophys. Res.-Atmos., 111, 1–16, https://doi.org/10.1029/2005JD006079, 2006.
Rasmussen, S. O., Vinther, B. M., Clausen, H. B., and Andersen, K. K.: Early Holocene climate oscillations recorded in three Greenland ice cores, Quaternary Sci. Rev., 26, 1907–1914, https://doi.org/10.1016/j.quascirev.2007.06.015, 2007.
Rasmussen, S. O., Bigler, M., Blockley, S. P., Blunier, T., Buchardt, S. L., Clausen, H. B., Cvijanovic, I., Dahl-Jensen, D., Johnsen, S. J., Fischer, H., Gkinis, V., Guillevic, M., Hoek, W. Z., Lowe, J. J., Pedro, J. B., Popp, T., Seierstad, I. K., Steffensen, J. P., Svensson, A. M., Vallelonga, P., Vinther, B. M., Walker, M. J. C., Wheatley, J. J., and Winstrup, M.: A stratigraphic framework for abrupt climatic changes during the Last Glacial period based on three synchronized Greenland ice-core records: Refining and extending the INTIMATE event stratigraphy, Quaternary Sci. Rev., 106, 14–28, https://doi.org/10.1016/j.quascirev.2014.09.007, 2014.
Reimer, P., Bard, E., Bayliss, A., Beck, J., Blackwell, P., Ramsey, C., Buck, C., Cheng, H., Edwards, R., Friedrich, M., Grootes, P., Guilderson, T., Haflidason, H., Hajdas, I., Hatté, C., Heaton, T., Hoffmann, D., Hogg, A., Hughen, K., Kaiser, K., Kromer, B., Manning, S., Niu, M., Reimer, R., Richards, D., Scott, E., Southon, J., Staff, R., Turney, C., and van der Plicht, J.: Intcal13 and Marine13 radiocarbon age calibration curves 0–50,000 years cal BP, Radiocarbon, 55, 1869–1887, https://doi.org/10.2458/azu_js_rc.55.16947, 2013.
Renssen, H., Goosse, H., and Fichefet, T.: Simulation of Holocene cooling events in a coupled climate model, Quaternary Sci. Rev., 26, 2019–2029, https://doi.org/10.1016/j.quascirev.2007.07.011, 2007.
Rind, D.: The Sun's Role in Climate Variations, Science, 296, 673–677, https://doi.org/10.1126/science.1069562, 2002.
Roden, J. S. and Ehleringer, J. R.: Observations of Hydrogen and Oxygen Isotopes in Leaf Water Confirm the Craig-Gordon Model under Wide-Ranging Environmental Conditions, Plant Physiol., 120, 1165–1173, 1999.
Rozanski, K.: Deuterium and oxygen-18 in European Groundwaters – Links to Atmospheric Circulation in the Past, Chem. Geol., 52, 349–363, 1985.
Rozanski, K., Araguás-Araguás, L., and Gonfiantini, R.: Isotopic Patterns in Modern Global Precipitation, in: Climate Change in Continental Isotopic Records, edited by: Swart, P. K., Lohmann, K. C., Mckenzie, J., and Savin, S., 1–36, Geophysical Monograph Series 78, American Geophysical Union (AGU), Washington DC, https://doi.org/10.1029/GM078p0001, 1993.
Sachse, D., Radke, J., and Gleixner, G.: Hydrogen isotope ratios of recent lacustrine sedimentary n-alkanes record modern climate variability, Geochim. Cosmochim. Ac., 68, 4877–4889, https://doi.org/10.1016/j.gca.2004.06.004, 2004.
Sachse, D., Billault, I., Bowen, G. J., Chikaraishi, Y., Dawson, T. E., Feakins, S. J., Freeman, K. H., Magill, C. R., McInerney, F. A., van der Meer, M. T. J., Polissar, P., Robins, R. J., Sachs, J. P., Schmidt, H.-L., Sessions, A. L., White, J. W. C., and West, J. B.: Molecular Paleohydrology: Interpreting the Hydrogen-Isotopic Composition of Lipid Biomarkers from Photosynthesizing Organisms, Annu. Rev., 40, 221–249, https://doi.org/10.1146/annurev-earth-042711-105535, 2012.
Sauer, P. E., Eglinton, T. I., Hayes, J. M., Schimmelmann, A., and Sessions, A. L.: Compound-specific D∕H ratios of lipid biomarkers from sediments as a proxy for environmental and climatic conditions, Geochim. Cosmochim. Ac., 65, 213–222, https://doi.org/10.1016/S0016-7037(00)00520-2, 2001.
Scharf, B. W. and Menn, U.: Hydrology and morphometry, in: Limnology of Eifel maar lakes, edited by: Scharf, B. and Björk, S., 43–62, E. Schweizerbart, Stuttgart, Germany, 1992.
Schmidt, H.-L., Werner, R. A., and Roßmann, A.: 18O Pattern and biosynthesis of natural plant products, Phytochemistry, 58, 9–32, https://doi.org/10.1016/S0031-9422(01)00017-6, 2001.
Sessions, A. L., Burgoyne, T. W., Schimmelmann, A., and Hayes, J. M.: Fractionation of hydrogen isotopes in lipid biosynthesis, Org. Geochem., 30, 1193–1200, 1999.
Sirocko, F., Dietrich, S., Veres, D., Grootes, P. M., Schaber-mohr, K., Seelos, K., Nadeau, M., Kromer, B., Rothacker, L., Röhner, M., Krbetschek, M., Appleby, P., Hambach, U., Rolf, C., Sudo, M., and Grim, S.: Multi-proxy dating of Holocene maar lakes and Pleistocene dry maar sediments in the Eifel, Germany, Quaternary Sci. Rev., 62, 56–76, https://doi.org/10.1016/j.quascirev.2012.09.011, 2013.
Sirocko, F., Knapp, H., Dreher, F., Förster, M. W., Albert, J., Brunck, H., Veres, D., Dietrich, S., Zech, M., Hambach, U., Röhner, M., Rudert, S., Schwibus, K., Adams, C., and Sigl, P.: The ELSA-Vegetation-Stack: Reconstruction of Landscape Evolution Zones (LEZ) from laminated Eifel maar sediments of the last 60,000 years, Global Planet. Change, 142, 108–135, https://doi.org/10.1016/j.gloplacha.2016.03.005, 2016.
Stenni, B., Masson-Delmotte, V., Selmo, E., Oerter, H., Meyer, H., Röthlisberger, R., Jouzel, J., Cattani, O., Falourd, S., Fischer, H., Hoffmann, G., Iacumin, P., Johnsen, S. J., Minster, B., and Udisti, R.: The deuterium excess records of EPICA Dome C and Dronning Maud Land ice cores (East Antarctica), Quaternary Sci. Rev., 29, 146–159, https://doi.org/10.1016/j.quascirev.2009.10.009, 2010.
Sternberg, L. S. L., DeNiro, M. J., and Savidge, R. A.: Oxygen Isotope Exchange between Metabolites and Water during Biochemical Reactions Leading to Cellulose Synthesis, Plant Physiol., 82, 423–427, 1986.
Stuiver, M. and Braziunas, T. F.: The Solar Component of the Atmospheric 14C Record, in: Secular Solar and Geomagnetic Variations in the Last 10,000 Years, edited by: Stephenson, F. R. and Wolfendale, A. W., 245–266, Springer, Dordrecht, 1988.
Stumpp, C., Klaus, J., and Stichler, W.: Analysis of long-term stable isotopic composition in German precipitation, J. Hydrol., 517, 351–361, https://doi.org/10.1016/j.jhydrol.2014.05.034, 2014.
Tarasov, P. E., Müller, S., Zech, M., Andreeva, D., Diekmann, B., and Leipe, C.: Last glacial vegetation reconstructions in the extreme-continental eastern Asia: Potentials of pollen and n-alkane biomarker analyses, Quaternary Int., 290–291, 253–263, https://doi.org/10.1016/j.quaint.2012.04.007, 2013.
Thornalley, D. J. R., Elderfield, H., and McCave, I. N.: Holocene oscillations in temperature and salinity of the surface subpolar North Atlantic, Nature, 457, 711–714, https://doi.org/10.1038/nature07717, 2009.
Thornalley, D. J. R., McCave, I. N., and Elderfield, H.: Freshwater input and abrupt deglacial climate change in the North Atlantic, Paleoceanography, 25, 1–16, https://doi.org/10.1029/2009PA001772, 2010.
Thornalley, D. J. R., Elderfield, H., and McCave, I. N.: Reconstructing North Atlantic deglacial surface hydrography and its link to the Atlantic overturning circulation, Global Planet. Change, 79, 163–175, https://doi.org/10.1016/j.gloplacha.2010.06.003, 2011.
Tipple, B. J., Berke, M. A., Doman, C. E., Khachaturyan, S., and Ehleringer, J. R.: Leaf-wax n-alkanes record the plant-water environment at leaf flush, P. Natl. Acad. Sci. USA, 110, 2659–2664, https://doi.org/10.1073/pnas.1213875110, 2013.
Tipple, B. J., Berke, M. A., Hambach, B., Roden, J. S., and Ehleringer, J. R.: Predicting leaf wax n-alkane 2H∕1H ratios: Controlled water source and humidity experiments with hydroponically grown trees confirm predictions of Craig-Gordon model, Plant Cell Environ., 38, 1035–1047, https://doi.org/10.1111/pce.12457, 2015.
Tuthorn, M., Zech, M., Ruppenthal, M., Oelmann, Y., Kahmen, A., del Valle, H. F., Wilcke, W., and Glaser, B.: Oxygen isotope ratios (18O∕16O) of hemicellulose-derived sugar biomarkers in plants, soils and sediments as paleoclimate proxy II: Insight from a climate transect study, Geochim. Cosmochim. Ac., 126, 624–634, https://doi.org/10.1016/j.gca.2013.11.002, 2014.
Tuthorn, M., Zech, R., Ruppenthal, M., Oelmann, Y., Kahmen, A., del Valle, H. F., Eglinton, T., Rozanski, K., and Zech, M.: Coupling δ2H and δ18O biomarker results yields information on relative humidity and isotopic composition of precipitation – a climate transect validation study, Biogeosciences, 12, 3913–3924, https://doi.org/10.5194/bg-12-3913-2015, 2015.
van der Plicht, J., van Geel, B., Bohncke, S. J. P., Bos, J. A. A., Blaauw, M., Speranza, A. O. M., Muscheler, R., and Björck, S.: The Preboreal climate reversal and a subsequent solar-forced climate shift, J. Quaternary Sci., 19, 263–269, https://doi.org/10.1002/jqs.835, 2004.
Voelker, S. L., Brooks, J. R., Meinzer, F. C., Roden, J., Pazdur, A., Pawelczyk, S., Hartsough, P., Snyder, K., Plavcova, L., and Santrucek, J.: Reconstructing relative humidity from plant δ18O and δD as deuterium deviations from the global meteoric water line, Ecol. Appl., 24, 960–975, https://doi.org/10.1890/13-0988.1, 2014.
Voelker, S. L., Stambaugh, M. C., Guyette, R. P., Feng, X., Grimley, D. A., Leavitt, S. W., Panyushkina, I., Grimm, E. C., Marsicek, J. P., Shuman, B., and Brandon Curry, B.: Deglacial hydroclimate of midcontinental North America, Quaternary Res., 83, 336–344, https://doi.org/10.1016/j.yqres.2015.01.001, 2015.
Volkman, J. K., Barrett, S. M., Blackburn, S. I., Mansour, M. P., Sikes, E. L., and Gelin, F.: Microalgal biomarkers: A review of recent research developments, Org. Geochem., 29, 1163–1179, https://doi.org/10.1016/S0146-6380(98)00062-X, 1998.
Vonmoos, M., Beer, J., and Muscheler, R.: Large variations in Holocene solar activity: Constraints from 10Be in the Greenland Ice Core Project ice core, J. Geophys. Res.-Space, 111, 1–14, https://doi.org/10.1029/2005JA011500, 2006.
Wagner, F., Bohncke, S. J. P., Dilcher, D. L., Kürschner, W. M., van Geel, B., and Visscher, H.: Century-Scale Shifts in Early Holocene Atmospheric CO2 Concentration, Science, 284, 1971–1974, 1999.
Walker, C. D. and Brunel, J.-P.: Examining Evapotranspiration in a Semi-Arid Region using Stable Isotopes of Hydrogen and Oxygen, J. Hydrol., 118, 55–75, 1990.
Waterhouse, J. S., Cheng, S., Juchelka, D., Loader, N. J., McCarroll, D., Switsur, V. R., and Gautam, L.: Position-specific measurement of oxygen isotope ratios in cellulose: Isotopic exchange during heterotrophic cellulose synthesis, Geochim. Cosmochim. Ac., 112, 178–191, https://doi.org/10.1016/j.gca.2013.02.021, 2013.
Weninger, B. and Jöris, O.: A 14C age calibration curve for the last 60 ka: the Greenland-Hulu U/Th timescale and its impact on understanding the Middle to Upper Paleolithic transition in Western Eurasia, J. Hum. Evol., 55, 772–781, https://doi.org/10.1016/j.jhevol.2008.08.017, 2008.
Wolfe, B. B., Edwards, T. W. D., and Aravena, R.: Changes in carbon and nitrogen cycling during tree-line retreat recorded in the isotopic content of lacustrine organic matter, western Taimyr Peninsula, Russia, Holocene, 9, 215–222, https://doi.org/10.1191/095968399669823431, 1999.
Yakir, D. and DeNiro, M. J.: Oxygen and Hydrogen Isotope Fractionation during Cellulose Metabolism in Lemna gibba L., Plant Ecol., 93, 325–332, 1990.
Zech, M. and Glaser, B.: Compound-specific δ18O analyses of neutral sugars in soils using gas chromatography-pyrolysis-isotope ratio mass spectrometry: problems, possible solutions and a first application, Rapid Commun. Mass Sp., 23, 3522–3532, https://doi.org/10.1002/rcm.4278, 2009.
Zech, M., Zech, R., and Glaser, B.: A 240,000-year stable carbon and nitrogen isotope record from a loess-like palaeosol sequence in the Tumara Valley, Northeast Siberia, Chem. Geol., 242, 307–318, https://doi.org/10.1016/j.chemgeo.2007.04.002, 2007.
Zech, M., Zech, R., Buggle, B., and Zöller, L.: Novel methodological approaches in loess research – interrogating biomarkers and compound-specific stable isotopes, E&G Quaternary Sci. J., 60, 13, https://doi.org/10.3285/eg.60.1.12, 2011.
Zech, M., Werner, R. A., Juchelka, D., Kalbitz, K., Buggle, B., and Glaser, B.: Absence of oxygen isotope fractionation/exchange of (hemi-) cellulose derived sugars during litter decomposition, Org. Geochem., 42, 1470–1475, https://doi.org/10.1016/j.orggeochem.2011.06.006, 2012.
Zech, M., Tuthorn, M., Detsch, F., Rozanski, K., Zech, R., Zöller, L., Zech, W., and Glaser, B.: A 220 ka terrestrial δ18O and deuterium excess biomarker record from an eolian permafrost paleosol sequence, NE-Siberia, Chem. Geol., 360–361, 220–230, https://doi.org/10.1016/j.chemgeo.2013.10.023, 2013a.
Zech, M., Tuthorn, M., Glaser, B., Amelung, W., Huwe, B., Zech, W., Zöller, L., and Löffler, J.: Natural abundance of δ18O of sugar biomarkers in topsoils along a climate transect over the Central Scandinavian Mountains, Norway, J. Plant Nutr. Soil Sc., 176, 12–15, https://doi.org/10.1002/jpln.201200365, 2013b.
Zech, M., Tuthorn, M., Schlütz, F., Zech, W., and Glaser, B.: A 16-ka δ18O record of lacustrine sugar biomarkers from the High Himalaya reflects Indian Summer Monsoon variability, J. Paleolimnol., 51, 241–251, https://doi.org/10.1007/s10933-013-9744-4, 2014a.
Zech, M., Mayr, C., Tuthorn, M., Leiber-Sauheitl, K., and Glaser, B.: Oxygen isotope ratios (18O∕16O) of hemicellulose-derived sugar biomarkers in plants, soils and sediments as paleoclimate proxy I: Insight from a climate chamber experiment, Geochim. Cosmochim. Ac., 126, 614–623, https://doi.org/10.1016/j.gca.2013.10.048, 2014b.
Zech, M., Zech, R., Rozanski, K., Gleixner, G., and Zech, W.: Do n-alkane biomarkers in soils/sediments reflect the δ2H isotopic composition of precipitation? A case study from Mt. Kilimanjaro and implications for paleoaltimetry and paleoclimate research, Isot. Environ. Healt. S., 51, 508–524, https://doi.org/10.1080/10256016.2015.1058790, 2015.
Zolitschka, B.: A 14,000 year sediment yield record from western Germany based on annually laminated lake sediments, Geomorphology, 22, 1–17, https://doi.org/10.1016/S0169-555X(97)00051-2, 1998.