the Creative Commons Attribution 4.0 License.
the Creative Commons Attribution 4.0 License.
 | 16 Sep 2019
Late Miocene to Holocene high-resolution eastern equatorial Pacific carbonate records: stratigraphy linked by dissolution and paleoproductivity
Anna Joy Drury
Jun Tian
Roy Wilkens
Thomas Westerhold
Coherent variation in CaCO3 burial is a feature of the Cenozoic eastern equatorial Pacific. Nevertheless, there has been a long-standing ambiguity in whether changes in CaCO3 dissolution or changes in equatorial primary production might cause the variability. Since productivity and dissolution leave distinctive regional signals, a regional synthesis of data using updated age models and high-resolution stratigraphic correlation is an important constraint to distinguish between dissolution and production as factors that cause low CaCO3. Furthermore, the new chronostratigraphy is an important foundation for future paleoceanographic studies. The ability to distinguish between primary production and dissolution is also important to establish a regional carbonate compensation depth (CCD). We report late Miocene to Holocene time series of XRF-derived (X-ray fluorescence) bulk sediment composition and mass accumulation rates (MARs) from eastern equatorial Pacific Integrated Ocean Drilling Program (IODP) sites U1335, U1337, and U1338 and Ocean Drilling Program (ODP) site 849, and we also report bulk-density-derived CaCO3 MARs at ODP sites 848, 850, and 851. We use physical properties, XRF bulk chemical scans, and images along with available chronostratigraphy to intercorrelate records in depth space. We then apply a new equatorial Pacific age model to create correlated age records for the last 8 Myr with resolutions of 1–2 kyr. Large magnitude changes in CaCO3 and bio-SiO2 (biogenic opal) MARs occurred within that time period but clay deposition has remained relatively constant, indicating that changes in Fe deposition from dust is only a secondary feedback to equatorial productivity. Because clay deposition is relatively constant, ratios of CaCO3 % or biogenic SiO2 % to clay emulate changes in biogenic MAR. We define five major Pliocene–Pleistocene low CaCO3 % (PPLC) intervals since 5.3 Ma. Two were caused primarily by high bio-SiO2 burial that diluted CaCO3 (PPLC-2, 1685–2135 ka, and PPLC-5, 4465–4737 ka), while three were caused by enhanced dissolution of CaCO3 (PPLC-1, 51–402 ka, PPLC-3, 2248–2684 ka, and PPLC-4, 2915–4093 ka). Regional patterns of CaCO3 % minima can distinguish between low CaCO3 caused by high diatom bio-SiO2 dilution versus lows caused by high CaCO3 dissolution. CaCO3 dissolution can be confirmed through scanning XRF measurements of Ba. High diatom production causes lowest CaCO3 % within the equatorial high productivity zone, while higher dissolution causes lowest CaCO3 percent at higher latitudes where CaCO3 production is lower. The two diatom production intervals, PPLC-2 and PPLC-5, have different geographic footprints from each other because of regional changes in eastern Pacific nutrient storage after the closure of the Central American Seaway. Because of the regional variability in carbonate production and sedimentation, the carbonate compensation depth (CCD) approach is only useful to examine large changes in CaCO3 dissolution.
- Article
(11335 KB) - Full-text XML
-
Supplement
(21224 KB) - BibTeX
- EndNote


Integrated Ocean Drilling Program (IODP) Expedition 320/321 drilled eight sites in the tropical Pacific in 2009. One of the primary objectives of IODP Expedition 320/321 (PEAT, Pacific Equatorial Age Transect; Lyle et al., 2010) was to join the equatorial portions of essentially continuous sediment records from the eight PEAT drill sites and to intercorrelate the PEAT records with Ocean Drilling Program (ODP) Leg 138 drilling for the late Neogene (Mayer et al., 1992) to study the evolution of the eastern equatorial Pacific for the last 50 million years. In addition, new chronostratigraphy from the PEAT drilling (e.g., Channell et al., 2013; Holbourn et al., 2014; Kochann et al., 2016; Drury et al., 2017, 2018) would be used to refine and update equatorial Pacific age models. Another important objective from the PEAT expeditions was to identify major changes and causes of carbonate storage in the eastern equatorial Pacific. Pälike et al. (2012) did a synthesis of CaCO3 data on a Cenozoic scale to identify changes in the carbonate compensation depth (CCD) in the equatorial Pacific using data from the PEAT expeditions and earlier drilling but new studies are needed to add detail to the record.
1.1 Objectives: CaCO3 deposition through site-to-site correlation of the late Miocene–Holocene sections from Exp. 321 and ODP Leg 138
We develop a regional site-to-site correlation between seven drill sites in the eastern Pacific and apply a new late Miocene–Holocene age model in order to study CaCO3 production and dissolution in the eastern Pacific. The regional CCD has been relatively deep since the middle Miocene and drill sites have not intersected the local CCD. In order to understand causes of eastern Pacific CaCO3 variability, we re-examine the Pliocene and Pleistocene interval to distinguish intervals of CaCO3 dissolution and productivity in a time interval and region where the CCD is typically deeper than the eastern Pacific sea floor. We explore alternate methods of developing the CCD by extrapolating CaCO3 MARs from drill sites above the CCD to the depth of zero burial (Lyle et al., 2005b) and use XRF-derived (X-ray fluorescence) CaCO3∕BaSO4 ratios as a measure of local CaCO3 dissolution (Lyle and Baldauf, 2015). We examine regional variation in the seven eastern Pacific sites where we have made high-resolution depth correlations and assigned ages with a new eastern Pacific age model as well as new stable isotope records (Drury et al., 2016, 2017, 2018; Tian et al., 2018).
A key aim is to disentangle CaCO3 variability caused by dissolution versus high bio-SiO2 paleoproductivity using bulk sediment chemistry and regional patterns of variation. Production intervals have a different CaCO3 expression at different drill sites because of regional differences in relative nannofossil production of CaCO3 versus diatom production of bio-SiO2. We will primarily discuss data for the interval from 5.3 to 0 Ma although the seven eastern Pacific sites are depth correlated to ≥10 Ma and the age model has been applied to ∼8 Ma for all sites (see the Supplement). We will briefly discuss the interval between 8 and 4.5 Ma (the late Miocene biogenic bloom, LMBB) because it has significantly more variability among the drill sites and needs further work. This depositional variability has been imposed in the eastern Pacific by the regional footprint of paleoproductivity within the LMBB interval.
1.2 Background: Cenozoic CaCO3 deposition
Cenozoic sediments of the eastern tropical Pacific Ocean have recorded changes in productivity and to the Pacific deep carbon reservoir (Berger, 1973; van Andel et al., 1975; Pälike et al., 2012). Distinctive CaCO3 profiles can be correlated across thousands of kilometers within the eastern equatorial Pacific because of coherent CaCO3 variability within the region (Mayer et al., 1986). The large geographic response to ENSO (El Niño–Southern Oscillation; Mantua et al., 1997; Di Lorenzo et al., 2015) demonstrates that the whole surface eastern tropical Pacific changes coherently on the interannual timescale. Large-scale flow of abyssal waters southward along the western flank of the East Pacific Rise (Johnson and Toole, 1993; Hautala, 2018) causes the western flank to be bathed by a common bottom water and to share a common signal of abyssal change. Both surface and abyssal processes interact to drive these common CaCO3 profiles across the equatorial region. Since CaCO3 variability causes large changes in sediment bulk density in the eastern tropical Pacific (Mayer, 1979, 1991; Reghellin et al., 2013), the extensive geographic scale of coherent CaCO3 profiles produces a distinctive set of seismic reflection horizons (Bloomer and Mayer, 1997; Tominaga et al., 2011) linked with major paleoceanographic change in the Pacific Ocean (Mayer et al., 1986).
Reconnaissance paleoceanographic descriptions of the Cenozoic equatorial Pacific (van Andel et al., 1975; Berger, 1973) often gloss over the late Miocene and early Pliocene as being periods almost like the present. The CCD variability within the last 12 million years is not nearly as dramatic as the huge changes earlier in the Cenozoic (Pälike et al., 2012). Nevertheless, as more detail has been generated from better chronology and more comprehensive regional records, significant changes in carbonate deposition can be found throughout the equatorial Pacific since the beginning of the late Miocene. Variability in the late Miocene and afterward represent profound changes in how CaCO3 has been produced and recycled within the Pacific.
The change in the calcite compensation depth (CCD) in the world's oceans is a primary indicator of rearrangement of the global carbon cycle. Well-known major changes in CCD are associated with the major climate changes in the Cenozoic (Berger, 1973; van Andel and Moore, 1974; Peterson et al., 1992; Pälike et al., 2012). Once sediments are buried, pore water concentrations quickly reach saturation with respect to CaCO3. Buried CaCO3 is unaffected by subsequent changes in ocean chemistry so the variation reflects the state of the ocean at the time of burial. Fluctuations in the CCD represent changes in the balance between CaCO3 production in surface waters and CaCO3 dissolution of carbonate hard parts at the benthic boundary layer (Milliman and Droxler, 1996; Boudreau et al., 2010). Surface production of CaCO3 has a large effect upon the CCD as shown by the CCD being 1 km deeper underneath the equatorial Pacific zone of high productivity versus on its flanks (Berger, 1973; van Andel and Moore, 1974).
The CCD shallows when (a) lower carbonate production results in lower CaCO3 rain to the seafloor, (b) the [CO3]2− content of bottom water decreases and becomes undersaturated with respect to calcite, or (c) rising sea levels allow significantly more CaCO3 storage on continental shelves and shallow basins (Opdyke and Wilkinson, 1988). Because the CCD strongly responds to changes in production and regional rates of CaCO3 burial, the global CCD has a complex response to changes in Cenozoic climate. The CCD differs between ocean basins because ocean circulation can alter where CaCO3-undersaturated water impinges on sediments regionally (Berger, 1970). The Holocene deep Atlantic Ocean is flushed with deep water with high [CO3]2− content originating from the surface North Atlantic. Higher CaCO3 saturation results in a much deeper CCD than that in the Pacific. The Atlantic CCD shallows in glacial intervals because of the loss of North Atlantic Deep Water (NADW) and intrusion of more undersaturated water from the Antarctic, while the Pacific CCD deepens as the intrusion of low-[CO3]2− water into the Atlantic basin dissolves CaCO3 there rather than in the Pacific (Crowley, 1985). The causes for CCD change can be disentangled but require sedimentary records from the different ocean basins as well as additional bulk chemical information beyond CaCO3 %.
The CCD has varied both on glacial–interglacial scales and over millions of years. Since large areas of the abyssal ocean basins are subject to CaCO3 dissolution, climate variability imposes a common regional CaCO3 stratigraphy modulated by the change in factors that perturb rates of CaCO3 burial. Such a common chronostratigraphic signal in the eastern equatorial Pacific has been noted through the Cenozoic (Hays et al., 1969; Mayer et al., 1986; Chuey et al., 1987; Farrell and Prell, 1989, 1991; Hagelburg et al., 1995). The development of the typical eastern Pacific CaCO3 burial profile is complicated by large-scale long-term variation in biogenic production (Farrell et al., 1995; Lyle and Baldauf, 2015). Such variability can change the dissolution-related CaCO3 signal by changing not only the mass of CaCO3 that rains to the sea floor but also the relative proportion of CaCO3 to biogenic opal (bio-SiO2) in the rain of biogenic hard parts. Nevertheless, knowledge of the processes that modify CaCO3 deposition allows for common intervals to be identified.
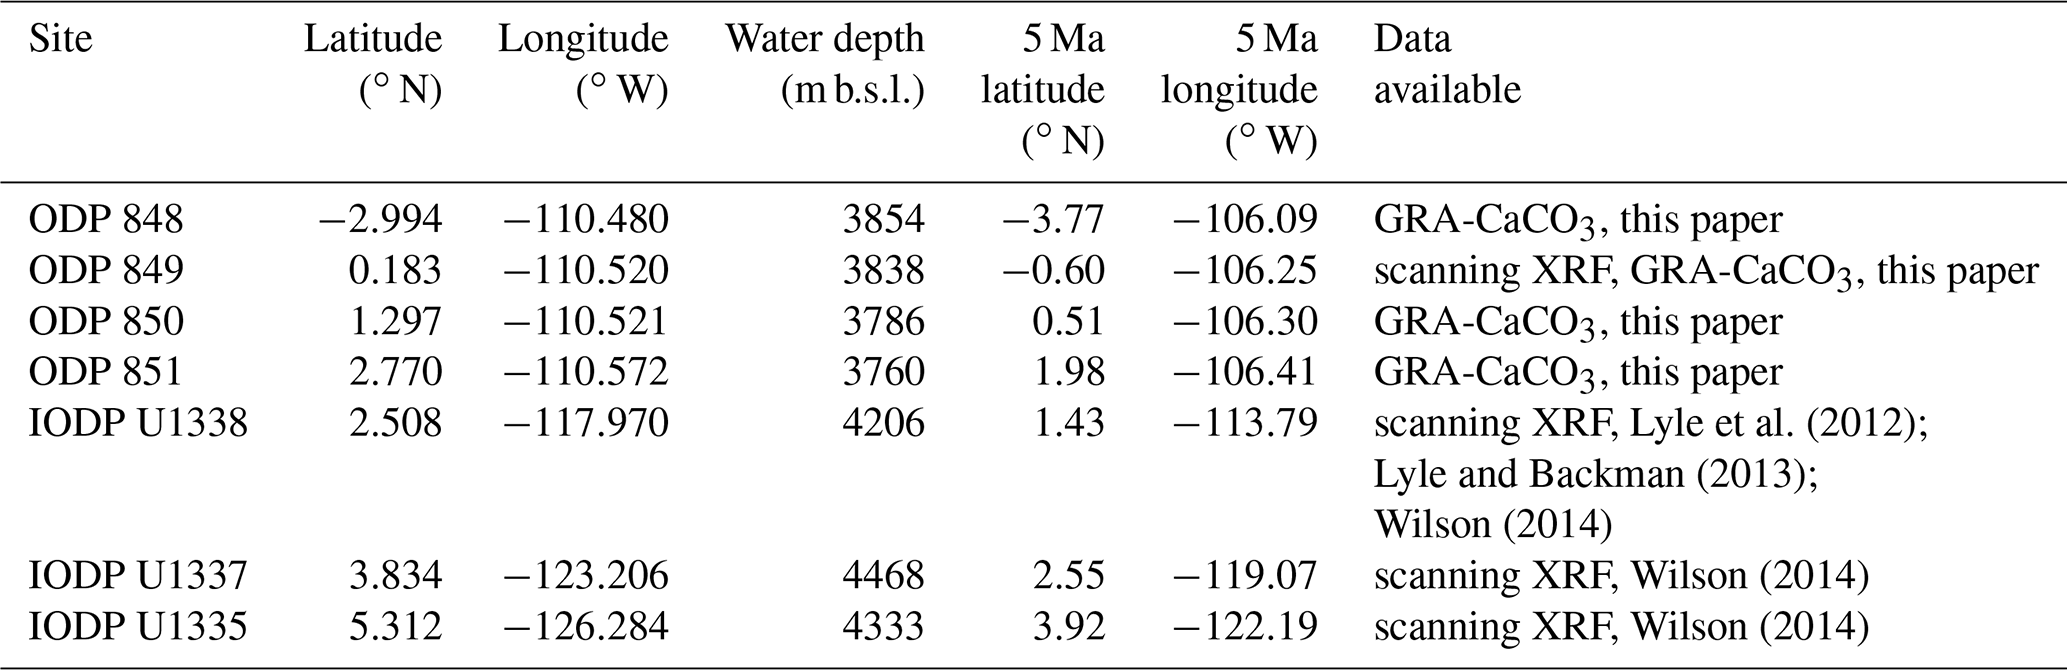
We report data from seven eastern equatorial Pacific drill sites, four with XRF scans along the sediment splice (IODP sites U1335, U1337, and U1338 and ODP site 849) and four with CaCO3 data estimated from spliced gamma ray attenuation (GRA) wet bulk density profiles (ODP sites 848, 849, 850, and 851; see Methods section for the process). Locations for the drill sites are shown in Fig. 1 and in Table 1.
The seven sites span the equatorial Pacific productivity zone and their positions range from 3∘ S to 5.3∘ N (Table 1). At 5 Ma, the site positions ranged from ∼4∘ S to ∼4∘ N based upon a fixed hotspot backtrack. All of the sites are west of the East Pacific Rise and contain sediments that are primarily biogenic in origin. Sites that are further from the Equator and/or deeper have more clay in the sediments (sites U1335, U1337, and 851) than those shallower and nearer the Equator, primarily because of lower carbonate production and preservation. Higher rainout of dust near the Intertropical Convergence Zone (ITCZ), located north of the Equator, results in higher dust fluxes and higher clay percentages in the north as well (Hovan, 1995).
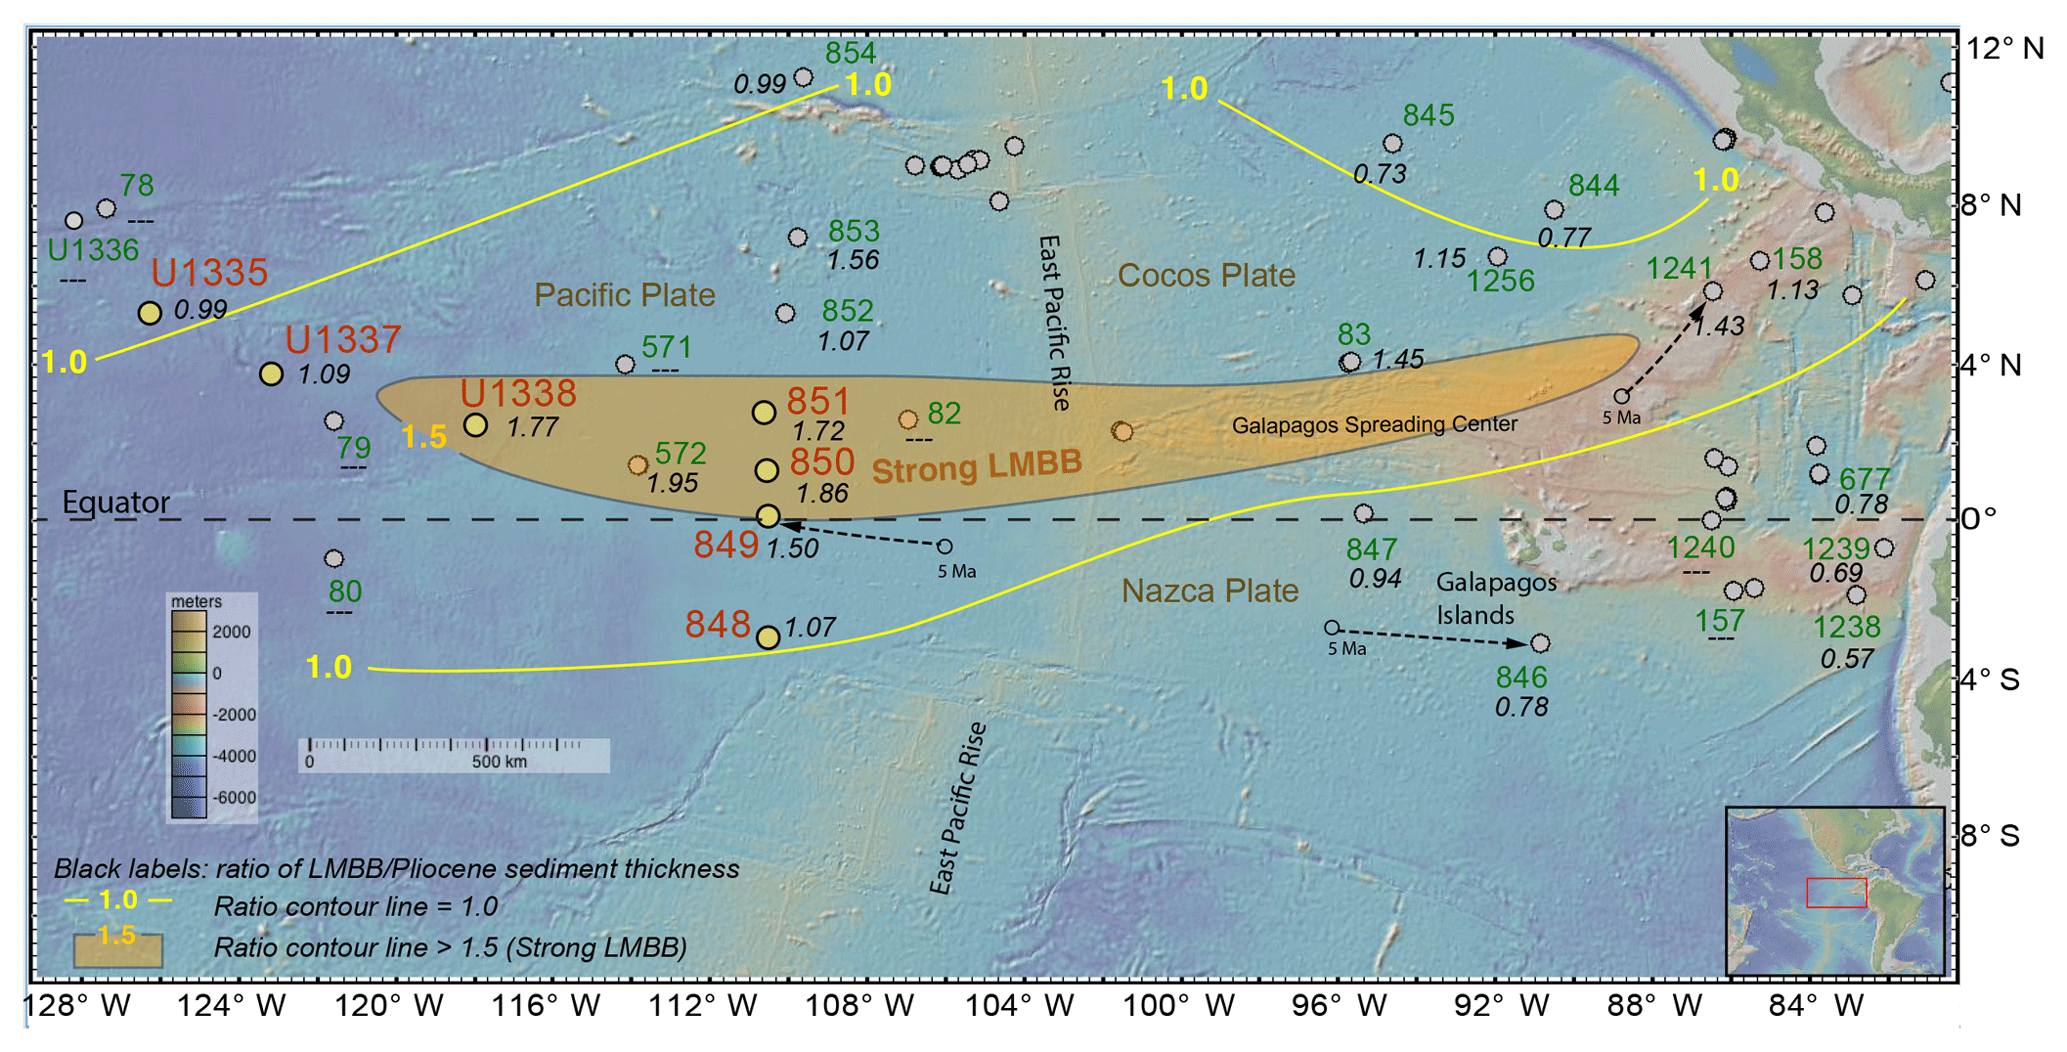
Figure 1Overview of east Pacific drill sites. Figure made with GeoMapApp (http://www.geomapapp.org, last access: 1 October 2018) (Ryan et al., 2009). Gray dots indicate positions of DSDP or ODP drill sites. Red site labels: ODP and IODP drill sites from the eastern equatorial Pacific used in this paper with other DSDP, ODP, or IODP sites labeled in green. All sites are at their modern locations. Example backtracked positions at 5 Ma are shown for site 849 on the Pacific Plate (representative for sites U1335, U1337, U1338, and sites 848–854), site 846 on the Nazca Plate (representative for sites 847, 1238, and 1239), and site 1241 on the Cocos Plate (representative for sites 844, 845, and 1256), assuming a hotspot reference frame. Thickness of the 8–4.5 Ma sediment divided by the 4.5–0 Ma sediment thickness (LMBB ∕ Pliocene ratio) are indicated by the italic black labels at each drill site. Sites on crust younger than 8 Ma, or where the section was incompletely drilled, or with a hiatus in the interval are marked with “—”. Yellow lines mark where the LMBB ∕ Pliocene ratio is 1, while the shaded orange region is where the ratio is > 1.5, marking the major LMBB locus of deposition. Thickest LMBB sequences are found on sites with crust older than 8 Ma on the Pacific and Cocos plates just north of the Equator. Sites south of the Equator in the easternmost Pacific have thicker sediments in the 4.5–0 Ma time range, indicating high and young sedimentation rates.
The ODP Leg 138 drill sites (sites 848–851) are positioned between 3∘ S to 2.8∘ N along 110∘ W (Mayer et al., 1992). They are correlated with Neogene sites from IODP Expedition 320/321 further west. All sites reside on the Pacific tectonic plate and have been translated to the NW over time by Pacific plate movement (Pälike et al., 2010). The Leg 138 sites have been cored to basement, which was formed about 11 Ma along 110∘ W. The Exp. 320/321 sites were cored to progressively older basement by following a common tectonic flow line from the East Pacific Rise. Each Expedition 320/321 drill site preserves a sediment record of progressively older Pacific equatorial regions. Because they are on older ocean crust than the late Miocene basement recovered at ODP Leg 138 drill sites, the Exp. 320/321 drill sites have sediments that extend back to the middle to lower Miocene boundary at site U1338, to the Oligocene to Miocene boundary at site U1337, and to the late Oligocene at site U1335 (Pälike et al., 2010).
Primarily because of depth-dependent carbonate dissolution, site U1338 has a sedimentation rate that is only 75 % of that at site 851, which lies at the same latitude but 450 m shallower. The depth difference is because site 851 is situated on ocean crust that is half the age of site U1338. From 5.3 Ma to the Holocene, each site deepened by about 200 m because of crustal cooling partly mitigated by sediment deposition that shallowed the sea floor. Isostatic subsidence due to sediment loading increased the depth somewhat but subsidence is only ∼20 % of the added sediment thickness (Lyle, 1997). While significant changes in depth have happened to the seven drill sites because of crustal cooling and sedimentation, the sites always remained separated by a similar water depth.
Please see the Supplement for more information about the assembly and calibration of data, including the age model, stratigraphic tie points, revised splices, estimated CaCO3 % profiles, and XRF bulk chemical data.
3.1 Stratigraphic correlation of eastern Pacific drill sites
We used the Code for Ocean Drilling Data (CODD; https://www.codd-home.net/, last access: 28 August 2019) analytical suite of software tools described by Wilkens et al. (2017) for the stratigraphic correlation of all the drill sites. We first investigated all the offsets and splice tie points at each multihole drill site to check that the ties were correct. We then built a continuous sediment section for each drill site by linking the sections within the splice. The spliced sediment columns were used to make site-to-site depth correlations. Descriptions of the splicing are given in the Supplement and splices used are in the Supplement Tables S1 to S7. Only site 849 had significant changes from the shipboard splice, in the lower section older than 4 Ma.
Initial site-to-site correlations were made with the shipboard physical properties data from ODP or IODP collected by scans of the unopened cores prior to splitting, primarily magnetic susceptibility and GRA bulk density. If XRF and stable isotope data were available, the site-to-site correlations were refined with the additional information. During site-to-site correlation, the spliced sediment section at each drill site was stretched and squeezed to match the splice of a master drill site so that the sediment section could be expressed in the equivalent depth of the master site. Site U1338 was chosen as the master drill site as it has the best balance between high sedimentation rates and sediment recovery across the last 8 Myr. It is also suitably situated in the center of the studied sites. The CODD analytical suite allows age datum levels like magnetochrons and biostratigraphic boundaries to be displayed in the correlation space and these were used to constrain the depth matching. Depth ties between drill sites can be found in Tables S8 to S13
Correlations were achieved as equivalent depth at site U1338. Sites U1335, U1337, 851, and 849 were tied directly to site U1338, while sites 848 and 850 were first tied to site 849 and then correlated to site U1338 through the site-849-assigned U1338 equivalent depth. We found that there was less ambiguity to work in this fashion because of regional differences in the CaCO3 profiles. Latitudinal differences in CaCO3 production make nearby records easier to correlate. For this reason, site 851 was directly correlated to site U1338 because it was at the same latitude and its record was more similar to site U1338 than site 849. Site 850 has very similar profiles to site 849 because it is only 1∘ further north and has similar diatom deposition intervals. Site 848 was the only site south of the Equator but was nearest to site 849. We checked the records by displaying them all in site-U1338-equivalent depth and searching for ambiguous correlations.
3.2 The combined site 849 and site U1338 age model
The Pacific Ocean lacks an orbitally resolving age model that covers the last 8 million years. We have constructed one by joining astrochronologically tuned stable isotope data from 0 to 3.6 Ma from site 849 (Mix et al., 1995) to the tuned stable isotope data from 3.5 to 8.2 Ma from site U1338 (Drury et al., 2016, 2018). Sites 849 and U1338 are the most central sediment records to the region we correlate, and provide good stratigraphic ties between the IODP Expedition 320/321 sites and those cored by ODP Leg 138. See the Supplement Sect. S3 for more details. The records are joined at 3.6 Ma because the revised site 849 splice had gaps in the older part of the record (see the Supplement).
The isotope splice for site 849 was assigned ages by correlation to the new Ceara Rise composite isotope stack in Wilkens et al. (2017) to provide age control between 0 and 5.3 Ma. For site U1338, we used the astrochronology between 3.5 and 8.0 Ma developed by Drury et al. (2018), which revised the benthic stable isotope age model in Drury et al. (2016). In this study, the better astromagnetochronology developed at site U1337 could be used to constrain ages at site U1338 through the late Miocene (8.0–6.0 Ma) based on depth matching between U1337 and U1338, while the remaining 6.0–3.5 Ma interval was astronomically tuned using the benthic δ18O data (Drury et al., 2017, 2018).
The 849 and U1338 age models were grafted together at 3.626 Ma to make the combined site 849–U1338 age model, with site 849 providing the younger section and site U1338 providing the older one. The two isotope records match well at 3.6 Ma (Fig. S3). Using the U1338 isotope stratigraphy in the early Pliocene also eliminates missing sections in the site 849 record found at about 3.7 and 4.2 Ma. The age model was propagated to all sites through use of the site-to-site correlations derived from the depth-matched physical properties and bulk composition profiles. See the Supplement for more details and for the age model tables (Tables S14 to S17).
3.3 XRF scanning at sites 849, U1335, U1337, and U1338
Only the XRF scanning data from site 849 are new in this paper. XRF scanning for sites U1335, U1337, and U1338 have been reported previously. The major elements (Al, Si, K, Ca, Fe) and significant minor elements (Ti, Mn, Ba) were measured using the Avaatech scanning XRF at the IODP Gulf Coast Repository. The elemental data were processed using the normalized median-scaled (NMS) method of Lyle et al. (2012). Raw and processed (but uncalibrated) data for sites U1335 and U1337 are found in Shackford et al. (2014). Similarly, raw and processed XRF scan data for site U1338 are found in Lyle et al. (2012).
Much of the XRF data have been calibrated against discrete chemical analyses. Calibrated CaCO3 % estimates from the U1338 XRF scan data are found in Lyle and Backman (2013) and use shipboard plus additional discrete CaCO3 measurements. Other elements from XRF scan data (sites U1337 and U1338) were calibrated with inductively coupled plasma mass spectrometer (ICP-MS) analyses of bulk sediment for the elements Al, Fe, Mn, Ti, and Ba (Wilson, 2014). CaCO3 contents were calibrated to shipboard CaCO3 analyses supplemented by additional CaCO3 data found in Wilson (2014). Discrete bio-SiO2 analyses, where bio-SiO2 was extracted using the KOH dissolution technique (Olivarez Lyle and Lyle, 2002), are reported in Wilson (2014) and used to calibrate XRF bio-SiO2 (sites U1337 and U1338). The bio-SiO2 percentages are reported without structural water – since there is ambiguity about the dependence of bio-SiO2 structural water on the organisms that make the tests.
Clay was estimated by assuming that clay has constant TiO2 and using the calibrated XRF TiO2 estimate. Clay is assumed to have the same composition as Taylor and McLennan (1995) upper continental crust, which has 0.3 % Ti. Clay-bound Si was estimated using the Taylor and McLennan (1995) Si∕Ti ratio for upper continental crust. Bio-SiO2 was calibrated to the total Si minus the clay component (Lyle and Baldauf, 2015). See Sect. S4.1 for more details. The calibrated XRF scan data for site U1337 and for site U1338 are listed in Tables S19 and S20. Site U1335 XRF scanning CaCO3 data are calibrated to shipboard CaCO3 % and are found in Wilson (2014). Processed but uncalibrated site U1335 XRF scanning data for other major and trace elements are found in Table S18 along with the calibrated CaCO3 % estimate.
XRF scanning data for site 849 are found in Table S21 and are discussed in Sect. S4.2. Shipboard CaCO3 % measurements from Mayer et al. (1992) were used to calibrate the site 849 XRF scan CaCO3 %, while discrete bio-SiO2 analyses were used to calibrate the bio-SiO2. The bio-SiO2 calibration data for site 849 are found in Table S22. To estimate clay content we correlated the XRF Fe2O3 NMS to a 232Th estimate of clay from the upper part of the sediment column (Winckler et al., 2008). We used the XRF Fe2O3 because Ti contents were often below the XRF detection limit deeper than 130 m CCSF (core composite depth below sea floor) and because the oxide-bound Fe is minimal. We used barite data from Ma et al. (2015) to calibrate the site 849 XRF Ba data.
The XRF scan data extend beyond 0–8.2 Ma for sites U1335, U1337, and U1338, to basalt crust at sites U1337 and U1338, but only to a depth of 301.2 m CCSF at site U1335. The records for sites U1335 and U1337 cover the entire Neogene, while the base of site U1338 is just below the early to middle Miocene boundary. Because of time constraints, site 849 was scanned only to 7.2 Ma (286.72 m CCSF).
3.4 CaCO3 % estimates from GRA wet bulk density from sites 848, 849, 850, and 851
It has long been known that variations in bulk density in the eastern equatorial Pacific are correlated to changes in CaCO3 content (Mayer, 1979, 1991; Hagelberg et al., 1995; Reghellin et al., 2013). CaCO3 can be calculated from wet bulk density in the equatorial Pacific because the sediments are essentially a mixture of bio-SiO2 and biogenic CaCO3 with less than 10 % clays. CaCO3-rich sediments have higher bulk density than porous bio-SiO2-rich sediments (Mayer, 1991). After correcting for burial compaction that reduces porosity with depth and causes an increasing trend in bulk density, the variation in the “decompacted” bulk density can be converted to estimated CaCO3 by correlating shipboard CaCO3 data to the decompacted GRA bulk density. Here we provide CaCO3 estimates from GRA bulk density for sites 848, 850, and 851 along the revised splices we made. We also estimated CaCO3 at site 849 from bulk density in addition to the XRF estimate in order to compare the XRF and bulk density estimates of CaCO3. When compared with shipboard measurements, the GRA-derived CaCO3 % estimate (SD of difference from measured ±5.86 %; see Fig. S4) was somewhat damped with respect to the discrete measurements of CaCO3 % at site 849. The XRF-derived CaCO3 estimate (SD of difference from measured: ±3.86 %) has a range that better matches that of the shipboard discrete measurements. Nevertheless, both estimates capture the same trends in the CaCO3 profile. See Sect. S5 for more details. Estimated CaCO3 % data are in Tables S24 to S27.
3.5 Mass accumulation rate (MAR) calculation
The bulk sediment percentage data at each site were converted to MAR using the site 849–U1338 age model, measured physical properties, and the bulk chemical data. The composition and physical properties data were interpolated to even 1–2 kyr spacing then smoothed with a 20-point binomial filter before being resampled at 10 kyr intervals to accommodate probable errors in the age model and site-to-site correlations. MAR calculations are much more sensitive to age errors than age profiles of sediment components because they depend on the differential of depth versus time (sedimentation rate) as well as the time–depth correlation at each site. Bulk MAR was calculated by multiplying the dry bulk density by the sedimentation rate from the age–depth relationship. Individual component MARs were calculated by multiplying by the fraction of that component in the dry sample by the bulk MAR.
Bio-SiO2, BaSO4, and clay MAR records were created at the sites where both XRF data and independent discrete measurements for bio-SiO2 and a clay-bound element existed. Sites U1337, U1338, and 849 had data suitable to calibrate the records, as discussed more in the Supplement. Discrete chemical analyses have never been done for site U1335 so only the CaCO3 record is calibrated at this time using shipboard CaCO3 % data from IODP Expedition 320/321. Ratios of uncalibrated Si to Ti from site U1335 suggest that the sediments have low bio-SiO2 contents. MAR data are found in Tables S28 to S34.
We primarily describe the factors that have shaped CaCO3 % and MAR profiles in the Pliocene and Pleistocene because there are good examples of both production and dissolution dominated intervals since 5.3 Ma and because the complex nature of the LMBB interval merits additional work. CaCO3 production has a latitudinal distribution and is highest at the Equator (Honjo et al., 1995). Conversely, dissolution signals are strongest at deep sites underneath lower CaCO3 production in latitudes away from the Equator. Because the East Pacific Rise is roughly N–S in orientation, the depth effect imposes a longitudinal overprint upon the latitudinal production pattern. Furthermore, a 100 kyr cyclicity of CaCO3 content first appears between 1.5 and 2 Ma and increases to the present, much earlier than the 100 kyr cycles of oxygen isotopes.
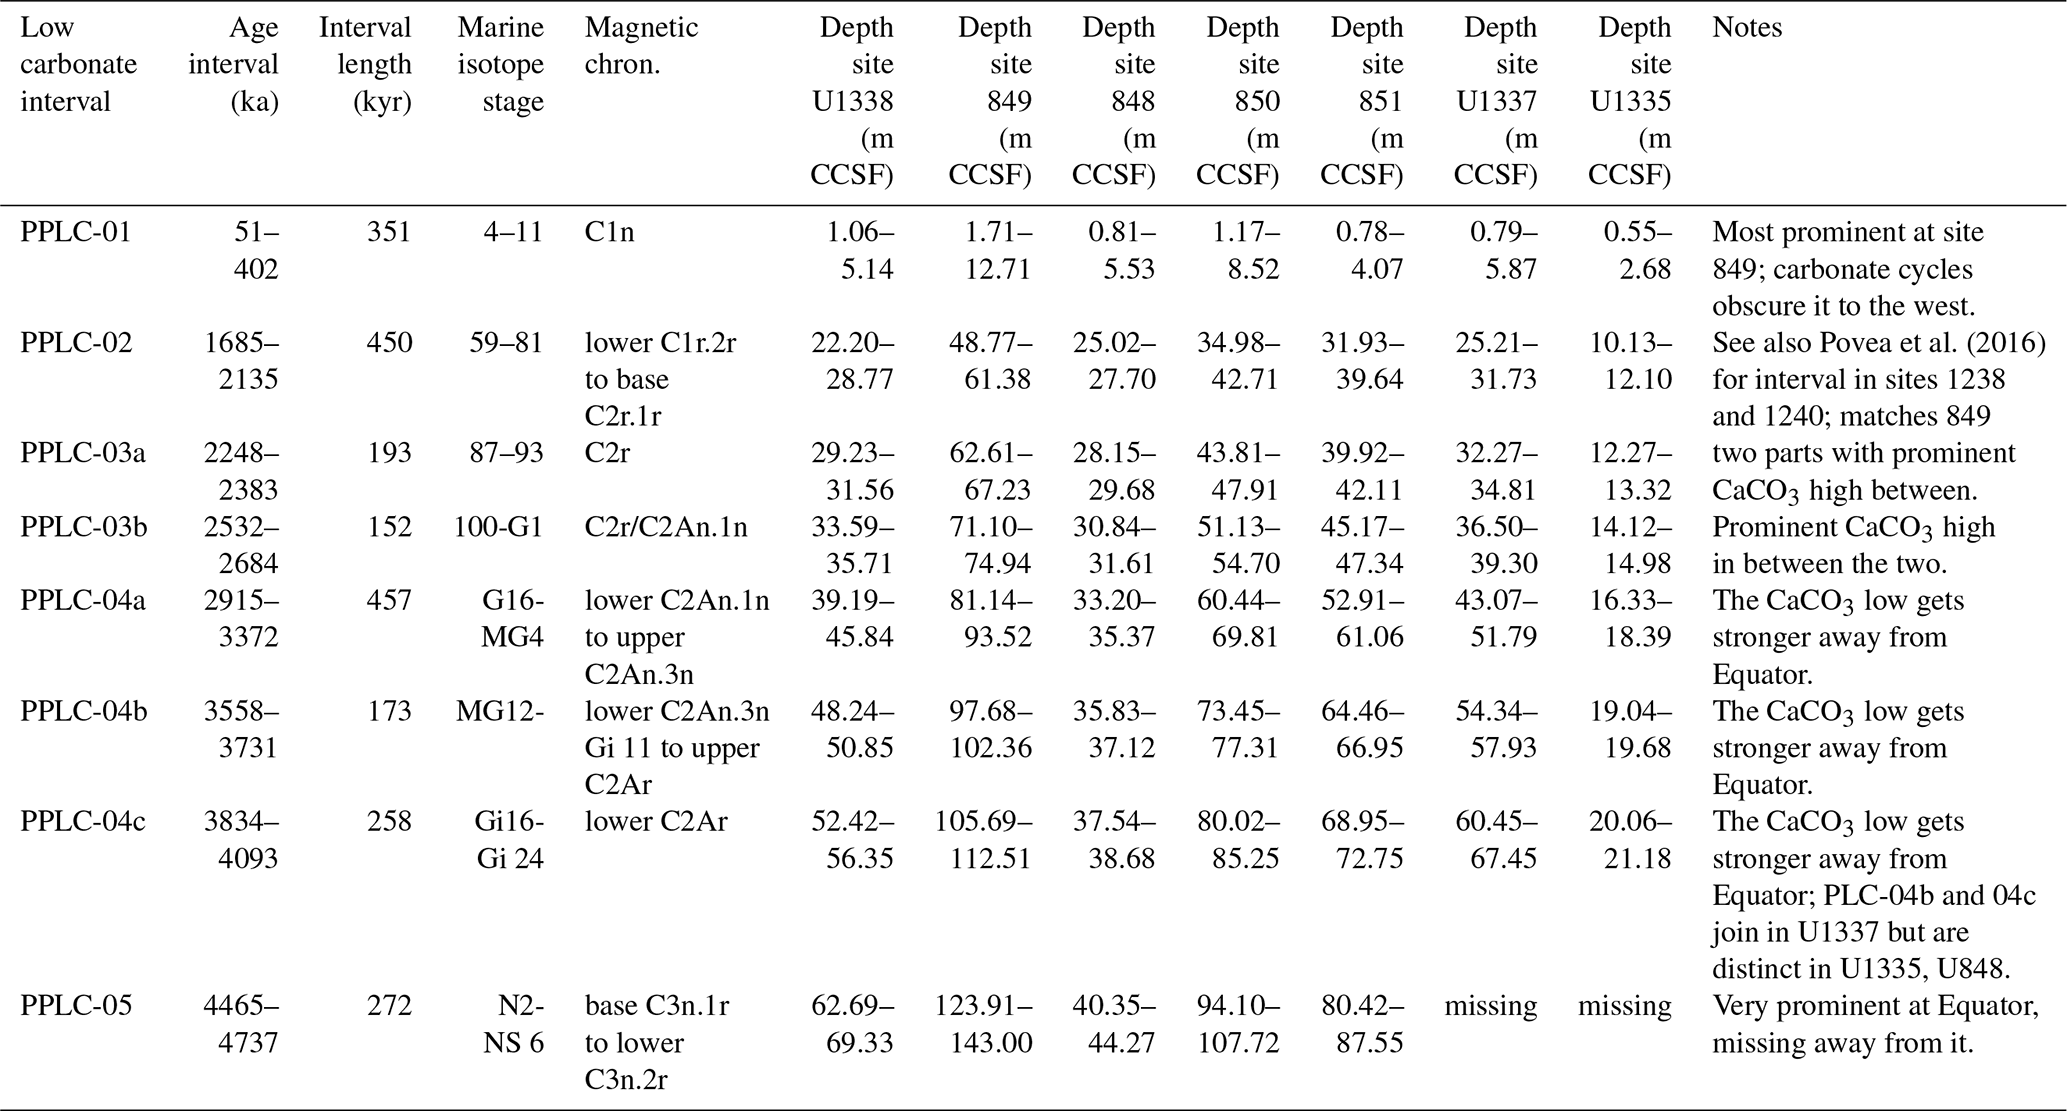
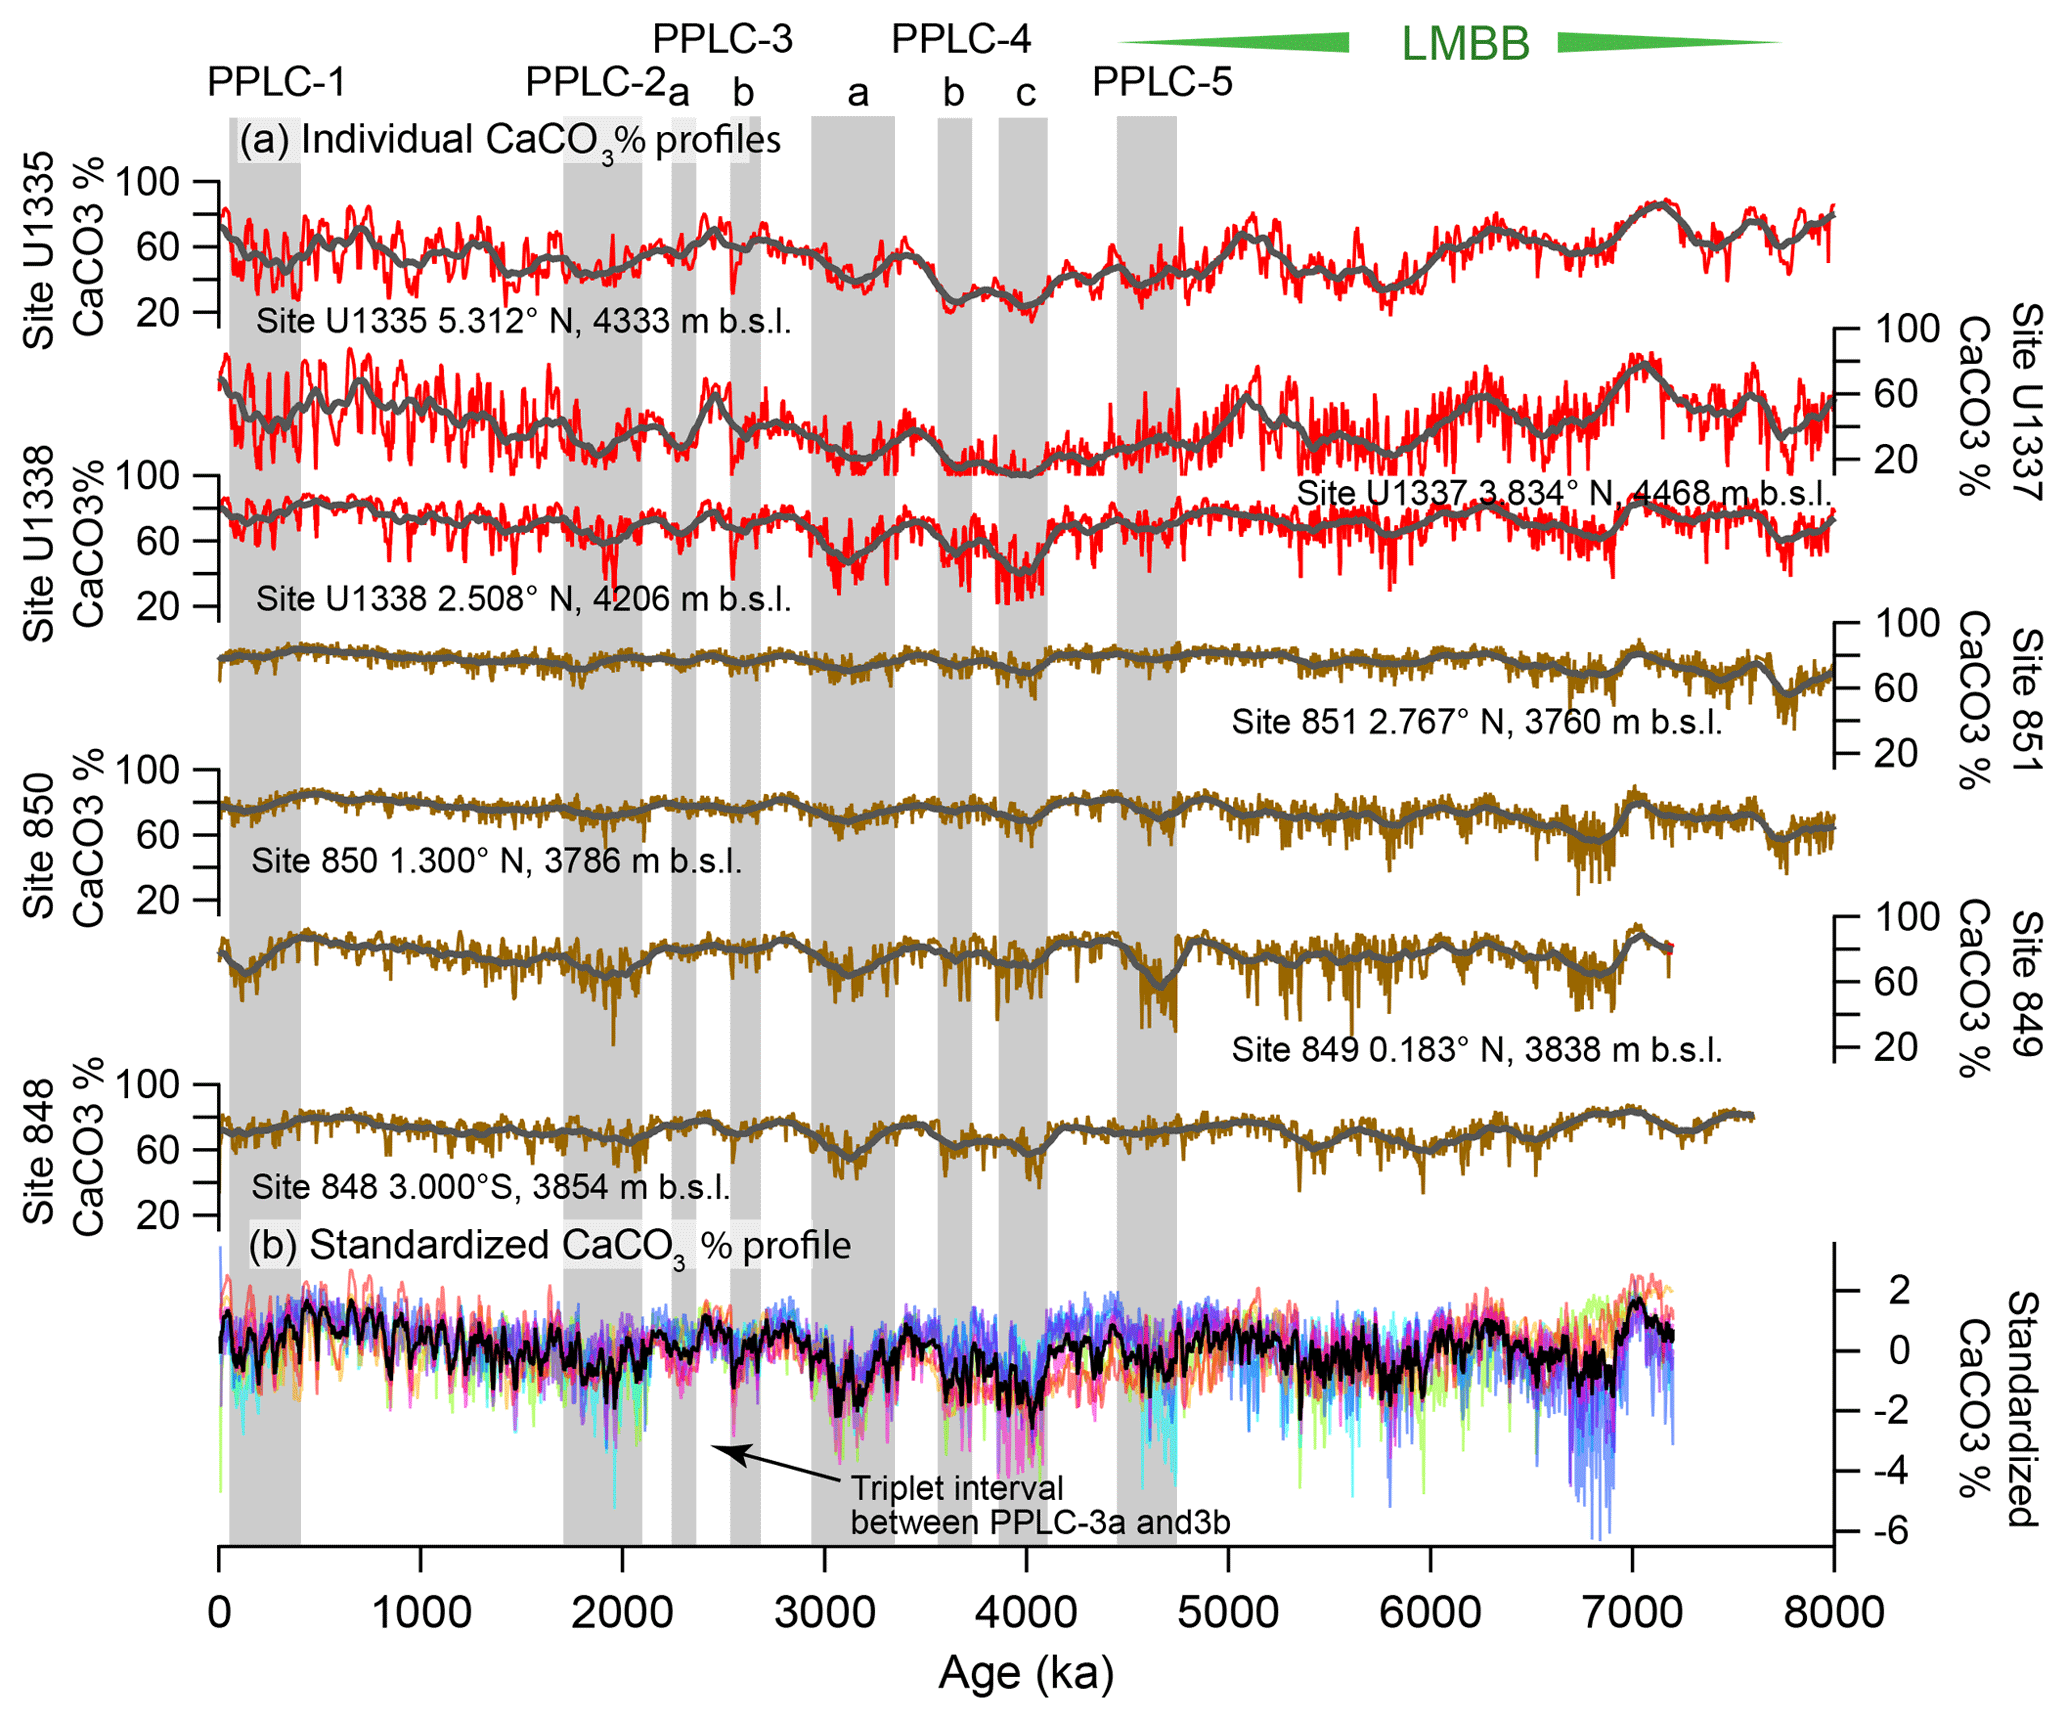
Figure 2(a) CaCO3 wt % profiles from the seven drill sites in this paper. Red profiles are from sites drilled by IODP Exp. 320/321 while the brown profiles are sites drilled on ODP Leg 138. Black lines are the smoothed profiles. The gray shading marks PPLC intervals determined in this paper (See Table 2), while the hatched intervals are productivity controlled. LMBB is the late Miocene biogenic bloom (LMBB) and includes PPLC-5, actually early Pliocene in age. (b) Stacked and standardized CaCO3 % profiles. Each profile is expressed in standard deviations from the mean and the data from each drill site have a different color. The black profile is the stack of all the CaCO3 % curves. The PPLCs were determined by common low CaCO3 % in the profiles.
The CaCO3 % and CaCO3 MAR profiles at all seven sites exhibit long period variability and orbital cyclicity (Figs. 2 and 3). We have used the CaCO3 % profiles to define five low percent and long-period CaCO3 % transients (Pliocene–Pleistocene Low CaCO3 intervals, PPLCs) in Table 2. We use CaCO3 % rather than MAR because (1) the percentage profiles can be directly measured as the sediment sections are processed at sea and they are the basis for most CCD reconstructions, (2) the CaCO3 % variability is chronostratigraphically synchronous across the east central Pacific, (3) the results are easily compared to earlier observations from other cores and drill sites where only CaCO3 % data are presented (e.g., Mayer et al., 1986; Farrell and Prell, 1991), and (4) the large changes in CaCO3 produce the characteristic seismic horizons found in the eastern Pacific (Mayer et al., 1986; Bloomer and Mayer, 1997). We then use MARs and other elemental data to understand the causes of each PPLC.
4.1 Low CaCO3 % intervals in the Pliocene and Pleistocene
Two primary factors cause low CaCO3 intervals – excess bio-SiO2 production and/or higher-than-average relative CaCO3 dissolution. Higher dissolution can result from an increase in dissolution at the sea floor or a reduction of CaCO3 surface production with little change of sea-floor dissolution. The late Miocene and early Pliocene have high CaCO3 variability in the LMBB interval largely driven by variability in relative bio-SiO2 and CaCO3 production. Low CaCO3 intervals are coherent through all seven records and have lowest CaCO3 in deeper sites away from the highest productivity. In Table 2 and Fig. 2 we have defined five PPLCs. The same low carbonate intervals can also be found in the low-resolution profiles of Deep Sea Drilling Project (DSDP) sites 572 and 573 from Farrell and Prell (1991) with some age shifts resulting from the older less accurate age model they used. The lowest CaCO3 % occurs at about 4 Ma (Fig. 2, PPLC-4c, 3834–4093 ka) and since that time CaCO3 % has slowly climbed to peak at about 500 ka, just before the initiation of PPLC-1.
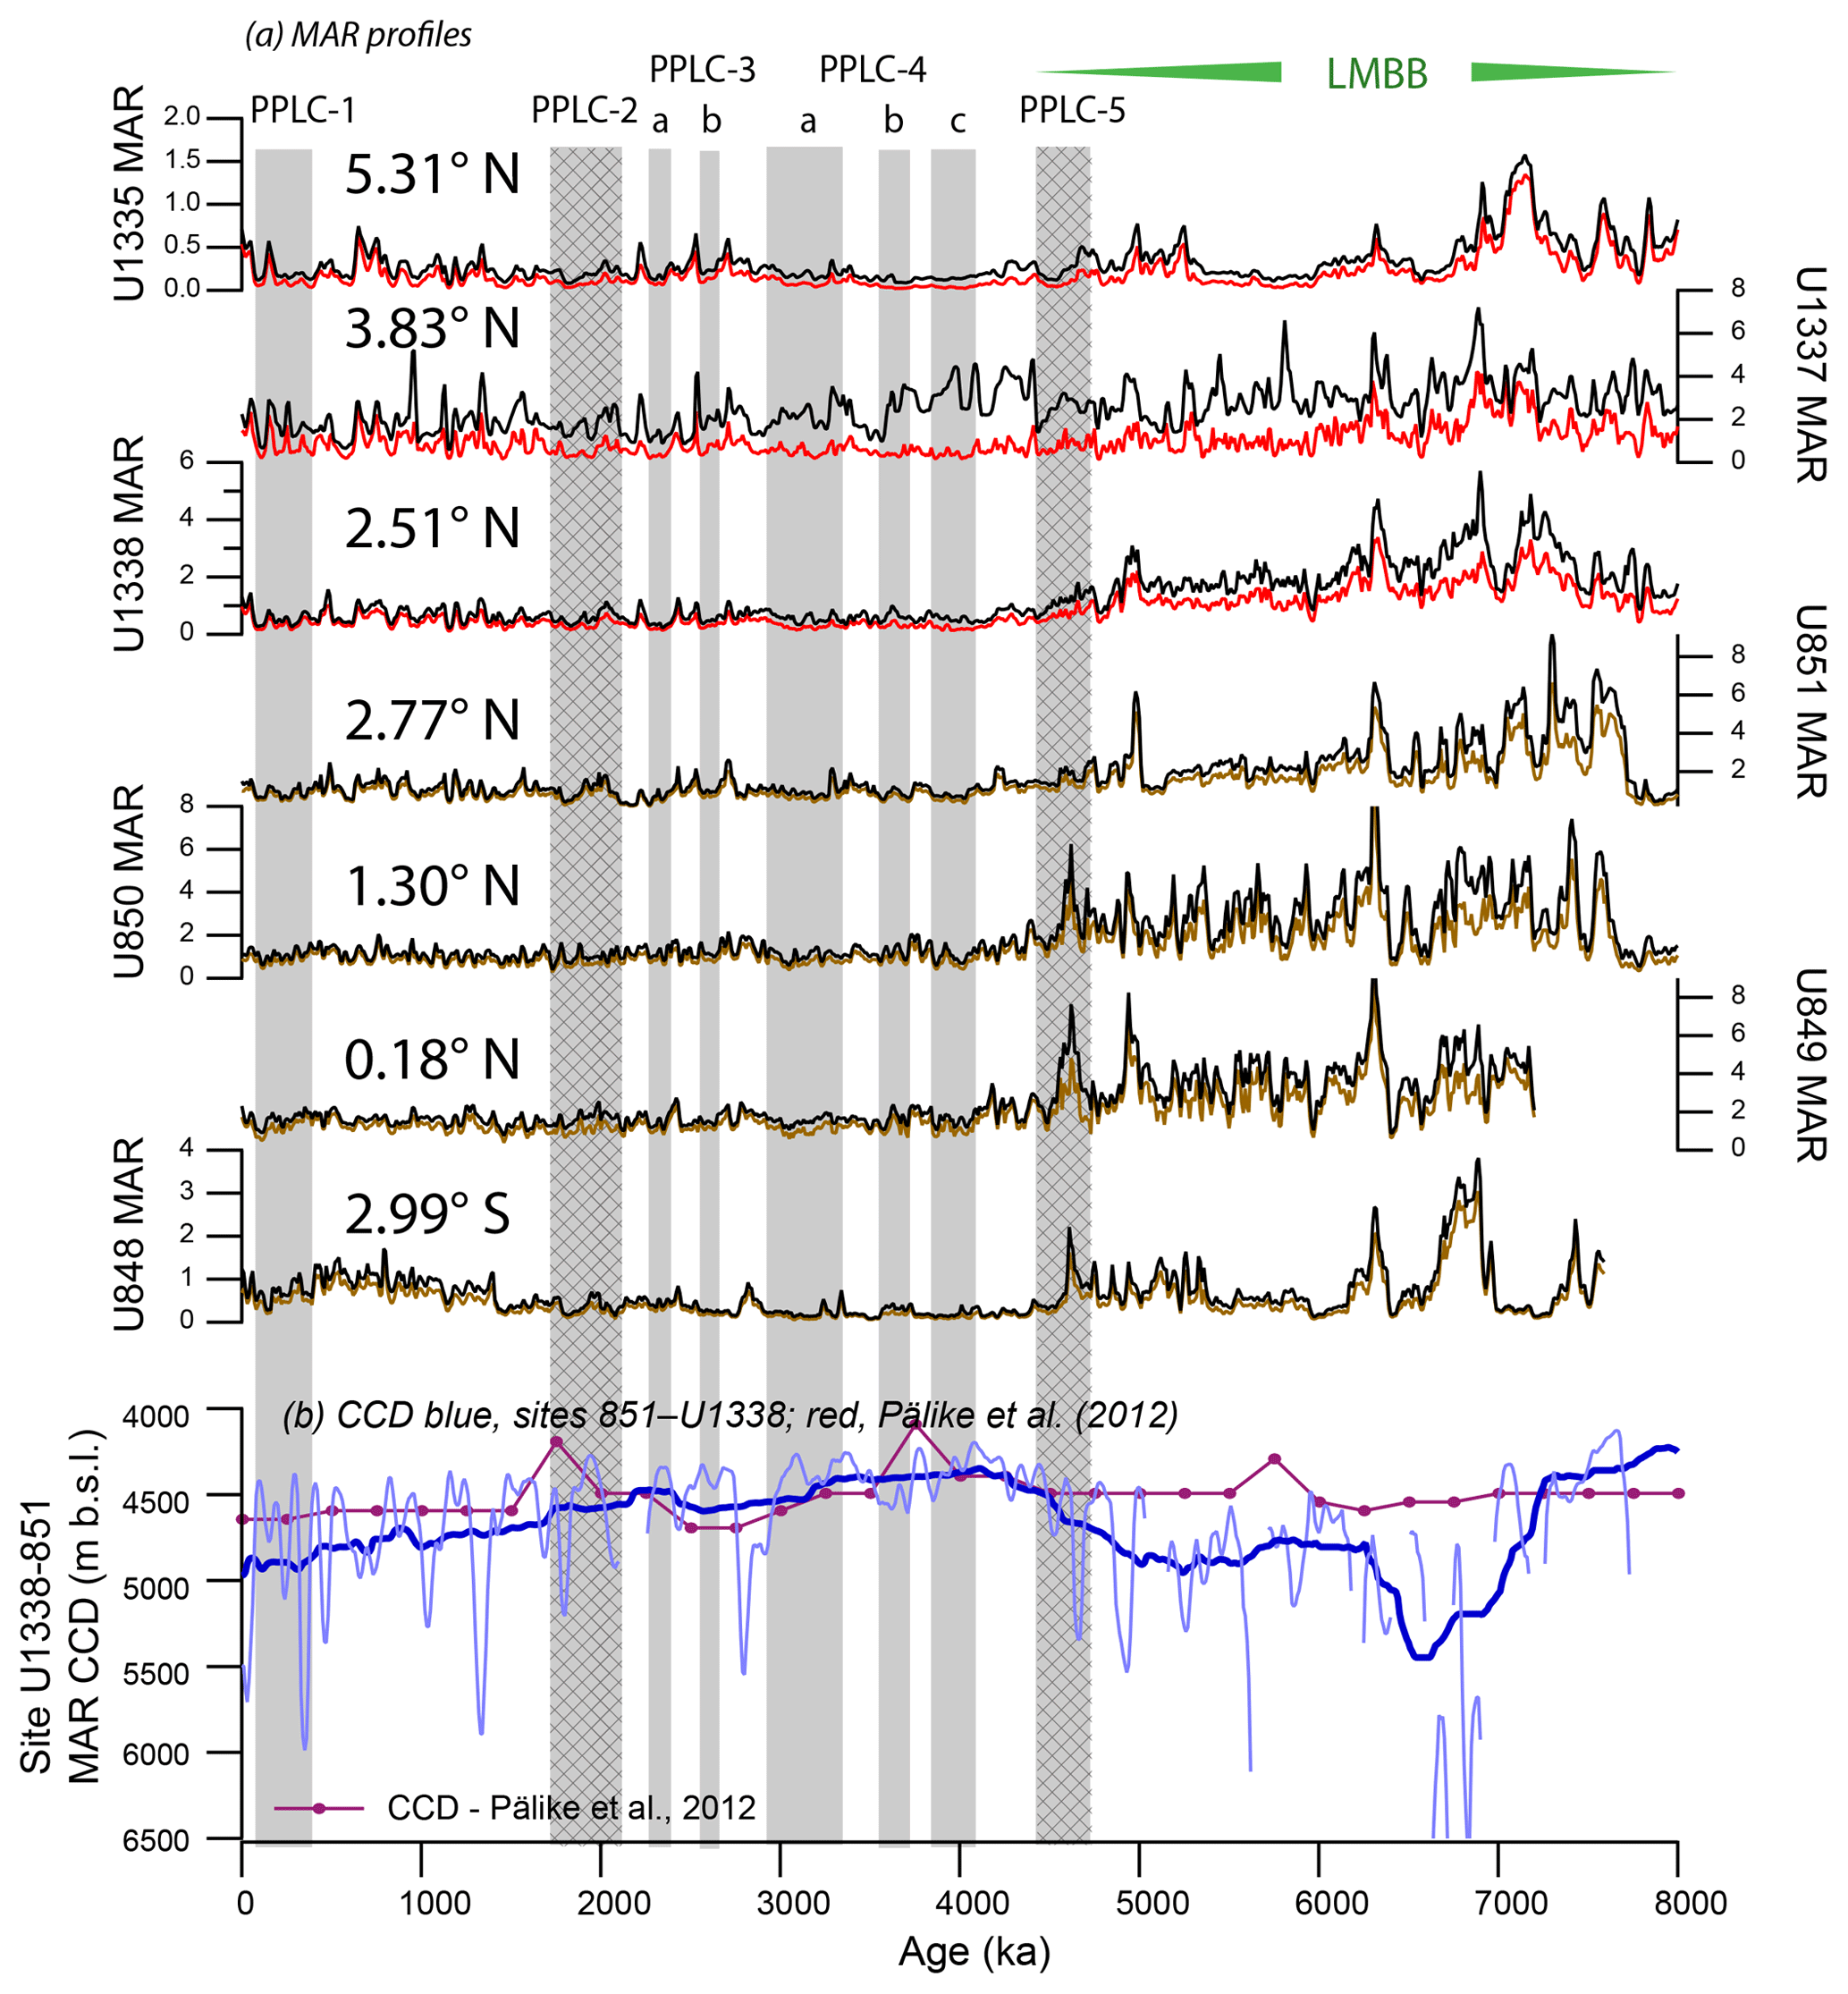
Figure 3(a) Mass accumulation rates (MARs) for eastern equatorial Pacific drill sites. Bulk MAR (black) and CaCO3 MAR (brown, Leg 138; red, Exp. 320/I21) profiles from drill sites studied for this paper. Shaded intervals are PPLCs and shaded hatched intervals are productivity controlled. MAR data are at 10 kyr intervals. Sites are arranged from south to north, at their modern position. Only site U1337 has bulk MAR time series that diverge significantly from the CaCO3 MAR profiles, indicative of sediment focusing at site U1337. (b) Eastern Pacific CCD change from Pälike et al. (2012; red line) and using the gradient of deposition from site 851 (3760 m) to site U1338 (4206 m) with two levels of smoothing, 50 kyr (light blue line) and 750 kyr (heavy blue line). Breaks in the light blue line profile are intervals where the CaCO3 MAR at the deeper site U1338 exceeded that at site 851. The 50 kyr smooth finds transient CCD changes up to 1.5 km but probably contains significant noise from local sediment variability. The 750 kyr smooth displays how the CCD was shallowest between 4200 and 3100 ka, during the time of PPLC-4.
The ∼100 kyr CaCO3 variation (Hays et al., 1969; Farrell et al., 1989; Murray et al., 2000) characteristic of the Pleistocene equatorial Pacific dominates the CaCO3 % records after 1.9 Ma and the CaCO3 variation is highest after 1 Ma (Fig. 2). The large CaCO3 swings are most prominent in sites U1337 and U1335, which are deep and relatively far from the equatorial productivity band. Sites along the Leg 138 transect have the smallest variability because they are also the shallowest sites. Earlier studies have found that CaCO3 % is high in Pleistocene glacial climate intervals and is low in interglacials (Chuey et al., 1987; Farrell and Prell, 1989). Development of ∼100 kyr cyclicity in the carbonate record predates the development of 100 kyr periodicity in the oxygen isotope record by about 1 Myr. The 100 kyr CaCO3 cycles are discussed further in Sects. 4.6 and 5.2. The older part of each record in Fig. 2 varies at a slower pace than 100 kyr.
4.2 Potential sediment focusing at U1337
Except for site U1337, bulk MAR records are similar throughout the eastern equatorial Pacific, indicating that much of the variability in an individual record is caused by regional factors not local sedimentation processes (Fig. 3). Site U1337 has anomalous deposition that may be caused by local sediment focusing (Francois et al., 2004; Lyle et al., 2005a; Tominaga et al., 2011; Marcantonio et al., 2014). Variability in the bulk sediment MAR is typically caused by changes in CaCO3 MAR that are coherent regionally. However, site U1337 is unique because it clearly has much higher bio-SiO2 and clay deposition unrelated to CaCO3 burial primarily between about 4.5 and 3 Ma and also between 6.2 and 5.4 Ma. The two intervals may have had higher-than-average local deep current activity to sweep sediments to site U1337. We propose that deposition at site U1337 is the result of local sediment focusing adding fine sediments to the sediment column at the drill site (Marcantonio et al., 2014; Lyle et al., 2014; Lovely et al., 2017). When deep currents are moderate in strength, sediment focusing preferentially moves the fine fraction of sediments (Lyle et al., 2014; Lovely et al., 2017) as is observed in the site U1337 record. Our interpretation is supported by seismic profiles and bottom bathymetry, which find active erosional channels around the northern and eastern edges of the site U1337 survey area (Figs. S1b, S5, Sect. S7; Pälike et al., 2010).
Surprisingly, the sediment focusing at site U1337 does not strongly affect the CaCO3 % profile but does result in anomalously high sedimentation rates, lower average CaCO3 contents, and higher-than-expected CaCO3 MAR. For example, average CaCO3 % for site U1337 is 39.5 % versus 54.5 % for U1335, despite site U1335 being 1.5∘ further north and further away from equatorial production. Similarly, CaCO3 MAR at site U1337 averages 20 % higher than the CaCO3 MAR at site U1338 for the last 8 Myr despite being further from the Equator than site U1338 (Fig. 3). Observations at site U1337 suggest that focusing over the Neogene enhances CaCO3 MAR to some extent but more greatly affects the MAR of finer sediment fractions.
4.3 Observed high production intervals: PPLC-5 (4465 to 4737 ka) and PPLC-2 (1685 to 2135 ka)
With a proper age model and with XRF scanning data, it is possible to distinguish a CaCO3 low caused by elevated bio-SiO2 production from intervals caused by higher CaCO3 dissolution at the sea floor. High bio-SiO2 burial during Pliocene and Pleistocene diatom deposition intervals can be distinguished by (1) low CaCO3 content, presumably by dilution with diatom bio-SiO2 for sites near the Equator, (2) little change in clay MAR but large change in bio-SiO2 content and bio-SiO2 MAR, (3) increase or little change in CaCO3 MAR, and (4) if there is a latitudinal transect, lowest CaCO3 % and high diatom deposition will be found at sites closest to the equatorial upwelling zone. Sites away from the Equator may actually have higher CaCO3 % and CaCO3 MAR in the equivalent interval presumably because elevated nutrients stimulate higher calcareous nannofossil production relative to time intervals on either side. The low CaCO3 near the Equator is caused mostly by dilution of CaCO3 by high fluxes of bio-SiO2 to the sea floor.
PPLC-5 (4737–4465 ka) is the last diatom deposition interval of the LMBB and exhibits all the characteristics of a high production interval. Sites 849 and 850, sites straddling the Equator at 5 Ma (Table 1), exhibit a pronounced CaCO3 % low at this time (Fig. 2), but sites farther away from the Equator exhibit much smaller CaCO3 % change (sites 848, 851, and U1338) or even slight CaCO3 % increases (sites U1337, U1335). All sites have relatively high or unchanged CaCO3 MARs within PPLC-5 (Fig. 3). Bio-SiO2 data are only available for sites 849, U1338, and U1337, and the records exhibit a large bio-SiO2 MAR peak at site 849 (Fig. 4), a small peak at site U1338 (Fig. 6), and ambiguous change at site U1337, exacerbated by potential sediment focusing there.
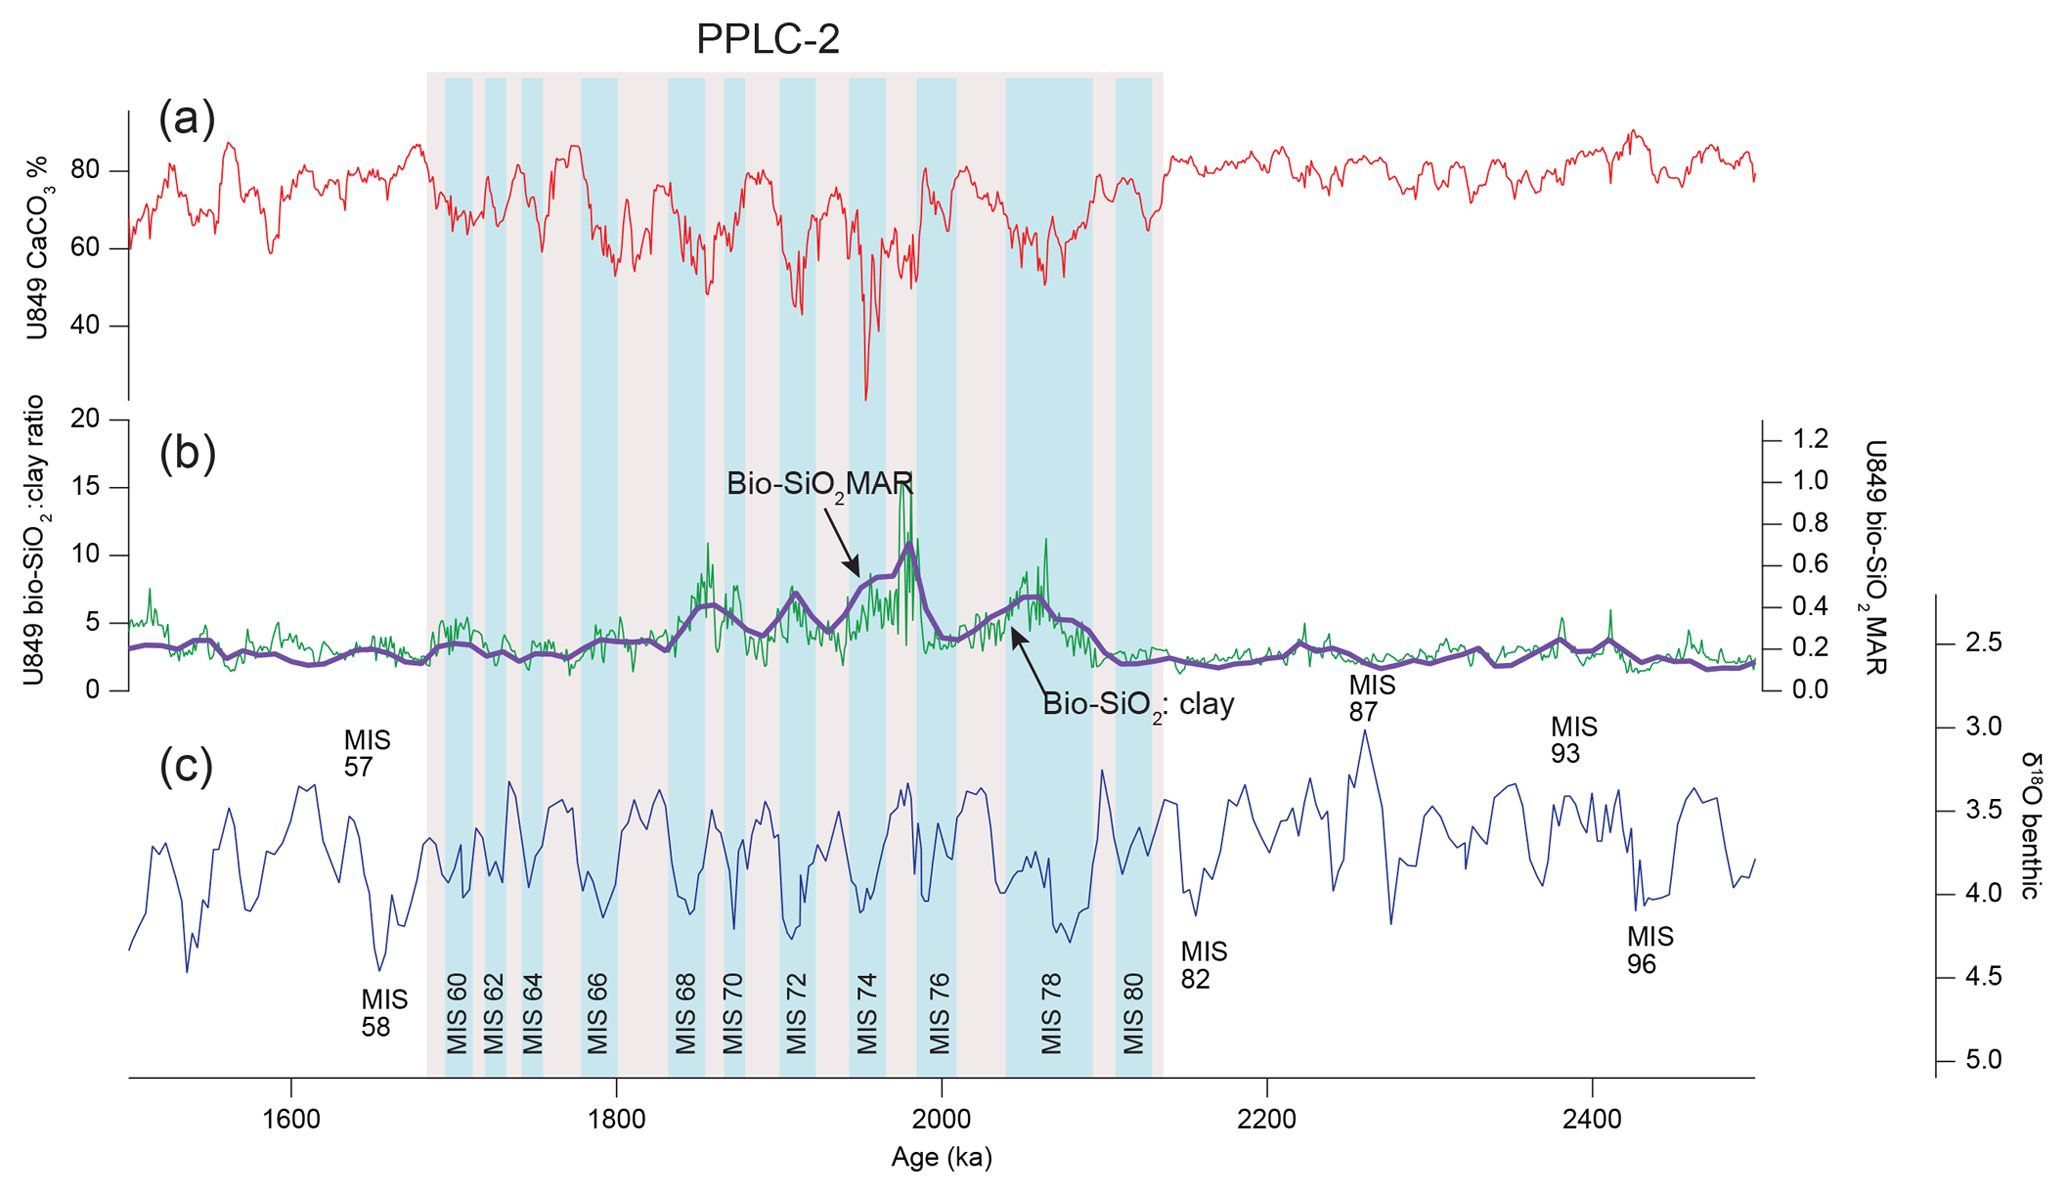
Figure 4Site 849 profiles over low carbonate interval PPLC-2 (2135–1685 ka) showing bio-SiO2 dilution as a primary cause of the low CaCO3 %. High bio-SiO2 MARs are in glacial intervals. (a) Scanning XRF CaCO3 %; (b) Thick line is bio-SiO2 MAR and thin line is bio-SiO2 : clay ratio, showing the high bio-SiO2 MAR associated with each subinterval in PPLC-2. (c) Site 849 benthic oxygen isotope stratigraphy constructed with data from Mix et al. (1995) using the updated splice from this paper. Stages are numbered following Lisiecki and Raymo (2005). Glacial intervals are labeled.
PPLC-2 (2135–1685 ka) is found at the Equator at site 849, but is also found at site U1338. The equivalent of the PPLC-2 interval has also been reported to the east, near the Galápagos Islands (sites 846 and 847; Farrell et al., 1995; site 846, Lawrence et al., 2006; site 1240, Povea et al., 2016). There are clear bio-SiO2 MAR peaks at site 849 (Fig. 4) that match in time and magnitude with a similar interval from site 1240 (Povea et al., 2016). Major bio-SiO2 MAR highs within PPLC-2 align with glacial intervals in the oxygen isotope series between marine isotope stage (MIS) 78 and MIS 60, even though the highest bio-SiO2 MAR is in an interglacial (MIS 75). CaCO3 % lows within PPLC-2 do not always align with high bio-SiO2 MAR, indicating CaCO3 dissolution has also occurred. At site U1338, low CaCO3 % and highest bio-SiO2 MAR are not aligned, evidence that a dissolution overprint exists.
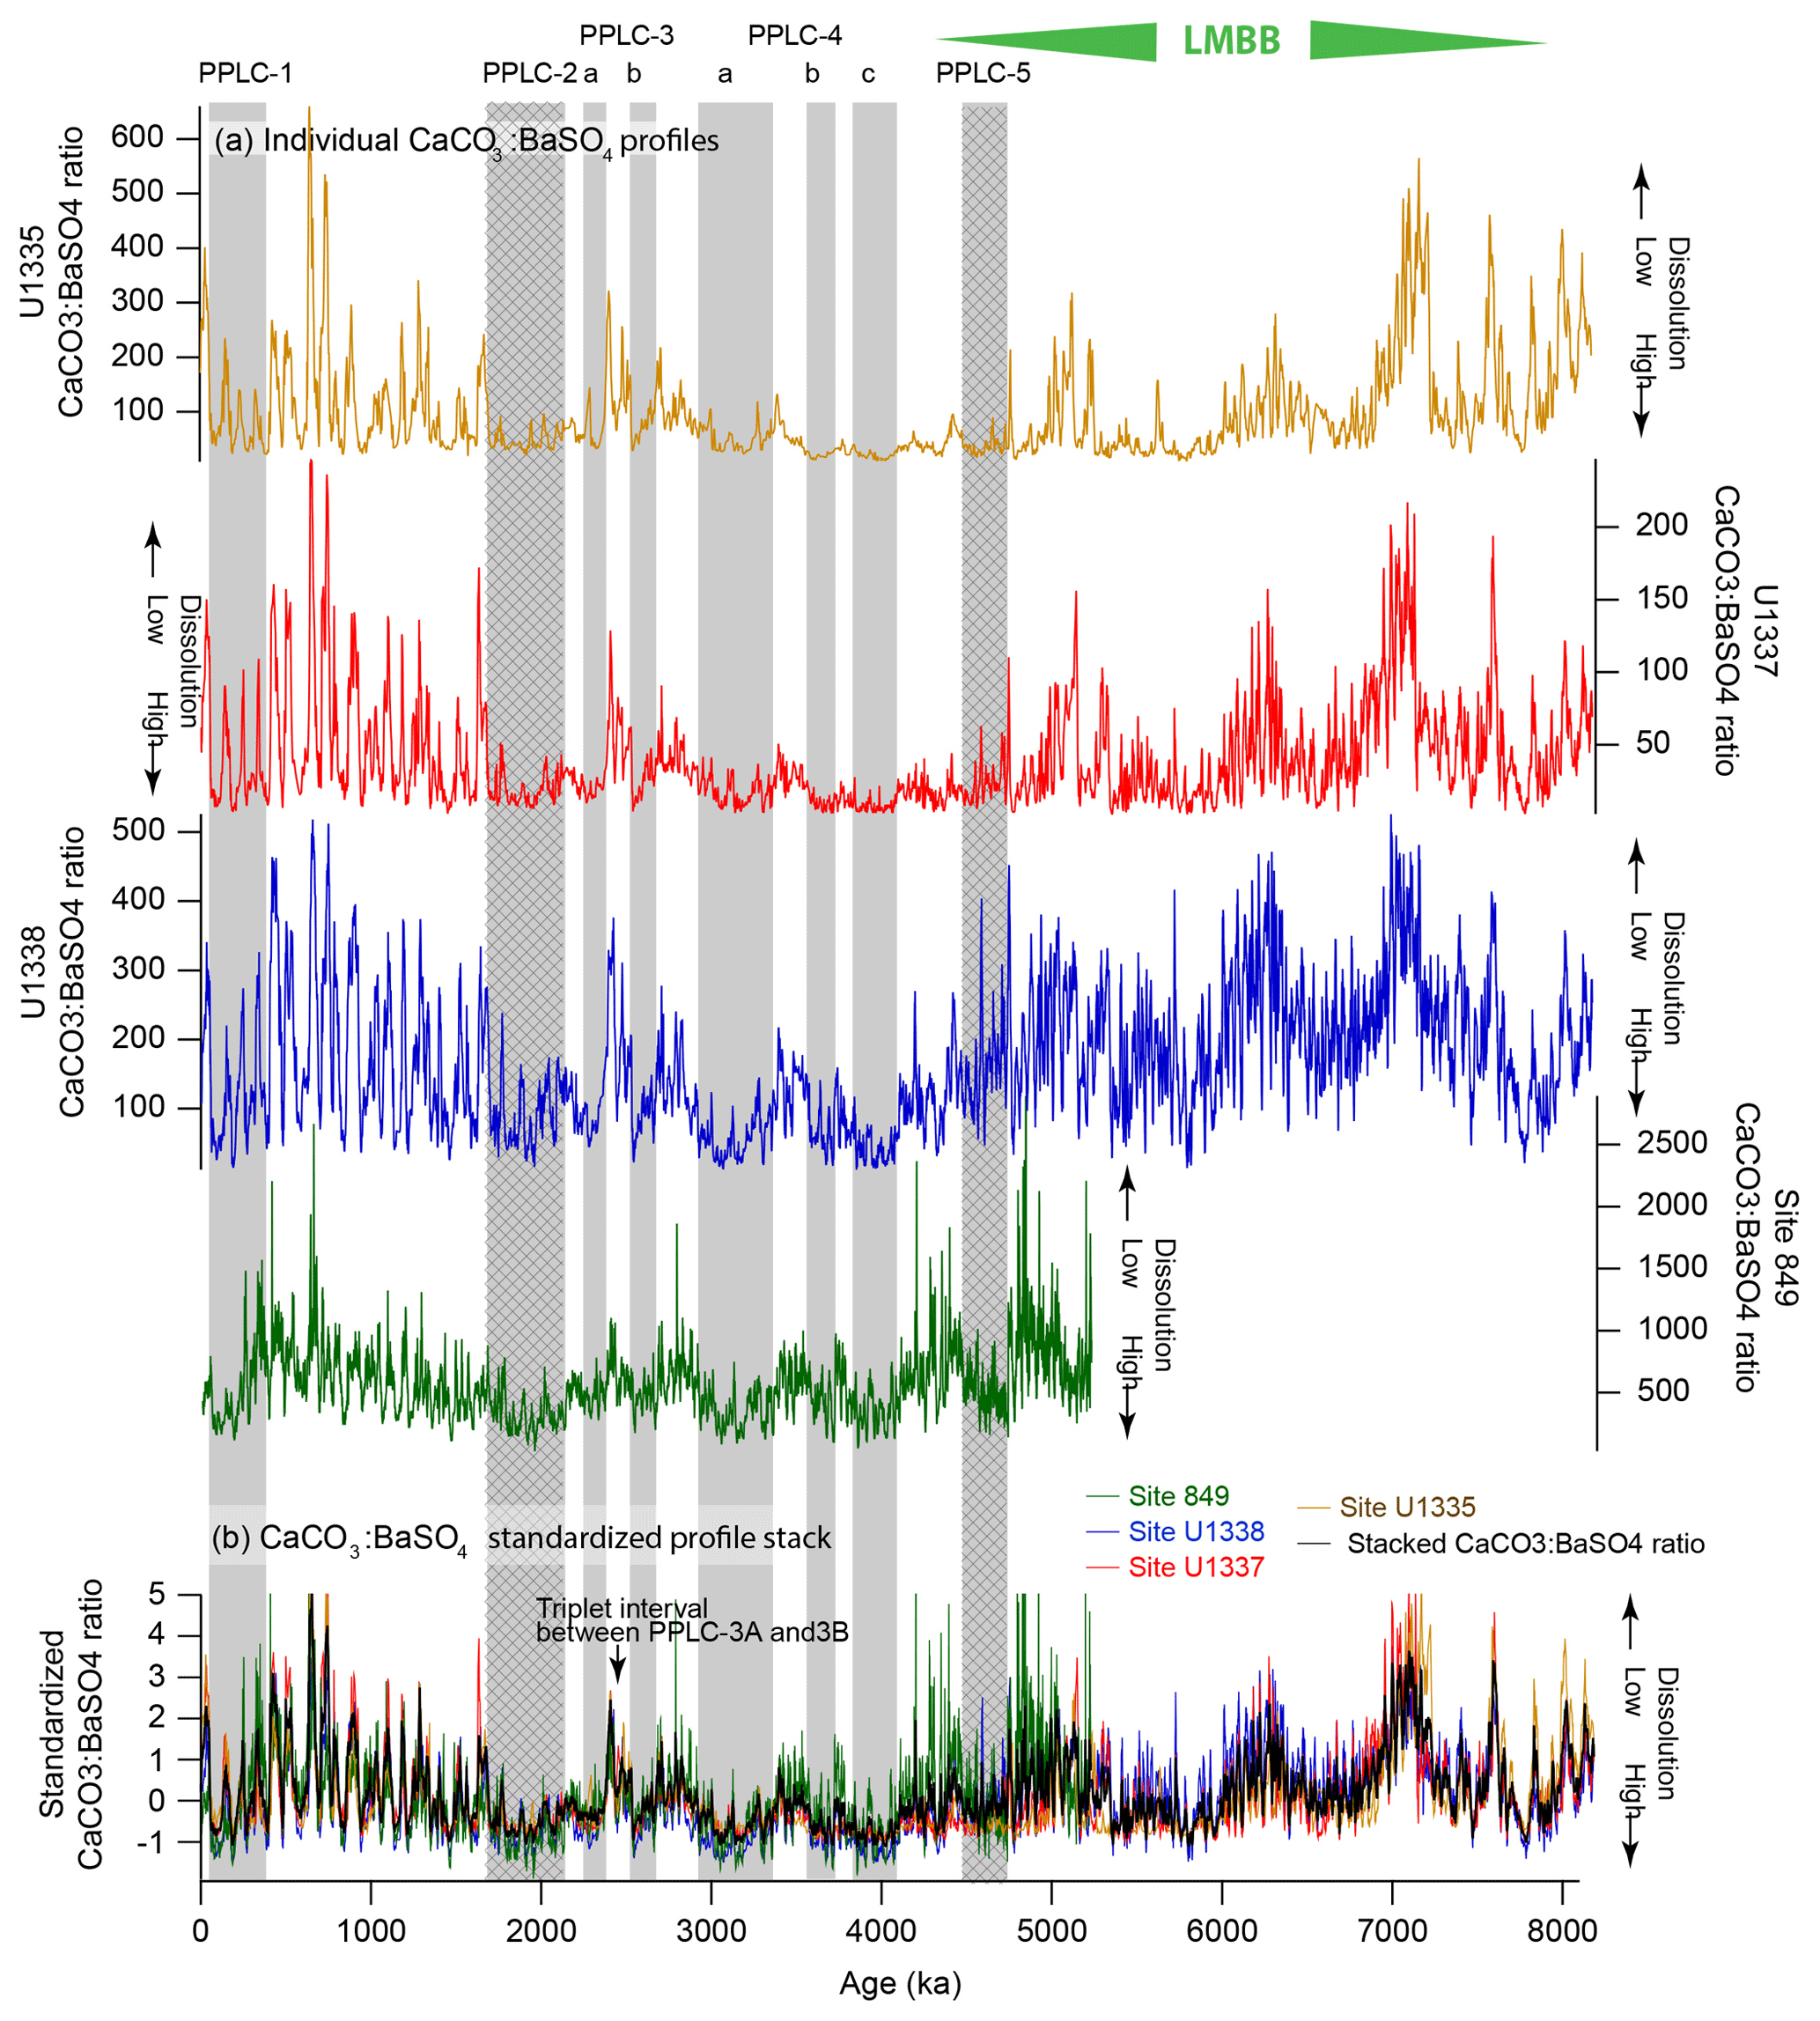
Figure 5XRF CaCO3:BaSO4 profiles to investigate CaCO3 dissolution at drill sites with scanning XRF profiles. Shaded intervals are PPLCs and shaded hatched intervals are productivity driven. Low CaCO3:BaSO4 ratio indicates high dissolution of CaCO3. (a) Individual profiles of CaCO3:BaSO4 at sites U1335, U1337, U1338, and site 849. Note how ratios are higher at site 849, the shallowest site nearest to the Equator. (b) Changes in dissolution in the eastern Pacific shown by stacked CaCO3:BaSO4 ratio records expressed as standard deviations from the average. Low CaCO3:BaSO4 ratios coincide with PPLCs, indicating that the dissolution signal has an important impact on the record, even within high productivity intervals.
The level of dissolution can be assessed by the CaCO3:BaSO4 ratio (Fig. 5; Table S22). Lyle and Baldauf (2015) proposed that the CaCO3:BaSO4 ratio is a good measure of relative preservation since CaCO3 preservation is highly variable but Ba is better preserved, and the preservation is relatively constant (Dymond et al., 1992; Balakrishnan Nair et al., 2005; Griffith and Paytan, 2012). In addition, particulate Ba rain caught in sediment traps is proportional to the Corg rain so normalizing to Ba largely normalizes out the production variability and leaves a signal dominated by CaCO3 dissolution. Both bio-Ba and CaCO3 rain are well-correlated to particulate organic carbon rain (Dymond and Collier, 1996) so changes in the CaCO3:BaSO4 ratio primarily mark changes in the relative preservation of CaCO3 (Lyle and Baldauf, 2015). Highest CaCO3:BaSO4 ratios in the XRF data set are found at site 849, which is shallower and has about twice the sedimentation rate of site U1338 or U1337 (Table 2). As expected, the ratio indicates lower dissolution while compensating for the higher production at site 849.
PPLC-2 has generally low CaCO3:BaSO4 ratios, which indicates that the interval not only has higher bio-SiO2 burial indicative of high surface productivity (Fig. 4) but also higher dissolution (Fig. 5). Production and dissolution do not have to be mutually exclusive and can be superimposed to produce a low CaCO3 interval.
4.4 Early Pliocene extensive CaCO3 dissolution: PPLC-4 (4093–2915 ka)
Immediately after the LMBB ends there is the PPLC-4 interval of very low CaCO3 %. The minimum is found throughout the eastern and central equatorial Pacific west of the East Pacific Rise. The base of PPLC-4 constitutes the acoustic impedance contrast that causes the Pliocene “green” seismic horizon (Mayer et al., 1986; Bloomer and Mayer, 1997). At site 850, Bloomer and Mayer (1997) identified a series of seismic horizons that can be linked to the CaCO3 variability associated with PPLC-3, -4, and -5.
PPLC-4 is made up of three low CaCO3 % intervals between 2915 and 4093 ka (Table 2) with lower CaCO3 % and more consistently low CaCO3 % at sites further away from the Equator. The lowest CaCO3 % in all the records is found at U1337 between 4500 and 3500 ka because apparent sediment focusing has caused extensive clay and bio-SiO2 dilution in addition to CaCO3 % dissolution (Figs. 2 and 3). Nevertheless, relatively shallow sites along the Leg 138 transect also exhibit coherent CaCO3 change, as exhibited by the standardized CaCO3 % records (Fig. 2b). The low bulk MAR and CaCO3 MAR over the PPLC-4 interval indicates that dissolution was a major factor shaping the CaCO3 record. The CaCO3:BaSO4 records (Fig. 5) also clearly show the low CaCO3:BaSO4 ratios indicative of dissolution in the PPLC-4 intervals. They have the lowest CaCO3:BaSO4 ratios in the time series and the lowest CaCO3 MAR.
The PPLC-4 set of dissolution-induced CaCO3 % lows occurs at an important juxtaposition of tectonic and environmental influences. Slow closure of the Central American Seaway was severing connections between the Caribbean and Pacific. However, extensive changes were also going on in global climate so it is currently impossible to isolate the seaway closure effect from other changes in the eastern Pacific (Molnar, 2008, 2017; O'Dea et al., 2016).
4.5 PPLC-3 (2684–2248 ka): CaCO3 dissolution at the initiation of Northern Hemisphere glaciation
PPLC-3 consists of two dissolution intervals separated by a distinctive triplet of high CaCO3 % peaks marked on Figs. 2 and 5. PPLC-3 can best be seen in the stacked and standardized CaCO3 % profile (Fig. 2, bottom). The PPLC-3 dissolution intervals surrounding a high carbonate triplet are also found at DSDP sites 573 and 574 (Farrell and Prell, 1991). The consistent expression of the PPLC-3 CaCO3 % lows merited their inclusion in this list. Deeper sites within the eastern Pacific have prominent lows around the triplet of high CaCO3 %, while records from the shallower Leg 138 sites have weaker variability. Along the relatively shallow Leg 138 transect (∼3800 m water depth), PPLC-3 lows are most pronounced south of the Equator at site 848 (3∘ S) and north of the Equator at site 851 (2.7∘ N), as expected if dissolution is superimposed upon an equatorial maximum of CaCO3 production. The timing of PPLC-3 suggests an association with the 2.7 Ma initiation of Northern Hemisphere glaciation (Haug et al., 2005) or at least with changes in abyssal circulation at that time. Dissolution at PPLC-3 can also be determined by the CaCO3:BaSO4 ratio (Fig. 5). The CaCO3:BaSO4 ratio around PPLC-3 clearly shows similar responses in all the records we have with two low CaCO3 intervals surrounding the CaCO3 % high.
4.6 PPLC-1 (51–402 ka): low CaCO3 interval among the 100 kyr Pleistocene cycles
The PPLC-1 interval is superimposed upon the classic Pleistocene Pacific 100 kyr glacial–interglacial carbonate cycles (Fig. 5). Significant 100 kyr CaCO3 cyclicity first appears at about 1900 ka in the eastern Pacific, well before the appearance of 100 kyr benthic oxygen isotope cycles at ∼900 ka that characterize the end of the Mid-Pleistocene Transition. If sites U1338 and 849 are compared it is clear that dissolution is a major factor in the cycles. Site 849 is the shallowest site and has a much higher CaCO3:BaSO4 ratio (less dissolution) than the other sites plus much weaker 100 kyr cycles. Dissolution apparently increases the amplitude of the CaCO3 cycles within site U1337 and site U1338 records. Not only does dissolution increase the 100 kyr cycle amplitude but it also selectively removes higher-frequency variability in the CaCO3:BaSO4 ratio that is apparent at site 849. Highest CaCO3 preservation as well as the highest CaCO3 % occurs just before the beginning of PPLC-1. The time offset of the low CaCO3:BaSO4 ratio at site 849 results from relatively weak dissolution in the early part of PPLC-1. These cycles largely match the Pleistocene CCD changes found by Farrell and Prell (1989) at around 140∘ W.
Two major processes affect carbonate burial in the equatorial Pacific. High production within the surface waters of the equatorial productivity belt may increase CaCO3 rain but may also dilute CaCO3 sediment concentrations with bio-SiO2. Dissolution by deep waters from the North Pacific rich in dissolved inorganic carbon (DIC) and low in [CO3]2− may reduce CaCO3 burial by increased CaCO3 dissolution at the sea floor. As noted in the introduction, Antarctic abyssal waters flow into the North Pacific basin to the west of Hawaii, and the return flow travels south from the northeast Pacific along the west flank of the East Pacific Rise (Johnson and Toole, 1993; Hautala, 2018) across the drill sites studied in this paper. All the east Pacific sites have been exposed to the same modified bottom water streaming from the north.
CaCO3 burial is the net difference between biogenic CaCO3 production and dissolution at the sea floor. If CaCO3 production decreases but dissolution at the bottom stays relatively constant, lower CaCO3 burial will also occur. Dissolution effects can be distinguished from those caused by productivity, in particular dilution by high bio-SiO2 deposition, by using burial fluxes (MAR) along with other sediment chemical data. BaSO4 MARs are especially useful to distinguish between dissolution and reduced production as the primary cause of an interval of low CaCO3 %.
The CCD concept is most useful at a reconnaissance scale. But using a ratio such as CaCO3:BaSO4 to normalize for different CaCO3 rain rates provides the best indicator of relative dissolution at any given drill site (Fig. 5). The ratio of benthic to planktic foraminifera could also be used to assess local carbonate dissolution but requires measurements in addition to the XRF scans.
We find that dissolution is most pronounced in the early Pliocene (PPLC-4) and is evidence that a major reorganization of carbon storage in the Pacific occurred then. We also found that bio-SiO2 dilution shapes the record, especially in PPLC-5 and PPLC-2. More XRF profiles, especially from ODP Leg 138 and ODP Leg 202 would be very useful to better understand the Pacific carbon cycle and the regional-to-global biogenic sedimentation patterns that are observed.
5.1 Disentangling production versus dissolution: eastern tropical Pacific sedimentation since the Miocene Climate Optimum (14 Ma)
Profound changes in equatorial Pacific biogenic deposition from the middle Miocene to Holocene were recorded at site U1338 (Lyle and Baldauf, 2015). Dilution of CaCO3 by bio-SiO2 deposition appears to be relatively common in the middle and late Miocene (Holbourn et al., 2014; Lyle and Baldauf, 2015). For the most part, CaCO3 burial was high since the end of the Miocene Climate Optimum, except within the late Miocene carbonate crash, 11–8 Ma (Lyle et al., 1995; Roth et al., 2000; Lyle and Baldauf, 2015). Poorest CaCO3 preservation occurred at about 9.7 Ma. The LMBB, from 8 to about 4.5 Ma, occurred in the equatorial region west of the East Pacific Rise after the carbonate crash (Farrell et al., 1995; Lyle and Baldauf, 2015). Consistently high sedimentation rates and biogenic deposition characterizes the LMBB with considerable variations in bio-SiO2 and CaCO3 burial. The last diatom production interval within the LMBB (PPLC-5) ended at 4465 ka, within the early Pliocene (see Sect. 5.2.1 for further discussion of the LMBB). In the LMBB, the most diatom-rich intervals are a mixture of mat-forming and upwelling diatom species but the upwelling species extended over much longer time ranges than the high diatom deposition intervals and are not restricted to them. Northern subtropical diatoms were abundant at the beginning of the LMBB and were replaced by diatoms now associated with the Southern Hemisphere subtropics by 4.4 Ma (Lyle and Baldauf, 2015).
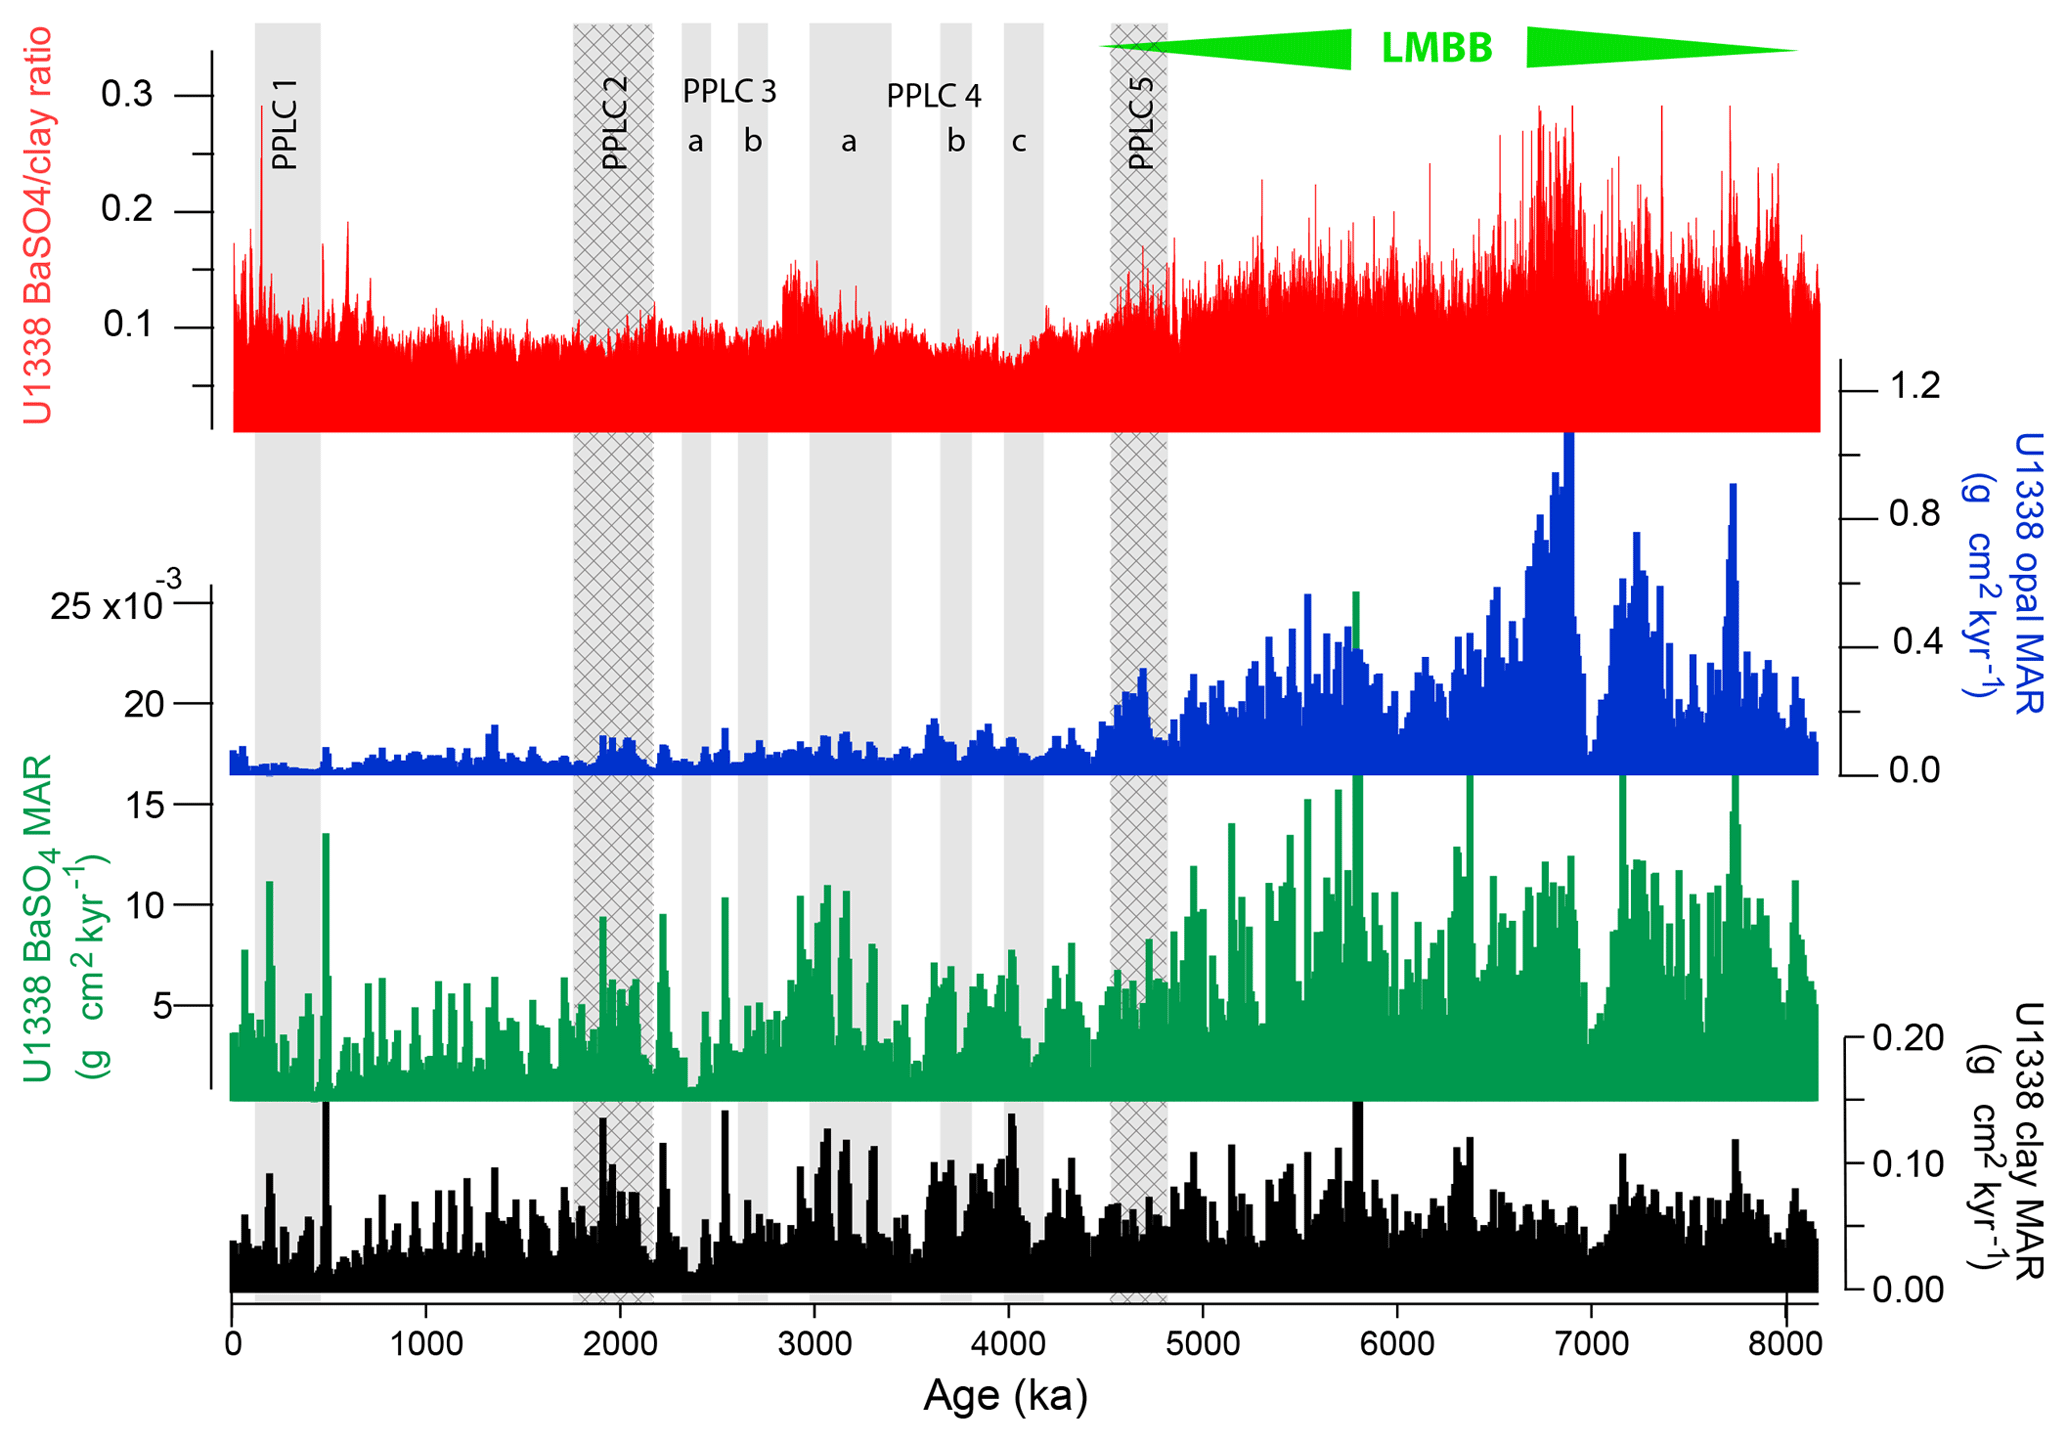
Figure 6Site U1338 BaSO4 ∕ clay ratio and mass accumulation rates (MARs) of biogenic sediment components and clay. Gray bands mark PPLCs (Pliocene–Pleistocene Low CaCO3 intervals) and hatched gray bands are productivity controlled. High bio-SiO2 and BaSO4 MAR prior to 4465 ka represents the LMBB interval at site U1338. Clay MAR is relatively constant over the 8 million years and is shown by the drop in BaSO4 ∕ clay ratio at that time.
Changes in biogenic deposition apparently result from variable responses under different nutrient or upwelling conditions by different plankton. At site U1338, BaSO4, bio-SiO2, and CaCO3 MAR reveal a major drop in burial at the end of the LMBB but also some second-order cyclicity (Fig. 6). PPLC-4b and -4c intervals are associated with low biogenic deposition of bio-SiO2 and bio-Ba so CaCO3 dissolution within those intervals may have been enhanced by low relative production of CaCO3. Estimated clay deposition varied much less than that of the biogenic components, especially across the LMBB. Since Ba production is linear with respect to organic carbon export production (Dymond et al., 1992), the BaSO4 ∕ clay ratio should be relatively constant if changes in dust-delivered Fe were the primary cause of the large-scale changes in productivity. At the end of the LMBB, the BaSO4 ∕ clay ratio dropped (top graph in Fig. 6) but the clay MAR remained relatively constant (bottom graph in Fig. 6), indicating that changes in dust delivery of Fe was not the main cause to end the LMBB. In contrast, in PPLC-2, the BaSO4 ∕ clay ratio was essentially constant despite relatively high BaSO4 MAR, indicating that changes in dust-derived Fe may have been critical to the change in surface productivity.
The observed changes in apparent productivity exceed the envelope encompassed by seasonal change in the Joint Global Ocean Flux Study (JGOFS) Pacific sediment trap experiment (Honjo et al., 1995; Dymond and Collier, 1996). Further work to understand the biogeochemical response to long-term climate change should be done. Not only were there long intervals of high biogenic deposition but also the ratios of the different biogenic hard parts varied by large amounts and different species within the phytoplankton participated at different times.
5.2 Primary productivity in the eastern equatorial Pacific (PPLC-5 and -2)
The LMBB (with PPLC-5) and PPLC-2 at 2 Ma result from major changes in primary productivity in the eastern Pacific. Apparently conditions conducive to high primary production were in place for hundreds of thousands of years (Table 2) modulated by Milankovitch cycles. Here we discuss the most likely causes of these prolonged phases.
5.2.1 The late Miocene biogenic bloom and PPLC-5
The LMBB has multiple intervals of high biogenic deposition after 8 Ma (Fig. 3; Farrell et al., 1995; Lyle and Baldauf, 2015), ending with PPLC-5. The significant difference in biogenic sediment accumulation associated with the LMBB is easily observed by the change in slope of the age–depth curves at about 4400 ka (Fig. 7). Each drill site exhibits slower sedimentation rates after ∼4400 ka, marking the end of the LMBB. In Fig. 1, the spatial pattern of the LMBB is also shown by a ratio of the thickness of the older sediments (8–4.5 Ma) from the LMBB to that of the younger ones since the end of the LMBB (4.5–0 Ma), referred to in Fig. 1 as the LMBB ∕ Pliocene ratio. Because only two time horizons need to be identified, and because this metric uses only sediment thickness, other sites can be added easily to the map using the published site descriptions. Additional Leg 138 sites (sites 844, 845, 846, 847, 852, 853, and 854) plus sites from ODP Leg 202 (sites 1238, 1239, and 1241) and DSDP sites (83, 158, and 572) were used to map the regional extent of the LMBB and its strength.
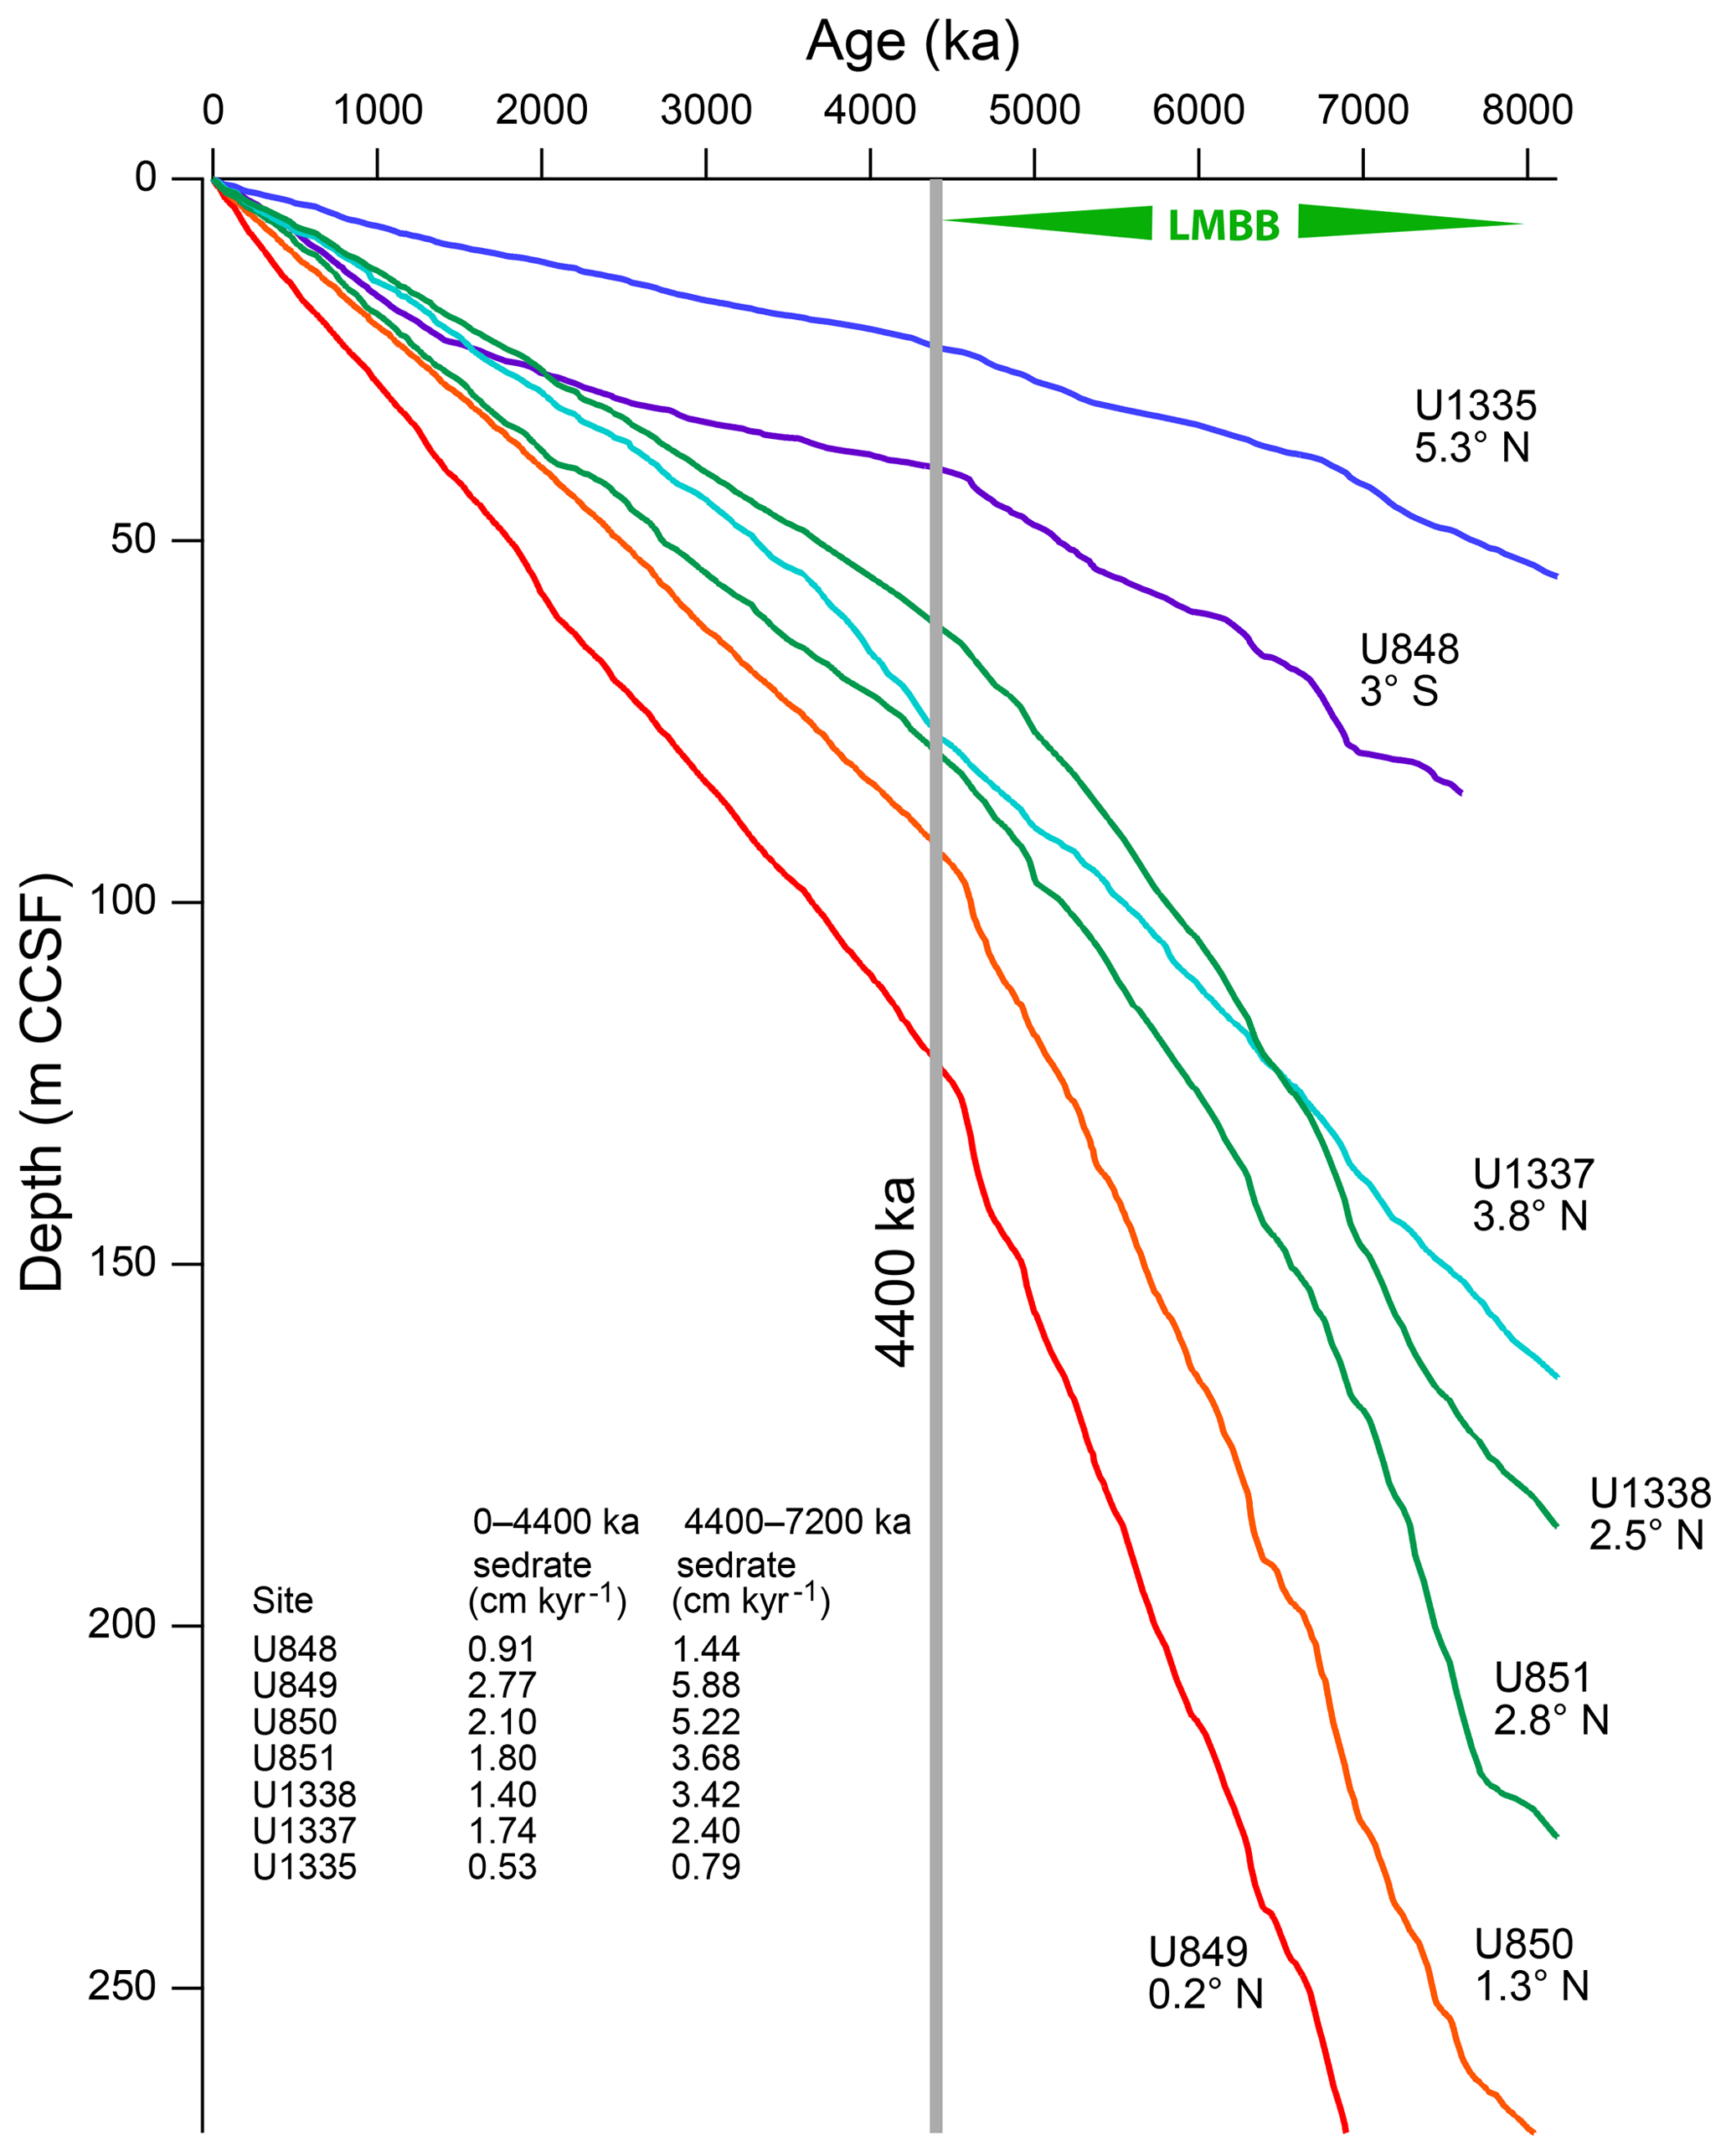
Figure 7Age–depth curves for ODP Leg 138 and sites 848, 849, 850, and 851 with IODP Expedition 320/321 sites U1335, U1337, and U1338, based on the age model in this paper. Steeper slopes represent faster sedimentation rates. Steepest slopes are found at sites that are nearest to the high productivity equatorial upwelling zone. Average sedimentation rates for the section younger than 4400 ka and for rates between 7200 ka (base of XRF section scanned in site 849) and 4400 ka are tabulated. The break in sedimentation at the gray line at 4400 ka marks the end of the LMBB. CCSF (composite coring depth below sea floor) is the depth within the continuous spliced sediment section.
Despite additional sediment compaction and the shorter total time span within the older interval (3.5 versus 4.5 Myr), the thickness of sediment section deposited during the 8–4.5 Ma time interval from many eastern Pacific drill sites is often more than that deposited in the 4.5–0 Ma interval. Since the sediments are primarily biogenic in origin, high ratios reflect high productivity in the LMBB. During the LMBB the largest ratios are found in the region from roughly 88 to 120∘ W, just north of the modern Equator (orange shading in Fig. 1). Factoring in Pacific plate motion, these sites were at the Equator around 6–7 Ma. East of the Galápagos Islands, sites have higher biogenic sedimentation after the LMBB, so the LMBB has a regional expression.
The cause of the variability during the LMBB needs further investigation and documentation. Many regions worldwide have intervals of high production in the late Miocene and early Pliocene, which may have a common cause. Globally, high biogenic deposition in the Indian Ocean, North Pacific and southwest Pacific, and the Benguela upwelling zone define a proposed global late Miocene production interval (Farrell et al., 1995; Filipelli, 1997; Dickens and Owen, 1999; Diester-Haass et al., 2002; Grant and Dickens, 2002).
High biogenic burial is common within the late Miocene but the timing varies significantly between regions. Dickens and Owen (1999) propose that upwelling in the Indian Ocean was high between 9 and 3.5 Ma but most intense between 6 and 5 Ma. Dickens and Barron (1997) recognized an interval of high pennate diatom deposition between 5.9 and 5.0 Ma in the subarctic North Pacific and noted that the timing matched pennate diatom layer deposition in the equatorial Pacific (Kemp and Baldauf, 1993). Highest biogenic deposition in the Benguela Current region also occurred in the period between 7 and 4.5 Ma (Diester-Haass et al., 2002). Within the Expedition 320/321 sites and the ODP Leg 138 sites along the 110∘ W transect, there are also high but variable biogenic MARs between ∼8 Ma and the end of PPLC-5 at 4.47 Ma that indicate high primary production. The highest biogenic deposition in the eastern equatorial Pacific was between 7 and 6.5 Ma. Broadly, there is high biogenic production and burial in the late Miocene after 8 Ma.
Hypotheses to the cause of high primary productivity vary. Filipelli (1997) proposed that the uplift of the Himalayas (Molnar et al., 1993) and late Miocene intensification of the Asian monsoon caused higher weathering and larger transport of nutrients to the oceans. Diester-Haass et al. (2002) suggested that reorganization of ocean circulation is likely to have played an important role, as well as intensification of trade winds. Recent reconstructions of Himalayan uplift and development of the Asian monsoon have found that much of the uplift occurred prior to the late Miocene, weakening the weathering hypothesis (Tada et al., 2016).
Higher biogenic deposition within the equatorial Pacific broadly occurred within the late Miocene but also extends through the Pliocene in the easternmost equatorial Pacific (Fig. 8). Million-year increments of CaCO3 MAR and noncarbonate (mostly bio-SiO2) MAR are shown from drill sites in the equatorial zone from near the 81∘ W longitude of the coast of Ecuador to almost 120∘ W, halfway to Hawaii. For all but the easternmost part of the equatorial transect, high CaCO3 MAR is confined within the time frame of the LMBB. However, east of about 100∘ W on the Nazca Plate, the bio-SiO2 deposition is much higher in the Pliocene and Pleistocene, as shown by the increased noncarbonate (mostly bio-SiO2) MAR post-LMBB.
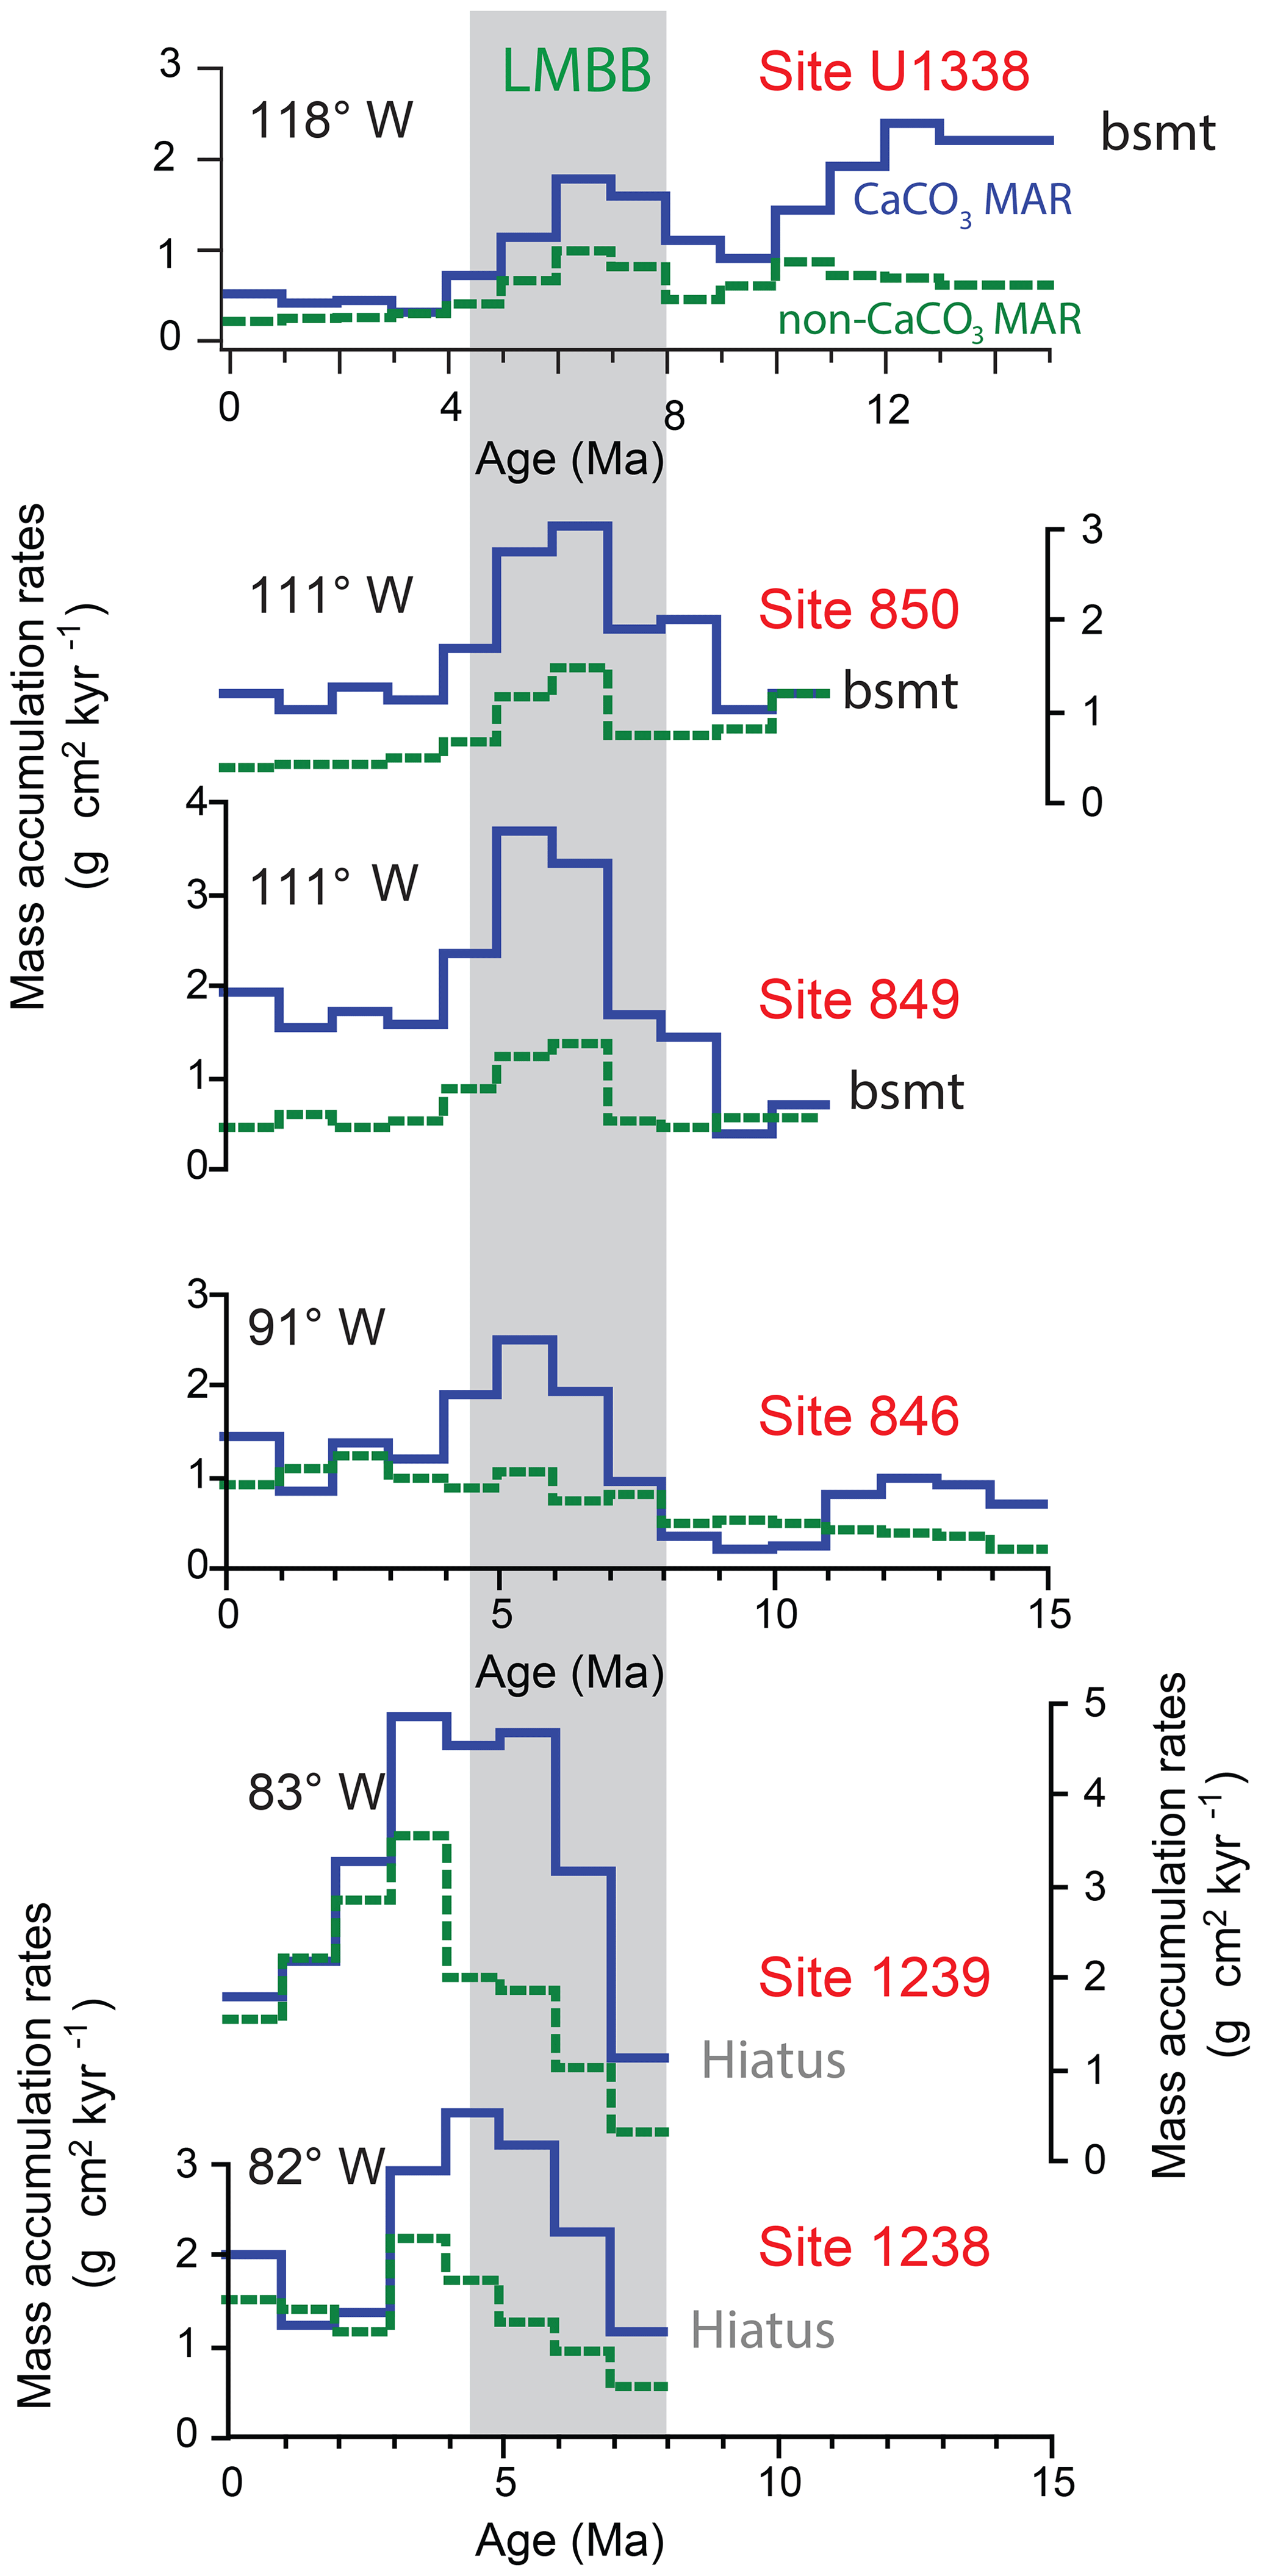
Figure 81 Myr increments of CaCO3 MAR (blue lines) and non-CaCO3 MAR (dashed green lines) on a longitudinal equatorial transect from 118 to 82∘ W, near Ecuador. Non-CaCO3 deposition is mostly biogenic silica at these drill sites. Basement is marked by “bsmt”. Data for U1338 are from this paper, while the other data are from ODP Leg 202 Shipboard Scientific Party (2003). The 8–4.5 Ma LMBB window is shaded. The end of peak CaCO3 deposition is roughly 2 million years younger near South America than in the west. Eastern Pacific drill sites (sites 846, 1238, and 1239) have increased biogenic deposition post-LMBB, presumably because of nutrient concentration after the Central American Seaway closed.
A similar lack of a common pattern is found worldwide. Highest deposition in the eastern equatorial Pacific LMBB is in the region near the Equator between about 88 and 120∘ W (Fig. 1), and the highest MAR was at the beginning of the LMBB, around 7 Ma. Site 1085 within the Benguela Current has highest biogenic MAR at the end of the LMBB interval (Diester-Haass et al., 2002). Peak diatom deposition in the subarctic North Pacific occurred in the middle of the LMBB interval, between 6 and 5 Ma (Dickens and Owen, 1999; Dickens and Barron, 1997). And, in the California Current region, diatom deposition decreased offshore at the beginning of the LMBB (7.5 Ma) to become more confined to the coastal region, implying decreased overall bio-SiO2 deposition after 7.5 Ma (Barron et al., 2002).
Farrell et al. (1995) described the abrupt drop in biogenic deposition along the 110∘ W transect at the end of the LMBB but continued high deposition to the east. They proposed that the change was related to movement of biogenic depocenters resulting from Central American Seaway (CAS) closure. Sites drilled on the Carnegie Ridge by ODP Leg 202 support a major increase in biogenic sedimentation in the east associated with CAS closure (Fig. 8). CAS closure, being a tectonic process, took place over a long period of time (O'Dea et al., 2016). Initial shoaling of sea passages to around 1000 m depth (middle bathyal) occurred between 13 and 12 Ma (Duque-Caro, 1990), while the Caribbean and eastern Pacific stable isotopes became distinct after 4.2 Ma (Haug et al., 2001). The major terrestrial North American and South American terrestrial mammal exchange at about 2.6 Ma is generally used to mark CAS closure (O'Dea et al., 2016).
Both sites 1238 and 1239, near Ecuador, are situated on crust formed in the late early Miocene. Both essentially have a hiatus until ∼8 Ma (ODP Leg 202 Shipboard Scientific Party, 2003). Biogenic sedimentation at both sites 1238 and 1239 rapidly increased after 7 Ma, peaked between 3 and 5 Ma, and continued to remain high up to the Holocene. Apparently, the easternmost Pacific became more productive because of the formation of the Isthmus of Panama. Nevertheless, high levels of paleoproductivity found after 8 Ma worldwide suggest that regional production intervals are superimposed upon a global signal. Now that high-resolution records of biogenic deposition are available from the east-central Pacific, there is a need to revisit the timing of regional changes in biogenic deposition through the late Miocene globally.
5.2.2 Unraveling the driving force of equatorial productivity
When the LMBB and PPLC-2 are examined in detail, it is apparent that the dynamics of nutrient delivery to the equatorial Pacific cannot be ignored. Figure 4 shows the PPLC-2 interval from site 849; it is comparable to site 1240 in the Panama Basin (Povea et al., 2016) and site 846 (Lawrence et al., 2006). There is clearly an orbital periodicity at site 849, as well as depositional events on the < 1 kyr resolution of the XRF record.
Similarly, within the LMBB at the XRF-scanned intervals of site U1338 and site 849 there is high bio-SiO2 variability on the millennial scale based upon the XRF-estimated bio-SiO2 : clay ratio, providing evidence that long bio-SiO2 deposition intervals are made up of large numbers of individual bio-SiO2 deposition events. These deposition intervals correlate to the intervals where diatom mats have been found in the equatorial Pacific cores, around 4.2, 5.5, and 7.3 Ma (Fig. F23 in Pälike et al., 2010; Kemp and Baldauf, 1993). As mentioned previously, clay deposition within the LMBB is about the same as that through the Pliocene and Pleistocene (Fig. 7) so the elevated biogenic MARs do not result from higher dust fertilization but instead apparently result from interoceanic reorganization of nutrient inventories (Ziegler et al., 2008). The BaSO4 ∕ clay ratio (top of Fig. 6) illustrates the higher relative deposition of biogenic sediments to clay within the LMBB, evidence for nutrient reorganization.
High productivity intervals in the eastern Pacific result from a combination of factors. There appears to be elevated production globally within the LMBB, for example, indicating higher availability of nutrients in surface waters generally in the late Miocene. However, timing of intervals of high productivity depends on how the nutrients flow to different upwelling regions and provide insight into how the subsurface oceans have changed. The appearance of PPLC-2 and its strong expression to the east of our study (Lawrence et al., 2006; Povea et al., 2016) show that long intervals where the euphotic zone had better access to nutrients occurred well into the Pleistocene.
5.3 Monitoring changes in depth-dependent dissolution: eastern equatorial Pacific CCD versus CaCO3:BaSO4 ratio
The CCD is a common metric for variations in the carbon cycle over time. Unfortunately, changes in the CCD can be difficult to interpret because changes in CaCO3 production affect the CCD just as strongly as variations of abyssal dissolution. Early discussions of the Pacific CCD, for example, found that the depth to complete CaCO3 dissolution was deeper under regions of higher CaCO3 production at the Equator (Berger, 1973; van Andel and Moore, 1974). Without regional drill sites that span the CCD within the same production regime, it remains difficult to define CCD changes except in low resolution or for abrupt large CCD movements like at the Eocene–Oligocene boundary (Coxall et al., 2005; Pälike et al., 2012).
5.3.1 CaCO3 MAR to estimate changes in CCD
Lyle et al. (2005b) used the gradient in CaCO3 MAR with depth between drill sites to define changes in the Eocene CCD, where site depth is corrected for crustal cooling and sediment loading. Working backwards from CaCO3 burial (MAR) has many ambiguities; however, and local sedimentation anomalies at the drill sites used cause significant noise. For large changes as in the Eocene, the CaCO3 MAR gradient approach works but the weaker signal in the Pliocene and Pleistocene is hard to distinguish from the noise.
CaCO3 MAR at any given location and time can be represented as a combination of the net focusing, rain, and dissolution as in Eq. (1):
where the T subscript refers to time T, rain refers to the particulate CaCO3 arriving at the bottom from surface CaCO3 production, F is the sediment focusing factor, and D is the CaCO3 dissolution at the sea floor. The variation in D responds to the chemistry of the regional water mass and depth of the sea floor; regional variability is typically a depth function because of the large spatial scale of deep water masses. However, sediment focusing is locally variable and CaCO3 production typically has a smaller spatial scale than the scale of water masses that control dissolution. Production and sediment focusing are thus difficult to control for in order to solve for the dissolution component.
An ideal set of sites to isolate the dissolution component of the carbonate signal would have similar productivity but would be at different water depths. Assuming production and focusing have remained the same at both sites over time, the depth-dependent dissolution can be isolated. Dividing the change in CaCO3 MAR between the two sites by the difference in water depth between them in the past, corrected for depth change caused by crustal cooling and sedimentation (Lyle, 1997; also see Sect. S7), produces the drop in CaCO3 MAR per meter of water depth. Dividing the CaCO3 MAR at the deeper site by this gradient of CaCO3 MAR with water depth produces the additional depth needed to reduce the CaCO3 MAR to zero, marking the CCD. This was the approach of Lyle et al. (2005b) to determine changes in the Eocene CCD.
Two of the sites in this study (site 851 and site U1338) are now at roughly the same latitude throughout the last 5 million years and have similar modern particulate organic carbon (POC) standing stock from satellite estimates (58 mg m−3 POC at site 851; 57 mg m−3 POC at site U1338; NASA Goddard Space Flight Center, 2014). Site 851 is 446 m shallower than site U1338, Hypothetically, if relative sediment focusing at both sites remained constant and productivity changed coherently, the gradient in CaCO3 MAR from the deep site should extrapolate to zero CaCO3 MAR at the CCD. Relative sediment focusing over long time frames in the pelagic regime appears reasonably constant (Liao and Lyle, 2014; Mitchell and Huthnance, 2013) and current-related anomalies can be discerned from the seismic profiles from site surveys. Sites chosen for drilling were chosen for the lack of anomalous seismic character in both ODP Leg 138 and IODP Exp. 320/321. The CaCO3 MAR gradient using sites 851 and U1338 is noisy but general trends can be discerned (Fig. 3). The trends are consistent with trends in CaCO3 MAR and CaCO3:BaSO4 ratio as indicators of enhanced dissolution.
The CCD estimate using CaCO3 MAR appears noisy over longer time frames because of a combination of relatively high frequency changes (e.g., the 100 kyr cycles in the last million years) but also suffers from the noise resulting from building the trend with records from only two sites. Minor errors in correlation plus local changes in CaCO3 production or burial are magnified in the CCD estimate. For example, site U1338 occasionally had higher CaCO3 MAR than site 851, making a negative CCD gradient with depth. Negative trends result from either CaCO3 production anomalies relative to modern conditions or changes in sediment focusing. These intervals were removed from the CCD estimate (e.g., the gap in the record between 2000 and 2250 ka; Table S35).
Figure 3 also displays the Pälike et al. (2012) CCD change over this period, which was reconstructed at 250 kyr intervals. The average CCD depth is similar between Pälike et al. (2012) and the site 851 and site U1338 MAR CCD extrapolation but the Pälike et al. (2012) version has much smaller deviation of the CCD over time. Pälike et al. (2012) use a graphical technique to estimate the CCD where CaCO3 MAR is plotted versus paleodepth of each drill site. Site U1334 constrained the change of the CCD in the youngest part of the time interval. Ideally the sites used to constrain the CCD should be within a common depositional regime. Sites U1338 and 851 are within the equatorial regime at the time of the LMBB but site U1334, without CaCO3 at the time of LMBB deposition, was located at 6∘ N and in a region of much lower CaCO3 production in the surface waters. The low CaCO3 production at this distance from the Equator causes the local CCD to be much shallower than that at a site nearer high productivity (Berger, 1973). There are no drill sites in the equatorial region that pass through paleodepths of > 5000 m in the late Miocene.
The unsmoothed CCD records by the MAR method are very noisy so smoothing is necessary. Two levels of smoothing are used to make the CCD in Fig. 3: 50 and 750 kyr. The shorter time frame is adequate to show higher-resolution changes, while the latter captures the longer trends. It is clear from these records that the late Miocene–Holocene CCD has been strongly affected by changes in production. Since 8 Ma, the LMBB interval has the deepest CCD as well as the highest CaCO3 MAR at both sites U1338 and 851. The relative CaCO3 MAR between site 851 and site U1338 is especially noisy in the LMBB with frequent times when CaCO3 MAR was higher at the deeper site U1338. Nevertheless, it is likely that higher CaCO3 production over sites 851 and U1338 drove the eastern Pacific CCD to be deeper during this interval, even though we suspect the magnitude of CCD deepening.
The CCD starts to shallow beginning at ∼4800 ka as the LMBB was fading. The shallowest CCD determinations do not precisely align with the PPLC-4 intervals although PPLC-4 is contained within a broad CCD minimum, indicating both a response to lowered CaCO3 deposition and, as indicated by CaCO3:BaSO4 ratio, to increased dissolution. During PPLC-1, the low CaCO3 % is clearly averaged over broad variability in CaCO3 dissolution. Nevertheless, low CaCO3:BaSO4 ratio during the PPLC-1, -3, and -4 intervals also indicate that enhanced dissolution was an important factor in the low average CaCO3 % (Fig. 5).
5.3.2 CaCO3:BaSO4 ratio to define CaCO3 dissolution
Section 4.3 discusses how the CaCO3:BaSO4 ratio can be used as a site-specific indicator of dissolution. We found that there is a common signal to the CaCO3:BaSO4 variability at the four sites with XRF scanning profiles (Fig. 5). Standardizing the data to units of standard deviation from the site mean better illustrates the common signal among all the sites where Ba data are available (Fig. 5b). The PPLC-3 and PPLC-4 intervals clearly have lower average CaCO3:BaSO4 ratios at sites U1335, U1337, U1338, and 849. These sites span from the Equator to more than 5∘ N and are up to 1900 km apart. The common dissolution record thus covers a significant portion of the east-central Pacific. Lowest CaCO3:BaSO4 ratios are found in PPLC-4c and -4a, also shown by lower CaCO3 MAR than in other intervals (Fig. 3). BaSO4 MAR during PPLC-4c and -4a are relatively high so dissolution must have outpaced somewhat higher CaCO3 production relative to stratigraphic intervals on either side (See Tables S17 to S21). The difference between the CCD change and the CaCO3:BaSO4 ratio probably results from the added CaCO3 rain within PPLC-4. Similarly, PPLC-2 has relatively high CaCO3 dissolution but not enough to make a CaCO3 MAR minimum during the interval. The LMBB exhibits major intervals of high relative CaCO3 deposition, although significant dissolution intervals appear at ∼5810 and ∼5350 ka and prior to 7500 ka (Fig. 5). The high CaCO3:BaSO4 ratios in the LMBB broadly match the deep CCD in Fig. 3.
The dissolution anomalies cover a large regional extent as expected from the large regional extent of deep water masses. PPLC-3a and -3b are very consistent across the set of drill sites, and mark dissolution on either side of a distinctive CaCO3:BaSO4 maximum all occurring as the Northern Hemisphere glaciations began.
5.4 Early beginnings of Pleistocene 100 kyr CaCO3 cyclicity
Both the CaCO3 % and the CaCO3:BaSO4 ratio records illustrate the development of 100 kyr deep Pacific dissolution cyclicity (Figs. 2 and 5). Surprisingly, the 100 kyr dissolution cyclicity began significantly before they strengthened towards the end of the mid-Pleistocene transition at ∼900 ka, at which time 100 kyr benthic oxygen isotope cycles became prominent. The dissolution cycles isolated by CaCO3:BaSO4 ratios begin at about 1900 ka (Fig. 9a) and build in amplitude until MIS 16 at 655 ka. High CaCO3 preservation is associated with periods of higher ice volume since about 1700 ka (MIS 58).
The appearance of 100 kyr power can also be tracked via wavelet time series of the stacked CaCO3:BaSO4 record (Fig. 9b). Strong power is found at 100 kyr from 1900 ka going forward in time and in the brief interval between PPLC-3a and -3b. Relatively strong 41 kyr power is also apparent associated with the 100 kyr cycles since 1900 ka, and strong 41 kyr power is found at the end of the LMBB.
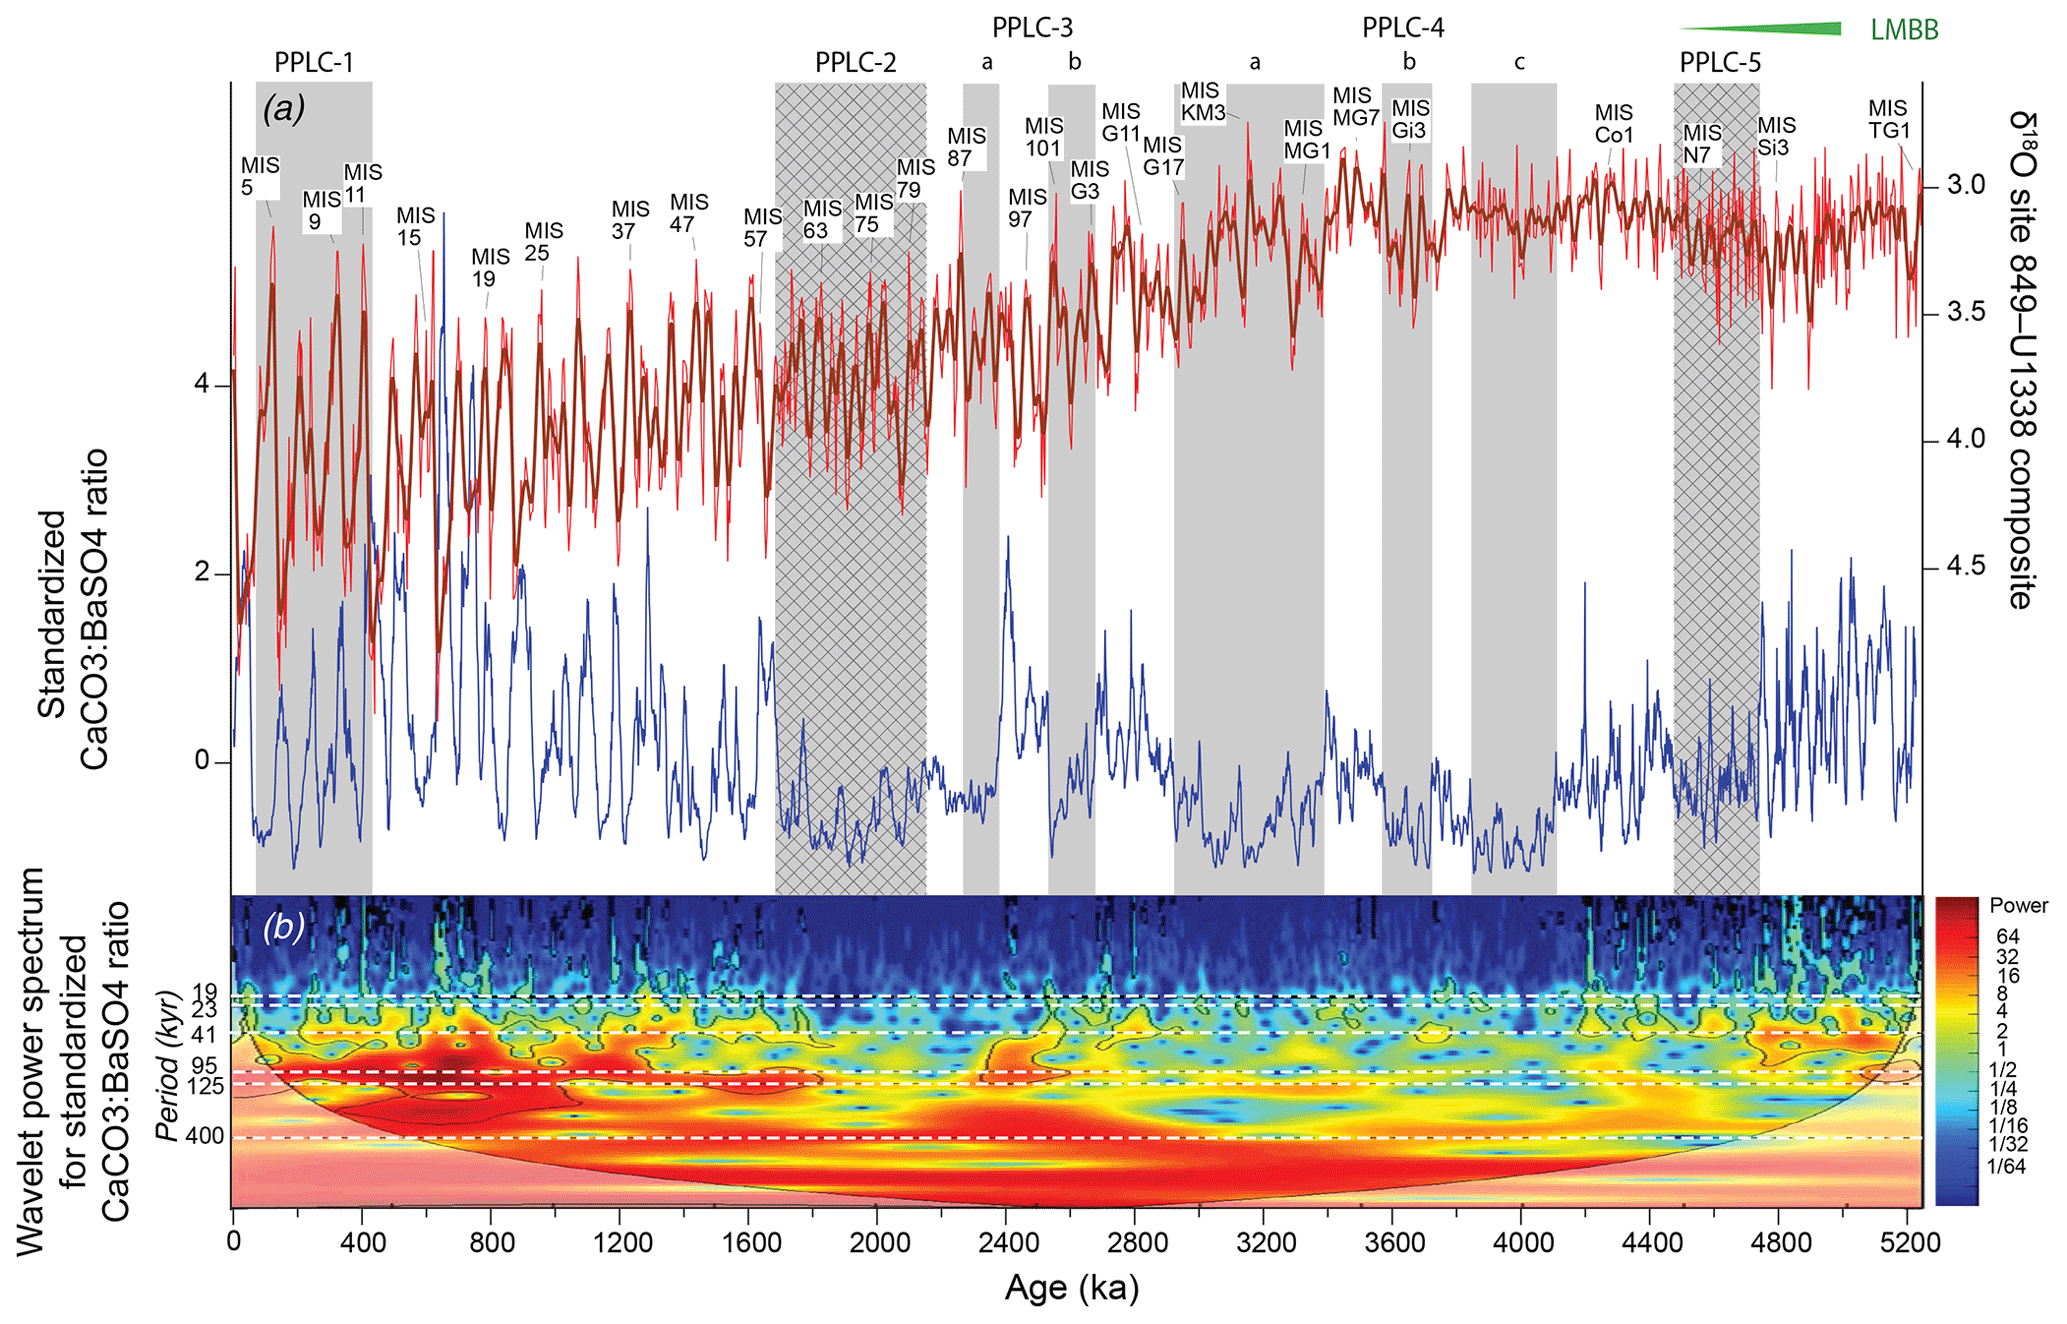
Figure 9(a) A comparison of the stacked CaCO3:BaSO4 record of dissolution cycles (blue line) to the combined U1338–849 benthic oxygen isotope record (red and brown lines). The thick brown line on the oxygen isotope record is a seven-point binomial smooth of the data. A strong 100 kyr periodicity to the dissolution cycle begins roughly at MIS 58 with low dissolution associated with periods of high benthic δ18O (high ice volume). Before MIS 58, the association is less clear. (b) Wavelet analysis of the CaCO3:BaSO4 ratio stack, showing 400 kyr power throughout the CaCO3:BaSO4 record and development of 100 kyr power in the interval beginning about 1800 ka and continues to the Holocene.
The early appearance of 100 kyr CaCO3 dissolution cycles in the equatorial Pacific is interesting but problematic. There is a tendency even within the δ18O 41 kyr world for high CaCO3 preservation to be associated with periods of heavier-than-average oxygen isotope cycles, and presumably cooler high-latitude regions. Figure 9a compares the CaCO3:BaSO4 combined stack, where a high value indicates better CaCO3 preservation, to the combined site 849–site U1338 isotope record.
When both oxygen isotopes and CaCO3:BaSO4 have strong 100 kyr cycles (1000–0 ka), it is very clear that high CaCO3 preservation is associated with glacial heavy isotope intervals. In the interval from 1000–1650 ka (MIS 25–59), that correlation is still strong when CaCO3:BaSO4 is compared to the smoothed oxygen isotope record. The correlation is weaker before 1600 ka but between 2400 and 2600 ka the high CaCO3 preservation interval between PPLC-3a and -3b is also characterized by a heavy oxygen isotope signal.
The 100 kyr CaCO3 cycles that appear in the Pacific could also appear in the deep Atlantic if there is cyclic weathering or variability in NADW formation. Unfortunately, there are few CaCO3 records for the Atlantic Ocean that cover the period between 1 and 2 Ma. Ruddiman et al. (1989) have a CaCO3 profile from site 607 at a depth of 3426 m b.s.l. Because it is shallow relative to Antarctic Bottom Water (AABW) in the Atlantic, it is unlikely to be affected by dissolution and instead appears to be affected by changes in clay deposition over glacial–interglacial cycles (Broecker, 1971; Bacon, 1984). The CaCO3 % record at site 607 changes from 41 to 100 kyr cyclicity at ∼900 kyr, like the δ18O record.
Harris et al. (1997) developed a CaCO3 dissolution index for the Ceara Rise and found that dissolution affected the CaCO3 records below a depth of 4356 m b.s.l. The index compared CaCO3 MARs at the deep site 929 to the shallow site 925 and found coherence with the oxygen isotope record of ice volume for the last million years. However, 100 kyr coherence was not very strong in the 1–2 Ma period. Since the dissolution record at the Ceara Rise primarily reflects oscillations in the penetration of AABW versus NADW around Ceara Rise, changes in NADW flow do not cause the Pacific oscillation. The differences between the Atlantic and Pacific CaCO3 records imply the development of oscillations in deep storage of DIC in the Pacific but little communication of this oscillation between ocean basins before the 900 ka mid-Pleistocene climate transition. The lack of strong cycles at the Ceara Rise may actually be caused by relatively strong NADW formation in the Atlantic prior to 1 Ma and but weakening NADW production and the development of NADW cyclicity only after the mid-Pleistocene climate transition (Kleiven et al., 2003).
For the 2.6 million years of the Pleistocene, we observe an important linkage between CaCO3 preservation and higher ice volume. Farrell and Prell (1989) have argued for a change in carbonate ion concentration variability of about 6 % to drive the glacial–interglacial cycles since 800 ka. Hodell et al. (2001) have argued that the Indo-Pacific association of high CaCO3 burial with glacials is evidence for cycles driven by shelf–basin fractionation of carbonate burial. During high sea level stands, the additional burial of CaCO3 on shallow tropical shelves reduces deep CaCO3 burial, while exposure of these shelves during glacials transfers CaCO3 burial to the deep ocean and also consumes atmospheric CO2 through carbonate weathering. The correlation that we observe between higher CaCO3:BaSO4 and heavy oxygen isotopes is supportive of a primary control of deep CaCO3 burial by shelf–basin transfer through the Pleistocene with ocean circulation transferring the signal mostly to the Pacific.
5.5 Origins of PPLC-4 and the Pliocene temperature maximum
Pleistocene changes in dissolution are adequately explained by shelf–basin fractionation but the Pliocene PPLC-4 dissolution series requires additional factors. Most of PPLC-4 is associated with lower-frequency dissolution variability prior to 2600 ka (Figs. 5 and 9) and the PPLC-4 intervals are also marked by extreme lows in CaCO3 MAR (Fig. 3).
PPLC-4 occurs during the final closure of the CAS (O'Dea et al., 2016), which might link closure and the extreme dissolution. Bell et al. (2015) suggest that NADW formation was strong prior to CAS closure and largely unaffected by changes in CAS geometry. Furthermore, they propose that the circulation effects of closure developed prior to 4 Ma. It does not appear that PPLC-4 dissolution is linked to flushing the Atlantic with NADW.
Poore et al. (2006) have proposed that the deep sill at the Greenland–Scotia Ridge between 6000 and 2000 ka caused a radical increase in volume of Northern Component deep water production, based upon strong δ13C gradients between the North Atlantic, Southern Ocean, and Pacific. Such an increase should increase basin–basin fractionation of CaCO3 burial between the Atlantic and Pacific. However, PPLC-4 also occurs immediately after the end of the LMBB, marking a major drop in biogenic CaCO3 rain regionally in the Pacific, and is also a period of high estimated atmospheric CO2 (Seki et al., 2010; Stap et al., 2016). PPLC-4 occurs during an interval of warm tropical sea surface temperature (SST) after the SST minimum at 5.4 Ma (Herbert et al., 2016). In other words, many important changes in the global biogeochemical cycles and global climate occurred at the time of PPLC-4, and it is as yet unclear how much these changes are related to CAS closure.
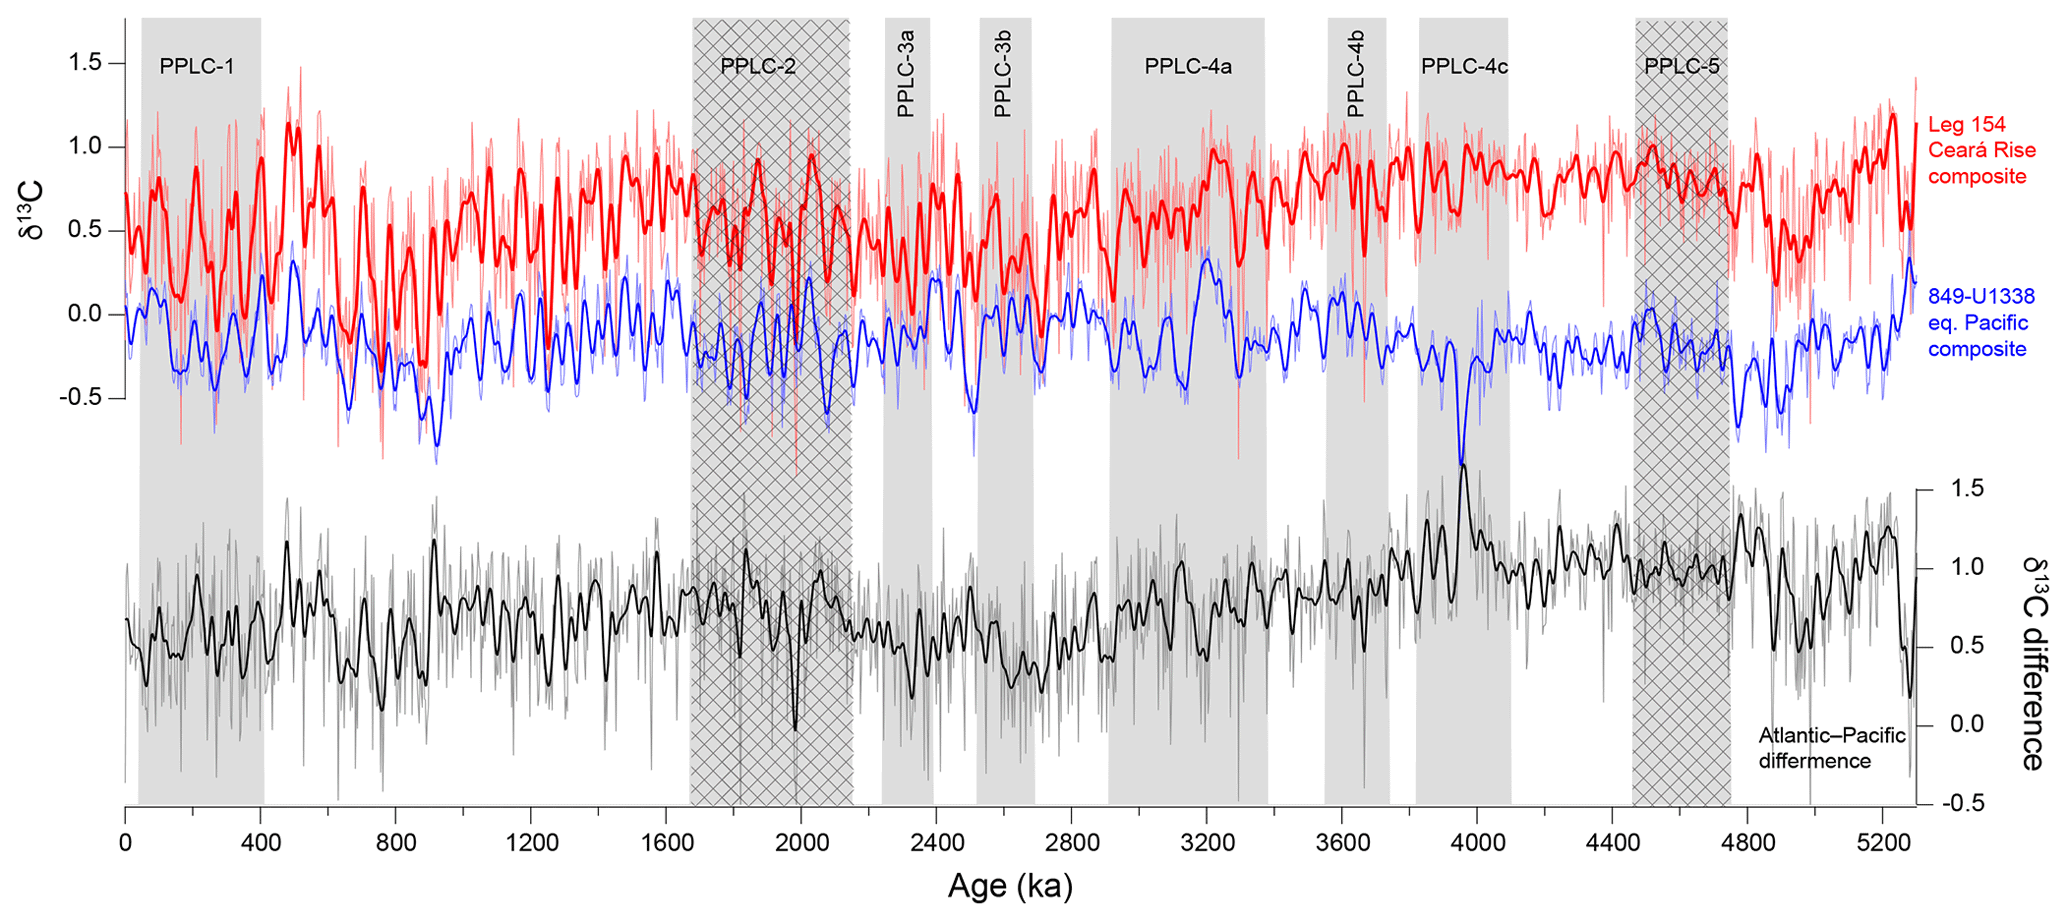
Figure 10δ13C records from Ceara Rise (Atlantic, red) and the site 849–U1338 composite (Pacific, blue), and the Atlantic–Pacific δ13C difference (black). The PPLC-4 dissolution interval falls on the period of decline of the Atlantic Pacific difference caused by a decrease in Atlantic δ13C of about 0.7 ‰ between 4000 and 2500 ka and an increase in Pacific δ13C of about 0.4 ‰ over the same interval.
Nevertheless, it is possible to say that during the early Pliocene the Atlantic was preferentially flushed of DIC, making positive δ13C in the Atlantic in contrast to the more negative δ13C in the Pacific. Between 4 and 2.5 Ma, however, the gradient between Atlantic and Pacific gradually weakened (Fig. 10), indicating penetration of low δ13C waters from the Antarctic-controlled deep circulation into the Atlantic. The slow rise of δ13C in the Pacific could result from a relatively high flux of Northern Component Water into the Antarctic, flowing toward the Southern Ocean shallower than the northerly Antarctic abyssal flow below it. The global SST warm transient between ∼5.4 to 3 Ma (Herbert et al., 2016), as well as evidence for elevated atmospheric CO2, suggests an important perturbation of the carbon cycle. The SST perturbation is also reflected in the bulk and planktonic foraminiferal stable isotopes at sites U1338 and 573 (Reghellin et al., 2015; Drury et al., 2018). At site 1241 on the Cocos Ridge, northeast of the sites in this paper, records of temperature and biogenic MAR find the interval between 5.4 and 3 Ma to be unusually warm but with relatively low biogenic production when compared to the LMBB (Seki et al., 2012).
The movement of the equatorial Pacific locus of high biogenic deposition from the east-central equatorial Pacific to east of the Galápagos Islands (Fig. 1; Farrell et al., 1995; Lawrence et al., 2006) may have triggered PPLC-4 by removing CaCO3 rain from the region west of the Galápagos Islands that had until then supported higher CaCO3 burial at the sea floor. However, low CaCO3 MAR apparently marks the PPLC-4 interval in the easternmost Pacific as well (sites 846 and 847; Farrell et al., 1995) and gives evidence that moving the locus of production is not the primary cause for PPLC-4.
Bell et al. (2015) have given a good summary of stable isotopes in the Atlantic and far South Atlantic, which they compared to site 849. Sites U1338 and U1337 have virtually the same δ13C signature as site 849 (Drury et al., 2016, 2017; Tian et al., 2018) so site 849 is representative of an east-central Pacific deep water signal. The trend in the Pacific δ13C time series rises somewhat between 5 and 3.6 Ma but the trend toward higher δ13C stops around then (Fig. 10). During the period between 4.4 and 4.2 Ma, the southernmost South Atlantic sites (site 704) became isotopically heavier and more like the North Atlantic, and were interpreted to indicate deep expansion of the NADW tongue and somewhat stronger NADW flow during the warm Pliocene (Hodell and Venz-Curtis, 2006; Bell et al., 2015). After 4 Ma, expansion of an Antarctic source that better mixed Atlantic and Pacific signals penetrated more effectively into both the Atlantic and Pacific to make the Atlantic isotopically lighter and the Pacific heavier. Similarly, Klevenz et al. (2008) interpreted Nd isotopes and Cd/Ca on Walvis Ridge to indicate that the Antarctic endmember signal reached a local minimum around 3.5–4 Ma and concluded that NADW flow was highest then. We suggest that the more thorough exchange of Pacific deep water after 3.5 Ma helped to increase deep dissolution in the Atlantic and enhanced Atlantic 100 kyr cyclicity that was beginning to occur in the Pacific.
In the absence of conclusive evidence, we suggest that the enhanced dissolution in PPLC-4 marks the effects of enhanced Antarctic flow within the deep Pacific and a larger reservoir of low [CO3]2− water in the deep ocean between 4.1 and 2.9 Ma. Sites U1337, U1338, and 849 all are sites within the mixing zone of Pacific deep water outflow with relatively weak deep flow from the Antarctic, at least compared to the western Pacific. The lack of strong change in δ13C, despite apparent increases in Antarctic influence worldwide, suggests continued deep DIC storage in the Pacific. Since the period between 5 and 3.5 Ma was also warm (Herbert et al., 2016), there may also be feedback from the carbon cycle as well as enhanced shelf storage of CaCO3 from high sea levels reducing deep CaCO3 burial. However, sea levels were relatively high for millions of years prior to the 4–3 Ma period of PPLC-4 (Rohling et al., 2014; Miller et al., 2005), so the sea level effect should not have been large.
We have developed site-to-site correlations at the meter scale and a composite age model for seven ODP and IODP drill sites from the eastern equatorial Pacific in order to study the evolution of eastern equatorial Pacific sedimentation. This fulfills one of the objectives of the Pacific Equatorial Age Transect and the high-resolution stratigraphy provides a foundation that should benefit future regional studies.
We identified five long-term low-CaCO3 intervals within the seven drill sites we investigated: PPLC-5 (4737–4465 ka), PPLC-4 (three intervals between 4093 and 2915 ka), PPLC-3 (two intervals on either side of a CaCO3 high, between 2684 and 2248 ka), PPLC-2 (2135–1685 ka), and PPLC-1 (402–51 ka). With bulk chemical data and the geographic range of the investigated drill sites, it is possible to distinguish between dissolution and production as causes of low-CaCO3 intervals in the Pliocene–Pleistocene record. We found that PPLC-5 and PPLC-2 result from CaCO3 dilution through diatom production and the other three result from enhanced CaCO3 dissolution.
The magnitude of CaCO3 dissolution can be described by changes in the CCD. However, local and regional variability in sedimentation makes the CCD method only useful for intervals of large carbon cycle change and/or low time resolution. The ratio CaCO3:BaSO4 makes it possible to study dissolution at an individual drill site. We used this ratio to show that 100 kyr dissolution cycles were regionally strong by 1600 ka in contrast to oxygen isotopes which did not develop 100 kyr cyclicity until ∼1000 ka. We also used CaCO3:BaSO4 ratios to confirm that the highest CaCO3 dissolution occurred in PPLC-4, between 4.1 and 2.9 Ma.
It is possible that PPLC-4 resulted from closure of the CAS but there are complicating factors like the shift of the locus of CaCO3 burial eastward in the Pacific at the end of PPLC-5, the last high deposition interval of the LMBB. High flushing of the Atlantic basin is indicated by the Atlantic–Pacific δ13C gradient but the gradient was actually weakening in the 4–3 Ma interval suggesting more Antarctic DIC storage or more total DIC in the ocean. New work concludes that atmospheric CO2 was declining in this interval as well (Stap et al., 2016) and is also associated with the decline, but global SST was still high (Herbert et al., 2016). The multiple changes in climate and carbon cycle indicators show that significant reorganizations were occurring in the early Pliocene despite a relatively stable ice volume indicated by benthic oxygen isotopes. The data we have presented here suggest that regional changes are strong and will be critical to understand the transition to the beginning of Northern Hemisphere glaciation.
All data for this paper are available in the Supplement as well as at PANGAEA (https://doi.org/10.1594/PANGAEA.904489, Lyle et al., 2019) as the PDI-21251 data set.
The supplement related to this article is available online at: https://doi.org/10.5194/cp-15-1715-2019-supplement.
ML provided XRF data and calculations of CaCO3 from bulk density. AJD and TW provided stable isotope data and tuned age models. JT provided additional stable isotope data to improve the age model. RW and JT provided splices for the IODP Expedition 321 drill sites, while RW checked and revised splices for the ODP Leg 138 drill sites. ML and AJD wrote most of the original text while all authors participated in the revisions.
The authors declare that they have no conflicts of interest.
We thank all the members of IODP Expedition 320/321 and those from ODP Leg 138 (scientists, technicians, drillers, and ships' crew) who collected the basic information and sediments needed for this study.
Mitchell Lyle was funded by the National Science Foundation, grants OCE-0962184 and OCE-1656960. Thomas Westerhold and Anna Joy Drury were funded by the Deutsche Forschungsgemeinschaft (DFG) grants WE5479-1 and WE5479-3, and Anna Joy Drury was a postdoctoral researcher in Heiko Pälike's ERC Consolidator Grant EARTHSEQUENCING (grant agreement 617462). Jun Tian was funded by the National Science Foundation of China (grant nos. 41525020, 41776051) and the Program of Shanghai Subject Chief Scientist (A type) (16XD1403000).
This paper was edited by Luc Beaufort and reviewed by Daniele Reghellin and one anonymous referee.
Bacon, M. P.: Glacial to interglacial changes in carbonate and clay sedimentation in the Atlantic Ocean estimated from 230Th measurements, Isotope Geoscience, 2, 97–111, 1984.
Balakrishnan Nair, T. M., Ittekkot, V., Shankar, R., and Guptha, M. V. S.: Settling barium fluxes in the Arabian Sea: Critical evaluation of relationship with export production, Deep-Sea Res. Pt. II, 52, 1930–1946, https://doi.org/10.1016/j.dsr2.2005.06.003, 2005.
Barron, J., Lyle, M., and Koizumi, I.: Late Miocene and early Pliocene biosiliceous sedimentation along the California margin, Rev. Mex. Cienc. Geol., 19, 161–169, 2002.
Bell, D. B., Jung, S. J. A., Kroon, D., Hodell, D. A., Lourens, L. J., and Raymo, M. E.: Atlantic deep-water response to the early Pliocene shoaling of the Central American Seaway, Sci. Rep., 5, 12552, https://doi.org/10.1038/srep12252, 2015.
Berger, W. H.: Biogenous deep-sea sediments: fractionation by deep-sea circulation, Geol. Soc. Am. Bull., 81, 1385–1402, 1970.
Berger, W. H.: Cenozoic sedimentation in the eastern tropical Pacific, Geol. Soc. Am. Bull., 84, 1941–1954, 1973.
Bloomer, S. F. and Mayer, L. A.: Core-log-seismic integration as a framework for determining the basin-wide significance of regional reflectors in the eastern equatorial Pacific, Geophys. Res. Lett., 24, 321–334, 1997.
Boudreau, B. P., Middelburg, J. J., and Meysman, F. J. R.: Carbonate compensation dynamics, Geophys. Res. Lett., 37, L03603, https://doi.org/10.1029/2009GL041847, 2010.
Broecker, W. S.: Calcite accumulation rates and glacial to interglacial changes in oceanic mixing, in: The Late Cenozoic Glacial Ages, edited by: Turekian, K. K., Yale University Press, New Haven, Connecticut, 239–265, 1971.
Channell, J. E. T., Ohneiser, C., Yamamoto, Y., and Kesler, M. S.: Oligocene-Miocene magnetic stratigraphy carried by biogenic magnetite at sites U1334 and U1335 (equatorial Pacific Ocean), https://doi.org/10.1029/2012GC004429, Geochem. Geophy. Geosy., 14, 265–282, 2013.
Chuey, J. M., Rea, D. K., and Pisias, N. G.: Late Pleistocene paleoclimatology of the central equatorial Pacific: a quantitative record of eolian and carbonate deposition, Quaternary Res., 28, 323–339, 1987.
Coxall, H. K., Wilson, P. A., Pälike, H., Lear C., and Backman, J.: Rapid stepwise onset of Antarctic glaciation and deeper calcite compensation in the Pacific Ocean, Nature, 433, 53–57, 2005.
Crowley, T. J.: Late Quaternary carbonate changes in the North Atlantic and Atlantic/Pacific comparisons, AGU Geophysical Monograph, 32, 271–284, 1985.
Di Lorenzo, E., Liguori, G., Schneider, N., Furtado, J. C., Anderson, B. T., and Alexander, M. A.: ENSO and meridional modes: A null hypothesis for Pacific climate variability, Geophys. Res. Lett., 42, 9440–9448, 2015.
Dickens, G. R. and Barron, J. A.: A rapidly deposited pennate diatom ooze in upper Miocene-lower Pliocene sediment beneath the North Pacific polar front, Mar. Micropaleontol., 31, 177–182, 1997.
Dickens, G. R. and Owen, R. M.: The latest Miocene-early Pliocene biogenic bloom: a revised Indian Ocean perspective, Mar. Geol., 161, 75–91, 1999.
Diester-Haass, L., Meyers, P. A., and Vidal, L.: The late Miocene onset of high productivity in the Benguela Current upwelling system as part of a global pattern, Mar. Geol., 180, 87–103, 2002.
Drury, A. J., John, C. M., and Shevenell, A. E.: Evaluating climatic response to external radiative forcing during the late Miocene to early Pliocene: New perspectives from eastern equatorial Pacific (IODP U1338) and North Atlantic (ODP982) locations, Paleoceanography, 31, 167–184, https://doi.org/10.1002/2015PA002881, 2016.
Drury, A. J., Westerhold, T., Frederichs, T., Tian, J., Wilkens, R., Channell, J. E. T., Evans, H., John, C. M., Lyle, M., and Röhl, U.: Late Miocene climate and time scale reconciliation: Accurate orbital calibration from a deep-sea perspective, Earth Planet. Sc. Lett., 475, 254–266, https://doi.org/10.1016/j.epsl.2017.07.038, 2017.
Drury, A. J., Lee, G. P., Gray, W. R., Lyle, M., Westerhold, T., Shevenell, A. E., and John, C. M.,: Deciphering the state of the late Miocene to early Pliocene equatorial Pacific, Paleoceanography and Paleoclimatology, 33, 246–263, https://doi.org/10.1002/2017PA003245, 2018.
Duque-Caro, H.: Neogene stratigraphy, paleoceanography and paleobiogeography in northwest South America and the evolution of the Panama Seaway, Palaeogeogr. Palaeocl., 77, 203–234, 1990.
Dymond, J. and Collier, R.: Particulate barium fluxes and their relationships to biological productivity, Deep-Sea Res. Pt. II, 43, 1283–1308, 1996.
Dymond, J., Suess, E., and Lyle, M.: Barium in deep-sea sediment: A geochemical proxy for paleoproductivity, Paleoceanography, 7, 163–181, 1992.
Farrell, J. W. and Prell, W. L.: Climatic change and CaCO3 preservation: an 800,000 year bathymetric reconstruction from the central equatorial Pacific Ocean, Paleoceanography, 4, 447–466, 1989.
Farrell, J. W. and Prell, W. L.: Pacific CaCO3 preservation and δ18O since 4 Ma: Paleoceanic and paleoclimatic implicatons, Paleoceanography, 6, 485–499, 1991.
Farrell, J. W., Raffi, I., Janecek, T. R., Murray, D. W., Levitan, M., Dadey, K. A., Emeis, K.-C., Lyle, M., Flores, J.-A., and Hovan, S.: Late Neogene sedimentation patterns in the eastern equatorial Pacific Ocean, in: Proceedings of the Ocean Drilling Program, Scientific Results, 138, 717–756, 1995.
Filipelli, G. M.: Intensification of the Asian monsoon and a chemical weathering event in the late Miocene-early Pliocene: Implications for late Neogene climate change, Geology, 25, 27–30, https://doi.org/10.1130/0091-7613(1997)025<0027:IOTAMA>2.3.CO;2, 1997.
Francois, R., Frank, M., Rutgers van der Loeff, M. M., and Bacon, M. P.: 230Th-normalization: an essential tool for interpreting sedimentary fluxes during the late Quaternary, Paleoceanography, 19, PA1018, https://doi.org/10.1029/2003PA000939, 2004.
Grant, K. M. and Dickens, G. R.: Coupled productivity and carbon isotope records in the southwest Pacific Ocean during the late Miocene-early Pliocene biogenic bloom, Palaeogeogr. Palaeocl., 187, 61–82, 2002.
Griffith, E. M. and Paytan, A.: Barite in the ocean–occurence, geochemistry and palaeoceanographic applications, Sedimentology, 59, 1817–1835, https://doi.org/10.1111/j.1365-3091.2012.01327.x, 2012.
Hagelberg, T. K., Pisias, N. G., Mayer, L. A., Shackleton, N. J., and Mix, A. C.: Spatial and temporal variability of late Neogene equatorial Pacific Carbonate: Leg 138, in: Proceedings of the Ocean Drilling Program, Scientific Results, 138, 321–336, 1995.
Harris, S. E., Mix, A. C., and King, T.: Biogenic and terrigenous sedimentation at Ceara Rise, western tropical Atlantic, supports Pliocene-Pleistocene Deep-water linkage between hemispheres, in: Proceedings of the Ocean Drilling Program, Scientific Results, 154, 331–345, 1997.
Haug, G. H., Tiedemann, R., Zahn, R., and Ravelo, A. C.: Role of Panama uplift on oceanic freshwater balance, Geology, 29, 207–210, 2001.
Haug, G. H., Ganapolski, A., Sigman, D. M., Rosell-Mele, A., Swann, G. E. A., Tiedemann, R., Jaccard, S. L., Bollman, J., Maslin, M. A., Leng, M. J., and Eglinton, G.: North Pacific seasonality and the glaciation of North America 2.7 million years ago, Nature, 433, 821–825, 2005.
Hautala, S. L.: The abyssal and deep circulation of the Northeast Pacific Basin, Prog. Oceanogr., 160, 68–82, https://doi.org/10.1016/j.pocean.2017.11.011,2018.
Hays, J. D., Saito, T., Opdyke, N. D., and Burckle, L. H.: Pliocene-Pleistocene sediments of the equatorial Pacific: Their paleomagnetic, biostratigraphic, and climatic record, Geol. Soc. Am. Bull., 80, 1481–1514, 1969.
Herbert, T. D., Lawrence, K. T., Tzanova, A., Peterson, L. C., Caballero-Gill, R., and Kelly, C. S.: Late Miocene global cooling and the rise of modern ecosystems, Nat. Geosci., 9, 843–847, https://doi.org/10.1038/NGEO2813, 2016.
Hodell, D. A., Charles, C. D., and Sierro, F. J.: Late Pleistocene evolution of the ocean's carbonate system, Earth Planet. Sc. Lett., 192, 109–124, 2001.
Holbourn, A., Kuhnt, W., Lyle, M., Schneider, L., Romero, O., and Andersen, N.: Middle Miocene climate cooling linked to intensification of eastern equatorial Pacific upwelling, Geology, 42, 19–22, https://doi.org/10.1130/G34890.1, 2014.
Honjo, S., Dymond, J., Collier, R., and Manganini, S. J.: Export production of particles to the interior of the equatorial Pacific Ocean during the 1992 EqPac experiment, Deep-Sea Res. Pt. II, 42, 831–870, 1995.
Hovan, S. A.: Late Cenozoic atmospheric circulation intensity and climatic history recorded by eolian deposition in the eastern equatorial Pacific Ocean, in: Proceedings of the Ocean Drilling Program, Scientific Results, 138, 615–627, 1995.
Johnson, G. C. and Toole, J. M.: flow of deep and bottom waters in the Pacific at 10∘ N, Deep-Sea Res. Pt. I, 40, 371–394, 1993.
Kemp, A. E. S. and Baldauf, J. G.: Vast Neogene laminated diatom mat deposits from the eastern equatorial Pacific Ocean, Nature, 362, 141–144, 1993.
Kleiven, H. F., Jansen, E., Curry, W. B., Hodell, D. A., and Venz, K.:, Atlantic Ocean thermohaline circulation changes on orbital to suborbital timescales during the mid-Pleistocene, Paleoceanography, 18, 1008, https://doi.org/10.1029/2001PA000629, 2003.
Klevenz, V., Vance, D., Schmidt, D. N., and Mezger, K.:Neodymium isotopes in benthic foraminifera: Core-top systematics and a down-core record from the Neogene south Atlantic, Earth Planet. Sc. Lett., 265, 571–587, https://doi.org/10.1016/j.epsl.2007.10.053, 2008.
Kochann, K. G. D., Holbourn, A., Kuhnt, W., Channell, J. E. T., Lyle, M. Shackford, J. K., Wilkens, R. H., and Andersen, N.: Eccentricity pacing of eastern equatorial Pacific carbonate dissolution cycles during the Miocene Climatic Optimum, Paleoceanography, 31, https://doi.org/10.1002/2016PA002988, 2016.
Lawrence, K. T., Liu, Z., and Herbert, T. D.: Evolution of the eastern tropical Pacific through Plio-Pleistocene glaciation, Science, 312, 79–83, https://doi.org/10.1126/science.1120395, 2006.
Liao, Y. and Lyle, M.: Late Miocene to Pleistocene sedimentation and sediment transport on the Cocos Ridge, eastern tropical Pacific Ocean, Mar. Geol., 355, 1–14, https://doi.org/10.1016/j.margeo.2014.05.007, 2014.
Lisiecki, L. E. and Raymo, M. E.: A Pliocene-Pleistocene stack of 57 globally distributed benthic δ18O records, Paleoceanography, 20, PA1003, https://doi.org/10.1029/2004PA001071, 2005.
Lovely, M. R., Marcantonio, F., Lyle, M., Ibrahim, R., Hertzberg, J. E., and Schmidt, M. W.: Sediment redistribution and grainsize effects on 230Th-normalized mass accumulation rates and focusing factors in the Panama Basin, Earth Planet. Sc. Lett., 480, 107–120, 2017.
Lyle, M.: Reconstructed geographic positions and water depths for Leg 167 drill sites, in: Proceedings of the Ocean Drilling Program, Initial Reports, Part 1, Leg167, https://doi.org/10.2973/odp.proc.ir.167.103.1997, 1997.
Lyle, M. and Backman, J.: Data Report: Calibration of XRF-estimated CaCO3 along the Site U1338 splice, Proceedings of the Integrated Ocean Drilling Program, 320/321, https://doi.org/10.2204/iodp.proc.320321.205.2013, 2013.
Lyle, M. and Baldauf, J.: Biogenic sediment regimes in the Neogene equatorial Pacific, IODP Site U1338: Burial, production, and diatom community, Palaeogeogr. Palaeocl., 433, 106–128, https://doi.org/10.1016/j.palaeo.2015.04.001, 2015.
Lyle, M., Mitchell, N. C., Pisias, N., Mix, A., Martinez, J. I., and Paytan, A.: Do geochemical estimates of sediment focusing pass the sediment test in the equatorial Pacific, Paleoceanography, 20, PA1005ß, https://doi.org/10.1029/2004PA001019, 2005a.
Lyle, M., Olivarez Lyle, A., Backman, J., and Tripati, A.: Biogenic sedimentation in the Eocene equatorial Pacific: the stuttering greenhouse and Eocene carbonate compensation depth, in: Proceedings of the Ocean Drilling Program, Scientific Results, Leg 199, 1–35, https://doi.org/10.2973/odp.proc.sr.199.219.2005, 2005b.
Lyle, M., Pälike, H., Nishi, H., Raffi, I., Gamage, K., Klaus, A., and the IODP Expeditions 320/321 Scientific Party: The Pacific Equatorial Age Transect, IODP Expeditions 320 and 321: Building a 50-Million-Year-Long Environmental Record of the Equatorial Pacific Ocean, Sci. Dril., 9, 4–15, https://doi.org/10.2204/iodp.sd.9.01.2010, 2010.
Lyle, M., Olivarez Lyle, A., Gorgas, T., Holbourn, A., Westerhold, T., Hathorne, E. C., Kimoto, K., and Yamamoto, S.: Data report: raw and normalized elemental data along the U1338 splice from X-ray Fluorescence scanning, Proceedings of the Integrated Ocean Drilling Program, 320/321, https://doi.org/10.2204/iodp.proc.320321.203.2012, 2012.
Lyle, M., Marcantonio, F., Moore, W. S., Murray, R. W., Huh, C.-A., Finney, B. P., Murray, D. W., and Mix, A. C.: Sediment size fractionation and sediment focusing in the equatorial Pacific: effect on 230Th normalization and paleoflux measurements, Paleoceanography, 29, 747–763, https://doi.org/10.1002/2014PA002616, 2014.
Lyle, M. W., Dadey, K., and Farrell, J. W. L.: The late Miocene (11–8 Ma) eastern Pacific carbonate crash: evidence for reorganization of deep water circulation by the closure of the Panama Gateway, Proceedings of the Ocean Drilling Program, Scientific Results, 138, 821–838, https://doi.org/10.2973/odp.proc.sr.138.157.1995, 1995.
Lyle, M. W., Drury, A. J., Tian, J., Wilkens, R. H., and Westerhold, T.: Supplemental Data for Climate of the Past article “Equatorial Pacific Carbonate cycles, 0-5 Ma: stratigraphy, dissolution, and paleoproductivity”, PANGAEA, https://doi.org/10.1594/PANGAEA.904489, 2019.
Ma, Z., Ravelo, A. C., Liu, Z., Zhou, L., and Paytan, A.: Export production fluctuations in the eastern equatorial Pacific during the Pliocene-Pleistocene: Reconstruction using barite accumulation rates, Paleoceanography, 30, https://doi.org/10.1002/2015PA002860, 2015.
Mantua, N. J., Hare, S. R., Zhang, Y., Wallace, J. M., and Francis, R. C.: A Pacific interdecadal climate oscillation with impacts on salmon production, B. Am. Meteorol. Soc., 78, 1069–1079, 1997.
Marcantonio, F., Lyle, M., and Ibrahim, R.: Particle sorting during sediment redistribution processes and the effect on 230Th-normalized mass accumulation rates, Geophys. Res. Lett., 41, 5547–5554, https://doi.org/10.1002/2014GL060477, 2014.
Mayer, L. A.: Deep-sea carbonates: acoustic, physical, and stratigraphic properties, J. Sediment. Petrol., 49, 819–836, 1979.
Mayer, L. A.: Extraction of high-resolution carbonate data for palaeoclimate reconstruction, Nature, 352, 148–150, 1991.
Mayer, L. A., Shipley, T. H., and Winterer, E. L.: Equatorial Pacific seismic reflectors as indicators of global oceanographic events, Science, 233, 761–764, 1986.
Mayer, L., Pisias, N., Janecek, T., et al.: Proc. ODP, Init. Repts., 138, College Station, TX (Ocean Drilling Program), https://doi.org/10.2973/odp.proc.ir.138.1992, 1992.
Miller, K. G., Kominz, M. A., Browning, J. V., Wright, J. D., Mountain, G. S., Katz, M. E., Sugarman, P. J., Cramer, B. S., Christie-Blick, N., and Pekar, S. F.: The Phanerozoic record of global sea-level change, Science, 310, 1293–1298, https://doi.org/10.1126/science.1116412, 2005.
Milliman, J. D. and Droxler, A. W.: Neritic and pelagic carbonate sedimentation in the marine environment: ignorance is not bliss, Geol. Rundsch., 85, 496–504, 1996.
Mitchell, N. C. and Huthnance, J. M.: Geomorphological and geochemical evidence (230Th anomalies) for cross-equatorial currents in the central Pacific, Deep-Sea Res. Pt. I, 178, 24–14, https://doi.org/10.1016/j.dsr.2013.04.003, 2013.
Mix, A. C., Pisias, N. G., Rugh, W., Wilson, J., Morey, A., and Hagelberg, T. K.: Benthic foraminifer stable isotope record from Site 849 (0–5 Ma): local and global climate change, in: Proceedings of the Ocean Drilling Program, Scientific Results, 138, 371–412, 1995.
Molnar, P.: Closing of the Central American Seaway and the Ice Age: A critical review, Paleoceanography, 23, PA2201, https://doi.org/10.1029/2007PA001574, 2008.
Molnar, P.: Comment (2) on ”Formation of the Isthmus of Panama” by O'Dea et al., Sci. Adv., 3, e1602320, https://doi.org/10.1126/sciadv.1602320, 2017.
Molnar, P., England, P., and Martinod, J.: Mantle dynamics, uplift of the Tibetan Plateau, and the Indian monsoon, Rev. Geophys., 31, 357–396, 1993.
Murray, R. W., Knowlton, C., Leinen, M., Mix, A., and Polsky, C. H.: Export production and carbonate dissolution in the central equatorial Pacific Ocean over the past 1 Myr, Paleoceanography, 15, 570–592, 2000.
NASA Goddard Space Flight Center: Ocean Ecology Laboratory, Ocean Biology Processing Group, Sea-viewing Wide Field-of-view Sensor (SeaWiFS) Particulate Organic Carbon Data; 2014 Reprocessing, NASA OB.DAAC, Greenbelt, MD, USA, https://doi.org/10.5067/ORBVIEW-2/SEAWIFS/L3B/POC/2014, 2014.
O'Dea, A. Lessios, H. A., Coates, A. G., Eytan, R. I., Restrepo-Moreno, S. A., Cione, A. L., Collins, L. S., de Queiroz, A., Farris, D. W., Norris, R. D., Stallard, R. F., Woodbourne, M. O., Aguilera, O., Aubry, M.-P., Berggren, W. A., Budd, A. F., Cossuol, M. A., Coppard, S. E., Duque-Caro, H., Finnegan, S., Gasparini, G. M., Grossman, E. L., Johnson, K. G., Keigwin, L. D., Knowlton, N., Leigh, E. G., Leonard-Pingel, J. S., Marko, P. B., Pyenson, N. D., Rachello-Dolmen, P., Soibelzon, E., Soibelzon, L., Todd, J. A., Vermeiz, G. J., and Jackson, J. B. C.: Formation of the Isthmus of Panama, Sci. Adv., 2, https://doi.org/10.1126/sciadv.1600883, 2016.
ODP Leg 202 Shipboard Scientific Party: Leg 202 summary, Proc. ODP, Init. Repts., 202: College Station, TX (Ocean Drilling Program), 1–145, https://doi.org/10.2973/odp.proc.ir.202.101.2003, 2003.
Olivarez Lyle, A. and Lyle, M.: Determination of biogenic opal in pelagic marine sediments: a simple method revisited, in: Proceedings of the Ocean Drilling Program, Initial Reports Volume 199, edited by: Lyle, M., Wilson, P. A., Janecek, T. R., et al., Ocean Drilling Program, College Station TX, https://doi.org/10.2973/odp.proc.ir.199.106.2002, 2002.
Opdyke, B. N. and Wilkinson, B. H.: Surface area control of shallow cratonic to deep marine carbonate accumulation, Paleoceanography, 3, 685–703, 1988.
Pälike, H., Nishi, H., Lyle, M., Raffi, I., Gamage, K., Klaus, A., and the Expedition 320/321 Scientists: Expedition 320/321 summary, Proc. IODP, 320/321, https://doi.org/10.2204/iodp.proc.320321.101.2010, 2010.
Pälike, H., Lyle, M., Nishi, H., Raffi, I., Ridgwell, A., Gamage, K., Klaus, A., Acton, G. D., Anderson, L., Backman, J., Baldauf, J., Beltran, C., Bohaty, S. M., Bown, P., Busch, W., Channell, J. E. T., Chun, C. O. J., Delaney, M., Dewangan, P., Dunkley Jones, T., Edgar, K. M., Evans, H., Fitch, P., Foster, G. L., Gussone, N., Hasegawa, H., Hathorne, E. C., Hayashi, H., Herrle, J. O., Holbourn, A., Hovan, S., Hyeong, K., Iijima, K., Ito, T., Kamikuri, S., Kimoto, K., Kuroda, J., Leon-Rodrigues, L., Malinverno, A., Moore Jr., T. C., Murphy, B. H., Murphy, D. P., Nakamura, H., Ogane, K., Ohneiser, C., Richter, C., Robinson, R., Rohling, E. J., Romero, O., Sawada, K., Scher, H., Schneider, L., Sluijs, A., Takata, H., Tian, J., Tsujimoto, A., Wade, B. S., Westerhold, T., Wilkens, R., Williams, T., Wilson, P. A., Yamamoto, Y., Yamamoto, S., Yamazaki, T., and Zeebe, R.: A Cenozoic record of the equatorial Pacific carbonate compensation depth, Nature, 488, 609–614, https://doi.org/10.1038/nature11360, 2012.
Peterson, L. C., Murray, D. W., Ehrmann, W. U., and Hempel, P.: Cenozoic carbonate accumulation and compensation depth changes in the Indian Ocean, in: Synthesis of Results from Scientific Drilling in the Indian Ocean, edited by: Duncan, R. A., Rea, D. K., Kidd, R. B., von Rad, U., and Weissel, J. K., Geophysical Monograph, 70, American Geophysical Union, Washington D.C., 311–331, 1992.
Poore, H. R., Samworth, R., White, N. J., Jones, S. M., and McCave, I. N.: Neogene overflow of Northern Component Water at the Greenland-Scotia Ridge, Geochem. Geophy. Geosy., 7, Q06010, https://doi.org/10.1029/2005GC001085, 2006.
Povea, P., Cacho, I., Moreno, A., Pena, L. D., Menendez, M., Calvo, E., Canals, M., Robinson, R. S., Mendez, F. J., and Flores, J.-A.: Atmosphere-ocean linkages in the eastern equatorial Pacific over the early Pleistocene, Paleoceanography, 31, https://doi.org/10.1002/2015PA002883, 2016.
Reghellin, D., Dickens, G. R., and Backman, J.: The relationship between wet bulk density and carbonate content in sediments from the eastern equatorial Pacific, Mar. Geol., 344, 41–52, 2013.
Reghellin, D., Coxall, H. K., Dickens, G. R., and Backman, J.: Carbon and oxygen isotopes of bulk carbonate in sediment deposited beneath the eastern equatorial Pacific over the last 8 million years, Paleoceanography, 30, 2015PA002825, https://doi.org/10.1002/2015PA002825, 2015.
Rohling, E. J., Foster, G. L., Grant, K. M., Marino, G., Roberts, A. P., Tamisiea, M. E., and Williams, F.: Sea-level and deep-sea-temperature variability over the past 5.3 million years, Nature, 508, 477–482, https://doi.org/10.1038/nature13230, 2014.
Roth, J. M., Droxler, A. W., and Kameo, K.: The Caribbean carbonate crash at the middle to late Miocene transition: linkage to the establishment of the modern global ocean conveyer, Proceedings of the Ocean Drilling Program, Scientific Results, 165, 249–273, https://doi.org/10.2973/odp.proc.sr.165.013.2000, 2000.
Ruddiman, W. F., Raymo, M. E., Martinson, D. G., Clement, B. M., and Backman, J.: Pleistocene evolution: Northern hemisphere ice sheets and North Atlantic Ocean, Paleoceanography, 4, 353–412, 1989.
Ryan, W. B. F. ,Carbotte, S. M., Coplan, J. O., O'hara, S., Melkonian, A., Arko, R., Weissel, R. A., Ferrini, V., Goodwillie, A., Nitsche, F., Bonczkowski, J., and Zemsky, R.: Global Multi-resolution topography synthesis, Geochem. Geophy. Geosy., 10, Q03014, 2009.
Seki, O., Foster, G. L., Schmidt, D. N., Mackenson, A., Kawamura, K., and Pancost, R. D.: Alkenone and boron-based Pliocene pCO2 records, Earth Planet. Sc. Lett., 292, 201–211, https://doi.org/10.1016/j.epsl.2010.01.037, 2010.
Seki, O., Schmidt, D. N., Schouten, S., Hopmans, E. C., Sininghe Damste, J. S., and Pancost, R. D.: Paleoceanographic changes in the eastern equatorial Pacific over the last 10 Myr, Paleoceanography, 27, PA3224, https://doi.org/10.1029/2011PA002158, 2012.
Shackford, J. K., Lyle, M., Wilkens, R., and Tian, J.: Data report: raw and normalized elemental data along the Site U1335, U1336, and U1337 splices from X-ray fluorescence scanning Proceedings of the Integrated Ocean Drilling Program, 320/321, https://doi.org/10.2204/iodp.proc.320321.216.2014, 2014.
Stap, L. B., de Boer, B., Ziegler, M., Bintanja, R., and Lourens, L. J.: CO2 over the past 5 million years: continuous simulation and new d11B-based proxy data, Earth Planet. Sc. Lett., 439, 1–10, https://doi.org/10.1016/j.epsl.2016.01.022, 2016.
Tada, R., Zheng, H., and Clift, P. D.: Evolution and variability of the Asian monsoon and its potential linkage with uplift of the Himalaya and Tibetan Plateau, Progress in Earth and Planetary Science, 3, https://doi.org/10.1186/s40645-016-0080-y, 2016.
Taylor, S. R. and McClennan,S. M. : The geochemical evolution of the continental crust, Rev. Geophys., 33, 241–265, 1995.
Tian, J., Ma, X., Zhou, J., Jiang, X., Lyle, M., Shackford, J. K., and Wilkens, R. : Paleoceanography of the east equatorial Pacific over the past 16 Myr and Pacific-Atlantic comparison: High resolution benthic foraminiferal δ18O and δ13C records at IODP Site U1337, Earth Planet. Sc. Lett., 499, 185–196, https://doi.org/10.1016/j.epsl.2018.07.025, 2018.
Tominaga, M., Lyle, M., and Mitchell, N. C.: Seismic interpretation of pelagic sedimentation regimes in the 18–53 Ma eastern equatorial Pacific: Basin-scale sedimentation and infilling of abyssal valleys, Geochem. Geophy. Geosy., 12, Q03004, https://doi.org/10.1029/2010GC003347, 2011.
van Andel, T. H. and Moore Rr., T. C.: Cenozoic calcium carbonate distribution and calcite compensation depth in the central equatorial Pacific Ocean, Geology, 2, 87–92, 1974.
van Andel, T. H., Heath, G. R., and Moore Jr., T. C.: Cenozoic History and Paleoceanography of the central equatorial Pacific Ocean, GSA Memoir 143, Geological Society of America, 1975.
Wilkens, R. H., Westerhold, T., Drury, A. J., Lyle, M., Gorgas, T., and Tian, J.: Revisiting the Ceara Rise, equatorial Atlantic Ocean: isotope stratigraphy of ODP Leg 154 from 0 to 5 Ma, Clim. Past, 13, 779–793, https://doi.org/10.5194/cp-13-779-2017, 2017.
Wilson, J. K.: Early Miocene carbonate dissolution in the eastern equatorial Pacific, Phd thesis, Oceanography, Texas A and M University, 155 pp., 2014.
Winckler, G., Anderson, R. F., Fleisher, M. Q., McGee, D., and Mahowald, N.: Covariant Glacial-Interglacial dust fluxes in the equatorial Pacific and Antarctica, Science, 320, 93–96, https://doi.org/10.1126/science.1150595, 2008.
Ziegler, C. L., Murray, R. W., Plank, T., and Hemming, S. R.: Sources of Fe to the equatorial Pacific Ocean from the Holocene to Miocene, Earth Planet. Sc. Lett., 270, 258–270, https://doi.org/10.1016/j.epsl.2008.03.044, 2008.