the Creative Commons Attribution 4.0 License.
the Creative Commons Attribution 4.0 License.
 | 02 Sep 2019
Rogation ceremonies: a key to understanding past drought variability in northeastern Spain since 1650
Ernesto Tejedor
Martín de Luis
Mariano Barriendos
José María Cuadrat
Jürg Luterbacher
Miguel Ángel Saz
In the northeast of the Iberian Peninsula, few studies have reconstructed drought occurrence and variability for the pre-instrumental period using documentary evidence and natural proxies. In this study, we compiled a unique dataset of rogation ceremonies – religious acts asking God for rain – from 13 cities in the northeast of Spain and investigated the annual drought variability from 1650 to 1899 CE. Three regionally different coherent areas (Mediterranean, Ebro Valley, and Mountain) were detected. Both the Barcelona and the regional Mediterranean drought indices were compared with the instrumental series of Barcelona for the overlapping period (1787–1899), where we discovered a highly significant and stable correlation with the Standardized Precipitation Index of May with a 4-month lag ( and ; p<0.001, respectively). We found common periods with prolonged droughts (during the mid and late 18th century) and extreme drought years (1775, 1798, 1753, 1691, and 1817) associated with more atmospheric blocking situations. A superposed epoch analysis (SEA) was performed showing a significant decrease in drought events 1 year after the volcanic events, which might be explained by the decrease in evapotranspiration due to reduction in surface temperatures and, consequently, the higher availability of water that increases soil moisture. In addition, we discovered a common and significant drought response in the three regional drought indices 2 years after the Tambora volcanic eruption. Our study suggests that documented information on rogation ceremonies contains important independent evidence to reconstruct extreme drought events in areas and periods for which instrumental information and other proxies are scarce. However, drought index for the mountainous areas (denoted Mountain later in the text) presents various limitations and its interpretation must be treated with caution.
- Article
(10911 KB) - Full-text XML
-
Supplement
(666 KB) - BibTeX
- EndNote


Water availability is one of the most critical factors for human activities, human wellbeing, and the sustainability for natural ecosystems. Drought is an expression of a precipitation deficit which often lasts longer than a season, a year, or even a decade. Drought leads to water shortages associated with adverse impacts on natural systems and socioeconomic activities, such as reductions in streamflow, crop failures, forest decay, or restrictions on urban and irrigation water supplies (Eslamian and Eslamian, 2017). Droughts represent a regular recurrent process that occurs in almost all climate zones. In the Mediterranean region, the impacts of climate change on water resources give significant cause for concern. Spain is one of the European countries with a high risk of drought caused by high temporal and spatial variability in the distribution of precipitation (Vicente-Serrano et al., 2014; Serrano-Notivoli et al., 2017). Several recent Iberian droughts and their impacts on society and the environment have been documented in the scientific literature (e.g., Domínguez-Castro et al., 2012; Trigo et al., 2013; Vicente-Serrano et al., 2014; Russo et al., 2015; Turco et al., 2017). For instance, during the period from 1990 to 1995, almost 12 million people suffered from water scarcity, the loss in agricultural production was an estimated EUR 1 billion, hydroelectric production dropped by 14.5 %, and 63 % of southern Spain was affected by fires (Domínguez-Castro et al., 2012). One of the most recent droughts in Spain lasted from 2004 to 2005 (García-Herrera et al., 2007) and was associated with major socioeconomic impacts (hydroelectricity and cereal production decreased to 40 % and 60 %, respectively, of the average values).
In other European regions, drought intensity and frequency have been widely studied since their socioeconomic and environmental impacts are expected to worsen with climate change (e.g., Spinoni et al., 2018; Hanel et al., 2018; Toreti et al., 2019). Long-term studies using instrumental meteorological observations have helped with understanding European drought patterns at various spatial and temporal scales (e.g., Spinoni et al., 2015; Stagge et al., 2017). In addition, natural proxy data have provided a multicentennial long-term perspective in Europe by developing high-resolution drought indices derived mostly from tree-ring records (e.g., Büntgen et al., 2010, 2011; Cook et al., 2015; Dobrovolný et al., 2018). Finally, documentary records utilized in historical climatology have complemented the understanding of droughts across Europe (e.g., Brázdil et al., 2005, 2010, 2018). These studies, covering the last few centuries, usually focus on specific periods of extreme droughts and their societal impacts (e.g., Diodato and Bellochi, 2011; Domínguez-Castro et al., 2012) and yet, studies attempting to develop continuous drought indices for the last few centuries, inferred from documentary evidence, remain an exception (e.g., Brázdil et al., 2013, 2016, 2018, 2019; Dobrovolný et al., 2015a, b; Možný et al., 2016; Mikšovský et al., 2019).
In the Iberian Peninsula, natural archives including tree-ring chronologies, lake sediments, and speleothems have been used to deduce drought variability before the instrumental period (Esper et al., 2015; Tejedor et al., 2016, 2017b; Benito et al., 2003, 2008; Pauling et al., 2006; Brewer et al., 2007; Carro-Calvo et al., 2013; Abrantes et al., 2017; Andreu-Hayles et al., 2017). Nevertheless, most of the highly temporally resolved natural proxy-based reconstructions represent high-elevation conditions during specific periods of the year (mainly summer; Tejedor et al., 2017b). Spain has a large amount of documentary-based data with a good degree of continuity and homogeneity for many areas, which enables important paleoclimate information to be derived at different timescales and for various territories. Garcia-Herrera et al. (2003) describe the main archives and discuss the techniques and strategies used to derive climate-relevant information from documentary records. Past drought and precipitation patterns have been inferred by exploring mainly rogation ceremonies and historical records from Catalonia (Martìn-Vide and Barriendos, 1995; Barriendos, 1997; Barriendos and Llasat, 2003; Trigo et al., 2009), Zaragoza (Vicente-Serrano and Cuadrat, 2007), Andalusia (Rodrigo et al., 1999, 2000), central Spain (Domínguez-Castro et al., 2008, 2012, 2014; Domínguez-Castro and García-Herrera, 2016) and Portugal (Alcoforado et al., 2000). In northeastern Spain, the most important cities were located on the riverbanks of the Ebro Valley, which were surrounded by large areas of cropland (Fig. 1). Bad wheat and barley harvests triggered socioeconomic impacts, including the impoverishment or malnutrition of whole families, severe alteration of the market economy, social and political conflicts, marginality, loss of population due to emigration and starvation, and diseases and epidemics, such as those caused by pests (Tejedor, 2017). Recent studies have related precipitation and drought variability in regions of Spain to wheat yield variability (Ray et al., 2015; Esper et al., 2017). The extent of impacts caused by droughts depends on the socioenvironmental vulnerability of an area and is related to the nature and magnitude of the drought and the structure of societies, such as agricultural-based societies including trades (Scandlyn et al., 2010; Esper et al., 2017; Xoplaki et al., 2016, 2018).

Figure 1Locations of the historical documents in the northeast of Spain.
During the past few centuries, Spanish society has been strongly influenced by the Catholic Church. Parishioners firmly believed in the will of God and the church to provide them with better harvests. They asked God to stop or provide rain through rogation ceremonies, a process created by bishop Mamertus in 469 CE (Fierro, 1991). The key factor in evaluating rogation ceremonies for paleoclimate research is determining the severity and duration of adverse climatic phenomena based on the type of liturgical act that was organized after deliberation and decision-making by local city councils (Barriendos, 2005). Rogations are solemn petitions by believers asking God to grant specific requests (Barriendos, 1996, 1997). Then, pro pluviam rogations were conducted to ask for precipitation during a drought, and they therefore provide an indication of drought episodes and clearly identify climatic anomalies and the duration and severity of the event (Martín-Vide and Barriendos, 1995; Barriendos, 2005). In contrast, pro serenitate rogations were requests for precipitation to end during periods of excessive or persistent rain causing crop failures and floods. In the Mediterranean Basin, the loss of crops triggered severe socioeconomic problems and was related to insufficient rainfall. Rogations were an institutional mechanism to address social stress in response to climatic anomalies or meteorological extremes (e.g., Barriendos, 2005). The municipal and ecclesiastical authorities involved in the rogation process guaranteed the reliability of the ceremony and maintained a continuous documentary record of all rogations. The duration and severity of natural phenomena that stressed society is reflected in the different levels of liturgical ceremonies that were applied (e.g., Martìn-Vide and Barriendos, 1995; Barriendos, 1997, 2005). Through these studies, we learned that the present heterogeneity of drought patterns in Spain also occurred over the past few centuries, in terms of the spatial differences, severity, and duration of the events (Martìn-Vide, 2001; Vicente-Serrano, 2006). Nevertheless, the fact that no compilation has been made of the main historical document datasets assembled over the past several years is impeding the creation of a continuous record of drought recurrences and intensities in the northeast of the Iberian Peninsula.
Here we compiled 13 series of historical documentary information of the pro pluviam rogation data from the Ebro Valley and the Mediterranean coast of Catalonia (Fig. 1) from 1438 to 1945 (Table 1). The cities cover a wide range of elevations from Barcelona, which is near the sea (9 m a.s.l.), to Teruel (915 m a.s.l.) (Fig. 1). Although some periods have already been analyzed for certain cities (i.e., Zaragoza in 1600–1900 CE by Vicente-Serrano and Cuadrat, 2007; Zaragoza, Calahorra, Teruel, Vic, Cervera, Girona, Barcelona, Tarragona, and Tortosa in 1750–1850 CE by Domínguez-Castro et al., 2012; La Seu d'Urgell, Girona, Barcelona, Tarragona, Tortosa, and Cervera in 1760–1800 CE by Barriendos and Llasat, 2003), this is the first systematic approach that analyzes all existing information for northeastern Spain, including new unpublished data for Huesca (1557–1860 CE) and Barbastro (1646–1925 CE), and examines the 13 sites jointly over a period of 250 years (1650–1899 CE). We analyzed droughts across the sites and identified extreme drought years and common periods in frequency and intensity. We also analyzed statistical links between drought indices and major tropical volcanic events in order to determine the effects of strong eruptions on regional droughts.
Table 1Historical document characteristics in the northeast of Spain.

2.1 Study area
The study area comprises the northeastern part of Spain, with an area of approximately 100 000 km2, and includes three geological units, the Pyrenees in the north, the Iberian Range in the south, and the large depression of the Ebro Valley separating the two (Fig. 1). The Ebro Valley has an average altitude of 200 m a.s.l. and its climate can be characterized as a Mediterranean type with warm summers, cold winters, and continental characteristics increasing with distance inland. Certain geographic aspects determine its climatic characteristics; for example, several mountain chains isolate the valley from moist winds, preventing precipitation. Thus, in the central areas of the valley, annual precipitation is low,with small monthly variations and an annual precipitation in the central Ebro Valley of approximately 322 mm (Serrano-Notivoli et al., 2017). In both the Pyrenees and the Iberian Range, the main climatic characteristics are related to a transition from oceanic/continental to Mediterranean conditions in the east. In addition, the barrier effect of the most frequent humid air masses causes gradually higher aridity towards the east and south (Vicente-Serrano, 2005; López-Moreno and Vicente-Serrano, 2007). Areas above 2000 m a.s.l. receive approximately 2000 mm of precipitation annually, increasing to 2500 mm in the highest peaks of the mountain range (Garcìa-Ruiz et al., 2001). Annual precipitation at the Mediterranean coast is higher than in the central Ebro Valley and ranges from approximately 500 mm in Tortosa to 720 mm in Girona (Serrano-Notivoli et al., 2017).
2.2 From historical documents to climate: development of a drought index for each location in NE Spain from 1650 to 1899 CE
Historical documents from 13 cities in the northeast of Spain were compiled into a novel dataset by using a consistent approach (Fig. 1, Tables 1 and 2). These historical documents are the rogation ceremonies reported in the “Actas Capitulares” of the municipal archives or main cathedrals. The documents (described in Table 2) range from 461 years of continuous data in Girona to 120 years in Lleida, with an average of 311 years of data for each station. Rogations were not only religious acts but also supported by the participation of several institutions; agricultural organizations and municipal and ecclesiastical authorities analyzed the situation and deliberated before deciding to hold a rogation ceremony (Vicente-Serrano and Cuadrat, 2007). Usually, the agricultural organizations would request rogations when they observed a decrease in rainfall, which could result in weak crop development. The municipal authorities would then recognize the predicament and discuss the advisability of holding a rogation ceremony. Whether a rogation was celebrated or not was not arbitrary since the cost was paid from the public coffers. When the municipal authorities decided to hold a rogation, the order was communicated to the religious authorities, who placed it on the calendar of religious celebrations and organized and announced the event. Previous studies have reported that winter precipitation is key for the final crop production in dry-farming areas of the Ebro Valley (wheat and barley; Austin et al., 1998a, b; McAneney and Arrué, 1993; Vicente-Serrano and Cuadrat, 2007). In addition to winter rogations, most of the others were held during the period of crop growth (March–May) and harvesting (June–August) since the socioeconomic consequences when the harvest was poor were more evident at those times. Thus, it is reasonable to view rogations in an index from December to August. Finally, from the various types of droughts, we will be referring to a combination of meteorological and agricultural droughts. The rogation was not only agronomical or focused on a drought or agricultural problem. They already inferred that the problem was meteorological and therefore they always asked for timely rain, appropriate rain, or consistent rain. In other words, they asked for the occurrence of a meteorological phenomenon. Accordingly, the follow-up or sentinel that gives them information is agricultural, although their answer is by a meteorological anomaly, and they ask for the development of a normalized meteorology that will allow for a development of the appropriate agriculture.
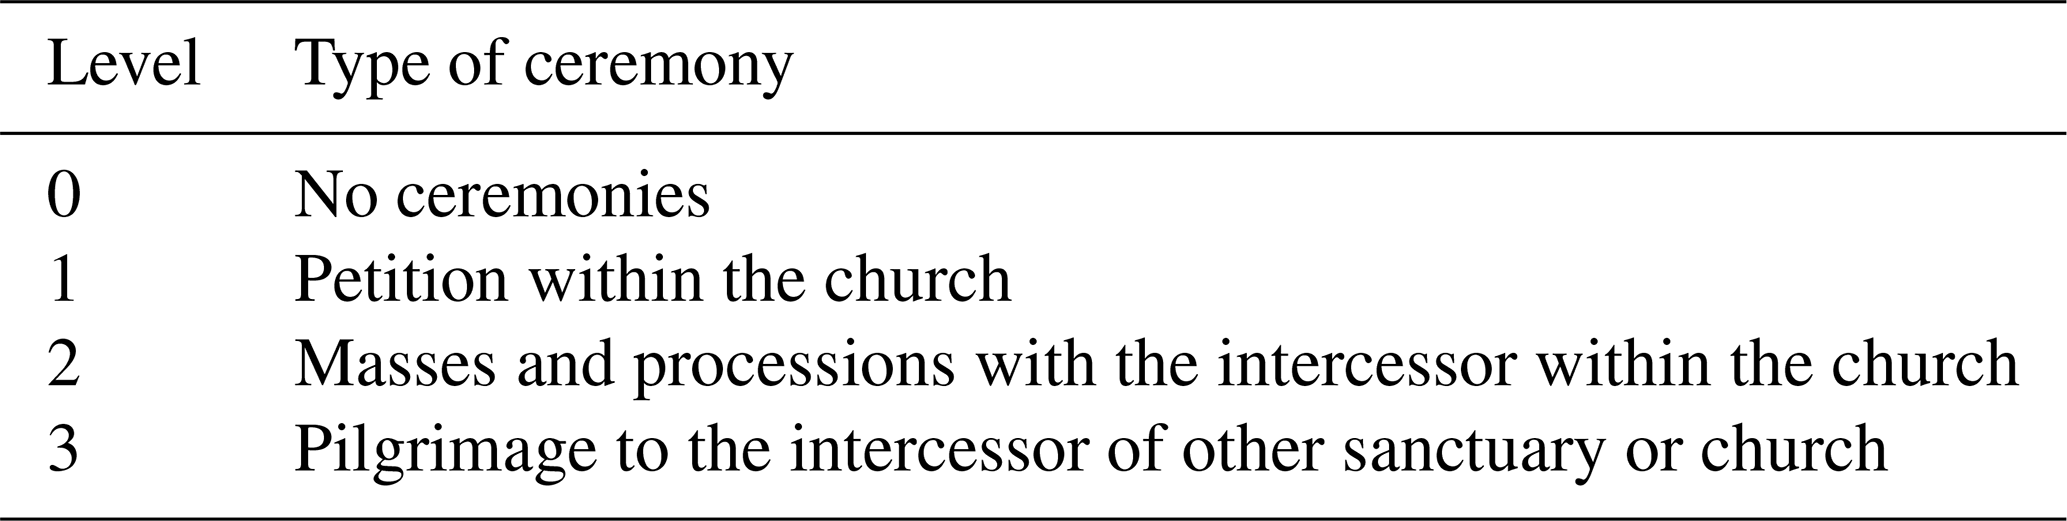
The qualitative information contained in the rogations was transformed into a semiquantitative continuous monthly series following the methodology of the Millennium Project (European Commission, IP 017008; Domínguez-Castro et al., 2012). Only pro pluviam rogations were included in this study. According to the intensity of the religious act, which were uniform ceremonies performed throughout the Catholic territories and triggered by droughts, we categorized the events into four levels from low to high intensity. 0: there is no evidence of any kind of ceremony, 1: a simple petition within the church was held, 2: intercessors were exposed within the church, and 3: a procession or pilgrimage took place in the public itineraries, the most extreme type of rogation (see Table 3). Although rogations have appeared in historical documents since the late 15th century and were reported up to the mid-20th century, we restricted the common period to 1650–1899 CE since there are a substantial number of data gaps before and after this period, although some stations do not cover the full period. A continuous drought index (DI) was developed for each site by grouping the rogations at various levels. A simple approach, similar to that of Martìn-Vide and Barriendos (1995) and Vicente-Serrano and Cuadrat (2007), was chosen. The annual DI values were obtained by determining the weighted average of the number of levels 1, 2, and 3 rogations recorded between December and August in each city. The weights of levels 1, 2, and 3 were 1, 2, and 3, respectively. Accordingly, the drought index for each city is a continuous semiquantitative value from 0, indicating the absence of drought, to a maximum of 3 (Fig. 2a).

Figure 2The empirical cumulative distribution function (ECDF) used to describe a sample of observations of a given variable. Its value at a given point is equal to the proportion of observations from the sample that are less than or equal to that point. ECDF analysis was performed for the local drought indices (a) and the regional drought indices (b).
Table 2Documentary references for administrative public documentary sources used for rogation monthly indices (all documents are generated and initialed by public notaries). Note that only the official documents are shown. Each documentary record is given a weight of reliability with the public notary rubric that acts like a secretary. This procedure is currently still in force for the same type of document, which is still generated at present time.
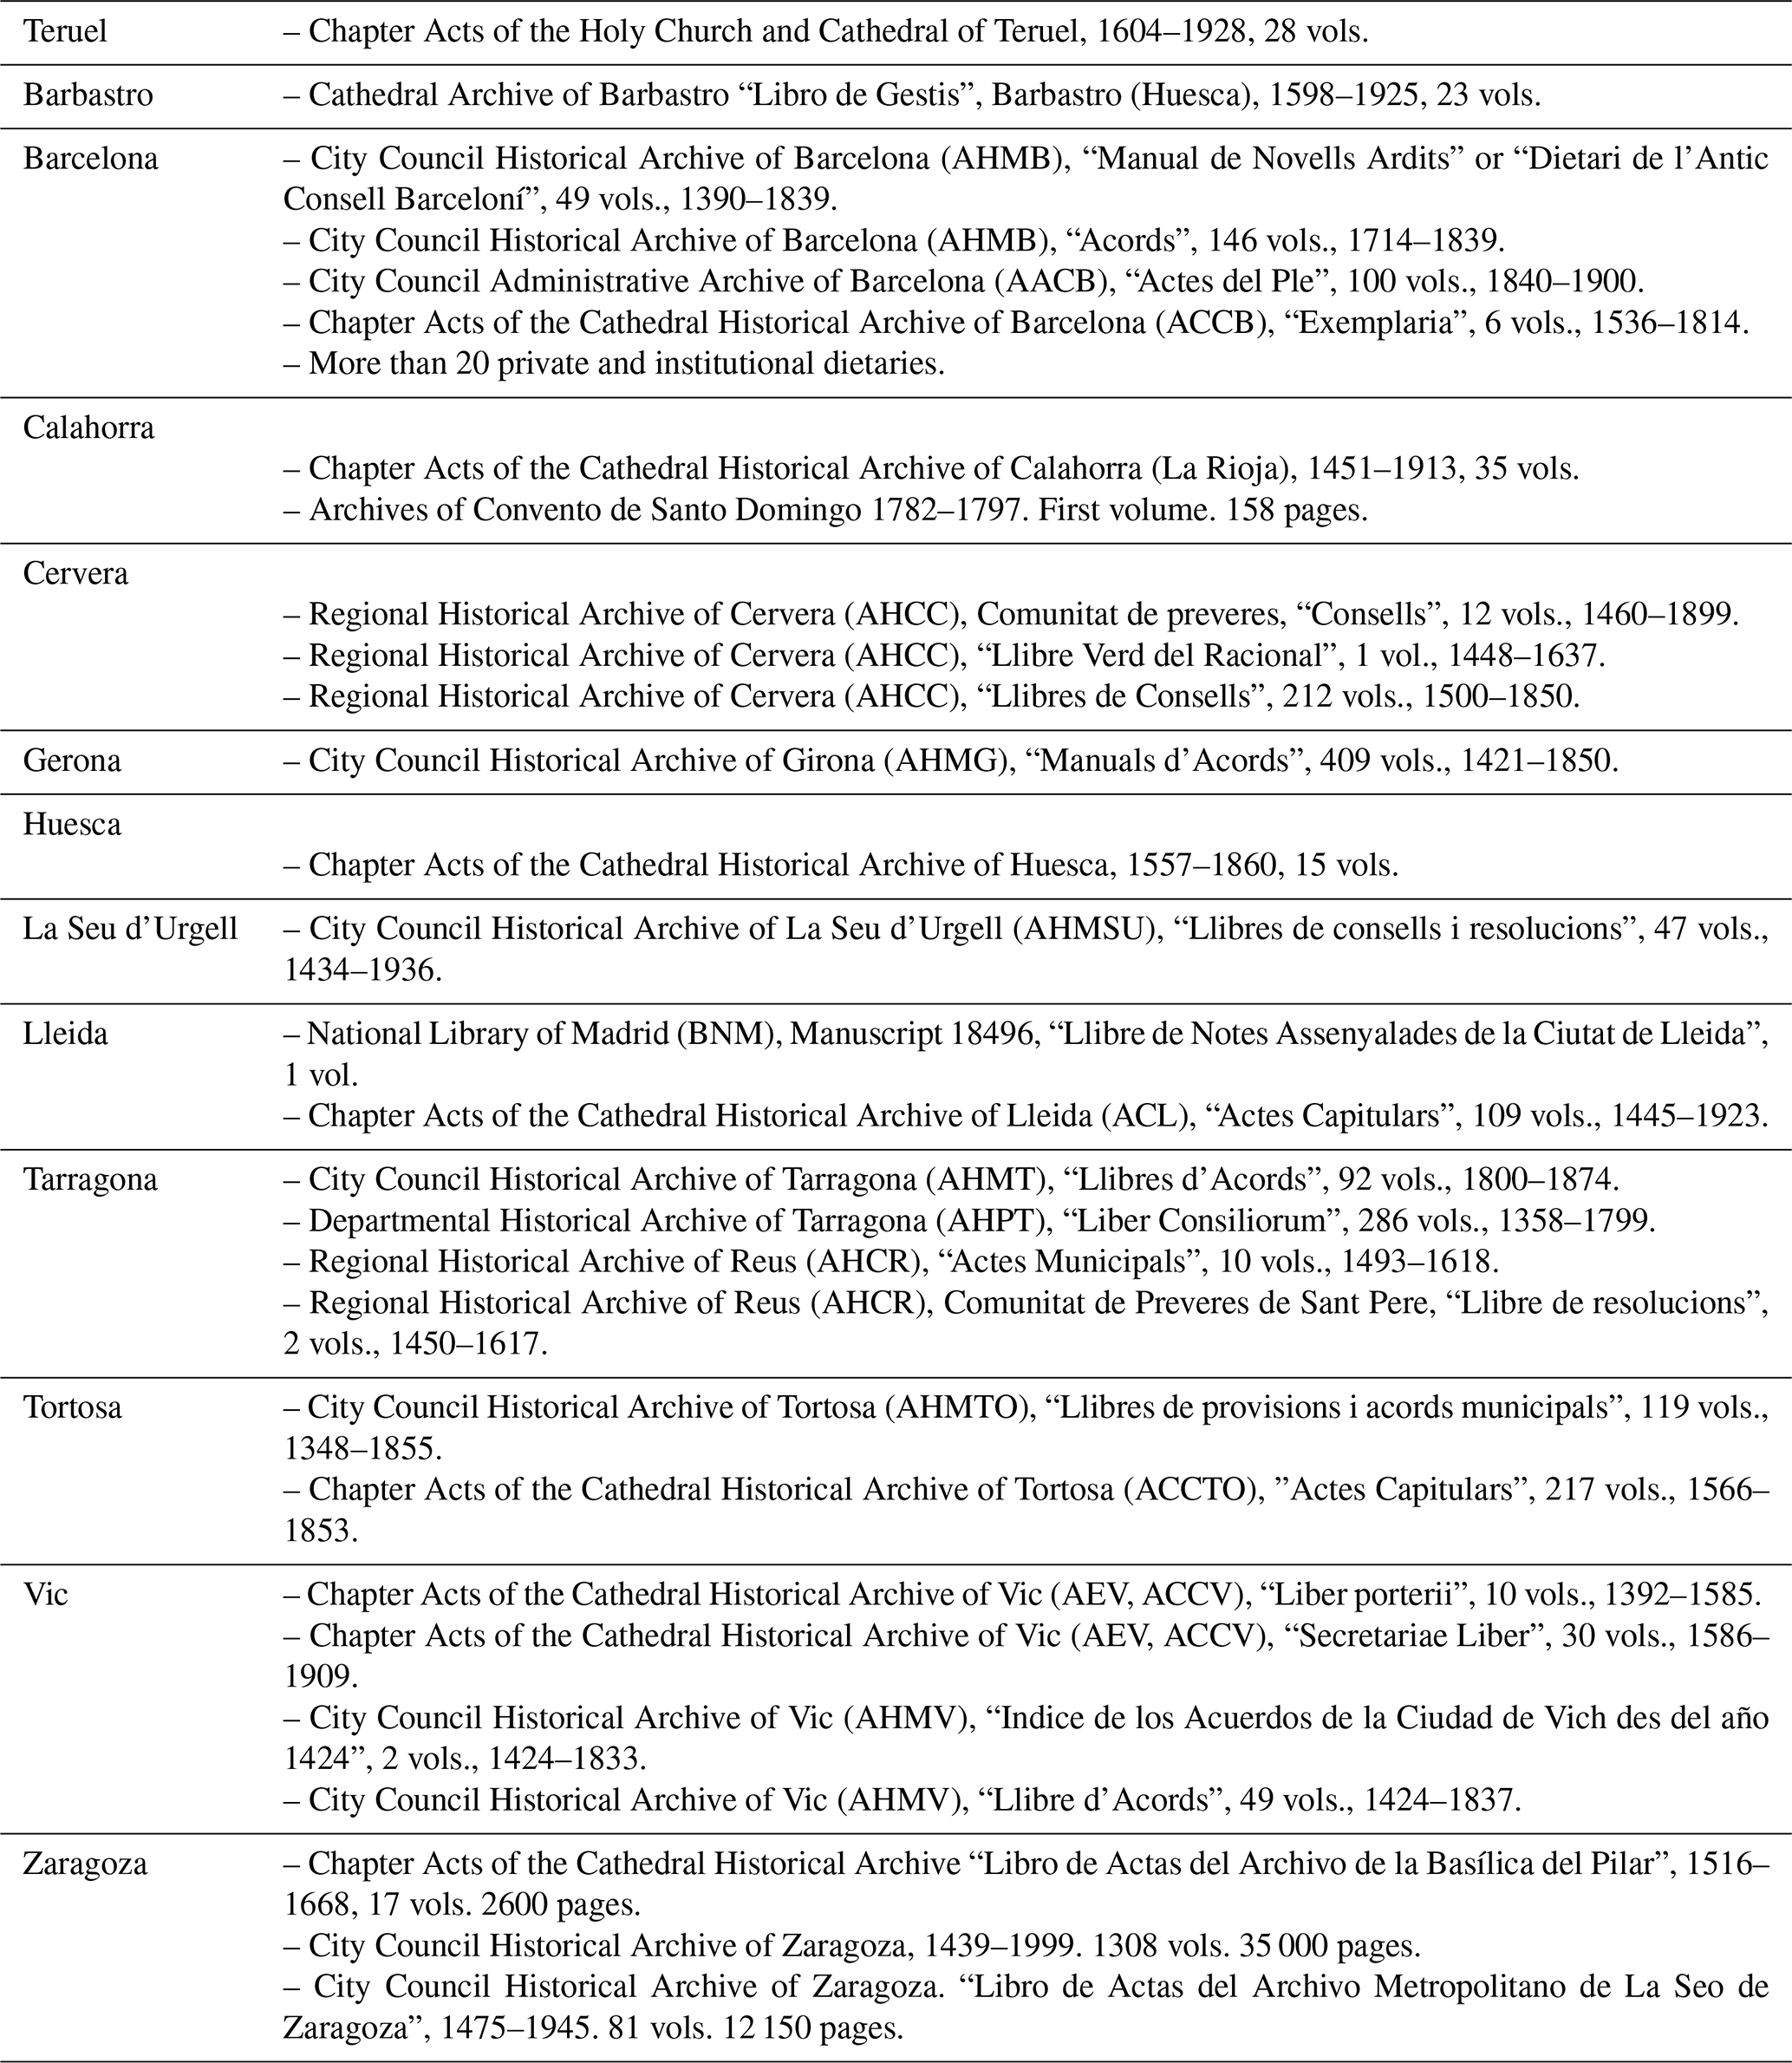
Table 3Rogation levels according to the type of ceremony celebrated.
2.3 Clustering station drought to regional drought indices from 1650 to 1899 CE
To evaluate similarities among local stations, we performed a cluster analysis (CA) that separates data into groups (clusters) with minimum variability within each cluster and maximum variability between clusters. We selected the period of common data 1650–1770 to perform the cluster analysis. The main benefit of a cluster analysis (CA) is that it allows similar data to be grouped together, which helps to identify common patterns between data elements. To assess the uncertainty in hierarchical cluster analysis, the R package “pvclust” (Suzuki and Shimodaira, 2006) was used. We used the Ward's method in which the proximity between two clusters is the magnitude by which the summed squares in their joint cluster will be greater than the combined summed square in these two clusters SS12−(SS1+SS2) (Ward, 1963; Everitt et al., 2001). Next, the root of the square difference between coordinates of a pair of objects was computed with its Euclidian distance. Finally, for each cluster within the hierarchical clustering, quantities called p values were calculated via multiscale bootstrap resampling (1000 times). Bootstrapping techniques do not require assumptions such as normality in original data (Efron, 1979) and thus represent a suitable approach to the semiquantitative characteristics of drought indices (DI) derived from historical documents. The p value of a cluster is between 0 and 1, which indicates how strongly the cluster is supported by the data. The package “pvclust” provides two types of p values: AU (approximately unbiased p value) and BP (bootstrap probability) value. AU p value is computed by multiscale bootstrap resampling and is a better approximation of an unbiased p value than the BP value computed by normal bootstrap resampling. The frequency of the sites falling into their original cluster is counted at different scales and then the p values are obtained by analyzing the frequency trends. Clusters with high AU values, such as those > 0.95, are strongly supported by the data (Suzuki and Shimodaira, 2006). Therefore, in this study, sites belonging to the same group were merged by means of an arithmetical average (Eq. 1).
where xn represents each individual annual drought index, and n is the number of drought indices per cluster. To evaluate the relationship of each site's rogations, we then performed a matrix correlation (Spearman) between the new groups derived from the cluster and each individual drought index for the 1650–1899 period.
2.4 Validation of the regional drought indices against overlapping instrumental series
To better understand the relationship between the derived drought indices and the instrumental series, we used the longest instrumental precipitation and temperature series covering the period 1786–2014 CE (Prohom et al., 2012, 2015) for the city of Barcelona and thus overlapping the rogation ceremony period of the local DI of Barcelona (DIBARCELONA) from 1786 to 1899 CE. However, the instrumental series was homogenized and completed including data from cities nearby and along the Mediterranean coast (see Prohom et al., 2015, for details). Therefore, the instrumental series contains coherent regional information from a Mediterranean section similar to our regional drought indices stations located along the Mediterranean coast. We then calculated the Standardized Precipitation Index (SPI; McKee et al., 1993) and the Standardized Evapotranspiration and Precipitation Index (SPEI; Vicente-Serrano et al., 2010). SPEI was calculated with the R package “SPEI” (Begueria et al., 2014). From the various ways of calculating evapotranspiration, we chose the Thornwaite method, which only requires temperature and latitude as input. Next, we calculated the Spearman correlation between the drought indices of the Mediterranean coast and the SPI/SPEI at different timescales including a maximum lag of 12 months covering the period 1787–1899. Further exploration of the relationship between the drought indices inferred from historical documents and the instrumental drought indices through time were performed by 30- and 50-year moving correlations. Finally, to avoid the circularity problem we performed the same analysis leaving one local station out each time.
2.5 Detecting extreme drought years and periods in the northeast of Spain between 1650 and 1899 CE and links to large-scale volcanic forcing
To identify the extreme drought years, we selected those above the 99th percentile of each regional drought index and mapped them in order to find common spatial patterns. In addition, the 11-year running mean performed for each drought index helped highlight drought periods within and among the drought indices. Finally, since rogation ceremonies are a response of the population to an extreme event, we performed a superposed epoch analysis (SEA; Panofsky and Brier, 1958) of the 3 years before and after the volcanic event, using the package “dplR” (Bunn, 2008) to identify possible effects on the hydroclimatic cycle caused by volcanic eruptions. The method involves sorting data into categories dependent on a key date (volcanic events). For each category, the year of the eruption is assigned as year 0 and we selected the values of the drought indices for the three years prior to the eruption and three years following in order to obtain a SEA matrix (number of volcanic events multiplied by 7). For each particular event, the anomalies with respect to the pre-eruption average were calculated to obtain a composite with all the events for the 7 years. Statistical significance of the SEA was tested by a Monte Carlo simulation based on the null hypothesis of finding no association between the eruptions and the climatic variables studied. Random years are chosen for each category as pseudo-event years and the average values are calculated for −3 to +3, the same as for real eruptions. This process is repeated to create 10 000 randomly generated composite matrices, which are sorted, and a random composite distribution is created for each column in the matrix (i.e., year relative to the eruption year 0). The distributions are then used to statistically compare the extent to which the existing composites are anomalous. We used these distributions to test the significance of the actual composites at a 99 % confidence level. The largest volcanic eruptive episodes (Sigl et al., 2015) chosen for the analysis were 1815, 1783, 1809, 1695, 1836, 1832, 1883, and 1862. In addition, we performed the SEA only with the largest eruption of this period, the Tambora eruption in the year 1815.
3.1 From historical documents to climate: development of a drought index for each location in NE Spain from 1650 to 1899 CE
We converted the ordinal data into continuous semiquantitative index data by performing a weighted average of the monthly data (see Methods section). As a result, we developed an annual drought index (from the previous December to the current August) containing continuous values from 0 to 3 collected from information on the annual mean extreme droughts of each year for each of the 13 locations. The empirical cumulative distribution function (EDCF, Fig. 2a) confirmed that the new drought indices can be treated as a continuous variable, since the drought index can take almost infinite values in the range from 0 to 3 (Fig. 2b). To study drought across the region, we performed a cluster analysis including the annual drought indices of the 13 cities. These data were then used to study the hydrological responses after strong tropical eruptions.
3.2 Clustering station drought to regional drought indices from 1650 to 1899 CE
The cluster analysis (CA, see Methods section) using the DI of the 13 locations and after being applied to the complete period until 1899 revealed three significant and physically coherent areas, hereafter known as Mountain, Mediterranean and, Ebro Valley (Fig. 3). The first cluster includes cities with a similar altitude (Teruel, La Seu d'Urgell) and similar in latitude (Barbastro, Lleida, Huesca, Girona; see Fig. 1). The cities within the second and third clusters are near the Ebro River (Calahorra, Zaragoza, and Tortosa) or have similar climatic conditions (Cervera, Vic, Barcelona, Tarragona). Clusters two and three suggest (Fig. 3) that the coherence of the grouping can be explained by the influence and proximity of the Mediterranean Sea (Tortosa, Cervera, Tarragona, Vic, and Barcelona) and the influence of a more continental climate (Zaragoza and Calahorra). Accordingly, three regional drought indices were developed by combining the individual DIs of each group; DI Mountain (DIMOU), composed of Barbastro, Teruel, Lleida, La Seu d'Urgell, and Girona; DI Mediterranean (DIMED), composed of Tortosa, Cervera, Tarragona, Vic, and Barcelona; and DI Ebro Valley (DIEV), comprising Zaragoza and Calahorra. The resulting drought indices in regional DI series can also vary from 0 to 3 but show a relatively continuous distribution range (Fig. 2b).

Figure 3Dendrogram showing the hierarchical cluster analysis of the drought indices developed from the historical documents for each location. The AU (approximately unbiased p value) is indicated in red and the BP (bootstrap probability) is presented in green.
The Spearman correlation matrix for the period 1650–1899 CE confirms the high and significant (p<0.05) correlations between each individual DI and its corresponding group, confirming the validity of the new DI groups (Fig. 4). The correlations among the cluster drought indices range from 0.76 (between DIEV and DIMED) to r=0.38 (between DIEV and DIMOU) and r=0.42 (between DIMED and DIMOU). In DIEV, both of the local DIs show similar correlations (Zaragoza, r=0.73; Calahorra, r=0.75). In the DIMED cluster, the high correlations among the members show strong coherency. DIMOU is the most heterogeneous cluster with correlations of r=0.57 for Barbastro and r=0.33 for La Seu d'Urgell. Although each individual DI within this group and within the DIMOU shows significant correlation, individual DIs compared one to another reveal some correlation values to be not significant (p < 0.05).
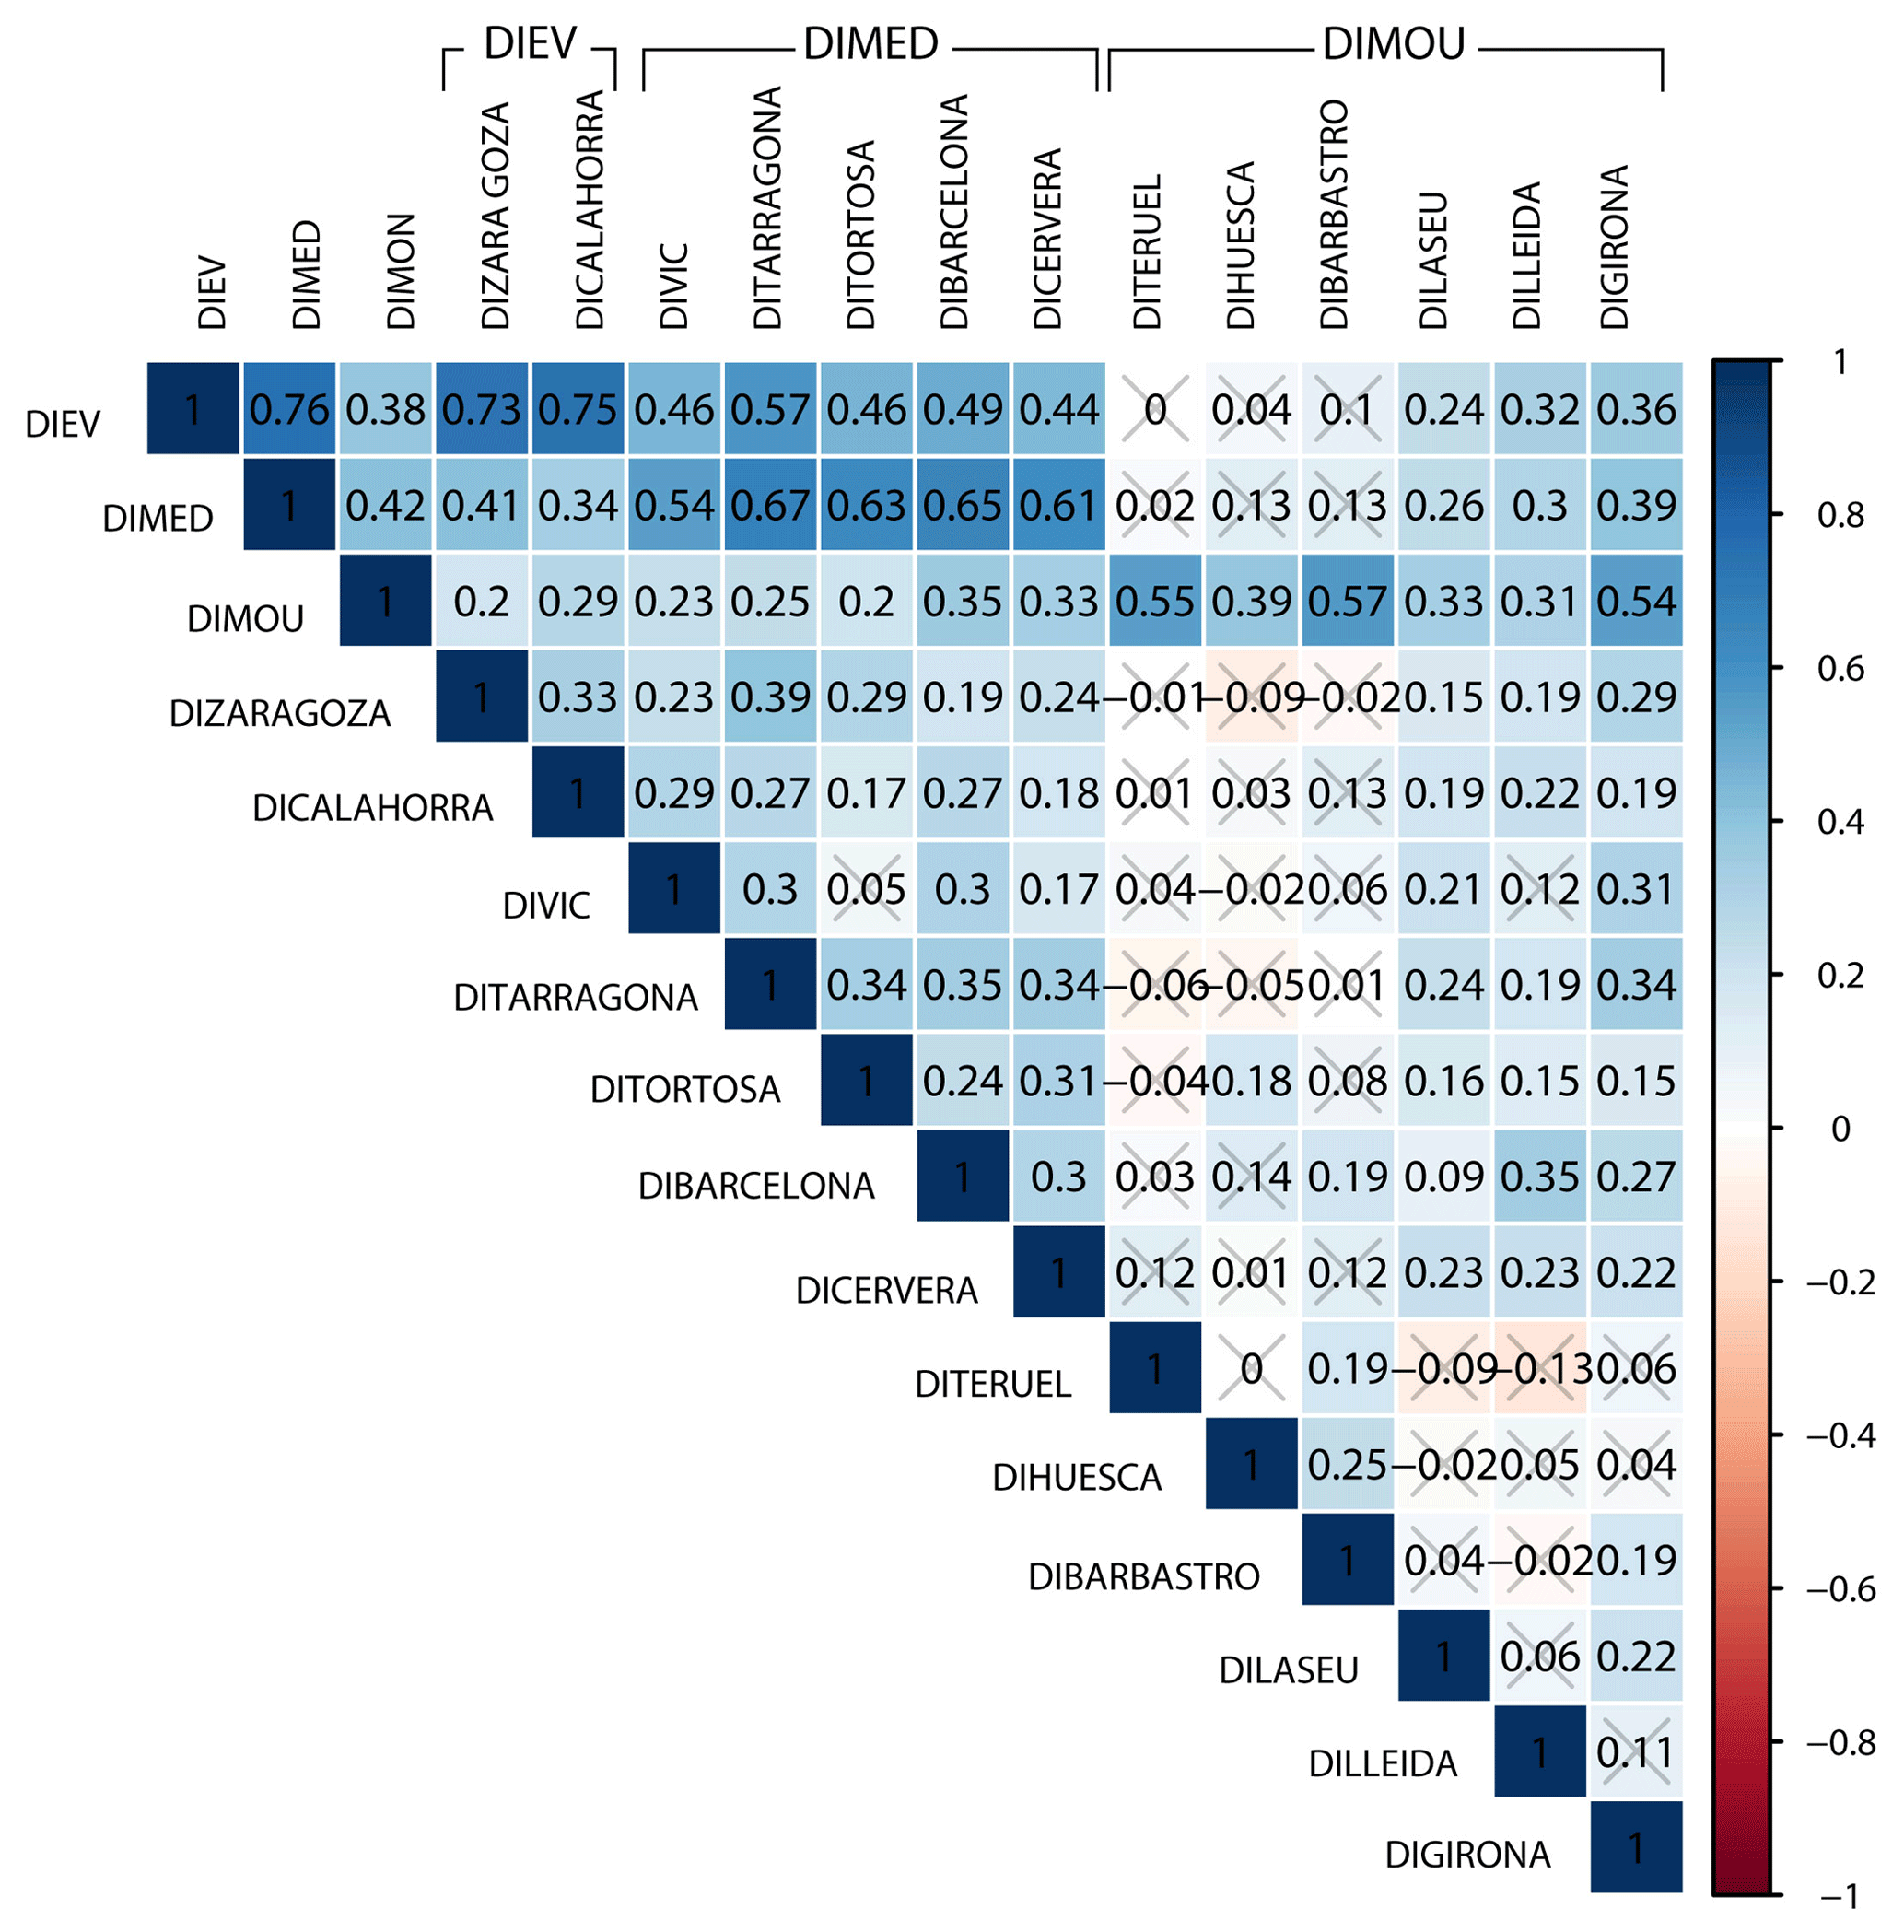
Figure 4Correlation matrix (Spearman) between the individual drought indices and the cluster drought indices for the period of 1650–1899. Values are significant at p < 0.05, except those marked with a gray cross, which are not significant.
3.3 Validation of the regional drought indices against overlapping instrumental series
The highest Spearman correlation (; p<0.001) between the Barcelona drought index and the instrumental SPI over the full 113-year period (1787–1899 CE; Fig. 5c) was found for the SPI of May with a lag of 4 months (SPIMAY_4 hereafter). A slightly lower, though still significant, correlation was obtained from the SPEI of May with a lag of 4 months (SPEIMAY_4) (; p<0.001; Fig. 5d). The regional Mediterranean drought index shows moderately higher correlations with the instrumental SPI (; p<0.001) and SPEI (; p<0.001) computed for the same period and timescale. The moving correlations analyses between DIMED, DIBARCELONA, and SPIMAY_4 for 30 and 50 years (Fig. 5a, b) presented significant values through the full period. However, the agreement is especially higher and stable during the period 1787–1834. After 1835, despite correlations remaining significant, the instability is higher and the agreement decreased.
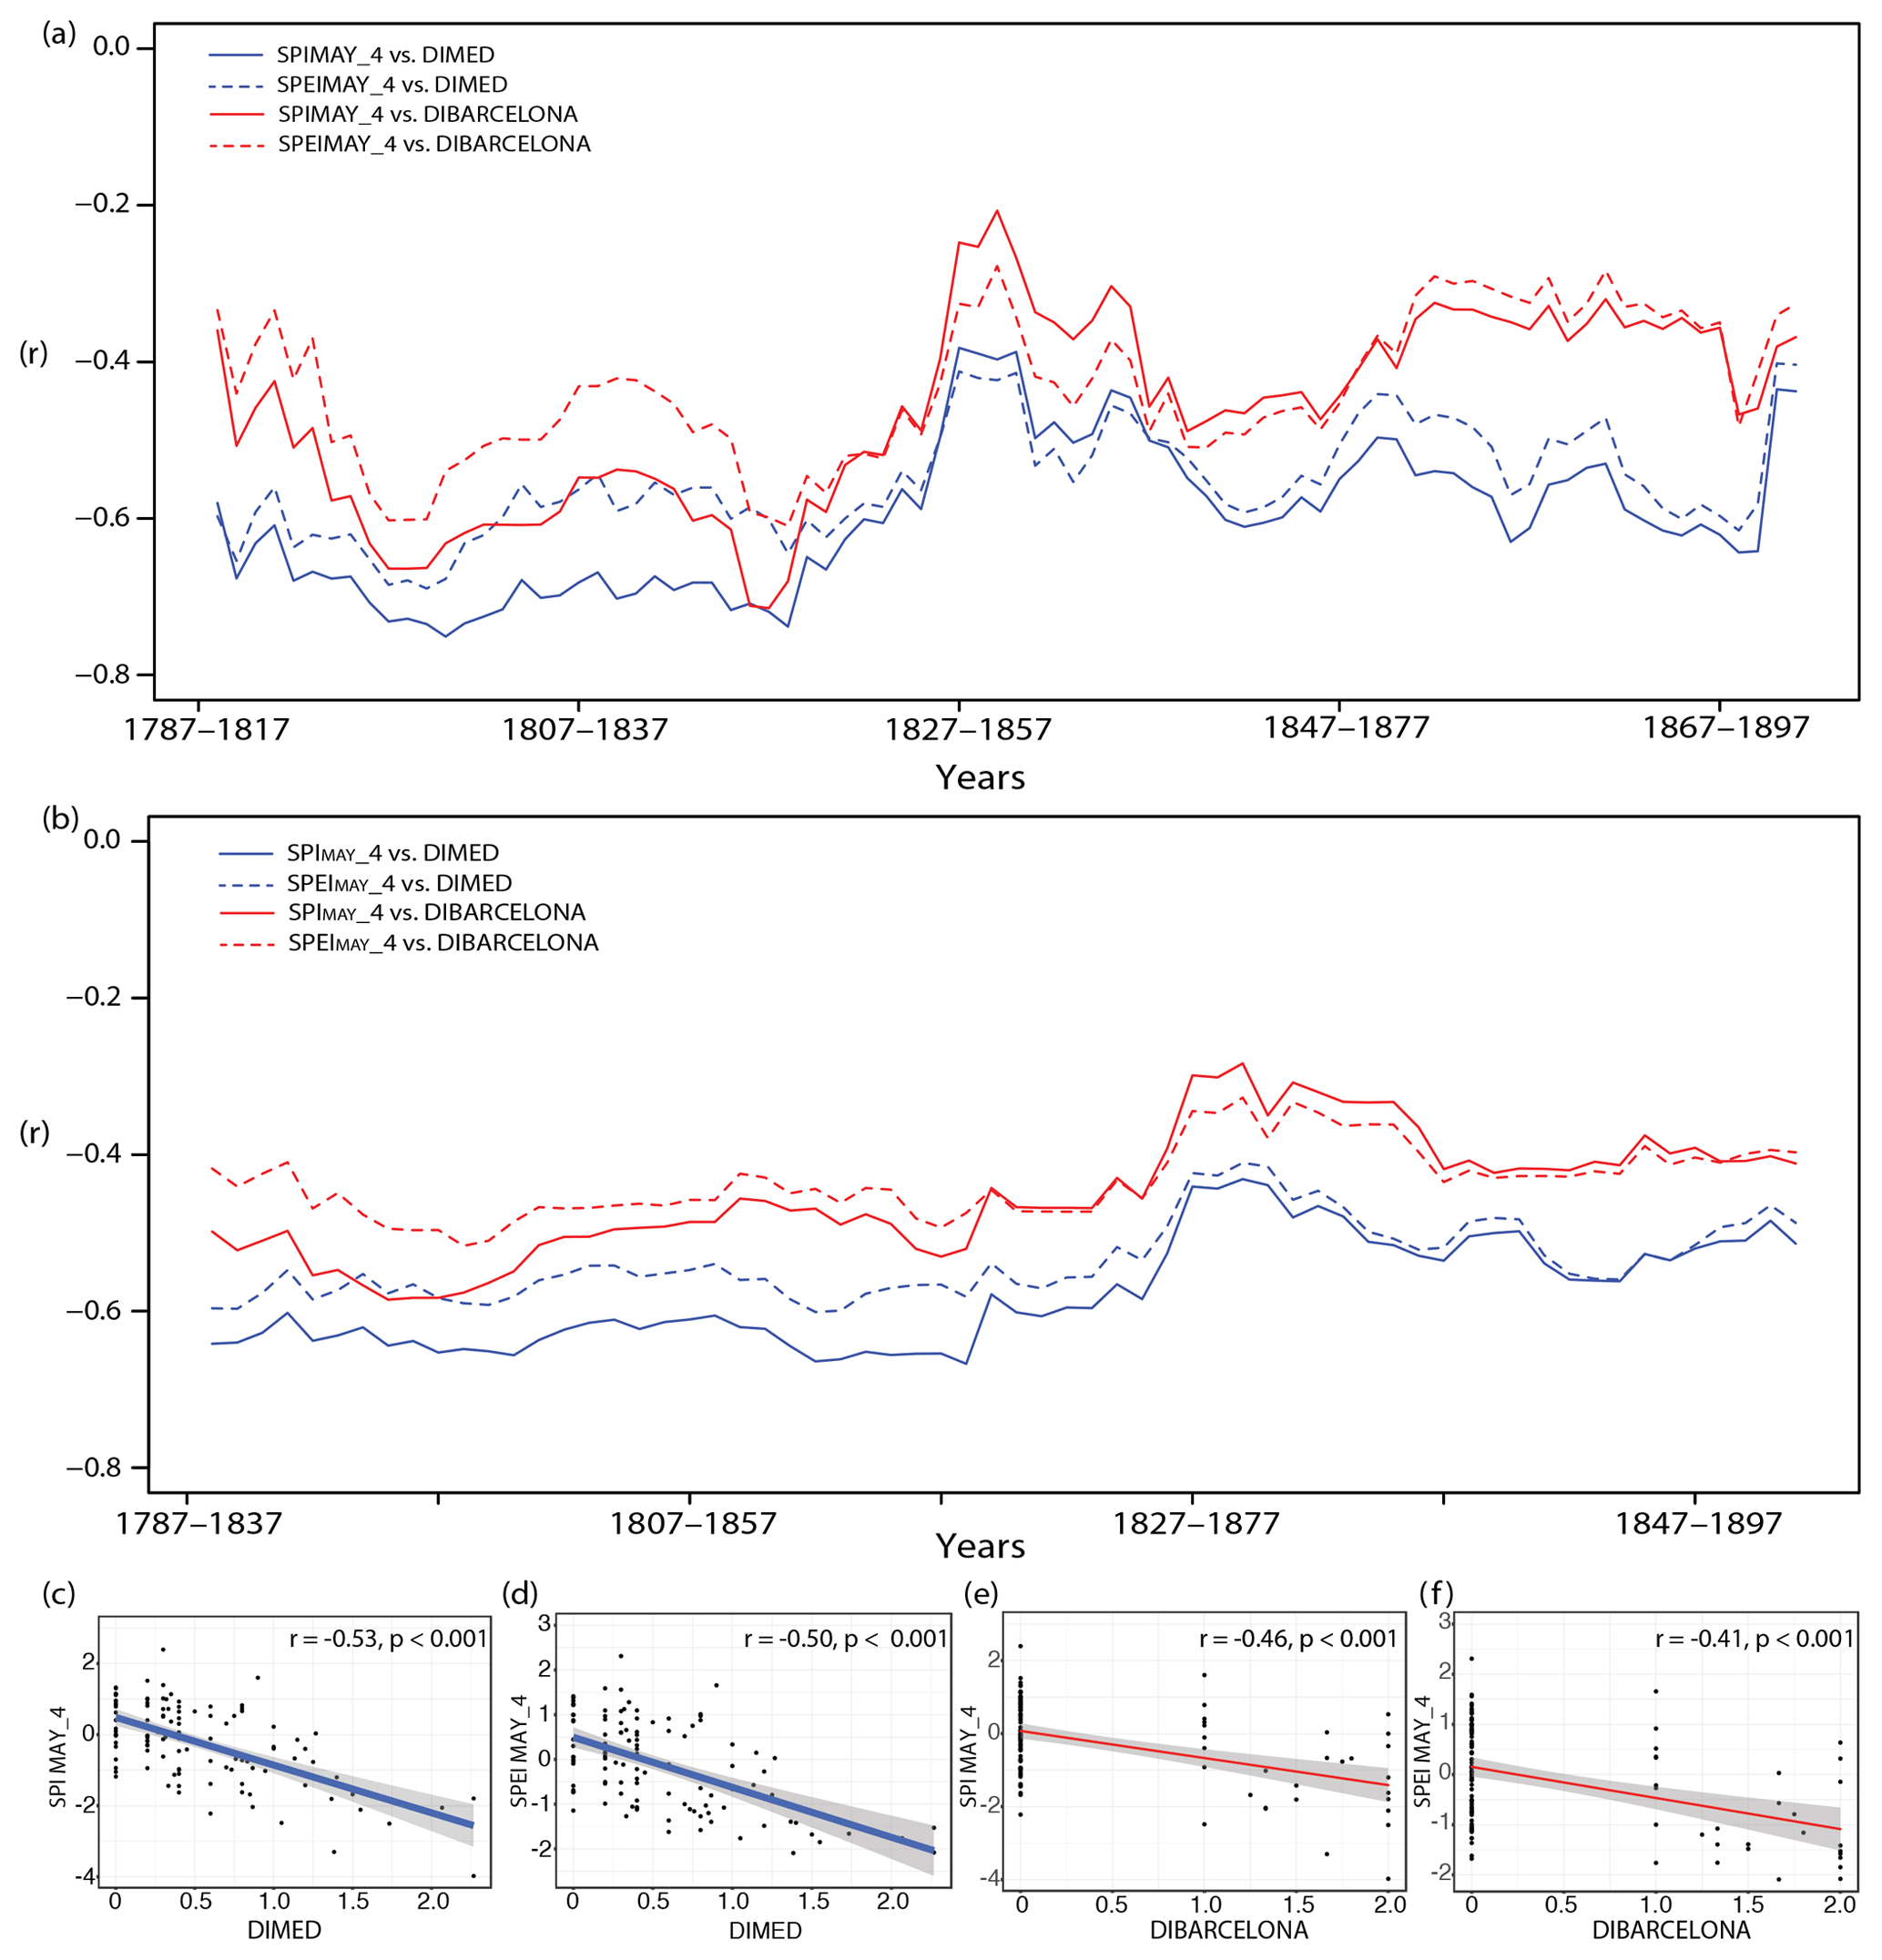
Figure 5(a) 30-year moving correlation between DIMED, DIBARCELONA, and the instrumental computed SPI and SPEI. (b) Same but for 50-year moving correlations. (c) Correlation (Spearman) between DIMED and SPIMAY_4 for the full period (1787–1899). (d) Correlation between DIMED and SPEIMAY_4 for the full period (1787–1899). (e) Correlation between DIBARCELONA and SPIMAY_4 for the full period (1787–1899). (f) Correlation between DIBARCELONA and SPEIMAY_4 for the full period (1787–1899).
Furthermore, when the analysis was performed leaving one station out each time (Fig. S1), the results remain significant (p<0.001) and the correlation in all cases is above 0.45. The next step will address the selection of extreme drought years and periods within the 250 years from 1650–1899 CE using information from the cluster analysis.
3.4 Detecting extreme drought years and periods in the northeast of Spain between 1650 and 1899 CE and links to large-scale volcanic forcing
According to the cluster grouping, the three new spatially averaged drought indices (DIEV, DIMED, and DIMOU) are presented in Fig. 6. Mountain DI (DIMOU) had the least number of drought events and a maximum DI of 1.6 in 1650 CE. The Ebro Valley DI (DIEV) had the highest number of droughts (derived from the highest number of positive index values) followed by the third region (Mediterranean DI, DIMED). The 17th and 18th centuries exhibited a relatively large number of severe droughts (Fig. 6). High positive index values over the duration of the DIs in all three series indicate that a drought period occurred from 1740 to 1755 CE. The lowest DIs were found at the end of the 19th century, meaning that droughts were less frequent in this period. The 11-year running mean shows common periods with low DI values, such as 1706–1717, 1800–1811, 1835–1846, and 1881–1892, which we infer to be normal or drought free. On the other hand, 1678–1689, 1745–1756, 1770–1781, and 1814–1825 are periods with continuously high DIs, indicating that significant droughts affected the crops during these periods and intense rogation ceremonies were needed.
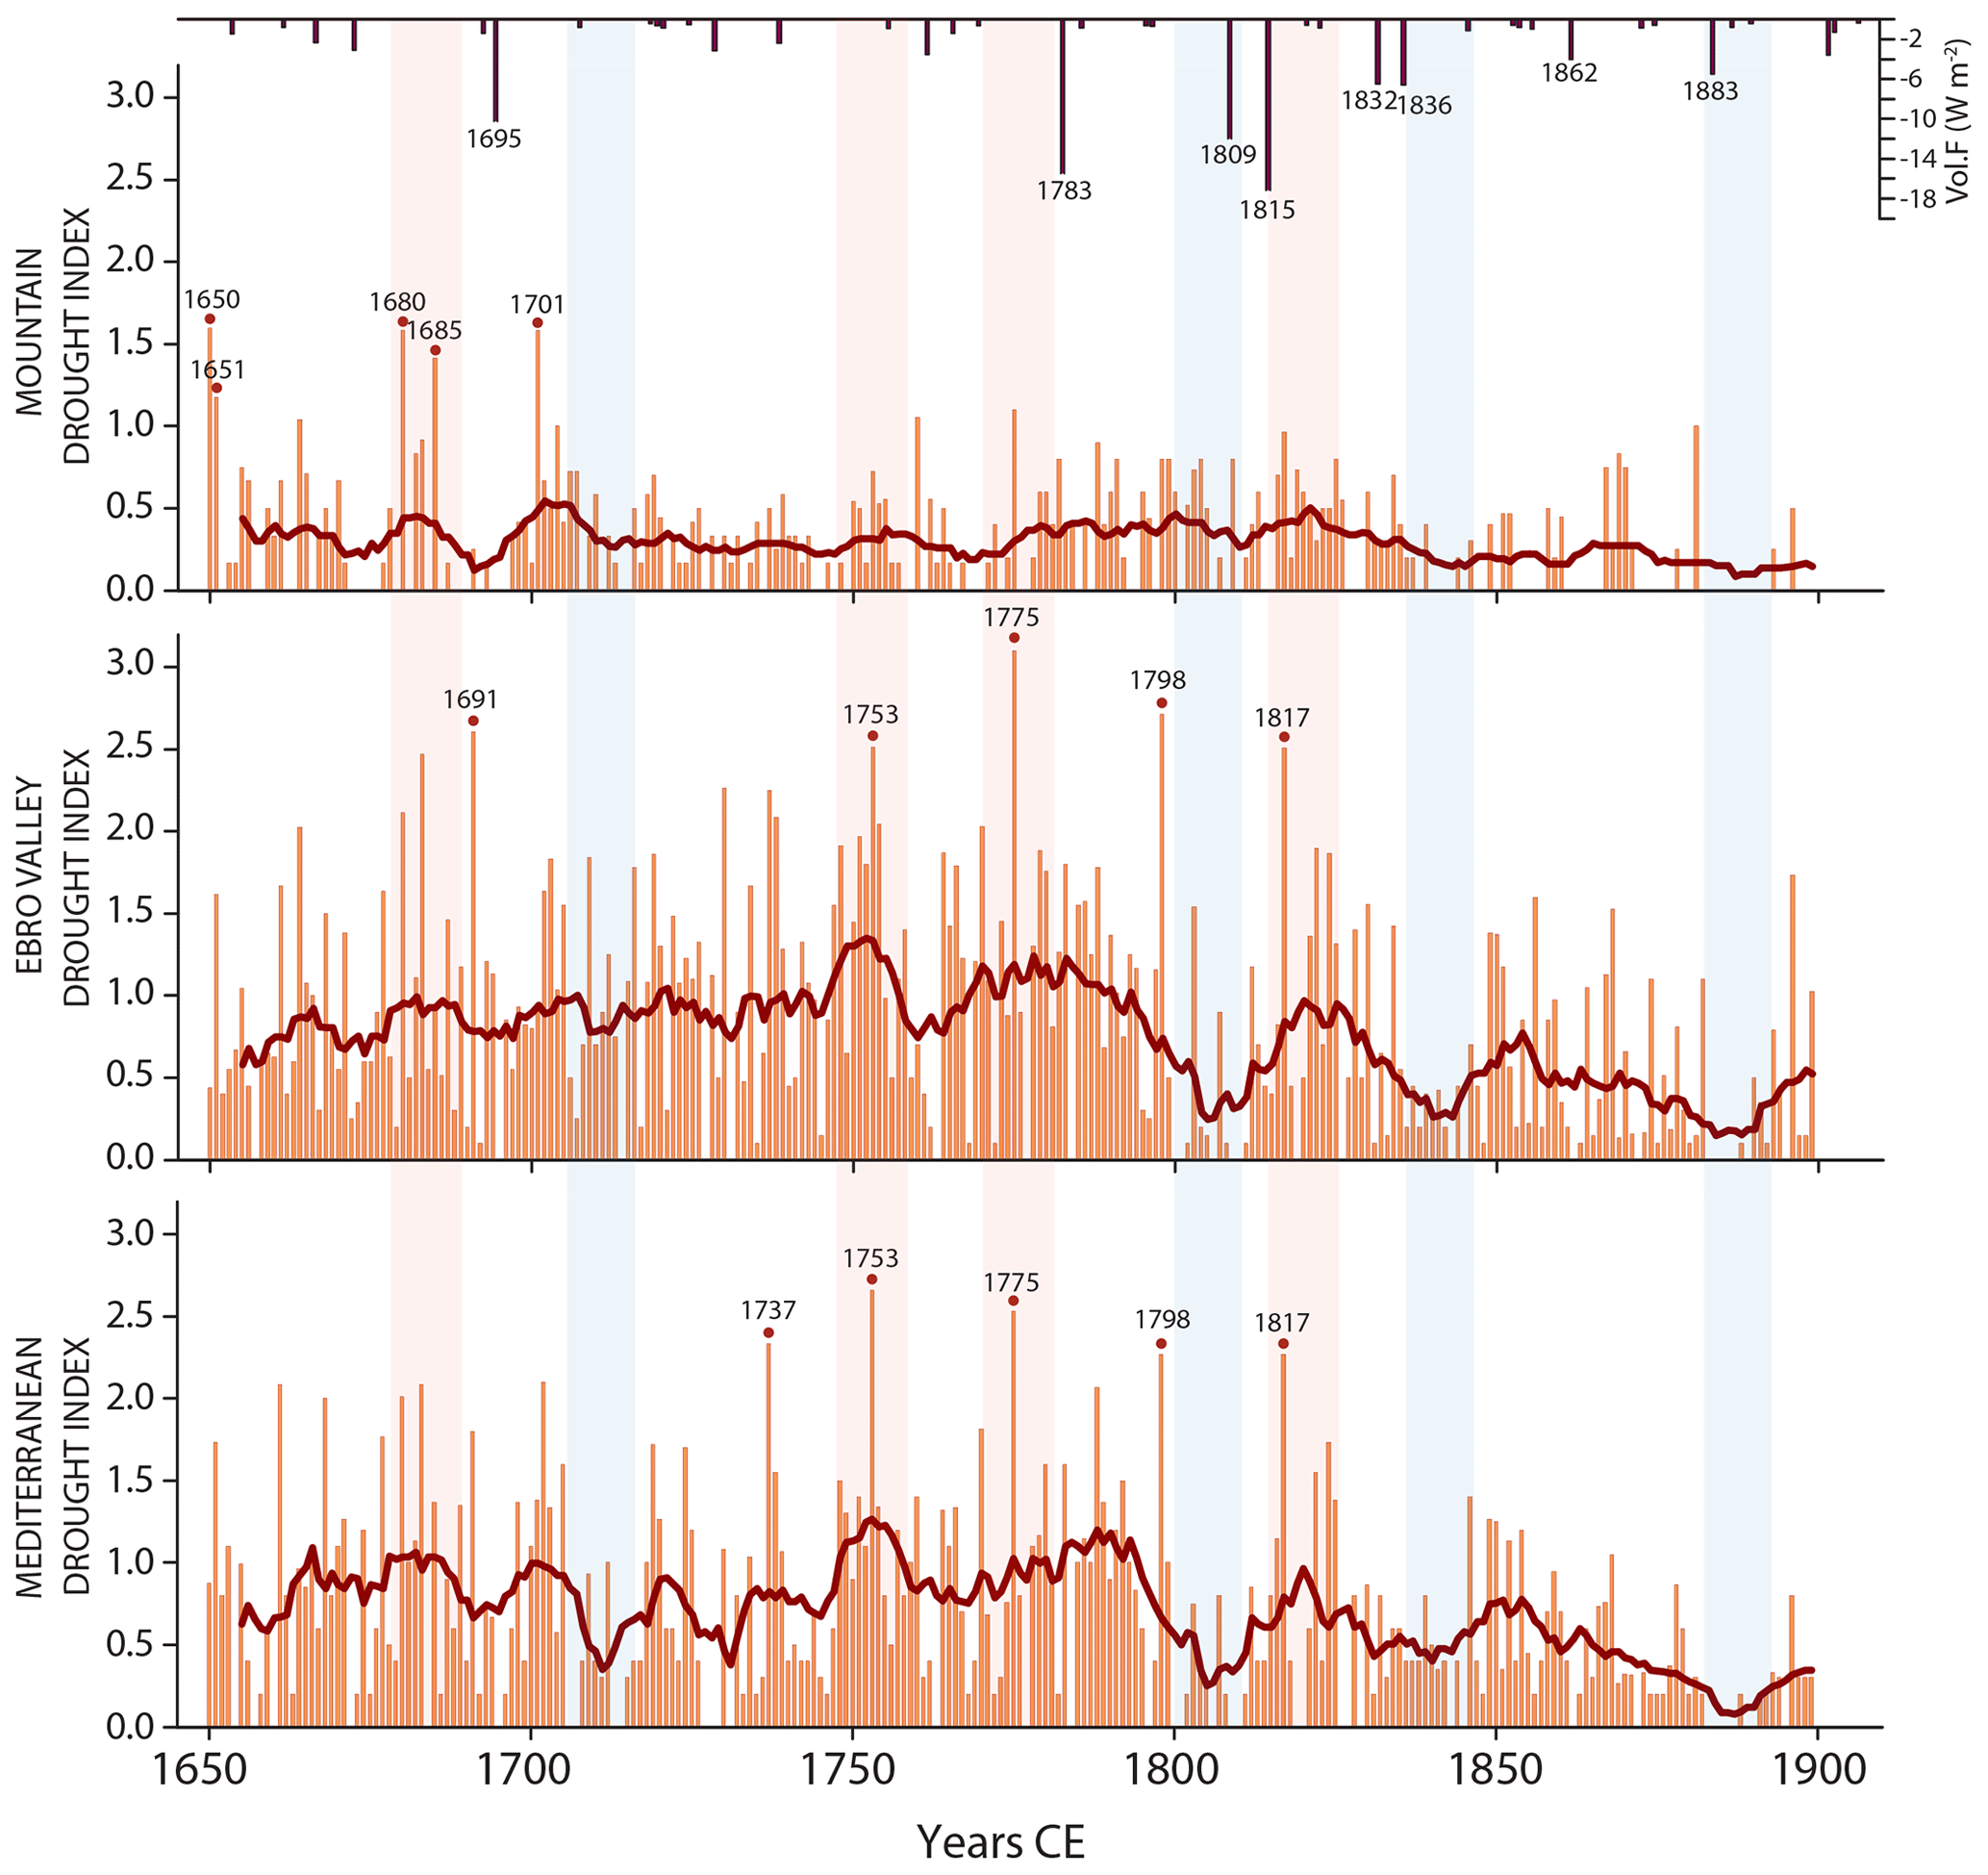
Figure 6Drought indices of the three clusters, DIMOU (Mountain), DIEV (Ebro Valley), and DIMED (Mediterranean). Vertical orange bars represent the drought index magnitude: 0 denotes normal conditions and 3 denotes an extreme drought year. The extreme drought index years are also highlighted with a red circle. Extreme volcanic events from Sigl et al. (2015) are shown in the top panel. Vertical pink shadows indicate extreme and common (for all three clusters) drought periods, while blue shadows indicate common periods with fewer droughts.
In the Ebro Valley, the most extreme years (Fig. 6) (according to the 99th percentile of the years 1650–1899) were 1775 (drought index value of 2.8), 1798 (2.7), 1691 (2.6), 1753 (2.5), and 1817 (2.5). Most of these extreme drought years can also be found in DIMED 1753 (2.6), 1775 (2.5), 1737 (2.3), 1798 (2.2), and 1817 (2.2). In DIMOU, the extreme drought years occurred in the 17th century: 1650 (1.6), 1680 (1.5), 1701 (1.5), and 1685 (1.4), and are spatially displayed in Fig. 7. In the years 1775 and 1798, the Ebro Valley, Mediterranean, and some mountain cites suffered from severe droughts. It is notable that the year 1650 in the Mountain category presented high values of DI, while the other locations had very low DI values (DIEV = 0.4; DIMED = 0.8).

Figure 7Spatial distribution of the most extreme drought years (based on the 99th percentile of the cluster drought indices). The distribution is given in a top-down order. The drought index value (magnitude) for each site within the cluster is also represented. The legend of the drought index value is based on the 30th, 60th, 70th, and 90th percentiles.
We performed a superposed epoch analysis (SEA, see Methods section) to study the drought response over northeast Iberia to major volcanic eruptions (Fig. 8a, b, c). The figure shows significant decreases (ρ<0.05) in the Ebro Valley and Mediterranean DI values during the year a volcanic event occurred and for the following year. We did not find a post-volcanic drought response in the Mountain area. No significant response was found for any of the DIs 2 or 3 years after the volcanic eruptions, including the major ones. However, 2 years after the Tambora eruption in April 1815, there was a significant (ρ<0.05) increase in the three drought indices (DIEV, DIMED, and DIMOU) (Fig. 8d, e, f).
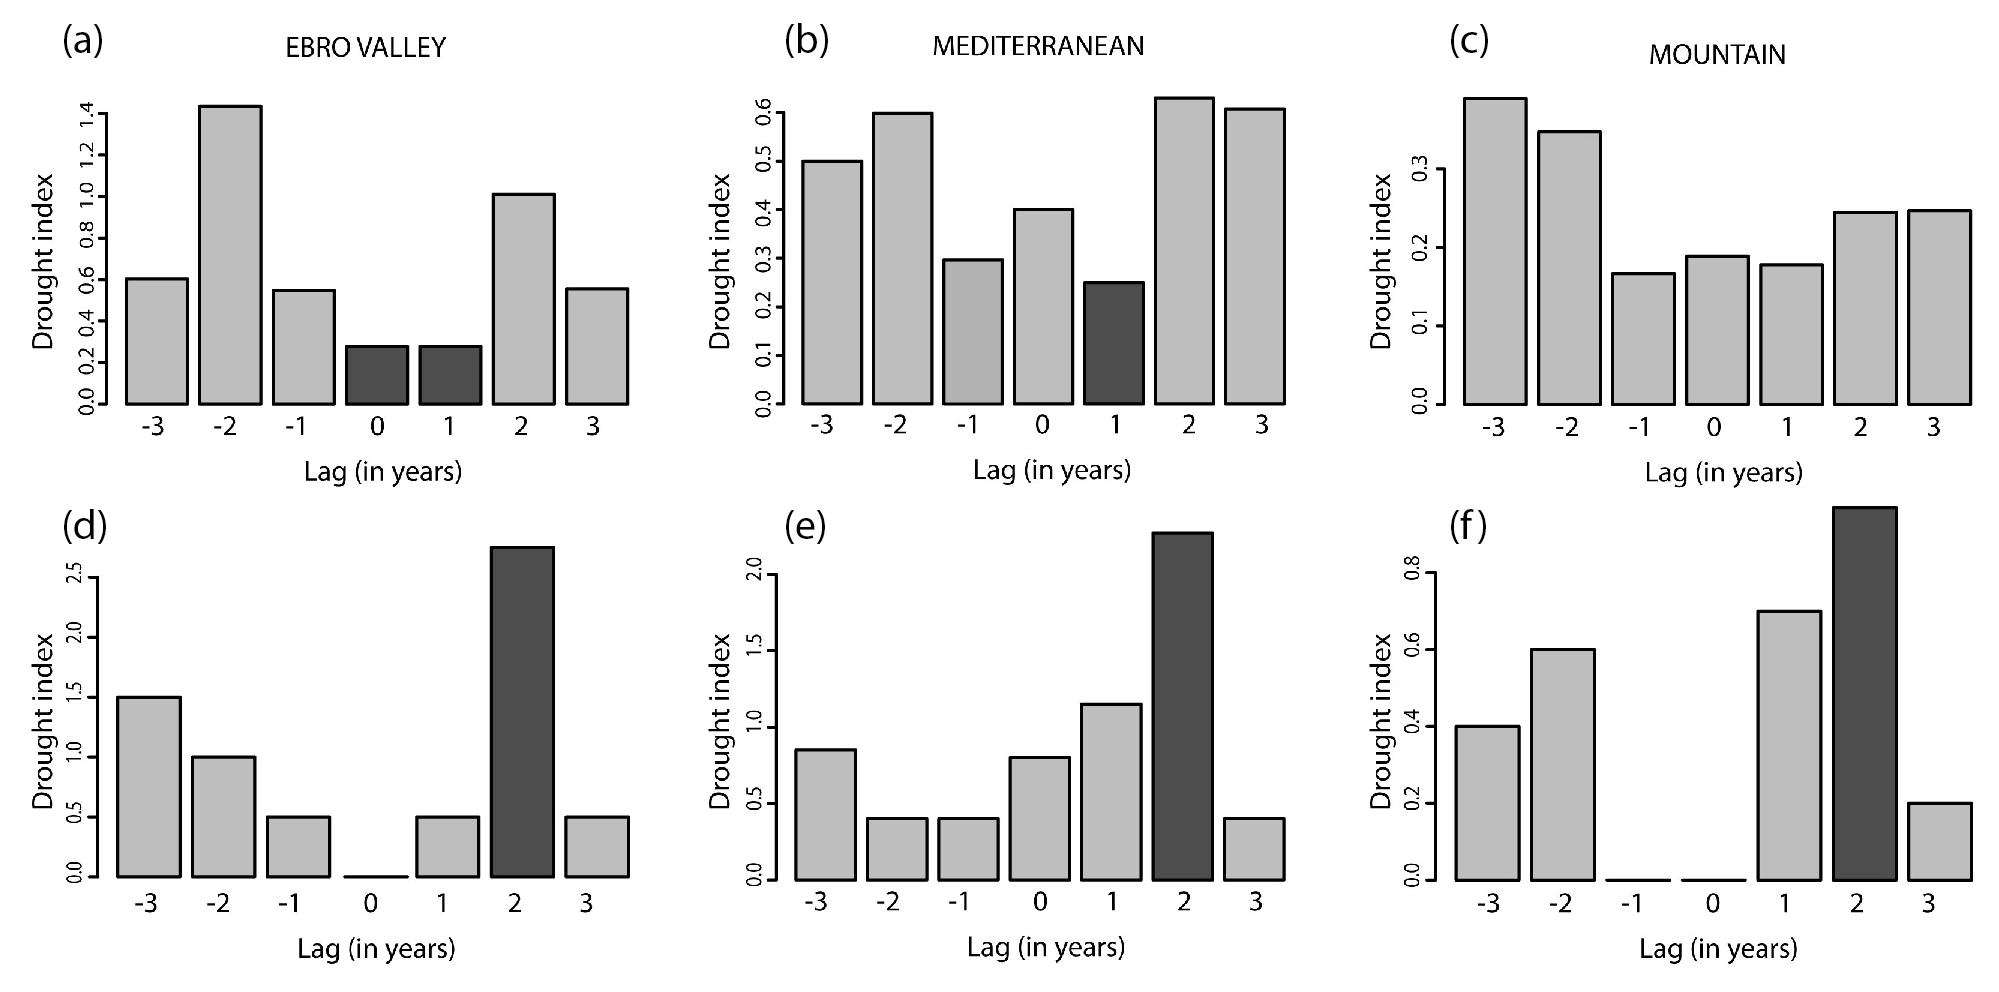
Figure 8(a, b, c) Superposed epoch analysis (SEA) of the three regional drought indices, DIMOU (Mountain), DIEV (Ebro Valley) and DIMED (Mediterranean), with major volcanic events from Sigl et al. (2015). Black shadows show significance at p < 0.01, i.e., significantly lower or higher drought index values after the volcanic event. (d, e, f) SEA of only the Tambora (1815) event showing a significant (p < 0.01) increase in the drought index.
In the northeast Iberian Peninsula, drought recurrence, intensity, persistence, and spatial variability have mainly been studied by using instrumental data covering the past ca. 60 years (Vicente-Serrano et al., 2014; Serrano-Notivoli et al., 2017). In addition, natural proxy data, including specially tree-ring chronologies, have been used to infer drought variability before the instrumental period (Esper et al., 2015; Tejedor et al., 2016, 2017b; Andreu-Hayles et al., 2017). Nevertheless, most of such highly temporally resolved natural proxy-based reconstructions represent high-elevation conditions during specific periods of the year and as a consequence drought behavior in large low-elevation areas remains poorly explored. In these areas, however, documentary records such as rogation ceremonies have demonstrated potential to complement the understanding of droughts across Europe (e.g., Brázdil et al., 2005, 2010, 2018).
Still, rogation ceremonies need to be considered a cultural proxy affected by a certain degree of subjectivity due to the perception of people about hydroclimate events. Accordingly, the analysis must be taken with caution, taking into account their historical and sociological nature. Further limitations are related to their binomial character (occurrence or not of rogation ceremonies), the cumulative character of drought, and the difficulty of the interpretation of sequential rogations or the restrictions to perform a rigorous calibration-verification approach due to a lack of overlapping periods with observational weather series.
Despite these limitations, and potential variations in the timing of occurrences of rogations in different areas or periods due to differences and variations in agricultural practices, we developed drought indices (DI) derived from rogations that occurred from early winter to August, which can be considered reliable drought proxies (even if only in some environments and some specific historical periods). More specifically, we found that (i) DI series exhibit a coherent regional pattern but their reliability is lower in mountain areas and (ii) represent a useful climate proxy for at least the period 1650 to 1830s but its reliability decreases thereafter.
Due to the cumulative character of drought, the delays between drought and rogation occurrence, and their differential influence on different agricultural species and environmental conditions, an accurate definition of the temporal scale in drought that is represented by the rogation is challenging. In this paper, for comparative purposes, a conservative approach is used by combining rogations occurred from December to August in an index trying to account for general drought conditions occurred during the whole crop growing season across the whole study area (spring and summer) but also including previous conditions that may have an impact on final production (spring and winter rogations are likely to reflect drought conditions occurred in the winter and previous autumn).
Further limitations when dealing with historical documents as a climatic proxy are related to converting binomial qualitative information (occurrence or not of rogation ceremonies) into quantitative data (e.g., Vicente-Serrano and Cuadrat, 2007; Domínguez-Castro et al., 2008). Here, we followed the methodology proposed in the Millennium Project (European Commission, IP 017008) and also applied in Domiìnguez-Castro et al. (2012). According to such proceedings and considering both the occurrence or otherwise of rogation ceremonies and the intensity of the religious acts, the information contained in historical documents can be transformed into a semiquantitative time series (including continuous values from 0 to 3). To that extent, the ECDF analysis helped with understanding the nature of the historical documents when transformed into semiquantitative data, confirming that they can be treated as a continuous variable. We then aggregated the annual values to develop a continuous semiquantitative drought index (DI) where values can range from 0 (absence of drought) to a maximum of 3 (severe drought). This set of procedures technically solves the structural problem of the data. However, we have added complexity to its interpretation since, for example, an index of level 2 does not necessarily imply that a drought was twice as intense as a drought classified as level 1 nor that the change in the intensity of droughts from level 1 to level 2 or from level 2 to 3 has to be necessarily equivalent. Yet, we can infer with much confidence that if there was a drought of level 2 it is because those types of ceremonies of level 1, if they occur, did not work, and therefore the drought was still an issue for the development of the crops, i.e., there is a progressive drying but it does not have to be twice as intense. Hence, this must be taken into account when interpreting the indices.
The confirmation of rogation ceremonies as a valid drought proxy requires an additional procedure – the calibration and verification approach. However, continuous rogation documents end in the 19th century, whereas instrumental weather data generally begin in the 20th century (González-Hidalgo et al., 2011). In the study area, only the continuous and homogenized instrumental temperature and precipitation series of Barcelona (Prohom et al., 2012, 2015) overlap the existing drought indices. Our results suggest that rogation ceremonies are not only valid as local indicators (good calibration and verification with the local DIBARCELONA), but they also have regional representativeness (DIMED) and provide valuable climatic information (good calibration and verification with the regional DIMED). To the best of our knowledge, this is the first time that rogation ceremonies in the Iberian Peninsula have been calibrated with such a long instrumental period. The correlation is maximized in May, the key month for the harvest to develop properly. In addition, the 4-month lag confirms the importance of the end of winter and spring precipitation for good crop growth. The high DIMED correlation (; p<0.001) indicates not only that this cluster captures the Mediterranean drought signal but also that it can be used as a semiquantitative proxy, with verification results similar to the standards required in dendroclimatology (Fritts et al., 1990).
In spite of being statistically valid for the whole analyzed period, the suitability of the drought index significantly varies in time. The agreement with instrumental weather data is especially higher during the period 1787–1834 but decrease thereafter. It is challenging to determine whether the decrease in the number of rogations after 1835 is due to the lack of droughts, the loss of documents, or a loss of religiosity. For instance, after the Napoleonic invasion (1808–1814) and the arrival of new liberal ideologies (Trienio Liberal 1820–1823), there was a change in the mentality of people in the big cities. These new liberal ideas were concentrated in the places where commerce and industry began to replace agriculturally based economies, leading to strikes and social demonstrations demanding better labor rights. New societies were less dependent on agriculture, hence, in dry spells, the fear of losing crops was less evident and fewer rogations were performed. In short, the apparent decrease in rogations in the 19th century could be explained by a combination of political instability in the main cities and the loss of religiosity and historical documents. Nevertheless, the institutional controls in pre-industrial society were so strict that many of its constituent parts remained unchanged for centuries, and rogation ceremonies are one of these such elements. This can be explained by two different factors. First, rogation ceremonies are used within the framework of the Roman Catholic Church liturgy, so changes can only be defined and ordered by the Vatican authorities. If there is a will to change criteria affecting the substance of liturgical ceremonies, all involved institutions must record considerations, petitions, and decisions in official documents from official meetings, supported by public notaries. In addition, changes must be motivated from the highest institutional level (Pope) to the regional authorities (Bishops) and local institutions (chapters, parishes, etc.). This system was too complex to favor changes. A second mechanism guarantees the stability of the rogation system: if any minor or important change in rogations was instigated at local level by the population or local institutions, this interference directly affected the Roman Catholic Church liturgy. Then, it was a change not to be taken lightly as the Inquisition court would start judicial proceedings and could bring a criminal charge of heresy. The punishment was so hard that neither institutions nor the people were interested in introducing changes in rogations.
To further calibrate the potential of this source of information as a climatic proxy, we need to consider the existence of coherent spatial patterns in the distribution of droughts. The instrumental climate data are subject to quality controls to determine the extent to which patterns reflect elements of the climatic cycle or may be due to errors of measurement, transcription of information, etc. (e.g., Alexanderson, 1986). In this paper, the local series are compared with the regional reference series as a basic element of quality control (e.g., Serrano-Notivoli et al., 2017). The interpretation of other proxies, such as tree-ring records, are subject to similar quality control procedures to guarantee the spatial representativeness of the information they contain (e.g., Esper et al., 2015; Duchesne et al., 2017; Tejedor et al., 2017b).
We were aware of the potential drawbacks and dealt with the problem of analyzing the spatial representativeness of the rogation series through a cluster analysis. We thus identified the extent to which the local rogation series show similar patterns to those observed in neighboring records and can, therefore, be considered representative of the climate behavior at a subregional scale. Clustering is a descriptive technique (Soni, 2012), the solution is not unique, and the results strongly rely upon the analyst's choice of parameter. However, we found three significant (p<0.05) and consistent structures across the drought indices based on historical documents. DIEV shows a robust and coherent cluster associated with droughts in the Ebro Valley area, including the cities of Zaragoza and Calahorra. The high correlation among the local drought indices suggests an underlying coherent climatic signal. DIMED shows also a robust and coherent cluster associated with droughts in the Mediterranean coast area, including high correlation between the local drought indices of Tortosa, Tarragona, Barcelona, Vic, and Cervera. The high correlation between DIEV and DIMED suggests similar climatic characteristics. Furthermore, the main cities among these two clusters share similar agrarian and political structures that support the comparison. Still, we know from observations that although DIEV and DIMED locations have similar climatic characteristics, the Mediterranean coast locations have slightly higher precipitation totals, which is supported by the cluster. One is reflecting the Ebro Valley conditions and the other is reflecting a more Mediterranean-like climate. Therefore, our final grouping is not only statistically significant but it also has a geographical or physical meaning.
We found that DIMOU shows a less robust and complex structure. This cluster includes local drought indices located in mountain or near-mountain environments. Although there is a high correlation between the local DIs and the regional DIMOU suggesting a common climatic signal, the low correlation among local drought indices might be explained by the fact that the productive system of the mountain areas is not only based on agriculture but also on animal husbandry, giving them an additional resource for survival in cases of extreme drought. Therefore, the DIMOU cluster might not only be collecting climatic information but also diverse agricultural practices or even species, translated into a weaker regional common pattern. For instance, Cervera and Lleida share similar annual precipitation totals, but belong to the Mediterranean and the mountain drought indices, respectively. Lleida is located in a valley with an artificial irrigation system since the Muslim period, which is fed by the river Segre (one of the largest tributaries to the Ebro river). The drought in the Pyrenees is connected with a shortage of water for the production of energy in the mills, as well as to satisfy irrigated agriculture. However, the irrigation system itself allowed Lleida to manage the resource and hold out much longer. Therefore, only the most severe droughts, and even those in an attenuated form, were perceived in the city. Cervera, located in the Mediterranean mountains, in the so-called pre-littoral system and its foothills, has a different precipitation dynamic that is more sensitive to the arrival of humid air from the Mediterranean. In addition, Lleida had a robust irrigation system that Cervera did not have. The droughts in Cervera are more akin to the Mediterranean ones and thus its presence in the Mediterranean drought index seems to be consistent.
DIMOU has a weaker climatological support and thus it should be interpreted with particular caution. Yet, this important constraint in the interpretation of DIMOU is not problematic from a practical point of view since it represents an area in which there are other proxy records (e.g., tree rings) covering a wide spatiotemporal scale and valuable as drought proxies (e.g., Tejedor et al., 2016, 2017b). The consistency of the clusters in the Ebro Valley and the coastal zones (DIMED and DIEV) is especially encouraging and reflects the high potential of rogations as a drought proxy. It is precisely in these areas that there are no relict forests, due to human intervention, and therefore no centennial tree-ring reconstructions can be performed to infer past climates. Consequently, in these environments, the information from historical documents is especially relevant.
These findings open a new line of research that the authors will continue exploring in future studies. We believe that these results highlight the validity of the drought indices to be taken as continuous variables. In addition, the analysis confirmed that the grouping made by the cluster analysis demonstrates spatial coherency among the historical documents. For some places such as the mountain areas, where the population had other ways of life in addition to agriculture, pro pluviam rogation ceremonies may have a weaker climatic significance. However, pro pluviam rogations may be especially relevant in valleys and coastal areas where there are no other climatic proxies. The exploration of historical documents from the main Cathedrals or municipal city archives, the Actas Capitulares, yielded the different types and payments of the rogation ceremonies that were performed in drought-stressed situations.
Despite general limitations, our results are comparable and in agreement with other drought studies based on documentary sources describing the persistent drought phase affecting the Mediterranean and the Ebro Valley areas in the second half of the 18th century (as found in Vicente-Serrano and Cuadrat, 2007, for Zaragoza). The results for the second half of the 18th century also agree with the drought patterns previously described for Catalonia (Barriendos, 1997, 1998; Martín-Vide and Barriendos, 1995). Common drought periods were also found in 1650–1775 for Andalusia (Rodrigo et al., 1999, 2000) and in 1725–1800 for Zamora (Domínguez-Castro et al., 2008). In general, based on documentary sources from Mediterranean countries, the second half of the 18th century had the highest drought persistency and intensity, which may be because there were more blocking situations in this period (Luterbacher et al., 2002; Vicente-Serrano and Cuadrat, 2007). The period of 1740–1800 CE coincides with the so-called “Maldá anomaly period”, a phase characterized by strong climatic variability including extreme drought and wet years (Barriendos and Llasat, 2003). The 18th century is the most coherent period including a succession of dry periods (1740–1755), extreme years (1753, 1775 and 1798), and years with very low DIs, which we interpret as normal years. Next, the period from 1814 to 1825 is noteworthy due to its prolonged drought. The causes of this extreme phase are still unknown although Prohom et al. (2015) suggested that there was a persistent situation of atmospheric blocking and high-pressure conditions at the time.
Results are also in line with described hydroclimatic responses to volcanic forcing. In the Ebro Valley and the Mediterranean area, rogation ceremonies were significantly less frequent in the year of volcanic eruptions and for the following year. Such patterns may be explained by the volcanic winter conditions, which are associated with reductions in temperature over the Iberian Peninsula 1–3 years after the eruption (Fischer et al., 2007; Raible et al., 2016). The lower temperature is experienced in spring and summer after volcanic eruptions compared to spring and summer conditions of nonvolcanic years. This might be related to a reduction in evapotranspiration, which reduces the risk of droughts. This reinforces the significance of volcanic events in large-scale climate changes. Furthermore, a significant increase in the intensity of the droughts was observed 2 years after the Tambora eruption in the three clusters (Fig. 8d, e, f) in agreement with findings by Trigo et al. (2009). This result is similar to that of a previous study using rogation ceremonies in the Iberian Peninsula, although it was based on individual and not regional drought indices (Domínguez-Castro et al., 2010). In addition, the normal conditions in the year of the Tambora eruption and the following year, and the increased drought intensity 2 years after the event, are in agreement with recent findings on hydroclimatic responses after volcanic eruptions (Fischer et al., 2007; Wegmann et al., 2014; Rao et al., 2017; Gao and Gao, 2017), although based on tree-ring data only. In addition, Gao and Gao (2017) highlight the fact that high-latitude eruptions tend to cause drier conditions in western-central Europe 2 years after the eruptions. Rao et al. (2017) suggested that the forced hydroclimatic response was linked to a negative phase of the east Atlantic pattern (EAP), which causes anomalous spring uplift over the western Mediterranean. This pattern was also found in our drought index for the Tambora eruption (1815 CE) but no significant pattern was found in northeast Spain for the other major (according to Sigl et al., 2015) volcanic eruptions. In particular, the mountain areas show less vulnerability to drought compared to the other regions. This is mainly due to the fact that mountainous regions experience less evapotranspiration, more snow accumulation, and convective conditions that lead to a higher frequency of thunderstorms during the summertime. Volcanic forcing, however, may differentially modulate seasonal climate conditions by their influence on the North Atlantic Oscillation and in the east Atlantic circulation patterns. This seasonal detail cannot be clarified in our research due to the annual scale used to compute the drought indices.
We developed a new dataset of historical documents by compiling historical records (rogation ceremonies) from 13 cities in the northeast of the Iberian Peninsula. These records were transformed into semiquantitative continuous data to develop drought indices (DIs). We regionalized them by creating three DIs (Ebro Valley, Mediterranean, and Mountain) covering the period from 1650 to 1899 CE. The intensity of the DI is given by the strength and magnitude of the rogation ceremony and the spatial extent of the DI is given by the cities where the rogations were held.
Our study highlights three considerations: (i) the spatial and temporal resolution of rogations should be taken into account, particularly when studying specific years, since the use of pro pluviam rogations gives information about drought periods and not about rainfall in general. Accordingly, it must be stressed that the drought indices developed here are not precipitation reconstructions; rather, they are high-resolution extreme event reconstructions of droughts spells. The comparison of these results with other continuous proxy records must be carried out with caution (Domínguez-Castro et al., 2008), although here we found a very high and stable correlation with the instrumental series for the overlapping period, which opens new lines of research. (ii) The validity of rogation ceremonies as a high-resolution climatic proxy to understand past drought variability in the coastal and lowland regions of the northeastern Mediterranean Iberian Peninsula is clearly supported by our study. This is crucial, considering that most of the high-resolution climatic reconstructions for the northern Iberian Peninsula have been developed using tree-ring records collected from high-elevation sites (> 1600 m a.s.l.) in the Pyrenees (Büntgen et al., 2008, 2017; Dorado-Liñán et al., 2012) and the Iberian Range (Esper et al., 2015; Tejedor et al., 2016, 2017a, b; Tejedor, 2017) to deduce the climate of mountainous areas. (iii) Particularly in the Mediterranean and in the Ebro Valley areas, significant imprints of volcanic eruptions are found in the drought indices derived from the rogation ceremonies. These results suggest that DI is a good proxy to identify years with extreme climate conditions in the past at low-elevation sites.
In addition, recent studies have emphasized the great precipitation (González-Hidalgo et al., 2011; Serrano-Notivoli et al., 2017) and temperature variabilities (González-Hidalgo et al., 2015) within reduced spaces, including those with a large altitudinal gradient, such as our study area. Finally, the historical data from rogations covers a gap within the instrumental measurement record of Spain (i.e., which starts in the 20th century). Hence, rogation data are key to understanding the full range of past climate characteristics (in lowlands and coastal areas) in order to accurately contextualize current climate change. We encourage the use of further studies to better understand past droughts and their influence on societies and ecosystems; learning from the past can help to adapt to future scenarios, especially because climate variability is predicted to increase in the same regions where it has historically explained most of the variability in crop yields.
The datasets generated and/or analyzed during the current study are available from the corresponding author on reasonable request.
The supplement related to this article is available online at: https://doi.org/10.5194/cp-15-1647-2019-supplement.
ET and JMC conceived the study. JMC and MB provided the data. ET and MdL conducted the data analysis, and ET wrote the paper with suggestions of all the authors. All authors discussed the results and implications and commented on the article at all stages.
The authors declare that they have no conflict of interest.
This article is part of the special issue “Droughts over centuries: what can documentary evidence tell us about drought variability, severity and human responses?”. It is not associated with a conference.
We would like to thank the support of all the custodians of the historical documents.
This research has been supported by the Ministry of Economy, Industry and Competitiveness (grant no. CGL2015-69985).
This paper was edited by Rudolf Brazdil and reviewed by four anonymous referees.
Abrantes, F., Rodrigues, T., Rufino, M., Salgueiro, E., Oliveira, D., Gomes, S., Oliveira, P., Costa, A., Mil-Homens, M., Drago, T., and Naughton, F.: The climate of the Common Era off the Iberian Peninsula, Clim. Past, 13, 1901–1918, https://doi.org/10.5194/cp-13-1901-2017, 2017.
Alcoforado, M. J., Nunes, M. F., Garcia, J. C., and Taborda, J. P.: Temperature and precipitation reconstruction in southern Portugal during the late Maunder Minimum (AD 1675–1715), The Holocene, 10, 333–340, 2000.
Alexandersson, H.: A homogeneity test applied to precipitation data, J. Climatol., 6, 661–675, 1986.
Andreu-Hayles, L., Ummenhofer, C. C., Barriendos, M., Schleser, G. H., Helle, G., Leuenberger, M., Gutierrez, E., and Cook, E. R.: 400 years of summer hydroclimate from stable isotopes in Iberian trees, Clim. Dynam., 49, 143–161, https://doi.org/10.1007/s00382-016-3332-z, 2017.
Austin, R. B., Cantero-Martínez, C., Arrúe, J. L., Playán, E., and Cano-Marcellán, P.: Yield-rainfall relationships in cereal cropping systems in the Ebro river valley of Spain, Eur. J. Agro., 8, 239–248, 1998a.
Austin, R. B., Playán, E., and Gimeno, J.: Water storage in soils during the fallow: prediction of the effects of rainfall pattern and soil conditions in the Ebro valley of Spain, Agric. Water Manag., 36, 213–231, 1998b.
Barriendos, M.: El clima histórico de Catalunya (siglos XIV–XIX) Fuentes, métodos y primeros resultados, Revista de Geografía, XXX–XXXI, 69–96, 1996–1997.
Barriendos, M.: Climatic variations in the Iberian Peninsula during the late Maunder minimum (AD 1675–1715): An analysis of data from rogation ceremonies, The Holocene, 7, 105–111, 1997.
Barriendos, M.: Climate and Culture in Spain, Religious Responses to Extreme Climatic Events in the Hispanic Kingdoms (16th–19th Centuries), in: Cultural Consequences of the Little Ice Age, edited by: Behringer, W., Lehmann, H., and Pfister, C., Vandenhoeck & Ruprecht, Göttingen, 2005.
Barriendos, M. and Llasat, M. C.: The Case of the “Maldá” Anomaly in the Western Mediterranean Basin (AD 1760–1800): An Example of a Strong Climatic Variability, Clim. Change, 61, 191–216, 2003.
Beguería, S., Vicente-Serrano, S. M., Reig, F., and Latorre, B.: Standardized Precipitation Evapotranspiration Index (SPEI) revisited: parameter fitting, evapotranspiration models, kernel weighting, tools, datasets and drought monitoring, Int. J. Climatol., 34, 3001–3023, https://doi.org/10.1002/joc.3887, 2014.
Benito, G., Diez-Herrero, A., Fernao, G., and de Villalta, M.: Magnitude and frequency of flooding in the Tagus Basin (Central Spain) over the last millennium, Clim. Change, 58, 171–192, 2003.
Benito, G., Thorndycraft, V. R., Rico, M., Sanchez-Moya, Y., and Sopena, A.: Palaeoflood and floodplain records from Spain: evidence for long-term climate variability and environmental changes, Geomorph., 101, 68–77, 2008.
Brázdil, R., Pfister, C., Wanner, H., von Storch, H., and Luterbacher, J.: Historical climatology in Europe – the state of the art, Clim. Change, 70, 363–430, https://doi.org/10.1007/s10584-005-5924-1, 2005.
Brázdil, R., Dobrovolný, P., Luterbacher, J., Moberg, A., Pfister, C., Wheeler, D., and Zorita, E.: European climate of the past 500 years: new challenges for historical climatology, Clim. Change, 101, 7–40, https://doi.org/10.1007/s10584-009-9783-z, 2010.
Brázdil, R., Dobrovolný, P., Trnka, M., Kotyza, O., Řezníčková, L., Valášek, H., Zahradníček, P., and Štěpánek, P.: Droughts in the Czech Lands, 1090–2012 AD, Clim. Past, 9, 1985–2002, https://doi.org/10.5194/cp-9-1985-2013, 2013.
Brázdil, R., Dobrovolný, P., Trnka, M., Büntgen, U., Řezníčková, L., Kotyza, O., Valášek, H., and Štěpánek, P.: Documentary and instrumental-based drought indices for theCzech Lands back to AD 1501, Clim. Res., 70, 103–117, https://doi.org/10.3354/cr01380, 2016.
Brázdil, R., Kiss, A., Luterbacher, J., Nash, D. J., and Řezníčková, L.: Documentary data and the study of past droughts: a global state of the art, Clim. Past, 14, 1915–1960, https://doi.org/10.5194/cp-14-1915-2018, 2018.
Brázdil, R., Dobrovolný, P., Trnka, M., Řezníčková, L., Dolák, L., and Kotyza, O.: Extreme droughts and human responses to them: the Czech Lands in the pre-instrumental period, Clim. Past, 15, 1–24, https://doi.org/10.5194/cp-15-1-2019, 2019.
Brewer, S., Alleaume, S., Guiot, J., and Nicault, A.: Historical droughts in Mediterranean regions during the last 500 years: a data/model approach, Clim. Past, 3, 355-366, https://doi.org/10.5194/cp-3-355-2007, 2007.
Bunn, A. G.: A dendrochronology program library in R (dplR), Dendrochronologia, 26, 115–124, 2008.
Büntgen, U., Frank, D., Grudd, H., and Esper, J.: Long-term summer temperature variations in the Pyrenees, Clim. Dyna., 31, 615–631, 2008.
Büntgen, U., Trouet, V., Frank, D., Leuschner, H. H., Friedrichs, D., Luterbacher, J., and Esper, J.: Tree-ring indicators of German summer drought over the last millennium, Quaternary Sci. Rev., 29, 1005–1016, 2010.
Büntgen, U., Tegel, W., Nicolussi, K., McCormick, M., Frank, D., Trouet, V., Kaplan, J., Herzig, F., Heussner, U., Wanner, H., Luterbacher, J., and Esper, J.: 2500 years of European climate variability and human susceptibility, Science, 331, 578–582, 2011.
Büntgen, U., Krusic, P. J., Verstege, A., Sangüesa Barreda, G., Wagner, S., Camarero, J. J., Ljungqvist, F. C., Zorita, E., Oppenheimer, C., Konter, O., Tegel, W., Gärtner, H., Cherubini, P., Reinig, F., and Esper, J.: New tree-ring evidence from the Pyrenees reveals Western Mediterranean climate variability since medieval times, J. Climate, 30, 5295–5318, 2017.
Carro-Calvo, L., Salcedo-Sanz, S., and Luterbacher, J.: Neural Computation in Paleoclimatology: General methodology and a case study, Neurocomputing, 113, 262–268, 2013.
Cook, E. R., Seager, R., Kushnir, Y., Briffa, K. R., Büntgen, U., Frank, D., Krusic, P. J., Tegel, W., Schrier, G. V., Andreu-Hayles, L., Baillie, M., Baittinger, C., Bleicher, N., Bonde, N., Brown, D., Carrer, M., Cooper, R., Eùfar, K., DIttmar, C., Esper, J., Griggs, C., Gunnarson, B., Günther, B., Gutierrez, E., Haneca, K., Helama, S., Herzig, F., Heussner, K. U., Hofmann, J., Janda, P., Kontic, R., Köse, N., Kyncl, T., Levaniè, T., Linderholm, H., Manning, S., Melvin, T. M., Miles, D., Neuwirth, B., Nicolussi, K., Nola, P., Panayotov, M., Popa, I., Rothe, A., Seftigen, K., Seim, A., Svarva, H., Svoboda, M., Thun, T., Timonen, M., Touchan, R., Trotsiuk, V., Trouet, V., Walder, F., Wany, T., Wilson, R., and Zang, C.: Old World megadroughts and pluvials during the Common Era, Sci. Adv., 1, e1500561, https://doi.org/10.1126/sciadv.1500561, 2015.
Diodato, N. and Bellocchi, G.: Historical perspective of drought response in central-southern Italy, Clim. Res., 49, 189–200, https://doi.org/10.3354/cr01020, 2011.
Dobrovolný, P., Brázdil, R., Trnka, M., Kotyza, O., and Valášek, H.: Precipitation reconstruction for the Czech Lands, AD 1501–2010, Int. J. Climatol., 35, 1–14, https://doi.org/10.1002/joc.3957, 2015a.
Dobrovolný, P., Rybníček, M., Kolář, T., Brázdil, R., Trnka, M., and Büntgen, U.: A tree-ring perspective on temporal changes in the frequency and intensity of hydroclimatic extremes in the territory of the Czech Republic since 761 AD, Clim. Past, 11, 1453–1466, https://doi.org/10.5194/cp-11-1453-2015, 2015b.
Dobrovolný, P., Rybníček, M., Kolář, T., Brázdil, R., Trnka, M., and Büntgen, U.: May–July precipitation reconstruction from oak tree-rings for Bohemia (Czech Republic) since AD 1040, Int. J. Climatol., 38, 1910–1924, https://doi.org/10.1002/joc.5305, 2018.
Domínguez-Castro, F. and García-Herrera, R.: Documentary sources to investigate multidecadal variability of droughts, Geograph. Res. Lett., 42, 13–27, 2016.
Domínguez-Castro, F., Santisteban, J. I., Barriendos, M., and Mediavilla, R.: Reconstruction of drought episodes for central Spain from rogation ceremonies recorded at Toledo Cathedral from 1506 to 1900: A methodological approach, Global Planet. Change, 63, 230–242, 2008.
Domínguez-Castro, F., Ribera, P., García-Herrera, R., Vaquero, J. M., Barriendos, M., Cuadrat, J. M., and Moreno, J. M.: Assessing extreme droughts in Spain during 1750–1850 from rogation ceremonies, Clim. Past, 8, 705–722, https://doi.org/10.5194/cp-8-705-2012, 2012.
Domínguez-Castro, F., de Miguel, J. C., Vaquero, J. M., Gallego, M. C., and García-Herrera, R.: Climatic potential of Islamic chronicles in Iberia: Extreme droughts (AD 711–1010), The Holocene, 24, 370–374, 2014.
Dorado-Liñán, I., Büntgen, U., González-Rouco, F., Zorita, E., Montávez, J. P., Gómez-Navarro, J. J., Brunet, M., Heinrich, I., Helle, G., and Gutiérrez, E.: Estimating 750 years of temperature variations and uncertainties in the Pyrenees by tree-ring reconstructions and climate simulations, Clim. Past, 8, 919–933, https://doi.org/10.5194/cp-8-919-2012, 2012.
Duchesne, L., D’Orangeville, L., Ouimet, R., Houle, D., and Kneeshaw, D.: Extracting coherent tree-ring climatic signals across spatial scales from extensive forest inventory data, PLoS ONE, 12, e0189444, https://doi.org/10.1371/journal.pone.0189444, 2017.
Efron, B: Bootstrap Methods: Another Look at the Jackknife, Ann. Statist., 7, 1–26, 1979.
Eslamian, S. and Eslamian. F. A. (Eds.): Handbook of Drought and Water Scarcity, Principle of Drought and Water Scarcity, CRC Press, Tailor & Francis LTD, Boca Raton, https://doi.org/10.1201/9781315226781, 2017.
Esper, J., Großjean, J., Camarero, J. J., García-Cervigón, A. I., Olano, J. M., González-Rouco, J. F., Domínquez-Castro, F., and Büntgen, U.: Atlantic and Mediterranean synoptic drivers of central Spanish juniper growth, Theor. Appl. Climatol. 121, 571–579, 2015.
Esper, J., Büntgen, U., Denzer, S., Krusic, P. J., Luterbacher, J., Schäfer, R., Schreg, R., and Werner, J.: Environmental drivers of historical grain price variations in Europe, Clim. Res., 72, 39–52, 2017.
Everitt, B. S., Landau, S., and Leese, M.: Cluster Analysis, 4th edn., Oxford University Press, New York, 2001.
Fierro, A.: Histoire de la météorologie, Denoël, Paris, 1991.
Fischer, E. M., Luterbacher, J., Zorita, E., Tett, S. F. B., Casty, C., and Wanner, H.: European climate response to tropical volcanic eruptions over the last half millennium, Geophys. Res. Lett., 34, L05707, https://doi.org/10.1029/2006GL027992, 2007.
Fritts, H. C., Guiot, J., Gordon, G. A., and Schweingruber, F.: Methods of Calibration, Verification, and Reconstruction, in: Methods of Dendrochronology, edited by: Cook, E. R. and Kairiukstis, L. A., Springer, Dordrecht, 1990.
Gao, Y. and Gao, C.: European hydroclimate response to volcanic eruptions over the past nine centuries, Int. J. Climatol., 37, 4146–4157, 2017.
García-Herrera, R., García, R. R., Prieto, M. R., Hernández, E., Gimeno, L., and Díaz, H. F.: The use of Spanish historical archives to reconstruct climate variability, B. Am. Meteorol. Soc., 84, 1025–1035, 2003.
García-Herrera, R., Paredes, D., Trigo, R., Trigo, I. F., Hernández, E., Barriopedro, D., and Mendes, M. A.: The Outstanding 2004/05 Drought in the Iberian Peninsula: Associated Atmospheric Circulation, J. Hydrometeorol., 8, 483–498, 2007.
González-Hidalgo, J. C., Brunetti, M., and de Luis, M.: A new tool for monthly precipitation analysis in Spain: MOPREDAS database (monthly precipitation trends December 1945–November 2005), Int. J. Climatol., 31, 715–731, 2011.
González-Hidalgo, J. C., Peña-Angulo, D., Brunetti, M., and Cortesi, N.: MOTEDAS: a new monthly temperature database for mainland Spain and the trend in temperature (1951–2010), Int. J. Climatol., 35, 4444–4463, 2015.
Hanel, M., Rakovec, O., Markonis, Y., Máca, P., Samaniego, L., Kyselý, J., and Kumar, R.: Revisiting the recent European droughts from a long-term perspective, Nat. Sci. Rep., 22, 9499, https://doi.org/10.1038/s41598-018-27464-4, 2018.
López-Moreno, J. I. and Vicente-Serrano, S. M.: Atmospheric circulation influence on the interannual variability of snow pack in the Spanish Pyrenees during the second half of the 20th century, Hydrol. Res., 38, 33–44, 2007.
Luterbacher, J., Xoplaki, E., Dietrich, D., Rickli, R., Jacobeit, J., Beck, C., Gyalistras, D., Schmutz, C., and Wanner, H.: Reconstruction of Sea Level Pressure fields over the Eastern North Atlantic and Europe back to 1500, Clim. Dynam., 18, 545–561, 2002.
Martín-Vide, J. and Barriendos, M.: The use of rogation ceremony records in climatic reconstruction: a case study from Catalonia (Spain), Clim. Change, 30, 201–221, 1995.
Martín-Vide, J. and Fernández, D.: El índice NAO y la precipitación mensual en la España peninsular, Investigaciones Geográficas, 26, 41–58, 2001.
McAneney, K. J. and Arrúe, J. L.: A wheat-fallow rotation in northeastern Spain: water balance – yield considerations, Agronomie, 13, 481–490, 1993.
McKee, T. B., Doesken, N. J., and Kliest, J.: The relationship of drought frequency and duration to time scales, in: Proceedings of the 8thConference on Applied Climatology, Anaheim, CA, USA, 170022, American Meteorological Society, Boston, MA, USA, 179–184, 1993.
Mikšovský, J., Brázdil, R., Trnka, M., and Pišoft, P.: Long-term variability of drought indices in the Czech Lands and effects of external forcings and large-scale climate variability modes, Clim. Past, 15, 827–847, https://doi.org/10.5194/cp-15-827-2019, 2019.
Možný, M., Brázdil, R., Dobrovolný, P., Trnka, M., Potopová, V., Hlavinka, P., Bartošová,L., Zahradníček, P., and Žalud, Z.: Drought reconstruction based on grape harvest dates forthe Czech Lands, 1499–2012, Clim. Res., 70, 119–132, https://doi.org/10.3354/cr01423, 2016.
Panofsky, H. A. and Brier, G. W.: Some applications of statistics to meteorology, Pennsylvania: University Park, 1958.
Pauling, A., Luterbacher, J., Casty, C., and Wanner, H.: Five hundred years of gridded high- resolution precipitation reconstructions over Europe and the connection to large-scale circulation, Clim. Dynam., 26, 387–405, 2006.
Prohom, M., Barriendos, M., Aguilar, E., and Ripoll, R.: Recuperación y análisis de la serie de temperatura diaria de Barcelona, 1780–2011, Cambio Climático, Extremos e Impactos, Asociación Española de Climatología, Serie A, 8, 207–217, 2012.
Prohom, M., Barriendos, M., and Sanchez-Lorenzo, A.: Reconstruction and homogenization of the longest instrumental precipitation series in the Iberian Peninsula (Barcelona, 1786–2014), Int. J. Climatol., 36, 3072–3087, 2015.
Raible, C. C., Brönnimann, S., Auchmann, R., Brohan, P., and Wegman, M.: Tambora 1815 as a test case for high impact volcanic eruptions: Earth system effects, WIREs Clim. Change, 7, 569–589, 2016.
Rao, M. P., Cook, B. I., Cook, E. R., D’Arrigo, R. D., Krusic, P. J., Anchukaitis, K. J., LeGrande, A. N., Buckley, B. M., Davi, N. K., Leland, C., and Griffin, K. L.: European and Mediterranean hydroclimate responses to tropical volcanic forcing over the last millennium, Geophys. Res. Lett., 44, 5104–5112, 2017.
Ray, D. K., Gerber, J. S., MacDonald, G. K., and West, P. C.: Climate variation explains a third of global crop yield variability, Nat. Commun. 6, 5989, https://doi.org/10.1038/ncomms6989, 2015.
Rodrigo, F. S., Esteban-Parra, M. J., Pozo-Vázquez, D., and Castro-Díez, Y.: A 500-year precipitation record in southern Spain, Int. J. Climatol, 19, 1233–1253, 1999.
Rodrigo, F. S., Esteban-Parra, M. J., Pozo-Vázquez, D., and Castro-Díez, Y.: Rainfall variability in southern Spain on decadal to centennial times scales, Int. J. Climatol., 20, 721–732, 2000.
Russo, A., Gouveia, C., Trigo, R., Liberato, M. L. R., and DaCamara, C. C.: The influence of circulation weather patterns at different spatial scales on drought variability in the Iberian Peninsula, Front. Environ. Sci., 3, 1, https://doi.org/10.3389/fenvs.2015.00001, 2015.
Scandlyn, J., Simon, C. N., Thomas, D. S. K., and Brett, J.: Theoretical Framing of worldviews, values, and structural dimensions of disasters, in: Social Vulnerability to disasters, Phillips, B. D., Thomas, D. S. K., Fothergill, A., and Blinn-Pike, L., CRC Press Taylor & Francis Group, Cleveland, 2010.
Serrano-Notivoli, R., Beguería, S., Saz, M. Á., Longares, L. A., and de Luis, M.: SPREAD: a high-resolution daily gridded precipitation dataset for Spain – an extreme events frequency and intensity overview, Earth Syst. Sci. Data, 9, 721–738, https://doi.org/10.5194/essd-9-721-2017, 2017.
Sigl, M., Winstrup, M., McConnell, J. R., Welten, K. C., Plunkett, G., Ludlow, F., Woodruff, T. E.: Timing and climate forcing of volcanic eruptions for the past 2500 years, Nature, 523, 543–549, 2015.
Spinoni, J., Naumann, G., Vogt, J. V., and Barbosa, P.: The biggest drought events in Europe from 1950 to 2012, J. Hydrol. Reg. Stud., 3, 509–524, 2015.
Spinoni, J., Vogt, J. V., Naumann, G., Barbosa, P., and Dosio, A.: Will drought events become more frequent and severe in Europe?, Int. J. Climatol, 38, 1718–1736, https://doi.org/10.1002/joc.5291, 2018.
Soni, T.: An overview on clustering methods, IOSR J. Engineering, 2, 719–725, 2012.
Stagge, J. H., Kingston, D. G., Tallaksen, L. M., and Hannah, D. M.: Observed drought indices show increasing divergence across Europe, Nat. Sci. Rep., 7, 14045, https://doi.org/10.1038/s41598-017-14283-2, 2017.
Suzuki, R. and Shimodaira, H:. Pvclust: An R package for assessing the uncertainty in hierarchical clustering, Bioinformatics, 22, 1540–1542, 2006.
Tejedor, E.: Climate variability in the northeast of Spain since the 17th century inferred from instrumental and multiproxy records, PhD thesis, University of Zaragoza, Zaragoza (Spain), 2017.
Tejedor, E., de Luis, M., Cuadrat, J. M., Esper, J., and Saz, M. A.: Tree-ring-based drought reconstruction in the Iberian Range (east of Spain) since 1694, Int. J. Biometerol., 60, 361–372, 2016.
Tejedor, E., Saz, M. Á., Cuadrat, J. M., Esper, J., and de Luis, M.: Temperature variability in the Iberian Range since 1602 inferred from tree-ring records, Clim. Past, 13, 93–105, https://doi.org/10.5194/cp-13-93-2017, 2017a.
Tejedor, E., Saz, M. A., Cuadrat, J. M., Esper, J., and de Luis, M.: Summer drought reconstruction in Northeastern Spain inferred from a tree-ring latewood network since 1734, Geophys. Res. Lett., 44, 8492–8500, 2017b.
Toreti, A., Belward, A., Perez-Dominguez, I., Naumann, G., Manfron, G., Luterbacher, J., Cronie, O., Seguini, L., Baruth, B., van den Berg, M., Dentener, F., Ceglar, A., Chatzopoulos, T., and Zampieri, M.: The exceptional 2018 European water seesaw calls for action on adaptation, Earth Fut., 7, 652–663, 2019.
Trigo, R. M., Vaquero, J. M., Alcoforado, M. J., Barriendos, M., Taborda, J., García-Herrera, R., and Luterbacher, J.: Iberia in 1816, the year without summer, Int. J. Climatol., 29, 99–115, 2009.
Trigo, R. M., Añel, J. A., Barriopedro, D., García-Herrera, R., Gimeno, L., Nieto, R., Castillo, R., Allen, M. R., and Massey, N.: The record Winter drought of 2011–12 in the Iberian Peninsula, in: Explaining Extreme Events of 2012 from a Climate Perspective, Bull. Am. Meteorol. Soc., 94, 41–45, 2013.
Turco, M., von Hardenberg, J., AghKouchak, A., Llasat, M. C., Provenzale, A., and Trigo, R.: On the key role of droughts in the dynamics of summer fires in Mediterranean Europe, Nat. Sci. Rep. 7, 81, https://doi.org/10.1038/s41598-017-00116-9, 2017.
Vicente-Serrano, S. M.: Las sequías climáticas en el valle medio del Ebro: Factores atmosféricos, evolución temporal y variabilidad espacial, Consejo de Protección de la Naturaleza de Aragón, Zaragoza, 277 pp., 2005.
Vicente-Serrano, S. M.: Spatial and temporal analysis of droughts in the Iberian Peninsula (1910–2000), Hydrol. Sci. J., 51, 83–97, 2006.
Vicente-Serrano, S. M. and Cuadrat, J. M.: North Atlantic oscillation control of droughts in north-east Spain: Evaluation since 1600 A.D, Clim. Change, 85, 357–379, 2007.
Vicente-Serrano, S. M., Beguería, S., and López-Moreno J. I.: A Multi-scalar drought index sensitive to global warming: The Standardized Precipitation Evapotranspiration Index – SPEI, J. Clim., 23, 1696, https://doi.org/10.1175/2009JCLI2909.1, 2010.
Vicente-Serrano, S. M., López-Moreno, J. I., Beguería, S., Lorenzo-Lacruz, J., Sánchez-Lorenzo, A., García-Ruiz, J. M., Azorín-Molina, E., Morán-Tejeda, E., Revuelto, J., Trigo, R., Coelho, F., and Espejo, F.: Evidence of increasing drought severity caused by temperature rise in southern Europe, Environ. Res. Lett., 9, 44001, https://doi.org/10.1088/1748-9326/9/4/044001, 2014.
Ward, J. H.: Hierarchical Grouping to Optimize an Objective Function, J. Americ. Stat. Assoc., 58, 236–244, 1963.
Wegmann, M., Brönnimann, S., Bhend, J., Franke, J., Folini, D., Wild, M., and Luterbacher, J.: Volcanic Influence on European Summer Precipitation through Monsoons: Possible Cause for “Years without a Summer”, J. Climate, 27, 3683–3691, 2014.
Xoplaki, E., Fleitmann, D., Izdebski, A., Luterbacher, J., Wagner, S., Zorita, E., Telelis, I., and Toreti, A.: The Medieval Climate Anomaly and Byzantium; a review of evidence on climatic fluctuations, economic performance and societal change, Quat. Sci., Rev., 136, 229–252, 2016.
Xoplaki, E., Luterbacher, J., Wagner, S., Zorita, E., Fleitmann, D., Haldon, J.F., Preiser-Kapeller, J., Sargent, A., Toreti, A., White, S., Mordechai, L., Bozkurt, D., Akçer, S., and Izdebski, A.: Climate and societal resilience in the Eastern Mediterranean during the last millennium, Human Ecol., 46, 363–379, 2018.