the Creative Commons Attribution 4.0 License.
the Creative Commons Attribution 4.0 License.
 | 08 Aug 2019
Spatial pattern of accumulation at Taylor Dome during Marine Isotope Stage 4: stratigraphic constraints from Taylor Glacier
James A. Menking
Edward J. Brook
Sarah A. Shackleton
Jeffrey P. Severinghaus
Michael N. Dyonisius
Vasilii Petrenko
Joseph R. McConnell
Rachael H. Rhodes
Thomas K. Bauska
Daniel Baggenstos
Shaun Marcott
Stephen Barker
New ice cores retrieved from the Taylor Glacier (Antarctica) blue ice area contain ice and air spanning the Marine Isotope Stage (MIS) 5–4 transition, a period of global cooling and ice sheet expansion. We determine chronologies for the ice and air bubbles in the new ice cores by visually matching variations in gas- and ice-phase tracers to preexisting ice core records. The chronologies reveal an ice age–gas age difference (Δage) approaching 10 ka during MIS 4, implying very low snow accumulation in the Taylor Glacier accumulation zone. A revised chronology for the analogous section of the Taylor Dome ice core (84 to 55 ka), located to the south of the Taylor Glacier accumulation zone, shows that Δage did not exceed 3 ka. The difference in Δage between the two records during MIS 4 is similar in magnitude but opposite in direction to what is observed at the Last Glacial Maximum. This relationship implies that a spatial gradient in snow accumulation existed across the Taylor Dome region during MIS 4 that was oriented in the opposite direction of the accumulation gradient during the Last Glacial Maximum.
- Article
(5827 KB) - Full-text XML
-
Supplement
(1319 KB) - BibTeX
- EndNote


Trapped air in ice cores provides a direct record of the Earth's past atmospheric composition (e.g., Bauska et al., 2016; Petrenko et al., 2017; Schilt et al., 2014). Measurements of trace gas species, particularly their isotopic composition, create a demand for large-volume glacial ice core samples. Blue ice areas, where a combination of glacier flow and high ablation rates bring old ice layers to the surface, offer relatively easy access to large samples and can supplement traditional ice cores (Bintanja, 1999; Sinisalo and Moore, 2010). Blue ice areas often have complex depth–age and distance–age relationships disrupted by folding and thinning of stratigraphic layers (e.g., Petrenko et al., 2006; Baggenstos et al., 2017). Taking full advantage of blue ice areas requires precise age control and critical examination of the glaciological context in which they form.
Effective techniques for dating ablation zone ice include matching globally well-mixed atmospheric trace gas records (e.g., CH4, CO2, δ18Oatm, N2O) and correlating glaciochemical records (e.g., δ18Oice, Ca2+, insoluble particles) with existing ice core records with precise chronologies (Bauska et al., 2016; Schilt et al., 2014; Petrenko et al., 2008, 2016; Schaefer et al., 2009; Baggenstos et al., 2017; Aarons et al., 2017). Other useful techniques include 40Aratm dating (Bender et al., 2008; Higgins et al., 2015) and radiometric 81Kr dating (Buizert et al., 2014). Matching gas and glaciochemical records can provide high precision with relatively small samples, and some measurements can be made in field settings. In contrast, 40Aratm and 81Kr require complex laboratory work and do not provide the level of age precision available from correlation methods, although these techniques do provide independent age information that can extend beyond the age range of existing records.
A number of blue ice areas have provided useful paleoclimate archives including Pakitsoq, Greenland, for the Younger Dryas–Preboreal transition (Petrenko et al., 2006, 2009; Schaefer et al., 2009, 2006), Allan Hills, Victoria Land, Antarctica, for ice 90–250 ka and >1 Ma (Spaulding et al., 2013; Higgins et al., 2015), Mt. Moulton, Antarctica, for the last interglacial (Korotkikh et al., 2011), the Patriot Hills, Horseshoe Valley, Antarctica, for ice from the last glacial termination (Fogwill et al., 2017), and Taylor Glacier, McMurdo Dry Valleys, Antarctica, for ice spanning the last glacial termination and MIS 3 (Bauska et al., 2016; Schilt et al., 2014; Baggenstos et al., 2017; Petrenko et al., 2017). Taylor Glacier is particularly well suited for paleoclimate reconstructions because of the excellent preservation of near-surface ice, large age span, and continuity of the record (Buizert et al., 2014; Baggenstos, 2015; Baggenstos et al., 2017). The proximity of the Taylor Dome ice core site to the probable deposition site for Taylor Glacier ice provides a useful point of comparison for the downstream blue ice area records (Fig. 1).
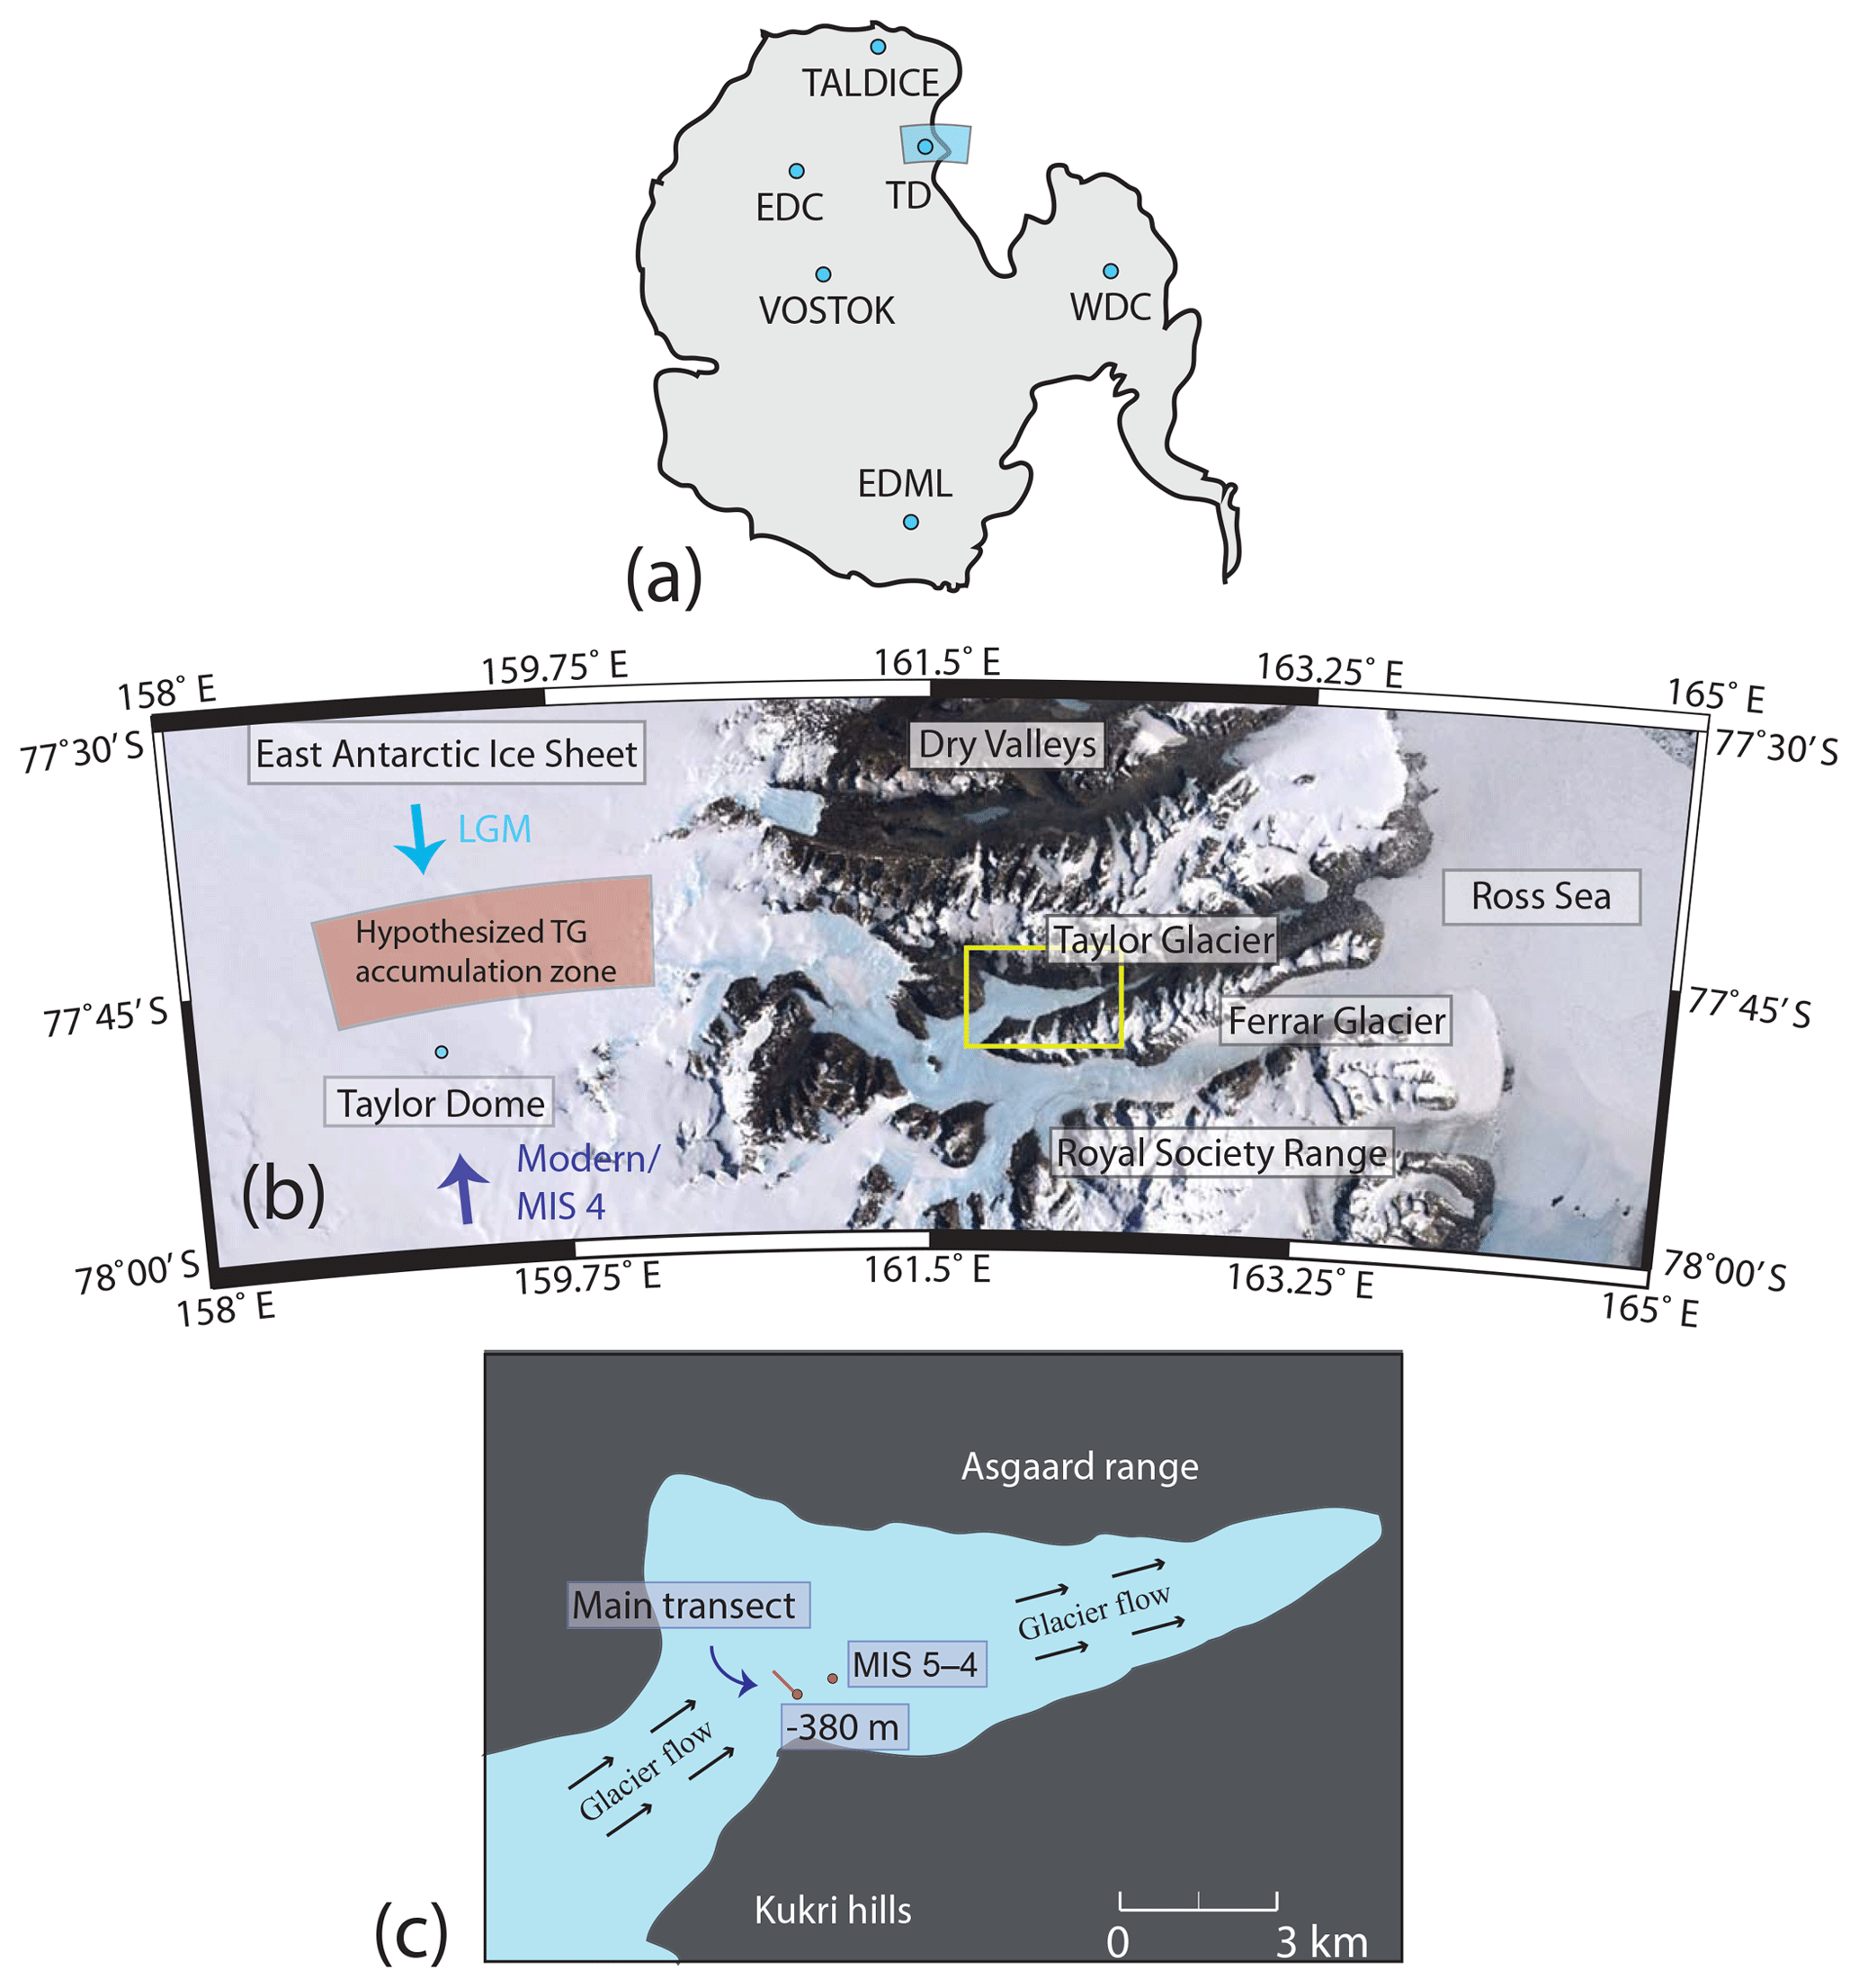
Figure 1(a) The locations of ice core sites discussed in this text are indicated with blue dots on the continent outline (EDC: EPICA Dome C, EDML: EPICA Dronning Maud Land, TALDICE: Talos Dome ice core, TD: Taylor Dome, WDC: West Antarctic Ice Sheet Divide core). (b) Landsat imagery of Taylor Valley (Bindschadler et al., 2008). Blue arrows conceptually show the modern storm trajectory as well as the hypothesized storm trajectories for the Last Glacial Maximum (LGM) and Marine Isotope Stage (MIS) 4 discussed later in the text. (c) Simplified map of Taylor Glacier showing the main transect (red line) containing ice spanning the Holocene-MIS 3 time period and drill sites discussed in the text (red dots).
This study extends the Taylor Glacier blue ice area archive by developing ice and gas chronologies spanning the MIS 5–4 transition (74–65 ka), a period of global cooling and ice sheet expansion. In 2014–2016 several ice cores were retrieved approximately 1 km down-glacier from the “main transect”, the across-flow transect containing ice from Termination 1 through MIS 3 (Baggenstos et al., 2017) (Fig. 1). This paper describes (1) the dating of the new ice cores via matching of variations in CH4, δ18Oatm, dust, and δ18Oice to preexisting records and (2) the description of a new climate record from Taylor Glacier across MIS 4, which was previously thought to be absent from the glacier (Baggenstos et al., 2017). New measurements of CH4 and CO2 from the Taylor Dome ice core are used to revise the Taylor Dome chronology across the MIS 5–4 transition and MIS 4 to allow for a better comparison of the glaciological conditions at Taylor Dome with those at the accumulation region for Taylor Glacier. This comparison allows for inferences about the climate history of the Taylor Dome region implied from the differences in the delta age (Δage = ice age − gas age) between the two sites.
2.1 Field site
Taylor Glacier is an outlet glacier of the East Antarctic Ice Sheet that flows from Taylor Dome and terminates in the McMurdo Dry Valleys (Fig. 1). The Taylor Glacier deposition zone is on the northern flank of Taylor Dome, a peripheral ice dome of the East Antarctic Ice Sheet centered at 77.75∘ S, 159.00∘ E on the eastern margin of the Ross Sea (Fig. 1). The Taylor Glacier deposition zone receives 3–5 cm of ice equivalent accumulation annually in present-day climate conditions (Kavanaugh et al., 2009a; Morse et al., 1999). The glacier flows through Taylor Valley at a rate of ∼10 m a−1 and terminates near Lake Bonney, approximately 30 km from the Ross Sea (Kavanaugh et al., 2009b; Aciego et al., 2007). The ablation zone extends approximately 80 km from the terminus (Kavanaugh et al., 2009b). The close proximity to McMurdo Station provides excellent logistical access to the site (e.g., Fountain et al., 2014; Petrenko et al., 2017; Baggenstos et al., 2017; Marchant et al., 1994; Aarons et al., 2017).
A combination of relatively high sublimation rates (∼ 10 cm a−1) and relatively slow flow creates an ablation zone where ancient ice with a large range of ages is exposed at the surface of Taylor Glacier (Kavanaugh et al., 2009a, b). An along-flow transect of water stable isotopes from just below the equilibrium line to the terminus revealed ice from the last glacial period outcropping at sporadic places along the transect (Aciego et al., 2007). The sporadic nature of the outcrops was later shown to be an artifact of sampling nearly parallel to isochrones such that they were occasionally crossed (Baggenstos et al., 2017). More recent across-flow profiles dated with stratigraphic matching of well-mixed atmospheric gases revealed ice that varies continuously in age from the Holocene to ∼50 ka (Schilt et al., 2014; Bauska et al., 2016; Baggenstos et al., 2017), with ice of last interglacial or older age found near the terminus of the glacier (Baggenstos et al., 2017; Buizert et al., 2014). The most heavily sampled archive is a 500 m section called the main transect, oriented perpendicular to isochrones (Fig. 1) across a syncline–anticline pair containing ice spanning from ∼50 ka before present (BP) to the mid Holocene (7 ka) (Baggenstos et al., 2017). Ice stratigraphy in the main transect dips approximately vertically so that it is possible to obtain large quantities of ice of the same age by drilling vertical or near-vertical ice cores (e.g., Baggenstos et al., 2017; Petrenko et al., 2017, 2016; Schilt et al., 2014; Bauska et al., 2016, 2018). Ice containing the full MIS 5–4 transition was formerly considered to be missing from the glacier (Baggenstos, 2015; Baggenstos et al., 2017), but we show here that a new ice core near the main transect contains an intact record with ice dating from 76.5–60.6 ka and air dating from 74.0–57.7 ka.
2.2 Core retrieval
In the 2013–2014 season an exploratory core was drilled vertically using a PICO hand auger 380 m away (−380 m by convention) from a benchmark position (77.75891∘ S, 161.7178∘ E in January 2014) along the main transect (Fig. 1). In the 2014–2015 field season another exploratory core was drilled vertically using the PICO hand auger approximately 1 km down-glacier from the main transect (77.7591∘ S, 161.7380∘ E in December 2014) where older ice near the surface was suspected. This site is hereafter referred to as the MIS 5–4 site (Fig. 1). An ice core was drilled directly adjacent to the PICO borehole at the MIS 5–4 site using the Blue Ice Drill (BID), a 24 cm diameter shallow coring device designed for retrieving large-volume ice samples suitable for trace gas and isotope analysis (Kuhl et al., 2014). The section 9–17 m was sampled in the field for laboratory trace gas analyses at Oregon State University (OSU) and at the Scripps Institution of Oceanography (SIO).
In the 2015–2016 season a second large-volume core was drilled directly adjacent to the previous MIS 5–4 boreholes using the BID, and the sections 0–9 and 17–19.8 m were sampled for trace gas analyses at OSU and at SIO. The entire 0–19.8 m of this core was sampled for continuous-flow analysis (CFA) in the field and at the Desert Research Institute (DRI). Samples for all analyses were cut with a band saw on the glacier, stored in chest freezers at ∘C in camp, and flown to McMurdo Station within 2 weeks of retrieval, where they were stored at ∘C. Storage temperature was ∘C for the remainder of their shipment to the USA and subsequent storage in laboratories.
2.3 Analytical methods
A field laboratory at the Taylor Glacier field camp permitted continuous measurements of CH4 and particle count on ice core samples within days of drilling and recovery (Table 1). CH4 concentration was measured using a Picarro laser spectrometer coupled to a continuous gas-extraction line with a de-bubbler similar to that described in Rhodes et al. (2013). The continuous CH4 data were calibrated by measuring standard air of known CH4 concentration introduced into a stream of gas-free water to simulate a bubble–liquid mixture similar to the melt stream from ice core samples. The tests indicated 3.5 %–5.5 % loss of CH4 due to dissolution in the melt stream. We adjusted the continuous CH4 data upwards by 5 % to account for the solubility effect, which resulted in a good agreement between our measurements and other Antarctic CH4 records (e.g., Schilt et al., 2010). Insoluble particle abundance was also measured continuously in the field using an Abakus particle counter coupled to the continuous meltwater stream. In order to obtain exploratory gas age information and verify the continuous CH4 data, discrete ice core samples were also measured for CH4 concentration in the field using a Shimadzu gas chromatograph coupled to a custom melt–refreeze extraction line, a manually operated version similar to the automated system used at OSU (Mitchell et al., 2011, 2013).
Table 1Summary of new datasets. Gas chromatograph (GC) and mass spectrometer (MS) measurements were made on discrete samples. Picarro, Abakus, and ICP-MS measurements were made by continuous-flow analysis. Analytical precision is from method reference or the pooled standard deviation of replicate samples. OSU: Oregon State University, SIO: Scripps Institution of Oceanography, DRI: Desert Research Institute.
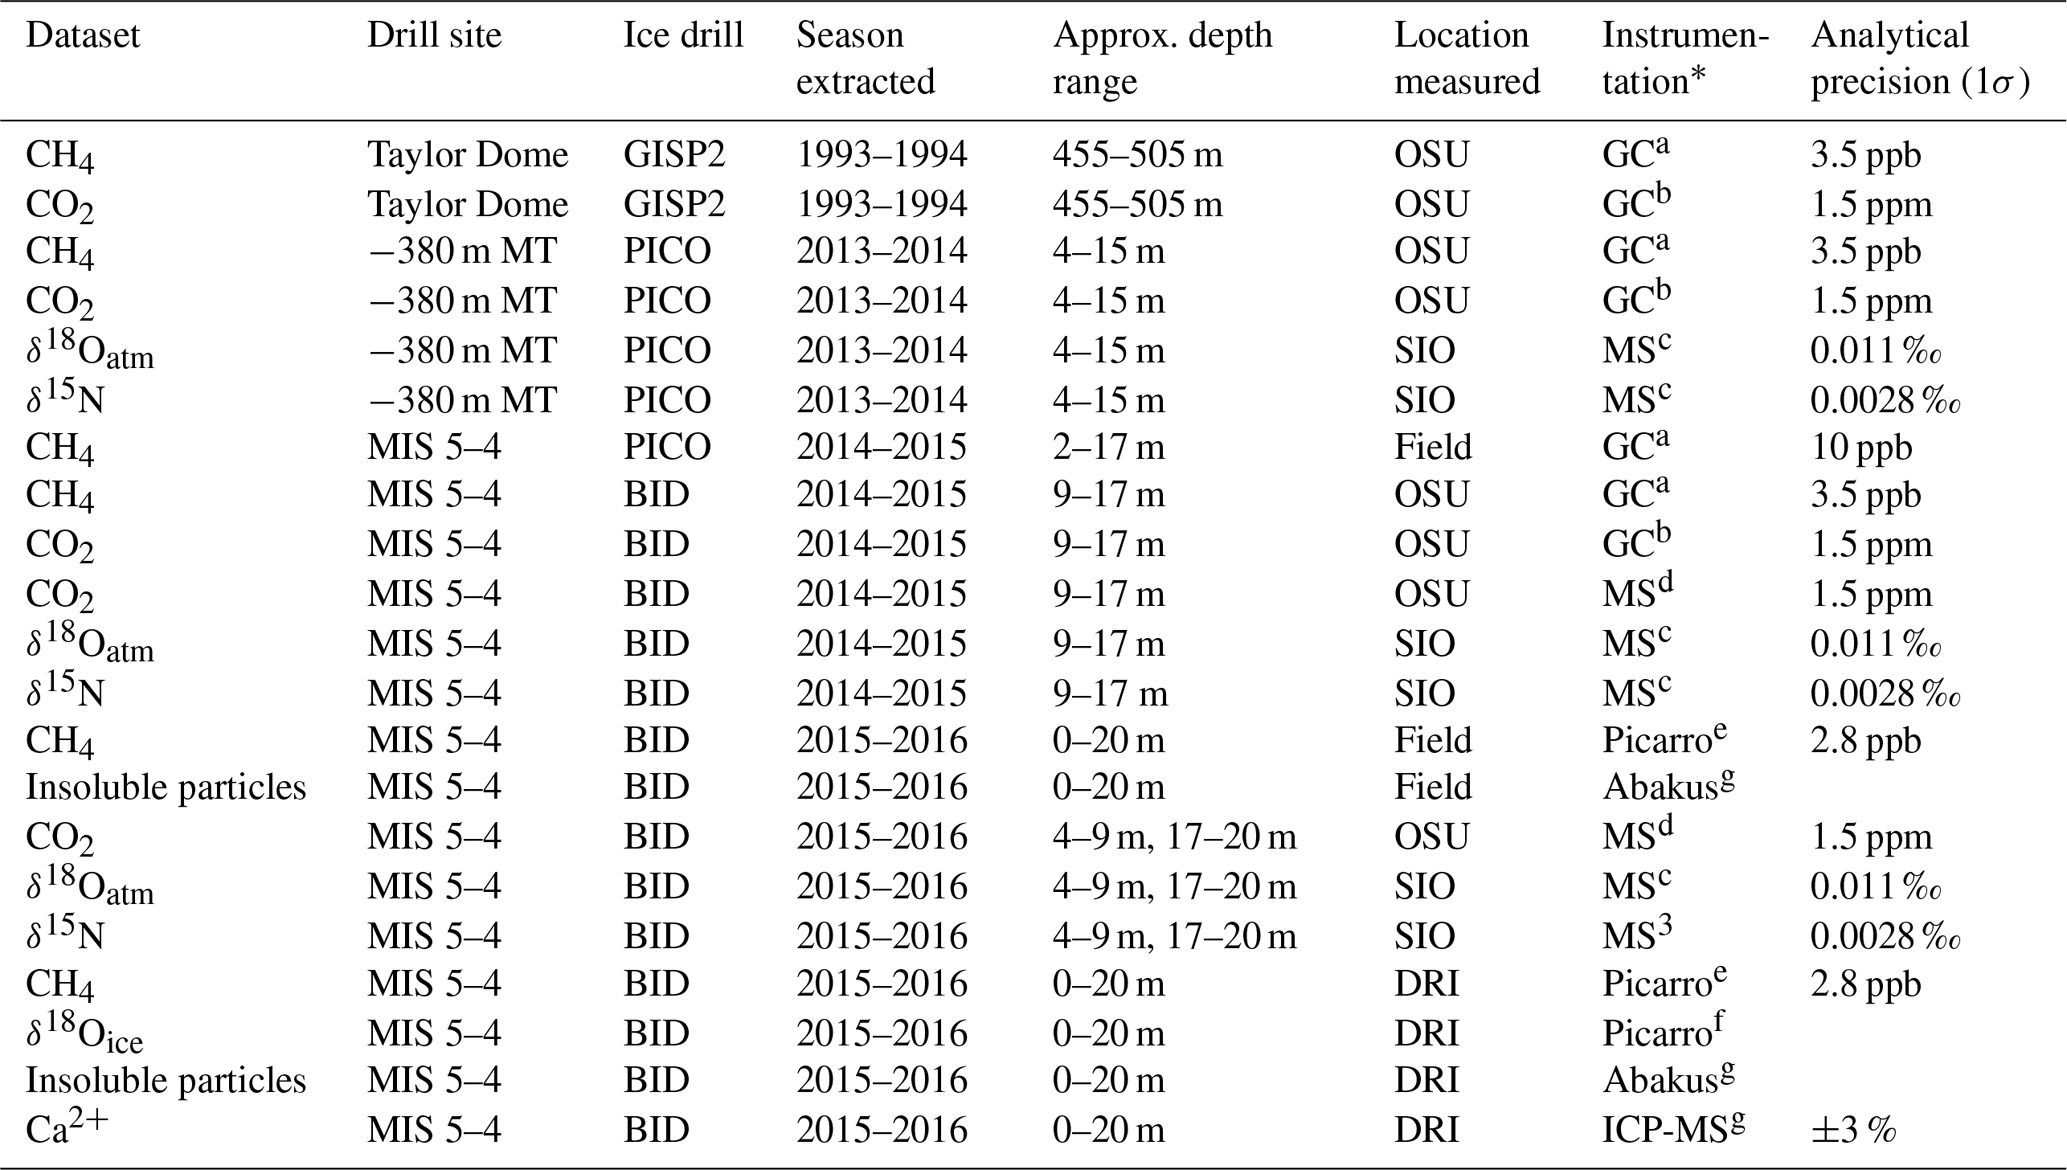
* Superscripts denote references for analytical procedures: 1 Mitchell et al. (2013, 2011); b Ahn et al. (2009); c Severinghaus et al. (1998), Petrenko et al. (2006); d Bauska et al. (2014); e Rhodes et al. (2013); f Maselli et al. (2013); g McConnell (2002).
Laboratory analyses on recovered samples and archived Taylor Dome samples included discrete CH4 and CO2 concentrations, δ15N of atmospheric N2, δ18O of atmospheric oxygen (δ18Oatm), continuous CH4 concentration, δ18Oice, major ion and elemental chemistry, and insoluble particle counts (Table 1). Continuous chemistry, dust, δ18Oice, and CH4 measurements were made at DRI by melting 3.5 cm × 3.5 cm ∼1 m longitudinal samples of ice and routing the melt stream to in-line instruments (McConnell, 2002; Maselli et al., 2013). Insoluble particles were measured using an Abakus particle counter, water isotopes using a Picarro laser spectrometer (Maselli et al., 2013), and CH4 using a Picarro laser spectrometer and air extraction system similar to that used in the field (Rhodes et al., 2013). Continuous CH4 data measured at DRI were calibrated with air standards as described above. The upward adjustment to account for dissolution in the melt stream was 8 % in this case. Discrete CH4 and CO2 measurements were made at OSU. CH4 was measured using an Agilent gas chromatograph equipped with a flame ionization detector coupled to a custom melt–refreeze extraction system (Mitchell et al., 2011). CO2 was measured (1) on an Agilent gas chromatograph equipped with a Ni catalyst and a flame ionization detector coupled to a custom dry-extraction “cheese grater” system for carbon isotopic analyses (Bauska et al., 2014), as well as (2) on a similar Agilent gas chromatograph coupled to a dry-extraction needle-crusher system (Ahn et al., 2009). δ15N–N2 and δ18Oatm were measured at SIO using a Thermo Delta V mass spectrometer coupled to a custom gas-extraction system (Severinghaus et al., 1998; Petrenko et al., 2006).
Discrete measurements of CH4 and CO2 were made at OSU on archived Taylor Dome ice core samples following the same procedures described above (Table 1).
2.4 Data uncertainties
The analytical uncertainties associated with new data presented in this paper are reported in Table 1. In addition to the uncertainties in concentration and isotopic measurements, we address uncertainties related to (1) smoothing of gas records due to dispersion and mixing in the CFA system (Rhodes et al., 2013; Stowasser et al., 2012), (2) depth uncertainty in gas and ice samples, and (3) artifacts due to contamination of gas and dust in near-surface ice. The effect of analytical smoothing is negligible, as demonstrated by close agreement of continuous CH4 with high-resolution discrete CH4 data from 9 to 17 m in the 2014–2015 MIS 5–4 core (Fig. S1 in the Supplement). Depth uncertainties of up to 20 cm resulted from unaligned, angled core breaks of up to 10 cm in length as well as small depth logging errors. Contamination is only a concern in near-surface ice where thermal expansion and contraction cause abundant cracks on the surface of Taylor Glacier. The cracks rarely penetrate below 4 m and have never been observed deeper than 7 m (Baggenstos et al., 2017). Gas measurements may be sensitive to contamination from resealed cracks between 0 and 4 m of depth, and dust measurements may be affected by local dust deposition between 0 and 40 cm of depth (Baggenstos et al., 2017, 2018). To minimize this problem we avoided analyses of ice with visible fractures.
3.1 Taylor Glacier MIS 5–4 cores
For the new MIS 5–4 cores the sections retrieved during the 2014–2015 season (9–17 m) and 2015–2016 season (0–9 and 17–20 m) are hereafter treated as one ice core record (unified depth and age scales), which is justified given the close proximity of the boreholes (<2 m spacing at surface) and the minimal depth uncertainty between the cores ( cm). The depth uncertainty is the maximum offset due to angle breaks at the ends of cores, which never exceeded 10 cm. Observable depth offsets between replicate measurements also do not exceed 20 cm (discussed in more detail below and in the Supplement). No depth adjustments were made to the raw data from any of the ice cores.
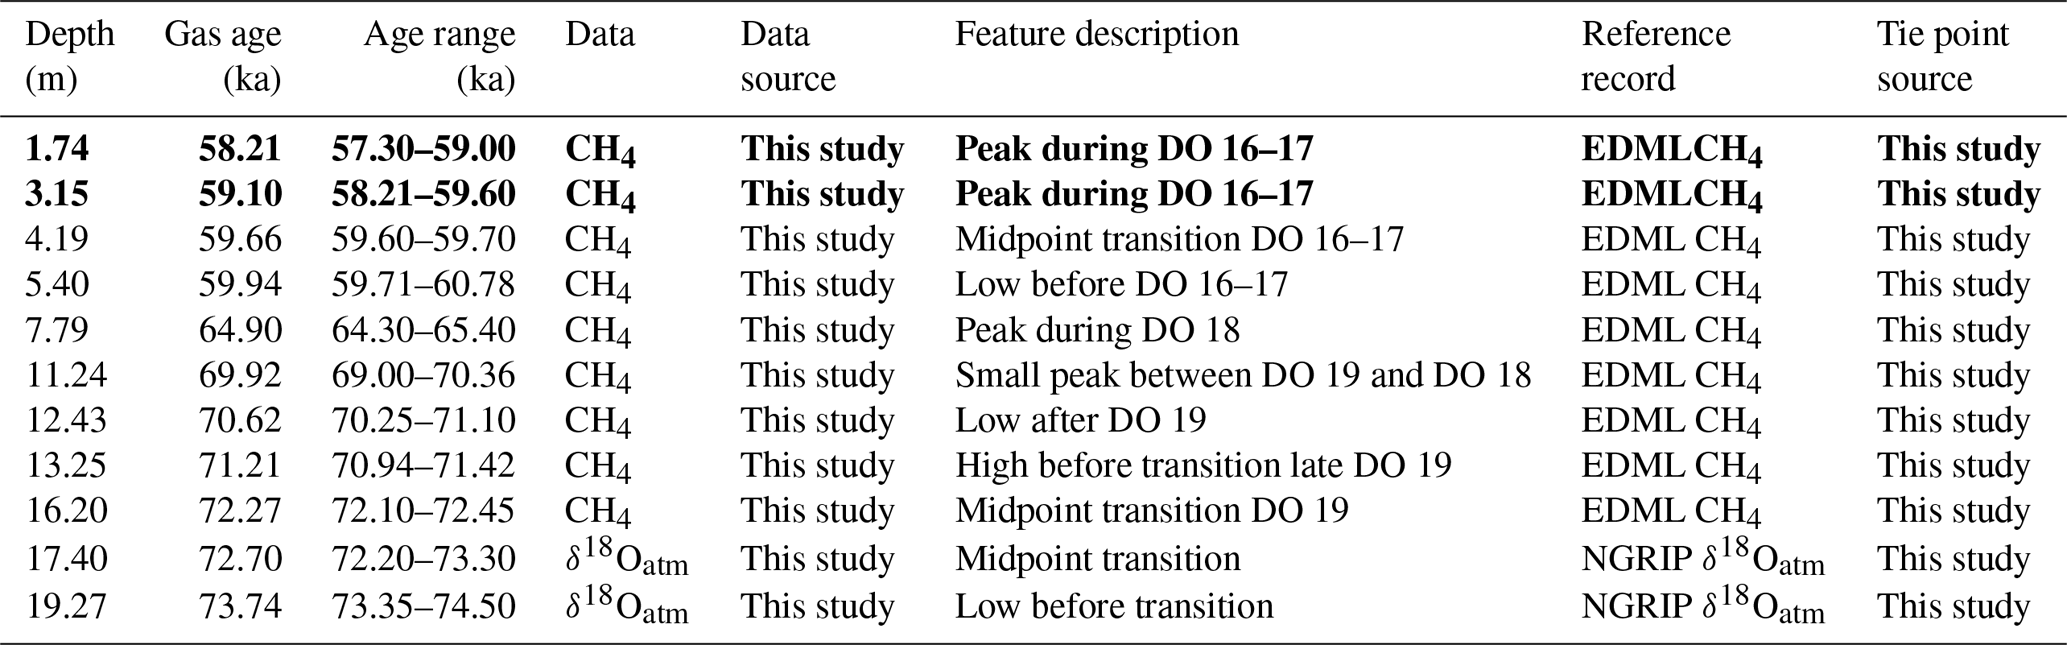
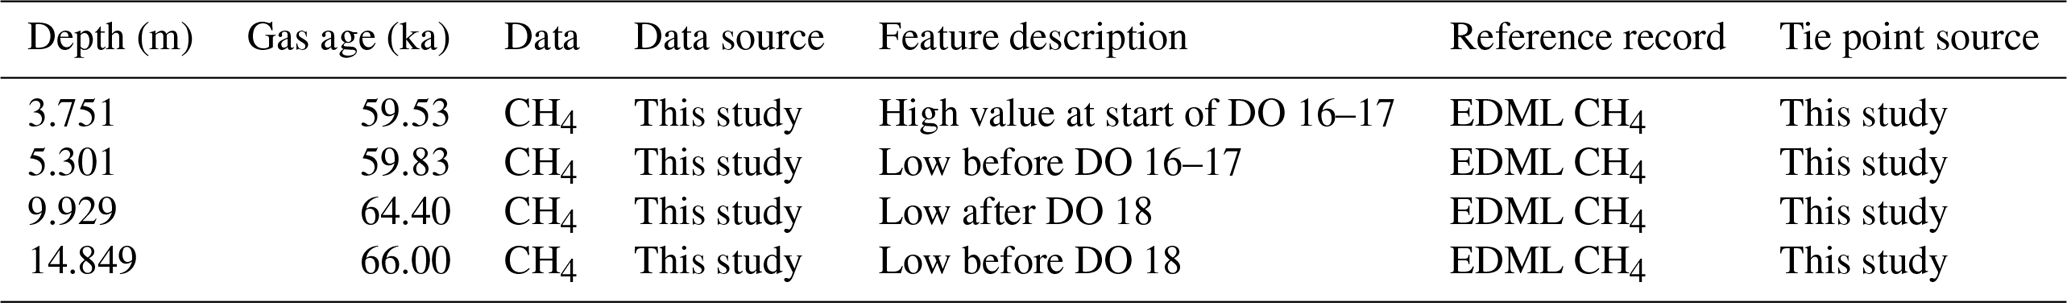
A gas age model for the Taylor Glacier MIS 5–4 cores was constructed by matching variations in CH4 and δ18Oatm to preexisting ice core records synchronized to the Antarctic Ice Core Chronology (AICC) 2012 (Veres et al., 2013; Bazin et al., 2013) (Fig. S1). This approach is valid for the gas age scale because CH4 and 18Oatm are globally well mixed (Blunier et al., 2007; Blunier and Brook, 2001). Variations in CH4 were tied to the EPICA Dronning Maud Land (EDML) record (Schilt et al., 2010), and δ18Oatm was tied to the North Greenland Ice Coring Project (NGRIP) record (Landais et al., 2007). These datasets were chosen because they contain the highest-resolution CH4 and δ18Oatm data available on the AICC 2012 timescale for this time period. Tie points linking ages to depths were manually chosen (Fig. S1 and Table 2). Ages between the tie points were interpolated linearly.
Table 2Tie points relating Taylor Glacier depth to gas age on the AICC 2012 timescale. Bold font indicates tie points <4 m of depth where abundant cracks in shallow ice may cause contamination of gas records (see text). DO refers to a Dansgaard–Oeschger event.
CO2 data were not used to tie Taylor Glacier to AICC 2012. An offset between the Taylor Glacier data and the Antarctic composite record of Bereiter et al. (2015) during the MIS 4–3 CO2 increase between 64 and 60 ka (Taylor Glacier lower by ∼13 ppm at 61.5 ka; Fig. 2) could bias our age model toward older ages. This offset may be real (e.g., Luthi et al., 2008), and we note that CO2 offsets of even larger magnitude exist between Taylor Glacier and the composite record in the interval 68–64 ka (Fig. 2).
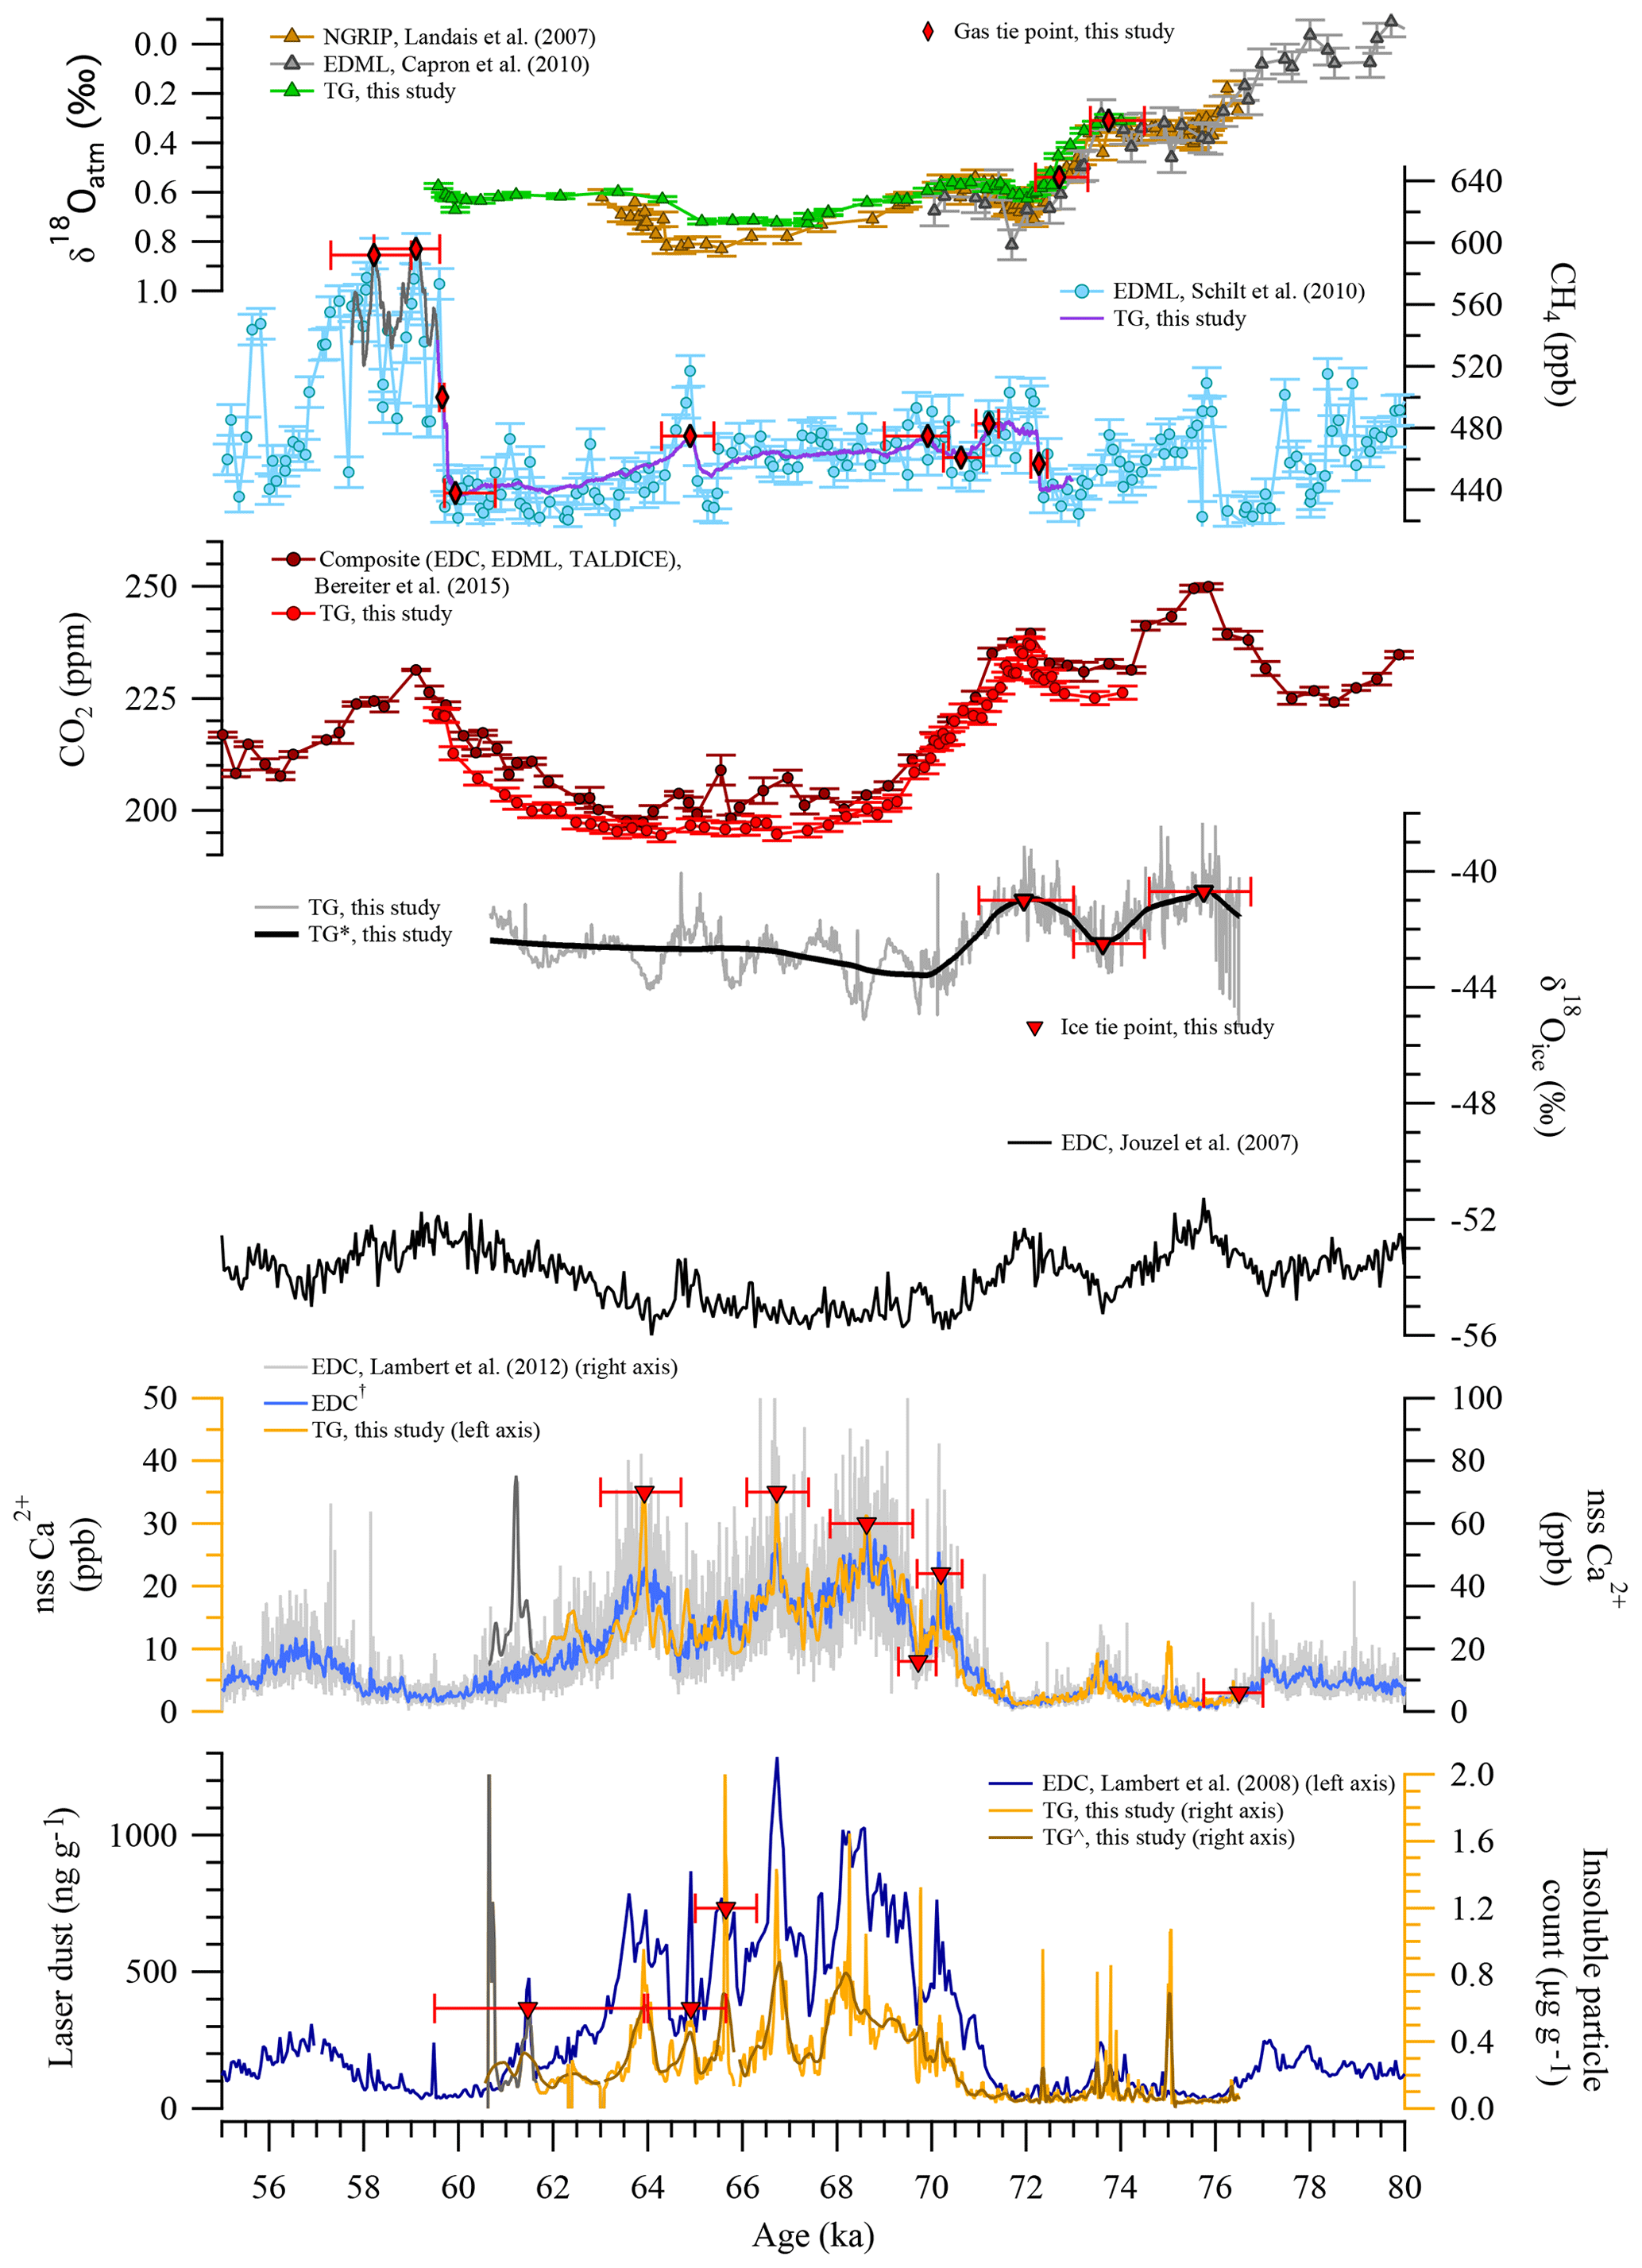
Figure 2Measurements of trace gases (CH4 and CO2), stable isotopes (ice and O2), insoluble particles, and nss Ca2+ from the Taylor Glacier ice core on new gas and ice age scales. All ice core data are synchronized to AICC 2012. CH4 data from <4 m of depth and dust data from <40 cm of depth are colored dark gray to denote potential contamination by surface cracks. NGRIP: North Greenland Ice Coring Project, TG: Taylor Glacier MIS 5–4 BID cores, EDML: EPICA Dronning Maud Land, EDC: EPICA Dome C, TALDICE: Talos Dome. *, †, and denote smoothing with 5000-point, 100-point, and 50-point LOESS algorithms, respectively.
Nonetheless, the general agreement with trends in preexisting CO2 measurements supports the chosen tie points for the new gas age scale (Fig. 2). The resemblance of the Taylor Glacier δ18Oatm record to NGRIP δ18Oatm between 72 and 63 ka also supports the gas age scale because tie points younger than 72 ka were picked only from CH4 data. This is particularly important because CH4 variability is small between 70 and 60 ka, limiting potential tie point selections. Good agreement between CH4 variability in the new MIS 5–4 cores and the independently dated δ18O–CaCO3 from Hulu Cave speleothems (Wang et al., 2001) also suggests that the gas age scale is accurate (Fig. S5). Agreement between atmospheric CH4 concentration (a global signal) and Hulu Cave speleothem δ18O–CaCO3 is expected because both parameters are sensitive to shifts in the latitudinal position of the Intertropical Convergence Zone and the delivery of moisture via the tropical rain belts (Rhodes et al., 2015; Buizert et al., 2015).
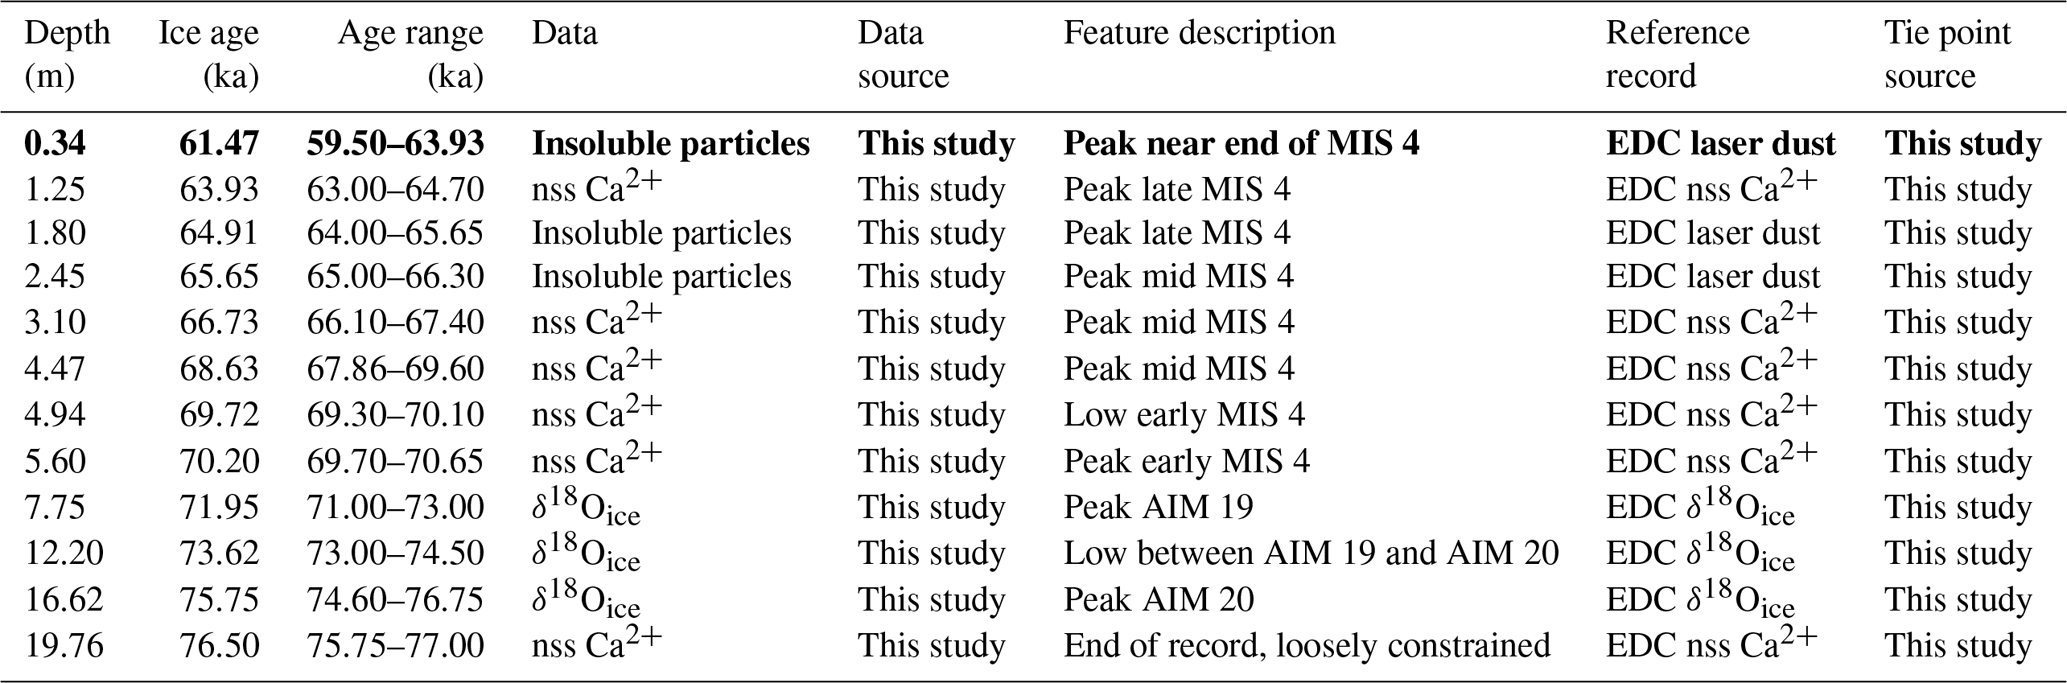
An ice chronology was constructed for the new Taylor Glacier MIS 5–4 cores by matching variations in Ca2+, insoluble particle count, and δ18Oice to preexisting EPICA Dome C (EDC) dust (Lambert et al., 2008, 2012) and δ18Oice records (Jouzel et al., 2007) synchronized to AICC 2012 (Fig. S2). This approach has been used successfully at Taylor Glacier before (e.g., Baggenstos et al., 2018), and it is possible because to first order the temporal patterns of dust content and δ18Oice in Antarctic ice are highly correlated at different ice core locations across the continent (Mulvaney et al., 2000; Schüpbach et al., 2013). Tie points were chosen manually (Fig. S2 and Table 3), and ages were interpolated linearly between them. The synchronized records are displayed in Fig. 2. A more detailed discussion and justification of tie point choices for the Taylor Glacier MIS 5–4 chronologies are provided in the Supplement.
Table 3Tie points relating Taylor Glacier depth to ice age on the AICC 2012 timescale. Bold font indicates tie points <0.4 m of depth where abundant cracks in shallow ice may cause contamination of dust measurements (see text). Ice-phase parameters (dust and δ18Oice) are unaffected by surface cracks below 0.4 m of depth. AIM refers to Antarctic Isotope Maximum event, and MIS refers to Marine Isotope Stage.
3.2 Taylor Glacier −380 m main transect core
To investigate continuity between the Taylor Glacier main transect and the new MIS 5–4 site, we constructed a gas age scale for the ice core at −380 m on the main transect collected during the 2013–2014 season (Fig. 3). Gas ages were determined by matching CH4 data to EDML on AICC 2012 (Table 4). The chronology of the −380 m core is more uncertain than for the MIS 5–4 cores because there are fewer features to match in the gas records, but the synchronous variability in CH4, CO2, and δ18Oatm is unique to the late MIS 4 and MIS 4–3 transition. The observation of late MIS 4 air (but not the full MIS 5–4 transition) was the basis for moving our 2014–2015 ice reconnaissance efforts down-glacier from the main transect where older ice is closer to the surface.
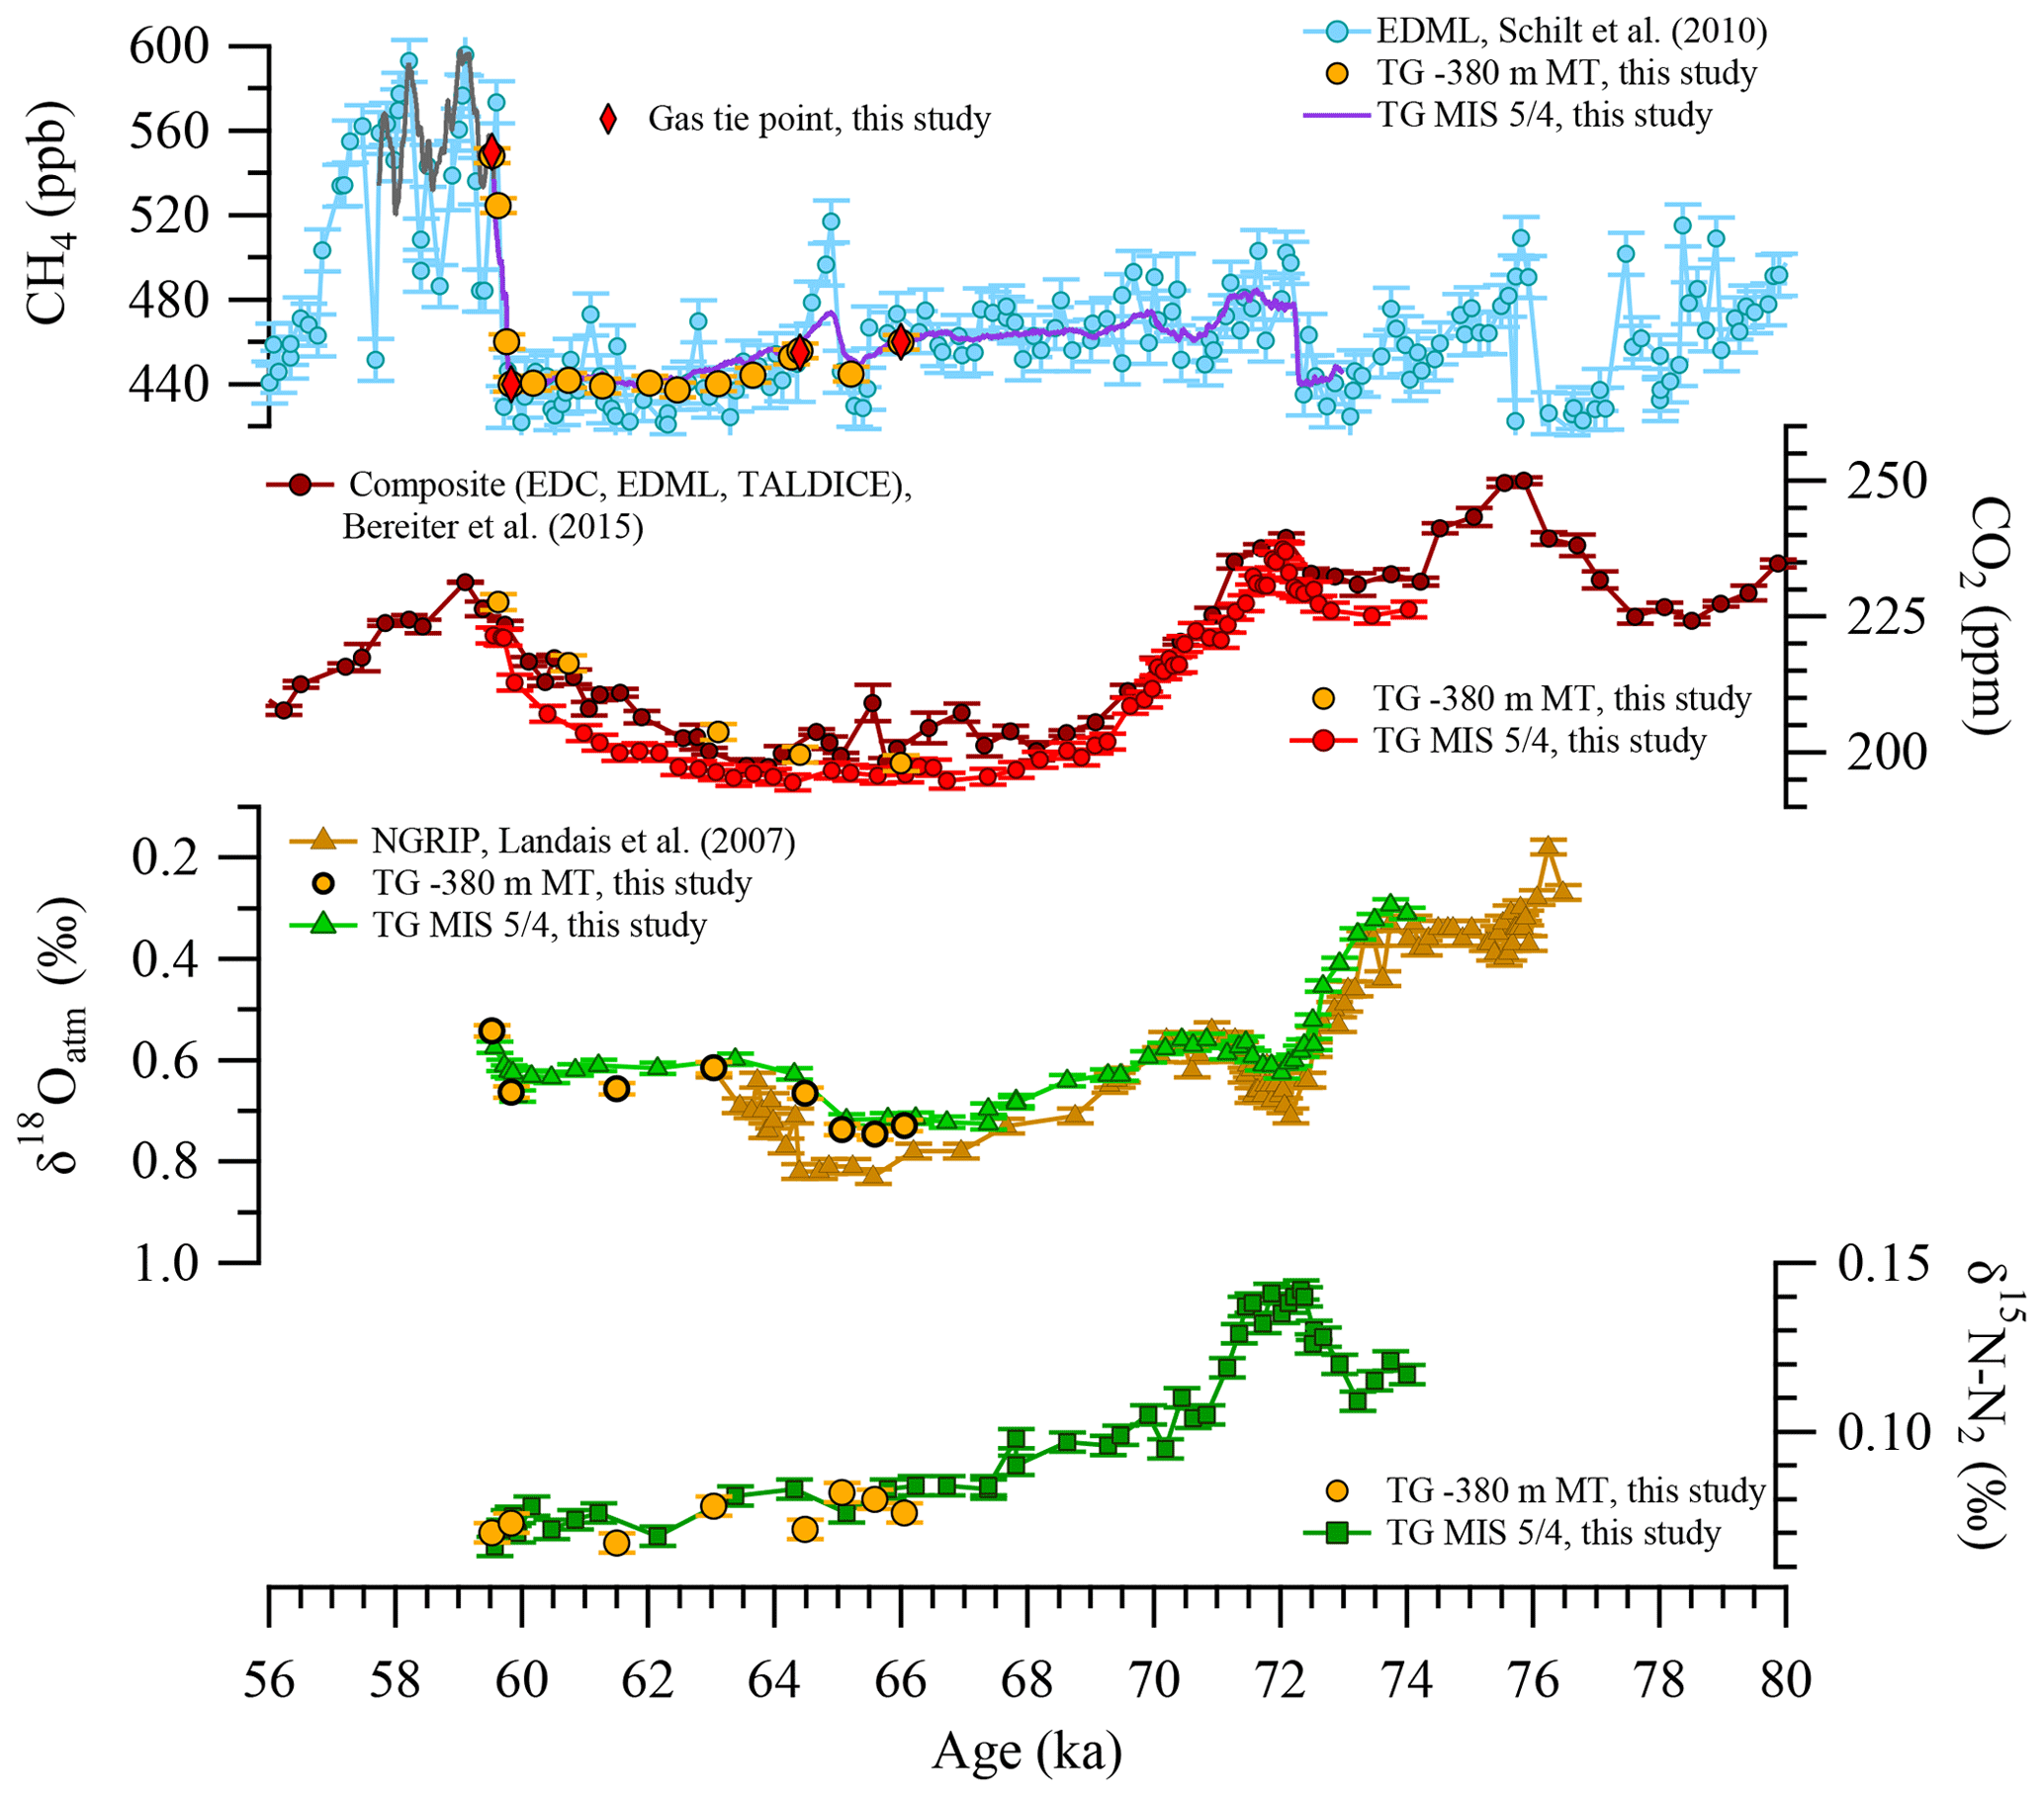
Figure 3Measurements of trace gases (CH4 and CO2) and stable isotopes (O2 and N2) from the −380 m main transect Taylor Glacier ice core and MIS 5–4 ice cores on new gas age scales. All ice core data are synchronized to AICC 2012. CH4 data from <4 m of depth are colored gray to denote potential contamination by surface cracks. NGRIP: North Greenland Ice Coring Project, TG: Taylor Glacier, EDML: EPICA Dronning Maud Land, EDC: EPICA Dome C, TALDICE: Talos Dome.
Table 4Tie points relating −380 m main transect core depth to gas age on the AICC 2012 timescale.
3.3 Taylor Dome core
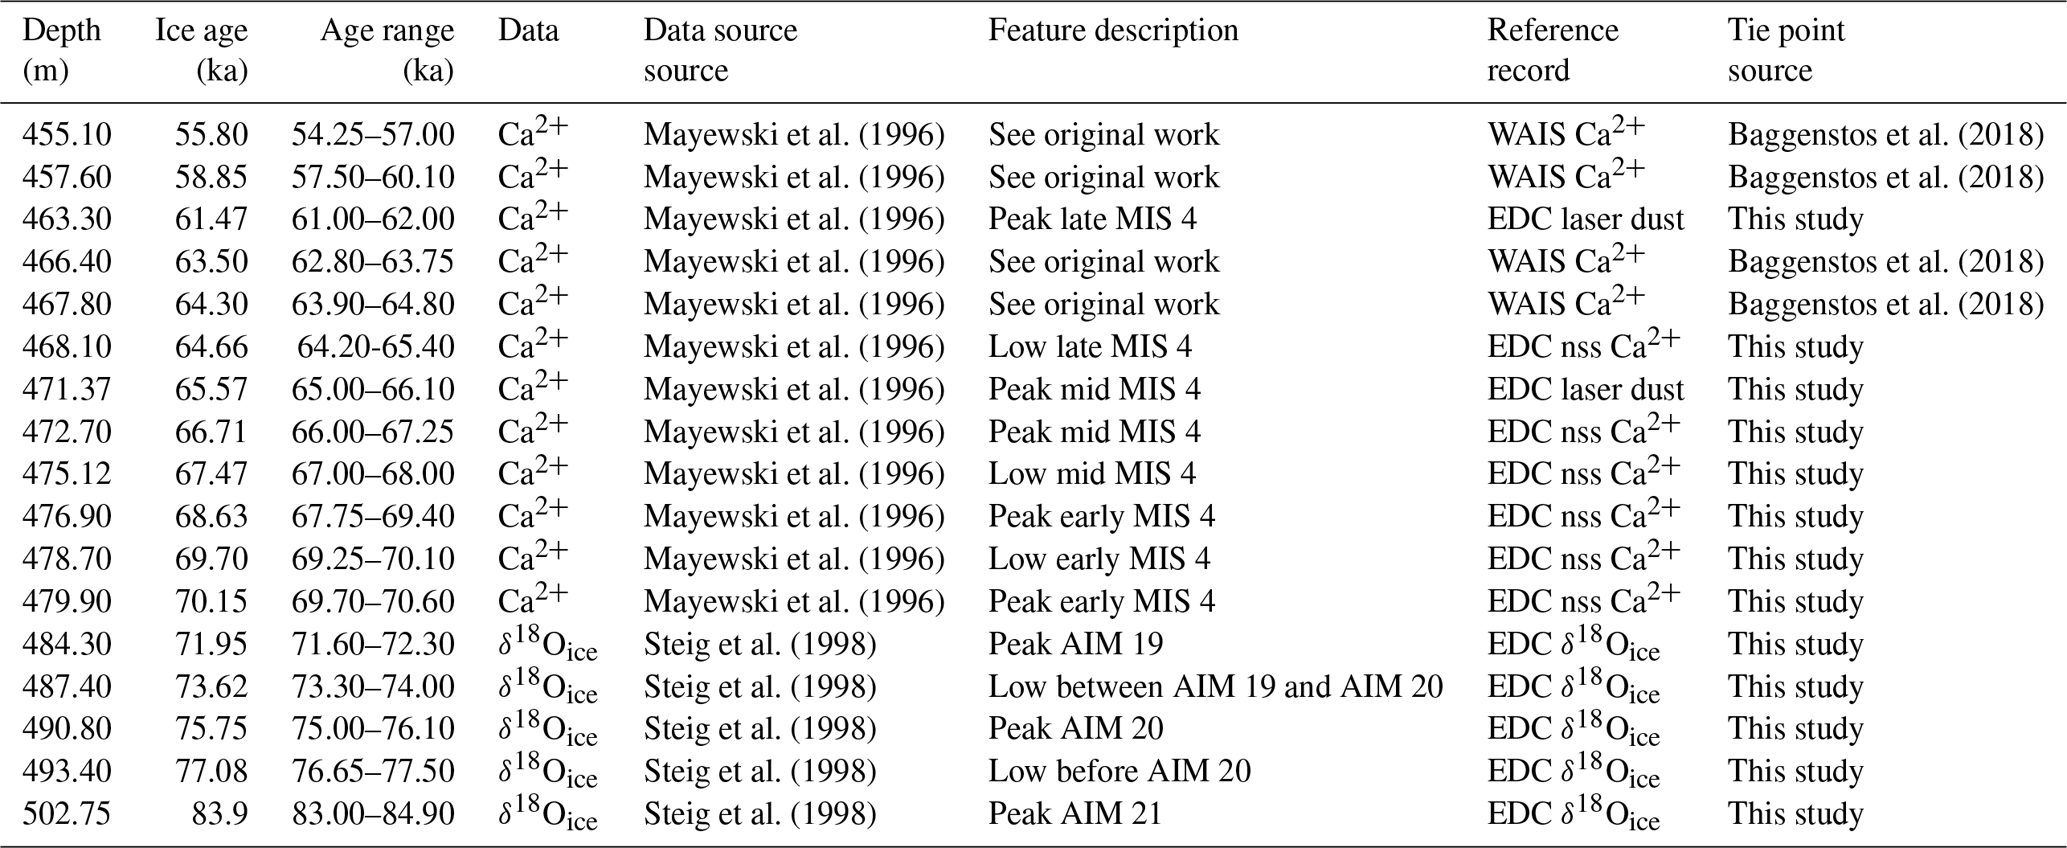
The early Taylor Dome chronologies (e.g., Steig et al., 1998, 2000) were recently revised by Baggenstos et al. (2018) from 0 to 60 ka in light of evidence that the original timescales were incorrect (e.g., Mulvaney et al., 2000; Morse et al., 2007). To investigate the new Taylor Glacier MIS 5–4 climate archive in the context of the glaciological history of the Taylor Dome region, we revised the Taylor Dome gas and ice age scales for the period 84–55 ka (504–455 m). We adopted the recently published age ties (Baggenstos et al., 2018) for the interval that overlaps our new records (60–55 ka). We then extended the timescale to 84 ka using new and preexisting data. Gas tie points were chosen by manually value matching variations in Taylor Dome CH4 data to EDML CH4 on AICC 2012. One of the new tie points matches the variability observed in a preexisting CH4 record from Taylor Dome (Brook et al., 2000) to the EDML CH4 record (Supplement), and three tie points adopted from Baggenstos et al. (2018) match variations observed in preexisting Taylor Dome CO2 data (Indermühle et al., 2000) to WD2014 (Buizert et al., 2015) (Fig. S3 and Table 5). Ice tie points were chosen by manually matching variations in the Taylor Dome Ca2+ record (i.e., Mayewski et al., 1996) to EDC dust (Lambert et al., 2012, 2008) on AICC 2012 (Fig. S4 and Table 6).
Table 5Tie points relating Taylor Dome depth to gas age on the AICC 2012 timescale.
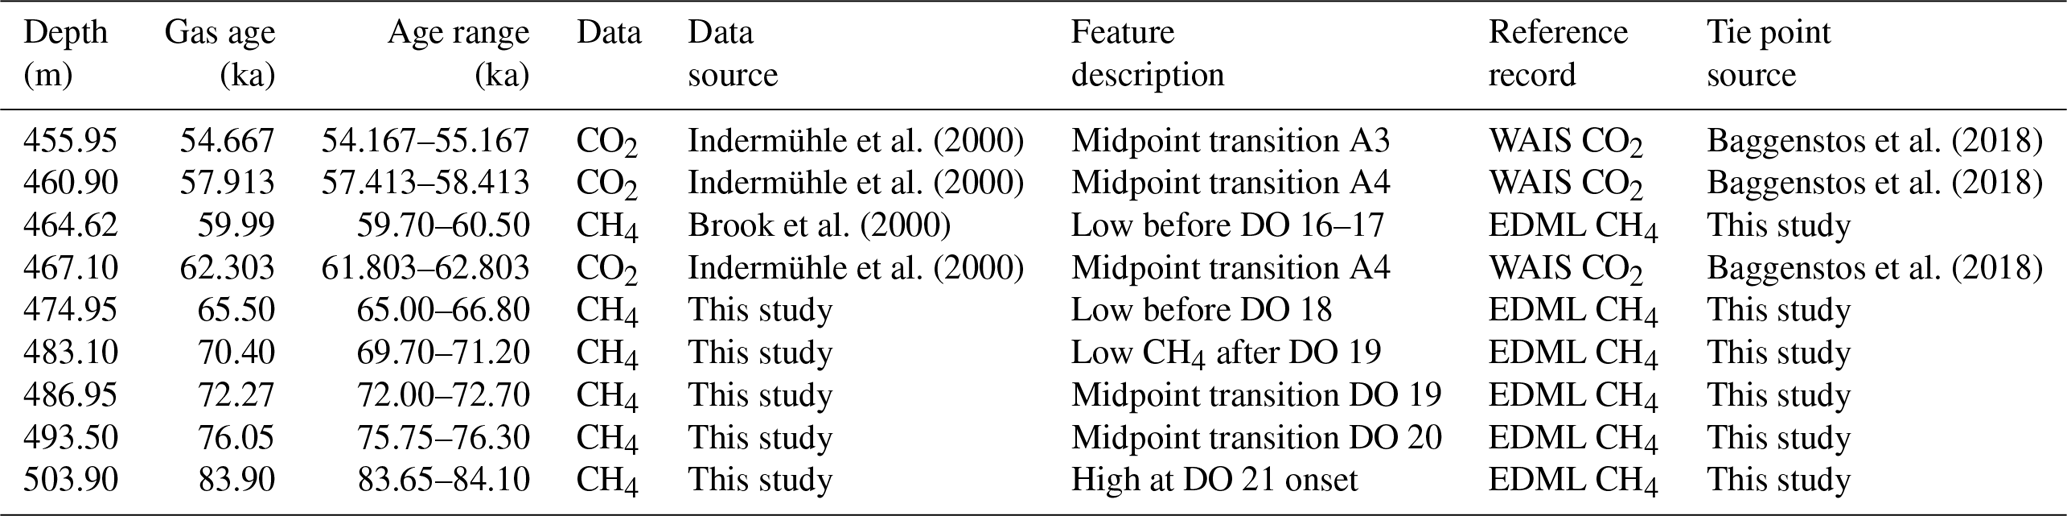
Table 6Tie points relating Taylor Dome depth to ice age on the AICC 2012 timescale.
The general agreement between the Taylor Dome CO2 record and preexisting data from other ice cores supports our revised gas age scale (Fig. 4), but we did not use the CO2 data in constructing the age scale apart from the points mentioned above. The general resemblance between Taylor Dome δ18Oatm and NGRIP δ18Oatm also supports the gas age scale, although the Taylor Dome δ18Oatm data are somewhat scattered due to lower measurement precision (Sucher, 1997). Taylor Dome CH4 data on the new timescale also agree well with δ18O–CaCO3 variability in Hulu Cave speleothems (Fig. S5). The Supplement provides further justification for the tie point choices in our revised Taylor Dome chronology.
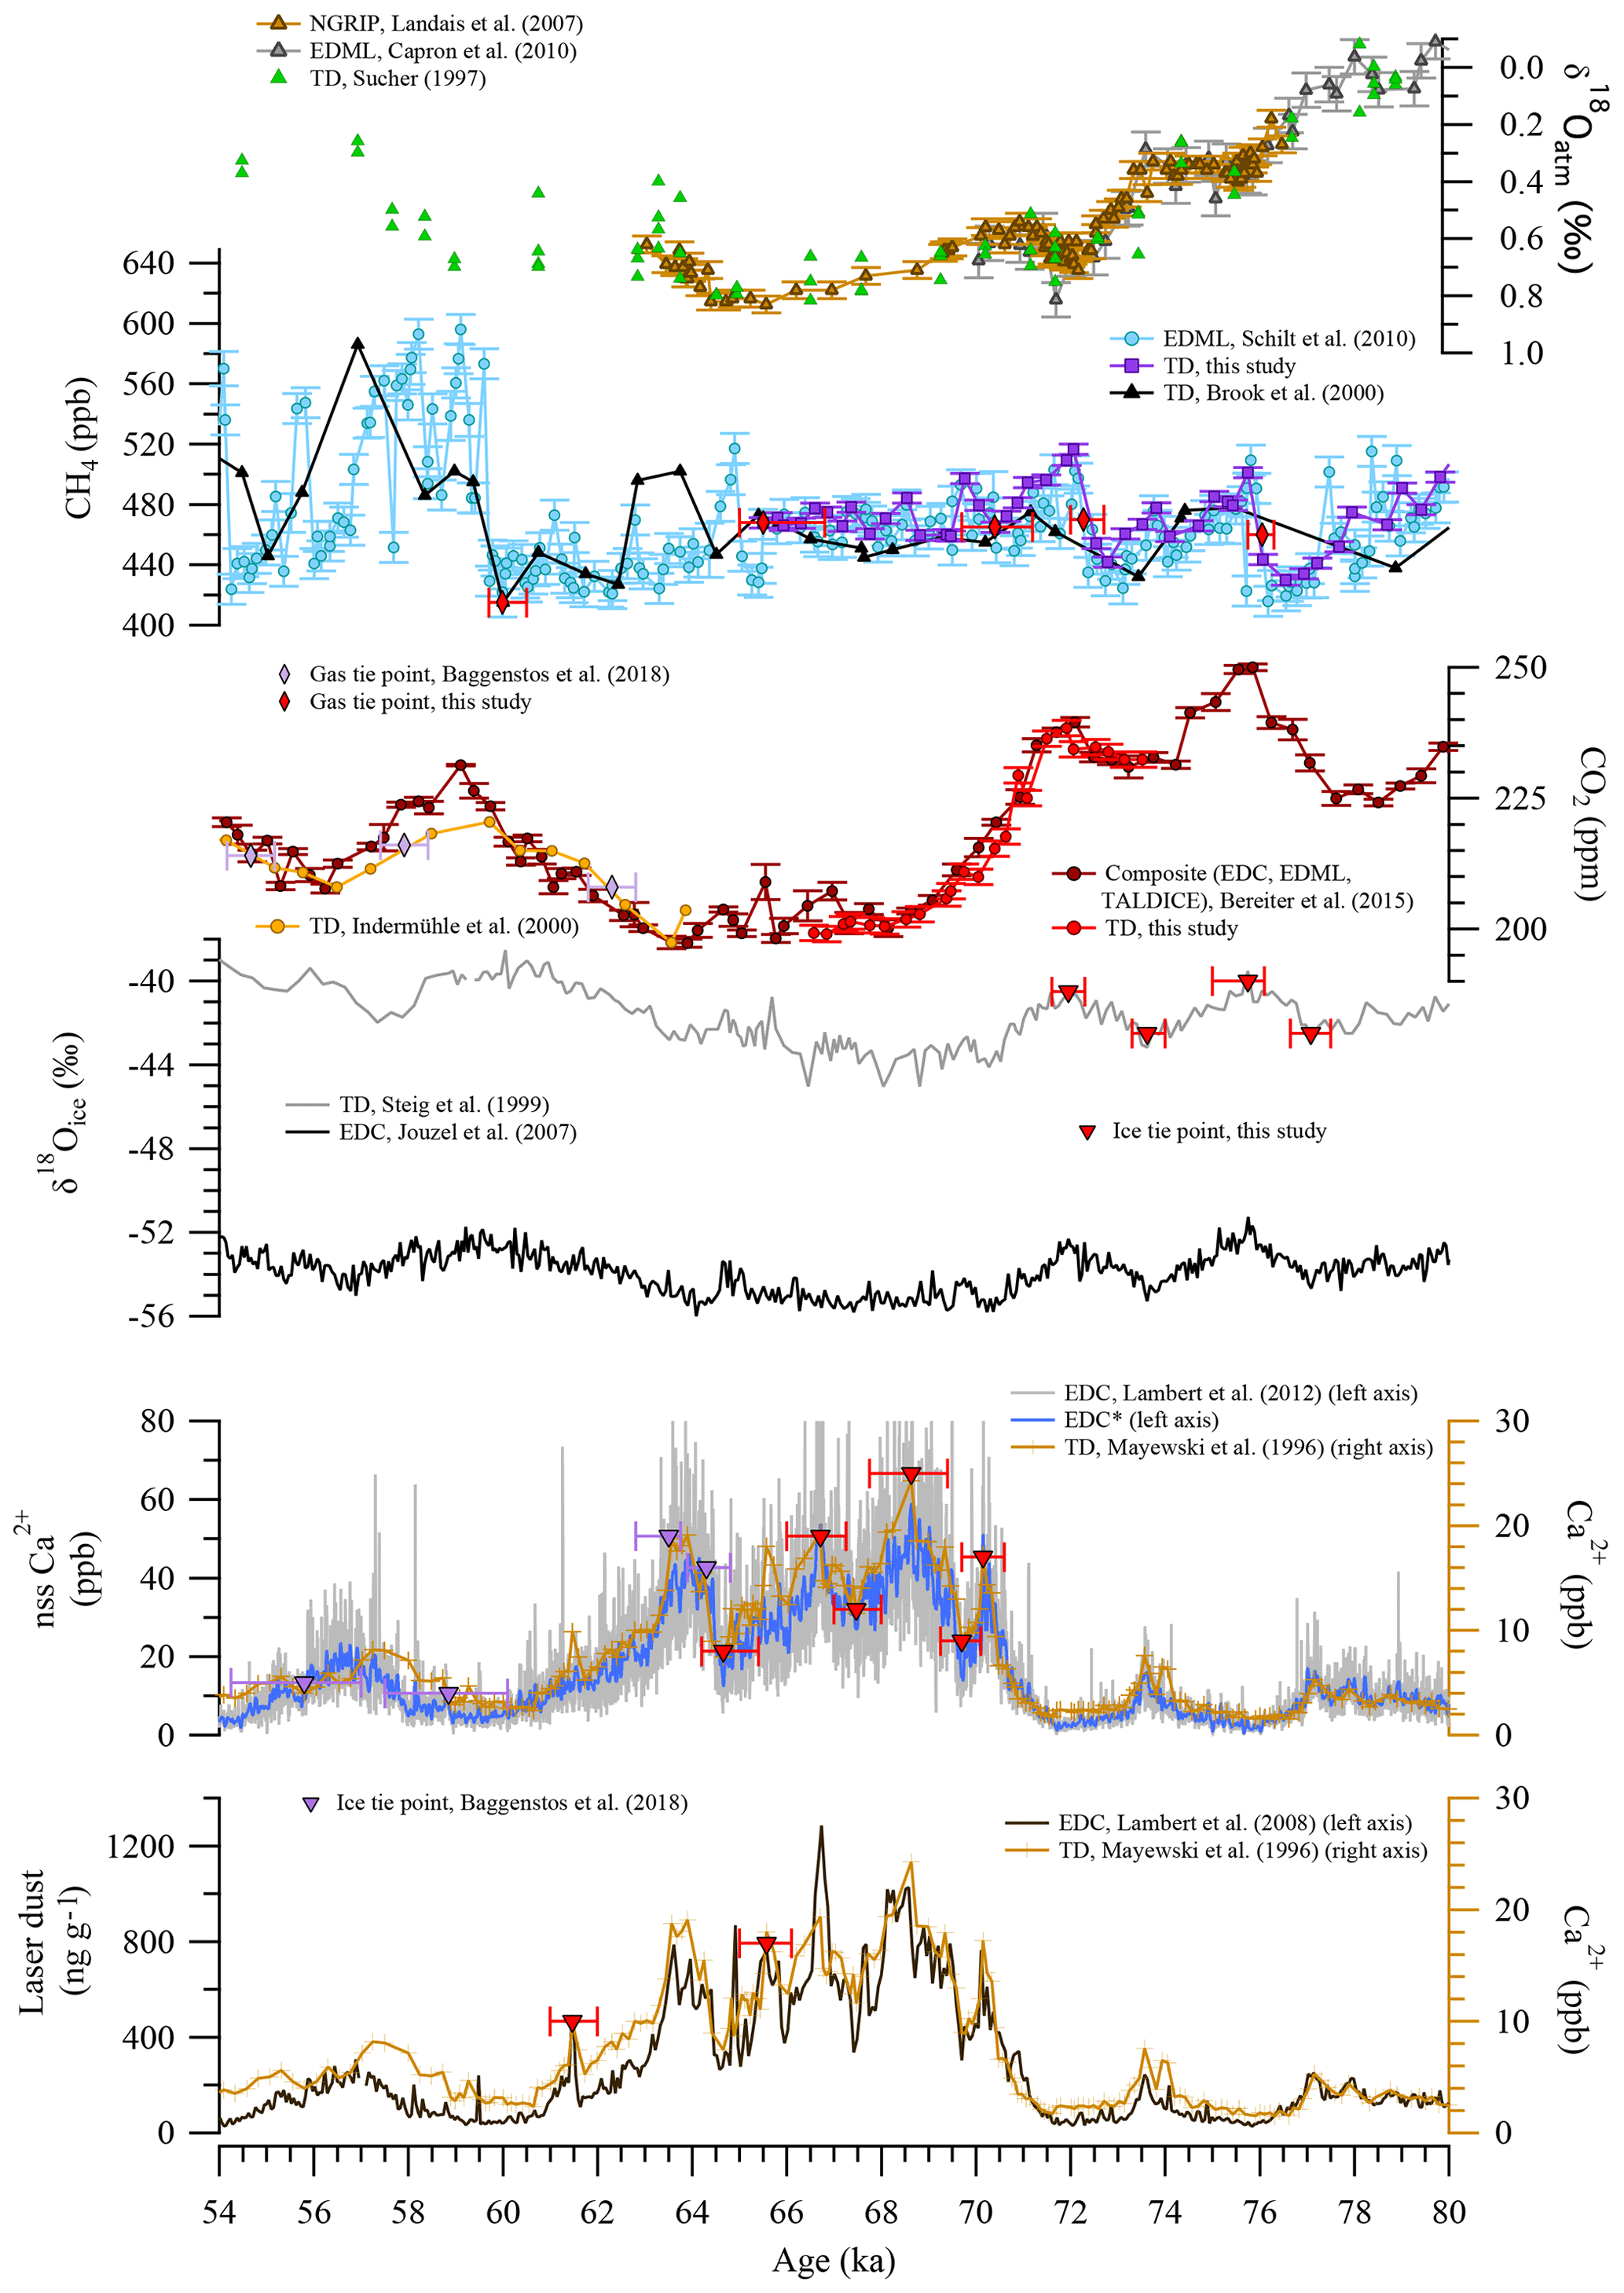
Figure 4Measurements of trace gases (CH4 and CO2), stable isotopes (ice and O2), and Ca2+ from the Taylor Dome ice core on new gas age and ice age scales. All ice core data are synchronized to AICC 2012. NGRIP: North Greenland Ice Coring Project, TD: Taylor Dome, EDML: EPICA Dronning Maud Land, EDC: EPICA Dome C, TALDICE: Talos Dome. * denotes smoothing with a 100-point LOESS algorithm.
3.4 Age model uncertainties
There are two types of uncertainty associated with the new gas and ice age models: (1) absolute age uncertainty propagated from the reference age scale (AICC 2012) and (2) relative age uncertainty arising from depth offsets and the manual selection of tie points. The latter is a function of (a) choosing the correct features to tie, (b) the resolution of the data that define the tie point features, and (c) the measurement error. To estimate relative age uncertainty we assigned a maximum and minimum age to each chosen tie point (Figs. 2, 4, Tables 2–3 and 5–6). The age ranges were determined by closely examining the matched features and estimating the maximum and minimum possible ages based on our judgment of factors (a)–(c) above. The resulting error ranges for our tie points are conservative. Maximum and minimum age scales were determined for the MIS 5–4 cores and the Taylor Dome ice core by interpolating linearly between the maximum and minimum age assigned to each tie point (Fig. 5a and c).
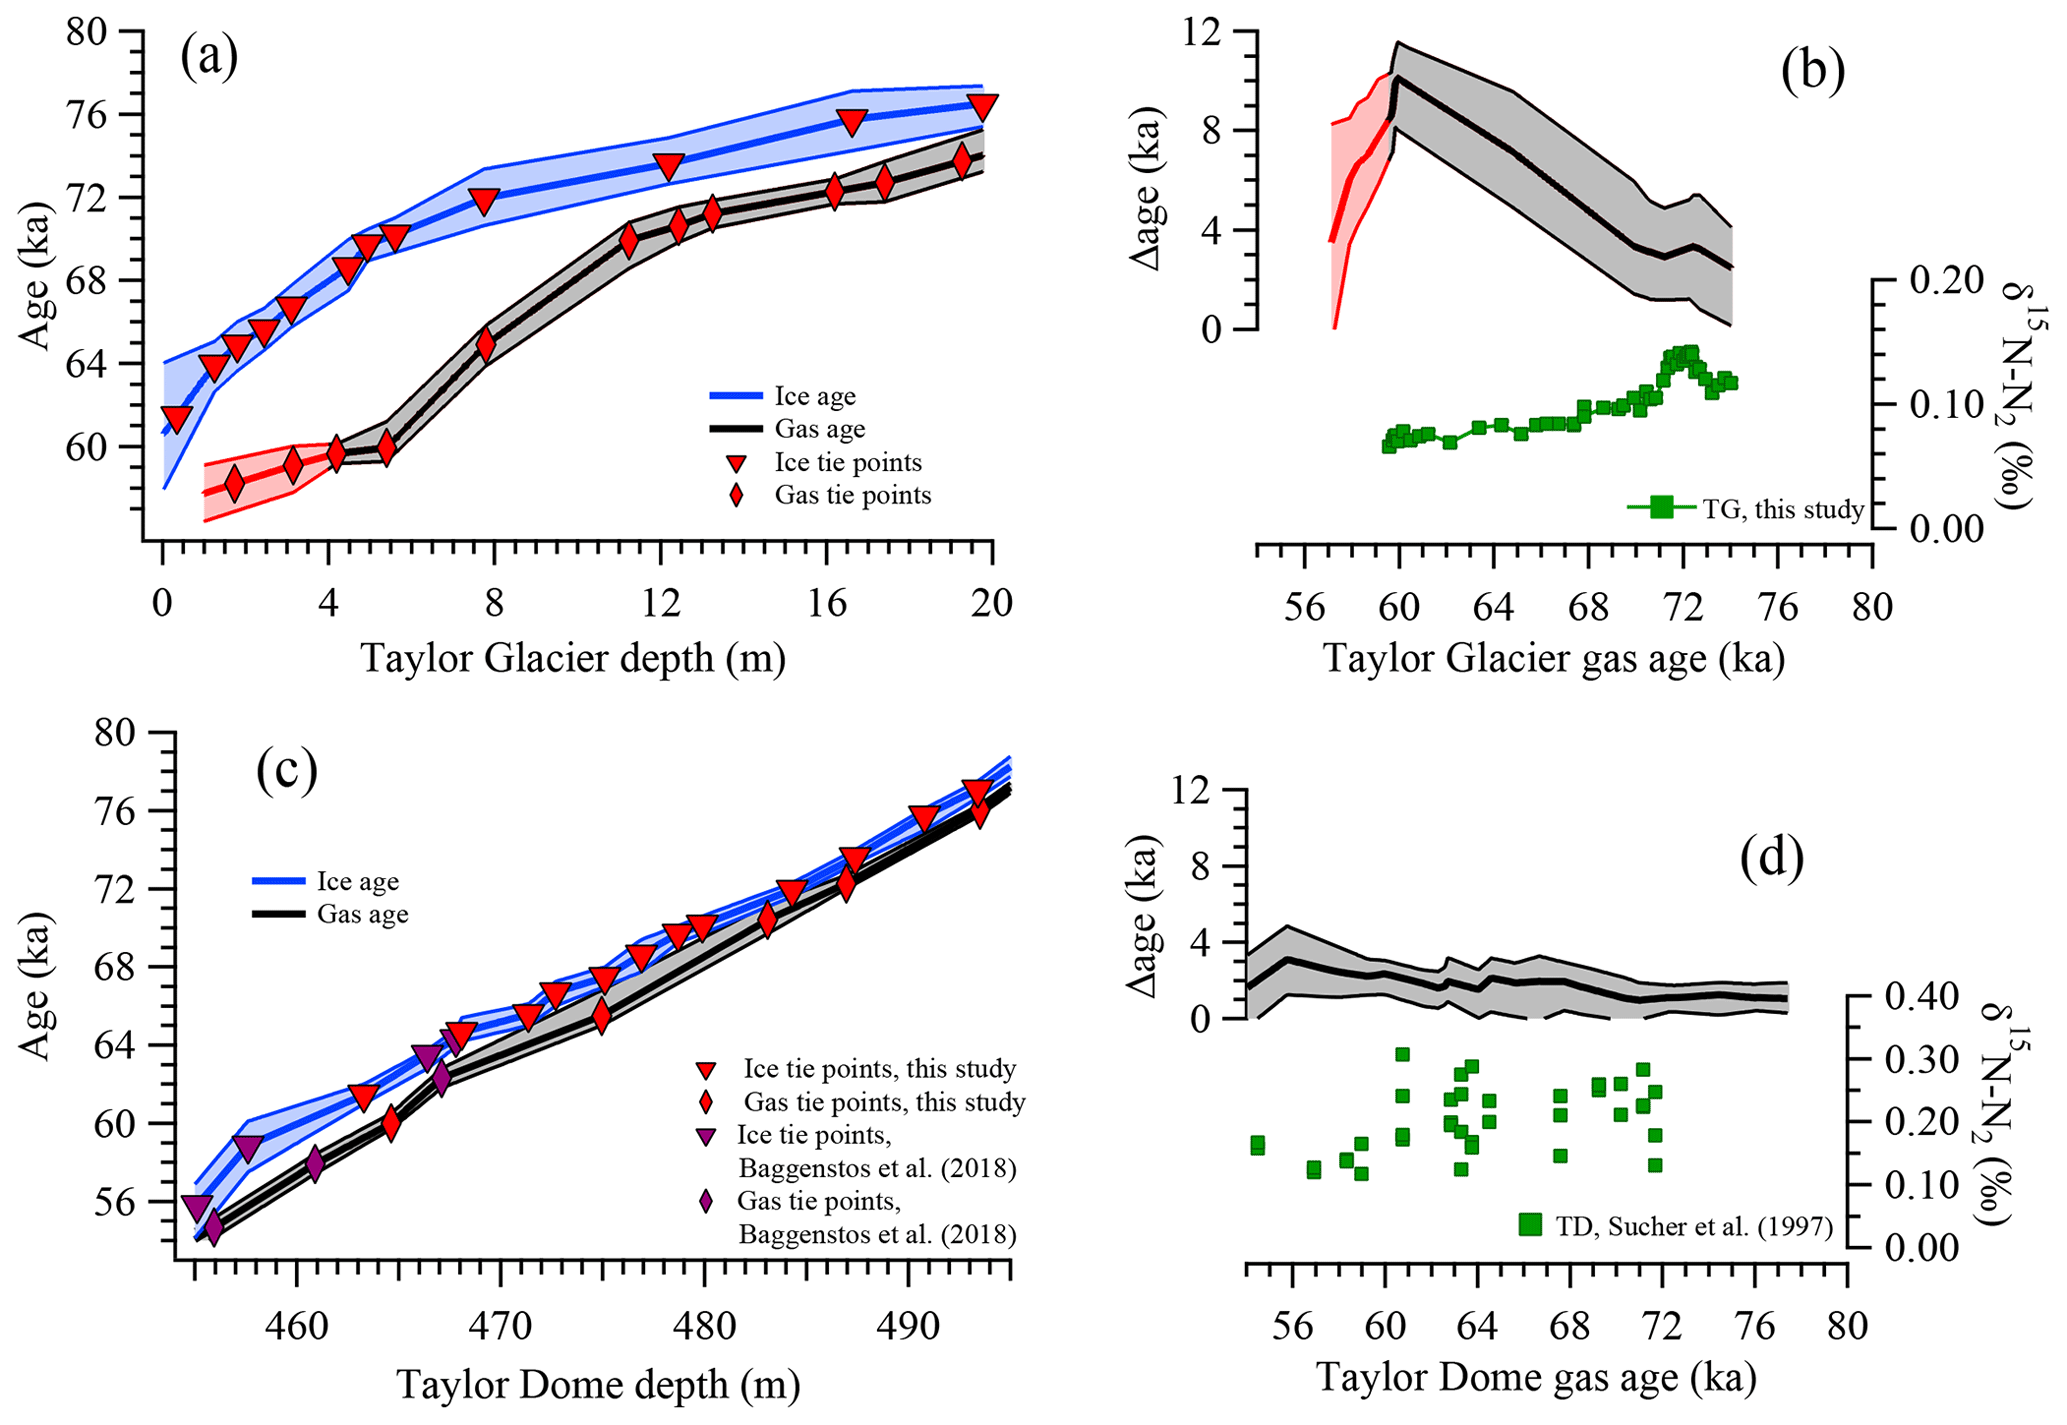
Figure 5(a) New Taylor Glacier MIS 5–4 gas and ice age models, as well as (b) Taylor Glacier Δage and δ15N–N2. Where age data and Δage are plotted in red, gas data are from the top 4 m where contamination from surface cracks is possible. (c) Revised Taylor Dome gas and ice age models, as well as (d) Taylor Dome Δage and δ15N–N2. Δage data are plotted on the gas age scale.
Depth errors contribute additional uncertainty to the total relative uncertainty described above. Depth errors between the Taylor Glacier MIS 5–4 cores were estimated by observing the depth offsets in features resolved by the continuous versus discrete CH4 measurements (Fig. S1). The largest depth offset was at the CH4 rise at ∼16.0 m: there is a 10 cm offset between the continuous field CH4 and the discrete laboratory CH4 and a 20 cm offset between the continuous and discrete laboratory CH4. Approximate 20 cm offsets are also apparent in the ice phase by comparing insoluble particle count data measured in the field versus in the laboratory (Fig. S2); 20 cm equates to 420 years on the new gas age scale in the interval of the ice core where gas age changes most rapidly with depth (65–60 ka; Fig. 5a), and it equates to 360 years on the ice age scale in the interval of the ice core where ice age changes most rapidly with depth (70–61 ka; Fig. 5a). We adopted 420 and 360 years as conservative estimates of the relative gas age error and ice age error, respectively, due to depth uncertainty. These errors were propagated into the calculations of maximum and minimum Taylor Glacier age scales. We are unaware of depth uncertainties in the archived Taylor Dome samples used in this study, so no additional depth uncertainty was added to the age error estimates for Taylor Dome.
The mean of the estimated age errors along the cores provides a reasonable cumulative estimate of the relative uncertainty in the new Taylor Glacier MIS 5–4 and revised Taylor Dome chronologies. For Taylor Glacier the mean relative uncertainty is ±0.9 ka for the gas age and +1.3 ka to −1.2 ka for the ice age. For Taylor Dome the mean relative uncertainty is +0.7 ka to −0.5 ka for the gas age and ±0.6 ka for the ice age. The relative uncertainty is larger in Taylor Glacier due to the depth errors described above.
We did not explicitly account for errors associated with interpolation. Given our conservative estimates of tie point error, we believe any additional uncertainty is minor relative to our conclusions. Tie points were not assigned to the end points of our records unless there was clearly a feature to match (with the exception of the last Taylor Glacier ice age tie point described in the Supplement). Age models are extrapolated from the closest pair of tie points for the interval 0–0.31 m for the ice age scale and the intervals 0–1.74 and 19.27–19.8 m for the gas age scale.
We suspect there are differences between Taylor Glacier and EDML due to gas transport in the firn layer because the features resolved in the new Taylor Glacier CH4 data are generally smoothed relative to the same features in EDML (Figs. 2 and S1). However, we believe that the effect of firn smoothing on our tie point selections is within the estimated relative error for the chronology (Fig. 5a). In contrast, CH4 features in the Taylor Dome record appear less smoothed (Figs. 4 and S3).
The absolute age uncertainty in the reference timescale (AICC 2012) is 2.5 ka for ice age and 1.5 ka for gas age (Veres et al., 2013). By nature, these errors are inherited by the Taylor Glacier 5–4 chronology and the revised Taylor Dome chronology, though the total error in our chronologies should be less than the total propagated EDC and EDML 1σ uncertainties because the uncertainties in gas age and ice age are correlated with depth. The close match of our gas age scales to the radiometrically dated Hulu Cave record (Wang et al., 2001) indicates that the absolute age uncertainties in our gas age scales are equal to or lower than the implied AICC 2012 error estimates (Fig. S5). We estimate an upper absolute age uncertainty of 1.5 ka for our Taylor Glacier and Taylor Dome gas age scales based on the phasing of features in the δ18O–CaCO3 record from Hulu Cave and our CH4 records.
4.1 Data quality and initial observations
Preliminary observations of CH4 variability in the MIS 5–4 PICO core revealed that the air likely contained the full MIS 5–4 transition and the MIS 4–3 transition (Fig. S1). The new Taylor Glacier MIS 5–4 ice cores provide a record of the atmospheric history spanning 74–57.7 ka, including the ∼40 ppm CO2 concentration decrease at the MIS 5–4 transition and the ∼30 ppm CO2 concentration increase near the MIS 4–3 transition (Fig. 2). The new ice cores also record millennial-scale variability in CH4, CO2, and δ18Oatm, as well as δ18Oice and dust. Taylor Glacier δ18Oice is more variable than other Antarctic records, most likely recording local-scale changes in postdepositional alteration (Baggenstos, 2015; Baggenstos et al., 2018; Neumann et al., 2005). We note that large features seen in other Antarctic stable isotope records are preserved (e.g., 2 ‰–3 ‰ changes at the Antarctica Isotope Maximum (AIM) 19 and AIM 20).
Field measurements (continuous CH4 and insoluble particles) were replicated in the laboratory at DRI (Figs. S1 and S2). Replication allowed for the assessment of data quality and supports the original data acquired in the 2014–2015 and 2015–2016 field seasons. Offsets between laboratory and field measurements are minor in the section 4–20 m and are due to the depth offsets described above (Figs. S1 and S2). CH4 offsets between field and DRI data in the section 0–4 m are much larger (Fig. S1) and may be attributed to contamination of the gas signal due to resealed thermal cracks near the glacier surface (Baggenstos et al., 2017). We report these shallow CH4 data for completeness. We assign two gas age tie points at 1.74 m (58.21 ka) and 3.15 m (59.10 ka) to offer a plausible gas age scale for the shallow ice, but the gas age scale for 0–4 m is not interpreted further and does not influence the conclusions of this study. CH4 data from the section 0–1 m were excluded due to very high amounts of contamination in both laboratory and field samples (CH4>1000 ppb). Continuous laboratory CH4 data were also excluded between 14.57–15.0 and 17.55–17.95 m due to technical problems with instrumentation. Variations in Ca2+ and insoluble particle counts generally agree with each other, suggesting that both parameters are recorders of dust variability. Particle count data measured at DRI were averaged every 1 cm, explaining why the record appears less noisy than insoluble particle counts measured in the field (Fig. S2).
CH4 variations in Taylor Glacier are smoother than in EDML. The largest difference appears at DO 18 (64.9 ka) where Taylor Glacier CH4 is ∼40 ppb lower than EDML (and Taylor Glacier δ18Oatm is ∼0.1 ‰ more enriched than NGRIP) (Fig. 2). The CH4 rise associated with DO 19 is less attenuated: ∼20 ppb lower in Taylor Glacier relative to EDML (72.3 ka, Fig. 2). Some of these differences may be due to higher analytical noise in the EDML record (mean of EDML CH41σ=10.25 ppb between 74 and 60 ka). New Taylor Dome CH4 data from OSU show little or no attenuation relative to the EDML record. Taylor Dome CH4 at the onset of DO 19 (72.3 ka) is 14 ppb higher than in EDML and 10 ppb lower at the onset of DO 20 (75.9 ka) (Fig. 4). These offsets are within the combined 1σ error of the measurements. The smoothing in the three ice cores reflects the firn conditions in which bubble trapping occurred, with smoother variations resulting from a thicker lock-in zone that traps bubbles with a larger age distribution. The new CH4 data suggest that Taylor Dome and EDML records are similarly smoothed by the firn, while Taylor Glacier bubbles have a larger gas age distribution.
One clear observation from the new ice core is that the ice from MIS 4 is very thin at Taylor Glacier; indeed the entire MIS 4 period (70–60 ka) appears to be contained in ∼6 m of ice (Fig. 5a). This partially explains why the MIS 4 interval has been relatively difficult to locate. Thin ice could occur due to either low snow accumulation or mechanical thinning of ice layers due to glacier flow. The implications of thin layers for the accumulation history are discussed in more detail below. Taylor Dome, in contrast, does not show such a steep age–depth relationship (Fig. 5c).
Our new data also show that the ice at the MIS 5–4 site is stratigraphically linked to the main transect. The evidence for this is that the −380 m core contains air from late MIS 4 and the MIS 4–3 transition (Fig. 3). The existence of MIS 4 ice on the main transect suggests continuity between the two archives, i.e., that both archives originated from the same accumulation zone. This is important because it means that it is possible to compare climate information from the new MIS 5–4 site to climate information from different intervals (e.g., the LGM) in ice from the main transect. More broadly speaking, it is important to note that geologic evidence from Taylor Valley suggests that Taylor Glacier has not changed dramatically in terms of its extent or thickness in the last ∼2.2 Myr and that Taylor Dome has remained a peripheral dome of the East Antarctic Ice Sheet through the last ice age (Marchant et al., 1994; Brook et al., 1993). It is therefore unlikely that the location of the Taylor Glacier accumulation zone drastically changed during the intervals preserved in the main transect and the MIS 5–4 site (∼77 to 7 ka).
A final observation is that the MIS 5–4 ice cores from Taylor Glacier have very low δ15N–N2 (Fig. 5b). The δ15N–N2 enclosed in ice core air bubbles is controlled primarily by gravitational fractionation in the firn column (Sowers et al., 1992) (Supplement). To first order the δ15N–N2 records the height of the diffusive air column (Sowers et al., 1992), an estimate for total firn thickness. δ15N–N2 is also influenced by convective mixing near the top of the firn (Kawamura et al., 2006; Severinghaus et al., 2010) and vertical gradients in firn temperature induced by rapid shifts in ambient temperature (Severinghaus et al., 1998). Low δ15N–N2 (<0.1 ‰) has been previously observed at Taylor Glacier (e.g., main transect position −125 m) and Taylor Dome (e.g., 380–390 m) and could result from thin firn and/or deep air convection (Baggenstos et al., 2018; Severinghaus et al., 2010; Sucher, 1997). The observation that δ15N–N2 in the −380 m core is similarly low as δ15N–N2 in the MIS 5–4 core supports our interpretation that the archives originated from the same deposition site (Fig. 3).
4.2 Gas age–ice age difference (Δage)
Gas is trapped in air bubbles in firn at polar sites typically 50–120 m below the surface, and thus ice core air is younger than the ice matrix that encloses it (Schwander and Stauffer, 1984). The magnitude of the difference between ice age and gas age (Δage) depends primarily on temperature and accumulation rate, with accumulation having a stronger control (Herron and Langway, 1980; Parrenin et al., 2012; Capron et al., 2013). Δage ranges from 100 to 3000 years in polar ice cores under modern conditions (Schwander and Stauffer, 1984), with high-accumulation sites having the smallest Δage (e.g., Buizert et al., 2015; Etheridge et al., 1996) due to fast advection of firn to the lock-in depth at which gases no longer mix with the overlying pore space. Extrema in Δage up to 6500 years (Vostok) and 12 000 years (Taylor Dome) have been documented for cold, low-accumulation sites at the Last Glacial Maximum (e.g., Veres et al., 2013; Bender et al., 2006; Baggenstos et al., 2018), when slow grain metamorphism and slow advection of firn increase the lock-in time. Other important factors may include ice impurity content (Horhold et al., 2012; Freitag et al., 2013; Bréant et al., 2017), surface wind stress, local summer insolation (Kawamura et al., 2007), and firn thinning. These factors are of secondary importance for polar ice cores compared to the effects of temperature and accumulation rate (Buizert et al., 2015).
Δage was calculated for the new Taylor Glacier ice core by subtracting the gas age at a given depth from the independently determined ice age at the same depth (Δage = ice age − gas age). The Δage in the Taylor Glacier MIS 5–4 core approaches ∼10 ka during late MIS 4 (Fig. 5b), which exceeds Δage for typical modern polar ice core sites even where ice accumulates very slowly. This finding is unprecedented in ice from Taylor Glacier, as Δage in ice from the main transect does not exceed ∼3 ka between 10 and 50 ka (Baggenstos et al., 2018). Our large Δage values imply that accumulation in the Taylor Glacier accumulation zone decreased significantly through MIS 4, which could have been caused by low precipitation and/or high wind scouring. This interpretation is supported by the following lines of evidence: (1) the depth–age relationship suggests the ice during MIS 4 is very thin (Fig. 5a). This is in contrast to ice from the Last Glacial Maximum, which is found at the surface of Taylor Glacier in two thicker (layer thickness is ∼50 m) outcrops that dip approximately vertically and strike along the glacier longitudinally (Baggenstos et al., 2017; Aciego et al., 2007). Thin MIS 4 layers could be due to mechanical thinning of the ice rather than low accumulation rates. However, we note that ice thinning does not alter Δage because Δage is fixed at the bottom of the firn when the ice matrix encloses bubbles (Parrenin et al., 2012). This is unlike Δdepth, the depth difference between ice and gas of the same age, which evolves with thinning. So even if increased thinning caused the steep depth–age curve observed during MIS 4, one would still need to invoke an explanation for the high Δage. (2) There is some degree of smoothing in the Taylor Glacier CH4 data relative to EDML, which can result from the expected longer gas trapping duration in firn where accumulation rates are relatively low (Köhler et al., 2011; Fourteau et al., 2017; Spahni et al., 2003). (3) As Δage increased at the onset of MIS 4, the δ15N–N2 progressively decreased (Fig. 5b), which is consistent with thinning of the firn column in response to decreased net accumulation. Inspection of Fig. 5b reveals that the change in δ15N–N2 is not linear with Δage, potentially due to nongravitational effects like thermal fractionation (Severinghaus et al., 1998) or convective mixing near the top of the firn (Kawamura et al., 2006). A very low accumulation rate is known to be associated with deep convective mixing in the firn (Severinghaus et al., 2010).
In contrast to Taylor Glacier, Δage at Taylor Dome reaches a maximum of 3 ka at ∼56 ka and does not rise above 2.5 ka throughout MIS 4 (Fig. 5d). The implication of the relatively “normal” Δage is that net accumulation at Taylor Dome did not dramatically change throughout MIS 4, while Δage in the Taylor Glacier accumulation region did.
Δage uncertainty was determined by propagating the error reported for the age models described above (Fig. 5a and c). The maximum and minimum Δage curves were calculated by subtracting the oldest gas age scale from the youngest ice age scale and vice versa. The mean Δage uncertainty is ±2.2 ka for the Taylor Glacier MIS 5–4 cores and +1.0 ka to −1.3 ka for the Taylor Dome core. The larger uncertainty for Taylor Glacier is due to the larger age uncertainties arising from the depth error. The uncertainties we estimate for Δage are of similar magnitude as the Δage uncertainty in other Taylor Glacier chronologies (Baggenstos et al., 2018).
4.3 Accumulation rate estimates
Given mean annual temperature and Δage, it is possible to use models of firn densification to estimate the accumulation rate at the Taylor Glacier accumulation zone. We used an empirical firn densification model (Herron and Langway, 1980) to compute firn density profiles for a range of temperatures and mean accumulation rates (Supplement). Δage in the model is estimated by calculating the age of the firn when it has reached the close-off depth (when the density is 0.83 g cm−3). The estimated accumulation rate comes from a simple lookup function that scans the full range of temperature and Δage and picks the corresponding accumulation rate (similar to work by Parrenin et al., 2012). For a Δage of 10 ka and a temperature of −46 ∘C the estimated accumulation rate for the Taylor Glacier MIS 5–4 cores is 1.9 mm yr−1 of ice equivalent. The temperature −46 ∘C is derived from the average δ18Oice for the period of firn densification (70–60 ka) using the relationship Δδ18Oice=0.5 ∘C−1 calibrated using modern ‰ and modern temperature at −43 ∘C (Waddington and Morse, 1994; Steig et al., 2000), similar to Baggenstos et al. (2018). We used the average δ18Oice from the Taylor Dome record because it is less noisy and avoids the question of whether Taylor Glacier δ18Oice accurately records temperature (Baggenstos et al., 2018). Since the close-off depth is estimated from the modeled firn density profile (30 m), it is possible to estimate the expected δ15N–N2 assuming that the close-off depth is an approximation of the height of the diffusive air column (Supplement). Assuming a 3 m lock-in zone height and a 0 m convective zone height (see the Supplement), the predicted δ15N–N2 (0.14 ‰) is enriched by a factor of 2 relative to measured values (∼0.07 ‰ at 60 ka; Fig. 5b). The difference in expected versus measured δ15N–N2 may imply the influence of deep air convection in the Taylor Glacier firn column (Kawamura et al., 2006; Severinghaus et al., 2010). To bring the predicted δ15N–N2 into closer agreement we introduced a convective zone height of 13.5 m (Fig. S7). The apparent influence of air convection could be due to cracks that penetrate the surface of the firn (e.g., Severinghaus et al., 2010), which only occur in firn with a low mean accumulation rate.
A similar estimate was performed for the Taylor Dome core. Running the models with a Δage of 2.3 ka (the Taylor Dome Δage at ∼60 ka when Taylor Glacier Δage is maximum, Fig. 5) and a temperature of −46 ∘C yields an estimated mean accumulation rate of 1.6 cm yr−1 of ice equivalent, almost a factor of 10 larger than Taylor Glacier. The estimated diffusive column height (53 m) with a 3 m lock-in zone height and 0 m convective zone height predicts δ15N–N2 of 0.26 ‰ (Fig. S8), in somewhat better agreement with measured δ15N–N2 (Fig. 5d), implying less influence of deep air convection. The δ15N–N2 data from Taylor Dome are lower resolution and less precise than the new Taylor Glacier data; in fact, there is not actually a δ15N–N2 measurement at 60 ka (Fig. 5d). Still, we think the closer agreement between modeled δ15N–N2 and the nearest measured δ15N–N2 suggests a shallower convective zone, consistent with higher mean accumulation rate.
These accumulation rate and firn thickness calculations estimate how low the accumulation at Taylor Glacier may have been relative to Taylor Dome in late MIS 4. We caution that these estimates are uncertain given that we extrapolated below the empirical calibration range of the firn densification model (lowest accumulation 2.4 cm yr−1 of ice equivalent at Vostok) (Herron and Langway, 1980). We are unaware of firn densification models that are specifically tailored to very-low-accumulation sites. Another potential uncertainty in our estimates is that we did not account for geothermal heat transfer through the firn, which is relatively close to bedrock at Taylor Dome (the depth to bedrock is ∼550 m). The effect of excess geothermal heat would drive firn temperatures higher, decreasing Δage (Goujon et al., 2003). Higher firn temperatures could also cause lower δ15N–N2, perhaps partially explaining low values of δ15N–N2 observed at Taylor Glacier and Taylor Dome.
Despite the model uncertainties, we conclude that the simplest explanation for the Δage patterns described above is markedly different accumulation rates in the Taylor Dome versus Taylor Glacier accumulation zones during MIS 4. Today the Taylor Glacier accumulation zone is on the northern flank of Taylor Dome, whereas the Taylor Dome ice core site is on the south flank (Fig. 1). The difference between the estimated accumulation rate at Taylor Glacier versus Taylor Dome implies a gradient in precipitation and/or wind scouring between the two locations. This implication is perhaps not surprising given that a modern accumulation gradient is observed in the same direction, with accumulation decreasing from 14 to 2 cm yr−1 going from south to north (Morse et al., 1999, 2007; Kavanaugh et al., 2009b). Moisture delivery to Taylor Dome primarily occurs during storms that penetrate the Transantarctic Mountains south of the Royal Society Range and reach Taylor Dome from the south (Morse et al., 1998); therefore, the modern-day accumulation rate decreases orographically from south to north. The Taylor Glacier accumulation zone is effectively situated on the lee side of Taylor Dome with respect to the modern prevailing storm tracks (Morse et al., 1999) (Fig. 1). The difference between Δage at Taylor Glacier versus Taylor Dome is too large to be explained by temperature contrasts between the two sites, which are on the order of 1–3 ∘C in the present day (Waddington and Morse, 1994).
A temporal change in the accumulation gradient across Taylor Dome (and hence between Taylor Dome and the Taylor Glacier accumulation zone) has already been suggested by other work for the Last Glacial Maximum. Morse et al. (1998) calculated the accumulation rate history for the Taylor Dome ice core site using modern accumulation data, a calculated ice flow field, and an age scale determined by the correlation of isotope and chemical data with Vostok ice core records (Fig. 6). By mapping the Taylor Dome age scale to ice layers resolved in radar stratigraphy, Morse et al. (1998) also inferred the accumulation rate history for a virtual ice core situated in the lee of the modern prevailing storm trajectory, ∼7 km to the north of the Taylor Dome drill site and likely near the hypothesized Taylor Glacier accumulation zone (Fig. 1).
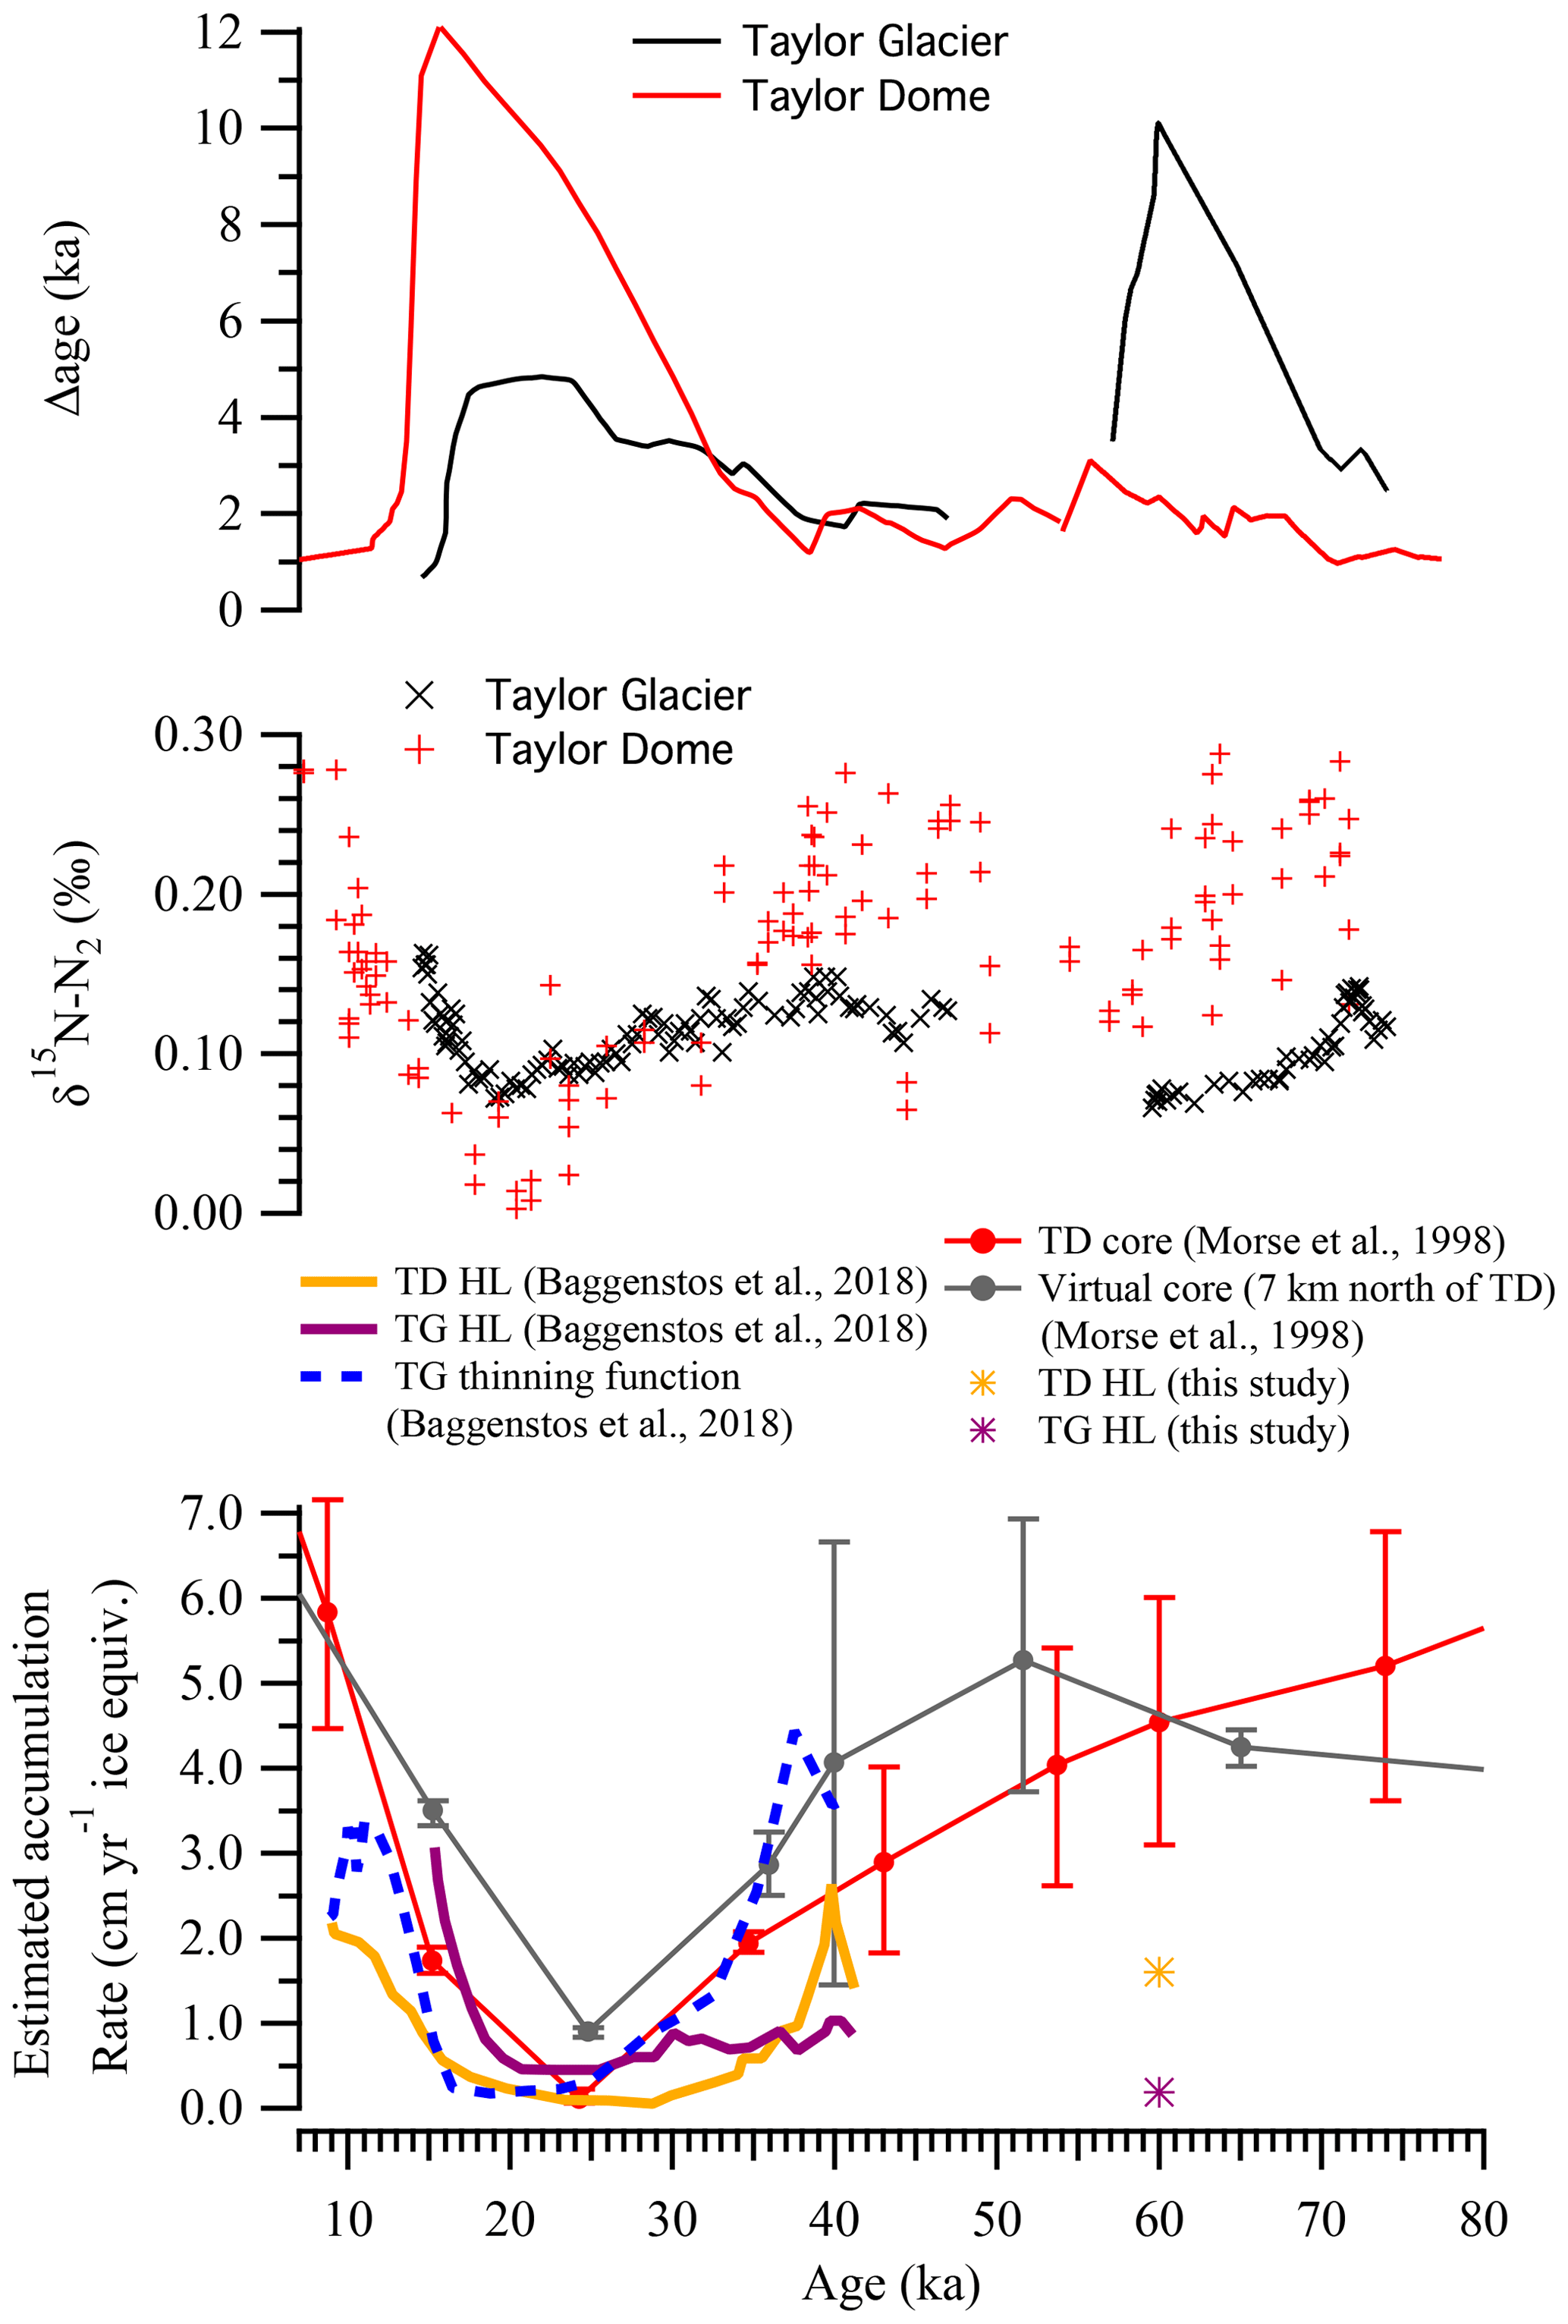
Figure 6Δage, δ15N–N2, and estimated accumulation rate for Taylor Glacier and Taylor Dome from 75 to 7 ka. Δage and δ15N–N2 data between 55 and 7 ka are from Baggenstos et al. (2018) and 80–55 ka are from this study, except all Taylor Dome δ15N–N2 data, which are from Sucher (1997). Δage data are plotted on the gas age scale. TD: Taylor Dome, TG: Taylor Glacier, HL: Herron and Langway (1980).
The accumulation histories inferred from the layer thicknesses revealed differences for the two sites but not in the direction expected from the modern south-to-north storm trajectory. The Last Glacial Maximum accumulation histories were characterized by extremely low accumulation at the Taylor Dome ice core site relative to higher accumulation at the northern virtual ice core site. The possibility that different layer thicknesses (and inferred accumulation histories) were a result of differential ice flow was rejected because deeper layers did not show the same effect (Morse et al., 1998). The reversed accumulation gradient inferred from ice layer thicknesses was qualitatively confirmed by independent Δage determinations on Taylor Glacier and Taylor Dome ice made by Baggenstos et al. (2018), which revealed a Taylor Glacier Δage of ∼3000 years and a Taylor Dome Δage of ∼ 12 000 years at the Last Glacial Maximum. Accumulation rate estimates from a firn densification model (Fig. 6) confirmed that the orientation of the accumulation gradient was north to south, in the opposite direction of the gradient observed today (Fig. 1).
Our new Δage data and accumulation rate estimates indicate an accumulation gradient in the same direction as the modern one but opposite to that of the Last Glacial Maximum. The accumulation rate estimates by Morse et al. (1998) qualitatively agree with this pattern: >60 ka (Fig. 6). It is hypothesized that the reversed accumulation gradient at the Last Glacial Maximum resulted from a shift in the trajectory of storm systems that delivered moisture to Taylor Dome, possibly in response to the extension of grounded ice far into the Ross Sea (Morse et al., 1998). If indeed the Antarctic ice sheet extended far enough into the Ross Sea to alter the atmospheric circulation during the Last Glacial Maximum, the implication of our new data is that a similar situation did not exist during MIS 4. This hypothesis seems at odds with independent evidence that the Southern Hemisphere experienced full glacial conditions during MIS 4 (Schaefer et al., 2015; Barker and Diz, 2014). A possible explanation is that the sea level minimum at MIS 4 was 25 m higher than during the Last Glacial Maximum due to the lack of extensive Northern Hemisphere ice sheets (Shakun et al., 2015; Siddall et al., 2003; Cutler et al., 2003), which limited how far grounded ice from the West Antarctic Ice Sheet could extend into the Ross Embayment. This suggestion is consistent with (1) data suggesting that the maximum Ross Ice Shelf extent occurred during the last glacial termination (Hall et al., 2015; Denton and Hughes, 2000) rather than MIS 4 and (2) the notion that the grounding line position in the Ross Sea is set by the balance between marine forcing (basal melting) and accumulation on the Antarctic ice sheets (Hall et al., 2015).
A second hypothesis arises from the notion that broad differences in regional atmospheric dynamics between MIS 4 and the Last Glacial Maximum might occur, without invoking changes in the extent of the Ross Ice Shelf as a mechanism for disrupting the atmospheric circulation. The Amundsen Sea Low, a low-pressure center that influences the Ross Sea and Amundsen Sea sectors of Antarctica, responds strongly to changes in tropical climate (Raphael et al., 2016; Turner et al., 2013) and exhibits cyclonic behavior that likely controls the path of storms that enter the Ross Embayment and reach Taylor Dome, as implied by Morse et al. (1998) and explored by Bertler et al. (2006). An intensified or shifted Amundsen Sea Low during MIS 4 relative to the Last Glacial Maximum might result in strong meridional flow across Taylor Dome that maintained a south-to-north orographic precipitation gradient. Interestingly, variability in the Amundsen Sea Low has been linked to the extent of Northern Hemisphere ice sheets (Jones et al., 2018), which were smaller in extent at MIS 4 relative to the Last Glacial Maximum. In summary, the anomalous accumulation gradients we document on Taylor Dome in MIS 4 may have their origin in the modest Northern Hemisphere ice volume at that time.
We obtained the first ice core from the Taylor Glacier blue ice area that contains air with ages unambiguously spanning the MIS 5–4 transition and the MIS 4–3 transition (74.0–57.7 ka). The ice core also contains ice spanning the MIS 5–4 transition and MIS 4 (76.5–60.6 ka). The gas age–ice age difference (Δage) in the cores approaches 10 000 years during MIS 4, implying extremely arid conditions with very low net accumulation at the site of snow deposition. To the south of the Taylor Glacier accumulation zone, the Taylor Dome ice core exhibits lower Δage (1000–2500 years) during the same time interval. This implies a steep accumulation rate gradient across the Taylor Dome region with precipitation decreasing toward the north and/or extreme wind scouring affecting the northern flank. The direction of the gradient suggests that the trajectory of storms was south to north during MIS 4 and that storm paths were not disrupted by Antarctic ice protruding into the Ross Sea or by changes in the strength and/or position of the Amundsen Sea Low, as occurred at the Last Glacial Maximum.
Data will be made available through the US Antarctic Program Data Center and the National Center for Environmental Information.
The supplement related to this article is available online at: https://doi.org/10.5194/cp-15-1537-2019-supplement.
JAM made measurements at OSU on Taylor Glacier samples, developed chronologies, and prepared the paper; JAM, EJB, and JRM made measurements in the field; TKB made measurements at OSU on the −380 m Taylor Glacier core; SB and SM made measurements at OSU on Taylor Dome samples; SAS made measurements on all new Taylor Glacier samples at SIO except the −380 m core, which were made by DB; JRM made measurements on Taylor Glacier samples at DRI; all authors provided valuable feedback and made helpful contributions to writing the paper.
The authors declare that they have no conflict of interest.
We thank Mike Jayred for maintaining and operating the blue ice drill and Kathy Schroeder and Chandra Llewellyn for managing the Taylor Glacier field camp; both tasks were Herculean. We thank Peter Sperlich, Isaac Vimont, Peter Neff, Heidi Roop, Bernhard Bereiter, Jake Ward, and Andrew M. Smith for help with field logistics and drilling, sampling, and packing ice cores. We thank Howard Conway and Ed Waddington for feedback on an early version of the paper, as well as Christo Buizert and Justin Wettstein for helpful conversations about the Amundsen Sea Low. We thank Michael Kalk, Aron Buffen, and Michael Rebarchik for laboratory assistance at Oregon State University and Monica Arienzo and Nathan Chellman for operation of the continuous melter and other instrumentation at the Desert Research Institute. We thank the United States Antarctic Program, with particular thanks to Science Cargo, the BFC, and Helicopter Operations. We also thank Brian Eisenstatt and Duncan May for ensuring the delivery of critical supplies to the glacier at critical times during both Antarctic field seasons.
This research has been supported by the National Science Foundation, Office of Polar Programs (grant nos. PLR-1245821, PLR-1245659, and PLR-1246148) and the UK National Environmental Research Council (grant no. 502625).
This paper was edited by Denis-Didier Rousseau and reviewed by four anonymous referees.
Aarons, S. M., Aciego, S. M., Arendt, C. A., Blakowski, M. A., Steigmeyer, A., Gabrielli, P., Sierra-Hernández, M. R., Beaudon, E., Delmonte, B., Baccolo, G., May, N. W., and Pratt, K. A.: Dust composition changes from Taylor Glacier (East Antarctica) during the last glacial-interglacial transition: A multi-proxy approach, Quaternary Sci. Rev., 162, 60–71, https://doi.org/10.1016/j.quascirev.2017.03.011, 2017.
Aciego, S. M., Cuffey, K. M., Kavanaugh, J. L., Morse, D. L., and Severinghaus, J. P.: Pleistocene ice and paleo-strain rates at Taylor Glacier, Antarctica, Quaternary Res., 68, 303–313, https://doi.org/10.1016/j.yqres.2007.07.013, 2007.
Ahn, J. H., Brook, E. J., and Howell, K.: A high-precision method for measurement of paleoatmospheric CO2 in small polar ice samples, J. Glaciol., 55, 499–506, 2009.
Baggenstos, D.: Taylor Glacier as an archive of ancient ice for large-volume samples: Chronology, gases, dust, and climate, PhD, Scripps Insittute of Oceanography, University of California, San Diego, 2015.
Baggenstos, D., Bauska, T. K., Severinghaus, J. P., Lee, J. E., Schaefer, H., Buizert, C., Brook, E. J., Shackleton, S., and Petrenko, V. V.: Atmospheric gas records from Taylor Glacier, Antarctica, reveal ancient ice with ages spanning the entire last glacial cycle, Clim. Past, 13, 943–958, https://doi.org/10.5194/cp-13-943-2017, 2017.
Baggenstos, D., Severinghaus, J. P., Mulvaney, R., McConnell, J. R., Sigl, M., Maselli, O., Petit, J. R., Grente, B., and Steig, E. J.: A Horizontal Ice Core From Taylor Glacier, Its Implications for Antarctic Climate History, and an Improved Taylor Dome Ice Core Time Scale, Paleoceanogr. Paleocl., 33, 778–794, https://doi.org/10.1029/2017pa003297, 2018.
Barker, S. and Diz, P.: Timing of the descent into the last Ice Age determined by the bipolar seesaw, Paleoceanography, 29, 489–507, https://doi.org/10.1002/2014pa002623, 2014.
Bauska, T., Baggenstos, D., Brook, E. J., Mix, A. C., Marcott, S. A., Petrenko, V. V., Schaefer, H., Severinghaus, J. P., and Lee, J. E.: Carbon isotopes characterize rapid changes in atmospheric carbon dioxide during the last deglaciation, P. Natl. Acad. Sci. USA, 113, 3465–3470, https://doi.org/10.1073/pnas.1513868113, 2016.
Bauska, T. K., Brook, E. J., Mix, A. C., and Ross, A.: High-precision dual-inlet IRMS measurements of the stable isotopes of CO2 and the N2O∕CO2 ratio from polar ice core samples, Atmos. Meas. Tech., 7, 3825–3837, https://doi.org/10.5194/amt-7-3825-2014, 2014.
Bauska, T. K., Brook, E. J., Marcott, S. A., Baggenstos, D., Shackleton, S., Severinghaus, J. P., and Petrenko, V. V.: Controls on Millennial-Scale Atmospheric CO2 Variability During the Last Glacial Period, Geophys. Res. Lett., 45, 7731–7740, https://doi.org/10.1029/2018gl077881, 2018.
Bazin, L., Landais, A., Lemieux-Dudon, B., Toyé Mahamadou Kele, H., Veres, D., Parrenin, F., Martinerie, P., Ritz, C., Capron, E., Lipenkov, V., Loutre, M.-F., Raynaud, D., Vinther, B., Svensson, A., Rasmussen, S. O., Severi, M., Blunier, T., Leuenberger, M., Fischer, H., Masson-Delmotte, V., Chappellaz, J., and Wolff, E.: An optimized multi-proxy, multi-site Antarctic ice and gas orbital chronology (AICC2012): 120–800 ka, Clim. Past, 9, 1715–1731, https://doi.org/10.5194/cp-9-1715-2013, 2013.
Bender, M. L., Floch, G., Chappellaz, J., Suwa, M., Barnola, J. M., Blunier, T., Dreyfus, G., Jouzel, J., and Parrenin, F.: Gas age-ice age differences and the chronology of the Vostok ice core, 0–100 ka, J. Geophys. Res.-Atmos., 111, D21115, https://doi.org/10.1029/2005jd006488, 2006.
Bender, M. L., Barnett, B., Dreyfus, G., Jouzel, J., and Porcelli, D.: The contemporary degassing rate of Ar-40 from the solid Earth, P. Natl. Acad. Sci. USA, 105, 8232–8237, https://doi.org/10.1073/pnas.0711679105, 2008.
Bereiter, B., Eggleston, S., Schmitt, J., Nehrbass-Ahles, C., Stocker, T. F., Fischer, H., Kipfstuhl, S., and Chappellaz, J.: Revision of the EPICA Dome C CO2 record from 800 to 600 kyr before present, Geophys. Res. Lett., 42, 542–549, https://doi.org/10.1002/2014gl061957, 2015.
Bertler, N. A. N., Naish, T. R., Oerter, H., Kipfstuhl, S., Barrett, P. J., Mayewski, P. A., and Kreutz, K.: The effects of joint ENSO-Antarctic Oscillation forcing on the McMurdo Dry Valleys, Antarctica, Antarct. Sci., 18, 507–514, https://doi.org/10.1017/s0954102006000551, 2006.
Bindschadler, R., Vornberger, P., Fleming, A., Fox, A., Mullins, J., Binnie, D., Paulsen, S. J., Granneman, B., and Gorodetzky, D.: The Landsat Image Mosaic of Antarctica, Remote Sens. Environ., 112, 4214–4226, https://doi.org/10.1016/j.rse.2008.07.006, 2008.
Bintanja, R.: On the glaciological, meteorological, and climatological significance of Antarctic blue ice areas, Rev. Geophys., 37, 337–359, https://doi.org/10.1029/1999rg900007, 1999.
Blunier, T. and Brook, E. J.: Timing of millennial-scale climate change in Antarctica and Greenland during the last glacial period, Science, 291, 109–112, https://doi.org/10.1126/science.291.5501.109, 2001.
Blunier, T., Spahni, R., Barnola, J.-M., Chappellaz, J., Loulergue, L., and Schwander, J.: Synchronization of ice core records via atmospheric gases, Clim. Past, 3, 325–330, https://doi.org/10.5194/cp-3-325-2007, 2007.
Bréant, C., Martinerie, P., Orsi, A., Arnaud, L., and Landais, A.: Modelling firn thickness evolution during the last deglaciation: constraints on sensitivity to temperature and impurities, Clim. Past, 13, 833–853, https://doi.org/10.5194/cp-13-833-2017, 2017.
Brook, E. J., Kurz, M. D., Ackert, R. P., Denton, G. H., Brown, E. T., Raisbeck, G. M., and Yiou, F.: Chronology of Taylor Glacier advances in Arena Valley, Antarctica, using insitu cosmogenic He-3 and Be-10, Quaternary Res., 39, 11–23, https://doi.org/10.1006/qres.1993.1002, 1993.
Brook, E. J., Harder, S., Severinghaus, J., Steig, E. J., and Sucher, C. M.: On the origin and timing of rapid changes in atmospheric methane during the last glacial period, Global Biogeochem. Cy., 14, 559–572, https://doi.org/10.1029/1999gb001182, 2000.
Buizert, C., Baggenstos, D., Jiang, W., Purtschert, R., Petrenko, V. V., Lu, Z. T., Muller, P., Kuhl, T., Lee, J., Severinghaus, J. P., and Brook, E. J.: Radiometric Kr-81 dating identifies 120,000-year-old ice at Taylor Glacier, Antarctica, P. Natl. Acad. Sci. USA, 111, 6876–6881, https://doi.org/10.1073/pnas.1320329111, 2014.
Buizert, C., Cuffey, K. M., Severinghaus, J. P., Baggenstos, D., Fudge, T. J., Steig, E. J., Markle, B. R., Winstrup, M., Rhodes, R. H., Brook, E. J., Sowers, T. A., Clow, G. D., Cheng, H., Edwards, R. L., Sigl, M., McConnell, J. R., and Taylor, K. C.: The WAIS Divide deep ice core WD2014 chronology – Part 1: Methane synchronization (68–31 ka BP) and the gas age–ice age difference, Clim. Past, 11, 153–173, https://doi.org/10.5194/cp-11-153-2015, 2015.
Capron, E., Landais, A., Buiron, D., Cauquoin, A., Chappellaz, J., Debret, M., Jouzel, J., Leuenberger, M., Martinerie, P., Masson-Delmotte, V., Mulvaney, R., Parrenin, F., and Prié, F.: Glacial–interglacial dynamics of Antarctic firn columns: comparison between simulations and ice core air-δ15N measurements, Clim. Past, 9, 983–999, https://doi.org/10.5194/cp-9-983-2013, 2013.
Cutler, K. B., Edwards, R. L., Taylor, F. W., Cheng, H., Adkins, J., Gallup, C. D., Cutler, P. M., Burr, G. S., and Bloom, A. L.: Rapid sea-level fall and deep-ocean temperature change since the last interglacial period, Earth Planet. Sc. Lett., 206, 253–271, https://doi.org/10.1016/s0012-821x(02)01107-x, 2003.
Denton, G. H. and Hughes, T. J.: Reconstruction of the Ross ice drainage system, Antarctica, at the last glacial maximum, Geogr. Ann. A, 82, 143–166, https://doi.org/10.1111/j.0435-3676.2000.00120.x, 2000.
Etheridge, D. M., Steele, L. P., Langenfelds, R. L., Francey, R. J., Barnola, J. M., and Morgan, V. I.: Natural and anthropogenic changes in atmospheric CO2 over the last 1000 years from air in Antarctic ice and firn, J. Geophys. Res.-Atmos., 101, 4115–4128, https://doi.org/10.1029/95jd03410, 1996.
Fogwill, C. J., Turney, C. S. M., Golledge, N. R., Etheridge, D. M., Rubino, M., Thornton, D. P., Baker, A., Woodward, J., Winter, K., van Ommen, T. D., Moy, A. D., Curran, M. A. J., Davies, S. M., Weber, M. E., Bird, M. I., Munksgaard, N. C., Menviel, L., Rootes, C. M., Ellis, B., Millman, H., Vohra, J., Rivera, A., and Cooper, A.: Antarctic ice sheet discharge driven by atmosphere-ocean feedbacks at the Last Glacial Termination, Sci. Rep.-UK, 7, 39979, https://doi.org/10.1038/srep39979, 2017.
Fountain, A. G., Levy, J. S., Gooseff, M. N., and Van Horn, D.: The McMurdo Dry Valleys: A landscape on the threshold of change, Geomorphology, 225, 25–35, https://doi.org/10.1016/j.geomorph.2014.03.044, 2014.
Fourteau, K., Faïn, X., Martinerie, P., Landais, A., Ekaykin, A. A., Lipenkov, V. Ya., and Chappellaz, J.: Analytical constraints on layered gas trapping and smoothing of atmospheric variability in ice under low-accumulation conditions, Clim. Past, 13, 1815–1830, https://doi.org/10.5194/cp-13-1815-2017, 2017.
Freitag, J., Kipfstuhl, S., Laepple, T., and Wilhelms, F.: Impurity-controlled densification: a new model for stratified polar firn, J. Glaciol., 59, 1163–1169, https://doi.org/10.3189/2013JoG13J042, 2013.
Goujon, C., Barnola, J. M., and Ritz, C.: Modeling the densification of polar firn including heat diffusion: Application to close-off characteristics and gas isotopic fractionation for Antarctica and Greenland sites, J. Geophys. Res.-Atmos., 108, 4792, https://doi.org/10.1029/2002jd003319, 2003.
Hall, B. L., Denton, G. H., Heath, S. L., Jackson, M. S., and Koffman, T. N. B.: Accumulation and marine forcing of ice dynamics in the western Ross Sea during the last deglaciation, Nat. Geosci., 8, 625–628, https://doi.org/10.1038/ngeo2478, 2015.
Herron, M. M. and Langway, C. C.: Firn densification – An empirical-model, J. Glaciol., 25, 373–385, 1980.
Higgins, J. A., Kurbatov, A. V., Spaulding, N. E., Brook, E., Introne, D. S., Chimiak, L. M., Yan, Y. Z., Mayewski, P. A., and Bender, M. L.: Atmospheric composition 1 million years ago from blue ice in the Allan Hills, Antarctica, P. Natl. Acad. Sci. USA, 112, 6887–6891, https://doi.org/10.1073/pnas.1420232112, 2015.
Horhold, M. W., Laepple, T., Freitag, J., Bigler, M., Fischer, H., and Kipfstuhl, S.: On the impact of impurities on the densification of polar firn, Earth Planet. Sc. Lett., 325, 93–99, https://doi.org/10.1016/j.epsl.2011.12.022, 2012.
Indermühle, A., Monnin, E., Stauffer, B., Stocker, T. F., and Wahlen, M.: Atmospheric CO2 concentration from 60 to 20 kyr BP from the Taylor Dome ice core, Antarctica, Geophys. Res. Lett., 27, 735–738, https://doi.org/10.1029/1999gl010960, 2000.
Jones, T. R., Roberts, W. H. G., Steig, E. J., Cuffey, K. M., Markle, B. R., and White, J. W. C.: Southern Hemisphere climate variability forced by Northern Hemisphere ice-sheet topography, Nature, 554, 351–355, https://doi.org/10.1038/nature24669, 2018.
Jouzel, J., Masson-Delmotte, V., Cattani, O., Dreyfus, G., Falourd, S., Hoffmann, G., Minster, B., Nouet, J., Barnola, J. M., Chappellaz, J., Fischer, H., Gallet, J. C., Johnsen, S., Leuenberger, M., Loulergue, L., Luethi, D., Oerter, H., Parrenin, F., Raisbeck, G., Raynaud, D., Schilt, A., Schwander, J., Selmo, E., Souchez, R., Spahni, R., Stauffer, B., Steffensen, J. P., Stenni, B., Stocker, T. F., Tison, J. L., Werner, M., and Wolff, E. W.: Orbital and millennial Antarctic climate variability over the past 800,000 years, Science, 317, 793–796, https://doi.org/10.1126/science.1141038, 2007.
Kavanaugh, J. L., Cuffey, K. M., Morse, D. L., Bliss, A. K., and Aciego, S. M.: Dynamics and mass balance of Taylor Glacier, Antarctica: 3. State of mass balance, J. Geophys. Res.-Earth, 114, F04012, https://doi.org/10.1029/2009jf001331, 2009a.
Kavanaugh, J. L., Cuffey, K. M., Morse, D. L., Conway, H., and Rignot, E.: Dynamics and mass balance of Taylor Glacier, Antarctica: 1. Geometry and surface velocities, J. Geophys. Res.-Earth, 114, F04010, https://doi.org/10.1029/2009jf001309, 2009b.
Kawamura, K., Severinghaus, J. P., Ishidoya, S., Sugawara, S., Hashida, G., Motoyama, H., Fujii, Y., Aoki, S., and Nakazawa, T.: Convective mixing of air in firn at four polar sites, Earth Planet. Sc. Lett., 244, 672–682, https://doi.org/10.1016/j.epsl.2006.02.017, 2006.
Kawamura, K., Parrenin, F., Lisiecki, L., Uemura, R., Vimeux, F., Severinghaus, J. P., Hutterli, M. A., Nakazawa, T., Aoki, S., Jouzel, J., Raymo, M. E., Matsumoto, K., Nakata, H., Motoyama, H., Fujita, S., Goto-Azuma, K., Fujii, Y., and Watanabe, O.: Northern Hemisphere forcing of climatic cycles in Antarctica over the past 360,000 years, Nature, 448, 912–914, https://doi.org/10.1038/nature06015, 2007.
Köhler, P., Knorr, G., Buiron, D., Lourantou, A., and Chappellaz, J.: Abrupt rise in atmospheric CO2 at the onset of the Bølling/Allerød: in-situ ice core data versus true atmospheric signals, Clim. Past, 7, 473–486, https://doi.org/10.5194/cp-7-473-2011, 2011.
Korotkikh, E. V., Mayewski, P. A., Handley, M. J., Sneed, S. B., Introne, D. S., Kurbatov, A. V., Dunbar, N. W., and McIntosh, W. C.: The last interglacial as represented in the glaciochemical record from Mount Moulton Blue Ice Area, West Antarctica, Quaternary Sci. Rev., 30, 1940–1947, dio:10.1016/j.quascirev.2011.04.020, 2011.
Kuhl, T. W., Johnson, J. A., Shturmakov, A. J., Goetz, J. J., Gibson, C. J., and Lebar, D. A.: A new large-diameter ice-core drill: the Blue Ice Drill, Ann. Glaciol., 55, 1–6, https://doi.org/10.3189/2014AoG68A009, 2014.
Lambert, F., Delmonte, B., Petit, J. R., Bigler, M., Kaufmann, P. R., Hutterli, M. A., Stocker, T. F., Ruth, U., Steffensen, J. P., and Maggi, V.: Dust-climate couplings over the past 800,000 years from the EPICA Dome C ice core, Nature, 452, 616–619, https://doi.org/10.1038/nature06763, 2008.
Lambert, F., Bigler, M., Steffensen, J. P., Hutterli, M., and Fischer, H.: Centennial mineral dust variability in high-resolution ice core data from Dome C, Antarctica, Clim. Past, 8, 609–623, https://doi.org/10.5194/cp-8-609-2012, 2012.
Landais, A., Masson-Delmotte, V., Nebout, N. C., Jouzel, J., Blunier, T., Leuenberger, M., Dahl-Jensen, D., and Johnsen, S.: Millenial scale variations of the isotopic composition of atmospheric oxygen over Marine Isotopic Stage 4, Earth Planet. Sc. Lett., 258, 101–113, https://doi.org/10.1016/j.epsl.2007.03.027, 2007.
Luthi, D., Le Floch, M., Bereiter, B., Blunier, T., Barnola, J. M., Siegenthaler, U., Raynaud, D., Jouzel, J., Fischer, H., Kawamura, K., and Stocker, T. F.: High-resolution carbon dioxide concentration record 650,000–800,000 years before present, Nature, 453, 379–382, https://doi.org/10.1038/nature06949, 2008.
Marchant, D. R., Denton, G. H., Bockheim, J. G., Wilson, S. C., and Kerr, A. R.: Quaternary changes in level of the upper Taylor Glacier, Antarctica – Implications for paleoclimate and East Antarctic Ice-Sheet dynamics, Boreas, 23, 29–43, 1994.
Maselli, O. J., Fritzsche, D., Layman, L., McConnell, J. R., and Meyer, H.: Comparison of water isotope-ratio determinations using two cavity ring-down instruments and classical mass spectrometry in continuous ice-core analysis, Isot. Environ. Healt. S., 49, 387–398, https://doi.org/10.1080/10256016.2013.781598, 2013.
Mayewski, P. A., Twickler, M. S., Whitlow, S. I., Meeker, L. D., Yang, Q., Thomas, J., Kreutz, K., Grootes, P. M., Morse, D. L., Steig, E. J., Waddington, E. D., Saltzman, E. S., Whung, P. Y., and Taylor, K. C.: Climate change during the last deglaciation in Antarctica, Science, 272, 1636–1638, https://doi.org/10.1126/science.272.5268.1636, 1996.
McConnell, J. R.: Continuous ice-core chemical analyses using inductively Coupled Plasma Mass Spectrometry, Environ. Sci. Technol., 36, 7–11, https://doi.org/10.1021/es011088z, 2002.
Mitchell, L., Brook, E., Lee, J. E., Buizert, C., and Sowers, T.: Constraints on the Late Holocene Anthropogenic Contribution to the Atmospheric Methane Budget, Science, 342, 964–966, https://doi.org/10.1126/science.1238920, 2013.
Mitchell, L. E., Brook, E. J., Sowers, T., McConnell, J. R., and Taylor, K.: Multidecadal variability of atmospheric methane, 1000–1800 CE, J. Geophys. Res.-Biogeo., 116, G02007, https://doi.org/10.1029/2010jg001441, 2011.
Morse, D. L., Waddington, E. D., and Steig, E. J.: Ice age storm trajectories inferred from radar stratigraphy at Taylor Dome, Antarctica, Geophys. Res. Lett., 25, 3383–3386, https://doi.org/10.1029/98gl52486, 1998.
Morse, D. L., Waddington, E. D., Marshall, H. P., Neumann, T. A., Steig, E. J., Dibb, J. E., Winebrenner, D. P., and Arthern, R. J.: Accumulation rate measurements at Taylor Dome, East Antarctica: Techniques and strategies for mass balance measurements in polar environments, Geogr. Ann. A, 81, 683–694, 1999.
Morse, D. L., Waddington, E. D., and Rasmussen, L. A.: Ice deformation in the vicinity of the ice-core site at Taylor Dome, Antarctica, and a derived accumulation rate history, J. Glaciol., 53, 449–460, https://doi.org/10.3189/002214307783258530, 2007.
Mulvaney, R., Rothlisberger, R., Wolff, E. W., Sommer, S., Schwander, J., Hutteli, M. A., and Jouzel, J.: The transition from the last glacial period in inland and near-coastal Antarctica, Geophys. Res. Lett., 27, 2673–2676, https://doi.org/10.1029/1999gl011254, 2000.
Neumann, T. A., Waddington, E. D., Steig, E. J., and Grootes, P. M.: Non-climate influences on stable isotopes at Taylor Mouth, Antarctica, J. Glaciol., 51, 248–258, https://doi.org/10.3189/172756505781829331, 2005.
Parrenin, F., Barker, S., Blunier, T., Chappellaz, J., Jouzel, J., Landais, A., Masson-Delmotte, V., Schwander, J., and Veres, D.: On the gas-ice depth difference (Δdepth) along the EPICA Dome C ice core, Clim. Past, 8, 1239–1255, https://doi.org/10.5194/cp-8-1239-2012, 2012.
Petrenko, V. V., Severinghaus, J. P., Brook, E. J., Reeh, N., and Schaefer, H.: Gas records from the West Greenland ice margin covering the Last Glacial Termination: a horizontal ice core, Quaternary Sci. Rev., 25, 865–875, https://doi.org/10.1016/j.quascirev.2005.09.005, 2006.
Petrenko, V. V., Severinghaus, J. P., Brook, E. J., Muhle, J., Headly, M., Harth, C. M., Schaefer, H., Reeh, N., Weiss, R. F., Lowe, D., and Smith, A. M.: A novel method for obtaining very large ancient air samples from ablating glacial ice for analyses of methane radiocarbon, J. Glaciol., 54, 233–244, https://doi.org/10.3189/002214308784886135, 2008.
Petrenko, V. V., Smith, A. M., Brook, E. J., Lowe, D., Riedel, K., Brailsford, G., Hua, Q., Schaefer, H., Reeh, N., Weiss, R. F., Etheridge, D., and Severinghaus, J. P.: (CH4)-C-14 Measurements in Greenland Ice: Investigating Last Glacial Termination CH4 Sources, Science, 324, 506–508, https://doi.org/10.1126/science.1168909, 2009.
Petrenko, V. V., Severinghaus, J. P., Schaefer, H., Smith, A. M., Kuhl, T., Baggenstos, D., Hua, Q., Brook, E. J., Rose, P., Kulin, R., Bauska, T., Harth, C., Buizert, C., Orsi, A., Emanuele, G., Lee, J. E., Brailsford, G., Keeling, R., and Weiss, R. F.: Measurements of C-14 in ancient ice from Taylor Glacier, Antarctica constrain in situ cosmogenic (CH4)-C-14 and (CO)-C-14 production rates, Geochim. Cosmochim. Ac., 177, 62–77, https://doi.org/10.1016/j.gca.2016.01.004, 2016.
Petrenko, V. V., Mith, A. M. S., Chaefer, H. S., Riedel, K., Brook, E., Baggenstos, D., Harth, C., Hua, Q., Buizert, C., Schilt, A., Fain, X., Mitchell, L., Bauska, T., Orsi, A., Weiss, R. F., and Severinghaus, J. P. S.: Minimal geological methane emissions during the Younger Dryas-Preboreal abrupt warming event, Nature, 548, 443–446, https://doi.org/10.1038/nature23316, 2017.
Raphael, M. N., Marshall, G. J., Turner, J., Fogt, R. L., Schneider, D., Dixon, D. A., Hosking, J. S., Jones, J. M., and Hobbs, W. R.: The Amundsen Sea Low Variability, Change, and Impact on Antarctic Climate, B. Am. Meteorol. Soc., 97, 111–121, https://doi.org/10.1175/bams-d-14-00018.1, 2016.
Rhodes, R. H., Fain, X., Stowasser, C., Blunier, T., Chappellaz, J., McConnell, J. R., Romanini, D., Mitchell, L. E., and Brook, E. J.: Continuous methane measurements from a late Holocene Greenland ice core: Atmospheric and in-situ signals, Earth Planet. Sc. Lett., 368, 9–19, https://doi.org/10.1016/j.epsl.2013.02.034, 2013.
Rhodes, R. H., Brook, E. J., Chiang, J. C. H., Blunier, T., Maselli, O. J., McConnell, J. R., Romanini, D., and Severinghaus, J. P.: Enhanced tropical methane production in response to iceberg discharge in the North Atlantic, Science, 348, 1016–1019, https://doi.org/10.1126/science.1262005, 2015.
Schaefer, H., Whiticar, M. J., Brook, E. J., Petrenko, V. V., Ferretti, D. F., and Severinghaus, J. P.: Ice record of delta C-13 for atmospheric CH4 across the Younger Dryas-Preboreal transition, Science, 313, 1109–1112, https://doi.org/10.1126/science.1126562, 2006.
Schaefer, H., Petrenko, V. V., Brook, E. J., Severinghaus, J. P., Reeh, N., Melton, J. R., and Mitchell, L.: Ice stratigraphy at the Pakitsoq ice margin, West Greenland, derived from gas records, J. Glaciol., 55, 411–421, 2009.
Schaefer, J. M., Putnam, A. E., Denton, G. H., Kaplan, M. R., Birkel, S., Doughty, A. M., Kelley, S., Barrell, D. J. A., Finkel, R. C., Winckler, G., Anderson, R. F., Ninneman, U. S., Barker, S., Schwartz, R., Andersen, B. G., and Schluechter, C.: The Southern Glacial Maximum 65,000 years ago and its Unfinished Termination, Quaternary Sci. Rev., 114, 52–60, https://doi.org/10.1016/j.quascirev.2015.02.009, 2015.
Schilt, A., Baumgartner, M., Schwander, J., Buiron, D., Capron, E., Chappellaz, J., Loulergue, L., Schupbach, S., Spahni, R., Fischer, H., and Stocker, T. F.: Atmospheric nitrous oxide during the last 140,000 years, Earth Planet. Sc. Lett., 300, 33–43, https://doi.org/10.1016/j.epsl.2010.09.027, 2010.
Schilt, A., Brook, E. J., Bauska, T. K., Baggenstos, D., Fischer, H., Joos, F., Petrenko, V. V., Schaefer, H., Schmitt, J., Severinghaus, J. P., Spahni, R., and Stocker, T. F.: Isotopic constraints on marine and terrestrial N2O emissions during the last deglaciation, Nature, 516, 234–237, https://doi.org/10.1038/nature13971, 2014.
Schüpbach, S., Federer, U., Kaufmann, P. R., Albani, S., Barbante, C., Stocker, T. F., and Fischer, H.: High-resolution mineral dust and sea ice proxy records from the Talos Dome ice core, Clim. Past, 9, 2789–2807, https://doi.org/10.5194/cp-9-2789-2013, 2013.
Schwander, J. and Stauffer, B.: Age difference between polar ice and the air trapped in its bubbles, Nature, 311, 45–47, https://doi.org/10.1038/311045a0, 1984.
Severinghaus, J. P., Sowers, T., Brook, E. J., Alley, R. B., and Bender, M. L.: Timing of abrupt climate change at the end of the Younger Dryas interval from thermally fractionated gases in polar ice, Nature, 391, 141–146, https://doi.org/10.1038/34346, 1998.
Severinghaus, J. P., Albert, M. R., Courville, Z. R., Fahnestock, M. A., Kawamura, K., Montzka, S. A., Muhle, J., Scambos, T. A., Shields, E., Shuman, C. A., Suwa, M., Tans, P., and Weiss, R. F.: Deep air convection in the firn at a zero-accumulation site, central Antarctica, Earth Planet. Sc. Lett., 293, 359–367, https://doi.org/10.1016/j.epsl.2010.03.003, 2010.
Shakun, J. D., Lea, D. W., Lisiecki, L. E., and Raymo, M. E.: An 800-kyr record of global surface ocean delta O-18 and implications for ice volume-temperature coupling, Earth Planet. Sc. Lett., 426, 58–68, https://doi.org/10.1016/j.epsl.2015.05.042, 2015.
Siddall, M., Rohling, E. J., Almogi-Labin, A., Hemleben, C., Meischner, D., Schmelzer, I., and Smeed, D. A.: Sea-level fluctuations during the last glacial cycle, Nature, 423, 853–858, https://doi.org/10.1038/nature01690, 2003.
Sinisalo, A. and Moore, J. C.: Antarctic blue ice areas – towards extracting palaeoclimate information, Antarct. Sci., 22, 99–115, https://doi.org/10.1017/s0954102009990691, 2010.
Sowers, T., Bender, M., Raynaud, D., and Korotkevich, Y. S.: Delta-N-15 of N2 in air trapped in polar ice – A tracer of gas-transport in the firn and a possible constraint on ice age-gas age-differences, J. Geophys. Res.-Atmos., 97, 15683–15697, 1992.
Spahni, R., Schwander, J., Fluckiger, J., Stauffer, B., Chappellaz, J., and Raynaud, D.: The attenuation of fast atmospheric CH4 variations recorded in polar ice cores, Geophys. Res. Lett., 30, 1571, https://doi.org/10.1029/2003gl017093, 2003.
Spaulding, N. E., Higgins, J. A., Kurbatov, A. V., Bender, M. L., Arcone, S. A., Campbell, S., Dunbar, N. W., Chimiak, L. M., Introne, D. S., and Mayewski, P. A.: Climate archives from 90 to 250 ka in horizontal and vertical ice cores from the Allan Hills Blue Ice Area, Antarctica, Quaternary Res., 80, 562–574, https://doi.org/10.1016/j.yqres.2013.07.004, 2013.
Steig, E. J., Brook, E. J., White, J. W. C., Sucher, C. M., Bender, M. L., Lehman, S. J., Morse, D. L., Waddington, E. D., and Clow, G. D.: Synchronous climate changes in Antarctica and the North Atlantic, Science, 282, 92–95, https://doi.org/10.1126/science.282.5386.92, 1998.
Steig, E. J., Morse, D. L., Waddington, E. D., Stuiver, M., Grootes, P. M., Mayewski, P. A., Twickler, M. S., and Whitlow, S. I.: Wisconsinan and Holocene climate history from an ice core at Taylor Dome, western Ross Embayment, Antarctica, Geogr. Ann. A, 82, 213–235, https://doi.org/10.1111/j.0435-3676.2000.00122.x, 2000.
Stowasser, C., Buizert, C., Gkinis, V., Chappellaz, J., Schüpbach, S., Bigler, M., Faïn, X., Sperlich, P., Baumgartner, M., Schilt, A., and Blunier, T.: Continuous measurements of methane mixing ratios from ice cores, Atmos. Meas. Tech., 5, 999–1013, https://doi.org/10.5194/amt-5-999-2012, 2012.
Sucher, C. M.: Atmospheric gases in the Taylor Dome ice core: Implications for East Antarctic climate change, Master's thesis, University of Rhode Island, Naraganset, 1997.
Turner, J., Phillips, T., Hosking, J. S., Marshall, G. J., and Orr, A.: The Amundsen Sea low, Int. J. Climatol., 33, 1818–1829, https://doi.org/10.1002/joc.3558, 2013.
Veres, D., Bazin, L., Landais, A., Toyé Mahamadou Kele, H., Lemieux-Dudon, B., Parrenin, F., Martinerie, P., Blayo, E., Blunier, T., Capron, E., Chappellaz, J., Rasmussen, S. O., Severi, M., Svensson, A., Vinther, B., and Wolff, E. W.: The Antarctic ice core chronology (AICC2012): an optimized multi-parameter and multi-site dating approach for the last 120 thousand years, Clim. Past, 9, 1733–1748, https://doi.org/10.5194/cp-9-1733-2013, 2013.
Waddington, E. and Morse, D. L.: Spatial variations of local climate at Taylor Dome, Antarctica: Implications for paleoclimate from ice cores., Ann. Glaciol., 20, 219–225, https://doi.org/10.3189/172756494794587014, 1994.
Wang, Y. J., Cheng, H., Edwards, R. L., An, Z. S., Wu, J. Y., Shen, C. C., and Dorale, J. A.: A high-resolution absolute-dated Late Pleistocene monsoon record from Hulu Cave, China, Science, 294, 2345–2348, https://doi.org/10.1126/science.1064618, 2001.