the Creative Commons Attribution 4.0 License.
the Creative Commons Attribution 4.0 License.
 | 27 Jun 2019
Late Quaternary climate variability at Mfabeni peatland, eastern South Africa
Charlotte Miller
Jemma Finch
Trevor Hill
Francien Peterse
Marc Humphries
Matthias Zabel
Enno Schefuß
The scarcity of continuous, terrestrial, palaeoenvironmental records in eastern South Africa leaves the evolution of late Quaternary climate and its driving mechanisms uncertain. Here we use a ∼7 m long core from Mfabeni peatland (KwaZulu-Natal, South Africa) to reconstruct climate variability for the last 32 000 years (cal ka BP). We infer past vegetation and hydrological variability using stable carbon (δ13Cwax) and hydrogen isotopes (δDwax) of plant-wax n-alkanes and use Paq to reconstruct water table changes. Our results indicate that late Quaternary climate in eastern South Africa did not respond directly to orbital forcing or to changes in sea-surface temperatures (SSTs) in the western Indian Ocean. We attribute the arid conditions evidenced at Mfabeni during the Last Glacial Maximum (LGM) to low SSTs and an equatorward displacement of (i) the Southern Hemisphere westerlies, (ii) the subtropical high-pressure cell, and (iii) the South Indian Ocean Convergence Zone (SIOCZ), which we infer was linked to increased Antarctic sea-ice extent. The northerly location of the high-pressure cell and the SIOCZ inhibited moisture advection inland and pushed the rain-bearing cloud band north of Mfabeni, respectively. The increased humidity at Mfabeni between 19 and 14 cal kyr BP likely resulted from a southward retreat of the westerlies, the high-pressure cell, and the SIOCZ, consistent with a decrease in Antarctic sea-ice extent. Between 14 and 5 cal kyr BP, when the westerlies, the high-pressure cell, and the SIOCZ were in their southernmost position, local insolation became the dominant control, leading to stronger atmospheric convection and an enhanced tropical easterly monsoon. Generally drier conditions persisted during the past ca. 5 cal ka BP, probably resulting from an equatorward return of the westerlies, the high-pressure cell, and the SIOCZ. Higher SSTs and heightened El Niño–Southern Oscillation (ENSO) activity may have played a role in enhancing climatic variability during the past ca. 5 cal ka BP. Our findings highlight the influence of the latitudinal position of the westerlies, the high-pressure cell, and the SIOCZ in driving climatological and environmental changes in eastern South Africa.
- Article
(4945 KB) - Full-text XML
-
Supplement
(1098 KB) - BibTeX
- EndNote


Eastern South Africa is an important region for scientific focus, specifically for furthering our understanding of regional and global climate dynamics. The region is particularly dynamic and sensitive to long-term climate change as it lies within a climatic transition zone, where it is strongly influenced by both temperate (southern westerlies) and tropical (tropical easterlies) climate systems. In eastern South Africa, modelled precipitation reductions and projected regional warming (3–6 ∘C by 2099) threaten the stability of current ecosystems in a region populated by communities already economically vulnerable to the effects of climate change (IPCC, 2013). Past climate and environmental reconstruction and the determination of climate-driving mechanisms will provide valuable information for assessing future climate and environmental trends in the region.
Changes in vegetation, precipitation, and temperature from the beginning of the Last Glacial Maximum (LGM; ca. 26.5 ka; Clark et al., 2009) to the present day are poorly constrained in eastern South Africa. Whether this region was characterized by aridity or increased humidity during the last glacial period remains unclear. Proxy data show spatial complexity (e.g. Baker et al., 2016; Chase et al., 2017; Chevalier and Chase, 2015, 2016; Dupont et al., 2011; Schefuß et al., 2011; Scott et al., 2012; Scott, 2016; Schmidt et al., 2014; Simon et al., 2015), and modelled LGM (26.5–19 ka; Clark et al., 2009) precipitation patterns for the region are highly variable and often do not even agree on the sign of precipitation change. For example, the PMIP3 model ensemble mean suggests increased LGM precipitation in the east of South Africa, with dry conditions towards the north (compared to the present day; Braconnot et al., 2007; Chevalier et al., 2017). Conversely, the NCAR CCSM3 model indicates drier than present conditions in the centre of South Africa and along the eastern coast (Otto-Bliesner et al., 2006). These contrasting simulations for the last glacial period highlight the difficulty in simulating past precipitation in South Africa, with a lack of a comprehensive understanding regarding the relevant climate processes involved (Stone, 2014).
The mechanisms driving Quaternary climate variability in South Africa are complex and spatially heterogeneous. For example, hydroclimate may be paced by austral summer insolation fluctuations resulting from changes in the Earth's orbital precession on 23–19 ka timescales. Strong summer insolation (during precession maxima) causes stronger atmospheric convection and an increase in the land–ocean temperature contrast, which results in higher moisture transport by the tropical easterlies and higher precipitation in eastern South Africa (e.g. Simon et al., 2015; Chevalier and Chase, 2015). Climate may also be influenced by high-latitude forcing related to changes in the Earth's orbital obliquity and eccentricity on longer, i.e. glacial–interglacial, timescales, which may result in the latitudinal contraction and expansion of the climatic belts (e.g. Dupont, 2011). The model of Nicholson and Flohn (1980) suggests an equatorward displacement of the tropical rainbelt (Nicholson, 2008) during the last glacial period, although proxy data from South Africa provide no conclusive support for this scenario. In addition, during glacial periods, the Walker circulation may have been weaker, with its ascending limb further to the east, over the Indian Ocean (e.g. DiNezio et al., 2018). This possibly resulted in an eastward displacement of the cloud band (SIOCZ) and thus a drier summer rainfall zone (SRZ; Tyson, 1999). Furthermore, changes in the latitudinal position of the Southern Hemisphere westerlies (as a response to fluctuations in Antarctic sea-ice extent) have been invoked to influence climate in South Africa (Chase and Meadows, 2007; Chevalier and Chase, 2015; Chase et al., 2017). The western South African region has received most focus regarding the Southern Hemisphere westerly influence in controlling climate variability (e.g. Stuut et al., 2004; van Zinderen Bakker, 1976). Some studies also suggest possible mechanistic links between SSTs in the Agulhas Current and the Indian Ocean and rainfall variability in South Africa, with high SSTs linked to increasing South African summer precipitation (e.g. Baker et al., 2017; Chevalier and Chase, 2015; Dupont, 2011; Dupont et al., 2011; Reason and Mulenga, 1999). Climate forcing experiments also indicate that changes in greenhouse gas concentrations may have driven eastern South African rainfall changes, increasing precipitation between 17 and 11 kyr (Otto-Bliesner et al., 2014).
The spatially heterogeneous nature of climate variability in South Africa from the last glacial period to the present day, and the multiple possible climate drivers, render the region an important focus for palaeoclimate research. Two important questions remain: (i) what was the climate like in eastern South Africa during the last glacial period? And (ii) what were the causes of the climate variability? These questions are difficult to answer, with the majority of long, continuous, terrestrial records situated further north, within the range of the modern tropical rainbelt (e.g. Barker et al., 2007; Tierney et al., 2008), making it hard to assess the long-term climate drivers in the south, in particular in eastern South Africa. In this area, terrestrial sediment archives suitable for palaeoenvironmental reconstruction are scarce, in particular those extending to the LGM. Marine and speleothem archives have hitherto mostly formed the basis of Quaternary climate research in this region (e.g. Dupont et al., 2011; Holmgren et al., 2003). Here we provide stable carbon (δ13C) and hydrogen (δD) isotope records of terrestrial plant waxes (long-chained n-alkanes) from Mfabeni peatland, one of the longest continuous terrestrial archives from South Africa. Our vegetation and hydroclimate reconstructions are compared with a previous biomarker-palaeoclimate study from Mfabeni (Baker et al., 2014, 2016, 2017). We more than double the temporal resolution of the previous plant-wax δ13C record from Baker et al. (2017) from ca. 1200 to ca. 500 years, revealing important and previously undocumented environmental variability.
The mid-latitude westerlies, in association with the subtropical high- (and low-) pressure cells and the SIOCZ, play critical roles in determining climatic conditions across the whole southern African continent (Fig. 1; Dyson and van Heerden, 2002; Macron et al., 2014; Munday and Washington, 2017). During austral winter, an anti-clockwise rotating subtropical high-pressure cell is located over southern Africa, which drives large-scale subsidence and suppresses rainfall (Fig. 1b). This high-pressure cell creates a blocking effect over the continent, which stops moisture advection inland over the majority of South Africa during winter (Dedekind et al., 2016), except for in the winter rainfall zone (WRZ), where the westerlies bring rainfall. During summer, the high-pressure cell shifts to the south, and the Angola and Kalahari low-pressure cells dominate the continent, enabling monsoonal systems (tropical easterlies) to penetrate southern Africa, bringing rainfall to the summer rainfall zone (SRZ; Fig. 1a; Tyson and Preston-Whyte, 2000; Munday and Washington, 2017). The dominant rain-producing mechanisms in the SRZ during the summer are tropical temperature troughs (TTTs), which are embedded within the SIOCZ and form a north-west–south-east orientated cloud band, extending over the continent into the south-western Indian Ocean (Fig. 1a; Todd and Washington 1999; Tyson and Preston-Whyte, 2000). TTTs form from interactions between tropical convection and mid-latitude perturbations, which result in heavy precipitation events (Tyson, 1986; Macron et al., 2014; Chase et al., 2017). A combination of strong easterly flux from the Indian Ocean and low pressure over the continent during the summer results in the development of TTTs (Fig. 1a; Cook, 2000; Macron et al., 2014; Rácz and Smith, 1999; Todd and Washington, 1999).
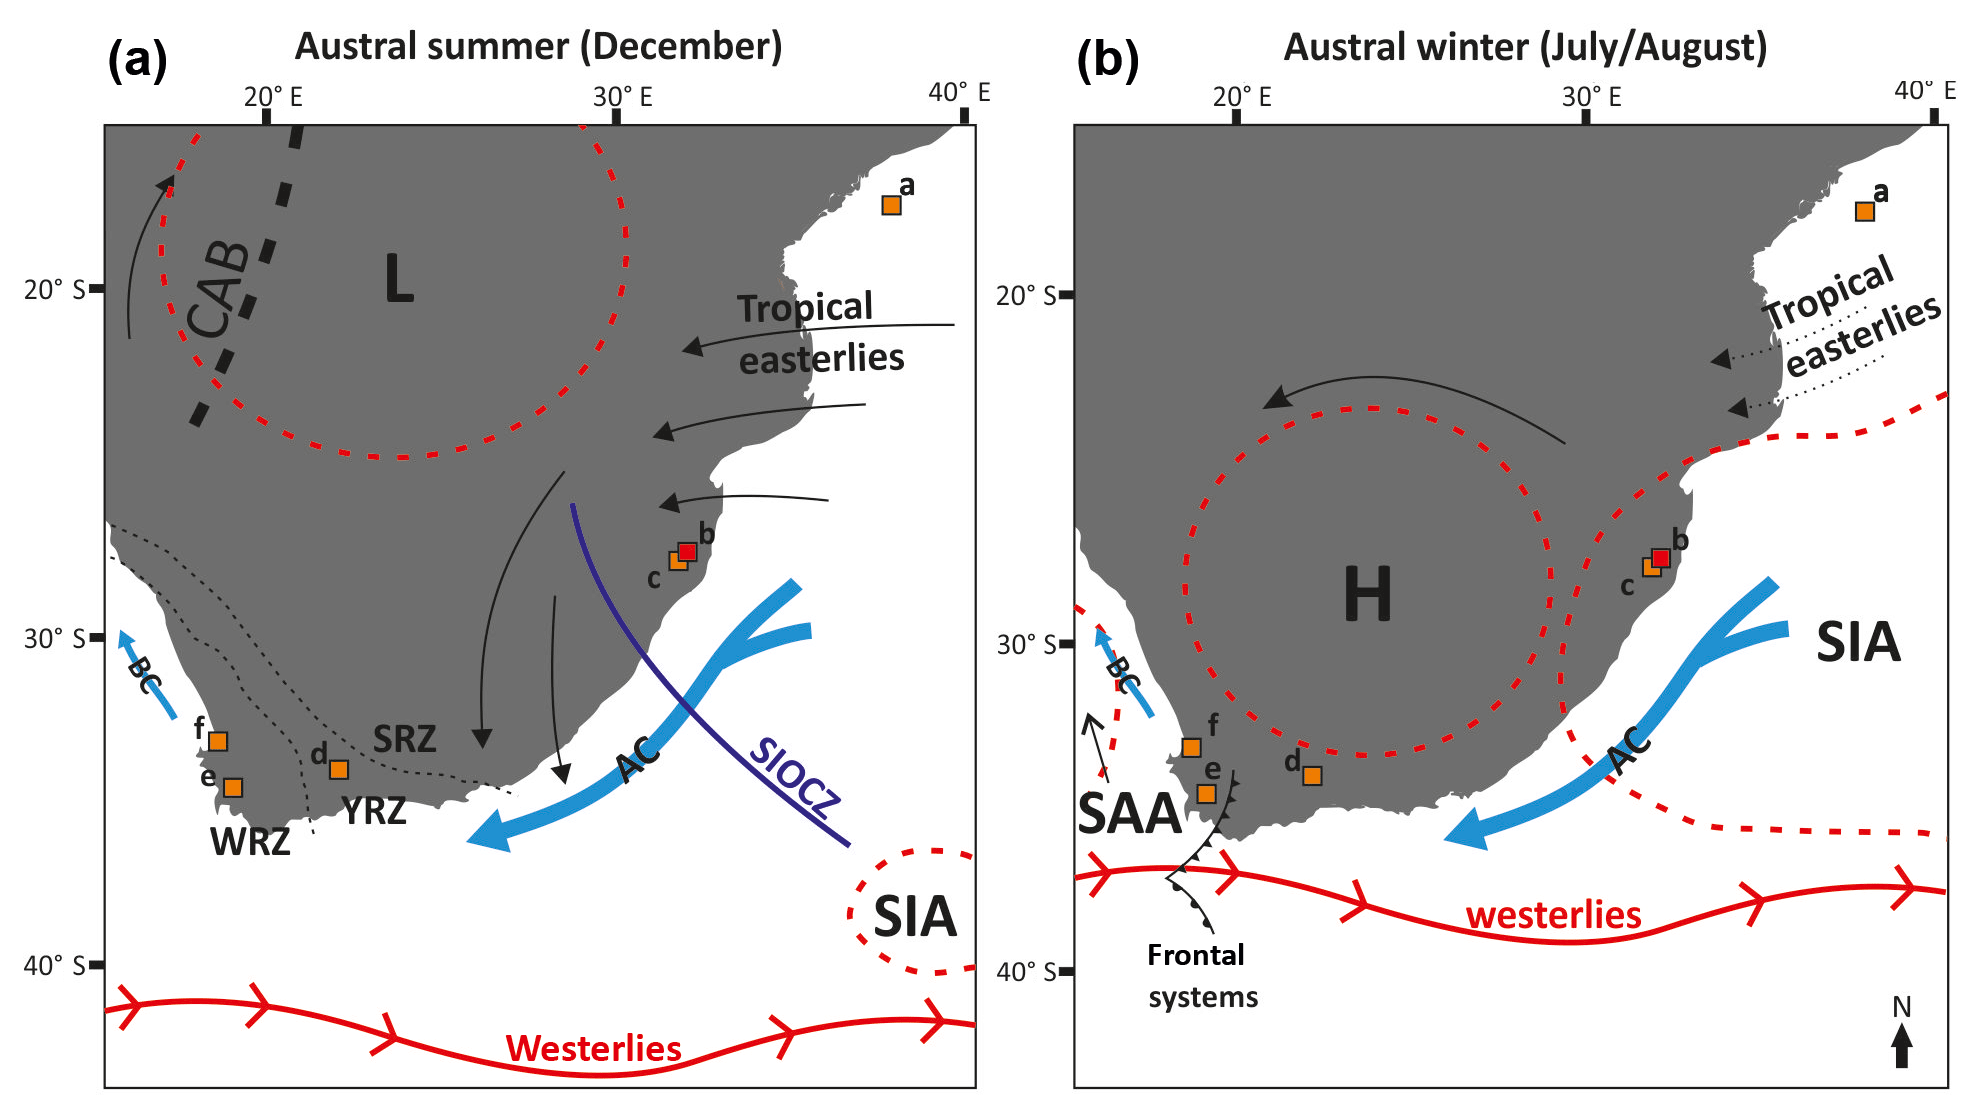
Figure 1Map of South Africa in austral summer (a) and winter (b) showing the major oceanic and atmospheric currents and the position of the Congo Air Boundary (CAB). H (L): high- (low)-pressure systems. BC: Benguela Current. AC: Agulhas Current. Rainfall zones are shown in (a): WRZ: winter rainfall zone, YRZ: year-round rainfall zone, and SRZ: summer rainfall zone. SIA: South Indian Anticyclone. SAA: South Atlantic Anticyclone. SIOCZ: South Indian Ocean Convergence Zone. Note that the westerlies move north during austral winter and that the high-pressure system dominates over much of the continent, suppressing rainfall in the SRZ. Squares represent the key study sites mentioned in the text (and shown in Figs. 4 and 5): (a) MD79257 (Sonzogni et al., 1998). (b) Mfabeni, this study (red square). (c) Lake St Lucia (Humphries et al., 2016). (d) Seweweekspoort (Chase et al., 2017). (e) Cecilia Cave (Baxter, 1989). (f) Klaarfontein (Meadows and Baxter, 2001) and Verlorenvlei (Carr et al., 2015), one location. Figure modified from Gasse et al. (2008).
South Africa can be divided into several climate zones: the SRZ lies in the north and east where 66 % of the mean annual precipitation falls between October and March (Fig. 1a; Chase and Meadows, 2007). Based on late Quaternary precipitation reconstructions, further subdivisions of the SRZ (northern SRZ, central/eastern SRZ) have been suggested by Chevalier and Chase (2015). In the extreme south and west of South Africa lies the WRZ (Fig. 1a), where 66 % of the mean annual precipitation falls between April and September (Chase and Meadows, 2007). This rainfall is associated with temperate frontal systems related to the Southern Hemisphere westerlies (Fig. 1b; Mason and Jury, 1997; Tyson, 1986; Tyson and Preston-Whyte, 2000). In between the SRZ and WRZ lies the year-round rainfall zone (YRZ) which receives precipitation in both the summer and winter seasons (Fig. 1a; Chase and Meadows, 2007). This zone comprises much of the southern Cape of South Africa and is highly heterogeneous in terms of precipitation seasonality and amount, spanning some of the wettest (e.g. along the southern coast) and driest (e.g. Namib Desert) regions in South Africa.
Mfabeni peatland is located within the SRZ, on the coastal plain of northern KwaZulu-Natal (28∘09′8.1′′ S, 32∘31′9.4′′ E; 9 m above sea level; Figs. 1 and 2). The dominating subtropical high-pressure cell across the majority of South Africa during the austral winter months leads to mild and dry winter conditions at Mfabeni. Occasional rainfall during the winter months at Mfabeni is associated with the passage of cold fronts, which develop in the western Atlantic and move across southern Africa (Fig. 1b; Grab and Simpson, 2000). These cold fronts trigger rainout of atmospheric moisture, which is sourced from the Indian Ocean and Agulhas Current region (Gimeno et al., 2010). When the subtropical high-pressure cell has moved south during the austral summer, the tropical easterlies dominate, TTTs form, and conditions at Mfabeni are hot and humid. The average annual rainfall amount between 2010 and 2018 at Mfabeni in the winter months (June–August) was measured at 134 mm compared to 426 mm during the summer months (December–February), meaning the majority of rainfall (76 %) falls during the summer months (data from World Weather Online, 2018). A north-east–south-west precipitation gradient is present across the peat bog, with 1200 mm yr−1 of precipitation in the east decreasing to 900 mm yr−1 westwards towards Lake St. Lucia (Figs. 1 and 2; Taylor et al., 2006). The main source of water to Mfabeni is precipitation, predominantly provided by the tropical easterlies and TTTs, sourced from the Indian Ocean and Agulhas Current region (Fig. 1; Tyson, 1999; Gimeno et al., 2010). Mean summer temperatures (November to March) surpass 21 ∘C. The wind regime is characterized by moderate north-easterly winds during the summer and more intense south-westerly winds during the winter.
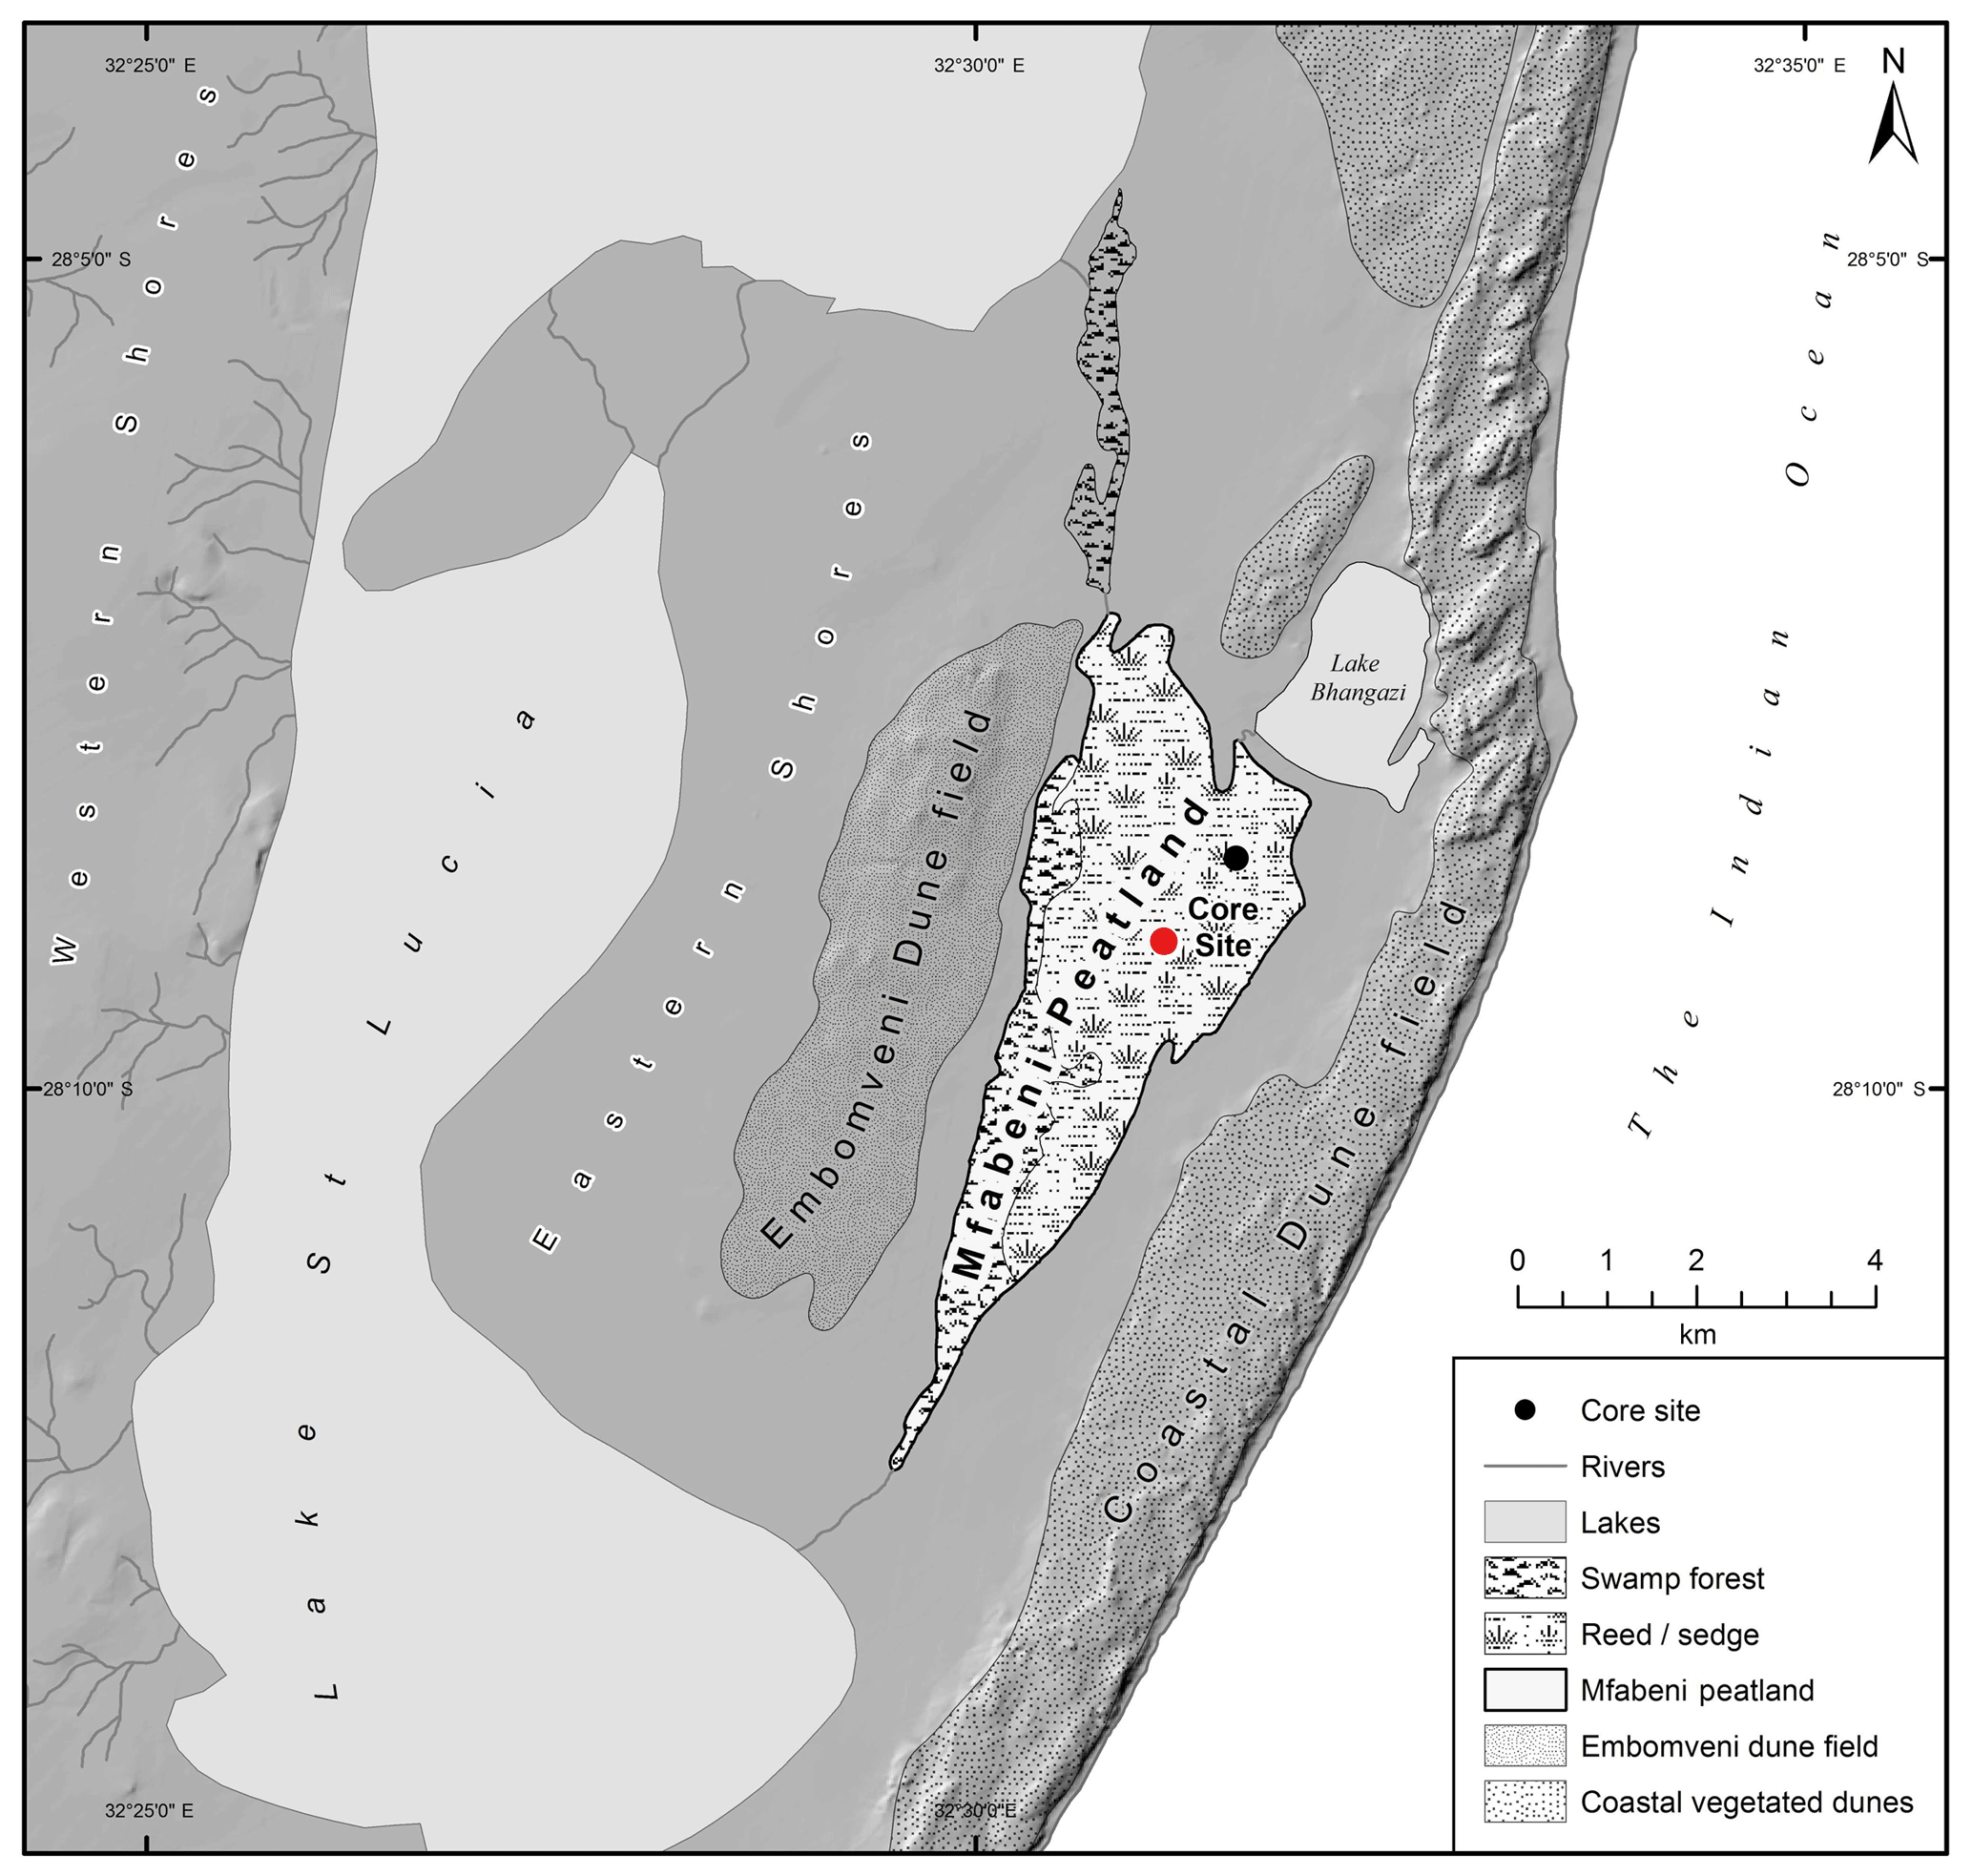
Figure 2Mfabeni peatland and its regional geomorphological features, indicating the location of core MF4-12 (red circle, this study) and the location of core SL6 (black circle, Baker et al., 2014, 2016, 2017). Map courtesy of Brice Gijsbertsen, UKZN Cartography Unit.
Mfabeni is one of the oldest continuously growing peatlands in South Africa (Grundling et al., 2013). It lies within a topographical inter-dunal depression between the Indian Ocean to the east and Lake St. Lucia to the west (Fig. 2; Grundling et al., 2013). Towards the ocean, it is bordered by an 80–100 m high vegetated dune barrier and to the west by the 15–70 m high Embomveni sand dune ridge (Fig. 2). Over the last 44 ka, the mire accumulated ca. 11 m of peat, deposited on top of a basal clay layer (Grundling et al., 2015). This clay layer was crucial in the formation and development of the mire, limiting water loss during low sea level stands (Grundling et al., 2013). Mfabeni is bound to the north and south by beach ridges isolating it from Lake Bhangazi and Lake St. Lucia, respectively (Fig. 2; Grundling et al., 2013). When lake levels in Lake Bhangazi are high, minor water exchange between Mfabeni and Bhangazi occurs, but there are no fluvial inputs to either system. Surface drainage occurs southwards towards Lake St Lucia (Fig. 2). The peatland receives groundwater via the swamp forest and the western dunes. This groundwater, which is important in keeping the mire wet during the dry season, discharges towards the centre of the peatland and then flows within a sub-surface layer towards the east (Grundling et al., 2015). In the northern and eastern parts of the peatland, the vegetation is sedge and reed fen (comprising sedges and grasses). In the western and southern parts of Mfabeni is swamp forest (Venter, 2003).
The modern water balance at Mfabeni is dominated by the interplay between evapotranspiration (ET; 1035 mm) and precipitation (1053 mm). Groundwater inflow (14 mm) and stream outflow (9 mm) have a minor contribution to the modern water balance (all measured between May 2008 and April 2009; Grundling et al., 2015). Changes in regional climate have much potential to influence the fine balance between ET and precipitation. For example, ET is suppressed when cloud cover is increased during the summer months and increased during times of higher wind speed (Grundling et al., 2015). ET is higher in the swamp forest than in the sedge and reed fen; therefore, a change in vegetation composition also has the potential to impact ET rates. The depositional setting of the Mfabeni peatland provides a unique opportunity to reconstruct past eastern South African climate variability at centennial-scale resolution from the Late Pleistocene to the present day.
To reconstruct past vegetation and hydroclimate, we use the distribution, and the carbon and hydrogen isotopic composition, of long-chain n-alkanes derived from plant waxes.
3.1 Distributions of plant waxes
To obtain information on water table variations, we quantify the relative contribution of plant waxes derived from submerged and floating macrophytes relative to that of emergent and terrestrial plants (Paq). Odd-numbered n-alkanes (C25–C35) are derived from the epicuticular wax coating of terrestrial higher plants (Eglinton and Hamilton, 1967). Conversely, aquatic plant waxes (of submerged macrophyte origin) are dominated by mid-chain n-alkanes (typically C23 and C25; e.g. Baker et al., 2016; Ficken et al., 2002). Thus we quantify Paq using Eq. (1) (Ficken et al., 2000).
with Cx the amount of each homologue.
To assess n-alkane degradation we used the carbon preference index (CPI; Bray and Evans, 1961). The CPI reflects the molecular distribution of odd-to-even n-alkanes within a certain carbon number range (here, n-C26 to n-C34; Eq. 2). High CPI values indicate a higher contribution of odd-numbered n-alkanes (relative to even), indicating the n-alkanes are derived from higher terrestrial plants. Low CPI values indicate either low contribution from terrestrial higher plants or high organic matter degradation (Eglinton and Hamilton, 1967).
with Cx the amount of each homologue.
3.2 Carbon and hydrogen isotopes of terrestrial plant waxes
To reconstruct vegetation changes, we use the carbon isotopic composition of terrestrial plant waxes (δ13Cwax). On late Quaternary timescales, the primary factor determining the amplitude of fractionation between the δ13C of atmospheric CO2 (δ13Catm) and the carbon isotopic composition of the plant (δ13Cplant) is the plant carbon fixation pathway (; e.g. Diefendorf and Freimuth, 2017). On these timescales, changes in the δ13Catm are too small to significantly influence δ13Cwax (Tipple et al., 2010). Shrubs and trees use the C3 photosynthetic pathway and show the largest fractionation. Grasses utilize either the C3 or C4 pathways, with C4 plants having the smallest net fractionation (Collister et al., 1994). The differences in carbon isotope fractionation during carbon uptake lead to different δ13Cwax signatures and allow the determination of past vegetation types: n-alkane δ13C values of C3 plants are ca. −36 ‰ VPDB (Vienna Pee Dee Belemnite) and ca. −20 ‰ VPDB for C4 plants (e.g. Diefendorf and Freimuth, 2017).
The hydrogen isotope composition of plant waxes (δDwax) reflects the isotopic composition of the water used during lipid biosynthesis (Sachse et al., 2012), rendering it a valuable tool for reconstructing past hydrological conditions (e.g. Collins et al., 2013; Schefuß et al., 2005). δDwax is influenced by three main factors: (i) the isotopic composition of precipitation; (ii) enrichment of soil and leaf water due to ET; and (iii) differences in the apparent isotopic fractionation between source water and plant waxes due to differences in vegetation type. The importance of each factor varies by study site and with time. The detailed interpretation of the Mfabeni δ13Cwax and δDwax is discussed in Sect. 6.1.
Core MF4-12 (6.96 m recovery, 8.77 m penetration) was recovered from the centre of Mfabeni peatland during January 2012 using a vibrocoring device (Fig. 2). The chronology of the core is established by 24 14C AMS (accelerator mass spectrometry) dates from bulk peat (Figs. 3, Sect. S1 in the Supplement). The chronology is extended from that published in Humphries et al. (2017) and the age model is made using the Bacon 2.2 program (Blaauw and Christen, 2011). Radiocarbon ages were calibrated using the Southern Hemisphere calibration curve, ShCal13 (Hogg et al., 2016), and the post-bomb Southern Hemisphere curve, zones 1–2, for the uppermost modern dates (Hua et al., 2016).

Figure 3Depth–age model of Mfabeni core MF4-12 produced using Bacon, based on 24 14C AMS dates (Sect. S1). Blue symbols are AMS dates and grey shading indicates the 95 % confidence interval on the mean age (red line).
Freeze-dried, bulk peat samples were ground and homogenized using a pestle and mortar and lipids were extracted from ca. 2 g of peat using a DIONEX Accelerated Solvent Extractor (ASE 200) at 100 ∘C and at 1000 psi for 5 min (repeated three times) using a dichloromethane (DCM) : methanol (MeOH) (9:1, v∕v) mixture. Prior to extraction, squalane was added as an internal standard. Copper turnings were used to remove elemental sulfur from the total lipid extract (TLE). To remove water, the TLE was passed over a Na2SO4 column (eluting with hexane). Subsequent to saponification (by adding 6 % KOH in MeOH) and extraction (with hexane), the neutral fractions were split into a further three fractions, hydrocarbon, ketone, and polar, by silica gel column chromatography (mesh size 60 µm) and elution with hexane, DCM and DCM : MeOH (1:1), respectively. By eluting the hydrocarbon fractions with hexane over AgNO3-impregnated silica columns we obtained the saturated hydrocarbon fractions. The saturated hydrocarbon fractions were measured using a Thermo Fischer Scientific Focus gas chromatograph (GC) with flame-ionization detection (FID) equipped with a Restek Rxi 5 ms column (30 m × 0.25 mm × 0.25 µm), in order to determine the concentrations of long-chain n-alkanes. The GC oven temperature was set at 60 ∘C, held for 2 min, increased at 20 ∘C min−1 to 150 ∘C, and then increased at 4 ∘C min−1 to 320 ∘C and held for 11 min. The split–splitless inlet temperature was 260 ∘C. To estimate the sample concentrations needed for isotope analyses, samples were compared with an external standard that was run every five samples which contained n-alkanes (C19–C34) at a concentration of 10 ng µL−1. A quantification uncertainty of <5 % was yielded through replicate analyses of the external standard.
The δ13C values of the long-chain n-alkanes were measured using a Thermo Trace GC Ultra equipped with an Agilent DB-5 column (30 m × 0.25 mm × 0.25 µm) coupled to a Finnigan MAT 252 isotope ratio mass spectrometer (IR-MS) via a combustion interface operated at 1000 ∘C. The GC temperature was programmed from 120 ∘C (hold time 3 min), followed by heating at 5 ∘C min−1 to 320 ∘C (hold time 15 min). The external CO2 reference gas was used to calibrate the δ13C values, and they are reported in ‰ VPDB. Samples were analysed in duplicate when n-alkane concentrations were adequate for multiple runs. The internal standard (squalane, ‰) yielded an accuracy of 0.6 ‰ and a precision of 0.2 ‰ (n=37). The external standard mixture was analysed every six runs. The long-term precision and accuracy of the external n-alkane standard were 0.2 ‰ and 0.15 ‰, respectively. For δ13C the average precision of the n-C29 and n-C31 alkanes in replicates was 0.2 ‰ and 0.1 ‰ (n=22), respectively.
The δD compositions of long-chain n-alkanes were measured using a Thermo Trace GC coupled via a pyrolysis reactor (operated at 1420 ∘C) to a Thermo Fisher MAT 253 IR-MS. The GC column and temperature program was similar to that used for the δ13C analysis. The external H2 reference gas was used to calibrate the δD values, and they are reported in ‰ VSMOW. The H3+ factor was monitored daily and fluctuated around 5.2 ppm nA−1 during analyses. After every sixth measurement, an n-alkane standard of 16 externally calibrated alkanes was measured. The long-term precision and accuracy of the external n-alkane standard was 2.7 and 2 ‰, respectively. Samples were analysed in duplicate when n-alkane concentrations were adequate for multiple runs. The internal standard (squalane, ‰; ±2) yielded an accuracy of 0.9 ‰ and a precision of 1.9 ‰ (n=36). For δD the average precision in replicates was 1 ‰ for both n-C29 and n-C31 alkanes (n=52).
The last glacial period Mfabeni δDwax values were corrected to account for the effect of changes in global ice volume (Collins et al., 2013; Schefuß et al., 2005). For this, the benthic foraminifera-based oxygen isotope curve (Waelbroeck et al., 2002) was interpolated to each sample age and then converted to δD values using the global meteoric water line (Craig, 1961).
This study focusses on the last 32 cal ka BP (ca. 590 cm). The average temporal resolution between the 62 samples analysed for δ13C and δD is ca. 500 years. From 590 to 70 cm (ca. 32–2 cal kyr BP) the core is very dark brown in colour, containing peat with humus, fine detritus, and silt. From 70 cm to the core top, the sediments are similar in colour to the peat below and contain fibrous peat with humus and herbaceous fine detritus (Humphries et al., 2017). Between 457 and 358 cm (ca. 23–14 cal kyr BP; comprising the LGM), mean grain sizes average 110 µm, with smaller diameters averaging 50 µm between 298 cm and the core top (ca. 11 cal kyr BP–present, Holocene; Fig. 4g). The lithology of core MF4-12 does not exactly match that observed from core SL6 (Baker et al., 2014, 2016, 2017), although sandy peat is observed during the LGM at both locations. This result is not surprising as multiple cores taken in transects across the bog indicate peat heterogeneity (Grundling et al., 2013).
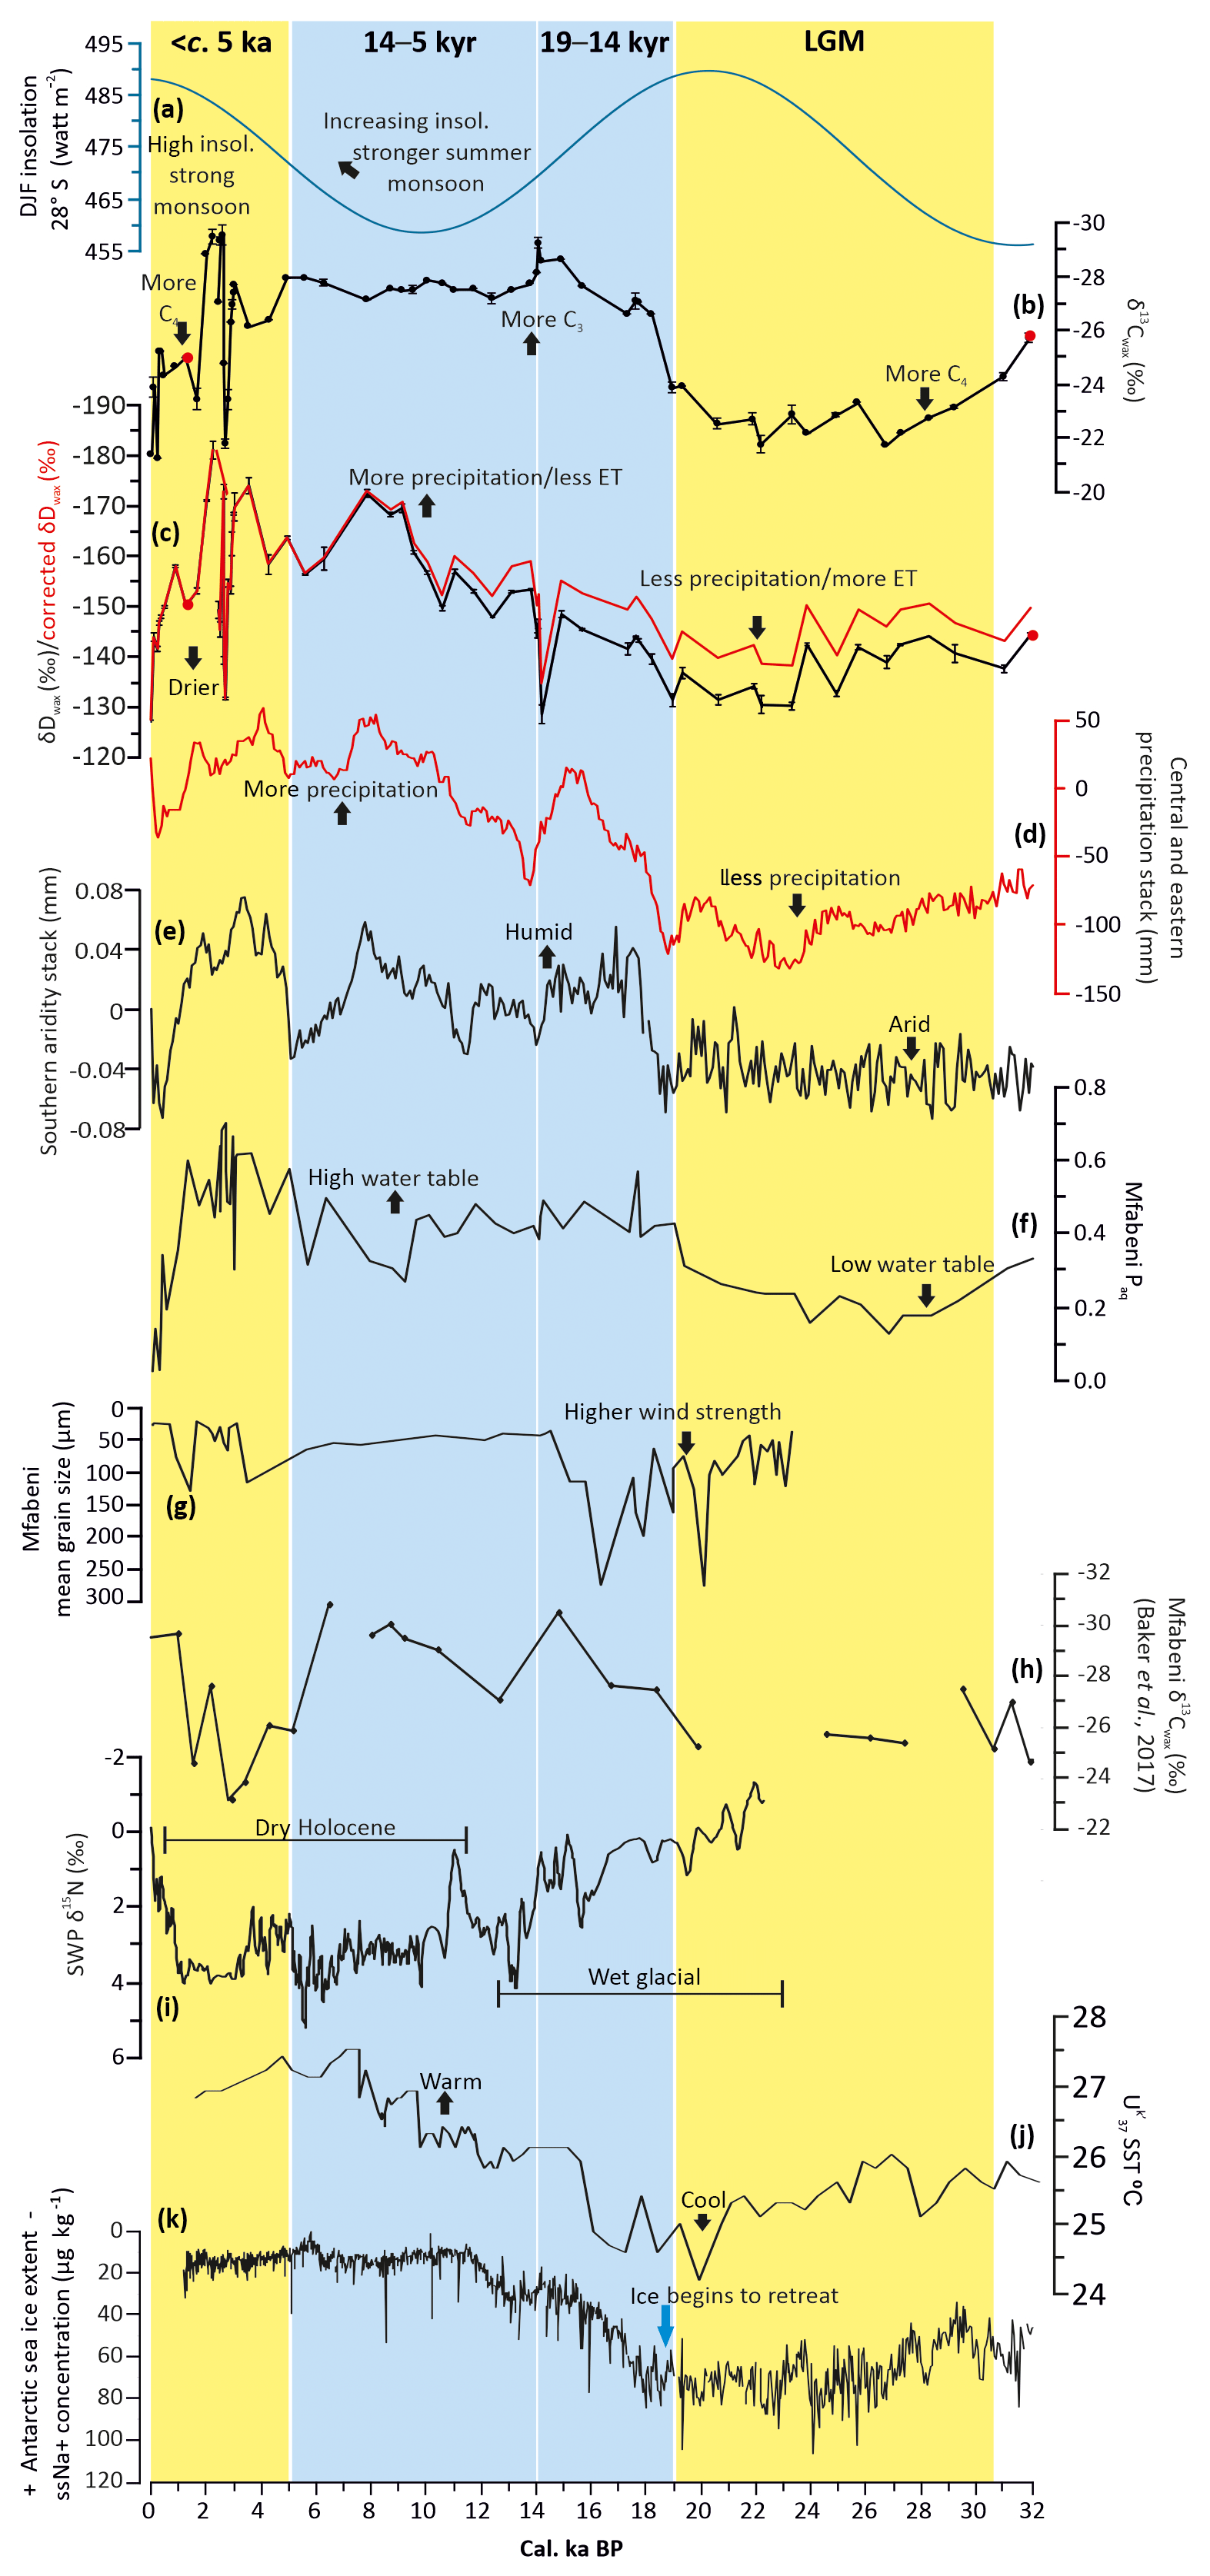
Figure 4Climate and environmental change at Mfabeni compared with regional records and orbital insolation. (a) December–January–February (DJF) insolation for 28∘ S (blue line; Laskar et al., 2011). (b) Stable carbon isotope composition (weighted mean) of C29–C31 n-alkanes from Mfabeni, reflecting changes in C3∕C4 vegetation type. (c) Hydrogen isotope composition (weighted mean) of C29–C31 n-alkanes from Mfabeni, reflecting changes in precipitation amount and ET. Red is the δDwax corrected for ice volume changes. Error bars on isotope data reflect analytical uncertainty of duplicate analyses. (d) Central and eastern South African regional precipitation stack (red line; Chevalier and Chase, 2015). (e) Southern African regional aridity stack (Chevalier and Chase, 2016). (f) Paq at Mfabeni, indicating the amount of aquatic vs. terrestrial n-alkanes (high/low water table). (g) Mean grain size data of the lithogenic sediment fraction from Mfabeni (Humphries et al., 2017). (h) Mfabeni core SL6 stable carbon isotope composition (weighted mean) of C29–C31 n-alkanes (Baker et al., 2017). (i) Combined nitrogen isotope data from Seweweekspoort rock hyrax middens, reflecting changes in humidity (Chase et al., 2017). (j) -derived SSTs from core MD79257 in the Mozambique Channel (Sonzogni et al., 1998). (k) Sea-salt sodium concentrations from the EPICA DML ice core in Antarctica, reflecting changes in sea-ice coverage (Fischer et al., 2007). The two Mfabeni samples with CPI values of ca. 2 are highlighted in red (b, c). Blue shading: Mfabeni wet, orange: Mfabeni arid.
Long-chain n-alkane CPI values are generally around 6 (ranging from 2 to 13), indicating good n-alkane preservation. The two samples with CPI values of 2, potentially containing more degraded n-alkanes, are highlighted in red (Figs. 4b, c; 5b, c; 6f, g). However, the inclusion or exclusion of these samples does not affect the observed pattern of changes, and we thus consider the record to be suitable for palaeoclimate reconstruction. The samples contain n-alkanes with carbon chain lengths ranging from C17 to C35, with C29 and C31 generally having the highest abundance. The high abundances of C29 and C31 enabled reliable isotopic analyses. The relationship between the δD and δ13C of the C29 and C31 n-alkanes is strong, with R2 values of 0.8 and 0.9, respectively. Consequently, for the δ13Cwax and δDwax, we use the amount-weighted mean of the C29 and C31 n-alkanes.
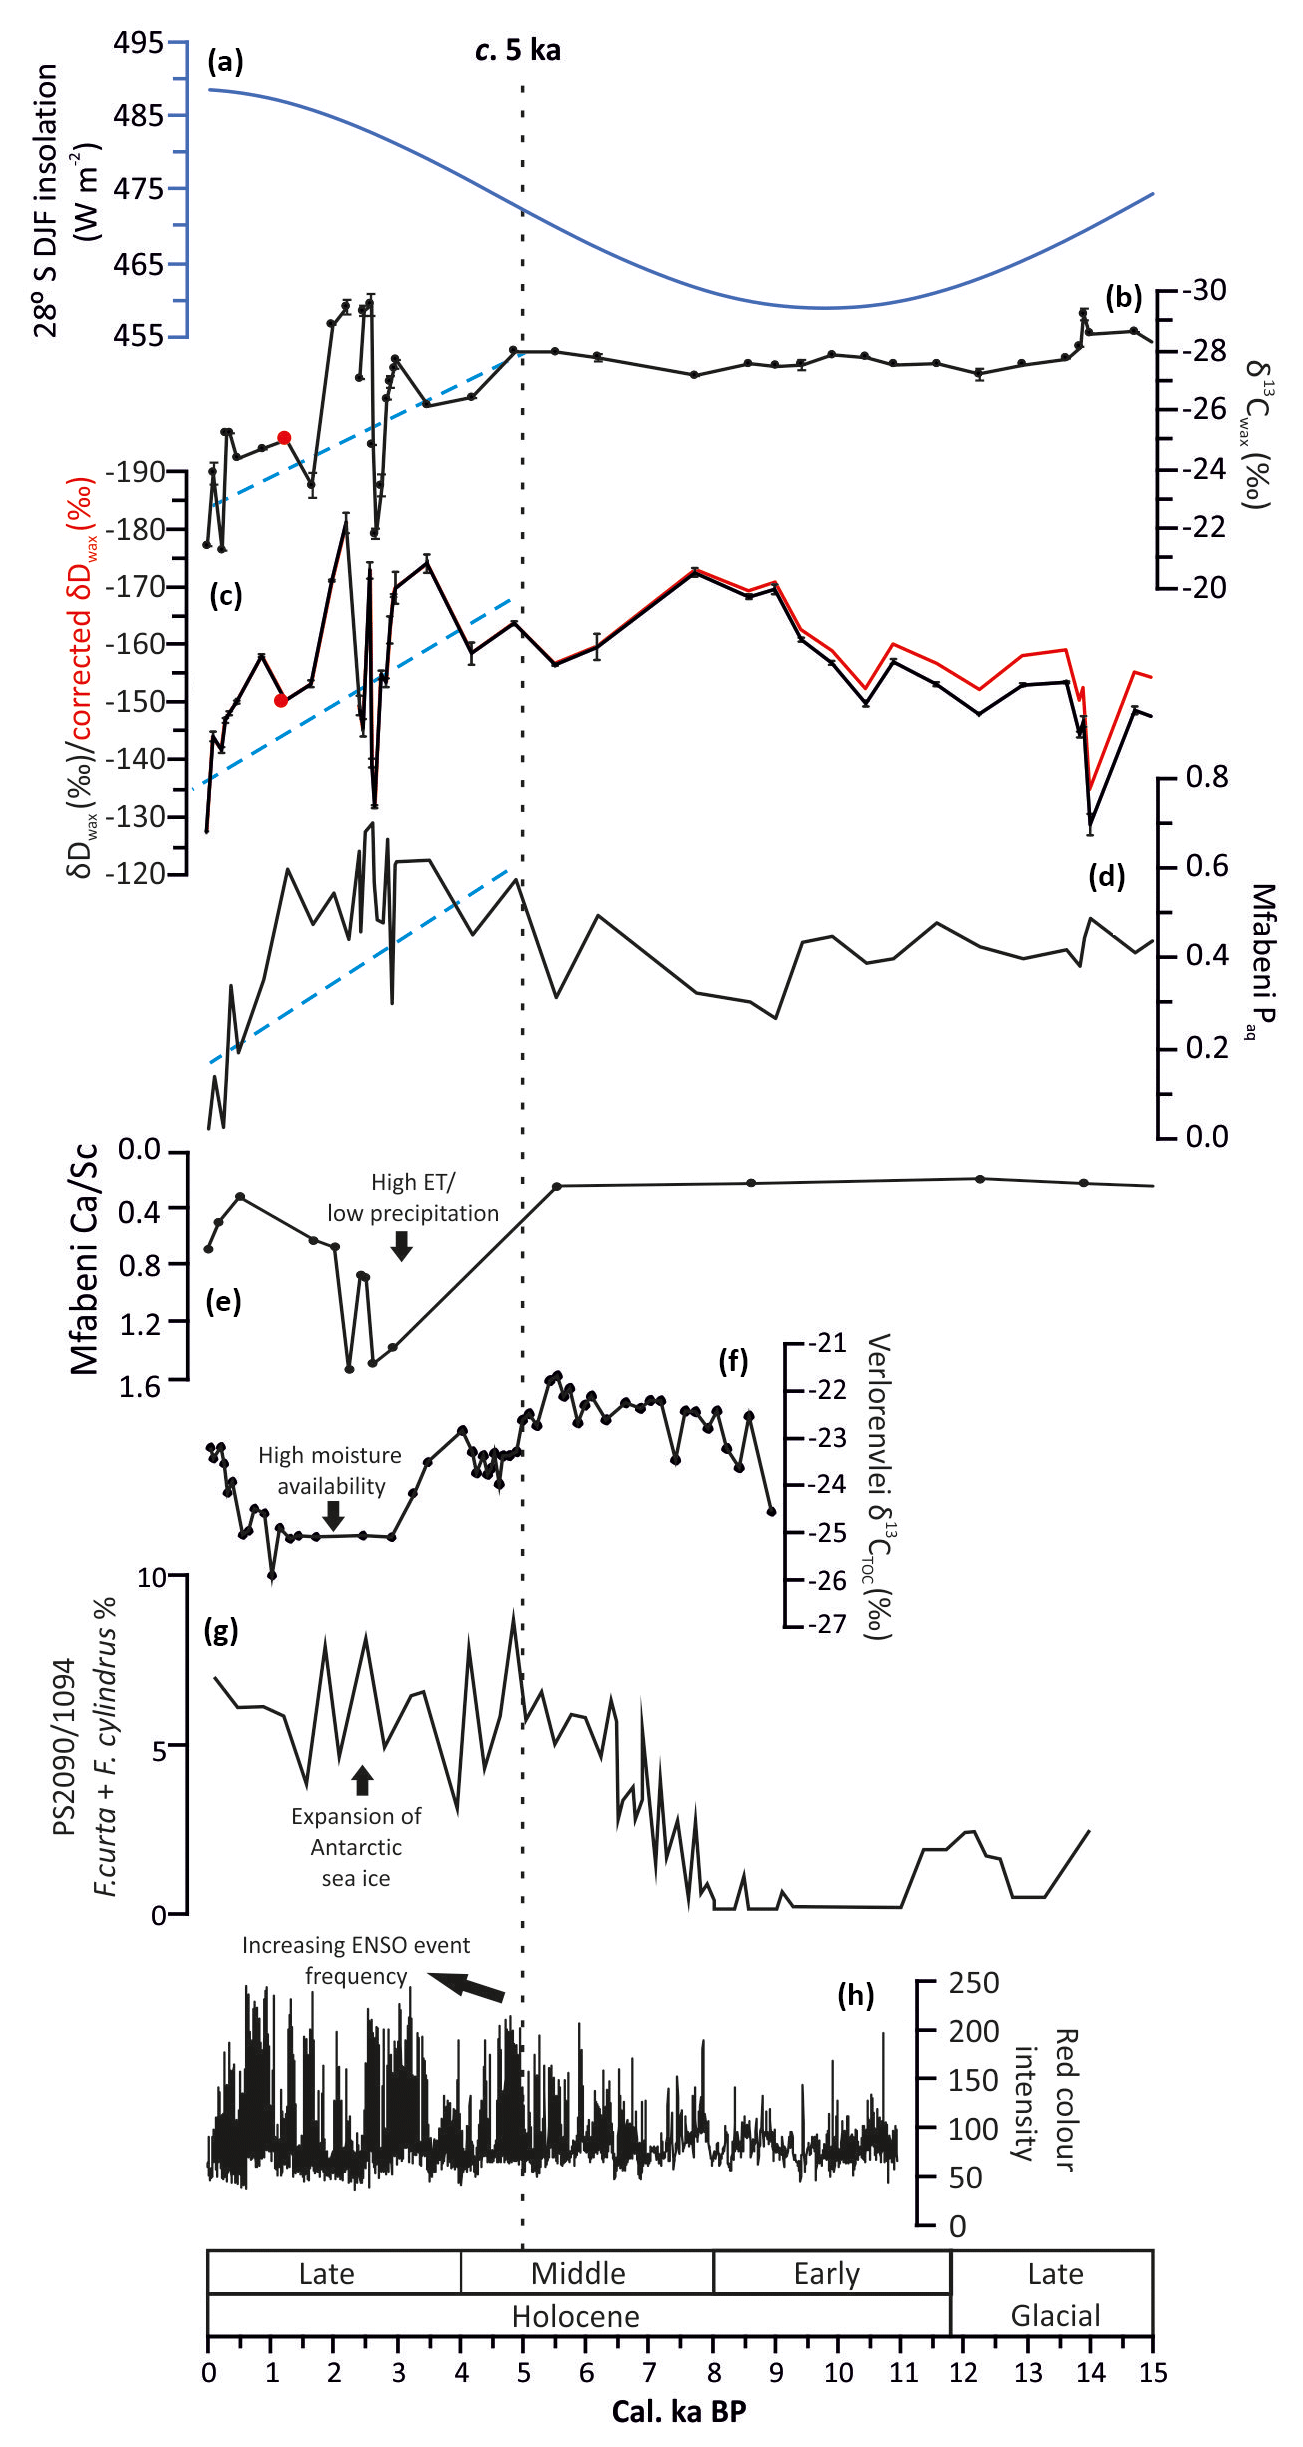
Figure 5Comparison of Mfabeni data with other records of environmental variability over the last 15 cal kyr BP. (a) DJF insolation for 28∘ S (black line; Laskar et al., 2011). (b) Carbon isotope composition (weighted mean) of C29–C31 n-alkanes from Mfabeni, reflecting changes in C3∕C4 vegetation type. (c) Hydrogen isotope composition (weighted mean) of C29–C31 n-alkanes from Mfabeni, reflecting changes in summer precipitation amount and ET. (d) Paq at Mfabeni, indicating the amount of aquatic vs. terrestrial n-alkanes (high/low water table). Blue dashed lines highlight trends. (e) Mfabeni calcium ∕ scandium ratio, indicating changes in the water table (Humphries et al., 2017). (f) Bulk carbon isotope data from Verlorenvlei (Carr et al., 2015). (g) An estimation of the extent of Antarctic sea ice based on the abundance of Fragilariopsis curta and Fragilariopsis cylindrus at site PS2090/ODP1094 (south-west of Cape Town; Bianchi and Gersonde, 2004). (h) Red colour intensity time series from Laguna Pallcacocha. High values are light coloured inorganic clastic laminae, which were deposited during ENSO-driven episodes (Moy et al., 2002). The Mfabeni sample with a CPI value of ca. 2 is highlighted in red (b, c).
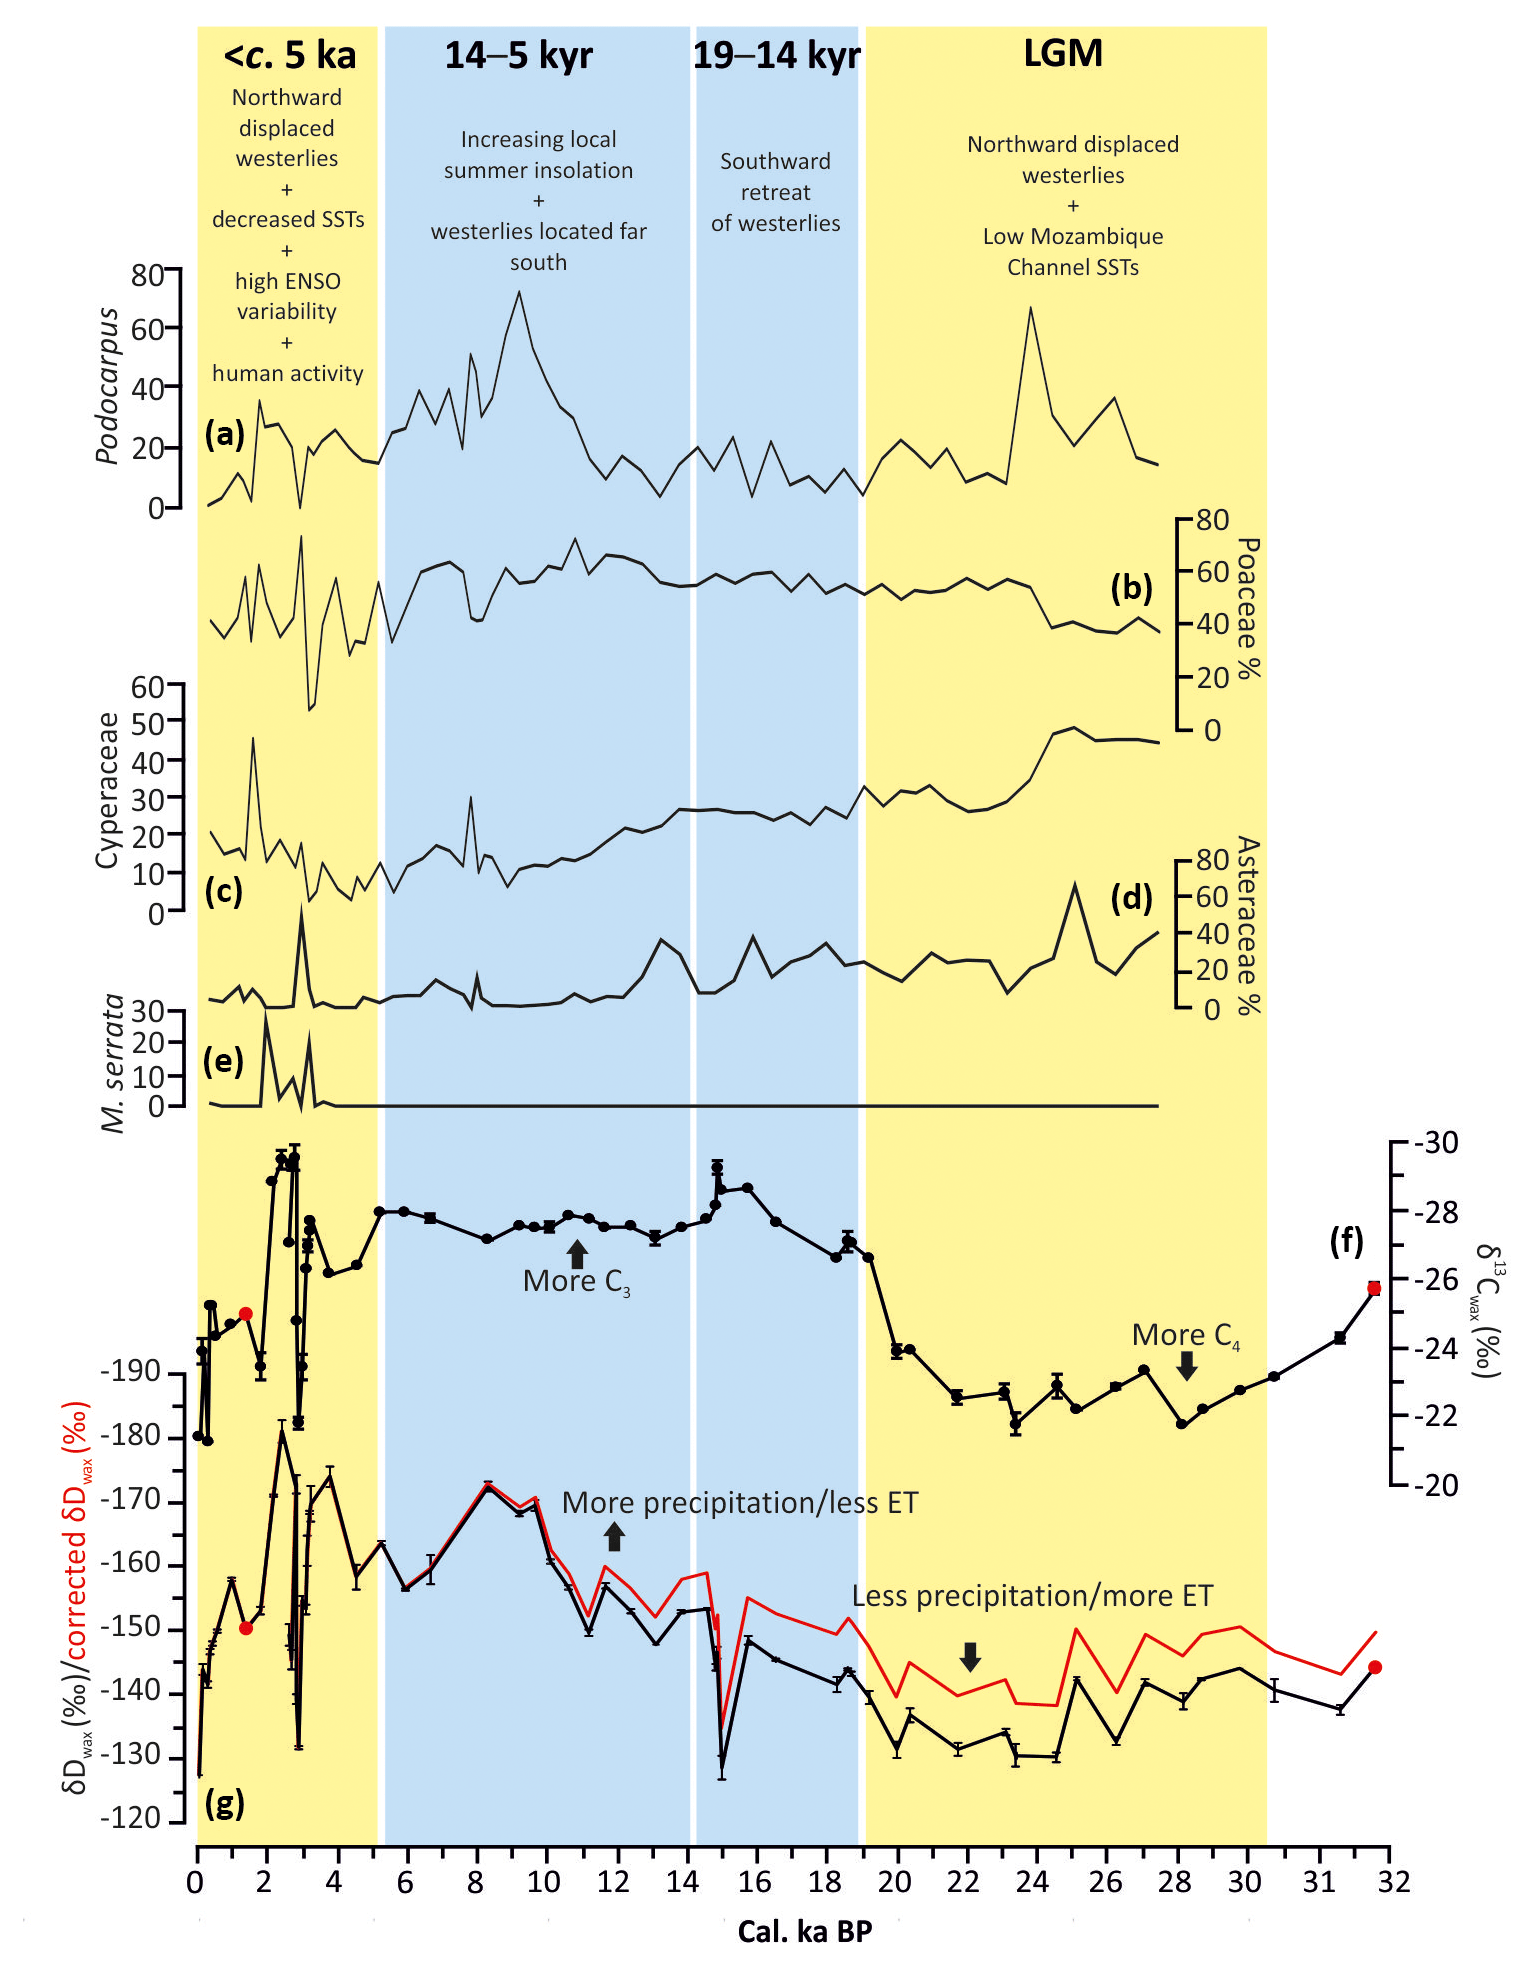
Figure 6Summary figure highlighting the main climate phases and driving mechanisms at Mfabeni. All pollen data are from Finch and Hill (2008). Note that the new age model for pollen % data is in the Supplement (Sect. S2). (a) Podocarpus % data from Mfabeni. (b) Poaceae % data from Mfabeni. (c) Cyperaceae % data from Mfabeni. (d) Asteraceae % data from Mfabeni. (e) Morella serrata % data from Mfabeni. Poaceae and Cyperaceae were excluded from the regional pollen sum, so their percentages are based on total pollen frequencies. Podocarpus, Asteraceae, and M. serrata percentages are based on regional frequencies. See Finch and Hill (2008) for more details. (f) Stable carbon isotopic composition (weighted mean) of C29–C31 n-alkanes from Mfabeni. (g) Hydrogen isotope composition (weighted mean) of C29–C31 n-alkanes from Mfabeni. Red is the δDwax corrected for ice volume changes. The two Mfabeni samples with CPI values of ca. 2 are highlighted in red. Blue shading: Mfabeni wet, orange: Mfabeni arid.
The δ13Cwax values range from −29 ‰ to −21 ‰ (Fig. 4b). The ice volume δD correction decreases the glacial Mfabeni δDwax values by <8 ‰ (Fig. 4c). The ice-corrected δDwax values of the n-C29 and n-C31 alkanes range from −181 ‰ to −128 ‰ (Fig. 4c). Paq values range from 0.02 to 0.7, averaging 0.2 (Fig. 4f).
During the LGM, δ13Cwax and δDwax values are relatively high, averaging −23 ‰ and ca. −136 ‰, respectively (Fig. 4b, c), and Paq values are low (ca. 0.24; Fig. 4f). At ca. 19 cal ka BP a 4 ‰ negative shift in δ13Cwax values occurs (Fig. 4b). This negative shift in δ13Cwax is concurrent with a gradual shift to lower δDwax values (Fig. 4c) and an increase in Paq values (Fig. 4f). Between 14 and 5 cal kyr BP, δ13Cwax values are relatively stable and average −28 ‰ (Fig. 4b). δDwax values become gradually lower during this period, reaching −173 ‰ at 7.5 cal ka BP. At 5 cal ka BP, δDwax values shift towards more positive values by 16 ‰ (Fig. 4c). Relatively high Paq values occur between 14 and 5 cal kyr BP (Fig. 4f). After ca. 5 cal ka BP several high-amplitude millennial-scale fluctuations in both δ13Cwax and δDwax values are evident. These fluctuations interrupt a trend where the isotope values of both δ13Cwax and δDwax gradually increase towards the present day. A pronounced shift to higher δ13Cwax and δDwax values occurs at 2.8 cal ka BP. From ca. 900 cal yr BP, δ13Cwax and δDwax values become higher, reaching core top values of −21 ‰ and −128 ‰, respectively (Fig. 4b, c). Generally high but variable and rapidly fluctuating Paq values are evident between ca. 5 and 0 cal kyr BP. Paq values decrease substantially after 1.3 cal ka BP from 0.6 to a core top value of ca. 0 (Fig. 4f).
6.1 Interpretation of the proxy signals
The relatively high CPI27–33 values indicate that the long-chain n-alkanes within the peat are derived from terrestrial higher plants and are relatively non-degraded. The long-chain n-alkanes are likely sourced directly from the local vegetation surrounding the coring location. It is possible that during times of stronger wind strength (i.e. during the LGM; Humphries et al., 2017) increased aeolian transport resulted in a higher biomarker contribution from more distal sources (i.e. the surrounding dune vegetation). Good preservation of n-alkanes in Mfabeni peat was also observed in nearby core SL6, but this was based on a CPI calculated using n-C21−31 (Baker et al., 2016). No relationship exists between the CPI and Paq (R2=0.11), which suggests that CPI variations at the location of core MF4-12 are not related to changes in organic matter preservation due to water table level variations.
The main source of carbon for terrestrial higher plants (the source of the C29 and C31 n-alkanes) is atmospheric CO2, whereas aquatics also assimilate dissolved carbon, complicating the interpretation of their carbon isotope signal. We thus focus solely on C29 and C31 n-alkanes that are predominantly derived from terrestrial plants (Eglinton and Hamilton, 1967). The majority of the samples (67 %) have dominant n-alkane chain lengths of C29 and C31. For the remaining 33 % of the samples, concentrated between 6 and 1.1 cal kyr BP, the dominant chain length switched to n-C25, indicating a higher n-alkane input from submerged macrophytes (Ficken et al., 2000). The n-C25 are unlikely to be sourced from mosses, as mosses are rare in subtropical peatland environments (Baker et al., 2016). Instead, the C25 is likely mainly derived from aquatic plants, which produce mid-chain n-alkanes as dominant homologues (C20–C25; Ficken et al., 2000). This increase in n-alkanes sourced from aquatic plants ca. 6–1.1 cal kyr BP is unlikely to have had any impact on the isotopic composition of the long-chain n-alkanes (C29 and C31) as these are minor components in aquatic plants (e.g. Aichner et al., 2010). Therefore, we interpret the δ13Cwax as changes in the C3∕C4 ratio of terrestrial higher plants.
Grasses exhibiting the C4 or C3 photosynthetic pathway in South Africa are largely geographically separated, with C4 grasses dominant within the SRZ and C3 grasses more prevalent in the YRZ and WRZ and at higher altitudes (Vogel et al., 1978). As C4 grasses require less water to fix CO2, thus having greater water-use efficiency than C3 grasses, C4 photosynthesis is favoured in arid regions (e.g. Downes, 1969; Osborne and Sack, 2012). C4 grasses also have the potential to achieve higher rates of photosynthesis than C3, particularly at high irradiance and temperature levels (Black et al., 1969; Monteith, 1978), as their more efficient carbon fixation has a higher energy demand (Sage, 2004). Today growing season temperatures are a controlling factor for the distribution of C4 and C3 grasses (with C4 grasses having an advantage over C3 grasses at higher temperatures; Sage et al., 1999). Consequently C4 grasses are mainly found in warm and dry environments such as the African savannas (Beerling and Osborne, 2006). Furthermore, under reduced atmospheric (i.e. glacial) CO2, the higher carbon fixation efficiency of C4 grasses provides an important advantage over C3 grasses (Sage, 2004; Pinto et al., 2014). Previous palynological studies indicate that the dominant components of the pollen assemblage at Mfabeni are Poaceae and Cyperaceae (Finch and Hill, 2008). Although Cyperaceae species can be either C3 or C4, most Cyperaceae in eastern South Africa (67 %) are of the C4 type (Stock et al., 2004). The C4 vegetation at Mfabeni is thus mostly Poaceae or Cyperaceae from the sedge and reed fen. The C3 vegetation at Mfabeni is comprised of arboreal taxa from the swamp forest (e.g. Myrtaceae and Ficus) and locally distributed Podocarpus (Finch and Hill, 2008; Venter, 2003). Shifts to higher δ13Cwax values (more C4-type vegetation) at Mfabeni could indicate an expansion of grassland (at the expense of arboreal taxa) or a shift from C3 to C4 grasses resulting from (i) less precipitation, (ii) a longer/more intense dry season, (iii) heightened ET, (iv) reduced water table height, (v) higher temperatures, (vi) reduced atmospheric CO2, or (vii) increased insolation levels (or any combination of the above).
The δDwax reflects the δDprecip, ET, and vegetation type. The δDprecip can be influenced by changes in air temperature, with an estimated temperature effect of ca. 0.5 ‰ per 1 ∘C for δ18Oprecip (Dansgaard, 1964). The maximum estimated temperature change of ca. 6 ∘C in the SRZ of South Africa from the LGM to the Holocene (Gasse et al., 2008) would thus correspond to a change in δ18Oprecip of 3 ‰. Conversion to changes in δDprecip using the global meteoric water line would thus lead to a potential LGM-to-Holocene δDprecip enrichment of 24 ‰ (Craig, 1961). However, the Mfabeni δDwax record shows a depletion in δDwax from the LGM to the Holocene, rather than an enrichment. The observed glacial δD depletion is therefore a conservative estimate. Consequently, changes in air temperature from the LGM to the Holocene did not exert a dominant control on Mfabeni δDwax.
Changes in vegetation type (C3∕C4) have the potential to reduce or exaggerate shifts in δDwax. There are differences in the apparent fractionation (the integrated isotopic fractionation between precipitation and plant-wax lipids) between plant types using different photosynthetic pathways. C3-type shrubs and trees fractionate the least, C4-type grasses slightly more, and C3-type grasses show the highest apparent fractionation (Sachse et al., 2012). The difference in δDwax between dicots (C3, shrubs, trees, and forbs) and monocots (C4, grasses) is likely the result of leaf architecture and the nature of water movement in the leaf. Monocots display progressive evaporative enrichment along parallel veins along the leaf, which does not occur in dicots. This grass-blade enrichment results in higher δDwax values in C4 grasses (Helliker and Ehleringer, 2000). However, recent data suggest that the effect of C3-tree to C4-grass vegetation-type changes on δDwax is likely relatively small (Collins et al., 2013; Vogts et al., 2016).
The δDprecip is strongly controlled by the “amount effect”, where there is a negative correlation between monthly precipitation amount and δDprecip (Dansgaard, 1964). Close to the Equator, passage of the tropical rainbelt can result in precipitation that is extremely depleted in D. Conversely, in arid regions, rainfall tends to be enriched in D, because of enhanced evaporation of the raindrops as they fall (Risi et al., 2008). Studies investigating the present-day relationship between precipitation amount and the isotopic variations in rainfall indicate shifts in δ18O of up to 15 ‰ (ca. 120 ‰ in δD) with the passage of the tropical rainbelt and shifts in δ18O of 7 ‰ (ca. 56 ‰ in δD) with the passage of convective storms (Gat et al., 2001). During times of heightened ET and/or lower precipitation amount, soil waters become enriched in D (Sprenger et al., 2017). In addition, under conditions of low ambient relative humidity, leaf water becomes enriched in D through increased transpiration (Kahmen et al., 2013). Large values of isotopic enrichment (ca. 40 ‰ in δ18O, 180 ‰ in δD) are associated with the effects of evaporation (e.g. Cappa et al., 2003). The control of precipitation amount and ET on D operates in the same direction, and thus the mechanisms are not easily disentangled.
Mfabeni has high rates of ET, which can equal or even exceed precipitation during dry periods (Grundling et al., 2015). Consequently, both precipitation amount and ET are likely to control the isotopic composition of soil and leaf waters, and subsequently of the leaf waxes at Mfabeni. High δDwax values at Mfabeni likely result from decreased summer precipitation amount and/or heightened ET. The similarity between the δDwax pattern and the regional precipitation/aridity stacks (Fig. 4d, e; Chevalier and Chase, 2015, 2016) supports the inference that precipitation amount and ET drive Mfabeni δDwax. Furthermore, this similarity indicates that the hydrological fluctuations in the Mfabeni record represent hydrological change at a broader spatial scale (Fig. 4c–e), but also suggest that the pollen-based precipitation stacks may also include an element of ET variability.
6.2 Climatic and environmental conditions at Mfabeni over the last 32 cal ka BP
The δ13Cwax, δDwax, and Paq data from Mfabeni indicate that the vegetation, hydrology, and water table varied considerably over the last 32 cal ka BP (Figs. 4, 5). The high δ13Cwax values during the LGM indicate that the vegetation was likely dominated by more drought-tolerant C4 plant types (Fig. 4b). Similar LGM δ13Cwax depletion was observed previously at Mfabeni (Fig. 4h; Baker et al., 2017). Drier conditions during the LGM correspond to low Paq values that indicate a higher relative contribution of terrestrial-over-aquatic n-alkanes, likely a consequence of a lower water table (Fig. 4f). The high δDwax values during the LGM suggest decreased precipitation amount and/or higher ET, which are both consistent with a drier environment (Fig. 4c). We cannot completely rule out the possible impact of increased drainage of the peat bog during the LGM due to a low eustatic sea level (Grundling et al., 2013). A lower water table during the LGM would likely serve to further soil water D enrichment. Nevertheless, the fact that the peat continued to grow during the LGM suggests that the sea level effect was minor. The organic geochemical proxies agree with palynological data indicating regional grassland dominance (high Poaceae, Cyperaceae, and Asteraceae) with low amounts of arboreal taxa (Fig. 6; Finch and Hill, 2008). Regional aridity and increased wind strength during the LGM at Mfabeni are also indicated by increased mean grain size of the lithogenic sediment fraction (Fig. 4g) and the modal grain size of the distal aeolian component (Humphries et al., 2017). Evidence of reduced precipitation (from the regional precipitation stack; Fig. 4d) and high aridity (from the regional aridity stack; Fig. 4e) during the LGM suggest that the dry conditions at Mfabeni appear to be part of a wider eastern South African pattern (Fig. 4d, e).
The shift to more negative δ13Cwax values following the LGM, at ca. 19 cal ka BP, indicating that the vegetation at Mfabeni changed to a more C3 type (Fig. 4b), is also evident in Mfabeni core SL6 (Fig. 4h; Baker et al., 2017). This change is thus likely representative of a C4–C3 change across the peat bog. The palynological record indicates no shift towards arboreal taxa at this time but instead a continuation of grasslands (Fig. 6a, b; Finch and Hill, 2008). A decrease in Cyperaceae percentages (as most Cyperaceae is of C4 type) may be responsible for the C4 to C3 shift observed in the δ13Cwax record, but the gradual nature of the Cyperaceae decrease points to an additional driver (Fig. 6c). The shift is more likely the result of a switch from C4 to C3 grasses. If temperature was driving the vegetation shifts at Mfabeni, we would expect a shift from C3 to C4 grasses from the LGM to the Holocene (with a ca. 6 ∘C increase in temperature). Nevertheless, the LGM-to-Holocene shift from C4 to C3 grasses suggests that temperature did not drive the vegetation change at Mfabeni. We suggest that the shift from C4 to C3 grasses may have been caused instead by (i) more precipitation, (ii) a shorter/less intense dry season, (iii) lower ET, and/or (iv) increased water table height. Furthermore, with C3 vegetation favoured under lower insolation conditions, a decrease in local summer insolation from the LGM to the Holocene (Fig. 4a) could have played a role in driving the vegetation shifts.
After ca. 19 cal ka BP, the δ13Cwax values continue to decrease to −29 ‰ until they stabilize at ca. 14 cal ka BP. This trend in δ13Cwax values between ca. 19 and 14 cal kyr BP, indicating an expansion of C3 vegetation, corresponds well to the δ13Cwax record from Mfabeni core SL6 (Baker et al., 2017; Fig. 4b, h). There are, however, some minor differences between the two δ13Cwax records. We attribute these to small-scale variations in vegetation across the peat bog, the lower sampling resolution of core SL6, and dating uncertainties in both records. The shift to lower δ13Cwax values at ca. 19 cal ka BP occurs at the same time as a rise in the water table as documented by an increase in Paq values (Fig. 4f). An abrupt increase in precipitation amount and a decrease in aridity is evident in the precipitation and aridity stacks at ca. 19 cal ka BP. All proxy records for precipitation (the regional stacks and the Mfabeni δDwax data; Fig. 4) strongly suggest a switch to wetter conditions after ca. 19 cal ka BP.
The δ13Cwax values between 14 and 5 cal kyr BP reflect a stable period of C3-type vegetation (Fig. 4b). At the same time, gradually decreasing δDwax values indicate increasing humidity. The gradual increase in precipitation is also evident in the precipitation stack, but this trend is interrupted by an abrupt return to aridity at ca. 14.2 cal ka BP, coinciding with the Antarctic Cold Reversal (Chase et al., 2017). This abrupt arid event is only evident in one sample at Mfabeni, and thus higher-resolution sampling is needed across this interval. The aridity stack indicates low aridity during this interval, but high variability suggests a complex interplay between high ET (from increased temperatures, resulting in less effective precipitation) and generally more precipitation (Fig. 4e). Pollen data from Mfabeni provide evidence of an expansion of arboreal-type vegetation at ca. 12 cal ka BP (Fig. 6a; Finch and Hill, 2008). The pollen data thus suggest the establishment of swamp forest vegetation during the early Holocene indicative of a moist climate (Fig. 6a). Mfabeni aeolian sediment flux is low and stable throughout this period, also suggesting a moist climate (Humphries et al., 2017). The moist climate likely resulted in vegetated dunes, reducing the amount of material available for aeolian transport. The relatively high Paq values between 14 and 5 cal kyr BP indicate a high and stable water table at this time (Fig. 4f). Elevated total organic carbon percentages within Mfabeni core SL6 during the Holocene also suggest increased water levels (Baker et al., 2017).
Between ca. 5 and 0 cal kyr BP several high-amplitude millennial-scale C3∕C4 vegetation changes are evident, superimposed on an overall shift from predominantly C3- to more C4-type vegetation towards the present day (Fig. 5b). This variability contrasts with the more gradual C4∕C3 vegetation transition from the glacial period to the Holocene. The δ13Cwax values from Mfabeni core SL6 between ca. 6 and 1 cal kyr BP also indicate a period of predominantly C4-type vegetation, implying arid conditions during this time (Baker et al., 2017; Fig. 4h). A similar pattern of a long-term trend with superimposed short-term variability is visible in the δDwax record. The general enrichment in D reflects gradual drying, punctuated by millennial-scale pulses of aridity, with the most pronounced arid event at ca. 2.8 cal ka BP (Fig. 5c). Counterintuitively, the high abundance of n-C25 alkanes and high but variable Paq values between ca. 5 and 0 cal kyr BP indicate a generally high water table, interrupted by brief periods of a lower water table (Fig. 5d). After 2.3 cal ka BP, both δ13Cwax and δDwax values become higher and Paq values lower (Fig. 5b–d). This suggests increased C4-type vegetation cover, decreased summer precipitation amount and/or higher ET, and low water table levels. A slight increase in precipitation followed by gradually decreasing precipitation over the last ca. 5 ka is evidenced in the precipitation stack (Fig. 4d). This initial increase in precipitation at ca. 5 cal ka BP corresponds to an abrupt decrease in aridity (Fig. 4d, e). The increased variability observed in our records between 5 and 0 cal kyr BP could be an artefact of the high temporal resolution of our record during this interval (∼220 vs. ∼700 years per sample for the remainder of the record). Nevertheless (Fig. 4d), other data from the region (e.g. Baker et al., 2017; Humphries et al., 2017, 2016; Finch and Hill, 2008; Neumann et al., 2010) also indicate climatic instability and arid climatic conditions during the last ca. 5 cal ka BP, suggesting that the observed variability is likely real (Fig. 5e).
It is interesting that modern δDwax values and those during the LGM appear similar (Fig. 4c), implying similarly arid conditions during both periods. The southern aridity stack also indicates extremely arid conditions during the last few thousand years, and the authors stress the importance of temperature in controlling aridity (Fig. 4e; Chevalier and Chase, 2016). It is possible that modern high mean annual temperatures caused these modern-day δDwax values to appear similar to those from the LGM. High modern-day temperatures increase ET and result in less “effective precipitation” and arid conditions, even when rainfall is high (Chevalier and Chase, 2016). During the LGM, lower temperatures would have reduced ET, leading to apparent humid conditions despite a reduced rainfall amount.
6.3 Climate-driving mechanisms
Modern observations suggest that high SSTs within the Mozambique Channel and Agulhas Current induce increased evaporation (e.g. Walker, 1990), resulting in higher rainfall in the SRZ (Tyson, 1999). Variations in local SSTs are thus thought to be an important driver of hydroclimate in eastern South Africa. This mechanism may also play a role on longer timescales. Indeed, Chevalier and Chase (2015) invoke SSTs as the dominant driver of precipitation variability during the LGM. Mfabeni vegetation and hydrology reconstructions over the last 32 cal ka BP do not show a clear relationship with changes in south-western Indian Ocean SSTs (Fig. 4j, Sonzogni et al., 1998). For example, if SSTs drove the climate at Mfabeni, then the abrupt shift to more C3-type vegetation and the gradual shift to a wetter climate at ca. 19 cal ka BP would be expected to correspond to an increase in SSTs. This is not the case, and SSTs do not increase until ca. 15.7 ka (Sonzogni et al., 1998; Fig. 4). The lowest temperatures within the Mozambique Channel correspond to Heinrich Event 1 (SSTs ca. 3 ∘C colder than the present day), an event which is not evident as a particularly arid period in the Mfabeni dataset. Mozambique Channel SSTs thus do not fully explain the variability observed in the records comprising the precipitation stack. These differences, as proposed previously by Chevalier and Chase (2015), suggest that SST variability is unlikely to be the sole driver of the changes in hydroclimate within this part of the SRZ. Chevalier and Chase (2015) proposed that the differences observed between SSTs and the records comprising the precipitation stack are due to the modulation of precipitation by the position of the westerlies.
We attribute the arid climate and the associated expansion of drought-tolerant C4 plants and a low water table at Mfabeni during the LGM, in part, to a northward displacement of the westerlies, the SIOCZ, and the subtropical high-pressure cell, shifting the hydroclimate to a more evaporative regime where ET exceeds precipitation. In addition, lower SSTs (Fig. 4j) in the Mozambique Channel at this time likely reduced moisture availability. It is possible that the combination of a northward displacement of these three systems (the westerlies, SIOCZ, and subtropical high-pressure cell) and lower SSTs shifted the fine balance between precipitation and ET at Mfabeni towards higher ET rates during the LGM.
Palaeoenvironmental studies (e.g. Lamy et al., 2001, 2010; Stuut and Lamy, 2004), climate model simulations (e.g. Rojas et al., 2009; Toggweiler et al., 2006), and theoretical models (e.g. Cockcroft et al., 1987) provide evidence of an equatorward migration and strengthening of the Southern Hemisphere westerlies in response to the increased extent of Antarctic sea ice during the LGM. Records from the present WRZ such as Elands Bay Cave (Baxter, 1996), Pakhuis Pass (Scott, 1994), and Driehoek Vlei (Meadows and Sugden, 1993) indicate increased winter rainfall, interpreted as a northward shift and strengthening of the westerlies during the LGM (Chase and Meadows, 2007). An equatorward migration of the westerlies may have expanded the limit of the WRZ in South Africa northward, to around 25∘ S in the west and 30∘ S in the east (Cockcroft et al., 1987). This would have put Mfabeni (at 28∘ S) within the range of the southern westerlies. Although during the LGM the westerlies were in a more northerly position and had the potential to provide rainfall (via the passage of more cold fronts; Nkoana et al., 2015), we do not see any evidence of increased precipitation at Mfabeni. Today mid-latitude cyclones (frontal systems; Fig. 1b) associated with the westerlies trigger rainout of atmospheric moisture, sourced from the Indian Ocean and Agulhas Current, during the winter months (Gimeno et al., 2010). However, the co-occurring subtropical high-pressure cell over the South African interior may have limited the amount of moisture advection towards Mfabeni, and thus even with increased cyclone occurrence, arid conditions persisted. Furthermore, with a northerly displaced subtropical high-pressure cell inhibiting monsoonal penetration, the duration of the dry season at Mfabeni may have been extended, shortening the rain season and heightening ET rates.
Northward migration and strengthening of the westerlies are also associated with a northerly displaced and weaker South Indian Anticyclone (Fig. 1; Cohen and Tyson, 1995). A weakening of the western portion of the South Indian Anticyclone results in a north-eastward shift of the SIOCZ (and the rain-bearing cloud band associated with TTTs; Cook, 2000). This north-eastward shift results in higher precipitation over coastal Africa (around 15∘ N) and Madagascar and lower than normal precipitation to the south, in eastern South Africa (Cook, 2000). We propose that a north-eastward shift of the SIOCZ during the LGM may have also played a key role in driving aridity at Mfabeni.
The latitudinal position of the subtropical high-pressure cell is highly correlated with rainfall variability along the eastern coast of South Africa (Dyson and van Heerden, 2002). Multivariate analysis of zonal moisture fluxes in South Africa indicates that the latitudinal position of the subtropical high-pressure cell directly controls the amount of moisture advection (monsoonal penetration) towards the southern African interior during the summer months (Vigaud et al., 2009). When the cell is shifted southward, during the summer, the tropical easterlies are able to penetrate further inland, resulting in higher continental moisture availability (Vigaud et al., 2009). Conversely, when the cell is shifted northward, during the winter, monsoonal circulation south of 25∘ S is impeded, creating a deficit in moisture advection from the ocean to the continent (Tyson and Preston-Whyte, 2000; Vigaud et al., 2009). A more northerly location of the subtropical high-pressure cell, during the LGM, would have lengthened the dry season, resulting in aridity at Mfabeni.
We suggest that the shift to more humid conditions at ca. 19 cal ka BP was related to the retreat of the westerlies, the subtropical high-pressure cell, and the SIOCZ as Antarctic sea ice began to retreat poleward (Fig. 4k), allowing an increased influence of the moist tropical easterlies. With the subtropical high-pressure cell further south, stronger easterly flux from the Indian Ocean likely enhanced the development of TTTs in the region, leading to increased precipitation. This shift at ca. 19 cal ka BP was unlikely driven by a change in local summer insolation because insolation was decreasing at this time. We suggest that the abrupt shift to more C3 vegetation was a non-linear response to increasing moisture availability in the region (Fig. 4c). Precipitation amount may have reached a critical threshold at ca. 19 cal ka BP for the establishment of C3-type vegetation, resulting in the observed abrupt vegetation shift (Fig. 4b).
Between 14 and 5 kyr BP, a reduced extent of Antarctic sea ice (Figs. 4k, 5g) resulted in a more poleward position of the westerlies and the subtropical high-pressure cell. The diminished effect of the westerlies and the subtropical high-pressure cell in eastern South Africa at this time permitted the tropical systems (easterlies) to dominate the climatic regime at Mfabeni. With a strengthened (but poleward displaced) South Indian Anticyclone the SIOCZ was likely situated over Mfabeni, resulting in increased rainfall. Strong easterly flux would have increased the development of TTTs in the region, resulting in higher humidity at Mfabeni. Increasing humidity at Mfabeni during the Holocene corresponds to increasing Southern Hemisphere summer insolation (Fig. 4a). The importance of insolation for South African climate variability during the late Quaternary has been suggested before (e.g. Partridge et al., 1997; Simon et al., 2015). Our results support the hypothesis that insolation control on precipitation variability was only significant during the Holocene (e.g. Schefuß et al., 2011; Chevalier and Chase, 2015). We suggest that direct local insolation forcing is only dominant in this region when the westerlies and subtropical high-pressure cell are located far south, which allows monsoonal precipitation to penetrate into the continent during the summer months.
To explain the millennial-scale climatic variability over the glacial–interglacial transition within their central and eastern African sites (which also include Mfabeni), Chevalier and Chase (2015) and Chase et al. (2017) suggest that this region may be influenced by the position and the intensity of the westerlies, and the interactions between the westerlies and the tropical easterlies (resulting in TTT development). We highlight the importance of the location of TTT development (i.e. the SIOCZ) and stress the interconnections between TTT development, the latitudinal position of the westerlies, and the subtropical high-pressure cell on glacial–interglacial timescales.
After ca. 5 cal ka BP, palaeoenvironmental records from both the WRZ and YRZ, such as from Verlorenvlei (Figs. 1, 5f; Carr et al., 2015), Seweweekspoort (Figs. 1, 4i; Chase et al., 2017), Klaarfontein (Fig. 1; Meadows and Baxter, 2001), Cecilia Cave (Fig. 1; Baxter, 1989), and Eilandvlei (Wündsch et al., 2018), document increased moisture availability, implying a recurring more northerly location of the westerlies. Chevalier and Chase et al. (2015) propose that increased precipitation in the WRZ during the late Holocene was due to both the warmer interglacial climate and the northward expansion of the westerly storm tracks. Although no indication of an increase in sea ice is evident from EPICA salt concentration data (Fig. 4k), diatom data (Fragilariopsis curta and F. cylindrus) from PS2090/ODP1094 in the southern South Atlantic document an increase in sea ice during the late Holocene (Fig. 5g), which may have pushed the southern westerlies equatorward. In addition, climate modelling results imply a northward shift of the southern westerlies at this time (Hudson and Hewitson, 2001). Consequently, in a comparable way to the LGM, the increased sea ice during the late Holocene (Fig. 5g) may have displaced (and strengthened) the westerlies, the South African high-pressure system, and the SIOCZ equatorward, resulting in higher aridity at Mfabeni. A slight decrease in Mozambique Channel SSTs may have also played a role in the generally arid climate at Mfabeni during the last ca. 5 cal ka BP (Fig. 4j; Sonzogni et al., 1998). Interestingly, the hydrological variability at Mfabeni (Fig. 5c) during the last ca. 5 cal ka BP is not present in the central and eastern South African precipitation stack (Fig. 4d). We attribute this to the highly sensitive balance between ET and precipitation at Mfabeni (Grundling et al., 2015) and the fact that the precipitation stack smooths local hydrological variability.
It is possible that anthropogenic influences also played a role in shaping the environment at Mfabeni, at least, during the late Holocene. However, unequivocal agricultural and exotic pollen indicators are absent from the pollen record, and although pollen data indicate that forest decline occurred during the late Holocene, it is unclear whether this was related to human influence or regional climate change (Fig. 6; Finch and Hill, 2008). The forest decline could have affected the water table and increased the relative amount of C4-type vegetation. The appearance of Morella and Acacia in the late Holocene may indicate the development of open vegetation or secondary forest due to fire disturbance (Fig. 6e; Finch and Hill, 2008). Human activities or climate change may be responsible for changes in fire regime. With no palaeo-charcoal data available for Mfabeni yet, no direct evidence of increased fire activity during the late Holocene exists. In addition, the palaeoenvironmental evidence available suggests that the arid conditions during the late Holocene were regional in nature (Scott, 1999; Scott et al., 2003; Humphries et al., 2016; Neumann et al., 2010). Thus, any human activity was unlikely the primary cause of the late Holocene regional aridity and the large magnitude of environmental changes observed at Mfabeni.
Today El Niño–Southern Oscillation (ENSO) activity is one of the most important driving mechanisms for inter-annual climatic variability in South Africa. Southern Africa's seasonal rainfall is linked to ENSO, with dry (wet) conditions associated with El Niño (La Niña) events (Archer et al., 2017; Mason and Jury, 1997). Interannual variability in the strength and position of the SIOCZ is linked to ENSO variability (Cook, 2000). During La Niña years, the SIOCZ is located over the continent, resulting in wet conditions in eastern South Africa. During El Niño, the SIOCZ shifts north-eastward over the Indian Ocean and, as a consequence, dry conditions prevail in eastern South Africa (Lindesay, 1988; Cook, 2001; Hart et al., 2018). Furthermore, during El Niño events, a northward shift of the westerlies may occur, which could increase rainfall over western South Africa but lead to aridity in the east (i.e. at Mfabeni; Lindesay, 1988). Palaeoenvironmental studies in the Pacific Basin and South America indicate that during the early Holocene El Niño events were smaller and occurred less frequently, with a shift to stronger ENSO activity after ca. 5 cal ka BP (Fig. 5h, Moy et al., 2002; Huffman, 2010; Rodbell et al., 1999; Sandweiss et al., 1996). It is difficult to disentangle the possible potential drivers of climate variability during the last ca. 5 cal ka BP at Mfabeni. We therefore invoke a possible combination of northerly displaced westerlies, lower SSTs, and the impact of ENSO variability as potential climatic drivers during this time.
Compound-specific carbon and hydrogen isotope data and n-alkane distributions (Paq) from Mfabeni peat bog are used to reconstruct climatic conditions over the last 32 cal ka BP in eastern South Africa. The LGM at Mfabeni was characterized by a high contribution of C4 grasses, low precipitation amount/high ET, and a low water table. We attribute the arid LGM conditions to an equatorward displacement (and strengthening) of the Southern Hemisphere westerlies, the SIOCZ, and the subtropical high-pressure cell, which may have extended the length and increased the intensity of the dry season as well as shifted the location of TTT formation north-east of Mfabeni. These mechanisms for driving LGM climate in South Africa are consistent with an increase in Antarctic sea-ice extent. Between ca. 19 and 5 cal kyr BP an expansion of C3-type vegetation occurred, with more rainfall and a higher water table at Mfabeni. At ca. 19 cal ka BP, a southward retreat of the westerlies, the SIOCZ, and the subtropical high-pressure cell occurred, coincident with a retreat in Antarctic sea ice. This ice retreat combined with an increase in local summer insolation, after ca. 12 cal ka BP, may have resulted in more precipitation and an increased wet season length at Mfabeni. When the westerlies, the SIOCZ, and the subtropical high-pressure cell were in their southernmost position (ca. 14–5 cal kyr BP), local insolation became the dominant control on Mfabeni climate, leading to stronger convection and enhanced monsoonal precipitation from the tropical easterlies. The late Holocene (ca. <5 cal ka BP) was characterized by increased environmental instability and increasingly arid conditions. We attribute these trends to concurring low SSTs and the recurring influence of the southern westerlies and/or heightened ENSO activity.
The Mfabeni record indicates that climate and environmental variability in eastern South Africa over the last 32 cal ka BP were driven by a combination of (i) enhanced/reduced moisture transport by the tropical easterlies, driven by variations in Southern Hemisphere summer insolation, and (ii) latitudinal displacements (and the strengthening/weakening) of the westerlies, the SIOCZ, and the subtropical high-pressure cell. With the expansion and retreat of Antarctic sea ice ultimately responsible for the displacement of these systems, we invoke high-latitude climate forcing as an important driver of climate in eastern South Africa.
Supplementary data for the depth–age model (Sect. S1) are available with this paper. A new depth–age model of core MF1 (Finch and Hill, 2008), produced by Bacon, can be found within the Supplement (Sect. S2). Other data are available on PANGAEA.
The supplement related to this article is available online at: https://doi.org/10.5194/cp-15-1153-2019-supplement.
CM and ES conducted δ13Cwax and δDwax analyses. Interpretation was carried out by CM, JF, TH, FP, MH, MZ, and ES.
The authors declare that they have no conflict of interest.
We thank Ralph Kreutz for assistance with δ13Cwax and δDwax data acquisition.
This research has been supported by the Bundesministerium für Bildung und Forschung (BMBF; RAiN project, grant no. 03G0840A/B) and the NRF (grant no. 84431, Jemma Finch).
The article processing charges for this open-access publication were covered by the University of Bremen.
This paper was edited by Erin McClymont and reviewed by two anonymous referees.
Aichner, B., Herzschuh, U., and Wilkes, H.: Influence of aquatic macrophytes on the stable carbon isotopic signatures of sedimentary organic matter in lakes on the Tibetan Plateau, Org. Geochem., 41, 706–718, 2010.
Archer, E. R. M., Landman, W. A., Tadross, M. A., Malherbe, J., Weepener, H., Maluleke, P., and Marumbwa, F. M.: Understanding the evolution of the 2014–2016 summer rainfall seasons in southern Africa: Key lessons, Climate Risk Management, 16, 22–28, 2017.
Baker, A., Routh, J., Blaauw, M., and Roychoudhury, A. N.: Geochemical records of palaeoenvironmental controls on peat forming processes in the Mfabeni peatland, Kwazulu Natal, South Africa since the Late Pleistocene, Palaeogeogr. Palaeocl., 395, 95–106, 2014.
Baker, A., Routh, J., and Roychoudhury, A. N.: Biomarker records of palaeoenvironmental variations in subtropical Southern Africa since the late Pleistocene: Evidences from a coastal peatland, Pleistocene, Palaeogeogr. Palaeocl., 451, 1–12, 2016.
Baker, A., Pedentchouk, N., Routh, J., and Roychoudhury, A. N.: 2017. Climatic variability in Mfabeni peatlands (South Africa) since the late Pleistocene, Quaternary Sci. Rev., 160, 57–66, 2017.
Barker, P. A., Leng, M. J., Gasse, F., and Huang, Y.: Century-to-millennial scale climatic variability in Lake Malawi revealed by isotope records, Earth Planet. Sc. Lett., 261, 93–103, 2007.
Baxter, A.: Late Quaternary Palaeoenvironments of the Sandveld, Western Cape Province, South Africa, PhD, University of Cape Town, Cape Town, South Africa, 1996.
Baxter, A. J.: Pollen analysis of a Table Mountain cave deposit, University of Cape Town, Cape Town, 1989.
Beerling, D. J. and Osborne, C. P.: The origin of the savanna biome, Glob. Change Biol., 12, 2023–2031, 2006.
Bianchi, C. and Gersonde, R.: Climate evolution at the last deglaciation: the role of the Southern Ocean, Earth Planet. Sc. Lett., 228, 407–424, 2004.
Blaauw, M. and Christen, J. A.: Flexible paleoclimate age-depth models using an autoregressive gamma process, Bayesian Anal., 6, 457–474, 2011.
Black, C. C., Chen, T. M., and Brown, R. H.: Biochemical Basis for Plant Competition, Weed Sci., 17, 338–344, 1969.
Braconnot, P., Otto-Bliesner, B., Harrison, S., Joussaume, S., Peterchmitt, J.-Y., Abe-Ouchi, A., Crucifix, M., Driesschaert, E., Fichefet, Th., Hewitt, C. D., Kageyama, M., Kitoh, A., Laîné, A., Loutre, M.-F., Marti, O., Merkel, U., Ramstein, G., Valdes, P., Weber, S. L., Yu, Y., and Zhao, Y.: Results of PMIP2 coupled simulations of the Mid-Holocene and Last Glacial Maximum – Part 1: experiments and large-scale features, Clim. Past, 3, 261–277, https://doi.org/10.5194/cp-3-261-2007, 2007.
Bray, E. E. and Evans, E. D.: Distribution of n-paraffins as a clue to recognition of source beds, Geochim. Cosmochim. Ac., 22, 2–15, 1961.
Cappa, C. D., Hendricks, M. B., DePaolo, D. J., and Cohen, R. C.: Isotopic fractionation of water during evaporation, J. Geophys. Res.-Atmos., 108, 4525, https://doi.org/10.1029/2003JD003597, 2003.
Carr, A. S., Boom, A., Chase, B. M., Meadows, M. E., and Grimes, H. L.: Holocene sea level and environmental change on the west coast of South Africa: evidence from plant biomarkers, stable isotopes and pollen, J. Paleolimnol., 53, 415–432, 2015.
Chase, B. M. and Meadows, M. E.: Late Quaternary dynamics of southern Africa's winter rainfall zone, Earth-Sci. Rev., 84, 103–138, 2007.
Chase, B. M., Chevalier, M., Boom, A., and Carr, A. S.: The dynamic relationship between temperate and tropical circulation systems across South Africa since the last glacial maximum, Quaternary Sci. Rev., 174, 54–62, 2017.
Chevalier, M. and Chase, B. M.: Southeast African records reveal a coherent shift from high- to low-latitude forcing mechanisms along the east African margin across last glacial–interglacial transition, Quaternary Sci. Rev., 125, 117–130, 2015.
Chevalier, M. and Chase, B. M.: Determining the drivers of long-term aridity variability: a southern African case study, J. Quaternary Sci., 31, 143–151, 2016.
Chevalier, M., Brewer, S., and Chase, B. M.: Qualitative assessment of PMIP3 rainfall simulations across the eastern African monsoon domains during the mid-Holocene and the Last Glacial Maximum, Quaternary Sci. Rev., 156, 107–120, 2017.
Clark, P. U., Dyke, A. S., Shakun, J. D., Carlson, A. E., Clark, J., Wohlfarth, B., Mitrovica, J. X., Hostetler, S. W., and McCabe, A. M.: The Last Glacial Maximum, Sci. J., 325, 710–714, 2009.
Cockcroft, M. J., Wilkinson, M. J., and Tyson, P. D.: The application of a present-day climatic model to the late quaternary in southern Africa, Climatic Change, 10, 161–181, 1987.
Cohen, A. L. and Tyson, P. D.: Sea-surface temperature fluctuations during the Holocene off the south coast of Africa: implications for terrestrial climate and rainfall, Holocene, 5, 304–312, 1995.
Collins, J. A., Schefuß, E., Mulitza, S., Prange, M., Werner, M., Tharammal, T., Paul, A., and Wefer, G.: Estimating the hydrogen isotopic composition of past precipitation using leaf-waxes from western Africa, Quaternary Sci. Rev., 65, 88–101, 2013.
Collister, J. W., Rieley, G., Stern, B., Eglinton, G., and Fry, B.: Compound-specific δ13C analyses of leaf lipids from plants with differing carbon dioxide metabolisms, Org. Geochem., 21, 619–627, 1994.
Cook, K. H.: The South Indian Convergence Zone and Interannual Rainfall Variability over Southern Africa, J. Climate, 13, 3789–3804, 2000.
Cook, K. H.: A Southern Hemisphere Wave Response to ENSO with Implications for Southern Africa Precipitation, J. Atmos. Sci., 58, 2146–2162, 2001.
Craig, H.: Isotopic Variations in Meteoric Waters, Sci. J., 133, 1702–1703, 1961.
Dansgaard, W.: Stable isotopes in precipitation, Tellus, 16, 436–468, 1964.
Dedekind, Z., Engelbrecht, F. A., and van der Merwe, J.: Model simulations of rainfall over southern Africa and its eastern escarpment, Water SA, 42, 129–143, 2016.
Diefendorf, A. F. and Freimuth, E. J.: Extracting the most from terrestrial plant-derived n-alkyl lipids and their carbon isotopes from the sedimentary record: A review, Org. Geochem., 103, 1–21, 2017.
DiNezio, P. N., Tierney, J. E., Otto-Bliesner, B. L., Timmermann, A., Bhattacharya, T., Rosenbloom, N., and Brady, E.: Glacial changes in tropical climate amplified by the Indian Ocean, Sci. Adv., 4, 1–11, https://doi.org/10.1126/sciadv.aat9658, 2018.
Downes, R. W.: Differences in transpiration rates between tropical and temperate grasses under controlled conditions, Planta, 88, 261–273, 1969.
Dupont, L.: Orbital scale vegetation change in Africa, Quaternary Sci. Rev., 30, 3589–3602, 2011.
Dupont, L. M., Caley, T., Kim, J.-H., Castañeda, I., Malaizé, B., and Giraudeau, J.: Glacial-interglacial vegetation dynamics in South Eastern Africa coupled to sea surface temperature variations in the Western Indian Ocean, Clim. Past, 7, 1209–1224, https://doi.org/10.5194/cp-7-1209-2011, 2011.
Dyson, L. L. and Van Heerden, J.: A model for the identification of tropical weather systems over South Africa, Water SA, 28, 249–258, 2002.
Eglinton, G. and Hamilton, R. J.: Leaf Epicuticular Waxes, Sci. J., 156, 1322–1335, 1967.
Ficken, K. J., Li, B., Swain, D. L., and Eglinton, G.: An n-alkane proxy for the sedimentary input of submerged/floating freshwater aquatic macrophytes, Org. Geochem., 31, 745–749, 2000.
Ficken, K. J., Wooller, M. J., Swain, D. L., Street-Perrott, F. A., and Eglinton, G.: Reconstruction of a subalpine grass-dominated ecosystem, Lake Rutundu, Mount Kenya: a novel multi-proxy approach, Palaeogeogr. Palaeocl., 177, 137–149, 2002.
Finch, J. M. and Hill, T. R.: A late Quaternary pollen sequence from Mfabeni Peatland, South Africa: Reconstructing forest history in Maputaland, Quaternary Res., 70, 442–450, 2008.
Fischer, H., Fundel, F., Ruth, U., Twarloh, B., Wegner, A., Udisti, R., Becagli, S., Castellano, E., Morganti, A., Severi, M., Wolff, E., Littot, G., Röthlisberger, R., Mulvaney, R., Hutterli, M. A., Kaufmann, P., Federer, U., Lambert, F., Bigler, M., Hansson, M., Jonsell, U., de Angelis, M., Boutron, C., Siggaard-Andersen, M.-L., Steffensen, J. P., Barbante, C., Gaspari, V., Gabrielli, P., and Wagenbach, D.: Reconstruction of millennial changes in dust emission, transport and regional sea ice coverage using the deep EPICA ice cores from the Atlantic and Indian Ocean sector of Antarctica, Earth Planet. Sc. Lett., 260, 340–354, 2007.
Gasse, F., Chalié, F., Vincens, A., Williams, M. A. J., and Williamson, D.: Climatic patterns in equatorial and southern Africa from 30,000 to 10,000 years ago reconstructed from terrestrial and near-shore proxy data, Quaternary Sci. Rev., 27, 2316–2340, 2008.
Gat, J. R., Mook, W. G., and Meijer, H. A.: Environmental isotopes in the hydrological cycle, Water Resources Programme, 2001.
Gimeno, L., Drumond, A., Nieto, R., Trigo, R. M., and Stohl, A.: On the origin of continental precipitation, Geophys. Res. Lett., 37, L13804, https://doi.org/10.1029/2010GL043712, 2010.
Grab, S. W. and Simpson, A. J.: Climatic and environmental impacts of cold fronts over KwaZulu-Natal and the adjacent interior of southern Africa South Afr. J. Sci., 96, 602–608, 2000.
Grundling, P., Grootjans, A. P., Price, J. S., and Ellery, W. N.: Development and persistence of an African mire: How the oldest South African fen has survived in a marginal climate, Catena, 110, 176–183, 2013.
Grundling, P., Clulow, A. D., Price, J. S., and Everson, C. S.: Quantifying the water balance of Mfabeni Mire (iSimangaliso Wetland Park, South Africa) to understand its importance, functioning and vulnerability, Mires Peat, 16, 1–18, 2015.
Hart, N. C. G., Washington, R., and Reason, C. J. C.: On the Likelihood of Tropical–Extratropical Cloud Bands in the South Indian Convergence Zone during ENSO Events, J. Climate, 31, 2797–2817, 2018.
Helliker, B. R. and Ehleringer, J. R.: Establishing a grassland signature in veins: 18O in the leaf water of C3 and C4 grasses, P. Natl. Acad. Sci. USA, 97, 7894–7898, 2000.
Hogg, A. G., Hua, Q., Blackwell, P. G., Niu, M., Buck, C. E., Guilderson, T. P., Heaton, T. J., Palmer, J. G., Reimer, P. J., Reimer, R. W., Turney, C. S. M., and Zimmerman, S. R. H.: SHCal13 Southern Hemisphere Calibration, 0–50,000 Years cal BP, Radiocarbon, 55, 1889–1903, 2016.
Holmgren, K., Lee-Thorp, J. A., Cooper, G. R. J., Lundblad, K., Partridge, T. C., Scott, L., Sithaldeen, R., Siep Talma, A., and Tyson, P. D.: Persistent millennial-scale climatic variability over the past 25,000 years in Southern Africa, Quaternary Sci. Rev., 22, 2311–2326, 2003.
Hua, Q., Barbetti, M., and Rakowski, A. Z.: Atmospheric Radiocarbon for the Period 1950–2010, Radiocarbon, 55, 2059–2072, 2016.
Hudson, D. A. and Hewitson, B. C.: The atmospheric response to a reduction in summer Antarctic sea-ice extent, Clim. Res., 16, 79–99, 2001.
Huffman, T. N.: Intensive El Niño and the Iron Age of South-eastern Africa, J. Archaeol. Sci., 37, 2572–2586, 2010.
Humphries, M. S., Green, A. N., and Finch, J. M.: Evidence of El Niño driven desiccation cycles in a shallow estuarine lake: The evolution and fate of Africa's largest estuarine system, Lake St Lucia, Global Planet. Change, 147, 97–105, 2016.
Humphries, M. S., Benitez-Nelson, C. R., Bizimis, M., and Finch, J. M.: An aeolian sediment reconstruction of regional wind intensity and links to larger scale climate variability since the last deglaciation from the east coast of southern Africa, Global Planet. Change, 156, 59–67, 2017.
IPCC: Climate Change 2013: The Physical Science Basis. Contribution of Working Group I of the Fifth Assessment Report of the Intergovernmental Panel on Climate Change, Cambridge University Press, 2013.
Kahmen, A., Schefuß, E., and Sachse, D.: Leaf water deuterium enrichment shapes leaf wax n-alkane δD values of angiosperm plants I: Experimental evidence and mechanistic insights, Geochim. Cosmochim. Ac., 111, 39–49, 2013.
Lamy, F., Hebbeln, D., Röhl, U., and Wefer, G.: Holocene rainfall variability in southern Chile: a marine record of latitudinal shifts of the Southern Westerlies, Earth Planet. Sc. Lett., 185, 369–382, 2001.
Lamy, F., Kilian, R., Arz, H. W., Francois, J.-P., Kaiser, J., Prange, M., and Steinke, T.: Holocene changes in the position and intensity of the southern westerly wind belt, Nat. Geosci., 3, 695–699, 2010.
Laskar, J., Fienga, A., Gastineau, M., and Manche, H.: La2010: a new orbital solution for the long-term motion, Astron. Astrophys., 532, 1–15, https://doi.org/10.1051/0004-6361/201116836, 2011.
Lindesay, J. A.: South African rainfall, the Southern Oscillation and a Southern Hemisphere semi-annual cycle, J. Climatol., 8, 17–30, 1988.
Macron, C., Pohl, B., Richard, Y., and Bessafi, M.: How do Tropical Temperate Troughs Form and Develop over Southern Africa?, J. Climate, 27, 1633–1647, 2014.
Mason, S. J. and Jury, M. R.: Climatic variability and change over southern Africa: a reflection on underlying processes, Prog. Phys. Geogr., 21, 23–50, 1997.
Meadows, M. E. and Baxter, A. J.: Holocene vegetation history and palaeoenvironments at Klaarfontein Springs, Western Cape, South Africa, Holocene, 11, 699–706, 2001.
Meadows, M. E. and Sugden, J. M.: The late quaternary palaeoecology of a floristic kingdom: the southwestern Cape South Africa, Palaeogeogr. Palaeocl., 101, 271–281, 1993.
Monteith, J. L.: Reassessment of Maximum Growth Rates for C3 and C4 Crops, Exp. Agr., 14, 1–5, 1978.
Moy, C. M., Seltzer, G. O., Rodbell, D. T., and Anderson, D. M.: Variability of El Nino/Southern Oscillation activity at millenial timescales during the Holocene epoch, Nature, 420, 162–165, 2002.
Munday, C. and Washington, R.: Circulation controls on southern African precipitation in coupled models: The role of the Angola Low, J. Geophys. Res.-Atmos., 122, 861–877, 2017.
Neumann, F. H., Scott, L., Bousman, C. B., and van As, L.: A Holocene sequence of vegetation change at Lake Eteza, coastal KwaZulu-Natal, South Africa, Rev. Palaeobot. Palyno., 162, 39–53, 2010.
Nicholson, S. E.: The intensity, location and structure of the tropical rainbelt over west Africa as factors in interannual variability, Int. J. Climatol., 28, 1775–1785, 2008.
Nicholson, S. E. and Flohn, H.: African environmental and climatic changes and the general atmospheric circulation in late pleistocene and holocene, Climatic Change, 2, 313–348, 1980.
Nkoana, R., Engelbrecht, F. A., and Marean, C. W.: Last Glacial Maximum simulations over southern Africa using a variable-resolution global model: synoptic-scale verification, 31st Conference of the South African Society for Atmospheric Science, Hennops River Valley, South Africa, 2015.
Osborne, C. P. and Sack, L.: Evolution of C4 plants: a new hypothesis for an interaction of CO2 and water relations mediated by plant hydraulics, Philos. T. R. Soc. B, 367, 583–600, 2012
Otto-Bliesner, B. L., Brady, E. C., Clauzet, G., Tomas, R., Levis, S., and Kothavala, Z.: Last Glacial Maximum and Holocene Climate in CCSM3, J. Climate, 19, 2526–2544, 2006.
Otto-Bliesner, B. L., Russell, J. M., Clark, P. U., Liu, Z., Overpeck, J. T., Konecky, B., deMenocal, P., Nicholson, S. E., He, F., and Lu, Z.: Coherent changes of southeastern equatorial and northern African rainfall during the last deglaciation, Science, 346, 1223–1227, 2014.
Partridge, T. C., Demenocal, P. B., Lorentz, S. A., Paiker, M. J., Vogel, J. C.: Orbital forcing of climate over South Africa: A 200,000-year rainfall record from the pretoria saltpan, Quaternary Sci. Rev., 16, 1125–1133, 1997.
Pinto, H., Sharwood, R. E., Tissue, D. T., and Ghannoum, O.: Photosynthesis of C3, C3–C4, and C4 grasses at glacial CO2, J. Exp. Bot., 65, 3669–3681, 2014.
Rácz, Z. and Smith, R. K.: The dynamics of heat lows, Q. J. Roy. Meteor. Soc., 125, 225–252, 1999.
Reason, C. J. C. and Mulenga, H.: Relationships between South African rainfall and SST anomalies in the Southwest Indian Ocean, Int. J. Climatol., 19, 1651–1673, 1999.
Risi, C., Bony, S., and Vimeux, F.: Influence of convective processes on the isotopic composition (δ18O and δD) of precipitation and water vapor in the tropics: 2. Physical interpretation of the amount effect, J. Geophys. Res.-Atmos., 113, D19306, https://doi.org/10.1029/2008JD009943, 2008.
Rodbell, D. T., Seltzer, G. O., Anderson, D. M., Abbott, M. B., Enfield, D. B., and Newman, J. H.: A ∼ 15,000-Year Record of El Niño-Driven Alluviation in Southwestern Ecuador, Sci. J., 283, 516–520, 1999.
Rojas, M., Moreno, P., Kageyama, M., Crucifix, M., Hewitt, C., Abe-Ouchi, A., Ohgaito, R., Brady, E. C., and Hope, P.: The Southern Westerlies during the last glacial maximum in PMIP2 simulations, Clim. Dynam., 32, 525–548, 2009.
Sachse, D., Billault, I., Bowen, G. J., Chikaraishi, Y., Dawson, T. E., Feakins, S. J., Freeman, K. H., Magill, C. R., McInerney, F. A., van der Meer, M. T. J., Polissar, P., Robins, R. J., Sachs, J. P., Schmidt, H.-L., Sessions, A. L., White, J. W. C., West, J. B., and Kahmen, A.: Molecular Paleohydrology: Interpreting the Hydrogen-Isotopic Composition of Lipid Biomarkers from Photosynthesizing Organisms, Annu. Rev. Earth Pl. Sc., 40, 221–249, 2012.
Sage, R. F.: The evolution of C4 photosynthesis, New Phytol., 161, 341–370, 2004.
Sage, R. F., Wedin, D. A., and Li, M.: The Biogeography of C4 Photosynthesis: Patterns and Controlling Factors, in: C4 Plant Biology, edited by: Sage, R. F. and Monson, R. K., Academic Press, San Diego, 1999.
Sandweiss, D. H., Richardson, J. B., Reitz, E. J., Rollins, H. B., and Maasch, K. A.: Geoarchaeological Evidence from Peru for a 5000 Years B.P, Onset of El Niño, Sci. J., 273, 1531–1533, 1996.
Schefuß, E., Schouten, S., and Schneider, R. R.: Climatic controls on central African hydrology during the past 20,000 years, Nature, 437, 1003–1006, 2005.
Schefuß, E., Kuhlmann, H., Mollenhauer, G., Prange, M., and Pätzold, J.: Forcing of wet phases in southeast Africa over the past 17,000 years, Nature, 480, 509, https://doi.org/10.1038/nature10685, 2011.
Schmidt, F., Oberhänsli, H., and Wilkes, H.: Biocoenosis response to hydrological variability in Southern Africa during the last 84 ka BP: A study of lipid biomarkers and compound-specific stable carbon and hydrogen isotopes from the hypersaline Lake Tswaing, Global Planet. Change, 112, 92–104, 2014.
Scott, L.: Palynology of late Pleistocene hyrax middens, southwestern Cape Province, South Africa: A preliminary report, Hist. Biol., 9, 71–81, 1994.
Scott, L.: Vegetation history and climate in the Savanna biome South Africa since 190,000 ka: a comparison of pollen data from the Tswaing Crater (the Pretoria Saltpan) and Wonderkrater, Quaternary Int., 57–58, 215–223, 1999.
Scott, L.: Fluctuations of vegetation and climate over the last 75 000 years in the Savanna Biome, South Africa: Tswaing Crater and Wonderkrater pollen sequences reviewed, Quaternary Sci. Rev., 145, 117–133, 2016.
Scott, L., Holmgren, K., Talma, A. S., Woodborne, S., and Vogel, J. C.: Age interpretation of the Wonderkrater spring sediments and vegetation change in the Savanna Biome, Limpopo province, South Africa: research letter, S. Afr. J. Sci., 99, 484–488, 2003.
Scott, L., Neumann, F. H., Brook, G. A., Bousman, C. B., Norström, E., and Metwally, A. A.: Terrestrial fossil-pollen evidence of climate change during the last 26 thousand years in Southern Africa, Quaternary Sci. Rev., 32, 100–118, 2012.
Simon, M. H., Ziegler, M., Bosmans, J., Barker, S., Reason, C. J. C., and Hall, I. R.: Eastern South African hydroclimate over the past 270,000 years, Nature, 5, 18153, https://doi.org/10.1038/srep18153, 2015.
Sonzogni, C., Bard, E., and Rostek, F.: Tropical sea-surface temperatures during the Last Glacial Period: A view based on alkenones in Indian Ocean sediments, Quaternary Sci. Rev., 17, 1185–1201, 1998.
Sprenger, M., Tetzlaff, D., and Soulsby, C.: Soil water stable isotopes reveal evaporation dynamics at the soil–plant–atmosphere interface of the critical zone, Hydrol. Earth Syst. Sci., 21, 3839–3858, https://doi.org/10.5194/hess-21-3839-2017, 2017.
Stock, W. D., Chuba, D. K., and Verboom, G. A.: Distribution of South African C3 and C4 species of Cyperaceae in relation to climate and phylogeny, Austral Ecol., 29, 313–319, 2004.
Stone, A. E. C.: Last Glacial Maximum conditions in southern Africa, Prog. Phys. Geog., 38, 519–542, 2014.
Stuut, J.-B. W. and Lamy, F.: Climate variability at the southern boundaries of the Namib (southwestern Africa) and Atacama (northern Chile) coastal deserts during the last 120,000 yr, Quaternary Res., 62, 301–309, 2004.
Stuut, J.-B. W., Crosta, X., van der Borg, K., and Schneider, R.: Relationship between Antarctic sea ice and southwest African climate during the late Quaternary, Geology, 32, 909–912, 2004.
Taylor, R., Kelbe, B., Haldorsen, S., Botha, G. A., Wejden, B., Været, L., and Simonsen, M. B.: Groundwater-dependent ecology of the shoreline of the subtropical Lake St Lucia estuary, Environ. Geol., 49, 586–600, 2006.
Tierney, J. E., Russell, J. M., Huang, Y., Sinninghe Damste, J. S., Hopmans, E. C., and Cohen, A. S.: Northern hemisphere controls on tropical southeast African climate during the past 60,000 years, Sci. J., 322, 252–255, 2008.
Tipple, B. J., Meyers, S. R., and Pagani, M.: Carbon isotope ratio of Cenozoic CO2: A comparative evaluation of available geochemical proxies, Paleoceanography, 25, 1–11, 2010.
Todd, M. and Washington, R.: Circulation anomalies associated with tropical-temperate troughs in southern Africa and the south west Indian Ocean, Clim. Dynam., 15, 937–951, 1999.
Toggweiler, J. R., Russell, J. L., and Carson, S. R.: Midlatitude westerlies, atmospheric CO2, and climate change during the ice ages, Paleoceanography, 21, 1–15, 2006.
Tyson, P. D.: Climatic Change and Variability in Southern Africa, Oxford University Press, Cape Town, 1986.
Tyson, P. D.: Atmospheric circulation changes and palaeoclimates of southern Africa, S. Afr. J. Sci., 95, 194–201, 1999.
Tyson, P. D. and Preston-Whyte, R. A.: The Weather and Climate of Southern Africa, Oxford University Press, Southern Africa, Cape Town, 2000.
van Zinderen Bakker, E. M.: The evolution of Late Quaternary palaeoclimates of southern Africa, Palaeoeco. A., 9, 160–202, 1976.
Venter, C. E.: The Vegetation Ecology of Mfabeni Peat Swamp, St Lucia, KwaZulu-Natal, University of Pretoria, Pretoria, 2003.
Vigaud, N., Richard, Y., Rouault, M., and Fauchereau, N.: Moisture transport between the South Atlantic Ocean and southern Africa: relationships with summer rainfall and associated dynamics, Clim. Dynam., 32, 113–123, 2009.
Vogel, J. C., Fuls, A., and Ellis, R. P.: The geographical distribution of kranz grasses in south africa, S. Afr. J. Sci., 74, 209–215, 1978.
Vogts, A., Badewien, T., Rullkötter, J., and Schefuß, E.: Near-constant apparent hydrogen isotope fractionation between leaf wax n-alkanes and precipitation in tropical regions: Evidence from a marine sediment transect off SW Africa, Org. Geochem., 96, 18–27, 2016.
Waelbroeck, C., Labeyrie, L., Michel, E., Duplessy, J. C., McManus, J. F., Lambeck, K., Balbon, E., and Labracherie, M.: Sea-level and deep water temperature changes derived from benthic foraminifera isotopic records, Quaternary Sci. Rev., 21, 295–305, 2002.
Walker, N. D.: Links between South African summer rainfall and temperature variability of the Agulhas and Benguela Current systems, J. Geophys. Res.-Occeans., 95, 3297–3319, 1990.
World Weather Online: available at: https://www.worldweatheronline.com/saint-lucia-estuary-weather-averages/kwazulu-natal/za.aspx, last access: 9 May 2018.
Wündsch, M., Haberzettl, T., Cawthra, H. C., Kirsten, K. L., Quick, L. J., Zabel, M., Frenzel, P., Hahn, A., Baade, J., Daut, G., Kasper, T., Meadows, M. E., and Mäusbacher, R.: Holocene environmental change along the southern Cape coast of South Africa – Insights from the Eilandvlei sediment record spanning the last 8.9 kyr, Global Planet. Change, 163, 51–66, 2018.