the Creative Commons Attribution 4.0 License.
the Creative Commons Attribution 4.0 License.
 | 10 Jan 2018
Temperature and mineral dust variability recorded in two low-accumulation Alpine ice cores over the last millennium
Pascal Bohleber
Tobias Erhardt
Nicole Spaulding
Helene Hoffmann
Hubertus Fischer
Paul Mayewski
Among ice core drilling sites in the European Alps, Colle Gnifetti (CG) is the only non-temperate glacier to offer climate records dating back at least 1000 years. This unique long-term archive is the result of an exceptionally low net accumulation driven by wind erosion and rapid annual layer thinning. However, the full exploitation of the CG time series has been hampered by considerable dating uncertainties and the seasonal summer bias in snow preservation. Using a new core drilled in 2013 we extend annual layer counting, for the first time at CG, over the last 1000 years and add additional constraints to the resulting age scale from radiocarbon dating. Based on this improved age scale, and using a multi-core approach with a neighbouring ice core, we explore the time series of stable water isotopes and the mineral dust proxies Ca2+ and insoluble particles. Also in our latest ice core we face the already known limitation to the quantitative use of the stable isotope variability based on a high and potentially non-stationary isotope/temperature sensitivity at CG. Decadal trends in Ca2+ reveal substantial agreement with instrumental temperature and are explored here as a potential site-specific supplement to the isotope-based temperature reconstruction. The observed coupling between temperature and Ca2+ trends likely results from snow preservation effects and the advection of dust-rich air masses coinciding with warm temperatures. We find that if calibrated against instrumental data, the Ca2+-based temperature reconstruction is in robust agreement with the latest proxy-based summer temperature reconstruction, including a “Little Ice Age” cold period as well as a medieval climate anomaly. Part of the medieval climate period around AD 1100–1200 clearly stands out through an increased occurrence of dust events, potentially resulting from a relative increase in meridional flow and/or dry conditions over the Mediterranean.
- Article
(6128 KB) - Full-text XML
-
Supplement
(406 KB) - BibTeX
- EndNote


Glaciers and ice caps of high mountain ranges can provide climate records of mid- and low latitudes complementary to polar ice cores. In comparison to their polar counterparts, mountain drilling sites are characterized by a comparatively small-scale glacier geometry and their proximity to continental source areas. As a consequence, cold mountain glaciers are an especially worthwhile target for ice core studies focusing on Holocene climate, e.g. in view of the envisaged IPICS 2k array (Brook et al., 2006) and the present under-representation of ice core records contributing to the PAGES 2k network (Ahmed et al., 2013). In the European Alps, ice core studies have been performed at Col du Dôme, Mont Blanc (Preunkert et al., 2000); Fiescherhorn, Bernese Alps (Schwerzmann et al., 2006); and Ortles, Eastern Alps (Gabrielli et al., 2016), as well as at Colle Gnifetti and Colle del Lys in the Monte Rosa region (e.g. Wagenbach et al., 2012, and references therein). Among these glaciers, Colle Gnifetti (CG) – in spite of its limited glacier depth – stands out as the only non-temperate site where net snow accumulation is low enough to provide records over the last millennium and potentially beyond at a reasonable time resolution. The exceptionally low net accumulation at CG is a result of seasonal net snow loss by wind erosion: since snow consolidation is most effective during the summer half year, winter precipitation is more likely to be removed from the surface (Wagenbach, 1992). This has far-reaching consequences with respect to the interpretation of the CG ice cores, hampering to date the full exploitation of their unique long climate time series. On the one hand, considerable uncertainty in the individual ice core chronologies becomes an obstacle already after a few hundred years. Difficulties in deploying annual layer counting as the main dating tool arise from snow scouring, rapid layer thinning associated with strongly non-linear time–depth relationships and the extremely low time resolution achieved in the bottom part of the glacier by conventional centimetre-resolution analyses. As a consequence, dating the deeper part of CG ice cores is commonly based on simple extrapolation combined with constraints from radiocarbon analysis (e.g. Jenk et al., 2009). On the other hand, irregular and summer-biased snow deposition makes the annual or long-term levels of ice core proxy signals with a prominent seasonal cycle a primary function of the relative winter snow fraction preserved, as opposed to their common climatological meaning. In addition, net snow accumulation is characterized by substantial spatial and temporal variability, leading to considerable influence of upstream flow effects and depositional noise (Wagenbach, 1992). In contrast to the strong signals of anthropogenic aerosol increase, depositional noise especially challenges the detection of the comparatively weak stable water isotope trends (δ18O and δD). Under these circumstances, the comparison of multiple cores drilled at the same site can be used to identify an atmospheric signal as shared variability among the cores (Wagenbach et al., 2012; Bohleber et al., 2013).
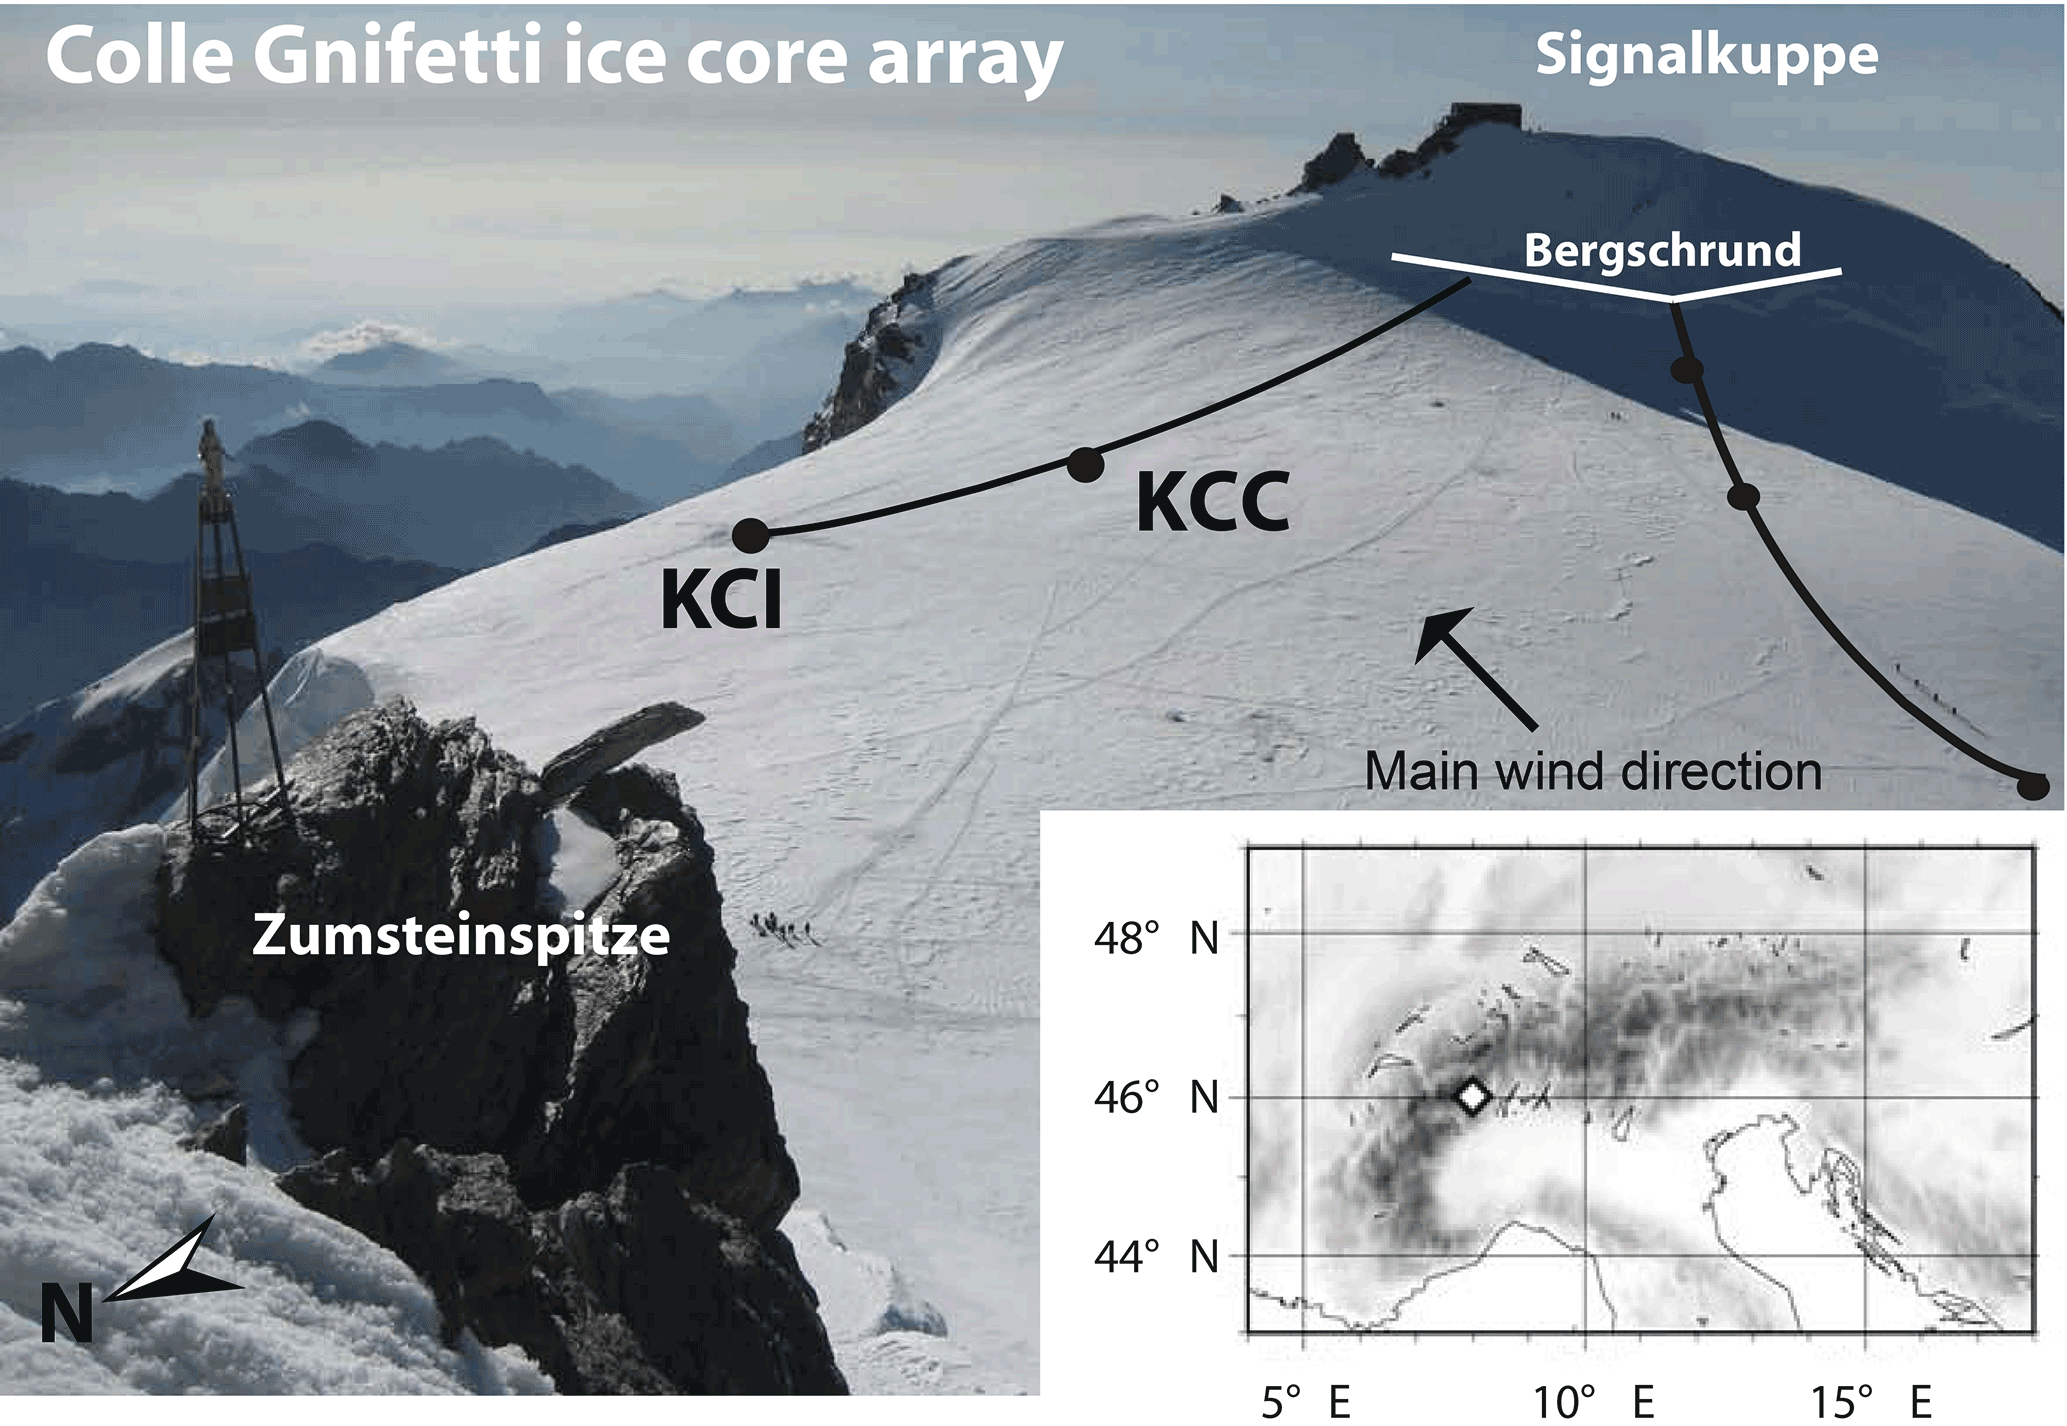
Figure 1The ice core array at Colle Gnifetti, at 4450 m a.s.l. in the Monte Rosa summit range. The drilling sites of the two cores KCI and KCC are located on approximately the same flow line (black line) towards the eastern flank (downwind of the main wind direction), hence providing the same upstream catchment area. Locations of previous drillings initiated by the Institute of Environmental Physics are also shown as small black dots for reference.
Here we present new results to tackle the twofold challenge above with a new core drilled at Colle Gnifetti in 2013, integrating datasets from an additional ice core drilled in 2005 on the same flow line. In order to obtain a reliable long-term chronology for the 2013 core, we utilize state-of-the-art continuous flow analysis for ice core impurity profiling and, to identify even highly thinned annual layers, laser ablation inductively coupled plasma mass spectrometry (LA-ICP-MS) at sub-millimetre depth resolution (Mayewski et al., 2014; Haines et al., 2016; Della Lunga et al., 2017; More et al., 2017). We combine annual layer counting in the resulting impurity profiles with absolute age constraints from radiocarbon analysis, taking advantage of recent progress in applying this technique to mountain ice cores (Uglietti et al., 2016; Hoffmann et al., 2017b). Based on a refined long-term chronology, the time series of stable water isotopes and mineral dust proxies (Ca2+ and insoluble particles) are investigated, with special emphasis on their relation to temperature.
Details on the glaciological features of CG are described thoroughly in the literature – e.g. Haeberli et al. (1988), Lüthi and Funk (2000) and Konrad et al. (2013) for geometry and glacier flow, Haeberli and Funk (1991) and Hoelzle et al. (2011) for englacial temperature, and Alean et al. (1983) for surface accumulation. Here, we present only a brief overview, mainly dedicated to explaining the role of snow deposition in relation to recording atmospheric temperature and mineral dust variability in the CG ice cores.
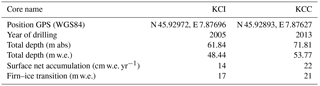
Table 1Basic glaciological parameters of the two CG ice cores.
With a horizontal scale of 400 m and a maximum ice thickness of around 140 m, the CG site forms a small firn saddle at around 4500 m a.s.l. between two summits of the Monte Rosa massif. The orientation of the convex, central saddle axis coincides with the main westerly wind direction, thereby making the downwind-situated ice cliff a perfect sink for drifting snow (Fig. 1). Hence, a substantial fraction of the annual fresh snow precipitation is removed at CG, which limits linking the net snow accumulation rate to the climatologic precipitation rate. The net snow accumulation rate ranges from 0.15 m water equivalent (w.e.) per year in the north-facing flank to about 1.2 m w.e. per year in the southern one, where the higher abundance of ice layers and ice crusts significantly reduces the snow erosion rate (Alean et al., 1983). Within the CG north flank (comprising our CG ice core array) fresh snow consolidation is faster during the summer half-year (additionally supported by refreezing surface melt). Accordingly, the mean net snow accumulation is mainly made up by precipitation of the warm seasons, which entails a systematic over-representation of the summer half-year in chemical and isotopic signatures (Wagenbach, 1989). A changing amount of preserved winter precipitation affects annual mean values of all signals with a distinct seasonality (including δ18O and most impurities), and may introduce a coupling on the inter-annual scale (Wagenbach, 1992). Notably this also includes a potential link to temperature, since warm summers feature increased vertical mixing and hence a higher atmospheric impurity load. In addition, faster fresh snow consolidation favoured by higher temperatures may lead to an increased relative amount of impurity-rich summer snow deposition.
A long-term co-variation between δ18O and Ca2+ suggesting a possible relationship between climate and dust deposition at CG has already been noted but was left for future investigation (Wagenbach and Geis, 1989; Wagenbach et al., 1996). A later study specifically explored the link between the δ18O signal and air temperature changes in the presence of the snow preservation influence at CG. A dominant influence of atmospheric temperature on decadal isotope variability shared among the CG cores was found, although a high and potentially non-stationary isotope/temperature sensitivity hampered the quantitative use of the CG isotope variability (Bohleber et al., 2013). Considering the co-variation of the long-term variability of (i) Ca2+ and δ18O, and (ii) δ18O and temperature, suggests that atmospheric temperature variability could also be reflected in the Ca2+ trends. In view of the shortcomings in quantitatively using the isotope-thermometer at CG, identifying a temperature-related imprint in the Ca2+ variability could provide a valuable supplement in this respect.
At CG, mineral background aerosol levels are generally low, meaning that the Ca2+ record is dominated by episodic inputs of dust, most likely originating in the Saharan desert (Wagenbach et al., 1996). While dry deposition may add to the average mineral dust content (Haeberli et al., 1983), it appears less important in the case of Saharan dust events (Schwikowski et al., 1995). In addition, only a marginal contribution to changes in the particle size distribution is expected from changes in the dry deposition (Ruth et al., 2003). As for most of the impurity species at CG, the seasonal contrast in Ca2+ concentration is primarily connected to the seasonal gradient in vertical atmospheric mixing, with an additional component from sporadic Saharan dust inputs (Preunkert and Wagenbach, 1998; Preunkert et al., 2000). Saharan dust deposition events are a frequent phenomenon in the Alps, with main occurrence in spring and summer (Prodi and Fea, 1979). A single deposition event typically lasts less than a few days (Schwikowski et al., 1995; Sodemann et al., 2006). The associated warm air temperature and the substantially lowered snow albedo both support surface snow consolidation and partly protect the dust layer from wind erosion (Haeberli et al., 1983). Intensive Saharan dust events of the summer half-year, associated with directly northward transport of air masses, are most likely to become preserved at CG. Saharan dust layers in CG ice cores can be characterized by high concentrations of insoluble particles, SO and Ca2+ coinciding with buffered low acidity, as well as to some extent by increased δ18O and deuterium excess values (Wagenbach and Geis, 1989; Wagenbach et al., 1996). Accordingly, the combination of Ca2+ with an alkalinity measurement is a tool to identify Saharan dust influenced layers in CG ice cores (Wagenbach et al., 1996), which will be employed in the following.
The above considerations warrant a general distinction and separate evaluation of the following two features of the Ca2+ record of the CG ice cores: (i) the long-term average Ca2+ concentration, and its potential coupling with δ18O and temperature via snow preservation, and (ii) spikes in Ca2+, typically 2 orders of magnitude above background, which are dominated by Saharan dust input (Wagenbach et al., 1996). Regarding (ii), changes in the dust peak occurrence rate can originate from changes in the meridional versus zonal circulation and/or in the desert dust source strength. Here detecting the frequency of dust peaks in the ice core matters, which is expected to be comparatively more robust against snow preservation influence.
The two cores used in this study, denoted as KCI and KCC, were drilled in 2005 and 2013, respectively. Both cores were drilled roughly on the same flow line, making them the natural choice for our inter-core comparison, i.e. as opposed to using previously deep cores drilled on another flow line (Fig. 1). Table 1 summarizes the basic glaciological parameters of the two cores. The depth sections used in this study were chosen to comprise roughly the last 1000 years – i.e. the upper 44 m w.e. (corresponding to 81 % relative depth) and 35 m w.e. (73 % relative depth) of KCC and KCI, respectively. Table 2 provides an overview of the carefully co-registered datasets used in this study. The various methods of analysis are discussed briefly in the following.
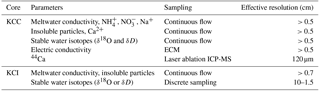
Table 2Overview on ice core analyses and datasets used in this study.
3.1 Impurity profiles from continuous flow analysis
Continuous flow analysis (CFA) of the KCC core was performed with the setup at the Division for Climate and Environmental Physics, Physics Institute, at the University of Bern. Analyses performed on the meltwater flow included meltwater conductivity, insoluble particle concentration and size distribution as well as selected ion species (Ca2+, NH, NO, Na+; see Table 2). In addition, stable water isotopes were analysed using a Picarro instrument coupled directly to the meltwater flow. The size distribution of insoluble particles recorded by the optical particle sensor was used to derive a profile of the “coarse particle percentage” (CPP). The CPP was calculated based on particle volume, and represents the percentage of particles exceeding a threshold of 4.0 µm. The threshold was chosen such that it corresponds to the expected median particle diameter of Saharan dust particles at CG, which was shown to be distinguishable from background sources (Wagenbach and Geis, 1989). Deviations from a CPP of 50 % indicate higher or lower contribution of large and small particles respectively. The melt rate was adjusted to provide the necessary amount of water for all analyses, resulting in an effective depth resolution ranging from 1.2 cm at the very top of the core to about 0.5 cm for all depth below approximately 25 m w.e. Electrical conductivity measurements (ECM) performed at the Institute of Environmental Physics, Heidelberg University, were used primarily to obtain a qualitative record of the acidity of the ice in connection to the detection of Saharan dust events.
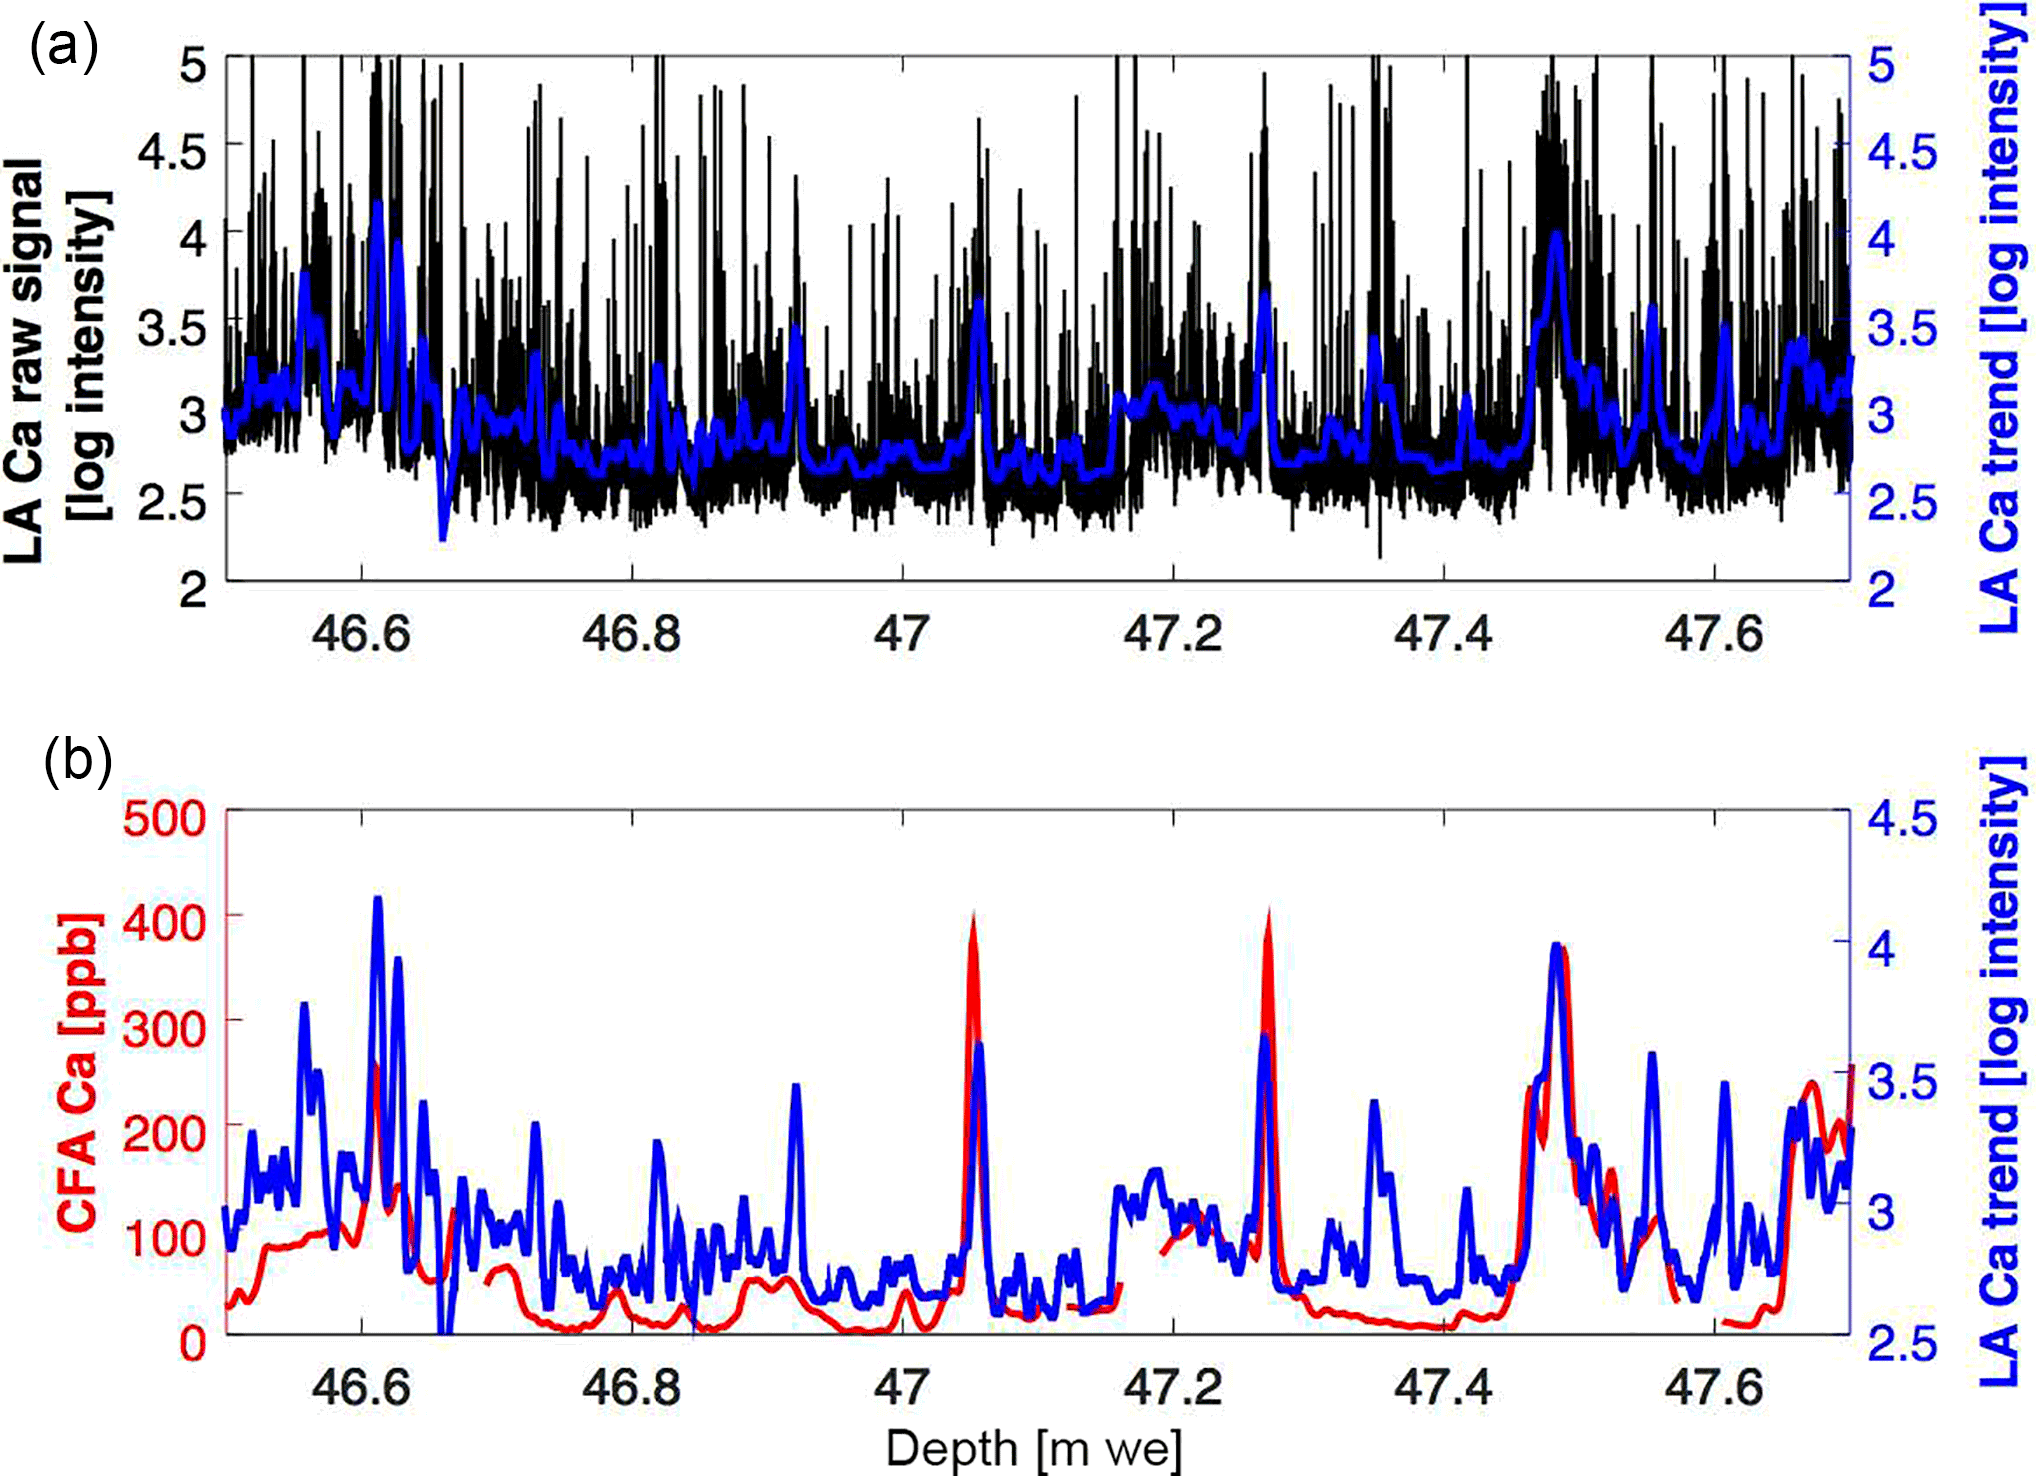
Figure 2Ca signals obtained from the KCC ice core at around 65 % relative depth using LA-ICP-MS and CFA in direct comparison after careful alignment of the two depth scales. (a) Raw (black) and filtered LA-ICP-MS Ca signal (blue). (b) CFA Ca (red) vs. filtered LA-ICP-MS Ca signal (blue). Note (i) the additional peaks and high-frequency information revealed by LA-ICP-MS, (ii) a general agreement of CFA and low-frequency LA-ICP-MS components consistently observed over core parts measured by LA-ICP-MS. LA-ICP-MS intensity is reported as counts per second.
The KCI core was analysed using the reduced CFA setup at the Institute of Environmental Physics, Heidelberg University. Meltwater conductivity and insoluble particle concentration were measured by CFA at about 0.7 cm effective resolution. Continuous sub-sampling of the core for stable water isotope analyses was conducted at a depth resolution typically ranging between 5 and 10 cm. Due to the relatively high firn temperature at CG, isotope smoothing is much faster compared to polar sites with similar annual layer thickness. Hence re-sampling most of KCI even at 1.5 cm depth resolution did not significantly restore any high-frequency isotope variability (Bohleber et al., 2013).
3.2 Ultra-high-resolution Ca-profile of the KCC core by laser ablation ICP-MS
Laser ablation inductively coupled plasma mass spectrometry (LA-ICP-MS) was conducted in the WM Keck Laser Ice Facility at the Climate Change Institute (University of Maine) and used to analyse 44Ca at ultra-high depth resolution (better than 120 µm). The more abundant 40Ca is blocked by mass interference from 40Ar used as carrier gas. Details regarding the method, sample preparation and calibration routine can be found in Spaulding et al. (2017) and Sneed et al. (2015). Briefly, the components of this system include a Thermo Element 2 ICP-MS, a New Wave UP-213 laser, and a cryo-cell chamber, designed to seal a 1 m ice core from the surrounding air while maintaining a uniform temperature of −15 ∘C. In order to ensure a complete seal of the ablation chamber, porous firn parts could not be measured. From 29.5 m w.e. to bedrock, the KCC ice core was analysed for 44Ca along a single ablation track. The 44Ca signal comprises contributions of soluble and insoluble Ca (Sneed et al., 2015). Crucial for further deployment for annual layer counting, the trend components in the LA-ICP-MS measured Ca signal have been shown to be in good correspondence with the lower-resolution CFA Ca signal, as shown in Fig. 2 and previously by Sneed et al. (2015) and Spaulding et al. (2017).
3.2.1 Radiocarbon analysis
The measurements for radiocarbon dating of the ice core have been conducted at the Institute of Environmental Physics (Heidelberg, Germany) under close collaboration with the accelerator mass spectrometer (AMS) facility at the Klaus-Tschira-Lab in Mannheim, Germany. The microscopic particulate organic carbon fraction (POC) incorporated into the ice matrix was extracted, combusted and analysed for 14C content. Calibration of the retrieved 14C ages was performed using OxCal version 2.4 (Ramsey, 2016) and by convention the 1σ error range is shown (Stuiver and Polach, 1977). For details on the sample preparation and measurement procedure, see Hoffmann et al. (2017a, b). The average ice sample masses were for both cores in a range of ca. 300–500 g ice resulting in absolute POC masses below 10 µgC. For the KCC core, a fraction of the ice core with a cross section of 17 cm2 was reserved for the POC 14C analysis. Within the upper 44 m w.e., a total of six samples were analysed, typically comprising between 40 and 60 cm of core. For the KCI ice core more core material (one-third) was available, resulting in depth intervals of 40 cm length used for radiocarbon dating. Within the upper 40 m w.e. of the KCI core six samples have been analysed so far.
Ice core chronologies were established by annual layer counting as the main dating tool in combination with additional age constraints from 14C for the lower core parts. For roughly the last 100 years, dated time horizons (1963 bomb radioactivity, and the Saharan dust layers of 1977, 1947 and 1901; see Fig. 4) are available to constrain the counting (Supplement). The 1963 horizon was used to cross-check that the annual signal had been identified correctly (compared with sub-annual and multi-year signals). The dust events were independently used for verification and typically lie within 1–2 years of the counted age scale (4 years at maximum for the 1901 horizon). Regarding additional absolute age markers beyond 1901, the identification of volcanic eruptions solely based on basic ice chemistry profiles is not feasible at CG. This is due to the fact that the relatively weak signals of volcanic sulfate or volcanic acidity are easily overlooked at CG since they are embedded into the relatively large variability of Saharan dust associated sulfate (mainly from gypsum) and (acidity consuming) carbonate. More promising in this respect is the investigation of relatively volatile trace elements (Kellerhals et al., 2010b), or the detection of tephra markers (Luongo et al., 2017), which are beyond the scope of this work, however.
4.1 The KCI chronology
For KCI, insoluble particle concentration and meltwater conductivity were used for annual layer counting, extending down to about 26 m w.e. Below 26 m w.e. the identification of annual layers became ambiguous and was abandoned. This depth corresponds (taking the uncertainty in layer counting into account) to (AD 1492±30). A two-parameter model (based on a simple analytical expression for the decrease of the annual layer thickness with depth) was used to extrapolate a continuous age–depth relation to greater depth (Nye, 1963; Jenk et al., 2009). Note that high-resolution annual layer counting could only be performed in KCC (see below), since only small sections of KCI have been analysed by LA-ICP-MS so far (Sneed et al., 2015).
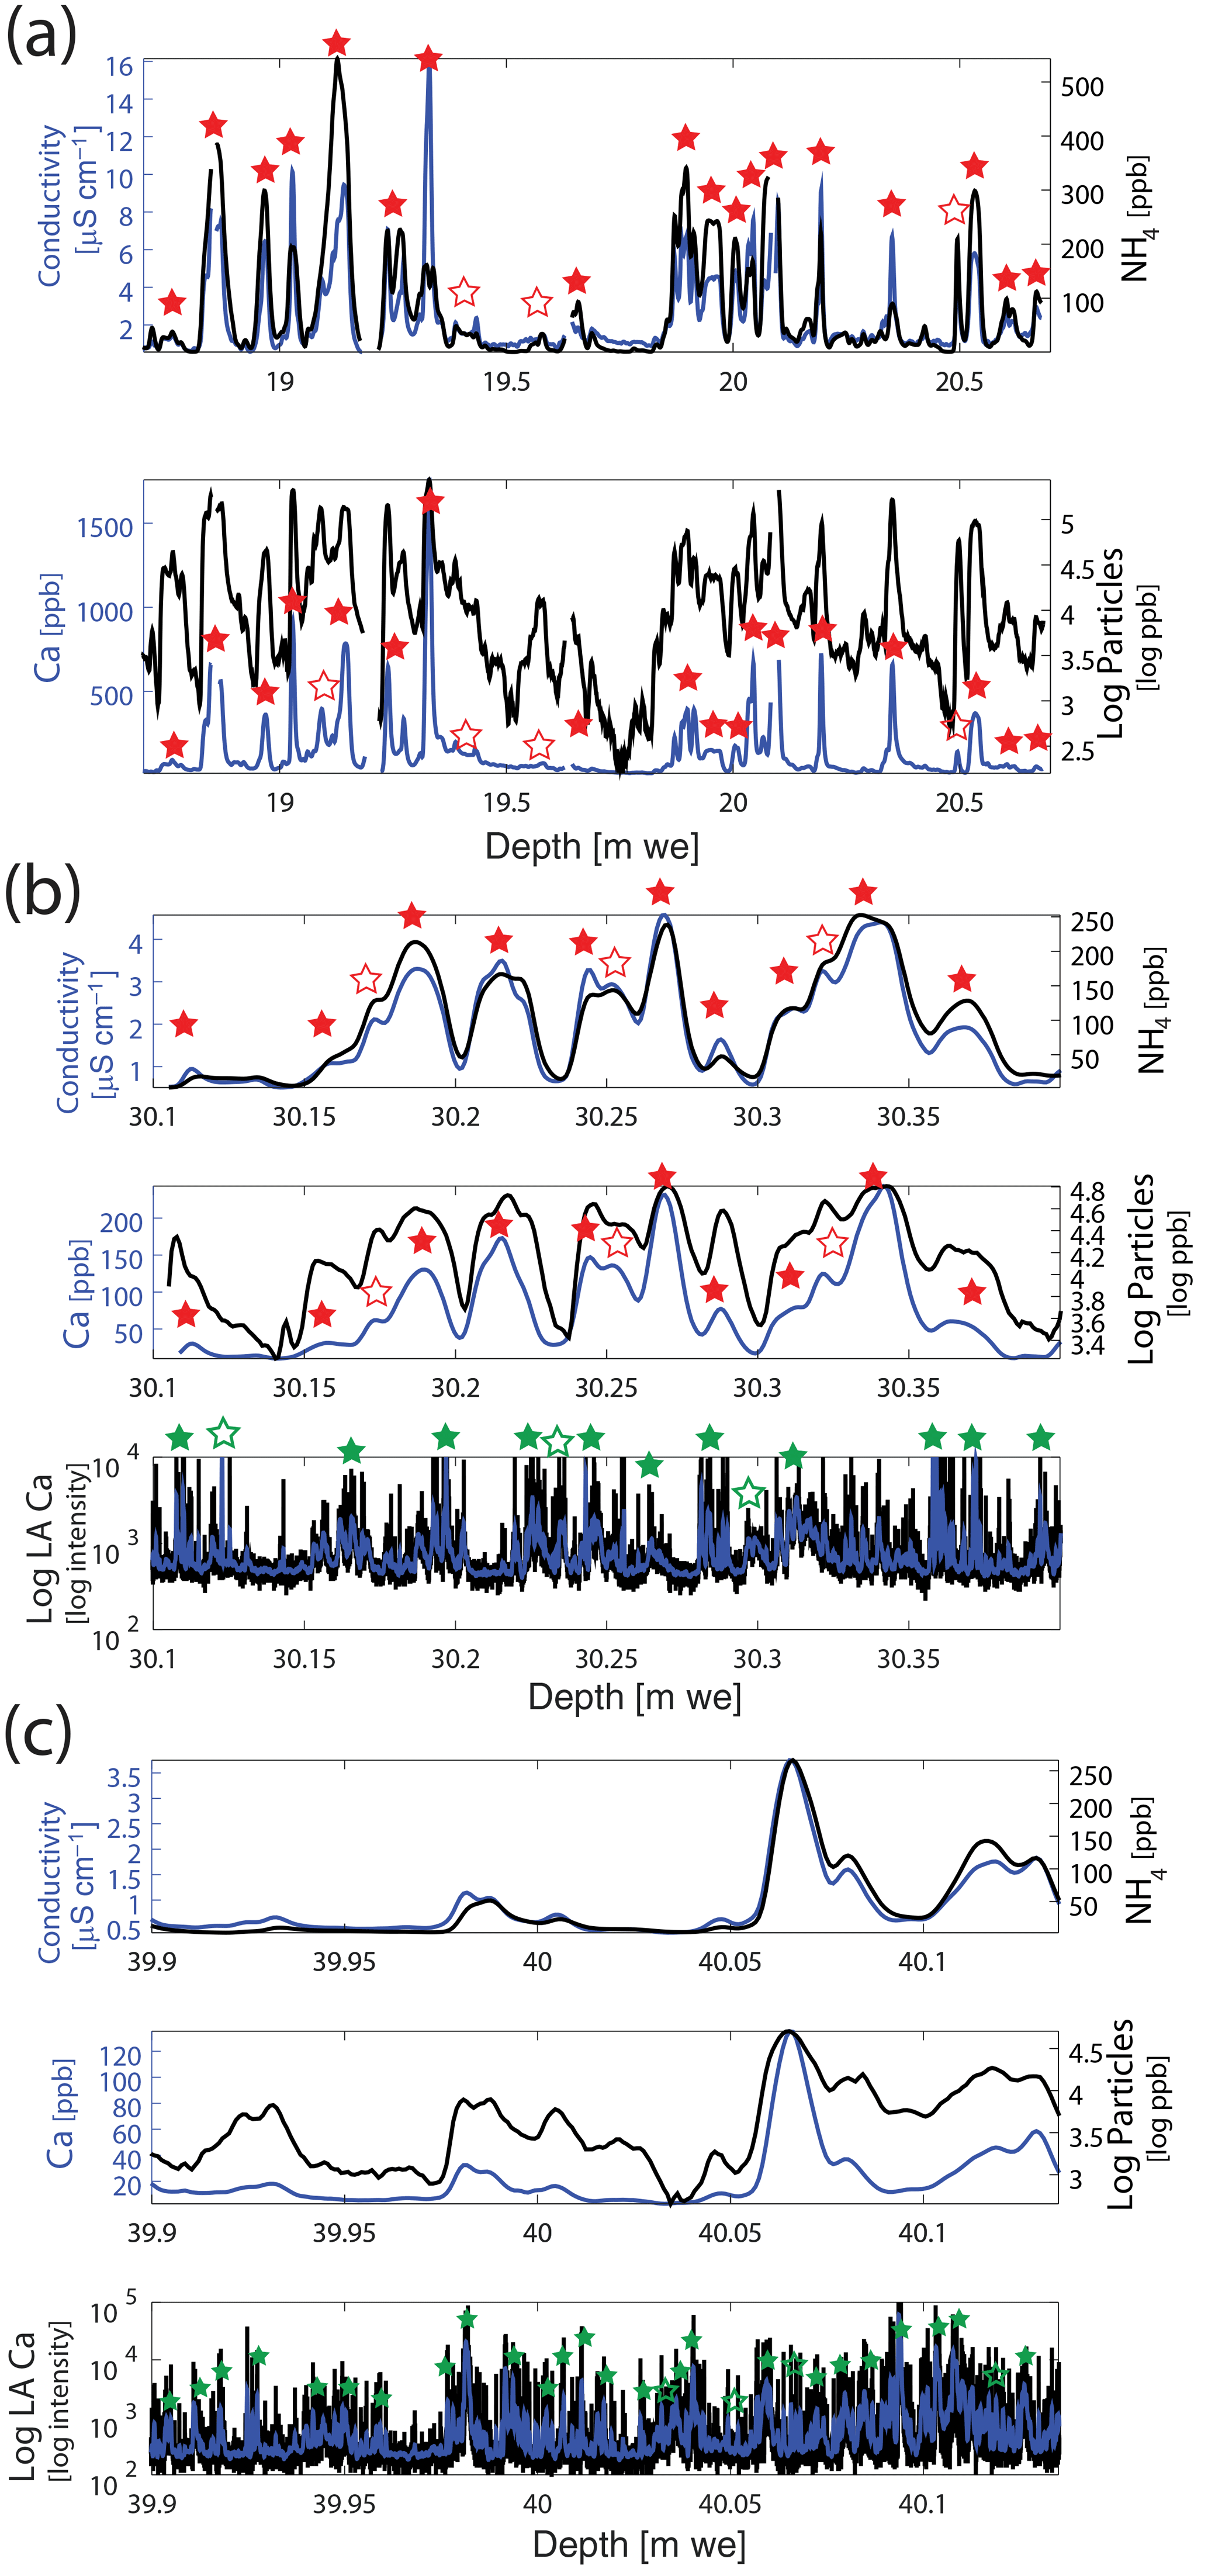
Figure 3Examples for annual layer counting in KCC impurity profiles for three different depth sections, labelled (a), (b) and (c), and corresponding roughly to 100, 250 and 1000 years before 2013, respectively (see Table 3). In the upper core parts (firn sections) CFA measured impurities were used for counting, with special emphasis on NH (a). Counted years are marked as full stars and uncertain years as white stars. (b) The middle row shows an example of overlap in counting between CFA and LA-ICP-MS Ca, showing (10±3) and (11±3) years, respectively. The LA-ICP-MS Ca raw signal is shown in black together with Gaussian smoothing (blue). Note that a minor depth offset (at most a few centimetres) may exist between the CFA and LA-ICP-MS datasets. Accordingly, no one-to-one match of the individual peaks is attempted. Counting within one of the deepest sections analysed for this study is shown in (c). Here, only the LA-ICP-MS Ca allows a reliable identification of almost sub-centimetre thin annual layers. LA-ICP-MS intensity is reported as counts per second.
4.2 The KCC chronology
All impurity species measured by CFA (Table 2) were used in combination for annual layer counting. Annual layers were defined as local maxima in at least two of the six impurity signals, with special emphasis on NH featuring the largest seasonal amplitude. An example of counting annual layers in the CFA profiles in shown in Fig. 3a. In order to identify highly thinned, sub-centimetre annual layers expected to dominate the deeper core sections, an independent counting was established using the LA-ICP-MS Ca profile starting at 29.5 m w.e. (corresponding to AD 1760). At this depth, the average annual layer thickness was estimated from CFA-based counting as around 3 cm. The LA-ICP-MS Ca record was investigated at full resolution and as a smoothed version (using the leading components in singular spectrum analysis or Gaussian smoothing). In its upper section, the LA-ICP-MS Ca profile is characterized by regular occurrence of several distinct peaks grouped together, along with an elevated baseline of Ca concentration (Fig. 3b). The groups of peaks are separated by a comparatively stable signal of low Ca concentrations. The latter is interpreted as resulting from the varying degree of winter snow being included in the record otherwise dominated by summer snow. Accordingly, the grouped peaks correspond to sub-annual snow deposition events of elevated Ca concentration during the summer period, which is also observed in the most shallow parts of KCC (Supplement). For the depth interval 29.5–32.5 m w.e., counting separated groups of peaks (typically 3–5 peaks per annual layer) in the LA-ICP-MS Ca record results in good agreement with counting performed on the CFA profile (typically within ±1 year per 10 counted years; see Fig. 3b). Below 32.5 m w.e., average annual layer thickness becomes close to 1 cm and counting in the CFA profile becomes increasingly difficult (i.e. frequent “shoulder type” annual layers merged into a single impurity peak). The LA-ICP-MS Ca profile continues to show distinct groups of peaks that become increasingly closely spaced and eventually merge into single broad peak events (Fig. 3c). Accordingly, LA-ICPMS Ca was the dominant source of annual layer counting after around 32.5 m w.e. (AD 1600). The annual layer signal remains clearly identifiable for the remaining part of the depth range investigated here (e.g. apparently not affected by diffusion of soluble Ca).
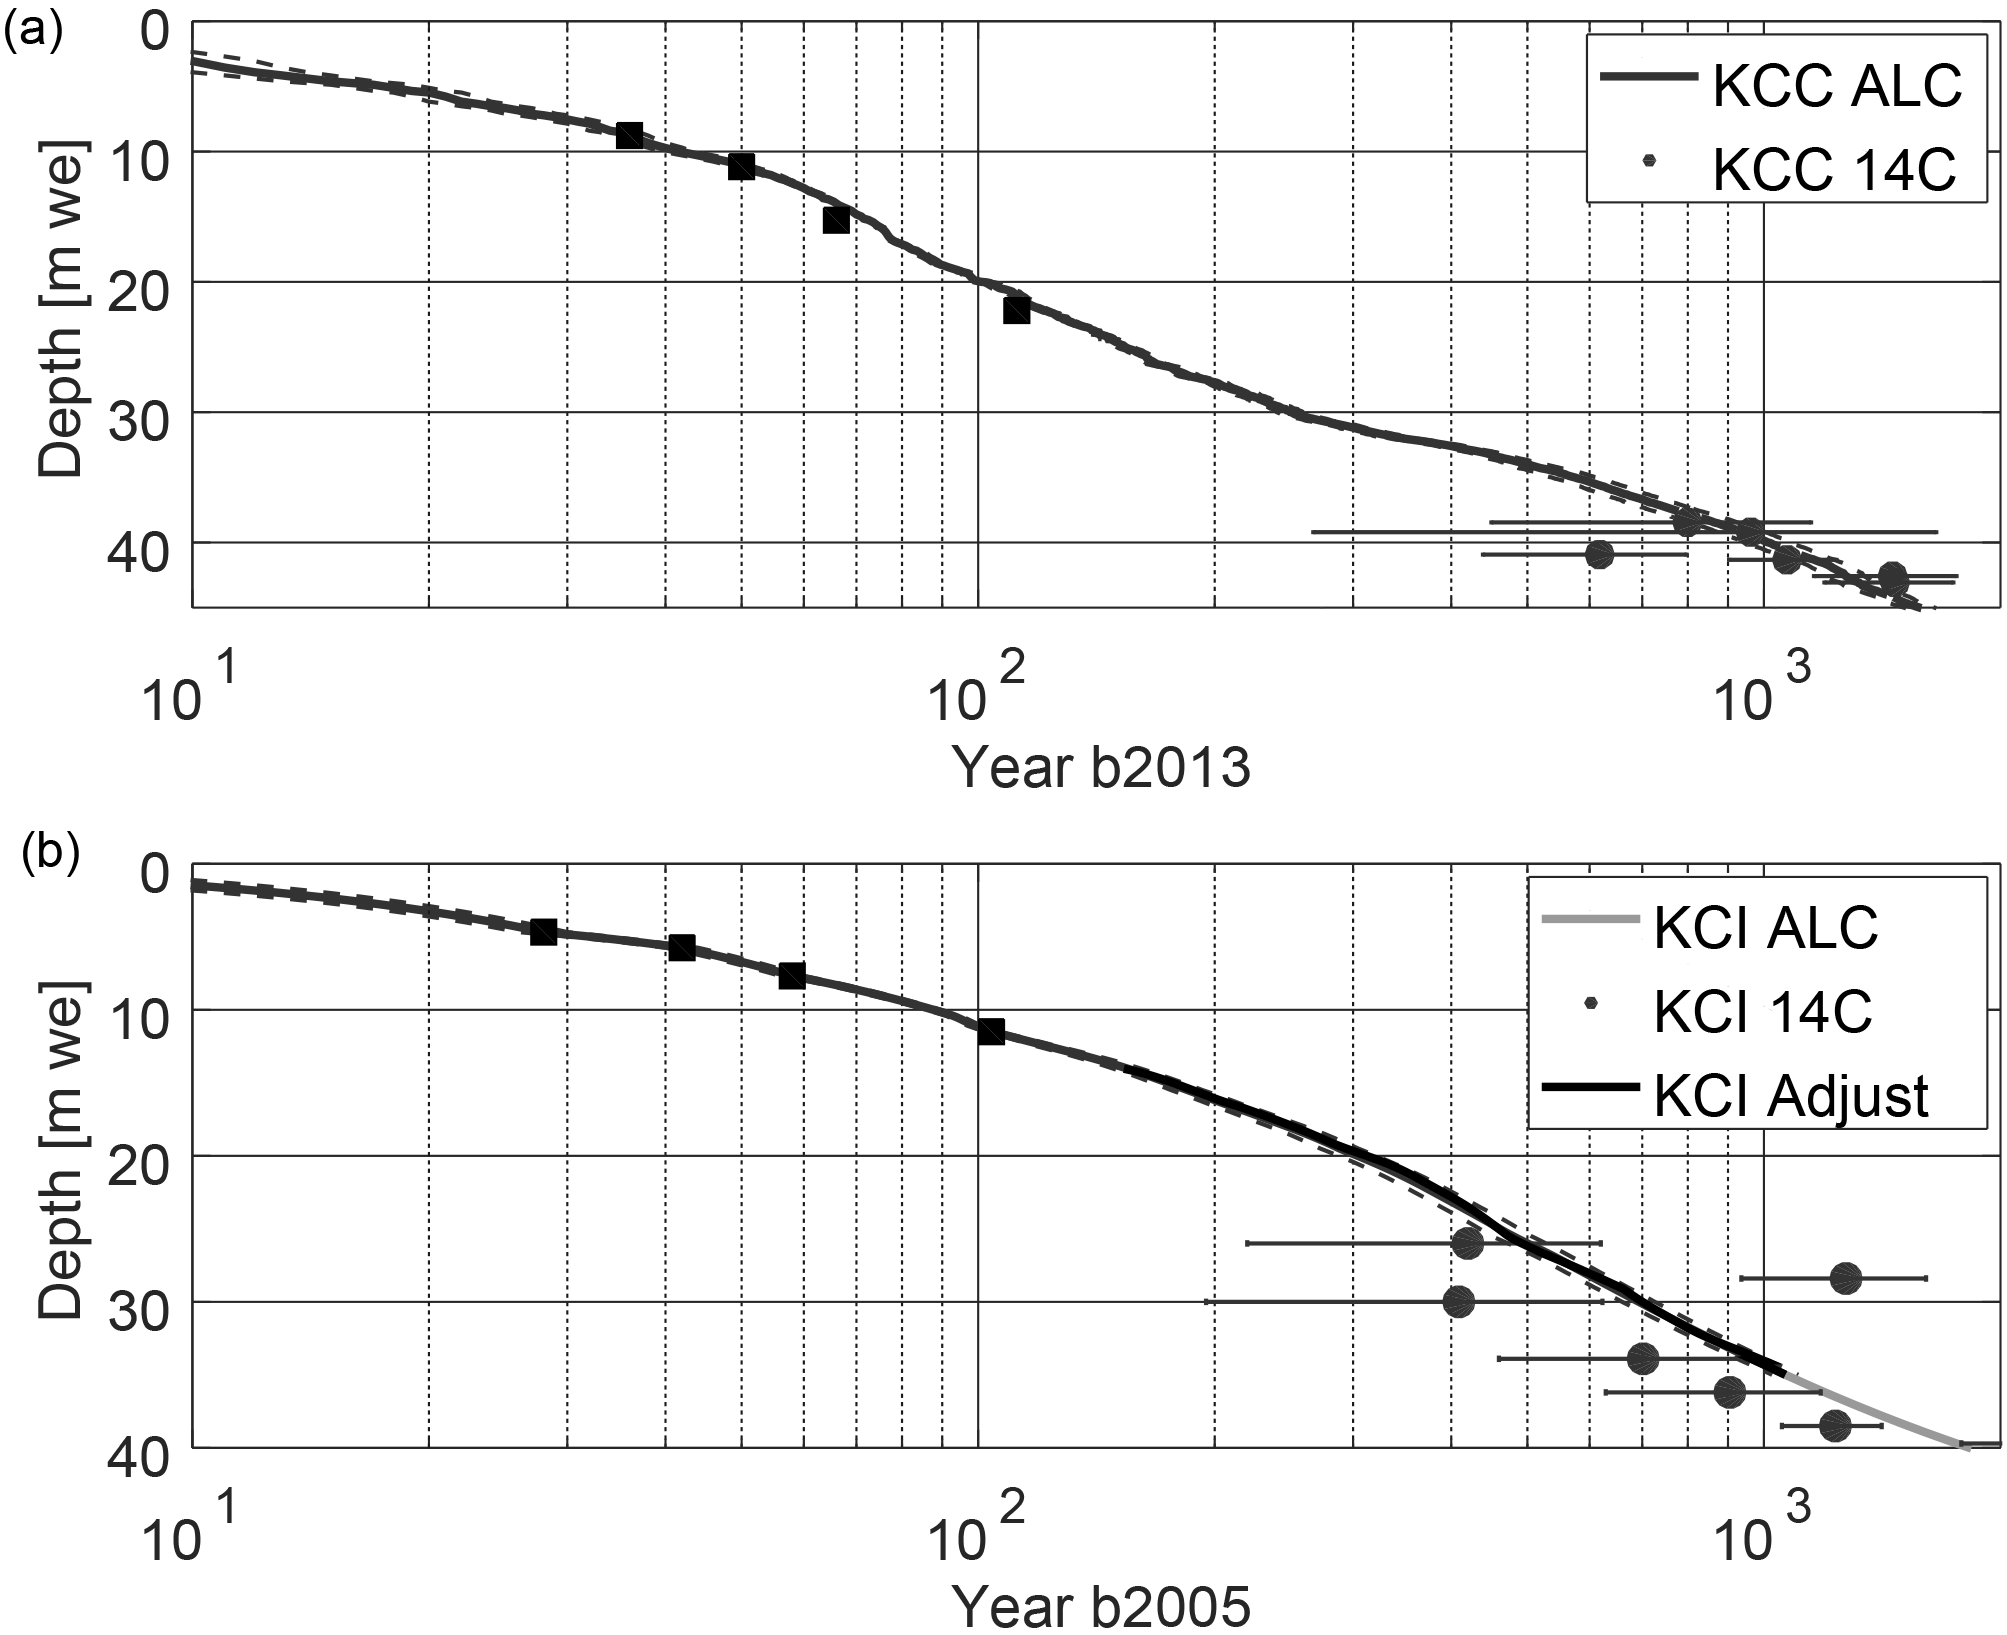
Figure 4Age–depth relations over the last 1000 years for KCC (top) and KCI (bottom). Age is plotted on a logarithmic axis, together with the according estimates of maximum dating uncertainty (dashed lines) and 14C age constraints (with 1σ range) for KCC and KCI. Also shown is the adjusted age scale of KCI based on the stable water isotope time series comparison (solid black line, within less than 15 years of the original dating and thus hardly distinguishable here; see text). Absolute dating horizons used roughly within the last 100 years (see text) are shown as black squares. Note that the KCI chronology is based on a simple extrapolation below 26 m w.e. and has large uncertainty beyond the last 1000 years (thus indicated as light grey line only).
4.3 Age constraints from radiocarbon analysis
For KCC, results from 14C analysis are found to back the annual layer counted age scale. Five of six 14C dates agree with the counting within their 1σ range (Fig. 4), corresponding to a root mean square deviation of 118 years (227 years including the outlier). The outlier 14C point contradicts a monotonic increase of age with depth and is thus disregarded. This is justified, because the 14C age of this sample matches with a very sensitive section of the 14C-calibration curve. Therefore already a small, unknown blank contribution would be able to shift the calibrated age of this sample significantly. Within the 2σ error range it also hits the error range of the annual layer counting chronology in the present configuration. Its deviation is therefore not of consequence.
For the KCI ice core, the radiocarbon ages are found to agree with the extension of the existing age scale based on the two-parameter model. It seems worth noting, however, that four out of six 14C points lie systematically above the extrapolated age scale (albeit in agreement within their 1σ range). Only the sample at 28.4 m w.e. shows an age that is significantly older than expected. This might be due to the extremely small (also compared to the other KCI samples) sample size of only 2.2 µgC, making this sample prone to even very small potential blank contributions. In this context a potential influence of aged organic material (e.g. from Saharan dust) has to also be considered. At present, the age of this sample is therefore regarded as an outlier. Additional radiocarbon measurements of this core section above and below the critical sample are planned to further refine the match, and to test if the systematic deviation of the 14C ages persists. The 14C ages of the KCC and KCI samples are summarized in the Supplement.
4.4 Dating uncertainty
Potential sources of uncertainty in annual layer counting stem from (i) erroneously identifying or missing of existing annual layers, (ii) interpolating data gaps and (iii) an incomplete stratigraphy missing years due to annual snowfall fully eroded from the surface. Regarding (i), we estimated the likelihood of miscounting layers by marking “uncertain years” (Fig. 3). In view of the high snow erosion at CG, uncertain layers were defined as additional peaks in close proximity to an annual layer (e.g. “shoulder type” peaks). To quantify counting uncertainty from uncertain layers, we followed the approach successfully employed for Greenland ice cores. This is to count uncertain layers as 0.5 ± 0.5 years and to estimate the maximum counting error (MCE) from N uncertain layers as N × 0.5 years (Andersen et al., 2006; Rasmussen et al., 2006). With 144 uncertain layers detected within the upper 40 m w.e. of KCC, this corresponds to an uncertainty of ±72 years at AD 1000. With respect to (ii), the depth interval considered in this work was completely recovered without core loss. The ends of the CFA core sections were trimmed in case of irregular core breaks. This resulted typically in less than a centimetre of missing CFA data, thus not interfering with annual layer counting. The ECM profile was used as an alternative backup across these short CFA data gaps. Likewise, the CFA data were used as an alternative indicator where the LA-ICP-MS profile was incomplete, which only concerned one major instance of missing LA-ICP-MS data between about 33.8 and 34.24 m w.e.
Contribution (iii) constitutes a fundamental difference relative to Greenland conditions, since CG is not a closed system with respect to precipitation and loss of the annual snowfall in selected years can occur. The frequency of occurrence in these total snow loss events is, however, extremely hard to quantify. Counting annual layers in between the above-mentioned (dust) horizons within the last century reveals an offset of typically only 1–2 years as compared to the known age of the horizons. Thus, the counting appears not to be systematically flawed by missing years. Hence we regard uncertainty (i) as dominant and use the MCE as an uncertainty estimation of the KCC age scale. Notably, the uncertainty refers to the unconstrained counting approach used here and could be further refined in the future with new absolute dating horizons, especially for the pre-AD 1900 period.
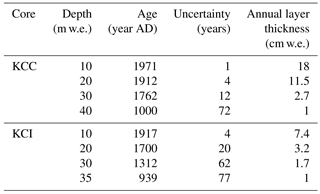
Table 3Ice core age, dating uncertainty and annual layer thickness for selected depths.
The uncertainty of the KCI age scale was obtained in a consistent manner, using the MCE for the annual layer counted interval and extrapolating the upper and lower uncertainty limits with the two-parameter model. Figure 4 shows the resulting age–depth relation and uncertainty bands for KCC and KCI, together with 14C dates (shown with their 1σ uncertainty range) available for the respective depth interval. Table 3 gives a complementary summary of the age–depth relation, uncertainties and annual layer thickness for 10 m depth intervals. It is important to note that we are less confident about the age–depth relation of KCI compared to KCC, due to KCI featuring (i) annual layering counting using only two bulk parameters and only down to 26 m w.e. and (ii) the extrapolation by the two-parameter model.
4.5 Inter-core time series comparison and age scale alignment
To investigate potential offsets between the KCI chronology and the presumably more reliably dated KCC, we compared the stable water isotope time series of the two cores. This is motivated by the fact that the decadal isotope trends among the CG ice cores have been previously shown to agree over the last 250 years (Bohleber et al., 2013). Without substantial dating offset between the cores, this inter-core agreement should hold also on longer time intervals. It is important to note that due to the strong effect of isotope diffusion at CG, inter-annual or even seasonal isotope variability is effectively eliminated. As a consequence, the records (except for the last 100 years in KCC) resolve only decadal-scale variability at best. Hence we did not apply any further smoothing to the time series. In order to avoid potential biases from increasing sampling resolution, both time series were sub-sampled to nominal biennial resolution. Figure 5 shows the comparison of the respective time series on their original timescales for the last 1000 years.
The two original time series of KCC and KCI already feature striking similarities, although frequently separated by a lag between the two time series (e.g. note the distinct isotope minima around AD 1360). The direction and magnitude of this lag varies with time, hampering an absolutely straightforward adjustment to match the two records. Aiming to adjust the KCI record to KCC time series, we employed the powerful algorithm developed by Lisiecki and Lisiecki (2002) for correlating paleoclimate time series. In doing so, we left the last 150 years of the KCI age scale unchanged (since considered reliably dated) but did not prescribe any further user-defined tie points to the algorithm. The result shows the original lag between the two time series eliminated (Fig. 5). A maximum shift of around 15 years is needed to align the two records (e.g. around the AD 1360 isotope minimum), which is within the estimated dating uncertainty of KCI (Fig. 4). As a result, the aligned time series are significantly correlated (r=0.47). This degree of correlation is within the typical range of correlating CG isotope time series on the decadal scale within the last 250 years (Bohleber et al., 2013). However, this is the first time that the correlation holds to this extent also for the comparatively old core sections of CG ice cores, e.g. we find a correlation coefficient of r=0.50 when considering the interval AD 1500–1000 only. In the following, all KCI time series are considered on their aligned timescale.
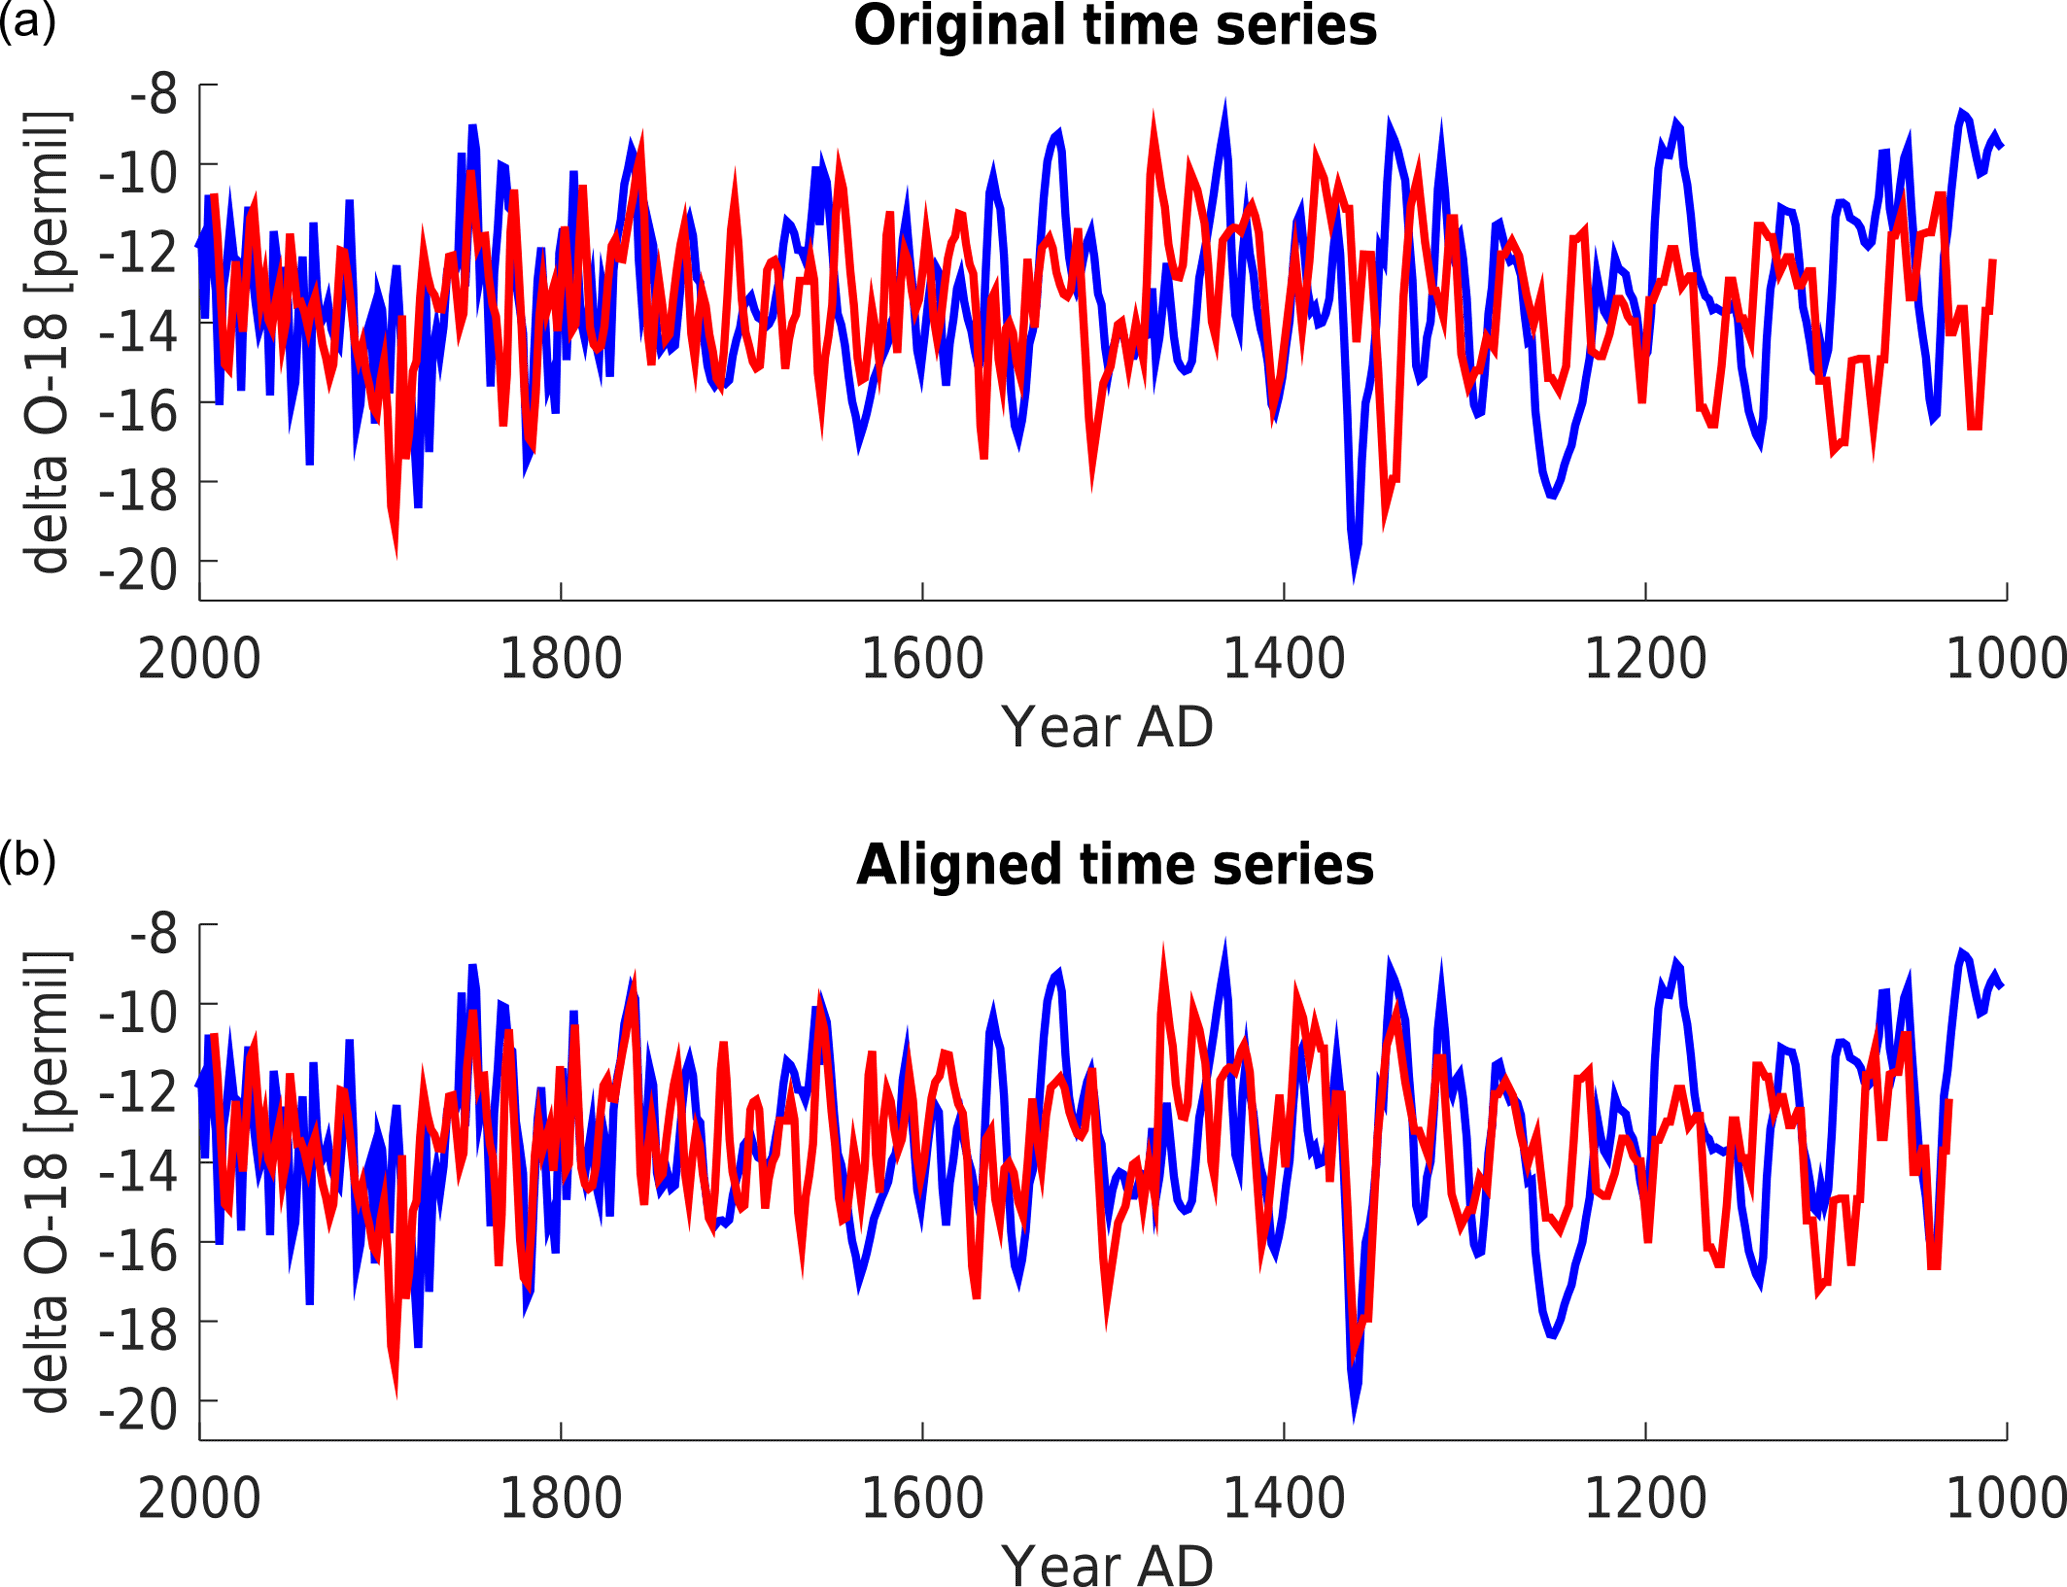
Figure 5Stable water isotope time series of KCC and KCI, shown in blue and red, respectively: (a) shows both records on their original timescale over the last 1000 years; (b) the KCI age scale was adjusted using the algorithm of Lisiecki and Lisiecki (2002) to optimize the match with KCC.
The age scale of KCC provides the first chronology of the last millennium for a CG ice core that is fully based on annual layer counting. The new KCC age scale offers the to-date most accurate foundation to study the CG proxy time series over long timescales, e.g. regarding the recent investigation pursuing the link with historical evidence by More et al. (2017), who used a slightly adjusted version of the age scale presented here (albeit not significantly different with respect to uncertainty). The novel technique of LA-ICP-MS was crucial for a reliable identification of centimetre and sub-centimetre thin layers in the deeper parts of the core. Thereby, this work adds to recent studies (e.g. Mayewski et al., 2014; Haines et al., 2016; Della Lunga et al., 2017) to demonstrate the potential of the high-resolution impurity records afforded by LA-ICP-MS for investigating highly thinned sections of polar and alpine ice cores. The combination of high-resolution annual layer counting and radiocarbon analysis promises a breakthrough also for dating highly thinned deep parts of ice cores drilled at other sites.
5.1 Stable water isotope records
The covariation of the δ18O time series between KCI and KCC strongly suggests a common atmospheric driver, i.e. temperature. At first glance Fig. 5 shows an increasing trend over the last 100 years but also generally higher mean isotope levels prior to about AD 1900. This is in line with earlier findings suggesting an “early instrumental period” warmer than instrumental data by about +0.4 ∘C derived from the CG isotope signal (Bohleber et al., 2013). Here we find the generally higher average isotope levels to persist over much of the pre-industrial period – for instance, the mean δ18O level in KCC between AD 1860 and 1000 is higher by about 0.75 ‰than the AD 2000–1860 average. A quantitative use of the common isotope signal would therefore require addressing systematic so-called “upstream effects” and a reliable calibration of the isotope signal against instrumental temperature.
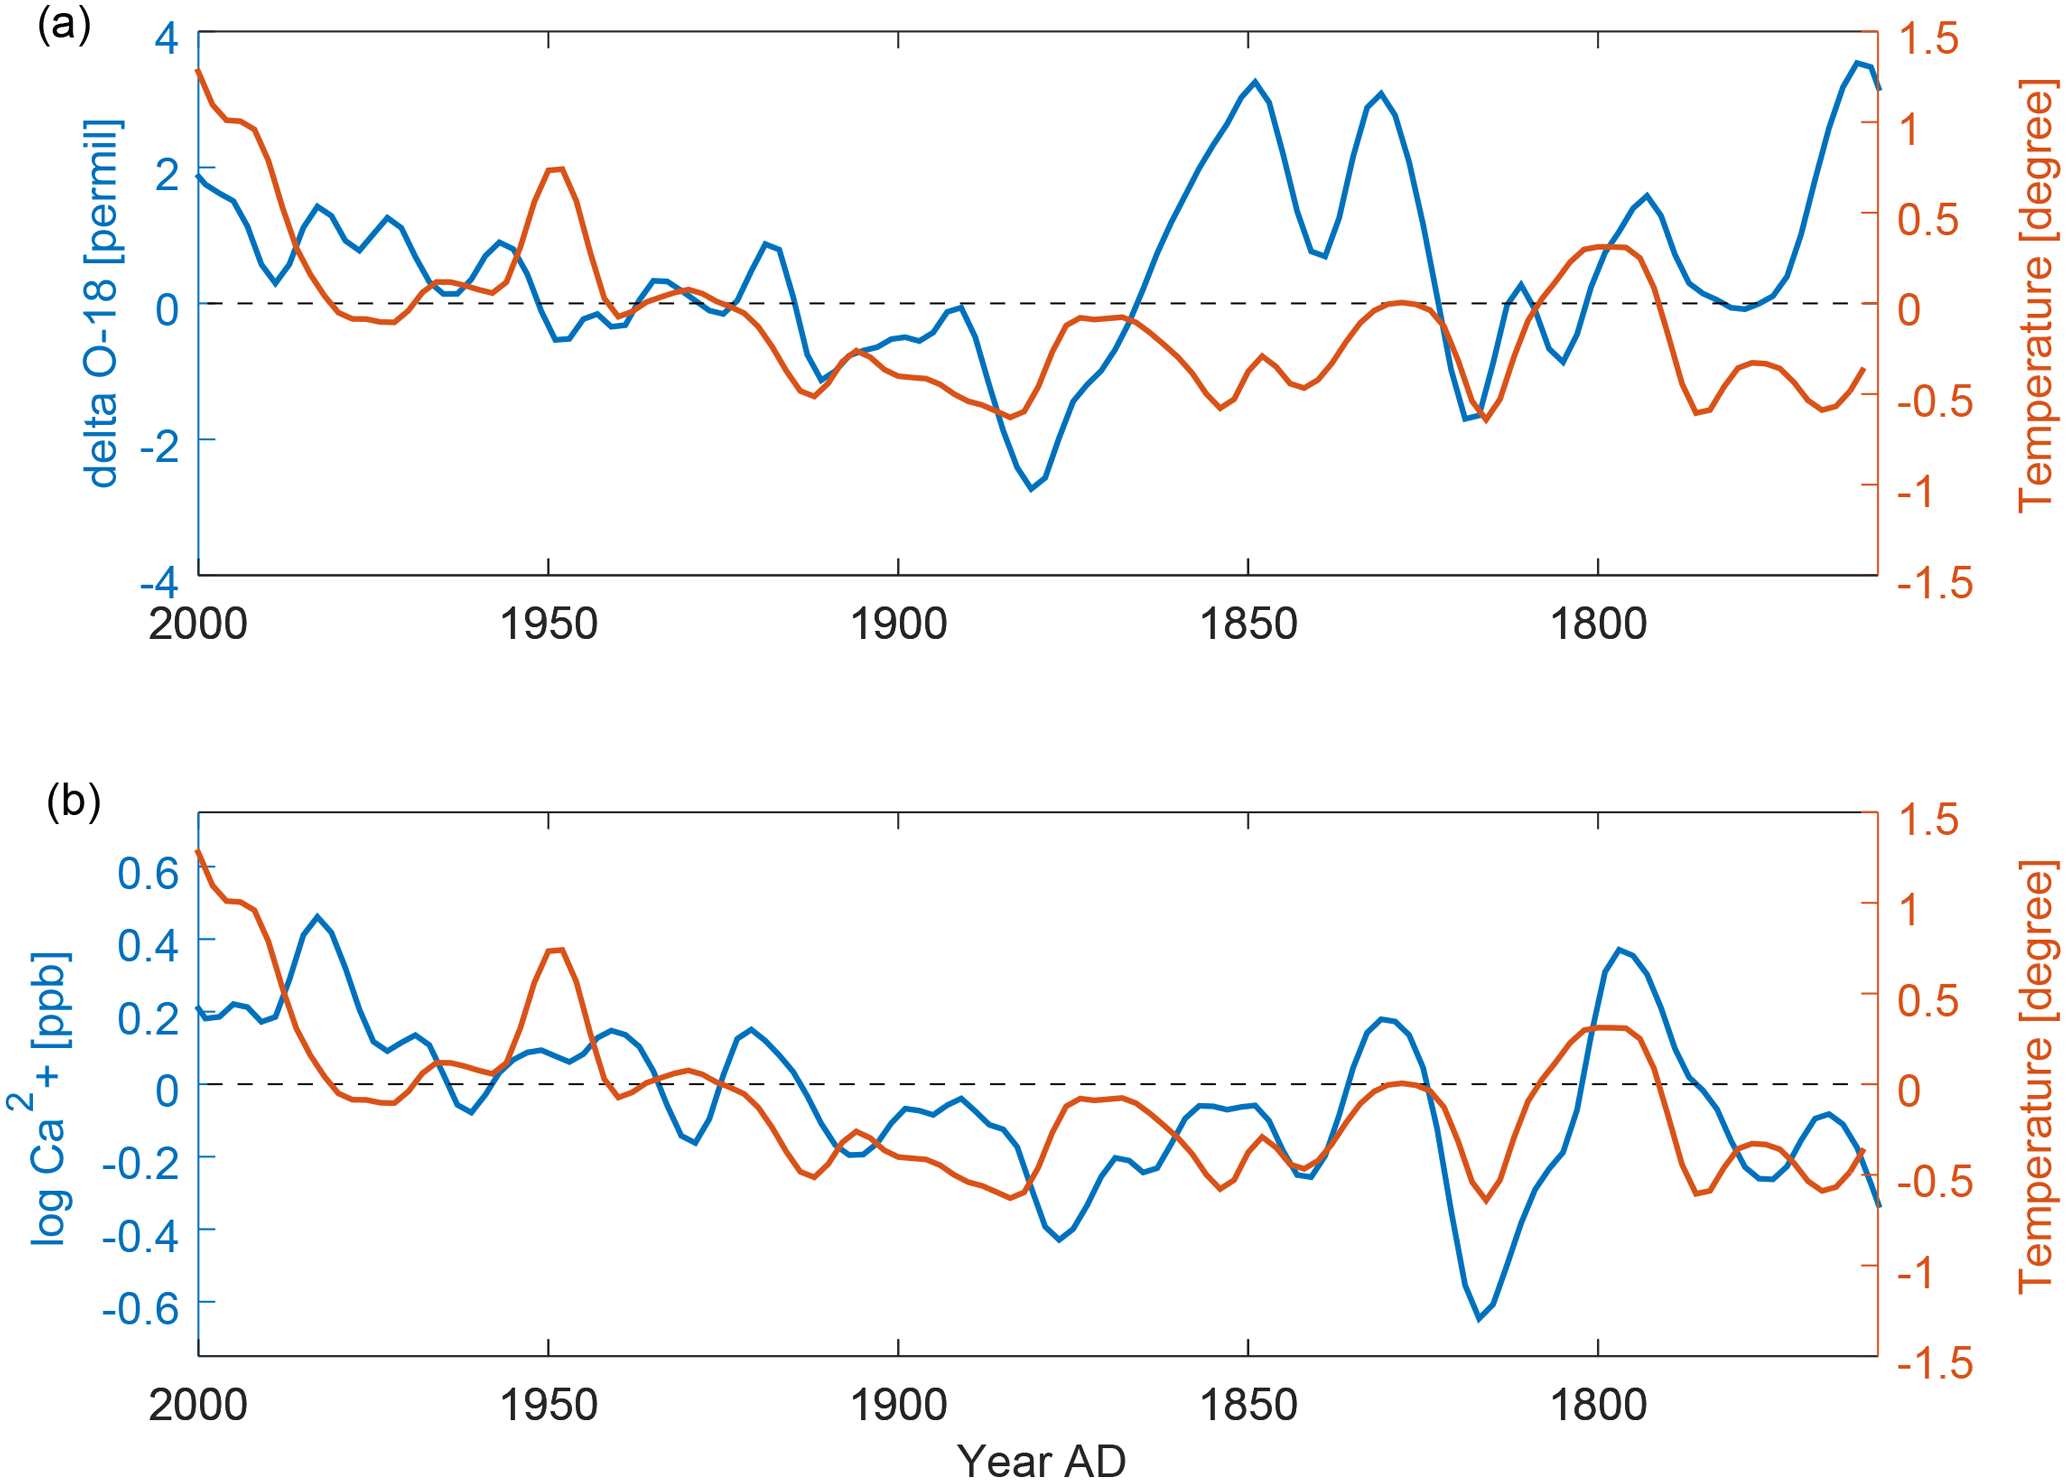
Figure 6Comparison of KCC δ18O and Ca2+ against the CG modified instrumental temperature (orange), shown in (a) and (b), respectively, and covering the full instrumental period back to AD 1760. Anomalies are shown relative to the respective AD 2000–1860 mean, and as decadal trends obtained from Gaussian smoothing.
Upstream effects concern the systematic variation in seasonality of the net accumulation upstream of the drilling site and have the potential to bias long-term core averages. Quantifying this effect requires accurate identification of the upstream catchment area (typically by sophisticated flow modelling) and evaluating the spatial variability in mean isotope levels. Dedicated efforts to evaluate the upstream effect for the KCI–KCC flow line are currently underway (C. Licciulli and J. Lier, IUP Heidelberg, personal communication, 2017). From a preliminary inspection of snow pit data recently obtained for the KCI-KCC flow line, there is no clear indication of a systematic trend in mean δ18O levels upstream of KCI, however – comprising roughly the years 2016–2014, three snow pits evaluated thus far show mean δ18O levels of −13.22, −11.94 and −15.04 ‰ at about 60, 195 and 300 m distance upstream of KCI, respectively (KCC is located roughly 110 m upstream of KCI; see Fig. 1).
In order to calibrate the stable water isotope signal, we used the instrumental temperature dataset compiled in an earlier study (Bohleber et al., 2013). This temperature dataset (referred to here as “CG modified temperature”) was specifically adjusted to the CG ice core conditions, taking into account the summer bias in precipitation and snow deposition. To calculate an isotope/temperature sensitivity, we considered both KCC and KCI individually as well as a stack of the two stable isotope records (calculated as their simple average at nominal annual resolution). Using AD 2000–1860 as calibration period (thus deliberately avoiding the “early instrumental period” prior to 1860) our results reproduce earlier findings of Bohleber et al. (2013). This specifically includes showing (i) an overall agreement between the isotope and temperature record interrupted by characteristic decadal mismatch periods (Fig. 6), (ii) an increase in isotope/temperature correlation for multi-annual and decadal averages (e.g. for discretely binned annual, 5- and 10-year averages, respectively, in the case of KCC) and (iii) higher correlations obtained from the stack vs. the individual time series (e.g. for annual, 5- and 10-year averages, respectively).
Regarding sensitivity values, we also find an increase with length in averaging period as well as substantially higher sensitivity values for KCI than KCC, revealing 2.3 vs. 1.4 ‰ ∘C−1, respectively, when using discretely binned 10-year averages (and 1.8 ‰ ∘C−1 for the stacked record). Hence we obtain sensitivity values about 3-fold higher than what is expected, e.g. based on the isotope/temperature relationship of 0.65 ‰ ∘C−1 reported by Rozanski et al. (1992) for European temporal trends in precipitation. Since a stricter confinement towards sampling the high summer season can be expected for the lower-accumulation KCI, the sensitivity difference between KCI and KCC points towards the seasonal bias in snow sampling being connected with enhanced sensitivity. It is important to note that the high isotope-sensitivity deserves a separate thorough investigation, ideally comprising regional climate–isotope modelling and taking into account post-depositional effects such as snow preservation, upstream effects and isotope diffusion, which is outside the scope of this study. Until an adequate long-term calibration of the CG isotope signal is achieved, however, we do not attempt a quantitative temperature reconstruction based on the isotope composite record so far.
Figure 7 shows the time series of δ18O in comparison with Ca2+, deuterium excess and CPP. Due to the logarithmic distribution of the Ca2+ data, we generally use a log scale to show the Ca2+ time series. For KCC, we find δ18O and Ca2+ to be significantly correlated over the last 1000 years (at r=0.49; see Fig. 7). This suggests that the common decadal-scale signal driver behind the shared variability between the δ18O time series of KCC and KCI also holds for Ca2+. Prior to about AD 1860, the δ18O time series constitutes nearly an upper envelope signal as compared to Ca2+. Short excursions to low Ca2+ concentrations missing a respective counterpart in δ18O may have been smoothed out by isotope diffusion. It is worth noting in this respect that the firn–ice transition in KCC coincides roughly with the last 100 years in the record (Tables 1 and 3).
5.2 Mineral dust proxy records
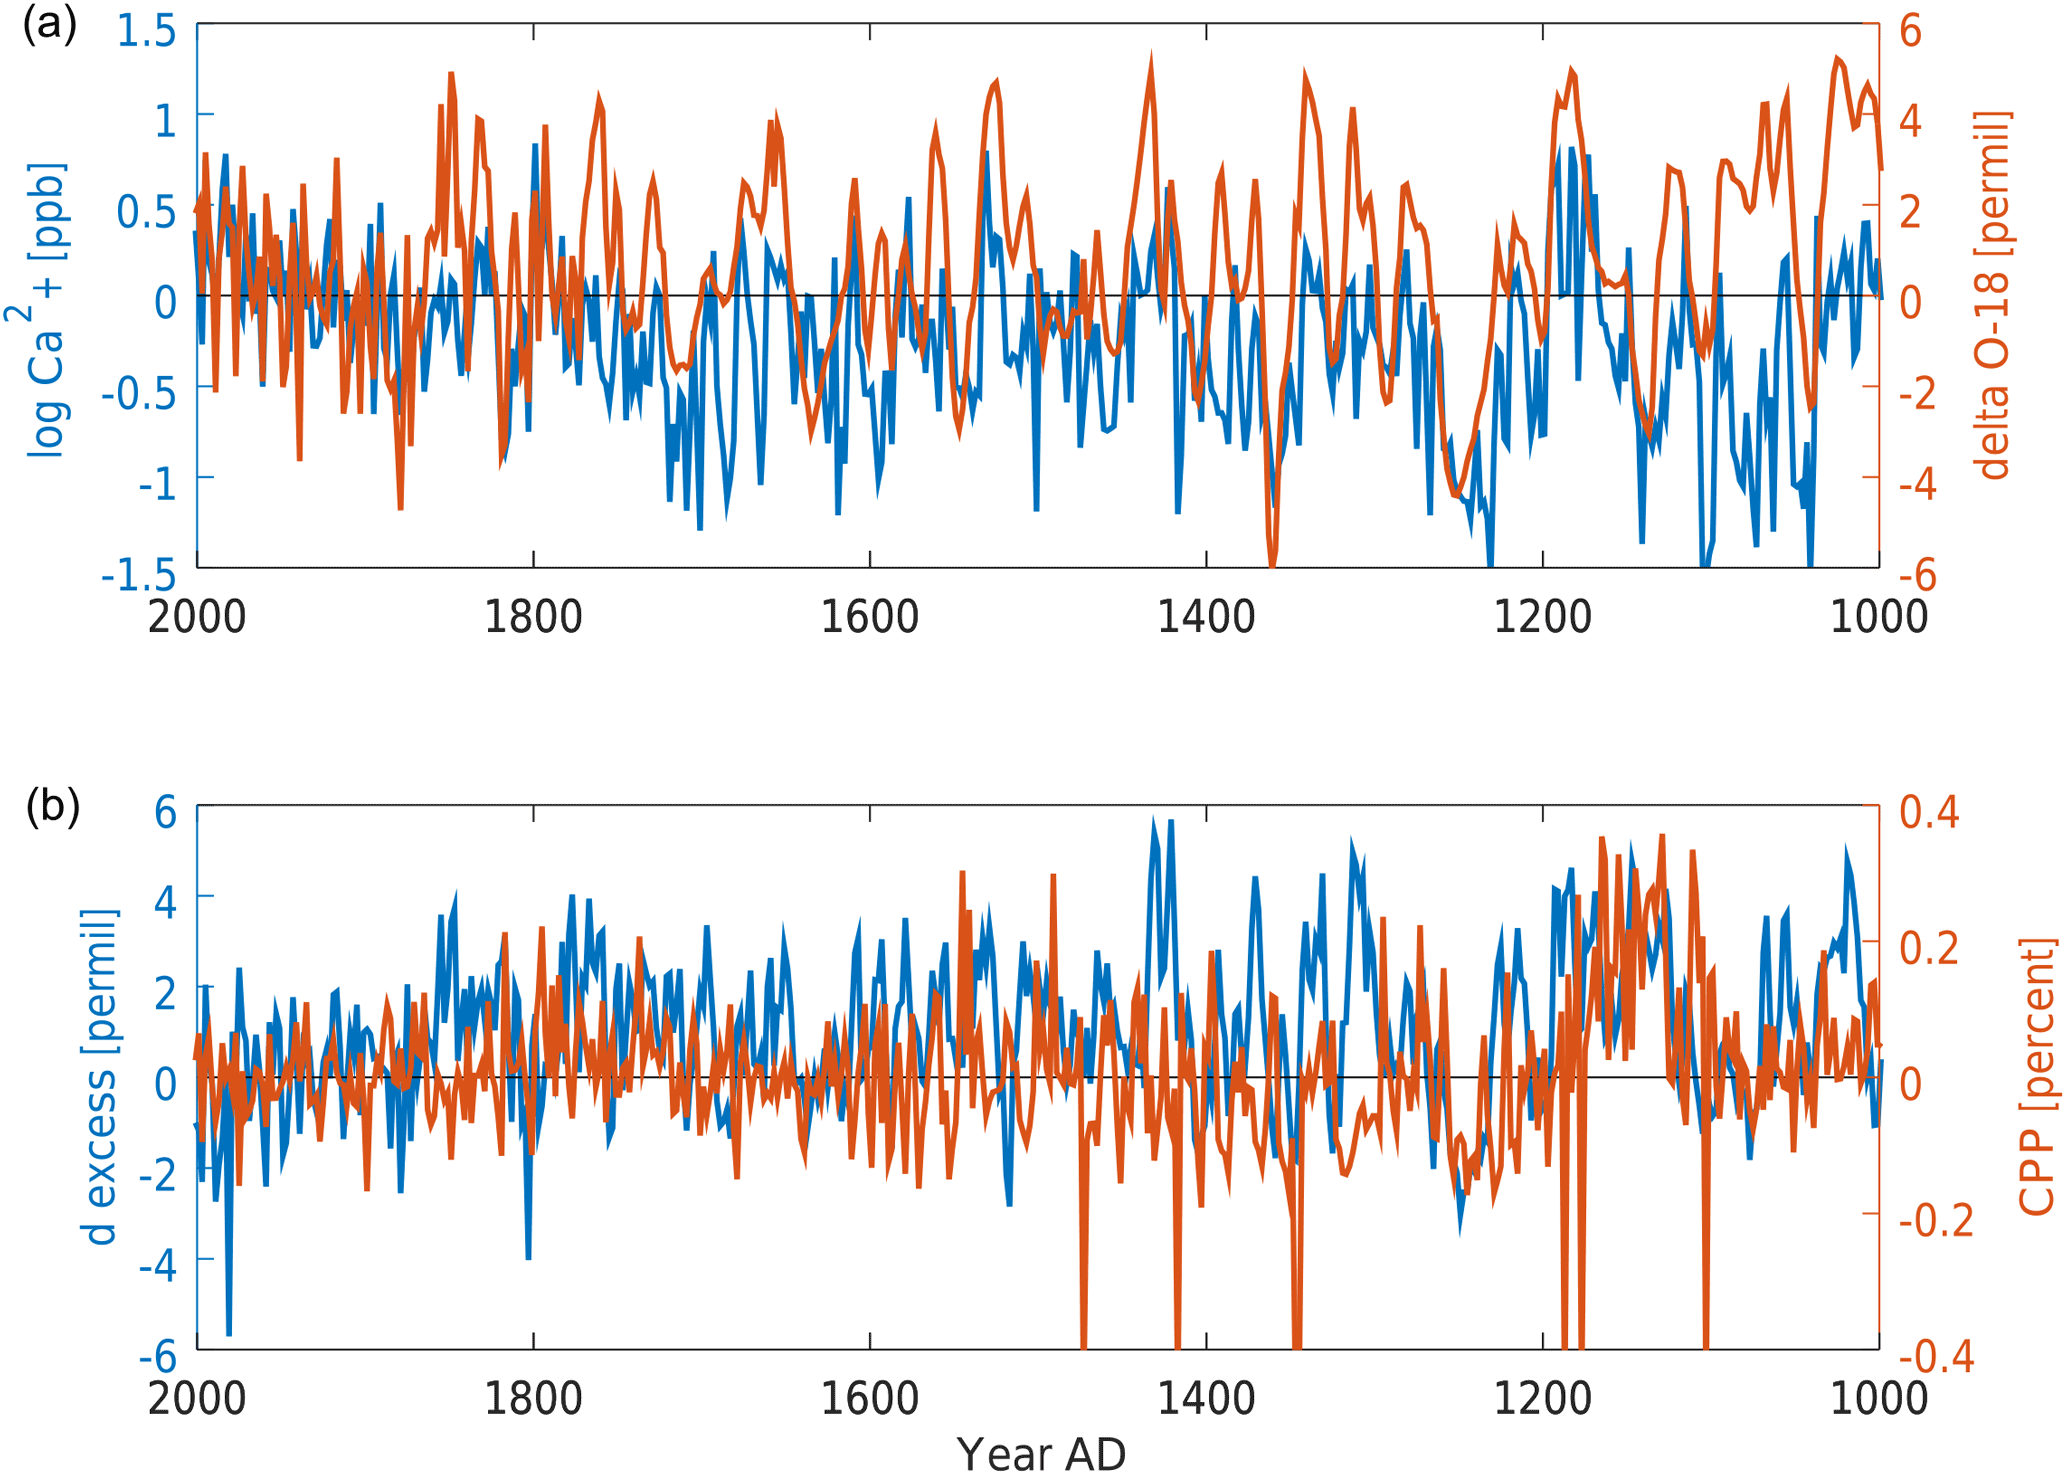
Figure 7Records of KCC, displaying δ18O together with Ca2+ (a) and deuterium excess together with the coarse particle percentage (CPP, b), shown in blue and orange, respectively. All time series are shown as anomalies relative to the respective AD 2000–1860 mean at biennial resolution. Note the high levels of deuterium excess and CPP around AD 1100–1200.
Following our general distinction (Sect. 2), two signal components of the Ca2+ time series are investigated separately: (i) the frequency of occurrence in Saharan dust deposition, and (ii) the long-term average Ca2+ concentration. In order to investigate to what extent the time series agreement observed for δ18O also holds in the case of mineral-dust-related species, we use the insoluble particle signal as a surrogate for Ca2+ (since Ca2+ has not been measured for KCI). Figure 8 shows an overview of the insoluble particle datasets of KCC and KCI. The KCC data show that the insoluble particle signal and Ca2+ concentrations are generally highly correlated (e.g. r=0.9 within the last 1000 years). The KCC–KCI inter-core comparison of insoluble particle records reveals agreement of decadal-scale features, as well as similarities regarding periods of low concentrations and higher peak abundance (e.g. 1800–1820 vs. 1780–1800, respectively). Differences in the magnitude of individual peak events as well as mean levels of particle concentrations can be explained in light of (i) the KCI particle signal measured on diluted sample meltwater, (ii) potential calibration differences in the optical particle sensor and (iii) inter-site snow deposition variability. Accordingly, it was not attempted to construct a composite record of insoluble particles from the two cores.
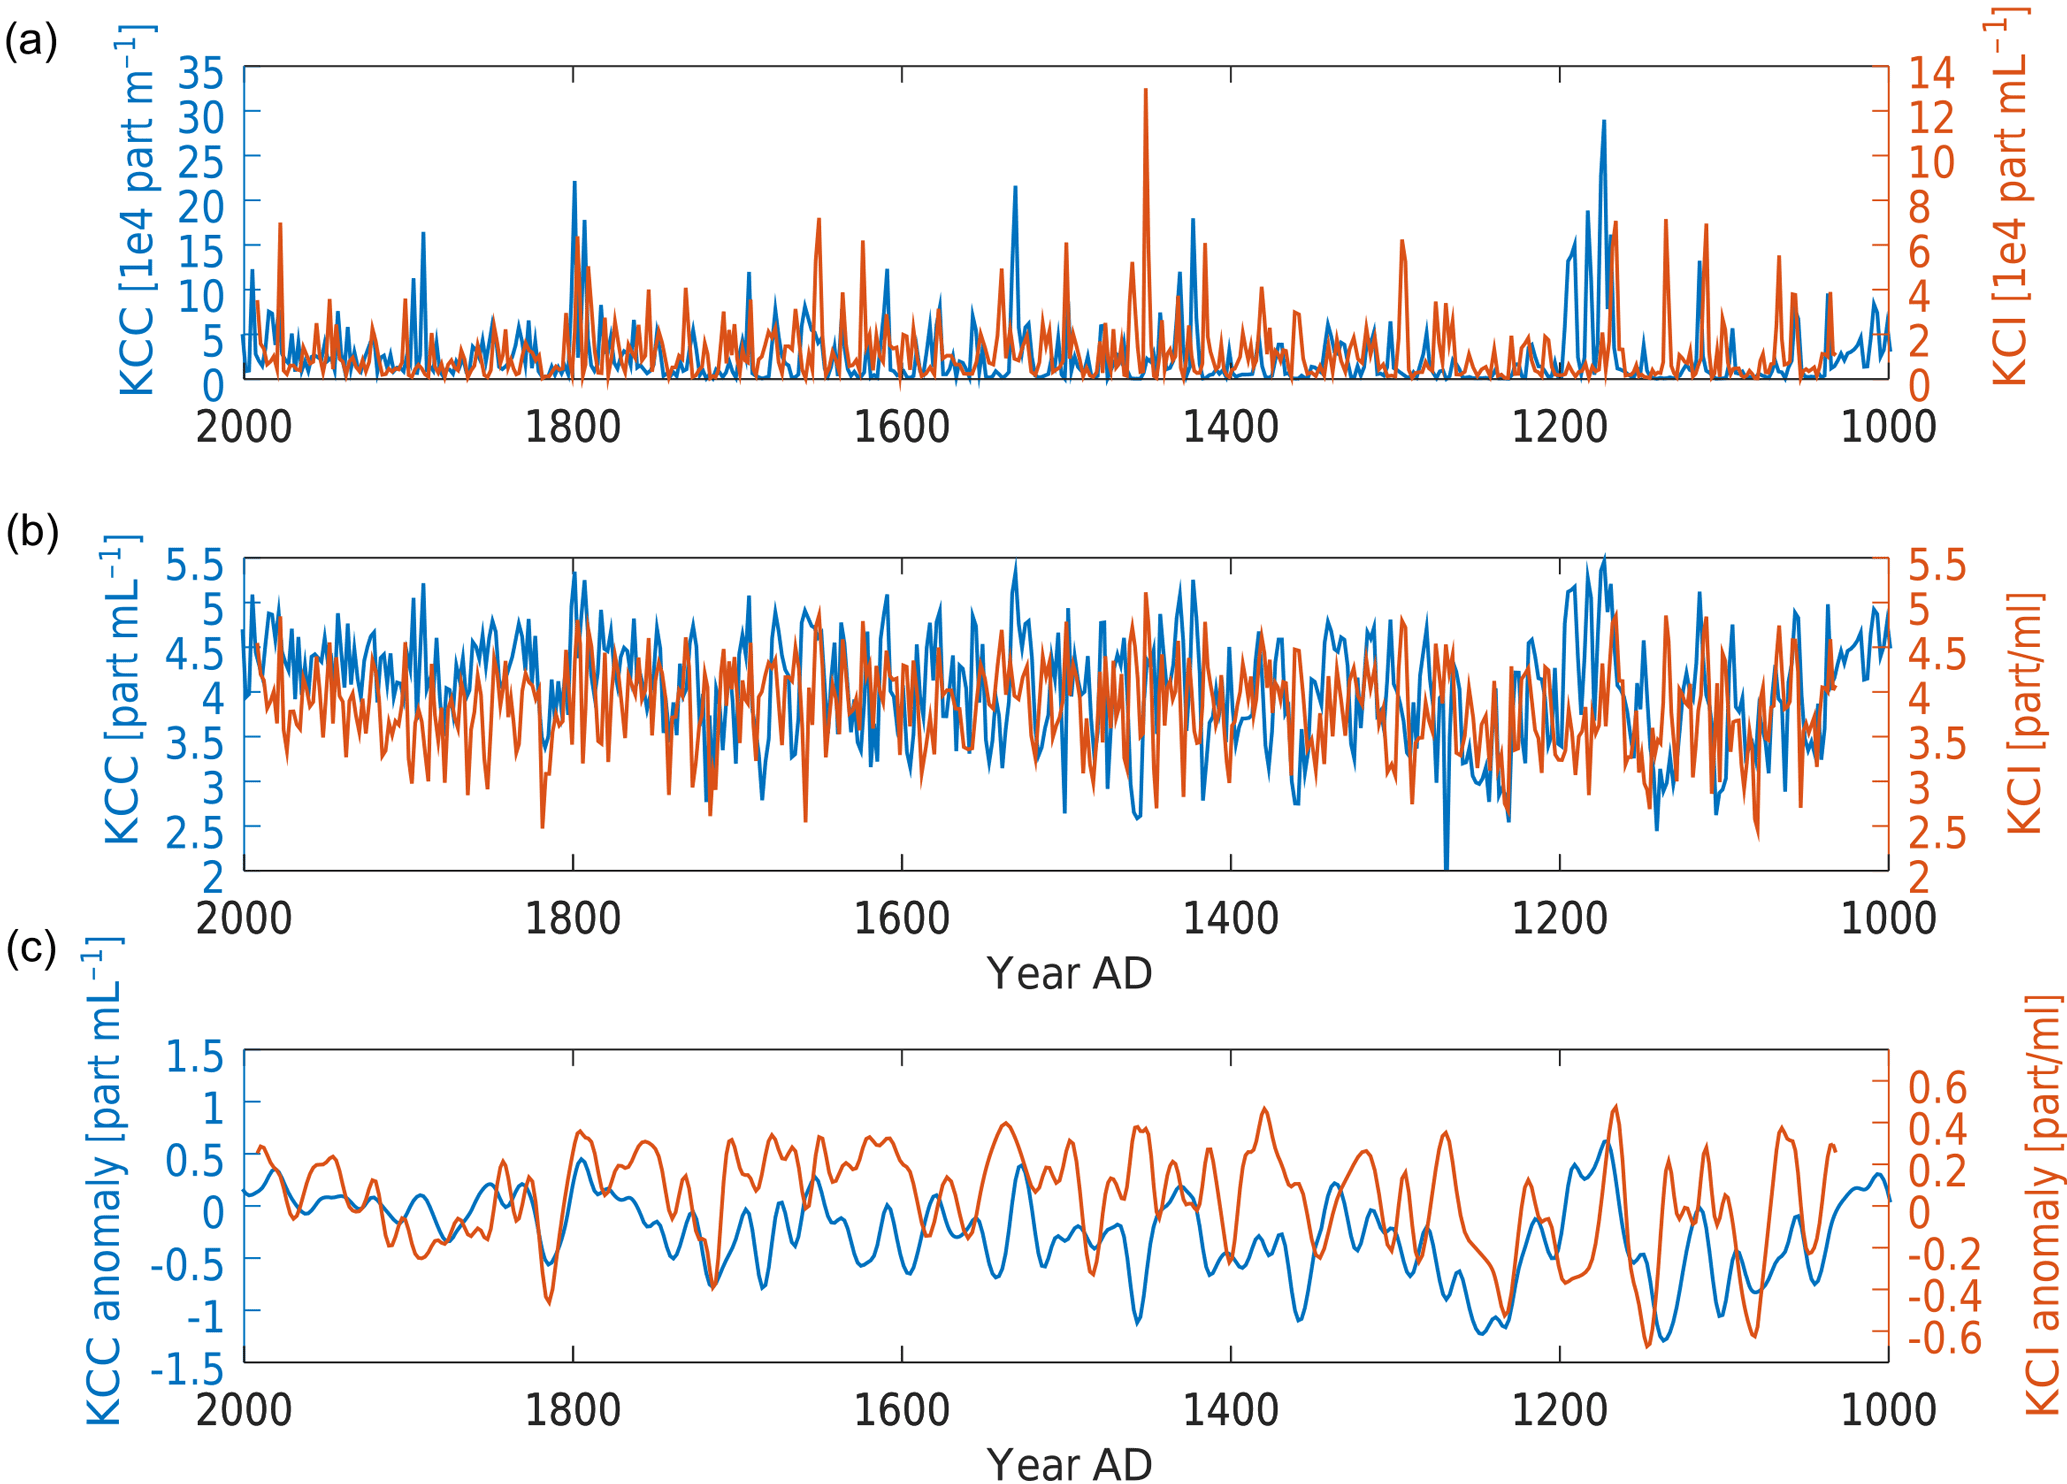
Figure 8Inter-core comparison of the insoluble particle signal of KCC (blue) and KCI (orange): (a, b) show the insoluble particle time series on a linear and logarithmic scale, respectively; (c) shows decadal trends of anomalies with respect to their AD 2000–1860 mean, highlighted by Gaussian smoothing. The KCI record is on the adjusted timescale after matching the stable water isotope records.
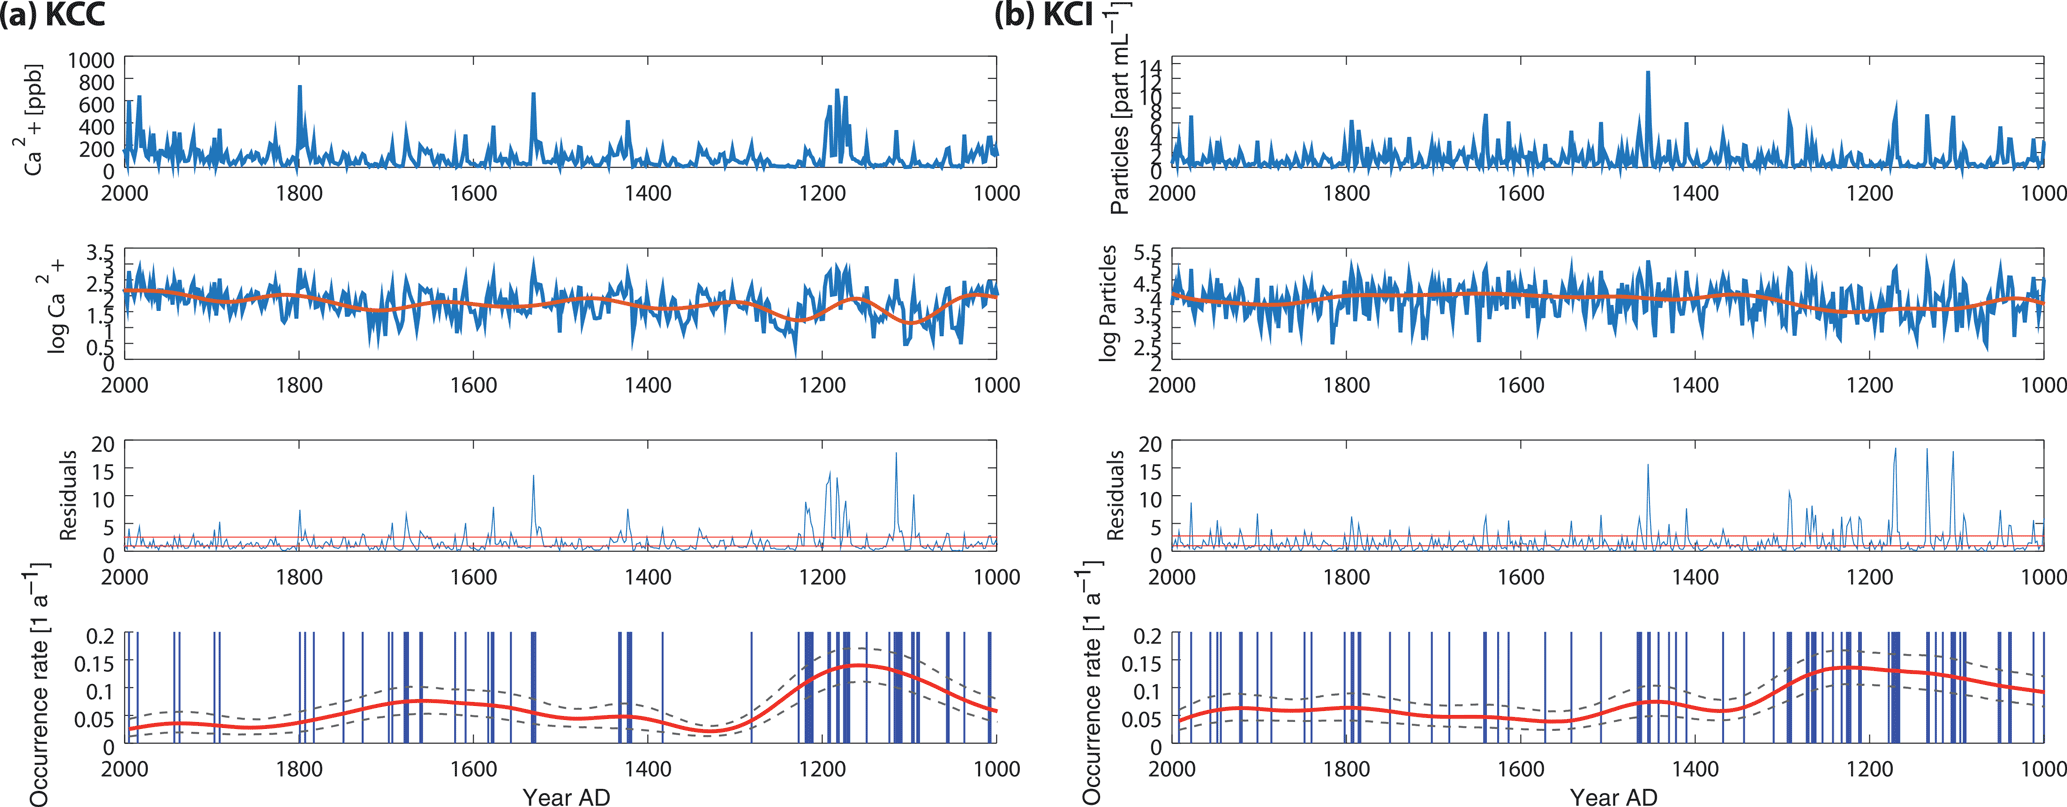
Figure 9Results from detecting Saharan dust events in the ice core records and estimating their long-term frequency of occurrence: (a) corresponds to KCC and (b) to KCI (see text). The bottom row shows the detected events (blue) and the frequency of occurrence kernel estimate with a 51-year bandwidth (bottom rows, in red) together with 90 % confidence intervals.
5.2.1 Detection of Saharan dust peak events and frequency of occurrence
Essential for the calculation of a robust occurrence rate of dust events are adequate means to distinguish desert dust from background and from deposition events of long-range transported anthropogenic pollutants. While the particle signal alone is not sufficient for differentiating these events, Saharan dust layers in CG ice cores can be reliably identified based on the analyses of Ca2+, supplemented by alkalinity measurements and, in principle, particle size distribution (Wagenbach et al., 1996). The central criteria used in this study in order to identify Saharan dust are strongly elevated concentrations of Ca2+ coinciding with acidity values reduced to alkaline levels. Since no direct acidity measurements are available in our case from CFA, we rely on the ECM record for this purpose. At CG high dust levels are able to reduce the ECM signal to almost zero (rendering the ECM to be a qualitative dust indicator rather than a quantitative acidity gauge). Dust anomalies were identified as “peaks over threshold”. A robust spline smoothing was used to remove the general trend from the Ca2+ data. Peak events then needed to exceed 3 times the median absolute deviations (Fig. 9). We have also used the particle size distribution to investigate exemplarily a small number of dust events, finding that dust events show systematically higher CPP with respect to dust-free core sections.
To detect the frequency of occurrence in dust peak events, we followed the statistical tool outlined in Chapter 6 of Mudelsee (2010). For a non-parametric occurrence rate estimate we used a moving Gaussian kernel (bandwidth 51 years) and accounted for boundary effects. For KCC, only the subset of peak events coinciding with a vanishing ECM signal was considered to be of Saharan dust origin. For KCI, we employed the same peak detection scheme to the insoluble particle signal. However, due to the lack of a full ECM profile, no subset corresponding to low acidity could be defined. Using a direct comparison with the insoluble particle signal of KCC, with and without ECM correction, we found that the respective uncorrected frequency of occurrence is expected to contain a minor bias towards higher peak abundances, but leaves the overall features unchanged. As the main robust features for KCC and KCI, the frequency of occurrence in dust peaks is systematically increased prior to AD 1250 with respect to the rest of the record (Fig. 9). Dust anomalies are found clustered in periods around 1100–1200 (extending into the 1200s), around 1400–1450 and, for KCC only, between 1500 and 1800. This is in broad agreement with enhanced Saharan dust deposition reported by Thevenon et al. (2009) for periods around 1200–1300, 1430–1520, 1570–1690, 1780–1800, and after 1870. The latter periods were identified by Thevenon et al. (2009) based on sophisticated elemental analysis in a CG ice core, albeit at much coarser resolution and larger dating uncertainty, which hampers a more detailed comparison. However, in our data we also recognize a large dust peak located between 1780 and 1800 which was suggested as a dating reference horizon by Thevenon et al. (2009).
5.2.2 The long-term Ca2+ variability in relation to temperature
Within the calibration period AD 2000–1860, we find the overall increasing trend in instrumental temperature to be represented also in increasing levels of δ18O and Ca2+ (Fig. 6). The Ca2+ signal correlates significantly with the CG modified instrumental temperature at using biennial, 5- and 10-year averages, respectively, within the calibration period. Nearly identical correlation values are obtained for the full instrumental period back to AD 1760. Within the calibration period (Fig. 6), we compared the decadal trends (highlighted by Gaussian smoothing) of the CG modified instrumental temperature with δ18O and Ca2+, respectively. The comparison reveals that the Ca2+ signal performs similarly to δ18O in explaining variance of the temperature data (both at around 25 %, although only interpreted with caution due to the autocorrelation of the smoothed curves).
Potential drivers for a Ca2+–temperature coupling can be expected from (i) the advection of air masses comprising a high Saharan dust load generally being associated with warm temperatures (Wagenbach et al., 1996), (ii) the deposition of dust leading to lowered snow albedo thus supporting surface snow consolidation (Haeberli et al., 1983) and (iii) warm temperature favouring snow consolidation (e.g. Haeberli et al., 1983; Fauve et al., 2002). However, it generally remains difficult to quantify the influence of the above processes. It seems worth pointing out that process (iii) acts independently from the type of impurity / isotope species considered. Likewise, a similar process as (i) may be envisaged in the case of δ18O. However, process (ii) mainly concerns dust-related species such as Ca2+, providing an essential “self-preserving” character for these species with respect to snow deposition. Regarding this connection between dust content and presumed faster snow consolidation, supporting evidence is provided by including the high-resolution density profile of KCC. Comparing profiles of Ca2+ and density reveals that layers with a high dust load generally coincide with layers of enhanced density (Fig. 10). Regarding process (iii), we made an attempt to semi-quantitatively explore the imprint of snow preservation on the long-term variability in Ca2+ (see the Supplement). Previous studies already used simplified conceptual models to investigate the influence of snow deposition on seasonal ice core signals, and demonstrated the decisive role played by the amplitude of the seasonality (Fisher and Koerner, 1988; Wagenbach et al., 2012). We employed the model by Wagenbach et al. (2012), with parameters reflecting CG snow preservation conditions. Our calculations revealed that incomplete snow preservation can bias the average Ca2+ concentration by a comparable magnitude as the long-term variability in Ca2+ observed in previous studies (Wagenbach et al., 1996) and also in the core investigated here. As a result, the influence of snow deposition appears non-negligible in explaining the apparent Ca2+–temperature co-variation. Notably this implies that, at best, the Ca2+–temperature coupling allows for using Ca2+ trends as a site-specific temperature proxy only. This is in analogue to the study by Kellerhals et al. (2010a) demonstrating temperature-related variability for NH at a low-latitude site, albeit explained by a different mechanism than discussed for Ca2+ at CG here.
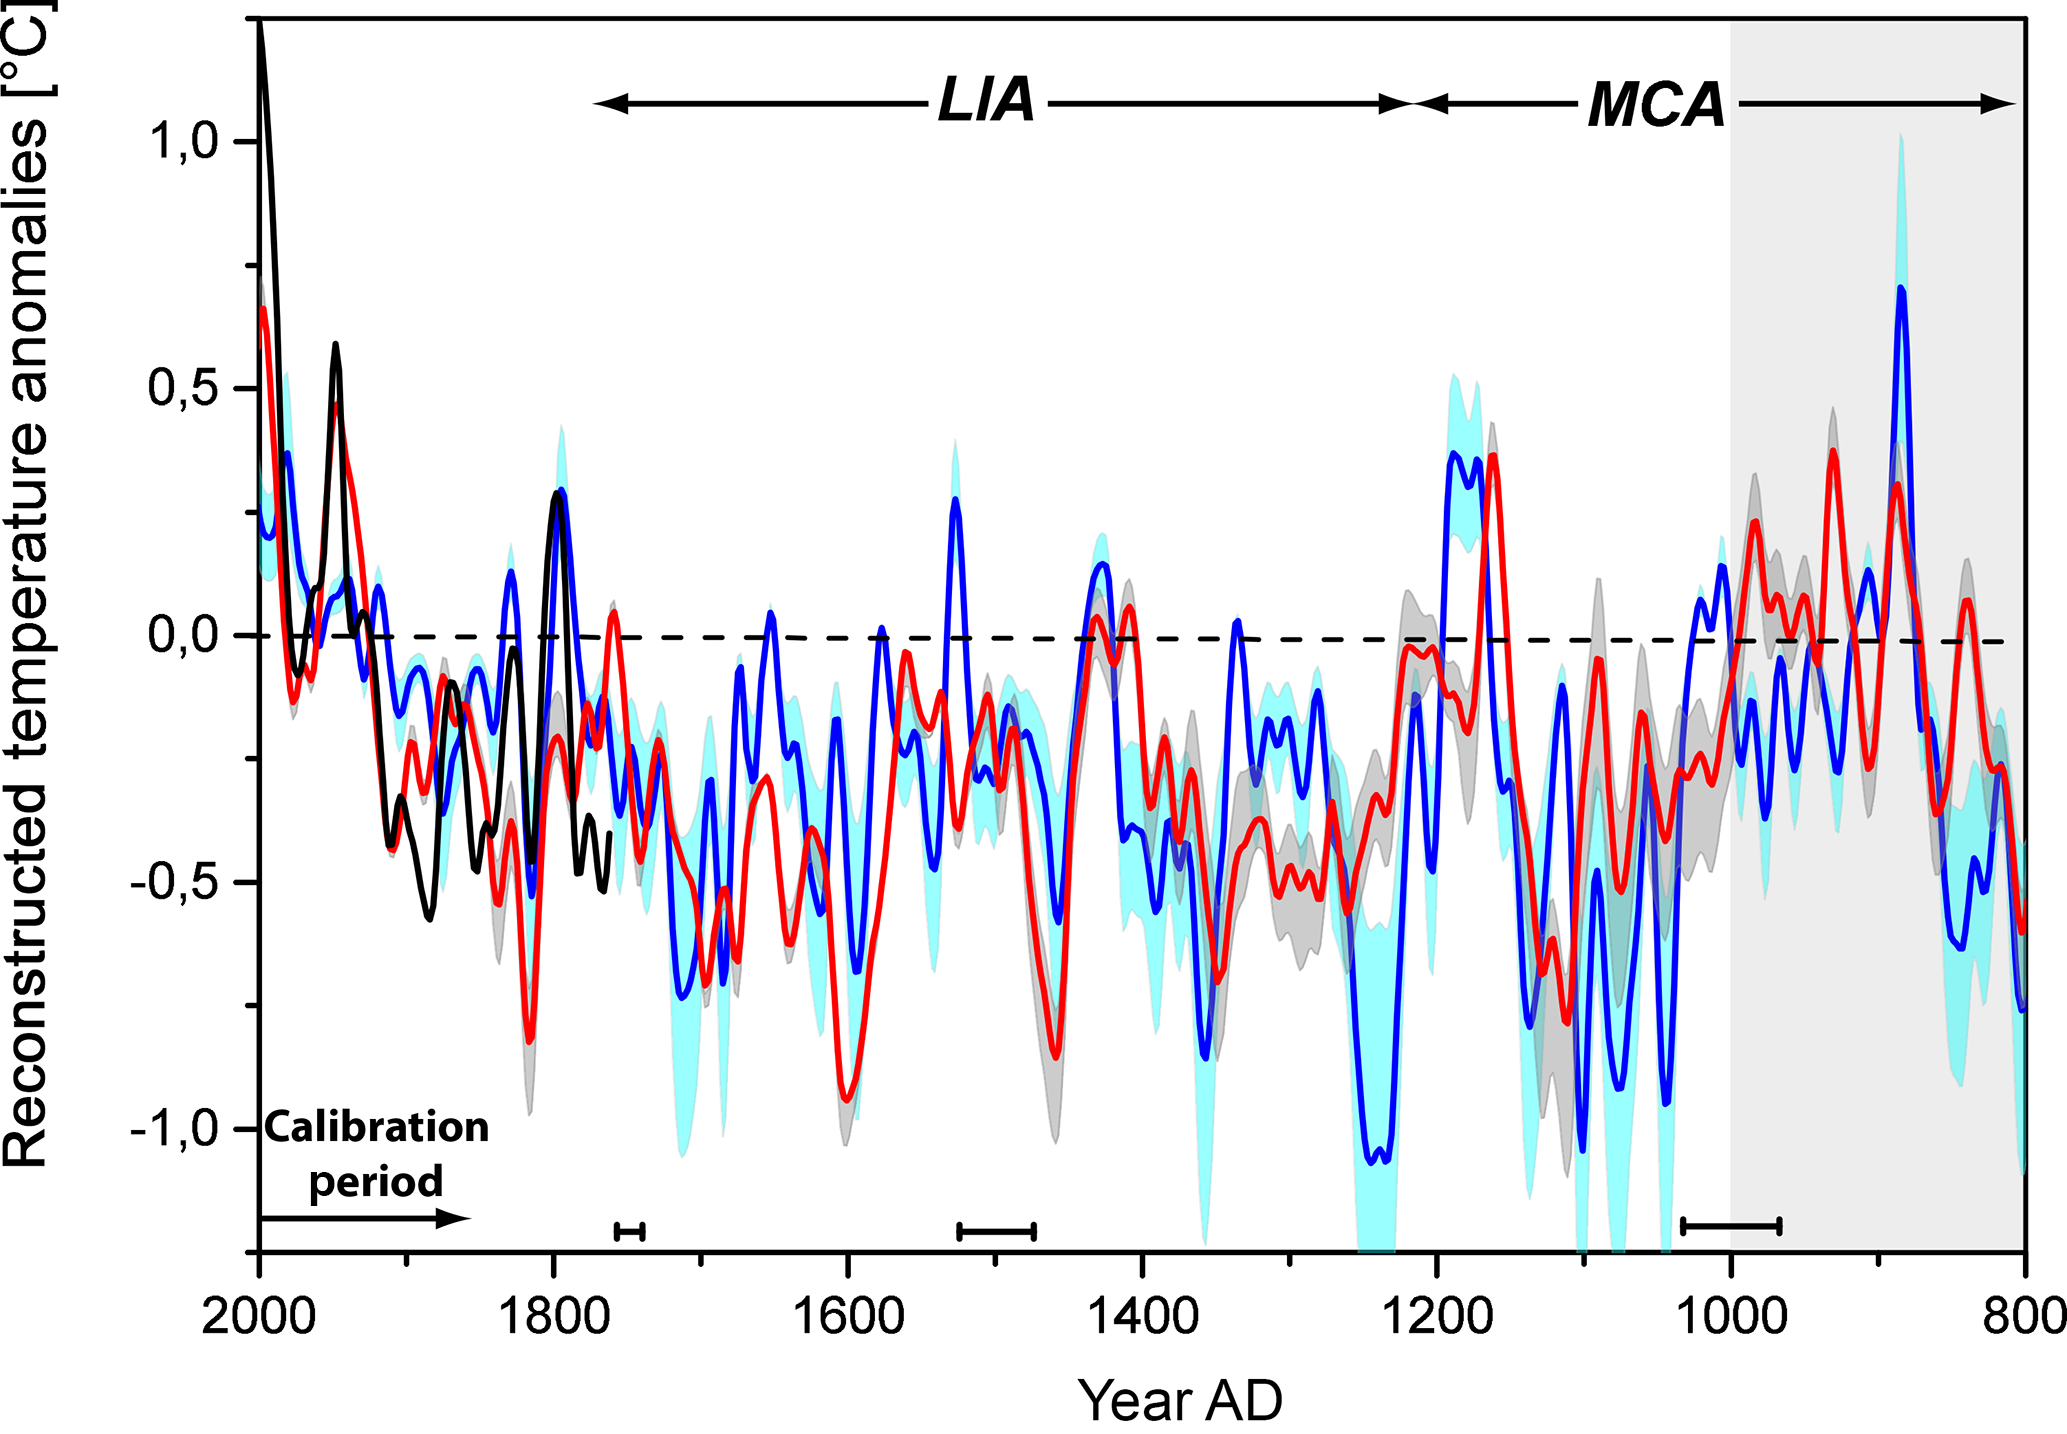
Figure 10Example view on comparing the KCC Ca2+ record with the density profile. Density was measured at high resolution by computer tomography at the Alfred Wegener Institute Bremerhaven (Johannes Freitag, personal communication, 2017). The comparison illustrates the connection between dust content and presumed faster snow consolidation: layers of high dust load coincide with layers of enhanced density (with respect to ambient layers).
5.3 Temperature and mineral dust variability over the last millennium
Based on the above considerations and the agreement within the instrumental period (Fig. 6), the potential of the Ca2+ signal to quantitatively record temperature variability is explored further over the full 1000-year period. For this purpose the biennial logarithmic Ca2+ is calibrated tentatively against instrumental temperature using linear regression within the time period AD 2006–1860. The respective 90 % confidence intervals are used to calculate a temperature reconstruction with uncertainty bands (0.7–1–1.8 ∘ ∕ log Ca2+ (ppb)). Decadal trends are again highlighted by Gaussian smoothing in Fig. 11. The resulting 1000-year record is shown with a tentative 200-year extension. Regarding its overall features and in view of remaining dating uncertainties, the record provides evidence of “Little Ice Age conditions” systematically cooler than the reference and calibration period, with an average of −0.3 ∘C between AD 1800 and 1200. A shorter warm interval of about +0.3 ∘C is found in the late 1100s These features are especially noteworthy considering the above-average mean of the δ18O values with respect to AD 2006–1860 (Fig. 7). The comparison with δ18O suggests that the Ca2+–temperature coupling may be less affected by non-stationary sensitivity (and upstream) effects.

Figure 11Comparison of decadal temperature trends as anomalies with respect to the mean of AD 2006–1860. Shown are calibrated temperatures obtained from the KCC Ca2+ variability (blue lines, with uncertainty indicated as light blue bands). Also shown are instrumental temperature data (black) and the summer temperature reconstruction of Luterbacher et al. (2016) in red (uncertainty as grey bands). Note that the overall co-variation between the two reconstructions persists for at least another 200 years beyond AD 1000 (light grey shaded area). Black bars on the bottom indicate maximum dating uncertainty.
In this context we further explored our Ca2+-based temperature reconstruction attempt in comparison with other proxy reconstructions of European summer temperature. We show here results from using the mean European summer temperature anomalies reconstructed by Luterbacher et al. (2016), considering their composite-plus-scaling method (CPS) adjusted to biennial resolution and our reference time period of AD 2006–1860. The decadal trends (represented by Gaussian smoothing) of both reconstructions shown in Fig. 11 are generally consistent in their overall features (and formally correlate at r=0.4). These features comprise the recent warming trend and below-average conditions during the “Little Ice Age” (LIA), and a warm episode in the late 1100s (“Medieval Climate Anomaly”, MCA). The only major feature of disagreement occurs around the already noted minimum around AD 1250–1230. The overall low levels of impurities (especially NH) and δ18O may point to increased deposition of winter snow during this time, or exceptionally cold summer conditions. It is worth noting that if, tentatively, extending the comparison for another 200 years beyond AD 1000, the agreement between the two reconstructions continues to last until AD 800, consistently showing a relatively warm interval lasting between about AD 1000 and 850. The overall agreement is especially noteworthy in the light of (i) only small offsets exist between the general features of the two records, which may stem from the remaining dating uncertainty of KCC (the comparison is not intended as a dating validation, however), and (ii) the absence of evidence of a non-stationary sensitivity. The magnitude of the general features (LIA, MCA) and decadal-scale temperature variability derived from our ice core record is consistent overall with the other proxy reconstruction.
A potential systematic bias to the observed Ca2+–temperature coupling could arise from strong and long-term changes at the dust source, e.g. increased dust mobilization, which could also affect the long-term Ca2+ variability. At the same time, increased dust mobilization would likely also influence the Saharan dust spikes and their frequency of occurrence. However, we only find one instance of long-term changes in dust occurrence rate – the period AD 1100–1200. Being the most outstanding period in the dust event occurrence, it warrants being looked at more closely. This outstanding period is characterized by (i) an increased frequency of Saharan dust events, (ii) above average levels, both in CPP and deuterium excess, starting to rise around AD 1100, and (iii) a delayed relative increase in δ18O and Ca2+, e.g. first showing minimum concentrations between AD 1130 and 1170 followed by a shorter maximum around AD 1170–1200. The CPP maximum constitutes the dominant feature of the entire record (notably, this result does not depend on the exact threshold chosen to calculate the CPP). The median of the CPP record within this AD 1100–1200 time period (0.61 ± 0.11, reported with one median absolute deviation) indicates an increase in coarse particles by about 12 % relative to the median of the rest of the 1000-year time period (0.48 ± 0.05). While an increase in dust mobilization cannot be ruled out, the connection of the distinct increase in coarse particles with enhanced dust event frequency rather suggests an increase in the direct transport of Saharan dust (as opposed to indirect advection with longer pathway and thus stronger decrease in coarse particles). Finding increased values of deuterium excess supports the view of a relative increase in direct Saharan dust advection, as increased deuterium excess could be expected from warm and dry air masses collecting moisture over the Mediterranean (e.g. Pfahl and Sodemann, 2014). Overall, these findings motivate getting an even more detailed picture of this outstanding period, e.g. using elemental and isotopic fingerprinting of the dust layers for a precise provenance investigation (e.g. Moreno et al., 2006; Ferrat et al., 2011; Meyer et al., 2011), which is left for future investigations.
A combination of state-of-the-art methods in ice core analysis allowed us to date the latest CG ice core KCC with unprecedented confidence. The breakthrough in this respect was to extend annual layer counting, for the first time at CG, over more than the last 1000 years and finding the resulting age scale corroborated by radiocarbon analyses. The combination of high-resolution annual layer counting afforded by LA-ICP-MS with constraints from radiocarbon analyses could be employed with great success also at deep sections of other (mountain) ice cores. By means of the improved age scale it became possible, for the first time, to demonstrate that the inter-core agreement in decadal isotope variability among two cores on the same flow line extends over the last 1000 years. The inter-core agreement suggests a common driver of the shared signal, also extending to the long-term variability in Ca2+. We find substantial agreement among the decadal trends of Ca2+ and temperature at CG, over the entire instrumental period. Since snow preservation plays a key role for the observed coupling between Ca2+ and instrumental temperature, this makes Ca2+ trends at best a site-specific temperature proxy, although it remains to be tested to what degree the association with temperature also holds at other Alpine drilling sites. In contrast to the stable isotope signal at CG, however, we find no evidence of non-stationary temperature sensitivity for Ca2+: considering a constant Ca2+–temperature relationship (i) proves to be consistent with other latest summer temperature reconstructions, and (ii) reproduces overall features regarding the “Little Ice Age” and the “Medieval Climate Anomaly”. Parameters less influenced by snow preservation (dust event occurrence rate and particle size distribution) reveal an exceptional medieval period around AD 1100–1200, suggesting a relative increase in meridional flow and dry conditions over the Mediterranean during that time. Future and ongoing investigations will target the application of our new dating approach to the bottom 10 m w.e. of KCC, and an improved quantitative understanding of the isotope thermometer at CG. In this context a central question remains – whether the isotope-based temperature signal can be reconciled quantitatively with the Ca2+-based reconstruction.
Underlying datasets including time series of stable oxygen isotopes, Ca2+ and reconstructed temperature are available at https://doi.org/10.1594/PANGAEA.883521 (Bohleber et al., 2018).
The supplement related to this article is available online at: https://doi.org/10.5194/cp-14-21-2018-supplement.
The authors declare that they have no conflict of interest.
We are grateful to numerous colleagues for their commitment regarding field
work, ice core drilling and ice core analyses. In particular we would like to
acknowledge the support of the Initiative for the Science of the Human Past
at Harvard University and all its project members. Additional invaluable
support in ice core processing was provided by the Alfred Wegener Institute,
Helmholtz Center for Polar and Marine Research, Bremerhaven (AWI). The
Klaus-Tschira-Lab Mannheim is acknowledged for their support in radiocarbon
analysis. We also would like to thank Johanna Kerch, Carlo Licciulli, Josef
Lier and Lars Zipf from IUP Heidelberg for their support. We thank
Johannes Freitag (AWI Bremerhaven) for the high-resolution density data.
Recovery and analysis of the 2013 CG ice core KCC were supported by the
Arcadia Fund of London (AC3450) and the Helmholtz Climate Initiative REKLIM.
Work on the 2005 CG ice core KCI has been funded by the European Union under
contract ENV4-CT97-0639 (project ALPCLIM) and within the project ALP-IMP
through grant EVK2-CT2002-00148. LA-ICP-MS ice core analyses were conducted
in the Climate Change Institute's W. M. Keck Laser Ice Facility at the
University of Maine supported from the W. M. Keck Foundation and the National
Science Foundation (PLR-1042883, PLR-1203640). Financial support was provided
to Pascal Bohleber by the Deutsche Forschungsgemeinschaft (BO 4246/1-1, BO 4246/3-1).
The Division of Climate and Environmental Physics acknowledges long-term
financial support of ice core research by the Swiss National Science
Foundation (SNSF) and the Oeschger Center for Climate Change Research. We
acknowledge financial support by Deutsche Forschungsgemeinschaft and
Ruprecht-Karls-Universität Heidelberg within the funding programme Open
Access Publishing. We also thank editor Amaelle Landais and two anonymous
referees for their valuable comments that helpful suggestions. We would like
to especially thank and acknowledge our late colleague Dietmar Wagenbach
(Heidelberg University) for his long-standing contributions to glaciological
research at Colle Gnifetti, and in particular for sharing his unique
expertise with us at the early stage of our project.
Edited by: Amaelle Landais
Reviewed by: two anonymous referees
Ahmed, M., Anchukaitis, K. J., Asrat, A., et al.: Continental-scale temperature variability during the past two millennia, Nat. Geosci., 6, 339–346, 2013. a
Alean, J., Haeberli, W., and Schädler, B.: Snow accumulation, firn temperature and solar radiation in the area of the Colle Gnifetti core drilling site (Monte Rosa, Swiss Alps): distribution patterns and interrelationships, Zeitschrift für Gletscherkunde und Glazialgeologie, 19, 131–147, 1983. a, b
Andersen, K. K., Svensson, A., Johnsen, S. J., Rasmussen, S. O., Bigler, M., Röthlisberger, R., Ruth, U., Siggaard-Andersen, M.-L., Steffensen, J. P., Dahl-Jensen, D., Vinther, B. M., and Clausen, H. B.: The Greenland ice core chronology 2005, 15–42ka. Part 1: Constructing the time scale, Quaternary Sci. Rev., 25, 3246–3257, 2006. a
Bohleber, P., Wagenbach, D., Schöner, W., and Böhm, R.: To what extent do water isotope records from low accumulation Alpine ice cores reproduce instrumental temperature series?, Tellus B, 65, 20148, https://doi.org/10.3402/tellusb.v65i0.20148, 2013. a, b, c, d, e, f, g, h
Bohleber, P., Erhardt, T., Spaulding, N., Hoffmann, H., Fischer, H., and Mayewski, P.: Temperature and mineral dust variability recorded of ice core Colle_Gnifetti_KCC, PANGAEA, available at: https://doi.org/10.1594/PANGAEA.883521, last access: 10 January 2018.
Brook, E. J., Wolff, E., Dahl-Jensen, D., Fischer, H., Steig, E. J.: The future of ice coring: international partnerships in ice core sciences (IPICS), PAGES news, 14, 6–10, 2006. a
Della Lunga, D., Müller, W., Rasmussen, S. O., Svensson, A., and Vallelonga, P.: Calibrated cryo-cell UV-LA-ICPMS elemental concentrations from the NGRIP ice core reveal abrupt, sub-annual variability in dust across the GI-21.2 interstadial period, The Cryosphere, 11, 1297–1309, https://doi.org/10.5194/tc-11-1297-2017, 2017. a, b
Fauve, M., Rhyner, H., and Schneebeli, M.: Pistenpräparation und Pistenpflege: ein Handbuch für den Praktiker, Eidgen. Inst. für Schnee-u. Lawinenforschung, Davos, Switzerland, 2002. a
Ferrat, M., Weiss, D. J., Strekopytov, S., Dong, S., Chen, H., Najorka, J., Sun, Y., Gupta, S., Tada, R., and Sinha, R.: Improved provenance tracing of Asian dust sources using rare earth elements and selected trace elements for palaeomonsoon studies on the eastern Tibetan Plateau, Geochim. Cosmochim. Ac., 75, 6374–6399, https://doi.org/10.1016/j.gca.2011.08.025, 2011. a
Fisher, D. A. and Koerner, R. M.: The effects of wind on δ(18O) and accumulation give an inferred record of seasonal δ amplitude from the Agassiz ice cap, Ellesmere Island, Canada, Ann. Glaciol., 10, 34–37, 1988. a
Gabrielli, P., Barbante, C., Bertagna, G., Bertó, M., Binder, D., Carton, A., Carturan, L., Cazorzi, F., Cozzi, G., Dalla Fontana, G., Davis, M., De Blasi, F., Dinale, R., Dragà, G., Dreossi, G., Festi, D., Frezzotti, M., Gabrieli, J., Galos, S. P., Ginot, P., Heidenwolf, P., Jenk, T. M., Kehrwald, N., Kenny, D., Magand, O., Mair, V., Mikhalenko, V., Lin, P. N., Oeggl, K., Piffer, G., Rinaldi, M., Schotterer, U., Schwikowski, M., Seppi, R., Spolaor, A., Stenni, B., Tonidandel, D., Uglietti, C., Zagorodnov, V., Zanoner, T., and Zennaro, P.: Age of the Mt. Ortles ice cores, the Tyrolean Iceman and glaciation of the highest summit of South Tyrol since the Northern Hemisphere Climatic Optimum, The Cryosphere, 10, 2779–2797, https://doi.org/10.5194/tc-10-2779-2016, 2016. a
Haeberli, W. and Funk, M.: Borehole temperatures at the Colle Gnifetti core-drilling site (MonteRosa, Swiss Alps), J. Glaciol., 37, 37–46, 1991. a
Haeberli, W., Schotterer, U., Wagenbach, D., Schwitter, H. H., and Bortenschlager, S.: Accumulation characteristics on a cold, high-Alpine firn saddle from a snow-pit study on Colle Gnifetti, Monte Rosa, Swiss Alps, J. Glaciol., 29, 260–271, 1983. a, b, c, d
Haeberli, W., Schmid, W., and Wagenbach, D.: On the geometry, flow and age of firn and ice at the Colle Gnifetti core drilling site (Monte Rosa, Swiss Alps), Zeitschrift für Gletscherkunde und Glazialgeologie, 24, 1–19, 1988. a
Haines, S. A., Mayewski, P. A., Kurbatov, A. V., Maasch, K. A., Sneed, S. B., Spaulding, N. E., Dixon, D. A., and Bohleber, P. D.: Ultra-high resolution snapshots of three multi-decadal periods in an Antarctic ice core, J. Glaciol., 62, 31–36, 2016. a, b
Hoelzle, M., Darms, G., Lüthi, M. P., and Suter, S.: Evidence of accelerated englacial warming in the Monte Rosa area, Switzerland/Italy, The Cryosphere, 5, 231–243, https://doi.org/10.5194/tc-5-231-2011, 2011. a
Hoffmann, H., Friedrich, R., Kromer, B., and Fahrni, S.: Status report: Implementation of gas measurements at the MAMS 14C AMS facility in Mannheim, Germany, Nucl. Instrum. Meth. B, 410, 184–187, https://doi.org/10.1016/j.nimb.2017.08.018, 2017a. a
Hoffmann, H., Preunkert, S., Legrand, M., Leinfelder, D., Bohleber, P., Friedrich, R., and Wagenbach, D.: A New Sample Preparation System for Micro-14C Dating of Glacier Ice with a First Application to a High Alpine Ice Core from Colle Gnifetti (Switzerland), Radiocarbon, 1–17, https://doi.org/10.1017/RDC.2017.99, 2017b. a, b
Jenk, T. M., Szidat, S., Bolius, D., Sigl, M., Gäggeler, H. W., Wacker, L., Ruff, M., Barbante, C., Boutron, C. F., and Schwikowski, M.: A novel radiocarbon dating technique applied to an ice core from the Alps indicating late Pleistocene ages, J. Geophys. Res., 114, D14305, https://doi.org/10.1029/2009JD011860, 2009. a, b
Kellerhals, T., Brütsch, S., Sigl, M., Knüsel, S., Gäggeler, H. W., and Schwikowski, M.: Ammonium concentration in ice cores: A new proxy for regional temperature reconstruction?, J. Geophys. Res.-Atmos., 115, D16123, https://doi.org/10.1029/2009JD012603, 2010a. a
Kellerhals, T., Tobler, L., Brütsch, S., Sigl, M., Wacker, L., Gäggeler, H. W., and Schwikowski, M.: Thallium as a tracer for preindustrial volcanic eruptions in an ice core record from Illimani, Bolivia, Environ. Sci. Techol., 44, 888–893, 2010b. a
Konrad, H., Bohleber, P., Wagenbach, D., Vincent, C., and Eisen, O.: Determining the age distribution of Colle Gnifetti, Monte Rosa, Swiss Alps, by combining ice cores, ground-penetrating radar and a simple flow model, J. Glaciol., 59, 179–189, 2013. a
Lisiecki, L. E. and Lisiecki, P. A.: Application of dynamic programming to the correlation of paleoclimate records, Paleoceanography, 17, 1049, https://doi.org/10.1029/2001PA000733, 2002. a, b
Luongo, M. T., Kurbatov, A. V., Erhardt, T., Mayewski, P. A., McCormick, M., More, A. F., Spaulding, N. E., Wheatley, S. D., Yates, M. G., and Bohleber, P. D.: Possible Icelandic Tephra Found in European Colle Gnifetti Glacier, Geochem. Geophy. Geosy., 18, 3904–3909, https://doi.org/10.1002/2017GC007022, 2017. a
Luterbacher, J., Werner, J., Smerdon, J. E., et al.: European summer temperatures since Roman times, Environ. Res. Lett., 11, 024001, https://doi.org/10.1088/1748-9326/11/2/024001, 2016. a, b
Lüthi, M. P. and Funk, M.: Dating ice cores from a high Alpine glacier with a flow model for cold firn, Ann. Glaciol., 31, 69–79, 2000. a
Mayewski, P. A., Sneed, S. B., Birkel, S. D., Kurbatov, A. V., and Maasch, K. A.: Holocene warming marked by abrupt onset of longer summers and reduced storm frequency around Greenland, J. Quaternary Sci., 29, 99–104, https://doi.org/10.1002/jqs.2684, 2014. a, b
Meyer, I., Davies, G. R., and Stuut, J.-B. W.: Grain size control on Sr-Nd isotope provenance studies and impact on paleoclimate reconstructions: An example from deep-sea sediments offshore NW Africa, Geochem. Geophy. Geosy., 12, q03005, https://doi.org/10.1029/2010GC003355, 2011. a
More, A. F., Spaulding, N. E., Bohleber, P., Handley, M. J., Hoffmann, H., Korotkikh, E. V., Kurbatov, A. V., Loveluck, C. P., Sneed, S. B., McCormick, M., and Mayewski, P. A.: Next generation ice core technology reveals true minimum natural levels of lead (Pb) in the atmosphere: insights from the Black Death, GeoHealth, 1, 211–219, https://doi.org/10.1002/2017GH000064, 2017. a, b
Moreno, T., Querol, X., Castillo, S., Alastuey, A., Cuevas, E., Herrmann, L., Mounkaila, M., Elvira, J., and Gibbons, W.: Geochemical variations in aeolian mineral particles from the Sahara–Sahel Dust Corridor, Chemosphere, 65, 261–270, https://doi.org/10.1016/j.chemosphere.2006.02.052, 2006. a
Mudelsee, M.: Climate Time Series Analysis, Springer, Dordrecht, the Netherlands, 2010. a
Nye, J.: Correction factor for accumulation measured by the thickness of the annual layers in an ice sheet, J. Glaciol., 4, 785–788, 1963. a
Pfahl, S. and Sodemann, H.: What controls deuterium excess in global precipitation?, Clim. Past, 10, 771–781, https://doi.org/10.5194/cp-10-771-2014, 2014. a
Preunkert, S. and Wagenbach, D.: An automatic recorder for air/firn transfer studies of chemical aerosol species at remote glacier sites, Atmos. Environ., 32, 4021–4030, 1998. a
Preunkert, S., Wagenbach, D., Legrand, L., and Vincent, C.: Col du Dôme (Mt Blanc Massif, French Alps) suitability for ice-core studies in relation with past atmospheric chemistry over Europe, Tellus, 52B, 993–1012, 2000. a, b
Prodi, F. and Fea, G.: A case of transport and deposition of Saharan dust over the Italian peninsula and southern Europe, J. Geophys. Res.-Oceans (1978–2012), 84, 6951–6960, 1979. a
Ramsey, B.: C. OxCal Program v4. 2.4, Radiocarbon Accelerator Unit, Univ. Oxford, Oxford, UK, 2016. a
Rasmussen, S. O., Andersen, K. K., Svensson, A., Steffensen, J. P., Vinther, B. M., Clausen, H. B., Siggaard-Andersen, M.-L., Johnsen, S. J., Larsen, L. B., Dahl-Jensen, D., Bigler, M., Röthlisberger, R., Fischer, H., Goto-Azuma, K., Hansson, M. E., and Ruth, U.: A new Greenland ice core chronology for the last glacial termination, J. Geophys. Res.-Atmos., 111, D06102, https://doi.org/10.1029/2005JD006079, 2006. a
Rozanski, K., Araguas-Araguas, L., and Gonfiantini, R.: Relation Between Long-Term Trends of Oxygen-18 Isotope Composition of Precipitation and Climate, Science, 258, 981–985, 1992. a
Ruth, U., Wagenbach, D., Steffensen, J. P., and Bigler, M.: Continuous record of microparticle concentration and size distribution in the central Greenland NGRIP ice core during the last glacial period, J. Geophys. Res.-Atmos., 108, 4098, https://doi.org/10.1029/2002JD002376, 2003. a
Schwerzmann, A., Funk, M., Blatter, H., Lüthi, M., Schwikowski, M., and Palmer, A.: A method to reconstruct past accumulation rates in alpine firn regions: A study on Fiescherhorn, Swiss Alps, J. Geophys. Res.-Earth, 111, F01014, https://doi.org/10.1029/2005JF000283, 2006. a
Schwikowski, M., Seibert, P., Baltensperger, U., and Gaggeler, H.: A study of an outstanding Saharan dust event at the high-alpine site Jungfraujoch, Switzerland, Atmos. Environ., 29, 1829–1842, 1995. a, b
Sneed, S. B., Mayewski, P. A., Sayre, W. G., Handley, M. J., Kurbatov, A. V., Taylor, K. C., Bohleber, P., Wagenbach, D., Erhardt, T., and Spaulding, N. E.: New LA-ICP-MS cryocell and calibration technique for sub-millimeter analysis of ice cores, J. Glaciol., 61, 233–242, 2015. a, b, c, d
Sodemann, H., Palmer, A. S., Schwierz, C., Schwikowski, M., and Wernli, H.: The transport history of two Saharan dust events archived in an Alpine ice core, Atmos. Chem. Phys., 6, 667–688, https://doi.org/10.5194/acp-6-667-2006, 2006. a
Spaulding, N. E., Sneed, S. B., Handley, M. J., Bohleber, P., Kurbatov, A. V., Pearce, N. J., Erhardt, T., and Mayewski, P. A.: A New Multielement Method for LA-ICP-MS Data Acquisition from Glacier Ice Cores, Environ. Sci. Technol., 51, 13282–13287, https://doi.org/10.1021/acs.est.7b03950, 2017. a, b
Stuiver, M. and Polach, H.: Discussion: Reporting of 14C data, Radiocarbon, 19, 355–363, 1977. a
Thevenon, F., Anselmetti, F. S., Bernasconi, S. M., and Schwikowski, M.: Mineral dust and elemental black carbon records from an Alpine ice core (Colle Gnifetti glacier) over the last millennium, J. Geophys. Res.-Atmos., 114, D17102, https://doi.org/10.1029/2008JD011490, 2009. a, b, c
Uglietti, C., Zapf, A., Jenk, T. M., Sigl, M., Szidat, S., Salazar, G., and Schwikowski, M.: Radiocarbon dating of glacier ice: overview, optimisation, validation and potential, The Cryosphere, 10, 3091–3105, https://doi.org/10.5194/tc-10-3091-2016, 2016. a
Wagenbach, D.: Environmental Records in Alpine Glaciers, in: The Environmental Record in Glaciers and Ice Sheets, edited by: Oeschger, H. and Langway Jr., C. C., John Wiley and Sons, New York, USA, 69–83, 1989. a
Wagenbach, D.: Special problems of mid-latitude glacier ice-core research, in: Greenhouse Gases, Isotopes and Trace Elements in Glaciers as Climatic Evidence of the Holocene, vol. Arbeitsheft Nr. 14 of “Report of the ESF/EPC Workshop, Zürich 27–28 October 1992”, Versuchsanstalt für Wasserbau, Hydrologie und Glaziologie der Eidgenössischen Technischen Hochschule Zürich, Zürich, Switzerland, 1992. a, b, c
Wagenbach, D. and Geis, K.: The mineral dust record in a high altitude glacier (Colle Gnifetti, Swiss Alps), in: Paleoclimatology and Paleometeorology: Modern and Past Patterns of Global Atmospheric transport, edited by: Wagenbach, D. and Geis, K., Kluwer Academic Publishers, Dordrecht, the Netherlands, 543–564 1989. a, b, c
Wagenbach, D., Preunkert, S., Schäfer, J., Jung, W., and Tomadin, L.: Northward transport of Saharan dust recorded in a deep Alpine ice core, in: The impact of desert dust across the Mediterranean, Springer, Dordrecht, the Netherlands, 291–300, 1996. a, b, c, d, e, f, g, h
Wagenbach, D., Bohleber, P., and Preunkert, S.: Cold alpine ice bodies revisited: What may we learn from their isotope and impurity content?, Geogr. Ann. Phys., 94, 245–263, 2012. a, b, c, d