the Creative Commons Attribution 4.0 License.
the Creative Commons Attribution 4.0 License.
 | 23 Nov 2018
A Late Quaternary climate record based on long-chain diol proxies from the Chilean margin
Marijke W. de Bar
Dave J. Stolwijk
Jerry F. McManus
Jaap S. Sinninghe Damsté
Stefan Schouten
In this study we have applied different indices based on long-chain diols, i.e., the long-chain diol index (LDI) as a proxy for past SST, the diol index as an indicator of past upwelling conditions, and the nutrient diol index (NDI) as a proxy for nitrate and phosphate concentrations in seawater. The proxies were analyzed in marine sediments recovered at ODP Site 1234, located within the Peru–Chile upwelling system, with a ∼2 kyr resolution covering the last 150 kyr. We also generated TEX and U temperature and planktonic δ18O records, as well as total organic carbon (TOC) and accumulation rates (ARs) of TOC and lipid biomarkers (i.e., C37 alkenones, GDGTs, dinosterol, and loliolide) to reconstruct past phytoplankton production. The LDI-derived SST record covaries with TEX- and U-derived SST records as well as with the planktonic δ18O record, implying that the LDI reflects past SST variations at this site. TOC and phytoplankton AR records indicate increased export production during the last interglacial (MIS 5), simultaneous with a peak in the abundance of preserved Chaetoceros diatoms, suggesting intensified upwelling during this period. The diol index is relatively low during the upwelling period, but peaks before and after this period, suggesting that Proboscia diatoms were more abundant before and after the period of upwelling. The NDI reveals the same trends as the diol index, suggesting that the input of nitrate and phosphate was minimal during upwelling, which is unrealistic. We suggest that the diol index and NDI should perhaps be considered as indicators for Proboscia productivity instead of upwelling conditions or nutrient concentrations.
- Article
(9330 KB) - Full-text XML
- BibTeX
- EndNote


Paleoclimatic reconstructions typically rely on physical, biological, and geochemical proxies from sedimentary archives. Physical proxies include sediment composition, structure, grain size, density, and magnetic susceptibility, which may provide information on the paleodepositional environment. Biological proxies comprise preserved (micro)organisms such as diatoms, foraminifera, dinoflagellates, corals, and mollusks or remnants deriving from higher plants such as pollen and spores. Geochemical proxies are based on the chemical composition of either the sediment or fossilized organisms. Stable isotope and elemental concentrations are inorganic proxies typically measured in shells or skeletons of marine organisms (foraminifera, mollusks, corals) preserved in the sediment, providing insight into the chemistry of the seawater in which the organisms lived. Organic proxies are a relatively newer class of tools based on fossilized molecules that are unique for a specific organism or group of organisms, referred to as biomarkers. The ratios of specific biomarker molecules are often related to physical parameters of the environment in which the source organism grew, such as temperature, salinity, oxygen availability, or productivity, and therefore such organic proxies can also be applied to reconstruct past depositional environments (e.g., Brassell et al., 1986; Prahl and Wakeham, 1987; Schouten et al., 2002; Rampen et al., 2008, 2012; Willmott et al., 2010; Gal et al., 2018).
In the last decade long-chain diols (LCDs) have attracted attention as novel proxies to reconstruct past environmental conditions. The long-chain diol index (LDI) was proposed based on the distribution of C28 and C30 1,13- and 1,15-diols in marine surface sediments, which shows a good correlation with mean annual sea surface temperature (SST; Rampen et al., 2012). These compounds have been detected in cultures of Eustigmatophyte algae (e.g., Volkman et al., 1992, 1999; Méjanelle et al., 2003; Rampen et al., 2014a), but the LCD distributions observed are different to those observed in the marine realm (e.g., Versteegh et al., 1997, 2000; Rampen et al., 2012, 2014a), and hence their role as LCD producers in the ocean remains uncertain. The diol index, which is an indicator for past upwelling and high nutrient conditions, is defined as the fractional abundance of 1,14-diols with respect to 1,13-diols (Willmott et al., 2010) or the C30 1,15-diol (Rampen et al., 2008), and 1,14-diols are biomarkers for Proboscia diatoms (Sinninghe Damsté et al., 2003; Rampen et al., 2014b). Proboscia grows during the early stages of upwelling since they need relatively little silica and they are able to migrate to deeper waters to obtain nutrients (Koning et al., 2001); therefore, it was proposed that the relative abundance of 1,14-diols can trace past upwelling conditions. C28, C30, and C32 1,14-diols have also been observed in the marine dictyochophyte Apedinella radians (Rampen et al., 2011) but its role as a 1,14-diol producer in the marine realm is unknown. Recently, a new index based on the saturated and monounsaturated C28 1,14-diol was proposed as a quantitative proxy for nitrate and phosphate concentrations (Gal et al., 2018), called the nutrient diol index (NDI). The authors found a strong positive correlation between the NDI and phosphate (R2=0.85) and nitrate (R2=0.80) concentrations for the marine sediment datasets of Rampen et al. (2014b) and de Bar et al. (2016). This suggests that the NDI might be a good indicator of past nutrient variations in surface waters.
Applications in sediment cores of these LCD proxies have shown that the LDI, as well as the diol index, is a promising paleotemperature and paleo-upwelling indicator (e.g., Pancost et al., 2009; Lopes dos Santos et al., 2012; Rampen et al., 2012; Seki et al., 2012; Rodrigo-Gámiz et al., 2014; Plancq et al., 2015; Jonas et al., 2017). However, a number of uncertainties still exist in the application of these biomarkers. For example, recent studies of surface sediments from coastal regions reveal different 1,13- and 1,15-diol distributions compared to open ocean sediments (de Bar et al., 2016; Lattaud et al., 2017a, b). Relatively high fractional abundances of the C32 1,15-diol along the coast were observed as a result of riverine input, significantly affecting the LDI signal, likely due to different 1,13- and/or 1,15-diol producers thriving in river outflow waters. Moreover, studies have related high Proboscia diatom abundances to stratified instead of upwelling conditions (e.g., Fernández and Bode, 1994). Similarly, Contreras et al. (2010) determined the relative abundance of the C28 1,14-diol at ODP Site 1229 located in the Peruvian upwelling system, and observed increased concentrations during the last interglacial (LIG; MIS 5e), and related this to enhanced water column stratification. Furthermore, Rodrigo-Gámiz et al. (2015) showed that for sediment traps and surface sediments around Iceland, which were characterized by high concentrations of 1,14-diols (> 75 % of all LCDs), the LDI did not correspond to SST. This makes the application of the LDI at sites with high input of diols from Proboscia diatoms (e.g., upwelling sites) uncertain. Finally, due to its recent development no studies have been performed yet to test the applicability of the NDI as a paleo-nutrient proxy.
To constrain the uncertainties in applying the LCD proxies (LDI, diol index, and NDI) at sites with upwelling and riverine input, we studied the Late Quaternary sedimentary record at ODP Site 1234. This site is located along the Chilean margin within the Chile–Peruvian upwelling system and near two major river mouths of the Andean river systems Río Biobío and Río Itata, both draining large basins (Muratli et al., 2010a). We sampled the last ∼150 kyr, including glacial and interglacial periods, and generated LDI-,TEX86-, and U-based temperature records to constrain glacial–interglacial variations in SST throughout this entire interval. Additionally, we compared the diol index and the NDI record with other paleoproductivity indicators, including total organic carbon (TOC), organic matter stable carbon isotopes (δ13C) and phytoplanktonic lipid biomarkers that are characteristic for certain phytoplankton communities (C37 alkenones, loliolide, and dinosterol).
2.1 Study site
Marine sediments along the coast of Chile and Peru have been thoroughly studied, as it is a key region in the Southern Hemisphere for studying climate variability related to both atmospheric and oceanographic circulation (e.g., Lamy et al., 1998, 1999, 2002, 2004; Hebbeln et al., 2000, 2002; Mohtadi and Hebbeln, 2004; Stuut and Lamy, 2004; Heusser et al., 2006; Romero et al., 2006; Mohtadi et al., 2008; Muratli et al., 2010a, b; Verleye and Louwye, 2010; Chase et al., 2014). The main circulation patterns include the southern westerly winds (SWWs) and the Antarctic Circumpolar Current (ACC; Fig. 1). The ACC approaches the South American continent from the west and initiates both the Humboldt Current (or Peru–Chile Current) flowing northwards along the continental margin and the Cape Horn Current flowing southwards (e.g., Stuut et al., 2006; Fig. 1). The Humboldt Current flows along the Chilean coast and turns westwards as it approaches the Equator, forming the South Equatorial Current (SEC). Variations in the strength and location of the ACC and southern westerlies are thought to be the main climate controls in this region. Lamy et al. (2002) showed that long-term Holocene trends in temperature and productivity are linked to latitudinal shifts of the ACC and the westerlies. On a millennial to multidecennial scale, paleotemperature variations are strongly connected to millennial-scale climate variations in Antarctica. When the ACC migrates northward, potentially associated with an expansion of Antarctic sea ice, cold subantarctic waters are advected into the Southern Hemisphere midlatitudes, including the Chilean margin (e.g., Lamy et al., 2004; Kaiser et al., 2005). The subtropical high-pressure system is an important climate control north of 33∘ S, which can enhance coastal upwelling (Mohtadi and Hebbeln, 2004).
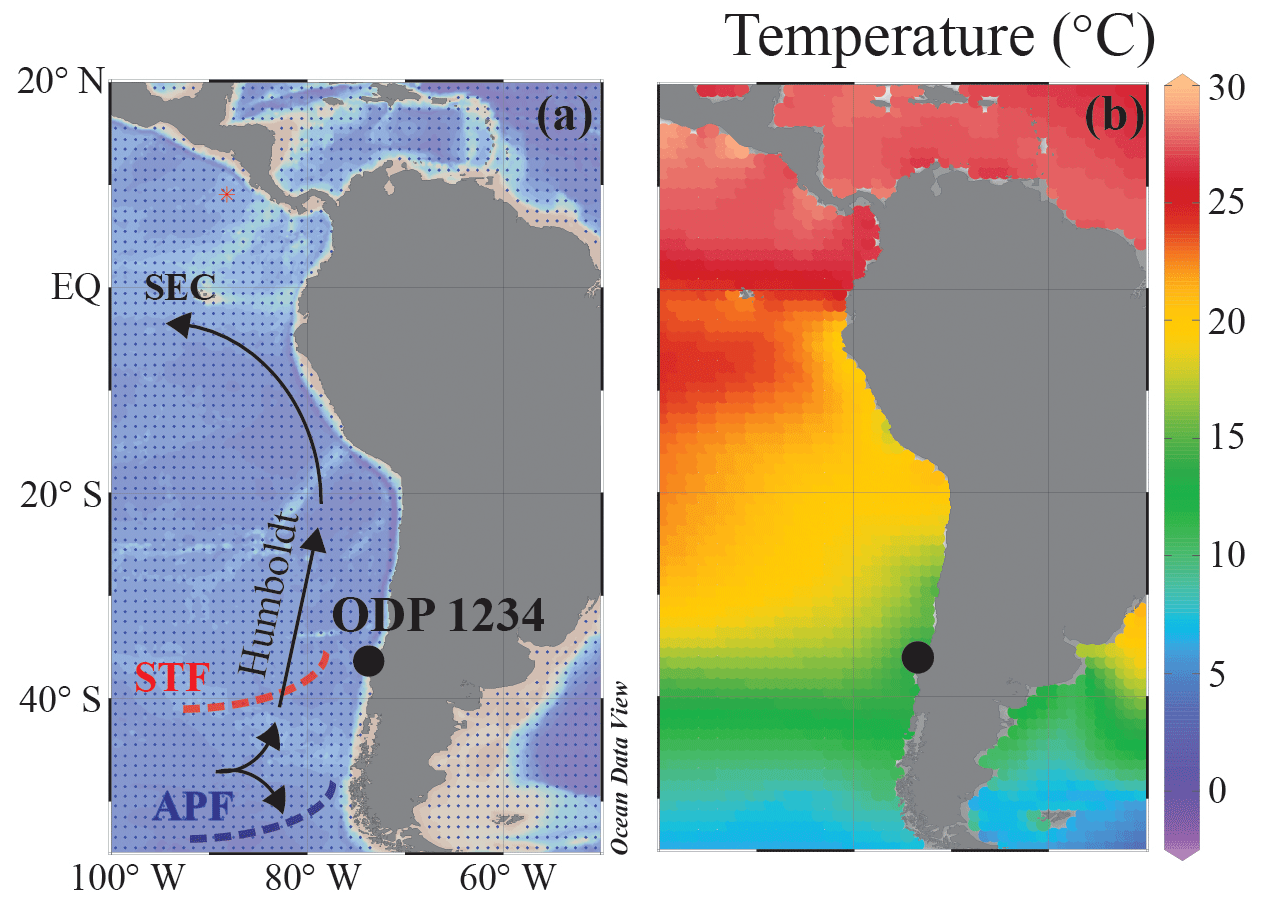
Figure 1Maps showing the location of ODP Site 1234. (a) A simplified illustration of the present-day atmospheric and oceanographic setting and the site location. SEC: South Equatorial Current; APF: Antarctic Polar Front; STF: subtropical front. (b) Present-day mean annual SST (∘C) for the region. Data derived from the World Ocean Atlas 2013 (Locarnini et al., 2013); maps were drawn in Ocean Data View (Schlitzer, 2015) and modified manually.
ODP Site 1234 is located in the southeast Pacific Ocean (36∘13.153′ S, 73∘40.902′ W; 1015 m water depth), ca. 65 km offshore of Concepción, Chile. This site lies in the vicinity of two large Andean river systems: the Río Biobío and Río Itata, which drain basins of 24 000 and 11 200 km2, respectively (Muratli et al., 2010a). The continental margin is under the influence of terrestrial input due to rainfall and land erosion (Lamy et al., 2004), and terrestrial material deposited along the coastal margin derives mainly from two mountain ranges, i.e., the Coast Range and the Andes (Lopez-Escobar et al., 1977; Martin et al., 1999). Moreover, ODP Site 1234 is located within the Peru–Chile upwelling system, which is one of the most important upwelling regions on Earth (Berger et al., 1987) due to the combination of upwelling-favorable winds (Daneri et al., 2000; Carr and Kearns, 2003) and an eastern boundary current (Humboldt Current). The upwelling regime stretches from 5 to 38∘ S, corresponding to ca. 5000 km of coastline. South of 38∘ S, onshore winds suppress upwelling (Strub et al., 1998), but high productivity is sustained by relatively high nutrient supply from the ACC (Hebbeln et al., 2000), which is typically rich in nitrate and limited in micronutrients such as iron (de Baar et al., 1995). Along the Chilean coast, iron availability (as well as other micronutrients) can increase due to fluvial supply as the precipitation of the southern westerlies onshore enhances river runoff (Mohtadi and Hebbeln, 2004).
2.2 Age model and sample strategy
The core was drilled as part of Ocean Drilling Program (ODP) Leg 202. Sedimentation rates were relatively high (∼80 cm kyr−1 on average; Mix et al., 2003; Heusser et al., 2006). The age model used is from Heusser et al. (2006) and is based upon radiocarbon dates and the correlation of benthic δ18O with deep Atlantic core MD95204 (upper half) and the Vostok ice core chronology (lower half; see Heusser et al., 2006 and references therein). Heusser et al. (2006) switched between the two age models around 69 ka where they overlap, as indicated by the dashed line in Fig. 2a. However, this results in a substantial, and likely unrealistic, dip in the sedimentation rate between ca. 80 and 90 ka in the hiatus between the age models (Fig. 2b). Hence, we chose to use the upper age model (dark blue in Fig. 2), which extends up to ∼83 ka, and linearly interpolate between this age and the age of ∼90 ka constrained by the other age model for the lower half of the core. This depth–age range of linear interpolation between the two age models is highlighted in green in Fig. 2 and results in less abrupt changes in sedimentation rates. The core was sampled with a ∼2 kyr resolution covering the last ∼150 kyr. In total, 74 sediment samples were analyzed for bulk and organic geochemistry.
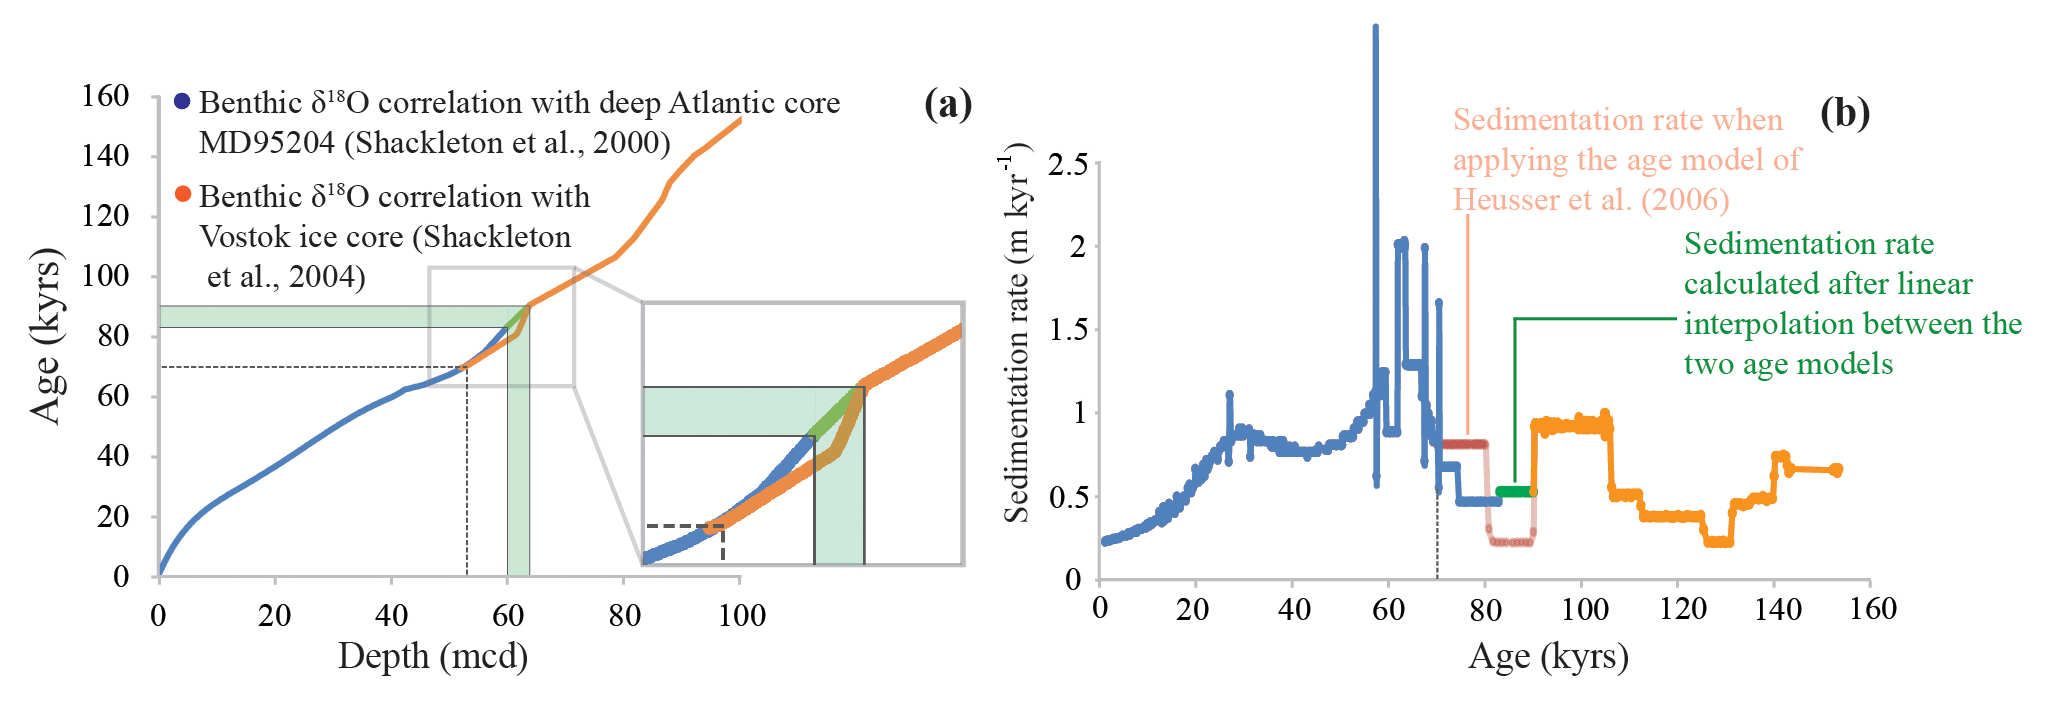
Figure 2Age–depth relations for ODP 1234 derived from Heusser et al. (2006). (a) Age–depth constraints based on the correlation of benthic δ18O with Atlantic core MD95204 (dark blue; upper half) and the Vostok ice core chronology (orange; lower half). Heusser et al. (2006) switched between the two different age models at ∼69 ka and ∼53 mcd (dashed line). However, we used the full upper age model and then linearly interpolated between the age models from ∼60 to 64 mcd, as indicated by the connecting green line. (b) Sedimentation rates were calculated after linear interpolation between the age–depth tie points of the two age models. The sedimentation rates calculated after the linear interpolation between the age models are presented in green. In transparent red, the sedimentation rates are plotted when applying the dating strategy of Heusser et al. (2006).
2.3 Elemental analysis
All 74 sediment samples were freeze-dried and homogenized. Small aliquots (ca. 50–100 mg) were used for elemental analysis. For this purpose, all aliquots were acidified with 2 M hydrochloric acid (HCl) to remove all carbonates and rinsed with distilled water to remove salts. Subsequently, the decalcified sediment samples were analyzed for total organic carbon (TOC), total nitrogen (TN), and stable carbon isotope ratios (δ13C) by means of a Thermo Scientific Flash 2000 elemental analyzer coupled to a Thermo Scientific Delta V Advantage isotope ratio mass spectrometer. Total nitrogen (TN) was measured on aliquots that were not acidified. Results are expressed in standard δ notation relative to Vienna Pee Dee Belemnite (VPDB) for δ13C. The precision as determined using laboratory standards calibrated to certified international reference standards was in all cases < 0.2 ‰. TOC mass accumulation rates (ARs; MARTOC) were calculated by multiplication of the sedimentation rate (linear interpolation between depth points of the age–depth model; see above) with an estimated bulk density of 1.6 g cm−3 (Mix et al., 2003) and subsequent multiplication with the TOC percentage.
2.4 Foraminiferal stable isotope analysis
Benthic stable isotope data were previously published and were generated using standard techniques in laboratories at Oregon State University and the Woods Hole Oceanographic Institution (McManus et al., 1999, 2002, 2003; Heusser et al., 2006). Oxygen isotope ratios in Cibicidoides and Uvigerina were adjusted to each other by 0.64 ‰ (Shackleton, 1974). Additional data on the planktonic species Globigerina bulloides were generated at Lamont Doherty Earth Observatory (LDEO) of Columbia University using a Thermo Delta V Plus gas-source isotope ratio mass spectrometer (IRMS) equipped with a Kiel IV automated individual acid bath sample-preparation device. Although a recent study found no size-related influence on G. bulloides δ18O (Costa et al., 2017), specimens were generally picked from the 250–300 µm size range, with 8–12 individuals selected for analysis. Samples were replicated at ∼5 %–10 % frequency and measured isotope ratios were calibrated to the VPDB isotope scale with NBS-19 and NBS-18. Reproducibility of the in-house standard (1σ) is ±0.06 ‰ (δ18O) and ±0.04 ‰ (δ13C).
2.5 Lipid extraction and organic geochemical analysis
The sediment samples (ca. 15 g dry weight) were extracted using accelerated solvent extraction (ASE) using a DIONEX 200 at 100 ∘C, a pressure of 7–8×10⁶ Pa, and a mixture of dichloromethane (DCM) and methanol (MeOH) (9:1; v:v). The total lipid extracts (TLEs) were dried under a stream of nitrogen (N2) using a Caliper TurboVap LV. All TLEs were desulfurized using copper granules activated with 1 M HCL. The copper turnings were added to the TLEs, stirred overnight, subsequently dried over anhydrous sodium sulfate (Na2SO4) in order to remove precipitate and water, and dried down under N2. For quantification purposes, three internal standards were added to the TLEs : 10-nonadecanone (C19:0 ketone) for long-chain alkenones, C22 7,16-diol for LCDs (Rodrigo-Gámiz et al., 2015), and the C46 GDGT for GDGTs (Huguet et al., 2006). The TLEs (aliquots of ∼4.5 mg) were separated into apolar, ketone (containing alkenones), and polar (containing LCDs and GDGTs) fractions by separation over activated (2 h at 150 ∘C) Al2O3 and elution with hexane : DCM (9:1; v:v), hexane : DCM (1:1; v:v), and DCM : MeOH (1:1; v:v), respectively. Polar fractions were split for GDGT (25 %) and LCD (75 %) analysis.
2.5.1 GDGTs
Aliquots of the polar fractions were dissolved in hexane : isopropanol (99:1, v:v) to a concentration of ca. 2 mg mL−1. The fractions were then filtered through 0.45 µm polytetrafluoroethylene (PTFE) filters. GDGTs were analyzed by means of ultrahigh-performance liquid chromatography mass spectrometry (UHPLC-MS) on an Agilent 1260 HPLC equipped with an automatic injector, which was coupled to a 6130 Agilent MSD, and HP Chemstation software according to Hopmans et al. (2016). The injection volume was 10 µL. Separation of the GDGTs was achieved in normal phase using two silica BEH HILIC columns in series (150 mm × 2.1 mm; 1.7 µm; Waters Acquity) at a temperature of 25 ∘C. The mobile phases are hexane (A) and hexane : isopropanol (9:1, v:v) (B). Compounds were isocratically eluted for 25 min with 18 % B, followed by a linear gradient to 35 % B in 25 min and a linear gradient to 100 % B in the 30 min thereafter. The flow rate was kept constant (0.2 mL min−1) during the analysis. The conditions for the APCI-MS were identical to Hopmans et al. (2016). GDGTs were detected in single ion monitoring (SIM) mode of the protonated molecules () of the various GDGTs. A standard mixture of C46 GDGT (internal standard) and crenarchaeol was analyzed to determine the relative response factor (RFF) between these two compounds (see Huguet et al., 2006) and thereby quantify GDGTs in the sediments.
For reconstruction of past SST we used the TEX index as proposed by Kim et al. (2010), which is defined as the logarithmic function of the original TEX86 (Schouten et al., 2002):
where the numbers correspond to the amount of cyclopentane moieties in the isoprenoid GDGTs and where Cren′ refers to the later eluting isomer of crenarchaeol (Sinninghe Damsté et al., 2002). We have discarded 13 samples for the TEX86 calculation due to the partial co-elution of GDGT-2 with an unknown compound.
The TEX values were converted to SSTs by applying the global core-top calibration of Kim et al. (2010):
There is also a regional TEX calibration available based on Chilean surface sediments between 25 and 50∘ S (Kaiser et al., 2015):
This calibration has a similar slope compared to the global core-top calibration of Kim et al. (2010) but a lower intercept, which results in SSTs that were ca. 2.4 ∘C lower compared to the TEX SSTs calculated after Kim et al. (2010). Although the outcomes are relatively similar, the calibration of Kim et al. (2010) resulted in SSTs that agreed better with the U and LDI records, and therefore we have used this calibration. In Appendix A, the TEX temperatures based on the calibration of Kaiser et al. (2015) are plotted (Fig. A1 in Appendix). Additionally, we plotted TEX86 temperatures calculated after the Bayesian calibration of Tierney and Tingley (2014, 2015) in Fig. A1 in the Appendix. These SSTs are on average 4 ∘C lower compared to the TEX-derived temperatures after Kim et al. (2010), which might be due to the relatively large number of high-latitude core tops on which the BAYSPAR calibration is based (Tierney and Tingley, 2014, 2015), whereas the TEX calibration of Kim et al. (2010) excludes (sub)polar core-top data. However, both reconstructions show the same trend.
To assess continental organic matter input into the marine realm, we calculated the branched isoprenoid tetraether (BIT) index, as proposed by Hopmans et al. (2004), including the 6-methyl brGDGTs as described by de Jonge et al. (2014, 2015):
where the numbers correspond to different branched GDGTs (Hopmans et al., 2004).
Additionally, we calculated the methane index (MI) as a proxy for the dissociation of marine gas hydrates conducive to the anaerobic oxidation of methane (AOM), as proposed by Zhang et al. (2011):
The archaea living in hydrate-impacted environments mainly contain GDGT-1, GDGT-2, and GDGT-3 as their membrane lipids. Therefore, relatively high abundances of these GDGTs might indicate these types of environments in the past and potentially explain erroneous TEX results due to high GDGT-1, GDGT-2, and/or GDGT-3 abundances. For all samples, this index was < 0.3, except for one data point (MI = 0.6), which was therefore removed from further discussion. Additionally, to assess other potential influence on the TEX, we determined the %GDGT-0 and ring index for all sediments. All values were below the advised thresholds, implying no substantial biases on the TEX86 (Zhang et al., 2006, 2011; Sinninghe Damsté et al., 2012).
2.5.2 Long-chain alkenones
Ketone fractions were dissolved in ethyl acetate to a concentration of ∼1 mg mL−1 and analyzed on an Agilent 6890N gas chromatograph (GC) with flame ionization detection (FID). Separation was achieved on a fused silica column with a length of 50 m and diameter of 0.32 mm, coated with a CP Sil-5 (thickness = 0.12 µm). Helium was used as a carrier gas. The flow mode was a constant pressure of 100 kPa. Alkenones were injected on-column at 70 ∘C at the start of the analysis and increased by 20 ∘C min−1 to 200 ∘C, followed by 3 ∘C min−1 until the final temperature of 320 ∘C. This end temperature was held for 25 min. Quantification of the alkenones was achieved by means of the C19:0 ketone internal standard. Identification of the long-chain alkenones was done on an Agilent 7890B GC system interfaced with an Agilent 5977A MS. Separation was achieved on a CP Sil-5 column with an identical diameter and film thickness as that of the GC-FID, but a length of 25 m. Helium was the carrier gas, maintaining a constant flow rate of 2 mL min−1. The MS operated at 70 eV. For both systems, the injection volume was 1 µL. The long-chain alkenones were identified in full scan, scanning between m∕z 50 and 850, and comparison with the literature (de Leeuw et al., 1980; Volkman et al., 1980; Marlowe et al., 1984).
The U index was calculated according to Prahl and Wakeham (1987):
The U values were converted to SSTs using the calibration of Müller et al. (1998):
There is also a Bayesian calibration available for the U, called the BAYSPLINE (Tierney and Tingley, 2018), but below ∼24 ∘C temperature estimates are similar to those of the calibration of Müller et al. (1998). Since our temperatures are well below 24 ∘C, we have applied the calibration of Müller et al. (1998).
2.5.3 LCDs
The LCDs were silylated prior to analysis. Polar fractions were dissolved in 25 µL of pyridine and 25 µL of N,O-bis(trimethylsilyl)trifluoroacetamide (BSTFA) and heated at 60 ∘C for 20 min. Prior to injection, 450 µL ethyl acetate was added. GC-MS analysis was carried out on an Agilent 7890B gas chromatograph coupled to an Agilent 5977A mass spectrometer. Samples were injected at 70 ∘C. The oven temperature was programmed to 130 ∘C by 20 ∘C min−1 and subsequently to 320 ∘C by 4 ∘C min−1; this final temperature was held for 25 min. The GC was equipped with an on-column injector and fused silica column (25 m × 0.32 mm) coated with CP Sil-5 (film thickness 0.12 µm). The carrier gas was helium at a constant flow of 2 mL min−1. The mass spectrometer operated with an ionization energy of 70 eV. The injection volume was 1 µL. Identification of the LCDs was achieved in full scan, scanning between m∕z 50 to 850, and on the basis of their characteristic fragmentation (Versteegh et al., 1997). Quantification of the LCDs and proxy computation was done by analysis in SIM mode of the characteristic fragments (m∕z 299, 313, 327, and 341; Rampen et al., 2012; m∕z 187 for C22 7,16-diol internal standard). We applied the following correction factors for the relative contribution of the selected fragment ions during SIM to the total ion counts: 16 % for all saturated diols, 9 % for all unsaturated diols, and 25 % for the C22 7,16-diol internal standard.
Past SST was reconstructed by means of the LDI (Rampen et al., 2012):
Subsequently, LDI values were converted to SST values via the following equation:
Three samples were discarded for the calculation of the LDI due to partial co-elution of the C28 1,13-diol with another unknown compound.
For the reconstruction of past upwelling conditions, the diol index as proposed by Willmott et al. (2010) was applied:
The diol index according to Rampen et al. (2008) was shown to also be affected by variations in SST due to the inclusion of the C30 1,15-diol in the ratio (Rampen et al., 2014b; Zhu et al., 2018), and since on a glacial–interglacial timescale we expect substantial SST differences, we consider the Willmott et al. (2010) ratio more appropriate.
Possible fluvial input of LCDs was assessed by the fractional abundance of the C32 1,15-diol, which is potentially derived from rivers (de Bar et al., 2016; Lattaud et al., 2017a, b):
The NDI, a proposed proxy for and concentrations, was calculated following Gal et al. (2018):
The NDI was then translated to [] and [] concentrations by using the following equations (Gal et al., 2018).
Finally, loliolide, an indicator of diatom abundance (Klok et al., 1984; Repeta, 1989), and dinosterol, a biomarker for dinoflagellates (Boon et al., 1979; Volkman et al., 1998), were identified by GC-MS analysis (simultaneously with the LCDs) of the silylated polar fraction and quantified using the C22 7,16-diol standard in full scan, correcting for the molecular weights of the compounds.
3.1 Bulk parameters and sedimentation rates
The TOC content varies between 0.4 % and 2.6 %. The TOC content is significantly higher during the interglacial periods (MIS 1, 3, and 5) compared to glacial periods (MIS 2, 4, and 6; two-tailed p< 0.001): the average TOC concentration is 1.4 % for the interglacial periods and 0.7 % for the glacial intervals (Fig. 3d), although TOC levels for MIS 3 are quite similar to those of MIS 1 and 2. Similarly, the average TN levels are 0.2 % and 0.1 % during the interglacial and glacial intervals, respectively (Fig. 3d). During Termination 2, both the TOC and TN contents increase rapidly (within < 2 kyr) towards interglacial values, and the highest TOC and TN values are observed around 78 ka (2.6 % and 0.3 %, respectively). The atomic C∕N ratio (Fig. 3b) varies from 4.3 to 10.5 and is on average higher during the interglacial periods (7.2) compared to glacial times (6.2). The organic matter δ13C record (δ13COM) also reveals a glacial–interglacial variation (Fig. 3c) corresponding to slightly 13C-enriched values during interglacial times ( ‰) compared to the glacials ( ‰). Although small, these changes are statistically significant (5 % significance level, two-tailed p< 0.001).
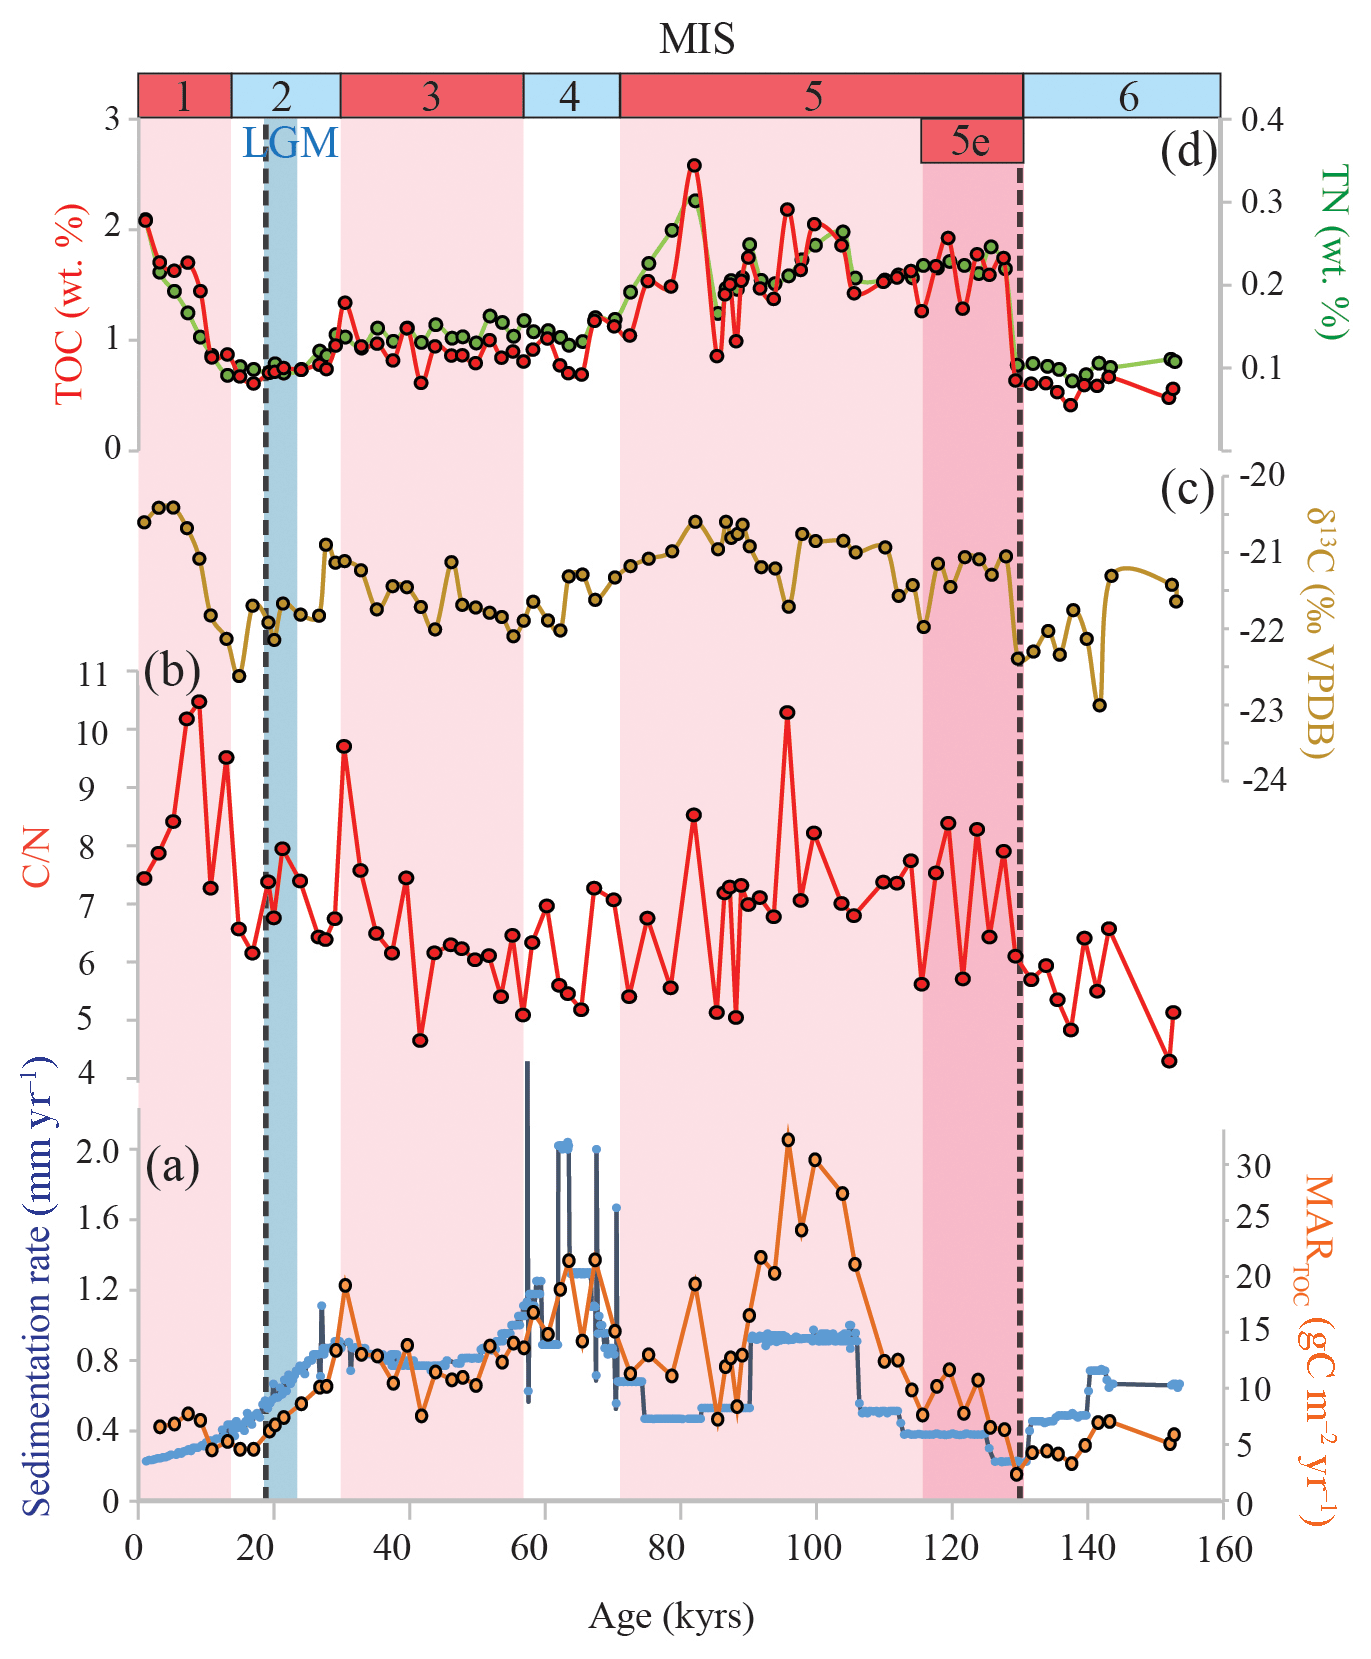
Figure 3Geochemical bulk records for the studied interval of ODP 1234. (a) Sedimentation rate (blue) and MARTOC (orange), (b) atomic C∕N ratio, (c) bulk organic δ13C, (d) TOC (red) and TN (green) concentrations. The different color bands indicate different time periods: interglacial stages MIS 1, 3, and 5 in pink, including the MIS 5e in dark pink. The LGM is highlighted in blue. MIS ages are according to Lisiecki and Raymo (2005). The dashed lines indicate the onset ages of Terminations 1 (Pacific age of Stern and Lisiecki, 2014) and 2 (approximate age).
Using the age model modified from Heusser et al. (2006), we estimated sedimentation rates that varied between ca. 0.2 and 1.7 mm yr−1 (Fig. 3a). Sedimentation rates were highest in MIS 4, during which the sedimentation rate reaches values of around 2 mm yr−1. Sedimentation rates were lowest during the warmest periods (MIS 1 and 5e; ca. 0.3–0.4 mm yr−1). The MARTOC varied between ca. 2 and 32 g m−2 yr−1 and shows a relatively similar pattern as the sedimentation rate, implying that the sedimentation rate strongly controls the AR of TOC (Fig. 3a). Around ca. 100 ka there is a pronounced maximum in the TOC AR, reaching ca. 32 g m−2 yr−1.
3.2 Lipid biomarker concentrations and ARs
In all sediments, long-chain alkenones, GDGTs, and LCDs were present above the quantification limit. The total concentration of crenarchaeol, a specific biomarker for marine Thaumarchaeota (Schouten et al., 2002, 2003), varies between ca. 2 and 16 µg g−1, with highest values during MIS 5, after MIS 5e (Eemian Interglacial; Fig. 4a). Accumulation rates (ARs) range from 1 to 25 mg m−2 yr−1 (Fig. 4a). The summed concentration of the di- and tri-unsaturated C37 alkenones, a productivity proxy for alkenone-producing haptophytes (e.g., Prahl et al., 1988; Prahl and Muehlhausen, 1989; Rostek et al., 1997; Villanueva et al., 1997), varies between ca. 0.5 and 10 µg g−1. Highest concentrations are observed for MIS 5e (126–116 ka; Fig. 4b). Around the boundary of MIS 4 and 5, concentrations decrease from ca. 6 to 2 µg g−1 sediment; however, the alkenone AR does not show this decrease. During the Late Holocene, C37 alkenone concentrations increase again. The alkenone AR record resembles that of the MARTOC with a peak around 100 ka of ca. 10 mg m−2 yr−1 (Fig. 4b). Dinosterol shows the highest abundance during the last interglacial (MIS 5), peaking just after the Eemian Interglacial (between ca. 116 and 110 ka; Fig. 4c) with concentrations of ca. 4 µg g−1. This peak is followed by a gradual decrease towards the LGM with values near 1 µg g−1 sediment. The AR record of dinosterol highly resembles the concentration record but peaks somewhat later, i.e., between ca. 105 and 98 ka. The loliolide concentration shows one maximum during the Late Holocene of ca. 2.3 µg g−1 sediment (Fig. 4d). Its AR varies between ca. 0 and 1 mg m−2 yr−1 throughout the record, with one pronounced peak around 100 ka of around 2 mg m−2 yr−1.
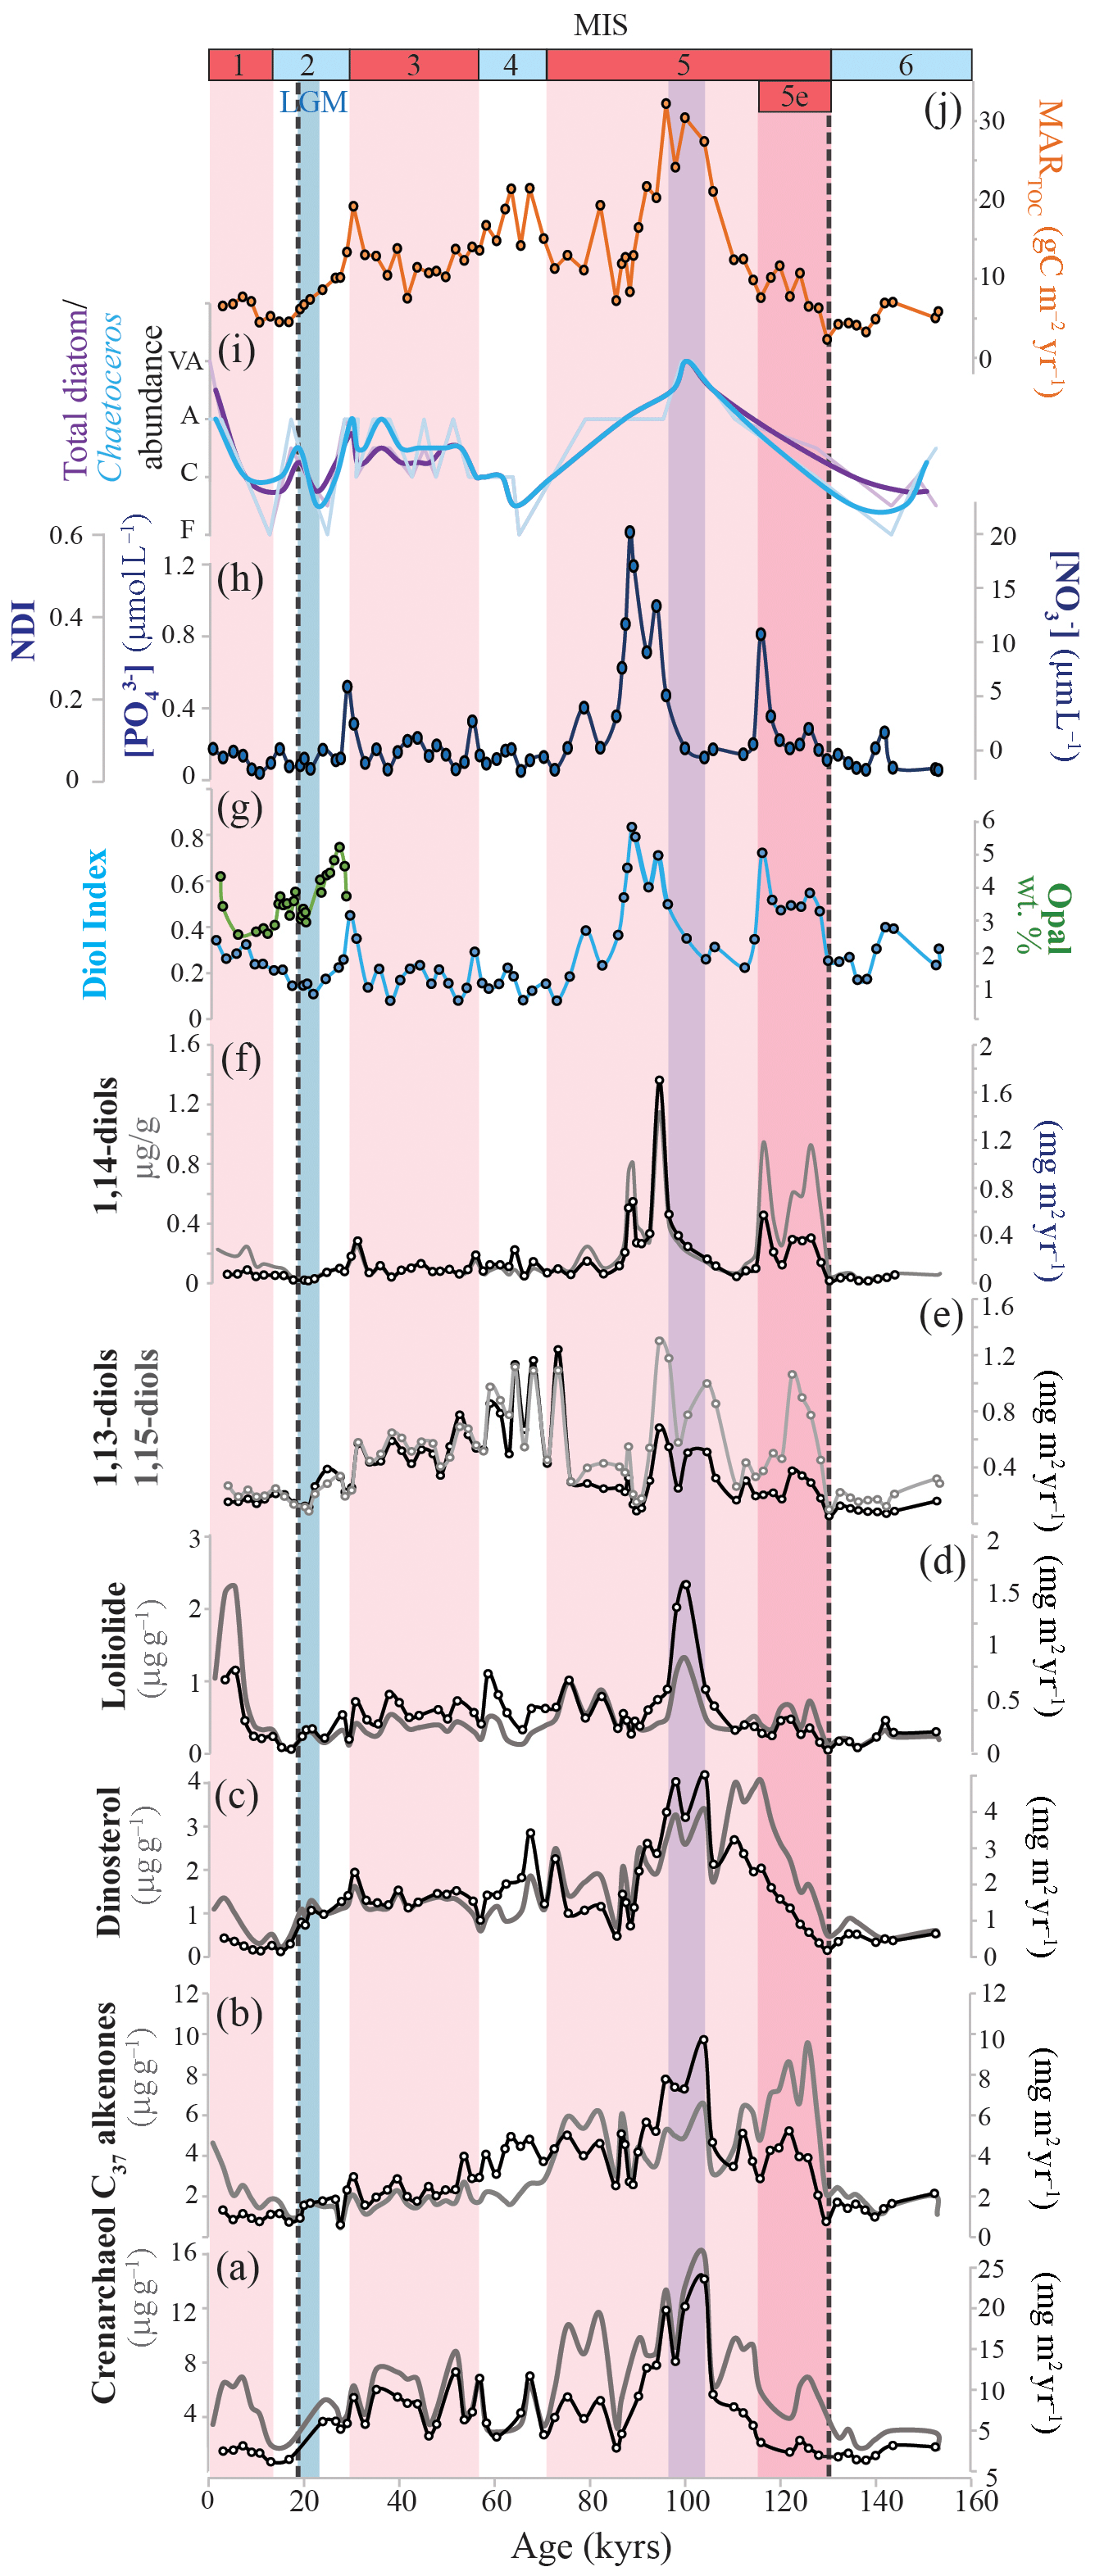
Figure 4Biomarker proxy and accumulation records for ODP 1234. (a) Crenarchaeol concentrations and MARs. (b) C37 alkenone concentrations and MARs. (c) Dinosterol concentrations and MARs. (d) Loliolide concentrations and MARs. (e) 1,13- and 1,15-diol MARs. (f) 1,14-diol concentration and MARs. (g) Diol index (blue) and biogenic opal concentrations (green; Muratli et al., 2010b) for the last ∼28 kyr. (h) Phosphate and nitrate concentrations calculated after the NDI. (i) Total diatom counts (purple) and Chaetoceros diatom counts (blue) (Mix et al., 2003). The thick smoothed lines reflect 2-point running averages of the diatom records. The counts are descriptive. F: few; C: common; A: abundant; VA: very abundant. (j) Mass AR of TOC. For panels (a)–(d) and (f): concentrations are in grey and MARs are in black. The different color bands indicate different time periods: interglacial stages MIS 1, 3, and 5 in pink, including the MIS 5e in dark pink. The LGM is highlighted in blue. The purple band indicates the period of presumed enhanced upwelling. MIS ages are according to Lisiecki and Raymo (2005). The dashed lines indicate the onset ages of Terminations 1 (Pacific age of Stern and Lisiecki, 2014) and 2 (approximate age).
The main LCDs detected throughout the core are the C28 and C30 1,13-diols, the C28, C30, and C30:1 1,14-diols, and the C30 and C32 1,15-diols. We did not detect the C32 1,14-diol (characteristic for Apedinella radians), but we did identify the C30:1 1,14-diol and C29 12-OH fatty acid, which are typical biomarkers for Proboscia diatoms (Sinninghe Damsté et al., 2003), implying that Proboscia diatoms are most likely the source of the 1,14-diols detected in the sediments. The profile of the summed concentration of 1,14-diols shows four distinct sharp peaks during the MIS 5 (Fig 4f), reaching concentrations up to 1.2 µg g−1. The 1,14-diol AR shows one distinct peak at 94 ka of ca. 1.7 mg m−2 yr−1, whereas throughout the rest of the record the AR varies between 0 and 0.6 mg m−2 yr−1. Figure 4h shows the ARs of the summed 1,13- and 1,15-diols. The AR of the 1,13-diols ranges between ca. 0.1 and 0.8 mg m−2 yr−1 throughout MIS 6 and 5 and peaks (ca. 1.2 mg m−2 yr−1) at the end of MIS 5, revealing the highest ARs during MIS 4, followed by a subsequent gradual decrease towards Holocene values of around 0.2 mg m−2 yr−1. The AR record of the 1,15-diols is highly similar to that of the 1,13-diols for MIS 1 to 4, as well as for MIS 6, but shows higher values during the second half of MIS 5 with maxima around 94, 104, and 122 ka of between ca. 1 and 1.3 mg m−2 yr−1.

Figure 5Foraminiferal oxygen isotope and organic temperature proxy records for ODP 1234. (a) The benthic stable oxygen isotope records for ODP Site 1234 of Heusser et al. (2006), in which the blue data reflect the benthic δ18O dated by correlation with Atlantic core MD95204, and the orange data represent the δ18O data correlated with the Vostok ice core chronology. (b) The organic geochemical seawater surface temperature records: U (green), TEX (red), and LDI (blue). The thick lines reflect 3-point running averages. (c) Planktonic foraminiferal δ18O of the species Globigerina bulloides with the 3-point running average. (d) Global compilation of benthic stable oxygen isotopes (Lisiecki and Raymo, 2005). The pink colored bands reflect the interglacial periods (MIS 1, 3, and 5). The pink lines within MIS 5 reflect the different substage δ18O minima and maxima. MIS (substage) ages are according to Lisiecki and Raymo (2005). The blue band reflects the Last Glacial Maximum, and the star symbol represents the present-day SST (World Ocean Atlas 2013 version 2). The dashed lines indicate the onset ages of Terminations 1 (Pacific age of Stern and Lisiecki, 2014) and 2 (approximate age).
3.3 Foraminiferal stable isotopic composition
We generated a δ18O record of G. bulloides for MIS 5 from ca. 70 to 142 ka, as well as for a short interval within MIS 3 from ca. 36 to 41 ka, which is plotted in Fig. 5b. The δ18O values of G. bulloides varied between ca. 0.3 ‰ and 4.2 ‰ and are most depleted during the Eemian Interglacial around 123 ka (δ18O = 0.3 ‰); enriched values are observed for MIS 6 and 3.
3.4 Organic proxy records
The diol index record shows several maxima, the most evident of which is during MIS 5 (Fig. 4g). During MIS 5e, the diol index reveals two peaks around 126 and 116 ka (up to 0.7), followed by a sharp drop and a subsequent increase around 110 ka, reaching a maximum value at ∼86 ka (up to 0.8). After 86 ka, the index gradually decreases. During MIS 2–4 the diol index varies between ca. 0.1 and 0.5. During MIS 1, the diol index shows a gradual increase from ca. 0.15 to 0.35.
We did not detect the monounsaturated C28 1,14-diol (C28:1 1,14-diol), and therefore this diol could not be included in the calculation of the NDI. In ∼64 % of the surface sediments of the datasets of Rampen et al. (2014b) and de Bar et al. (2016), on which the NDI calibration of Gal et al. (2018) is based, the C28:1 1,14 was also not detected. The NDI record reveals similar variations as the diol index, although more pronounced. During MIS 6 the NDI is close to zero, followed by a small peak at the end of the Eemian Interglacial (NDI = 0.4), coincident with the peak in the diol index at 116 ka. NDI-derived [] and [] concentrations around 116 ka are 11 and 0.8 µmol L−1, respectively (Fig. 4h). Similar to the diol index, the ratio then decreases after which the NDI shows a broad peak (∼100–80 ka) with a maximum at 88 ka (NDI = 0.6), which gives concentrations of 20 and 1.4 µmol L−1 when translated to [] and [PO], respectively (Fig. 4h). Between 80 and 0 ka (i.e., MIS 4–1), the NDI does not reveal any distinct maxima, and the ratio varies between ca. 0 and 0.2.
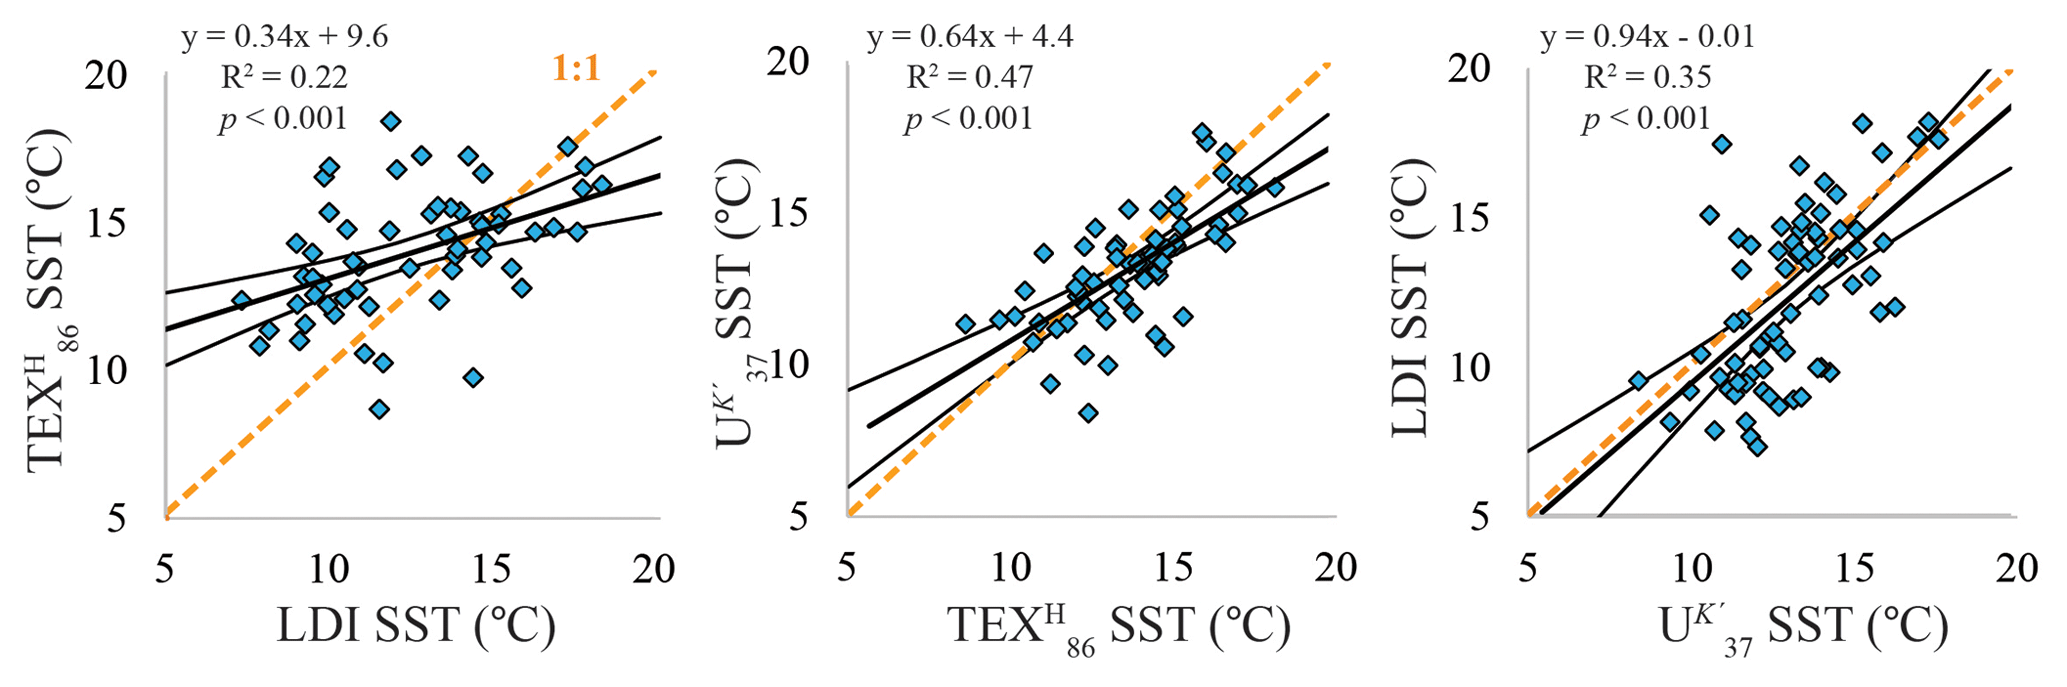
Figure 6Cross-correlations of sea surface temperature estimates based on the TEX index, U index, and LDI. Linear regressions are indicated by the black solid lines, together with the 95 % confidence intervals. All correlations are significant (p< 0.001). The orange dashed line represents the 1:1 line.
Overall the organic SST proxy records broadly follow the same trend, clearly revealing glacial–interglacial temperature variability (Fig. 5b). Indeed, when we cross-correlate the three proxies, all combinations display significant positive correlations (p< 0.001; Fig. 6), albeit with some scatter.
Additionally, the SST trends show good correspondence with the planktonic δ18O record of G. bulloides (Fig. 5c), as well as with the benthic oxygen isotope record for ODP Site 1234 (Heusser et al., 2006; Fig. 5a) and the global stack of benthic δ18O values (e.g., Lisiecki and Raymo, 2005; Fig. 5d). Termination 2 (around 130 ka) is clearly expressed in all three organic proxy SST records, showing a rise in temperature of approximately 4 ∘C within ca. 2 kyr. During MIS 5e, SSTs were between ca. 16 and 18 ∘C based on the three temperature proxies. Then, during MIS 5, the interglacial substages representing alternating cold and warm periods are clearly reflected in all three proxy records. The three records show temperature drops between ca. 4 and 6 ∘C during MIS 5a (ca. 70 ka). During MIS 4, 3, and 2, all SST records show a gradual decrease towards the LGM, during which U and TEX reveal temperatures between 9 and 10 ∘C and an LDI between 7 and 8 ∘C. Around 25 ka, U and TEX temperatures show a similar steady rise to Holocene temperatures of around 16 and 18 ∘C. The LDI reveals an approximate 7 ∘C warming over Termination 1, starting slightly later at around 22 ka. During the last ∼ 20 kyr, LDI-derived SSTs are ∼3–4 ∘C lower compared to the U- and TEX-derived SSTs.
4.1 Productivity
The average bulk organic carbon δ13C over the last 150 kyr is −21.4 (±0.6, SD) ‰, and the atomic C∕N ratio displays an average value of 6.8 (±1.3), both implying a dominant marine organic carbon source (Bordovskiy, 1965; Emerson and Hedges, 1988; Meyers, 1997). Today, the amount of sedimentary organic carbon is a good indicator of export production along the Chilean margin (Hebbeln et al., 2000). Hence, higher TOC levels during the interglacial intervals in the ODP 1234 record may suggest enhanced marine productivity during these intervals for this site. However, enhanced interglacial productivity is in contrast with previous studies that state that coastal productivity on the Peru margin was highest during the LGM and diminished during the Holocene (e.g., Thomas et al., 1994; Marchant et al., 1999; Thomas, 1999; Hebbeln et al., 2000, 2002; Lamy et al., 2002, 2004; Romero and Hebbeln, 2003; Mohtadi and Hebbeln, 2004). These studies suggest that during the LGM the ACC migrated northward, supplying nutrients (particularly nitrate and phosphate; Levitus et al., 1994), together with a northward shift of the southern westerly belt as the main precipitation source onshore, resulting in enhanced micronutrient supply via continental runoff. This combined effect would have stimulated productivity along the Chilean coast during the LGM. Upon deglaciation the climate zones propagated southward, resulting in a lowering of productivity, as indicated by pollen, sedimentological, and continental studies (e.g., Heusser, 1990; Lamy et al., 1998, 1999, 2001, 2004; Brathauer and Abelmann, 1999; Haberle and Bennett, 2004; Stuut and Lamy, 2004; Kaiser et al., 2005; Heusser et al., 2006). These studies suggest a 5 to 6∘ northward movement of the southern westerly belt during the LGM.
In contrast to the hypothesis of stimulated productivity during the LGM and lower productivity during the Holocene, two studies suggested low paleoproductivity during the LGM for core sites at the same latitude as that of our core (35–36∘ S) (Romero et al., 2006; Mohtadi et al., 2008). Mohtadi et al. (2008) hypothesized that if the climate zones shifted 5 to 6∘ northward during the LGM, the SWW would be just above the core site (35–36∘ S), blowing directly onshore and thereby preventing coastal upwelling. In turn, during the Early Holocene the subtropical high pressure would have become the dominant atmospheric player according to Romero et al. (2006), favoring upwelling. However, Muratli et al. (2010b), who reconstructed paleoproductivity over the last ∼30 kyr for ODP 1234, suggested that the rise in TOC after the LGM is probably not the result of increased productivity, but of a lower oxygen availability due to decreased Antarctic Intermediate Water ventilation and thus increased preservation. The authors based these suggestions on the fact that neither opal concentrations nor opal or TOC MARs increased simultaneously with TOC concentrations. Chase et al. (2014) support this hypothesis based on the Th-normalized organic carbon fluxes. Our (unnormalized) MARTOC supports these findings as well since although TOC levels show a steady rise after the LGM, we do not observe this increase in the accumulation of organic carbon, and the MARTOC is higher during the LGM compared to the Holocene, suggesting higher glacial productivity. In summary, our findings seem consistent with previous studies suggesting that higher TOC levels during the Holocene likely do not result from increased productivity, but rather from increased preservation.
Interestingly, during MIS 3, 4, and 5 we observe even higher MARTOC values, reaching a pronounced maximum around 100 ka during MIS 5, i.e., during an interglacial period. Hence, this record suggests that the general productivity over the last ∼150 kyr was highest around 100 ka. This interpretation is supported by most of the AR records of the individual lipid biomarkers peaking around 100 ka. The C37 alkenone, crenarchaeol, and dinosterol ARs are all at their maximum between ca. 105 and 95 ka (Fig. 4b, a, and c, respectively), simultaneous with maximal MARTOC (Fig. 4j). The AR of loliolide (indicating diatom abundance) peaks at 100 ka (Fig. 4d), coincident with a maximum in total diatoms and Chaetoceros diatom counts (Mix et al., 2003; Fig. 4c) and concurrent with the peak in MARTOC. Chaetoceros diatoms are generally associated with upwelling (e.g., Abrantes, 1988; Abrantes and Moita, 1999), and also for the Peru–Chile upwelling system, the diatom genus Chaetoceros is thought to dominate the diatom community during upwelling conditions (e.g., Anabalón et al., 2007; Schrader and Sorknes, 1991; Romero et al., 2001; Vargas et al., 2004; Abrantes et al., 2007; González et al., 2007; Sanchez et al., 2012). Therefore, the high abundance of Chaetoceros diatoms at ∼100 ka suggests that there was a peak in upwelling intensity around this time. This upwelling would have introduced macronutrients from deeper colder waters into the euphotic zone, stimulating several phytoplankton communities, including haptophytes, dinoflagellates, and diatoms. During MIS 4 we also observe a peak in MARTOC (Fig. 3a) but there is no corresponding peak in Chaetoceros abundance (Fig. 4i). However, the high MARTOC during MIS 4 is linked to high sedimentation rates (Fig. 3c), whereas the peak in MARTOC during MIS 5 is not, confirming that the MARTOC maximum during MIS 5 indeed likely resulted from increased primary productivity, whereas during MIS 4 the high MARTOC did not.
4.2 1,14-diols as past upwelling and nutrient indicators
Interestingly, peaks in the diol index and 1,14-diol concentrations and accumulation rates occur before and after (around 116 and 88 ka; Fig. 4a and j), but not during, the time interval with enhanced upwelling (i.e., around 100 ka; purple band in Fig. 3). Contreras et al. (2010) also reported high abundances of the C28 1,14-diol around 120 ka near the coast of Peru (11∘ S). This suggests that Proboscia diatoms were more abundant before and after this period of intense upwelling and is in agreement with observations that in the present-day Chile–Peru upwelling region, Proboscia alata is more dominant when upwelling is less intense (Tarazona et al., 2003; Herrera and Escribano, 2006). Although the recent timescale is quite different from our long time record, which represents an integrated signal of several hundreds to thousands of years, it suggests that over the time period 120–80 kyr, on average, upwelling became stronger, reaching a maximum at 100 ka before subsequently decreasing. Shortly before and after the period of maximum upwelling, the conditions (averaged over multiple years) were apparently optimal for Proboscia diatoms. As previously suggested by Rampen et al. (2014b), this indicates that the diol index should perhaps be considered as a specific indicator for Proboscia productivity, rather than upwelling strength generally, as the environmental conditions determining Proboscia abundance likely differ from region to region.
Recently, the NDI was introduced as a quantitative paleo-nutrient proxy. The diol index, the 1,14-diol AR, and the NDI are low during the time of most intense upwelling (around 100 ka), suggesting a minimum in annual mean nitrate and phosphate concentrations, which is highly unlikely. The NDI is based on the saturated and monounsaturated C28 1,14-diol relative to other diols. Whereas we observe a strong correlation between the ARs of the monounsaturated and saturated C30 1,14-diol (R2=0.70), the correlations between the C28 1,14 and C30 1,14-diol (R2=0.32) and the C28 1,14 and C30:1 1,14-diol (R2=0.36) are weak, indicating different source organisms for the C28 and C30 1,14-diols, in agreement with previous studies (Rampen et al., 2014b; de Bar et al., 2016; Gal et al., 2018). In fact, Sinninghe Damsté et al. (2003) found that 98 % of the diols in P. alata consisted of the saturated and monounsaturated C28 1,14-diol, whereas P. indica produces similar amounts of the C30 and C28 1,14-diol and P. inermis mainly produced the C28 1,14-diol (Rampen et al., 2007). P. alata is the Proboscia species detected along the modern coast of Chile and Peru (Tarazona et al., 2003; Herrera and Escribano, 2006), and therefore it is likely that P. alata is the predominant producer of the C28 1,1,4-diol detected in the ODP 1234 sediments. Consequently, the NDI record likely reflects variations in the abundance of P. alata over the last 150 kyr in the Chilean margin, whereas the diol index (which also includes the C30 1,14-diol) more likely reflects the abundance of multiple species of Proboscia.
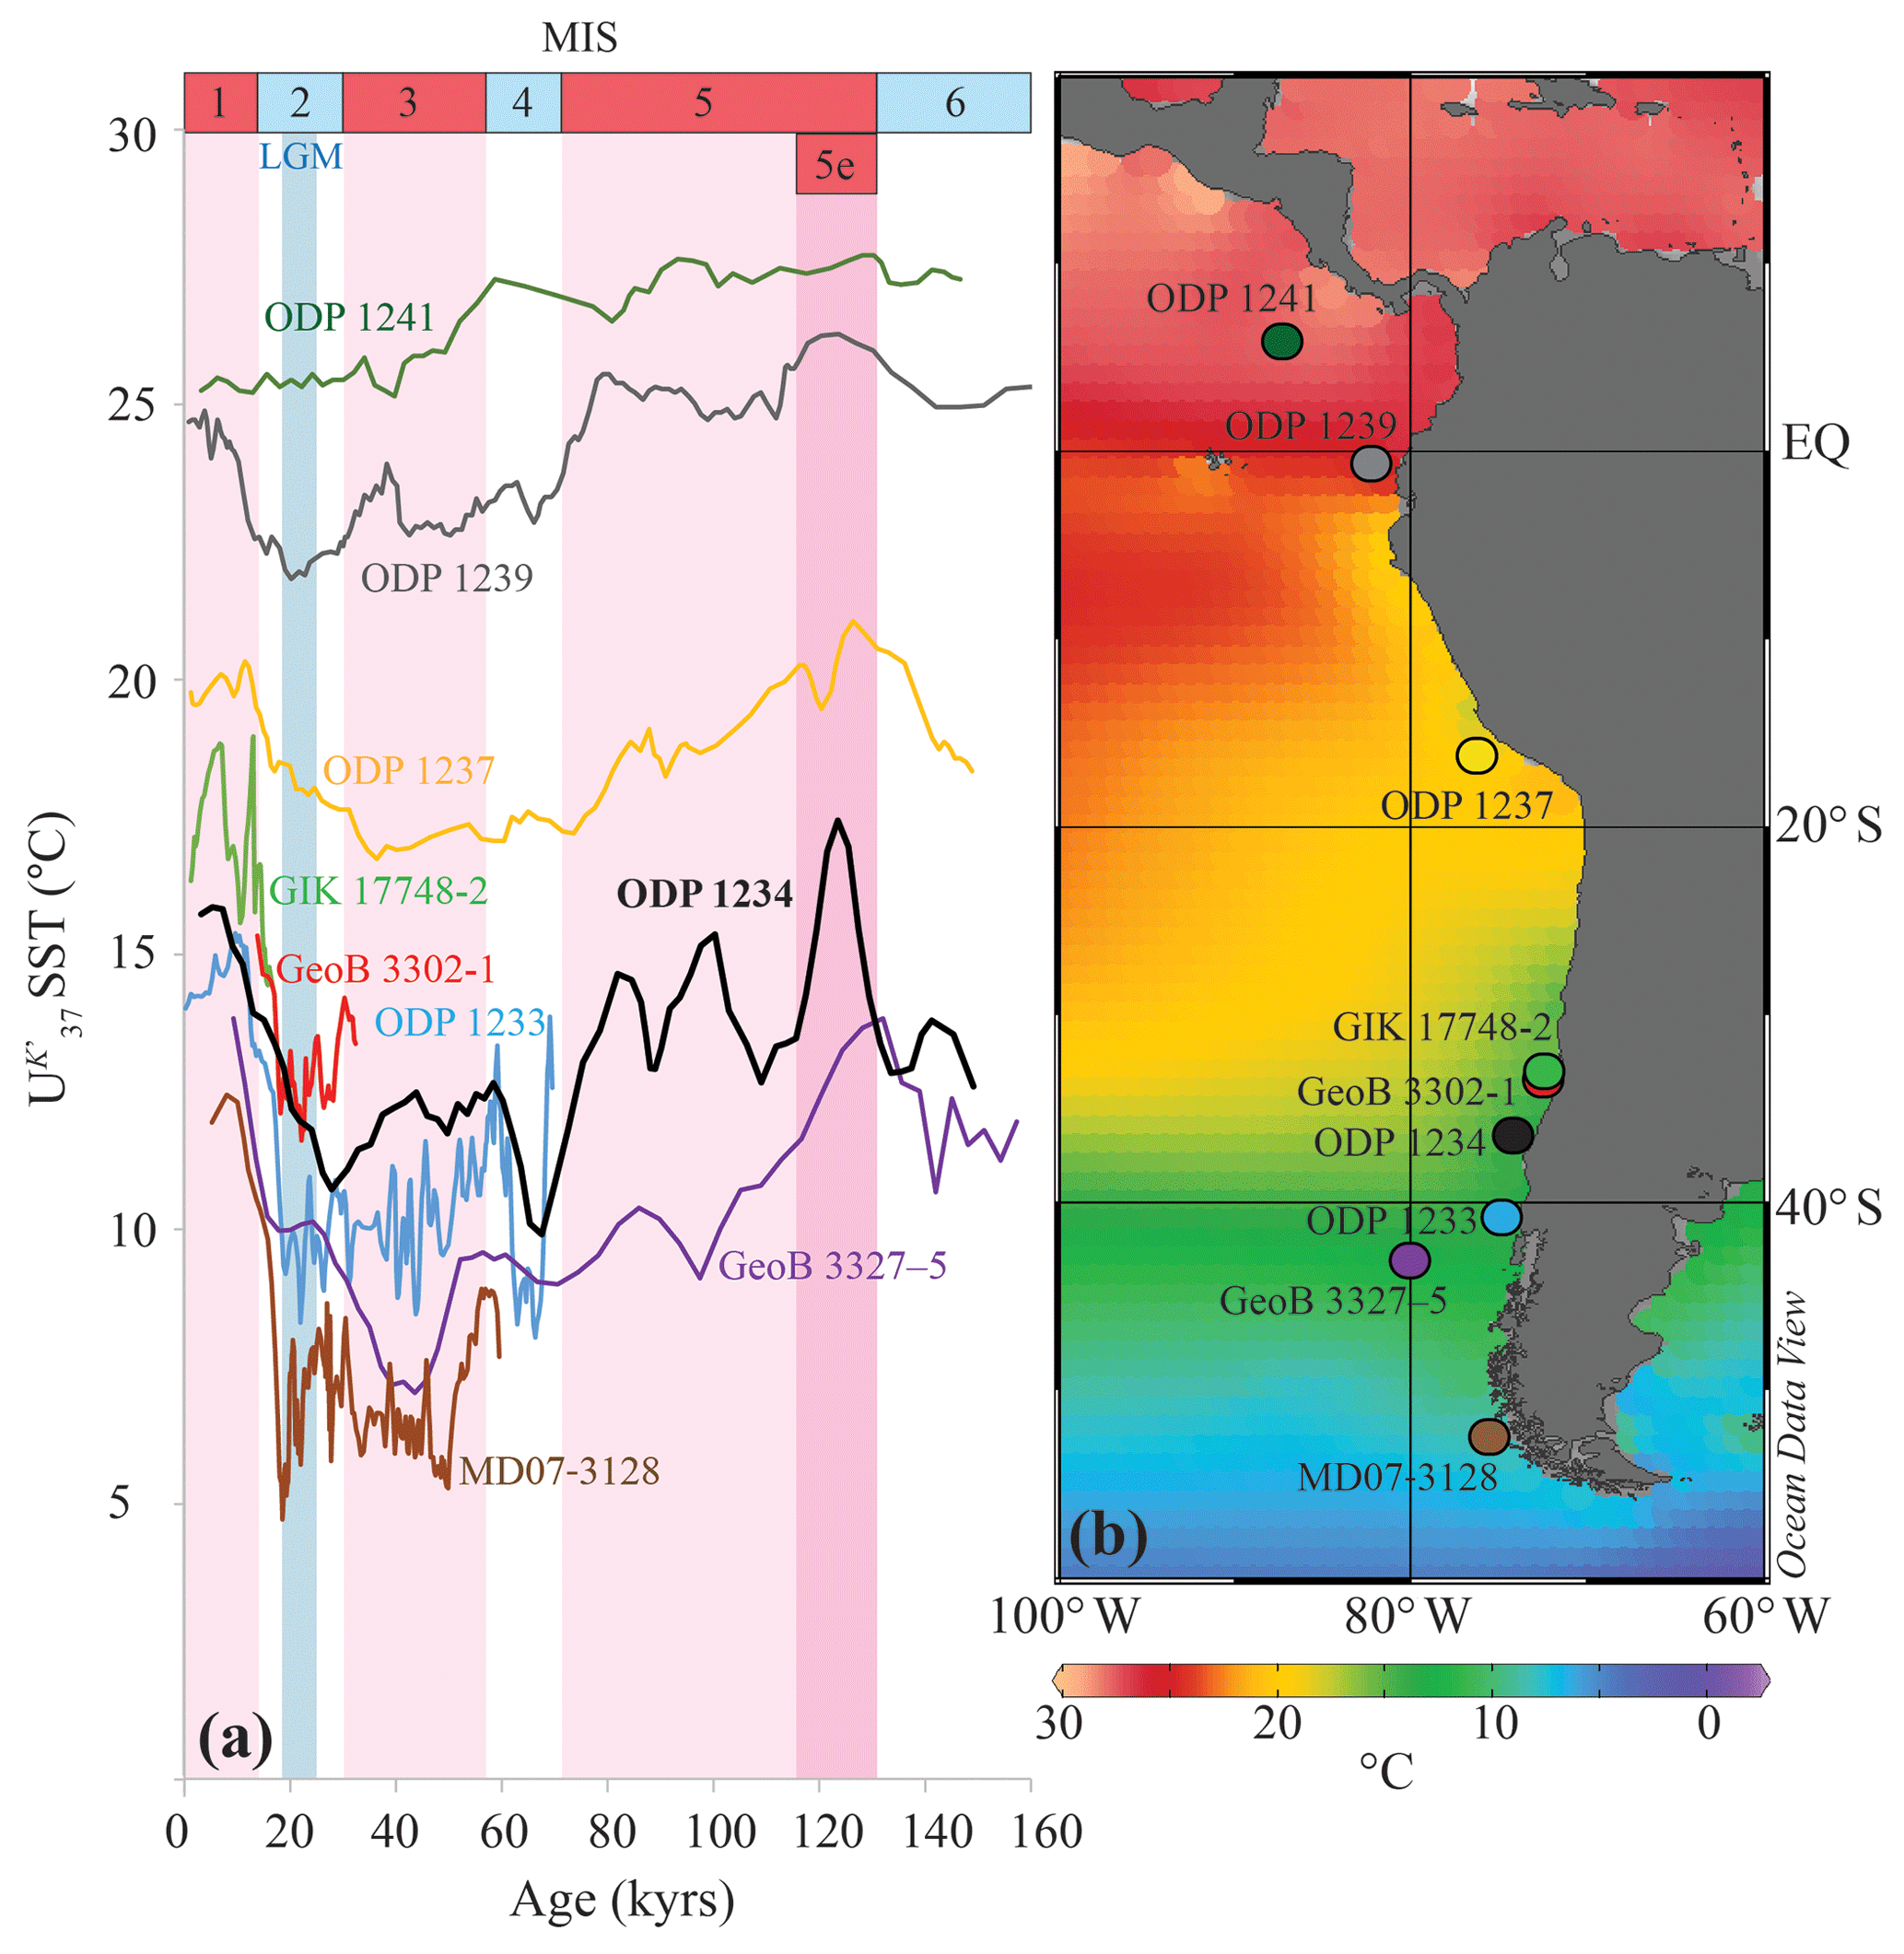
Figure 7(a) Pacific U SST reconstructions off South America for the last ∼160 kyr (3-point running averages). (b) Sea surface temperature (∘C) map for the region. The colors of the records correspond to the colors of the site symbols in the map. Alkenone-based SST data is from Caniupán et al. (2011) (MD07-3128; 53∘ S), Ho et al. (2012) (GeoB 3327-5; 43∘ S), Kaiser et al. (2005) (ODP1233; 41∘ S), this study (ODP 1234; 36∘ S), Kim et al. (2002) (GeoB 3302-1 and GIK 17748-2; 33∘ S), Bin Shaari (2013) (ODP 1237; 16∘ S), Bin Shaari et al. (2013) (ODP 1239; 1∘ S) and Bin Shaari et al. (2014) (ODP 1241; 6∘ N). Surface temperature data derived from the World Ocean Atlas 2013 (Locarnini et al., 2013); map is drawn in Ocean Data View (Schlitzer, 2015), and modified manually.
Previous studies showed that P. alata preferentially blooms over other diatoms when nutrients are high but silica concentrations are low (as P. alata needs little Si to build its frustule) (Haake et al., 1993; Sakka et al., 1999; Koning et al., 2001; Smith, 2001). In fact, although P. alata is often observed in high nutrient and/or upwelling regions (Hernández-Becerril, 1995; Lange et al., 1998; Koning et al., 2001; Smith, 2001), the conditions in which the species is abundant are often described as post-bloom, stratification, early upwelling season and/or the oceanic side of the upwelling front (e.g., Hart, 1942; Takahashi et al., 1994; Katsuki et al., 2003; Moita et al., 2003; Tarazona et al., 2003; Herrera and Escribano, 2006; Sukhanova et al., 2006; see references in Table 1 of Rampen et al., 2014b). Moreover, sediment trap studies from the Arabian Sea showed that the maximum flux of Proboscia lipids was at the start of the upwelling season (Prahl et al., 2000; Wakeham et al., 2002; Sinninghe Damsté et al., 2003; Rampen et al., 2007). When silicate concentrations increase (i.e., during upwelling), P. alata is likely outcompeted by more heavily silicified diatoms (such as Chaetoceros; e.g., Riegman et al., 1996). This suggests that the C28 1,14-diol likely reflects early or post-upwelling nutrient conditions. Hence, the dip in reconstructed [] and [] concentrations at ∼100 ka is not realistic and likely due to the low abundance of P. alata at this time of intense upwelling. In other regions, the C28 1,14-diol might be produced by other Proboscia species (e.g., P. inermis) and the NDI might thus not reflect solely P. alata productivity. In summary, we suggest that the NDI at the Chilean margin likely reflects Proboscia productivity and may therefore not be suitable as paleo-nutrient tracer.
4.3 Sea surface temperature evolution
The three organic proxy-based SST records broadly follow the trend of the planktonic oxygen isotope record for MIS 5, as well as the benthic oxygen isotope record for ODP Site 1234 (Heusser et al., 2006; Fig 5), and the global stack of benthic δ18O (e.g., Lisiecki and Raymo, 2005) for the entire record, suggesting that the evolution of SST at our study location generally follows global climate patterns. The resolution of our record is not high enough to recognize possible millennial-scale SST variations related to climatic events such as the Antarctic Cold Reversal. Nevertheless, the overall SST patterns are similar to other Southern Hemisphere records (e.g., Kaiser et al., 2005; Kaiser and Lamy, 2010; Caniupán et al., 2011; Lopes dos Santos et al., 2013) and Antarctic ice core stable isotope records (e.g., Blunier and Brook, 2001). The three temperature proxies are all significantly positively correlated and present a coherent view of regional climate variability (Fig. 6).
In principle, we would expect similar reconstructed temperatures from the LDI and U index, since both proxies are based on biomarkers produced by photosynthetic algae (Prahl and Wakeham, 1987; Rampen et al., 2012). Indeed, Kim et al. (2002) showed that for surface sediments off Chile, U-derived temperatures strongly correlated with annual mean temperatures of the sea surface mixed layer. The linear regression for the U vs. the LDI is close to the 1:1 line, suggesting the LDI is reflecting SST. Interestingly, the LDI reveals a greater amplitude over the record compared to the U and TEX, with a maximum temperature difference between the coldest (LGM) and warmest (Eemian Interglacial) temperature of ca. 10 ∘C, whereas this is ca. 7 and 8 ∘C for the U and TEX, respectively. Other LDI and U applications on glacial–interglacial timescales also show somewhat greater amplitudes for the LDI compared to the U (Rampen et al., 2012; Lopes dos Santos et al., 2013; Rodrigo-Gámiz et al., 2014; Jonas et al., 2017). This might potentially suggest that the surface sediment calibration of the LDI requires some modification, such as a lower slope. Further analysis of surface sediments should reveal this.
For the TEX86, it has been shown to potentially reflect subsurface rather than surface water temperatures (Huguet et al., 2007; Kim et al., 2010, 2015; Schouten et al., 2013; Chen et al., 2014) due to the production of isoprenoid GDGTs below the surface mixed layer. Overall, the TEX record agrees reasonably well with the U record for ODP 1234, suggesting that it mainly reflects SST. Also, Kaiser et al. (2015), who established a regional TEX calibration, suggested that this proxy mainly reflects SST. However, all cross-correlations still reveal relatively large scatter, reflecting the multiple different constraints on the respective proxies, as each one is affected by different parameters and can reflect different seasonal temperatures. Nevertheless, for the largest part of the record, the absolute temperature differences between the three temperature proxies is smaller than the maximal possible discrepancy that can be explained by the combined calibration errors (calibration errors of U, TEX, and LDI are 1.5, 2.5, and 2.0 ∘C, respectively; Müller et al., 1998; Kim et al., 2010; Rampen et al., 2012, respectively).
The only period during which the offsets are larger than the calibration errors is the last ∼25 kyr, i.e., from the LGM to the Holocene, and the relatively brief interval between 52 and 56 ka. During these time spans, the LDI-derived temperatures are ca. 3 to 6 ∘C lower than those derived from U or TEX. This offset could potentially be related to terrestrial input; however, we have assessed the relative contribution of terrestrially derived organic carbon by means of the BIT index (Hopmans et al., 2004) and the fractional abundance of the C32 1,15-diol (de Bar et al., 2016; Lattaud et al., 2017a, b), which were both always < 0.2, implying that there was no substantial riverine input from terrigenous organic matter. Alternatively, the LDI might be compromised by a high input of 1,14-diols (Rodrigo-Gámiz et al., 2015); however, we do not observe a correlation between the LDI (or the SST offset between the LDI and U or TEX) and the fractional abundance of the summed 1,14-diols. Potentially, the production of the 1,13- and 1,15-diols shifted to a colder season due to regional climatic change associated with the southward migration of the ACC and SWW upon the deglacial warming. Finally, we observe an early onset of the deglacial warming for the LDI compared to the U and TEX (ca. 6 kyr; Fig. 5b), the reasons for which are elusive.
We can compare our SST records of ODP Site 1234 with those of other SST records along the coast of South America, in particular those generated by the U, which has been used the most often (Fig. 7). Our U temperature record agrees well with other records in the vicinity of ODP 1234, both in terms of absolute temperature and in glacial–interglacial temperature amplitude. Our U SST record shows an approximate 7 ∘C warming over Termination 1, which is in agreement with other past SST records for the central and southern Chilean margin (Kim et al., 2002; Lamy et al., 2002, 2004; Kaiser et al., 2005; Romero et al., 2006; Kaiser and Lamy, 2010). Although the timing of deglacial warming associated with Termination 2 is comparable to other records, the last deglaciation (Termination 1) reveals an early start (around 26 ka) at Site 1234 compared to neighboring sites. The TEX record reveals this same timing, whereas the LDI suggests a timing more comparable to other records in the vicinity (around 20 ka). Regional differences in the timing of deglacial warming have previously been related to the southward shift of the SWW, which directly and indirectly influences local paleoproductivity and upwelling intensity, thereby potentially leaving site-dependent, unique signatures in the SST records (Mohtadi et al., 2008). This may partially explain the discrepancies that we observe between our U record and the other records. For instance, site GeoB 3327-5 is located at the northern extent of the ACC and thus largely influenced by its latitudinal movement, which is closely related to the migration of the SWW (Ho et al., 2012), whereas for ODP 1234 this influence might be less. Furthermore, the combined regional records show an increase in the magnitude of U temperature variations over glacial–interglacial timescales towards the south (Fig. 7), which agrees with the idea of greater glacial–interglacial temperature differences at high latitudes compared to low latitudes (e.g., CLIMAP, 1976; Mohtadi and Hebbeln, 2004; Mohtadi et al., 2008).
We have applied long-chain diols as tracers for past SST (using the LDI), upwelling and nutrient conditions (diol index), and [] and [] (NDI) at ODP 1234, located within the Peru–Chile upwelling system. The LDI agrees with the TEX and U sea surface temperature records, as well as with the planktonic δ18O, suggesting that the LDI reflects past SSTs. During the last interglacial (MIS 5), increased accumulation of TOC and phytoplankton lipid biomarkers centered around 100 ka indicate enhanced primary productivity. Concurrently, there is a peak abundance in preserved Chaetoceros diatoms, suggesting a peak in upwelling intensity. The diol index peaks before and after this peak in upwelling, agreeing with present-day diatom distributions along the Chile–Peru margin, with Chaetoceros diatoms being dominant during upwelling and Proboscia alata thriving in more stable waters. The NDI (based primarily on the C28 1,14-diol) shows the same trend as the diol index (based on both the C28 and C30 1,14-diols), i.e., also showing a dip around 100 ka, suggesting low mean annual nitrate and phosphate concentrations during this upwelling interval, which is not realistic. Likely P. alata is the main C28 1,14-diol producer at ODP 1234, suggesting that the NDI likely reflects P. alata productivity at the core site and is therefore not suitable as a paleo-nutrient tracer, since the species is generally outcompeted when Si concentrations increase, i.e., during upwelling (potentially explaining the minimum in NDI around 100 ka). Overall, these data suggest that the NDI and the diol index should perhaps be considered indicators for Proboscia productivity, rather than nutrient concentrations or general upwelling conditions.
The data reported in this paper is archived in PANGAEA: https://doi.pangaea.de/10.1594/PANGAEA.892651 (de Bar et al., 2018).
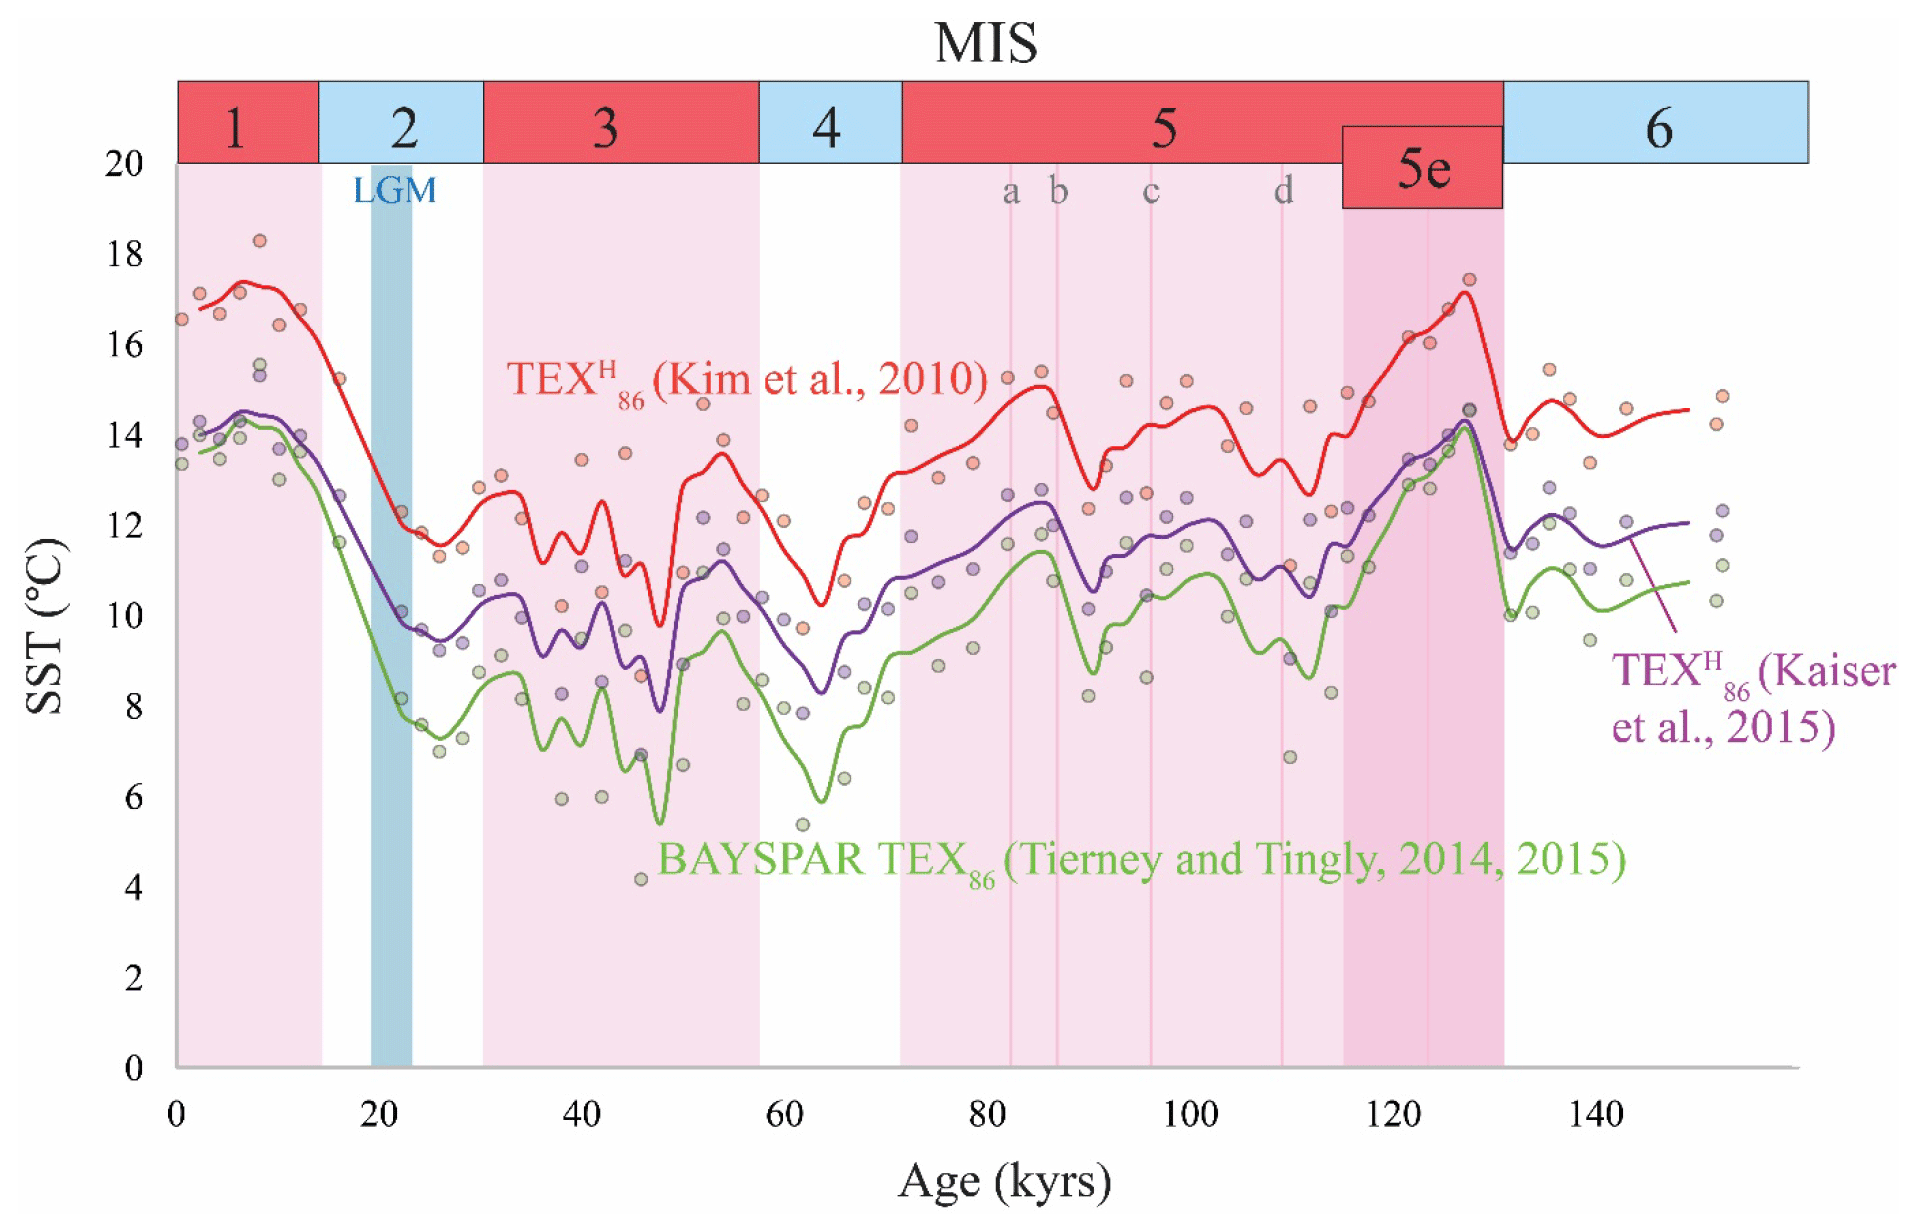
Figure A1TEX86 records for ODP 1234 with different calibrations, i.e., the global core-top calibration of Kim et al. (2010) in red (TEX), the local core-top calibration of Kaiser et al. (2015) in purple, and the Bayesian model of Tierney and Tingley (2014, 2015) in green applying the BAYSPAR tool (http://bayspar.geo.arizona.edu, last access: April 2018). For the BAYSPAR calculation we have assumed a prior mean 13 ∘C and a search tolerance of 0.2 TEX86 units. The calculated values are based on TEX86 values from 62 latitude–longitude grid boxes that are 20∘ by 20∘.
MWdB, JSSD, and SS designed the experiments and DS carried them out. JFM analyzed the planktonic foraminiferal stable oxygen isotopes. MWdB prepared the paper with contributions from all coauthors.
The authors declare that they have no conflict of interest.
We thank Phil Rumford for the sampling of core ODP 1234. Ronald van Bommel is
thanked for analytical support. Linda Heusser and Alan Mix are thanked for
providing the age model. Alberto Reyes and three anonymous reviewers are
thanked for their constructive comments, which improved the paper. This
research has been funded by the European Research Council (ERC) under the
European Union's Seventh Framework Program (FP7/2007–2013) ERC grant
agreement 339206 to Stefan Schouten. Stefan Schouten and Jaap S. Sinninghe Damsté receive funding from the
Netherlands Earth System Science Center (NESSC) though a gravitation grant
from the Dutch ministry for Education, Culture and Science (grant number 024.002.001).
The contribution of Jerry F. McManus to this work was supported in part
by funding from the United States National Science Foundation.
Edited by: Alberto Reyes
Reviewed by: three anonymous referees
Abrantes, F.: Diatom assemblages as upwelling indicators in surface sediments off Portugal, Mar. Geol., 85, 15–39, 1988.
Abrantes, F. and Moita, M. T.: Water column and recent sediment data on diatoms and coccolithophorids, off Portugal, confirm sediment record of upwelling events, Oceanol. Acta, 22, 318–336, 1999.
Abrantes, F., Lopes, C., Mix, A., and Pisias, N.: Diatoms in Southeast Pacific surface sediments reflect environmental properties, Quaternary Sci. Rev., 26, 155–169, 2007.
Anabalón, V., Morales, C. E., Escribano, R., and Angélica Varas, M.: The contribution of nano- and micro-planktonic assemblages in the surface layer (0–30m) under different hydrographic conditions in the upwelling area off Concepción, central Chile, Prog. Oceanogr., 75, 396–414, 2007.
Berger, W.H., Fischer, K., Lai, C., and Wu., G.: Ocean productivity and organic carbon flux. Part I. Overview and maps of primary production and export productivity, University of California, San Diego, La Jolla, California, 1987.
Bin Shaari, H.: Hydrological evolution of the eastern tropical Pacific during the last 430,000 years, PhD Thesis, Hokkaido University, 2013.
Bin Shaari, H., Yamamoto, M., and Irino, T.: Enhanced upwelling in the eastern equatorial Pacific at the last five glacial terminations, Paleogeogr. Paleocl., 386, 8–15, 2013.
Bin Shaari, H., Yamamoto, M., Irino, T., and Oba, T.: Nutricline shoaling in the eastern Pacific warm pool during the last two glacial maxima, J. Oceanogr., 70, 25–34, 2014.
Blunier, T. and Brook, E. J.: Timing of millennial-scale climate change in Antarctica and Greenland during the last glacial period, Science, 291, 109–112, 2001.
Boon, J. J., Rijpstra, W. I. C., Delange, F., de Leeuw, J. W., Yoshioka, M., and Shimizu, Y.: Black Sea sterol – molecular fossil for dinoflagellate blooms, Nature, 277, 125–127, 1979.
Boyer, T. P., Antonov, J. I., Baranova, O. K., Coleman, C., Garcia, H. E., Grodsky, A., Johnson, D. R., Locarnini, R. A., Mishonov, A. V., O'Brien, T. D., Paver, C. R., Reagan, J. R., Seidov, D., Smolyar, I. V., and Zweng, M. M.: World Ocean Database 2013, NOAA Atlas NESDIS 72, edited by: Levitus, S. A. Mishonov, Technical Ed., Silver Spring, MD, 209 pp., https://doi.org/10.7289/V5NZ85MT, 2013.
Bordovskiy O. K.: Accumulation of organic matter in bottom sediments, Mar. Geol., 3, 33–82, 1965.
Brassell, S. C., Eglinton, G., Marlowe, I. T., Pflaumann, U., and Sarnthein, M.: Molecular stratigraphy – a new tool for climatic assessment, Nature, 320, 129–133, 1986.
Brathauer, U. and Abelmann, A.: Late Quaternary variations in sea surface temperatures and their relationship to orbital forcing recorded in the Southern Ocean (Atlantic sector), Paleoceanography, 14, 135–148, 1999.
Caniupán, M., Lamy, F., Lange, C. B., Kaiser, J., Arz, H., Kilian, R., Urrea, O. B., Aracena, C., Hebbeln, D., Kissel, C., Laj, C., Mollenhauer, G., and Tiedemann, R.: Millennial-scale sea surface temperature and Patagonian Ice Sheet changes off southernmost Chile (53∘ S) over the past ∼60 kyr, Paleoceanography, 26, PA3221, https://doi.org/10.1029/2010PA002049, 2011.
Carr, M. E. and Kearns, E. J.: Production regimes in four Eastern Boundary Current systems, Deep-Sea Res. Pt. II, 50, 3199–3221, 2003.
Chase, Z., McManus, J. F., Mix, A. C., and Muratli, J.: Southern-ocean and glaciogenic nutrients control diatom export production on the Chile margin, Quaternary Sci. Rev., 99, 135–145, 2014.
Chen, W. W., Mohtadi, M., Schefuss, E., and Mollenhauer, G.: Organic-geochemical proxies of sea surface temperature in surface sediments of the tropical eastern Indian Ocean, Deep-Sea Res. Pt. I, 88, 17–29, 2014.
CLIMAP: The Surface of the Ice-Age Earth, Science, 191, 1131–1137, 1976.
Contreras, S., Lange, C. B., Pantoja, S., Lavik, G., Rincon-Martinez, D., and Kuypers, M. M. M.: A rainy northern Atacama Desert during the last interglacial, Geophys. Res. Lett., 37, L23612, https://doi.org/10.1029/2010GL045728, 2010.
Costa, K. M., McManus, J. F., and Anderson, R. F.: Radiocarbon and Stable Isotope Evidence for Changes in Sediment Mixing in the North Pacific Over the Past 30 kyr, Radiocarbon, 60, 113–135, 2018.
Daneri, G., Dellarossa, V., Quinones, R., Jacob, B., Montero, P., and Ulloa, O.: Primary production and community respiration in the Humboldt Current System off Chile and associated oceanic areas, Mar. Ecol. Prog. Ser., 197, 41–49, 2000.
de Baar, H. J. W., Dejong, J. T. M., Bakker, D. C. E., Loscher, B. M., Veth, C., Bathmann, U., and Smetacek, V.: Importance of iron for plankton blooms and carbon-dioxide drawdown in the Southern-Ocean, Nature, 373, 412–415, 1995.
de Bar, M. W., Dorhout, D. J. C., Hopmans, E. C., Rampen, S. W., Sinninghe Damsté, J. S., and Schouten, S.: Constraints on the application of long chain diol proxies in the Iberian Atlantic margin, Org. Geochem., 101, 184–195, 2016.
de Bar, M. W., Stolwijk, D., McManus, J. F., Sinninghe Damsté, J. S., and Schouten, S.: A Late Quaternary climate record based on long chain diol proxies from ODP Site 202-1234, available at: https://doi.pangaea.de/10.1594/PANGAEA, last access: November 2018.
de Jonge, C., Hopmans, E. C., Zell, C. I., Kim, J.-H., Schouten, S., and Sinninghe Damsté, J. S.: Occurrence and abundance of 6-methyl branched glycerol dialkyl glycerol tetraethers in soils: Implications for palaeoclimate reconstruction, Geochim. Cosmochim. Ac., 141, 97–112, 2014.
de Jonge, C., Stadnitskaia, A., Hopmans, E. C., Cherkashov, G., Fedotov, A., Streletskaya, I. D., Vasiliev, A. A., and Sinninghe Damsté, J. S.: Drastic changes in the distribution of branched tetraether lipids in suspended matter and sediments from the Yenisei River and Kara Sea (Siberia): Implications for the use of brGDGT-based proxies in coastal marine sediments, Geochim. Cosmochim. Ac., 165, 200–225, 2015.
de Leeuw, J. W., v.d. Meer, F. W., Rijpstra, W. I. C., and Schenck, P. A.: On the occurrence and structural identification of long chain unsaturated ketones and hydrocarbons in sediments, Phys. Chem. Earth, 12, 211–217, 1980.
Emerson, S. and Hedges, J. I.: Processes controlling the organic carbon content of open ocean sediments, Paleoceanography, 3, 621–634, 1988.
Fernández, E. and Bode, A.: Succession of phytoplankton assemblages in relation to the hydrography in the southern Bay of Biscay: a multivariate approach, Sci. Mar., 58, 191–205, 1994.
Gal, J.-K., Kim, J.-H., and Shin, K.-H.: Distribution of long chain alkyl diols along a south-north transect of the northwestern Pacific region: Insights into a paleo sea surface nutrient proxy, Org. Geochem., 119, 80–90, 2018.
González, H. E., Menschel, E., Aparicio, C., and Barría, C.: Spatial and temporal variability of microplankton and detritus, and their export to the shelf sediments in the upwelling area off Concepcion, Chile (∼36∘ S), during 2002–2005, Prog. Oceanogr., 75, 435–451, 2007.
Haake, B., Ittekkot, V., Rixen, T., Ramaswamy, V., Nair, R. R., and Curry, W. B.: Seasonality and interannual variability of particle fluxes to the deep Arabian Sea, Deep-Sea Res. Pt. I, 40, 1323–1344, 1993.
Haberle, S. G. and Bennett, K. D.: Postglacial formation and dynamics of North Patagonian Rainforest in the Chonos Archipelago, southern Chile, Quaternary Sci. Rev., 23, 2433–2452, 2004.
Hart, J. T.: Phytoplankton periodicity in Antarctic surface waters, Disc. Rep., 21, 261–356, 1942.
Hebbeln, D., Marchant, M., Freudenthal, T., and Wefer, G.: Surface sediment distribution along the Chilean continental slope related to upwelling and productivity, Mar. Geol., 164, 119–137, 2000.
Hebbeln, D., Marchant, M., and Wefer, G.: Paleoproductivity in the southern Peru-Chile Current through the last 33.000 yr, Mar. Geol., 186, 487–504, 2002.
Hernández-Becerril, D. U. and Pena, M. I. T.: Planktonic diatoms from the Gulf of California and coasts off Baja California: Species of the genus Thalassiosira, Bot. Marina, 38, 543–555, 1995.
Herrera, L. and Escribano, R.: Factors structuring the phytoplankton community in the upwelling site off El Loa River in northern Chile, J. Mar. Syst., 61, 13–38, 2006.
Heusser, C. J.: Ice-age vegetation and climate subtropical Chile, Paleogeogr. Paleocl., 80, 107–127, 1990.
Heusser, L., Heusser, C., Mix, A., and McManus, J. F.: Chilean and Southeast Pacific paleoclimate variations during the last glacial cycle: directly correlated pollen and δ18O records from ODP Site 1234, Quaternary Sci. Rev., 25, 3404–3415, 2006.
Ho, S. L., Mollenhauer, G., Lamy, F., Martínez-Garcia, A., Mohtadi, M., Gersonde, R., Hebbeln, D., Nunez-Ricardo, S., Rosell-Melé, A., and Tiedemann, R.: Sea surface temperature variability in the Pacific sector of the Southern Ocean over the past 700 kyr, Paleoceanography, 27, PA4202, https://doi.org/10.1029/2012PA002317, 2012.
Hopmans, E. C., Weijers, J. W. H., Schefuss, E., Herfort, L., Sinninghe Damsté, J. S., and Schouten, S.: A novel proxy for terrestrial organic matter in sediments based on branched and isoprenoid tetraether lipids, Earth Planet. Sc. Lett., 224, 107–116, 2004.
Hopmans, E. C., Schouten, S., and Sinninghe Damsté, J. S.: The effect of improved chromatography on GDGT-based palaeoproxies, Org. Geochem., 93, 1–6, 2016.
Huguet, C., Hopmans, E. C., Febo-Ayala, W., Thompson, D. H., Sinninghe Damsté, J. S., and Schouten, S.: An improved method to determine the absolute abundance of glycerol dibiphytanyl glycerol tetraether lipids, Org. Geochem., 37, 1036–1041, 2006.
Huguet, C., Schimmelmann, A., Thunell, R., Lourens, L. J., Sinninghe Damsté, J. S., and Schouten, S.: A study of the TEX86 paleothermometer in the water column and sediments of the Santa Barbara Basin, California, Paleoceanography, 22, PA3203, https://doi.org/10.1029/2006PA001310, 2007.
Jonas, A. S., Schwark, L., and Bauersachs, T.: Late Quaternary water temperature variations of the Northwest Pacific based on the lipid paleothermometers TEX, U and LDI, Deep-Sea Res. Pt. I, 125, 81–93, 2017.
Kaiser, J. and Lamy, F.: Links between Patagonian Ice Sheet fluctuations and Antarctic dust variability during the last glacial period (MIS 4-2), Quaternary Sci. Rev., 29, 1464–1471, 2010.
Kaiser, J., Lamy, F., and Hebbeln, D.: A 70-kyr sea surface temperature record off southern Chile (Ocean Drilling Program Site 1233), Paleoceanography, 20, PA4009, https://doi.org/10.1029/2005PA001146, 2005.
Kaiser, J., Schouten, S., Kilian, R., Arz, H. W., Lamy, F., and Sinninghe Damsté, J. S.: Isoprenoid and branched GDGT-based proxies for surface sediments from marine, fjord and lake environments in Chile, Org. Geochem., 89/90, 117–127, 2015.
Katsuki, K., Takahashi, K., and Okada, M.: Diatom assemblage and productivity changes during the last 340,000 years in the subarctic Pacific, J. Oceanogr., 59, 695–707, 2003.
Kim, J.-H., Schneider, R. R., Hebbeln, D., Müller, P. J., and Wefer, G.: Last deglacial sea-surface temperature evolution in the Southeast Pacific compared to climate changes on the South American continent, Quaternary Sci. Rev., 21, 2085–2097, 2002.
Kim, J.-H., van der Meer, J., Schouten, S., Helmke, P., Willmott, V., Sangiorgi, F., Koc, N., Hopmans, E. C., and Sinninghe Damsté, J. S.: New indices and calibrations derived from the distribution of crenarchaeal isoprenoid tetraether lipids: Implications for past sea surface temperature reconstructions, Geochim. Cosmochim. Ac., 74, 4639–4654, 2010.
Kim, J.-H., Schouten, S., Rodrigo-Gámiz, M., Rampen, S., Marino, G., Huguet, C., Helmke, P., Buscail, R., Hopmans, E. C., Pross, J., Sangiorgi, F., Middelburg, J. B. M., and Sinninghe Damsté, J. S.: Influence of deep-water derived isoprenoid tetraether lipids on the TEX paleothermometer in the Mediterranean Sea, Geochim. Cosmochim. Ac., 150, 125–141, 2015.
Klok, J., Cox, H. C., Deleeuw, J. W., and Schenck, P. A.: Loliolides and dihydroactinidiolide in a recent marine sediment probably indicate a major transformation pathway of carotenoids, Tetrahedron Lett., 25, 5577–5580, 1984.
Koning, E., van Iperen, J. M., van Raaphorst, W., Helder, W., Brummer, G. J. A., and van Weering, T. C. E.: Selective preservation of upwelling-indicating diatoms in sediments off Somalia, NW Indian Ocean, Deep-Sea Res. Pt. I, 48, 2473–2495, 2001.
Lamy, F., Hebbeln, D., and Wefer, G.: Late quaternary precessional cycles of terrigenous sediment input off the Norte Chico, Chile (27.5∘ S) and palaeoclimatic implications, Paleogeogr. Paleocl., 141, 233–251, 1998.
Lamy, F., Hebbeln, D., and Wefer, G.: High-resolution marine record of climatic change in mid-latitude Chile during the last 28,000 years based on terrigenous sediment parameters, Quaternary Res., 51, 83–93, 1999.
Lamy, F., Hebbeln, D., Rohl, U., and Wefer, G.: Holocene rainfall variability in southern Chile: a marine record of latitudinal shifts of the Southern Westerlies, Earth Planet. Sc. Lett., 185, 369–382, 2001.
Lamy, F., Ruhlemann, C., Hebbeln, D., and Wefer, G.: High- and low-latitude climate control on the position of the southern Peru-Chile Current during the Holocene, Paleoceanography, 17, 1–10, https://doi.org/10.1029/2001PA000727, 2002.
Lamy, F., Kaiser, J., Ninnemann, U., Hebbeln, D., Arz, H. W., and Stoner, J.: Antarctic timing of surface water changes off Chile and Patagonian ice sheet response, Science, 304, 1959–1962, 2004.
Lange, C. B., Romero, O. E., Wefer, G., and Gabric, A. J.: Offshore influence of coastal upwelling off Mauritania, NW Africa, as recorded by diatoms in sediment traps at 2195 m water depth, Deep-Sea Res. Pt. I, 45, 985–1013, 1998.
Lattaud, J., Dorhout, D., Schulz, H., Castañeda, I. S., Schefuß, E., Sinninghe Damsté, J. S., and Schouten, S.: The C32 alkane-1,15-diol as a proxy of late Quaternary riverine input in coastal margins, Clim. Past, 13, 1049–1061, https://doi.org/10.5194/cp-13-1049-2017, 2017a.
Lattaud, J., Kim, J.-H., De Jonge, C., Zell, C., Sinninghe Damsté, J. S., and Schouten, S.: The C32 alkane-1,15-diol as a tracer for riverine input in coastal seas, Geochim. Cosmochim. Ac., 202, 146–158, 2017b.
Levitus, S., Burgett, R., and Boyer, T. B.: World Ocean Atlas 1994, Nutrients, NOAA, US Dept. of Comm., Washington, DC, vol. 3, 1994.
Lisiecki, L. E. and Raymo, M. E.: A Pliocene-Pleistocene stack of 57 globally distributed benthic δ18O records, Paleoceanography, 20, PA1003, https://doi.org/10.1029/2004PA001071, 2005.
Locarnini, R. A., Mishonov A. V., Antonov J. I., Boyer T. P., Garcia, H. E., Baranova, O. K., Zweng, M. M., Paver, C. R., Reagan, J. R., Johnson, D. R., Hamilton, M., and Seidov, D.: World Ocean Atlas 2013, Volume 1: Temperature, edited by: Levitus, S., A. Mishonov Technical Ed., NOAA Atlas NESDIS 73, 40 pp., 2013.
Lopes dos Santos, R. A. L., Wilkins, D., de Deckker, P., and Schouten, S.: Late Quaternary productivity changes from offshore Southeastern Australia: A biomarker approach, Paleogeogr. Paleocl., 363, 48–56, 2012.
Lopes dos Santos, R. A. L., Spooner, M. I., Barrows, T. T., de Deckker, P., Sinninghe Damsté, J. S., and Schouten, S.: Comparison of organic (U, TEX6, LDI) and faunal proxies (foraminiferal assemblages) for reconstruction of late Quaternary sea surface temperature variability from offshore southeastern Australia, Paleoceanography, 28, 377–387, 2013.
Lopez-Escobar, L., Frey, F. A., and Vergara, M.: Andesites and high-alumina basalts from central south Chile high Andes – geochemical evidence bearing on their petrogenesis, Contrib. Mineral. Petr., 63, 199–228, 1977.
Marchant, M., Hebbeln, D., and Wefer, G.: High resolution planktic foraminiferal record of the last 13,300 years from the upwelling area off Chile, Mar. Geol., 161, 115–128, 1999.
Marlowe, I. T., Brassell, S. C., Eglinton, G., and Green, J. C.: Long chain unsaturated ketones and esters in living algae and marine sediments, Org. Geochem., 6, 135–141, 1984.
Martin, M. W., Kato, T. T., Rodriguez, C., Godoy, E., Duhart, P., McDonough, M., and Campos, A.: Evolution of the late Paleozoic accretionary complex and overlying forearc-magmatic arc, south central Chile (38∘–41∘ S): Constraints for the tectonic setting along the southwestern margin of Gondwana, Tectonics, 18, 582–605, 1999.
McManus, J. F., Oppo, D. W., and Cullen, J. L.: A 0.5-million-year record of millennial-scale climate variability in the North Atlantic, Science, 283, 971–975, 1999.
McManus, J. F., Oppo, D. W., Keigwin, L. D., Cullen, J. L., and Bond, G. C.: Thermohaline circulation and prolonged interglacial warmth in the North Atlantic, Quaternary Res., 58, 17–21, 2002.
McManus, J. F., Oppo, D. W., Cullen, J. L., and Healey, S. L.: Marine Isotope Stage 11 (MIS 11): Analog for Holocene and future climate?, in: Geophysical Monograph 137, Earth's Climate and Orbital Eccentricity: The Marine Isotope Stage 11 Question, edited by: Droxler, A., Poore, R., Burckle, L., and Osterman, L., 69–85, 2003.
Méjanelle, L., Sanchez-Gargallo, A., Bentaleb, I., and Grimalt, J. O.: Long chain n-alkyl diols, hydroxy ketones and sterols in a marine eustigmatophyte, Nannochloropsis gaditana, and in Brachionus plicatilis feeding on the algae, Org. Geochem., 34, 527–538, 2003.
Meyers, P. A.: Organic geochemical proxies of paleoceanographic, paleolimnologic, and paleoclimatic processes, Org. Geochem., 27, 213–250, 1997.
Mix, A. C., Tiedemann, R., Blum, P., Abrantes, F. F., Benway, H, Cacho-Lascorz, I., Chen, M.-T., Delaney, M. L., Flores, J.-A. Giosan, L., Holbourn, A. E., Irino, T., Iwai, M., Joseph, L. H., Kleiven, H. F., Lamy, F., Lund, S. P., Martinez, P., McManus J. F., Ninneman, U. S., Pisias, N. G., Robinson, R. S., Stoner, J. S., Sturm, A., Wara, M. W., and Wei, W.: Proc. ODP, Init. Repts., 202: College Station, TX (Ocean Drilling Program), chapter 5: Site 1234, https://doi.org/10.2973/odp.proc.ir.202.2003, 2003.
Mohtadi, M. and Hebbeln, D.: Mechanisms and variations of the paleoproductivity off northern Chile (24∘ S–33∘ S) during the last 40,000 years, Paleoceanography, 19, PA2023, https://doi.org/10.1029/2004PA001003, 2004.
Mohtadi, M., Rossel, P., Lange, C. B., Pantoja, S., Boning, P., Repeta, D. J., Grunwald, M., Lamy, F., Hebbeln, D., and Brumsack, H. J.: Deglacial pattern of circulation and marine productivity in the upwelling region off central-south Chile, Earth Planet. Sc. Lett., 272, 221–230, 2008.
Moita, M. T., Oliveira, P. B., Mendes, J. C., and Palma, A. S.: Distribution of chlorophyll a and Gymnodinium catenatum associated with coastal upwelling plumes off central Portugal, Acta Oecol.-Int. J. Ecol., 24, S125–S132, 2003.
Müller, P. J., Kirst, G., Ruhland, G., von Storch, I., and Rosell-Melé, A.: Calibration of the alkenone paleotemperature index U based on core-tops from the eastern South Atlantic and the global ocean (60∘ N–60∘ S), Geochim. Cosmochim. Ac., 62, 1757–1772, 1998.
Muratli, J. M., Chase, Z., McManus, J. F., and Mix, A.: Ice-sheet control of continental erosion in central and southern Chile (36∘–41∘ S) over the last 30,000 years, Quaternary Sci. Rev., 29, 3230–3239, 2010a.
Muratli, J. M., Chase, Z., Mix, A. C., and McManus, J. F.: Increased glacial-age ventilation of the Chilean margin by Antarctic Intermediate Water, Nat. Geosci., 3, 23–36, 2010b.
Pancost, R. D., Boot, C. S., Aloisi, G., Maslin, M., Bickers, C., Ettwein, V., Bale, N., and Handley, L.: Organic geochemical changes in Pliocene sediments of ODP Site 1083 (Benguela Upwelling System), Paleogeogr. Paleocl., 280, 119–131, 2009.
Plancq, J., Grossi, V., Pittet, B., Huguet, C., Rosell-Melé, A., and Mattioli, E.: Multi-proxy constraints on sapropel formation during the late Pliocene of central Mediterranean (southwest Sicily), Earth Planet. Sc. Lett., 420, 30–44, 2015.
Prahl, F. G. and Wakeham, S. G.: Calibration of unsaturation patterns in long-chain ketone compositions for paleotemperature assessment, Nature, 330, 367–369, 1987.
Prahl, F. G. and Muehlhausen, L. A.: Lipid biomarkers as geochemical tools for paleoceanographic study, John Wiley, 271–280, 1989.
Prahl, F. G., Muehlhausen, L. A., and Zahnle, D. L.: Further evaluation of long-chain alkenones as indicators of paleoceanographic conditions, Geochim. Cosmochim. Ac., 52, 2303–2310, 1988.
Prahl, F. G., Dymond, J., and Sparrow, M. A.: Annual biomarker record for export production in the central Arabian Sea, Deep-Sea Res. Pt. II, 47, 1581–1604, 2000.
Rampen, S. W., Schouten, S., Wakeham, S. G., and Sinninghe Damsté, J. S.: Seasonal and spatial variation in the sources and fluxes of long chain diols and mid-chain hydroxy methyl alkanoates in the Arabian Sea, Org. Geochem., 38, 165–179, 2007.
Rampen, S. W., Schouten, S., Koning, E., Brummer, G. J. A., and Sinninghe Damsté, J. S.: A 90 kyr upwelling record from the northwestern Indian Ocean using a novel long-chain diol index, Earth Planet. Sc. Lett., 276, 207–213, 2008.
Rampen, S. W., Schouten, S., and Sinninghe Damsté, J. S.: Occurrence of long chain 1,14-diols in Apedinella radians, Org. Geochem., 42, 572–574, 2011.
Rampen, S. W., Willmott, V., Kim, J.-H., Uliana, E., Mollenhauer, G., Schefuss, E., Sinninghe Damsté, J. S., and Schouten, S.: Long chain 1,13-and 1,15-diols as a potential proxy for palaeotemperature reconstruction, Geochim. Cosmochim. Ac., 84, 204–216, 2012.
Rampen, S. W., Datema, M., Rodrigo-Gamiz, M., Schouten, S., Reichart, G.-J., and Sinninghe Damsté, J. S.: Sources and proxy potential of long chain alkyl diols in lacustrine environments, Geochim. Cosmochim. Ac., 144, 59–71, 2014a.
Rampen, S. W., Willmott, V., Kim, J.-H., Rodrigo-Gamiz, M., Uliana, E., Mollenhauer, G., Schefuss, E., Sinninghe Damsté, J. S., and Schouten, S.: Evaluation of long chain 1,14-alkyl diols in marine sediments as indicators for upwelling and temperature, Org. Geochem., 76, 39–47, 2014b.
Repeta, D. J.: Carotenoid diagenesis in recent marine sediments: II. Degradation of fucoxanthin to loliolide, Geochim. Cosmochim. Ac., 53, 699–707, 1989.
Riegman, R., de Boer, M., and Domis, L. D.: Growth of harmful marine algae in multispecies cultures, J. Plankton Res., 18, 1851–1866, 1996.
Rodrigo-Gámiz, M., Martinez-Ruiz, F., Rampen, S. W., Schouten, S., and Sinninghe Damsté, J. S.: Sea surface temperature variations in the western Mediterranean Sea over the last 20 kyr: A dual- organic proxy (U and LDI) approach, Paleoceanography, 29, 87–98, 2014.
Rodrigo-Gámiz, M., Rampen, S. W., de Haas, H., Baas, M., Schouten, S., and Sinninghe Damsté, J. S.: Constraints on the applicability of the organic temperature proxies U, TEX86 and LDI in the subpolar region around Iceland, Biogeosciences, 12, 6573–6590, https://doi.org/10.5194/bg-12-6573-2015, 2015.
Romero, O. E., Hebbeln, D., and Wefer, G.: Temporal and spatial variability in export production in the SE Pacific Ocean: evidence from siliceous plankton fluxes and surface sediment assemblages, Deep-Sea Res. Pt. I, 48, 2673–2697, 2001.
Romero, O. and Hebbeln, D.: Biogenic silica and diatom thanatocoenosis in surface sediments below the Peru-Chile Current: controlling mechanisms and relationship with productivity of surface waters, Mar. Micropaleontol., 48, 71–90, 2003.
Romero, O. E., Kim, J.-H., and Hebbeln, D.: Paleoproductivity evolution off central Chile from the Last Glacial Maximum to the Early Holocene, Quaternary Res., 65, 519–525, 2006.
Rostek, F., Bard, E., Beaufort, L., Sonzogni, C., and Ganssen, G.: Sea surface temperature and productivity records for the past 240 kyr in the Arabian Sea, Deep-Sea Res. Pt. II, 44, 1461–1480, 1997.
Sakka, A., Legendre, L., Gosselin, M., Leblanc, B., Delesalle, B., and Price, N.: Nitrate, phosphate, and iron limitation of the phytoplankton assemblage in the lagoon of Takapoto Atoll (Tuamotu Archipelago, French Polynesia), 1999.
Sanchez, G. E., Lange, C. B., Gonzalez, H. E., Vargas, G., Munoz, P., Cisternas, C., and Pantoja, S.: Siliceous microorganisms in the upwelling center off Concepcion, Chile (36∘ S): Preservation in surface sediments and downcore fluctuations during the past similar to 150 years, Prog. Oceanogr., 92–95, 50–65, 2012.
Schlitzer, R.: Data Analysis and Visualization with Ocean Data View, CMOS Bulletin SCMO, 43, 9–13, available at: https://odv.awi.de/ (last access: April 2018), 2015.
Schouten, S., Hopmans, E. C., Schefuss, E., and Sinninghe Damsté, J. S.: Distributional variations in marine crenarchaeotal membrane lipids: a new tool for reconstructing ancient sea water temperatures?, Earth Planet. Sc. Lett., 204, 265–274, 2002.
Schouten, S., Hopmans, E. C., and Sinninghe Damsté, J. S.: The organic geochemistry of glycerol dialkyl glycerol tetraether lipids: A review, Org. Geochem., 54, 19–61, 2013.
Schouten, S. C. Hopmans, E., Forster, A., van Breugel, Y. M. M., Kuypers, M., and Sinninghe Damsté, J.: Extremely high sea-surface temperatures at low latitudes during the middle Cretaceous as revealed by archaeal membrane lipids, Geology, 31, 1069–1072, 2003.
Schrader, H. and Sorknes, R.: Peruvian coastal upwelling – Late Quaternary productivity changes revealed by diatoms, Mar. Geol., 97, 233–249, 1991.
Seki, O., Schmidt, D. N., Schouten, S., Hopmans, E. C., Sinninghe Damsté, J. S., and Pancost, R. D.: Paleoceanographic changes in the Eastern Equatorial Pacific over the last 10 Myr, Paleoceanography, 27, PA3224, https://doi.org/10.1029/2011PA002158, 2012.
Shackleton, N. J.: Attainment of isotopic equilibrium between ocean water and the benthonic foraminifera genus Uvigerina: isotopic changes in the ocean during the last glacial, England, Colloques Internationaux du C.N.R.S, 1974.
Shackleton, N. J., Hall, M. A., and Vincent, E.: Phase relationships between millennial-scale events 64,000–24,000 years ago, Paleoceanography, 15, 565–569, 2000.
Shackleton, N. J., Fairbanks, R. G., Chiu, T. C., and Parrenin, F.: Absolute calibration of the Greenland time scale: implications for Antarctic time scales and for Delta C-14, Quaternary Sci. Rev., 23, 1513–1522, 2004.
Sinninghe Damsté, J. S., Rijpstra, W. I. C., Hopmans, E. C., Prahl, F. G., Wakeham, S. G., and Schouten, S.: Distribution of membrane lipids of planktonic Crenarchaeota in the Arabian seat, Appl. Environ. Microbiol., 68, 2997–3002, 2002.
Sinninghe Damsté, J. S., Rampen, S., Irene, W., Rupstra, C., Abbas, B., Muyzer, G., and Schouten, S.: A diatomaceous origin for long-chain diols and mid-chain hydroxy methyl alkanoates widely occurring in Quaternary marine sediments: Indicators for high-nutrient conditions, Geochim. Cosmochim. Ac., 67, 1339–1348, 2003.
Sinninghe Damsté, J. S., Ossebaar, J., Schouten, S., and Verschuren, D.: Distribution of tetraether lipids in the 25-ka sedimentary record of Lake Challa: extracting reliable TEX86 and MBT ∕ CBT palaeotemperatures from an equatorial African lake, Quaternary Sci. Rev., 50, 43–54, 2012.
Smith, S. L.: Understanding the Arabian Sea: Reflections on the 1994–1996 Arabian Sea Expedition, Deep-Sea Res. Pt. II, 48, 1385–1402, 2001.
Stern, J. V. and Lisiecki, L. E.: Termination 1 timing in radiocarbon-dated regional benthic δ18O stacks, Paleoceanography, 29, 1127–1142, 2014.
Strub, T. P., Mesias, M. J., Montecino, V., Rutland, J., and Salinas, S.: Coastal ocean circulation off western South America, edited by: Robinson, R. A. and Brink, H. K., The Global Coastal Ocean – Regional Studies and Synthesis. The Sea, Ideas and Observations on Progress in the Study of the Seas, John Wiley & Sons, Inc, New York, 273–313, 1998.
Stuut, J.-B. W. and Lamy, F.: Climate variability at the southern boundaries of the Namib (Southwestern Africa) and Atacama (northern Chile) coastal deserts during the last 120,000 yr, Quaternary Res., 62, 301–309, 2004.
Stuut, J.-B. W., Marchant, M., Kaiser, J., Lamy, F., Mohtadi, M., Romero, O., and Hebbeln, D.: The late quaternary paleoenvironment of Chile as seen from marine archives, Geogr. Helv., 61, 135–151, https://doi.org/10.5194/gh-61-135-2006, 2006.
Sukhanova, I. N., Flint, M. V., Whitledge, T. E., Stockwell, D. A., and Rho, T. K.: Mass development of the planktonic diatom Proboscia alata over the Bering Sea shelf in the summer season, Oceanology, 46, 200–216, 2006.
Takahashi, K., Jordan, R., and Priddle, J.: The diatom genus Proboscia in Subantarctic waters, Diatom Res., 9, 411–428, 1994.
Tarazona, J., Gutiérrez, D., Paredes, C., and Indacochea, A.: Overview and challenges of Marine Biodiversity Research in Peru, Gayana (Concepción), 2003.
Thomas, A. C.: Seasonal distributions of satellite-measured phytoplankton pigment concentration along the Chilean coast, J. Geophys. Res.-Ocean., 104, 25877–25890, 1999.
Thomas, A. C., Huang, F., Strub, P. T., and James, C.: Comparison of the seasonal and interannual variability of phytoplankton pigment concentrations in the Peru and California Current systems, J. Geophys. Res.-Ocean., 99, 7355–7370, 1994.
Tierney, J. E. and Tingley, M. P.: A Bayesian, spatially-varying calibration model for the TEX86 proxy, Geochim. Cosmochim. Ac., 127, 83–106, 2014.
Tierney, J. E. and Tingley, M. P.: A TEX86 surface sediment database and extended Bayesian calibration, Sci. Data, 2, 150029, https://doi.org/10.1038/sdata.2015.29, 2015.
Tierney, J. E. and Tingley, M. P.: BAYSPLINE: A New Calibration for the Alkenone Paleothermometer, Paleoceanography and Paleoclimatology, 33, 281–301, 2018.
Vargas, G., Ortlieb, L., Pichon, J. J., Bertaux, J., and Pujos, M.: Sedimentary facies and high resolution primary production inferences from laminated diatomacous sediments off northern Chile (23∘ S), Mar. Geol., 211, 79–99, 2004.
Verleye, T. J. and Louwye, S.: Late Quaternary environmental changes and latitudinal shifts of the Antarctic Circumpolar Current as recorded by dinoflagellate cysts from offshore Chile (41∘ S), Quaternary Sci. Rev., 29, 1025–1039, 2010.
Versteegh, G. J. M., Bosch, H. J., and de Leeuw, J. W.: Potential palaeoenvironmental information of C24 to C36 mid-chain diols, keto-ols and mid-chain hydroxy fatty acids; a critical review, Org. Geochem., 27, 1–13, 1997.
Versteegh, G. J. M., Jansen, J. H. F. de Leeuw, J. W., and Schneider, R. R.: Mid-chain diols and keto-ols in SE Atlantic sediments: a new tool for tracing past sea surface water masses?, Geochim. Cosmochim. Ac., 64, 1879–1892, 2000.
Villanueva, J., Grimalt, J. O., Cortijo, E., Vidal, L., and Labeyriez, L.: A biomarker approach to the organic matter deposited in the North Atlantic during the last climatic cycle, Geochim. Cosmochim. Ac., 61, 4633–4646, 1997.
Volkman, J. K., Eglinton, G., Corner, E. D. S., and Sargent, J. R.: Novel unsaturated straight-chain C37–C39 methyl and ethyl ketones in marine sediments and a coccolithophore Emiliania huxleyi, Phys. Chem. Earth, 12, 219–227, 1980.
Volkman, J. K., Barrett, S. M., Dunstan, G. A., and Jeffrey, S. W.: C30–C32 alkyl diols and unsaturated alcohols in microalgae of the class Eustigmatophyceae, Org. Geochem., 18, 131–138, 1992.
Volkman, J. K., Barrett, S. M., Blackburn, S. I., Mansour, M. P., Sikes, E. L., and Gelin, F.: Microalgal biomarkers: A review of recent research developments, Org. Geochem., 29, 1163–1179, 1998.
Volkman, J. K., Barrett, S. M., and Blackburn, S. I.: Eustigmatophyte microalgae are potential sources of C29 sterols, C22–C28 n-alcohols and C28–C32n-alkyl diols in freshwater environments, Org. Geochem., 30, 307–318, 1999.
Wakeham, S. G., Peterson, M. L., Hedges, J. I., and Lee, C.: Lipid biomarker fluxes in the Arabian Sea, with a comparison to the equatorial Pacific Ocean, Deep-Sea Res. Pt. II, 49, 2265–2301, 2002.
Willmott, V., Rampen, S. W., Domack, E., Canals, M., Sinninghe Damsté, J. S., and Schouten, S.: Holocene changes in Proboscia diatom productivity in shelf waters of the north-western Antarctic Peninsula, Antarct. Sci., 22, 3–10, 2010.
Zhang, Y. G., Zhang, C. L., Liu, X.-L., Li, L., Hinrichs, K.-U., and Noakes, J. E.: Methane Index: A tetraether archaeal lipid biomarker indicator for detecting the instability of marine gas hydrates, Earth Planet. Sc. Lett., 307, 525–534, 2011.
Zhang, Y. G., Pagani, M., and Wang, Z.: Ring Index: A new strategy to evaluate the integrity of TEX86 paleothermometry, Paleoceanography, 31, 220–232, 2016.
Zhu, X. W., Jia, G. D., Mao, S. Y., and Yan, W.: Sediment records of long chain alkyl diols in an upwelling area of the coastal northern South China Sea, Org. Geochem., 121, 1–9, 2018.