the Creative Commons Attribution 3.0 License.
the Creative Commons Attribution 3.0 License.
Climate variability in the subarctic area for the last 2 millennia
Marie Nicolle
Maxime Debret
Nicolas Massei
Christophe Colin
Anne deVernal
Dmitry Divine
Johannes P. Werner
Anne Hormes
Atte Korhola
Hans W. Linderholm
To put recent climate change in perspective, it is necessary to extend the instrumental climate records with proxy data from paleoclimate archives. Arctic climate variability for the last 2 millennia has been investigated using statistical and signal analyses from three regionally averaged records from the North Atlantic, Siberia and Alaska based on many types of proxy data archived in the Arctic 2k database v1.1.1. In the North Atlantic and Alaska, the major climatic trend is characterized by long-term cooling interrupted by recent warming that started at the beginning of the 19th century. This cooling is visible in the Siberian region at two sites, warming at the others. The cooling of the Little Ice Age (LIA) was identified from the individual series, but it is characterized by wide-range spatial and temporal expression of climate variability, in contrary to the Medieval Climate Anomaly. The LIA started at the earliest by around AD 1200 and ended at the latest in the middle of the 20th century. The widespread temporal coverage of the LIA did not show regional consistency or particular spatial distribution and did not show a relationship with archive or proxy type either. A focus on the last 2 centuries shows a recent warming characterized by a well-marked warming trend parallel with increasing greenhouse gas emissions. It also shows a multidecadal variability likely due to natural processes acting on the internal climate system on a regional scale. A ∼ 16–30-year cycle is found in Alaska and seems to be linked to the Pacific Decadal Oscillation, whereas ∼ 20–30- and ∼ 50–90-year periodicities characterize the North Atlantic climate variability, likely in relation with the Atlantic Multidecadal Oscillation. These regional features are probably linked to the sea ice cover fluctuations through ice–temperature positive feedback.
- Article
(3039 KB) - Full-text XML
-
Supplement
(507 KB) - BibTeX
- EndNote
Since the beginning of the industrial era, the global average temperature has increased by about 1 ∘C and recent decades have been the warmest in the last 1400 years (PAGES 2k Consortium, 2013; IPCC, 2013). The warming is more pronounced at high latitudes in the Northern Hemisphere than in other parts of the Earth (Serreze and Barry, 2011; PAGES 2k Consortium, 2013), being more than twice the rate and magnitude in the Arctic than the global average (Cohen et al., 2014). To place this warming in the perspective of long-term natural climate variability, the instrumental time series are not sufficient and it is necessary to extend the meteorological measurements back in time with proxy data from paleoclimate archives (ice cores, tree rings, lake sediments, speleothems, marine sediments and historical series).
Over the last decade, extensive efforts have been made to collect and compile paleoclimate available data to reconstruct past climate variability on regional, hemispheric and global scales. Most temperature reconstructions include different types of archives and proxies (Moberg et al., 2005; Mann et al., 2009; Kaufman et al., 2009; Ljungqvist, 2010; Marcott et al., 2013) and some studies focused on a single paleoclimate archive type and/or area (e.g., McGregor et al., 2015, for oceans; Weissbach et al., 2016, for ice core; Wilson et al., 2016, for tree rings). In the Arctic and subarctic area (90–60∘ N), several multi-proxy reconstructions of temperatures encompassing the last 2 millennia were published on a global (PAGES 2k Consortium, 2013; McKay and Kaufman, 2014; Werner et al., 2017) and regional scale (Hanhijärvi et al., 2013). The annual resolution of these reconstructions allows the study of the climate variability from low frequencies (i.e., millennial and multi-centennial fluctuations) to high frequencies such as decadal variations.
Climatic reconstructions highlighted a millennial cooling trend associated with the monotonic reduction in summer insolation at high northern latitudes and a reversal marked by an important warming of more than 1 ∘C consistent with the increase in greenhouse gases since the mid-20th century (e.g., Kaufman et al., 2009; PAGES 2k Consortium, 2013). The long-term cooling trend correlates with the millennial-scale summer insolation reduction at high northern latitudes (Kaufman et al., 2009) but an increased frequency of volcanic events during the last millennium may also have concurred with and contributed to the cooling episodes that occurred after AD 1000 (PAGES 2k Consortium, 2013; Sigl et al., 2015).
Superimposed on the long-term climate fluctuation, continental-scale temperature reconstructions in the Northern Hemisphere highlight major climatic warming and cooling pulses during the last millennium, with relatively warm conditions during the Medieval Climate Anomaly (MCA, AD 950–1250; Mann et al., 2009) and a cold Little Ice Age (LIA, AD 1400–1700; Mann et al., 2009) period. The LIA is, however, characterized by an important spatial and temporal variability, particularly visible on a more regional scale (e.g., PAGES 2k Consortium, 2013). It has been attributed to a combination of natural external forcings (solar activity and large volcanic eruptions) and internal sea ice and ocean feedback, which fostered long-standing effects of short-lived volcanic events (Miller et al., 2012).
Arctic–subarctic multidecadal climate variability is also influenced by internal climatic system dynamics such as the Atlantic Multidecadal Oscillation (AMO) or the Pacific Decadal Oscillation (PDO), which may impact temperatures and sea ice cover fluctuations (Chylek et al., 2009). The reconstruction of these oscillations with paleoclimate records offers the possibility of exploring the linkages between the internal climate variability and the Arctic–subarctic climate over the last 2 millennia (e.g., Knudsen et al., 2014; Miles et al., 2014; Wei and Lohmann, 2012).
In this study, we explore the regional expression of the Arctic–subarctic climate variability during the last 2 millennia using statistical and wavelet analysis. To do so, we define three regions, North Atlantic, Alaska and Siberia, from which we calculated climatic variations. Hence, the regional mean records allowed us to determine if the timing of the long-term and secular (MCA and LIA) climatic fluctuations that occur on the global Arctic–subarctic scale are also characteristic of the regional climate variability. Special attention is given to the last 2 centuries, with the comparison between the three regional mean records and instrumental climate index, to determine the influence of internal climate variability but also the ability of paleoclimate series to reproduce decadal to multidecadal variability observed in instrumental data.
The records used in this study were compiled by the Arctic 2k working group of the Past Global Changes (PAGES) research program. This working group released a database comprising 56 proxy records for the Arctic area (version 1.1.1; McKay and Kaufman, 2014). The database contains all available records that meet data quality criteria concerning location (from north of 60∘ N), time coverage (extending back to at least AD 1500), mean resolution (better than 50 years) and dating control (at least one age control point every 500 years) (Fig. 1a). See Table S1 in the Supplement for more information about each site (cf. also McKay and Kaufman, 2014).
Proxy records are from different archive types. Most are continental archives with very reliable chronologies (16 ice cores, 13 tree rings, 19 lake sediment cores and 1 speleothem). Six records are from marine archives and one is a historic record (months of ice cover). Among the 56 records, 35 have an annual resolution (Fig. 1b). Hence, the high temporal resolution of the Arctic 2k database series offers the possibility of studying the high-frequency climate variability of the last 2 millennia, assuming that the proxy record climate variability and the archiving process do not induce a bias in the multi-annual to centennial frequencies analyzed.
The database has been built from paleoclimate proxy series with a demonstrated relationship to temperature variability. All the proxy data used have been published in peer-reviewed journals and the sensitivity of each proxy record to temperature was evidenced either statistically (e.g., correlation with instrumental temperature data) or mechanistically with the description of the processes through which the proxy has shown its sensitivity to temperature change (McKay and Kaufman, 2014).
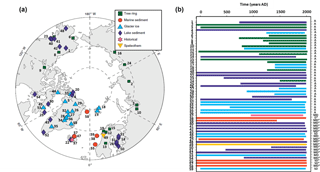
Figure 1Paleoclimate series used for this study. (a) Polar projection of the proxy records location contained in the PAGES Arctic 2k database v1.1.1 (from McKay and Kaufman, 2014). (b) Temporal coverage and resolution (A: annual; SD: subdecadal; D: decadal; MD: multidecadal) of the records from AD 0 to AD 2000. Letters with an asterisk indicate a mean temporal resolution. Colors correspond to archive type and refer to the map legend and numbers in the Arctic 2k database index.
Our review of the original publications presenting the data used to develop the Arctic 2k database led us to raise some concerns about the actual temperature controls on proxy. In some case, the correlation between proxy measurements and instrumental temperatures is significant but weak, with a correlation coefficient lower than 0.5 (e.g., Bird et al., 2009; D'Arrigo et al., 2005, 2009, Spielhagen et al., 2011; Wiles et al., 2014). Such weak relationships suggest that the variability recorded by the proxies is not exclusively linked to the mean annual temperature but probably also relates to other parameters, climatic or not. In some cases, the authors clearly state that the relationship is not strong enough for reconstructing high-resolution variations (D'Arrigo et al., 2005). As there are such uncertainties in the assumed temperature control on proxy, whatever the archive type, we choose to work on the original proxy records directly and not on temperature reconstructions derived from them.
The spatial distribution of the series highlights heterogeneity (Fig. 1a). Among the 56 series of the Arctic 2k database, 40 (71 %) are from the North Atlantic sector, including Scandinavia, Iceland, Greenland and the Canadian Arctic, while 9 (16 %) represent Alaska and 5 (9 %) Siberia. This high spatial discrepancy raises the question of the influence of the over-weighting of the North Atlantic sector on the global Arctic signal. Therefore, to avoid a regional bias, we divide the Arctic area into three sectors (Fig. 2a). The Arc_9 record located in the central part of the Canadian Arctic, between the North Atlantic and Alaska, was finally included in the North Atlantic regional mean record due to the correlation between ring width and Canadian–North American temperatures highlighted by the authors (D'Arrigo et al., 2009).
Calculating regionally averaged records allows us to investigate the common spatial climate signal of each region and reduce the noise of individual records due to local effects (e.g., Weissbach et al., 2016). Before calculating each regional mean record, all records were standardized over the whole record to report the variations in terms of the standard deviation, which permits comparison of the records with each other, regardless of the parameters and unit values of independent records. The number of data points used to calculate each regional mean record is also indicated (Fig. 2e–g). The number of time series used for the Siberian regional averaged record is very low, with only five series for a large area and the statistical representativeness of the data is thus questionable. The AD 0–750 period of the Alaskan regionally averaged record is also the result of a low number of time series. This period should be interpreted with caution.The three regional mean records based on the spatial distribution of the series were calculated and then compared with a global Arctic mean record presented in Fig. 3.
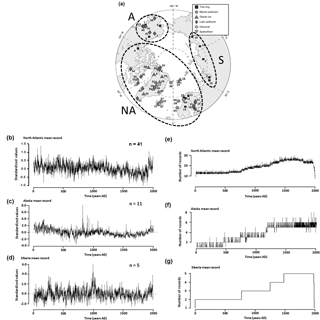
Figure 2(a) Map of record location (modified from McKay and Kaufman, 2014). Dashed lines show selected area used for calculating the three regional mean records (NA: North Atlantic, A: Alaska and S: Siberia) presented at (b–c) curves. n corresponds to the number of records available in each area. Each regional mean record is associated with a corresponding number of records available for each year.
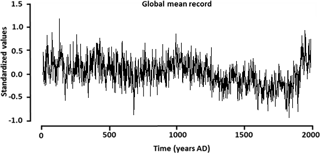
Figure 3Global Arctic mean record obtained from the paleoclimate series contained in the PAGES Arctic 2k database.
The correlation between the global Arctic record and the mean North Atlantic record shows a particularly strong relationship (Fig. 4b; r2 = 0.81, p value ≪ 0.05). Correlations are weaker between the Arctic mean and the regional average Alaskan record (Fig. 4b; r2 = 0.23, p value ≪ 0.05) or the regional mean Siberian record (Fig. 4c; r2 = 0.16, p value ≪ 0.05). The strong influence of the spatial distribution of data on the global mean Arctic record is also highlighted by the wavelet coherence analysis (see Appendix A for the method description). Wavelet coherence spectra revealed much stronger coherence between the North Atlantic sector and the global Arctic mean than for the two other regions, particularly at a low frequency with common variabilities for periods around 200 (170–220 years) and 500 years (395–540 years), which occur during the last 2 millennia (Fig. 4d). The coherence spectra between global Arctic mean record and the Alaskan regional record show a significant periodicity around 200 years, for an interval mostly spanning from AD 1330 to AD 1900 (Fig. 4e). The coherence wavelet spectra between the global Arctic mean and the Siberian mean record does not highlight significant periodicity around the centennial scale except after AD 1680 (Fig. 4f). The comparison between regional mean records and the global Arctic subarctic record highlights climate variability dominated by the North Atlantic signal, which is normal because of the much higher number of time series available in this area. For this reason, we decided to study the Arctic–subarctic climate variability for the last 2 millennia with a regional approach.
The grouping into the three regions (i.e., North Atlantic, Alaska and Siberia) is justified by present-day regional climate. The climate of the Arctic–subarctic is influenced by the Atlantic and the Pacific oceans, which experience internal variability on different timescales with specific regional climate impacts. In the North Atlantic sector, instrumental sea surface temperature (SST) variations since AD 1860 highlight low-frequency oscillations known as the AMO (Kerr, 2000). The AMO corresponds to the alternation of warm and cool anomalies, which have a considerable impact on the regional climate over the Atlantic, North America and western Europe (e.g., Enfield et al., 2001; Sutton and Hodson, 2005; Knight et al., 2006; Assani et al., 2011). In the North Pacific, the PDO drives the multidecadal variability (Mantua et al., 1997). It is defined as the leading principal component of monthly SST in the North Pacific Ocean (poleward of 20∘ N) (Mantua et al., 1997; Mantua and Hare, 2002). Positive phases of PDO are associated with precipitation deficit and positive temperature anomalies in the northwestern US and precipitation increases in southern Alaska and the southwestern US (Mantua and Hare, 2002; Zhang and Delworth, 2015). Conditions are reversed during negative PDO phases.
4.1 Long-term tendencies
Regional mean records for the three sectors and their corresponding 50-year LOESS filtering are presented in Figs. 2 and 3. The North Atlantic and Alaskan regional records show a well-marked and significant decrease before the beginning of the 19th century: τ = −0.28 (p ≪ 0.01; Fig. 5b) and τ = −0.42 (p ≪ 0.01; Fig. 5c), respectively. In the Siberian region, no decrease is recorded (τ = −0.02, p = 0.20; Fig. 5d). These trends are also shown from the analysis of all individual records from that region (Fig. 5a and Table S2). All the regions are characterized by significant warming after the beginning of the 19th century: τ = 0.40 (p ≪ 0.01) for the North Atlantic, τ = 0.48 (p ≪ 0.01) for Alaska and τ = 0.45 (p ≪ 0.01) for Siberia.
The subarctic North Atlantic regional record is characterized by two different trends. The first millennium does not show long-term fluctuations. However, it is marked by a cold event pulse at AD ∼ 675, which is depicted in the multi-proxy reconstruction of Hanhijärvi et al. (2013) from the Arctic Atlantic region and coincided with the occurrence of volcanic events (Sigl et al., 2015). The second millennium is characterized by a well-marked decrease, particularly clear after AD ∼ 1250 and ending at AD ∼ 1810 with the onset of the recent warming phase (Fig. 5b).
The first millennium in the Alaskan region is characterized by a pronounced decrease in temperatures until AD ∼ 660 followed by an increase until the beginning of the second millennium (Fig. 5c). The cold minimum at AD ∼ 660 is recorded in three time series over the five available. During the interval between SD ∼ 1000 and AD ∼ 1530, temperatures decreased markedly, followed by a period of slight increase, before the recent warming starting at AD ∼ 184 in the Alaskan area.
Contrary to the subarctic North Atlantic and the Alaskan regional mean records, the Siberian regional mean record does not show apparent differences in temperature trend between the first and the second millennium (Fig. 5d). The recent warming is well-marked in the Siberian area and started at AD ∼ 1820. Notable warm events occurred at AD ∼ 250, AD ∼ 990 and AD ∼ 1020.
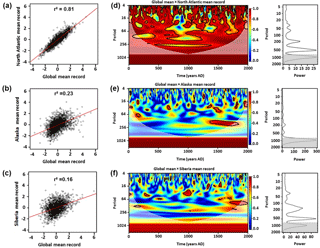
Figure 4Left panels: correlation between the global mean based on proxy data and the three regional mean records for the (a) North Atlantic, (b) Alaskan and (c) Siberian areas. Correlations are significant at the 95 % confidence level. Right panels: (e) wavelet coherence between global and North Atlantic mean records, (f) global and Alaskan mean records, and (g) global and Siberian mean records. Colors represent the amplitude of the signal at a given time and spectral period (red equals the highest power, blue the lowest). The white line corresponds to a cone of influence on the wavelet coherence spectrum. A confidence level of 95 % (α = 0.05) is indicated on the wavelet spectrum with the black line.
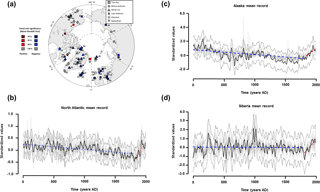
Figure 5(a) Individual trends for each record before recent warming. The white dot highlights inconsistency between two tendencies for the same archive. North Atlantic (b), Alaska (c) and Siberia (d) regional 50-year LOESS. Blue colors indicate a decreasing tendency whereas red colors indicate increasing trends. Dashed black lines correspond to the 95 % confidence interval.
In the subarctic North Atlantic, the analysis of individual time series revealed inconsistencies between the data from the marine Arc_38 record, which is based on diatoms (Berner et al., 2011), and that of the Arc_39 record, which is based on alkenones (Calvo et al., 2002). The two data sets are from the same marine core (MD 95-2011) but suggest opposite trends before AD 1810 (Table S2). Data from record no. 38 show a significant decrease (τ = −0.18, p < 0.01), whereas those from record 39 present a slight, but non-significant increase (τ = 0.14, p = 0.14). Different sensitivity to seasonal temperatures possibly explains the difference between the two records as previously reported from the Nordic Seas (Van Nieuwenhove et al., 2016). In the Arctic–subarctic areas, diatoms often relate to a spring bloom, whereas alkenones are produced by coccolithophorids, which develop during the warmest part of the summer (e.g., Andruleit, 1997). Divergence between alkenone and diatom records was also observed during the Holocene and was related to sensitivity to different depths (Jansen et al., 2008; Hessler et al., 2014).
Except for some time series that record warming trends, which can be explained by local effects or differential seasonal responses, most individual series and regional mean records show decreasing trends before the beginning of the 19th century. The millennial-scale cooling trend is consistent with previously published reconstructions from the North Atlantic (Hanhijärvi et al. (2013), Arctic (Kaufman et al., 2009; PAGES 2k Consortium, 2013; McKay and Kaufman, 2014) and the Northern Hemisphere (e.g., Moberg et al., 2005; Mann et al., 2008). A robust global cooling trend ending at about AD 1800 was also observed in regional paleoceanographic reconstructions (McGregor et al., 2015). The millennial cooling trend has been attributed to the reduction in summer insolation at high northern latitudes since the beginning of the Holocene (Kaufman et al., 2009) and associated with volcanic and solar forcings, notably during the last millennia (PAGES 2k Consortium, 2013; Stoffel et al., 2015). Whereas previous studies date the transition between the long-term cooling and the recent warming at the beginning of the 20th century (e.g., Mann et al., 2008; PAGES 2k Consortium, 2013), we identified here that the cooling trend ended between AD 1810 and AD 1840. The evidence of industrial-era warming starting earlier at the beginning of the 19th century was proposed by Abram et al. (2016) for the entire Arctic area. However, the intense volcanic activity of the 19th century (1809, 1815 and around 1840; Sigl et al., 2015) may also explain the apparent early warming trend, suggesting that it may have been recovery from an exceptionally cool phase. On the scale of the Holocene, internal fluctuations occurring on a millennial scale have been identified in the subarctic North Atlantic area and were tentatively related to ocean dynamics (Debret et al., 2007; Mjell et al., 2015). Therefore, to better understand the cooling trend of the last 2 millennia in a larger temporal context, taking into account the role of oceanic variability in the long-term temperature variations, a longer time series encompassing the entire Holocene would be useful.
4.2 Secular variability
Long-term change is not the only variability mode that defines the climate of the last 2 millennia, which was also characterized by long-standing climatic events such as the LIA and the MCA. Here, we intend to summarize the expression of the LIA and the MCA in the Arctic–subarctic area based on the Arctic 2k records. The timing of these two periods, which we identified in most but not all of the series used in this study, is taken from the original publications. The tables that list the beginning and end of the LIA and the MCA are available in the Supplement.
The MCA corresponds to a relatively warm period occurring between 950 and AD 1250 (Mann et al., 2009). The starting year of this relatively warm period in the Arctic–subarctic area ranges between AD 900 and 950 in Siberia and AD 900 and 1000 in Alaska, which is consistent with the overall records of the Northern Hemisphere (Fig. 6a). In the North Atlantic sector, the MCA began between AD 800 and AD 1050, except in two lake sediment records located in the Canadian Arctic in which the MCA started at the end of the 12th century (Arc_25, Moore et al., 2001; Arc_54, Rolland et al., 2009). The end of the MCA ranges between AD 1100 and AD 1550 (Fig. 6b). The majority of the records highlight a transition between warmer and colder periods around the 14th century. Two records are characterized by an ending point after the 15th century (Arc_49, Linge et al., 2009; Arc_38, Berner et al., 2011). The time coverage of the MCA is about ∼ 200–250 years in most records (Fig. 6c).
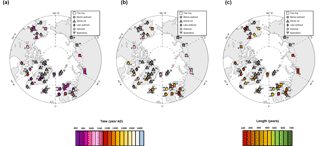
Figure 6Expression of the Medieval Climate Anomaly (MCA) of the Arctic 2k series based on a reference paper (see McKay and Kaufman, 2014): starting (a), ending (b) and length (c). Symbols in grey correspond to series for which the MCA is not mentioned by the authors. More details concerning the temporal expression of the LIA are available in Table S4 and Fig. S2.
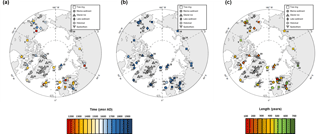
Figure 7Spatial expression of the Little Ice Age (LIA) of the Arctic 2k series based on a reference paper (see McKay and Kaufman, 2014): starting (a), ending (b) and length (c). Symbols in grey correspond to series for which the LIA is not mentioned by the authors in the original publication. More details concerning the temporal expression of the LIA are available in Table S3 and Fig. S1.

Figure 8Regional mean records of the last 2 centuries showing the recent warming period. Red dashed lines correspond to a linear trend obtained from a Mann–Kendall test and the black curve corresponds to ∼ 50-year loess filtering. Dashed lines correspond to the 95 % confidence level interval.
The duration and timing of the LIA in the Arctic–subarctic area are more variable from site to site than the MCA, particularly for the starting year (Fig. 7a). The earliest starting point is dated around AD 1200 (Esper, 2002; Melvin et al., 2013; Larsen et al., 2011) and the earliest ending point is reported to be as late as AD 1900 (e.g., Gunnarson et al., 2011; Isaksson et al., 2005; Linge et al., 2009; Massa et al., 2012) (Fig. 7a and b). The time coverage of the LIA ranges between ∼ 100 years (Kirchhefer, 2001) and ∼ 700 years (Melvin et al., 2013). It does not seem to depend upon the location of the data set in space nor the type of archive or proxy (Fig. 7c). The large range of possible timing for the LIA is consistent with the results of a previous study in this area (Wanner et al., 2011). It points to difficulty in distinguishing the LIA cooling in subarctic settings. Actually, individual paleoclimate series from the northern Greenland area did not clearly record the LIA, but a stack of these series highlighted a cold pulse between the 17th and 18th centuries (Weissbach et al., 2016). Although the LIA corresponds to a negative temperature anomaly, it is difficult to identify the Arctic area solely based on temperature proxies. Evidence of the LIA might also be found in paleohydrological time series (Nesje and Dahl, 2003). For example, Lamoureux et al. (2001) highlighted the evidence of rainfall increase during the LIA in a varved lake sediment core from the Canadian Arctic. Therefore, it would be relevant to study the LIA by using paleoclimate series sensitive to hydrological variability (Linderholm et al., 2017). This would contribute to a better understanding of secular climate variability in the Arctic area and the role of internal climatic system fluctuations on secular variation during the last millennia.
4.3 Recent warming and internal climate oscillations
Studying the climate of the last centuries is a means of examining the important issue of distinguishing anthropogenic influences from natural variability and the response of an ocean–atmosphere coupled system. The last 2 centuries were characterized in all regions by a well-marked warming trend (North Atlantic sector: τ = 0.40, p < 0.01; Alaska: τ = 0.48, p < 0.01; Siberia: τ = 0.45, p < 0.01) (Fig. 8). The temperature increase recorded over the last 2 centuries is consistent with the increase in greenhouse gas emissions (Shindell and Faluvegi, 2009). However, the recent warming was not linear, as it included different phases of increase highlighted by the 50-year LOESS filtering. This is particularly the case in the subarctic North Atlantic sector, where different periods are distinguished with a pronounced warming transition phase between AD 1920 and AD 1930 (Fig. 8a). These results suggest the occurrence of multidecadal variability superimposed on the increasing anthropogenic trend during the last centuries and which can be linked with a natural internal climate variability mode.
To determine the origin of the multidecadal variability in each region, we compared the three regional mean records with two instrumental climate indices: the AMO (Enfield et al., 2001) and the PDO (Mantua et al., 1997), using the wavelet coherence (Figs. 9 and 10, Appendix A). Because one of the main objectives of the paper is to determine the ability of the Arctic 2k database series to mimic the climate variability recorded in the observation data, we did not use the noninstrumental AMO and PDO records to go farther back in time. The analyses were thus performed on the time intervals used to define the AMO and PDO indices, which are AD 1856–2000 and AD 1900–2000, respectively.
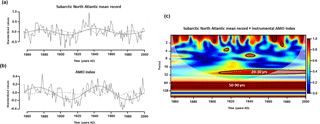
Figure 9Wavelet coherence analysis between subarctic North Atlantic mean record and instrumental AMO index during the AD 1856–2000 period. (a) Subarctic North Atlantic mean record (this study) and (b) instrumental AMO index (Enfield et al., 2001). Grey lines and dashed lines correspond to wavelet reconstructions of the ∼ 50–90- and ∼ 20–30-year periodicities highlighted on the wavelet coherence spectrum (c). Colors on the coherence wavelet spectrum represent correlation in both time and frequency domain. (Red equals the highest correlation and blue the lowest.) The white line corresponds to the cone of influence. A confidence level of 95 % (α = 0.05) is indicated with the black line.
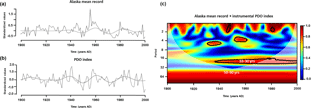
Figure 10Wavelet coherence analysis between the Alaskan mean record and instrumental PDO index during the AD 900–2000 period. (a) Alaskan mean record (this study) and (b) instrumental PDO index (Mantua et al., 1997). Grey lines correspond to wavelet reconstructions of the ∼ 16–30-year periodicity highlighted on the wavelet coherence spectrum (c). Colors on the coherence wavelet spectrum represent correlation in both time and frequency domain. (Red equals the highest correlation and blue the lowest.) The white line corresponds to the cone of influence. A confidence level of 95 % (α = 0.05) is indicated with the black line.
Persistent multidecadal variability with a period of 50–90 years is consistent between the subarctic North Atlantic mean record and the AMO over the last 2 centuries (AD 1856–2000; Fig. 9c). However, this scale of variability is located in the cone of influence. Comparison of the reconstruction of the 50–90-year oscillation with the original data for each series allowed us to verify if this fluctuation truly characterizes the original signal (Fig. 9a and b). It also revealed that fluctuations are in phase and continuous throughout the last 2 centuries. In the subarctic North Atlantic sector, the AD 1920–1930 transition also coincides with the occurrence of multidecadal variability with a 20–30-year period similar to the AMO index. Comparison with the instrumental PDO index revealed a 16–30-year oscillation common to the Alaskan area and the instrumental index during the AD 1900–2000 interval (Fig. 10b). Wavelet reconstruction of the 16–30-year oscillation for the Alaskan paleoclimate mean record and instrumental PDO index revealed that these scales of fluctuation are in phase. However, while they were continuous throughout the last century for the instrumental index (Fig. 10b), the 16–30-year oscillations only appear after AD ∼ 1940 in the Alaska record (Fig. 10a).
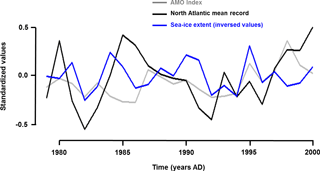
Internal climate fluctuations are also linked with sea ice cover fluctuations, which are an important component of the climate system at high latitude (Miles et al., 2014; Sha et al., 2015; Screen and Francis, 2016). The relationship between the AMO, the sea ice extent fluctuations and climate variability recorded in the North Atlantic is well illustrated from 1979 to 2000 (Fig. 11). The decline in sea ice cover was marked by a decrease in sea ice extent (4 % per decade since the end of the 1970s; Cavalieri and Parkinson, 2012), but also ice thickness (50 % since 1980 in the central Arctic; Kwok and Rothrock, 2009) and the length of the ice season (a 3-month longer summer ice-free season; Stammerjohn et al., 2012). It was accompanied by heat and moisture transfer to the atmosphere owing to the increase in open water surface (Stroeve et al., 2012). This is associated with an increase in surface air temperature, especially in coastal and archipelago areas surrounding the Arctic Ocean (Polyakov et al., 2012). Therefore, while the climate warming in the Arctic accelerates sea ice decline, the sea ice decline simultaneously amplifies and accelerates the recent warming (ice–temperature positive feedback).
Comparison between our three regional mean records and climate index shows the ability of regional proxy-based records to reproduce variability that occurs on multidecadal scales in instrumental data but also the importance of the role of internal variability in the climate in the Arctic area during the last centuries.
With the publication of the PAGES Arctic 2k database, which contains proxy time series that respond to several quality criteria, it was possible to describe the climate in the Arctic–subarctic region over the last 2000 years from low- to high-frequency variabilities. Long-term tendency, secular variability and multidecadal fluctuations with a focus on the last 200 years were described using statistical and signal analysis methods.
We presented three new regional mean records for the North Atlantic, Alaskan and Siberian regions. Owing to the uncertainties concerning the relationship between several proxy measurements and instrumental temperatures, climate variability has been studied based on proxy time series rather than temperature reconstructions. A large number of proxy time series in the PAGES Arctic 2k database are from the North Atlantic region, but the Siberian region, and to a lesser extent the Alaskan region, are underrepresented. Therefore, the global Arctic–subarctic record is probably biased toward the North Atlantic climate variability. This study clearly underlines the necessity to increase the number of series, especially in Alaska and Siberia. Increasing the number of series in the Pacific Arctic, western North America and Siberia would be relevant to gain a better understanding of the global Arctic–subarctic climate variability over the last 2 millennia.
Despite the spatial heterogeneity of the database, we found regional long-term tendencies similar to the millennial cooling trend recorded on the global Arctic–subarctic spatial scale, except in the Siberian region. Nevertheless, the three regions are characterized by a recent warming starting at the beginning of the 19th century. However, it is important to notice that because regional records correspond to a mix of climate variables and seasonal sensitivities, they cannot be considered as annual mean temperature reconstructions. Future effort should be made to study the impact of mixing proxy seasonality and transfer-function biases on paleoclimate signal reconstructions, whatever the studied climate parameter (e.g., temperature, precipitation).
Synthesis of the expression of secular fluctuations has shown the spatial and temporal variability in the cold LIA. The definition of the LIA as a major climate event is therefore equivocal, unlike the warm MCA, which seems more evenly represented.
The focus on the last 2 centuries led us to highlight that the recent warming was marked by a global increasing temperature trend linked to the anthropogenic forcing. It was also punctuated by climatic fluctuations related to regional internal climate oscillations that occur on multidecadal scales, especially the AMO in the North Atlantic region and the PDO in the Alaskan region. It would be interesting to extend the study throughout the last 2000 years and determine if these scales of variability are persistent on longer timescales, especially during the warm MCA and cold LIA major climatic periods. The identification of this variability in the proxy-based records raises the important issue of the need to better understand regional past climate variability in the Arctic–subarctic area. Comparison between regional proxy-based records and instrumental climate index also leads us to propose linkage between paleoclimate series on one side and instrumental data on the other.
All the series used to produce the regional time series are from the PAGES Arctic 2k database. Citations and URLs for the original data used in this study are listed in Table S1. The PAGES Arctic 2k database used is this study (v1.1.1) is archived at the National Oceanic and Atmospheric Administration's World Data Center for Paleoclimatology (WDC-Paleo) and available at https://www.ncdc.noaa.gov/paleo/study/16973. The database is also archived on figshare and available at https://figshare.com/articles/Arctic_2k_v1_1/1054736/5. The three regional time series calculated and used in the paper are available at https://doi.org/10.6084/m9.figshare.5616310.
The wavelet transform (WA) is particularly adapted for the study of nonstationary processes, i.e., discontinuities and changes in frequency or magnitude (Torrence and Compo, 1998). Wavelet analysis corresponds to a band-pass filter, which decomposes the signal on the base of scaled and translated versions of a reference wave function. Each wavelet has a finite length and is highly localized in time. The reference wavelet ψ comprises two parameters for time-frequency exploration, i.e., scale parameter a and time-localization parameter b, so that
The parameter a can be interpreted as a dilation (a > 1) or contraction (a < 1) factor of the reference wavelet corresponding to the different scales of observation. The parameter b can be interpreted as a temporal translation or phase shift.
The continuous WT of a signal s(t) producing the wavelet spectrum is defined as
The so-called local wavelet spectrum allows description and visualization of power distribution (z axis) according to frequency (y axis) and time (x axis).
In this study, the Morlet wavelet was chosen as the wavelet reference. Several types of wavelets are available, but the Morlet wavelet offers a good frequency resolution and is most often used with a wave number of 6, for which wavelet scale and Fourier period are approximately equal.
All series were zero-padded to double the data length to prevent spectral leakages produced by the finite length of the time series. Zero-padding produces edge effects and the lowest frequencies, and the area near the edges of the series is underestimated. This area is known as the cone of influence. For this reason, fluctuations that occur in this area have to be interpreted with caution.
Detected fluctuations are statistically tested at the α = 0.05 significance level against an appropriate background spectrum, i.e., a red noise (autoregressive process for AR(1) > 0) or a white noise (autoregressive process for AR(1) = 0) background (Torrence and Compo, 1998). Autoregressive modeling is used to determine the AR(1) stochastic process for each time series. The detected components can be extracted and reconstructed in the time domain by either inverse Fourier or WT of selected energy bands in the spectrum.
The cross-wavelet spectrum WXY(a, T) between two signals x(t) and y(t) is calculated according to Eq. (9), where CX(a, T) and , T) are the wavelet coefficient of the signal x(t) and the conjugate of the coefficient of the wavelet of y(t), respectively:
The wavelet coherence is a method that evaluates the correlation between two signals according to the different scales (frequencies) over time. It corresponds to a bivariate extension of wavelet analysis that describes the common variabilities between two series. The wavelet coherence is analogous to the correlation coefficient between two series in the frequency domain. For two signals x(t) and y(t) the wavelet coherence is calculate as follows:
where S is a smoothing operator.
The wavelet coherence spectrum allows description and visualization of wavelet coherence (z axis) according to frequency (y axis) and time (x axis). Wavelet coherence ranges between 0 and 1, indicating no relationship and a linear relationship between x(t) and y(t), respectively.
Wavelet analyses were performed with the software R (R Team, 2008) using the package biwavelet (Gouhier and Grinsted, 2016).
The locally weighted regression (Cleveland and Delvin, 1988; Cleveland and Loader, 1996) was used to investigate systematic features and patterns in the data. It is a method used for smoothing a scatter plot. Contrary to the moving average filtering method, LOESS-filtering allows conservation of the analyzed signal variance. The polynomial adjustment is locally performed on the whole series of data: a point x is adjusted by the neighboring points and weighted by the distance in x of these points. The relative weight of each point depends on its distance from x: the closer the x, the more important its influence on the shape of the regression, and vice versa. For this study, we chose a 50-year window analysis, which allows us to investigate long-term fluctuations and multidecadal to centennial variability.
For each individual record, a Mann–Kendall test (Mann, 1945; Kendall, 1975) was used to detect trends in proxy-inferred climate data. It is a nonparametric test commonly employed to detect monotonic trends in climatologic data because it does not require the data to be normally distributed and has low sensitivity to abrupt breaks due to inhomogeneous time series. The null hypothesis, H0, is that the data are independent and randomly ordered. The alternative hypothesis H1 is that the data follow a monotonic trend over time. For n > 10, the statistic S is approximately normally distributed and positive values of ZS indicate increasing trends while negative ZS values show decreasing trends. Testing of the trend is performed at the α significance level. When > , the null hypothesis is rejected and a significant trend exists in the time series. In this study, significance levels α = 0.10, α = 0.05 and α = 0.01 were tested. A statistic closely related to S is Kendall's tau. It will take a value between −1 and +1. Positive values indicate that the ranks of both variables increase together, meaning an increasing trend, while a negative correlation indicates a decreasing trend. The closer to +1 or −1 the value of Kendall's tau, the more significant the trend in the time series.
The supplement related to this article is available online at: https://doi.org/10.5194/cp-14-101-2018-supplement.
The authors declare that they have no conflict of interest.
This article is part of the special issue “Climate of the past 2000 years: regional and trans-regional syntheses”. It is not associated with a conference.
This is a contribution to the PAGES 2k Network (through the Arctic 2k
working group). Past Global Changes (PAGES) is supported by the US and Swiss
National Science Foundations. Marie Nicolle was supported by the French Ministry.
Maxime Debret, Marie Nicolle, Nicolas Massei and Anne deVernal are financed by
the France Canada research fund and Maxime Debret, Marie Nicolle and Christophe Colin
received funding from the HAMOC project (grant ANR-13-BS06-0003). We
also thank the FED CNRS 3730: SCALE. We acknowledge all the reviewers for
their constructive suggestions and comments.
Edited by: Marie-France Loutre
Reviewed by: four anonymous referees
Abram, N. J., McGregor, H. V. , Tierney, J. E., Evans, M. N., McKay, N. P., Kaufman, D. S., and the PAGES2k Consortium: Early onset of industrial-era warming across the oceans and continents, Nature, 536, 411–418, https://doi.org/10.1038/nature19082, 2016.
Andruleit H.: Coccolithophore fluxes in the Norwegian-Greenland Sea: Seasonality and assemblage alterations, Marine Micropaleontology, 31, 45–64, 1997.
Assani, A. A., Landry, R., and Laurencelle, M.: Comparison of interannual variability modes and trends of seasonal precipitation and streamflow in southern Quebec (Canada), River Res. Appl., 28, 1740–1752, 2011.
Berner, K. S., Koç, N., Godtliebsen, F., and Divine, D.: Holocene climate variability of the Norwegian Atlantic Current during high and low solar insolation forcing, Paleoceanography, 26, 245–255, 2011.
Bird, B., Abbott, M., Finney, B., and Kutchko, B.: A 2000 year varve-based climate record from the central Brooks Range, Alaska, J. Paleolimnol., 41, 25–41, 2009.
Calvo, E., Grimalt, J., and Jansen, E.: High resolution U37K sea surface temperature reconstruction in the Norwegian Sea during the Holocene, Quaternary Sci. Rev., 21, 1385–1394, https://doi.org/10.1016/S0277-3791(01)00096-8, 2002.
Cavalieri, D. J. and Parkinson, C. L.: Arctic sea ice variability and trends, 1979–2010, The Cryosphere, 6, 881–889, https://doi.org/10.5194/tc-6-881-2012, 2012.
Chylek, P., Folland, C. K., Lesins, G., Manvendra, K. D., and Wang, M.: Arctic air temperature change amplification and the Atlantic Multidecadal Oscillation, Geophys. Res. Lett., 36, L14801, https://doi.org/10.1029/2009GL03877, 2009.
Cleveland, W. and Devlin, S.: Locally weighted regression: an approach to regression analysis by local fitting, J. Am. Stat. Assoc., 83, 596–610, 1988.
Cleveland, W. and Loader, C.: Smoothing by local regression: Principles and methods, Statistical theory and computational aspects of smoothing, in: Statistical theory and computational aspects of smoothing, Physica-Verlag HD, 10–49, 1996.
Cohen, J., Screen, J. A., Furtado, J. C., Barlow, M., Whittleston, D., Coumou, D., Francis, J., Dethloff, K., Entekhabi, D., Overland, J., and Jones, J.: Recent Arctic amplification and extreme mid-latitude weather, Nat. Geosci., 7, 627–637, 2014.
D'Arrigo, R., Mashig, E., Frank, D., Wilson, R., and Jacoby, G.: Temperature variability over the past millennium inferred from Northwestern Alaska tree rings, Clim. Dynam., 24, 227–236, 2005.
D'Arrigo, A., Jacoby, G., Buckley, B., Sakulich, J., Frank, D., Wilson, R., Curtis, A., and Anchukaitis, K.: Tree growth and inferred temperature variability at the North American Arctic treeline, Global Planet. Change, 65, 71–82, 2009.
Debret, M., Bout-Roumazeilles, V., Grousset, F., Desmet, M., McManus, J. F., Massei, N., Sebag, D., Petit, J.-R., Copard, Y., and Trentesaux, A.: The origin of the 1500-year climate cycles in Holocene North-Atlantic records, Clim. Past, 3, 569–575, https://doi.org/10.5194/cp-3-569-2007, 2007.
Enfield, D. B., Mestas-Nunez, A. M., and Trimble, P. J.: The Atlantic Multidecadal Oscillation and it's relation to rainfall and river flows in the continental U.S., Geophys. Res. Lett., 28, 2077–2080, https://doi.org/10.1029/2000GL012745, 2001.
Esper, J.: Low-frequency signals in long tree-ring chronologies for reconstructing past temperature variability, Science, 295, 2250–2253, 2002.
Gouhier, T. and Grinsted, A.: biwavelet: Conduct univariate and bivariate wavelet analyses, R package version 0.20.11, available at: https://cran.rproject.org/web/packages/biwavelet/biwavelet.pdf, last access: September 2016.
Gunnarson, B. E., Linderholm, H. W., and Moberg, A.: Improving a tree-ring reconstruction from west-central Scandinavia: 900 years of warm-season temperatures, Clim. Dynam., 36, 97–108, 2011.
Hanhijärvi, S., Tingley, M. P., and Korhola, A.: Pairwise comparisons to reconstruct mean temperature in the Arctic Atlantic Region over the last 2,000 years, Clim. Dynam., 41, 2039–2060, https://doi.org/10.1007/s00382-013-1701-4, 2013.
Hessler, I., Harrison, S. P., Kucera, M., Waelbroeck, C., Chen, M.-T., Anderson, C., de Vernal, A., Fréchette, B., Cloke-Hayes, A., Leduc, G., and Londeix, L.: Implication of methodological uncertainties for mid-Holocene sea surface temperature reconstructions, Clim. Past, 10, 2237–2252, https://doi.org/10.5194/cp-10-2237-2014, 2014.
IPCC: Climate Change 2013: The Physical Science Basis, in: Contribution of Working Group I to the Fifth Assessment Report of the Intergovernmental Panel on Climate Change, Cambridge University Press, Cambridge, UK and New York, USA, 2013.
Isaksson, E., Divine D., Kohler, J., Martma, T., Pohjola, V., Motoyama, H., and Watanabe, O.: Climate oscillations as recorded in Svalbard ice core δ18O records between AD 1200 and 1997, Geogr. Ann. A, 87, 203–214, 2005.
Jansen, E., Andersson, C., Moros, M., Nisancioglu, K. H., Nyland, B. F., and Telford, R. J.: The Early to Mid-Holocene Thermal Optimum in the North Atlantic. Natural Climate Variability and Global Warming: A Holocene Perspective, 123–137, https://doi.org/10.1002/9781444300932.ch5, 2008.
Kaufman, D. S., Schneider, D. P., McKay, N. P., Ammann, C. M., Bradley, R. S., Briffa, K. R., Miller, G. H., Otto-Bliesner, B. L., Overpeck, J. T., Vinther, B. M., and Arctic Lakes 2k Project Members: recent warming reverses long-term Arctic cooling, Science, 325, 1236–1239, https://doi.org/10.1126/science.1173983, 2009.
Kendall, M. G.: Rank Correlation Methods, Griffin, London, UK, 1975.
Kerr, R. A.: A North Atlantic climate pacemaker for the centuries, Science, 288, 1984–1985, 2000.
Kirchhefer, A.: Reconstruction of summer temperatures from tree-rings of Scots pine (Pinus sylvestris L.) in coastal northern Norway, Holocene, 11, 41–52, 2001.
Knight, J. R., Folland, C. K., and Scaife, A. A.: Climate impacts of the Atlantic Multidecadal Oscillation, Geophys. Res. Lett., 33, 1–4, https://doi.org/10.1029/2006GL026242, 2006.
Knudsen, M. F., Jacobsen, B. H., Seidenkrantz, M. S., and Olsen, J.: Evidence for external forcing of the Atlantic Multidecadal Oscillation since termination of the Little Ice Age, Nat. Commun., 5, 3323, https://doi.org/10.1038/ncomms4323, 2014.
Kwok, R. and Rothrock, D. A.: Decline in Arctic sea ice thickness from submarine and ICE Sat records: 1958–2008, Geophys. Res. Lett., 36, L15501, https://doi.org/10.1029/2009GL039035, 2009.
Lamoureux, S. F., England, J. H., Sharp, M. J., and Bush, A. B. G.: A varve record of increase “Little ice Age” rainfall associated with volcanic activity, Arctic Archipelago, Canada, Holocene, 11, 243–249, 2001.
Larsen, D. J., Miller, G. H., Geirsdóttir, Á., and Thordarson, T.: A 3000-year varved record of glacier activity and climate change from the proglacial lake Hvítárvatn, Iceland, Quaternary Sci. Rev., 30, 2715–2731, 2011.
Linderholm, H. W., Nicolle, M., Francus, P., Gajewski, K., Helama, S., Korhola, A., Solomina, O., Yu, Z., Zhang, P., D'Andrea, W. J., Debret, M., Divine, D., Gunnarson, B. E., Loader, N. J., Massei, N., Seftifgen, K., Thomas, E. K., and Werner, J.: Arctic hydroclimate variability during the last 2000 years – current understanding and research challenges, Clim. Past Discuss., https://doi.org/10.5194/cp-2017-34, in review, 2017.
Linge H., Lauritzen, S.-E., Andersson, C., Hansen, J. K., Skoglung, R. Ø., and Sundqvist, H. S.: Stable isotope records for the last 10 000 years from Okshola cave (Fauske, northern Norway) and regional comparisons, Clim. Past, 5, 667–682, https://doi.org/10.5194/cp-5-667-2009, 2009.
Ljungqvist, F. C.: A new reconstruction of temperature variability in the extra-tropical Northern Hemisphere during the last two millennia, Geogr. Ann. A, 92, 339–351, 2010.
Mann, H. B.: Nonparametric test against trend, Econometrica, 13, 245–259, 1945.
Mann, M. E., Zhang, Z., Hughes, M., Bradley, R. S., Miller, S. K., Rutherford, S., and Ni, F.: Proxy-based reconstructions of hemispheric and global surface temperature variations over the past two millennia, P. Natl. Acad. Sci. USA, 105, 13252–13257, 2008.
Mann, M. E., Zhang, Z., Rutherford, S., Bradley, R. S., Hughes, M. K., Shindell, D., Ammann, C., Faluvegi, G., and Ni, F.: Global Signatures and Dynamical Origins of the Little Ice Age and Medieval Climate Anomaly, Science, 326, 1256–1260, 2009.
Mantua, N. J. and Hare, S. R.: The Pacific decadal oscillation, J. Oceanogr., 58, 35–44 2002.
Mantua, N. J., Hare, S. R., Zhang, Y., Wallace, J. M., and Francis, R. C.: A Pacific interdecadal climate oscillation with impacts on salmon production, B. Am. Meteorol. Soc., 78, 1069–1079, 1997.
Marcott, S. A., Shakun, J. D., Clark, P. U., and Mix, A. C.: A reconstruction of regional and global temperature for the past 11,300 years, Science, 339, 1198–1201, https://doi.org/10.1126/science.1228026, 2013.
Massa, C., Perren, B. B., Gauthier, E., Bichet, V., Petit, C., and Richard, H.: A multiproxy evaluation of Holocene environmental change from Lake Igaliku, South Greenland, J. Paleolimnol., 48, 241–258, 2012.
McGregor, H. V., Evans, M. N., Gosse, H., Leduc, G., Martrat, B., Addison, J. A., Mortyn, P. G., Oppo, D. W., Seidenkrantz, M.-S., Sicre, M.-A., Phipps, S. J., Selvaraj, K., Thirumalai, K., Filipsson, H. L., and Ersek, V.: Robust global ocean cooling trend for the pre-industrial Common Era, Nat. Geosci., 8, 671–677, https://doi.org/10.1038/NGEO2510, 2015.
McKay, N. P. and Kaufman, D. S.: An extended Arctic proxy temperature database for the past 2,000 years, Sci. Data, 1, 140026, https://doi.org/10.1038/sdata.2014.26, 2014.
Melvin, T. M., Grudd, H., and Briffa, K. R.: Potential bias in updating tree-ring chronologies using regional curve standardization: Re-processing 1500 years of Torneträsk density and ring-width data, Holocene, 23, 364–373, 2013.
Miles, M. W., Divine, D. V., Furevik, T., Jansen, E., Moros, M., and Ogilvie, A. E.: A signal of persistent Atlantic multidecadal variability in Arctic sea ice, Geophys. Res. Lett., 41, 463–469, https://doi.org/10.1002/2013GL058084, 2014.
Miller, G. H., Geirsdottir, A., Zhong, Y., Larsen, D. J., Otto-Bliesner, B. L., Holland, M. M., Bailey, D. A., Refsnider, K. A., Lehman, S. J., Southon, J. R., Anderson, C., Björnsson, H., and Thordarson, T.: Abrupt onset of the Little Ice Age triggered by volcanism and sustained by sea-ice/ocean feedbacks, Geophys. Res. Lett., 39, L02708, https://doi.org/10.1029/2011GL050168, 2012.
Mjell, T. L., Ninnemann, U. S., Eldevik, T., and Kleiven, H. K. F.: Holocene multidecadal-to millennial-scale variations in Iceland-Scotland overflow and their relationship to climate, Paleoceanography, 30, 558–569, 2015.
Moberg, A., Sonechkin, D. M., Holmgren, K., Datsenko, N. M., and Karlen, W.: Highly variable northern hemisphere temperatures reconstructed from low- and high-resolution proxy data, Nature, 433, 613–617, https://doi.org/10.1038/nature03265, 2005.
Moore, J., Hughen, K., Miller, G., and Overpeck, J.: Little Ice Age recorded in summer temperature reconstruction from varved sediments of Donald Lake, Baffin Island, Canada, J. Paleolimnol., 25, 503–5017, 2001.
Nesje, A. and Dahl, S. O.: The `Little Ice Age' – Only temperature?, Holocene, 13, 139–145, 2003.
PAGES 2k Consortium: Continental-scale temperature variability during the past two millennia, Nat. Geosci., 6, 339–346, https://doi.org/10.1038/NGEO1797, 2013.
Polyakov, I. V., Walsh, J. E., and Kwok, R.: Recent changes of Arctic multiyear sea ice coverage and the likely causes, B. Am. Meteorol. Soc., 93, 145–151, 2012.
Rolland, N., Larocque, I., Francus, P., Pienitz, R., and Laperrière, L.: Evidence of a warmer period during the 12th and 13th centuries AD from chironomid assemblages in Southampton Island, Nuvanut, Canada, Quatern. Res., 72, 27-37, 2009.
R Team: R: A language and environment for statistical computing, R Foundation for Statistical Computing, Vienna, Austria, available at: http://www.r-project.org/ (last access: February 2015), 2008.
Screen, J. A. and Francis, J. A.: Contribution of sea-ice loss to Arctic amplification is regulated by Pacific Ocean decadal variability, Nat. Clim. Change, 6, 856–860, https://doi.org/10.1038/nclimate3011, 2016.
Serreze, M. C. and Barry, R. G.: Processes and impacts of Arctic amplification: A research synthesis, Global Planet. Change, 77, 85–96, https://doi.org/10.1016/j.gloplacha.2011.03.004, 2011.
Sha, L., Jiang, H., Seidenkrantz, M.-S., Muscheler, R., Zhang, X., Knudsen, M. F., Olsen, J., Knudsen, K. L., and Zhang, W.: Solar forcing as an important trigger for West Greenland sea-ice variability over the last millennium, Quaternary Sci. Rev., 13, 148–156, https://doi.org/10.1016/j.quascirev.2015.11.002, 2015.
Shindell, D. and Faluvegi, G.: Climate response to regional radiative forcing during the twentieth century, Nat. Geosci., 2, 294–300, https://doi.org/10.1038/NGEO473, 2009.
Sigl, M., Winstrup, M., McConnell, J. R., Welten, K. C., Plunkett, G., Ludlow, F., Buentgen, U., Caffee, M., Chellman, N., Dahl-Jensen, D., Fischer, H., Kipfstuhl, S., Kostick, C., Maselli, O. J., Mekhaldi, F., Mulvaney, R., Muscheler, R., Pasteris, D. R., Pilcher, J. R., Salzer, M., Schuepbach, S., Steffensen, J. P., Vinther, B. M., and Woodruff, T. E.: Timing and climate forcing of volcanic eruptions for the past 2,500 years, Nature, 523, 543–549, https://doi.org/10.1038/nature14565, 2015.
Spielhagen, R. F., Werner, K., Sørensen, S. A., Zamelczyk, K., Kandiano, E., Budeus, G., Husum, K., Marchitto, T. M., and Hald, M.: Enhanced modern heat transfer to the Arctic by warm Atlantic water, Science, 331, 450–453, https://doi.org/10.1126/science.1197397, 2011.
Stammerjohn, S., Massom, R., Rind, D. and Martinson, D.: Regions of rapid sea ice change: an interhemispheric seasonal comparison, Geophys. Res. Lett., 39, L06501, 2012.
Stoffel, M., Khodri, M., Corona, C., Guillet, S., Poulain, V., Bekki, S., Guiot, J., Luckman, B. H., Oppenheimer, C., Lebas, N., Beniston, M., and Masson-Delmotte, V.: Estimates of volcanic-induced cooling in the Northern Hemisphere over the past 1,500 years, Nat. Geosci., 8, 784–788, https://doi.org/10.1038/NGEO2526, 2015.
Stroeve, J. C., Serreze, M. C., Holland, M. M., Kay, J. E., Maslanik, J., and Barrett, A. P.: The Arctic's rapidly shrinking sea ice cover: a research synthesis, Climatic Change, 110, 1005–1027, 2012.
Sutton, R. T. and Hodson, D. L. R.: Atlantic Ocean forcing of North American and European summer climate, Science, 309, 115–118, 2005.
Torrence, C. and Compo, G. P.: A practical guide to wavelet analysis, B. Am. Meteorol. Soc., 79, 61–78, 1998.
Van Nieuwenhove, N., Baumann, A., Matthiessen, J., Bonnet, S., and de Vernal, A.: Sea surface conditions in the southern Nordic Seas during the Holocene based on dinoflagellate cyst assemblages, Holocene, 26, 722–735, https://doi.org/10.1177/0959683615618258, 2016.
Wanner, H., Solomina, O., Grosjean, M., Ritz, S. P., and Jetel, M.: Structure and origin of Holocene cold events, Quaternary Sci. Rev., 30, 3109–3123, 2011.
Wei, W. and Lohmann, G.: Simulated Atlantic Multidecadal Oscillation during the Holocene, J. Climate, 25, 6989–7002, 2012.
Weissbach, S., Wegner, A., Opel, T., Oerter, H., Vinther, B. M., and Kipfstuhl, S.: Spatial and temporal oxygen isotope variability in northern Greenland – implications for a new climate record over the past millennium, Clim. Past, 12, 171–188, https://doi.org/10.5194/cp-12-171-2016, 2016.
Werner, J. P., Divine, D. V., Charpentier Ljungqvist, F., Nilsen, T., and Francus, P.: Spatio-temporal variability of Arctic summer temperatures over the past two millennia: an overview of the last major climate anomalies, Clim. Past Discuss., https://doi.org/10.5194/cp-2017-29, in review, 2017.
Wiles, G. C., D'Arrigo, R., Barclay, D., Wilson, R. S., Jarvis, S. K., Vargo, L., and Frank, D.: Surface air temperature variability reconstructed with tree rings for the Gulf of Alaska over the past 1200 years, Holocene, 24, 198–208, 2014.
Wilson, R., Anchukaitis, K., Briffa, K. R., Büngten, U., Cook, E., D'Arrigo, R., Davi, N., Esper, J., Frank, D., Gunnarson, B., Hegerl, G., Helama, S., Klesse, S., Krustic, P. J., Linderholm, H. W., Myglan, V., Osborn, T. J., Rydval, M., Schneider, L., Schurer, A., Wiles, G., Zhang, P., and Zorita, E.: Last millennium northern hemisphere summer temperatures from tree rings: Part I: The long term context, Quaternary Sci. Rev., 134, 1–18, 2016.
Zhang, L. and Delworth, T. L.: Analysis of the characteristics and mechanisms of the Pacific Decadal Oscillation in a suite of coupled models from the Geophysical Fluid Dynamics Laboratory, J. Climate, 28, 7678–7701, https://doi.org/10.1175/JCLI-D-14-00647.1, 2015.


