the Creative Commons Attribution 4.0 License.
the Creative Commons Attribution 4.0 License.
 | 13 May 2026
Limited early-industrial warming and strong volcanic imprints in the Caucasus: the first temperature reconstruction based on maximum latewood density
Rupesh Dhyani
Dario Martin-Benito
Louis Verschuren
Vladimir Matskovsky
Jan Van den Bulcke
Mehmet Doğan
Revaz Kvaratskhelia
Nesibe Köse
Hüseyin Tuncay Güner
Lea Schneider
The Caucasus occupies a unique climatic region influenced by European, Mediterranean, and Asian circulation systems, yet it remains underrepresented in tree ring-based Northern Hemisphere temperature proxy networks. Here, we present the first summer temperature reconstruction for the Caucasus region based on maximum latewood density (MXD). We used X-ray micro-computed tomography of tree-ring samples from Pinus sylvestris growing at the upper tree line in the Lesser Caucasus and an ensemble nested regression approach to develop a robust 326 year-long June–September temperature reconstruction (1697–2022). The record explains – regionally unprecedented – 72 % of temperature variance during the instrumental period (1901–2022) and captures distinct interannual and multi-decadal variability including pronounced warming since the 1990s and a strong imprint of major volcanic eruptions. Temperatures in the second half of the 19th century were not significantly colder in the Caucasus than in the second half of the 20th century. The reconstruction highlights the exceptional magnitude and pace of 21st century warming in the region, which is without analogue at least in the past three centuries. Comparison with regional and large-scale temperature reconstructions reveals strong agreement within the Caucasus but negative correlations with Central Europe, indicating distinct temperature variability patterns across Europe and western Asia. Future work should focus on the climate dynamics behind this dipole and the extension of temperature-sensitive tree-ring records in the region.
- Article
(5723 KB) - Full-text XML
-
Supplement
(1245 KB) - BibTeX
- EndNote


Global surface temperatures have risen rapidly over the past century, reaching levels unprecedented in the context of the last two millennia (IPCC, 2023). Understanding this recent warming requires a long-term perspective on natural climate variability and the drivers of past temperature change. High-resolution paleoclimate reconstructions extend our view into the Common Era and provide essential context for evaluating the magnitude, spatial patterns, and causes of recent warming (Esper et al., 2018). Such reconstructions have revealed both natural centennial-scale fluctuations, including the Medieval Climate Anomaly and the Little Ice Age, as well as the exceptional nature of the temperature increase since 1900 CE (Anchukaitis et al., 2017; Esper et al., 2024; Neukom et al., 2019).
Most of the proxy records used for large-scale, high-resolution temperature reconstructions are derived from tree rings, which provide a superior archive of terrestrial climate variability for timescales from years to millennia because of their precise annual age control and the relatively extensive spatial coverage (Büntgen et al., 2021; Esper et al., 2018). Among different parameters derived from tree rings, maximum latewood density (MXD) provides the most reliable proxy of summer temperature with usually high correlations and little impact of physiological memory (Briffa et al., 1998; Esper et al., 2015). Over the past few decades, significant efforts have been made to develop a network of MXD records across the Northern Hemisphere to better understand large-scale and long-term temperature changes (Anchukaitis et al., 2017; Schneider et al., 2015).
In southern Europe, MXD-based temperature reconstructions are available for the Pyrenees (Dorado Liñán et al., 2012), the European Alps (Büntgen et al., 2006), the Western Carpathians (Büntgen et al., 2013), Croatia (Römer et al., 2021) and Greece (Esper et al., 2020; Klesse et al., 2015). In southern Asia, MXD chronologies were developed for the Altai Mountains (Kirdyanov et al., 2024), the Tien Shan (Chen et al., 2019), the Tibetan plateau (Huang et al., 2025) and the Himalaya (Khan et al., 2024). However, along the Alpide belt, a significant spatial gap in the MXD network exists between the Euro-Mediterranean and the Central-/East-Asian regions (Anchukaitis et al., 2017)
A few studies have used other dendrochronological proxies to reconstruct past temperature variability in the Caucasus (Bakhtiyorov et al., 2025; Dolgova, 2016; Holobâcă et al., 2016; Köse et al., 2017; Kvaratskhelia and Gavashelishvili, 2025). Holobâcă et al. (2016) reconstructed 179 years of summer temperatures using tree-ring width (TRW) data, but with a relatively weak temperature signal. Dolgova (2016) produced the first summer temperature reconstruction extending back to 1596 using Latewood Blue Intensity (LWBI). The record correlates strongly with observed temperatures and shows unprecedented warming since the 1980s. Compared to Dolgova (2016), more recent reconstructions were shorter and less skillful (Bakhtiyorov et al., 2025; Köse et al., 2017; Kvaratskhelia and Gavashelishvili, 2025). A network of temperature sensitive LWBI chronologies revealed high coherence between the Lesser and the Greater Caucasus at high frequencies, but divergence on multi-decadal and centennial timescales (Dhyani et al., 2025). However, this disagreement is likely not an expression of local temperature variability but rather associated with the uncertainty inherent in the low-frequency signal of the LWBI proxy (Björklund et al., 2017). Consolidating pre-industrial temperature estimates for the Caucasus requires a more robust proxy, like MXD, which can offer greater precision at longer timescales.
One primary constraint for the widespread application of MXD is the limited availability of specialized measurement equipment and the complexity and time-intensive nature of traditional X-ray densitometry methods (Björklund et al., 2019). Recently, X-ray Computed Tomography (XµCT) has emerged as an innovative alternative, offering precise density measurements. Simplified sample preparation and a fully digital workflow after X-ray imaging minimize the labor costs and allow the production of well-replicated chronologies. The three-dimensional approach overcomes challenges associated with varying grain angles in wood samples affecting MXD and enhances the robustness of resulting chronologies (Björklund et al., 2019; De Mil and Van den Bulcke, 2023; Verschuren et al., 2025).
While previous LWBI chronologies from the Caucasus have been valuable and consistent regarding high-frequency temperature variability (Dhyani et al., 2025; Dolgova, 2016), longer-term trends diverged significantly which can partly be attributed to limitations of the proxy. In this context, we aim to answer whether MXD data can provide a more robust basis for the reconstruction of past temperatures. We hypothesise that a high sample replication combined with the new XµCT approach yields more reliable chronologies and a more solid proxy calibration to instrumental data at high and low frequencies resulting in a better confined temperature history at local to regional scales.
To test this hypothesis, we developed a 409 year chronology from Scots pine (Pinus sylvestris) tree rings from the upper treeline in the Lesser Caucasus. Our XµCT-derived MXD record is assessed with established quality metrics and correlated to local instrumental temperature data at different frequency domains. After conversion to temperature anomalies, it is compared to temperature variability during the last 300 years over the wider region and to other tree-ring reconstructions from mid-latitude high-elevation sites across Europe.
2.1 Climate of the study region
The Caucasus region coincides with the climatic transition between the humid subtropics of the eastern Black Sea and the more continental, semi-arid interior of Eurasia (Ambroziak, 1977; Stanev, 1990). Moisture is supplied year-round by prevailing westerly circulation, but the rugged topography creates sharp regional gradients. The Greater Caucasus limits the southward penetration of cold continental air, while the Lesser Caucasus redirects warm southerly flows (Ambroziak, 1977). Seasonal climate variability is controlled by the migration of major pressure systems: in summer, the subtropical high pressure over the eastern Mediterranean and the Asian thermal depression promote continental warming and convective activity; in winter, the western extension of the Siberian High dominates, modulating cold-air outbreaks and storm tracks (Shahgedanova et al., 2009). Recent climatic observations from the Caucasus reveal that the signal of summer warming is particularly pronounced, exceeding the rates of temperature increase recorded in winter, spring, and autumn (Elizbarashvili et al., 2013, 2017; Shahgedanova et al., 2005, 2009; Tashilova et al., 2016; Tielidze et al., 2020). As in many mountain regions, the Caucasus lacks long-term meteorological records at high elevations. Moreover, reliable station measurements in the region began operating in the mid-20th century and some were not maintained after the collapse of the Soviet Union (Hu et al., 2014; Keggenhoff et al., 2014; Schöne et al., 2013).
2.2 Tree-ring sampling and preparation
In two field campaigns (2015 and 2023), we collected tree core samples from Pinus sylvestris trees growing at the upper treeline (41.4° N, 42.3° E; 2200–2300 m above sea level (m a.s.l.)) in the western Lesser Caucasus (Fig. 1). The sampling site is characterized by an open-canopy P. sylvestris forest growing on dry, south-facing slopes in a subalpine environment with rocky outcrops (Martin-Benito et al., 2018). The underlying pedology consists predominantly of shallow, rocky soils derived from volcanic and sedimentary parent materials. The sparse understory features rhododendron and juniper shrubs separated by patches of herbaceous vegetation. A total of 73 increment cores were obtained from 55 trees by extracting one or two cores per tree perpendicular to the slope. To avoid the influence of resin on MXD measurements, samples were chemically treated prior to the analysis. A Soxhlet extraction with ethanol for at least 24 h was performed to remove resins for accurate wood density determination (De Mil and Van den Bulcke, 2023). After extraction, the samples were oven-dried at 103 °C for 24 h and then stored before scanning in paper straws and air-tight bags with silica gel to prevent them from re-moisturization.
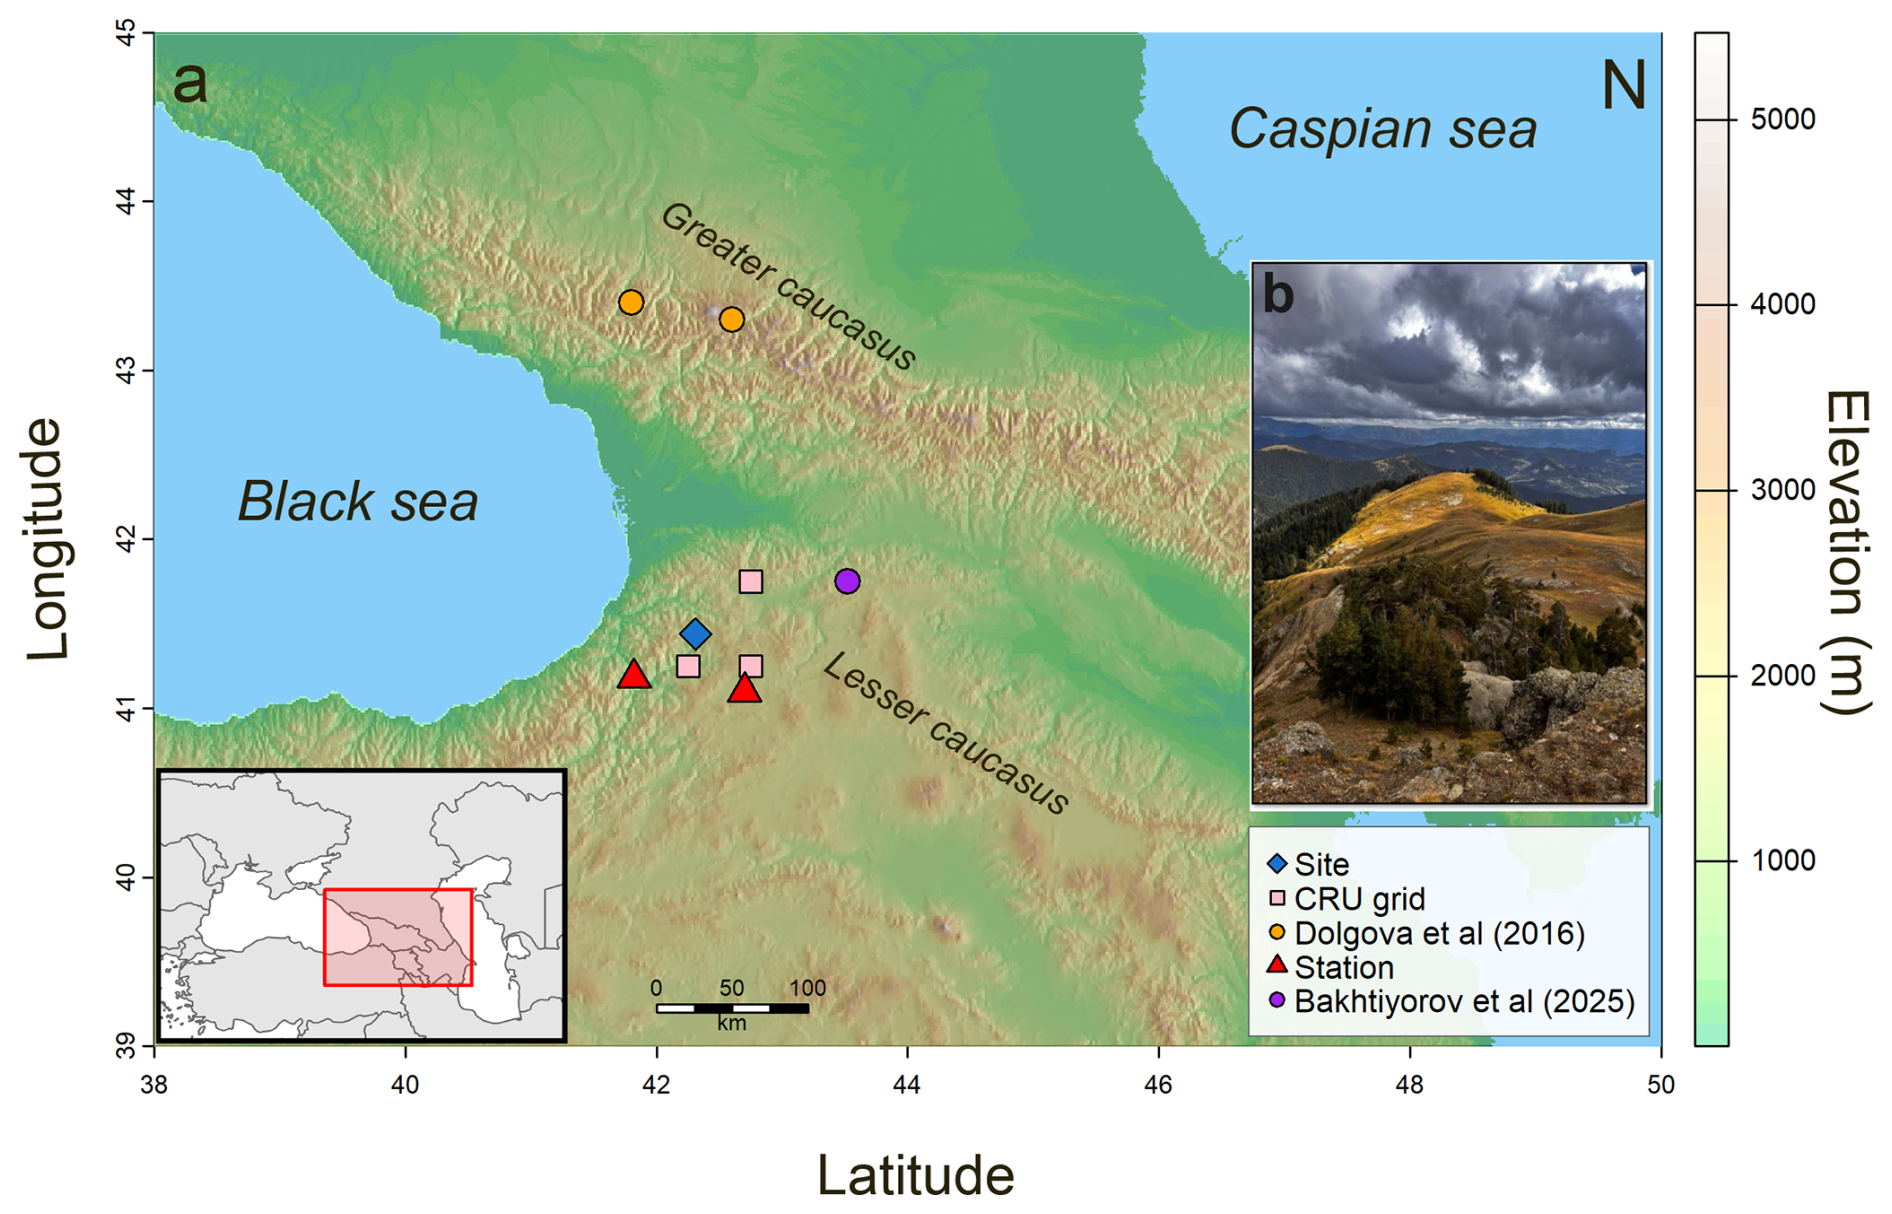
Figure 1(a) Map of the study site showing locations of the sampling site, previous studies on LWBI by Dolgova (2016) and Bakhtiyorov et al. (2025), nearby metrological stations and CRU grids used in the study. (b) Pinus sylvestris trees growing at the upper treeline (2200–2300 m a.s.l.) in the Lesser Caucasus.
2.3 MXD measurements
We scanned the cores using the XµCT toolchain from the UGent-Woodlab at Ghent University (De Mil et al., 2016; De Mil and Van den Bulcke, 2023; Van den Bulcke et al., 2014, 2019; Verschuren et al., 2025). The cores were scanned at a voxel size of 153 µm3 with a helical scan using the TESCAN CoreTOM. We chose the scan setting “High resolution fast” from Verschuren et al. (2025). The Octopus Reconstruction software reconstructed the voxels into 3D volumes (Vlassenbroeck et al., 2007). The reconstructed scans were processed with three different MATLAB stand-alone applications designed for the analysis of 3D wood density data: CoreProcessor, RingIndicator, CoreComparison (Verschuren, 2025b). Images of the individual cores were extracted and aligned to the vertical fiber direction using the CoreProcessor, which also converts grayscale values into absolute density values. Ring boundaries are marked as lines on both the transverse and radial planes of the 3D digital increment core using RingIndicator (Verschuren, 2025b) Cores were visually and statistically cross-dated using the CoreComparison (Verschuren, 2025b) and the COFECHA software (Holmes, 1983) based on obtained TRW measurements. For each sample, a continuous density profile is generated along the entire length of the core and integrating over 30 % of the core radius. Yearly MXD values were then calculated with the density profile for the respective ring using the average of the 20 % densest values within the last 20 % of the radial width. This step, performed with the XCT.Read function (Verschuren, 2025a) in R (R Core Team, 2016), removes the effect of resin ducts and yields a clear separation towards the earlywood of the next year. Additionally, visual and statistical cross-dating based on the obtained MXD measurements has been performed in CDendro (https://cdendro.se/, last access: 16 July 2025) to ensure correct cross-dating of the samples that were difficult to cross-date solely based on TRW measurements.
2.4 Climate data
We analysed monthly records of temperature variability from June–September using the nearest station observations: Ardahan and Artvin (Fig. S1 in the Supplement) (Menne et al., 2012). Annual JJAS means were calculated by averaging June–September values, excluding years with missing or flagged data. However, the station records were relatively short and incomplete, which limited their application to long-term climate analyses. Thus, we complemented the station data with the three nearest gridded temperature data points from the CRU TS 4.09 dataset, which is a pre-processed product derived through interpolation of monthly climate anomalies from extensive weather station observations providing continuous monthly mean temperatures from 1901 to the presence (Harris et al., 2020). We compared individual station records with corresponding grid cells and analysed the correlation between the mean of all stations and the mean of all grids (Fig. 1). Correlation analysis demonstrated strong agreement between stations and gridded data (Fig. S1). Recent warming trends were also comparable over the overlapping period, with CRU JJAS temperatures increasing at nearly the same rate as the station-based means. This consistency in both interannual variability and long-term trends demonstrate the reliability of the CRU TS 4.09 dataset. For all the subsequent analyses we used the averaged time-series extracted from three grid points of the CRU TS 4.09 temperature dataset as the instrumental temperature record.
2.5 Chronology Development
Standardization, which includes detrending and averaging of raw MXD data, was implemented to minimize the effects of non-climatic growth trends on the resulting chronology while preserving the full frequency spectrum of climate variability. We detrended the individual MXD series taking its ratios from fitted cubic smoothing splines. The age-dependent splines had an initial stiffness of 50 years (50 % variance cut off at the wavelength of 50 years) and progressively increasing stiffness with cambial age (Cook and Peters, 1997; Melvin et al., 2007). To further enhance the capacity of the chronology to retain long-term signals, the detrending was performed within the signal-free framework (Melvin and Briffa, 2008) using the ssf() function in dplR (Bunn, 2008). This approach iteratively removes the common signal prior to detrending, allowing the detrending splines to be more accurately estimated without being influenced by strong climate signals (Melvin et al., 2007). Chronology quality was assessed using subsample signal strength (SSS) (Buras, 2017) and average inter-series correlation () (Wigley et al., 1984).
2.6 Assessment of the climate signal in MXD
Pearson's correlations between the instrumental temperature record and the detrended MXD chronology were calculated for the period 1901–2022, with monthly temperature data for September of the previous year to October of the current year and the June–September (JJAS) seasonal means. A 30 year running correlation analysis was performed to check the stability of the correlations over time. The impact of sample replication was assessed with a bootstrap resampling analysis. For each replication level (ranging from 1–73 MXD tree-ring series), 1000 iterations were performed by randomly sampling and averaging tree-ring series, followed by correlation with the JJAS temperature record.
2.7 Temperature reconstruction
For reconstructing summer temperature, we applied a nested approach that builds successive transfer functions from a set of 73 individual detrended MXD chronologies with increasing temporal coverage and decreasing replication (Cook et al., 2002; Meko, 1997). Within each “nest” the replication of the chronology, i.e., the number of MXD measurements per year, remains constant. Each time a single sample drops out, a new nest chronology is built from the remaining samples. The first nest chronology spans the period from 1901–2022. The algorithm generated 61 different nests by sequentially eliminating the shortest sample at each iteration, thereby producing nested subsets with progressively earlier start dates but decreasing replication. This nesting approach ensures optimal utilization of available MXD data across the entire chronology period and allows for constant re-assessment of reconstruction skill back in time. Each nest chronology was calibrated against the instrumental temperature record (1901–2022) using a linear regression model and an iterative split-period approach with a fixed calibration window of 61 years. The first reconstruction model was calibrated on observations between 1901 and 1961 and validated against temperatures between 1962 and 2022. We then iteratively shifted the 61 year calibration/validation block one year forward at a time while re-calibrating the reconstruction with the remaining years of climate data. For each model, verification statistics including the coefficient of determination (R2), the reduction of error (RE) and the coefficient of efficiency (CE) were computed to assess reconstruction skill (Fritts, 1976). A final reconstruction nest was developed by averaging all the iterative model outputs. The reconstruction nests were spliced together using the best replicated nest at each time step. To assess the robustness of the reconstruction, we quantified two distinct sources of uncertainty: calibration uncertainty and sampling uncertainty (Esper et al., 2007; Kuhl et al., 2024; Schneider et al., 2015). Calibration uncertainty represents the statistical error in the linear regression between the MXD chronologies and summer temperature during the calibration period and was calculated using the residual standard error of the regression coefficients for each nest. Sampling uncertainty was estimated by expressing it as the additional error variance of each nest compared with the best-replicated nest that is, the residual between the standard error of the current nest and the standard error of the nest with the highest replication (Cook et al., 2002; Kuhl et al., 2024). We correlated reconstructed summer temperatures for the Lesser Caucasus with the gridded temperature reconstruction fields of the Northern Hemisphere Tree-Ring Network Development (N-TREND) from Anchukaitis et al. (2017) over their period of overlap (1697–2014) and compared our record to other regional products (Table S1 in the Supplement). These were z-transformed and low-pass filtered in order to emphasize similarity in the low-frequency domain calculated using 30 year moving averages. For the analysis of volcanic signals, temperature reconstructions were re-calibrated with summer months from local gridded instrumental temperature data and a scaling for each of the reconstructions (Esper et al., 2005), because of small deviations in the targeted season. We assessed the relative expression of high- and low-frequency temperature variability in the different local reconstructions by calculating the ratios of standard deviations in high- and low-pass filtered timeseries (σHF and σLF).
2.8 Superposed Epoch Analysis
We evaluated the influence of large-scale tropical volcanic eruptions on reconstructed summer temperatures using Superposed Epoch Analysis (Rao et al., 2019). Significant tropical eruptions during the 18th and 19th century (1809, 1883, 1835, 1831, 1815) were identified from the eVolv2k database by selecting those with peak estimated Northern Hemisphere sulfate flux () and non-zero Southern Hemisphere flux (Toohey and Sigl, 2017). In addition, the 1991 Pinatubo eruption was added to the event list. To determine the statistical significance of the observed response, we compared it to the probability distribution generated from 10 000 random draws of six years from the reconstruction (Rao et al., 2019).
3.1 MXD chronology and climate
We developed a 326 year (1697–2022) set of 61 MXD chronologies with decreasing replication and increasing length. For the best replicated period, average inter-series correlation is 0.43 and SSS is 0.97 (Fig. 2). The best replicated MXD chronology shows significant positive correlations with temperatures from February–October (Fig. 3a). Distinctively higher correlations are confined to the months from June to September, with the highest correlation for mean JJAS temperature (r=0.84, p<0.001). In the high-frequency domain (i.e., first differences), the highest correlation value was also obtained with the mean JJAS temperature (r=0.78) (Fig. 3c), proofing a very strong relationship between temperature and proxy even if autocorrelation and trends are removed from the data. The moving-window correlation analysis between the MXD chronology and the JJAS mean temperature revealed stable correlations (p<0.01) over the entire instrumental period (1901–2022). The bootstrapped resampling analysis shows the mean correlation increased steadily with replication, from 0.56 (95 % CI: ) at (95 % CI: ) at n=73 (Fig. S3a in the Supplement). Mean correlation after n>10 was 0.78 (CI: After n>30, mean correlation values approach an asymptote around r=0.84 (Fig. S3a).
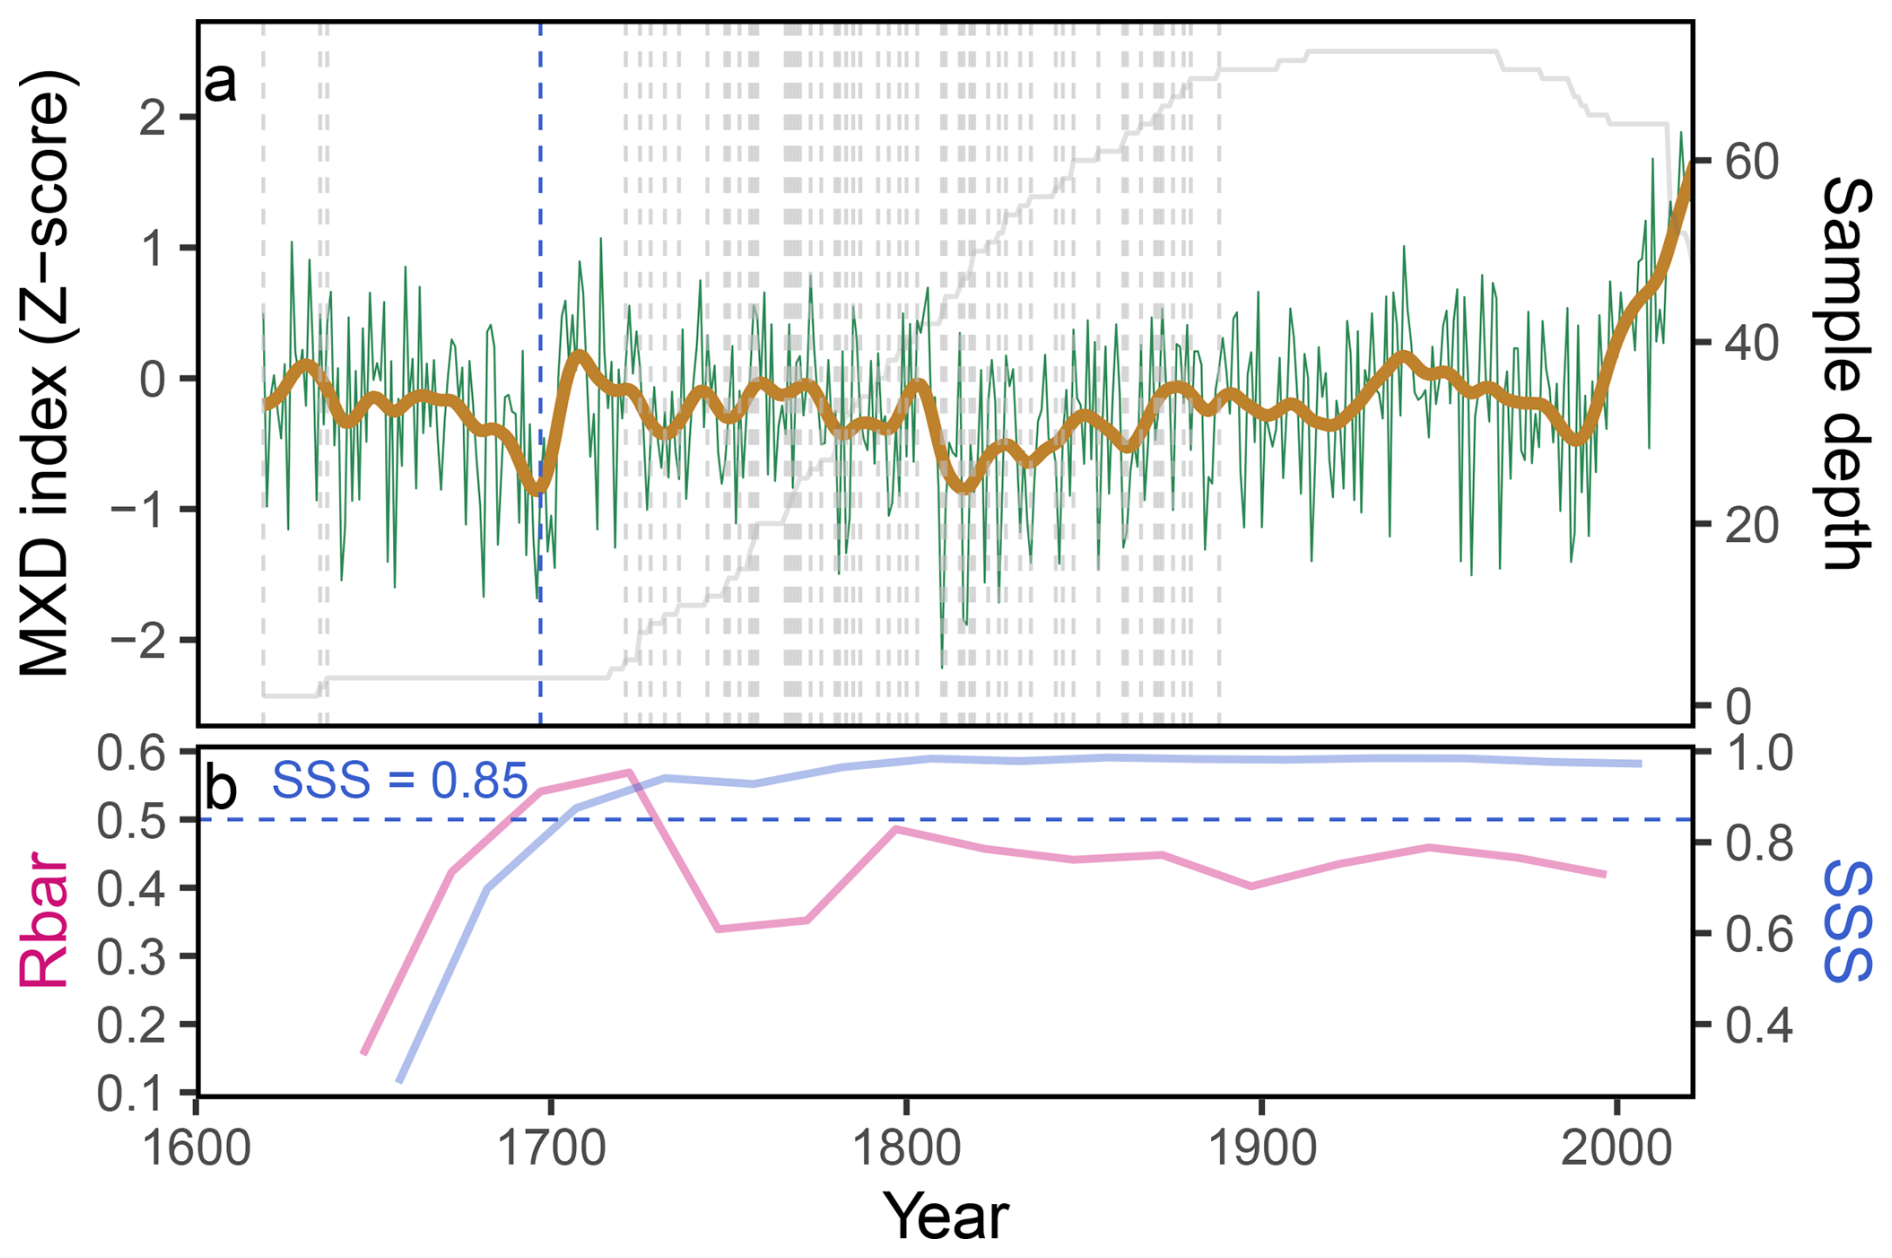
Figure 2Nested MXD chronology and chronology statistics. (a) Detrended maximum latewood density (MXD) chronology (green) with 20 year spline smoothing (brown) and corresponding sample depth (grey, secondary axis). The vertical dashed grey lines show end years of individual nests. (b) Mean inter-series correlation () and Subsample signal strength (SSS) through time. The blue dashed horizontal line in panel (b) denotes the threshold of SSS=0.85.
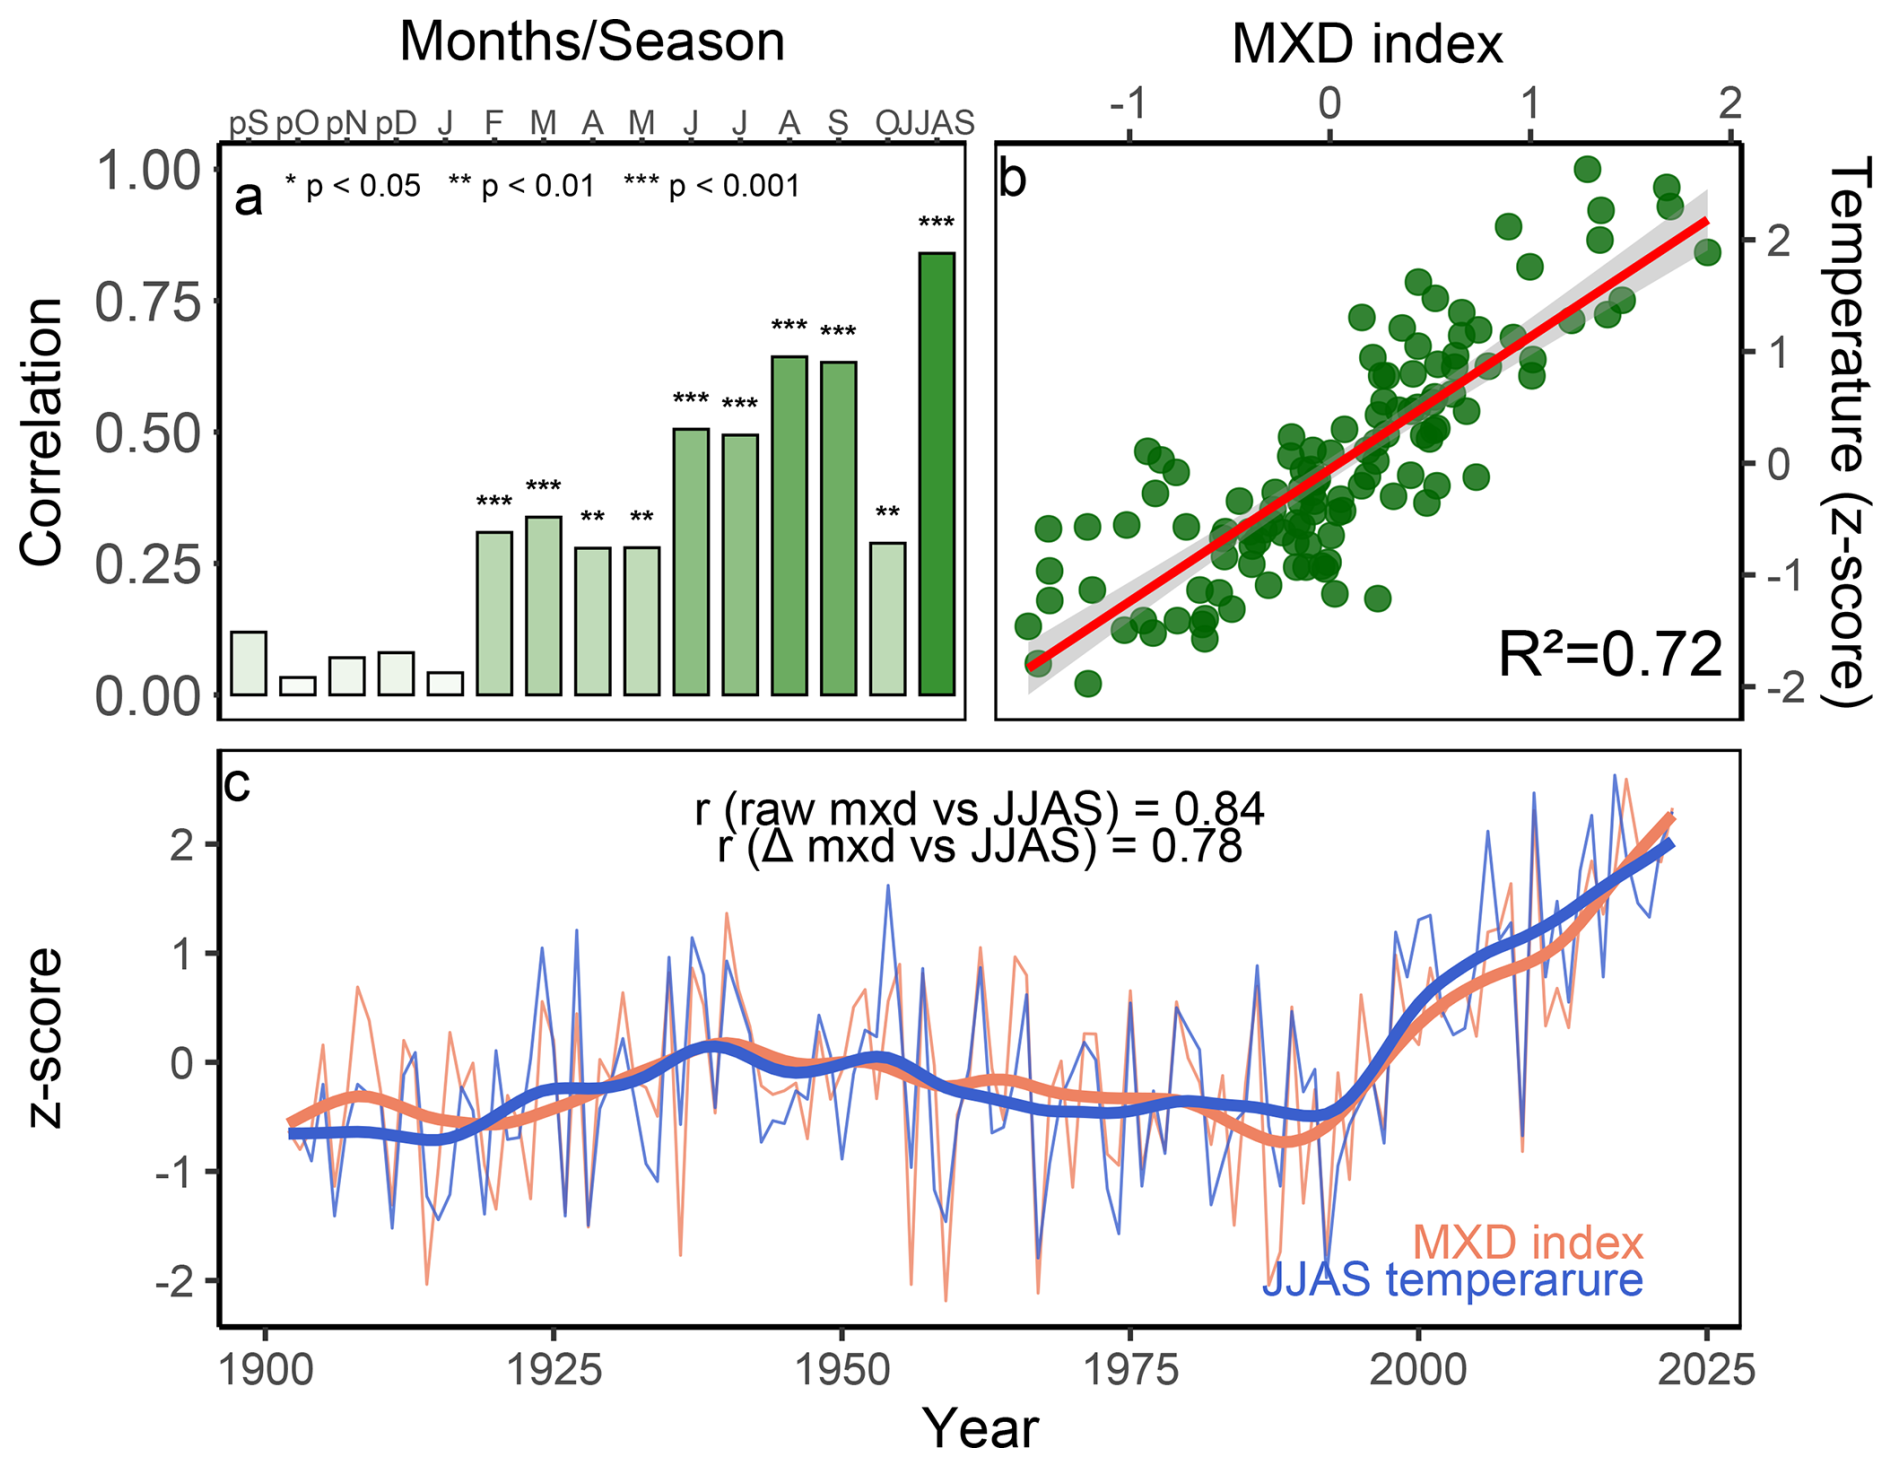
Figure 3MXD chronology vs. JJAS CRU TS 4.09 temperature relationships. (a) Correlation coefficients between the MXD chronology and monthly/seasonal temperatures, with significance levels indicated by asterisks (** p<0.01, *** p<0.001). (b) regression between MXD chronology and JJAS temperature for the period 1901–2022 and (c) Z-scores of the MXD chronology (orange) and JJAS temperature data (blue) with 20 years smoothing spline. The correlation of raw MXD and first difference (Δmxd) with JJAS temperature are shown in the figure.
3.2 Reconstruction skills and characteristics
Our MXD-based summer temperature (June–September) reconstruction for the Lesser Caucasus (LC) demonstrates strong predictive skill, explaining a maximum of 72 % of the variance in summer mean temperatures over the instrumental period from 1901–2022 (Fig. 4). During the shifting calibration periods, the model explained a mean of 65 % of the variance in temperature data. In the verification period, the model retained a high level of skill, with 68 % of explained variance, showing that the reconstruction generalizes well beyond the calibration dataset. RE values were positive across all calibration windows representing high predictive skill beyond climatological baselines, while R2 values remained consistently high, indicating stability of the temperature signal (Fig. S4 in the Supplement). Across all moving calibration windows, the reconstruction achieved a mean positive RE skill (0.67). The similarity of RE and R2 values across nests shows that our reconstruction reliably estimates JJAS temperatures even for the longest nests with relatively low replication. Nests with high replication (≥10 predictors), calibrated in the 20th century, achieve robust predictive performance, with median CE commonly above 0.6 and R2 exceeding 0.7. Skill gradually degrades as replication falls: nests with only 3–8 series still maintain mostly positive CE (0.3–0.5; Fig. S4). The best replicated nests show smaller residual errors, with mean root mean squared error (RSE) around 0.4 °C. In contrast, least-replicated nests with the minimum predictor set at the oldest part of the record show larger calibration error with RSE exceeding 0.7–1.0 °C. Monte Carlo simulations demonstrated that the error declines rapidly with increasing replication, with the largest improvements achieved at n>10, while gains diminish once replication is relatively high (Fig. S3b).
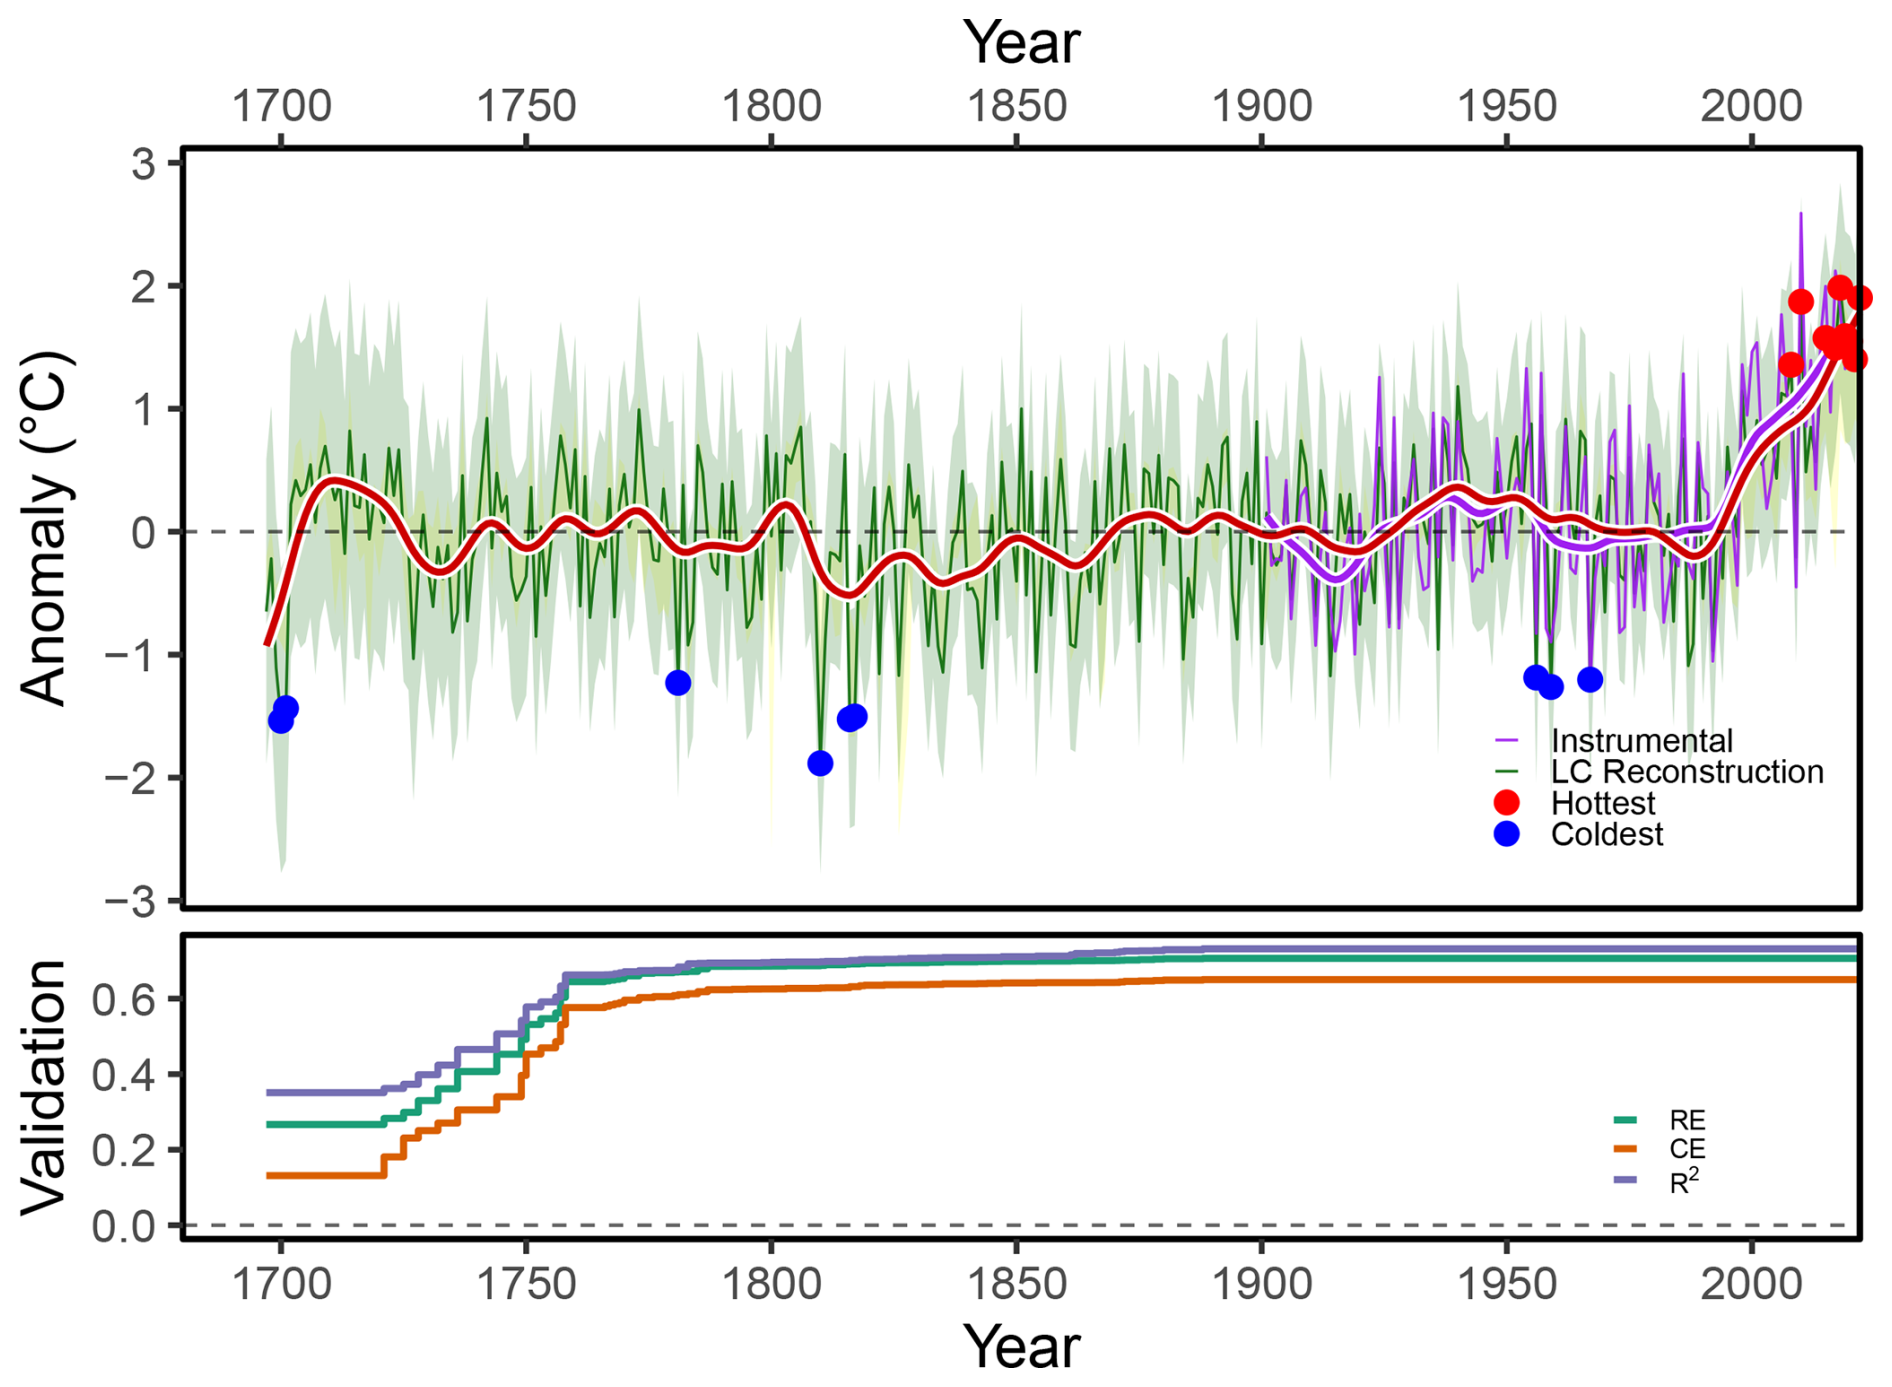
Figure 4Reconstructed and observed JJAS temperature anomalies (°C) for 1697–2022 relative to 1961–1990. The LC reconstruction is shown as a thin dark-green line with a 20 year spline (bold red line); instrumental temperature appears as the thin purple line with a 20 year spline (bold purple line). Calibration uncertainty is conveyed by the inner ±2σ model band (light green) and the sampling uncertainty is shown by outer nest 5 %–95 % band (yellow). Red and blue circles mark the 10 hottest and coldest reconstructed years, respectively. The bottom panel shows median RE, CE, and R2 across nests and the dashed horizontal line indicates zero skill.
Reconstructed temperatures varied strongly from year to year, while multi-decadal and centennial-scale variability was relatively low (Fig. S7 in the Supplement). At the annual scale, the ten coldest years spread over the last three centuries with three each in the 18th (1700, 1701, 1781) and 19th (1810, 1816, 1817) century and four cold extremes in the 20th century (1914, 1956, 1959, 1967), while the nine warmest years (2008, 2010, 2015, 2017, 2018, 2019, 2020, 2021, 2022) are exclusively concentrated in the early 21st century. The coldest sustained 30 year period occurred during 1809–1838 with a mean temperature anomaly of −0.66 °C (Fig. 4). This interval includes several consecutive negative extremes, with 1831–1840 representing the coldest decade of the record. Between the 1850s and the 1990s, the reconstruction shows no clear long-term warming trend, with 30 year mean anomalies in the late 20th century remaining comparable to those in the mid-19th and early 20th centuries. At the recent end, the reconstruction shows pronounced warming of ∼0.52 °C per decade (p<0.001) (Fig. 4).
3.3 Regional climate variability
To highlight the spatial representativeness of our LC reconstruction, the correlation between the reconstruction and the observed JJAS mean temperature field was calculated over the eastern Mediterranean domain and southwestern Asia. Correlations between the LC reconstruction and gridded summer temperatures are highly significant over a wide area that includes North Africa, the Arabian Peninsula and the Eurasian steppe region (Fig. S5 in the Supplement). After high-pass filtering, the correlations remain high over the Caucasus region and particularly towards the south (Arabian Peninsula) and east across the Eurasian Steppe. Comparison between our LC reconstruction and other MXD temperature reconstructions from the low- and mid-latitudes (Fig. 5a) shows strong correlation with the Greater Caucasus (r=0.64, p<0.001), a weak correlation with the Eastern Mediterranean (r=0.26, p<0.001) and insignificant correlations with the Pyrenees (r=0.08) and the Alps (r=0.06). After 20 year low-pass filtering, positive correlations () are found with all the considered reconstructions. At high frequencies, a declining correlation from east to west is observed (r=0.64 to −0.24) (Fig. S6 in the Supplement). Similar correlation trends are also found with N-TREND data at higher frequencies (Fig. 5b). The low-to-high-frequency variability ratios for the 18th and 19th centuries are low in the LC reconstruction (; Fig. S7). In comparison, higher ratios are observed in the Alps (; Fig. S7) and the Pyrenees (; Fig. S7).
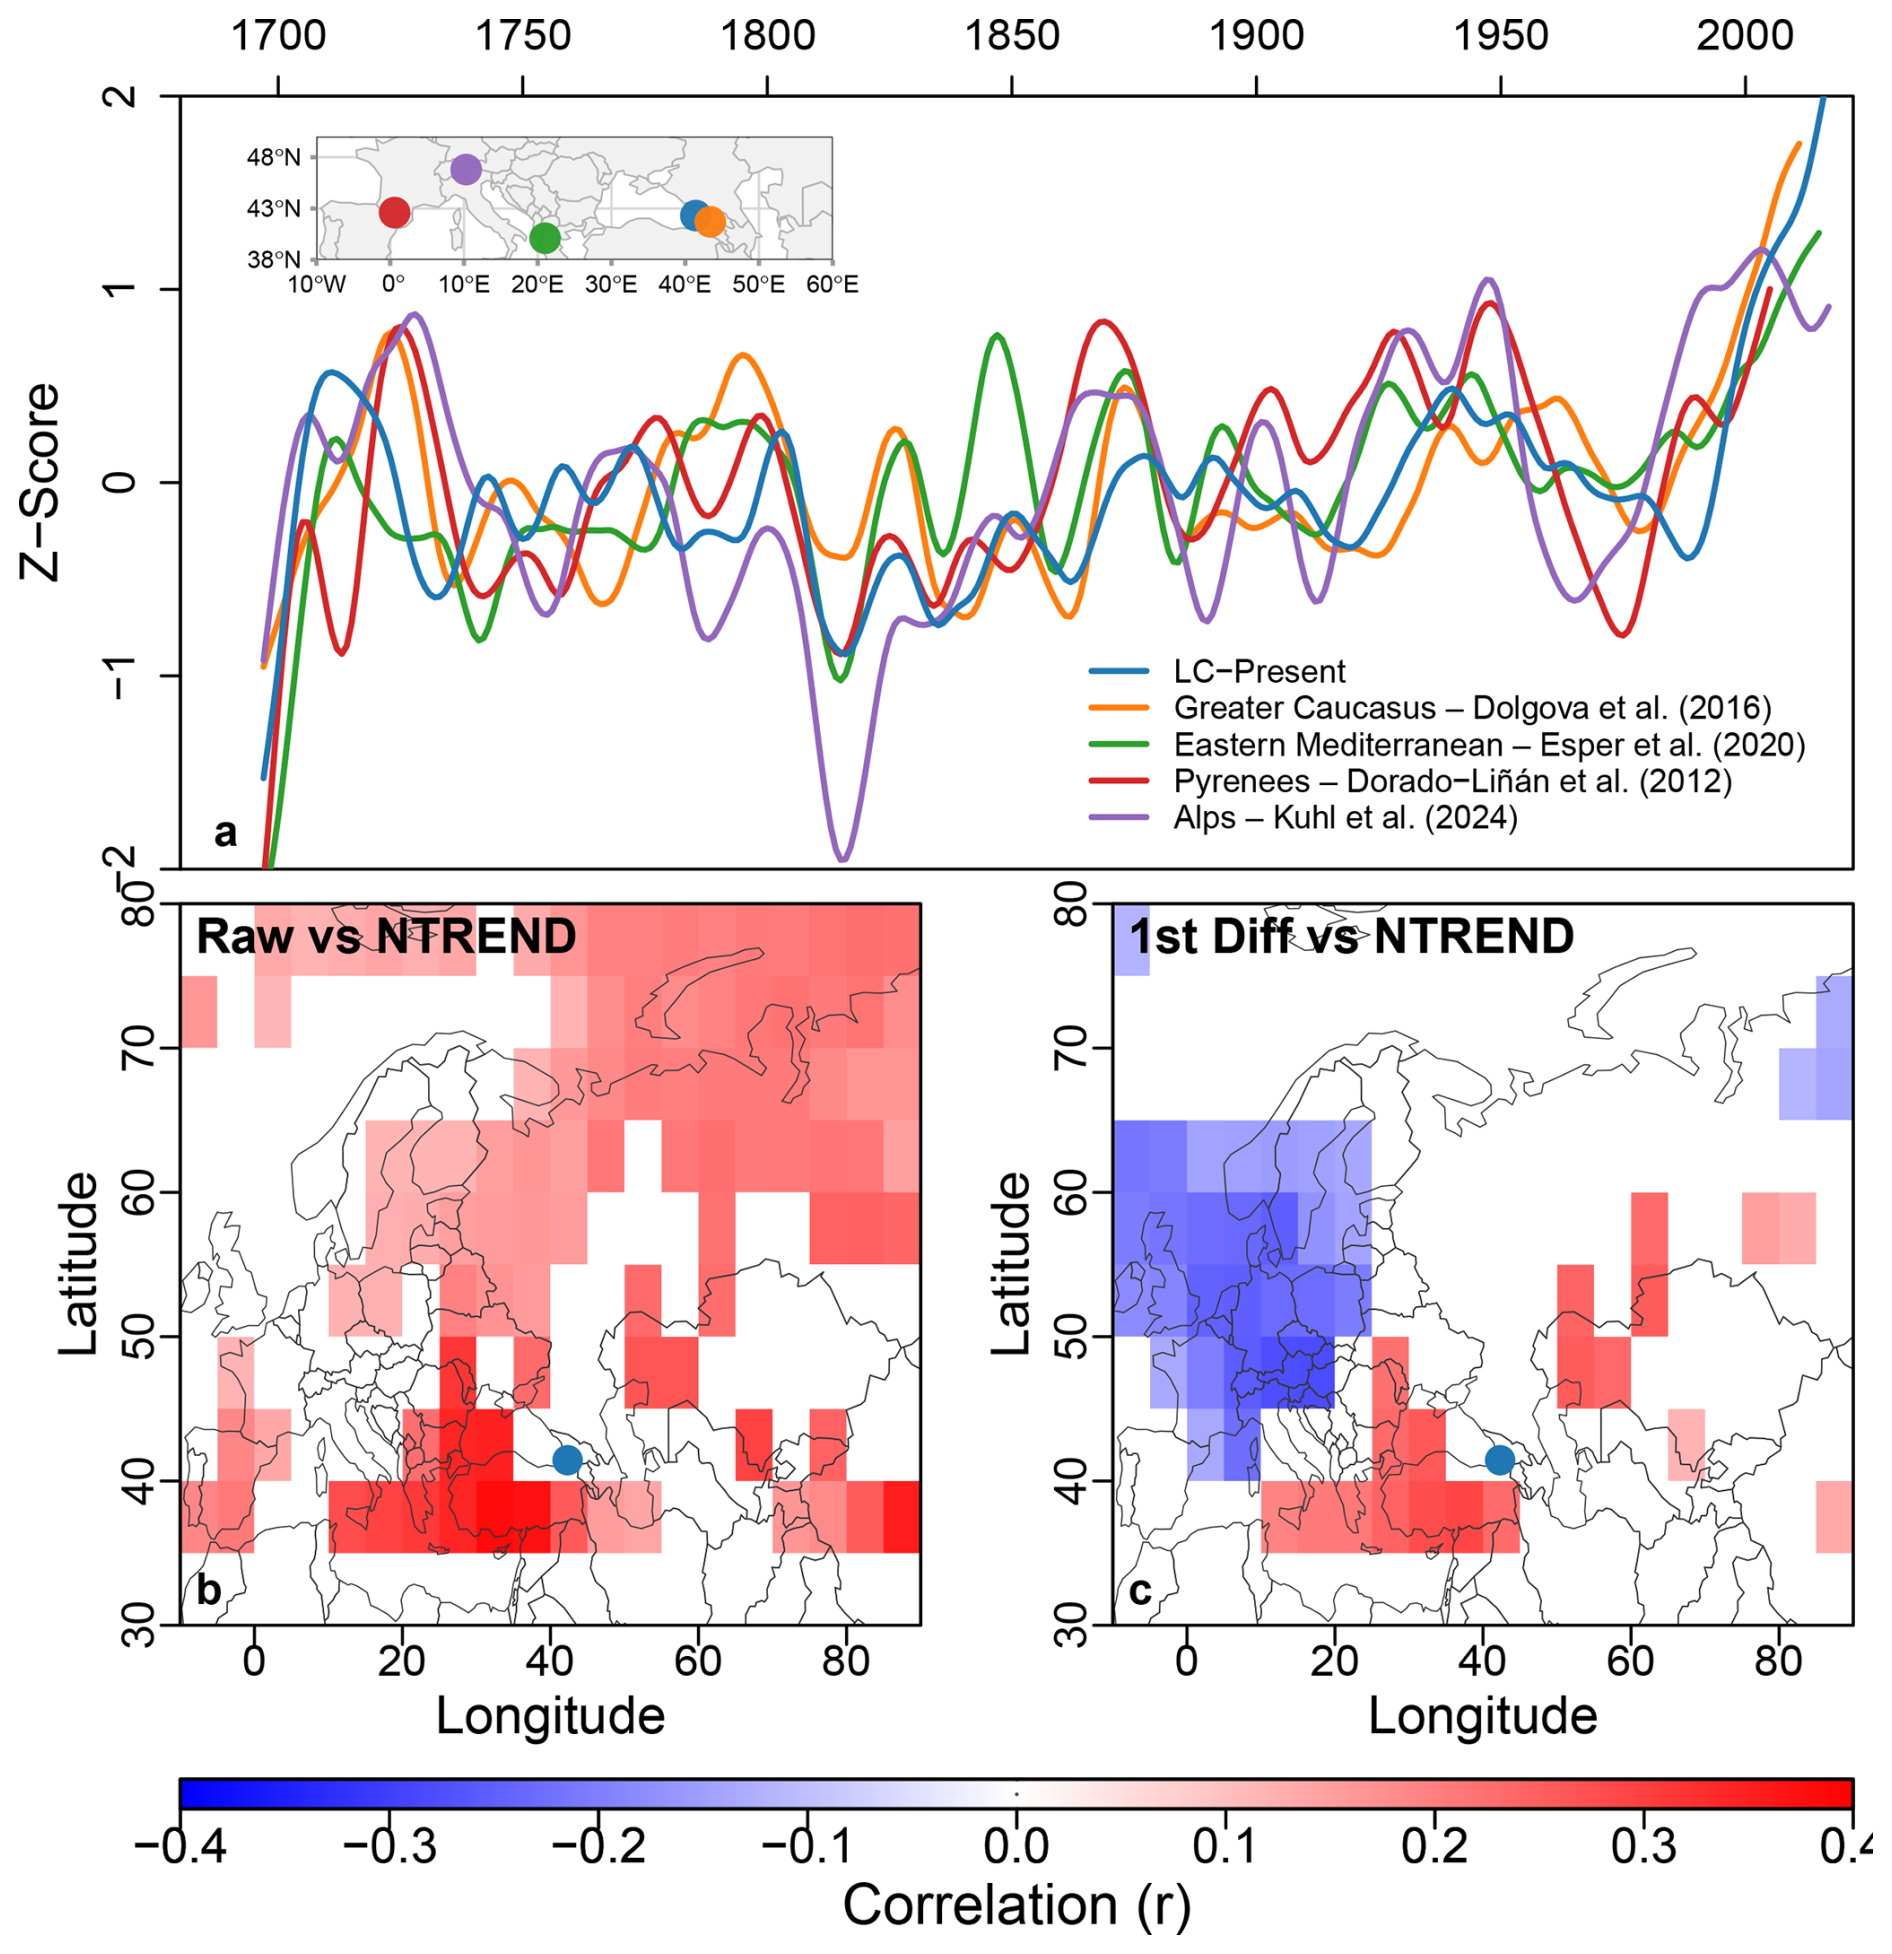
Figure 5(a) Comparison of the LC reconstruction with other MXD records from the mid latitudes. All the series are smoothed with a 30 year smoothing spline. Colours are consistent across panels for the Lesser Caucasus, the Greater Caucasus, the Eastern Mediterranean, the Pyrenees and the Alps. The top-left inset map marks site locations using the same colours. (b) Spatial correlations of the LC reconstruction vs. N-TREND temperature field (Anchukaitis et al., 2017) and (c) is as (b), but with first differenced data for the period 1697–2014. Blue filled circles indicate the site location of the present study.
3.4 Response to major volcanic eruptions
The SEA showed strong post-volcanic cooling (+1 year), with the strongest anomalies in our present LC reconstruction (−1.11 °C, p<0.01; Fig. 6). The other reconstructions showed similar behaviours in the SEA but with different magnitudes and timing (Fig. 6). Significant post-eruption cooling occurred one year after eruptions in the Lesser and Greater Caucasus. The records from the Eastern Mediterranean and the Pyrenees showed significant cooling only in year 0. The cooling estimates in the years 0 and +1 are similar in magnitude and range from 0.83–1.00 °C. Remarkably, the LC reconstruction thereby exceeds its significance threshold twice, much more than any of the other records, indicating that volcanic cooling is particularly pronounced compared to background variability in this reconstruction. The record from the Alps showed no significant cooling in the years 0 to +5 (Fig. 6).
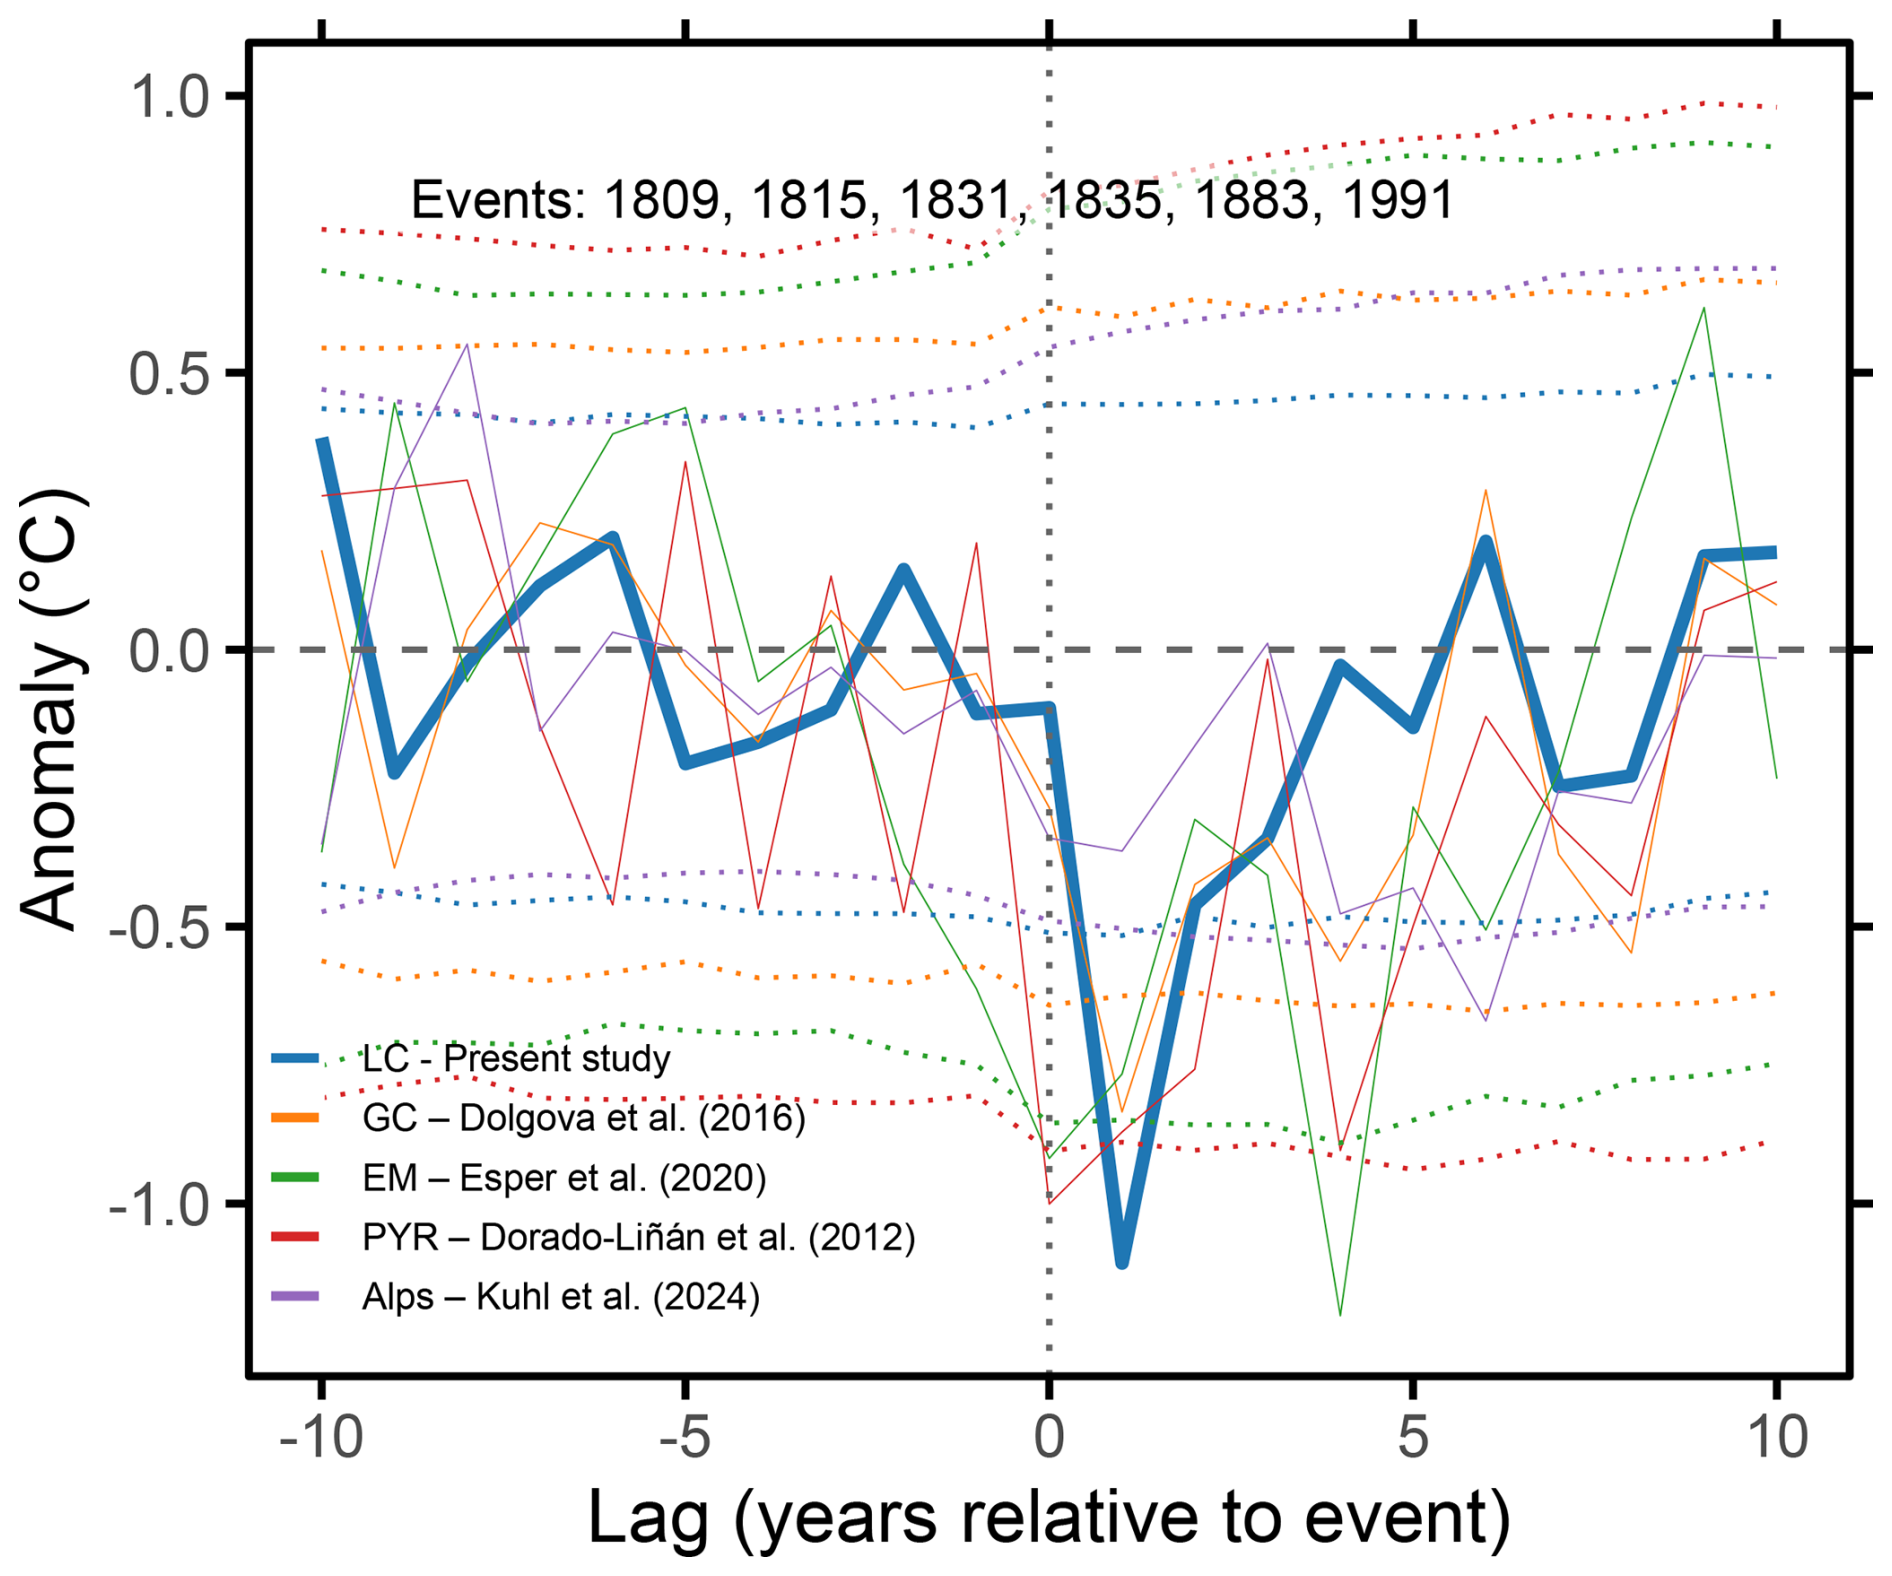
Figure 6Superposed epoch analysis (SEA) showing the response of tree-ring reconstructed temperatures to volcanic events. Solid lines represent the mean temperature anomaly for each record relative to five pre-event years. The horizontal dotted lines denote the thresholds for statistical significance determined using random bootstrapping at the 95 % confidence level. These thresholds were calculated by compositing 10 000 random draws of 6-time windows from each temperature reconstruction.
4.1 Limited early-industrial warming and strong volcanic forcing in the LC reconstruction
We present the first MXD chronology from the upper treeline in the Caucasus region, developed from 73 individual tree core samples of slow-growing living pine trees using the innovative X-ray µCT technology for density measurements. Our study was designed to maximize the climatic signal in the proxy data. The sampling site is characterized by open-canopy pine stands at the upper treeline (>2200 m) growing on dry south-facing slopes naturally minimizing ecological competition (Fig. 1). The high replication, a moderate age trend and a robust inter-series coherence of the MXD data are strong indicators for a reliable chronology. Weak age-trends and minimal differences between raw and detrended MXD chronologies imply a limited impact of detrending on the low-frequency climate signals (Fig. S2). Compared to the previously developed LWBI chronology from the same site (Dhyani et al., 2025), the MXD reconstruction shows a significantly better fit with observed temperatures, particularly in the low-frequency domain (Fig. S8 in the Supplement). This reinforces the capability of MXD to better retain long-term climate signals (Björklund et al., 2024). In addition, the bootstrap resampling experiment further supports the stability of the relationship between MXD and temperature even at lower replications (Fig. S3a) indicating that MXD can provide robust reconstructions even with low to moderate sample replication. Collectively, these attributes reduce the overall uncertainty of the reconstruction, even when conservative assumptions are applied regarding error propagation.
The MXD chronology aligns exceptionally well with the instrumental temperature record over the period of anthropogenic warming, showing no indication of divergence during the rapid warming of the late 20th and early 21st centuries (D'Arrigo et al., 2008). The most striking features of our LC reconstruction are pronounced short-lived volcanic cooling signals, limited low-frequency variability until the 1990s and an unprecedented 21st century warming. Extreme warm years, including 2010, 2018, 2019, and 2022, coincide with large-scale Eurasian heatwaves (Beck et al., 2013, 2024; Jeong et al., 2025; Rasmijn et al., 2018) and record-breaking global warmth (Dunn et al., 2023). The reconstruction captures pronounced cold anomalies in 1810, 1816 and 1817 associated with major ice-core sulphur deposition peaks (1809 and 1815) and with the “Year Without a Summer” following the 1815 Tambora eruption (Stothers, 1984; Toohey and Sigl, 2017), suggesting a pronounced impact of tropical volcanic forcing in the region. Other tropical eruptions, like Krakatau in 1883 and Pinatubo in 1991, also result in significant cooling one summer after the eruption. In contrast, the eruption of Cosigüina in January 1835 (Toohey and Sigl, 2017) caused cooling in summer of the same year because of the early eruption date (Esper et al., 2025; Kuhl et al., 2024). The short-term volcanic cooling found in the LC reconstruction, exceeding 1.0 °C on an absolute scale and 0.6 times the standard deviation on a relative scale, is larger than in many comparable European reconstructions, yet volcanic eruptions do not induce the same level of multi-year to decadal cooling that is typical for regions coupled to North Atlantic dynamics (Wanner et al., 2022). These differences likely show the continental climatic setting of the Caucasus, where reduced ocean–atmosphere coupling limits the persistence of temperature responses to forcing pulses. Additionally, cold extremes in the mid-20th century occurred in 1956, 1959 and 1967 coinciding with Eurasian blocking events (Fink et al., 2006).
Beyond these short-lived events, the LC reconstruction shows remarkably limited long-term temperature variability prior to the late 20th century. The early 19th century (1807–1836) is the coldest multi-decadal interval (30 year mean) in the reconstruction, potentially related to the Dalton Minimum, a period with prolonged solar activity minima (Silverman and Hayakawa, 2021) as well as to repeated volcanic cooling events (Schneider et al., 2017). In contrast with other single site and regional MXD reconstructions, such as those from the Alps (Esper et al., 2025), Southern Finland (Helama et al., 2014), Polar Urals (Briffa et al., 2013), and large-scale reconstructions (Anchukaitis et al., 2017; Büntgen et al., 2021), the LC reconstruction shows limited early-industrial warming. Temperatures during 1950–2000 were only slightly warmer (ΔT∼0.1 °C) than during 1850–1900. Weak early-industrial warming is also evident in other regional or Mediterranean reconstructions (Esper et al., 2020; Kuhl et al., 2024). While limited low-frequency variability can arise from methodological choices in proxy datasets (Büntgen et al., 2021), the strong calibration statistics and absence of divergence in the LC record suggest that this pattern may reflect genuine regional climatic stability.
4.2 Regional climate variability in the Caucasus (and Black Sea) region
To date, few studies have utilized TRW and LWBI data to reconstruct temperature variability from the Caucasus region (Bakhtiyorov et al., 2025; Dolgova, 2016; Holobâcă et al., 2016; Köse et al., 2017; Kvaratskhelia and Gavashelishvili, 2025). The variance explained by summer temperature is much higher in our MXD-based LC reconstruction (72 %) than reported for other chronologies from the region (40 %–65 %) (Bakhtiyorov et al., 2025; Dolgova, 2016), and even exceeds values from many highly cited MXD-based temperature reconstructions (Esper et al., 2016). The spatial correlation fields with observed JJAS temperatures (Fig. S5) show the relevance of the LC reconstruction for revealing the temperature history of a wider region. Our LC reconstruction, together with the Greater Caucasus records from Dolgova (2016) and Holobaca et al. (2016) agree with the finding that recent warming clearly exceeds the amplitude of earlier warm periods. In contrast, the recently published reconstruction from the northern Lesser Caucasus (Bakhtiyorov et al., 2025) shows warming since the 1990s but within the range of previous variability. The weak warming signal in Bakhtiyorov et al. (2025) seems to be supported by the instrumental record from the Kluhorski Pereval station (2037 m a.s.l.) in the Greater Caucasus and the TRW based spring-temperature reconstruction from western Anatolia (Köse et al., 2017). In contrast, the gridded temperature product CRU TS 4.09 and the nearby high-elevation station records (Ardahan; 1830 m a.s.l.) analysed in this study reveal stronger warming rates (Fig. S1). In addition, Bakhtiyorov et al. (2025) use trees from sites situated below 1900 m a.s.l. with a weaker climate/growth relationship questioning the reliability of the reconstruction. A multispecies conifer LWBI network from upper-treeline sites in the Lesser and Greater Caucasus showed strong summer temperature sensitivity but also did not fully capture the recent warming (Dhyani et al., 2025). Dhyani et al. (2025) conclude that the weaker expression of recent warming in available LWBI records from the region likely indicates methodological limitations of LWBI rather than actual temperature differences. However, despite these discrepancies, our LC reconstruction and the LWBI-based temperature record developed by Dolgova (2016) from the Greater Caucasus show highest calibration skill and strong correlation between each other which supports a reliable representation of regional temperature variability in reconstructions with high signal-to-noise ratios.
4.3 Caucasian temperature history and continental scale climate dynamics
Large-scale comparisons place our LC reconstruction within Eurasian climate dynamics (Fig. 5). The climatic setting of the Caucasus is a result of the combined influence of moist westerly circulation, subtropical high-pressure systems and strong continental conditions, which create a transitional regime between European, northern African and Asian climate systems. The spatial correlation fields of our MXD reconstruction represent this pattern with strong correlations extending eastward into the continental drylands of Kazakhstan and southward into the subtropical deserts of the Arabian Peninsula, while correlations decline more rapidly towards the west (Fig. S5). A rapid correlation decline towards the west is further evident in the spatial correlation pattern with N-TREND temperature fields (Anchukaitis et al., 2017) and direct comparisons with MXD based temperature reconstructions along the Alpide Belt (Fig. 5). Our LC record shows strong coherence with temperature reconstructions from the Greater Caucasus (Dolgova, 2016) and a moderate correlation with the Eastern Mediterranean region (Esper et al., 2020), whereas correlations with reconstructions from the Alps (Kuhl et al., 2024) and the Pyrenees (Dorado Liñán et al., 2015) are weak or absent. Particularly, high-frequency correlations decline westward, shifting from weak positive values with the Eastern Mediterranean region to negative correlations with the Alps (Fig. S6). The correlation patterns indicate that temperature variability in the Caucasus partly opposes Central European temperature variability emphasizing the need to capture such regional characteristics. In addition to these spatial differences, the volcanic cooling signals presented show strongest post volcanic cooling response in the LC (1.1 °C) and Greater Caucasus (0.83 °C) whereas the Eastern Mediterranean, Pyrenees and Alps display less pronounced responses (Fig. 5). Similar to regional correlation patterns, the current record shows a stronger and more coherent volcanic response in the continental interior, while the impact becomes progressively weaker towards the maritime western regions likely due to enhanced oceanic buffering and circulation-related moderation of post-eruption cooling (Brönnimann et al., 2019).
Late-20th century warming as well as cooling associated with major volcanic eruptions are evident in our LC reconstruction and in the other regional records, although the timing and magnitude of these characteristics vary among sites. Our LC reconstruction shows only a weak expression of the multi-decadal cooling in the early 19th century, in contrast to its clear prominence in most Alpine records (Esper et al., 2025). The strong agreement with the Greater Caucasus summer temperature reconstruction of Dolgova (2016), which also shows weak multidecadal cooling during the early 19th century, confirms this signal. Lower values for the low-to-high-frequency variability ratios support the interpretation of stronger continentality in the Caucasus region (Fig. S7).
If the exceptional warming observed in the present study during the 21st century continues, as also anticipated by climate model projections (Shahgedanova et al., 2009), it will likely further impact human societies across the Caucasus region. The reconstruction shows that no previous warm interval in the last three centuries approaches the magnitude or persistence of the current episode, emphasizing that modern warming is without analogue in the proxy record. Snow accumulation, which serves as a crucial natural reservoir sustaining water supply during warm months is also projected to decline with continued warming in the Caucasus (Shahgedanova et al., 2009; Stokes et al., 2007; Tielidze et al., 2025) further intensifying water stress as human demand continues to grow (Mankin et al., 2015).
This study presents the first MXD-based summer temperature reconstruction from the Caucasus, extending back more than three centuries. By applying X-ray µCT scanning, we overcame limitations of traditional densitometry and demonstrated the strong sensitivity of tree-line Pinus sylvestris MXD to summer temperatures. The skill and the high proportion of variance explained by JJAS temperatures exceed the statistics for most of the single-site MXD records from the Northern Hemisphere. Our reconstruction captures major volcanic cooling peaks as well as the onset of sustained modern warming in the early 21st century, showing that recent summer warming is unprecedented over at least the past three centuries. More broadly, this record closes a critical spatial gap in mid-latitude tree-ring based temperature reconstructions and highlights the potential of MXD proxies to provide robust, spectrally unbiased estimates of past climate. In addition to its regional relevance, the chronology contributes to large-scale initiatives such as N-TREND, helping to better constrain Northern Hemisphere summer temperature variability. Continued development and temporal extension of MXD datasets in the topographically complex and climatically variable Caucasus region will be crucial for refining our understanding of past climate dynamics and for placing ongoing anthropogenic warming into a long-term perspective.
A primary challenge will be the extension of the Caucasus tree-ring reconstructions beyond the current few centuries to many centuries or even millennia to investigate the full period of the LIA as well as the earlier Medieval Climate Anomaly. The relatively short lifespan of trees in the region restricts the temporal reach of reconstructions based on living wood only. Future efforts must therefore integrate archaeological material and wood from old buildings to provide insights into climate variability in the deeper past and to understand human and landscape evolution in the context of climate change for the Caucasus region.
The tree-ring data used in this paper will be available to the International Tree-Ring Databank (ITRDB).
The supplement related to this article is available online at https://doi.org/10.5194/cp-22-989-2026-supplement.
RD: Writing – original draft, Methodology, Data curation, Visualization and Conceptualization. DM-B: Investigation, Writing – review and editing. LV: Resources, Writing – review and editing. VM: Resources, Writing – review and editing. JVdB: Resources, Writing – review and editing. MD: Writing – review and editing. RK: investigation, Writing – review and editing. NK: Writing – review and editing. HTG: Writing – review and editing. LS: Supervision, Methodology, onceptualization, funding acquisition, Writing – review and editing, Project administration.
The contact author has declared that none of the authors has any competing interests.
Publisher's note: Copernicus Publications remains neutral with regard to jurisdictional claims made in the text, published maps, institutional affiliations, or any other geographical representation in this paper. The authors bear the ultimate responsibility for providing appropriate place names. Views expressed in the text are those of the authors and do not necessarily reflect the views of the publisher.
We thank Alper K. Kadıoğlu and Daniel A. Bishop for their help during fieldwork. We also thank Samuli Helama and the two anonymous reviewers for their constructive comments, which helped to improve the article.
This research has been supported by the Deutsche Forschungsgemeinschaft (DFG, German Research Foundation; grant no. 543966483). RK received support from the Johannes Amos Comenius Programme (PJAC), project no. CZ.02.01.01/00/22_008/0004605, Natural and anthropogenic georisks. Authors JVDB, VM and LV acknowledge the financial support of the UGCT Core Facility by the Special Research Fund (BOF.C0R.2022.008) and IOF project FaCT 5F2021/IOF-Equip/021. VM acknowledges the financial support from the Research Foundation–Flanders (FWO) for the ACTREAL (G019521N) project.
This paper was edited by Hans Linderholm and reviewed by two anonymous referees.
Ambroziak, R. A.: The Climates of the Soviet Union. By Paul E. Lydolph. World Survey of Climatology, vol. 7. Amsterdam and New York: Elsevier Scientific Publishing Company, 1977. xii, 443 pp. Illus. Dfl. 200. $81.75, Slavic Review, 36, 696–697, https://doi.org/10.2307/2495290, 1977.
Anchukaitis, K. J., Wilson, R., Briffa, K. R., Büntgen, U., Cook, E. R., D'Arrigo, R., Davi, N., Esper, J., Frank, D., Gunnarson, B. E., Hegerl, G., Helama, S., Klesse, S., Krusic, P. J., Linderholm, H. W., Myglan, V., Osborn, T. J., Zhang, P., Rydval, M., Schneider, L., Schurer, A., Wiles, G., and Zorita, E.: Last millennium Northern Hemisphere summer temperatures from tree rings: Part II, spatially resolved reconstructions, Quaternary Sci. Rev., 163, 1–22, https://doi.org/10.1016/j.quascirev.2017.02.020, 2017.
Bakhtiyorov, Z., Chen, F., Chen, Y., Wang, S., Zhang, H., Hu, M., Yue, W., Habibulloev, S., Kavtaradze, G., Rahmonov, O., Dolgova, E., Gurskaya, M., Agafonov, L., Khan, A., and Tao, H.: Tree-ring blue-intensity reconstruction of the April–September maximum temperature in the Greater Caucasus region of Georgia since 1780 CE, Int. J. Biometeorol., https://doi.org/10.1007/s00484-025-02930-7, 2025.
Beck, P. S. A., Andreu-Hayles, L., D'Arrigo, R., Anchukaitis, K. J., Tucker, C. J., Pinzón, J. E., and Goetz, S. J.: A large-scale coherent signal of canopy status in maximum latewood density of tree rings at arctic treeline in North America, Global Planet. Change, 100, 109–118, https://doi.org/10.1016/j.gloplacha.2012.10.005, 2013.
Beck, T. M., Schumacher, D. L., Achebak, H., Vicedo–Cabrera, A. M., Seneviratne, S. I., and Ballester, J.: Mortality burden attributed to anthropogenic warming during Europe's 2022 record-breaking summer, npj Clim. Atmos. Sci., 7, 245, https://doi.org/10.1038/s41612-024-00783-2, 2024.
Björklund, J., Seftigen, K., Schweingruber, F., Fonti, P., von Arx, G., Bryukhanova, M. V., Cuny, H. E., Carrer, M., Castagneri, D., and Frank, D. C.: Cell size and wall dimensions drive distinct variability of earlywood and latewood density in Northern Hemisphere conifers, New Phytol., 216, 728–740, https://doi.org/10.1111/nph.14639, 2017.
Björklund, J., von Arx, G., Nievergelt, D., Wilson, R., Van den Bulcke, J., Günther, B., Loader, N. J., Rydval, M., Fonti, P., Scharnweber, T., Andreu-Hayles, L., Büntgen, U., D'Arrigo, R., Davi, N., De Mil, T., Esper, J., Gärtner, H., Geary, J., Gunnarson, B. E., Hartl, C., Hevia, A., Song, H., Janecka, K., Kaczka, R. J., Kirdyanov, A. V., Kochbeck, M., Liu, Y., Meko, M., Mundo, I., Nicolussi, K., Oelkers, R., Pichler, T., Sánchez-Salguero, R., Schneider, L., Schweingruber, F., Timonen, M., Trouet, V., Van Acker, J., Verstege, A., Villalba, R., Wilmking, M., and Frank, D.: Scientific Merits and Analytical Challenges of Tree-Ring Densitometry, Rev. Geophys., 57, 1224–1264, https://doi.org/10.1029/2019RG000642, 2019.
Björklund, J., Seftigen, K., Kaczka, R. J., Rydval, M., and Wilson, R.: A definition and standardised terminology for Blue Intensity from Conifers, Dendrochronologia, 85, 126200, https://doi.org/10.1016/j.dendro.2024.126200, 2024.
Briffa, K. R., Jones, P. D., Schweingruber, F. H., and Osborn, T. J.: Influence of volcanic eruptions on Northern Hemisphere summer temperature over the past 600 years, Nature, 393, 450–455, https://doi.org/10.1038/30943, 1998.
Briffa, K. R., Melvin, T. M., Osborn, T. J., Hantemirov, R. M., Kirdyanov, A. V., Mazepa, V. S., Shiyatov, S. G., and Esper, J.: Reassessing the evidence for tree-growth and inferred temperature change during the Common Era in Yamalia, northwest Siberia, Quaternary Sci. Rev., 72, 83–107, https://doi.org/10.1016/j.quascirev.2013.04.008, 2013.
Brönnimann, S., Franke, J., Nussbaumer, S. U., Zumbühl, H. J., Steiner, D., Trachsel, M., Hegerl, G. C., Schurer, A., Worni, M., Malik, A., Flückiger, J., and Raible, C. C.: Last phase of the Little Ice Age forced by volcanic eruptions, Nat. Geosci., 12, 650–656, https://doi.org/10.1038/s41561-019-0402-y, 2019.
Bunn, A. G.: A dendrochronology program library in R (dplR), Dendrochronologia, 26, 115–124, https://doi.org/10.1016/j.dendro.2008.01.002, 2008.
Büntgen, U., Frank, D. C., Nievergelt, D., and Esper, J.: Summer Temperature Variations in the European Alps, a.d. 755–2004, J. Climate, 19, 5606–5623, https://doi.org/10.1175/JCLI3917.1, 2006.
Büntgen, U., Kyncl, T., Ginzler, C., Jacks, D. S., Esper, J., Tegel, W., Heussner, K.-U., and Kyncl, J.: Filling the Eastern European gap in millennium-long temperature reconstructions, P. Natl. Acad. Sci. USA, 110, 1773–1778, https://doi.org/10.1073/pnas.1211485110, 2013.
Büntgen, U., Allen, K., Anchukaitis, K. J., Arseneault, D., Boucher, É., Bräuning, A., Chatterjee, S., Cherubini, P., Churakova, O. V., and Corona, C.: The influence of decision-making in tree ring-based climate reconstructions, Nat. Commun., 12, 3411, https://doi.org/10.1038/s41467-021-23627-6, 2021.
Buras, A.: A comment on the expressed population signal, Dendrochronologia, 44, 130–132, https://doi.org/10.1016/j.dendro.2017.03.005, 2017.
Chen, F., Yuan, Y., Yu, S., and Chen, F.: A 391-Year Summer Temperature Reconstruction of the Tien Shan, Reveals Far-Reaching Summer Temperature Signals Over the Midlatitude Eurasian Continent, J. Geophys. Res.-Atmos., 124, 11850–11862, https://doi.org/10.1029/2019JD030301, 2019.
Cook, E. R. and Peters, K.: Calculating unbiased tree-ring indices for the study of climatic and environmental change, Holocene 7, 361–370, https://doi.org/10.1177/095968369700700314, 1997.
Cook, E. R., D'Arrigo, R. D., and Mann, M. E.: A Well-Verified, Multiproxy Reconstruction of the Winter North Atlantic Oscillation Index since a.d. 1400, J. Climate, https://doi.org/10.1175/1520-0442(2002)015<1754:AWVMRO>2.0.CO;2, 2002.
D'Arrigo, R., Wilson, R., Liepert, B., and Cherubini, P.: On the “Divergence Problem” in Northern Forests: A review of the tree-ring evidence and possible causes, Global Planet. Change, 60, 289–305, https://doi.org/10.1016/j.gloplacha.2007.03.004, 2008.
De Mil, T. and Van den Bulcke, J.: Tree Core Analysis with X-ray Computed Tomography, JOVE-J. Vis. Exp., https://doi.org/10.3791/65208, 2023.
De Mil, T., Vannoppen, A., Beeckman, H., Van Acker, J., and Van den Bulcke, J.: A field-to-desktop toolchain for X-ray CT densitometry enables tree ring analysis, Ann. Bot.-London, 117, 1187–1196, https://doi.org/10.1093/aob/mcw063, 2016.
Dhyani, R., Martin-Benito, D., Doğan, M., Kvaratskhelia, R., Köse, N., Güner, H. T., and Schneider, L.: Consistent summer temperature signals in a latewood blue intensity network from the upper tree line in the Caucasus, Dendrochronologia, 92, 126372, https://doi.org/10.1016/j.dendro.2025.126372, 2025.
Dolgova, E.: June–September temperature reconstruction in the Northern Caucasus based on blue intensity data, Dendrochronologia, 39, 17–23, https://doi.org/10.1016/j.dendro.2016.03.002, 2016.
Dorado Liñán, I., Büntgen, U., González-Rouco, F., Zorita, E., Montávez, J. P., Gómez-Navarro, J. J., Brunet, M., Heinrich, I., Helle, G., and Gutiérrez, E.: Estimating 750 years of temperature variations and uncertainties in the Pyrenees by tree-ring reconstructions and climate simulations, Clim. Past, 8, 919–933, https://doi.org/10.5194/cp-8-919-2012, 2012.
Dorado Liñán, I., Zorita, E., González-Rouco, J. F., Heinrich, I., Campello, F., Muntán, E., Andreu-Hayles, L., and Gutiérrez, E.: Eight-hundred years of summer temperature variations in the southeast of the Iberian Peninsula reconstructed from tree rings, Clim. Dynam., 44, 75–93, https://doi.org/10.1007/s00382-014-2348-5, 2015.
Dunn, R. J. H., Sandford, C., Kendon, M., Morice, C. P., Kennedy, J. J., and Rayner, N. A.: Global and regional climate in 2022, Weather, 78, 328–336, https://doi.org/10.1002/wea.4500, 2023.
Elizbarashvili, E. Sh., Tatishvili, M. R., Elizbarashvili, M. E., Elizbarashvili, Sh. E., and Meskhiya, R. Sh.: Air temperature trends in Georgia under global warming conditions, Russ. Meteorol. Hydrol., 38, 234–238, https://doi.org/10.3103/S1068373913040043, 2013.
Elizbarashvili, M., Elizbarashvili, E., Tatishvili, M., Elizbarashvili, S., Meskhia, R., Kutaladze, N., King, L., Keggenhoff, I., and Khardziani, T.: Georgian climate change under global warming conditions, Annals of Agrarian Science, 15, 17–25, https://doi.org/10.1016/j.aasci.2017.02.001, 2017.
Esper, J., Frank, D. C., Wilson, R. J. S., and Briffa, K. R.: Effect of scaling and regression on reconstructed temperature amplitude for the past millennium, Geophys. Res. Lett., 32, 2004GL021236, https://doi.org/10.1029/2004GL021236, 2005.
Esper, J., Frank, D., Büntgen, U., Verstege, A., Luterbacher, J., and Xoplaki, E.: Long-term drought severity variations in Morocco, Geophys. Res. Lett., 34, https://doi.org/10.1029/2007GL030844, 2007.
Esper, J., Schneider, L., Smerdon, J. E., Schöne, B. R., and Büntgen, U.: Signals and memory in tree-ring width and density data, Dendrochronologia, 35, 62–70, https://doi.org/10.1016/j.dendro.2015.07.001, 2015.
Esper, J., Krusic, P. J., Ljungqvist, F. C., Luterbacher, J., Carrer, M., Cook, E., Davi, N. K., Hartl-Meier, C., Kirdyanov, A., Konter, O., Myglan, V., Timonen, M., Treydte, K., Trouet, V., Villalba, R., Yang, B., and Büntgen, U.: Ranking of tree-ring based temperature reconstructions of the past millennium, Quaternary Sci. Rev., 145, 134–151, https://doi.org/10.1016/j.quascirev.2016.05.009, 2016.
Esper, J., George, S. St., Anchukaitis, K., D'Arrigo, R., Ljungqvist, F. C., Luterbacher, J., Schneider, L., Stoffel, M., Wilson, R., and Büntgen, U.: Large-scale, millennial-length temperature reconstructions from tree-rings, Dendrochronologia, 50, 81–90, https://doi.org/10.1016/j.dendro.2018.06.001, 2018.
Esper, J., Klippel, L., Krusic, P. J., Konter, O., Raible, C. C., Xoplaki, E., Luterbacher, J., and Büntgen, U.: Eastern Mediterranean summer temperatures since 730 CE from Mt. Smolikas tree-ring densities, Clim. Dynam., 54, 1367–1382, https://doi.org/10.1007/s00382-019-05063-x, 2020.
Esper, J., Smerdon, J. E., Anchukaitis, K. J., Allen, K., Cook, E. R., D'Arrigo, R., Guillet, S., Ljungqvist, F. C., Reinig, F., Schneider, L., Sigl, M., Stoffel, M., Trnka, M., Wilson, R., and Büntgen, U.: The IPCC's reductive Common Era temperature history, Commun. Earth Environ., 5, 222, https://doi.org/10.1038/s43247-024-01371-1, 2024.
Esper, J., Reinig, F., Torbenson, M., del Castillo, E. M., Kunz, M., Arzac, A., Carrer, M., Chen, F., Kadioglu, A. K., Kirdyanov, A. V., Tejedor, E., Trnka, M., and Büntgen, U.: Pan-alpine summer temperatures since 742 CE, Dendrochronologia, 94, 126432, https://doi.org/10.1016/j.dendro.2025.126432, 2025.
Fink, C., Hadler, F., and Schramm, T.: 1956: European and Global Perspectives, Leipziger Universitätsverlag, 364 pp., ISBN 3937209565, 2006.
Fritts, H.: Tree Rings and Climate, Academic Press, 583 pp., ISBN 0122684508, 1976.
Harris, I., Osborn, T. J., Jones, P., and Lister, D.: Version 4 of the CRU TS monthly high-resolution gridded multivariate climate dataset, Sci. Data, 7, 109, https://doi.org/10.1038/s41597-020-0453-3, 2020.
Helama, S., Vartiainen, M., Holopainen, J., Mäkelä, H. M., Kolström, T., and Meriläinen, J.: A palaeotemperature record for the Finnish Lakeland based on microdensitometric variations in tree rings, Geochron, 41, 265–277, https://doi.org/10.2478/s13386-013-0163-0, 2014.
Holmes, R. L.: Computer-assisted quality control in tree-ring dating and measurement, Tree-Ring Bull., 43, 51–67, http://hdl.handle.net/10150/261223 (last access: 16 July 2025), 1983.
Holobâcă, I.-H., Pop, O., and Petrea, D.: Dendroclimatic reconstruction of late summer temperatures from upper treeline sites in Greater Caucasus, Russia, Quatern. Int., 415, 67–73, https://doi.org/10.1016/j.quaint.2015.10.103, 2016.
Hu, Z., Zhang, C., Hu, Q., and Tian, H.: Temperature Changes in Central Asia from 1979 to 2011 Based on Multiple Datasets, https://doi.org/10.1175/JCLI-D-13-00064.1, 2014.
Huang, R., Yin, H., Zhu, H., Liang, E., Ullah, A., Jens-Henrik Meier, W., Asad, F., Bräuning, A., and Grießinger, J.: A late summer temperature reconstruction based on tree-ring maximum latewood density since AD 1246 on the southeastern Tibetan Plateau, Quaternary Sci. Rev., 355, 109266, https://doi.org/10.1016/j.quascirev.2025.109266, 2025.
IPCC: Summary for Policymakers, in: Climate Change 2022 – Impacts, Adaptation and Vulnerability, edited by: Pörtner, H.-O., Roberts, D. C., Poloczanska, E. S., Mintenbeck, K., Tignor, M., Alegría, A., Craig, M., Langsdorf, S., Löschke, S., Möller, V., and Okem, A.: in: Climate Change 2022 – Impacts, Adaptation and Vulnerability, Cambridge University Press, Cambridge, UK and New York, NY, USA, 3–34, https://doi.org/10.1017/9781009325844.001, 2023.
Jeong, J.-H., Kim, M.-S., Yoon, J.-H., Kim, H., Wang, S.-Y. S., Woo, S.-H., and Linderholm, H. W.: Emerging trans-Eurasian heatwave-drought train in a warming climate, Science Advances, 11, eadr7320, https://doi.org/10.1126/sciadv.adr7320, 2025.
Khan, A., Chen, F., Saleem, S., Chen, Y., Zhang, H., and Bakhtiyorov, Z.: Tree-ring maximum latewood density reveals unprecedented warming and long-term summer temperature in the upper Indus Basin, northern Pakistan, Sci. Total Environ., 956, 177393, https://doi.org/10.1016/j.scitotenv.2024.177393, 2024.
Keggenhoff, I., Elizbarashvili, M., Amiri-Farahani, A., and King, L.: Trends in daily temperature and precipitation extremes over Georgia, Weather and Climate Extremes, 4, 75–85, https://doi.org/10.1016/j.wace.2014.05.001, 2014.
Kirdyanov, A. V., Arzac, A., Kirdyanova, A. A., Arosio, T., Ovchinnikov, D. V., Ganyushkin, D. A., Katjutin, P. N., Myglan, V. S., Nazarov, A. N., Slyusarenko, I. Y., Bebchuk, T., and Büntgen, U.: Tree-Ring Chronologies from the Upper Treeline in the Russian Altai Mountains Reveal Strong and Stable Summer Temperature Signals, Forests, 15, 1402, https://doi.org/10.3390/f15081402, 2024.
Klesse, S., Ziehmer, M., Rousakis, G., Trouet, V., and Frank, D.: Synoptic drivers of 400 years of summer temperature and precipitation variability on Mt. Olympus, Greece, Clim. Dynam., 45, 807–824, https://doi.org/10.1007/s00382-014-2313-3, 2015.
Köse, N., Güner, H. T., Harley, G. L., and Guiot, J.: Spring temperature variability over Turkey since 1800 CE reconstructed from a broad network of tree-ring data, Clim. Past, 13, 1–15, https://doi.org/10.5194/cp-13-1-2017, 2017.
Kuhl, E., Esper, J., Schneider, L., Trouet, V., Kunz, M., Klippel, L., Büntgen, U., and Hartl, C.: Revising Alpine summer temperatures since 881 CE, Clim. Dynam., https://doi.org/10.1007/s00382-024-07195-1, 2024.
Kvaratskhelia, R. and Gavashelishvili, A.: Common Yew (Taxus baccata) as a climate archive: Reconstructing 200 years of temperature change in Georgia (Caucasus), Dendrochronologia, 89, 126285, https://doi.org/10.1016/j.dendro.2024.126285, 2025.
Mankin, J. S., Viviroli, D., Singh, D., Hoekstra, A. Y., and Diffenbaugh, N. S.: The potential for snow to supply human water demand in the present and future, Environ. Res. Lett., 10, 114016, https://doi.org/10.1088/1748-9326/10/11/114016, 2015.
Martin-Benito, D., Pederson, N., Köse, N., Doğan, M., Bugmann, H., Mosulishvili, M., and Bigler, C.: Pervasive effects of drought on tree growth across a wide climatic gradient in the temperate forests of the Caucasus, Global Ecol. Biogeogr., 27, 1314–1325, https://doi.org/10.1111/geb.12799, 2018.
Meko, D.: Dendroclimatic reconstruction with time varying predictor subsets of tree indices, J. Climate, 10, 687–696, https://doi.org/10.1175/1520-0442(1997)010<0687:DRWTVP>2.0.CO;2, 1997.
Melvin, T. M. and Briffa, K. R.: A “signal-free” approach to dendroclimatic standardisation, Dendrochronologia, 26, 71–86, https://doi.org/10.1016/j.dendro.2007.12.001, 2008.
Melvin, T. M., Briffa, K. R., Nicolussi, K., and Grabner, M.: Time-varying-response smoothing, Dendrochronologia, 25, 65–69, https://doi.org/10.1016/j.dendro.2007.01.004, 2007.
Menne, M. J., Durre, I., Vose, R. S., Gleason, B. E., and Houston, T. G.: An Overview of the Global Historical Climatology Network-Daily Database, J. Atmos. Ocean. Tech., 29, 897–910, https://doi.org/10.1175/JTECH-D-11-00103.1, 2012.
Neukom, R., Barboza, L. A., Erb, M. P., Shi, F., Emile-Geay, J., Evans, M. N., Franke, J., Kaufman, D. S., Lücke, L., Rehfeld, K., Schurer, A., Zhu, F., Brönnimann, S., Hakim, G. J., Henley, B. J., Ljungqvist, F. C., McKay, N., Valler, V., von Gunten, L., and PAGES 2k Consortium: Consistent multidecadal variability in global temperature reconstructions and simulations over the Common Era, Nat. Geosci., 12, 643–649, https://doi.org/10.1038/s41561-019-0400-0, 2019.
Rao, M. P., Cook, E. R., Cook, B. I., Anchukaitis, K. J., D'Arrigo, R. D., Krusic, P. J., and LeGrande, A. N.: A double bootstrap approach to Superposed Epoch Analysis to evaluate response uncertainty, Dendrochronologia, 55, 119–124, https://doi.org/10.1016/j.dendro.2019.05.001, 2019.
Rasmijn, L. M., van der Schrier, G., Bintanja, R., Barkmeijer, J., Sterl, A., and Hazeleger, W.: Future equivalent of 2010 Russian heatwave intensified by weakening soil moisture constraints, Nat. Clim. Change, 8, 381–385, https://doi.org/10.1038/s41558-018-0114-0, 2018.
R Core Team: R: A language and environment for statistical computing. R Foundation for Statistical Computing, Vienna, Austria, http://www.R-project.org/ (last access: 16 October 2025), 2016.
Römer, P., Hartl, C., Schneider, L., Bräuning, A., Szymczak, S., Huneau, F., Lebre, S., Reinig, F., Büntgen, U., and Esper, J.: Reduced Temperature Sensitivity of Maximum Latewood Density Formation in High-Elevation Corsican Pines under Recent Warming, Atmosphere, 12, 804, https://doi.org/10.3390/atmos12070804, 2021.
Schneider, L., Smerdon, J. E., Büntgen, U., Wilson, R. J. S., Myglan, V. S., Kirdyanov, A. V., and Esper, J.: Revising midlatitude summer temperatures back to A. D. 600 based on a wood density network, Geophys. Res. Lett., 42, 4556–4562, https://doi.org/10.1002/2015GL063956, 2015.
Schneider, L., Smerdon, J. E., Pretis, F., Hartl-Meier, C., and Esper, J.: A new archive of large volcanic events over the past millennium derived from reconstructed summer temperatures, Environ. Res. Lett., 12, 094005, https://doi.org/10.1088/1748-9326/aa7a1b, 2017.
Schöne, T., Zech, C., Unger-Shayesteh, K., Rudenko, V., Thoss, H., Wetzel, H.-U., Gafurov, A., Illigner, J., and Zubovich, A.: A new permanent multi-parameter monitoring network in Central Asian high mountains – from measurements to data bases, Geosci. Instrum. Method. Data Syst., 2, 97–111, https://doi.org/10.5194/gi-2-97-2013, 2013.
Shahgedanova, M., Stokes, C. R., Gurney, S. D., and Popovnin, V.: Interactions between mass balance, atmospheric circulation, and recent climate change on the Djankuat Glacier, Caucasus Mountains, Russia, J. Geophys. Res.-Atmos., 110, https://doi.org/10.1029/2004JD005213, 2005.
Shahgedanova, M., Hagg, W., Zacios, M., and Popovnin, V.: An Assessment of the Recent Past and Future Climate Change, Glacier Retreat, and Runoff in the Caucasus Region Using Dynamical and Statistical Downscaling and HBV-ETH Hydrological Model, in: Regional Aspects of Climate-Terrestrial-Hydrologic Interactions in Non-boreal Eastern Europe, Springer Science and Business Media, Dordrecht, 63–72, https://doi.org/10.1007/978-90-481-2283-7_8, 2009.
Silverman, S. M. and Hayakawa, H.: The Dalton Minimum and John Dalton's Auroral Observations, J. Space Weather Spac., 11, 17, https://doi.org/10.1051/swsc/2020082, 2021.
Stanev, E. V.: On the mechanisms of the Black Sea circulation, Earth-Sci. Rev., 28, 285–319, https://doi.org/10.1016/0012-8252(90)90052W, 1990.
Stokes, C. R., Popovnin, V., Aleynikov, A., Gurney, S. D., and Shahgedanova, M.: Recent glacier retreat in the Caucasus Mountains, Russia, and associated increase in supraglacial debris cover and supra-/proglacial lake development, Ann. Glaciol., 46, 195–203, https://doi.org/10.3189/172756407782871468, 2007.
Stothers, R. B.: The Great Tambora Eruption in 1815 and its Aftermath, Science, 224, 1191–1198, https://doi.org/10.1126/science.224.4654.1191, 1984.
Tashilova, A. A., Kesheva, L. A., Teunova, N. V., and Taubekova, Z. A.: Analysis of temperature variability in the mountain regions of the North Caucasus in 1961–2013, Russ. Meteorol. Hydrol., 41, 601–609, https://doi.org/10.3103/S1068373916090028, 2016.
Tielidze, L. G., Svanadze, D., Gadrani, L., Asanidze, L., Wheate, R. D., and Hamilton†, G. S.: A 54 year record of changes at Chalaati and Zopkhito glaciers, Georgian Caucasus, observed from archival maps, satellite imagery, drone survey and ground-based investigation, Hungarian Geographical Bulletin, 69, 175–189, https://doi.org/10.15201/hungeobull.69.2.6, 2020.
Tielidze, L. G., Mackintosh, A. N., Gavashelishvili, A., Gadrani, L., Nadaraia, A., and Elashvili, M.: Post-Little Ice Age Equilibrium-Line Altitude and Temperature Changes in the Greater Caucasus Based on Small Glaciers, Remote Sens.-Basel, 17, 1486, https://doi.org/10.3390/rs17091486, 2025.
Toohey, M. and Sigl, M.: Volcanic stratospheric sulfur injections and aerosol optical depth from 500 BCE to 1900 CE, Earth Syst. Sci. Data, 9, 809–831, https://doi.org/10.5194/essd-9-809-2017, 2017.
Van den Bulcke, J., Wernersson, E. L. G., Dierick, M., Van Loo, D., Masschaele, B., Brabant, L., Boone, M. N., Van Hoorebeke, L., Haneca, K., Brun, A., Luengo Hendriks, C. L., and Van Acker, J.: 3D tree-ring analysis using helical X-ray tomography, Dendrochronologia, 32, 39–46, https://doi.org/10.1016/j.dendro.2013.07.001, 2014.
Van den Bulcke, J., Boone, M. A., Dhaene, J., Van Loo, D., Van Hoorebeke, L., Boone, M. N., Wyffels, F., Beeckman, H., Van Acker, J., and De Mil, T.: Advanced X-ray CT scanning can boost tree ring research for earth system sciences, Ann. Bot.-LONDON, 124, 837–847, https://doi.org/10.1093/aob/mcz126, 2019.
Verschuren, L.: UGent-Woodlab/XCT.read-R-function: V2, Zenodo, https://doi.org/10.5281/ZENODO.14654939, 2025a.
Verschuren, L.: UGent-Woodlab/XCT-toolchain-compiled: V2, Zenodo, https://doi.org/10.5281/ZENODO.14677732, 2025b.
Verschuren, L., Matskovsky, V., Boone, M. N., Van Hoorebeke, L., Van Acker, J., De Mil, T., Trouet, V., Pearson, C., De Bolle, J., Gheyle, T., and Van den Bulcke, J.: X-ray micro-CT pipeline for large-scale tree-ring densitometry studies, Dendrochronologia, 92, 126343, https://doi.org/10.1016/j.dendro.2025.126343, 2025.
Vlassenbroeck, J., Dierick, M., Masschaele, B., Cnudde, V., Van Hoorebeke, L., and Jacobs, P.: Software tools for quantification of X-ray microtomography at the UGCT, Nucl. Instrum. Meth. A, 580, 442–445, https://doi.org/10.1016/j.nima.2007.05.073, 2007.
Wanner, H., Pfister, C., and Neukom, R.: The variable European Little Ice Age, Quaternary Sci. Rev., 287, 107531, https://doi.org/10.1016/j.quascirev.2022.107531, 2022.
Wigley, T. M. L., Briffa, K. R., and Jones, P. D.: On the Average Value of Correlated Time Series, with Applications in Dendroclimatology and Hydrometeorology, J. Appl. Meteorol. Climatol., 23, 201–213, https://doi.org/10.1175/1520-0450(1984)023<0201:OTAVOC>2.0.CO;2, 1984.