the Creative Commons Attribution 4.0 License.
the Creative Commons Attribution 4.0 License.
 | 18 Mar 2026
Cryosphere and ocean variability in Kane Basin since the 18th century: insights from two marine multi-proxy records
Anna Bang Kvorning
Marie-Alexandrine Sicre
Gregor Luetzenburg
Sabine Schmidt
Thorbjørn Joest Andersen
Vincent Klein
Eleanor Georgiadis
Audrey Limoges
Jacques Giraudeau
Anders Anker Bjørk
Nicolaj Krog Larsen
Nares Strait, a marine gateway connecting the Arctic Ocean with northern Baffin Bay, is characterised by the formation of seasonal ice bridges between Canada and Greenland that prevent the southward export of multiyear sea ice. Recent observations indicate increasing instability in sea-ice formation particularly evident in Kane Basin, which either freezes over or remains open during winter and spring, depending on ice-bridge dynamics. Kane Basin is influenced by contrasting ocean currents in its eastern and western sides, as well as by the Humboldt Glacier, Greenland's widest marine-terminating glacier. Kane Basin is a critical region due to its pronounced sensitivity to cryospheric and oceanic changes. However, its long-term environmental history, particularly in the eastern sector, remains poorly constrained prior to the satellite era. Here, we present two multi-proxy sediment core records from opposite sides of Kane Basin, spanning the 18th century to the present, that we compare with Humboldt Glacier solid ice discharge and retreat since 1965 CE. Clear spatial differences are evident across the basin in terms of sediment delivery, primary productivity, and organic matter sources. Both records also reveal temporal changes, transitioning from cold sea-surface conditions with extensive sea-ice cover during the Little Ice Age (peaking around 1900 CE), towards more open and stratified waters, accompanied by a shift towards higher primary production from approximately 1950 CE to the present.
- Article
(4252 KB) - Full-text XML
- BibTeX
- EndNote


Global warming is driving changes in the cryosphere, including the impending disappearance of summer sea ice in the Arctic (Kim et al., 2023; Serreze and Stroeve, 2015; Stroeve et al., 2012). The Lincoln Sea, part of the Last Ice Area (Fol et al., 2025), contains old and thick multi-year sea ice that is projected to become the last refuge for perennial sea ice in the Arctic. However, accelerated loss of multi-year sea ice is now observed due to enhanced export through Nares Strait, a waterway separating Greenland from Ellesmere Island in Canada and connecting the Lincoln Sea in the Arctic Ocean to northern Baffin Bay (Moore et al., 2021).
The 530 km-long Nares Strait became an open conduit between 9000 and 8300 calibrated years before present (cal years BP), after the Greenland Ice Sheet and the Innuitian Ice Sheet separated (Georgiadis et al., 2018, 2020; Jennings et al., 2011). This led to the establishment of the modern ocean circulation in Baffin Bay and the Labrador Sea (Georgiadis et al., 2018, 2020; Jennings et al., 2011). Nares Strait serves as a dual gateway with distinct environmental conditions on the western and eastern sides (Joli et al., 2018). On the western side, a southward-flowing current from the Arctic Ocean carries nutrient-rich Pacific water, river discharge, local precipitation, and sea-ice melt in the upper 70–110 m, underlain by warm, saline waters of Atlantic origin (Kirillov et al., 2022; Melling et al., 2001). The two water masses differ in silicate and nitrate concentrations, with Pacific-origin water exhibiting higher levels of silicate and lower levels of nitrate than Atlantic-derived water. However, studies have found that in Kane Basin, topographic mixing over a sill promotes nutrient supply to the surface, contributing to enhanced regional productivity (Burgers et al., 2023). On the eastern side, the strait is bordered by several major marine-terminating glaciers, including Petermann Glacier and Humboldt Glacier, contributing with meltwater input. Humboldt Glacier is the widest outlet glacier in Greenland with a ca. 100 km-wide calving front. The glacier has been retreating at an accelerated pace and is projected to contribute 6.2–8.7 mm to global sea-level rise by 2100 CE under high-emission scenarios (Hillebrand et al., 2022). The retreat has mostly been attributed to ocean warming, leading to undercutting of the glacier (Rignot et al., 2019). Humboldt Glacier terminates in Kane Basin (Fig. 1), a 120 km-wide basin covering an area of 27 000 km2 (Fig. 1).
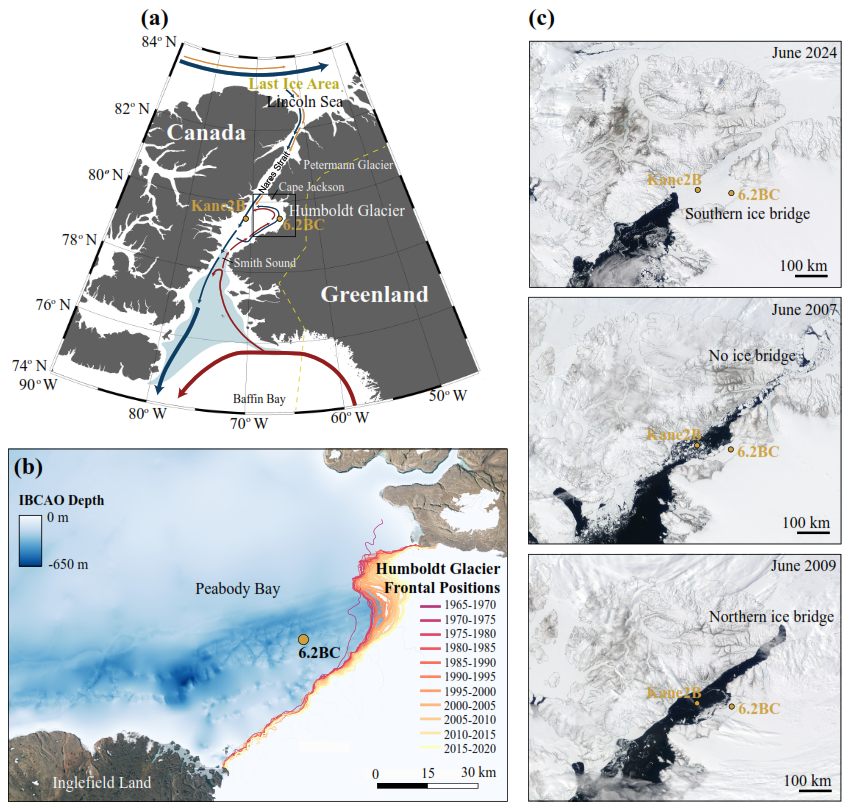
Figure 1(a) Map of the study region, illustrating ocean circulation patterns in Nares Strait, with the warm, saline West Greenland Current shown in red and the cold, fresher Baffin Current in blue. The locations of the two cores, AMD14-Kane2B-BC (Kane2B) and AMD19-6.2BC (6.2BC), are marked with yellow dots. The North Water Polynya extent in light blue is based on Inuit Circumpolar Council Pikialasorsuaq Commission (2017) and the Last Ice Area extent is shown by a grey dashed line based on Fol et al. (2025). (b) Enlarged view of Kane Basin in Nares Strait, including bathymetric data obtained from the International Bathymetric Chart of the Arctic Ocean (IBCAO), Version 5 (Jakobsson et al., 2024). Glacier frontal positions and centerline retreat rates for Humboldt Glacier were extracted from the TermPicks Version 2 dataset (Goliber et al., 2022). Terrestrial high-resolution optical satellite imagery is from the Sentinel 2 and SPOT 6/7 satellites provided by the Danish Agency for Climate Data (KDS, 2025). The data were plotted in QGIS version 3.4.3 using a polar stereographic projection centred on the North Pole (EPSG: 3413). (c) Examples of early June ice bridge configuration. We acknowledge the use of imagery from NASA Worldwide application (https://worldview.earthdata.nasa.gov, last access: 30 June 2025), part of the NASA Earth Science Data and Information System (ESDIS).
A cyclonic gyre in Kane Basin slows the southward drift of sea ice and icebergs through Nares Strait (Nutt, 1966). This circulation pattern, combined with the unique shape and bathymetry of Nares Strait, facilitates the formation of ice bridges. These ice bridges, typically forming between late October and early April, can persist until June or July (Vincent, 2019), and play a crucial role in regulating the southward export of freshwater and sea ice. Additionally, by blocking sea-ice movement, the bridges support the formation of the North Water (NOW) Polynya, known as Pikialasorsuaq (meaning “the great upwelling”) in Kalaallit Nunaat (Greenland) and Sarvarjuaq in Inuit Nunangat (Canada). This is the largest and most productive polynya in the Northern Hemisphere (Klein et al., 2002; Odate et al., 2002), supporting a diverse ecosystem including marine mammals and seabirds (Heide-Jørgensen et al., 2013).
Satellite imagery and remote sensing studies over the past three decades (1997 CE to present) have revealed a trend towards atypical sea-ice configurations in Nares Strait (Moore et al., 2021). Observations include a shorter duration of the ice bridges, more frequent formation of only the northern ice bridge, or even the complete absence of ice bridges (Moore et al., 2021; Vincent, 2019). The formation of ice bridges depends on factors such as cold air temperatures (below −15 °C), weaker tidal forces, cessation or reversal of prevailing north-westerly winds, ice thickness, and land-fast ice stability (Kirillov et al., 2021, 2022). A decline in ice-bridge formation and stability, by 2.1 d yr−1 between 1979 and 2019 CE (Vincent, 2019), has been linked to changes in ice thickness (Kirillov et al., 2021, 2022). Ice thickness, in turn, is most strongly correlated with winter wind speed and spring air temperature (Ren et al., 2022). These findings are supported by marine studies indicating increased polynya instability over the same approximately 40-year period (Koerner et al., 2021, 2025; Ribeiro et al., 2021).
Kane Basin occupies a pivotal position between the typical sites of formation of the northern and southern ice bridges. When the southern ice bridge forms in Smith Sound, Kane Basin is frozen-over, whereas it remains open when only the northern bridge is present (Fig. 1). Thus, increased marine productivity in the Basin indicates a prevalence of northern ice arch configuration. This makes Kane Basin a crucial site for observing broader changes in the Nares Strait region. Furthermore, the basin acts as a conduit between the Last Ice Area, the sensitive Pikialasorsuaq polynya, and the major marine-terminating Humboldt Glacier (Fig. 1). To gain insight into past local and regional changes, two marine sediment cores were retrieved from strategically chosen locations. Marine sediments deposited on the seafloor record information about the environmental conditions at the time of their deposition and therefore provide a valuable tool to explore past environmental changes beyond historical observations. The paleorecords used in our study span approximately 250 years and are integrated with 60 years of data on ice discharge and glacier frontal positions from historical and satellite imagery.
2.1 Sediment cores and geochronology
Box core AMD14-Kane2B-BC (hereafter Kane2B; coordinates: 79°31.140′ N, 70°53.287′ W; length: 32 cm; water depth: 220 m) and AMD19-6.2BC (hereafter 6.2BC; coordinates: 79°30.894′ N, 65°45.252′ W; length: 28 cm; water depth: 384 m) were retrieved aboard the Canadian icebreaker CCGS Amundsen in 2014 and 2019, respectively (Fig. 1). Sediment cores were subsampled at 1 cm resolution for Kane2B and 0.5 cm resolution for 6.2BC. The samples were weighed wet, freeze-dried and weighed again, and the profile of dry bulk density (DBD, g cm−3) og the entire core was calculated assuming a sediment density of 2.65 g cm−3. The samples analysed for lipid biomarkers were stored in sealed ziplock bags and kept frozen (−18 °C) until further processing. Age models were developed using 210Pb and 137Cs measurements performed at University of Copenhagen, Denmark (6.2BC) and University of Bordeaux, France (Kane2B). Measurements were conducted with a Canberra low-background well-type Ge-detector to determine 210Pb, 226Ra, the difference between which was used to calculate 210Pbxs, and 137Cs. The Mass accumulation rate (MAR, g cm−2 yr−1) was obtained for each core by applying the constant flux/constant sedimentation (CF_CS) model to the profile of 210Pbxs plotted against cumulative mass. Since the MARs were calculated using the slope of the exponential curve describing the 210Pbxs profiles, the MAR errors were determined using the standard error of this slope. The chronologies were obtained by dividing the cumulative mass of each core by the respective MAR and assuming that the topmost age of the core corresponds to the year of core retrieval; the errors on ages were calculated considering the error on MARs. The onset of 137Cs at about 7 cm in core Kane2B and at about 12 cm in core 6.2BC validates the age-depth relationship (Appendix Fig. A1). The age-depth model was further extrapolated to depths in the sediment cores beyond which 210Pbxs activities were detected, assuming constant MARs (Fig. 2). We examined each centimetre of both cores for calcareous material, such as foraminifera and shell fragments, however, none contained sufficient datable material to obtain reliable 14C measurements.
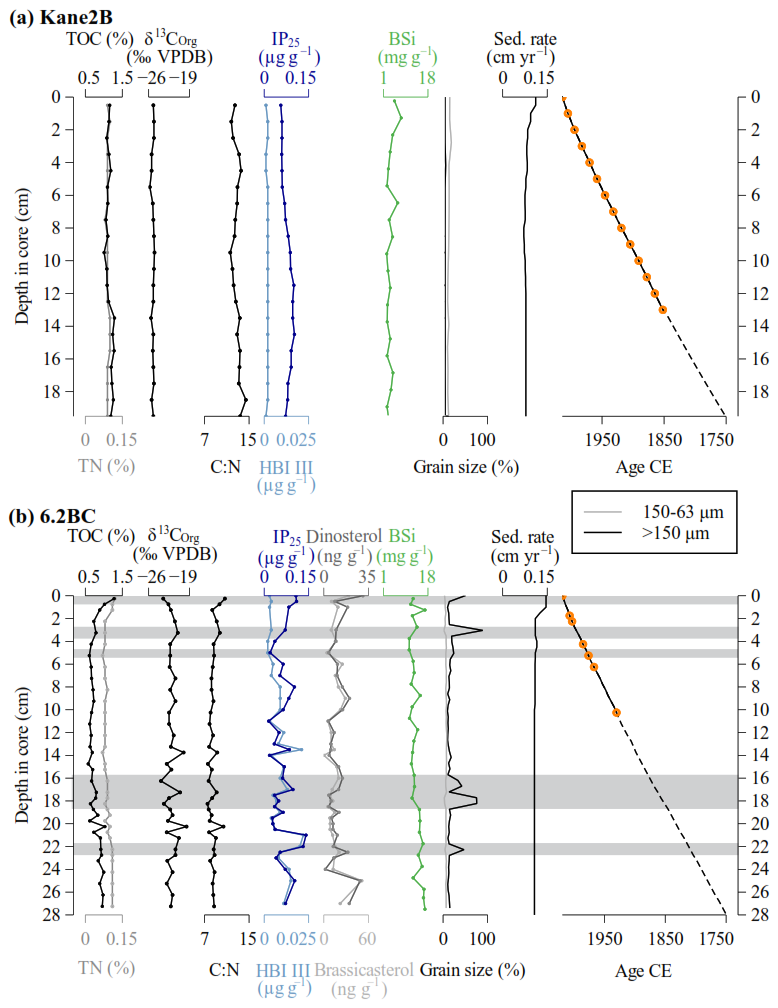
Figure 2Marine sediment records (a) Kane2B and (b) 6.2BC. From left to right: total organic carbon (TOC) and total nitrogen (TN) weight percentages, carbon stable isotope (δ13C) values (relative to VPDB), carbon-to-nitrogen ratio (C : N), concentration of lipid biomarker IP25 and HBI III, concentration of dinosterol and brassicasterol (exclusively for core 6.2BC (b)), biogenic silica (BSi) content, percentage of grain sizes > 63 µm, sedimentation rate, and age-depth model. The orange dots highlight the levels with detectable 210Pbxs activites, which were used to estimate the mass accumulation rates: the dashed lines indicate the layers for which the age models where extrapolated (see Sect. 3.1 for details). The grey bands highlight layers where grains larger than 150 µm (IRD) constitute at least 20 % of the sample.
Grain-size distribution analysis was conducted at the Geological Survey of Denmark and Greenland (GEUS), Denmark. Freeze-dried samples (ca. 2 g) were collected from Kane2B (1 cm resolution) and 6.2BC (0.5 cm resolution). These samples were wet-sieved to determine the percentage composition of clay and silt (< 63 µm), fine sand (63–150 µm), and coarse sand (> 150 µm).
2.2 Bulk biogeochemical analyses
Freeze-dried and homogenized samples (20–30 mg) from Kane2B (1 cm resolution) and 6.2BC (0.5–1 cm resolution) were analysed for total organic carbon (TOC), total nitrogen (TN), and the stable isotopic composition of the bulk organic matter (δ13C). The analytical precision was found based on replicate measurements of an in-house sediment standard. We found that it is better than 2 %–3 % (coefficient of variation) for TOC and TN, and ± 0.2 ‰ for δ13C. The detected values remain well above instrumental detection limits. TOC serves as an indicator of organic matter (OM) production, while stable isotope values (δ13C) are used to determine the origin of OM. These values help to distinguish between different OM sources: Arctic sea ice-derived organic carbon (−18.3 ‰ to −20.6 ‰) (Belt et al., 2008; Schubert and Calvert, 2001), marine organic carbon (−20 ‰ to −22 ‰ in mid to low latitude regions and −16.7 ‰ to −30.4 ‰ at high latitudes) (Kumar et al., 2016), and terrestrial organic carbon (−26 ‰ to −28 ‰) (Stein and Macdonald, 2004). The analyses were conducted at the Department of Geosciences and Natural Resource Management, University of Copenhagen, Denmark. To remove the inorganic carbon, the samples were treated with 10 % hydrochloric acid (HCl) prior to analysis. TOC, TN, and δ13C were measured simultaneously by Dumas combustion using an elemental analyzer coupled in continuous-flow mode to a Finnigan MAT Delta PLUS or Thermo Delta V Advantage isotope ratio mass spectrometer (Thermo Scientific, Bremen, Germany). Elemental concentrations were calibrated using acetanilide and soil reference materials, and the isotope ratio (δ13C) is reported relative to the VPDB (Vienna Peedee Belemnite) standard. This approach provides a more accurate determination of OM origin (Fig. 3) (Fernando et al., 2013; Lamb et al., 2006).

Figure 3(a) Biogenic silica (BSi) plotted against total organic carbon (TOC). (b) Origin of the organic matter is described by plotting δ13C against C : N ratio (Meyers, 1994). The blue dots show data from AMD14-Kane2B-BC and the red dots show data from AMD19-6.2BC. The sea-ice and terrestrial arrows are indicative of organic matter sources to the marine environment.
Biogenic silica (BSi) was used as an indicator of primary productivity from siliceous primary producers, mainly diatoms. Freeze-dried homogenized samples (30 ± 1 mg) from Kane2B (1 cm resolution) and 6.2BC (0.5 cm resolution) were analysed for BSi at GEUS, Denmark, following the procedure outlined by DeMaster (1991) on two replicates. The samples were leached with 40 mL of 1 % sodium carbonate (Na2CO3) in a warm water bath at 85 °C. Subsamples (1 mL) were collected after 3, 4 and 5 h and mixed with 9 mL of 0.021 M HCl (DeMaster, 1991). BSi concentrations were determined using the blue ammonium molybdate method on a Perkin Elmer lambda 25UV/VIS spectrophotometer (Mullin and Riley, 1955). The final BSi concentration was calculated using the average of the measurements, assuming complete dissolution of BSi after 2 h of extraction (Barão et al., 2015).
2.3 Lipid biomarkers
Sea-ice reconstructions are based on the identification and quantification of source-specific highly branched isoprenoids (HBIs) and sterol biomarkers. The mono-unsaturated HBI, IP25 (Ice Proxy with 25 carbon atoms), is produced by sea-ice dwelling diatoms of the Haslea and Pleurosigma genera (Belt, 2018; Belt et al., 2007; Belt and Müller, 2013; Brown et al., 2014). When detected in marine sediments, IP25 indicates seasonal sea-ice conditions. In contrast, the absence of IP25 in sediments suggests either permanent sea-ice cover or open water (year-round) (Belt et al., 2007; Belt and Müller, 2013). We combined IP25 with the tri-unsaturated HBI, HBI III. Studies of modern distribution of HBI III in the region show a positive correlation between IP25 and HBI III (Harning et al., 2023).This has been interpreted to indicate either that HBI III is associated with marginal ice zone conditions (e.g. Belt et al., 2015; Kolling et al., 2020; Bai et al., 2019), or that it is produced beneath the sea ice prior to, and concurrently with, IP25 (Amiraux et al., 2019). By combining the sympagic HBI with a pelagic biomarker such as brassicasterol or dinosterol, it becomes possible to distinguish between perennial sea ice and open water conditions (Müller et al., 2011). The assumption behind this approach is that open-water conditions promote higher pelagic productivity, leading to elevated concentrations of these phytosterols.
Freeze-dried and homogenized samples (4–5 g) from Kane2B (1 cm resolution) and 6.2BC (0.5–1 cm resolution) were analysed for HBIs and sterols at LOCEAN, Sorbonne University, France (Massé et al., 2008). Before extraction, the internal standard 7-hexylnonadecane (7-HND) was added to each sample (10 µL). We used cholestane as the external standard for sterol quantification. Lipid extraction was performed three times using a mixture of dichloromethane (DCM) and methanol (MeOH) mixture (2 : 1, ). For each extraction, respectively 6, 2 and 2 mL of solvent was added to the samples, which were then ultrasonicated for 10 min and centrifuged at 2500 rpm for 2 min. The resulting extracts were combined and evaporated under a slow stream of nitrogen until dryness. The HBIs and sterols were separated using silicagel (SiO2) column. Elution was performed with 2.5 mL n-hexane, 4 mL n-hexane/ethyl acetate (90 : 10 ), and 4 mL n-hexane/ethyl acetate (70 : 30 ). The fractions were then evaporated under a nitrogen stream until dryness. To complete derivatization, 50 µL bis-trimethylsilyl-trifluoroacetamide (BSTFA) was added to the sterol fraction and heated at 70 °C for 1 h. The HBI and sterol fractions were analyzed by gas chromatography coupled to mass spectrometry (GC-MS) using an Agilent Technologies 7693 GC coupled to an Agilent Technologies 5975C inert XL MS. For HBI GC-MS analyses, the GC oven temperature was programmed from 40 till 300 °C at a heating rate of 10 °C min−1 and maintained at final temperature for 10 min. For sterol GC-MS analyses, the temperature was programmed from 50 to 100 °C at 30 °C min−1, then to 150 °C at 1.5 °C min−1 and up to final temperature of 300 °C at 3 °C min−1, maintained for 20 min. For both IP25 and sterol analyses, we used a fused capillary column HP 5MS of 30 m long 0.25 mm i.d. and 0.25 µm film thickness. The response factor for IP25 was determined to 9.8 for record Kane2B and 32 for record 6.2BC, based on four replicates of 0.1 µg IP25 and 7-HND. Compounds were identified based on their individual retention time using reference compounds and their mass spectra (Belt et al., 2007, 2013). To account for changing sedimentation rates and other sedimentary processes the biomarker concentrations were normalized to TOC.
Biomarker extractions were not conducted at the same time; consequently, sterols were extracted only from 6.2BC, and therefore the following are restricted to this record. To estimate semi-quantitative sea-ice conditions, we calculated the PIP index using both sympagic and pelagic markers (Müller et al., 2011) using the following Eq. (1):
where c represents the ratio of the mean sympagic marker to the mean pelagic marker (Müller et al., 2011). In our analysis, we used IP25 as the sympagic marker, while brassicasterol (PbIP25) and dinosterol (PdIP25) served as the pelagic phytoplankton biomarkers.
2.4 Dinoflagellate cysts
Palynological processing of freeze-dried samples (ca. 2 g) from Kane2B (1 cm resolution) and 6.2BC (0.5–1 cm resolution) was conducted at Ghent University, Belgium, following the procedure described by Quaijtaal et al. (2014). One tablet of Lycopodium spores (batch no. 100320201), containing 14 285 ± 501 spores was added to each sample. The samples were treated sequentially with hydrochloric acid (2 M HCl) and hydrofluoric acid (40 % HF) at room temperature to remove carbonates and dissolve siliceous material, respectively. Between acid treatments, the samples were rinsed with deionized water, sonicated, sieved through a 10 µm nylon mesh, and gently centrifuged (Quaijtaal et al., 2014). After processing, the samples were mounted on microscope slides using glycerine jelly.
Palynological analyses were performed with an Olympus BX60 transmitted light microscope at magnifications of 400 × and 1000 ×. A minimum of 300 dinoflagellate cysts were counted per slide to ensure representative relative and absolute abundances. Furthermore, each slide was scanned for rare species. Other palynomorph groups, including acritarchs, pollen, copepod eggs, foraminiferal linings and the freshwater ciliate taxon Halodinium spp. were also counted.
2.5 Data analyses
A Principal Component Analysis (PCA) was performed on the relative abundance of dinoflagellate cysts to identify variance patterns in the dataset and reduce its dimensionality. The relative abundances were transformed using a Hellinger transformation (Legendre and Gallagher, 2001), to downweight dominant taxa and minimize the influence of double zeros, making the data more suitable for analysis with statistical models such as generalized additive models (GAMs). PCA was carried out in R (R Core Team, 2021) using the Community Ecology (vegan) package (Oksanen et al., 2022). To capture basin-wide changes in Kane Basin and account for differences in the sedimentation rates of the two sites, the samples were grouped into 50-year intervals, except for the uppermost part, which covers the 14-year period from 2000 to 2014.
To detect trends across the different datasets, GAMs were applied (Hastie, 1990). GAMs are well-suited for time series with unevenly spaced data points (Simpson, 2018). The analysis was conducted in R (R Core Team, 2021) using the Mixed GAM Computation Vehicle with Automatic Smoothness Estimation (mgcv) package (Wood, 2011). The smoothing parameters were estimated using Restricted Maximum Likelihood (REML). Model performance was evaluated through effective degrees of freedom and residual dignostics to ensure appropriate smoothness. The smoothing functions were parameterized using thin plate regression splines, with the number of basis functions (k) varying based on the GAMs performance. When selecting a k, we aimed to balance flexibility while preventing overfitting, with the values ranging from 3 to 8.
3.1 Sediment cores and geochronology
In both records, 210Pbxs profiles present the classical exponential decrease with depth, and reach almost supported levels at about 10–15 cm (Fig. A1), suggesting a low sedimentation rate (< 0.1 cm yr−1). For the marine sediment core Kane2B located farthest from the Humboldt Glacier in the central Kane Basin, extrapolation of the 210Pb-based chronology suggests that the Kane2B record could cover approximately the last 500 years; however, given the large uncertainty associated with simple extrapolation, our focus here is on the period from ca. 1750 CE to the present. During this time, sedimentation rates ranged from 0.07 to 0.11 cm yr−1, resulting in an average sample resolution of ca. 13 years (Fig. 2a). By comparison, the 6.2BC core, retrieved closer to the Humboldt Glacier, covers the period from 1750 CE to the present. Sedimentation rates for this core range from 0.11 to 0.15 cm yr−1, providing an average temporal resolution of ca. 10 years (Fig. 2b). We note that the age-depth models are weakly constrained before 1850 CE, because it is beyond the age limit that can reliably be dated with 210Pb, and because it was not possible to recover sufficient material for radiocarbon dating.
The Kane2B core varies largely in composition, with discrete samples containing 84 %–93 % clay and silt, 7 %–16 % fine sand, and 0 %–2 % coarse sand (Fig. 2a). In comparison, the 6.2BC core samples are composed of 10 %–88 % clay and silt, 1 %–7 % fine sand, and 9 %–89 % coarse sand (Fig. 2b). Icebergs can transport grains of all sizes, but those larger than 150 µm (coarse sand) are almost exclusively iceberg borne. Therefore, we define grains larger than 150 µm as ice rafted debris (IRD). IRD are present in both cores, but in considerably larger amounts in 6.2BC. In 6.2BC, distinct IRD layers where grains larger than 150 µm make up at least 20 % are found at 22–22.5 cm (1762 CE), 17.5–18.5 cm (1818–1812 CE), 16–17 cm (1837–1839 CE), 4.5–5.5 cm (1984–1980 CE), 3–3.5 cm (2006 CE), and 0–0.5 (2019 CE) (Fig. 2b).
3.2 Bulk biogeochemical analyses
The TOC content in Kane2B ranges from 1.06 % to 1.29 % (average 1.12 ± 0.07 %), while in 6.2BC, values range from 0.58 % to 1.28 % (average 0.79 ± 0.16 %). TN varies between 0.08 % and 0.10 % (average 0.09 ± 0.00 %) in Kane2B and between 0.07 % and 0.12 % (average 0.09 ± 0.01 %) in 6.2BC. The δ13C values in Kane2B range from −25.8 ‰ to −25 ‰ (average −25.29 ± 0.025 ‰), while in 6.2BC, δ13C values range from −23.9 ‰ to −19.5 ‰ (average −22.05 ± 0.94 ‰). Kane2B is isotopically lighter than 6.2BC, which could indicate either enhanced open-water productivity at Kane2B compared to more sea-ice-associated productivity at 6.2BC, or a higher contribution of terrestrial OM to the Kane2B site. To further evaluate this, we combined the δ13C values with the C : N ratio (Meyers, 1994) (Fig. 3). In Kane2B, the C : N ratio ranges from 11.6 to 13.6, while in 6.2BC, it ranges from 7.5 to 10.7. In the Kane2B record, BSi concentrations ranged from 2.03 to 7.50 mg g−1 dry mass (average 3.44 ± 1.35 mg g−1) (Fig. 2a), while in the 6.2BC record, they range from 10.84 to 16.86 mg g−1 dry mass (mean 13.45 ± 1.92 mg g−1) (Fig. 2b).
3.3 Lipid biomarkers
In the Kane2B record, the IP25 concentrations vary between 0.06 and 0.10 µg g−1 sed (average 0.08 ± 0.02 µg g−1 sed), and in the 6.2BC core between 0.02 and 0.14 µg g−1 sed (average 0.06 ± 0.03 µg g−1 sed). When normalized to TOC, the IP25 concentrations in Kane2B range from 4.83 to 9.18 µg g−1 TOC (average 6.73 ± 1.32 µg g−1 TOC), while in the 6.2BC record, concentrations range from 2.45 to 15.47 µg g−1 TOC (average 8.00 ± 3.51 µg g−1 TOC). In the Kane2B record, the HBI III concentrations vary between 0.001 and 0.002 µg g−1 sed (average 0.002 ± 0.000 µg g−1 sed), and between 0.002 and 0.022 µg g−1 sed (average 0.008 ± 0.005 µg g−1 sed) in 6.2BC. When normalized to TOC the HBI III concentrations in record Kane2B range from 0.086 to 0.203 µg g−1 TOC (average 0.155 ± 0.033 µg g−1 TOC), while in 6.2BC, concentrations range from 0.230 to 2.986 µg g−1 TOC (average 1.064 ± 0.648 µg−1 TOC). Analyses of the pelagic markers brassicasterol and dinosterol were only conducted for record 6.2BC. The concentration of brassicasterol varies between 0.06 and 51.18 ng g−1 sed (average 15.37 ± 9.64 ng g−1) and between 1.11 and 30.72 ng g−1 sed (average 10.83 ± 6.97 ng g−1 sed) for dinosterol. When normalized to TOC, brassicasterol varies between 0.01 and 5.72 µg g−1 TOC (average 1.9 ± 1.13 µg g−1 TOC) and dinosterol between 0.11 and 3.18 µg g−1 TOC (average 1.36 ± 0.72 µg g−1 TOC).
3.4 Dinoflagellate cysts
Dinoflagellate cysts are a useful proxy for sea-surface conditions. In the Kane2B record, dinoflagellate cyst concentrations range from 2851 to 5879 cysts g−1 (average 4236 ± 849 cysts g−1), while in the 6.2BC record, concentrations range from 1434 to 6699 cysts g−1 (average 2996 ± 1406.5 cysts g−1) (Appendix Fig. A2). A total of 13 and 12 different dinoflagellate cyst taxa were identified in Kane2B and 6.2BC, respectively (Appendix Figs. A3 and A4). The assemblages in both records are dominated by heterotrophic dinoflagellate cysts, accounting for at least 94 % of the total assemblage in record Kane2B and 93 % in record 6.2BC. The most abundant species in both records are Brigantedinium spp. (Bspp), Islandinium minutum subsp. minutum (Imin), Echinidinium karaense (Ekar) and Islandinium? cezare/cyst of Protoperidinium tricingulatim (Icez). Notably, there is an increase in phototrophic/mixotrophic species in both records, towards present day. Additionally, Spiniferites ramosus (Sram) was only detected in Kane2B.
The PCA performed on the relative abundance of dinoflagellate cysts in both records shows that axis 1 explains approximately 71 % of the data variance (eigenvalue of 0.02), while axis 2 accounts for around 13 % (eigenvalue of 0.003) (Fig. 4). The PCA results reveal that sample intervals from 1950–2000 and 2000–2014 CE cluster together with most phototrophic/mixotrophic species, such as Operculodinium centrocarpum (Ocen), Pentapharsodinium dalei (Pdal), Biecheleria spp. (Biec) and Spiniferites elongatus s.l. (Selo). Cysts of Pentapharsodinium dalei (Pdal) and Biecheleria spp. (Biec) are associated with high stratification and increased freshwater input (Fig. 4). Notably, Biecheleria spp. (Biec) was not detected in a record from the central Kane Basin spanning the past 9000 cal years BP (Caron et al., 2019). Spiniferites elongatus s.l. is closely associated with the sample interval 2000–2014 CE. This taxon thrives in eutrophic settings, such as the North Atlantic frontal system, indicating that enhanced water stratification in Kane Basin during this period may have facilitated its growth. The heterotrophic taxon Brigantedinium spp. (Bspp) also clusters with these samples, suggesting a rise in productivity from 1950 CE to the present. The presence of cysts of P. glacialis (Pgla) could reflect improved preservation or an increase in seasonal sea-ice productivity (i.e. a longer open-water season). This statistically supported grouping underlines a shift in sea-surface conditions beginning around 1950 CE.
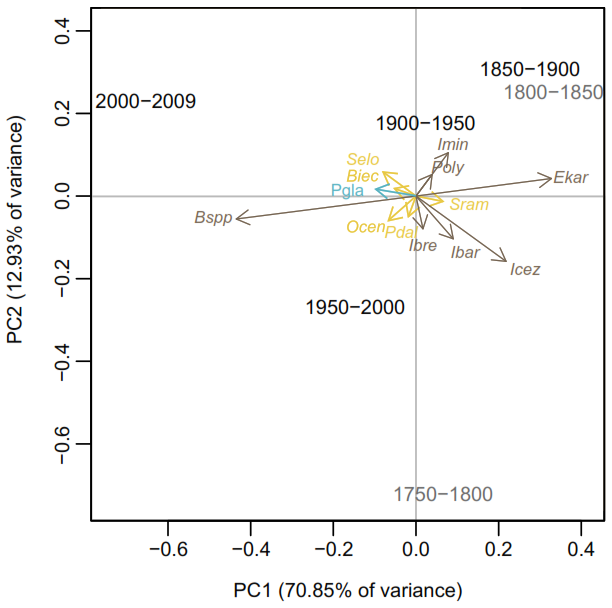
Figure 4Principal Component Analysis (PCA) of the dinoflagellate cyst assemblage data for both records grouped into 50-year intervals. The intervals < 1850 CE are plotted in grey to reflect the lower confidence in age estimation for the older parts of the cores. Brigantedinium spp. (Bspp), Operculodinium centrocarpum (Ocen), cyst of Pentapharsodinium dalei (Pdal), Islandinium brevispinosum (Ibrev), Islandinium minutum subsp. barbatum (Ibar), Islandinium? cezare/cyst of Protoperidinium tricingulatim (Icez), Spiniferites ramosus var. ramosus (Sram), Echinidinium karaense (Ekar), Islandinium minutum subsp. minutum (Imin), cyst of Polykrikos? sp. of Kunz-Pirrung (1998) – Arctic morphotype (Poly), Spiniferites elongatus s.l. (Selo), cyst of Biecheleria spp. (Biec), cyst of Pentapharsodinium dalei (Pdal). Heterotrophic taxa are shown in black, phototrophic/mixotrophic taxa in yellow, and the sea-ice indicator Polarella glacialis (Pgla) in blue.
4.1 Spatial differences between the sites
The two marine sediment cores collected in Kane Basin reveal significant spatial differences. The Kane2B core, retrieved from the central part of Kane Basin at 220 m water-depth, has a lower sedimentation rate, resulting in an average temporal resolution of 13 years. The 6.2BC core, collected at 384 m water-depth from the eastern side of the basin, in close proximity to the Humboldt Glacier, has a higher sedimentation rate, resulting in an average temporal resolution of 10 years. Furthermore, the 6.2BC record contains multiple layers of IRD where at least 20 % of the total sample consists of grains > 150 µm, indicating periods of strong iceberg activity (Fig. 2b). In contrast, such IRD layers are absent from the Kane2B record.
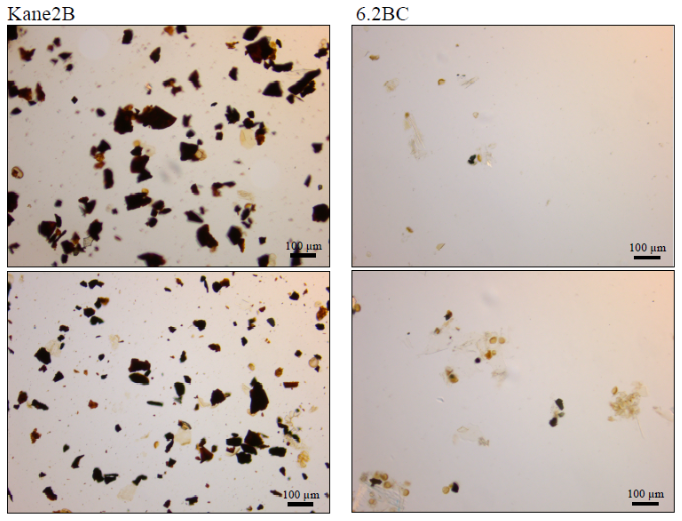
Figure 5Visual comparison of micro charcoal fragment abundance between the two sites. Slides from Kane2B (left site) show a consistently high concentration of coal fragments throughout the record, in contrast to rare occurrences in record 6.2BC (right site).
A clear spatial difference in primary production indicators is also observed between the two sites (Fig. 3a). The TOC content ranges from 1.06 % to 1.29 % in Kane2B and from 0.58 % to 1.28 % in 6.2BC. A study of surface sediments from Petermann Fjord, Hall Basin, northern Kennedy Channel, and southern Robeson Channel reports TOC values between 0.09 % and 0.23 %, with the highest values linked to sites with mobile sea ice (Jennings et al., 2020). Thus, the elevated TOC values in Kane Basin may indicate more mobile sea ice compared to sites further north of Kane Basin. To further investigate the origin of TOC, we plotted δ13C values against the C : N ratio to get additional insights into the composition and source of the organic material (Fig. 3b). We observe a clear difference in the OM signatures between the two sites. The isotopic signal in 6.2BC may be explained by a greater contribution of autochthonous OM produced within sea ice (−18.3 ‰ to −20.6 ‰) (Belt et al., 2008; Schubert and Calvert, 2001), whereas the lighter isotopic signal in Kane2B suggests a higher contribution of terrestrial OM. This interpretation is corroborated by the C : N ratio. Kane2B has an average C : N of 12.55, higher than the C : N ratio of 8.6 for core 6.2BC. Furthermore, the presence of micro charcoal fragments in the dinoflagellate cyst slides from Kane2B (Fig. 5) is a strong indication that the site is influenced by the coal-bearing Paleogene sequences along the western coast of Nares Strait (e.g., Miall, 1982). This observation was also made for the longer gravity core Kane2B, which was retrieved from the same site (Georgiadis et al., 2018).
Higher biogenic silica concentrations in core 6.2BC compared to Kane2B, could reflect several processes. (1) Hydrodynamic conditions: diatom settling on the seafloor may be disrupted by strong wind and ocean currents flowing through the main channel of Nares Strait (Moore et al., 2021). The more sheltered location of 6.2BC is less affected by these currents, allowing a higher proportion of diatoms to settle. (2) Nutrient availability: The eastern sector of the basin is under a greater influence of glacial meltwater, which may contribute to enhanced nutrient availability. Studies have shown that pro-glacial upwelling taking place in front of marine-terminating glaciers can increase nutrient supply, thereby fuelling primary production (Meire et al., 2017). It is possible that this mechanism also occurs near Humboldt Glacier, where meltwater is likely charged in nutrients from glacial erosion, and that upwelling triggered by subglacial freshwater discharge potentially entrails additional nutrient-rich ambient fjord bottom water on its way up to the surface. It should also be considered that if such a mechanism is operating, the upwelled water may include nutrient-rich Baffin Bay water originating from the polynya, transported northward. Furthermore, recent observations indicate the presence of a polynya near Cape Jackson in the northern Kane Basin (Fig. 1a) (Kirillov et al., 2022), which may also contribute nutrient-rich waters to the region. (3) Oceanographic feature differences: in Kane Basin, ocean cyclonic circulation is characterised by a southward flow along the western coast, originating from the Lincoln Sea. This flow comprises Pacific Water in the upper 100–150 m, underlain by a warmer layer associated with Atlantic Water entering through the Arctic Ocean. On the eastern side, relatively warm Atlantic Water flows northward from Baffin Bay (Fig. 1a). One branch of this flow recirculates and merges with the southward-flowing current, while the other continues northward. Additionally, a cyclonic gyre in Peabody Bay influences local circulation patterns (Fig. 1) (Kirillov et al., 2022). The eastern side of Kane Basin is therefore more influenced by warmer nutrient-rich Atlantic water, potentially stimulating primary productivity at site 6.2BC.
South of Kane Basin in Baffin Bay, the eastern side of the bay exhibited both higher overall dinoflagellate cyst concentrations and a larger proportion of phototrophic/mixotrophic species compared to the western side (Koerner et al., 2025). This pattern was attributed to the influence of Atlantic-derived waters, supported by the high abundance of Operculodinium centrocarpum (e.g., de Vernal et al., 2020). While our record may reflect a similar trend of enhanced primary productivity in the eastern side, we do not observe a comparable high abundance of Operculodinium centrocarpum.

Figure 6Estimated retreat of the Humboldt glacier since 1965 and solid ice discharge (Mouginot et al., 2019), compared with IRD layers found in the 6.2BC sediment core. The centerline retreat of Humboldt Glacier has been calculated in kilometres based on the systematically mapped front positions from 1965 CE (Goliber et al., 2022). For years with multiple frontal observations, we calculated the annual mean change rate. The dark grey bands highlight layers where grains larger than 150 µm constitute at least 20 % of the sample, with the age uncertainties shown in light grey derived from 210Pb chronology and corresponding to layers within the well-constrained part of the sediment record.
4.2 Glacier dynamics and ice-rafted debris
In the marine sediment record 6.2BC, near Humboldt Glacier, multiple IRD layers were identified based on grain size analyses. The three most recent layers correspond to the periods 1976–1980 ± 7.6 years, 1994 ± 4.8 years, and 2017 ± 0.4 years CE, enabling a direct comparison between IRD deposition, historical glacier front positions (Goliber et al., 2022) and solid iceberg discharge (Mouginot et al., 2019) (Fig. 6). The position of the Humboldt Glacier front has been systematically mapped from aerial photos and historical and modern satellite images since 1965 CE (Goliber et al., 2022). This was done by manually tracing the ice-ocean boundary. The Humboldt Glacier is a vast and wide outlet glacier, with two distinct zones exhibiting different calving margin behaviours. The southern zone lies on a relatively high elevation bed and is characterized by low flow speeds and minimal variability throughout the 20th century. In contrast, the most northern sector is situated over a deep subglacial trough, where flow velocities and retreat rates are high and have accelerated over the study period. Although there is some temporal overlap between the significant retreat around 1970 CE and an IRD layer dated to 1976–1980 ± 7.6 years (Fig. 6), the age-model uncertainty is considerable. However, a clear correspondence is observed between the peak iceberg discharges and the two most recent IRD layers (Fig. 6).
4.3 Temporal trends in sea-ice conditions and primary productivity
In the Kane2B record, elevated concentrations of IP25 and HBI III, alongside high abundances of Islandinium minutum subsp. minutum, are observed between approximately 1750 and 1900 CE, reaching a maximum around 1900 CE. Islandinium minutum subsp. minutum is found in cold environments and can tolerate sea ice (e.g., Head et al., 2001) (Fig. 7). These cold conditions reconstructed in our record coincide with the Little Ice Age (Kjær et al., 2022). This period experienced the last maximum ice-sheet advance at 1900 CE associated with lower air temperatures and ocean surface cooling (Kjær et al., 2022). Our findings further support the notion that temperatures were colder and sea-ice cover more extensive, reaching a peak around 1875–1900 CE. GAMs indicate a declining trend between 1875 and 1900 CE to the present, however, the GAMs model does not reflect the high abundance of Islandinium minutum subsp. minutum in the uppermost sample, where its relative abundance exceeds 70 %, a level comparable to peaking Little Ice Age conditions (Fig. 7). This finding strongly indicates cold sea-surface conditions today, possibly driven by enhanced freshwater input. Cysts of the dinoflagellate Polarella glacialis appear around 1990 CE and persist until present. This species is considered a sea-ice indicator, commonly detected in first-year sea ice, and its cysts are deposited on the seabed following sea-ice melt (e.g., Harðardóttir et al., 2024; Stoecker et al., 2000). This finding is also consistent with enhanced HBI III values reflecting sea-ice edge conditions (Jalali et al., 2024). An increase in Polarella glacialis was also observed in the records from northern Baffin Bay starting around 1970 CE (Koerner et al., 2025). The presence of the cysts indicates improved preservation and/or an increase in first-year sea ice relative to multi-year ice.
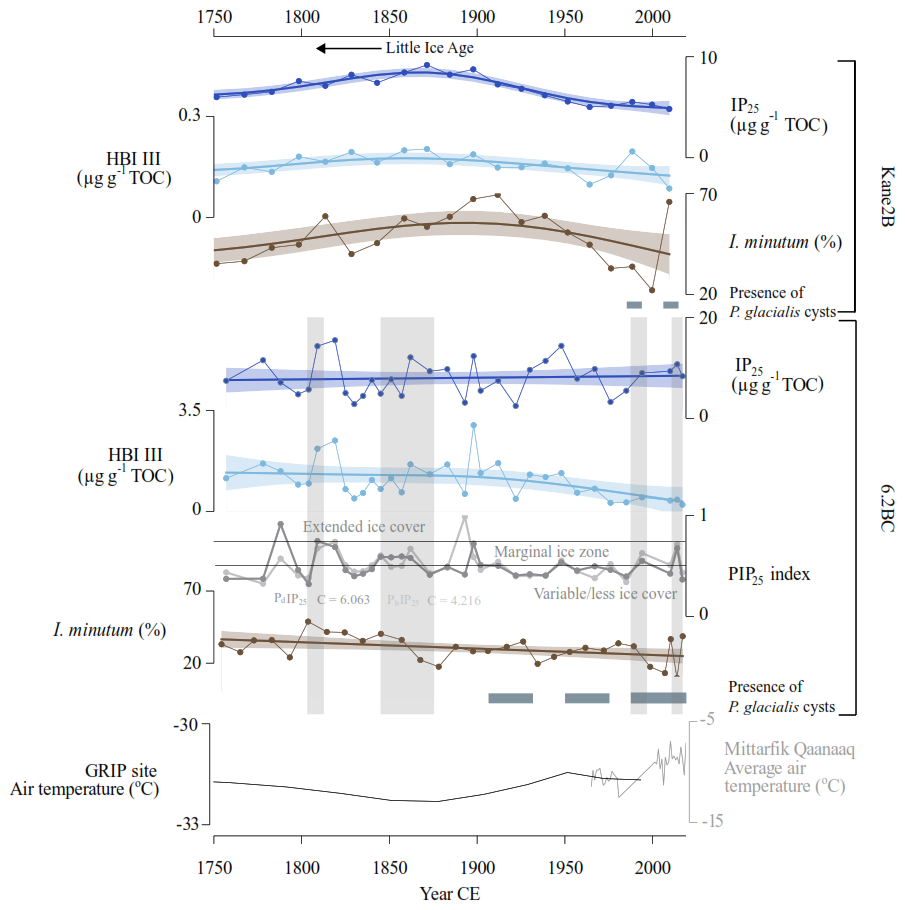
Figure 7Inferred sea-ice conditions for the Kane2B record (top) and 6.2BC record (bottom) based on IP25, HBI III, the abundance of Islandinium minutum subsp. minutum, and the occurrence of Polarella glacialis cysts represented by horizontal grey bands. For the 6.2BC record, the PIP25 index is calculated using brassicasterol (PBIP25, shown in light grey, and with c = 4.216) and dinosterol (PDIP25, shown in dark grey, and with c = 6.063). PIP25-based sea-ice conditions are derived from Müller et al. (2011). The bottom panel displays air temperature data from the GRIP ice core record in black (Dahl-Jensen et al., 1998) and the Mittarfik Qaanaaq weather station in grey (data from the Danish Meteorological Institute (dmi.dk)). Vertical grey bands highlight layers where grains larger than 150 µm constitute at least 20 % of the sediment core. The Little Ice Age (LIA) period is indicated by an arrow.
In core 6.2BC, the concentrations of IP25, HBI III and Islandinium minutum subsp. minutum exhibit minimal fluctuations. However, GAMs indicate an overall decreasing trend in HBI III and Islandinium minutum subsp. minutum toward the present, a pattern supported by the PIP25 index. The PIP25 index was calculated for core 6.2BC, that was analysed for the pelagic phytosterols brassicasterol (PbIP25) and dinosterol (PdIP25) (Fig. 7). Surface samples from the region have shown that the PIP25,-index broady correlates with spring and autumn sea-ice conditions (Harning et al., 2023; Koerner et al., 2021); however, some phytosterols can derive from multiple sources, including sea ice-associated algae (Belt, 2018; Belt and Müller, 2013), thus these should be considered as reflecting general marine productivity (Köseoğlu et al., 2019). The PIP25 shows a similar trend when calculated using either of the two pelagic phytosterols, with a transition around 1900 CE to a more variable sea-ice cover (Fig. 7) (Müller et al., 2011). Additionally, cysts of the dinoflagellate Polarella glacialis appear in the record from approximately 1910 CE to the present. Combined, these findings suggest a shift from semi-permanent ice cover to a seasonal and less extensive sea-ice cover, occurring earlier in the eastern part of Kane Basin than in the central region.

Figure 8Primary production panel for the Kane2B record (top) and 6.2BC record (bottom) based on biogenic silica (BSi), dinoflagellate cyst concentrations, and the abundance of phototrophic/mixotrophic species. For the 6.2BC record, additional data include the pelagic biomarkers brassicasterol and dinosterol, as well as total organic carbon (TOC). Dinoflagellate cyst assemblages are represented as pie charts, showing the relative average abundances for the periods 1750–1900 and 1900 CE to the present. Grey bands highlight layers where grains > 150 µm constitute at least 20 % of the sediment. The Little Ice Age extent is indicated by an arrow.
Primary productivity reconstructions are based on biogenic silica (BSi), dinoflagellate cyst concentrations, the abundance of phototrophic/mixotrophic species (as indicative of improved light availability) and δ13C against C : N ratio (Fig. 3b), which we have demonstrated to be mainly of marine origin. For record 6.2BC we also include the pelagic biomarkers brassicasterol and dinosterol (Fig. 8). To further evaluate the composition and structure of the dinoflagellate cyst assemblages, these are shown as pie charts, displaying the average abundances for the periods 1750–1900 and 1900 CE to the present (Fig. 8).
In the Kane2B core, BSi increases toward present, while the dinoflagellate cyst concentrations decrease. The rising BSi values could be attributed to (1) weaker currents, resulting in reduced southward export, (2) increased BSi production in the Arctic Ocean leading to higher concentrations transported by southward-flowing currents, or (3) a shift in the primary producer composition around 1900 CE, indicating an environmental transition from conditions favouring dinoflagellate to those more supportive of diatom productivity. Furthermore, an examination of the cyst assemblage reveals a slight increase in both Brigantedinium spp. and phototrophic/mixotrophic species, suggesting enhanced primary productivity and light availability, respectively.
In core 6.2BC, the GAMs reveal a decreasing trend in BSi toward present; however, the model smoothed the high values from around 1980–2000 CE until present. The dinoflagellate cyst concentrations and TOC both show a decline until approximately 1900 CE, followed by an increase toward the present. Dinosterol and brassicasterol exhibit the same trend, a slight decrease until around 1850 CE, after which they increase toward the present. Furthermore, the cyst assemblage reveals an increase in both Brigantedinium spp. and phototrophic/mixotrophic species, as observed for the Kane2B record. However, the increase in Brigantedinium spp. abundance is more pronounced in 6.2BC. Enhanced productivity and a shift toward phototrophic/mixotrophic species relative to heterotrophic ones has also been observed in northern Baffin Bay (Koerner et al., 2025). Like our records, these authors found an increase in cysts of Pentapharsodinium dalei, a species associated with enhanced stratification (Heikkilä et al., 2014).
4.4 Indicator region for a future Nares Strait
Our records show a clear shift around 1950 CE, marked by increased primary production and a change in the dinoflagellate cyst assemblage composition toward more phototrophic/mixotrophic species. Furthermore, we observe a rise in taxa indicative of enhanced stratification and increased freshwater input. We attribute these changes to (1) intensified local freshwater runoff from the Humboldt Glacier and/or (2) a higher frequency of failed ice bridge formation, facilitating a greater freshwater export through Nares Strait, contributing to summer surface freshening. Observational data from the past three decades (1997 CE–present) reveal an atypical ice configuration in Nares Strait (Moore et al., 2021), including shorter ice bridge duration, more frequent formation of only the northern ice bridge, or even the complete absence of an ice bridge (Moore et al., 2021; Vincent, 2019). An increasing trend toward the exclusive northern ice bridge limits the export of drift ice through Nares Strait, leading to more open-water conditions in Kane Basin and stronger influence from North Atlantic waters coming from the south. A previous study suggests that the persistence of the northern ice bridge therefore promotes enhanced primary productivity in the region (Georgiadis et al., 2020). Based on this, we interpret the observed rise in primary production and changes in dinoflagellate cyst assemblages as a response to more frequent open-water conditions in Kane Basin. However, differences between the two core sites are likely explained by local factors linked to subglacial discharge triggering upwelling and thus sustaining higher productivity. A modelling study of Nares Strait projecting sea ice and hydrographic conditions from 1952 to 2080 CE predicted a decline in sea-ice cover and a fresher sea surface (Rasmussen et al., 2011). Our long-term observations indicate that these changes were already underway by ca. 1950 CE.
Our results highlight the importance of paleo-records for assessing the time of emergence and sensitivity of these mechanisms to warming and for evaluating the subsequent hydrological and primary production changes important to ecosystem services. The presence of ice-bridges in Nares Strait plays an essential role in maintaining the highly productive North Water Polynya, a climate sensitive ecosystem (Ribeiro et al., 2021), and satellite data indicate a potential decline in its productivity (Marchese et al., 2017). This raises the possibility that areas of open water supporting higher productivity may extend northward, a trend also seen for higher trophic levels over the Holocene (Schreiber et al., 2025). A long-term study covering periods where both ice bridges were lacking has shown that the configuration led to increased drift-ice export through Nares Strait and a subsequent decline in primary production (Georgiadis et al., 2020). This supports the notion that the recent increase in productivity observed in Kane Basin is associated with the presence of the northern ice bridge.
We analysed two marine sediment records spanning approximately 250 years from two locations within Kane Basin to distinguish between local and regional changes. The two sediment cores from Kane Basin show clear spatial differences. The eastern site near Humboldt Glacier records repeated IRD layers, a stronger marine organic matter signature, and generally higher productivity. This likely reflects its proximity to glacial meltwater input, subglacial discharge, and nutrient supply. In contrast, the central basin site (Kane2B) shows a stronger terrestrial signal and no distinct IRD layers, pointing to different circulation patterns and sediment sources within the basin.
Both records capture colder, more extensive sea-ice conditions during the Little Ice Age (∼ 1750–1900 CE). After ∼ 1900 CE, they show a shift toward more seasonal and variable sea ice, with this transition occurring earlier and more clearly on the eastern side. Around 1950 CE, both sites register a more pronounced change: increasing primary production, a shift toward more phototrophic/mixotrophic dinoflagellate species, and signals of enhanced stratification and freshwater input. We interpret this as a response to intensified glacial melt and changing ice-bridge dynamics in Nares Strait. Our results suggest that the reorganization of sea-ice and productivity patterns began by the mid-20th century, before the most rapid phase of recent Arctic warming.
Overall, Kane Basin emerges as a sensitive indicator region for future change in Nares Strait. Because this gateway controls ice and freshwater exchange between the Arctic Ocean and northern Baffin Bay, continued shifts in glacier dynamics and sea-ice configuration are likely to have wider impacts on regional circulation and marine ecosystems. These high-resolution records provide important long-term context for understanding how this system responds to ongoing warming.
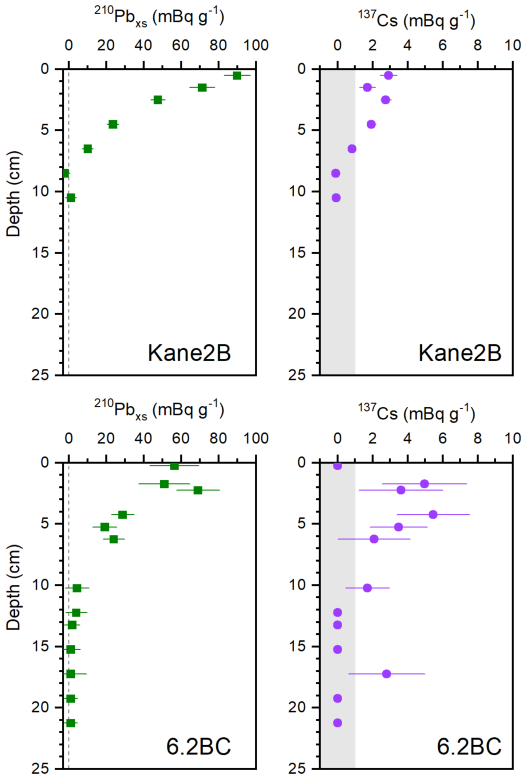
Figure A1Profiles of 210Pbxs and of 137Cs with depth in cores Kane2B and 6.2BC. The grey area indicates 137Cs values that are not significant.

Figure A2Relative abundance (%) of dinoflagellate cyst taxa and cyst concentration (cysts g−1) in record AMD14-Kane2B and AMD19-6.2BC. The autotrophic/mixotrophic species are shown in yellow and the heterotrophic dinoflagellate species in brown.

Figure A3Dinoflagellate cyst plate from Kane2B. 1–6: high to low focus of Brigantedinium simplex with slightly granular surface. 1–3: Specimen with loosely attached operculum still in place. 7–9: high to low focus of Islandinium minutum subsp. minutum. 10–12: high to low focus of Islandinium minutum subsp. barbatum. Scale bar: 10 µm.

Figure A4Dinoflagellate cyst plate from Kane2B. 1–3: high to low focus of Echinidinium karaense, arrows indicate the expanded and flared tip of some of the processes. 4–5: high to low focus of Islandinium? cezare. 7–9: high to low focus of Polarella glacialis cysts. Scale bar: 10 µm.
All the proxy data presented in the manuscript are available on the public data repository GEUS Dataverse (https://doi.org/10.22008/FK2/WT7P1E, Kvorning, 2026).
A.B.K. wrote the manuscript and generated all figures with input from all co-authors. S.R. conceived the study and provided extensive feedback and comments on the manuscript. M.-A.S. provided expert knowledge on biomarkers, G.L. helped generating parts of the figures. S.S. and T.J.A. helped generating the age-depth models. E.G., A.L., and J.G. contributed with expert knowledge on the area. A.A.B. and N.K.L. provided terrestrial context to the interpretations. All co-authors commented on the manuscript and approved its content.
The contact author has declared that none of the authors has any competing interests.
Publisher's note: Copernicus Publications remains neutral with regard to jurisdictional claims made in the text, published maps, institutional affiliations, or any other geographical representation in this paper. The authors bear the ultimate responsibility for providing appropriate place names. Views expressed in the text are those of the authors and do not necessarily reflect the views of the publisher.
We wish to thank the officers, crew members, scientific personnel, and the chief scientists of the ArcticNet 2014 and 2019 Leg 2 expeditions onboard the Canadian research icebreaker CCGS Amundsen, with the support of the Amundsen Science program funded by the Canada Foundation for Innovation (CFI) Major Science Initiatives (MSI) Fund and ArcticNet, a Network of Centres of Excellence in Canada. We also gratefully acknowledge Mikkel Aagaard Frederiksen for the laboratory work conducted at GEUS.
This research has been supported by the Danmarks Frie Forskningsfond (grant no. 9064-00039B).
This paper was edited by Linden Ashcroft and reviewed by David Harning and one anonymous referee.
Amiraux, R., Smik, L., Köseoğlu, D., Rontani, J. F., Galindo, V., Grondin, P. L., Babin, M., and Belt, S. T.: Temporal evolution of IP25 and other highly branched isoprenoid lipids in sea ice and the underlying water column during an Arctic melting season, Elementa, 7, https://doi.org/10.1525/elementa.377, 2019.
Bai, Y., Sicre, M. A., Chen, J., Klein, V., Jin, H., Ren, J., Li, H., Xue, B., Ji, Z., Zhuang, Y., and Zhao, M.: Seasonal and spatial variability of sea ice and phytoplankton biomarker flux in the Chukchi sea (western Arctic Ocean), Prog. Oceanogr., 171, 22–37, https://doi.org/10.1016/j.pocean.2018.12.002, 2019.
Barão, L., Vandevenne, F., Clymans, W., Frings, P., Ragueneau, O., Meire, P., Conley, D. J., and Struyf, E.: Alkaline-extractable silicon from land to ocean: A challenge for biogenic silicon determination, Limnol. Oceanogr. Methods, 13, 329–344, https://doi.org/10.1002/lom3.10028, 2015.
Belt, S. T.: Source-specific biomarkers as proxies for Arctic and Antarctic sea ice, Org. Geochem., 125, 277–298, https://doi.org/10.1016/j.orggeochem.2018.10.002, 2018.
Belt, S. T. and Müller, J.: The Arctic sea ice biomarker IP25: A review of current understanding, recommendations for future research and applications in palaeo sea ice reconstructions, Quat. Sci. Rev., 79, 9–25, https://doi.org/10.1016/j.quascirev.2012.12.001, 2013.
Belt, S. T., Massé, G., Rowland, S. J., Poulin, M., Michel, C., and LeBlanc, B.: A novel chemical fossil of palaeo sea ice: IP25, Org. Geochem., 38, 16–27, https://doi.org/10.1016/j.orggeochem.2006.09.013, 2007.
Belt, S. T., Massé, G., Vare, L. L., Rowland, S. J., Poulin, M., Sicre, M.-A., Sampei, M., and Fortier, L.: Distinctive 13 C isotopic signature distinguishes a novel sea ice biomarker in Arctic sediments and sediment traps, Mar. Chem., 112, 158–167, 2008.
Belt, S. T., Brown, T. A., Ringrose, A. E., Cabedo-Sanz, P., Mundy, C. J., Gosselin, M., and Poulin, M.: Quantitative measurement of the sea ice diatom biomarker IP25 and sterols in Arctic sea ice and underlying sediments: Further considerations for palaeo sea ice reconstruction, Org. Geochem., 62, 33–45, https://doi.org/10.1016/j.orggeochem.2013.07.002, 2013.
Belt, S. T., Cabedo-Sanz, P., Smik, L., Navarro-Rodriguez, A., Berben, S. M. P., Knies, J., and Husum, K.: Identification of paleo Arctic winter sea ice limits and the marginal ice zone: Optimised biomarker-based reconstructions of late Quaternary Arctic sea ice, Earth Planet. Sci. Lett., 431, 127–139, 2015.
Brown, T. A., Belt, S. T., Tatarek, A., and Mundy, C. J.: Source identification of the Arctic sea ice proxy IP 25, Nat. Commun., 1–7, https://doi.org/10.1038/ncomms5197, 2014.
Burgers, T. M., Miller, L. A., Rysgaard, S., Mortensen, J., Else, B., Tremblay, J., and Papakyriakou, T.: Distinguishing Physical and Biological Controls on the Carbon Dynamics in a High-Arctic Outlet Strait, J. Geophys. Res.-Oceans, 128, https://doi.org/10.1029/2022JC019393, 2023.
Caron, M., Rochon, A., Montero-Serrano, J. C., and St-Onge, G.: Evolution of sea-surface conditions on the northwestern Greenland margin during the Holocene, J. Quat. Sci., 34, 569–580, https://doi.org/10.1002/jqs.3146, 2019.
Dahl-Jensen, D., Mosegaard, K., Gundestrup, N., Clow, G. D., Johnsen, S. J., Hansen, A. W., and Balling, N.: Past temperatures directly from the Greenland Ice Sheet, Science, 282, 268–271, https://doi.org/10.1126/science.282.5387.268, 1998.
DeMaster, D. J.: Measuring biogenic silica in marine sediments and suspended matter, in: Marine Particles: Analysis and Characterization, Geophysical Monograph 63, American Geophysical Union, edited by: Hurd, D. C. and Spencer, D. W., Washington, D. C., 363–367, https://doi.org/10.1029/GM063p0363, 1991.
de Vernal, A., Radi, T., Zaragosi, S., Van Nieuwenhove, N., Rochon, A., Allan, E., De Schepper, S., Eynaud, F., Head, M. J., Limoges, A., Londeix, L., Marret, F., Matthiessen, J., Penaud, A., Pospelova, V., Price, A., and Richerol, T.: Distribution of common modern dinoflagellate cyst taxa in surface sediments of the Northern Hemisphere in relation to environmental parameters: The new n=1968 database, Mar. Micropaleontol., 159, 101796, https://doi.org/10.1016/j.marmicro.2019.101796, 2020.
Fernando, A., Freire, M., and Monteiro, M. C.: A Novel Approach for Inferring the Proportion of Terrestrial Organic Matter Input to Marine Sediments on the Basis of TOC: TN and δ13C org Signatures, Scientific Research, Open Journal of Marine Science, 3, 74–92, 2013.
Fol, M., Tremblay, B., Pfirman, S., Newton, R., Howell, S., and Lemieux, J. F.: Revisiting the Last Ice Area projections from a high-resolution Global Earth System Model, Commun. Earth Environ., 6, 1–12, https://doi.org/10.1038/s43247-025-02034-5, 2025.
Georgiadis, E., Giraudeau, J., Martinez, P., Lajeunesse, P., St-Onge, G., Schmidt, S., and Massé, G.: Deglacial to postglacial history of Nares Strait, Northwest Greenland: a marine perspective from Kane Basin, Clim. Past, 14, 1991–2010, https://doi.org/10.5194/cp-14-1991-2018, 2018.
Georgiadis, E., Giraudeau, J., Jennings, A., Limoges, A., Jackson, R., Ribeiro, S., and Massé, G.: Local and regional controls on Holocene sea ice dynamics and oceanography in Nares Strait, Northwest Greenland, Mar. Geol., 422, 106115, https://doi.org/10.1016/j.margeo.2020.106115, 2020.
Goliber, S., Black, T., Catania, G., Lea, J. M., Olsen, H., Cheng, D., Bevan, S., Bjørk, A., Bunce, C., Brough, S., Carr, J. R., Cowton, T., Gardner, A., Fahrner, D., Hill, E., Joughin, I., Korsgaard, N. J., Luckman, A., Moon, T., Murray, T., Sole, A., Wood, M., and Zhang, E.: TermPicks: a century of Greenland glacier terminus data for use in scientific and machine learning applications, The Cryosphere, 16, 3215–3233, https://doi.org/10.5194/tc-16-3215-2022, 2022.
Harðardóttir, S., Haile, J. S., Ray, J. L., Limoges, A., Van Nieuwenhove, N., Lalande, C., Grondin, P. L., Jackson, R., Skaar, K. S., Heikkilä, M., Berge, J., Lundholm, N., Massé, G., Rysgaard, S., Seidenkrantz, M. S., De Schepper, S., Lorenzen, E. D., Lovejoy, C., and Ribeiro, S.: Millennial-scale variations in Arctic sea ice are recorded in sedimentary ancient DNA of the microalga Polarella glacialis, Commun. Earth Environ., 5, https://doi.org/10.1038/s43247-023-01179-5, 2024.
Harning, D. J., Holman, B., Woelders, L., Jennings, A. E., and Sepúlveda, J.: Biomarker characterization of the North Water Polynya, Baffin Bay: implications for local sea ice and temperature proxies, Biogeosciences, 20, 229–249, https://doi.org/10.5194/bg-20-229-2023, 2023.
Hastie, T. J.: Generalized Additive Models, 1st edn., Routledge, https://doi.org/10.1201/9780203753781, 1990.
Head, M. J., Harland, R., and Matthiessen, J.: Cold marine indicators of the late Quaternary: The new dinoflagellate cyst genus Islandinium and related morphotypes, J. Quat. Sci., 16, 621–636, https://doi.org/10.1002/jqs.657, 2001.
Heide-Jørgensen, M. P., Burt, L. M., Hansen, R. G., Nielsen, N. H., Rasmussen, M., Fossette, S., and Stern, H.: The significance of the north water polynya to arctic top predators, Ambio, 42, 596–610, https://doi.org/10.1007/s13280-012-0357-3, 2013.
Heikkilä, M., Pospelova, V., Hochheim, K. P., Kuzyk, Z. Z. A., Stern, G. A., Barber, D. G., and Macdonald, R. W.: Surface sediment dinoflagellate cysts from the Hudson Bay system and their relation to freshwater and nutrient cycling, Mar. Micropaleontol., 106, 79–109, https://doi.org/10.1016/j.marmicro.2013.12.002, 2014.
Hillebrand, T. R., Hoffman, M. J., Perego, M., Price, S. F., and Howat, I. M.: The contribution of Humboldt Glacier, northern Greenland, to sea-level rise through 2100 constrained by recent observations of speedup and retreat, The Cryosphere, 16, 4679–4700, https://doi.org/10.5194/tc-16-4679-2022, 2022.
Inuit Circumpolar Council Pikialasorsuaq Commission: People of the Ice Bridge: The Future of the Pikialasorsuaq, https://doi.org/10.25607/OBP-1693, 2017.
Jakobsson, M., Mohammad, R., Karlsson, M., Salas-Romero, S., Vacek, F., Heinze, F., Bringensparr, C., Castro, C. F., Johnson, P., Kinney, J., Cardigos, S., Bogonko, M., Accettella, D., Amblas, D., An, L., Bohan, A., Brandt, A., Bünz, S., Canals, M., Casamor, J. L., Coakley, B., Cornish, N., Danielson, S., Demarte, M., Di Franco, D., Dickson, M.-L., Dorschel, B., Dowdeswell, J. A., Dreutter, S., Fremand, A. C., Hall, J. K., Hally, B., Holland, D., Hong, J. K., Ivaldi, R., Knutz, P. C., Krawczyk, D. W., Kristofferson, Y., Lastras, G., Leck, C., Lucchi, R. G., Masetti, G., Morlighem, M., Muchowski, J., Nielsen, T., Noormets, R., Plaza-Faverola, A., Prescott, M. M., Purser, A., Rasmussen, T. L., Rebesco, M., Rignot, E., Rysgaard, S., Silyakova, A., Snoeijs-Leijonmalm, P., Sørensen, A., Straneo, F., Sutherland, D. A., Tate, A. J., Travaglini, P., Trenholm, N., Wijk, E. van, Wallace, L., Willis, J. K., Wood, M., Zimmermann, M., Zinglersen, K. B., and Mayer, L.: The International Bathymetric Chart of the Arctic Ocean (IBCAO), Sci. Data, 11, 1–13, https://doi.org/10.1038/s41597-024-04278-w, 2024.
Jalali, B., Sicre, M. A., Ren, J., Klein, V., Li, Z., Su, L., Bai, Y., Astakhov, A. S., and Chen, J.: Reconstruction of sea ice variability in the Chukchi Sea during the last three centuries based on biomarker proxies, Environ. Res. Commun., 6, https://doi.org/10.1088/2515-7620/ad75f1, 2024.
Jennings, A., Andrews, J., Reilly, B., Walczak, M., Jakobsson, M., Mix, A., Stoner, J., Nicholls, K. W., and Cheseby, M.: Modern foraminiferal assemblages in northern Nares Strait, Petermann Fjord, and beneath Petermann ice tongue, NW Greenland, Arct. Antarct. Alp. Res., 52, 491–511, https://doi.org/10.1080/15230430.2020.1806986, 2020.
Jennings, A. E., Sheldon, C., Cronin, T. M., Francus, P., Stoner, J., and Andrews, J.: The Holocene History of Nares Strait, Transition from Glacial Bay to Arctic-Atlantic Troughflow, Oceanography, 24, 26–41, 2011.
Joli, N., Gosselin, M., Ardyna, M., Babin, M., Onda, D. F., Tremblay, J. É., and Lovejoy, C.: Need for focus on microbial species following ice melt and changing freshwater regimes in a Janus Arctic Gateway, Sci. Rep., 8, 1–11, https://doi.org/10.1038/s41598-018-27705-6, 2018.
KDS: Satellite images from Sentinel 2 and SPOT 6/7, Danish Agency for Climate Data [data set], https://dataforsyningen.dk/data/4783 (last access: 8 January 2025), 2025.
Kim, Y. H., Min, S. K., Gillett, N. P., Notz, D., and Malinina, E.: Observationally-constrained projections of an ice-free Arctic even under a low emission scenario, Nat. Commun., 14, 3–10, https://doi.org/10.1038/s41467-023-38511-8, 2023.
Kirillov, S., Babb, D. G., Komarov, A. S., Dmitrenko, I., Ehn, J. K., Worden, E., Candlish, L., Rysgaard, S., and Barber, D. G.: On the Physical Settings of Ice Bridge Formation in Nares Strait, J. Geophys. Res., 126, e2021, https://doi.org/10.1029/2021JC017331, 2021.
Kirillov, S., Dmitrenko, I., Babb, D. G., Ehn, J. K., Koldunov, N., Rysgaard, S., Jensen, D., and Barber, D. G.: The role of oceanic heat flux in reducing thermodynamic ice growth in Nares Strait and promoting earlier collapse of the ice bridge, Ocean Sci., 18, 1535–1557, https://doi.org/10.5194/os-18-1535-2022, 2022.
Kjær, K. H., Bjørk, A. A., Kjeldsen, K. K., Hansen, E. S., Andresen, C. S., Siggaard-Andersen, M. L., Khan, S. A., Søndergaard, A. S., Colgan, W., Schomacker, A., Woodroffe, S., Funder, S., Rouillard, A., Jensen, J. F., and Larsen, N. K.: Glacier response to the Little Ice Age during the Neoglacial cooling in Greenland, Earth. Sci. Rev., 227, https://doi.org/10.1016/j.earscirev.2022.103984, 2022.
Klein, B., LeBlanc, B., Mei, Z. P., Beret, R., Michaud, J., Mundy, C. J., Von Quillfeldt, C. H., Garneau, M. È., Roy, S., Gratton, Y., Cochran, J. K., Bélanger, S., Larouche, P., Pakulski, J. D., Rivkin, R. B., and Legendre, L.: Phytoplankton biomass, production and potential export in the North Water, Deep-Sea. Res. 2 Top. Stud. Oceanogr., 49, 4983–5002, https://doi.org/10.1016/S0967-0645(02)00174-1, 2002.
Koerner, K. A., Limoges, A., Van Nieuwenhove, N., Richerol, T., Massé, G., and Ribeiro, S.: Late Holocene sea-surface changes in the North Water polynya reveal freshening of northern Baffin Bay in the 21st century, Glob. Planet. Change, 206, https://doi.org/10.1016/j.gloplacha.2021.103642, 2021.
Koerner, K. A., Limoges, A., Pike-Connolly, E., Van Nieuwenhove, N., and Rochon, A.: Early impacts of Arctic amplification in the western North Water Polynya: A 400-year perspective, Mar. Micropaleontol., 197–198, https://doi.org/10.1016/j.marmicro.2025.102470, 2025.
Kolling, H. M., Stein, R., Fahl, K., Sadatzki, H., de Vernal, A., and Xiao, X.: Biomarker Distributions in (Sub)-Arctic Surface Sediments and Their Potential for Sea Ice Reconstructions, Geochem. Geophy. Geosy., 21, https://doi.org/10.1029/2019GC008629, 2020.
Köseoğlu, D., Belt, S. T., and Knies, J.: Abrupt shifts of productivity and sea ice regimes at the western Barents Sea slope from the Last Glacial Maximum to the Bølling-Allerød interstadial, Quat. Sci. Rev., 222, 105903, https://doi.org/10.1016/j.quascirev.2019.105903, 2019.
Kumar, V., Tiwari, M., Nagoji, S., and Tripathi, S.: Evidence of Anomalously Low δ13C of Marine Organic Matter in an Arctic Fjord, Sci. Rep., 6, 1–9, https://doi.org/10.1038/srep36192, 2016.
Kvorning, A. B.: Data for “Cryosphere and ocean variability in Kane Basin since the 18th century: insights from two marine multi-proxy records”, V1, GEUS Dataverse [data set], https://doi.org/10.22008/FK2/WT7P1E, 2026.
Lamb, A. L., Wilson, G. P., and Leng, M. J.: A review of coastal palaeoclimate and relative sea-level reconstructions using δ13C and C N ratios in organic material, Earth. Sci. Rev., 75, 29–57, https://doi.org/10.1016/j.earscirev.2005.10.003, 2006.
Legendre, P. and Gallagher, E. D.: Ecologically meaningful transformations for ordination of species data, Oecologia, 2, 271–280, https://doi.org/10.1007/s004420100716, 2001.
Marchese, C., Albouy, C., Tremblay, J. É., Dumont, D., D'Ortenzio, F., Vissault, S., and Bélanger, S.: Changes in phytoplankton bloom phenology over the North Water (NOW) polynya: a response to changing environmental conditions, Polar Biol., 40, 1721–1737, https://doi.org/10.1007/s00300-017-2095-2, 2017.
Massé, G., Rowland, S. J., Sicre, M. A., Jacob, J., Jansen, E., and Belt, S. T.: Abrupt climate changes for Iceland during the last millennium: Evidence from high resolution sea ice reconstructions, Earth Planet. Sci. Lett., 269, 565–569, https://doi.org/10.1016/j.epsl.2008.03.017, 2008.
Meire, L., Mortensen, J., Meire, P., Juul-Pedersen, T., Sejr, M. K., Rysgaard, S., Nygaard, R., Huybrechts, P., and Meysman, F. J. R.: Marine-terminating glaciers sustain high productivity in Greenland fjords, Glob. Chang. Biol., 23, 5344–5357, https://doi.org/10.1111/gcb.13801, 2017.
Melling, H., Gratton, Y., and Ingram, G.: Ocean circulation within the North Water polynya of Baffin Bay, Atmos.-Ocean, 39, 301–325, https://doi.org/10.1080/07055900.2001.9649683, 2001.
Meyers, P. A.: Preservation of Elemental and Isotopic Source Identification of Sedimentary Organic Matter, Chem. Geol., 114, 289–302, https://doi.org/10.1016/0009-2541(94)90059-0, 1994.
Miall, A. D.: Tertiary sedimentation and tectonics in the Judge Daly Basin, northeast Ellesmere Island, Arctic Canada, Energy, Mines, and Resources Canada, https://doi.org/10.4095/119451, 1982.
Moore, G. W. K., Howell, S. E. L., Brady, M., Xu, X., and McNeil, K.: Anomalous collapses of Nares Strait ice arches leads to enhanced export of Arctic sea ice, Nat. Commun., 12, 1–8, https://doi.org/10.1038/s41467-020-20314-w, 2021.
Mouginot, J., Rignot, E., Bjørk, A. A., van den Broeke, M., Millan, R., Morlighem, M., Noël, B., Scheuchl, B., and Wood, M.: Forty-six years of Greenland Ice Sheet mass balance from 1972 to 2018, Proc. Natl. Acad. Sci. USA, 116, 9239–9244, https://doi.org/10.1073/pnas.1904242116, 2019.
Müller, J., Wagner, A., Fahl, K., Stein, R., Prange, M., and Lohmann, G.: Towards quantitative sea ice reconstructions in the northern North Atlantic: A combined biomarker and numerical modelling approach, Earth Planet. Sci. Lett., 306, 137–148, https://doi.org/10.1016/j.epsl.2011.04.011, 2011.
Mullin, J. B. and Riley, J. P.: The colorimetric determination of silicate with special reference to sea and natural waters, Anal. Chim. Acta, 12, 162–176, 1955.
Nutt, D. C.: The Drift of Ice Island WH-5, Arctic, 19, https://doi.org/10.14430/arctic3432, 1966.
Odate, T., Hirawake, T., Kudoh, S., Klein, B., LeBlanc, B., and Fukuchi, M.: Temporal and spatial patterns in the surface-water biomass of phytoplankton in the North Water, Deep-Sea. Res. 2 Top. Stud. Oceanogr., 49, 4947–4958, https://doi.org/10.1016/S0967-0645(02)00172-8, 2002.
Oksanen, J., Simpson, G. L., Blanchet, F. G., Kindt, R., Legendre, P., Minchin, P. R., O'Hara, R. B., Solymos, P., Stevens, M. H. H., Szoecs, E., Wagner, H., Barbour, M., Bedward, M., Bolker, B., Borcard, D., Carvalho, G., Chirico, M., Caceres, M. De, Durand, S., Evangelista, H. B. A., FitzJohn, R., Friendly, M., Furneaux, B., Hannigan, G., Hill, M. O., Lahti, L., McGlinn, D., Ouellette, M.-H., Cunha, E. R., Smith, T., Stier, A., Braak, C. J. F. Ter, Weedon, J., and Borman, T.: vegan: Community Ecology Package, R package version 2.6-2, https://CRAN.R-project.org/package=vegan (last access: 4 June 2025), 2022.
Quaijtaal, W., Donders, T. H., Persico, D., and Louwye, S.: Characterising the middle Miocene Mi-events in the Eastern North Atlantic realm: A first high-resolution marine palynological record from the Porcupine Basin, Palaeogeogr. Palaeoclimatol. Palaeoecol., 399, 140–159, https://doi.org/10.1016/j.palaeo.2014.02.017, 2014.
Rasmussen, T. A. S., Kliem, N., and Kaas, E.: The effect of climate change on the sea ice and hydrography in Nares Strait, Atmos.-Ocean, 49, 245–258, https://doi.org/10.1080/07055900.2011.604404, 2011.
R Core Team: R: A language and environment for statistical computing, R Foundation for Statistical Computing, Vienna, Austria, https://www.R-project.org/ (last access: 4 June 2025), 2021.
Ren, H., Shokr, M., Li, X., Zhang, Z., Hui, F., and Cheng, X.: Estimation of Sea Ice Production in the North Water Polynya Based on Ice Arch Duration in Winter During 2006–2019, J. Geophys. Res.-Oceans, 127, https://doi.org/10.1029/2022JC018764, 2022.
Ribeiro, S., Limoges, A., Massé, G., Johansen, K. L., Colgan, W., Weckström, K., Jackson, R., Georgiadis, E., Mikkelsen, N., Kuijpers, A., Olsen, J., Olsen, S. M., Nissen, M., Andersen, T. J., Strunk, A., Wetterich, S., Syväranta, J., Henderson, A. C. G., Mackay, H., Taipale, S., Jeppesen, E., Larsen, N. K., Crosta, X., Giraudeau, J., Wengrat, S., Nuttall, M., Grønnow, B., Mosbech, A., and Davidson, T. A.: Vulnerability of the North Water ecosystem to climate change, Nat. Commun., 12, https://doi.org/10.1038/s41467-021-24742-0, 2021.
Rignot, E., An, L., Chauche, N., and Morlighem, M.: Retreat of Humboldt Gletscher , North Greenland , Driven by Undercutting From a Warmer Ocean Geophys. Res. Lett., 1–9, https://doi.org/10.1029/2020GL091342, 2019.
Schreiber, L., Ribeiro, S., Jackson, R., Kvorning, A. B., Nota, K., O'Regan, M., Pearce, C., Seersholm, F., Seidenkrantz, M. S., Zimmermann, H. H., and Lorenzen, E. D.: Holocene shifts in marine mammal distributions around Northern Greenland revealed by sedimentary ancient DNA, Nat. Commun., 16, https://doi.org/10.1038/s41467-025-59731-0, 2025.
Schubert, C. J. and Calvert, S. E.: Nitrogen and carbon isotopic composition of marine and terrestrial organic matter in Arctic Ocean sediments: Implications for nutrient utilization and organic matter composition, Deep-Sea. Res. 1 Oceanogr. Res. Pap., 48, 789–810, https://doi.org/10.1016/S0967-0637(00)00069-8, 2001.
Serreze, M. C. and Stroeve, J.: Arctic sea ice trends, variability and implications for seasonal ice forecasting, Philos. T. Roy. Soc. A, 373, https://doi.org/10.1098/rsta.2014.0159, 2015.
Simpson, G. L.: Modelling palaeoecological time series using generalised additive models, Front. Ecol. Evol., 6, 1–21, https://doi.org/10.3389/fevo.2018.00149, 2018.
Stein, R. and Macdonald, R. W.: The Organic Carbon Cycle in the Arctic Ocean, Springer Nature, 194 pp., https://doi.org/10.1007/978-3-642-18912-8, 2004.
Stoecker, D. K., Gustafson, D. E., Baier, C. T., and Black, M. M. D.: Primary production in the upper sea ice, Aquat. Microb. Ecol., 21, 275–287, https://doi.org/10.3354/ame021275, 2000.
Stroeve, J. C., Serreze, M. C., Holland, M. M., Kay, J. E., Malanik, J., and Barrett, A. P.: The Arctic's rapidly shrinking sea ice cover: A research synthesis, Clim. Change, 110, 1005–1027, https://doi.org/10.1007/s10584-011-0101-1, 2012.
Vincent, R. F.: A Study of the North Water Polynya Ice Arch using Four Decades of Satellite Data, Sci. Rep., 9, 1–12, https://doi.org/10.1038/s41598-019-56780-6, 2019.
Wood, S. N.: Fast stable restricted maximum likelihood and marginal likelihood estimation of semiparametric generalized linear models, J. R. Stat. Soc. Series B Stat. Methodol., 73, 3–36, https://doi.org/10.1111/j.1467-9868.2010.00749.x, 2011.