the Creative Commons Attribution 4.0 License.
the Creative Commons Attribution 4.0 License.
 | 04 Mar 2026
Seven centuries of rainfall reconstructed from Scots Pine ring width in sub-Arctic Sweden
Jesper Björklund
Fredrik Charpentier Ljungqvist
Jennie Sandström
Mauricio Fuentes
Paul J. Krusic
Zhi-Bo Li
Kristina Seftigen
As the sub-Arctic and Arctic regions undergoes rapid changes, understanding its hydroclimate history is more critical than ever. A limited availability of moisture-sensitive proxy data severely constrains our insights, underscoring the urgent need for more hydroclimate reconstructions in the region. Here we present a May–June precipitation reconstruction based on ring width from living and dead trees of Scots pine (Pinus sylvestris L.) growing under drought-stressed conditions at 63° N, near Skuleskogen National Park, on the northern part of the east coast of Sweden. The oldest deadwood sample dates back to the mid-11th century, and the Expressed Population Signal (EPS) exceeds 0.85 from 1320 CE until the present (2021 CE), making this the longest tree-ring-based hydroclimate reconstruction from high-latitude Fennoscandia. Unlike typical high-latitude forests in Fennoscandia, the trees at this site thrive under low-pressure conditions and show strong correlations up to approximately 6 over the period 1920–2021 with drought-related variables such as precipitation, cloud cover, solar radiation, potential evapotranspiration and diurnal temperature range. The climate signal is concentrated to a short window between mid-May and early July but reflects climatic conditions over a broad region. Significant spatial correlations extend over most of Sweden as well as large parts of Norway and Finland, indicating sensitivity to large-scale climate systems. The tree-ring chronology also shows clear cyclic patterns, with a particularly strong ∼ 64-year cycle. The modern era stands out for its variability, with 2018 CE emerging as one of the of the driest year in the entire record. There is potential to extend the chronology further back in time, possibly to 1000 CE or earlier, and to extract additional climate information using other tree-ring parameters such as blue intensity.
- Article
(7576 KB) - Full-text XML
- BibTeX
- EndNote


Dendroclimatologists not seldom journey to some of the world's most remote corners in search of untouched forests, free of significant human influence, to extract an as pure climate signal as possible from the woods, and to be able to make long time-series (Schweingruber, 1988; Speer, 2010). They might search in sediments of lakes to potentially produce chronologies spanning most of the Holocene (Grudd et al., 2002), seek out driftwood in the Arctic (Linderholm et al., 2021), or take samples from historical buildings (Labbas et al., 2024; Shumilov et al., 2025). Remarkably, a natural archive of living and dead Pinus sylvestris L., at the “High Coast” on the northeast coast of Sweden, have been preserved for a millennium – possibly even longer – on relatively modest hills, which rise a few hundred meters at the most, and which have been surrounded by human settlements since pre-historic times. Additionally, these trees give a distinctly different type of climatic information from what normally can be expected at high latitude forests. While tree-ring-derived chronologies from northern Fennoscandia have been an excellent source of past summer temperature proxy data (e.g., Melvin and Briffa, 2013; Matskovsky and Helama, 2014; Linderholm and Gunnarson, 2019; Fuentes et al., 2018; Stridbeck et al., 2022; Björklund et al., 2023; Esper et al., 2024), as they typically respond strongly to growing season temperatures (Linderholm et al., 2015), the trees on the rocky terrain of the High Coast are instead primarily limited by moisture availability (Jönsson and Nilsson, 2009; Sandström et al., 2020). This offers a rare opportunity to reconstruct past hydroclimate conditions from a region where temperature has traditionally dominated the tree-ring signal.
Recent advances in dendroclimatology have demonstrated the feasibility to produce long tree-ring based reconstructions of hydroclimate (precipitation or various drought indices) from regions with a relatively cold, and in some cases also a rather humid, climate (e.g., Bebchuk et al., 2025; Cook et al., 2015, 2020; Seftigen et al., 2015a, 2017, 2020, 2025; Hartl et al., 2021). These reconstructions, derived from trees growing in unique micro-site conditions in otherwise relatively humid and cold locations (Ljungqvist et al., 2020), can carry a significant, time stable drought and/or precipitation signal almost comparable in strength to that of reconstructions from the arid and semi-arid regions of western United States that typically have the strongest hydroclimate signal of all tree-ring based reconstructions (for the latter, see St. George, 2014; St. George and Ault, 2014). In Europe, north of the Mediterranean region, a number of millennium-long hydroclimate reconstructions from tree-ring width data have been developed in recent decades (Helama et al., 2009; Büntgen et al., 2010a, 2011; Cooper et al., 2013; Wilson et al., 2013; Land et al., 2019; Muigg et al., 2020).
Few high-resolution hydroclimate reconstructions exist for the sub-Arctic region (Ljungqvist et al., 2016), and the potential to develop tree-ring based such reconstructions for this cold region have been deemed challenging (Linderholm et al., 2018). However, a large-scale assessment of the June–July climate signal in tree-ring width series across Eurasia north of 60° N by Hellmann et al. (2016) revealed that – in particular in regions in Siberia with a continental climate – a drought signal, rather than a temperature signal, prevailed up to 65° N at many locations. This included low-elevation sites in boreal Sweden and Finland (see Fig. 3 in Hellmann et al., 2016), corroborating earlier findings by Seftigen et al. (2015b). Similarly, Jack pine (Pinus banksiana) growing on rocky outcrop locations in the Northwest Territories, Canada, have been found to record a significant May–August precipitation signal despite their sub-Arctic location (Pisaric et al., 2009). In summary, these studies provide evidence that hydroclimate-sensitive tree-ring chronologies can be developed from trees growing at high-latitude sites characterized by high solar radiation, relatively elevated summer temperatures, well-drained soils, and dry microsite conditions.
Seftigen has previously developed a rather dense network of tree-ring width chronologies from Pinus Sylvestris L. collected at moisture-limited sites throughout southern Sweden (e.g. Seftigen et al., 2015a) These typically exhibit a significant early growing season precipitation signal. In well-drained settings, it has been feasible even at Sweden's relatively precipitation-rich west coast. However, most of these sites are located towards the eastern generally drier parts of the country, including the island of Gotland, one of the regions with the lowest amount of precipitation in Sweden. In subsequent work, Seftigen et al. (2017) incorporated these and additional tree-ring chronologies from more northerly sites in Sweden, Finland, and Norway to investigate large-scale hydroclimatic variability over the past millennium, developing a reconstruction of the summer Standardized Precipitation–Evapotranspiration Index (SPEI). In close proximity to our study area and in a similar environment, Jönsson and Nilsson (2009) reconstructed May–June precipitation back to 1560 using Scots pine (Pinus sylvestris L.) from just east of the town of Härnösand, with a principal component regression explaining 46 % of the local precipitation variability. Sandström et al. (2020) also conducted extensive tree-ring-related research in the High Coast region; however, their focus was primarily on forest structure and fire history rather than climate reconstructions.
In this study, we present what is, to our knowledge, the longest northernmost tree-ring-based precipitation reconstruction in Northern Europe, based on Scots pines (Pinus sylvestris L.) growing in a moisture-limited environment on the northeastern coast of Sweden at 63° N, near Skuleskogen National Park, approximately 60 km north of the town of Härnösand. The present work builds upon and complements previous studies, extending the spatial coverage of hydroclimatic reconstructions further north. Additionally, it enhances the temporal depth of such reconstructions beyond the past 300–400 years by incorporating a substantial amount of deadwood material, whereas earlier studies primarily relied on living trees. The specific objectives of this study are to (1) assess whether Scots pine (Pinus sylvestris L.) growing under moisture-limited conditions on the High Coast, located along the east coast of Northern Sweden, is suitable for hydroclimate reconstruction; (2) develop and evaluate a precipitation reconstruction extending as far back as feasible based on both living and dead material; (3) analyse the spatial extent of the climate–growth relationships in order to determine the regional representativeness of the signals; (4) identify potential centennial trends and multi-decadal cycles and compare the reconstructed variability with other relevant Fennoscandian records.
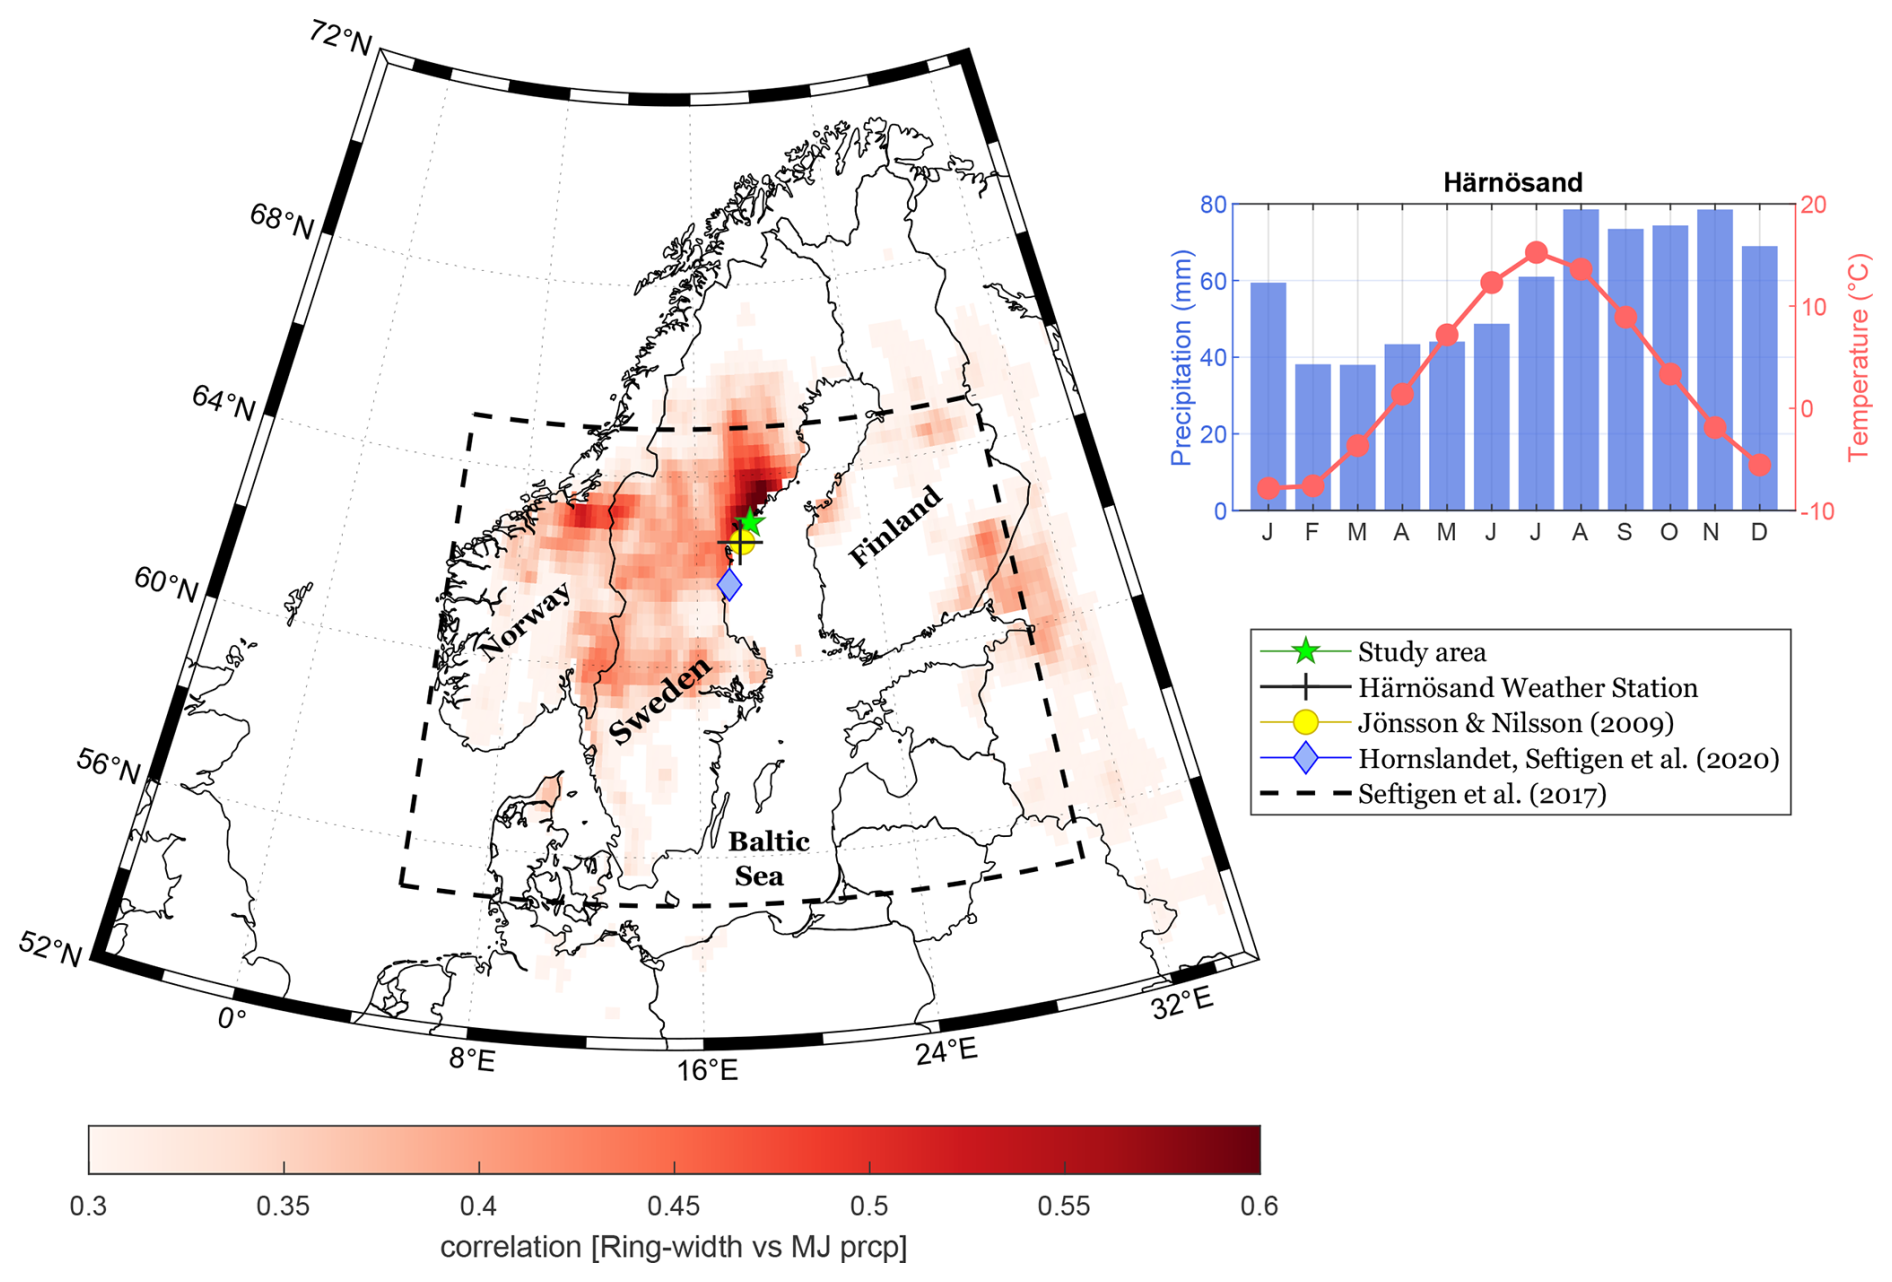
Figure 1Location of the study area, along with nearby moisture-sensitive tree-ring chronology sites. The dashed rectangle indicates the area of a Standardized Precipitation-Evapotranspiration Index (SPEI) reconstruction conducted by Seftigen et al. (2017). The figure also includes the spatial correlation between the ring-width chronology presented in this study and May–June precipitation from the E-OBS gridded dataset (Cornes et al., 2018). The climograph presents monthly temperature and precipitation data from the Härnösand meteorological station for the period 1920–2021. The station is located 60 km south from the study site.
2.1 Study area
The study area (63.0° N, 18.5° E) is located just south of Skuleskogen National Park within the High Coast region (Sw. Höga Kusten), located on the northern part of Sweden's east coast (Fig. 1). This area is part of a distinctive and often dramatic landscape shaped by rapid post-glacial rebound following the retreat of the Weichselian ice sheet. The terrain is characterized by steep cliffs, rocky outcrops interspersed with deep valleys and remains of raised beach terraces (Fig. 2). The region was heavily glaciated during the Last Glacial Period (c. 115 000 to c. 11 700 years ago), with an ice thickness reaching about 3000 m. As the ice receded, the land began to rebound, causing an extensive uplift, which today still amounts to about 8 mm yr−1, making it the fastest rising landmass globally in present time. The highest coastline, located just west of the study site, reaches 286 m above present sea level (Wastenson and Fredén, 1994). The soils in the study area are generally shallow and poorly developed, a consequence of both glacial scouring and subsequent wave erosion, which have exposed extensive areas of bedrock. These conditions create a moisture-limited environment despite a moderate annual precipitation of 600–700 mm. Unlike most high-latitude forests in northern Fennoscandia, where temperature is typically the primary growth-limiting factor, the High Coast represents a rare example where tree growth is constrained by water availability (Jönsson and Nilsson, 2009). Scots pine (Pinus sylvestris L.) dominates the tree cover, being well-suited to survive in these dry and nutrient-limited environments. Individual trees frequently reach ages of 300–400 years, with the oldest specimen found at the site exceeding 600 years. A notable feature of the site is the abundance of relict deadwood material, which can remain well-preserved on the ground for several centuries. The combination of nutrient poor soils, rocky terrain and frequent forest fires likely contributed to the limited historical exploitation of these perched forests, despite their proximity to human settlements.
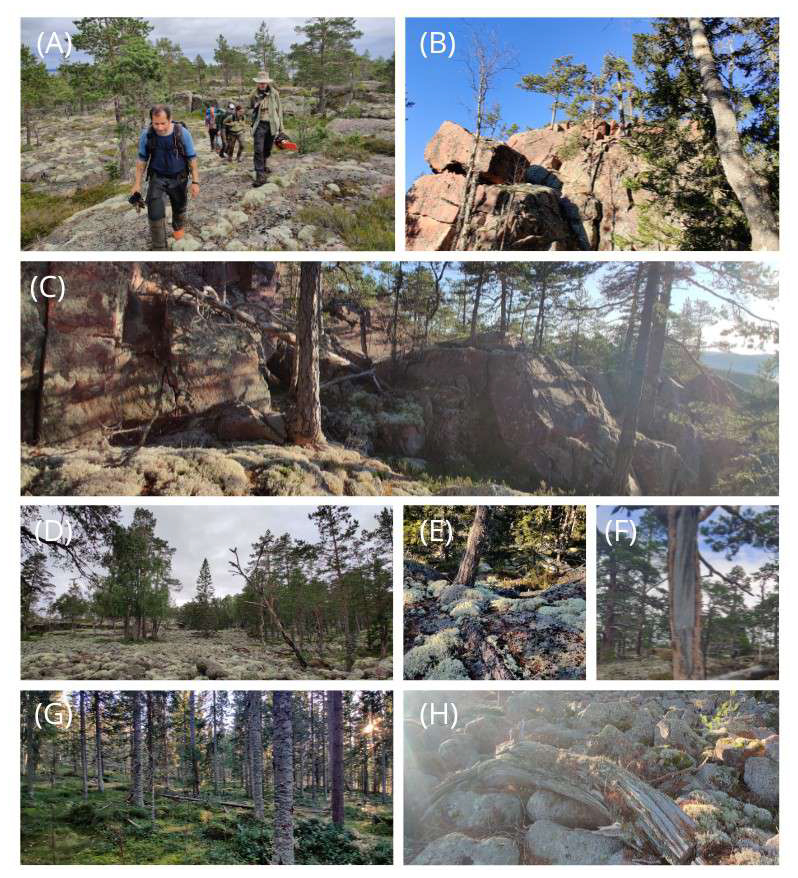
Figure 2(A–C) Typical terrain on the higher parts of the sampling area, with thin soil cover where mainly Scots pine trees thrive. (D) Raised shingle field formed by wave action when the shoreline was at higher level, now located about 50–100 m above the present sea level. The pines that grow here can be relatively large and reach a remarkable age. Here the trees tend to grow in patches, which likely helps protect them from the recurring fires evident throughout the area. The oldest living tree here is well over 600 years old. (E) A small pine tree with thick roots that run across the bedrock to moister terrain. In this rocky terrain, it is not uncommon to see exposed roots nearly as thick as the stem itself. (F) Fire scars are often easily visible on both living trees and deadwood. (G) In one of the valleys just below the site, soil conditions are much wetter, supporting a relatively fast-growing spruce-dominated forest. (H) Example of deadwood found on the raised beach. In this dry environment, wood from pine can remain well-preserved for hundreds of years after falling. The sapwood tends to disintegrate relatively quickly, and in the older specimens, parts of the heartwood can also be missing.
2.2 Sampling work
During 2021 and 2022, a reconnaissance survey of the area was conducted to investigate its potential for hydroclimate reconstruction. Sampling was subsequently carried out on Gårdberget, Vårdkallberget and Fanön located approximately 5 km south of Skuleskogen National Park (Fig. 1). Samples from living Scots pine trees were collected using 5 or 10 mm increment borers, sampling at breast height whenever possible. Very exposed areas on the mountain tops, where trees were twisted and bent, were generally avoided, as such individuals are likely to contain a high proportion of reaction wood. Similarly, relatively moist depressions were excluded from sampling. The deadwood of Scots pines in the area appears to remain well-preserved for extended periods after death, likely due to a high resin content and the generally dry forest floor conditions. From the relic material lying on the ground, samples were collected using a chainsaw, targeting sections with an estimated minimum of 50–100 years of intact growth rings.
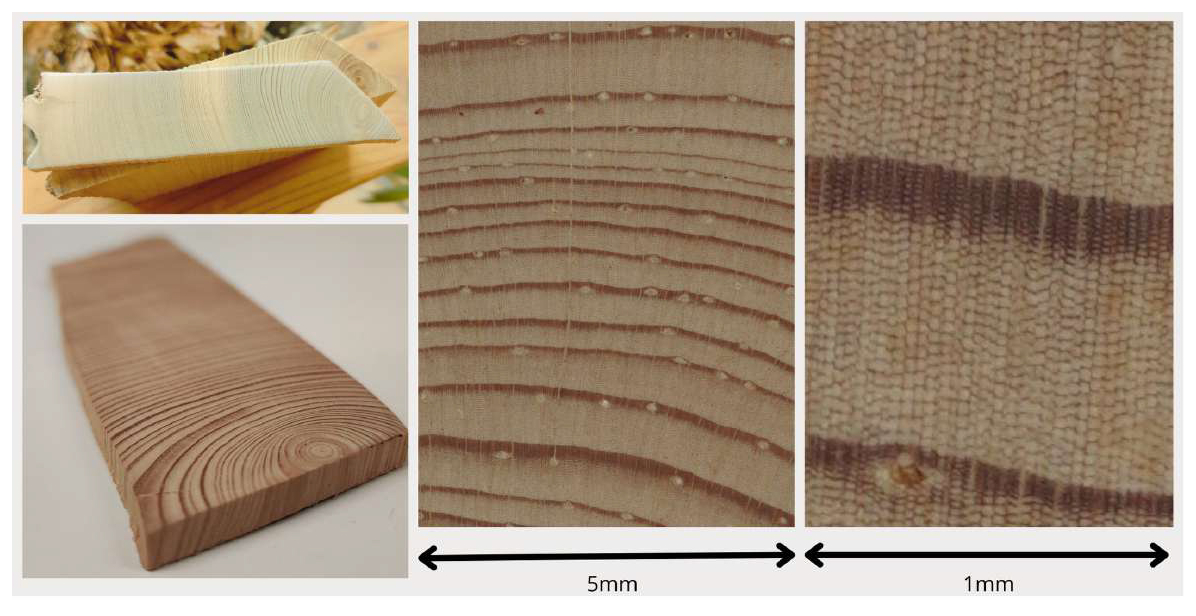
Figure 3Piece of deadwood dated to c. 1100–1350 CE, with the heartwood in very good condition.
2.3 Sample preparations and ring width chronology development
The samples were washed in 96 % ethanol using a Soxhlet extractor for at least 48 h, or until they no longer discoloured the solvent. The deadwood samples were sawn into slices approximately 4 mm thick before washing. The samples were then sanded with progressively finer sandpaper up to 800 grit. Digital images of the samples were taken using the Skippy image-capturing system (Gärtner et al., 2024), integrated with a Sony Alpha 7R IV 61-megapixel camera, capable of producing images at resolutions up to 6000 dpi. At this resolution, well-prepared wood samples in good condition, allow for the distinction between cell walls and the lumen. Figure 3 shows a section cut from a disk of deadwood where the heartwood has remained in excellent condition despite many centuries on the ground. Note the abundance of resin ducts, which is typical of the pine wood from this site. Tree-ring width (TRW) measurements were conducted with CooRecorder (version 9.4; Larsson, 2014) and cross-dated using CDendro (Larsson, 2014) and COFECHA (Holmes, 1983). In addition to TRW, earlywood and latewood widths were also measured. Although these parameters were not incorporated into the final precipitation reconstruction, they were retained for use in the climate–growth relationship analysis.
The extensive material collected allowed for a selective approached in choosing which samples to use; about half of the collected material has been incorporated into the chronology. In some of the oldest, slowest-growing trees, the growth rings were often barely distinguishable even after thorough sanding. In such cases, parts of the sample, or sometimes the entire sample, were omitted. Further, some rather long segments of deadwood have not been possible to date, suggesting that they could be older than the chronology presented here.
For standardization, a regional curve standardization (RCS) method (e.g., Briffa et al., 1992; Esper et al., 2003) was applied. Due to large differences in growth characteristics and growth rates among individual trees, the multiple Regional Curve Standardization (mRCS) approach was used (methodological details are provided in Appendix A), which groups samples into different age–growth classes. To evaluate the reconstruction skills of the mRCS chronology, a conventional calibration-verification approach was conducted (Cook and Kairiukstis, 1990). The calibration period was split into two equally long segments and split-period calibration were performed in both directions. Model performance was assessed using Pearson's correlations (r), reduction of error (RE), and coefficient of efficiency (CE). Further, the reliability of the chronology was assessed using the Expressed Population Signal (EPS), where values exceeding 0.85 conventionally are considered indicative of a sufficiently strong common signal for a robust climate reconstruction (Wigley et al., 1984). A linear model was then used to reconstruct total precipitation for May–June.
2.4 Meteorological data and power spectrum analysis
In this study, meteorological data from the town of Härnösand, located about 60 km south of the site were used. Additionally, two grided datasets were used: the ensemble version of the E-OBS dataset (Cornes et al., 2018) and the CRU TS v4.08 dataset (Harris et al., 2020). The E-OBS dataset provides temperature and precipitation at 0.1°×0.1° resolution across Europe while CRU offers global monthly climate data at 0.5° resolution. Incorporating both datasets allowed for including more variables as well as examining differences in how the two datasets align with our chronology. For proper comparison, both datasets were analysed over the common period of 1920–2021 and for an identical 1°×1° region covering 62.5–63.5° N and 18–19° E.
Firstly, the climate–growth relationship was determined by correlating the mRCS chronology with various CRU variables as well as E-OBS data for the current year. Encouraged by a noticeably stronger alignment between the precipitation data from E-OBS and our chronology additional analysis was performed for this dataset incorporating for early- and latewood width as well. For the spatial correlation analysis which is presented as maps covering the 52–72° N and 5–35° E regions, E-OBS was used when available. Lastly, precipitation data from Härnösand weather station were used, a record that starts already at 1859. However, it have some missing entries up to and including the 1870s. In addition, there are disproportionately more extreme readings in the older part of the record. Nevertheless, excluding the earlier part of the time series, Härnösand were deemed to be most appropriate to use for the precipitation reconstruction. The correlation with the chronology was very similar to that of the E-OBS, however, a relatively low variability was identified in the first decades of the E-OBS dataset, which was not reflected in either the chronology or in the Härnösand time-series.
In order to explore and detect possible cyclicity in the precipitation reconstruction, we employed power spectral analysis using the NCAR Command Language (UCAR/NCAR/CISL/TDD, 2019). This is a technique used to examine the frequency components of a time series by decomposing its variance into different frequency bands, typically using Fourier Transform methods. Thus, it helps identify dominant periodicities and energy distributions within the data (Bingham et al., 1967).
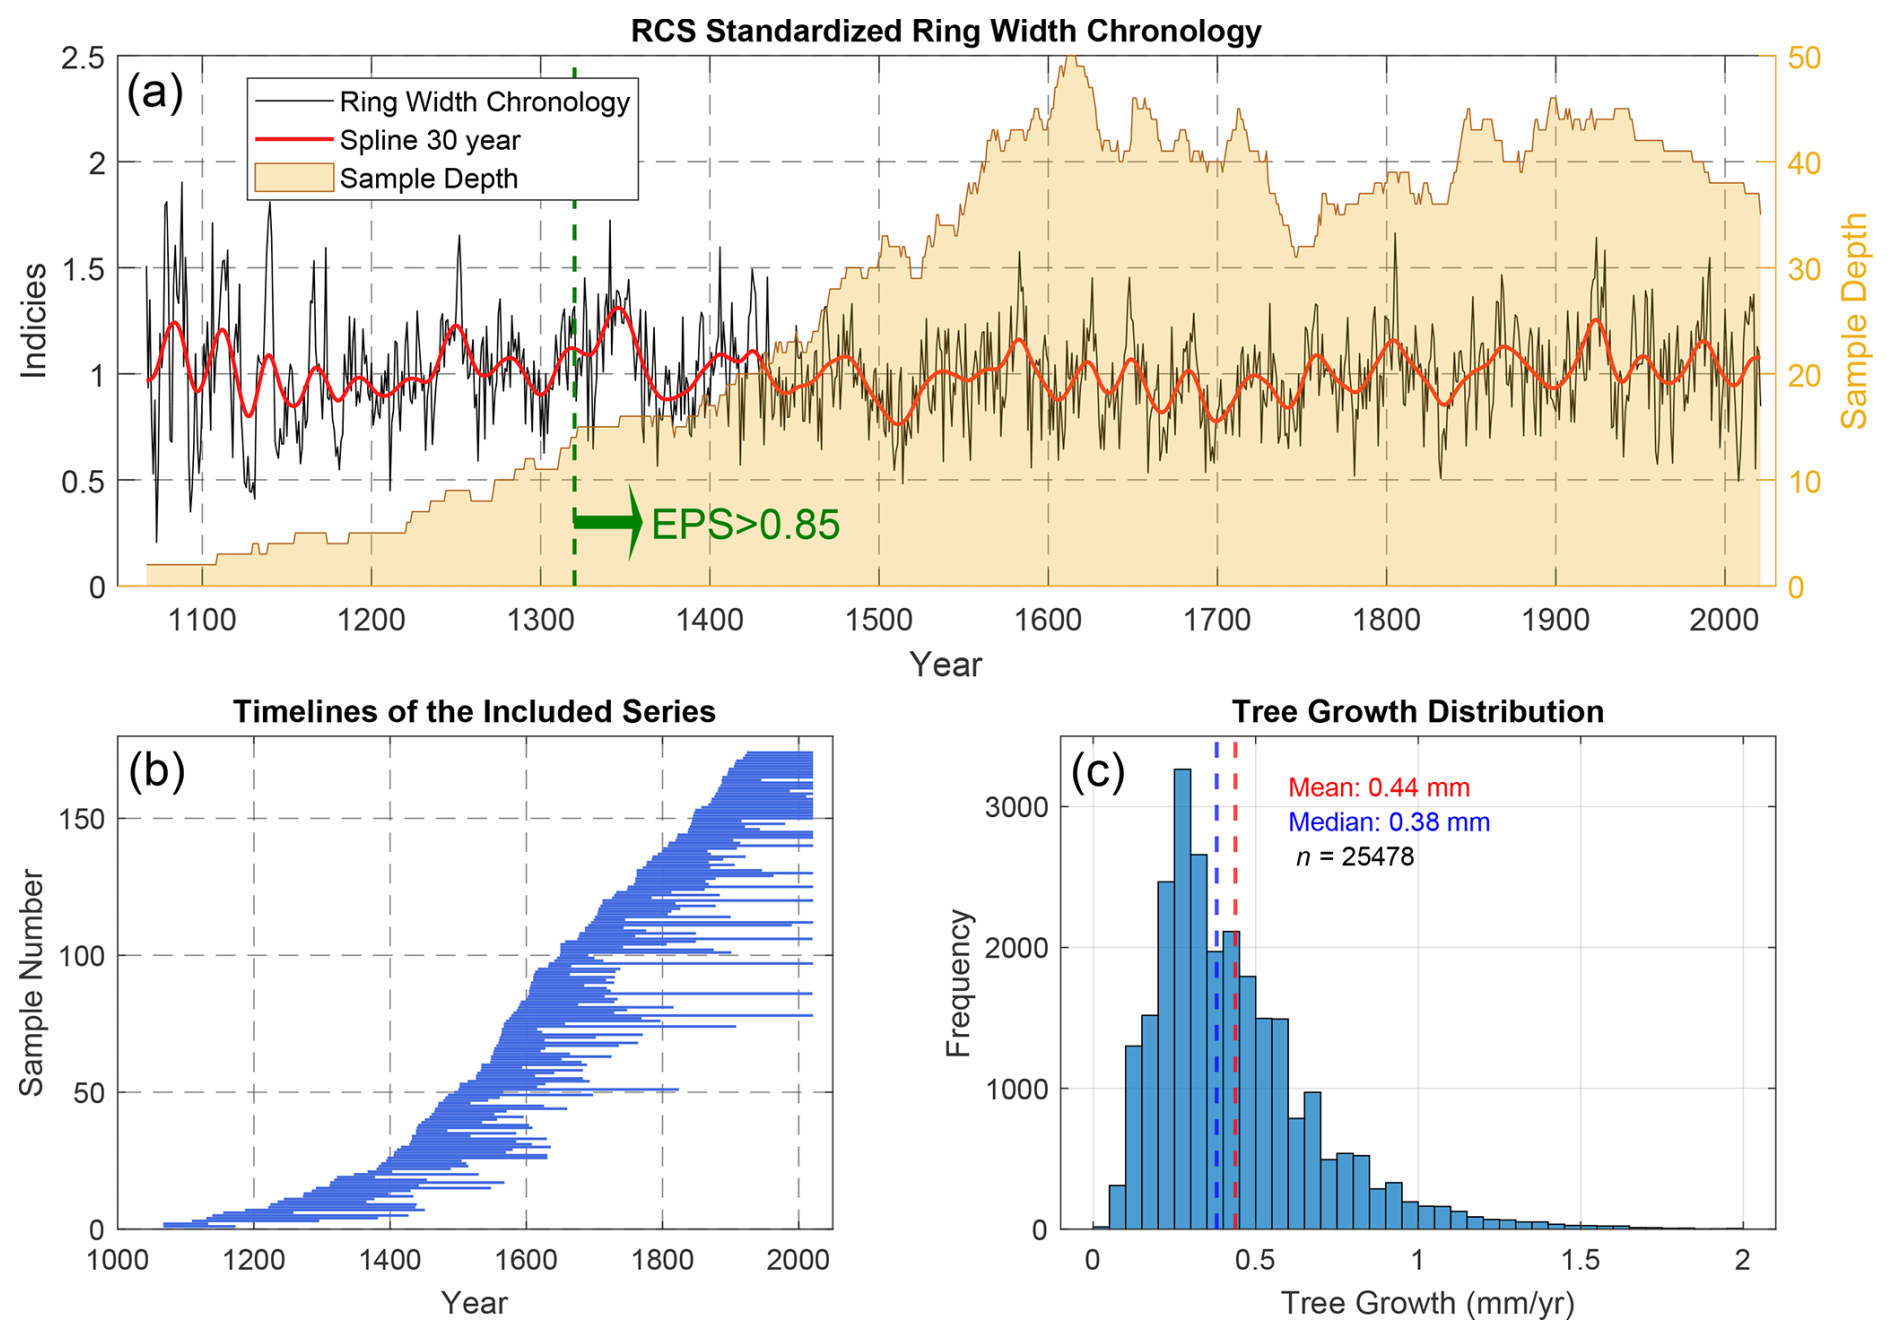
Figure 4Ring-width chronology built from 165 samples and 155 unique trees. (a) The tree-ring width chronology (black line), standardized using the multiple Regional Curve Standardization (mRCS) approach, smoothed with a 30-year cubic spline (red line). Sample depth is shown on the right y-axis. (b) The temporal extent of the individual series included in the chronology. (c) Distribution of all actual (non-standardized) tree-ring widths.
3.1 Ring width chronology
The mRCS ring-width chronology covers the period 1067–2021 CE (Fig. 4). From 1526 onward, the sample depth remains consistently above 30 series. However, it gradually declines further back in time, and prior to 1320, the EPS drops below 0.85 – the commonly accepted threshold for dendroclimatological reconstructions. A notable feature of the chronology is a strong decadal cyclicity, which is highlighted a the 30-year spline (Fig. 4). Centennial-scale trends are less pronounced, though a general decline in growth from c. 1300 to 1700 is evident, followed by a tendency toward increasing growth from 1700 into the 20th century. In the modern era, the 1920s stand out with consistently high growth. In contrast, several recent years, particularly 2009 and 2018, show short-term declines followed by quick recovery. The overall long-term trend from 1900 onwards remains relatively flat. The distribution of all raw ring widths in the chronology (Fig. 4c) reveals a broad range of growth values with an upward-skewed distribution. Several hundred measured rings fall within the 50–100 µm range, while some exceed 1.5 mm at the upper extreme. See Appendix A1 for details on the twelve age–growth classes into which the samples were divided during the mRCS standardization process.
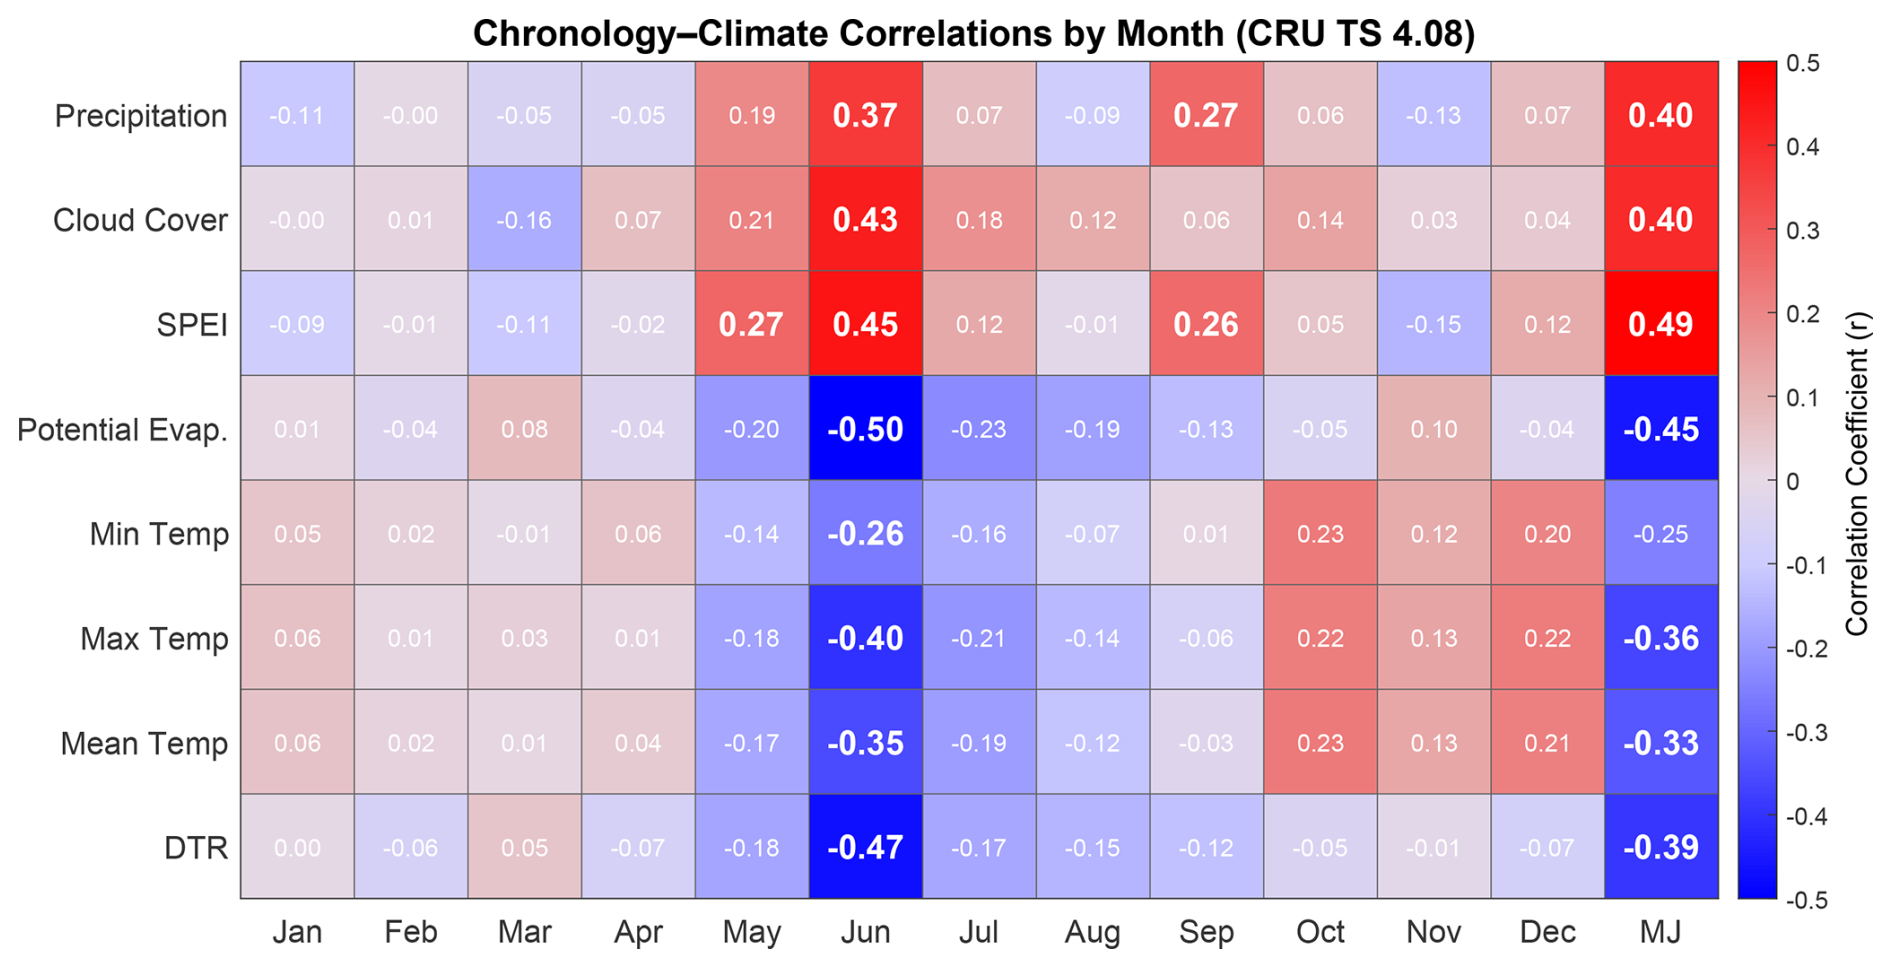
Figure 5Monthly Pearson correlations between various drought-related variables from the CRU TS 4.08 dataset and the ring-width chronology for the period 1920–2021 (except for global radiation, available from 1957–2021). The rightmost column shows correlations with climate variables averaged over the May–June (MJ) period. All time-series were detrended using a 30-year spline before correlation analysis. Climate variables include precipitation, cloud cover, the Standardised Precipitation Evapotranspiration Index (SPEI), potential evapotranspiration, temperature, and diurnal temperature range (DTR). Statistically significant correlations (P<0.01) are highlighted in bold.
3.2 Monthly correlations between precipitation and various climate variables
Figure 5 shows the monthly correlations between the ring-width mRCS chronology and various climatic variables from the CRU dataset. All variables exhibit statistically significant correlations with the chronology in June, with the strongest relationships found for diurnal temperature range (DTR), potential evapotranspiration, and the Standardized Precipitation-Evapotranspiration Index (SPEI). Variables associated with dry conditions consistently display negative correlations, and vice versa. While the CRU dataset offers a wide range of variables, precipitation data from E-OBS show substantially stronger correlations with tree-ring variables, whereas temperature correlations are similar for both datasets.
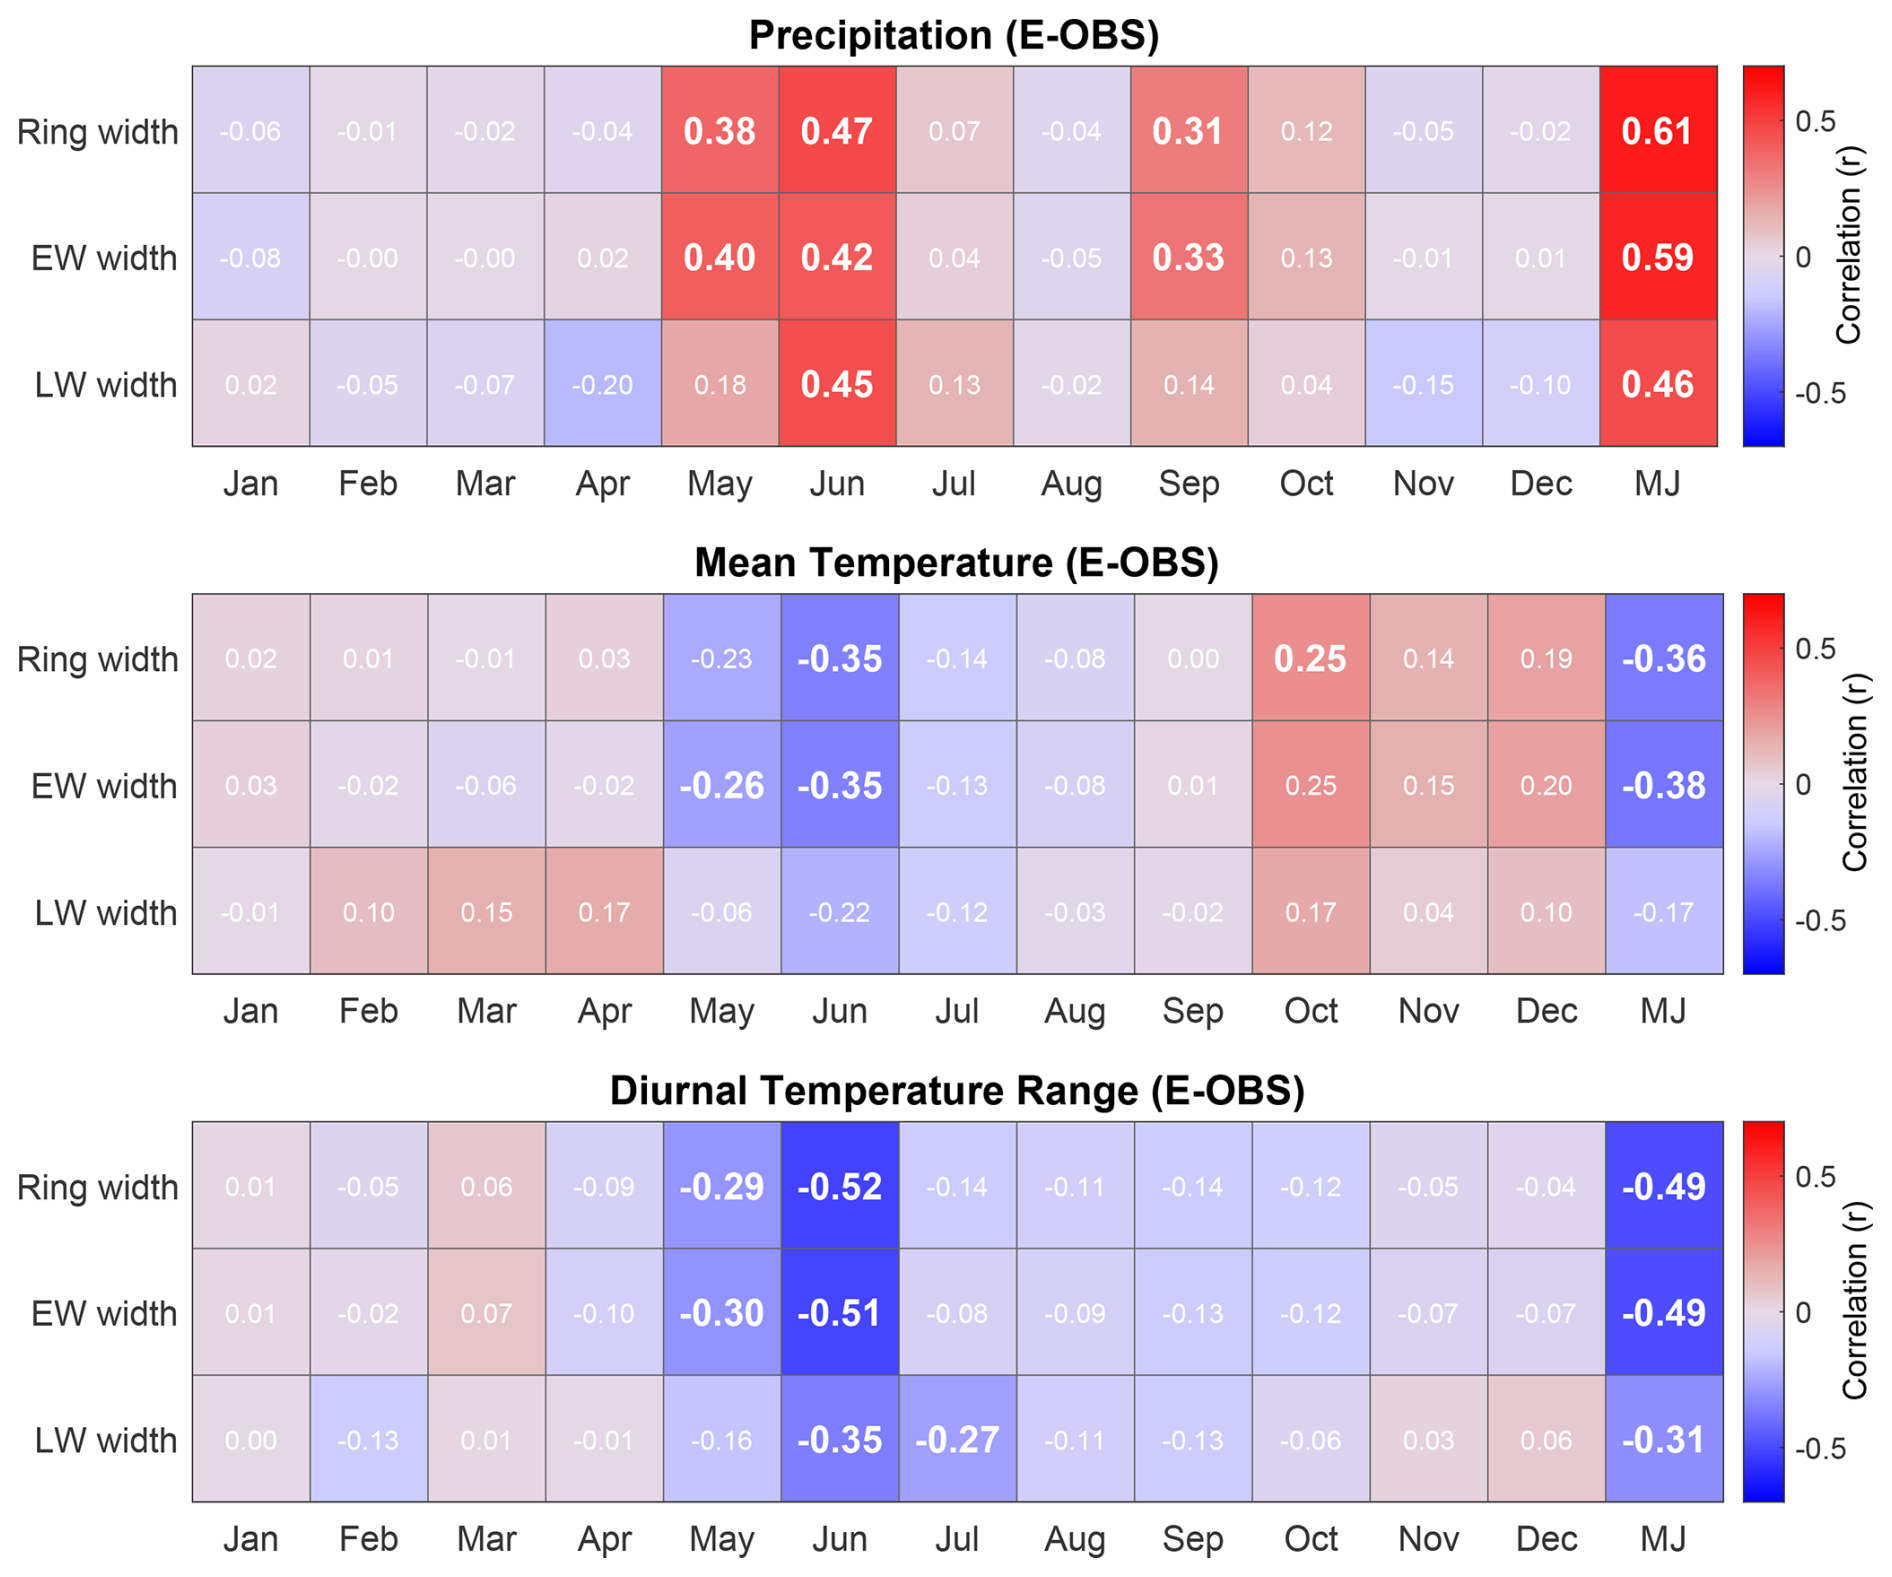
Figure 6Monthly Pearson correlations between the different ring width components and precipitation, mean temperature, diurnal temperature range using the E-OBS dataset for the 1920–2021 period. The ring width components are earlywood (EW) width, latewood (LW) width as well as the full ring width. Both the climate data and the ring width data have been detrended with a 30-years spline prior to correlation analysis. Statistically significant correlations (P<0.01) are highlighted in bold.
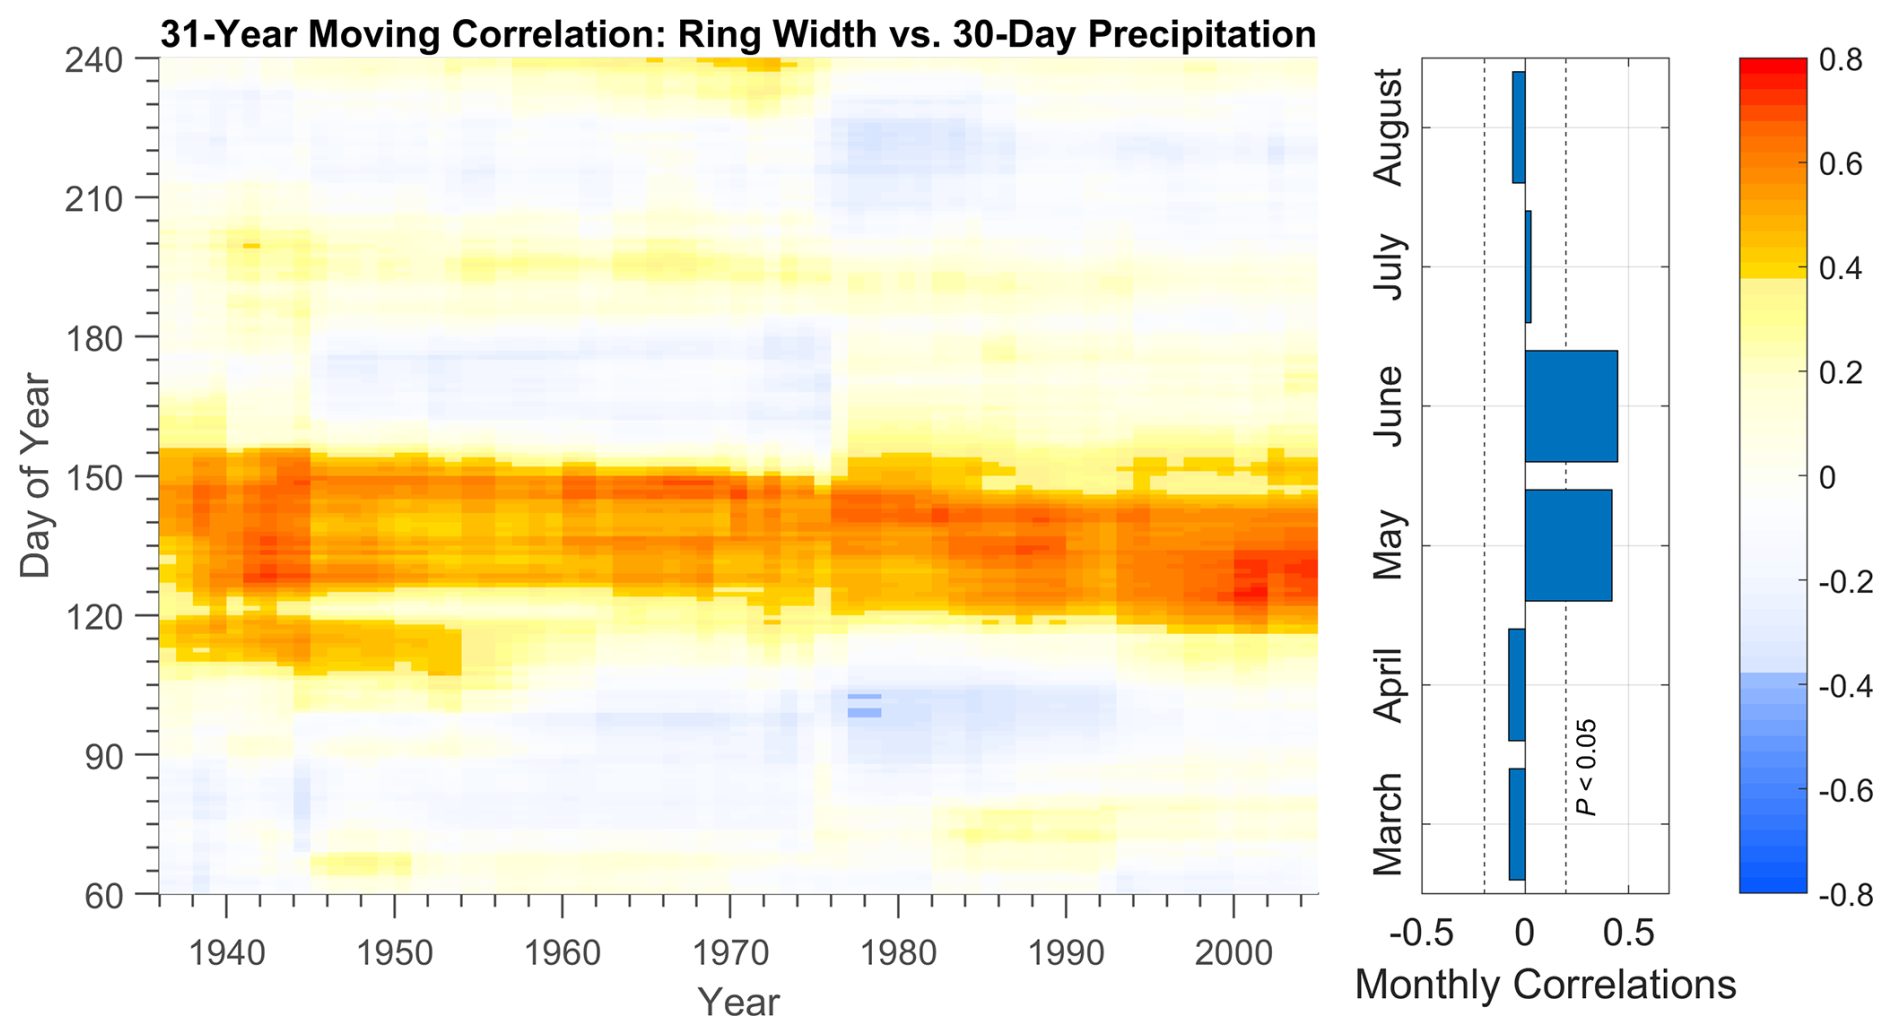
Figure 7Running 31-year correlation (Pearson) between tree-ring width and 30 d precipitation totals from the Härnösand meteorological station for the period 1920–2021. The y-axis (Day of Year) corresponds to the start date of each 30 d window. Insignificant correlations (P>0.05) are displayed in pale colours. The bar chart displays monthly correlations for the entire 1920–2021 period, the dotted line indicates a significant correlation for the entire 102-years period. The climate data and the chronology have been detrended with a 30-year spline prior to correlation analysis.
The E-OBS dataset (Fig. 6) exhibit considerably stronger correlations with the chronology, indicating a greater capacity to capture local variability in precipitation. When separating the growth ring into earlywood and latewood components, we see a tendency for later climate responses in the wood formed later in the season. September precipitation stands out with a significant correlation, which is unexpected, as tree growth is typically expected to have ceased by that time. By the time of sampling in the second half of July 2022, the trees had, according to visual inspection, already developed a substantial portion of their latewood.
Mean temperature shows a negative association with ring width and is roughly the inverse of the precipitation signal, albeit weaker. The negative correlation between temperature and ring width during the growing season contrasts with what is frequently observed in relatively cool environments. However, it is noteworthy that periods of higher precipitation tend to coincide with lower mean temperatures, suggesting that the negative correlation with temperature may be an artifact of this inverse relationship. Diurnal temperature range (DTR), for which large values are indicative of clear weather and a lack of frontal precipitation, shows an almost inverse pattern to the precipitation signal during the critical May–June period.
3.3 Running correlations: optimal target season
Figure 7 shows a running correlation analysis (31-year window) between tree-ring width and daily precipitation data from Härnösand meteorological station, calculated over 30 d moving periods. These periods are not confined to calendar months but can begin at any day of the year. For example, day 152 on the y-axis represents running correlation for the month of June. The precipitation signal remains generally stable in both timing and strength over the analysed period. The optimal target season – the window with the strongest correlation across the entire 1920–2021 period – falls within the May–June period (7 May to 2 July, r=0.63). A notable anomaly occurs between 1945 and 1975, when July shows a slightly negative correlation, due to a single outlier year. In that year (1960), a dry early summer was followed by heavy rainfall in July, yet tree growth remained relatively low (see Fig. 8). Excluding this outlier would shift the optimal target season further into July.
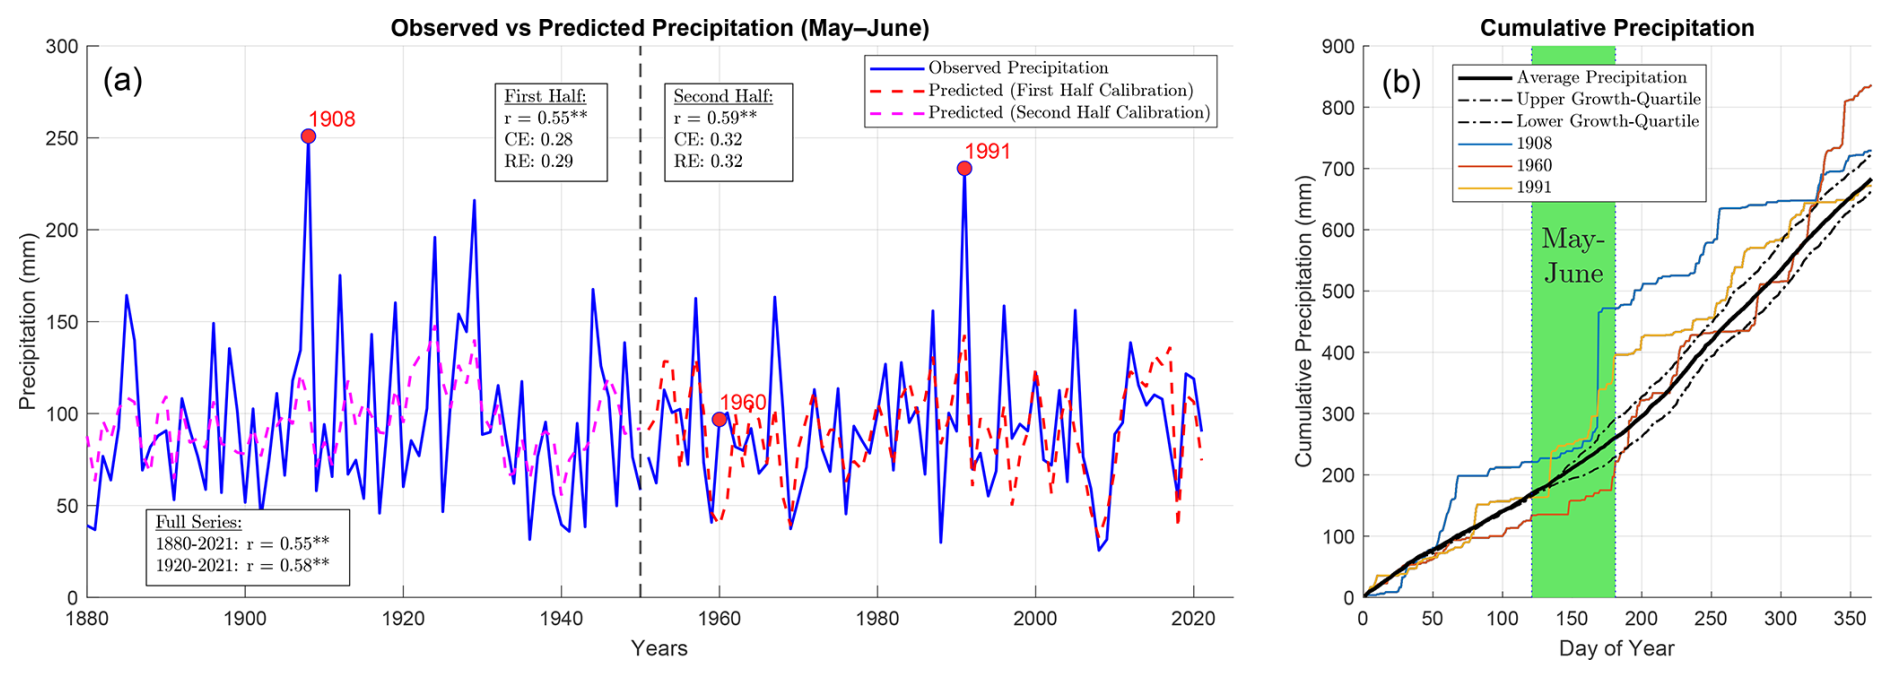
Figure 8(a) Calibration and validation of the model for May–June precipitation. The 1880–2021 period is divided into two segments (1880–1950 and 1951–2021), with linear regressions fitted to each period. The blue line represents observed precipitation, while the dashed line shows reconstructed values based on the linear regression model from the other half period. The model's performance is evaluated using the Coefficient of Efficiency (CE), Reduction of Error (RE), and Pearson correlation (r) statistics between observed and modelled precipitation. (b) Mean cumulative precipitation over the year, alongside three specific years (1908, 1960 and 1991) where observed precipitation substantially exceeded model predictions. These years are characterized by dry spells during spring, with much of the May–June precipitation occurring in short, intense events. This is especially evident in 1908, when 187 mm of precipitation was recorded on 17 June alone. Mean precipitation for years with fast and slow growth (corresponding to the upper and lower quartiles) is represented with dashed lines.
3.4 May–June precipitation reconstruction
Based on the relationship between the ring-width index and instrumental precipitation data, May–June precipitation totals were identified as the most relevant variable to reconstruct. Split-sample calibration–validation tests were conducted by dividing the periods 1880–2021 and 1920–2021 into two equally long parts (Fig. 8, see Appendix B for complete statistics). The latter period was chosen for the reconstruction due to quality concerns with the early part of the Härnösand record, which contains relatively extreme outliers. Figure 8b shows the average cumulative precipitation for 1880–2021, and three years in which observed and predicted precipitation differ markedly. The dashed black lines represent the mean of cumulative precipitation for the years of upper and lower growth quartiles of the chronology; note that they are essentially identical until early May, then they diverge.
The model significantly predicts precipitation both forward and backward (P<0.01), although it tends to underestimate the amplitude of the variability. As a robustness test, Spearman's rank correlation (ρ) was calculated in addition to the conventional Pearson's r. Spearman's ρ yielded similar correlations (although consistently slightly lower), indicating that the relationship is linear and not driven by outliers. Furthermore, although precipitation generally exhibits a skewed distribution, the May–June precipitation totals are only moderately positively skewed, and a Kolmogorov–Smirnov test (Massey, 1951) did not reject the null hypothesis of normality (see Appendix C, Fig. C1). Moreover, fitting non-linear models to the data produced trends that were essentially linear, with only negligible increases in explained variance (see Appendix C, Fig. C2). These results suggest that simple linear regression is a suitable model and that the conventional Pearson's r is an appropriate metric to describe its accuracy in our case. The linear regression model which was applied accounts for 35 % of the variance in May–June precipitation for the 1920–2021 period and was statistically significant at the P<0.01 level (see Fig. 8).
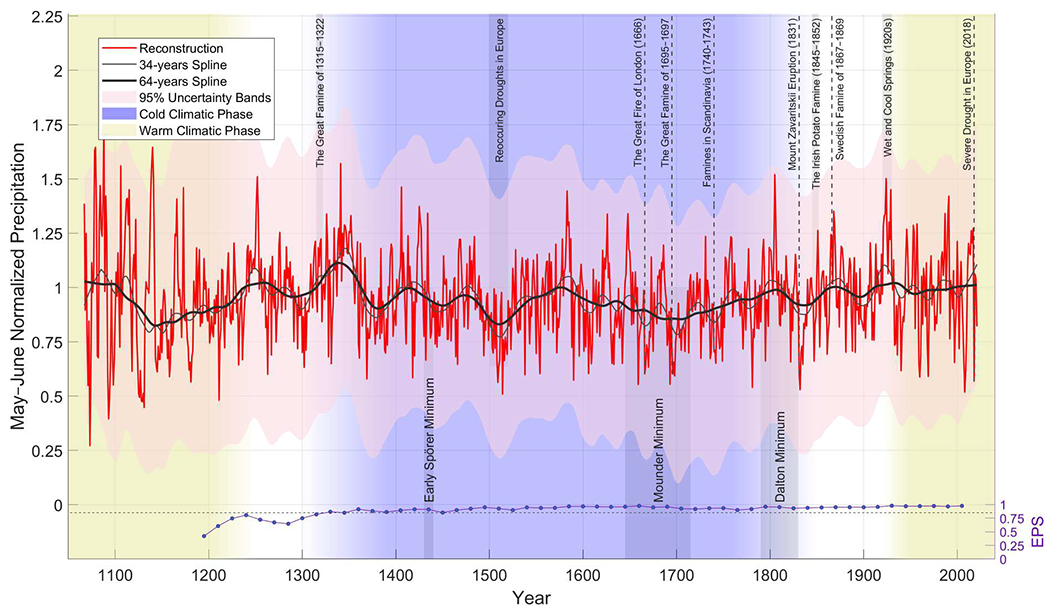
Figure 9Total May–June precipitation reconstruction based on the mRCS chronology, highlighting some significant historical events and periods of extreme weather or famine in Europe. A 34-years and 64-years spline represents the peak of the significant cycles (P<0.05) identified in the power spectrum analysis. Below the chronology, the Expressed Population Signal (EPS) is plotted on the right y-axis. Smoothed 95 % uncertainty band is shown in light red.
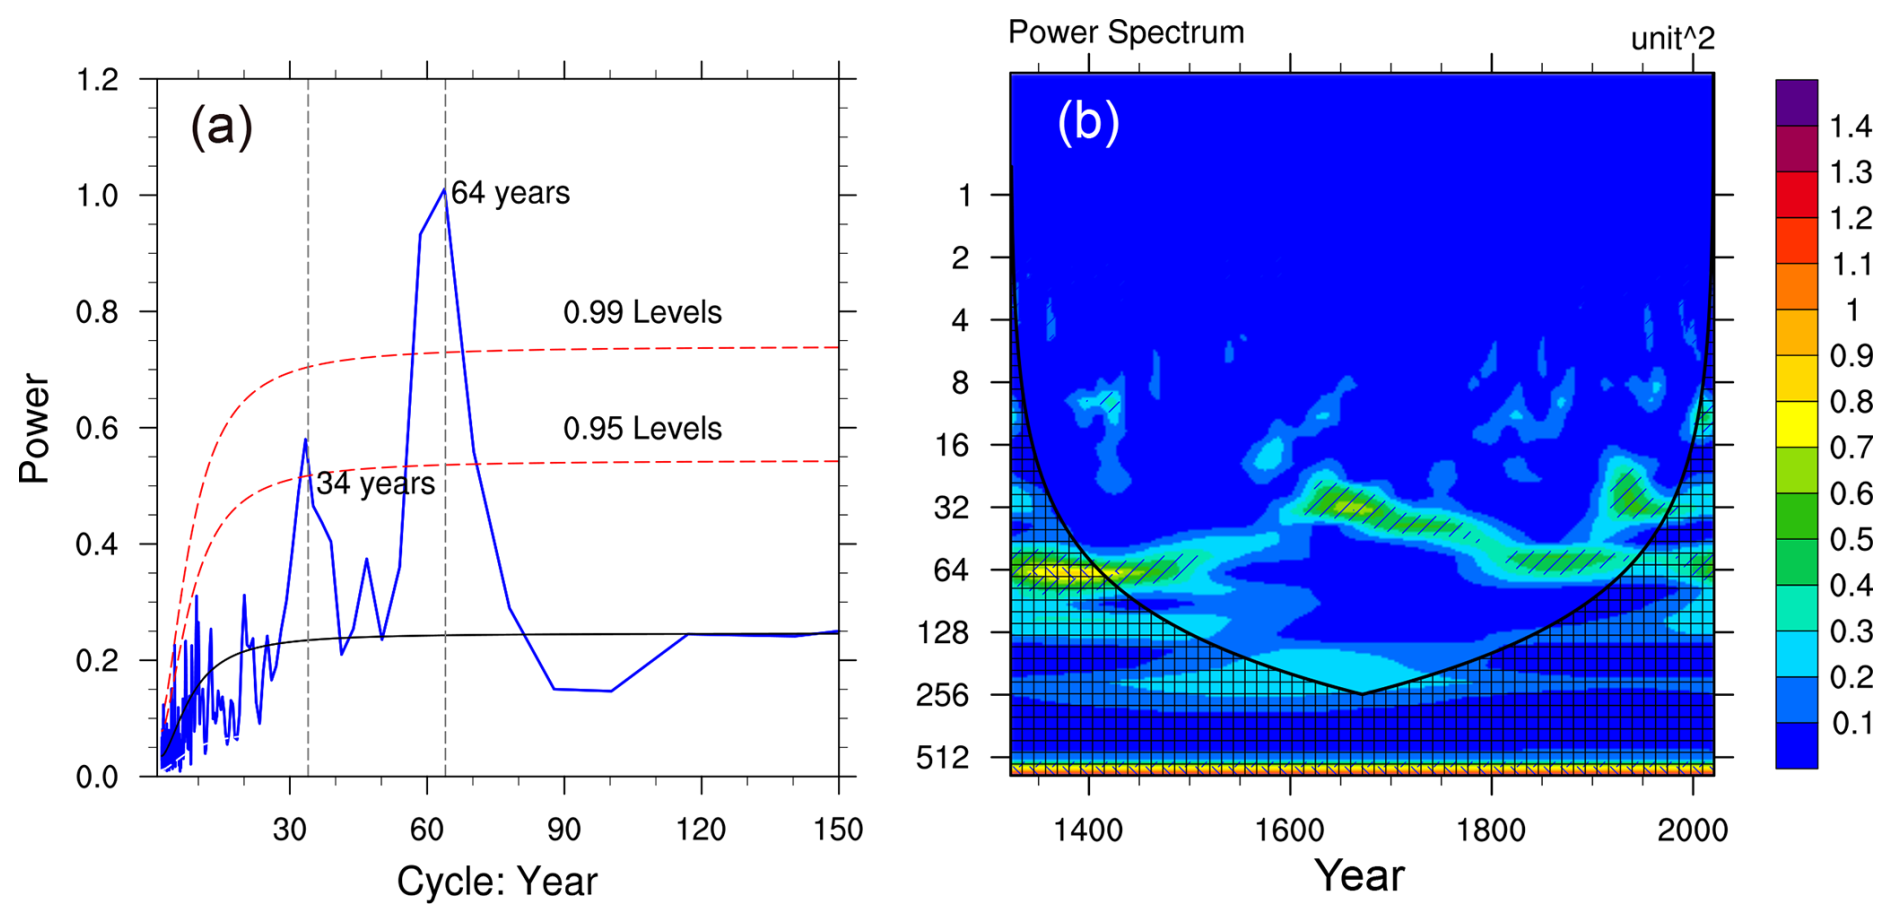
Figure 10Power spectrum and wavelet of the mRCS chronology over the period 1320–2021 during which the expressed population signal (EPS) remains above 0.85. (a) Peak years with significant power (P<0.05) are indicated. Two dashed red lines denote the P=0.01 and P=0.05. (b) Wavelet indicating the stability of the cycles over time, significant regions are (P<0.05) marked with diagonal lines.
Figure 9 shows the reconstructed May–June precipitation totals for the full length of the chronology, for which EPS exceeds the standard threshold of 0.85 from 1320 onward. Annotations are added to the reconstruction to highlight important events or periods relevant to hydroclimate variability, illustrating temporal associations without implying a necessary or demonstrable causal relationship. The spectral analysis indicates two dominant cycles in a close to 2:1 relationship, with maximum power at ∼ 64 and ∼ 34 years (Fig. 10a). To highlight these cycles, a 34-year and a 64-year spline are included in the Fig. 9. The wavelet analysis (Fig. 10b) confirms that, for most of the time series, at least one of these cycles is significant (P<0.05), with the exception of the 16th century, when a transition from the longer to the shorter cycle takes place. From 19th century onwards, the shorter cycle becomes dominant again.
A comparison with five existing hydroclimatic reconstructions for Fennoscandia (Appendix D) indicates that the two drought reconstructions based on scPDSI (Great Eurasian Drought Atlas; Cook et al., 2024) and SPEI (Seftigen et al., 2017), as well as the Härnösand precipitation reconstruction, are significantly correlated with our reconstruction over their common periods (P<0.01), while the European gridded multi-proxy precipitation reconstruction by Pauling et al. (2006) and the Finnish tree-ring-based sunshine reconstruction by Gagen et al. (2011) show no significant relationship.
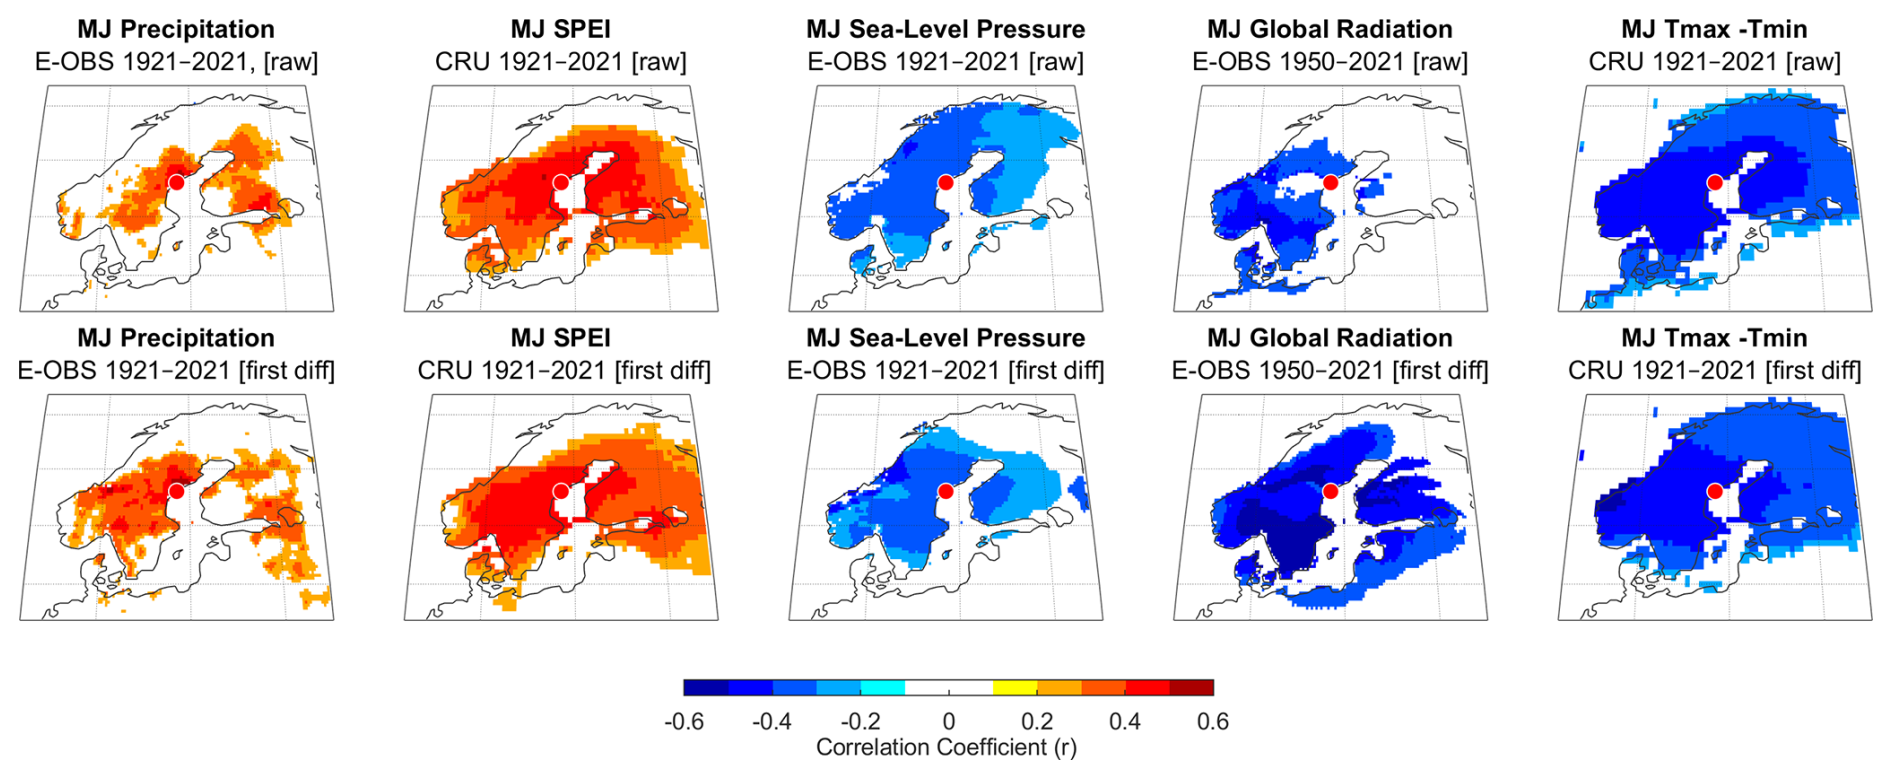
Figure 11Correlation maps (Pearson's r values, P<0.01) between tree-ring width chronology and the instrumental data for May–June over the 1921–2021 period. Raw data (upper row) and first-difference data (lower row) are shown. The red dot denotes the location of our sampling site.
3.5 Large-scale climate correlation patterns
Figure 11 shows the spatial correlation fields between the chronology and various climatic metrics – including precipitation, SPEI, cloud cover, solar radiation, and diurnal temperature range – over the May–June period. The upper panel displays results using the mRCS chronology, while the lower panel shows results based on the first-differenced chronology. Large fields with significant correlations are primarily restricted to May and July, with July consistently showing the strongest individual-month signal (see Appendix E). Thus, the seasonal response window is short, but it explains, for some climatic parameters, conditions across most of Scandinavia.
Precipitation shows the strongest correlation with chronology locally, while the other parameters – particularly those involving a temperature component, such as SPEI and diurnal temperature range (DTR) – tend to exhibit large significant field. Applying first differencing strengthens the precipitation correlation field, suggesting that high-frequency variability is better captured in the chronology than long-term trends. Interestingly, for all parameters except precipitation, the areas of strongest correlation tend to appear south or southwest of the site (which is indicated by a red dot). For individual months, June consistently exhibits the strongest signal, and for DTR and global radiation the spatial correlation field for June alone is comparable in extent to that for May–June (see Appendix E).
Reconstructing hydroclimatic conditions can be more challenging than reconstructing temperature, partly because precipitation varies more locally and tends to have a skewed distribution (Büntgen et al., 2010b; Bunde et al., 2013; Franke et al., 2013; Zhang et al., 2015). Here we have successfully developed a hydro-climatological reconstruction that extends beyond the spatial limits of most previous studies. In our view, this makes the study valuable, even though the relationship between rainfall and tree growth is not particularly strong, and the target season only spans two months. With regard to site conditions, we believe that the relative lack of human influence is related to the contrasting growing conditions compared to the surrounding valleys, which are fertile and moist and support much faster tree growth.
4.1 The climate signal and associated uncertainties
The reconstruction explained a relatively modest 35 % of the precipitation variance, leaving substantial room for growth-limiting factors beyond total May–July precipitation. Given the large uncertainties in the reconstruction, identifying long-term trends or influence from recent climate change is challenging. What we can state with high statistical confidence is the presence of a strong cyclical pattern in the record, although the exact origin of this pattern remains speculative.
For instance, the possibility that long-term trends partly are driven by temperature should not be dismissed, as indicated by relatively low growth during portions of the Little Ice Age (c. 1300–1850; Wanner et al., 2022). Nevertheless, the chronology consistently showed significant responses to all variables related to drought or soil moisture examined for one or more months. Years with unusually low growth therefore are very likely to correspond to dry conditions during the growing season. Importantly, whether rainfall occurs as intense showers or is spread out over time can greatly affect water availability, particularly in well-drained conditions as at this site. Examples of years with large amounts of precipitation concentrated in extreme events and/or with very low precipitation prior to the target season of May–June (as shown in Fig. 8b) had significant deviations between observed and predicted precipitation.
A recurring theme throughout this work is that conservative methods for reconstructing climate have generally been used (with the exception of the mRCS standardization), guided by the ethos of not adding complexity when it does not yield meaningful improvements in model performance. Obviously, an overly simplified model may fail to capture much of the signal in the data, and it is reasonable to assume that the precipitation response is dampened at high precipitation levels. However, fitting non-linear regressions such as a second-degree polynomial or a power function, also resulted in close to linear trends and a negligible increase in explained variance. Further, the linear regression calibration method used to estimate precipitation from the chronology tends to underestimate the amplitude of precipitation variability, particularly at low frequencies. However, alternative calibration methods, when accounting for the level of explained variance, would instead risk of overestimating the variability. To avoid underestimation (or overestimation) of low-frequency variability, a correlation coefficient of approximately r=0.7 or higher would be required (Christiansen and Ljungqvist, 2017).
Our reconstruction, Jönsson and Nilsson (2009), and Seftigen et al. (2017) all show significant commonalities over their overlapping periods (P<0.01) (Appendix D1). A notable difference is that Jönsson's reconstruction has much less amplitude in the decadal cycles. The SPEI reconstruction by Seftigen et al. (2017) shares common cyclic patterns with ours but also shows periods of divergence, particularly during the 1800s. Noteworthy, it is to be expected that this reconstruction differs substantially, as it has a one-month later target season, cover a broader region, and is for a drought index rather than precipitation. The gridded seasonal precipitation reconstruction for Europe developed by Pauling et al. (2006), which covers the period 1500–1900, was based on a wide variety of instrumental series and different types of natural proxies, including tree rings; however, it lacks agreement with our reconstruction. It should be noted that no paleoclimate records from Fennoscandia were included in their work. Another interesting comparison is the more than a millennia long sunshine reconstruction from western Finland by Gagen et al. (2011). However, it lies at the margin of the significant correlation field for global radiation of our chronology and year-by-year correlations show no significant relationship; however, long-term trends exhibit some tendency to be inverted as could be expected as our chronology have a significant negative correlation with sunshine for a large part of Fennoscandia. It is noteworthy that these reconstructions overlap with ours only for the month of June, as their target seasons are June–August and June–July, respectively.
4.2 Comparison of climate datasets
The CRU dataset appears to capture local variability in precipitation to a lesser extent than other records used in this study. This is not unexpected as the CRU dataset interpolates precipitation over relatively large spatial areas, introducing strong spatial smoothing in data-sparse regions, which likely explains why E-OBS captures local precipitation variability more effectively – particularly in coastal regions with sharp spatial gradients (Haylock et al., 2008; Harris et al., 2020). The close similarity between the E-OBS precipitation data and the Härnösand record – the only dataset covering 1920–2021 within the 1°×1° grid box used here – suggests a substantial contribution of the Härnösand record to the E-OBS data for this area.
The Standardized Precipitation-Evapotranspiration Index (SPEI) was the only CRU variable showing significant correlation with the chronology for both May and June, and it also had a relatively large significant correlation field. The fact that the CRU-derived SPEI exhibits a weaker local correlation with the chronology than E-OBS precipitation (r=0.49 vs. r=0.61) likely originates from the precipitation component in the index. It would be of great interest to explore a drought index based on datasets that better reflect year-to-year precipitation variability than CRU currently provides in the region. It has further been suggested that the more complex Palmer Drought Severity Index (PDSI) is more suitable for high-latitude regions with seasonal snowpack, such as Scandinavia (Raible et al., 2017). However, the PDSI responds slowly and reflects conditions over the preceding 9–12 months. Our site, by contrast, has thin, well-drained soils, and tree growth is affected by meteorological conditions over a much shorter period. This is evident from the fact that May is the first month of the year to show a positive correlation with precipitation. Moreover, Seftigen et al. (2017; see Appendix D) conducted an extensive evaluation of tree growth sensitivity to drought, applying the SPEI across multiple accumulation periods (1 to 24 months). While our specific site was not included, the study encompassed ecologically analogous sites across Scandinavia. Their findings demonstrate a consistent and robust growth response to short-duration summer drought events, emphasizing the limited relevance of long-term drought indices such as the PDSI in such settings. These results suggest that snowpack and associated meltwater inputs are of marginal hydrological significance in environments with limited water-holding capacity and rapid soil drainage.
Precipitation data from Härnösand weather station outperformed both E-OBS and CRU in terms of reflecting local conditions, particularly prior to 1950 – even though the station is located more than 50 km from the site. This may be due to the fact that both locations share similar environmental settings – they are coastal and separated from the open Baltic Sea by a few kilometres of archipelago.
4.3 Trends, cycles and historical events
Severe droughts across Europe over the past millennium are clearly imprinted in European tree-ring data (Cook et al., 2015). Droughts, sometimes lasting multiple years, were also occurring during portions of the Little Ice Age and are well documented in historical data (Pfister and Wanner, 2021) and tree-ring data in Central Europe (Büntgen et al., 2021; Arosio et al., 2025). The sparse documentary information over climatic conditions in Sweden from the 16th century reveals dry conditions for most off that century (Leijonhufvud and Retsö, 2021), something not shown in our chronology. Such differences may be related to geography as most documentary records derives from the southern one-third of Sweden (below about 60° N). Several historically documented droughts are traceable in the chronology, while others are not, likely because the study site is too distant to reflect the climate impacts experienced in more densely populated agricultural regions (for historical drought-impacts on agriculture in southern Sweden, see Skoglund, 2022, 2023). Interestingly, some periods of reduced solar activity, typically connected with colder climate phases, such as the early part of the Spörer Minimum in (1430s), and the Dalton Minimum (1790–1830 CE), coincides with relatively rapid tree growth, indicating that the trees are moisture-limited and thrive under wet conditions. Even highly anomalous low growing-season temperatures do not necessarily result in suppressed growth at this site. This is well illustrated by 1867, which experienced an exceptionally cold spring and short summer that led to severe crop failure in northern Sweden (Forsberg and Bohman, 2024), yet the chronology presented here shows above-average growth in that year. However, during the Maunder Minimum (1645–1715 CE), growth conditions at the site were generally unfavourable, indicating that dry conditions prevailed during a period that is well established as cold (e.g., Esper et al., 2024). This represents a notable exception to the climate–growth relationship observed at our site. The reasons for this, including the possible role played by different hydroclimatic conditions, warrant further research.
Moreover, the long cycle is generally stronger throughout the chronology, as indicated by the dominant peak in the power spectrum at approximately 64 years (Fig. 10a). An exception occurs during the period c. 1600–1800, there the short cycle (∼ 34 years) dominates and reaches its maximum power in the second half of the 1600s, coinciding with the Maunder Minimum, as indicated by the wavelet analysis (Fig. 10b). Interestingly, Torbenson et al. (2025) identified a significant breakdown around 1700 CE in the usual teleconnection pattern of drought among regions that are normally linked through the El Niño–Southern Oscillation (ENSO). However, their work focused on Asia, Eastern Australia, and North America, so any similarities with Fennoscandia should be interpreted with caution. The Maunder Minimum contributed to harsh conditions across Europe, with severe harvest failures in many regions in the 1690s (Ljungqvist et al., 2024), including the Nordic countries, culminating in the great famine of 1695–1697 (Dribe et al., 2017). In present-day Finland, nearly one-third of the population died during this famine (Huhtamaa et al., 2022).
Lastly, although the reconstructed period–May to June–is relatively short, it is critically important for agriculture in Sweden (Skoglund, 2023). Our new precipitation reconstruction from Skuleskogen explains large-scale weather patterns not only near the site but for much of southern Sweden as well. This means that the Skuleskogen tree-ring chronology can provide valuable information on May–June hydroclimate conditions also in the southern one-third of Sweden where drought can be expected to result in poorer harvest yields for most major crops historically (Edvinsson et al., 2009; Ljungqvist et al., 2023) as well as today (Skoglund, 2023). Thus, the new dataset presented here offers the potential to improve our understanding of harvest variations over the past millennium.
4.4 Prospects for extending the chronology further back in time
About a dozen lakes in the area, both near the site and further inland, were investigated for subfossil material. However, the available material appears to be limited and/or originates from environments with persistently moist conditions, making the woods from these sites less suitable for extending the existing chronology. Among our sample collection, approximately 50 samples could not be dated, including some relatively long segments with non-complacent growth pattern, suggesting they may predate the established chronology. In addition, 50–75 yet unprocessed deadwood samples remain, most of which are relatively small pieces with only a small portion of the original cross-section persevered. These samples are potentially old and could contribute to extending the chronology, although their segment lengths are expected to be short. This presents a promising opportunity to extend the record further, contingent upon successful dating of additional material from the site. Radiocarbon (14C) dating could initially help verify whether these undatable samples are indeed older than the current reference chronology or simply lack synchronous growth signals necessary for cross dating. The long-term preservation of wood at this site, evidenced by well-preserved samples such as the one shown in Fig. 3, supports the potential to extend the chronology beyond a millennium. This underscores the broader opportunity to develop long tree-ring-based hydroclimate reconstruction from carefully selected sites in the sub-Arctic boreal forest zone – a region that remain underutilized in high-latitude tree-ring-based hydroclimate reconstructions. Looking ahead, we aim to analyse Blue Intensity data from the same material to further assess its potential for capturing hydroclimatic variability across high-latitude environments, with the aim of advancing large-scale climate reconstructions in regions where such records remain critically underrepresented.
We present the first tree-ring-based precipitation reconstruction from boreal sub-Arctic Sweden extending back to medieval time (with EPS >0.85 from 1320 CE to 2021 CE). Drought related variables such as precipitation, SPEI, sunshine, cloudiness and sea-level pressure significantly correlate with the chronology during a short but critical season typically ranging from late spring to early summer, with no or little climate signal beyond early July. Significant spatial correlations extend across a much of Fennoscandia for May–June. The broad spatial signal, particularly for the wetter southwestern parts of Scandinavia, demonstrates the added value of our dataset in regions where identifying drought-sensitive or moisture-limited trees is inherently challenging. There is a strong potential to extend the current tree-ring chronology back to at least 1000 CE, if not earlier. Reconstructions of other variables, such as global radiation or a drought index are also feasible, underscoring the broader opportunity to develop long tree-ring-based hydroclimate reconstruction from carefully selected sites in the sub-Arctic boreal forest zone.
What follows is an abridged description of the multiple Regional Curve Standardization (mRCS) programs developed by Paul J. Krusic (https://www.geog.cam.ac.uk/research/projects/dendrosoftware/, last access: 11 February 2026) that represent an attempt to marry the need for removing non-climatic biological trends with conserving low-frequency climatic trends in annual tree-ring increments. Version 12 of the mRCS can distinguish up to 12 age–growth classes; two age classes, short and long; and six growth classes. A first order growth class distinction is based on the performance of each series' initial growth relative to that of the mean or median of the cohort's initial growth. For example, in version v12 the initial growth rate of the two age cohorts, Short and Long, is partitioned into three growth classes; ShortLow; series with an initial growth rate that is < (μ-1σ); ShortHigh; series' initial growth rate is > (μ-1σ); and ShortMid; all that remain. The next three growth conditions are based on the performance of the middle and final third of each series' growth rate. For example, the v12 age–growth class; ShortLow_LowMid contains all those series with a low initial growth rate, relative to the initial mean or median of all series in the short age cohort; and a low mid-life growth rate relative to the rate of growth in the series' final rd measurements (i.e., _LowMid). Conversely, the age–growth class LongHigh_HighMid describes long series that have overall high initial growth, and relatively high mid-life growth in relation to the growth rate in the last third of the series' length. In the end there are 12 age–growth classes.
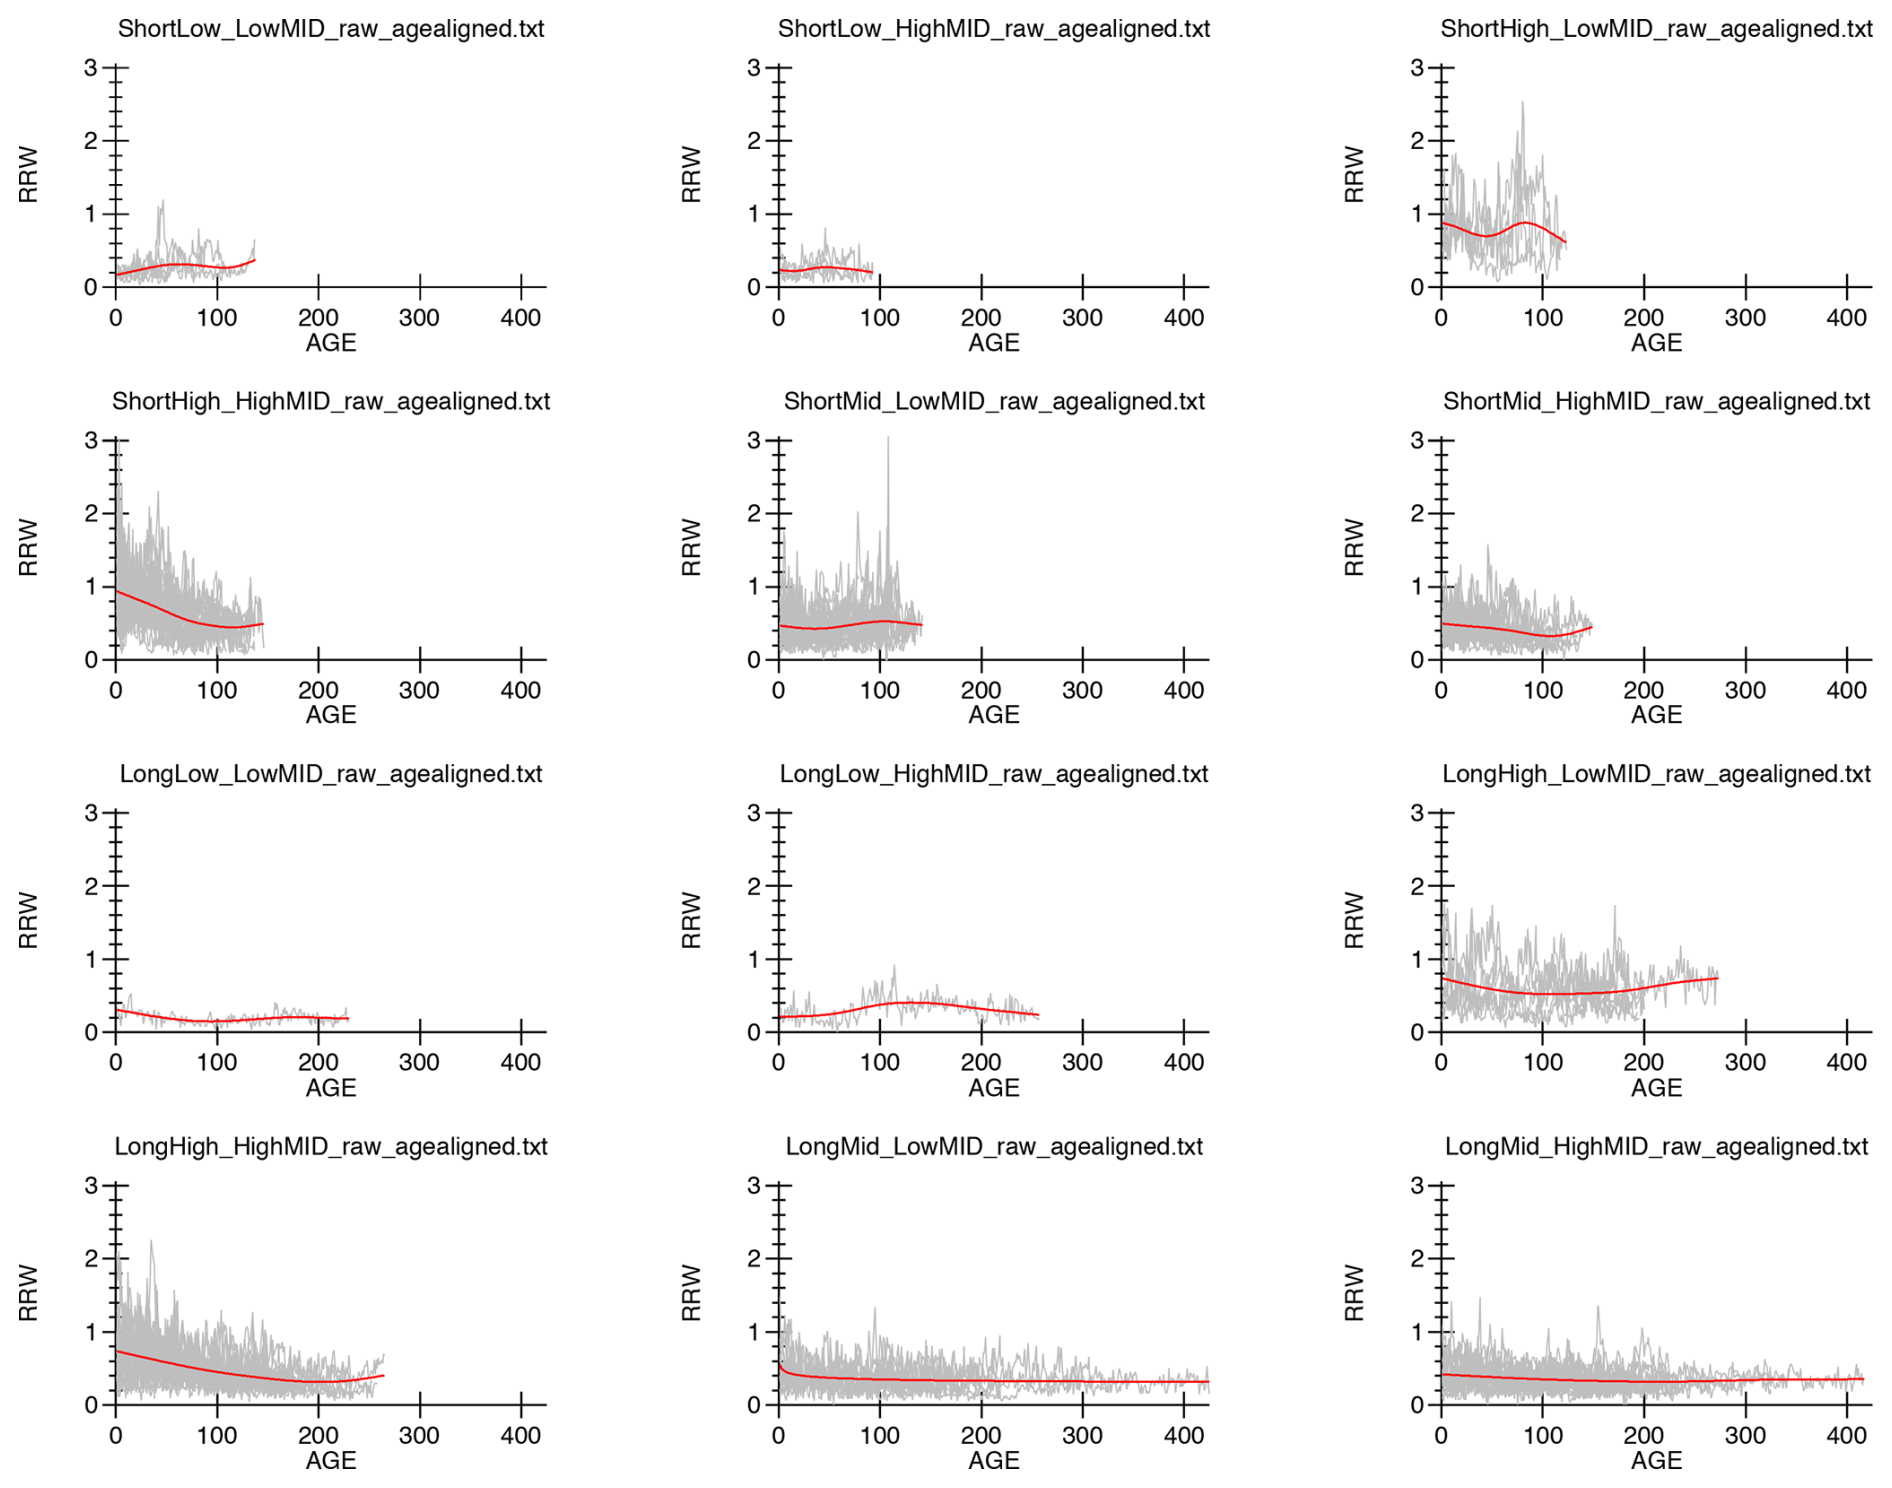
Table B1Split-sample calibration–validation results for the relationship between May–June Härnöand precipitation totals and the mRCS ring-width chronology, evaluated over the periods 1880–2021 and 1920–2021.
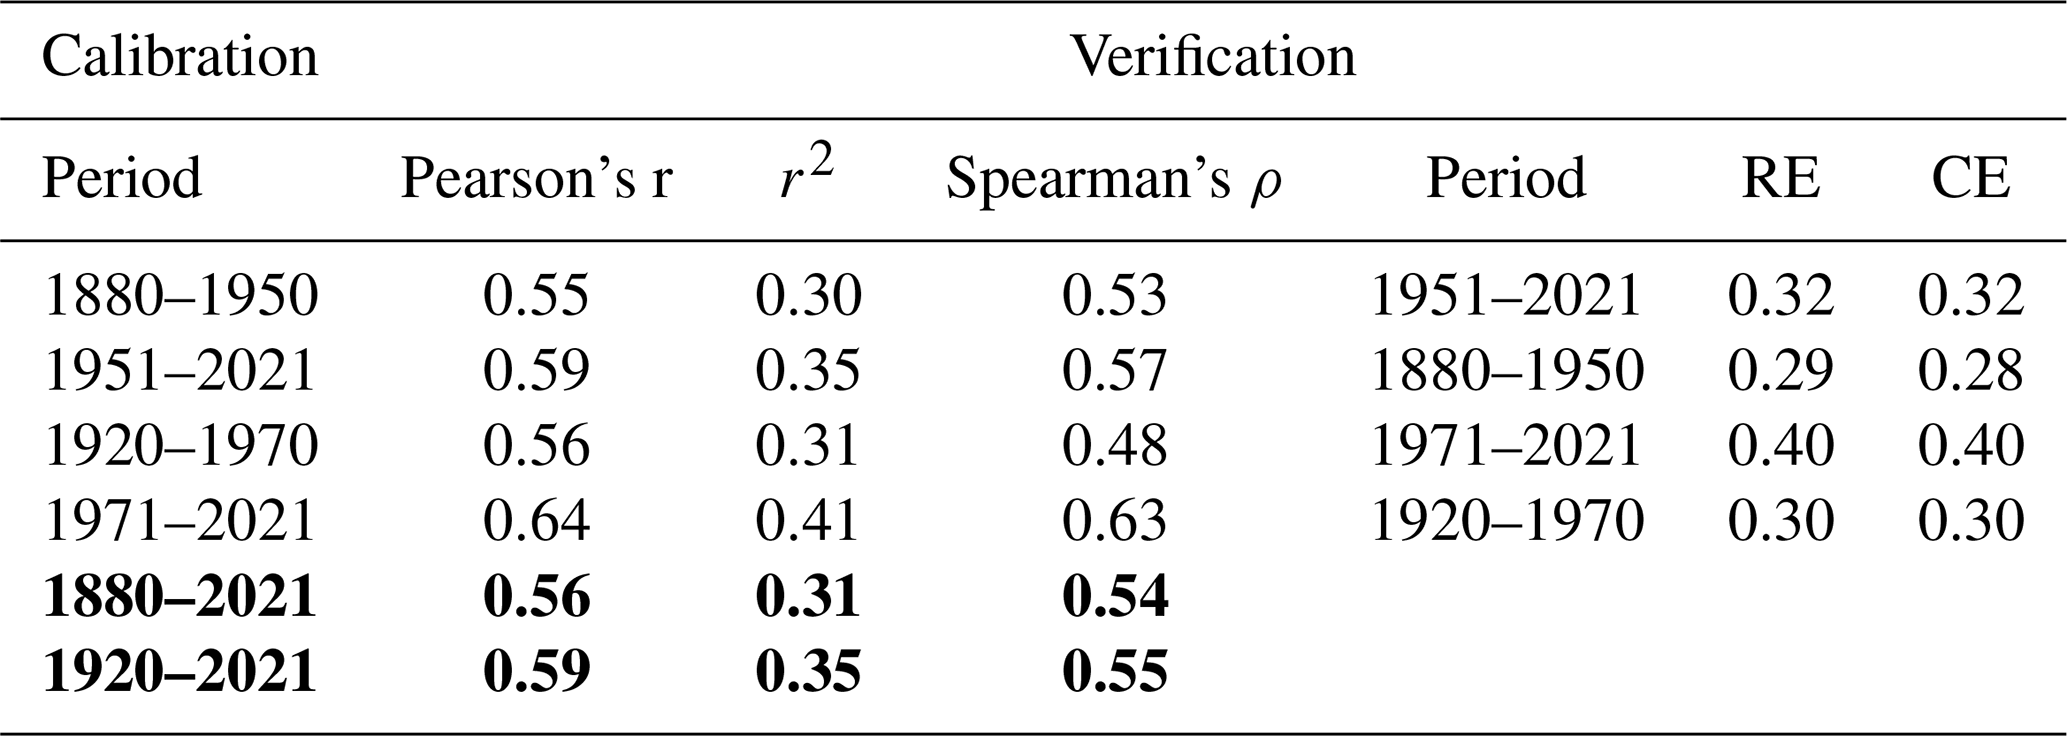
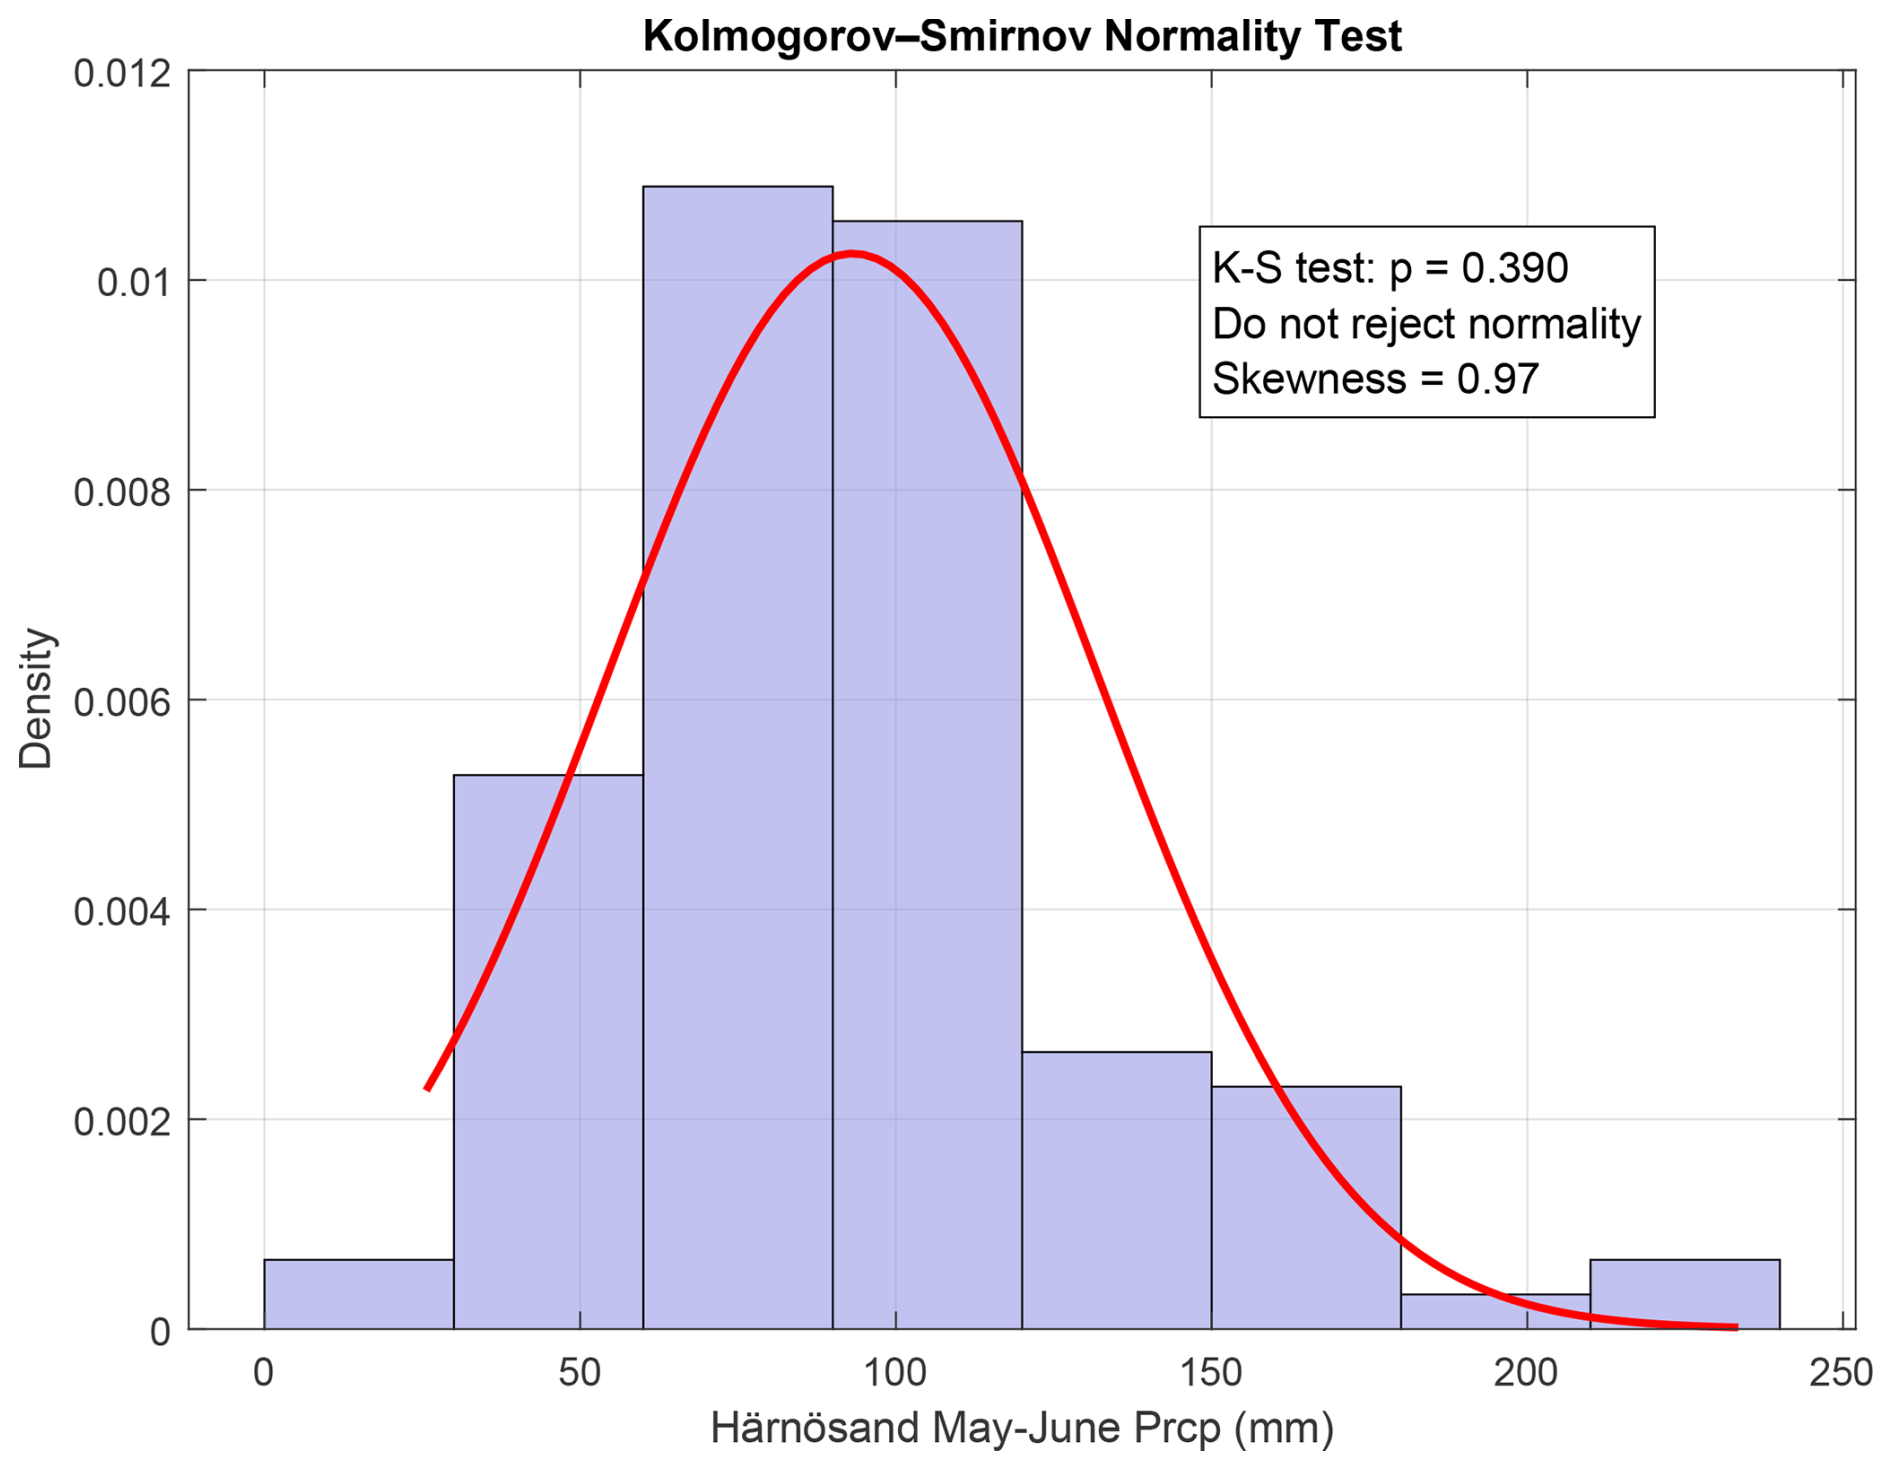
Figure C1Distribution of May–June precipitation recorded at the Härnösand weather station for the period 1920–2021, along with the results of the Kolmogorov–Smirnov test for normality.
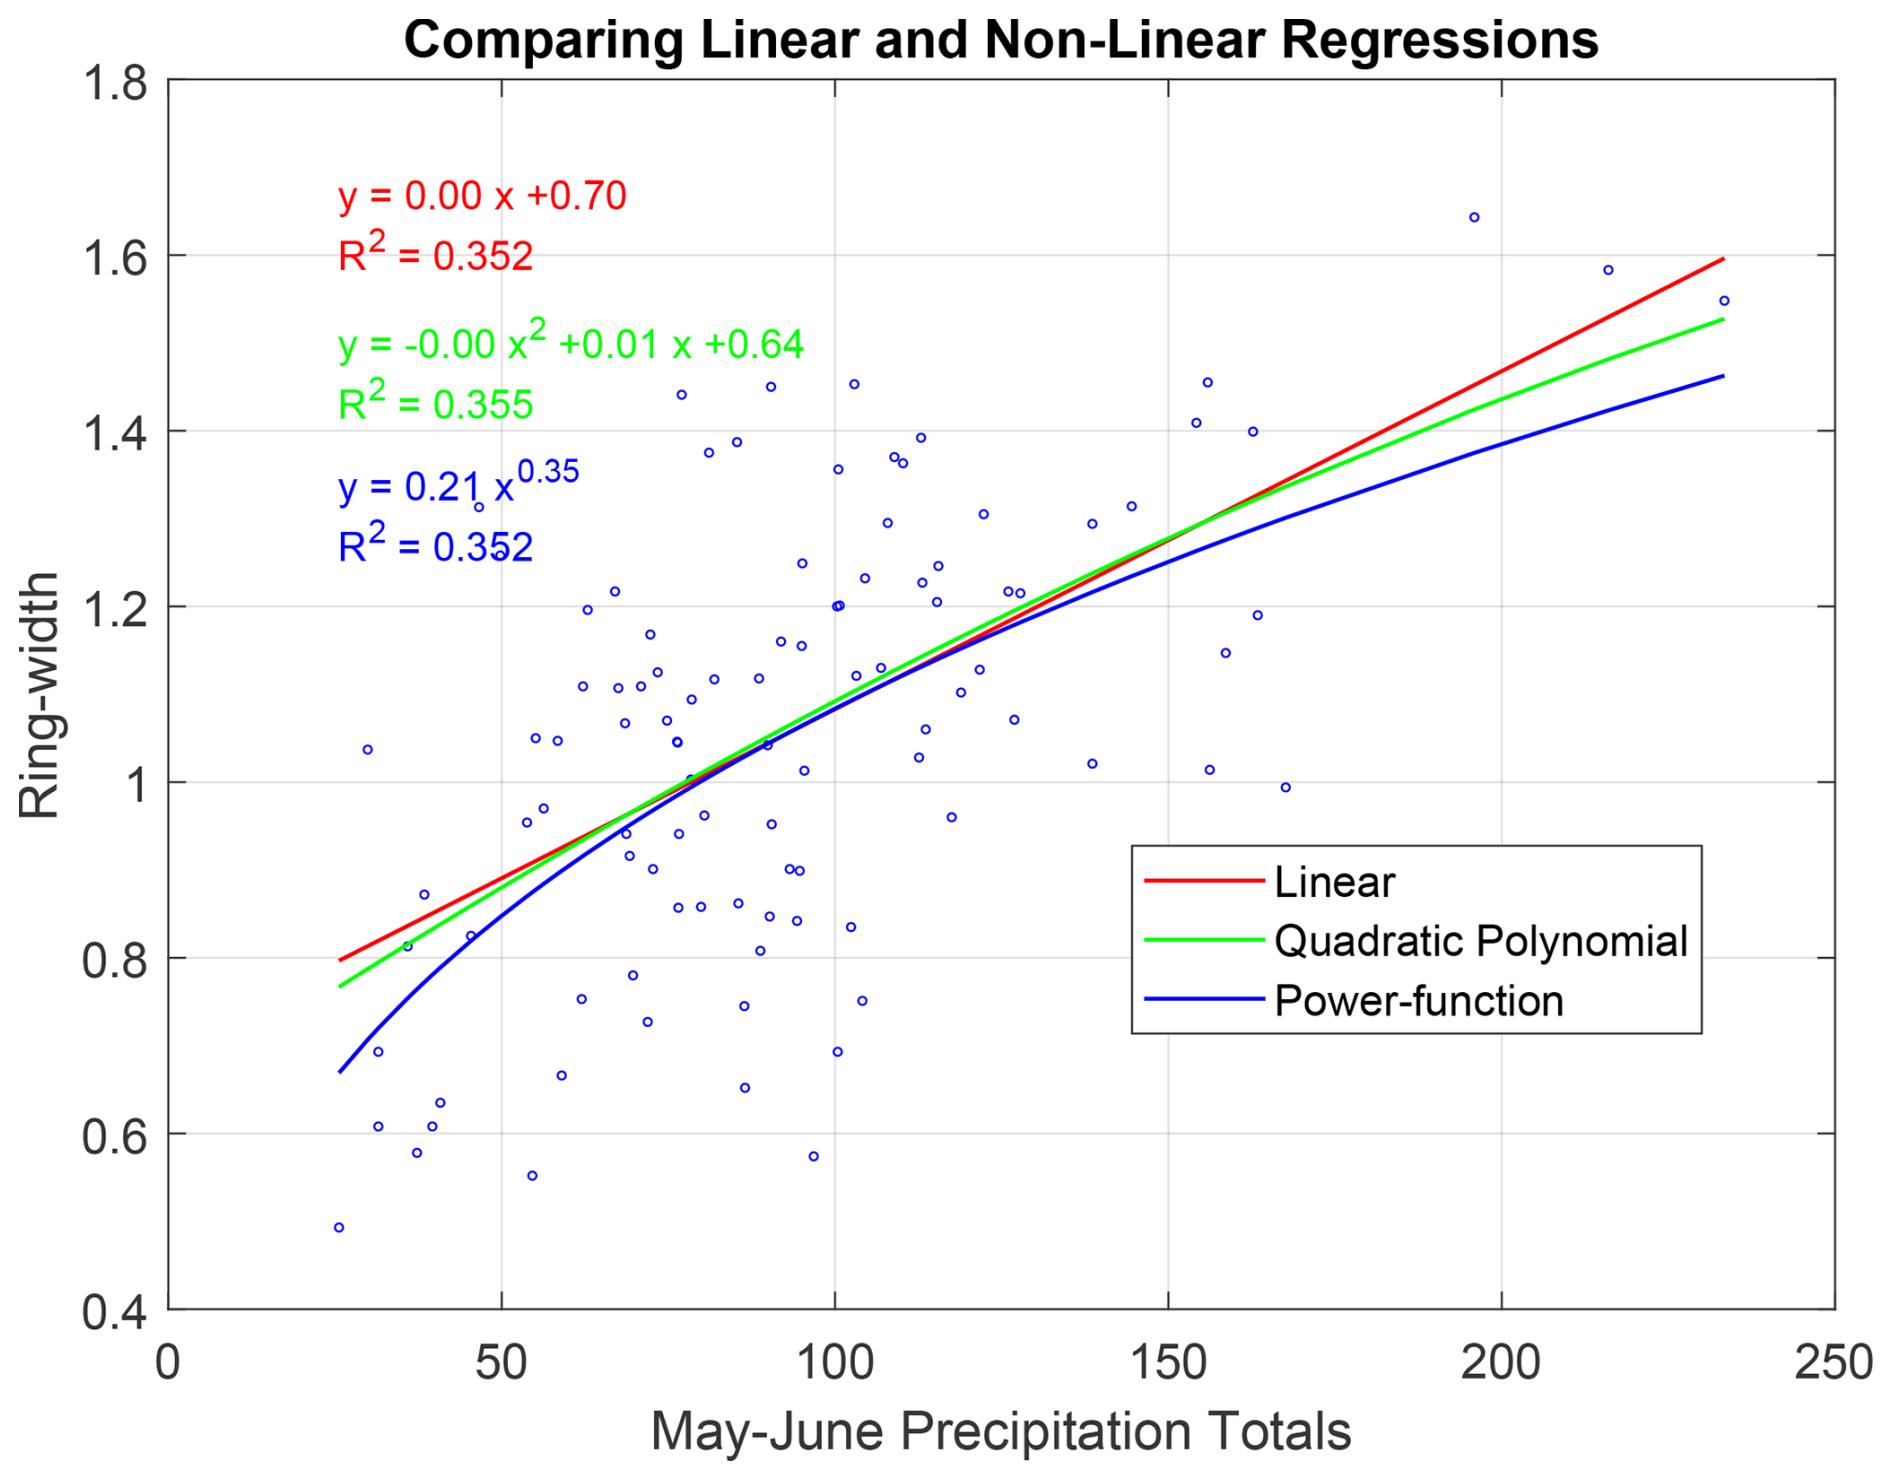
Figure C2Scatter-plot of May–June precipitation totals with fitted regression models (linear, polynomial and power function). Corresponding regression equations and R2 values are displayed in the figure.
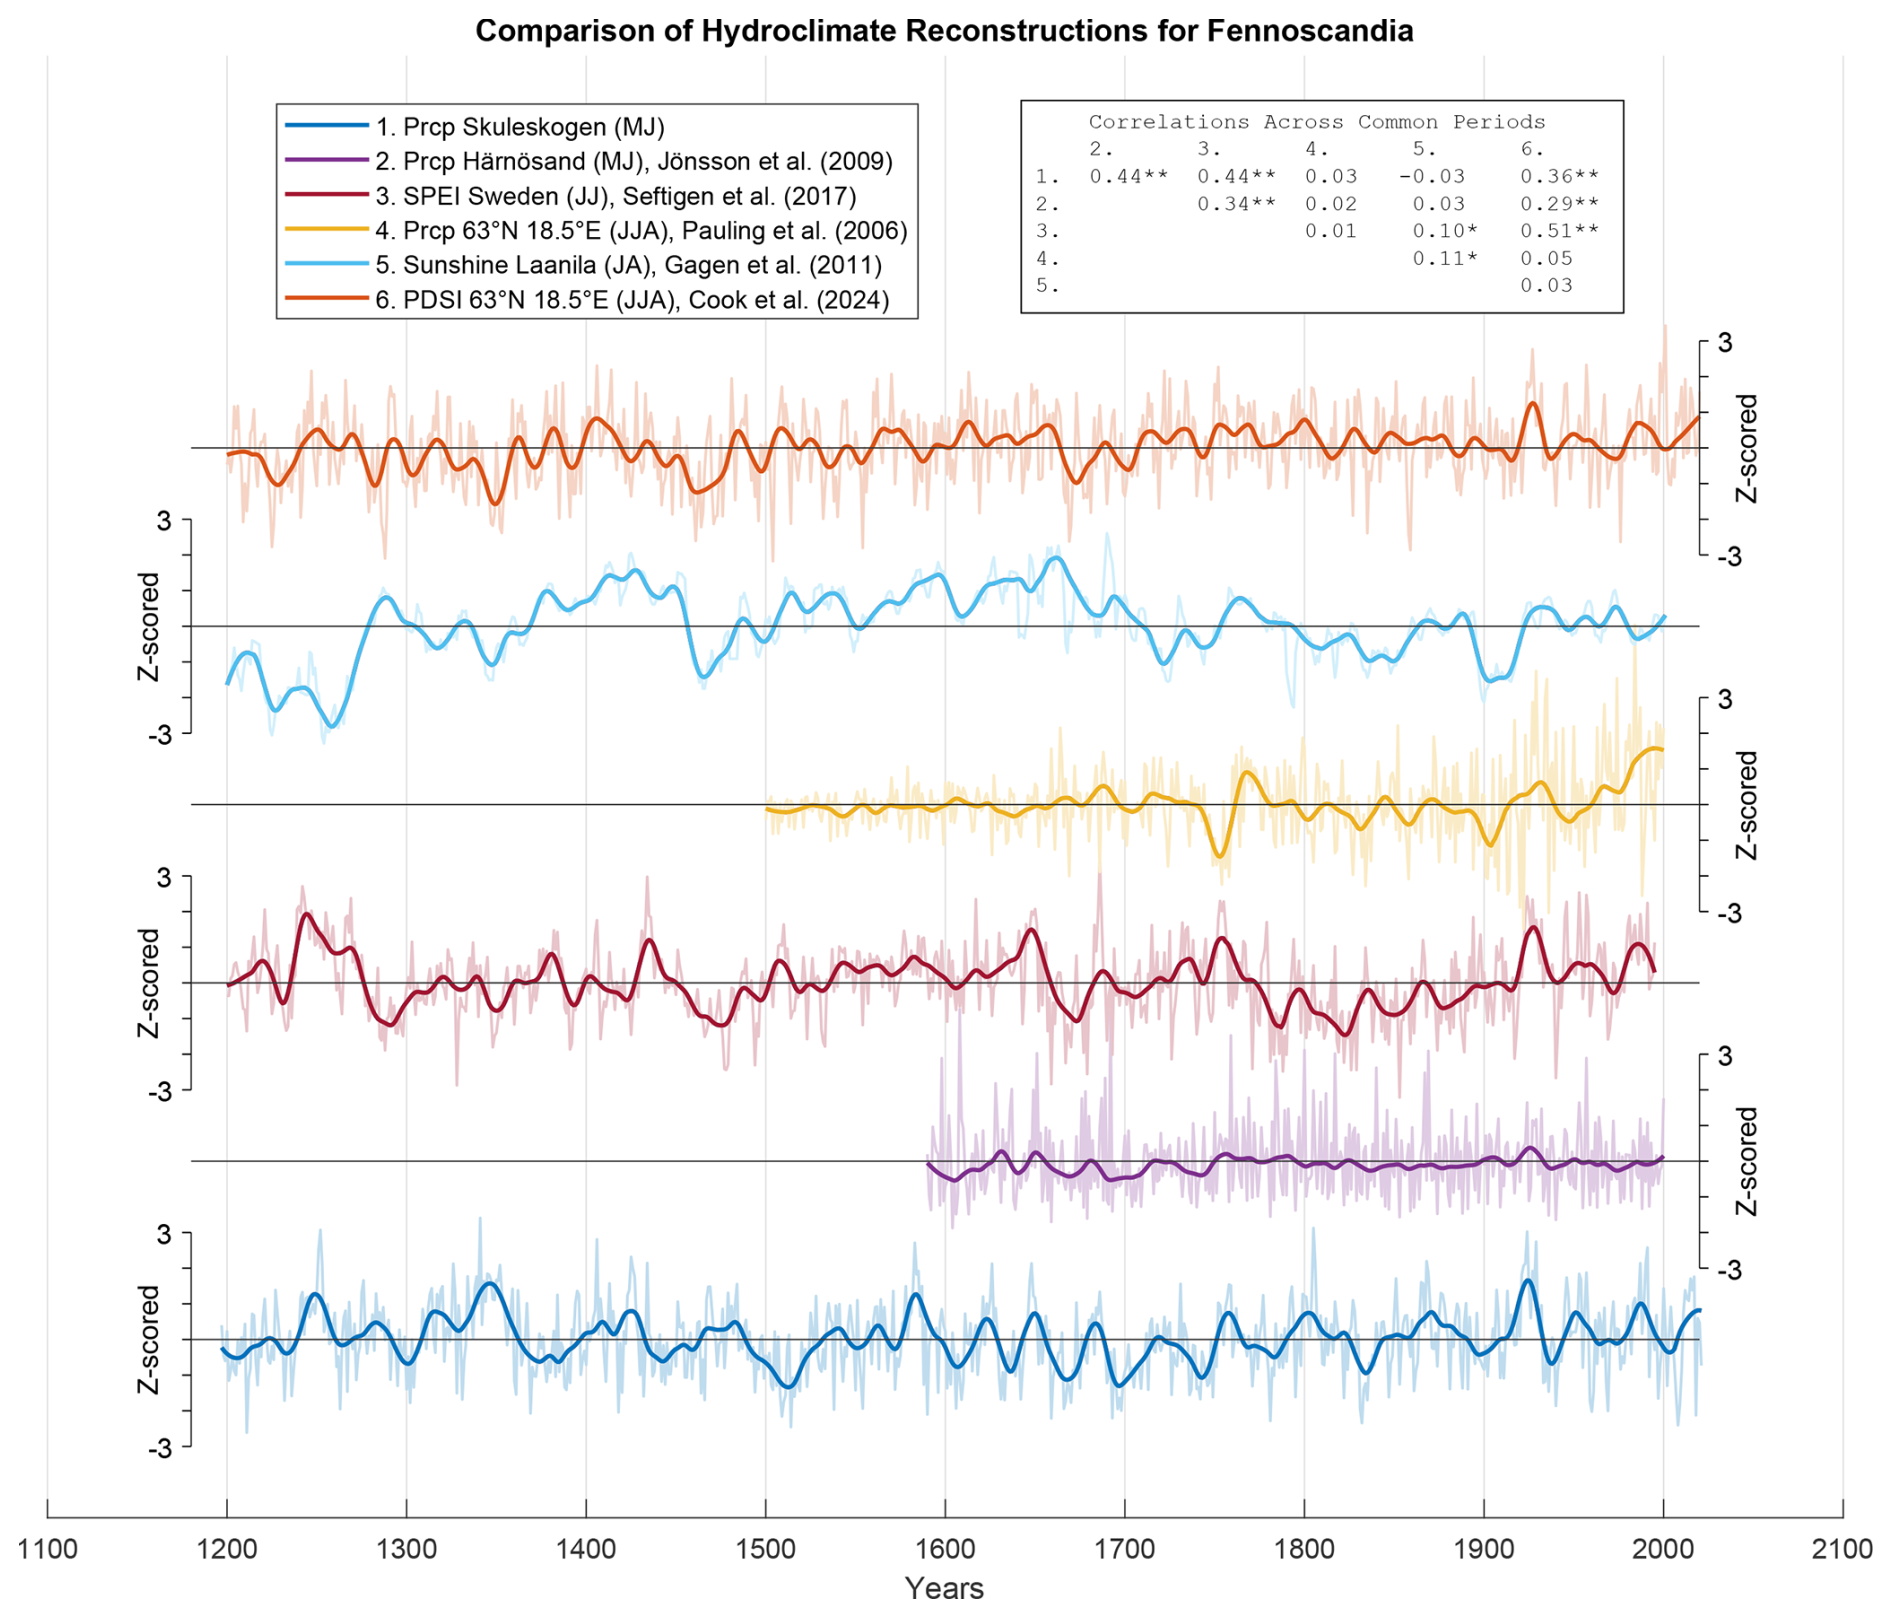
Figure D1Comparison of our reconstruction (63° N, 18.5° E) with other hydroclimatic reconstructions in the region, including May–June precipitation near Härnösand (62.6° N, 18.0° E; Jönsson and Nilsson, 2009), June–July drought index (SPEI) for 55–65° N and 5–30° E (Seftigen et al., 2017), European gridded June–August precipitation (grid at 63° N, 18.5° E used) (Pauling et al., 2006), sunshine reconstruction from Lannila, northwest Finland (65.0° N, 25.5° E); Gagen et al. (2011) and June–August scPDSI (GEDA: 63° N, 18.5° E) (Cook et al., 2020). All series are standardized to z-scores. Correlation matrix showing Pearson's r across common periods is showed in the upper left corner, , .
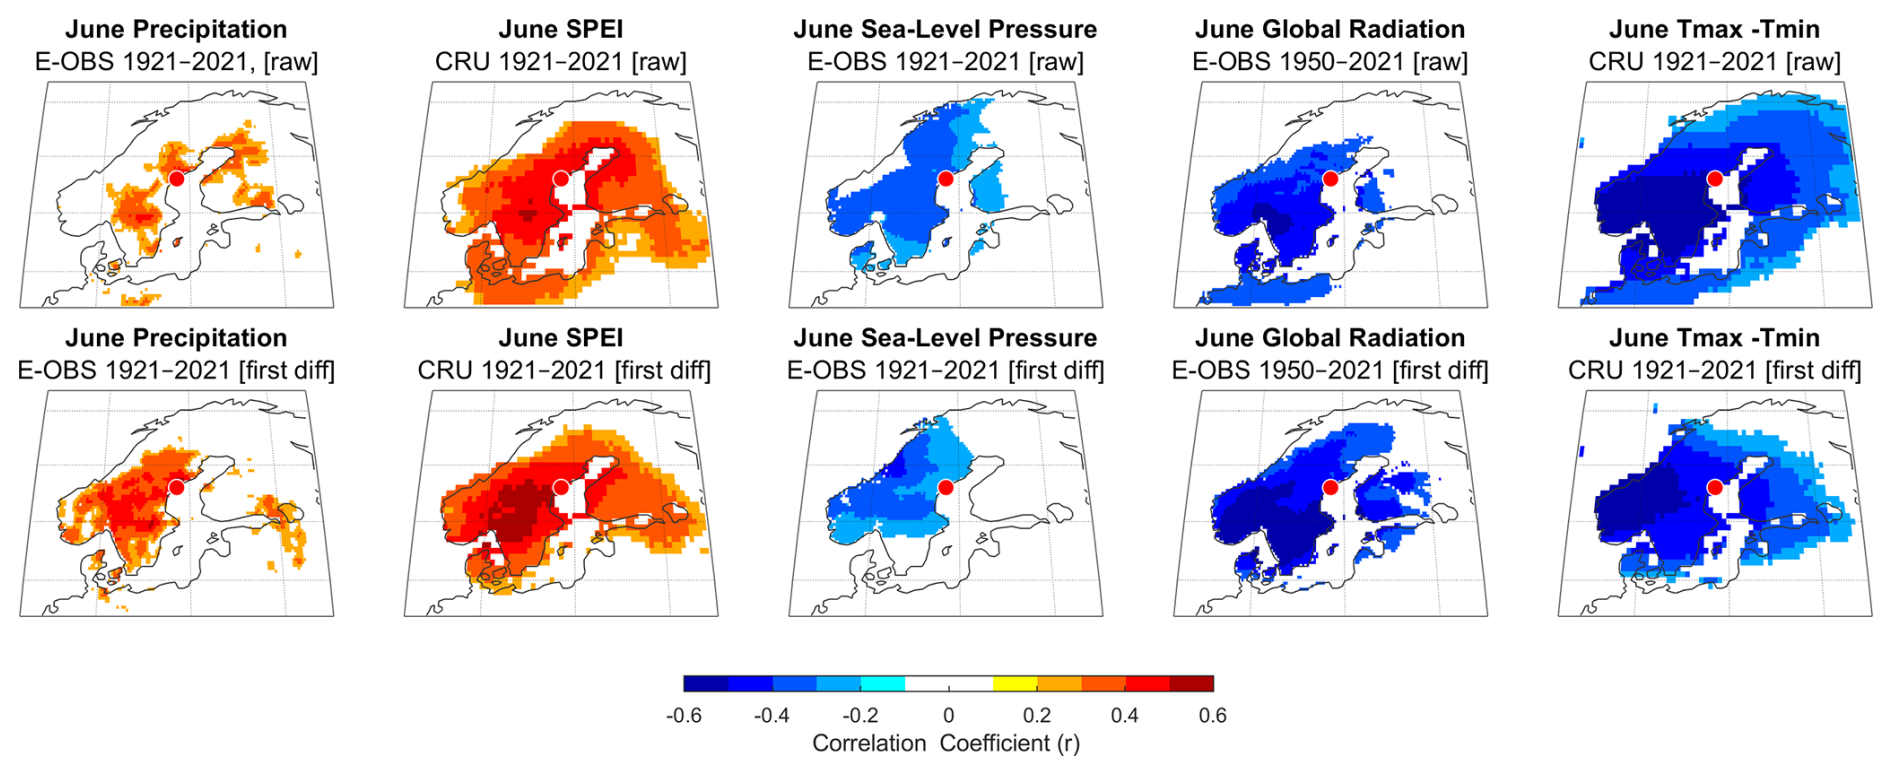
Figure E1Correlation maps (Pearson's r values, P<0.01) between tree-ring width chronology and the instrumental data for June over the 1921–2021 period. Raw data (upper panel) and first-difference data (lower panel) are used. The red dot denotes the location of our chronology.
The precipitation reconstruction generated in this study is publicly available in the Zenodo repository at https://doi.org/10.5281/zenodo.18506649 (Stridbeck et al., 2026).
PS: Writing – original draft, Conceptualization, Investigation, Software, Formal analysis, Visualization. JS: Writing (review and editing), Funding acquisition, Supervision, Investigation. FCL: Writing – original draft, Supervision, Investigation. JS: Writing – review & editing, Investigation, Resources. MF: Writing – review & editing, Investigation. PJK: Writing – review & editing, Formal analysis, Software. ZL: Writing – review & editing, Formal analysis, Software. KS: Writing – review & editing, Conceptualization, Funding acquisition, Supervision, Investigation.
The contact author has declared that none of the authors has any competing interests.
Publisher's note: Copernicus Publications remains neutral with regard to jurisdictional claims made in the text, published maps, institutional affiliations, or any other geographical representation in this paper. The authors bear the ultimate responsibility for providing appropriate place names. Views expressed in the text are those of the authors and do not necessarily reflect the views of the publisher.
We thank Tim Brandin, Alexandra Seftigen, and Peter Seftigen for assistance during the fieldwork in Skuleskogen in July 2022.
This research has been supported by the Vetenskapsrådet (grant nos. 2019-05228 and 2023-00605) and the Carl Tryggers Stiftelse för Vetenskaplig Forskning (grant no. 21:1469).
The publication of this article was funded by the Swedish Research Council, Forte, Formas, and Vinnova.
This paper was edited by Jürg Luterbacher and reviewed by two anonymous referees.
Arosio, T., Leuenberger, M., Nicolussi, K., Esper, J., Krusic, P., Bebchuk, T., Tegel, W., Hafner, A., Kirdyanov, A. V., Schlüchter, C., Reinig, F., Muschitiello, F., and Büntgen, U.: Tree-ring stable isotopes from the European Alps reveal long-term summer drying over the Holocene, Science Advances, 11, eadr4161, https://doi.org/10.1126/sciadv.adr4161, 2025.
Bebchuk, T., Moir, A. K., Arosio, T., Kirdyanov, A. V., Torbenson, M. C. A., Krusic, P. J., Hindson, T. R., Howard, H., Buchwal, A., Norman, C. A. P., and Büntgen, U.: Taxus tree-ring chronologies from southern England reveal western European hydroclimate changes over the past three centuries, Clim Dyn., 63, 108, https://doi.org/10.1007/s00382-025-07601-2, 2025.
Bingham, C., Godfrey, M., and Tukey J.: Modern techniques of power spectrum estimation, IEEE Transactions on Audio and Electroacoustics, 15, 56–66, https://doi.org/10.1109/TAU.1967.1161895, 1967.
Björklund, J., Seftigen, K., Stoffel, M., Fonti, M. V., Kottlow, S., Frank, D. C., et al.: Fennoscandian tree-ring anatomy shows a warmer modern than medieval climate, Nature, 620, 97–103, https://doi.org/10.1038/s41586-023-06176-4, 2023.
Briffa, K. R., Jones, P. D., Bartholin, T. S., Eckstein, D., Schweingruber, F. H., Karlén, W., Zetterberg, P., and Eronen, M.: Fennoscandian summers from AD 500: Temperature changes on short and long timescales, Clim Dyn., 7, 111–119, https://doi.org/10.1007/BF00211153, 1992.
Bunde, A., Büntgen, U., Ludescher, J., Luterbacher, J., and von Storch, H.: Is there memory in precipitation?, Nat. Clim. Chang. 3, 174–175, https://doi.org/10.1038/nclimate1830, 2013.
Büntgen, U., Trouet, V., Frank, D., Leuschner, H.H., Friedrichs, D., Luterbacher, J., and Esper, J.: Tree-ring indicators of German summer drought over the last millennium, Quat. Sci. Rev., 29, 1005–1016, https://doi.org/10.1016/j.quascirev.2010.01.003, 2010a.
Büntgen, U., Franke, J., Frank, D., Wilson, R., González-Rouco, F., and Esper, J.: Assessing the spatial signature of European climate reconstructions, Clim. Res. 41, 125–130, https://doi.org/10.3354/cr00848, 2010b.
Büntgen, U., Tegel, W., Nicolussi, K., McCormick, M., Frank, D., Trouet, V., Kaplan, J.O., Herzig, F., Heussner, K.-U., Wanner, H., Luterbacher, J., and Esper, J.: 2500 years of European climate variability and human susceptibility, Science, 331, 578–582, https://doi.org/10.1126/science.1197175, 2011.
Büntgen, U., Urban, O., Krusic, P. J., Rybníček, M., Kolář, T., Kyncl, T., Ač, A., Koňasová, E., Čáslavský, J., Esper, J., Wagner, S., Saurer, M., Tegel, W., Dobrovolný, P., Cherubini, P., Reinig, F., and Trnka, M.: Recent European drought extremes beyond Common Era background variability, Nature Geoscience, 14, 190–196, https://doi.org/10.1038/s41561-021-00698-0, 2021.
Christiansen, B. and Ljungqvist, F. C.: Challenges and perspectives for large-scale temperature reconstructions of the past two millennia, Reviews of Geophysics, 55, 40–96, https://doi.org/10.1002/2016RG000521, 2017.
Cook, B. I., Cook, E. R., Anchukaitis, K. J., and Singh, D.: Characterizing the 2010 Russian heat wave–Pakistan flood concurrent extreme over the last millennium using the Great Eurasian Drought Atlas, Journal of Climate, 37, 4389–4401, https://doi.org/10.1175/jcli-d-23-0773.1, 2024.
Cook, E. R. and Kairiukstis, L. A.: Methods of Dendrochronology: Applications in the Environmental Sciences, Kluwer Academic Publishers, https://doi.org/10.1007/978-94-015-7879-0, 1990.
Cook, E. R., Seager, R., Kushnir, Y., Briffa, K. R., Büntgen, U., Frank, D., Krusic, P. J., Tegel, W., van der Schrier, G., Andreu-Hayles, L., Baillie, M., Baittinger, C., Bleicher, N., Bonde, N., Brown, D., Carrer, M., Cooper, R., Cufar, K., Dittmar, C., Esper, J., Griggs, C., Gunnarson, B., Günther, B., Gutierrez, E., Haneca, K., Helama, S., Herzig, F., Heussner, K.-U., Hofmann, J., Janda, P., Kontic, R., Köse, N., Kyncl, T., Levanic, T., Linderholm, H., Manning, S., Melvin, T. M., Miles, D., Neuwirth, B., Nicolussi, K., Nola, P., Panayotov, M., Popa, I., Rothe, A., Seftigen, K., Seim, A., Svarva, H., Svoboda, M., Thun, T., Timonen, M., Touchan, R., Trotsiuk, V., Trouet, V., Walder, F., Ważny, T., Wilson. R., and Zang, C.: Old World megadroughts and pluvials during the Common Era, Sci. Adv., 1, e1500561, https://doi.org/10.1126/sciadv.1500561, 2015.
Cook, E. R., Solomina, O., Matskovsky, V., Cook, B. I., Agafonov, L., Berdnikova, A., Dolgova, E., Karpukhin, A., Knysh, N., Kulakova, M., Kuznetsova, V., Kyncl, T., Kyncl, J., Maximova, O., Panyushkina, I., Seim, A., Tishin, D., Ważny, T., and Yermokhin, M.: The European Russia Drought Atlas (1400–2016 CE), Clim. Dyn., 54, 2317–2335, https://doi.org/10.1007/s00382-019-05115-2, 2020.
Cooper, R. J., Melvin, T. M., Tyers, I., Wilson, R. J. S., and Briffa, K. R.: A tree-ring reconstruction of East Anglian (UK) hydroclimate variability over the last millennium, Climate Dynamics, 40, 1019–1039, https://doi.org/10.1007/s00382-012-1328-x, 2013.
Cornes, R., van der Schrier, G., van den Besselaar, E. J. M., and Jones, P. D.: An Ensemble Version of the E-OBS Temperature and Precipitation Datasets, J. Geophys. Res. Atmos., 123. https://doi.org/10.1029/2017JD028200, 2018.
Dribe, M., Olsson, M., and Svensson, P.: Famines in European History, Cambridge University Press, 185–211, https://doi.org/10.1017/9781316841235.009, 2017.
Edvinsson, R., Leijonhufvud, L., and Söderberg, J.: Väder, skördar och priser i Sverige, in: Agrarhistoria på många sätt: 28 studier om människan och jorden. Festskrift till Janken Myrdal på hans 60-årsdag, edited by: Liljewall, B., Flygare, I. A., Lange, U., Ljunggren, L., and Söderberg, J., The Royal Swedish Academy of Agriculture and Forestry, Stockholm, 115–136, ISBN 978-91-85205-91-2, 2009.
Franke, J., Frank, D., Raible, C. C., Esper, J., and Brönnimann, S.: Spectral biases in tree-ring climate proxies, Nat. Clim. Chang., 3, 360e364, https://doi.org/10.1038/nclimate1816, 2013.
Esper, J., Cook, E. R., Krusic, P. J., Peters, K., and Schweingruber, F. H.: Tests of the RCS method for preserving low-frequency variability in long tree-ring chronologies, Tree-Ring Res., 59, 81–98, 2003.
Esper, J., Torbenson, M., and Büntgen, U.: 2023 summer warmth unparalleled over the past 2,000 years, Nature, 631, 94–97, https://doi.org/10.1038/s41586-024-07512-y, 2024.
Forsberg, H. and Bohman, M.: Relieving famine. Northern Sweden (Västerbotten) between state, market, and civil society during the 1860s, Scandinavian Economic History Review, 72, 248–265, https://doi.org/10.1080/03585522.2023.2279215, 2024.
Fuentes, M., Salo, R., Björklund, J., Seftigen, K., Zhang, P., Gunnarson, B., Aravena, J.-C., and Linderholm, H. W.: A. 970-year-long summer temperature reconstruction from Rogen, west-central Sweden, based on blue intensity from tree rings, The Holocene, 28, 254–266, https://doi.org/10.1177/0959683617721322, 2018.
Gagen, M., Zorita, E., McCarroll, D., Young, G. H. F., Grudd, H., Jalkanen, R., Loader, N. J., Robertson, I., and Kirchhefer, A.,: Cloud Response to Summer Temperatures in Fennoscandia over the Last Thousand Years, Geophysical Research Letters, 38, L05701, https://doi.org/10.1029/2010GL046216, 2011.
Grudd, H., Briffa, K. R., Karlén, W., Bartholin, T. S., Jones, P. D., and Kromer, B.: A 7400-year tree-ring chronology in northern Swedish Lapland: natural climatic variability expressed on annual to millennial timescales, The Holocene, 12, 657–665. 2002.
Gärtner, H., Schneider, L., and Cherubini, P.: A New Workflow for Sampling and Digitizing Increment Cores, J. Vis. Exp., 211, e67098, https://doi.org/10.3791/67098, 2024.
Hartl, C., Düthorn, E., Tejedor, E., Kirchhefer, A. J., Timonen, M., Holzkämper, S., Büntgen, U., and Esper, J.: Micro-site conditions affect Fennoscandian forest growth, Dendrochronologia, 65, 125787, https://doi.org/10.1016/j.dendro.2020.125787, 2021.
Harris, I., Osborn, T. J., Jones, P., and Lister, D.: Version 4 of the CRU TS monthly high-resolution ridded multivariate climate dataset, Scientific Data, 7, 109, https://doi.org/10.1038/s41597-020-0453-3, 2020.
Haylock, M. R., Hofstra, N., Klein Tank, A. M. G., Klok, E. J., Jones, P. D., and New, M. A.: European daily high-resolution gridded data set of surface temperature and precipitation for 1950–2006, J. Geophys. Res., 113, https://doi.org/10.1029/2008JD010201, 2008.
Helama, S., Meriläinen, J., and Tuomenvirta, H.: Multicentennial megadrought in northern Europe coincided with a global El Niño–Southern Oscillation drought pattern during the Medieval Climate Anomaly, Geology, 37, 175–178, https://doi.org/10.1130/G25329A.1, 2009.
Hellmann, L., Nikolaev, A., Ljungqvist, F. C., Churakova, O., Düthorn, E., Esper, J., Hülsmann, L., Kirdyanov, A.V., Moiseev, P., Myglan, V. S., Nikolaev, A. N., Reinig, F., Schweingruber, F., Solomina, O., Tegel, W., and Büntgen, U.: Diverse growth trends and climate responses across Eurasia's boreal forest, Environmental Research Letters, 11, 074021, https://doi.org/10.1088/1748-9326/11/7/074021, 2016.
Holmes, R. L.: Computer-Assisted Quality Control in Tree-Ring Dating and Measurement, https://repository.arizona.edu/handle/10150/261223, 1983.
Huhtamaa, H., Stoffel, M., and Corona, C.: Recession or resilience? Long-range socioeconomic consequences of the 17th century volcanic eruptions in northern Fennoscandia, Clim. Past, 18, 2077–2092, https://doi.org/10.5194/cp-18-2077-2022, 2022.
Jönsson, K. and Nilsson, C.: Scots Pine (Pinus sylvestris L.) on shingle fields: A dendrochronologic reconstruction of early summer precipitation in mideast Sweden, J. Clim., 22, 4710–4722, 2009.
Labbas, V., Saulnier, M., Burri, S., Larrieu L., and Py-Saragaglia V.: A dendroarchaeological tree-ring dataset of Abies alba Mill. from historic buildings in the French Pyrenees, Annals of Forest Science, 81, 41, https://doi.org/10.1186/s13595-024-01248-5, 2024.
Land, A., Remmele, S., Hofmann, J., Reichle, D., Eppli, M., Zang, C., Buras, A., Hein, S., and Zimmermann, R.: Two millennia of Main region (southern Germany) hydroclimate variability, Clim. Past, 15, 1677–1690, https://doi.org/10.5194/cp-15-1677-2019, 2019.
Larsson, L: CDendro & CooRecorder program package for tree ring measurements and crossdating of the data, version 9.4, https://www.cybis.se/forfun/dendro (last access: 11 February 2026), 2014.
Leijonhufvud, L. and Retsö, D.: Documentary evidence of droughts in Sweden between the Middle Ages and ca. 1800 CE, Clim. Past, 17, 2015–2029, https://doi.org/10.5194/cp-17-2015-2021, 2021.
Linderholm, H., Björklund, J., Seftigen, K., Gunnarson, B., and Fuentes, M.: Fennoscandia revisited: a spatially improved tree-ring reconstruction of summer temperatures for the last 900 years, Clim. Dyn., 45, 933–947, https://doi.org/10.1007/s00382-014-2328-9, 2015.
Linderholm, H. W., Nicolle, M., Francus, P., Gajewski, K., Helama, S., Korhola, A., Solomina, O., Yu, Z., Zhang, P., D'Andrea, W. J., Debret, M., Divine, D. V., Gunnarson, B. E., Loader, N. J., Massei, N., Seftigen, K., Thomas, E. K., Werner, J., Andersson, S., Berntsson, A., Luoto, T. P., Nevalainen, L., Saarni, S., and Väliranta, M.: Arctic hydroclimate variability during the last 2000 years: current understanding and research challenges, Clim. Past, 14, 473–514, https://doi.org/10.5194/cp-14-473-2018, 2018.
Linderholm, H. W., Gunnarson, B. E., Fuentes, M., Büntgen, U., and Hormes, A.: The origin of driftwood on eastern and south-western Svalbard, Polar Science, 29, 100658, https://doi.org/10.1016/j.polar.2021.100658, 2021.
Ljungqvist, F. C., Krusic, P. J., Sundqvist, H. S., Zorita, E., Brattström, G., and Frank, D.: Northern Hemisphere hydroclimate variability over the past twelve centuries, Nature, 532, 7597, https://doi.org/10.1038/nature17418, 2016.
Ljungqvist, F. C., Piermattei, A., Seim, A., Krusic, P. J., Büntgen, U., He, M., Kirdyanov, A. V., Luterbacher, J., Schneider, L., Seftigen, K., Stahle, D. W., Villalba, R., Yang, B., and Esper, J.: Ranking of tree-ring based hydroclimate reconstructions of the past millennium, Quaternary Science Reviews, 230, 106074, https://doi.org/10.1016/j.quascirev.2019.106074, 2020.
Ljungqvist, F. C., Christiansen, B., Esper, J., Huhtamaa, H., Leijonhufvud, L., Pfister, C., Seim, A., Skoglund, M. K., and Thejll, P.: Climatic signatures in early modern European grain harvest yields, Clim. Past, 19, 2463–2491, https://doi.org/10.5194/cp-19-2463-2023, 2023.
Ljungqvist, F. C., Seim, A., and Collet, D.: Famines in medieval and early modern Europe – Connecting climate and society, WIREs Climate Change, e859, https://doi.org/10.1002/wcc.859, 2024.
Matskovsky, V. V. and Helama, S.: Testing long-term summer temperature reconstruction based on maximum density chronologies obtained by reanalysis of tree-ring data sets from northernmost Sweden and Finland, Clim. Past, 10, 1473–1487, https://doi.org/10.5194/cp-10-1473-2014, 2014.
Massey, F. J.: The Kolmogorov-Smirnov Test for Goodness of Fit, Journal of the American Statistical Association, 46, 68–78, 1951.
Melvin, T. and Briffa, K.: CRUST: Software for the implementation of Regional Chronology Standardisation: Part 1. Signal-Free RCS. Dendrochronologia, 32, https://doi.org/10.1016/j.dendro.2013.06.002, 2013.
Muigg, B., Seim, A., Tegel, W., Werther, L., Herzig, F., Schmidt, J., Zielhofer, C., Land, A., and Büntgen, U.: Tree rings reveal dry conditions during Charlemagne's Fossa Carolina construction in 793 CE, Quat. Sci. Rev., 227, 106040, https://doi.org/10.1016/j.quascirev.2019.106040, 2020.
UCAR/NCAR/CISL/TDD: The NCAR Command Language (Version 6.6.2) [software], Boulder, CO, USA, https://doi.org/10.5065/D6WD3XH5, 2019.
Pauling, A., Luterbacher, J., Casty, C., and Wanner, H.: Five hundred years of gridded high-resolution precipitation reconstructions over Europe and the connection to large-scale circulation, Climate Dynamics, 26, 387–405, https://doi.org/10.1007/s00382-005-0090-8, 2006.
Pfister, C. and Wanner, H.: Climate and society in Europe: The last thousand years, Haupt Verlag, Bern, ISBN 978-3-258-08234-9, 2021
Pisaric, M. F. J., St-Onge, S. M., and Kokelj, S. V.: Tree-ring reconstruction of early growing season precipitation from Yellowknife, Northwest Territories, Canada, Arct. Antarct. Alp. Res., 41, 486–496, https://www.jstor.org/stable/25642076, 2009.
Raible, C. C., Bärenbold, O., and Gómez-navarro, J. J.: Drought indices revisited – improving and testing of drought indices in a simulation of the last two millennia for Europe, Tellus A: Dynamic Meteorology and Oceanography, 69, 1287492, https://doi.org/10.1080/16000870.2017.1296226, 2017.
Sandström, J., Edman, M., and Jonsson, B. G.: Rocky pine forests in the High Coast Region in Sweden: structure, dynamics and history, Nature Conservation, 38, 101–130, https://doi.org/10.3897/natureconservation.38.34870, 2020.
Seftigen, K., Cook, E., Linderholm, H., Fuentes, M., and Björklund, J.: The potential of deriving tree-ring-based field reconstructions of droughts and pluvials over Fennoscandia, J. Clim., 28, 3453–3471, https://doi.org/10.1175/JCLI-D-13-00734.1, 2015a.
Seftigen, K., Björklund, J., Cook, E. R., and Linderholm, H. W.: A tree-ring field reconstruction of Fennoscandian summer hydroclimate variability for the last millennium, Climate Dynamics, 44, 3141–3154, https://doi.org/10.1007/s00382-014-2191-8, 2015b.
Seftigen, K., Goosse, H., Klein, F., and Chen, D.: Hydroclimate variability in Scandinavia over the last millennium – insights from a climate model–proxy data comparison, Clim. Past, 13, 1831–1850, https://doi.org/10.5194/cp-13-1831-2017, 2017.
Seftigen, K., Fuentes, M., Ljungqvist, F. C., and Björklund, J.: Using Blue Intensity from drought-sensitive Pinus sylvestris in Fennoscandia 600 to improve reconstruction of past hydroclimate variability, Climate Dynamics, 55, 579–594, https://link.springer.com/article/10.1007/s00382-020-05287-2, 2020.
Seftigen, K., von Arx, G., Fonti, M. V., and Björklund, J.: Benchmarking Blue Intensity from drought limited Pinus sylvestris using tree-ring anatomy, Dendrochronologia, 92, 126367, https://doi.org/10.1016/j.dendro.2025.126367, 2025.
Shumilov, O. I., Kasatkina, E. A., Timonen, M., and Potorochin, E. O.: Volcanic Impact Patterns in Tree Rings from Historical Wood in Northern Fennoscandia's Old Churches, Forests, 16, 573, https://doi.org/10.3390/f16040573, 2025.
Skoglund, M. K.: Climate variability and grain production in Scania, 1702–1911, Clim. Past, 18, 405–433, https://doi.org/10.5194/cp-18-405-2022, 2022.
Skoglund, M. K.: Climate and Agriculture in the Little Ice Age: The case of Sweden in a wider European perspective, PhD thesis, Swedish University of Agricultural Sciences, Ulltuna, https://doi.org/10.54612/a.3rnsodears, 2023.
St. George, S.: An overview of tree-ring width records in the Northern Hemisphere, Quat. Sci. Rev., 95, 132–150, https://doi.org/10.1016/j.quascirev.2014.04.029, 2014.
St. George, S. and Ault, T. R.: The imprint of climate within Northern Hemisphere trees, Quat. Sci. Rev., 89, 1–4, https://doi.org/10.1016/j.quascirev.2014.01.007, 2014.
Stridbeck, P., Björklund, J., Fuentes, M., Gunnarson, B. E., Jönsson, A. M., Linderholm, H. W., Ljungqvist, F. C., Ohlson, C., Rayner, D., Rocha, E., Zhang, P., and Seftigen, K.: Partly decoupled tree-ring width and leaf phenology response to 20th century temperature change in Sweden, Dendrochronologia, 75, 125993, https://doi.org/10.1016/j.dendro.2022.125993, 2022.
Stridbeck, P., Seftigen, K., Björklund, J., and Charpentier Ljungqvist, F.: MJ Precipitation Reconstruction for 63.0°N, 18.5°E, Zenodo [data set], https://doi.org/10.5281/zenodo.18506649, 2026.
Schweingruber, F.: Tree Rings: Basics and Applications of Dendrochronology, Reidel, Dodrecht, https://doi.org/10.1007/978-94-009-1273-1, 1988.
Speer, J. H.: Fundamentals of Tree-Ring Research, University of Arizona Press, Tucson, ISBN 9780816526857, 2010.
Torbenson, M. C. A., Stahle, D. W., Cook, E. R., Cook, B. I., Büntgen, U., Chen, F., Tejedor, E., Stagge, J. H., Trnka, M., Burnette, D. J., Yue, W., and Esper, J.: Disruption of Drought Teleconnections Between ENSO-Influenced Regions Around 1700 CE, Geophysical Research Letters, 52, e2025GL115600, https://doi.org/10.1029/2025GL115600, 2025.
Wanner, H., Pfister, C., and Neukom, R.: The variable European Little Ice Age, Quat. Sci. Rev., 287, 107531, https://doi.org/10.1016/j.quascirev.2022.107531, 2022.
Wastenson, L. and Fredén, C.: Sveriges nationalatlas: Berg och jord, Stockholm, Sveriges nationalatlas, ISBN 9187760274, 1994.
Wigley, T. M. L., Briffa, K. R., and Jones, P. D.: On the Average Value of Correlated Time Series, with Applications in Dendroclimatology and Hydrometeorology, Journal of Applied Meteorology and Climatology, 23, 201–213, https://www.jstor.org/stable/26181323, 1984.
Wilson, R., Miles, D., Loader, N. J., Melvin, T., Cunningham, L., Cooper, R., and Briffa, K.: A millennial long March–July precipitation reconstruction for southerncentral England, Clim. Dyn. 40, 997–1017, https://doi.org/10.1007/s00382-012-1318-z, 2013.
Zhang, H., Yuan, N., Xoplaki, E., Werner, J., Büntgen, U., Esper, J., Treydte, K., and Luterbacher, J.: Modified climate with long term memory in tree ring proxies, Environ. Res. Lett. 10, 084020, https://doi.org/10.1088/1748-9326/10/8/084020, 2015.
- Abstract
- Introduction
- Material and method
- Results
- Discussion
- Conclusions
- Appendix A: Description of the mRCS software (version 12)
- Appendix B: Statistics of calibration–validation tests
- Appendix C: Comparison of Regression Models and Normality Tests for May–June Precipitation
- Appendix D: Comparison with other hydroclimatic reconstructions from Fennoscandia
- Appendix E: Climate correlation maps for June
- Data availability
- Author contributions
- Competing interests
- Disclaimer
- Acknowledgements
- Financial support
- Review statement
- References