
the Creative Commons Attribution 4.0 License.
the Creative Commons Attribution 4.0 License.
 | 20 Nov 2026
Strong winds in Poland in the 17th century and their consequences, in light of documentary evidence

Janusz Filipiak
Piotr Oliński
Babak Ghazi
The paper presents a detailed analysis of strong winds in Poland in the 17th century, including their frequency, intensity, and impacts on the natural environment, society and economy. The analysis is solely based on available documentary evidence. Preliminary archival research allowed the construction of a comprehensive database of strong winds for Poland for the study period. The 542 weather notes were used to obtain the following information about strong winds: time, location/region, duration, and indexations of intensity, extent, and damage character. For the first time, this study utilises continuous daily weather records spanning 14 years to analyse the occurrence of strong winds. The methodology follows that utilised by Przybylak et al. (2025) for the analysis of strong winds prior to the 17th century. The number of strong winds in Poland in the 17th century reached 525, with the majority occurring in the second half of the century. In the annual cycle, strong winds were less frequent in summer, whereas the other seasons had similar frequencies. The wind category “fresh and strong breeze” occurred the most frequently (61.9 %), followed by “gales” (26.7 %). The former category dominated in spring and autumn (58.8 %), whereas the latter prevailed in the cold half-year (65 %). Each category of strong wind occurred more frequently in northern and north-eastern Poland than elsewhere. In 73.7 % of reports of strong winds (excluding daily weather notes), information about damage was available – most frequently in winter and autumn and least frequently in spring. The most frequently reported damage and destruction involved buildings (residential, agricultural, churches, etc.) and forests. The availability of daily-resolution data significantly improved the reliability of results on strong wind occurrence, particularly for the mildest analysed category (fresh and strong breeze). Data of this type were not suitable for analysing wind-induced damage (only one such case was identified) or for the spatial analysis of its occurrence and consequences (as the data covered only a limited area). The changes in frequency of strong wind events in Poland in the 17th century were more similar to those observed in Northern than Southern Europe.
- Article
(6620 KB) - Full-text XML
-
Supplement
(694 KB) - BibTeX
- EndNote


Available global statistics indicate that all types of storms, as distinguished by the Emergency Events Database (tropical cyclones, extratropical storms, and convective storms), are among the most damaging weather-related natural hazards worldwide, causing substantial economic losses and numerous human fatalities (WMO, 2021). An investigation conducted by Lorenc (2012) in Poland supports this conclusion. Strong winds are second only to floods in terms of damage caused. A similar situation is observed in Europe, where, during the period 2001–2020, floods were the most frequent natural disasters (41 %), followed by strong winds (27 %) (see https://www.statista.com/statistics/1269886/most-common-natural-disasters-in-europe, last access: 12 December 2025). Moreover, modelling works (e.g., Donat et al., 2011; Outten and Sobolowski , 2021) indicate that, in the future, the frequency and intensity of strong winds will increase in Central Europe, including Poland.
The present paper, which focuses on the analysis of strong wind occurrences in Poland in the 17th century and their impacts on the natural environment and society, is a continuation of our studies aimed at reconstructing the occurrence of this extreme phenomenon in the entire historical period, i.e., prior to the start of regular instrumental observations in the mid-19th century (Brönnimann et al., 2019). The first paper already published (Przybylak et al., 2025) covers the period from medieval times (late 13th century – subject to data availability) through the early Little Ice Age (LIA) to 1600. That paper also contains a detailed review of the available literature on the occurrence of strong winds in Poland and Europe, not only for the 13th–16th centuries, but also for the entire historical period (including, for Poland, the contemporary period). For this reason, some of these topics are omitted in the present paper, while others are presented briefly.
The 17th century is climatically very interesting because the majority of millennial temperature reconstructions reveal that this century was, on average, the coldest century of the entire last millennium, both globally and in Europe (see, e.g., Fig. 1 in Juckes et al., 2007, or Mann et al., 2009; Schimanke et al., 2012; PAGES 2k Consortium, 2013). Moreover, it also included the coldest phase of the LIA, known as the Maunder Minimum (1645–1715) (Pfister, 1999; Wanner et al., 2000; Luterbacher et al., 2004; Brázdil et al., 2010; Schimanke et al., 2012). Luterbacher et al. (2001a) also indicated that this period was characterised by high climate variability, enhanced atmospheric 14C concentrations, numerous volcanic eruptions, and very low solar activity. For these reasons, and because we have documentary evidence with daily resolution for more than 30 years of this century (Chrapowicki's diary and Büthner's calendars), we decided to analyse the large sets of strong wind data separately.
To date, no reconstruction of the occurrence of strong winds in the 17th century and their impacts in Poland has been investigated. Such information, although it exists for Europe, is neither abundant nor extensive. Similar to the period prior to 1601, of all European countries, strong winds in the 17th century have been analysed most comprehensively for the Czech Lands (e.g., Brázdil and Dobrovolný, 2000, 2001; Dobrovolný and Brázdil, 2003; Brázdil et al., 2004, 2012; Dobrovolný and Keprtová, 2006). Another area with considerable information on the occurrence of strong winds (especially storm-force winds) and their consequences for the natural environment and society is the western coast of continental Europe and the British Isles, as well as the surrounding seas. This was most often done using logbooks (Wheeler et al., 2009, 2010) or other documentary evidence (e.g., Winn, 1857; Lindgren and Neumann, 1985; Lamb, 1966; Lamb and Frydendahl, 1991; de Kraker, 2013; Pfeifer and Pfeifer, 2013). Other proxy data have also been used (further, see, e.g., Lamb and Frydendahl, 1991; Clarke and Rendell, 2009, 2011; Orme, 2014), such as records of sand drift and dune-building (Wilson et al., 2004; Aagaard et al., 2007; Clarke and Rendell, 2009, 2011, for a review) or high-resolution sedimentological and rock magnetic analyses (Hansom and Hall, 2009; Sorrel et al., 2009).
Although historical climatology has advanced greatly in recent decades (see, e.g., Brázdil et al., 2005), strong winds have rarely been the subject of analysis. Most of the papers mentioned here are limited to case studies or provide only a general picture of the location and timing of the strongest winds (i.e., they focus mainly on stormy periods). Notable exceptions include databases of all categories of strong winds, as well as comprehensive climatological analyses of strong wind occurrences and their impacts, such as those presented by Brázdil et al. (2004) and, more recently, by Przybylak et al. (2025). Such an analysis for other parts of Europe, based mainly on documentary evidence (the most precise and reliable source of information on wind characteristics), is urgently needed to enhance our understanding of all aspects of the European climate, not just air temperature and precipitation. Therefore, in this research, we present a comprehensive database of strong winds in Poland for the 17th century, the result of many years of work by a team of historians and climatologists in libraries and archives located in Poland, Lithuania, Belarus, Ukraine and Germany, along with their comprehensive statistical analysis. Compared to our previous article (Przybylak et al., 2025), a new feature is the inclusion of the aforementioned daily weather records (diaries and calendars) from the second half of the 17th century in the database. This high-resolution information on the occurrence of strong winds enables a more reliable comparison of extreme wind conditions in the 17th century against those in contemporary conditions. We hope that the work presented here on strong winds in 17th-century Poland helps to partially fill the knowledge gap about this variable in Central Europe.
2.1 Area
The analysis of strong winds in the 17th century presented in this research is geographically limited to the area of modern-day Poland (Fig. 1). It must be noted, however, that, in the 17th century, Poland (then known as the Polish–Lithuanian Commonwealth) was one of the largest European countries, with an area of approximately 800 000 to 815 000 km2 (almost three times Poland's present size) and a population of 7–8 million (Wyczański, 1965; Topolski, 2015). At this time, it was a multi-ethnic state encompassing the present area of Poland (except the western part), Lithuania, Belarus, Ukraine, and parts of Russia/Baltics (see Fig. S1 in the Supplement).
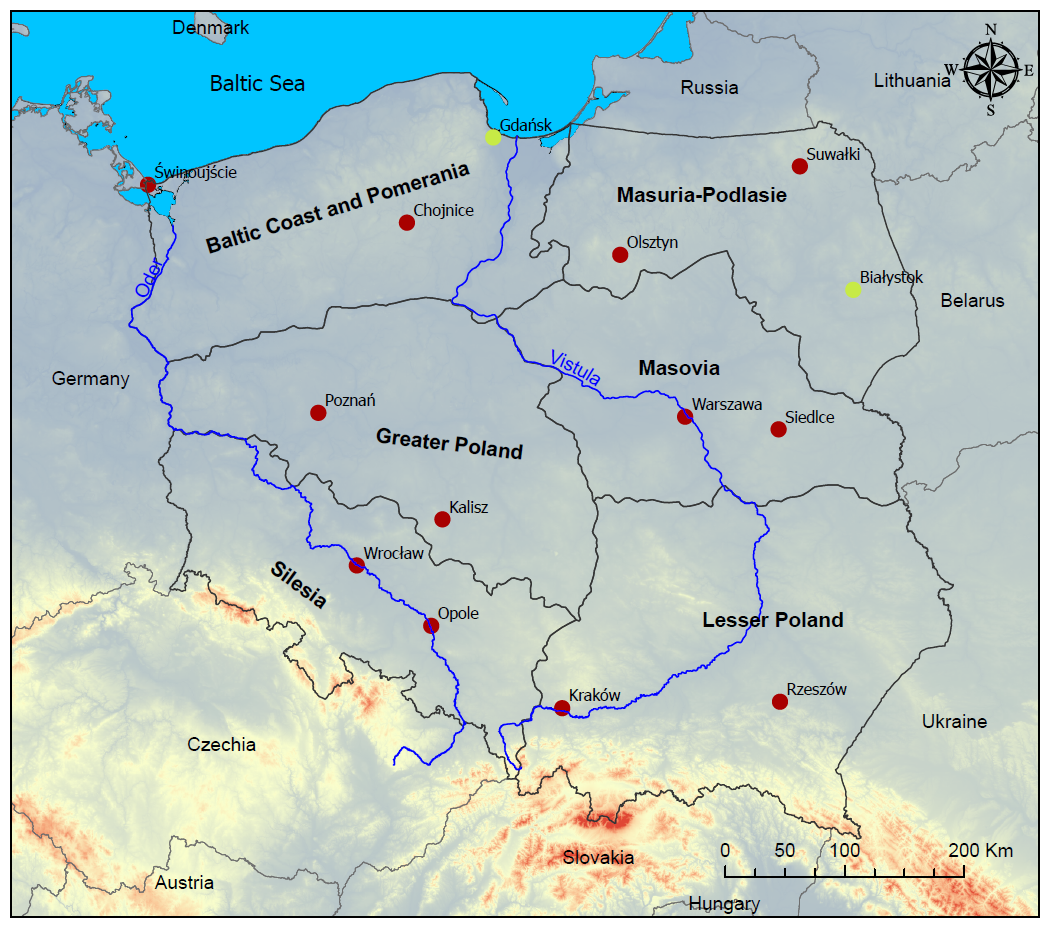
Figure 1Geographical location of Poland, main historical geographical regions and contemporary meteorological stations used in the previous paper (red dots, after Przybylak et al., 2025) and green dots (stations added for this paper).
Contemporary Poland is a Central European country extending from the Baltic Sea in the north and the Sudetes and Carpathian Mountains in the south (Fig. 1). The spatial changes in the occurrence of strong winds in the 17th century were investigated for six historical-geographical regions of Poland: Baltic Coast and Pomerania, Masuria and Podlasie, Greater Poland, Masovia, Silesia, and Lesser Poland. Comparison with current wind conditions was performed using instrumental data from 14 meteorological stations representing all the mentioned regions (see Fig. 1).
Contemporary wind conditions in Poland are well documented (see, e.g., Araźny et al., 2007; Ustrnul et al., 2014; Wibig, 2021; Przybylak et al., 2025, for reviews). The average annual wind speed, calculated based on data from 41 stations evenly distributed across Poland (1966–2018), was 3.6 m s−1 (Wibig, 2021). The spatial distribution of the largest annual average and extreme wind speeds varies slightly. For example, average winds are highest along the Baltic coast (4–5 m s−1), while extreme winds are most powerful in south-western Poland, followed by the Baltic coast (Wibig, 2021). On average, the weakest winds in Poland are noted in the foothills of the Sudeten and Carpathian Mountains (<3 m s−1).
2.2 Sources and data
Similarly to our paper analysing strong winds from the 13th to 16th centuries (Przybylak et al., 2025), three categories of documentary sources were used: handwritten and unpublished sources, published sources, and “secondary” literature (e.g., articles, monographs). However, for the 17th century, for the first time, we also used data extracted from the informationally richest sources – daily weather notes – to analyse strong wind events.
The oldest daily weather data source from the 17th century available for Poland is a diary kept by Jan Antoni Chrapowicki from 1656 to 1685 (further referred to as the Diary). Jan Antoni Chrapowicki was a nobleman who was a Vitebsk Voivode and a member of the Polish parliament (further, see Bokwa et al., 2001; Nowosad et al., 2007; Przybylak and Marciniak, 2010). In the Diary, he described the weather on an ongoing, almost daily basis, with only rare instances of retrospective completion (at least in terms of weather records). The difficulty in compiling the weather notes in the Diary is related to (i) the fact that Chrapowicki kept them in four main, widely separated areas, located in present-day north-eastern Poland, Belarus, and Lithuania, and (ii) only the original diary for the period 1656–1664 has been preserved. The Diary for later years is available only from copies manually transcribed in the 18th (1786) and 19th (1852) centuries (Chrapowicki, 1988). The 18th-century copy, although it covers all years of Chrapowicki's Diary (1656–1685), is less reliable than the 19th-century copy, which covers only five years (1663–1667). These copies, unfortunately, particularly 18th-century ones, are not faithful because they contain many simplifications and textual omissions, especially regarding weather conditions (for details, see Nowosad et al., 2007; Przybylak and Marciniak, 2010).
Although the Diary covers 1656–1685, we selected the first eight years (1656–1663) for case-study analysis because the data are from the preserved original covering 1656–1664 (Chrapowicki, 1978). The last year, however, was excluded from the analysis because until October, Chrapowicki was outside the present territory of Poland, i.e., on his estates located in present-day Belarus (Nowosad et al., 2007).
The second source with daily resolution comes from Gdańsk, a large and important port city on the Baltic Sea. Friedrich Büthner, a professor of mathematics at the then-most-prestigious secondary school in Gdańsk, the Academic Gymnasium (despite its name, an institution that provided university-level education), began publishing the Calendars in 1655 (further, the Calendars). Although the Calendars primarily took the form of astronomical tables, Büthner also included information on expected weather conditions and recorded weather observations in the margins. Complete information regarding Büthner's weather observations was contained in the manuscript “Observationes meteorologicae singulis diebus Calendarii annotatae ab a. 1655 ad a. 1699”, which, unfortunately, appears to have been irretrievably lost. However, surviving copies of individual editions of the Calendars containing these annotations are still available. On the basis of these materials, it is possible to reconstruct in detail only the occurrence of strong winds that occurred in Gdańsk during two separate three-year periods: 1672–1674 and 1691–1693.
The daily resolution of information enabled us to more reliably recognise wind conditions during the study period than with rare information from less comprehensive sources. Therefore, the comparison of results for extremely strong winds in Poland with contemporary instrumental data should be more accurate than when using other available sources. For each event of strong wind occurrence in Poland, a detailed reference to the source(s) is given, see https://doi.org/10.18150/ESPWII.
The quality of each source was assessed using the method known as “source criticism” or the “historical method” in the historical sciences. This method, commonly used by historians, enables assessment of the trustworthiness and utility of a historical source, including for interpretation in conducting research into (in our case) the occurrence of strong winds.
The quality of every source describing strong winds was estimated using three categories: 1 (weak), 2 (moderate), and 3 (high). If there were multiple sources describing the same event, more weight was given to the most credible source. To stratify sources according to these three categories, the following rules were utilised:
- Category 1:
-
Information was derived from secondary literature rather than the original source.
- Category 2:
-
Information was written centuries after the strong wind occurrence.
- Category 3:
-
Information was written in a source in the same period as the strong wind event occurred, and provides precise information.
As mentioned, we primarily used the last category of sources for the analysis, as it provided the most valuable and reliable information. However, when a lower-quality source contained useful information on wind strength or its effects – information not found in the highest-quality, most reliable source – that information was also included, and the source was added to the list.
2.2.1 Database: historical period
The database listing strong-wind occurrences in Poland for the 17th century is available at https://doi.org/10.18150/ESPWII (Przybylak et al., 2026). It extends the existing database, which ends in 1600 (for details, see Przybylak et al., 2025), by another 100 years (up to 1700). The construction of the present database is identical to that of the published, first-mentioned database. This means that it also contains detailed information not only on the timing and duration of strong wind events, but also on their location/region and intensity, and the extent and character of damage. Additionally, the exact text of the original weather note, the source's name, and an evaluation of the source's quality are provided. Available historical sources contain information of varying quality and content. Sometimes they provide all the necessary information about strong winds, and sometimes the information is very simplified and generalised, which does not allow for the completion of all the desired types of information. For example, in cases of strong winds for which no information is available about a specific place or region, we introduced an additional region category called “Poland”. The time and duration of strong wind events are also often incomplete, being limited to a single year or season. However, in most cases, we have precise information containing the year, month, and day(s) (and often the start and end dates of the event). This varied, imprecise information about the timing of strong wind events introduces peculiarities into the calculated statistics. For example, the frequency of strong wind occurrences calculated by season takes into account all cases with precise timing, as well as cases for which available information is only about the month belonging to the given season, and those for which information is only available about the season itself. In Table 1, we present selected database entries that illustrate varying degrees of detail.
Table 1Examples of entries in the strong wind database.
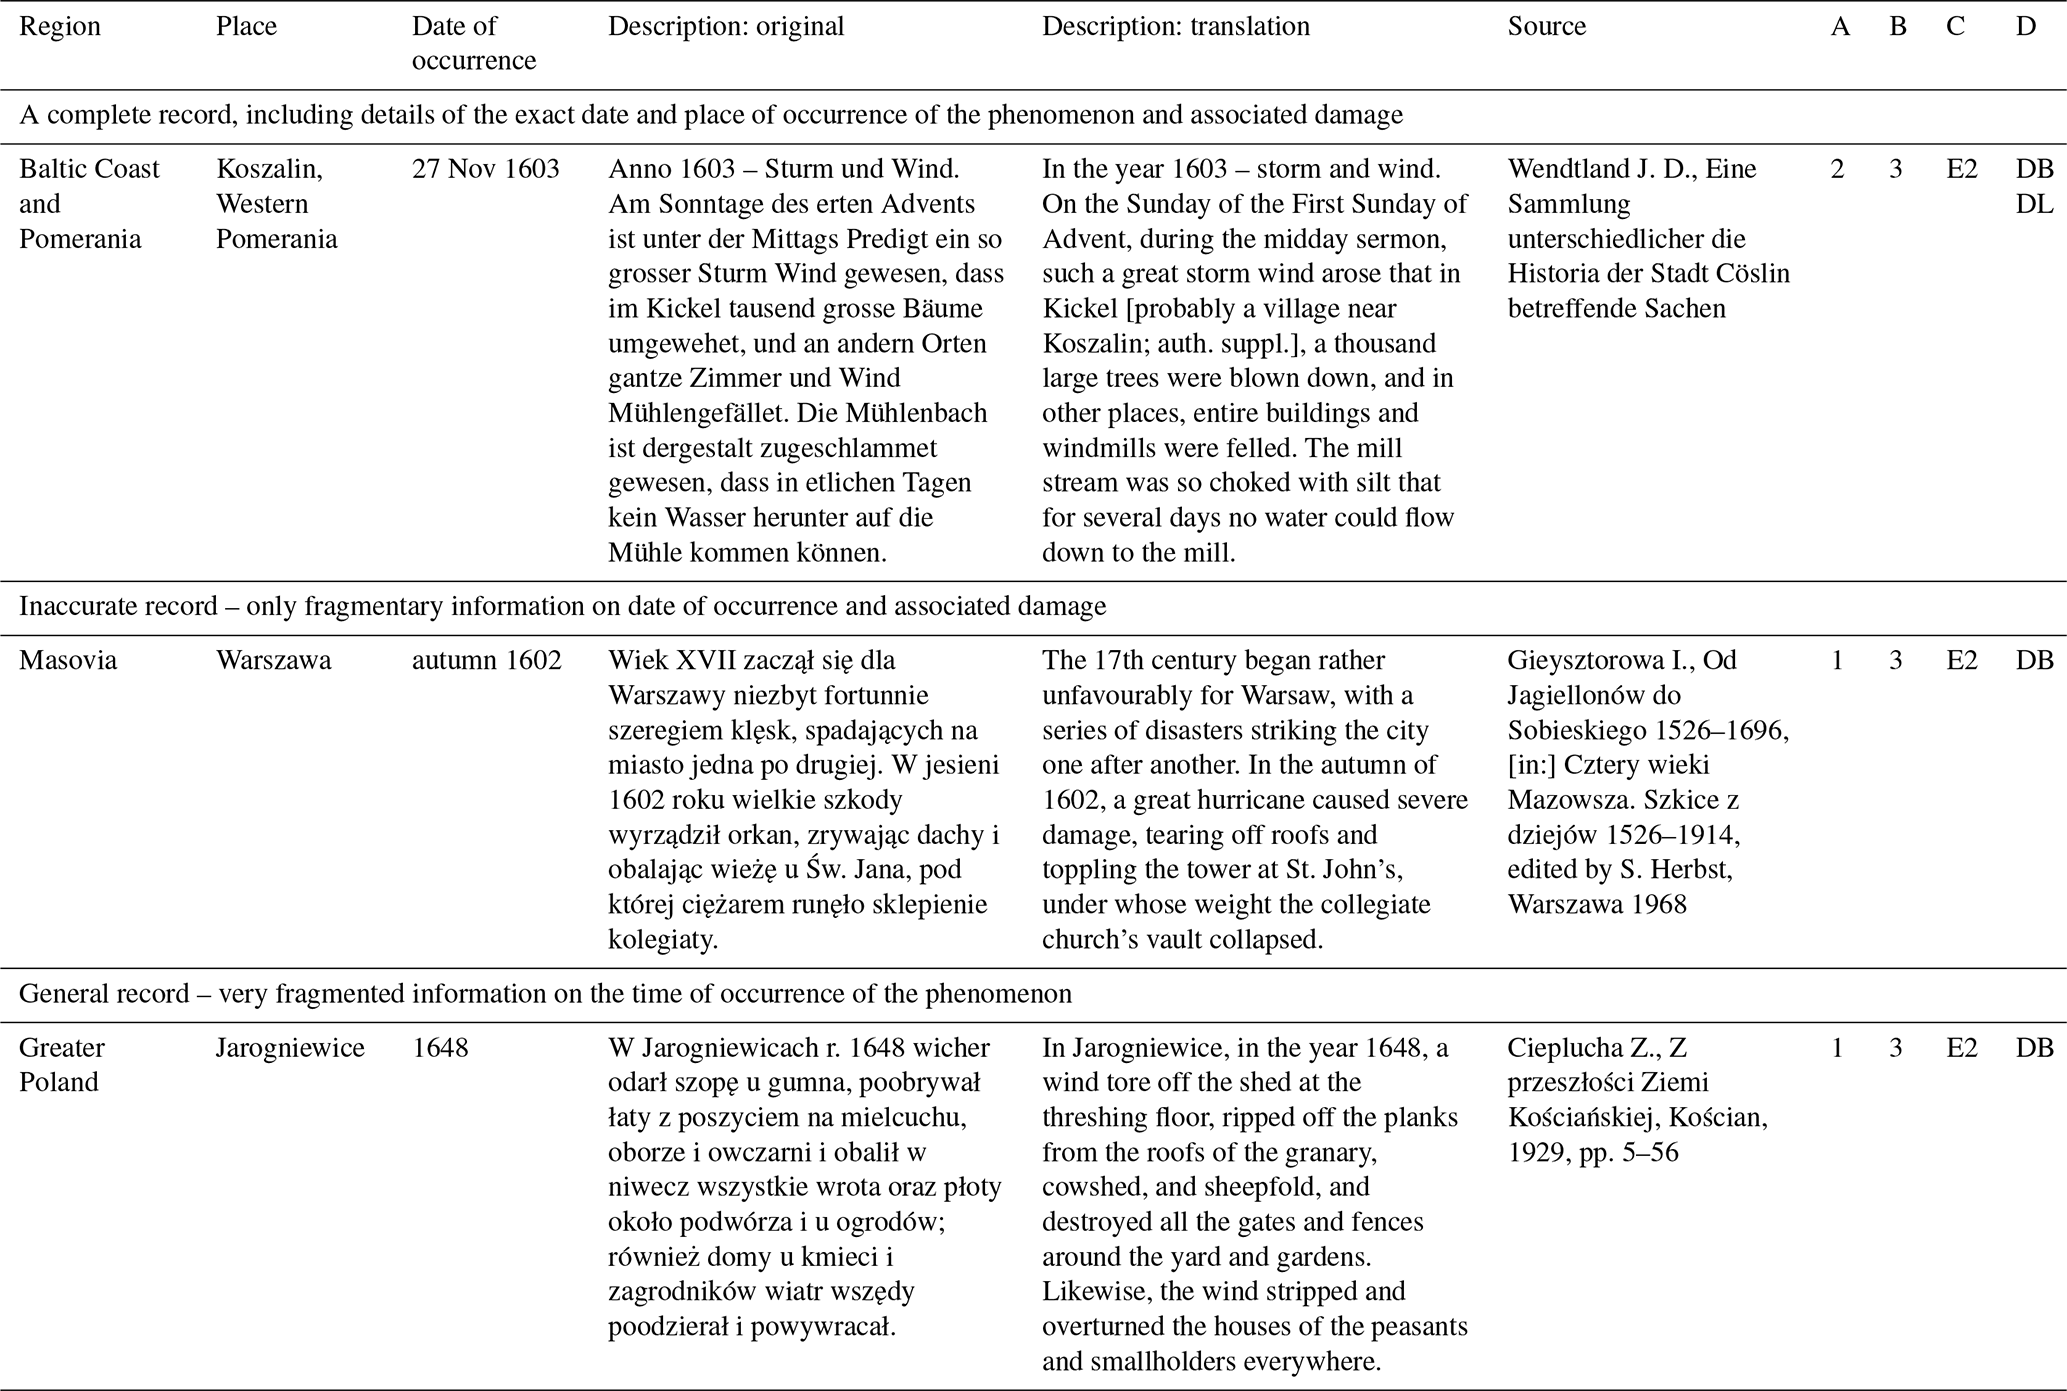
Explanations: A – source quality; B – type of strong wind; C – extent of damage of strong wind; D – character of damage of strong wind.
Table content (numbers, etc.) is fully described in the database and in the Methods.
The database of strong wind occurrences in Poland for the 17th century contains 525 records and is based on 542 weather notes. As seen, the number of strong wind occurrences does not match the number of weather notes used. This is because one weather note can contain information about more than one strong wind occurrence. On the other hand, the same case of strong wind can be described in many weather notes available in different historical sources. The matter is further complicated by the fact that the number of historical sources differs significantly from both the number of strong wind events and the number of available weather records. The differences are greater when informationally richer sources (e.g., with daily resolution) are available for the study period. In the 17th century, such sources in Poland include Jan Antoni Chrapowicki's daily Diary and Büthner's Calendars.
The decadal frequencies of statistics of weather notes documenting the occurrence of strong winds are presented in Fig. 2. Notably, the greatest decadal number of weather notes (>100 cases, except for the decade 1681–1690) was found for the second half of the 17th century (Fig. 2a). Such a pattern also appears when we exclude weather notes taken from the richest sources mentioned above, but the number of weather notes do not exceed 20 (see blue colour in Fig. 2a). In the first half of the 17th century, the decade with the richest weather notes describing strong winds is the first decade (20 cases). The majority of weather notes in the historical sources related to just two regions – Baltic Coast and Pomerania (265 cases) and Masuria-Podlasie (199) – while the regions for which fewest were available were Greater Poland and “Poland” (2 and 1, respectively) (Fig. 2b). However, when sources with daily weather notes are omitted, the greatest number of weather notes still relates to the Baltic Coast and Pomerania region (70) but, after that, to Silesia (21).
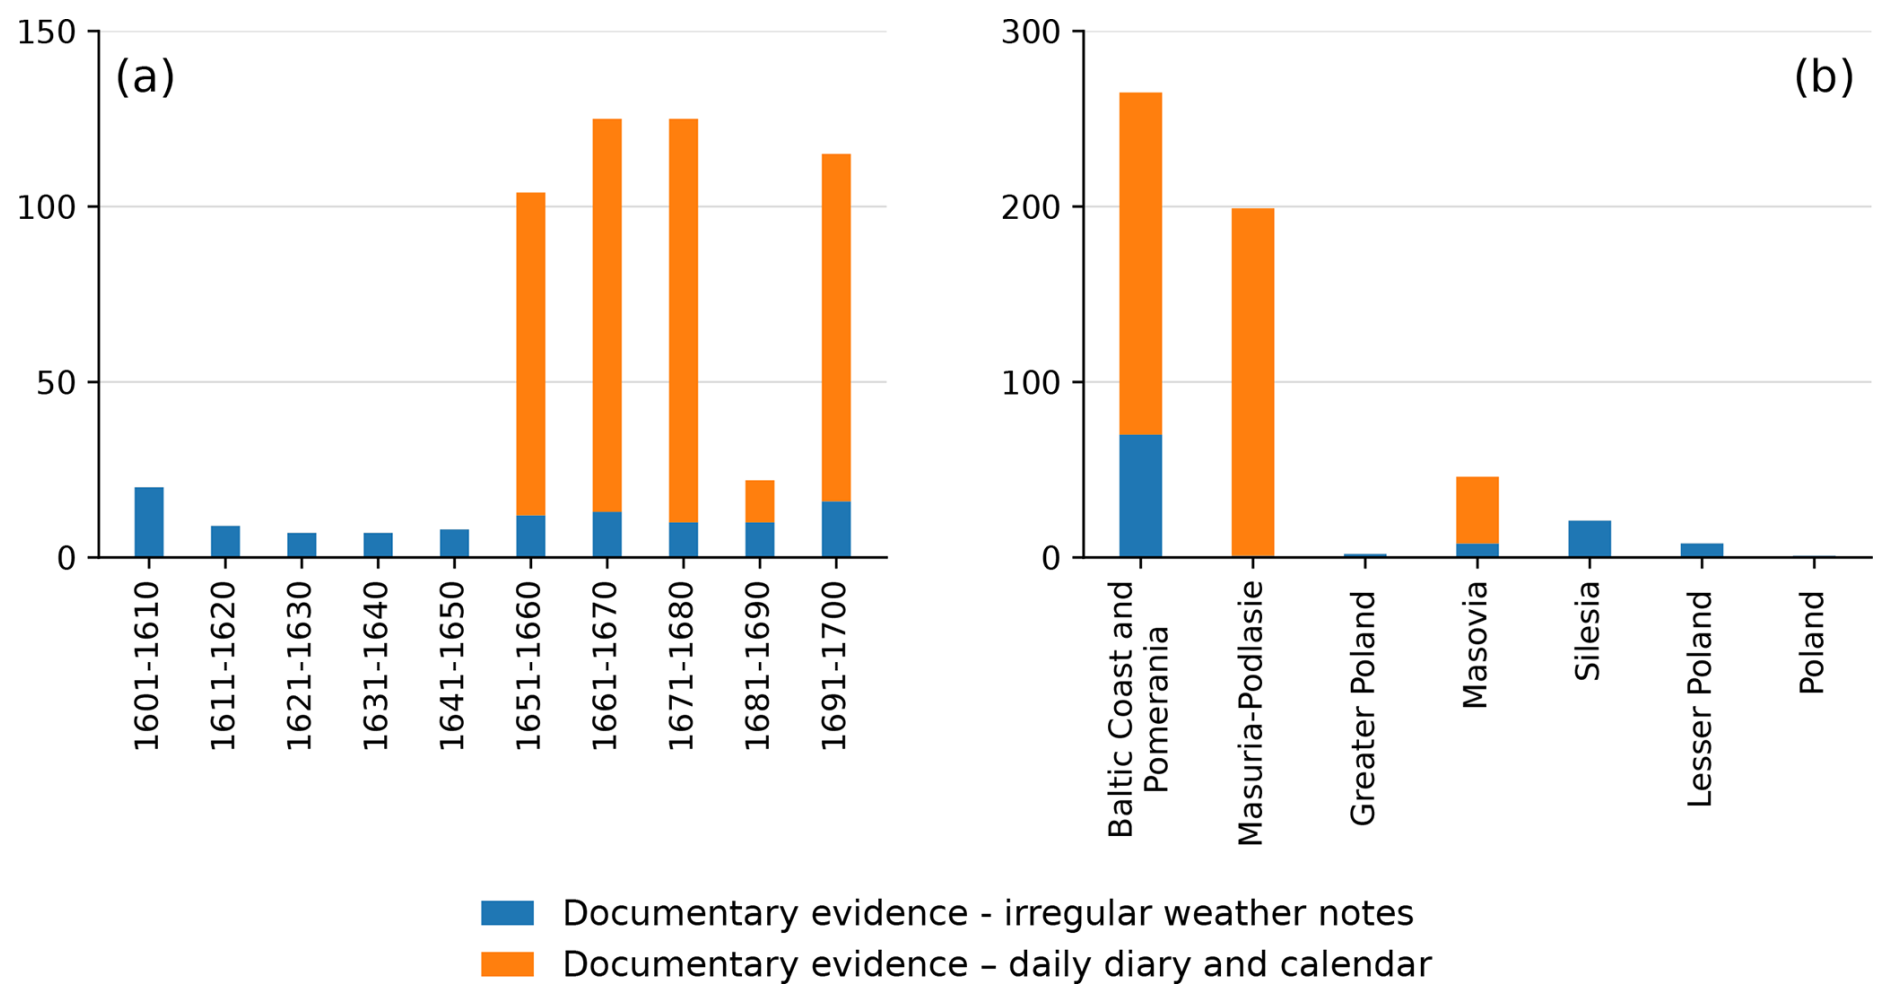
Figure 2Number of weather notes relating information on strong winds in the period 1601–1700: (a) for Poland, (b) separately for regions.
2.2.2 Database: contemporary period
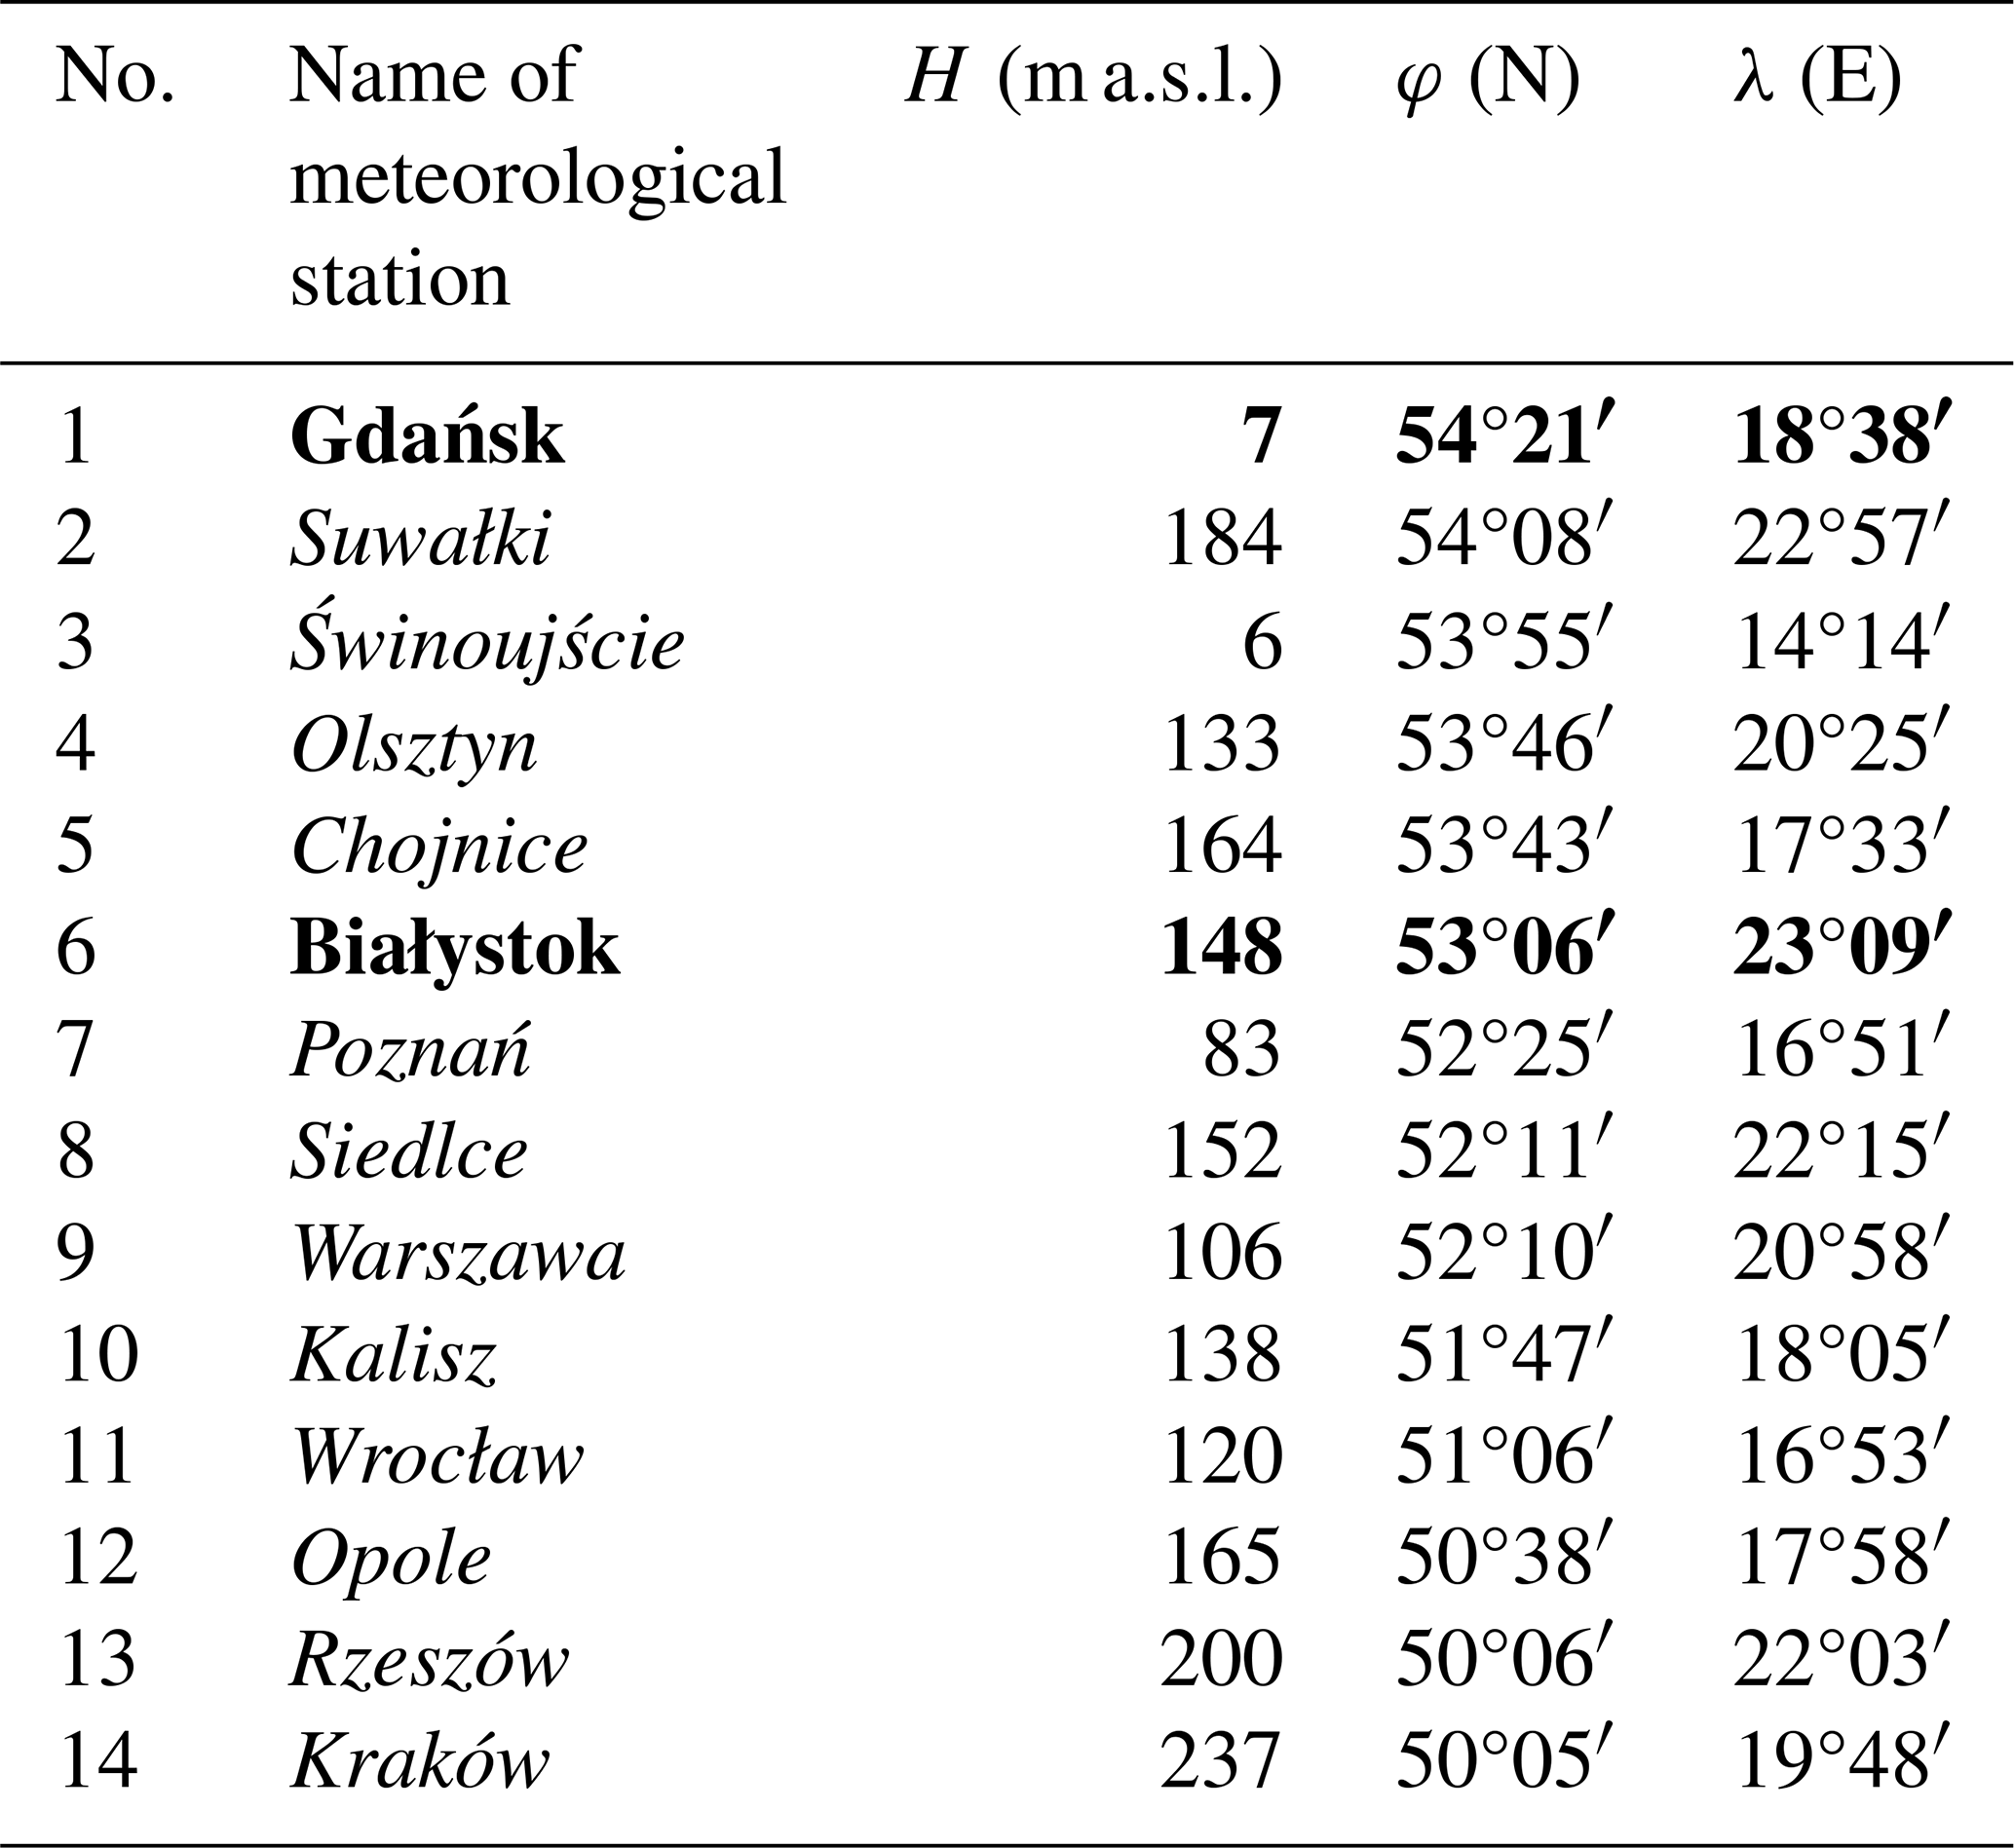
In the present paper, we compiled sub-daily wind speed data for the same set of 12 Polish meteorological stations, representing all six of the historical geographical regions in the country (Table 2, Fig. 1), as distinguished and used by Przybylak et al. (2025) to characterise winds prior to the 17th century. However, we propose a new contemporary period (2011–2025), due to the greater availability of accurate data – specifically, the ability to count gusts from so-called “previous weather”. For purposes of comparison with historical data extracted from the daily Diary (1656–1663) and the Calendars (1672–1674 and 1691–1693), for which we have a significantly larger amount of information than for other periods in the 17th century (see Fig. 2), we selected two additional new meteorological stations: Gdańsk on the eastern Baltic Coast and Białystok in north-eastern Poland (Table 2, Fig. 1). These locations correspond with the areas (or places) of each chronicler's activity. Data from all 14 stations listed in Table 2 were downloaded from the website of the Institute of Meteorology and Water Management – National Research Institute (IMGW-PIB) (https://danepubliczne.imgw.pl/, last access: 1 March 2026). Two data types were collected, i.e. (i) average wind speed every hour and (ii) the highest gust speed for 1 h intervals.
Table 2Geographical location of meteorological stations used in the work. Key: station names after Przybylak et al. (2025) given in italic; names of new stations given in bold.
2.3 Methods
2.3.1 Historical period
In the present paper, we employed the same methodology developed and used in our previous paper (Przybylak et al., 2025). This enabled direct comparison of the results presented in both articles. Strong wind cases were assigned to five categories. The first four are consistent with the proposition given by Brázdil et al. (2004, their types T1, T3–T5 in Table 6.1) for the Czech Lands, while the last one (tornadoes) was added by us.
- (a)
Fresh and strong breeze (force according to Beaufort Scale [BS] 5–7)
- (b)
Gale (BS 8–9)
- (c)
Storm (BS 10 and more)
- (d)
Squall (i.e., gusty wind during a thunderstorm)
- (e)
Tornado
The classification of strong winds into the above categories was originally made by the team member entering the record of strong wind occurrences into the database. In the following step, all propositions were discussed and ultimately accepted by all team members. The same procedure was also used to estimate the degree of damage caused by strong winds. Again, the proposition given by Brázdil et al. (2004) was used, but with a minor modification. Three categories of extent of damage (E0–E2) were utilised:
- E0:
-
no information about damage
- E1:
-
small damage, damage of lesser extent
- E2:
-
large damage, areally extensive damage
Given Poland's coastal location, the E2 category was modified to account for damage at sea (e.g., the destruction or sinking of ships) and losses from storm floods. Information about damage caused by strong winds is sometimes more precise, allowing for the estimation of the type of damage. Brázdil et al. (2004, Table 3) proposed types of damage for the Czech Lands, which we modified for Poland by adding two more categories that precisely describe the influence of the Baltic Sea on coastal areas. Most often, however, the weather notes did not include information on the character of damage, and in such cases, we introduced a separate category, “N/A”. The procedure for determining the final classification of damage types was carried out as described earlier to assess the intensity of strong winds and the extent of their damage. Thus, to characterise damages and losses caused by strong winds, the following nine categories were used:
- DO:
-
casualties (lost lives)
- DL:
-
wind damage in forests
- DP:
-
minor damage to buildings
- DB:
-
considerable damage or destruction of buildings
- DS:
-
fruit trees uprooted, damage to hop gardens and vineyards
- DU:
-
damage to field crops, gardens and orchard harvests
- DV:
-
considerable damage/destruction to vessels, including sinking (newly added)
- DJ:
-
other damage (e.g., upturned carriages, vessels, injured persons, minor damage to property)
- DF:
-
considerable damage/destruction by storm flood or inland flood (newly added)
- N/A:
-
information not available
More details on the classification of strong winds in the historical period and their consequences are available in the database: https://doi.org/10.18150/ESPWII.
To assess the influence of source resolution on the reconstructed characteristics of strong winds, we additionally repeated selected analyses after separating the historical database into two groups: (i) irregular weather notes derived from documentary sources that did not provide systematic daily observations, and (ii) daily-resolution observations derived from Chrapowicki's Diary and Büthner's Calendars. We compared the relative frequencies of the different strong-wind categories, their seasonal distributions, and their monthly and seasonal distributions among geographical regions. Results from the two source groups were also compared with those from the complete database. This source-specific analysis was undertaken to identify the effects of documentary-source characteristics on the reconstruction and to clarify the complementary information provided by the two types of evidence.
2.3.2 Contemporary period
For comparison with historical strong-wind data, we used contemporary instrumental observations of this variable from stations evenly distributed across Poland (Table 2, Fig. 1). For historical daily weather observations from a single location or region, we used data from nearby weather stations. The following statistics were calculated:
-
Average daily, monthly, seasonal, and annual wind speed
-
Highest gust speed for every day, month, season, and year
-
Frequency of gusts >17.0 m s−1 calculated for every month and year for each station
-
Frequency of gusts in the following speed intervals:
- (a)
8.0–17.1 m s−1 (BS 5–7): quite strong, strong, and very strong wind
- (b)
17.2–24.4 m s−1 (BS 8–9): gale
- (c)
>24.4 m s−1 (BS 10–12): very strong and violent storms, and hurricanes
- (a)
Comparing historical data with present data is not straightforward. In this paper, we employed two independent methodologies, depending on the resolution and character of the historical data. For irregular weather notes about strong winds, we follow the proposition given by Przybylak et al. (2025). This means that comparison with historical data applied the three categories of modern data listed in point 4 above, particularly those described in points (b) and (c). Most reliably, however, we can compare only differences and similarities in the study area's annual cycle and spatial distribution, but not the numbers of cases, because many of them in historical time were undetectable. All studied aspects of strong wind occurrences during the study period can be more reliably compared to present conditions in the case of historical data extracted from the daily Diary (1656–1663) and the Calendars (1672–1674 and 1691–1693), also including the quite strong, strong, and very strong winds (category 4a, BS 5–7), as well as absolute number of cases of all categories of strong winds.
Finally, we note that the IMGW-PIB (Polish weather service) has recently begun cataloguing extreme weather, climate, and water phenomena and has developed a dedicated database; however, the material collected to date is insufficient for a comprehensive analysis.
3.1 Historical
The number of strong winds recorded in Poland in the 17th century was 525 (Table 3, Fig. 3; see also database https://doi.org/10.18150/ESPWII). If only irregular weather notes were taken into account, annual and decadal frequencies of strong winds were quite evenly distributed throughout the century, not usually exceeding 5 and 15 cases, respectively (Fig. 3, blue bars). For the second half of the 17th century, two very comprehensive sources are available that present results of daily weather observations by Jan Antoni Chrapowicki in north-eastern Poland (Fig. S2 in the Supplement) and Friedrich Büthner in Gdańsk (second category of notes). In the first source, we found as many as 236 notes containing information about the occurrence of strong wind, while in the second, we found only slightly fewer (194) (Fig. 3).
Table 3Monthly, seasonal, and annual numbers of strong winds in Poland in the 17th century.
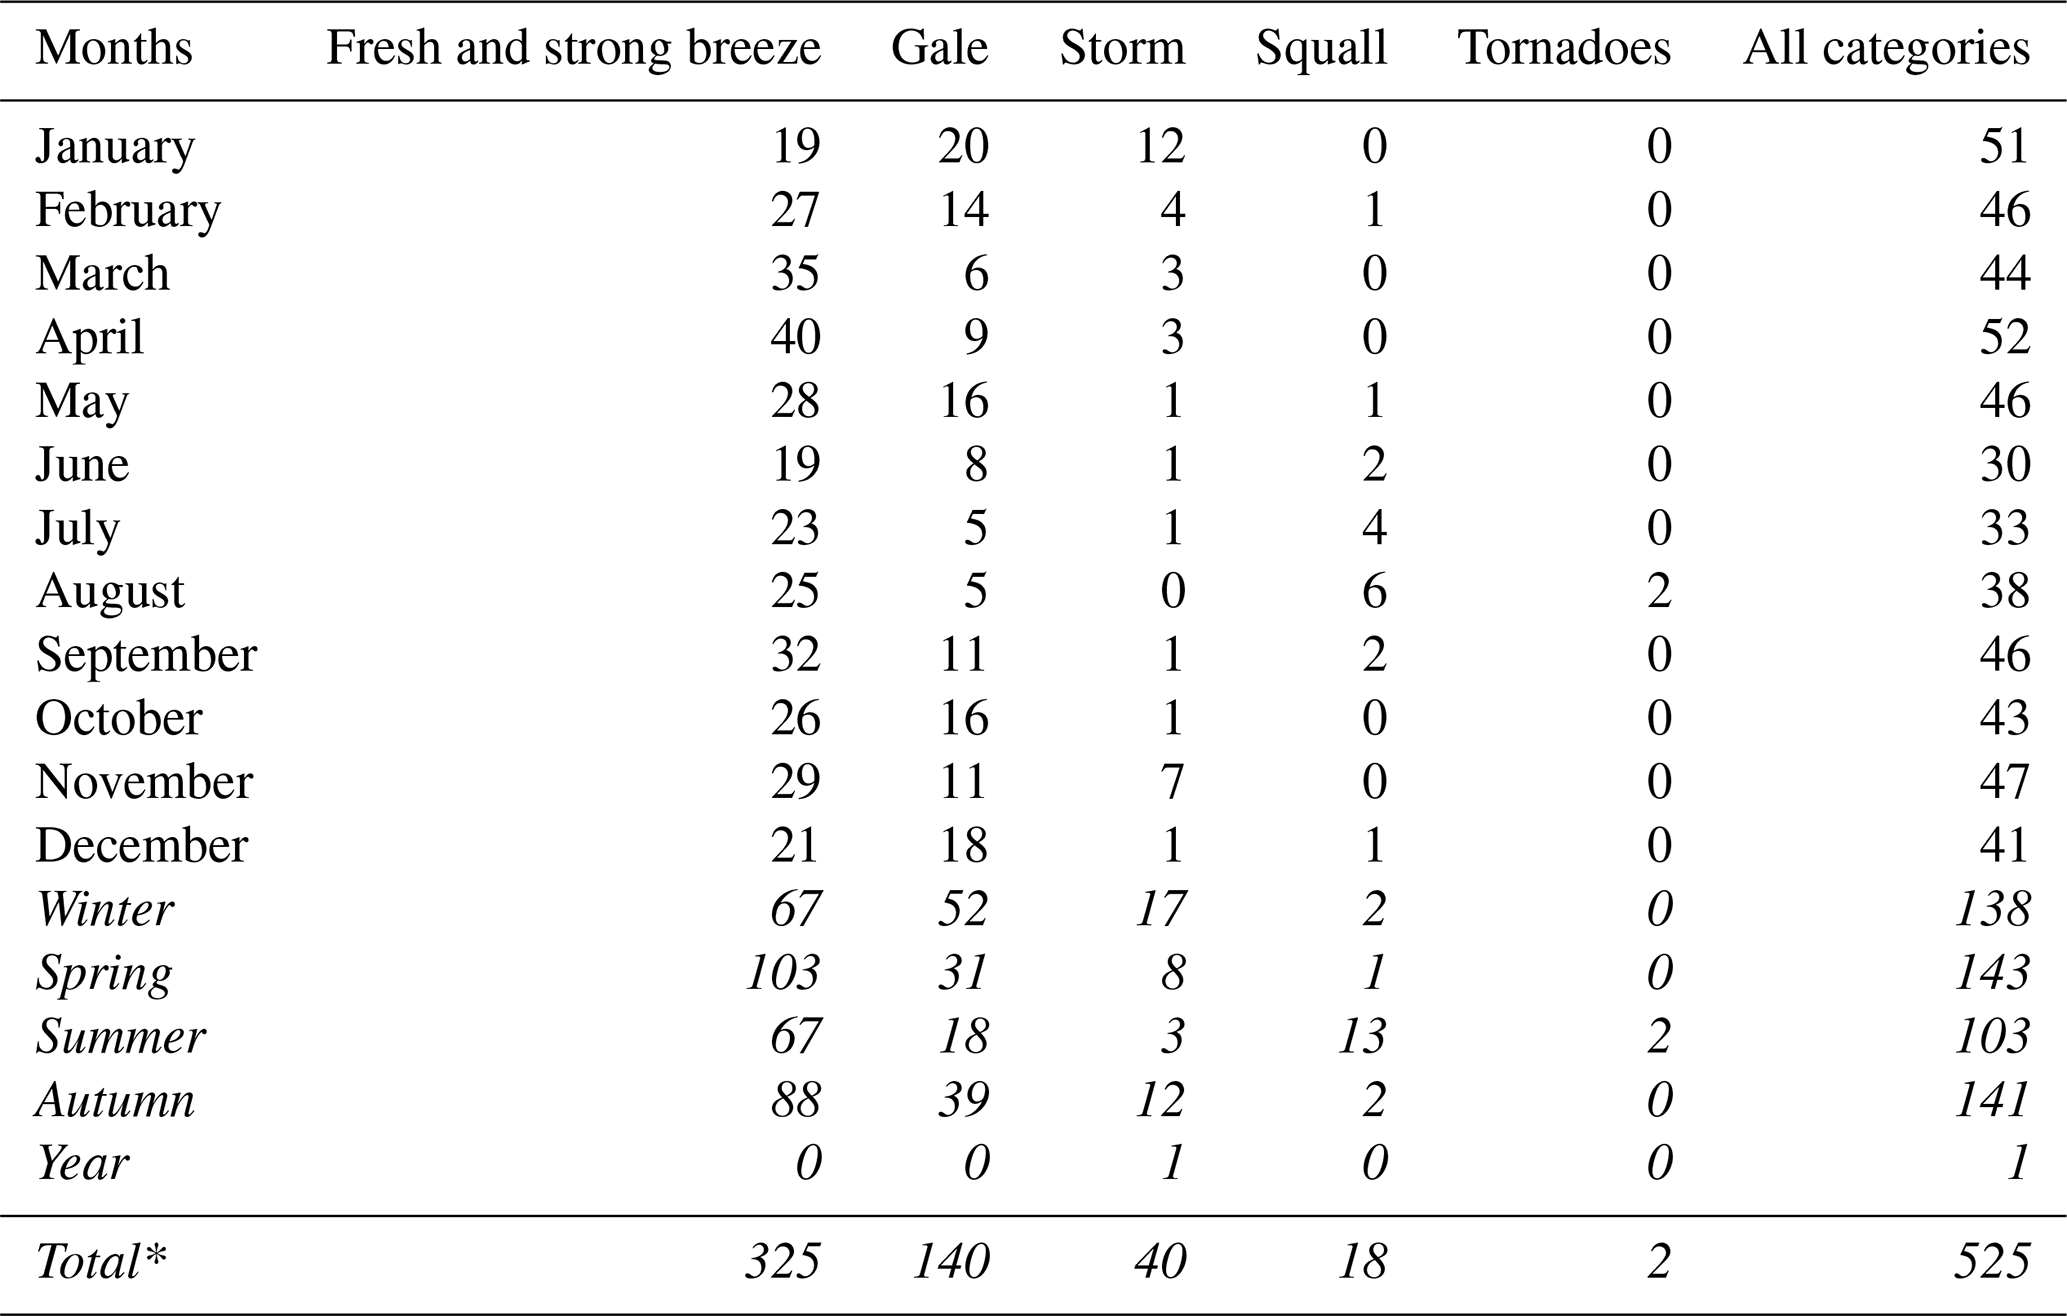
* NB: The total number of strong winds was calculated based on seasonal values, as we have information about the season for all events (except in one case, only the year is known; this case was added to the annual number of cases), while for 6 cases, there is no information about the month.
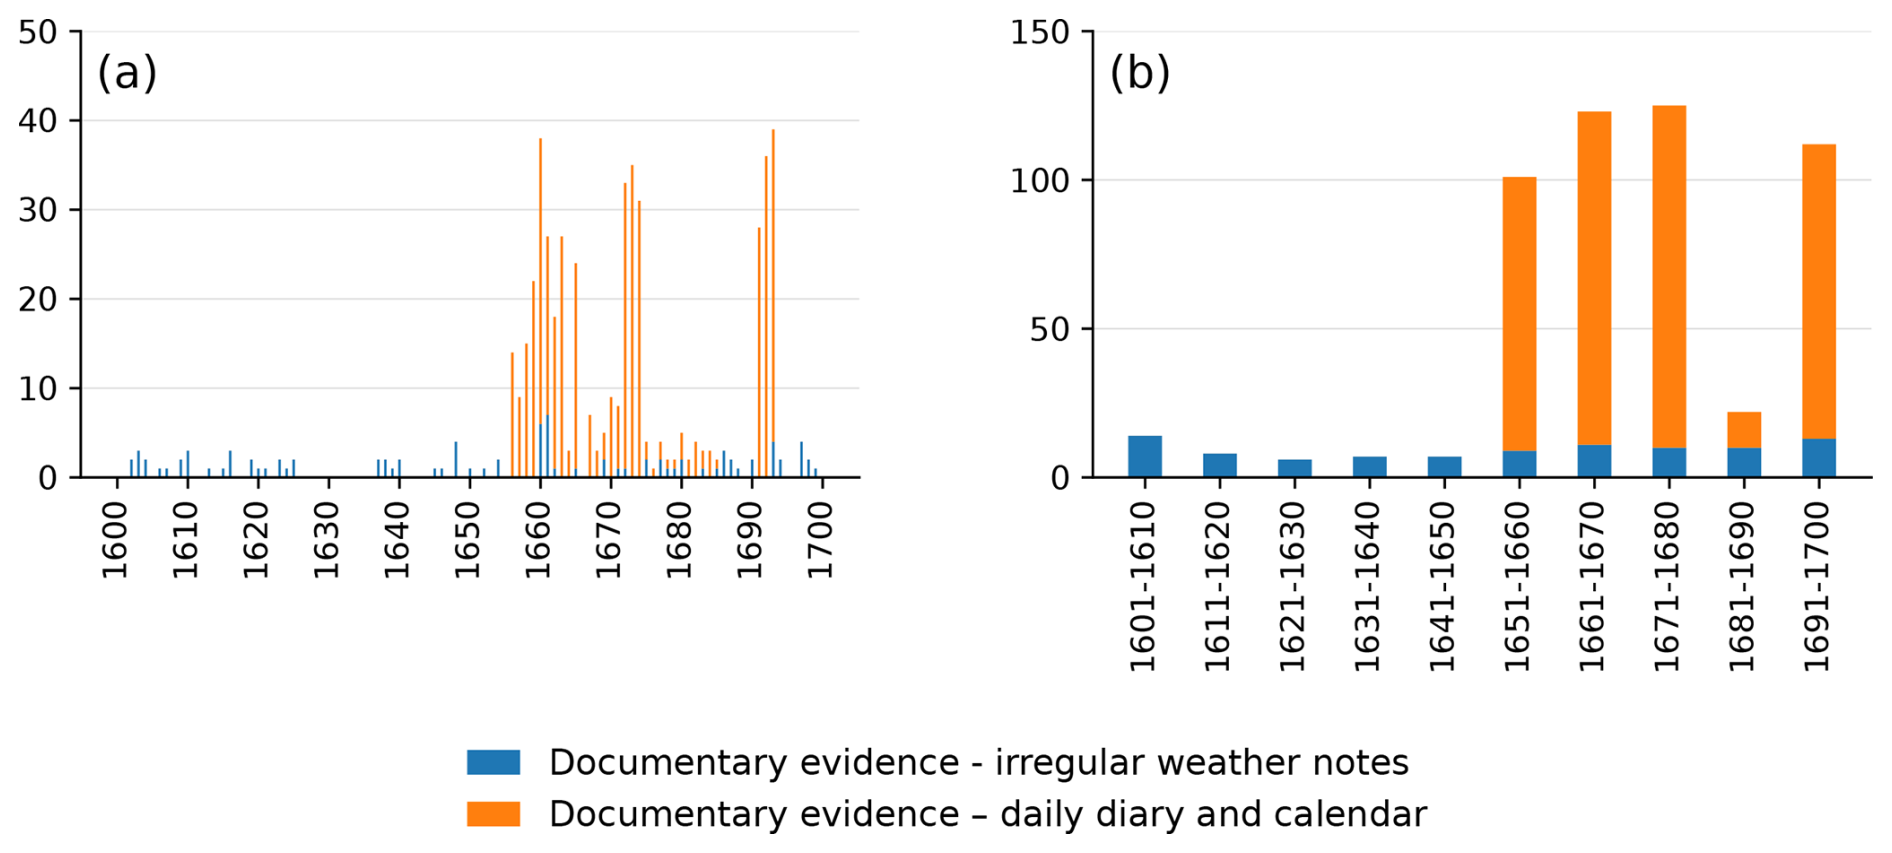
Figure 3Number of occurrences of strong wind categories in Poland in the 17th century: (a) annually, (b) by decade.
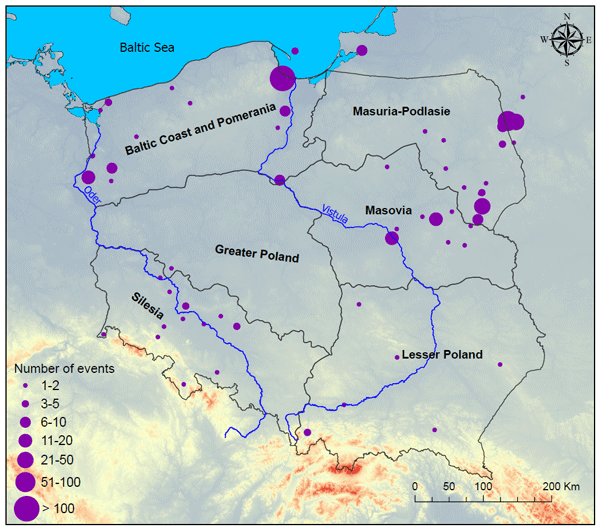
The peak number of strong winds in the annual cycle occurred between November and May (inclusive) and ranged from 44 to 52 cases, excluding December (41). Seasonal totals for autumn, winter, and spring were very similar (∼140 cases), though the spring total of 143 was the highest (Table 3). The lowest seasonal total was for summer (103), largely due to low monthly totals in June (30) and July (33). The spatial distribution of strong wind events registered in the historical sources is shown in Figs. 4 and 5. The regions with the greatest numbers of strong winds were the Baltic Coast and Pomerania, and Masuria-Podlasie (Fig. 4), i.e., in northern Poland (Fig. 5); the fewest occurred in the Greater Poland region. A relatively high number of strong winds was also noted in the Masovia region. For individual locations (66 sites), the greatest numbers of strong wind reports in the historical sources were found for Gdańsk (202 cases), Łabno (91), and Andrianki (49) (see Figs. 5 and S2). For the majority of sites (59), the number of registered strong winds is <10.
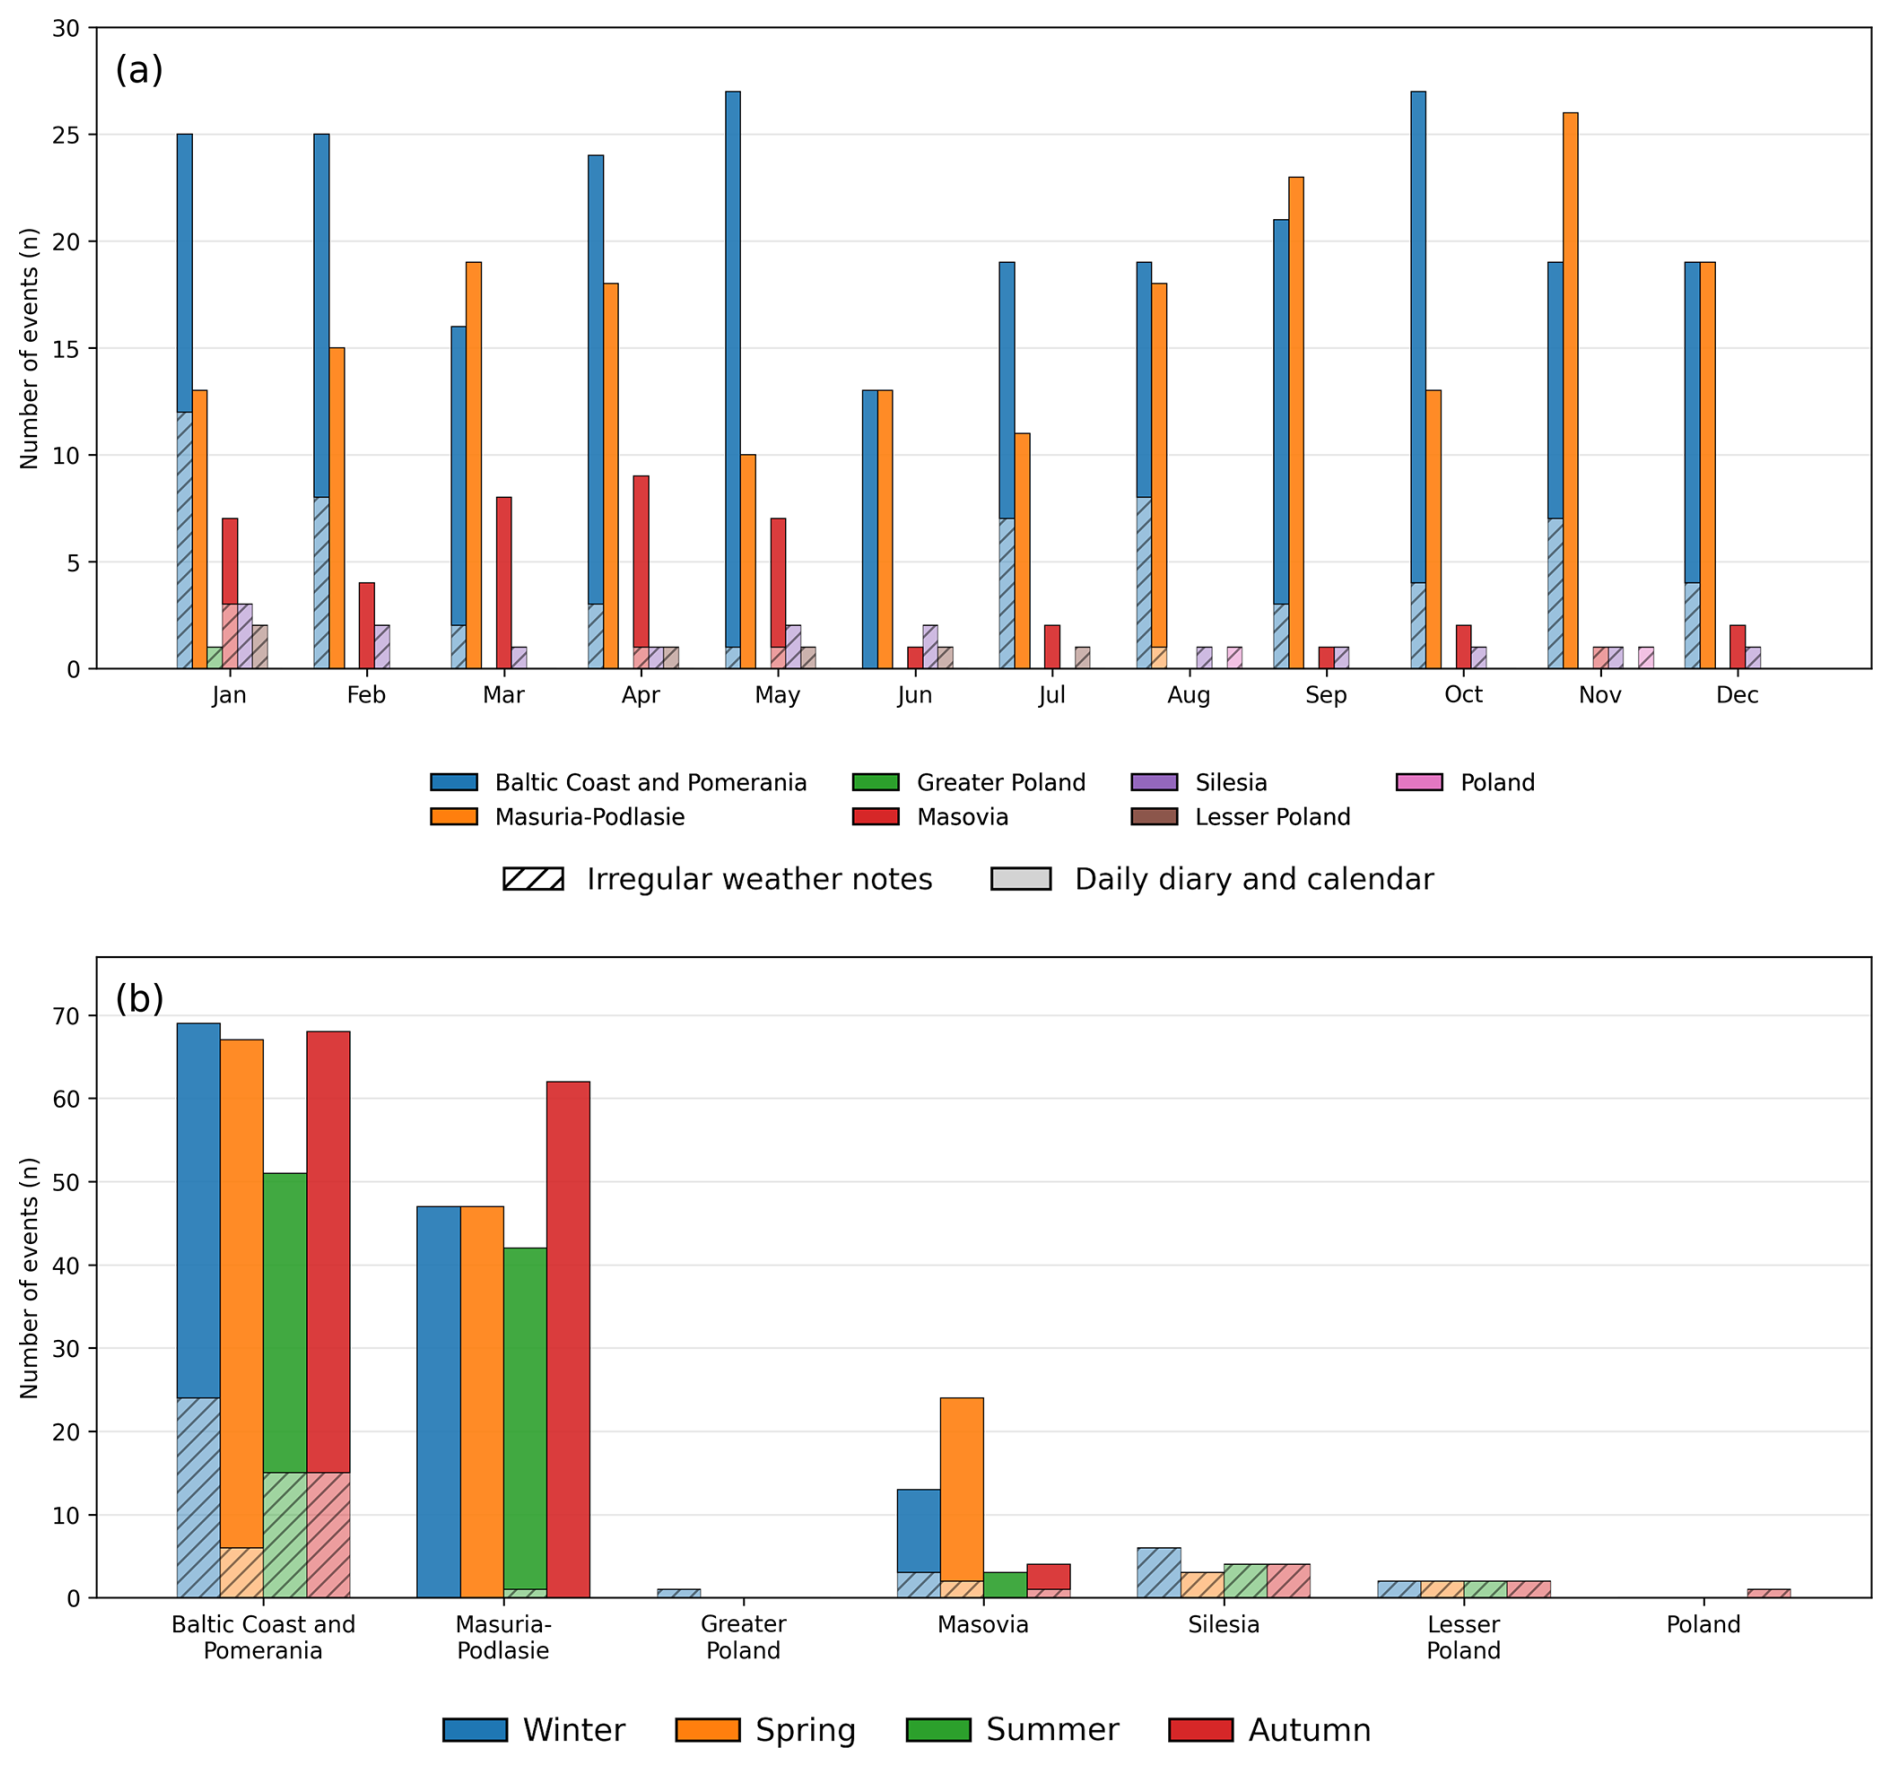
Figure 4Number (n) of strong winds of all categories by region, 1601–1700: (a) by month, (b) by season. Explanation: NB: The total number of strong winds in seasons/years presented in (b) is greater than calculated based only on monthly statistics because, in some weather notes, there is information only about the season or even the year of the strong wind occurrence (see also text in Sect. 2.2.1 and Table 1).
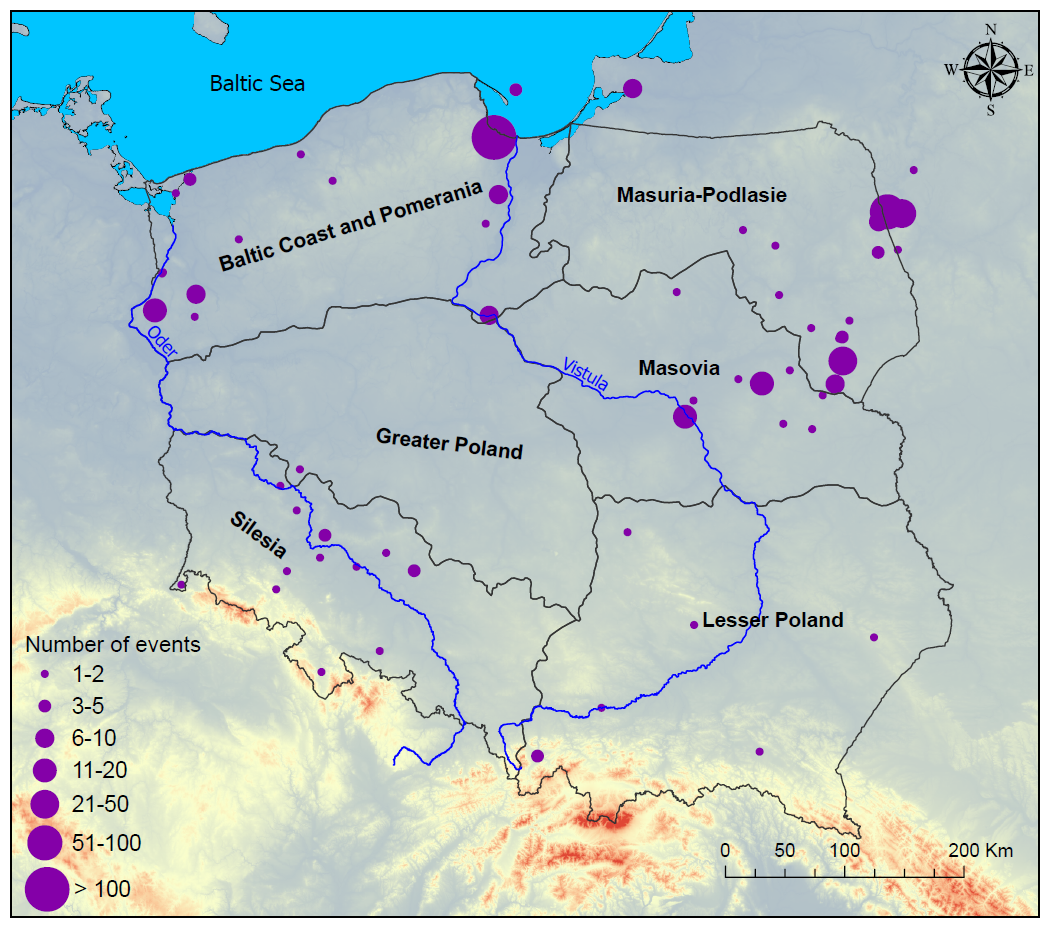
Figure 5Spatial distribution and number of strong wind events in Poland, 1601–1700.
In the annual cycle, most regions exhibit a clear summer minimum in the occurrence of strong winds (except Lesser Poland and Silesia). Meanwhile, clear seasonal maxima are observed in Masovia (in spring) and Masuria-Podlasie (in autumn) (Fig. 4). For the Baltic Coast and Pomerania, there is no clear seasonal maximum; the frequencies from autumn to spring range narrowly around 70 cases.
Separating the records according to source type reveals the influence of source availability on the reconstructed spatial and seasonal distributions (Figs. 4 and 6). Among the 95 strong-wind events identified from irregular weather notes, the Baltic Coast and Pomerania clearly dominate the record throughout the year. Other regions are represented much less frequently, although events are documented in all geographical regions considered in the study. The Baltic Coast and Pomerania contain 60 of the 95 events derived from irregular sources and show particularly high numbers during winter. Silesia is the second most frequently represented region in this source group. Of all the seasons analysed, strong wind events were recorded most frequently in winter and least frequently in spring.
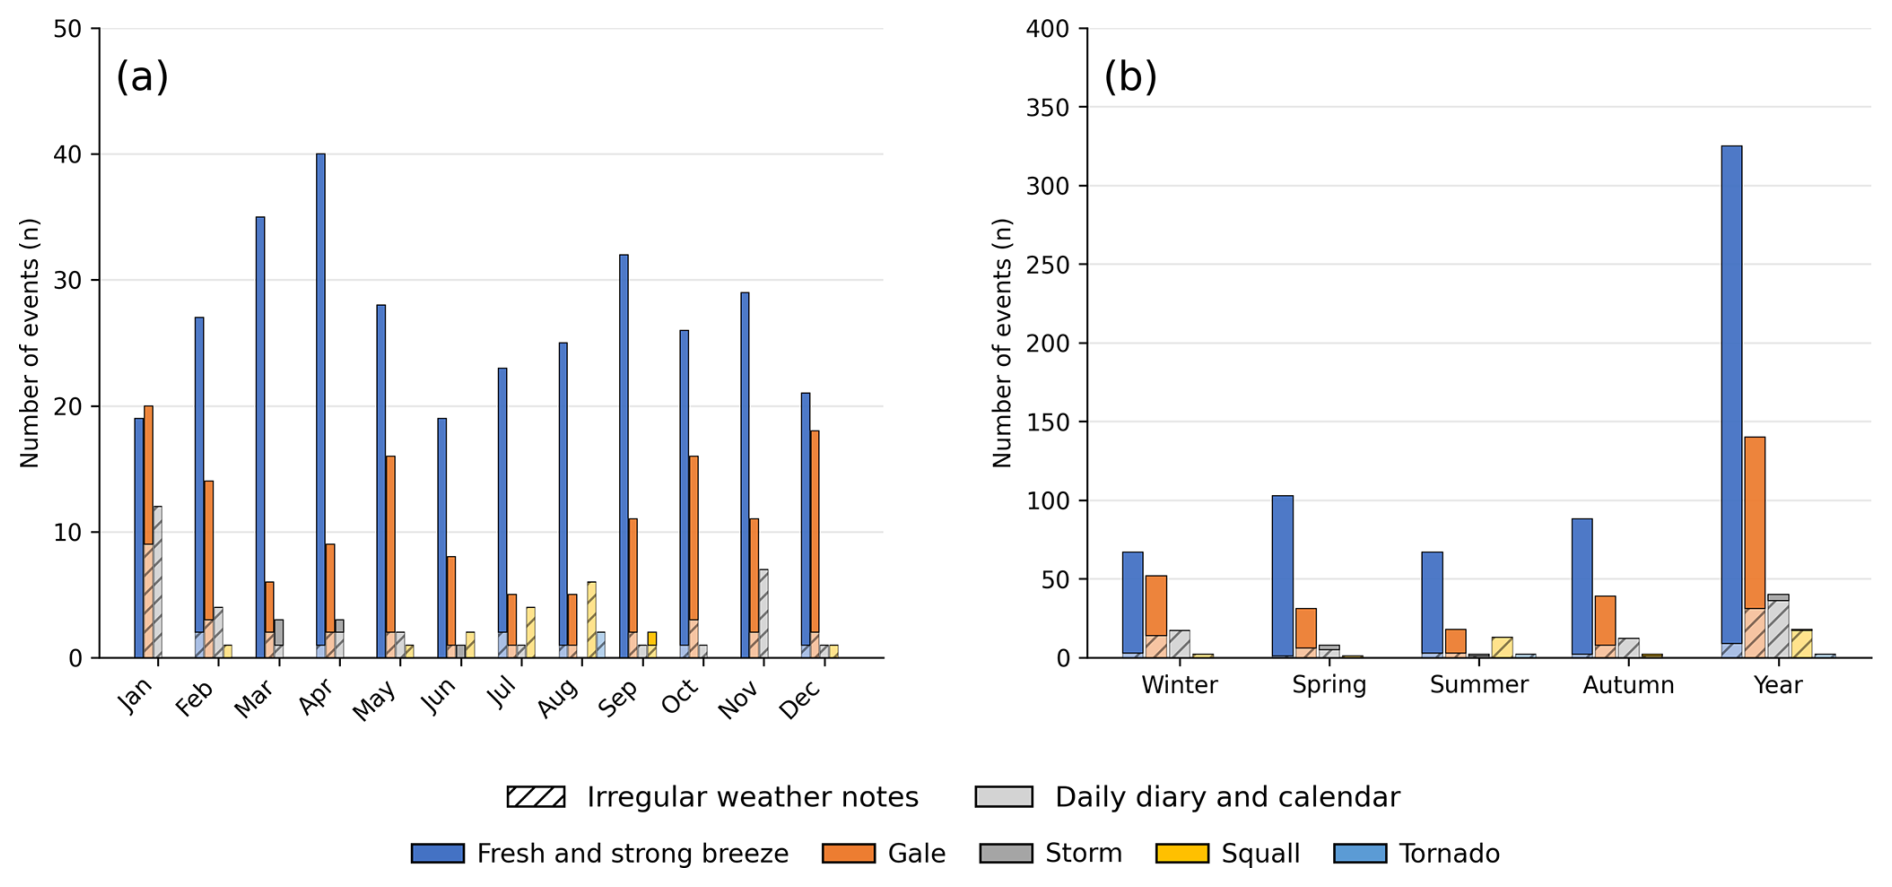
Figure 6Number (n) of occurrences of strong wind types in Poland, 1601–1700: (a) by month, (b) by season.
The distribution based on the daily Diary and Calendars differs because systematic daily observations are available only for specific areas. Of the 430 events identified from these sources, most occur in the Baltic Coast and Pomerania and Masuria-Podlasie regions, with a smaller contribution from Masovia. Strong wind events were recorded most frequently in transitional seasons (autumn and particularly in spring) (Figs. 4 and 6). Consequently, the very high number of records for Masuria-Podlasie in the complete database largely reflects the availability of Chrapowicki's systematic weather observations, whereas the prominence of the Baltic Coast and Pomerania is evident in both source groups. Therefore, the source-specific regional results demonstrate that absolute numbers of documented events are affected by the geographical distribution and temporal resolution of the available documentary evidence. At the same time, the irregular sources provide much broader spatial coverage, whereas the daily records substantially increase the completeness of observations within the regions for which they are available.
As shown in Fig. 6, the most abundant category is that representing the weakest strong winds (fresh and strong breeze), with 325 cases (61.9 %). A relatively high frequency was also observed for gales (140 cases; 26.7 %) and storms (40 cases; 7.6 %). The annual cycle of event frequency is distinct for each individual category of strong winds. The fresh and strong breeze category shows two maxima (spring: 103 and autumn: 88) and two minima (summer and winter: both 67) (Table 3, Fig. 6). Gales and storms are most common in winter and autumn, which together account for about two-thirds of all cases in the year, whereas only 11.7 % occurred in summer. Strong winds associated with the development of convective clouds (squalls) are observed mainly from May to September, with a maximum (71 %) in the summer months (Table 3, Fig. 6). Only two tornadoes were recorded in Poland in the 17th century – both in August.
The relative frequencies of the strong-wind categories differ significantly between the two types of documentary evidence (Figs. 6 and S3a in the Supplement). Among the 95 events derived from irregular weather notes, fresh and strong breezes account for only 9.5 % of cases, whereas storms (37.9 %), gales (32.6 %), and squalls (17.9 %) together constitute the great majority of records. By contrast, among the 430 events derived from the daily Diary and Calendars, fresh and strong breezes dominate strongly (73.5 %), followed by gales (25.3 %), while storms and squalls account for only 0.9 % and 0.2 %, respectively. The distribution in the complete database lies between these source-specific distributions, with fresh and strong breezes representing 61.9 %, gales 26.7 %, storms 7.6 %, squalls 3.4 %, and tornadoes 0.4 %.
These differences reflect the different character of documentary sources. Irregular historical records preferentially document unusual, severe, or damaging winds, whereas systematic daily weather observations also record less severe winds that did not necessarily produce notable impacts. Thus, the addition of daily observations does not simply increase the number of identified events; it broadens the range of wind intensities represented in the reconstruction.
Source type also influences the reconstructed seasonal distribution (Figs. 6 and S3b). Irregular weather notes show the largest proportion of documented strong winds in winter (38.3 %), followed by autumn (24.5 %) and summer (23.4 %), whereas spring accounts for only 13.8 %. The daily Diary and Calendars show a different distribution, with the largest proportion in spring (30.2 %), followed by autumn (27.4 %) and winter (23.7 %), and the smallest proportion in summer (18.6 %). In the complete database, spring, autumn, and winter have similar relative frequencies (27.3 %, 26.9 %, and 26.3 %, respectively), while summer has the lowest frequency (19.5 %).
The differences between the two source groups indicate that some aspects of the reconstructed annual cycle are sensitive to the nature and distribution of documentary evidence. In particular, irregular records preferentially preserve noteworthy severe-weather events, whereas daily observations provide more systematic coverage irrespective of event severity. Therefore, the combined seasonal distribution represents the full body of available documentary evidence rather than the output of a temporally and spatially uniform observation network.
The mildest category of strong winds (fresh and strong breeze) was most frequently noted (54 %) in the Masuria-Podlasie region, while the other analysed categories (tornadoes omitted due to very low frequency) were most frequent (≥50 %) in the Baltic Coast and Pomerania region (Fig. 7). Relatively large frequencies were noted for fresh and strong breezes in Baltic Coast and Pomerania (35 %), for gales in Masuria-Podlasie (14 %), for storms in Silesia (13 %) and Lesser Poland (12 %), and for squalls in Silesia (33 %) (Fig. 7). Only storms were registered in all studied regions, whereas the categories “fresh and strong breeze” and “squalls” were recorded in four regions.
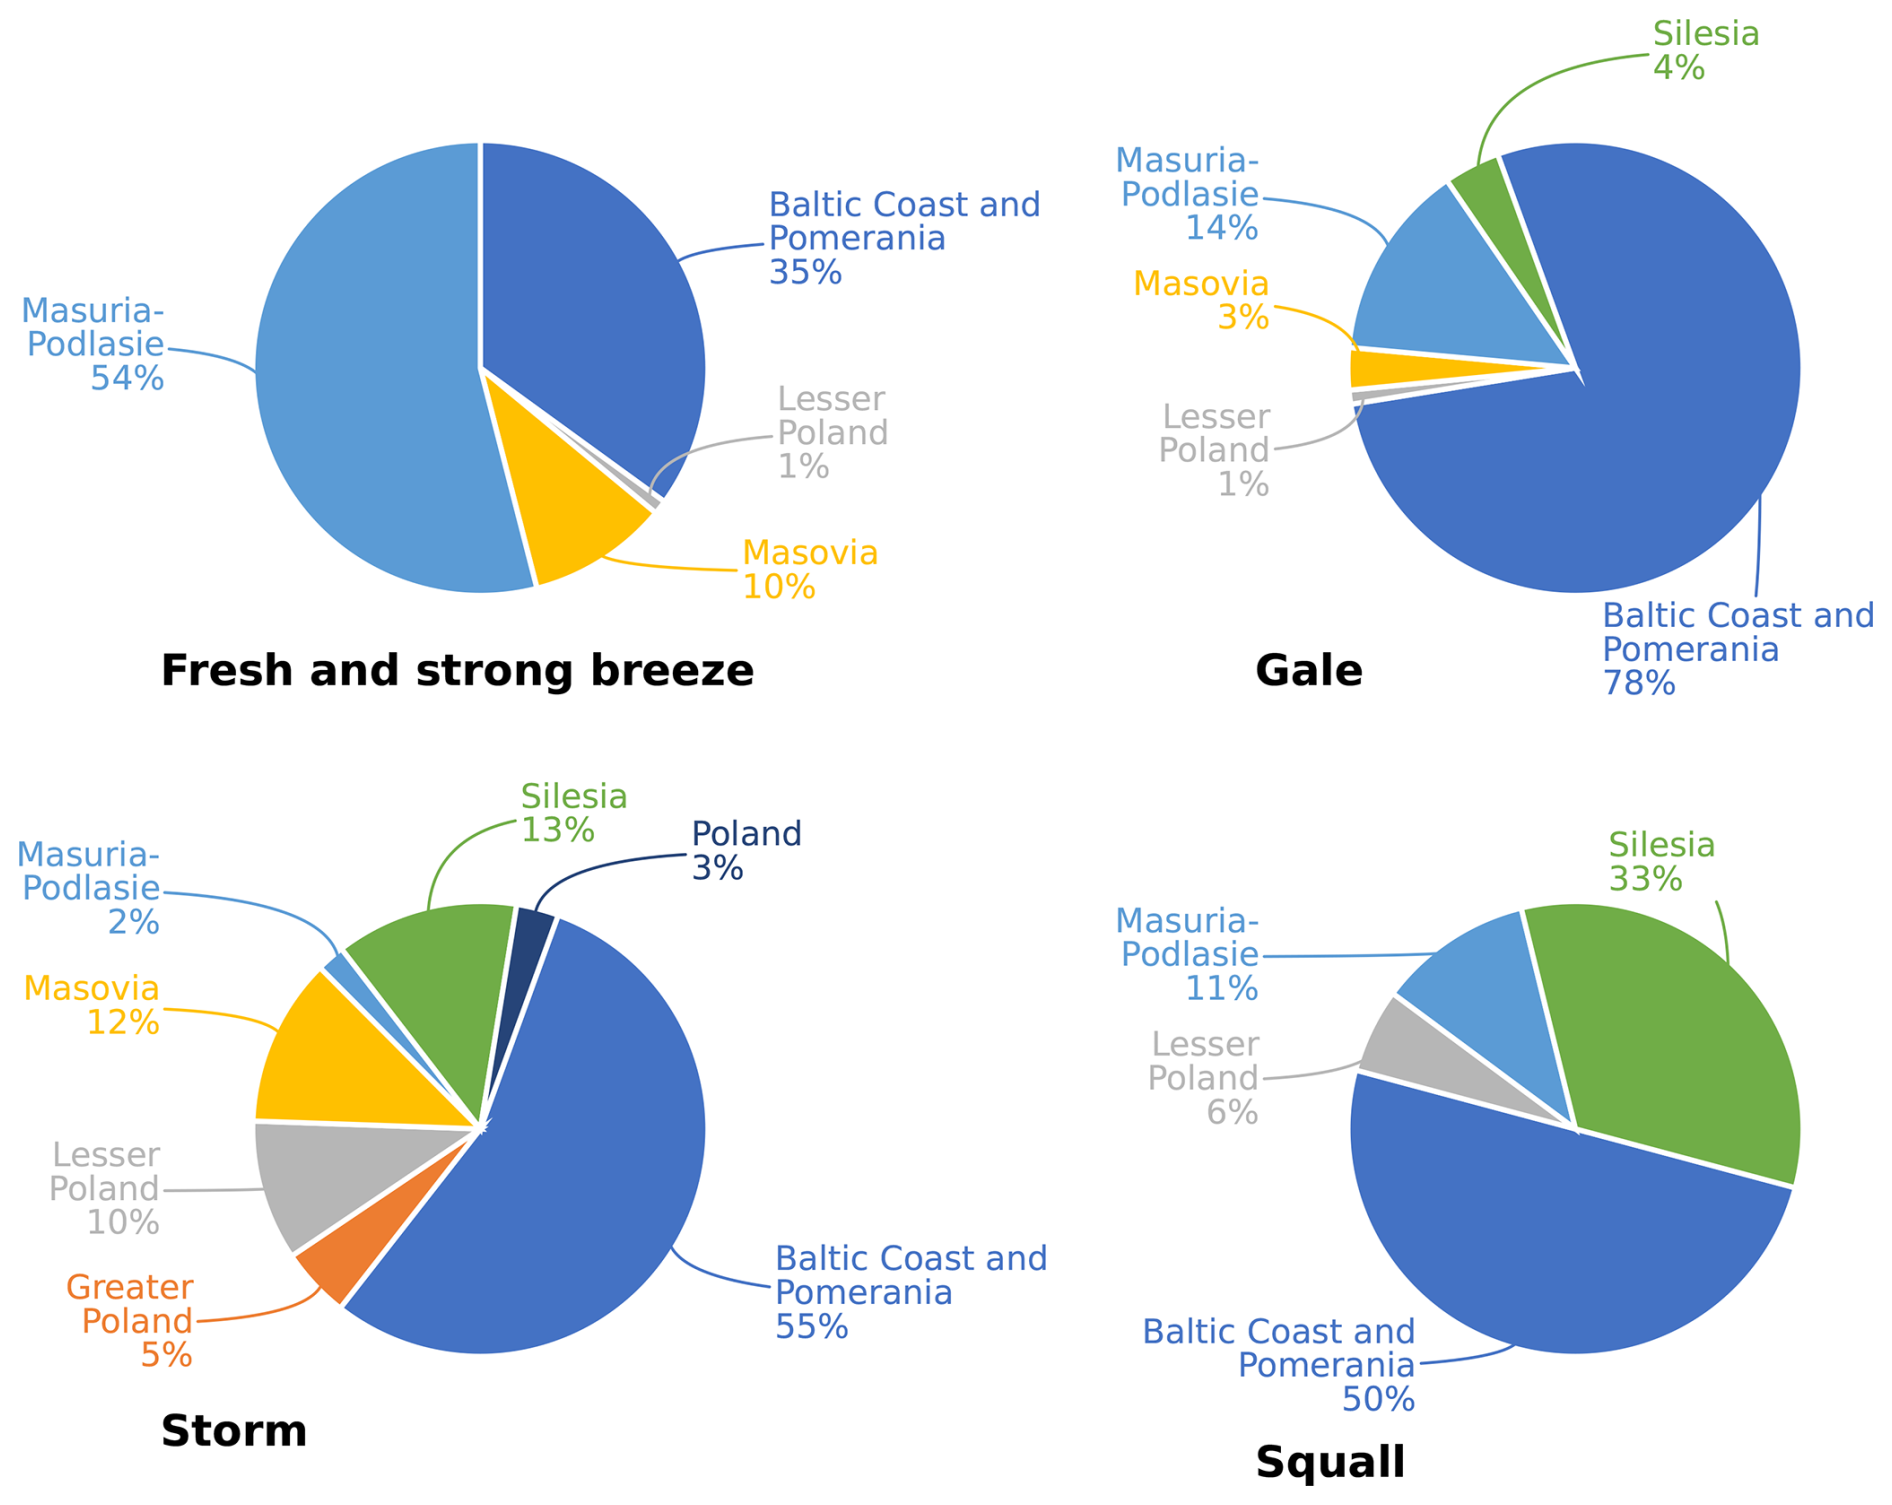
Figure 7Relative frequencies (%) of occurrence of strong wind types (tornadoes excluded) in the studied regions of Poland, 1601–1700 (regions with zero value are omitted).
As a result of investigations into strong wind events in Poland, it has been determined that gusts exceeding 17 m s−1 pose a threat to the population, economy, and natural environment (Lorenc, 2012). This means that all very strong wind categories (gales, storms, squalls and tornadoes) distinguished using documentary evidence have the potential to cause various types of damage, as listed in the Methods section. This is also the most important reason for the dominance of weather notes in historical sources, because they prioritise the description of the most extreme wind events and their impacts. The exceptions are periods for which regular weather observations and records were conducted (e.g., see Diary). These sources also mention strong winds that do not cause any material damage. In our classification, this is the first category of strong winds.
Among the 525 analysed cases of strong winds in Poland in the 17th century, only about 13.5 % (71 cases) included information about damage caused (Fig. 8). It is worth adding, however, that all cases with information about damage – with the exception of one – are drawn from the irregular weather notes category. This type of historical source provided information on damage in as many as 73.7 % of the cases involving strong winds. Such reports were more common for winter and autumn events, while the fewest were observed in spring. Slightly more events were attributed to category E2 (large damage) than category E1 (small damage) in all seasons, but particularly in summer (see Fig. 8b). In individual months, this was not always the case (Fig. 8a). Category E0 (no information about damage) includes all categories of strong winds; all cases representing fresh and strong breezes, and about 68 % of all events characterising very strong winds (gales, storms, squalls and tornadoes). This means that approximately one in three such events brings destruction.
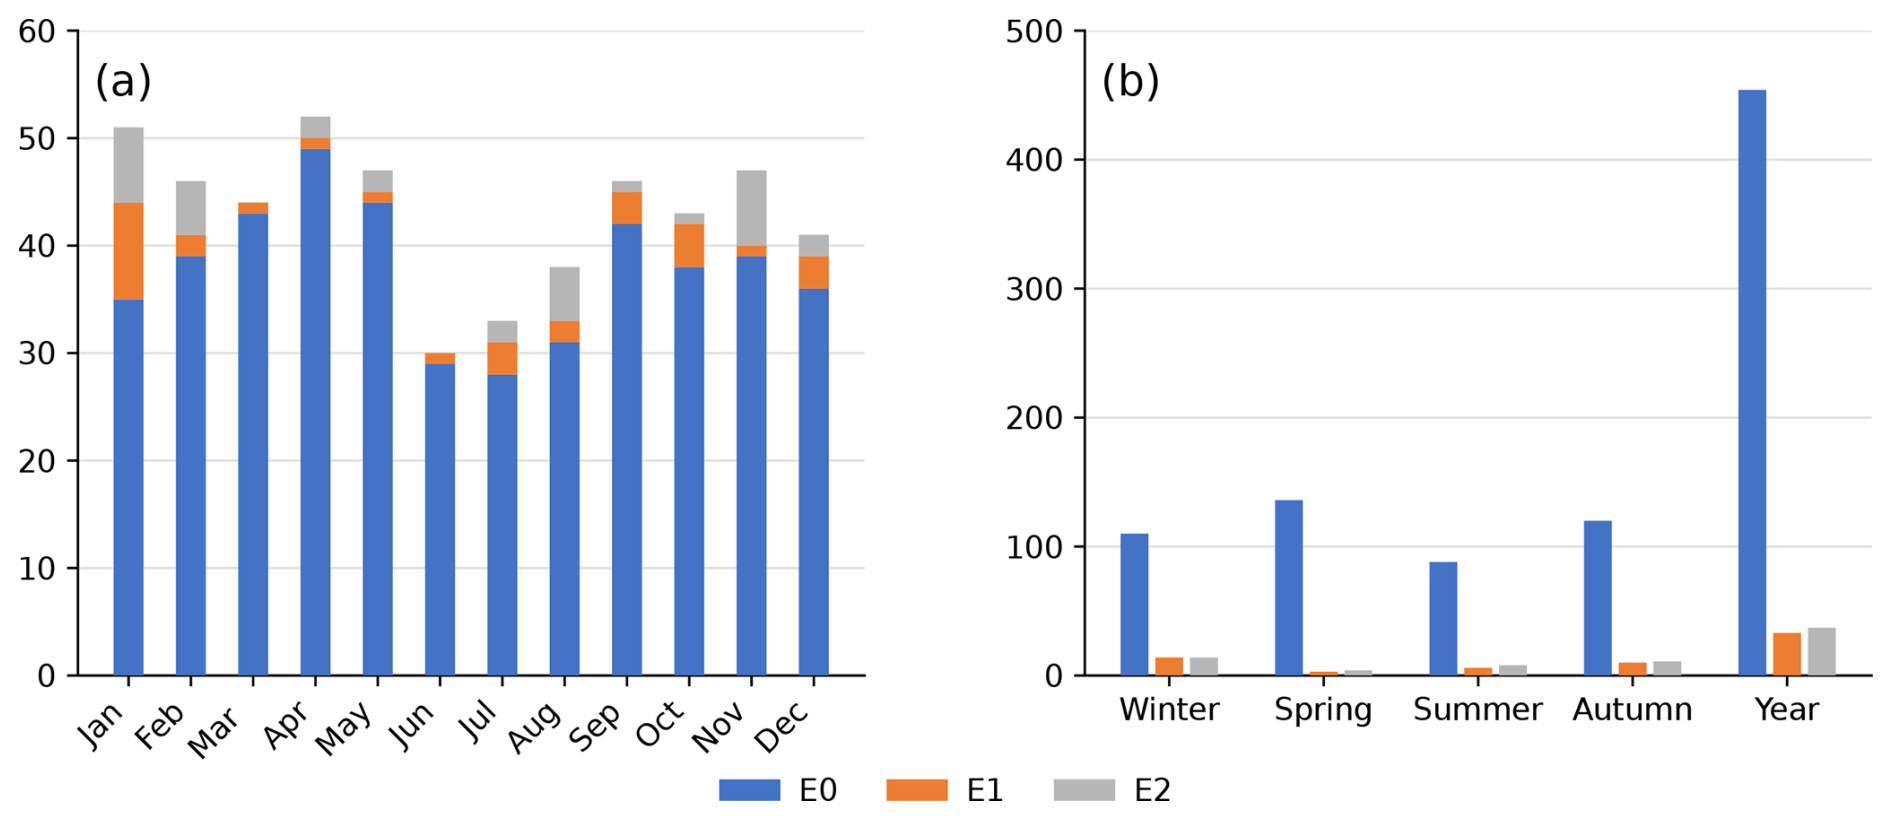
Figure 8Number (n) of occurrence of strong winds in Poland, according to extent of damage, 1601–1700: (a) by month, (b) by season. Key: For explanations of abbreviations, see the Methods section.
The two regions together accounting for by far the majority of strong wind events for which no damage was reported were Baltic Coast and Pomerania (46 %) and Masuria-Podlasie (43 %) (Fig. 9). Only for Greater Poland do all event reports contain information about damage. Meanwhile, the Baltic Coast and the Pomerania region alone accounted for the majority (53 %–73 %) of strong wind events causing either minor (E1) or major (E2) damage (Fig. 9). By contrast, such events were rarely recorded in the Masuria-Podlasie region, despite weather observations having been conducted daily during 1656–1685 there. In addition to north-western Poland, winds in Silesia also often caused damage, mainly of category E1 (21 %) (Fig. 9). This spatial distribution of damages connected with winds is in line with expectations because, in Poland, westerlies bringing air masses within cyclones from the Atlantic clearly dominate, particularly in the cold half-year. For the E2 type of damage, Lesser Poland (10 %) and Masovia (8 %) also accounted for relatively large shares of events.
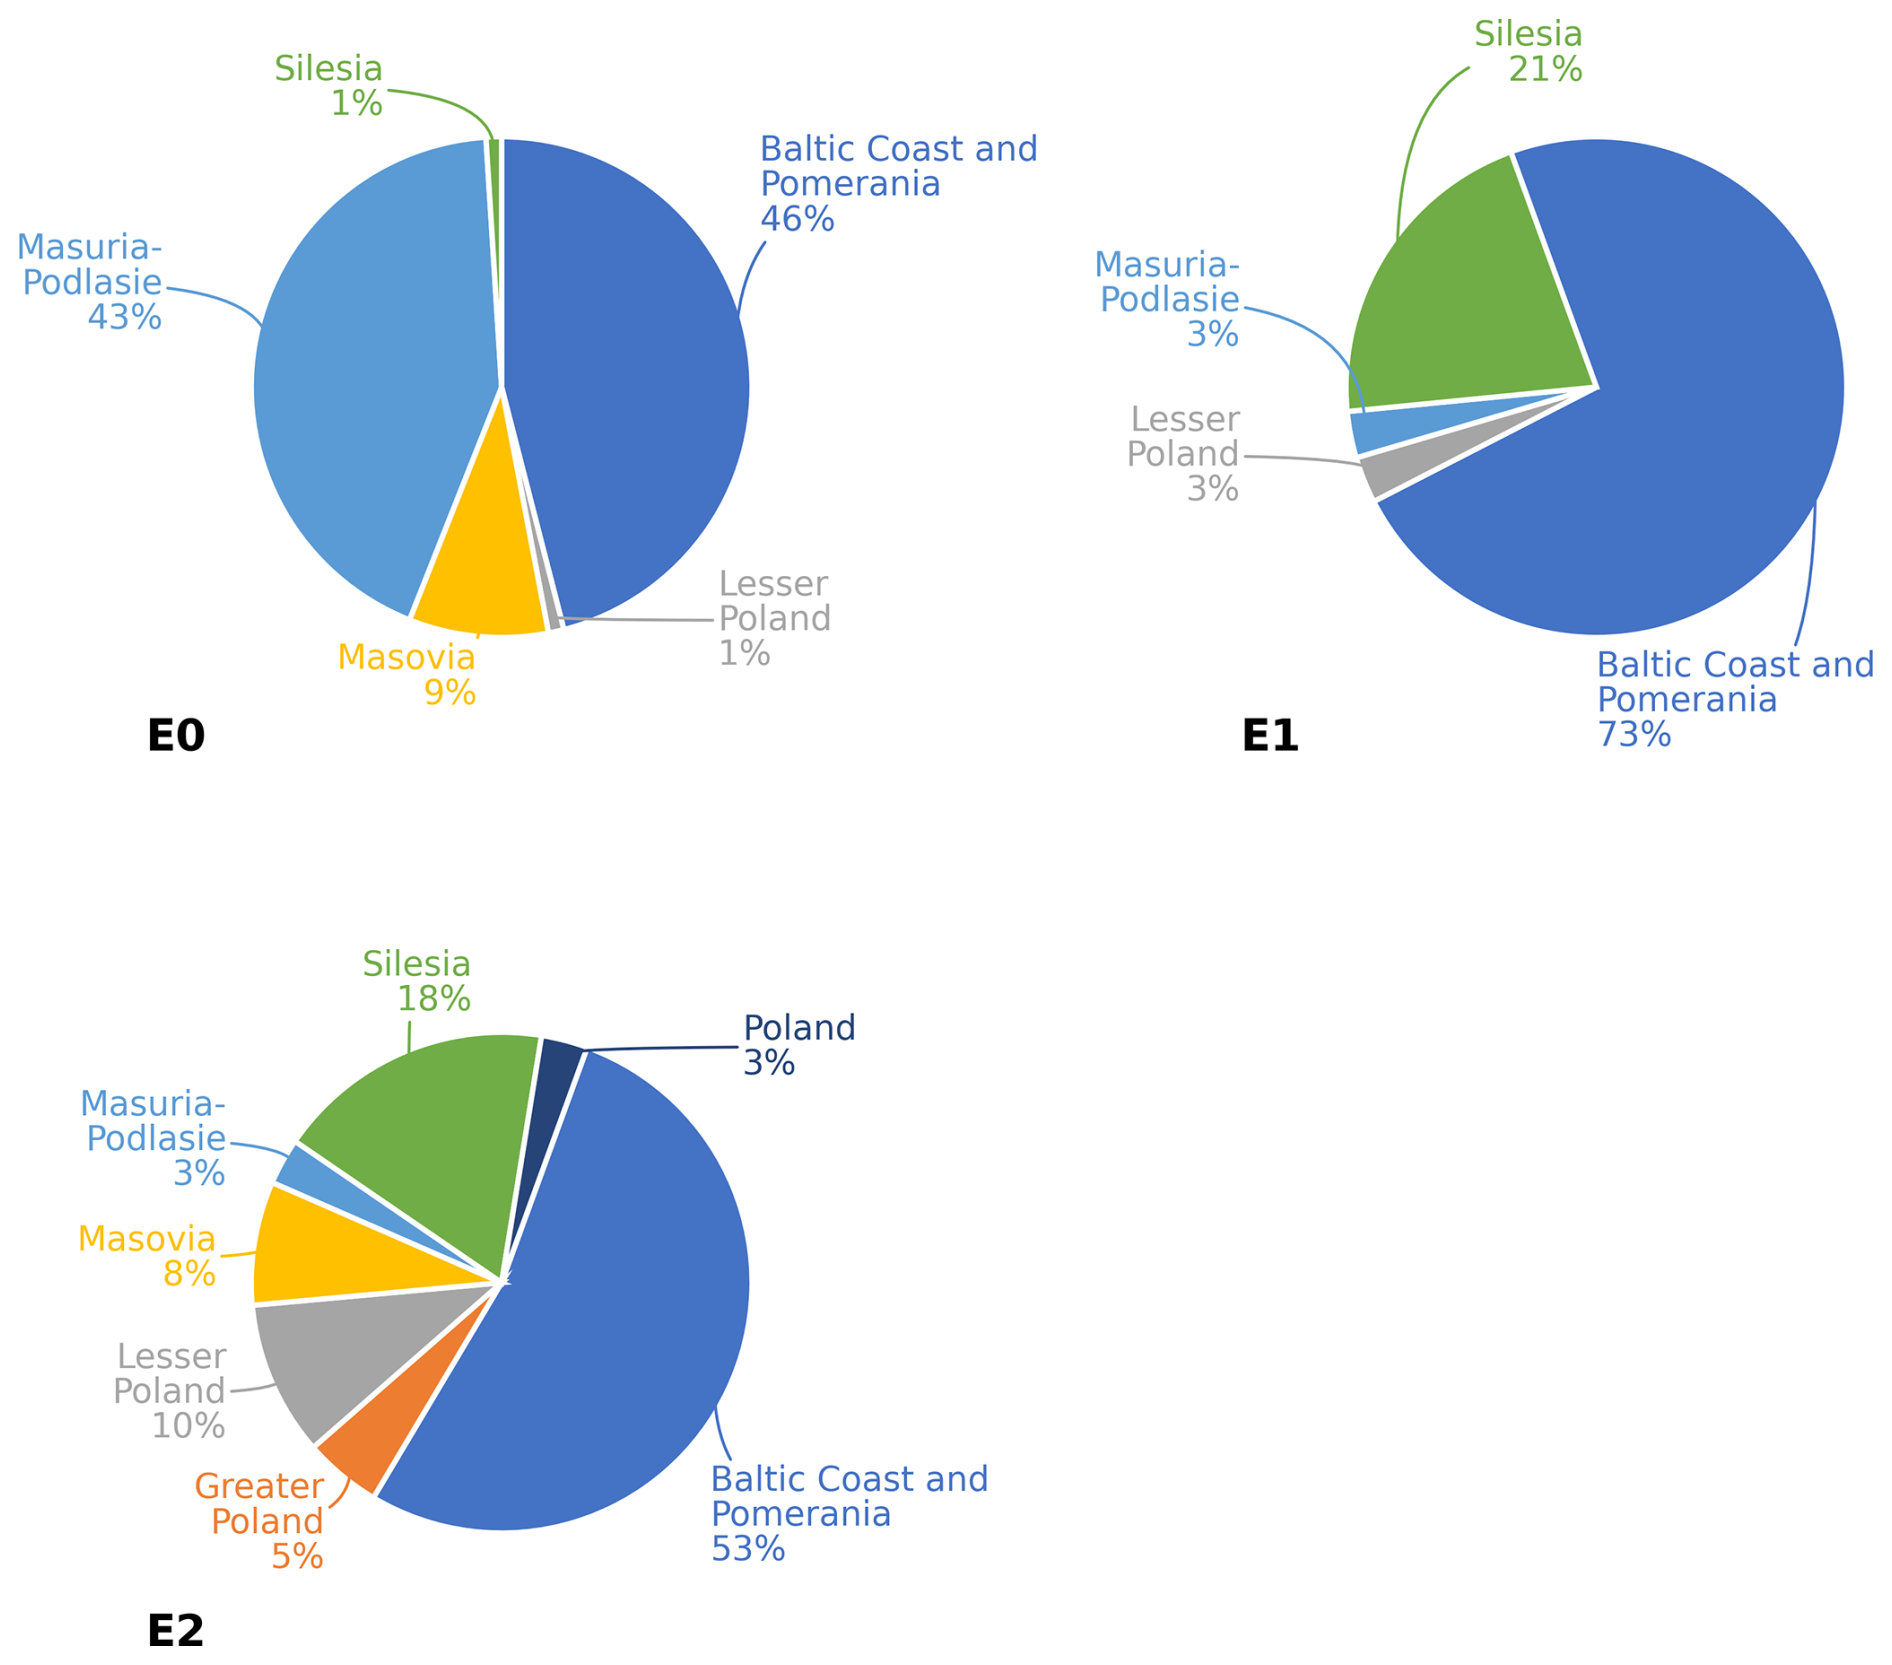
Figure 9Relative frequencies (%) of occurrence of strong winds in studied regions of Poland for different types of damage, 1601–1700 (regions with zero value omitted). Key: For explanations of abbreviations, see the Methods section.
The different types of damage caused by strong winds in Poland in the 17th century are shown in Fig. 10. The most frequently reported damage and destruction associated with strong winds concern buildings (residential, agricultural, churches, etc.). More serious damage to buildings (DB) was recorded slightly less frequently than weaker damage (DP); however, in both cases, the total number exceeded 20 (Fig. 10). There were also relatively frequent descriptions of damage in forests (DL, 16 cases) and of damage to field crops, gardens, and orchard harvests (DU, 8 cases). The frequency of other types of damage ranged from 1 to 4 cases (Fig. 10b). Damage by strong wind was observed most frequently in winter (30 cases, peaking in January) followed by autumn (27 cases, peaking in November) and least in spring (10 cases) (Fig. 10).
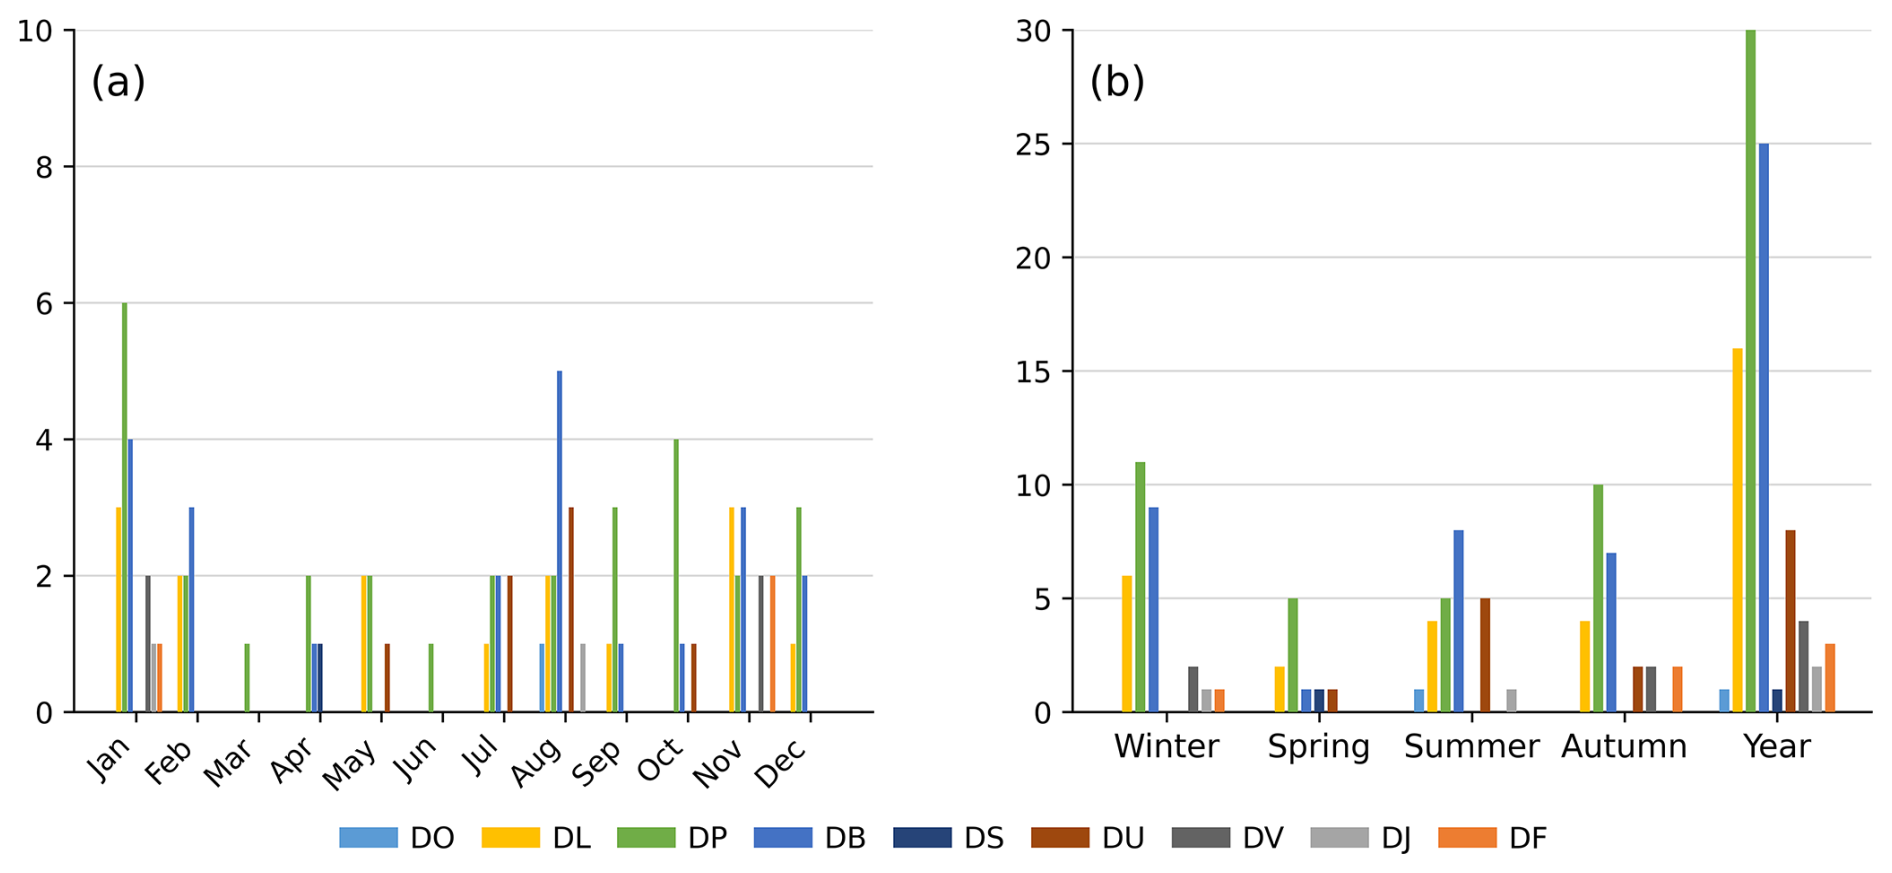
Figure 10Number of strong winds in Poland for which character of damage is reported (DB, DF, DJ, DL, DO, DP, DS, DU, DV and DI), 1601–1700: (a) by month, (b) by season and by year. Key: For explanations of abbreviations, see the Methods section.
For the four most frequent types of damage caused by strong winds in Poland in the 17th century, we present occurrences across the six historical geographical regions studied (Fig. 11) and their spatial distribution (Fig. 12). Severe building damage or destruction (DB) was recorded most frequently in three regions: Baltic Coast and Pomerania (50.0 %), Silesia (19 %) and Lesser Poland (11 %), and least in Masuria-Podlasie (4 %). A very similar spatial distribution is also observed for damage noted in forests (DL) (see Fig. 11). Two other types of damage (DP and DU) are limited to only three regions (Figs. 11 and 12). Of those three, the Baltic Coast and Pomerania region accounted for 75 % of DU damages and 74 % of DP. DP was recorded next most often noted in Silesia (23 %) and DU in Lesser Poland (13 %) (Figs. 10 and 12).
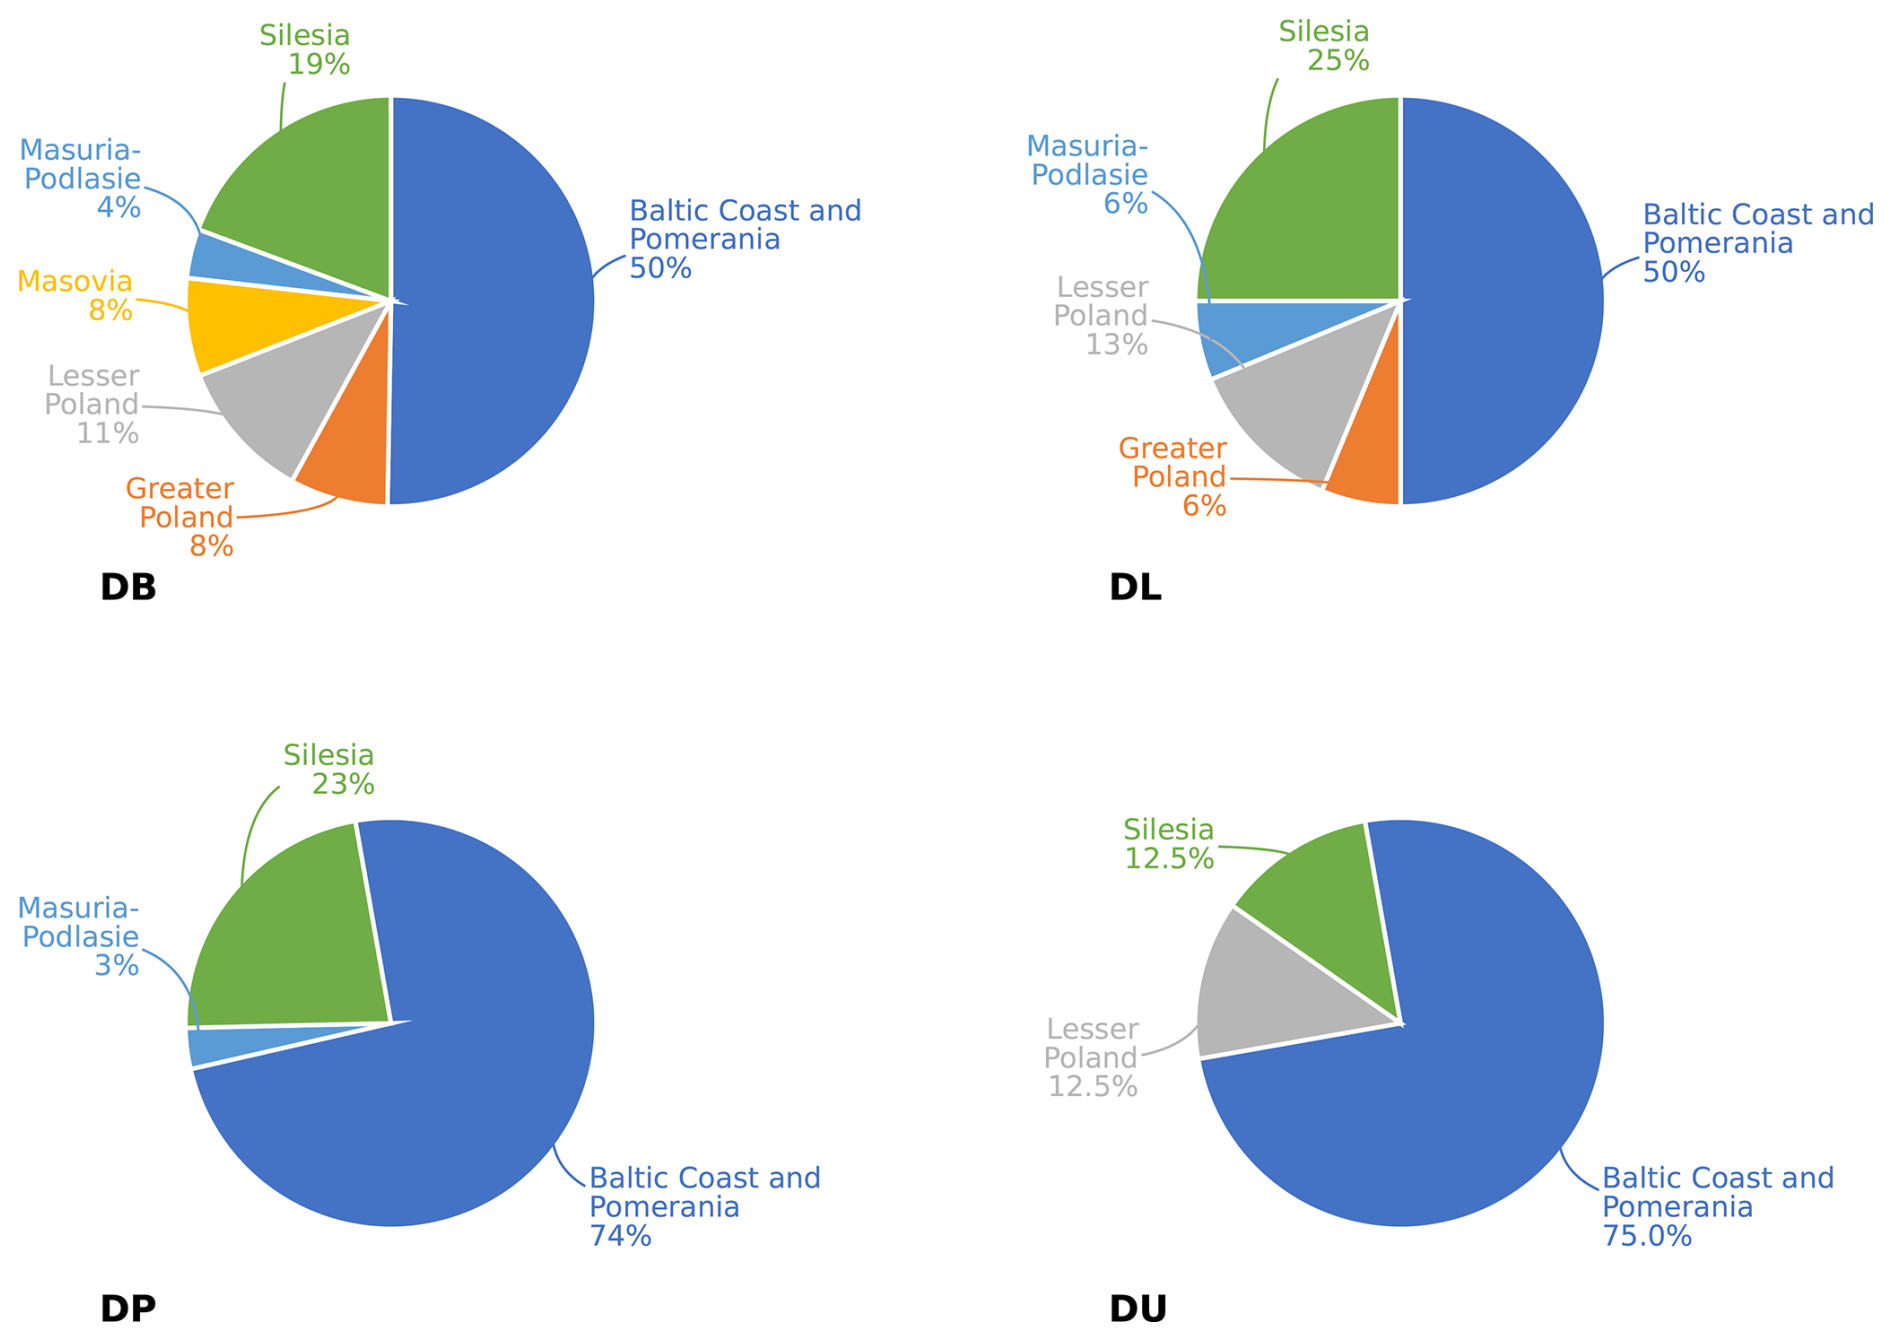
Figure 11Relative frequencies (%) of the four most frequent damage categories estimated for particular regions in Poland, 1601–1700 (regions with zero value omitted). Key: For explanations of abbreviations, see the Methods section.
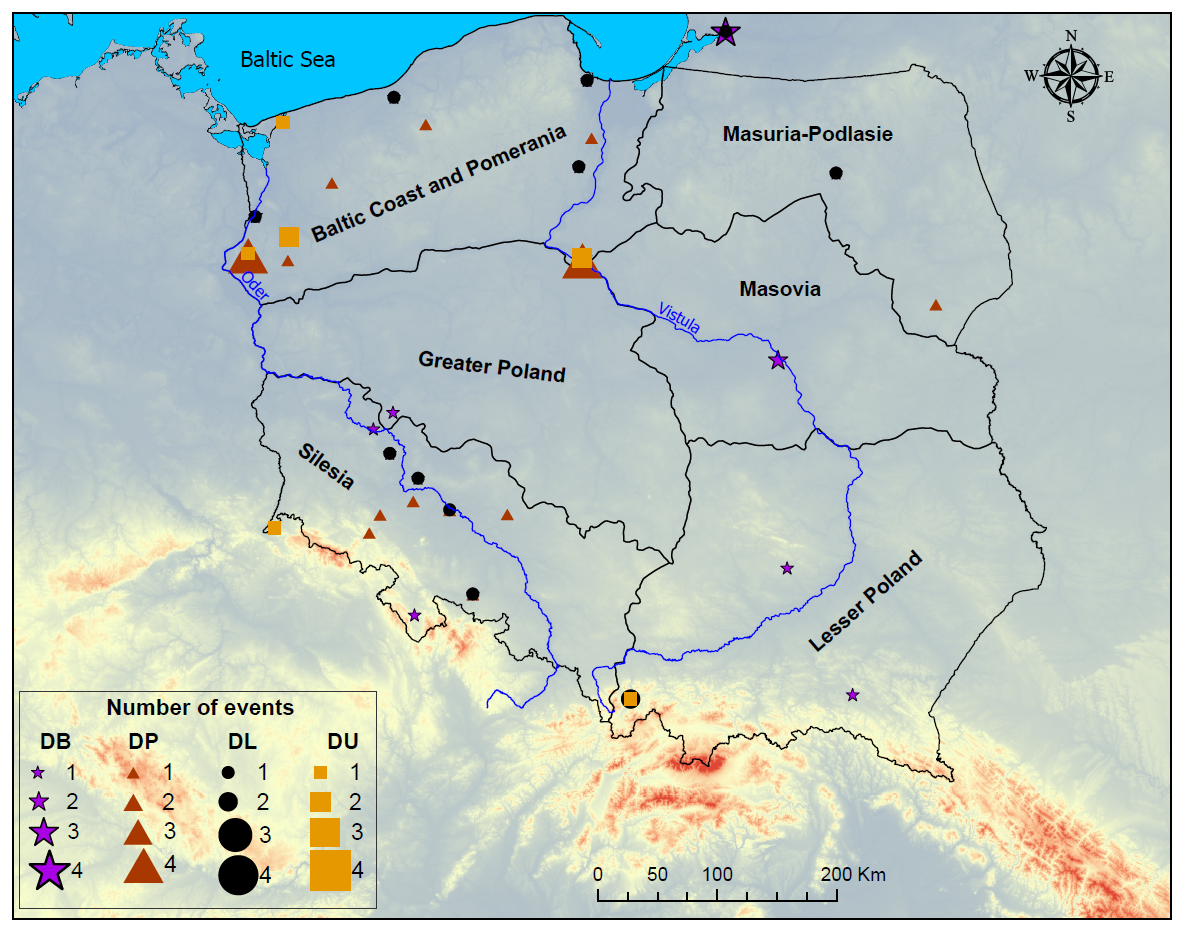
Figure 12Spatial distribution and number of the four most frequent categories of damages and losses (DB, DP, DL, DU) caused by strong winds in Poland, 1601–1700. Key: For explanations of abbreviations, see the Methods section.
Case studies based on daily weather notes
It is obvious that weather information at daily resolution, particularly when it results from observations made by a single person, captures the occurrence of strong winds at the observation site more precisely than information from diverse sources that do not result from regular weather observations. Such data are therefore more reliable for comparison with contemporary instrumental wind measurements. As we already mentioned, for the 17th century we have two such efficient sources of weather information (Chrapowicki's Diary and Buthner's Calendars) covering the respective periods: (i) 1656–1663 (north-eastern Poland) and (ii) 1672–1674 and 1691–1693 (Gdańsk).
In north-eastern Poland, during 1656–1663, among all strong wind types, fresh and strong breezes were most common (Fig. 13). They were most frequent in spring (average 5.7 cases) and least frequent in summer (average 3.2 cases). In the annual cycle based on monthly means (Fig. 13a), the frequency of fresh and strong breezes was greatest in March (2.4 cases) and November (2.3 cases). This type of strong wind was noted most rarely in June (0.6 cases) and October (0.9 cases). The annual course of gales was a little different from that of fresh and strong breezes. Winter accounted for the clear majority of gales, followed by spring, whereas none were noted for summer (Fig. 13). On average, one gale per year occurred during this historical period in north-eastern Poland.
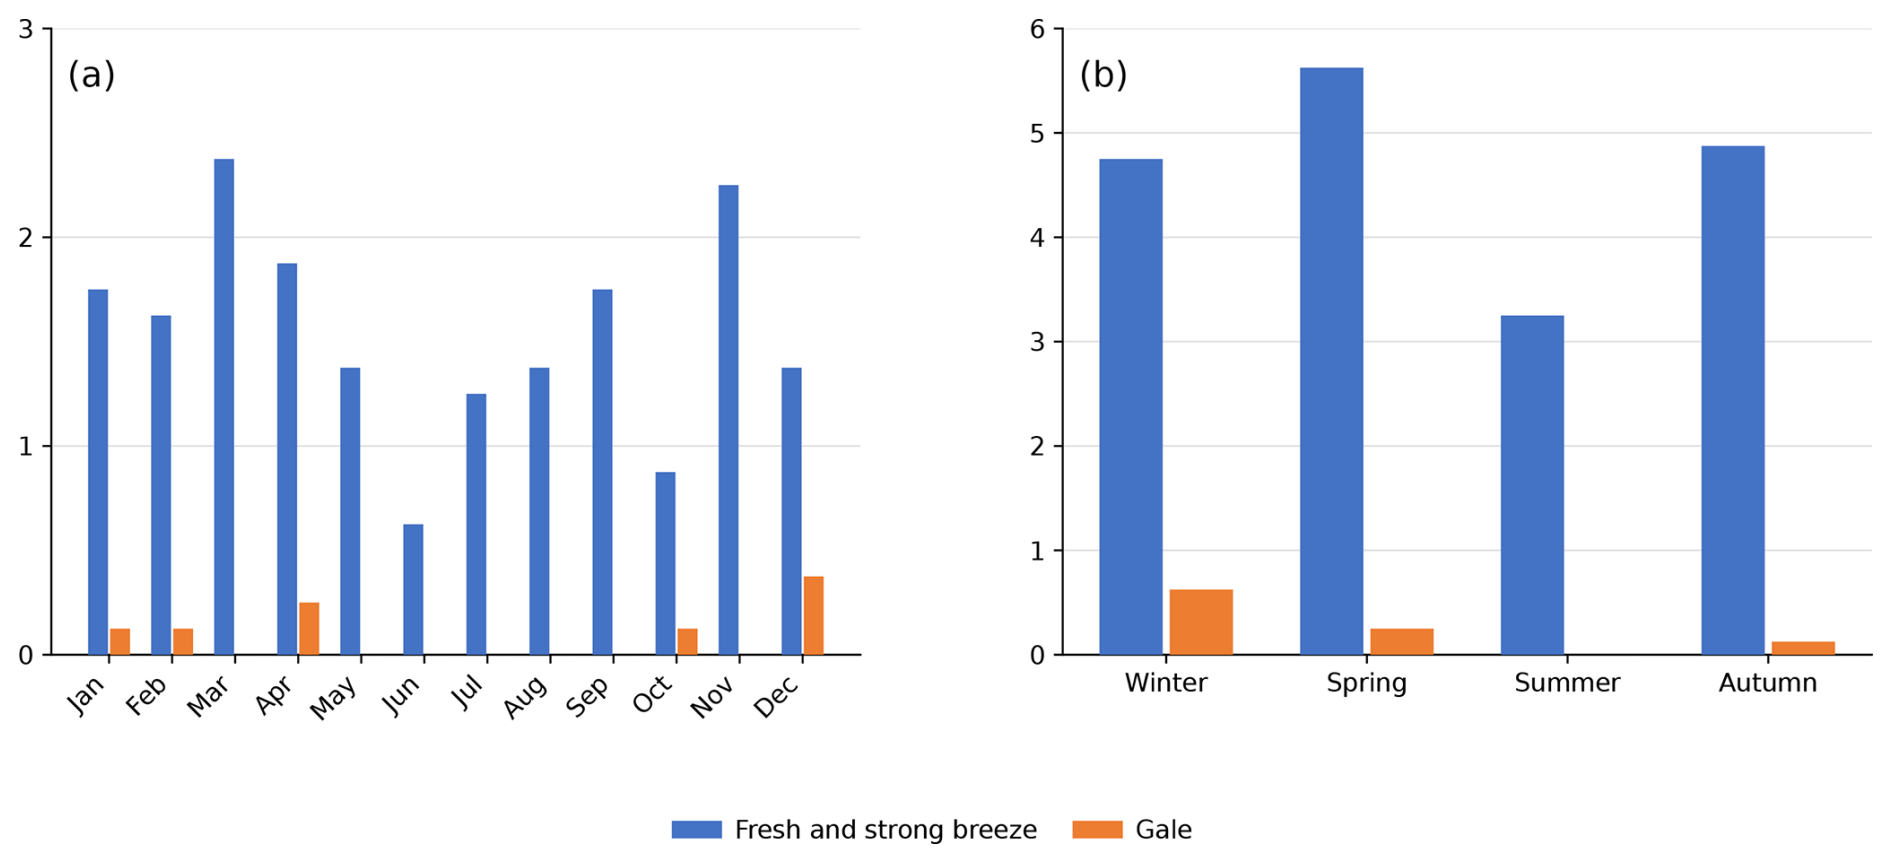
Figure 13Mean number of occurrences of strong wind types in north-eastern Poland, 1656–1663: (a) by month, (b) by season, (based on Chrapowicki's Diary).
Generally, the mean occurrence of fresh and strong breezes in north-eastern Poland corresponds well with that of the Baltic coast (Gdańsk) (cf. Figs. 13 and 14). The main difference is their greater and lower frequency in Gdańsk compared to north-eastern Poland in summer and winter, respectively. On the other hand, marked differences are evident for the frequency of gales. Their frequency is, as expected, many times higher on the Baltic coast than in north-eastern Poland throughout the entire year (cf. Figs. 13 and 14). Gales dominate in the cold half-year, but they are also very common in spring, particularly in May (2.3 cases). Notably, they also occurred more frequently in summer on the Baltic coast (zero observed inland) than in winter in north-eastern Poland.
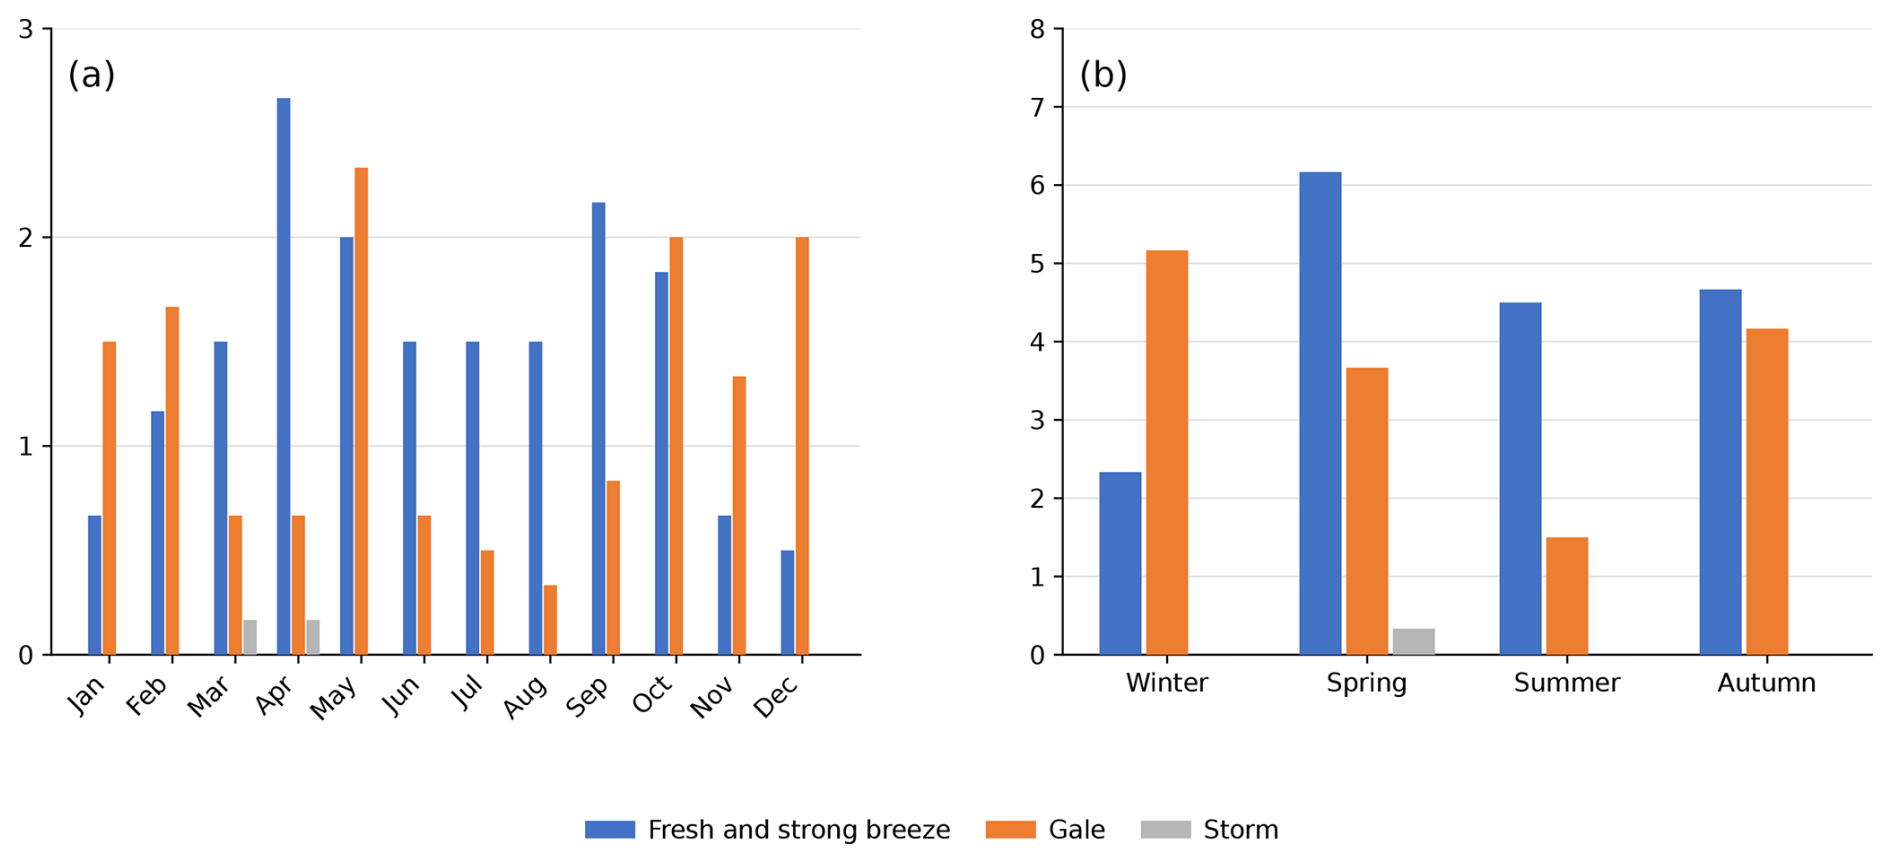
Figure 14Mean number of occurrences of different types of strong winds in Gdańsk (Poland), 1672–1674 and 1691–1693: (a) by month, and (b) by season, (based on Büthner's Calendars).
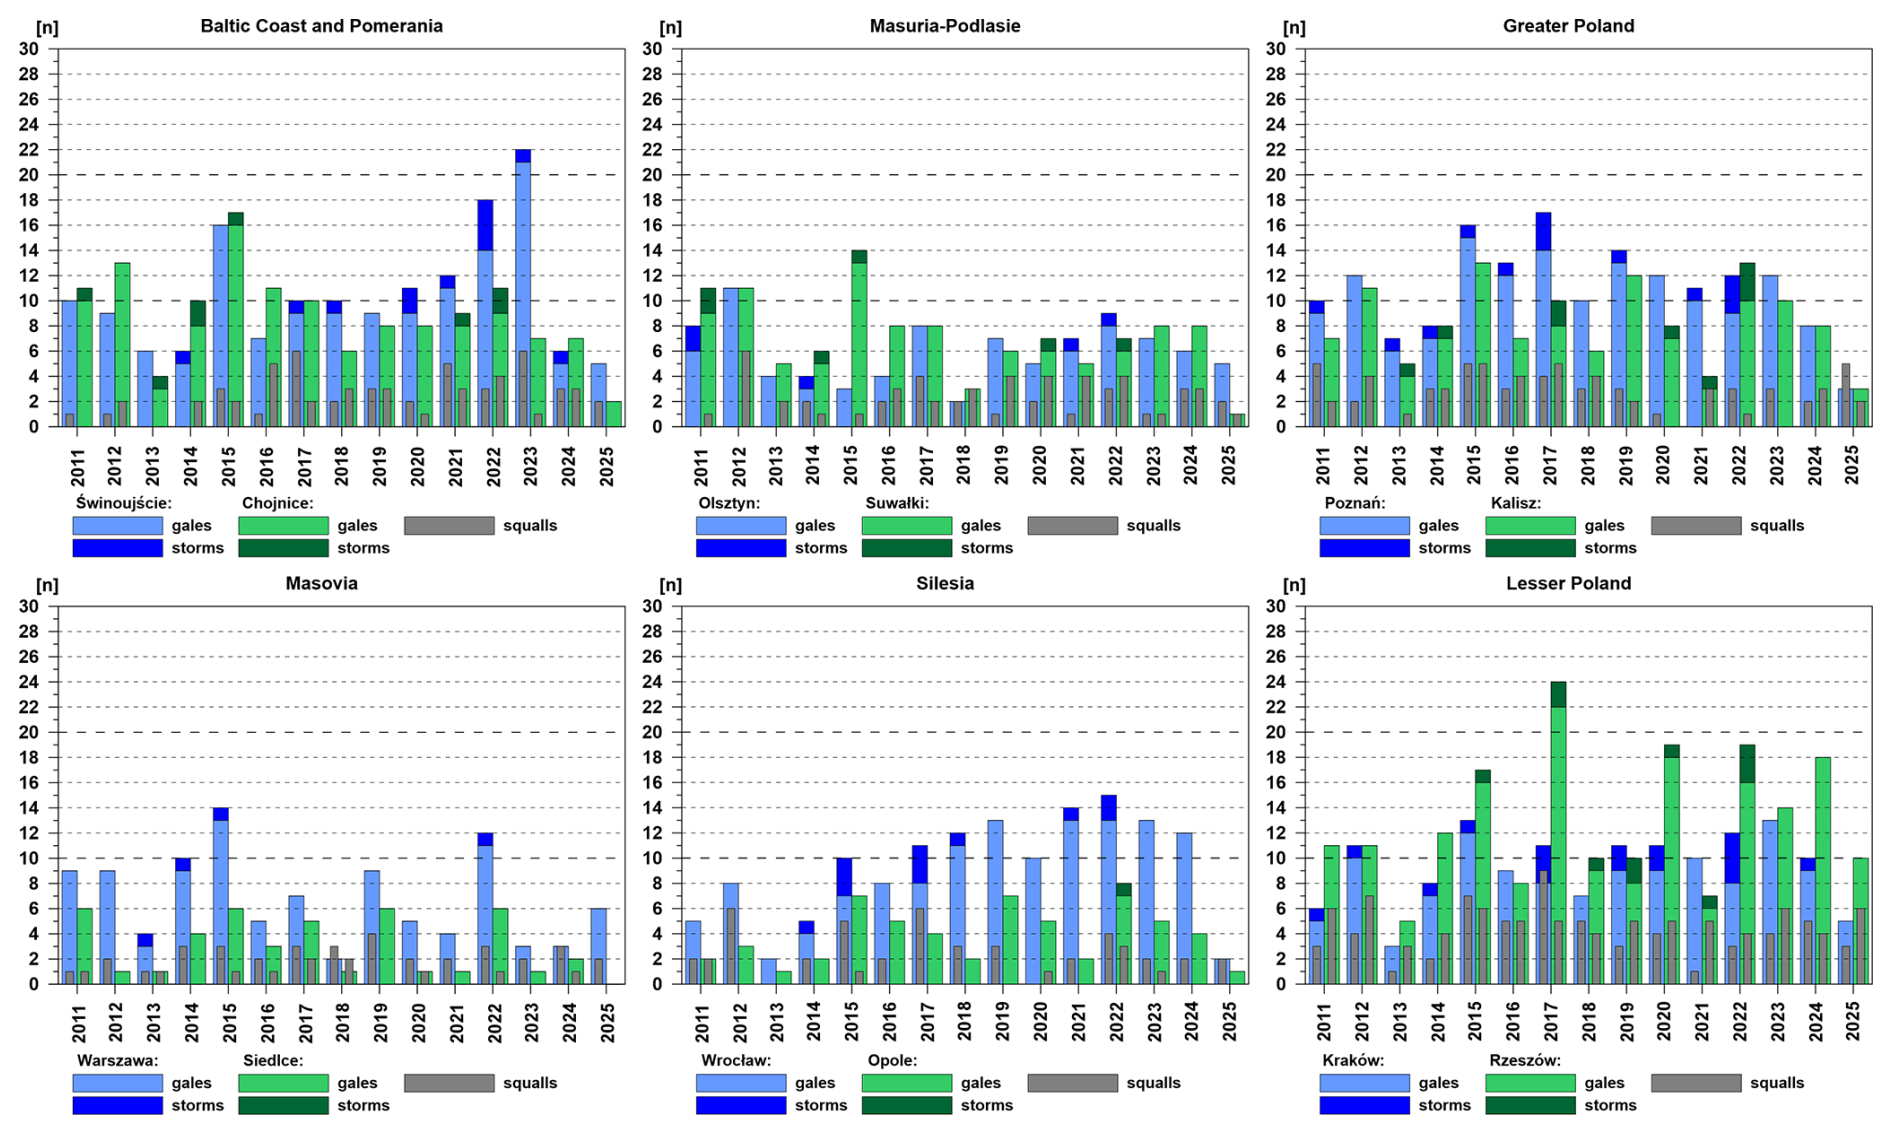
Figure 15Year-to-year course of annual number (n) of strong wind categories (gales, storms, and squalls) in Poland, 2011–2025.
3.2 Contemporary period
A comprehensive analysis of strong wind frequencies over recent decades (1993–2022) based on data from 12 stations evenly distributed across Poland was presented in our previous paper (Przybylak et al., 2025). For the reasons mentioned in Sect. 2 of the present paper, we utilise data from the most recent period, updated to 2025 (2011–2025). Results from this period, mainly the spatial distribution and annual cycle of strong-wind frequency, were used to compare with historical data for the entire century. On the other hand, for periods for which we have daily-resolution weather notes for the 17th century (1656–1663, 1672–1674, and 1691–1693), there is a high probability of reliably assessing changes between the historical and present periods, including for absolute frequencies of strong winds. To improve the comparison between these high-resolution historical data and present wind conditions, data from two new stations (Gdańsk and Białystok) were gathered for the contemporary period. We identified the meteorological stations that we judged to be most representative of the areas/sites for which we have weather notes in historical sources with daily resolution (see Table 2, Fig. 1).
In contemporary Poland, strong winds are most common in the west (the Baltic Coast and Pomerania region and Greater Poland, and the western part of the Silesia region) and in the south-east (the eastern part of Lesser Poland) (Figs. 15 and 16 [see Gdańsk]). The annual number of strong wind events peaks at 20–30 and rarely falls below 10. On the other hand, the fewest strong winds are observed in eastern and north-eastern Poland (Masovia and Masuria-Podlasie). Here, the annual number of strong winds is usually below 10. In the Podlasie sub-region (Białystok) and eastern Masovia (Siedlce), these values are particularly low, ranging from 0–6 to 0–7, respectively (Figs. 15 and 16).
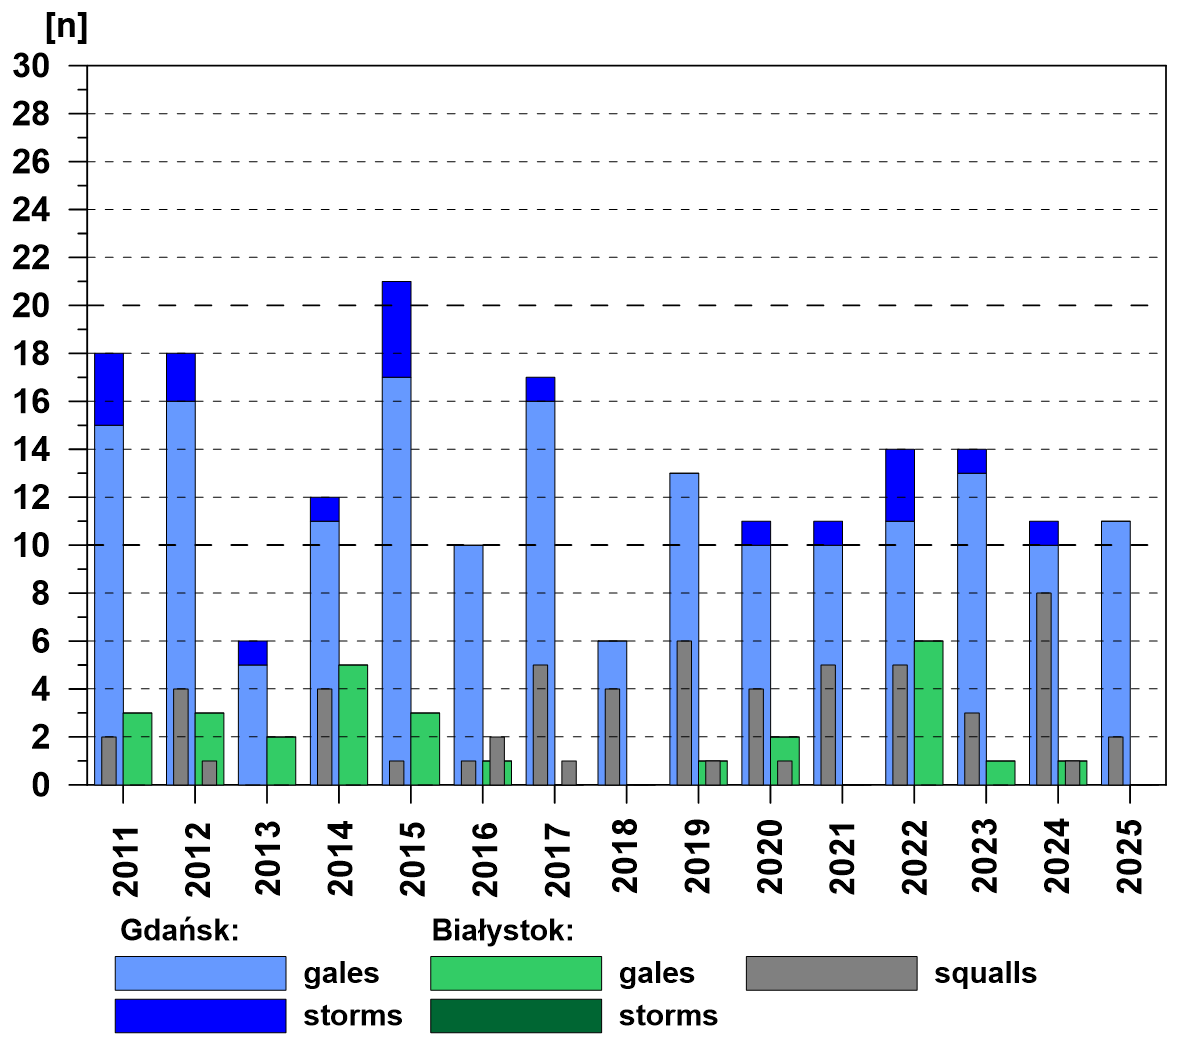
Figure 16Year-to-year course of annual number (n) of strong wind categories (gales, storms, and squalls) in Gdańsk and Białystok, 2011–2025.
The annual cycle is clearly dominated by strong winds (gales and storms) connected with macrocirculation (meteorological fronts) occurring in the cold half-year, averaging 1.5–2 cases per month in the windiest regions (Baltic Coast and Pomerania, Greater Poland, Lesser Poland) (Figs. 17 and 18 [see Gdańsk]). At this time, squalls were rare, occurring only in March and October. On the other hand, squalls, being associated with convective processes, dominate in the warm half-year, particularly in summer. Their long-term average in the summer months ranges from 0.5 to 1.0 across almost all regions (Figs. 17 and 18); the only exception is July in Lesser Poland, averaging ∼1.5 squalls.
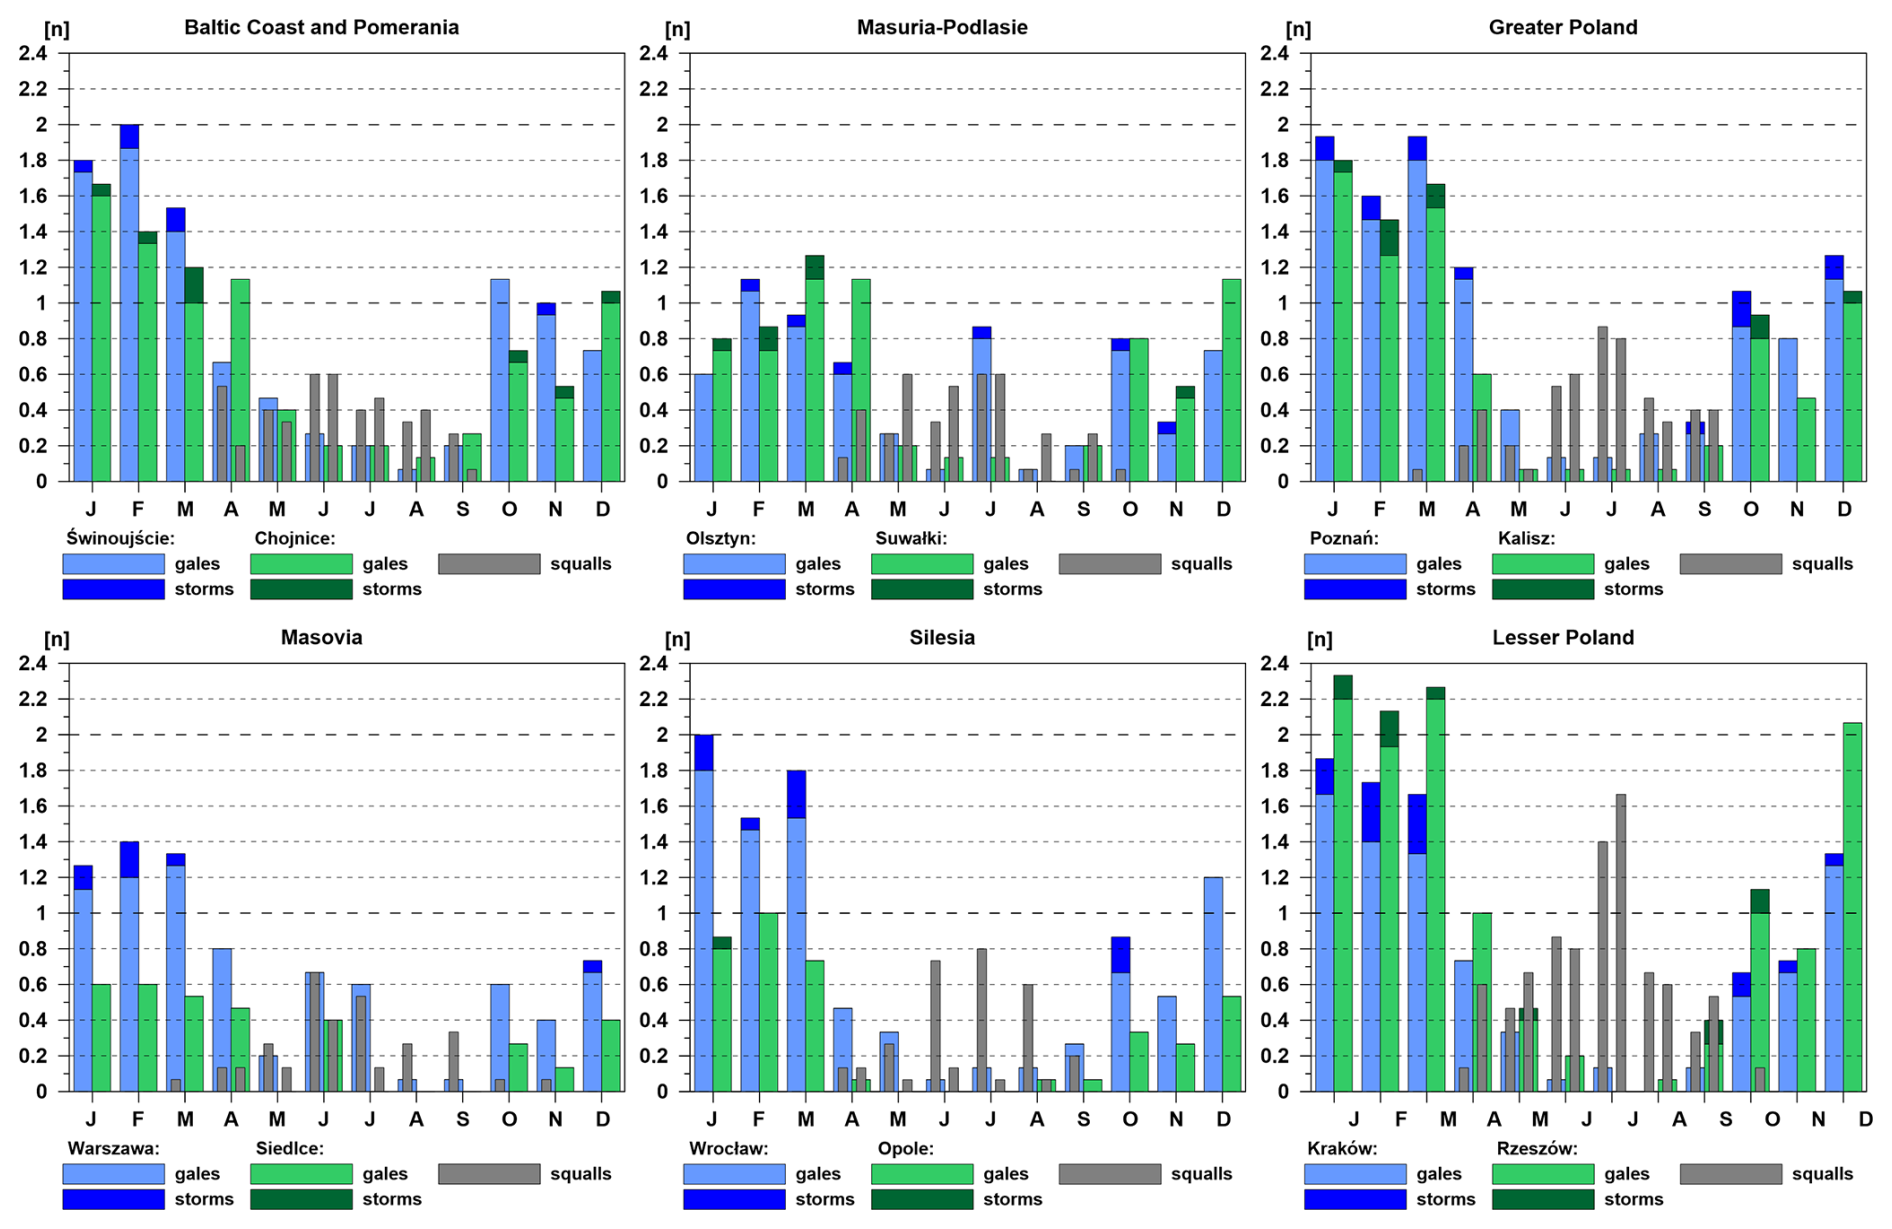
Figure 17Annual cycle based on average monthly number (n) of strong wind categories (gales, storms and squalls) in Poland, 2011–2025.
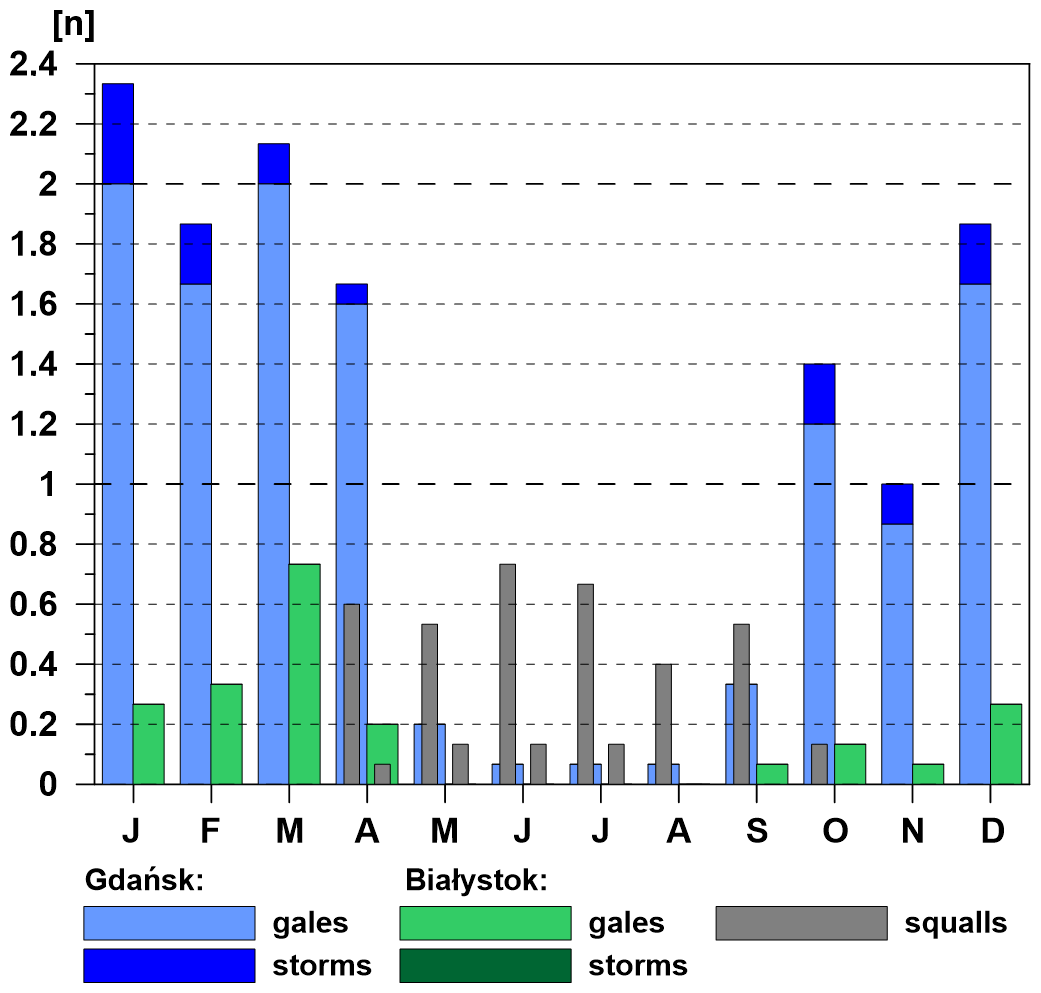
Figure 18Annual course based on the monthly average number (n) of strong wind categories (gales, storms, and squalls) in Gdańsk and Białystok, 2011–2025.
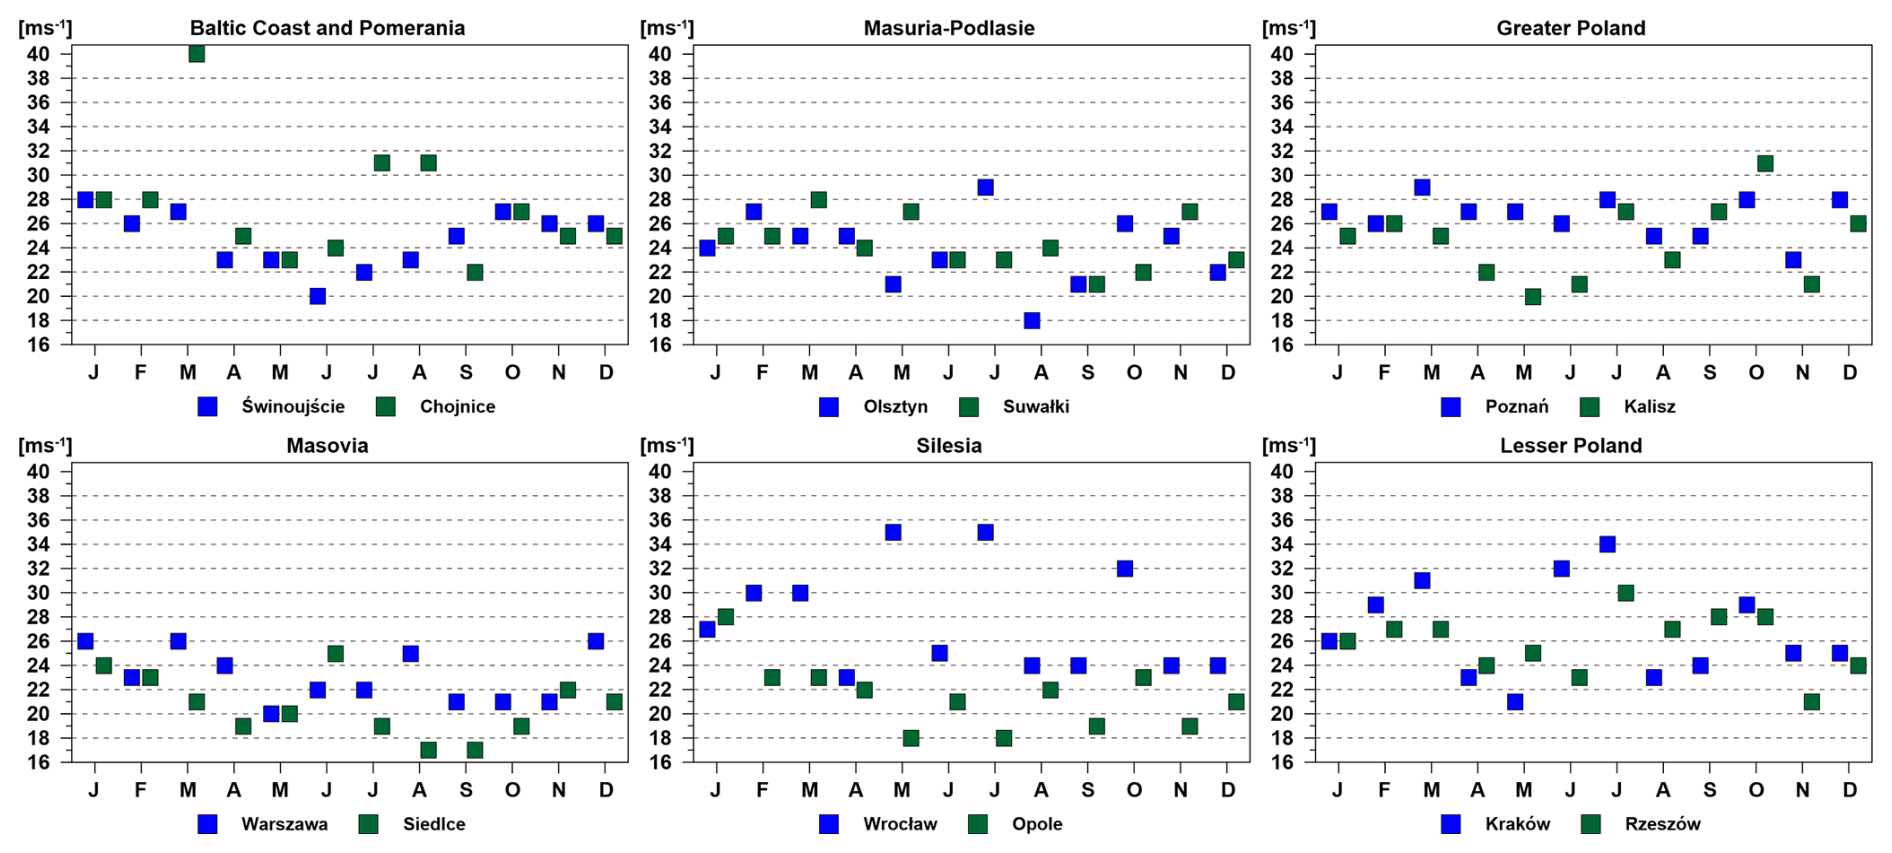
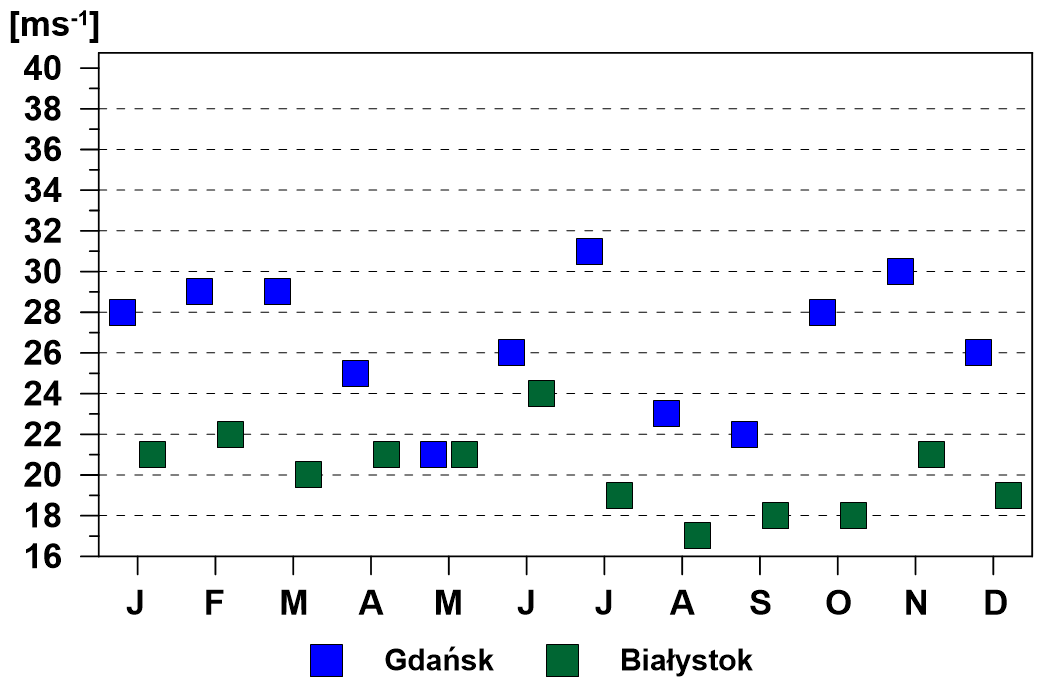
In the period 2011–2025, similarly to the longer period (1993–2022) analysed by Przybylak et al. (2025), the highest gust speed exceeded 30 m s−1 in most regions except the less windy ones (i.e., Masovia and Masuria-Podlasie) (Fig. 19). The single strongest wind (40 m s−1) was measured in the Baltic Coast and Pomerania region at the Chojnice station on 31 March 2015. Very high peak wind speeds were also observed in Silesia and Lesser Poland, at 35 and 34 m s−1, respectively, and occurred in May and July. On the other hand, the lowest peak values (≤25 m s−1) were recorded in the eastern parts of Masovia (Siedlce) and the Masuria-Podlasie (Suwałki) regions (Fig. 19). The lowest monthly peak wind speed in a given year was most likely to occur in the warm half of the year and slightly exceeded 16 m s−1. During the study period, they were most often observed in May, July, and September (Fig. 19). The monthly peak gust speeds are significantly higher in Gdańsk than in Białystok, at 31 and 24 m s−1, respectively, and occur in summer (Fig. 20).
The present article, analysing strong wind occurrences in the 17th century in Poland and their consequences for the economy and society, is a continuation of our previous work published in 2025 (Przybylak et al., 2025) for the period of the Medieval Warm Period (Medieval Climate Anomaly) and the beginning of the Little Ice Age (i.e., until 1600). The 17th century, as was stated in the Introduction, is considered by many scientists to have been the coldest of the entire millennium and, on average, globally. Przybylak et al. (2025) stated that documentary evidence from the mid-15th century onwards allows for a reliable estimate of the occurrence of certain characteristics of strong winds in Poland (e.g., the annual cycle and spatial distribution), except for the first category, i.e. fresh and strong breezes. Data gathered for the 17th century confirm this opinion, but the availability of information at daily resolution has here allowed us, for the first time, to present a more comprehensive analysis that includes the mildest category of strong winds.
The number of irregular weather notes (i.e., without systematic daily weather observations) for the 17th century, at 111 (Fig. 2), exceeded the number of notes for the 16th century (i.e., 84) (see Fig. 2 in Przybylak et al., 2025). However, this does not pertain to the numbers of strong winds, which were very similar across the two periods, at 95 and 88, respectively. It must also be noted that the spatial pattern of weather notes describing strong winds remained stable from the 14th to 17th centuries. Throughout those centuries, most information about strong winds was found for the Baltic Coast and Pomerania region, and later for Silesia and Lesser Poland. Also, at present, the strongest winds occur in the regions mentioned above (see Wibig, 2021). On the other hand, significant changes are observed in the seasonal distributions of strong winds between medieval times and the 17th century. In the period 1281–1600, strong winds were most frequent in autumn, whereas their frequencies differed little among the other seasons (Przybylak et al., 2025). In the 17th century, strong winds were less frequent in summer (103 cases), whereas in the other seasons their occurrence was clearly greater and quite similar (138–143 cases) (Table 3). It is worth noting that the availability of systematic, long-term weather observations at daily resolution for the 17th century increased the reliability of our picture of the frequency of occurrence of strong wind categories. During the study period, as with wind speed data from contemporary instrumental measurements, the first wind category (fresh and strong breeze) was more frequent than gales and storms, which dominated in the pre-1600s (chronicles focused mainly on very strong winds). However, the absolute number of occurrences of this mildest strong wind category is still much lower than that obtained from modern instrumental measurements, even for periods for which only weather notes with daily resolution were included. Without daily-resolution information, i.e., using only irregular weather notes from documentary evidence, the “fresh and strong breeze” category occurred with a frequency about 25 times lower than at present. On the other hand, systematic daily weather observations significantly reduced this difference; the frequency was lower in the historical period, but only about 6–8 times less than at present. For example, in Gdańsk and Białystok during 2011–2025, the respective average annual frequency of fresh and strong breezes reached 104.6 and 140.1, whereas in historical times it was 17.7 and 18.5. A greater similarity of results across periods was obtained for the frequency of gales and of storms. In north-eastern Poland, gales were recorded twice as frequently in present than historical times, whereas storms were not detected in either period. On the Baltic coast (Gdańsk), differences were even smaller. Gales and storms occurred with respective average annual frequencies of 11.7 and 1.3 in the present time, as compared to 14.5 and 0.3 in historical times. These values indicate that daily-resolution weather data allow the frequency of gales and storms to be reconstructed with very high reliability. On the other hand, for the fresh and strong breeze category, corrections should be introduced to obtain more reliable results; i.e., for Poland, they should be multiplied by 6–8.
The results from the source-specific analyses (Figs. 4, 6, and S3) clarify an important methodological aspect of documentary climate reconstruction. Irregular weather notes and systematic daily weather observations should not be regarded as competing datasets from which only one should be selected. Rather, they have different observational biases and provide complementary information. Irregular documentary sources cover a much broader portion of the 1601–1700 period and a wider geographical area, and they are particularly valuable for identifying severe winds and their environmental and societal consequences. However, because historical chroniclers preferentially recorded unusual or damaging phenomena, these sources substantially underrepresent weaker and non-damaging winds. Daily observations reduce this reporting bias because weather was recorded systematically regardless of whether a wind event had noteworthy consequences, but such observations are available only for a restricted set of locations and periods.
The new source-separated results demonstrate this complementarity directly. Severe categories dominate the irregular records, whereas fresh and strong breezes dominate the daily observations. Similarly, the regional distributions differ because the daily sources are geographically concentrated, particularly in the Baltic Coast, Pomerania, and Masuria-Podlasie regions. These differences do not indicate that the results based on the complete database are incorrect. Rather, they identify the contribution and limitations of each source type and explain the structure of the combined reconstruction. The purpose of the complete database is to synthesize all surviving documentary evidence to obtain the most comprehensive reconstruction currently possible of the occurrence, intensity, seasonality, spatial distribution, and consequences of strong winds in 17th-century Poland. At the same time, the combined database should not be interpreted as equivalent to a homogeneous instrumental record with constant temporal and spatial sampling. Absolute frequencies and some aspects of the annual and regional distributions are influenced by changes in documentary availability. This is precisely why the daily resolution subset is analysed separately when more quantitative comparisons with contemporary instrumental observations are required. The source-specific analyses, therefore, complement, rather than replace, the century-wide reconstruction and make explicit which features are robust and which are more sensitive to documentary-source characteristics.
As already noted by Przybylak et al. (2025), knowledge of strong winds in Europe in the pre-instrumental period is very limited, particularly regarding works that comprehensively analyse this issue. For this reason, it is not easy to reliably compare the results presented here with those from other parts of Europe. Nevertheless, some comparisons are still possible. For example, in Poland, we identified a slightly greater frequency of all categories of strong winds in the second half of the 17th century (see Fig. 4, results from irregular weather notes). Similar results were obtained by Glaser (2001) for Germany, though, the difference was significantly greater than in Poland. Similar results were also obtained for the UK and Scandinavia, where severe storms occurred most frequently at the peak of the LIA, particularly during the Maunder Minimum (Orme, 2014). However, in the area of Europe south of these countries, opposite results were obtained: stronger winds were recorded in the first half of the century under study than in the second. For example, such results were presented for the Czech Lands (Brázdil and Dobrovolny, 2000, 2001; Dobrovolny and Brázdil, 2003; Brázdil et al., 2004, 2012), Switzerland (Pfister, 1999), France (Sorrel et al., 2009) and Portugal (Bao et al., 2007). A reasonable explanation is that NAO indices, according to the NAO reconstruction presented by Esper et al. (2007) and more recently by Cook et al. (2019), were positive and higher in the second half of the 17th century than in the first. During the positive phase of the NAO, as shown in many studies (e.g., Economou et al., 2014; Orme, 2014; Degenhardt et al., 2023 and references therein), Northern Europe is hit by winds and storms more often than Southern Europe because the jet stream is stronger (additionally shifted northwards) and the cyclonic intensity increases and their track moves north.
A comparison of the absolute number of strong winds in Poland in the 17th century and in European countries using documentary sources is possible only for the Czech Republic, where such data exist and, importantly, a consistent methodology for identifying strong winds was applied. In Poland, we documented 525 cases of strong winds across all categories, including 200 cases of gales, storms, squalls, and tornadoes. Brázdil et al. (2004, p. 204) list 298 such cases in their Table 8.1. There may be several reasons for these differences. First, there are still some differences in the classification, particularly for the first category of strong wind (fresh and strong breeze), which is not generally mentioned in the Czech study. The only category mentioned there is “wind without detailed specification”, which could certainly include all the strong wind categories we have listed. Secondly, the differences mainly concern the recognition of strong winds in cases that did not cause any damage to the natural or anthropogenic environment. Thirdly, the differences probably also result from the size of the compared countries (calculations of strong winds were conducted over the entire areas of the countries; Poland is about four times as large as the Czech Republic), their different physical and geographical conditions, as well as their geographical location and openness to the inflow of air masses, especially from the western sector (Atlantic). Finally, differences in the availability and resolution of documentary evidence across the compared countries also play an important role.
The analysis of strong winds in Poland in the 17th century and their consequences for the natural and anthropogenic environment, as presented in this article, largely confirms the results and conclusions of Przybylak et al.'s (2025) study of strong wind occurrence for the period 1451–1600. It also revealed the reliability of the information obtained based on irregular weather descriptions about the four categories of strong winds potentially capable of causing damage (v>17.0 m s−1) (i.e., gales, storms, squalls, and tornadoes). A new feature in the analysis of strong winds for the 17th century is the availability of complete daily visual weather observations for fourteen years. These observations significantly improved the reliability of results on strong wind occurrences, particularly for the first category – fresh and strong breeze. The people who observed daily weather conditions with sufficient precision also recorded all strong winds, not just those that brought damage to human property or the natural environment as had been common among earlier chroniclers. Our research has shown that, using daily data increased fivefold the records of fresh and strong breezes compared to the available irregular weather descriptions. Although daily data have significantly improved our understanding of strong winds in Poland during the 17th century, it should be remembered that many strong winds, especially fresh and strong breezes, were still not captured. This stems from the fact that the creators of daily weather records likely did not continuously observe the changing weather, as they had many other activities at the same time (Chrapowicki, for example, was a member of Parliament and owner of many estates). Therefore, compared with modern instrumental observations that record wind speed at several-hour resolution, or even continuously, the results remain underestimated. Nevertheless, when daily data are available, the annual course, their spatial distribution in Poland, and the rough frequency relations between the distinguished categories of strong winds appear similar to those presented for modern times. Daily data also allow for a more precise comparison of results (particularly frequency of occurrence) between the historical and contemporary periods, because they often come from a single location (Gdańsk in our case) or region (Podlasie, north-eastern Poland), rather than the entire country (which is possible only when irregular weather notes are available). However, to fully characterise the occurrence of strong winds across Poland, we would need much more of this type of data at daily resolution, especially to capture the scale and character of the damage they cause. But, to our knowledge, such data do not exist for Poland in the 17th century. Therefore, an analysis using all available documentary evidence, as done in this article, remains absolutely necessary.
For a complete reconstruction of anemological (and circulation) conditions in Europe, including its central part, detailed and comprehensive studies of the occurrence of strong winds are needed that would be conducted using similar methods. Currently, such analyses for the 17th century are only available for the Czech Republic and Poland. A positive NAO index, as revealed by this study for the historical period and also documented for the contemporary period (e.g., Hurrell, 1995; Jones et al., 2003; Brázdil et al., 2004; Orme, 2014, and references therein), favours a greater frequency of strong winds (intensification of zonal circulation and cyclonic activity), especially in Northern Europe and particularly in the winter half-year. As we documented in the paper, in many areas of northern Europe (including Poland), stronger winds occurred in the second half of the 17th century, particularly during the Maunder Minimum. At that time, the NAO index was in a positive phase, as compared to the first half of that century, when NAO indices were neutral (Cook et al., 2019). However, not all NAO reconstructions available for the 17th century yield results similar to those presented above, as we are convinced by the reviews of Luterbacher et al. (2001b) and, more recently, Cook et al. (2019). Also, a review of studies investigating relationships between NAO and storminess for the historical period (Orme, 2014) reveals that these relationships are not stationary (i.e., not unambiguous in time). This means that further research is urgently needed both to improve the reconstruction of the NAO and to better understand the frequency of strong winds over the last millennium across Europe.
Datasets for this research were derived from the following public domain resources:
-
Repository for Open Data (RepOD), Nicolaus Copernicus University Centre for Climate Change Research collection, as cited in Przybylak et al. (2026), https://doi.org/10.18150/ESPWII
-
The Institute of Meteorology and Water Management (IMGW-PIB) website: https://danepubliczne.imgw.pl/ (last access: 1 March 2026).
The supplement related to this article is available online at https://doi.org/10.5194/cp-22-2129-2026-supplement.
RP: Conceptualisation, Methodology, Investigation, Data collection and selection, Database construction, Literature review, Formal analysis, Visualisation, Validation, Interpretation of results, Writing – original draft, Writing – review and editing, Funding acquisition, Project administration; AA: Conceptualisation, Methodology, Investigation; JF: Conceptualisation, Methodology, Investigation, Data collection and selection, Database construction, Visualisation, Validation, Interpretation of results; PO: Conceptualisation, Investigation, Data collection and selection, Database construction; BG: Software, Visualisation, Validation, Formal analysis.
The contact author has declared that none of the authors has any competing interests.
Publisher's note: Copernicus Publications remains neutral with regard to jurisdictional claims made in the text, published maps, institutional affiliations, or any other geographical representation in this paper. The authors bear the ultimate responsibility for providing appropriate place names. Views expressed in the text are those of the authors and do not necessarily reflect the views of the publisher.
The research work of RP, JF, PO and BG was supported by a grant funded by the National Science Centre, Poland, no. 2020/37/B/ST10/00710. The work of AA was supported by funds from IDUB Research Group Weather and Climate: Reconstructions and Future Scenarios. We would like to thank the anonymous reviewers for their valuable comments and suggestions, which have significantly improved our manuscript.
This research has been supported by the Narodowe Centrum Nauki (grant no. 2020/37/B/ST10/00710).
This paper was edited by Mary Gagen and reviewed by three anonymous referees.
Aagaard, T., Oxford, J., and Murray, A. S.: Environmental controls on coastal dune formation; Skallingen Spit, Denmark, Geomorphology, 83, 29–47, https://doi.org/10.1016/j.geomorph.2006.06.007, 2007.
Araźny, A., Przybylak, R., Vízi, Z., Kejna, M., Maszewski, R., and Uscka-Kowalkowska, J.: Mean and extreme wind velocities in Central Europe 1951–2005 (on the basis of data from NCEP/NCAR reanalysis project), Geographia Polonica, 80, 69–78, https://www.geographiapolonica.pl/article/item/7690.html (last access: 15 April 2026), 2007.
Bao, R., Alonso, A., Delgado, C., and Pagés, J. L.: Identification of the main driving mechanisms in the evolution of a small coastal wetland (Traba, Galicia, NW Spain) since its origin 5700 cal yr BP, Palaeogeogr. Palaeocl., 247, 296–312, https://doi.org/10.1016/j.palaeo.2006.10.019, 2007.
Bokwa, A., Limanówka, D., and Wibig, J.: Pre-instrumental weather observations in Poland in the 16th and 17th centuries, in: History and Climate, edited by: Jones, P. D., Ogilvie, A. E. J., Davies, T. D., Briffa, K. R., Springer, Boston, MA, https://doi.org/10.1007/978-1-4757-3365-5_2, 2001.
Brázdil, R. and Dobrovolný, P.: Chronology of strong wind events in the Czech Lands during the 16th–19th centuries, Instytut Geograficzny UJ, Prace Geograficzne, 107, 65–70, 2000.
Brázdil, R. and Dobrovolný, P.: History of strong winds in the Czech Lands: causes, fluctuations, impacts, Geographia Polonica, 74, 11–27, 2001.
Brázdil, R., Dobrovolný, P., Štekl, J., Kotyza, O., Valášek, H., and Jež, J.: History of weather and climate in the Czech Lands VI: Strong winds, Masaryk University, Brno, https://www.muni.cz/en/research/publications/569849?utm_source=chatgpt.com (last access: 15 April 2026), ISBN 80-210-3547-1, 2004.
Brázdil, R., Pfister, C., Wanner, H., von Storch, H., and Luterbacher, J.: Historical climatology in Europe – the state of the art, Climatic Change, 70, 363–430, https://doi.org/10.1007/s10584-005-5924-1, 2005.
Brázdil, R., Dobrovolný, P., Luterbacher, J., Moberg, A., Pfister, C., Wheeler, D., and Zorita, E.: European climate of the past 500 years: new challenges for historical climatology, Climatic Change, 101, 7–40, https://doi.org/10.1007/s10584-009-9783-z, 2010.
Brázdil, R., Chromá, K., Dobrovolný, P., and Černoh, Z.: The tornado history of the Czech Lands, AD 1119–2010, Atmos. Res., 118, 193–204, https://doi.org/10.1016/j.atmosres.2012.06.019, 2012.
Brönnimann, S., Allan, R., Ashcroft, L., Baer, S., Barriendos, M., Brázdil, R., Brugnara, Y., Brunet, M., Brunetti, M., Chimani, B., Cornes, R., Dominguez-Castro, F., Filipiak, J., Founda, D., Herrera, R., Gergis, J., Grab, S., Hannak, L., Huhtamaa, H., Jacobsen, K., Jones, P., Jourdain, S., Kiss, A., Lin, K., Lorrey, A., Lundstad, E., Luterbacher, J., Mauelshagen, F., Maugeri, M., Maughan, N., Moberg, A., Neukom, R., Nicholson, S., Noone, S., Nordli, Ø., Ólafsdóttir, K., Pearce, P., Pfister, L., Pribyl, K., Przybylak, R., Pudmenzky, C., Rasol, D., Reichenbach, D., Rezničková, L., Rodrigo, F., Rohr, C., Skrynyk, O., Slonosky, V., Thorne, P., Valente, M., Vaquero, J., Westcottt, N., Williamson, F., and Wyszyński, P.: Unlocking pre-1850 instrumental meteorological records: A global inventory, B. Am. Meteorol. Soc., 100, ES389–ES413, https://doi.org/10.1175/BAMS-D-19-0040.1, 2019.
Chrapowicki, J. A.: Diariusz cz. I: lata 1656–1664, Instytut Wydawniczy PAX, Warszawa, 664 pp., 1978.
Chrapowicki, J. A.: Diariusz cz. II: lata 1665–1669, Instytut Wydawniczy PAX, Warszawa, ISBN 83-211-0904-7, 640 pp., 1988.
Clarke, M. L. and Rendell, H. M.: The impact of North Atlantic storminess on western European coasts: A review, Quatern. Int., 195, 31–41, https://doi.org/10.1016/j.quaint.2008.02.007, 2009.
Clarke, M. L. and Rendell, H. M.: Atlantic storminess and historical sand drift in Western Europe: implications for future management of coastal dunes, J. Coast. Conserv., 15, 227–236, 2011.
Cook, E. R., Kushnir, Y., Smerdon, J. E., Williams, A. P., Anchukaitis, K. J., and Wahl, E.: A Euro-Mediterranean tree-ring reconstruction of the winter NAO index since 910 C. E., Clim. Dynam., 53, 1567–1580, https://doi.org/10.1007/s00382-019-04696-2, 2019.
Degenhardt, L., Leckebusch, G. C., and Scaife, A. A.: Large-scale circulation patterns and their influence on European winter windstorm predictions, Clim. Dynam., 60, 3597–3611, https://doi.org/10.1007/s00382-022-06455-2, 2023.
De Kraker, A.: Storminess in the Low Countries, 1390–1725, Environ. Hist.-UK, 19, 149–171, https://doi.org/10.3197/096734013X13642082568570, 2013.
Dobrovolný, P. and Brázdil, R.: Documentary evidence on strong winds related to convective storms in the Czech Republic since AD 1500, Atmos. Res., 67–68, 95–116, https://doi.org/10.1016/S0169-8095(03)00046-2, 2003.
Dobrovolný, P. and Keprtova, K.: Spatial analysis of damage caused by strong winds and gales in the Czech lands since AD 1500, Geografie-Pragus, 111, 51–69, https://doi.org/10.37040/geografie2006111010051, 2006.
Donat, M. G., Leckebusch, G. C., Wild, S., and Ulbrich, U.: Future changes in European winter storm losses and extreme wind speeds inferred from GCM and RCM multi-model simulations, Nat. Hazards Earth Syst. Sci., 11, 1351–1370, https://doi.org/10.5194/nhess-11-1351-2011, 2011.
Economou, T., Stephenson, D. B., and Ferro, C. A. T.: Spatio-temporal modelling of extreme storms, Ann. Appl. Stat., 8, 2223–2246, https://doi.org/10.1214/14-AOAS766, 2014.
Esper, J., Frank, D., Büntgen, U., Verstege, A., Luterbacher, J. R., and Xoplaki, E.: Long-term drought severity variations in Morocco, Geophys. Res. Lett., 34, L17702, https://doi.org/10.1029/2007GL030844, 2007.
Glaser, R.: Klimageschichte Mitteleuropas: 1000 Jahre Wetter, Klima, Katastrophen, Primus Verlag, Darmstadt, 227 pp., ISBN 978-3-89678-405-6, 2001.
Hansom, J. D. and Hall, A. M.: Magnitude and frequency of extra-tropical North Atlantic cyclones: A chronology from cliff-top storm deposits, Quatern. Int., 195, 42–52, https://doi.org/10.1016/j.quaint.2007.11.010, 2009.
Hurrell, J. W.: Decadal trends in the North Atlantic Oscillation regional temperatures and precipitation, Science, 269, 676–679, https://doi.org/10.1126/science.269.5224.676, 1995.
Jones, P. D., Osborn, T. J., and Briffa, K. R.: Pressure-based measures of the NAO: A comparison and an assessment of changes in the strength of the NAO and in its influence on surface climate parameters, in: The North Atlantic Oscillation: Climatic Significance and Environmental Impact, edited by: Hurrell, J. W., Visbeck, M., Kushnir, Y., and Ottersen, G., American Geophysical Union, Washington, 51–62, https://doi.org/10.1029/134GM03, 2003.
Juckes, M. N., Allen, M. R., Briffa, K. R., Esper, J., Hegerl, G. C., Moberg, A., Osborn, T. J., and Weber, S. L.: Millennial temperature reconstruction intercomparison and evaluation, Clim. Past, 3, 591–609, https://doi.org/10.5194/cp-3-591-2007, 2007.
Lamb, H.: The Changing Climate, Methuen & Co., London, https://www.routledge.com/The-Changing-Climate-Routledge- Revivals-Selected-Papers/Lamb/p/book/9780415682251? utm_source=chatgpt.com (last access: 1 March 2026), 1966.
Lamb, H. H. and Frydendahl, K.: Historic Storms of the North Sea, British Isles and Northwest Europe, Great Britain, Cambridge University Press, Cambridge, 203 pp., ISBN 978-0-521-37522-1, https://books.google.com/books?id=P4n1z9rOh5MC (last access: 1 March 2026), 1991.
Lindgren, S. and Neumann, J.: Great Historical Events That Were Significantly Affected by the Weather: 7, “Protestant Wind”—“Popish Wind”: The Revolution of 1688 in England, B. Am. Meteorol. Soc., 66, 634–644, https://doi.org/10.1175/1520-0477(1985)066<0634:GHETWS>2.0.CO;2, 1985.
Lorenc, H.: Maksymalne prędkości wiatru w Polsce, Monografie, Instytut Meteorologii i Gospodarki Wodnej – Państwowy Instytut Badawczy, Warszawa, ISBN 978-83-61102-62-5, 2012.
Luterbacher, J., Rickli, R., Xoplaki, E., Tinguely, C., Beck, C., Pfister, C., and Wanner, H.: The Late Maunder Minimum (1675–1715) – A Key Period for Studying Decadal Scale Climatic Change in Europe, Climatic Change, 49, 441–462, https://doi.org/10.1023/A:1010667524422, 2001a.
Luterbacher, J., Xoplaki, E., Dietrich, D., Jones, P. D., Davies, T. D., Portis, D., Gonzalez-Rouco, J. F., von Storch, H., Gyalistras, D., Casty, C., and Wanner, H.: Extending North Atlantic Oscillation Reconstructions Back to 1500, Atmos. Sci. Lett., 2, 114–124 (https://doi.org/10.1006/asle.2002.0047), 2001b.
Luterbacher, J., Dietrich, D., Xoplaki, E., Grosjean, M., and Wanner, H.: European seasonal and annual temperature variability, trends and extremes since 1500, Science, 303, 1499–1503, https://doi.org/10.1126/science.1093877, 2004.
Mann, M. E., Zhang, Z., Rutherford, S., Bradley, R. S., Hughes, M. K., Shindell, D., Ammann, C., Faluvegi, G., and Ni, F.: Global Signatures and Dynamical Origins of the Little Ice Age and Medieval Climate Anomaly, Science, 326, 1256–1260, https://doi.org/10.1126/science.1177303, 2009.
Nowosad, W., Przybylak, R., Marciniak, K., and Syta, K.: Diariusz Jana Antoniego Chrapowickiego jako źródło do badań klimatu Rzeczypospolitej w II połowie XVII, Klio, 9, 21–60, 2007.
Orme, L. C.: Reconstructions of Late Holocene storminess in Europe and the role of the North Atlantic Oscillation, PhD work, University of Exeter, 306 pp., http://ore.exeter.ac.uk/repository/bitstream/handle/10871/16128/OrmeL.pdf?sequence=1 (last access: 1 March 2026), 2014.
Outten, S. and Sobolowski, S.: Extreme wind projections over Europe from the Euro-CORDEX regional climate models, Weather and Climate Extremes, 33, 100363, https://doi.org/10.1016/j.wace.2021.100363, 2021.
PAGES 2 k Consortium: Continental-scale temperature variability during the past two millennia, Nat. Geosci., 6, 339–346, https://doi.org/10.1038/ngeo1797, 2013.
Pfeifer, K. and Pfeifer, N.: Severe storm reports of the 17th century: Examples from the UK and France, 6th European Conference on Severe Storms (ECSS2013), 3–7 June 2013, Helsinki, Finland, https://doi.org/10.13140/2.1.1057.7287, 2013.
Pfister, C.: Wetternachhersage. 500 Jahre Klimavariationen und Naturkatastrophen (1496–1995), Paul Haupt, Bern, ISBN 3-258-05696-X, https://boris.unibe.ch/197521/1/Wetternachhersage.pdf (last access: 20 May 2026), 1999.
Przybylak, R. and Marciniak, K.: Climate changes in the Central and North-Eastern parts of the Polish–Lithuanian Commonwealth from 1656 to 1685, in: The Polish climate in the European context: An historical overview, edited by: Przybylak, R., Majorowicz, J., Brázdil, R., and Kejna, M., Springer, New York, 423–443, https://doi.org/10.1007/978-90-481-3167-9_21, 2010.
Przybylak, R., Araźny, A., Filipiak, J., Oliński, P., Wyszyński, P., and Szwaba, A.: Strong wind occurrence in Poland from the 13th to 16th centuries based on documentary evidence, Clim. Past, 21, 1501–1519, https://doi.org/10.5194/cp-21-1501-2025, 2025.
Przybylak, R., Filipiak, J., Oliński, P., and Ghazi, B.: Database of strong wind occurrences in Poland in the 17th century based on documentary evidence, Repository for Open Data (RepOD), Nicolaus Copernicus University Centre for Climate Change Research collection, V 1 [data set], https://doi.org/10.18150/ESPWII, 2026.
Schimanke, S., Meier, H. E. M., Kjellström, E., Strandberg, G., and Hordoir, R.: The climate in the Baltic Sea region during the last millennium simulated with a regional climate model, Clim. Past, 8, 1419–1433, https://doi.org/10.5194/cp-8-1419-2012, 2012.
Sorrel, P., Tessier, B., Demory, F., Delsinne, N., and Mouazé, D.: Evidence for millennial-scale climatic events in the sedimentary infilling of a macrotidal estuarine system, the Seine estuary (NW France), Quaternary Sci. Rev., 28, 499–516, https://doi.org/10.1016/j.quascirev.2008.11.009, 2009.
Topolski, J.: Historia Polski, Wydawnictwo Poznańskie, Poznań, 384 pp., ISBN 978-83-7976-269-9, https://wydawnictwopoznanskie.pl/produkt/historia-polski-2015/?utm_source=chatgpt.com (last access: 20 April 2026), 2015.
Ustrnul, Z., Wypych, A., Henek, E., Czekierda, D., Walawender, J., Kubacka, D., Pyrc, R., and Czernecki, B.: Atlas zagrożeń meteorologicznych Polski (Meteorological hazard atlas of Poland), Instytut Meteorologii i Gospodarki Wodnej – Państwowy Instytut Badawczy, Kraków, ISBN 978-83-61102-22-9, https://imgw.pl/atlas-zagrozen-meteorologicznych-polski/?utm_source=chatgpt.com (last access: 20 April 2026), 2014.
Wanner, H., Holzhauser, H. P., Pfister, C., and Zumbühl, H.: Interannual to Century Scale Climate Variability in the European Alps, Erdkunde, 54, 62–69, https://doi.org/10.3112/erdkunde.2000.01.05, 2000.
Wheeler, D., García-Herrera, R., Vaquero, J. M., Chenoweth, M., and Mock, C. J.: Reconstructing the trajectory of the August 1680 hurricane from contemporary records, Bull. Amer. Meteor. Soc., 90, 971–978, https://doi.org/10.1175/2009BAMS2649.1, 2009.
Wheeler, D., García-Herrera, R., Wilkinson, C. W., and Ward, C.: Atmospheric circulation and storminess derived from Royal Navy logbooks: 1685 to 1750, Climatic Change, 101, 257–280, https://doi.org/10.1007/s10584-009-9732-x, 2010.
Wibig, J.: Change of Wind, in: Climate Change in Poland: Past, Present, Future, edited by: Falarz, M., Springer Nature Switzerland, 391–420, https://doi.org/10.1007/978-3-030-70328-8_15, 2021.
Wilson, P., McGourty, J., and Bateman, M. D.: Mid-to late-Holocene coastal dune event stratigraphy for the north coast of Northern Ireland, Holocene, 14, 406–416, https://doi.org/10.1191/0959683604hl716rp, 2004.
Winn, J. M.: Notes on the meteorology and epidemics of the seventeenth century, The Sanitary Review and Journal of Public Health, 3, 55–62, 1857.
WMO: WMO Atlas of Mortality and Economic Losses from Weather, Climate and Water Extremes (1970–2019), WMO-No. 1267, World Meteorological Organization, Geneva, ISBN 978-92-63-11267-5, https://library.wmo.int/idurl/4/57564 (last access: 1 March 2026), 2021.
Wyczański, A.: Polska – Rzeczą Pospolitą Szlachecką 1454–1764, Państwowe Wydawnictwo Naukowe, Warszawa, 452 pp., ISBN 83-01-10044-3, https://www.scribd.com/document/ 502697537/Andrzej-Wyczański-Polska-Rzeczą-Pospolitą- Szlachecką-1454-1764-Pastwowe-Wydawnictwo-Naukowe- 1965?utm_source= chatgpt.com (last access: 1 March 2026), 1965.