
the Creative Commons Attribution 4.0 License.
the Creative Commons Attribution 4.0 License.
 | 12 Nov 2026
Tree-ring cellulose oxygen isotope reveals summer hydroclimate variability across the East European Plain
Qiaoyun Lin

Ru Huang
Wenling An
Vladimir Matskovsky
Olga Solomina
Ekaterina Dolgova
Yaru Zhao
Zhengtang Guo
Hydroclimate variability across the East European Plain plays a critical role in regional ecosystems and climate dynamics, yet moisture-sensitive tree-ring proxies remain scarce in this region, particularly at high latitudes where tree-ring width (TRW) and density are primarily controlled by temperature. Tree-ring cellulose oxygen isotopes (δ18OTRC) have the potential to serve as a useful hydroclimate proxy, but their climatic signal in this region remains poorly understood. Here, we developed three δ18OTRC chronologies of Scots pine (Pinus sylvestris L.) from the northern, central, and southern East European Plain to assess their climate signals. The δ18OTRC chronologies from the three sites show similar responses to summer moisture conditions. The northern δ18OTRC shows the strongest relationship with vapor pressure deficit (VPD), the central δ18OTRC records both hydroclimate variability and precipitation oxygen isotopes (δ18Op) signals, and the southern δ18OTRC mainly reflects the Standardized Precipitation Evapotranspiration Index (SPEI). In contrast, TRW shows weak hydroclimate sensitivity at the northern and central sites, whereas at the southern site it mainly reflects soil moisture. Overall, compared with TRW, δ18OTRC better captures regional summer hydroclimate signals, particularly capturing signals related to atmospheric drought.
- Article
(5222 KB) - Full-text XML
-
Supplement
(1637 KB) - BibTeX
- EndNote


East European Plain occupies a pivotal position in the Eurasian climate system, serving as a key transitional region between the North Atlantic, Europe, and the continental interior of Asia (Liu et al., 2014; Morozova et al., 2023). Understanding climate variability in this region is fundamental for interpreting large-scale climate variability across Eurasia. With global warming, this region has experienced pronounced temperature increases accompanied by complex and spatially heterogeneous changes in hydroclimate (Moberg et al., 2006; Spinoni et al., 2015; Zolina et al., 2009). Historical analyses of hydroclimate variability over past centuries using proxy data are an essential quantitative way to put current conditions in a longer-term perspective.
Tree-ring proxies have been widely used to reconstruct past climate because they are broadly distributed, long-lived, annually resolved, and climate-sensitive (McCarroll and Loader, 2004). To date, tree-ring width (TRW)-based climate-signal studies in the East European Plain span from the Arctic margin to the southern Caucasus (Solomina and Matskovsky, 2021). However, the application of TRW to climate reconstructions in this region remains limited. First, TRW–climate relationships show pronounced regional differences across the East European Plain, with a transition from temperature limitation to moisture limitation around 55–60° N (Matskovsky, 2016). North of approximately 60° N, conifer TRW generally responds positively to summer temperature, with the strongest responses occurring mainly in June and July (Dolgova et al., 2022; Matskovsky, 2016; Semenyak and Dolgova, 2023). In the central transitional region at approximately 54–56° N, TRW is jointly influenced by summer temperature and moisture conditions, with the main moisture-related variables including precipitation, PDSI, and soil moisture (Matskovsky, 2016). Farther south, in the southern Middle Volga region and the forest-steppe zone of Voronezh, pine growth is primarily limited by warm-season moisture availability (Kuznetsova and Solomina, 2022; Matveev et al., 2019).
Second, TRW at most sites shows low-to-moderate climate sensitivity (correlation coefficients rarely exceed 0.5) (Hughes et al., 2019; Solomina and Matskovsky, 2021). Consequently, although TRW has been used to reconstruct past hydroclimate variability, moisture-sensitive sites capable of capturing interannual hydroclimate variability remain scarce and unevenly distributed, particularly at high latitudes (Cook et al., 2020; Kuznetsova and Solomina, 2022; Matskovsky et al., 2017). This motivates us to explore alternative hydroclimate proxies with more directly process-based interpretations and stronger moisture sensitivity.
Compared with TRW, tree-ring cellulose oxygen isotope (δ18OTRC) typically shows lower within-tree variability, higher inter-tree coherence, and no or very limited age-related effects, making it a widely utilized hydroclimate proxy over the globe (Rinne, 2012; Römer et al., 2025; Xu et al., 2011). δ18OTRC is mainly controlled by (i) the isotopic composition of source water (δ18Os), which largely reflects precipitation oxygen isotopes (δ18Op), (ii) evaporative enrichment of leaf water, and (iii) oxygen exchange with xylem water during cellulose formation (McCarroll and Loader, 2004; Roden et al., 2000). These processes are modulated by factors such as temperature, precipitation amount, moisture-transport history, relative humidity (RH), and wind speed (Gat, 1996; Roden et al., 2000). Consequently, δ18OTRC can preserve climate information from seasonal to interannual timescales and can be used to reconstruct multiple hydroclimate variables, including precipitation (Rinne, 2012; Xu et al., 2023), RH (Haupt et al., 2011), vapor pressure deficit (VPD) (Nagavciuc et al., 2024; Treydte et al., 2024), and drought indices (An et al., 2023; Arosio et al., 2025; Freund et al., 2023; Xu et al., 2013a).
Although networks of tree-ring δ18O chronologies have been widely developed across Europe and Asia and applied to hydroclimate reconstructions (Freund et al., 2023; Treydte et al., 2024; Xu et al., 2024), the climate sensitivity of δ18OTRC shows pronounced regional variability. Moisture sources and transport pathways influence the isotopic composition of precipitation and tree source water, whereas local relative humidity and evaporative demand regulate leaf-water evaporative enrichment (Gat, 1996; McCarroll and Loader, 2004; Roden et al., 2000). Soil-water storage and seasonal mixing can further alter the contribution of precipitation from different seasons to tree source water, potentially extending the δ18O climate response beyond the period of cellulose formation (Treydte et al., 2014). Consequently, the dominant controls, response strength, and seasonal response windows of δ18OTRC may differ among hydroclimatic settings (Freund et al., 2023; Treydte et al., 2007). This spatial heterogeneity highlights the need for region-specific studies of climate signals. In contrast, tree-ring isotope research in the East European Plain is limited (Matskovsky et al., 2022; Panyushkina et al., 2016), and the ability of δ18OTRC to capture interannual hydroclimate variability in this region remains a significant knowledge gap.
Given the pronounced north–south gradients and spatial heterogeneity in interannual variability and long-term trends of temperature and precipitation (Klimenko and Solomina, 2010), a single site cannot adequately represent the regional-scale climate sensitivity of δ18OTRC. Here, we sampled Scots pine (Pinus sylvestris L.) from three representative forest regions in the northern, central, and southern East European Plain (51–65° N) and developed site-level δ18OTRC chronologies along this transect. Our objectives were to (1) quantify the relative contributions of δ18Op and RH-related evaporative enrichment to the spatial difference in δ18OTRC; (2) identify the dominant climate signal and key seasonal windows of δ18OTRC at the interannual scale; and (3) evaluate the potential of δ18OTRC for reconstructing historical hydroclimate variability in the East European Plain.
2.1 Study area
The study area is located in the East European Plain and is characterized by cold winters, warm summers, and pronounced seasonality. The relatively flat topography of the East European Plain, together with the low relief of Central and Western Europe, allows Atlantic moisture carried by the prevailing westerlies to penetrate far inland toward the Ural Mountains (Klimenko and Solomina, 2010).
The geographic locations of the three sampling sites are shown in Fig. 1a and Table 1. The northern sampling site is located on the Solovetsky Islands, which have a subarctic climate. Owing to the maritime influence of the White Sea, the islands experience milder temperatures, smaller diurnal temperature ranges, higher humidity, and stronger winds than the adjacent mainland coast (Semenyak and Dolgova, 2023). The central sampling site is located in Yaroslavl city and has a temperate continental climate. The surrounding forests are mainly coniferous and dominated by Scots pine. The site lies within a forest park in an urban zone and may be influenced by anthropogenic disturbance. The southern sampling site is located in Khrenovskoy Forest (Voronezh Oblast) and has a temperate continental climate. The forest lies in the forest-steppe zone and represents the southernmost natural pine forest in the East European Plain (Matskovsky et al., 2017), with Scots pine as the dominant tree species (Matveev et al., 2017).

Figure 1Study site locations and climatic characteristics. (a) Arrows indicate the mean vertically integrated water vapor flux (kg m−1 s−1) and the transport direction for May to September, 1950–2019. Panels (b)–(d) show mean monthly temperature, precipitation, and RH at the northern, central, and southern sites, respectively. Temperature and precipitation data were obtained from meteorological stations, whereas RH was calculated from CRU TS 4.08 gridded temperature and vapor pressure (Harris et al., 2020). All mean monthly values are for 1950–2021, except for central-site precipitation (1967–2021).
Table 1Location, environmental characteristics, and δ18OTRC chronology statistics.
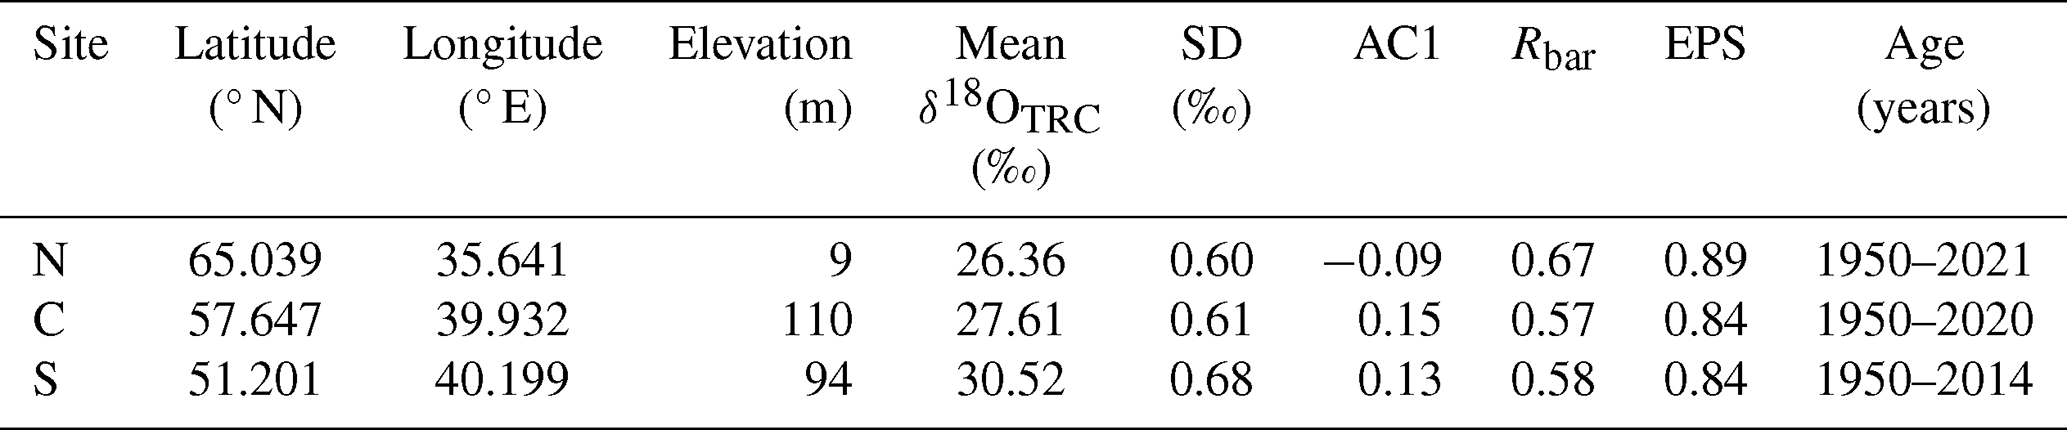
N, C, S denote northern, central, southern sites, respectively. SD, AC1, Rbar, and EPS represent the standard deviation, first-order autocorrelation, mean interseries correlation, and expressed population signal, respectively.
From 1950–2021 (precipitation for the central site is only available for 1967–2021; Fig. 1b–d), mean annual precipitation was 480, 623, and 489 mm at the northern, central, and southern sites, respectively. Mean annual temperatures were 1.52, 3.85, and 6.51 °C, respectively. Mean summer (June–August) temperature increased from 12.86 °C at the northern site to 16.73 °C at the central site and 19.66 °C at the southern site. The lowest mean RH occurred in June at the northern site (69.54 %) and in May at the central (63.56 %) and southern (56.71 %) sites (Fig. 1b–d).
Scots pine was selected as the study species. It is long-lived (up to ∼ 400 years) and widely distributed across northern Eurasia (Lange et al., 2018). Xylogenesis observations indicate pronounced latitudinal differences in growth phenology: in northern insular ecosystems near our northern site, growth typically begins in early June and ceases by mid to late August, whereas at more southerly sites xylem formation generally starts earlier (from late April to May) and ends later (from late August to September) (Matulewski et al., 2019; Matveev et al., 2020; Tishin et al., 2016).
2.2 Sampling, Sample Preparation and Isotope Analysis
Initially, the cores were collected for dendroclimatic analysis at breast height using increment corers from dominant and subdominant trees. The cores were mounted on wooden bases with polyvinyl alcohol (PVA) glue, polished, and scanned. Tree-ring widths (TRW) were measured in CooRecorder, and cross-dating was verified for all samples using COFECHA (Holmes, 1983). The TRW chronologies used in this study were developed by detrending and standardizing the ring-width series with the ARSTAN program. Previous analyses of TRW data from these sites are available in Dolgova et al. (2022) and Semenyak and Dolgova (2023).
The numbers of candidate samples and the results of core selection for δ18OTRC analysis are summarized in Table S1 in the Supplement. The same selection criteria were applied at all three sites, including preferentially selecting the oldest cores to minimize potential juvenile effects, reliable cross-dating and continuous temporal coverage, clearly identifiable ring boundaries, and the ability to isolate individual rings without contamination from adjacent rings while obtaining sufficient α-cellulose for isotope measurement (Xu et al., 2011, 2013b). Narrow rings were retained as long as they could be reliably separated and provided sufficient material, whereas cores containing missing rings or rings that could not be reliably separated and measured were not selected. Based on these criteria, four cores from four different trees were initially selected from all candidate cores at each site. Additional sampling at the northern site in 2021 provided three further cores covering 2000–2021, allowing the isotope chronology to be extended to 2021. α-cellulose was extracted using a modified plate method (Xu et al., 2011, 2013b). Cores were cut into ∼ 1 mm thick, and ∼ 7 cm long slivers and processed following the Jayme–Wise protocol (Loader et al., 1997). Specifically, lignin, hemicellulose, and lipids were sequentially removed by treatment with acidified NaClO2, 17 wt % NaOH, and organic solvents (acetone, toluene, and ethanol), respectively. After chemical treatment, the α-cellulose slivers were oven-dried at 70 °C. Annual α-cellulose subsamples were separated under a binocular microscope using a scalpel. The α-cellulose samples (0.12–0.20 mg) were weighed and wrapped in silver foil for oxygen isotope analysis.
δ18OTRC values were measured at the Institute of Geology and Geophysics, Chinese Academy of Sciences, using an isotope ratio mass spectrometer (Delta V Advantage, Thermo Scientific, Germany) coupled to a high-temperature conversion elemental analyzer (Flash HT, Thermo Scientific, Germany). Oxygen isotope ratios are reported in δ notation relative to Vienna Standard Mean Ocean Water (VSMOW): δ18O = × 1000 ‰, where Rsample and Rstandard denote the ratios of the sample and standard, respectively. For calibration and quality control, a Merck cellulose working standard was analyzed after every eight samples, and δ18O values were normalized to this standard. The analytical uncertainties for repeated measurements of Merck cellulose were ∼ ±0.16 ‰ (n = 149).
2.3 Climate data
Temperature and precipitation data for the northern, central, and southern sites were obtained from the Kem'-Port Meteorological Station (34.80° E, 64.98° N; WMO No. 22520), Kostroma Meteorological Station (40.78° E, 57.73° N; WMO No. 27333), and Kamennaya Step' Meteorological Station (40.70° E, 51.05° N; WMO No. 34139), respectively (Fig. 1a). All meteorological station data were obtained from the Russian Institute of Hydrometeorological Information-World Data Centre (RIHMI-WDC).
To examine contemporaneous and lagged relationships between δ18OTRC and additional climatic variables, we used gridded products from the following archives. These included monthly mean temperature (Tmean), maximum temperature (Tmax), minimum temperature (Tmin), precipitation (Pre), cloud cover (CC), and vapor pressure (VP) from CRU TS 4.08 at 0.5° × 0.5° spatial resolution for 1950–2021 (Harris et al., 2020); drought indices including the Standardized Precipitation Evapotranspiration Index (SPEI) and the Palmer Drought Severity Index (PDSI) (Dai et al., 2004; Vicente-Serrano et al., 2010b); and soil moisture (SM; 0–10 and 0–40 cm) from the Famine Early Warning Systems Network Land Data Assimilation System (FLDAS) at 0.1° × 0.1° resolution (McNally et al., 2017).
All gridded datasets were accessed and downloaded via the KNMI Climate Explorer (Trouet and Van Oldenborgh, 2013). For each site, gridded variables were spatially averaged within a 2° × 2° box centered on the sampling coordinates. Monthly Tmean and VP were used to calculate RH and VPD following formulae (Allen et al., 1998):
where esat is saturated vapor pressure (hPa), and T is mean temperature (°C).
Given that δ18Opis an important control on δ18OTRC, and that nearby Global Network of Isotopes in Precipitation (GNIP; https://www.iaea.org/zh/fu-wu/wang-luo, last access: 5 November 2026) records are relatively short, GNIP observations alone are insufficient for long-term analyses. Therefore, we used the isotope-enabled atmospheric general circulation model ECHAM5-wiso to obtain δ18Op for our study region. ECHAM5-wiso is an isotope-enabled extension of ECHAM5 in which the stable water isotopologues HO and HDO are explicitly simulated within the atmospheric hydrological cycle (Werner et al., 2011). We downloaded model-simulated monthly δ18Op (https://doi.org/10.1594/PANGAEA.902347, Werner, 2019) and extracted time series from the grid cell nearest to each study site for 1958–2013. Previous studies have evaluated ECHAM5-wiso against GNIP observations at the global scale (Werner et al., 2011) and across Europe (Langebroek et al., 2011). Moreover, ECHAM5-wiso successfully reproduced the seasonal phase of δ18Op observed at nearby GNIP stations, despite a pronounced station-dependent mean offset, particularly at southern stations with limited GNIP coverage (Fig. S1 in the Supplement). Consequently, we primarily used ECHAM5-wiso δ18Op simulations to interpret interannual variability in source-water isotopes. The latitude, longitude, and other metadata for the simulated and observed δ18Op data are provided in Table S2.
2.4 Statistical analyses
The δ18OTRC series from all analyzed cores at each site were averaged to generate site-level δ18OTRC chronologies for the northern, central, and southern sites. We calculated the mean interseries correlation (Rbar) to evaluate inter-core coherence and the expressed population signal (EPS) to assess chronology representativeness (Wigley et al., 1984). Rbar was calculated as the mean of all pairwise Pearson correlations among the four original core series at each site, and EPS was derived from Rbar using a fixed sample replication of N = 4. Because the isotope chronologies span only approximately 65–72 years, Rbar and EPS were calculated over the common period of the four original core series at each site rather than using moving-window analyses. The three additional northern series cover only approximately 2000–2021 and were therefore excluded from these calculations.
To explore the factors controlling the spatial differences in δ18OTRC, we used a simplified mechanistic fractionation framework for δ18OTRC (Roden et al., 2000):
Here, δ18Os is the oxygen isotopic composition of source water (approximated by δ18Op); ϵ0 is the net biochemical fractionation term associated with cellulose formation; f0 is the proportion of exchangeable oxygen during cellulose synthesis (set to 0.42; Sternberg and Ellsworth, 2011); ϵ* and ϵk are the equilibrium and kinetic fractionation factors, respectively (set to 9 ‰ and 29 ‰, respectively; Allison et al., 1985); h is the relative humidity at the evaporative site in the leaf; and α is a scaling/attenuation factor describing the transfer of the evaporative-enrichment signal to cellulose (set to 1; Allison et al., 1985; Barbour, 2007).
We further defined the evaporative enrichment term, E, as
Here, Δ denotes the pairwise difference between sites. We then calculated Δδ18OTRC, Δδ18Op, ΔRH, and ΔE to quantify the relative contributions of site-to-site differences in δ18Op and RH-controlled evaporative enrichment to spatial variability in δ18OTRC.
To identify climatic and source-water signals recorded in δ18OTRC, we correlated the chronology with monthly and seasonal climate variables from June of the previous year to September of the current year, and with δ18Op from October of the previous year to September of the current year. Spatial correlations between each site chronology and gridded CRU TS 4.08 data were calculated using the KNMI Climate Explorer (https://climexp.knmi.nl/start.cgi, last access: 5 November 2026) to evaluate the regional representativeness of δ18OTRC.
3.1 Tree-ring cellulose oxygen isotope chronologies
The mean inter-series correlation (Rbar) for the northern δ18OTRC site was 0.67, and the expressed population signal (EPS) of the chronology was 0.89 (Table 1). By contrast, the central and southern sites showed slightly lower values (Rbar = 0.57 and 0.58, respectively; EPS = 0.84 for both sites; Table 1). Along the north–south transect, the series were averaged to build δ18OTRC chronologies for the North (1950–2021), Central (1950–2020), and South (1950–2014) (Fig. 2a–d). The original four-tree and expanded seven-tree chronologies at the northern site showed similar interannual variability over their overlapping period (Fig. S2a). EPS was ≥ 0.84 at all three sites, suggesting overall coherent inter-tree signals within each site. The high within-site inter-series correlations (Table S3) further support the reliability of the δ18OTRC chronologies.
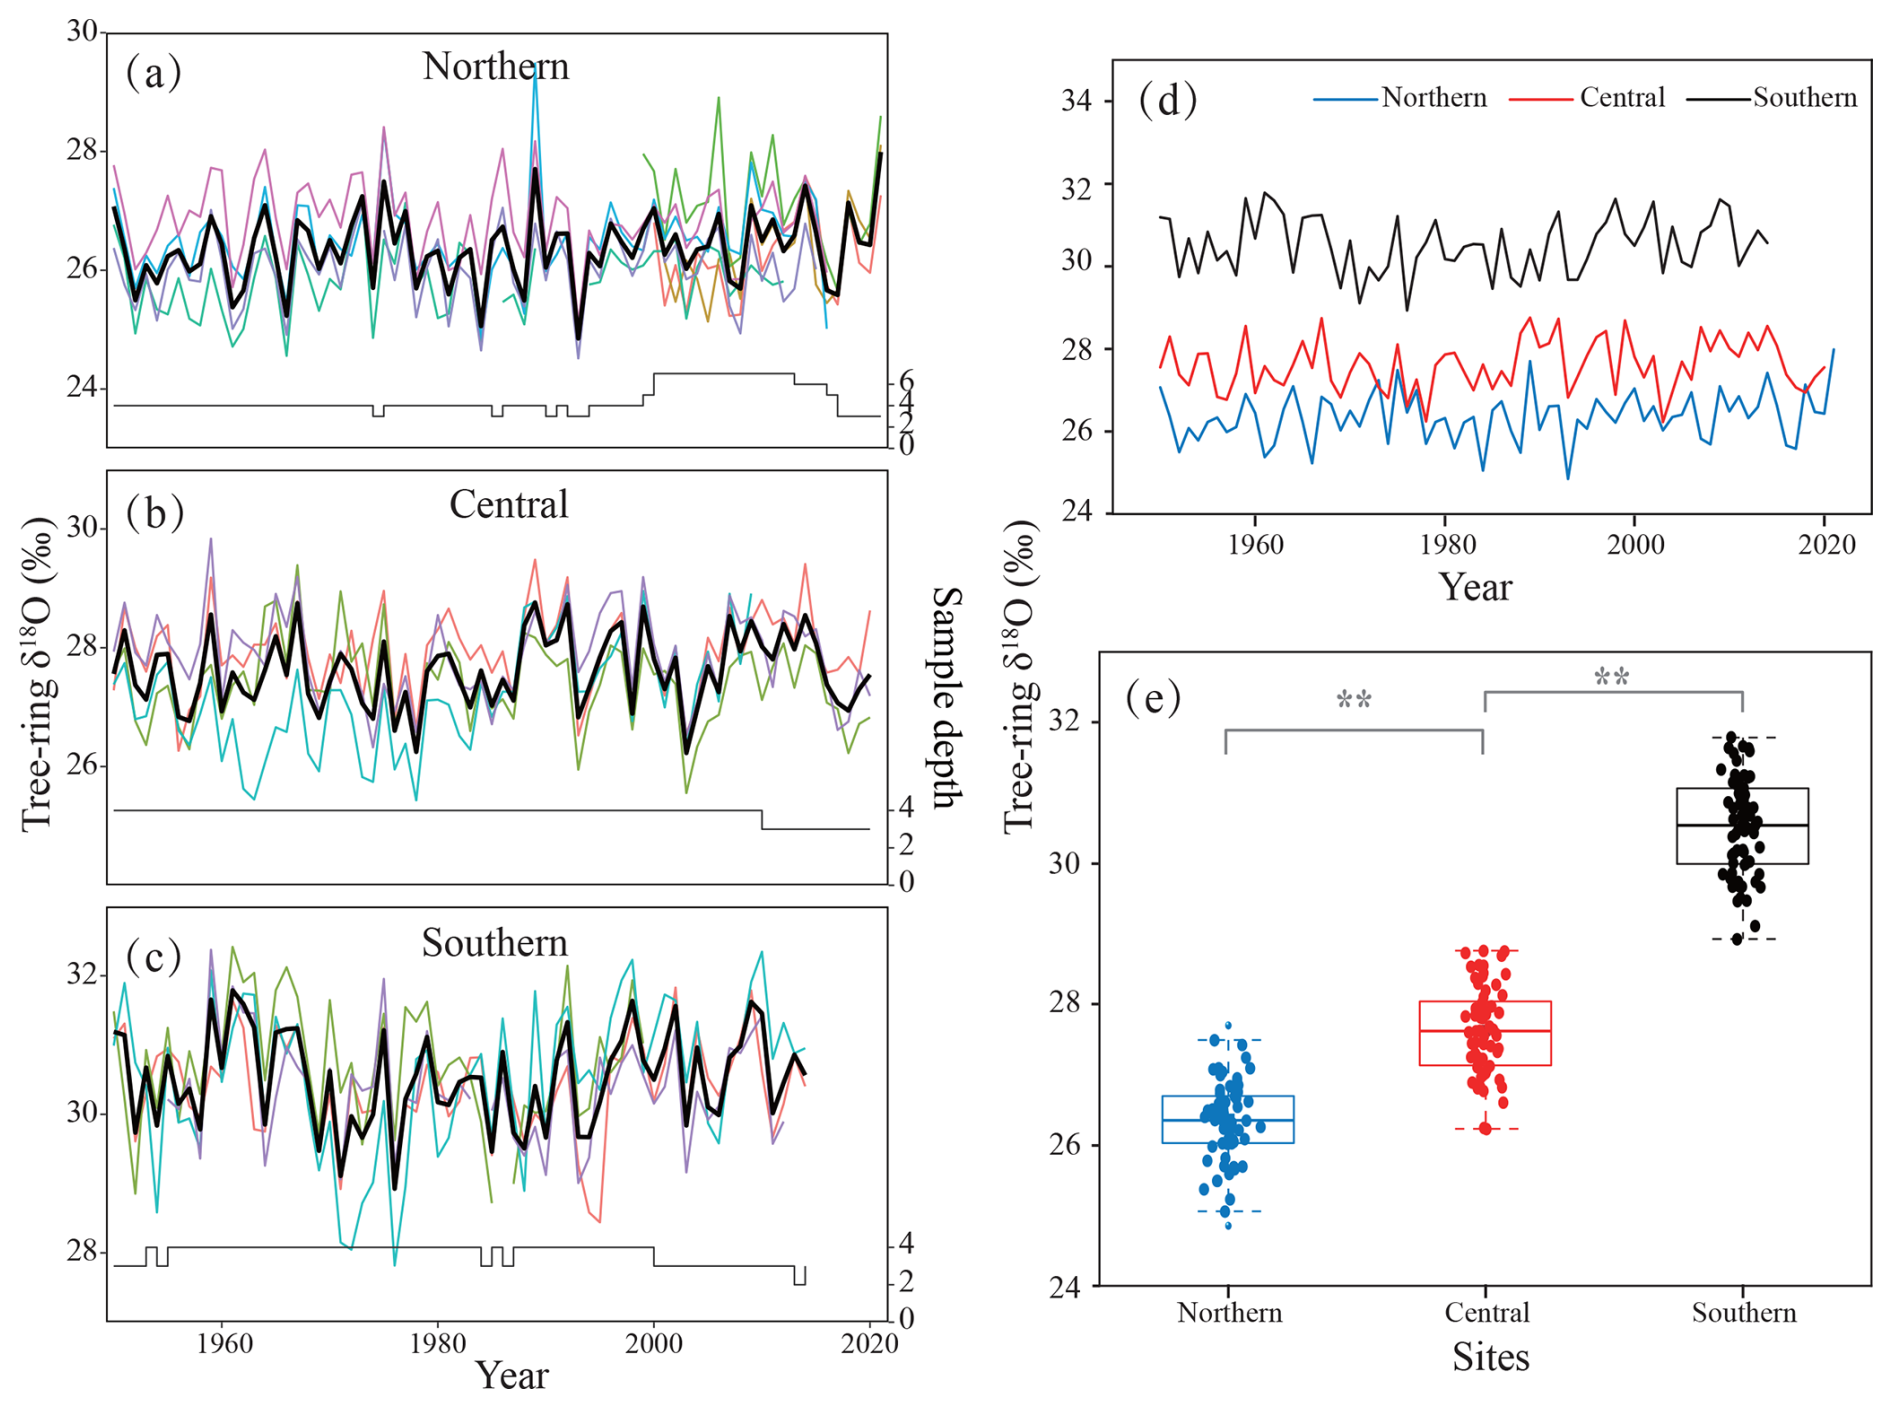
Figure 2δ18OTRC chronologies for the northern (a), central (b), and southern (c) East European Plain. Individual δ18OTRC series are shown as thin colored lines; the site mean chronologies are shown as thick black lines. Annual sample depth is shown by the gray step lines in panels (a)–(c). Time-series plots (d) and box-and-whisker plots (e; 1950–2014) show the δ18OTRC chronologies at the three sites. In panel (e), the line within each box denotes the median; box limits indicate the 25th and 75th percentiles; and filled circles denote outliers. Asterisks indicate statistical significance (, p < 0.01).
The northern δ18OTRC chronology ranged from 24.85 ‰ to 27.99 ‰, with a mean of 26.36 ‰, a standard deviation (SD) of 0.60 ‰, and a first-order autocorrelation (AC1) of −0.09 (Table 1). The central chronology ranged from 26.23 ‰ to 28.76 ‰, with a mean of 27.61 ‰, an SD of 0.61 ‰, and an AC1 of 0.15 (Table 1). The southern chronology ranged from 28.93 ‰ to 31.79 ‰, with a mean of 30.52 ‰, an SD of 0.68 ‰, and an AC1 of 0.13 (Table 1). Over the common period (1950–2014), the northernmost Solovetsky Islands chronology had the lowest median (26.35 ‰), the central site was 27.62 ‰, and the southernmost site had the highest median (30.54 ‰) (Fig. 2e). Overall, both the mean and median values of the East European Plain δ18OTRC chronologies show a clear latitudinal gradient, with higher values in the south and lower values in the north.
Pairwise correlations among the three chronologies ranged from 0.14 to 0.35 over 1950–2014. Significant correlations were found for the North–Central pair (NC; r = 0.33, p < 0.01) and the Central–South pair (CS; r = 0.35, p < 0.01), whereas the North–South pair (NS; r = 0.14, p > 0.05) was not significant (Fig. 2e). Overall, these results suggest that δ18OTRC variability shows local coherence, with stronger similarity between adjacent sites that weakens with increasing distance.
3.2 Climate responses and source water signals of δ18OTRC
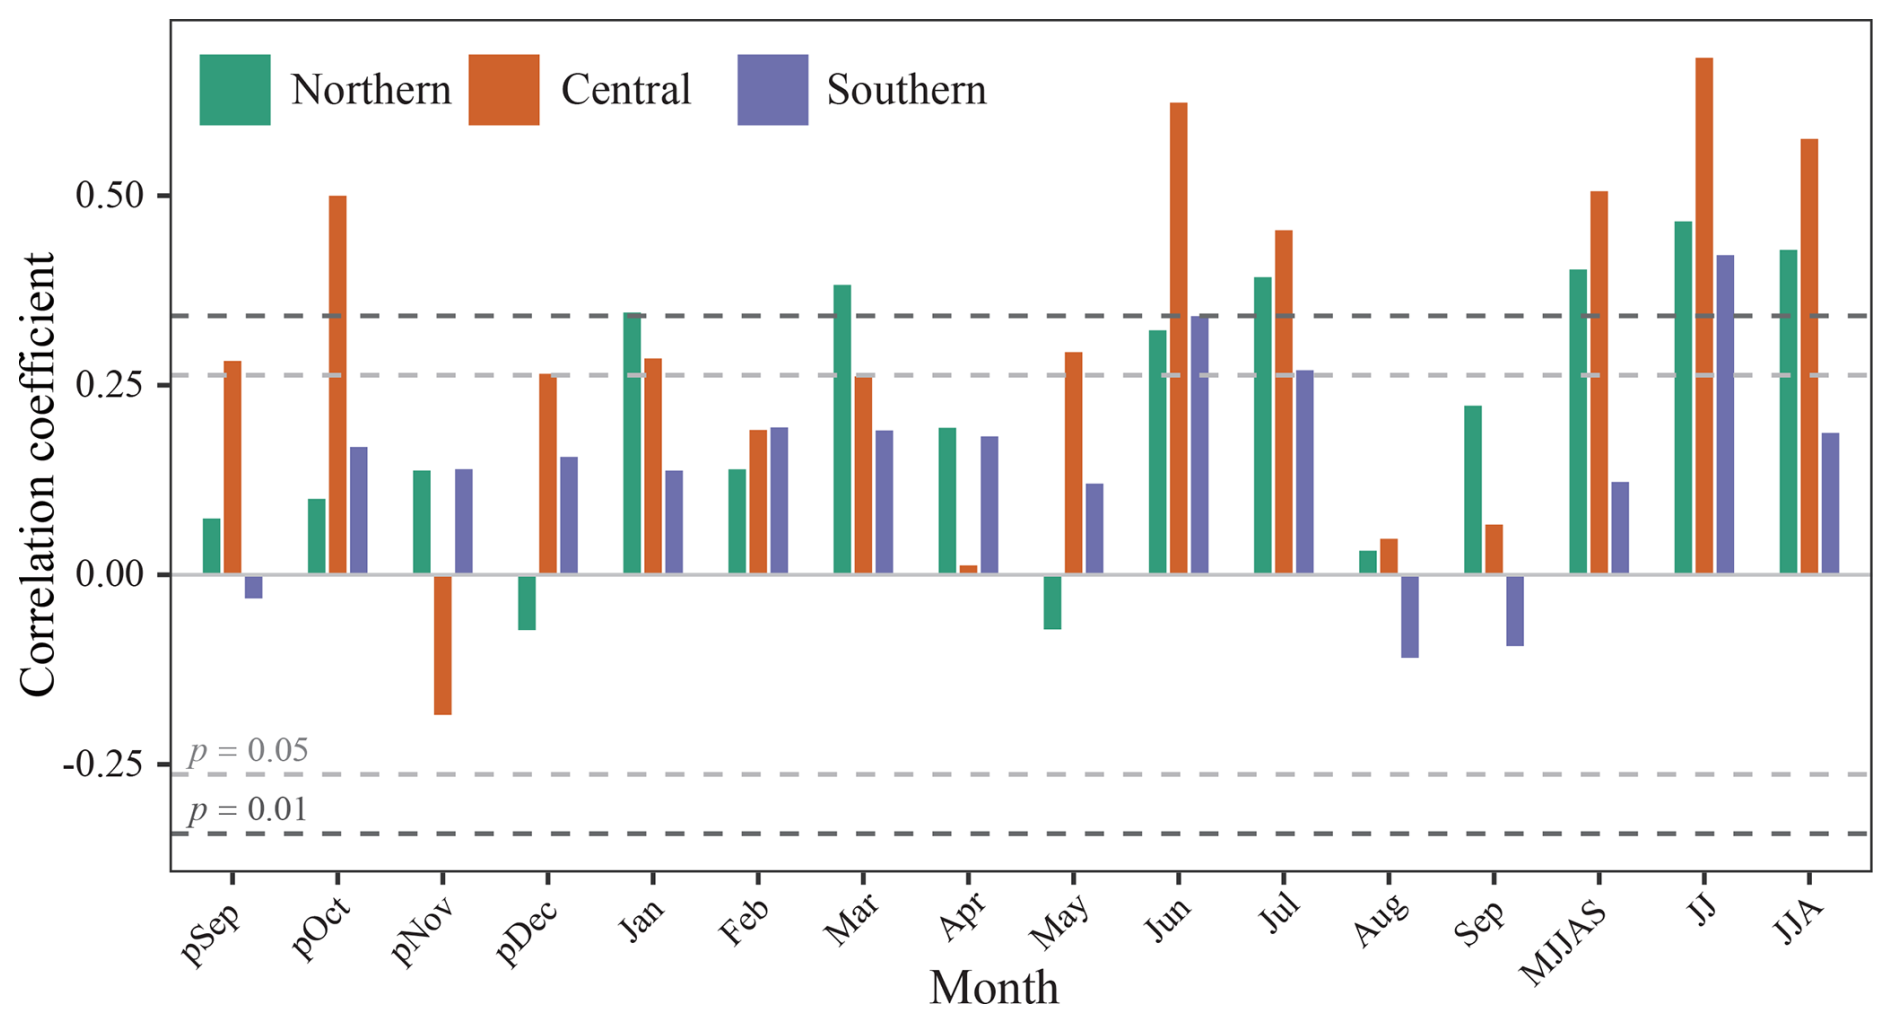
During the growing season or summer, δ18OTRC is significantly positively correlated with VPD, but significantly negatively correlated with moisture-related variables such as Pre, RH, CC, SPEI, PDSI, and SM (Fig. 3; Tables S4–S6). Among the three sites, the northern site shows the strongest atmospheric drying signal, with the highest correlation between δ18OTRC and May–September VPD (r = 0.61, p < 0.01, n = 72) (Fig. 3; Table S4). In contrast, moisture signals are weaker at the central and southern sites: δ18OTRC at central site correlates with May–September SPEI at r = −0.42 (p < 0.01, n = 69), whereas the strongest relationship at the southern site is with June–August SPEI (r = −0.51, p < 0.01, n = 65) (Fig. 3; Tables S5–S6). By comparison, moisture conditions in the previous year and in spring (March–May) exert relatively limited influence on δ18OTRC, with only a few variables showing significant effects in isolated months.
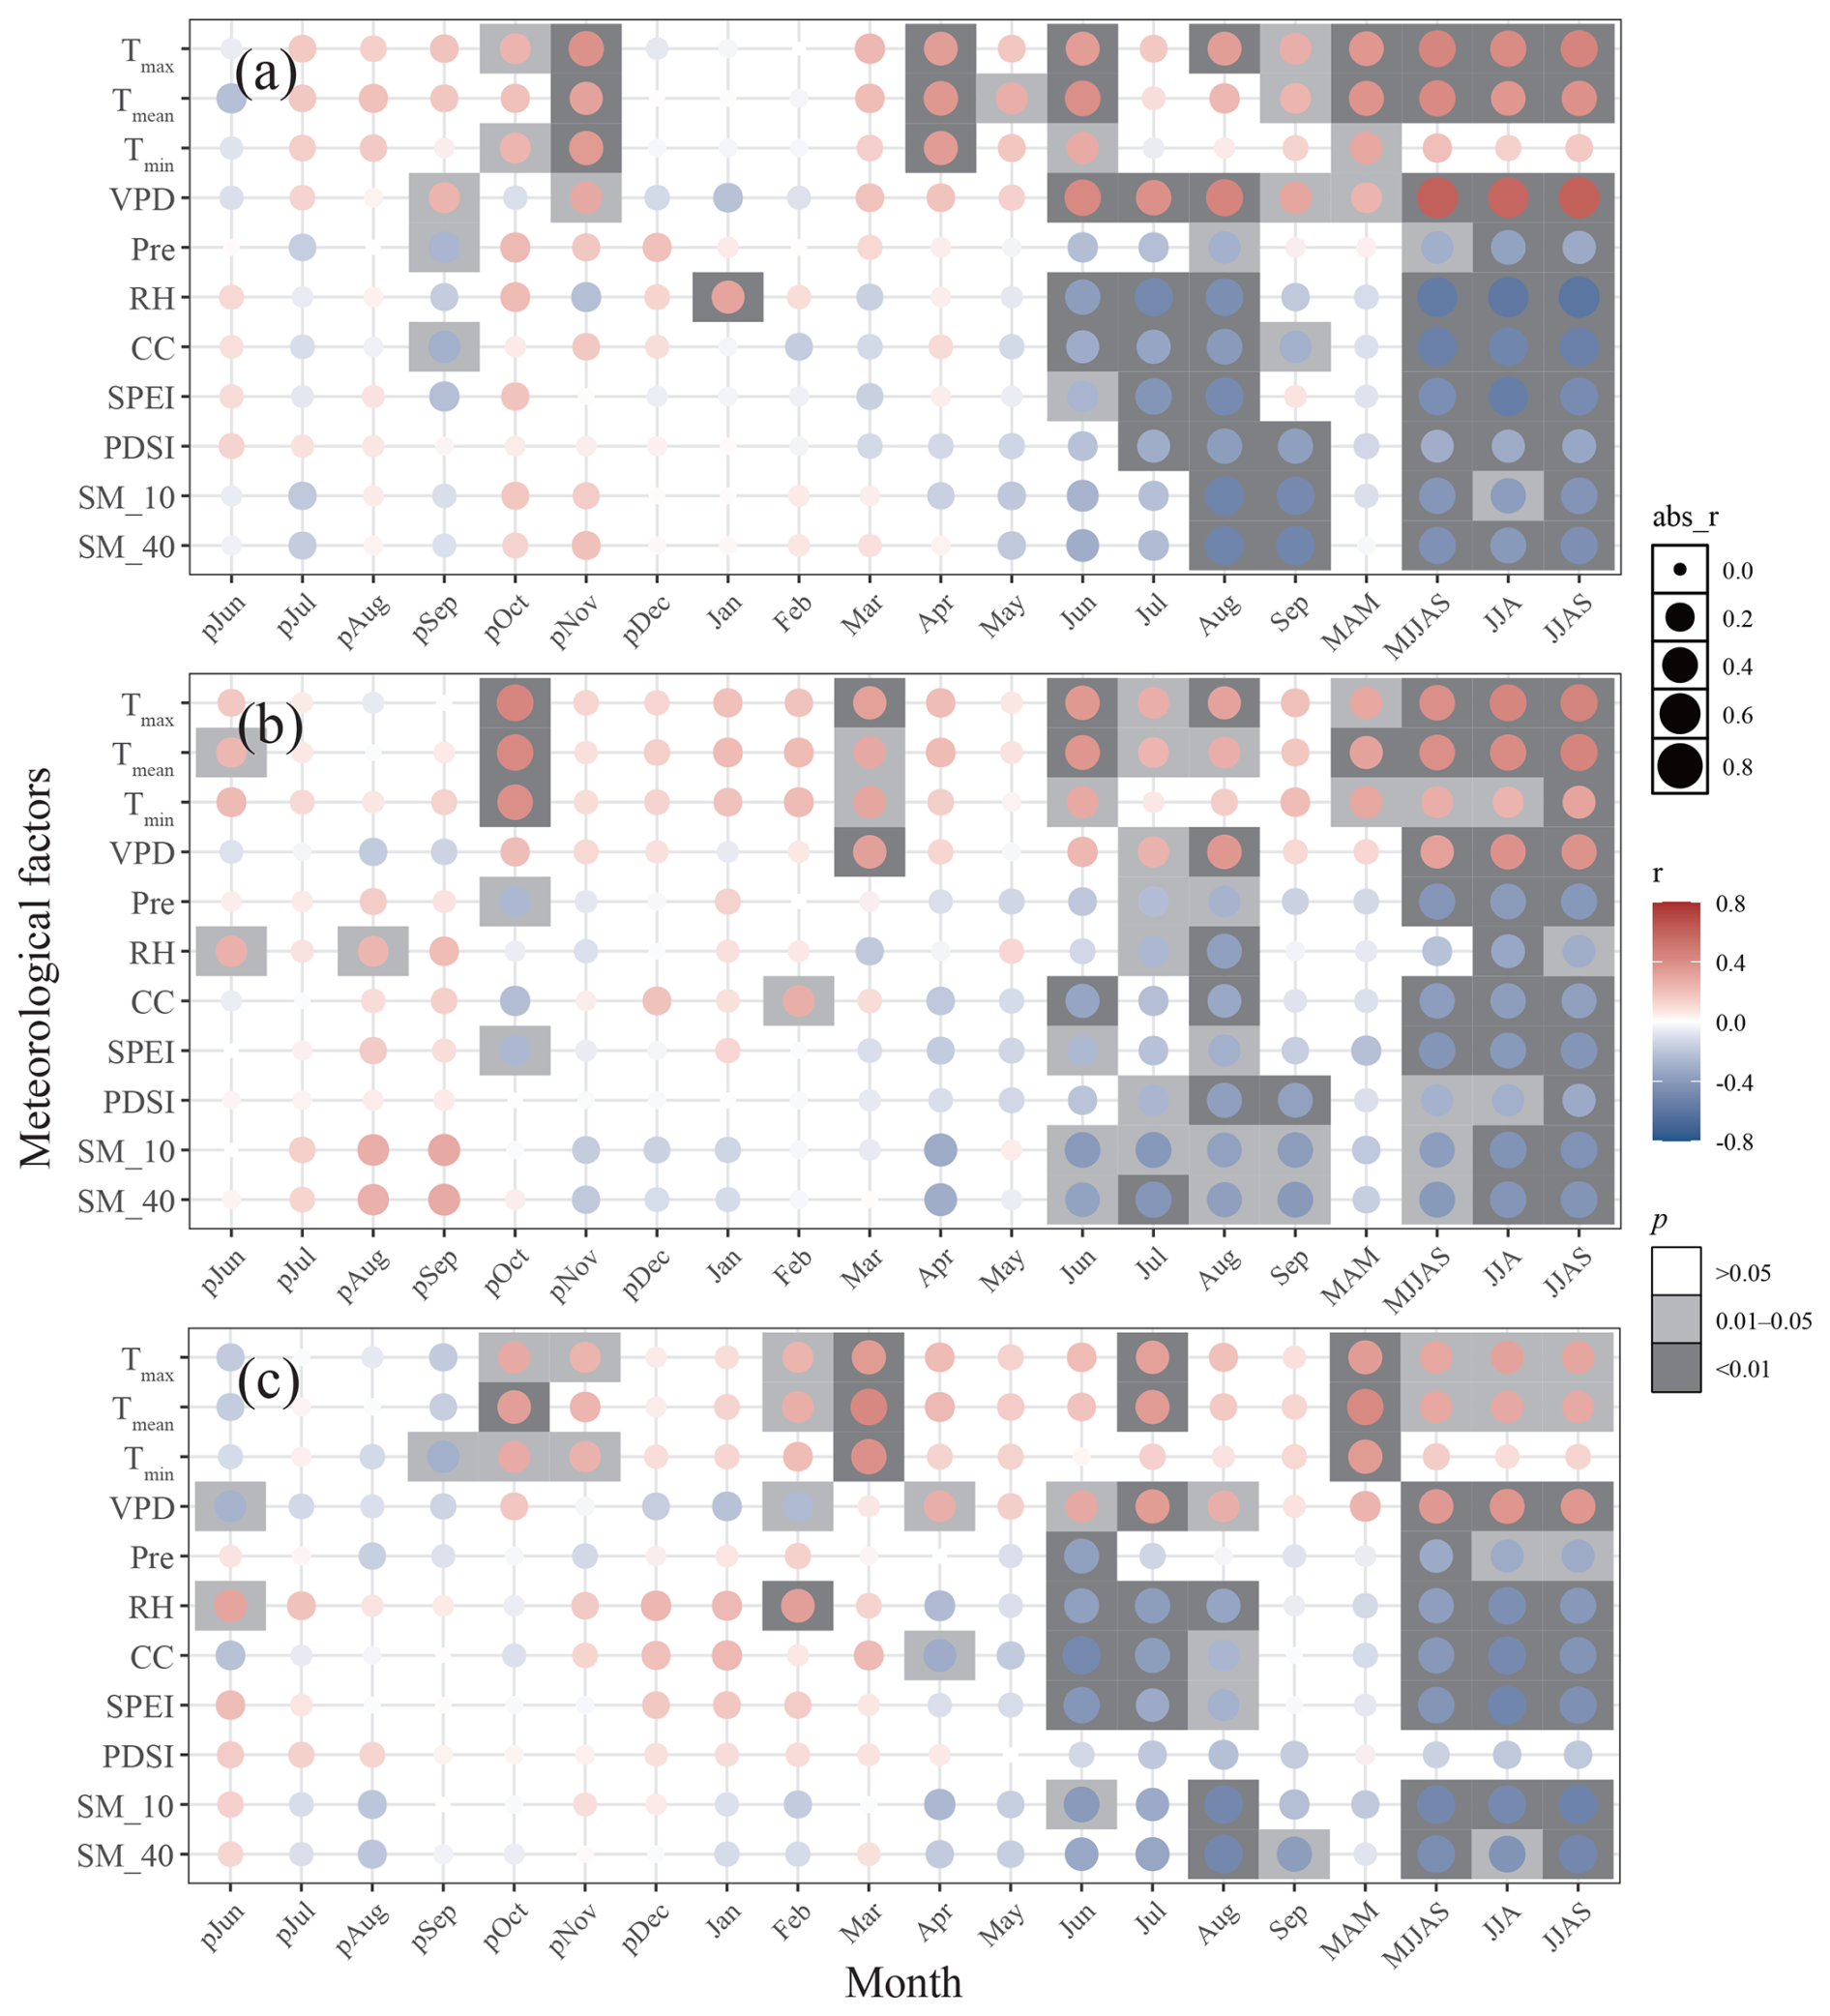
Figure 3Correlations between δ18OTRC and meteorological factors for the northern (a), central (b), and southern (c) sites in the East European Plain. The time periods are 1950–2021 (north), 1950–2020 (central), and 1950–2014 (south), except for SPEI (1950–2018) at the northern and central sites and SM (1982 to the end year of each chronology) at all sites. Tmean and precipitation were obtained from meteorological stations, except that precipitation at the central site was taken from the CRU TS 4.08 dataset.
Overall, correlation analyses between δ18OTRC and local climate factors indicate that all three sites consistently capture hydroclimatic variability. Results based on first-differenced chronologies further support these patterns (Fig. S3). Correlation strengths at the northern site changed little after differencing, whereas correlations with moisture-related indices become stronger at the central and southern sites, indicating that the interannual correspondence between δ18OTRC and hydroclimate becomes clearer once low-frequency variability is reduced (Fig. S3). Notably, at the northern site, the original four-tree and expanded seven-tree chronologies also showed broadly consistent climate-response patterns, particularly for summer hydroclimatic variables (Fig. S2b, c).
In addition to the moisture signal, δ18OTRC at all three sites also exhibits significant temperature responses. The central site shows the strongest summer temperature signal, with δ18OTRC correlated with June–September Tmax (r = 0.45, p < 0.01, n = 71) (Fig. 3), and this relationship remains nearly unchanged when using first-differenced series (Fig. S3). Notably, the temperature influence is not confined to summer, but extends into the previous cold season and the current spring. Further analyses show stronger correlations between δ18OTRC and broader seasonal temperature windows: the northern site correlates with March–September Tmax (r = 0.50), while the central and southern sites correlate with mean temperature from the previous October to the current September (both r = 0.48), exceeding the strength of summer-only temperature signals.
Source-water signals in the three δ18OTRC chronologies are shown in Fig. 4. At all sites, δ18OTRC showed its strongest correlations with δ18Op in early summer (June–July), with r = 0.47, 0.68, and 0.42 from north to south (p < 0.01; Fig. 4). Following first-order differencing, these correlations changed only slightly (Fig. S4). At the northern site, δ18OTRC was also positively correlated with δ18Op in January and March of the current year. At the central site, δ18Op in the previous September, October, and December, as well as in January and May of the current year, was positively associated with δ18OTRC. In contrast, at the southern site, δ18Op outside June–July showed no significant relationship with δ18OTRC.
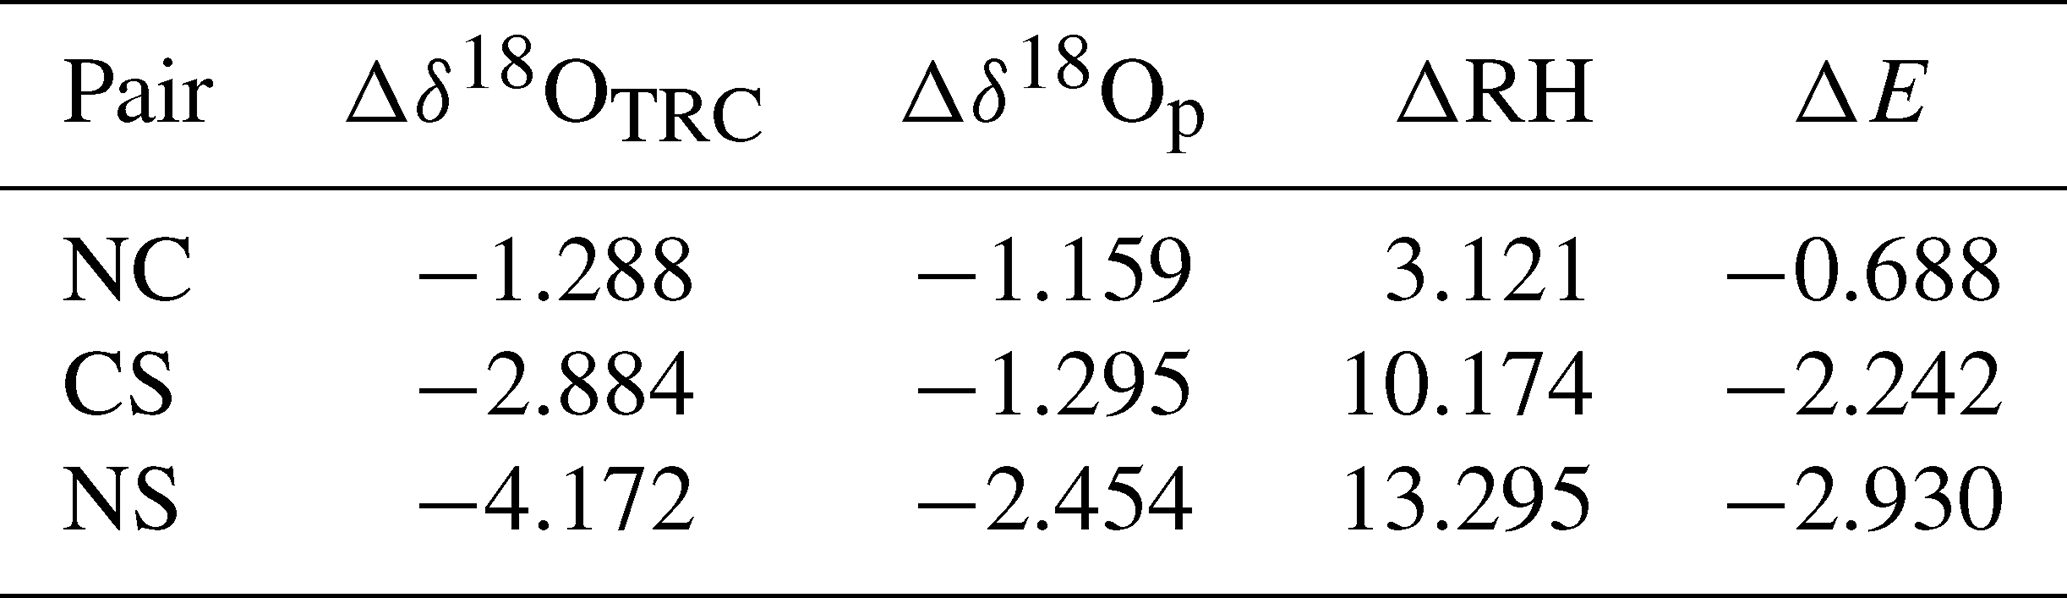
For the spatial difference between the northern and central sites (NC), the δ18OTRC difference is −1.288 ‰. In this case, Δδ18Op (−1.159 ‰) is larger than the difference in the enrichment term (−0.688 ‰), indicating that source-water isotopic differences dominate the NC δ18OTRC spatial offset (Table 2). In contrast, the δ18OTRC difference between the central and southern sites (CS) is −2.884 ‰, and the enrichment-term difference (−2.242 ‰) exceeds Δδ18Op (−1.295 ‰). Together with the larger RH difference (ΔRH = 10.174 %), this suggests that stronger evaporative enrichment is the primary driver of the δ18OTRC offset between the Central and Southern sites (Table 2). The overall difference between the δ18OTRC from northern and southern sites (NS) is −4.172 ‰, with comparable magnitudes for Δδ18Op (−2.454 ‰) and the enrichment term (−2.930 ‰) (Table 2). Estimates based on observed δ18Op also support this pattern, showing a consistent north–south gradient (Table S7).
Table 2Pairwise differences (Δ) in δ18OTRC, modeled δ18Op, RH, and the RH-driven enrichment term (May–September mean, 1958–2013; NC = North–Central, CS = Central–Southern, NS = North–Southern).
3.3 Spatial correlations of δ18OTRC with hydroclimate and δ18Op
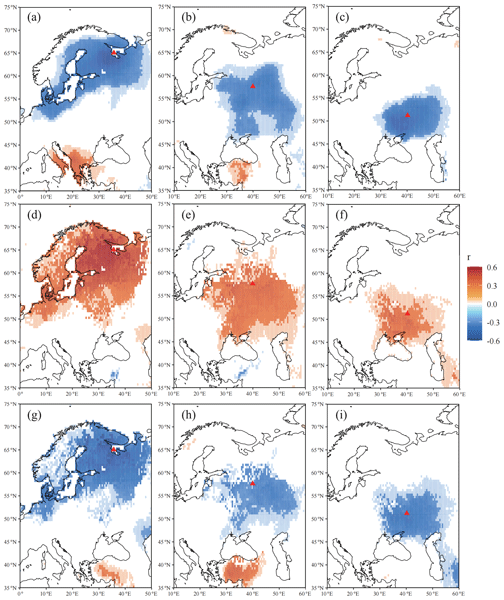
Spatial correlation analyses based on gridded hydroclimate metrics (SPEI, VPD, and RH) indicate that δ18OTRC at all three sites exhibited a consistent response to regional summer moisture conditions: it shows significant positive correlations with June–August VPD over broad areas, but significant negative correlations with RH and SPEI (Fig. 5). At the northern site, the strongest correlations formed a spatially coherent significant region over the White Sea area and adjacent northern Europe (Fig. 5a, d, g). The central site showed a similar but weaker pattern, with significant regions mainly covering the central East European Plain and extending eastward (Fig. 5b, e, h). At the southern site, significant regions were primarily distributed over the southern East European Plain (Fig. 5c, f, i). In addition, spatial correlations with ECHAM5-wiso–simulated δ18Op further suggested a coherent source-water isotopic imprint in δ18OTRC (Fig. S5). Overall, δ18OTRC reflected both regional summer hydroclimate and δ18Op variability, with broadly consistent spatial patterns across sites but differing strengths.

Figure 5Spatial correlations between δ18OTRC and summer (June–August) hydroclimate variables: SPEI (a–c), VPD (d–f), and RH (g–i). Columns correspond to the northern (a, d, g), central (b, e, h), and southern (c, f, i) sites in the East European Plain; the corresponding year ranges are provided in the figure legend for Fig. 3.
3.4 Climate responses of tree-ring width
The climatic sensitivity of TRW differs markedly among the three sites (Fig. 6). Because the SM record is relatively short, we do not use it as the primary basis for identifying dominant controls, although its correlations are significant. TRW at the northern and southern sites shows significant summer hydroclimate sensitivity, with the strongest relationships in both cases occurring for PDSI (north: July, r = 0.36; south: June–September, r = 0.54; Fig. 6a, c). By contrast, TRW at the central site shows little evidence of a stable moisture response (Fig. 6b). TRW at all three sites is also significantly sensitive to temperature, but the optimal response window shifts earlier toward lower latitudes: the northern site responds mainly to midsummer (July–August) temperature, the central site to early spring (March–April), and the southern site to late winter–early spring (January–March) (Fig. 6). Overall, the climatic responses of TRW exhibit clear regional differentiation: temperature and moisture signals are of comparable strength at the northern site, the central site is dominated by temperature, and the southern site is primarily controlled by moisture conditions.

Figure 6Correlations between TRW and meteorological factors for the northern (a), central (b), and southern (c) sites in the East European Plain. Time periods and meteorological data sources are the same as in Fig. 3, except that the northern TRW chronology spans 1950–2016. Numbers shown in the figure indicate correlations significant at p < 0.05.
4.1 Spatial latitudinal gradient of δ18OTRC across the East European Plain
δ18Op and RH-regulated leaf-water evaporative enrichment jointly control spatial variations in δ18OTRC (Roden et al., 2000). Across the East European Plain, δ18Op shows higher values in the south than in the northern region (Fig. S6), whereas regional RH exhibits a wetter north–drier south gradient (Fig. 1). These large-scale gradients are broadly consistent with the southward increase in δ18OTRC across the region (Table 1; Fig. 2). Further analyses indicate that the dominant controlling factors on the spatial variability of δ18OTRC are different between the NC and CS site pairs.
For the NC pair, the between-site difference in δ18Op is clearly larger than the corresponding difference in RH-driven evaporative enrichment (Table 2), indicating that δ18Op is the primary driver. This pattern is expected because δ18OTRC partly reflects the isotopic composition of source water via soil-water uptake and therefore often covaries positively with δ18Op (Saurer et al., 2000). In mid- to high-latitude regions, the “amount effect” is generally weak, whereas temperature often exerts a dominant control on δ18Op (Krklec et al., 2018; Rozanski et al., 1992). At higher latitudes, lower condensation temperatures and stronger isotopic fractionation, together with progressive rainout during poleward transport, deplete 18O in the remaining vapor and result in lower δ18Op values (Dansgaard, 1953; Gat, 1996). Global observations support this mechanism, showing an average decrease of ∼ 0.5 ‰ per 1° increase in latitude (Rozanski et al., 1992). In addition, the RH difference between the northern and central sites is relatively small (Figs. 1; S6), resulting in a relatively limited between-site contrast in evaporative enrichment. Together, these mechanisms explain why source-water isotopes dominate spatial difference in δ18OTRC between the NC sites.
For the CS pair, the RH contrast is much larger than that in the NC pair (Figs. 1; S6). Consistently, the between-site difference in RH-driven evaporative enrichment exceeds the corresponding difference in δ18Op (Table 2), indicating that drier southern conditions enhance evaporative enrichment and contribute more to Δδ18OTRC. Lower RH strengthens the leaf-to-atmosphere evaporative gradient, increasing 18O enrichment in leaf water and its transfer to cellulose (Roden et al., 2000). A modeling study further indicates that spatial variation in leaf-water evaporative enrichment is closely linked to atmospheric humidity, with drier conditions favoring greater 18O enrichment (Keel et al., 2016). Similar humidity-driven patterns have been reported elsewhere, for example along a north–south gradient in the tropical Andes, where δ18OTRC increases toward drier southern sites (Álvarez et al., 2024).
Comparable large-scale latitudinal patterns in δ18OTRC has also been documented in other regions, including the European tree-ring δ18O network (Balting et al., 2021), the Asian tree-ring δ18O network (Huang et al., 2025; Xu et al., 2021, 2024), and eastern Anatolia (Mutlu et al., 2012). Across Europe, spatial variability in tree-ring δ18O has been attributed to the combined effects of latitude, elevation, and continentality (Balting et al., 2021; Mutlu et al., 2012). Across Asia, the tripolar pattern in tree-ring δ18O primarily reflects the latitudinal structure of δ18Op, with RH-controlled enrichment acting as a key modulator, particularly in mid-latitudes (Huang et al., 2025; Xu et al., 2024). Similar to patterns reported in Asian, spatial variability in the East European Plain reflects a dual control: the mid- to high-latitude NC pair is dominated by δ18Op, whereas the mid-latitude CS pair is driven primarily by RH-controlled enrichment. Together, these mechanisms produce a south-to-north decrease in δ18OTRC across the region.
4.2 Interannual climatic implications of δ18OTRC in the East European Plain
Based on the mechanistic framework of cellulose δ18O, δ18OTRC integrates both δ18Op and evaporative enrichment of leaf water (McCarroll and Loader, 2004; Roden et al., 2000). Across the three sites, δ18OTRC records a coherent interannual signal during the growing season and summer: values tend to increase under higher evaporative demand and more enriched δ18Op, and decrease under more humid conditions (Figs. 3; S3).
On the source-water side, interannual variability in source-water δ18O is linked to temperature- and precipitation-related processes (Dansgaard, 1964; Rozanski et al., 1992). Higher temperature and VPD can enhance soil evaporation and enrich near-surface soil water, whereas higher precipitation and SM tend to reduce evaporative enrichment and δ18Os. In parallel, the strong linkages of δ18OTRC with moisture indicate leaf-water evaporative enrichment as a key control (McCarroll and Loader, 2004; Roden et al., 2000), because root uptake involves negligible isotopic fractionation (Dawson and Ehleringer, 1991). Lower RH (higher VPD) enhances leaf-water 18O enrichment and its transfer to cellulose (McCarroll and Loader, 2004; Roden et al., 2000); CC likely reflects coupled radiative–humidity effects on enrichment (Wang et al., 2022). Finally, SPEI and PDSI integrate precipitation supply and evaporative demand (Dai et al., 2004; Vicente-Serrano et al., 2010b), which is consistent with their coherent relationships with δ18OTRC as integrated indicators of hydroclimate (Xu et al., 2013a).
Despite the overall similarity in response patterns, the dominant controls on interannual δ18OTRC variability differ among sites. The central site exhibits both a pronounced source-water isotopic imprint and a leaf-water enrichment signal (Figs. 3–4; S3). Significant correlations between δ18OTRC and δ18Op in both the original and first-differenced series indicate that interannual anomalies in source-water δ18O are effectively transmitted into cellulose. Together with the relatively larger interannual variability in δ18Op and smaller variability in RH (Fig. S6), this suggests that the source-water signal is more readily expressed statistically. By contrast, correlations with humidity-related metrics become markedly stronger after differencing, indicating that low-frequency variability partly obscures the interannual hydroclimate signal (Fig. S3). The weaker humidity signal in the original series may reflect the urban forest-park setting of the central site, where canopy buffering and local anthropogenic influences can decouple near-canopy humidity from the broader gridded macroclimatic background at low frequencies (De Frenne et al., 2019; Zellweger et al., 2020). In addition, the strong Tmax response changes little after differencing, implying that it is not solely trend-driven and may partly reflect temperature-related modulation of regional δ18Op and associated processes (Field et al., 2022; Leland et al., 2023).
In contrast, humidity signals are more pronounced at the northern and southern sites, although the underlying mechanisms differ. The northern δ18OTRC chronology shows a stable VPD signal (Figs. 3; S3; S7). The Solovetsky Islands lie in a cold and moist high-latitude environment (Fig. 1), where tree growth is more strongly temperature-limited. Under such conditions, warming tends to increase atmospheric evaporative demand (Zharkov et al., 2021), allowing evaporative-demand–driven leaf-water enrichment to exert a stable control on interannual δ18OTRC variability. Similarly, studies from high-latitude northern Europe have reported clear summer VPD signals in δ18OTRC and have used δ18OTRC networks to reconstruct regional-scale VPD (Treydte et al., 2024). By comparison, the southern site is characterized by a drier climatic background with lower RH (Figs. 1; S6), and δ18OTRC shows its strongest relationship with SPEI, consistent with evaporative enrichment being jointly constrained by moisture supply and atmospheric demand. Numerous SPEI reconstructions based on δ18OTRC have also been reported for mid-latitude Europe (An et al., 2023; Freund et al., 2023; Labuhn et al., 2016).
Together, these results highlight the potential of δ18OTRC for hydroclimate reconstructions in the East European Plain. The northern δ18OTRC chronology exhibits a strong and stable growing-season VPD signal (Figs. 3; S3; S7), indicating particularly strong potential for high-latitude hydroclimate reconstruction. Meanwhile, the significant coherence among chronologies from nearby sites (Fig. 2e), together with the common sensitivity of the three chronologies to regional summer hydroclimate (Fig. 5), underscores the potential of δ18OTRC for reconstructing regional-scale hydroclimate variability and supports expanding site coverage to improve the spatial representativeness of future reconstructions. However, the low replication and EPS values of 0.84 at the central and southern sites introduce uncertainty in chronology representativeness and should be considered when evaluating their regional applicability and reconstruction potential.
4.3 Compared with TRW, δ18OTRC provides additional information
Moisture signals in TRW at the northern and central sites are markedly weaker than those in δ18OTRC (Figs. 3; 6). This contrast is consistent with the growth limitation commonly observed at mid- to high latitudes, where TRW north of approximately 50–60° N is often primarily constrained by summer temperature and is therefore better suited for temperature reconstructions (Dolgova et al., 2022; Solomina and Matskovsky, 2021). By contrast, δ18OTRC reflects both source-water isotope composition and leaf-water evaporative enrichment, allowing it to retain sensitivity to atmospheric humidity and evaporative demand even when radial growth is not strongly moisture-limited (McCarroll and Loader, 2004; Roden et al., 2000). Thus, in relatively humid, temperature-limited mid- to high-latitude settings, δ18OTRC may outperform TRW in characterizing hydroclimate variability.
At the drier southern site, the strongest correlation between TRW and PDSI is comparable in magnitude to the strongest correlation between δ18OTRC and SPEI (Figs. 3; 6). In addition, relative to other humidity metrics, δ18OTRC shows weaker associations with PDSI in both the original and first-differenced series, whereas TRW mainly reflects PDSI and SM signals (Fig. 6). Because PDSI is widely used to represent drought severity and persistence and is closely related to soil-moisture conditions (Dai et al., 2004), this suggests that under stronger moisture limitation, TRW more directly tracks soil-moisture constraints on radial growth. By contrast, SPEI integrates precipitation supply and potential evapotranspiration and therefore better represents moisture conditions shaped jointly by water supply and atmospheric demand (Vicente-Serrano et al., 2010a). Accordingly, at the drier southern site, TRW tends to preferentially capture soil-moisture variability, whereas δ18OTRC is more likely to integrate both source-water signals and evaporative enrichment processes.
The contrasting climate responses of δ18OTRC and TRW observed in this study indicate that different tree-ring proxies record complementary climatic information. Previous studies have shown that, in temperature-limited environments, maximum latewood density (MXD) and some quantitative wood-anatomical traits generally exhibit stronger warm-season temperature signals than TRW and have been widely used to reconstruct warm-season temperature variability (Björklund et al., 2019, 2023). By contrast, stable carbon and oxygen isotopes can provide complementary information on tree physiological responses and hydroclimatic processes (McCarroll and Loader, 2004). Therefore, future multiproxy studies combining TRW, MXD, quantitative wood anatomy, and stable carbon and oxygen isotopes across the East European Plain could help more effectively disentangle regional temperature and moisture signals.
We established three δ18OTRC chronologies of Scots pine over the East European Plain. We found a clear latitudinal gradient, with lower δ18OTRC values in the north and higher values in the south. Across sites, δ18OTRC shows broadly similar response patterns to growing-season and summer climate variables, as well as to δ18Op, although the dominant controls and response strengths differ among sites. The δ18OTRC chronologies at three sites record a coherent signal of regional summer hydroclimate variability, but the northern chronology shows the strongest and most stable climate response, indicating the greatest reconstruction potential. In addition, comparison with TRW suggests that δ18OTRC may be the more suitable hydroclimate proxy in temperature-limited environments, whereas in drier, moisture-limited settings TRW more directly reflects soil-moisture constraints on radial growth, while δ18OTRC more likely integrates source-water isotopic signals and evaporative enrichment processes. Overall, our study demonstrates that δ18OTRC contains valuable information on the spatiotemporal patterns of hydroclimate variability across the East European Plain and highlights its potential for future hydroclimate reconstruction.
The raw data supporting the conclusions of this article will be made available by the corresponding author Chenxi Xu (cxxu@mail.iggcas.ac.cn). The ECHAM5-wiso simulation data used in this study are publicly available from PANGAEA at https://doi.org/10.1594/PANGAEA.902347 (Werner, 2019).
The supplement related to this article is available online at https://doi.org/10.5194/cp-22-2015-2026-supplement.
CX, WA, and VM conceived the study. QL performed the data analysis and prepared the original draft with contributions from CX, WA, RH, and YZ. CX and ZG acquired funding for this study. OS, VM, and ED collected the samples and provided the tree-ring width data. All authors contributed to the interpretation of the results, critically reviewed and edited the final manuscript, and approved the submitted version.
The contact author has declared that none of the authors has any competing interests.
Publisher's note: Copernicus Publications remains neutral with regard to jurisdictional claims made in the text, published maps, institutional affiliations, or any other geographical representation in this paper. The authors bear the ultimate responsibility for providing appropriate place names. Views expressed in the text are those of the authors and do not necessarily reflect the views of the publisher.
We are grateful to Qingyu Zhao, Sainan Liu, and Yao Li for providing relevant references and helpful suggestions during figure preparation and manuscript preparation.
This study is supported by the International Partnership program of the Chinese Academy of Sciences (grant no. 170GJHZ2023074GC), National Key Research and Development Program of China (grant no. 2024YFF0807902), the Second Tibetan Plateau Scientific Expedition and Research (STEP) program (2024QZKK0301).
This paper was edited by Mary Gagen and reviewed by two anonymous referees.
Allen, R. G., Pereira, L. S., Raes, D., and Smith, M.: Crop evapotranspiration – Guidelines for computing crop water requirements, FAO Irrigation and Drainage Paper 56, FAO, Rome, ISBN 92-5-104219-5, 1998.
Allison, G. B., Gat, J. R., and Leaney, F. W. J.: The relationship between deuterium and oxygen-18 delta values in leaf water, Chemical Geology: Isotope Geoscience section, 58, 145–156, https://doi.org/10.1016/0168-9622(85)90035-1, 1985.
Álvarez, C., Christie, D. A., González-Reyes, Á., Veblen, T. T., Helle, G., LeQuesne, C., Rodriguez-Caton, M., Szejner, P., Flores-Sáez, F., Gipoulou-Zúñiga, T., Suazo-Álvarez, M., Muñoz-Salazar, T., Aliste, D., Morales, M. S., Muñoz, A., and Villalba, R.: Hydroclimate variability in the Tropical Andes recorded by δ18O isotopes from a new network of Polylepis tarapacana tree-rings, Global Planet. Change, 239, 104503, https://doi.org/10.1016/j.gloplacha.2024.104503, 2024.
An, W., Xu, C., Marković, S. B., Sun, S., Sun, Y., Gavrilov, M. B., Govedar, Z., Hao, Q., and Guo, Z.: Anthropogenic warming has exacerbated droughts in southern Europe since the 1850s, Communications Earth & Environment, 4, 232, https://doi.org/10.1038/s43247-023-00907-1, 2023.
Arosio, T., Leuenberger, M., Nicolussi, K., Esper, J., Krusic, P. J., Bebchuk, T., Tegel, W., Hafner, A., Kirdyanov, A., Schlüchter, C., Reinig, F., Muschitiello, F., and Büntgen, U.: Tree-ring stable isotopes from the European Alps reveal long-term summer drying over the Holocene, Sci. Adv., 11, eadr4161, https://doi.org/10.1126/sciadv.adr4161, 2025.
Balting, D. F., Ionita, M., Wegmann, M., Helle, G., Schleser, G. H., Rimbu, N., Freund, M. B., Heinrich, I., Caldarescu, D., and Lohmann, G.: Large-scale climate signals of a European oxygen isotope network from tree rings, Clim. Past, 17, 1005–1023, https://doi.org/10.5194/cp-17-1005-2021, 2021.
Barbour, M. M.: Stable oxygen isotope composition of plant tissue: a review, Funct. Plant Biol., 34, 83–94, https://doi.org/10.1071/FP06228, 2007.
Björklund, J., von Arx, G., Nievergelt, D., Wilson, R., Van den Bulcke, J., Günther, B., Loader, N. J., Rydval, M., Fonti, P., Scharnweber, T., Andreu-Hayles, L., Büntgen, U., D'Arrigo, R., Davi, N., De Mil, T., Esper, J., Gärtner, H., Geary, J., Gunnarson, B. E., Hartl, C., Hevia, A., Song, H., Janecka, K., Kaczka, R. J., Kirdyanov, A. V., Kochbeck, M., Liu, Y., Meko, M., Mundo, I., Nicolussi, K., Oelkers, R., Pichler, T., Sánchez-Salguero, R., Schneider, L., Schweingruber, F., Timonen, M., Trouet, V., Van Acker, J., Verstege, A., Villalba, R., Wilmking, M., and Frank, D.: Scientific Merits and Analytical Challenges of Tree-Ring Densitometry, Rev. Geophys., 57, 1224–1264, https://doi.org/10.1029/2019RG000642, 2019.
Björklund, J., Seftigen, K., Stoffel, M., Fonti, M. V., Kottlow, S., Frank, D. C., Esper, J., Fonti, P., Goosse, H., Grudd, H., Gunnarson, B. E., Nievergelt, D., Pellizzari, E., Carrer, M., and von Arx, G.: Fennoscandian tree-ring anatomy shows a warmer modern than medieval climate, Nature, 620, 97–103, https://doi.org/10.1038/s41586-023-06176-4, 2023.
Cook, E. R., Solomina, O., Matskovsky, V., Cook, B. I., Agafonov, L., Berdnikova, A., Dolgova, E., Karpukhin, A., Knysh, N., Kulakova, M., Kuznetsova, V., Kyncl, T., Kyncl, J., Maximova, O., Panyushkina, I., Seim, A., Tishin, D., Ważny, T., and Yermokhin, M.: The European Russia Drought Atlas (1400–2016 CE), Clim. Dynam., 54, 2317–2335, https://doi.org/10.1007/s00382-019-05115-2, 2020.
Dai, A., Trenberth, K. E., and Qian, T.: A Global Dataset of Palmer Drought Severity Index for 1870–2002: Relationship with Soil Moisture and Effects of Surface Warming, J. Hydrometeorol., 5, 1117–1130, https://doi.org/10.1175/JHM-386.1, 2004.
Dansgaard, W.: The Abundance of O18 in Atmospheric Water and Water Vapour, Tellus, 5, 461–469, https://doi.org/10.1111/j.2153-3490.1953.tb01076.x, 1953.
Dansgaard, W.: Stable isotopes in precipitation, Tellus, 16, 436–468, https://doi.org/10.1111/j.2153-3490.1964.tb00181.x, 1964.
Dawson, T. E. and Ehleringer, J. R.: Streamside trees that do not use stream water, Nature, 350, 335–337, https://doi.org/10.1038/350335a0, 1991.
De Frenne, P., Zellweger, F., Rodríguez-Sánchez, F., Scheffers, B. R., Hylander, K., Luoto, M., Vellend, M., Verheyen, K., and Lenoir, J.: Global buffering of temperatures under forest canopies, Nature Ecology & Evolution, 3, 744–749, https://doi.org/10.1038/s41559-019-0842-1, 2019.
Dolgova, E. A., Solomina, O. N., Matskovsky, V. V., Cherenkova, E. A., and Semenyak, N. S.: Climate signal strength in tree-ring width of spruce growing in the Solovetsky Islands (Russia), Dendrochronologia, 76, 126012, https://doi.org/10.1016/j.dendro.2022.126012, 2022.
Field, R. D., Andreu-Hayles, L., D'Arrigo, R. D., Oelkers, R., Luckman, B. H., Morimoto, D., Boucher, E., Gennaretti, F., Hermoso, I., Lavergne, A., and Levesque, M.: Tree-ring cellulose δ18O records similar large-scale climate influences as precipitation δ18O in the Northwest Territories of Canada, Clim. Dynam., 58, 759–776, https://doi.org/10.1007/s00382-021-05932-4, 2022.
Freund, M. B., Helle, G., Balting, D. F., Ballis, N., Schleser, G. H., and Cubasch, U.: European tree-ring isotopes indicate unusual recent hydroclimate, Communications Earth & Environment, 4, 26, https://doi.org/10.1038/s43247-022-00648-7, 2023.
Gat, J. R.: Oxygen and hydrogen isotopes in the hydrologic cycle, Annu. Rev. Earth Pl. Sc., 24, 225–262, https://doi.org/10.1146/annurev.earth.24.1.225, 1996.
Harris, I., Osborn, T. J., Jones, P., and Lister, D.: Version 4 of the CRU TS monthly high-resolution gridded multivariate climate dataset, Sci. Data, 7, 109, https://doi.org/10.1038/s41597-020-0453-3, 2020.
Haupt, M., Weigl, M., Grabner, M., and Boettger, T.: A 400-year reconstruction of July relative air humidity for the Vienna region (eastern Austria) based on carbon and oxygen stable isotope ratios in tree-ring latewood cellulose of oaks (Quercus petraea Matt. Liebl.), Climatic Change, 105, 243–262, https://doi.org/10.1007/s10584-010-9862-1, 2011.
Holmes, R. L.: Computer-assisted quality control in tree-ring dating and measurement, Tree-Ring Bulletin, 43, 69–78, 1983.
Huang, R., Xu, C., An, W., Zhao, Q., Zhao, Y., Liu, Y., Grießinger, J., Meier, W. J.-H., and Guo, Z.: Asian continental isoscapes of tree-ring δ18O: implications for paleoclimate and paleoenvironment, Natl. Sci. Rev., 12, nwaf481, https://doi.org/10.1093/nsr/nwaf481, 2025.
Hughes, M. K., Olchev, A., Bunn, A. G., Berner, L. T., Losleben, M., and Novenko, E.: Different climate responses of spruce and pine growth in Northern European Russia, Dendrochronologia, 56, 125601, https://doi.org/10.1016/j.dendro.2019.05.005, 2019.
Keel, S. G., Joos, F., Spahni, R., Saurer, M., Weigt, R. B., and Klesse, S.: Simulating oxygen isotope ratios in tree ring cellulose using a dynamic global vegetation model, Biogeosciences, 13, 3869–3886, https://doi.org/10.5194/bg-13-3869-2016, 2016.
Klimenko, V. and Solomina, O.: Climatic Variations in the East European Plain During the Last Millennium: State of the Art, in: The Polish Climate in the European Context: An Historical Overview, edited by: Przybylak, R., Springer Netherlands, Dordrecht, 71–101, https://doi.org/10.1007/978-90-481-3167-9_3, 2010.
Krklec, K., Domínguez-Villar, D., and Lojen, S.: The impact of moisture sources on the oxygen isotope composition of precipitation at a continental site in central Europe, J. Hydrol., 561, 810–821, https://doi.org/10.1016/j.jhydrol.2018.04.045, 2018.
Kuznetsova, V. V. and Solomina, O. N.: Contrasting climate signals across a Scots pine (Pinus sylvestris L.) tree-ring network in the Middle Volga (European Russia), Dendrochronologia, 73, 125957, https://doi.org/10.1016/j.dendro.2022.125957, 2022.
Labuhn, I., Daux, V., Girardclos, O., Stievenard, M., Pierre, M., and Masson-Delmotte, V.: French summer droughts since 1326 CE: a reconstruction based on tree ring cellulose δ18O, Clim. Past, 12, 1101–1117, https://doi.org/10.5194/cp-12-1101-2016, 2016.
Lange, J., Buras, A., Cruz-García, R., Gurskaya, M., Jalkanen, R., Kukarskih, V., Seo, J.-W., and Wilmking, M.: Climate Regimes Override Micro-Site Effects on the Summer Temperature Signal of Scots Pine at Its Northern Distribution Limits, Front. Plant Sci., 9, 1597, https://doi.org/10.3389/fpls.2018.01597, 2018.
Langebroek, P. M., Werner, M., and Lohmann, G.: Climate information imprinted in oxygen-isotopic composition of precipitation in Europe, Earth Planet. Sc. Lett., 311, 144–154, https://doi.org/10.1016/j.epsl.2011.08.049, 2011.
Leland, C., Andreu-Hayles, L., Cook, E. R., Anchukaitis, K. J., Byambasuren, O., Davi, N., Hessl, A., Martin-Benito, D., Nachin, B., and Pederson, N.: Impacts of climate and tree morphology on tree-ring stable isotopes in central Mongolia, Tree Physiol., 43, 539–555, https://doi.org/10.1093/treephys/tpac142, 2023.
Liu, Y., Wang, L., Zhou, W., and Chen, W.: Three Eurasian teleconnection patterns: spatial structures, temporal variability, and associated winter climate anomalies, Clim. Dynam., 42, 2817–2839, https://doi.org/10.1007/s00382-014-2163-z, 2014.
Loader, N. J., Robertson, I., Barker, A. C., Switsur, V. R., and Waterhouse, J. S.: An improved technique for the batch processing of small wholewood samples to α-cellulose, Chem. Geol., 136, 313–317, https://doi.org/10.1016/S0009-2541(96)00133-7, 1997.
Matskovsky, V.: Climatic signal in tree-ring width chronologies of conifers in European Russia, Int. J. Climatol., 36, 3398–3406, https://doi.org/10.1002/joc.4563, 2016.
Matskovsky, V., Dolgova, E., Lomakin, N., and Matveev, S.: Dendroclimatology and historical climatology of Voronezh region, European Russia, since 1790s, Int. J. Climatol., 37, 3057–3066, https://doi.org/10.1002/joc.4896, 2017.
Matskovsky, V. V., Kuznetsova, V. V., Semenyak, N. S., Turchinskaya, S. M., Zazovskaya, E. P., Engovatova, A. V., Lazarev, A. S., Zhdanova, E. Yu., Dolgova, E. A., and Solomina, O. N.: Dendroclimatic potential of stable carbon isotopes in tree-ring cellulose of Pinus sylvestris L. in the Yaroslavl and Kostroma regions, Geomorfologiya i Paleogeografiya, 53, 74–82, https://doi.org/10.31857/S0435428122030099, 2022 (in Russian).
Matulewski, P., Buchwal, A., and Makohonienko, M.: Higher climatic sensitivity of Scots pine (Pinus sylvestris L.) subjected to tourist pressure on a hiking trail in the Brodnica Lakeland, NE Poland, Dendrochronologia, 54, 78–86, https://doi.org/10.1016/j.dendro.2019.02.008, 2019.
Matveev, S., Timashchuk, D., and Matskovsky, V.: The intensity of the climatic signal in the dynamics of the increment of Scots pine (Pinus silvestris L.) of the Khrenovskii forest (Voronezh region, Russia), IOP Conf. Ser.: Earth Environ. Sci., 226, 012017, https://doi.org/10.1088/1755-1315/226/1/012017, 2019.
Matveev, S., Tishin, D., Maximchuk, P., and Zhuravleva, I.: Seasonal radial growth dynamics of Scots pine (Pinus silvestris L.) in Voronezh region (Russia), IOP Conf. Ser.: Earth Environ. Sci., 595, 012044, https://doi.org/10.1088/1755-1315/595/1/012044, 2020.
Matveev, S. M., Chendev, Yu. G., Lupo, A. R., Hubbart, J. A., and Timashchuk, D. A.: Climatic Changes in the East-European Forest-Steppe and Effects on Scots Pine Productivity, Pure Appl. Geophys., 174, 427–443, https://doi.org/10.1007/s00024-016-1420-y, 2017.
McCarroll, D. and Loader, N. J.: Stable isotopes in tree rings, Quaternary Sci. Rev., 23, 771–801, https://doi.org/10.1016/j.quascirev.2003.06.017, 2004.
McNally, A., Arsenault, K., Kumar, S., Shukla, S., Peterson, P., Wang, S., Funk, C., Peters-Lidard, C. D., and Verdin, J. P.: A land data assimilation system for sub-Saharan Africa food and water security applications, Sci. Data, 4, 170012, https://doi.org/10.1038/sdata.2017.12, 2017.
Moberg, A., Jones, P. D., Lister, D., Walther, A., Brunet, M., Jacobeit, J., Alexander, L. V., Della-Marta, P. M., Luterbacher, J., Yiou, P., Chen, D., Klein Tank, A. M. G., Saladié, O., Sigró, J., Aguilar, E., Alexandersson, H., Almarza, C., Auer, I., Barriendos, M., Begert, M., Bergström, H., Böhm, R., Butler, C. J., Caesar, J., Drebs, A., Founda, D., Gerstengarbe, F., Micela, G., Maugeri, M., Österle, H., Pandzic, K., Petrakis, M., Srnec, L., Tolasz, R., Tuomenvirta, H., Werner, P. C., Linderholm, H., Philipp, A., Wanner, H., and Xoplaki, E.: Indices for daily temperature and precipitation extremes in Europe analyzed for the period 1901–2000, J. Geophys. Res.-Atmos., 111, D22106, https://doi.org/10.1029/2006JD007103, 2006.
Morozova, S. V., Denisov, K. E., Polyanskaya, E. A., Kondakov, K. S., Korotkova, N. V., and Gafurov, R. R.: Changes in the Atmospheric Circulation Regime in the Context of Global Climate Trends in the Atlantic-Eurasian Sector of the Northern Hemisphere, Geogr. Nat. Resour., 44, 191–197, https://doi.org/10.1134/S1875372823030083, 2023.
Mutlu, H., Köse, N., Akkemik, Ü., Aral, D., Kaya, A., Manning, S. W., Pearson, C. L., and Dalfes, N.: Environmental and climatic signals from stable isotopes in Anatolian tree rings, Turkey, Reg. Environ. Change, 12, 559–570, https://doi.org/10.1007/s10113-011-0273-2, 2012.
Nagavciuc, V., Michel, S. L. L., Balting, D. F., Helle, G., Freund, M., Schleser, G. H., Steger, D. N., Lohmann, G., and Ionita, M.: A past and present perspective on the European summer vapor pressure deficit, Clim. Past, 20, 573–595, https://doi.org/10.5194/cp-20-573-2024, 2024.
Panyushkina, I. P., Karpukhin, A. A., and Engovatova, A. V.: Moisture record of the Upper Volga catchment between AD 1430 and 1600 supported by a δ13C tree-ring chronology of archaeological pine timbers, Dendrochronologia, 39, 24–31, https://doi.org/10.1016/j.dendro.2016.02.002, 2016.
Rinne, K.: 400-year May-August Precipitation Reconstruction for England Using Stable Oxygen Isotope Ratios (δ18O) of Tree Rings, Quatern. Int., 279–280, 403–404, https://doi.org/10.1016/j.quaint.2012.08.1281, 2012.
Roden, J. S., Lin, G., and Ehleringer, J. R.: A mechanistic model for interpretation of hydrogen and oxygen isotope ratios in tree-ring cellulose, Geochim. Cosmochim. Ac., 64, 21–35, https://doi.org/10.1016/S0016-7037(99)00195-7, 2000.
Römer, P., Wieland, A., Torbenson, M. C. A., Reinig, F., Ziaco, E., Frigo, D., Greule, M., Urban, O., Čáslavský, J., Pernicová, N., Trnka, M., Carrer, M., Büntgen, U., Keppler, F., and Esper, J.: Covariance and climate signals among state-of-the-art tree-ring proxies, Quaternary Sci. Rev., 355, 109270, https://doi.org/10.1016/j.quascirev.2025.109270, 2025.
Rozanski, K., Araguás-Araguás, L., and Gonfiantini, R.: Relation Between Long-Term Trends of Oxygen-18 Isotope Composition of Precipitation and Climate, Science, 258, 981–985, https://doi.org/10.1126/science.258.5084.981, 1992.
Saurer, M., Cherubini, P., and Siegwolf, R.: Oxygen isotopes in tree rings of Abies alba: The climatic significance of interdecadal variations, J. Geophys. Res.-Atmos., 105, 12461–12470, https://doi.org/10.1029/2000JD900160, 2000.
Semenyak, N. and Dolgova, E.: Dendroclimatic signals in the pine and spruce chronologies in the Solovetsky Archipelago, Dendrochronologia, 77, 126029, https://doi.org/10.1016/j.dendro.2022.126029, 2023.
Solomina, O. and Matskovsky, V.: Dendrochronology in European Russia in the Early 21st Century: State of the Art, Front. Ecol. Evol., 9, 738199, https://doi.org/10.3389/fevo.2021.738199, 2021.
Spinoni, J., Naumann, G., Vogt, J., and Barbosa, P.: European drought climatologies and trends based on a multi-indicator approach, Global Planet. Change, 127, 50–57, https://doi.org/10.1016/j.gloplacha.2015.01.012, 2015.
Sternberg, L. and Ellsworth, P. F. V.: Divergent Biochemical Fractionation, Not Convergent Temperature, Explains Cellulose Oxygen Isotope Enrichment across Latitudes, PLoS ONE, 6, e28040, https://doi.org/10.1371/journal.pone.0028040, 2011.
Tishin, D. V., Chizhikova, N. A., Zhuravleva, I. V., and Chugunov, R. G.: Xylogenesis of Pinus sylvestris L. growing in the northern island ecosystems, Lesotekhnicheskii Zhurnal (Forestry Engineering Journal), 6, 89–97, https://doi.org/10.12737/23439, 2016 (in Russian).
Treydte, K., Frank, D., Esper, J., Andreu, L., Bednarz, Z., Berninger, F., Boettger, T., D'Alessandro, C. M., Etien, N., Filot, M., Grabner, M., Guillemin, M. T., Gutierrez, E., Haupt, M., Helle, G., Hilasvuori, E., Jungner, H., Kalela-Brundin, M., Krapiec, M., Leuenberger, M., Loader, N. J., Masson-Delmotte, V., Pazdur, A., Pawelczyk, S., Pierre, M., Planells, O., Pukiene, R., Reynolds-Henne, C. E., Rinne, K. T., Saracino, A., Saurer, M., Sonninen, E., Stievenard, M., Switsur, V. R., Szczepanek, M., Szychowska-Krapiec, E., Todaro, L., Waterhouse, J. S., Weigl, M., and Schleser, G. H.: Signal strength and climate calibration of a European tree-ring isotope network, Geophys. Res. Lett., 34, L24302, https://doi.org/10.1029/2007GL031106, 2007.
Treydte, K., Boda, S., Graf Pannatier, E., Fonti, P., Frank, D., Ullrich, B., Saurer, M., Siegwolf, R., Battipaglia, G., Werner, W., and Gessler, A.: Seasonal transfer of oxygen isotopes from precipitation and soil to the tree ring: source water versus needle water enrichment, New Phytol., 202, 772–783, https://doi.org/10.1111/nph.12741, 2014.
Treydte, K., Liu, L., Padrón, R. S., Martínez-Sancho, E., Babst, F., Frank, D. C., Gessler, A., Kahmen, A., Poulter, B., Seneviratne, S. I., Stegehuis, A. I., Wilson, R., Andreu-Hayles, L., Bale, R., Bednarz, Z., Boettger, T., Berninger, F., Büntgen, U., Daux, V., Dorado-Liñán, I., Esper, J., Friedrich, M., Gagen, M., Grabner, M., Grudd, H., Gunnarsson, B. E., Gutiérrez, E., Hafner, P., Haupt, M., Hilasvuori, E., Heinrich, I., Helle, G., Jalkanen, R., Jungner, H., Kalela-Brundin, M., Kessler, A., Kirchhefer, A., Klesse, S., Krapiec, M., Levanič, T., Leuenberger, M., Linderholm, H. W., McCarroll, D., Masson-Delmotte, V., Pawelczyk, S., Pazdur, A., Planells, O., Pukiene, R., Rinne-Garmston, K. T., Robertson, I., Saracino, A., Saurer, M., Schleser, G. H., Seftigen, K., Siegwolf, R. T. W., Sonninen, E., Stievenard, M., Szychowska-Krapiec, E., Szymaszek, M., Todaro, L., Waterhouse, J. S., Weigl-Kuska, M., Weigt, R. B., Wimmer, R., Woodley, E. J., Vitas, A., Young, G., and Loader, N. J.: Recent human-induced atmospheric drying across Europe unprecedented in the last 400 years, Nat. Geosci., 17, 58–65, https://doi.org/10.1038/s41561-023-01335-8, 2024.
Trouet, V. and Van Oldenborgh, G. J.: KNMI Climate Explorer: A Web-Based Research Tool for High-Resolution Paleoclimatology, Tree-Ring Res., 69, 3–13, https://doi.org/10.3959/1536-1098-69.1.3, 2013.
Vicente-Serrano, S. M., Beguería, S., and López-Moreno, J. I.: A Multiscalar Drought Index Sensitive to Global Warming: The Standardized Precipitation Evapotranspiration Index, J. Climate, 23, 1696–1718, https://doi.org/10.1175/2009JCLI2909.1, 2010a.
Vicente-Serrano, S. M., Beguería, S., López-Moreno, J. I., Angulo, M., and El Kenawy, A.: A New Global 0.5° Gridded Dataset (1901–2006) of a Multiscalar Drought Index: Comparison with Current Drought Index Datasets Based on the Palmer Drought Severity Index, J. Hydrometeorol., 11, 1033–1043, https://doi.org/10.1175/2010JHM1224.1, 2010b.
Wang, W., Zeng, X., Liu, X., An, W., and Zhang, L.: Temporal evolution of the influence of atmospheric circulation on regional cloud cover as revealed by tree-ring δ18O in southwestern China, Global Planet. Change, 208, 103690, https://doi.org/10.1016/j.gloplacha.2021.103690, 2022.
Werner, M.: ECHAM5-wiso simulation data – present-day, mid-Holocene, and Last Glacial Maximum, PANGAEA [data set], https://doi.org/10.1594/PANGAEA.902347, 2019.
Werner, M., Langebroek, P. M., Carlsen, T., Herold, M., and Lohmann, G.: Stable water isotopes in the ECHAM5 general circulation model: Toward high-resolution isotope modeling on a global scale, J. Geophys. Res., 116, D15109, https://doi.org/10.1029/2011JD015681, 2011.
Wigley, T. M. L., Briffa, K. R., and Jones, P. D.: On the Average Value of Correlated Time Series, with Applications in Dendroclimatology and Hydrometeorology, J. Appl. Meteorol. Clim., 23, 201–213, https://doi.org/10.1175/1520-0450(1984)023<0201:OTAVOC>2.0.CO;2, 1984.
Xu, C., Sano, M., and Nakatsuka, T.: Tree ring cellulose δ18O of Fokienia hodginsii in northern Laos: A promising proxy to reconstruct ENSO?, J. Geophys. Res.-Atmos., 116, D24109, https://doi.org/10.1029/2011JD016694, 2011.
Xu, C., Sano, M., and Nakatsuka, T.: A 400-year record of hydroclimate variability and local ENSO history in northern Southeast Asia inferred from tree-ring δ18O, Palaeogeogr. Palaeocl., 386, 588–598, https://doi.org/10.1016/j.palaeo.2013.06.025, 2013a.
Xu, C., Zheng, H., Nakatsuka, T., and Sano, M.: Oxygen isotope signatures preserved in tree ring cellulose as a proxy for April–September precipitation in Fujian, the subtropical region of southeast China, J. Geophys. Res.-Atmos., 118, 12805–12815, https://doi.org/10.1002/2013JD019803, 2013b.
Xu, C., Zhao, Q., An, W., Wang, S., Tan, N., Sano, M., Nakatsuka, T., Borhara, K., and Guo, Z.: Tree-ring oxygen isotope across monsoon Asia: Common signal and local influence, Quaternary Sci. Rev., 269, 107156, https://doi.org/10.1016/j.quascirev.2021.107156, 2021.
Xu, C., Wang, S.-Y. S., Borhara, K., Buckley, B., Tan, N., Zhao, Y., An, W., Sano, M., Nakatsuka, T., and Guo, Z.: Asian-Australian summer monsoons linkage to ENSO strengthened by global warming, npj Clim. Atmos. Sci., 6, 8, https://doi.org/10.1038/s41612-023-00341-2, 2023.
Xu, C., Huang, R., An, W., Zhao, Q., Zhao, Y., Ren, J., Liu, Y., and Guo, Z.: Tree ring oxygen isotope in Asia, Global Planet. Change, 232, 104348, https://doi.org/10.1016/j.gloplacha.2023.104348, 2024.
Zellweger, F., De Frenne, P., Lenoir, J., Vangansbeke, P., Verheyen, K., Bernhardt-Römermann, M., Baeten, L., Hédl, R., Berki, I., Brunet, J., Van Calster, H., Chudomelová, M., Decocq, G., Dirnböck, T., Durak, T., Heinken, T., Jaroszewicz, B., Kopecký, M., Máliš, F., Macek, M., Malicki, M., Naaf, T., Nagel, T. A., Ortmann-Ajkai, A., Petřík, P., Pielech, R., Reczyńska, K., Schmidt, W., Standovár, T., Świerkosz, K., Teleki, B., Vild, O., Wulf, M., and Coomes, D.: Forest microclimate dynamics drive plant responses to warming, Science, 368, 772–775, https://doi.org/10.1126/science.aba6880, 2020.
Zharkov, M. S., Fonti, M. V., Trushkina, T. V., Barinov, V. V., Taynik, A. V., Porter, T. J., Saurer, M., and Churakova (Sidorova), O. V.: Mixed Temperature-Moisture Signal in δ18O Records of Boreal Conifers from the Permafrost Zone, Atmosphere, 12, 1416, https://doi.org/10.3390/atmos12111416, 2021.
Zolina, O., Simmer, C., Belyaev, K., Kapala, A., and Gulev, S.: Improving Estimates of Heavy and Extreme Precipitation Using Daily Records from European Rain Gauges, J. Hydrometeorol., 10, 701–716, https://doi.org/10.1175/2008JHM1055.1, 2009.