
the Creative Commons Attribution 4.0 License.
the Creative Commons Attribution 4.0 License.
 | 06 Nov 2026
Multi-centennial precipitation reconstructions for Dublin: comparing documentary-instrumental and circulation-based approaches
Csaba Horvath

Conor Murphy
Ciara Ryan
Long precipitation records are needed to place recent droughts and wet periods in their historical context. This study combines documentary weather accounts, early rain-gauge measurements, atmospheric-circulation and temperature indices, and tree-ring isotope evidence to reconstruct precipitation for contrasting lowland and upland water-resource domains for the Greater Dublin Area (GDA). We develop and evaluate three reconstruction products: a monthly documentary-instrumental reconstruction extending to 1711 (the Jenkinson series); a monthly statistical ensemble, combining Lasso and Random Forest models, extending to 1748; and a tree-ring δ18O reconstruction of May-August precipitation extending to 1200 CE. Monthly reconstructions are evaluated against 1 km gridded observations over their common overlap period, 1865–1977. Both monthly reconstructions reproduce observed rainfall variability, but the documentary-instrumental Jenkinson reconstruction generally shows stronger agreement at monthly, seasonal, annual and event scales. The statistical ensemble provides an independent, circulation-informed estimate but produces smoother variability and underestimates some extremes. The tree-ring reconstruction shows weaker interannual agreement with Dublin rainfall but supplies a substantially longer perspective on summer hydroclimatic variability. However, superior performance against observations does not necessarily translate into greater reliability during the reconstructed period.
The two monthly reconstructions diverge most strongly in winter and spring before the mid-nineteenth century, potentially reflecting snow- and sleet-related undercatch in early precipitation measurements which affects the Jenkinson series. This divergence has important consequences for inferred long-term trends. The Jenkinson series indicates large and frequently significant increases in winter and spring precipitation that are not evident in the statistical ensemble. In contrast, both reconstructions show substantial, persistent and often statistically significant decreases in summer precipitation, although these are generally larger in the Jenkinson series. Used together, the reconstructions extend the evidence available for evaluating historical droughts, pluvials and water-resource vulnerability in the Greater Dublin Area beyond the instrumental period.
- Article
(15943 KB) - Full-text XML
-
Supplement
(1580 KB) - BibTeX
- EndNote


Long-term rainfall reconstructions are fundamental to water resource management, offering the possibility of extending the evidence base for water resource yield assessments, drought planning, and decision-making beyond the instrumental period. They can also provide the context needed to distinguish emerging anthropogenic change from natural climate variability (Fordham and Murphy, 2026) and identify historically plausible drought and wet periods for stress testing infrastructure and management plans (Noone et al., 2017; Wilby et al., 2015; Wilby and Murphy, 2019). Historical climatology and palaeoclimatology consistently demonstrate that hydroclimatic variability inferred from the instrumental era alone can underestimate both the severity and persistence of extremes, with direct implications for water-supply reliability, infrastructure design, and climate adaptation planning (Wetter et al., 2014; Cook et al., 2015; Blöschl et al., 2020; Brázdil et al., 2020a; Büntgen et al., 2021). Beyond water resource management, Engler et al. (2013) show how precipitation reconstructions can shed light on previous extremes, such as the 1740–1741 famine in Ireland, while Murphy et al. (2020) highlight the extent of multi-annual drought across the British and Irish Isles in 1765. Jobbová et al. (2024) have linked precipitation reconstructions with newspaper records to examine drought impacts in Ireland from the early 1700s to present.
Ireland has a rich history of weather observing, with systematic observations beginning in Dublin in 1789 (Shields, 1983). Recent research has leveraged these data, with Noone et al. (2016) developing a homogenised network of 25 long-term monthly precipitation gauges across the island from 1850 onwards, while Ryan et al. (2022) developed a network of long-term daily stations extending back to the late 1800s. Others, including Jenkinson et al. (1979) and Murphy et al. (2018), have also used observations and documentary sources to develop a monthly rainfall series for the Island of Ireland from 1711 to the present.
In addition to observations, Murphy et al. (2020) have used circulation-based predictors to reconstruct monthly precipitation totals for regional precipitation series across the British and Irish Isles using multiple linear regression, showing that observed winter totals may be underestimated given changes in gauge design and undercatch of snow prior to circa 1860. At a European scale, Pauling et al. (2006) developed seasonal gridded precipitation fields for land areas at 0.5° × 0.5° resolution from 1500–1900 using principal component regression combining long instrumental precipitation series, documentary information and natural proxies, including tree rings, ice cores, corals and speleothems as predictors. Reconstruction skill over Ireland is good for all seasons from circa 1700 onwards, with the data previously used as a benchmark against which other Irish reconstructions have been assessed (Murphy et al., 2018). Relatedly, Casty et al. (2007) also provide reconstructions of monthly precipitation from 1766 onwards, which have previously been employed to extend river flow reconstructions for 51 Irish catchments (O'Connor et al., 2021).
While these datasets and reconstructions have been valuable for assessing past extremes, they are often not configured around the spatial units relevant to water-resource planning and may not fully capture important local heterogeneity in precipitation variability. Moreover, recent data rescue initiatives, including Rainfall Rescue (Hawkins et al., 2023) and transcription of historical Irish rain-gauge records by Met Éireann (Ireland's national meteorological service, Ryan et al., 2021; Ryan and McGovern, 2025), have substantially strengthened the observational basis for long-term rainfall assessment and increased potential for developing bespoke multi-century reconstructions for key water resource zones. Despite Ireland's generally wet climate, the Greater Dublin Area (GDA), which encompasses Ireland's largest metropolitan region, is highly vulnerable to drought. This vulnerability reflects the combination of high and growing water demand, ageing infrastructure with little spare capacity, relatively low rainfall compared to western Ireland, limited local storage, strong dependence on key surface-water sources, and sensitivity to seasonal rainfall deficits (Kelly-Quinn et al., 2014).
This study reconstructs monthly precipitation for two water resource zones in the GDA using three approaches: (i) month-specific statistical reconstructions (Lasso and random-forest regression) driven by circulation and hydroclimate predictors (back to 1748), (ii) scaling of a rainfall anomaly dataset compiled by Jenkinson et al. (1979) (back to 1711), and (iii) an annually resolved oak cellulose δ18O proxy chronology, developed for Central England (Loader et al., 2019) and used here to reconstruct growing-season precipitation (MJJA) back to 1200.
The key aims of this paper are to (i) use available datasets to produce multi-centennial precipitation reconstructions for the GDA that can support evaluation of historical droughts and pluvials; (ii) assess how skilfully different reconstruction approaches capture precipitation variability and extremes across contrasting upland and lowland domains; and (iii) examine how inferred annual and seasonal rainfall trends depend on reconstruction approach and analysis period. Section 2 describes the study area and datasets, while Sect. 3 presents the reconstruction methods and approaches to evaluating performance and trends. Section 4 presents the results, Sect. 5 discusses the findings and limitations, and Sect. 6 summarises the main conclusions and implications.
2.1 Study Area
Ireland's water-resources planning is structured around Regional Water Resources Plans (RWRPs), which subdivide Regional Water Management Areas into Study Areas (SAs) comprising one or more Water Resource Zones (WRZs). The GDA broadly aligns with Uisce Éireann's (Ireland's national water utility) Study Areas SA1, SA2 and SA9. SA1 and SA2 encompass the eastern and western parts of the northern Wicklow Mountains, including steep mountain slopes, upland valleys and headwater catchments. The upland domains are strongly exposed to moisture-bearing Atlantic air masses, particularly under prevailing south-westerly and westerly circulation, enhancing orographic precipitation relative to lowland SA9. Elevation ranges from lowland foothills and valley floors to more than 800 m in the Wicklow Mountains, producing pronounced orographic rainfall gradients. SA9 is predominantly urban and spans County Dublin and parts of adjacent counties, with a population of approximately 1.7 million. The GDA water supply system is substantially reliant on the River Liffey, increasing sensitivity to prolonged rainfall deficits and operational shocks (Uisce Éireann, 2022a, b). For precipitation reconstruction, SA9 is retained as defined by Uisce Éireann, while SA1 and SA2 are combined into a single upland domain (hereafter SA-upland) to reflect hydrological similarity (Fig. 1). Reconstructions are produced and evaluated separately for SA9 and SA-upland and evaluated against gridded observational rainfall.
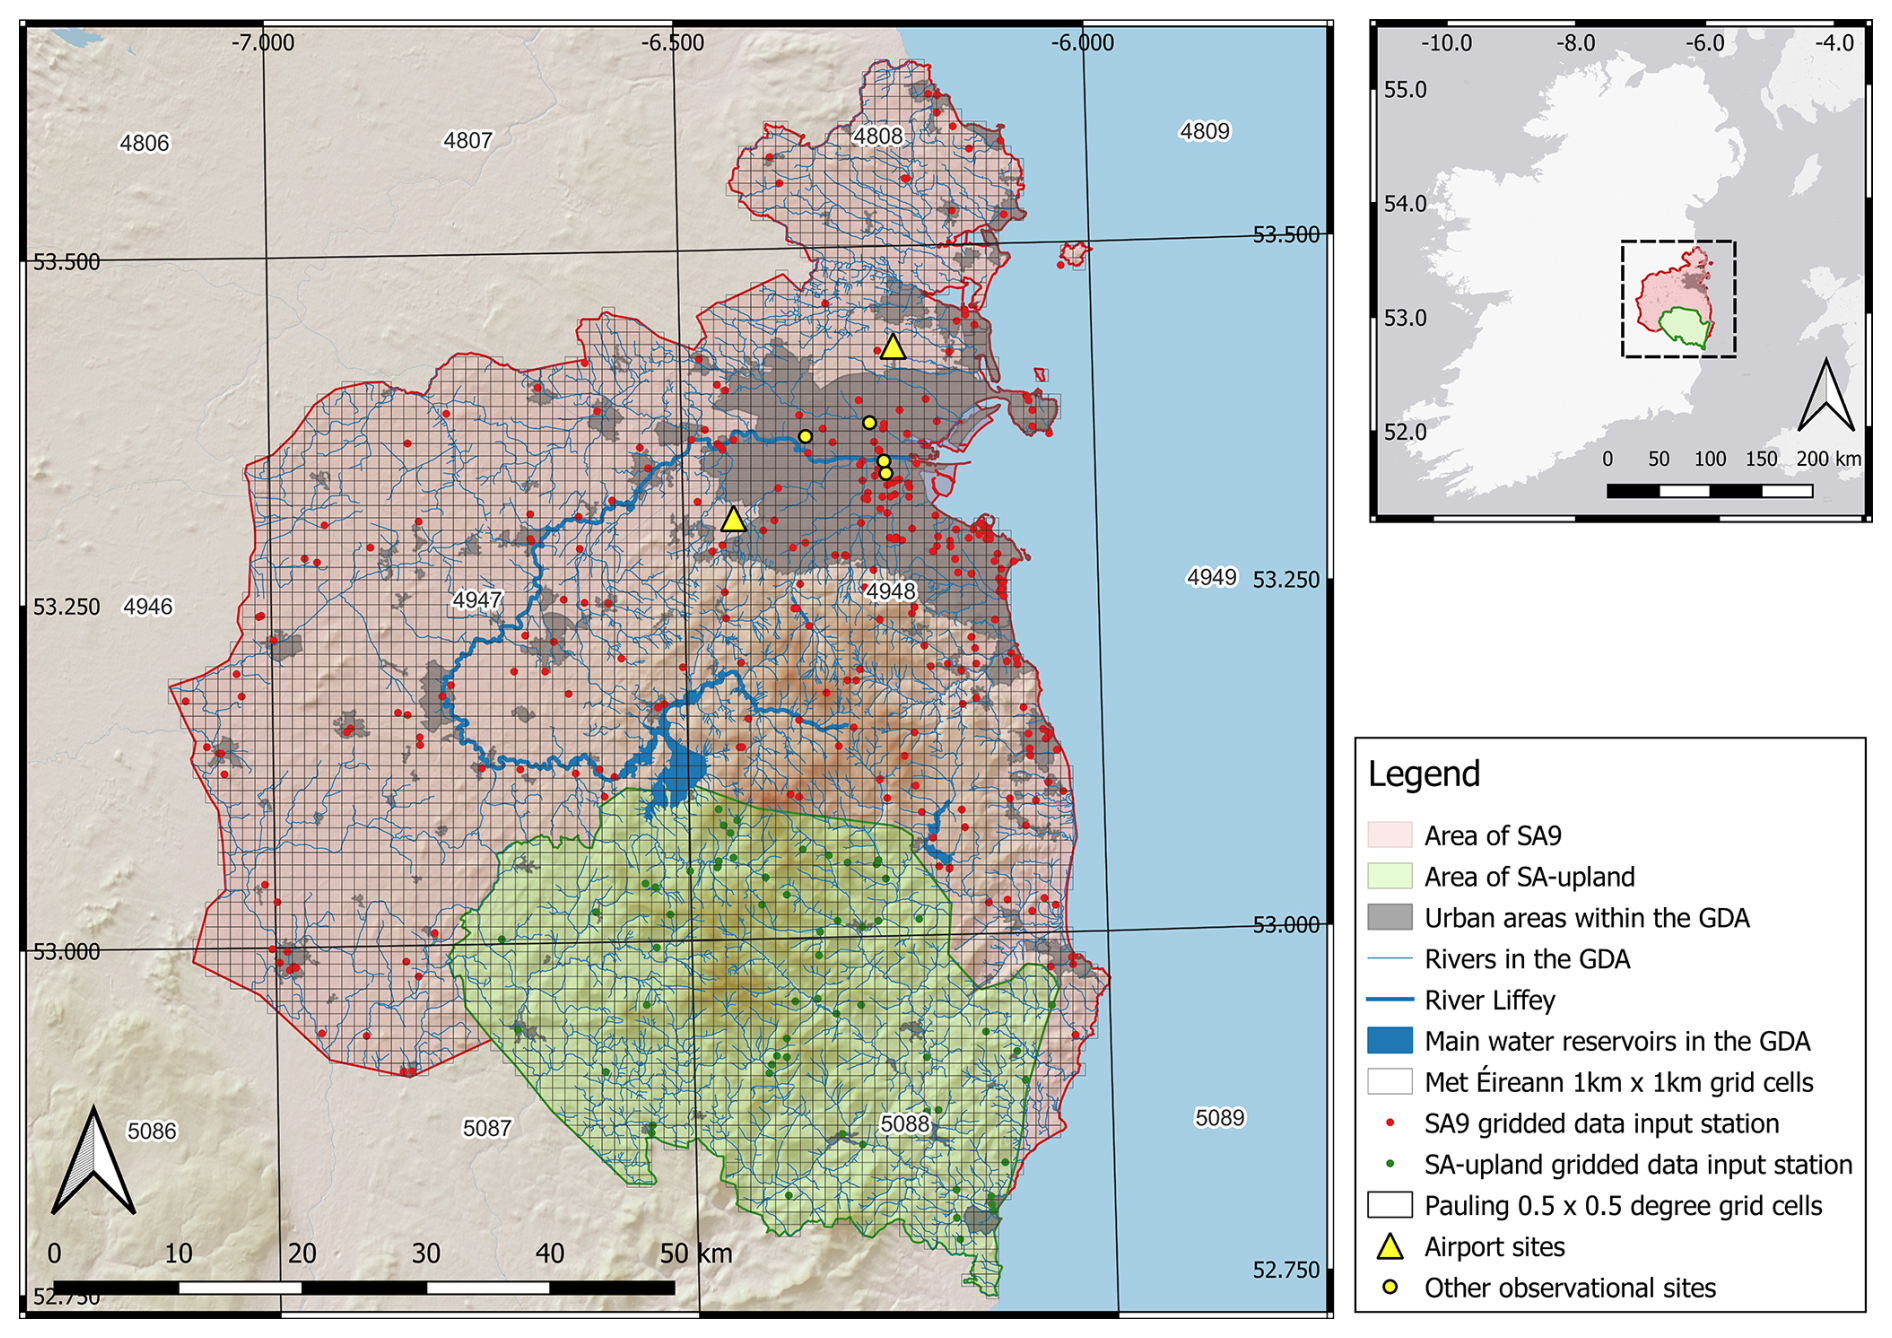
Figure 1Map of the Greater Dublin Area (GDA) on the east coast of Ireland. The GDA is defined here as the combination of Uisce Éireann water management areas SA9 (red shading) and the merged SA1–SA2 regions, referred to in the study as “SA-upland” (green shading). Grey shading denotes urban areas within the GDA, whereas blue indicates water bodies, including the River Liffey (highlighted by the thicker blue line) and the main reservoirs supplying the Dublin region. Source: the map is the author's work in QGIS.
2.2 Observed gridded rainfall dataset (1865–2024)
Observed monthly precipitation is represented using a 1 km gridded rainfall dataset (1865–2024) produced by Met Éireann. Inputs are drawn from the modern station network after 1941, while earlier decades incorporate extensive rescued historical gauge data, including Rainfall Rescue digitisation (Hawkins et al., 2023) and additional Met Éireann transcriptions (Ryan et al., 2021; Ryan and McGovern, 2025). Grids are generated using regression on physiographic predictors and kriged residuals, and evaluated by cross-validation (Coonan et al., 2024). A single series of monthly totals for each domain was extracted from the gridded data for use in subsequent analysis, with the contributing stations and 1 km grid cells shown in Fig. S1 in the Supplement. As with all long-term gridded gauge-based precipitation products, station density and record continuity are generally lower in complex terrain and in earlier periods (Hofstra et al., 2009; Newman et al., 2015; Cornes et al., 2018). Interpolation can smooth small-scale variability, dampen local extremes relative to point observations, and may introduce larger uncertainties in upland areas where rainfall gradients are strong (Daly, 2006; Hofstra et al., 2009; Herrera et al., 2012; Daly et al., 2021; Matiu et al., 2024). Gridded totals also inherit known gauge-measurement biases – particularly exposure, wind and snow-induced undercatch (Adam and Lettenmaier, 2003; Murphy et al., 2018; Pollock et al., 2018; Hawkins et al., 2023; Kendon et al., 2023).
2.3 The Jenkinson Dataset (1711–1977)
The Jenkinson dataset is a documentary-instrumental rainfall anomaly series for the island of Ireland derived from an unpublished UK Meteorological Office note compiled by Jenkinson et al. (1979). It provides continuous Ireland-wide monthly rainfall estimates for 1711–1977, expressed as (i) annual rainfall anomalies (annual totals expressed as a percentage of an estimated annual average rainfall, AAR) and (ii) proportional monthly rainfall distributions expressed as “internal percentages” of the annual total. Resampling AAR for the GDA allows the annual anomaly and monthly distribution information to be re-anchored to the rainfall climatology for the Dublin domains considered here.
The Jenkinson series draws on a changing combination of source materials through time including early rain-gauge observations, documentary weather diaries, regional UK rainfall series used as proxy stations, and later Irish station observations. The full Jenkinson series, its compilation and provenance are described in detail by Murphy et al. (2018). For much of the eighteenth century, the series is strongly informed by Rutty's Dublin weather diary (Rutty, 1770). From 1792 to 1839, observed Dublin rainfall measurements reported by Dixon (1953), supplemented by manuscript records held by the UK Met Office, contribute to the reconstruction, while additional monthly and annual totals from Dublin are included for 1823–1824. From 1840 to 1977, the reconstruction increasingly incorporates instrumental observations from a growing Irish station network, including Dublin, Belfast, Armagh, Cork and Sligo. During 1940–1948, the series further draws on monthly rainfall totals from ten long-term Irish stations (Tabony, 1980) together with annual rainfall maps produced by the UK Meteorological Office (1940–1945) and the Irish Meteorological Service (1946–1948). From 1949 to 1977, monthly and annual rainfall observations from the Irish Meteorological Service/Met Éireann provide the principal observational input to the reconstruction. The Jenkinson series is not fully independent of the gridded observational rainfall used for evaluation, particularly during periods when both products draw directly or indirectly on Dublin-area station records. Nevertheless, the series provides a valuable long-term documentary-instrumental estimate of monthly rainfall variability.
2.4 Predictors used for statistical reconstructions (1748–1994)
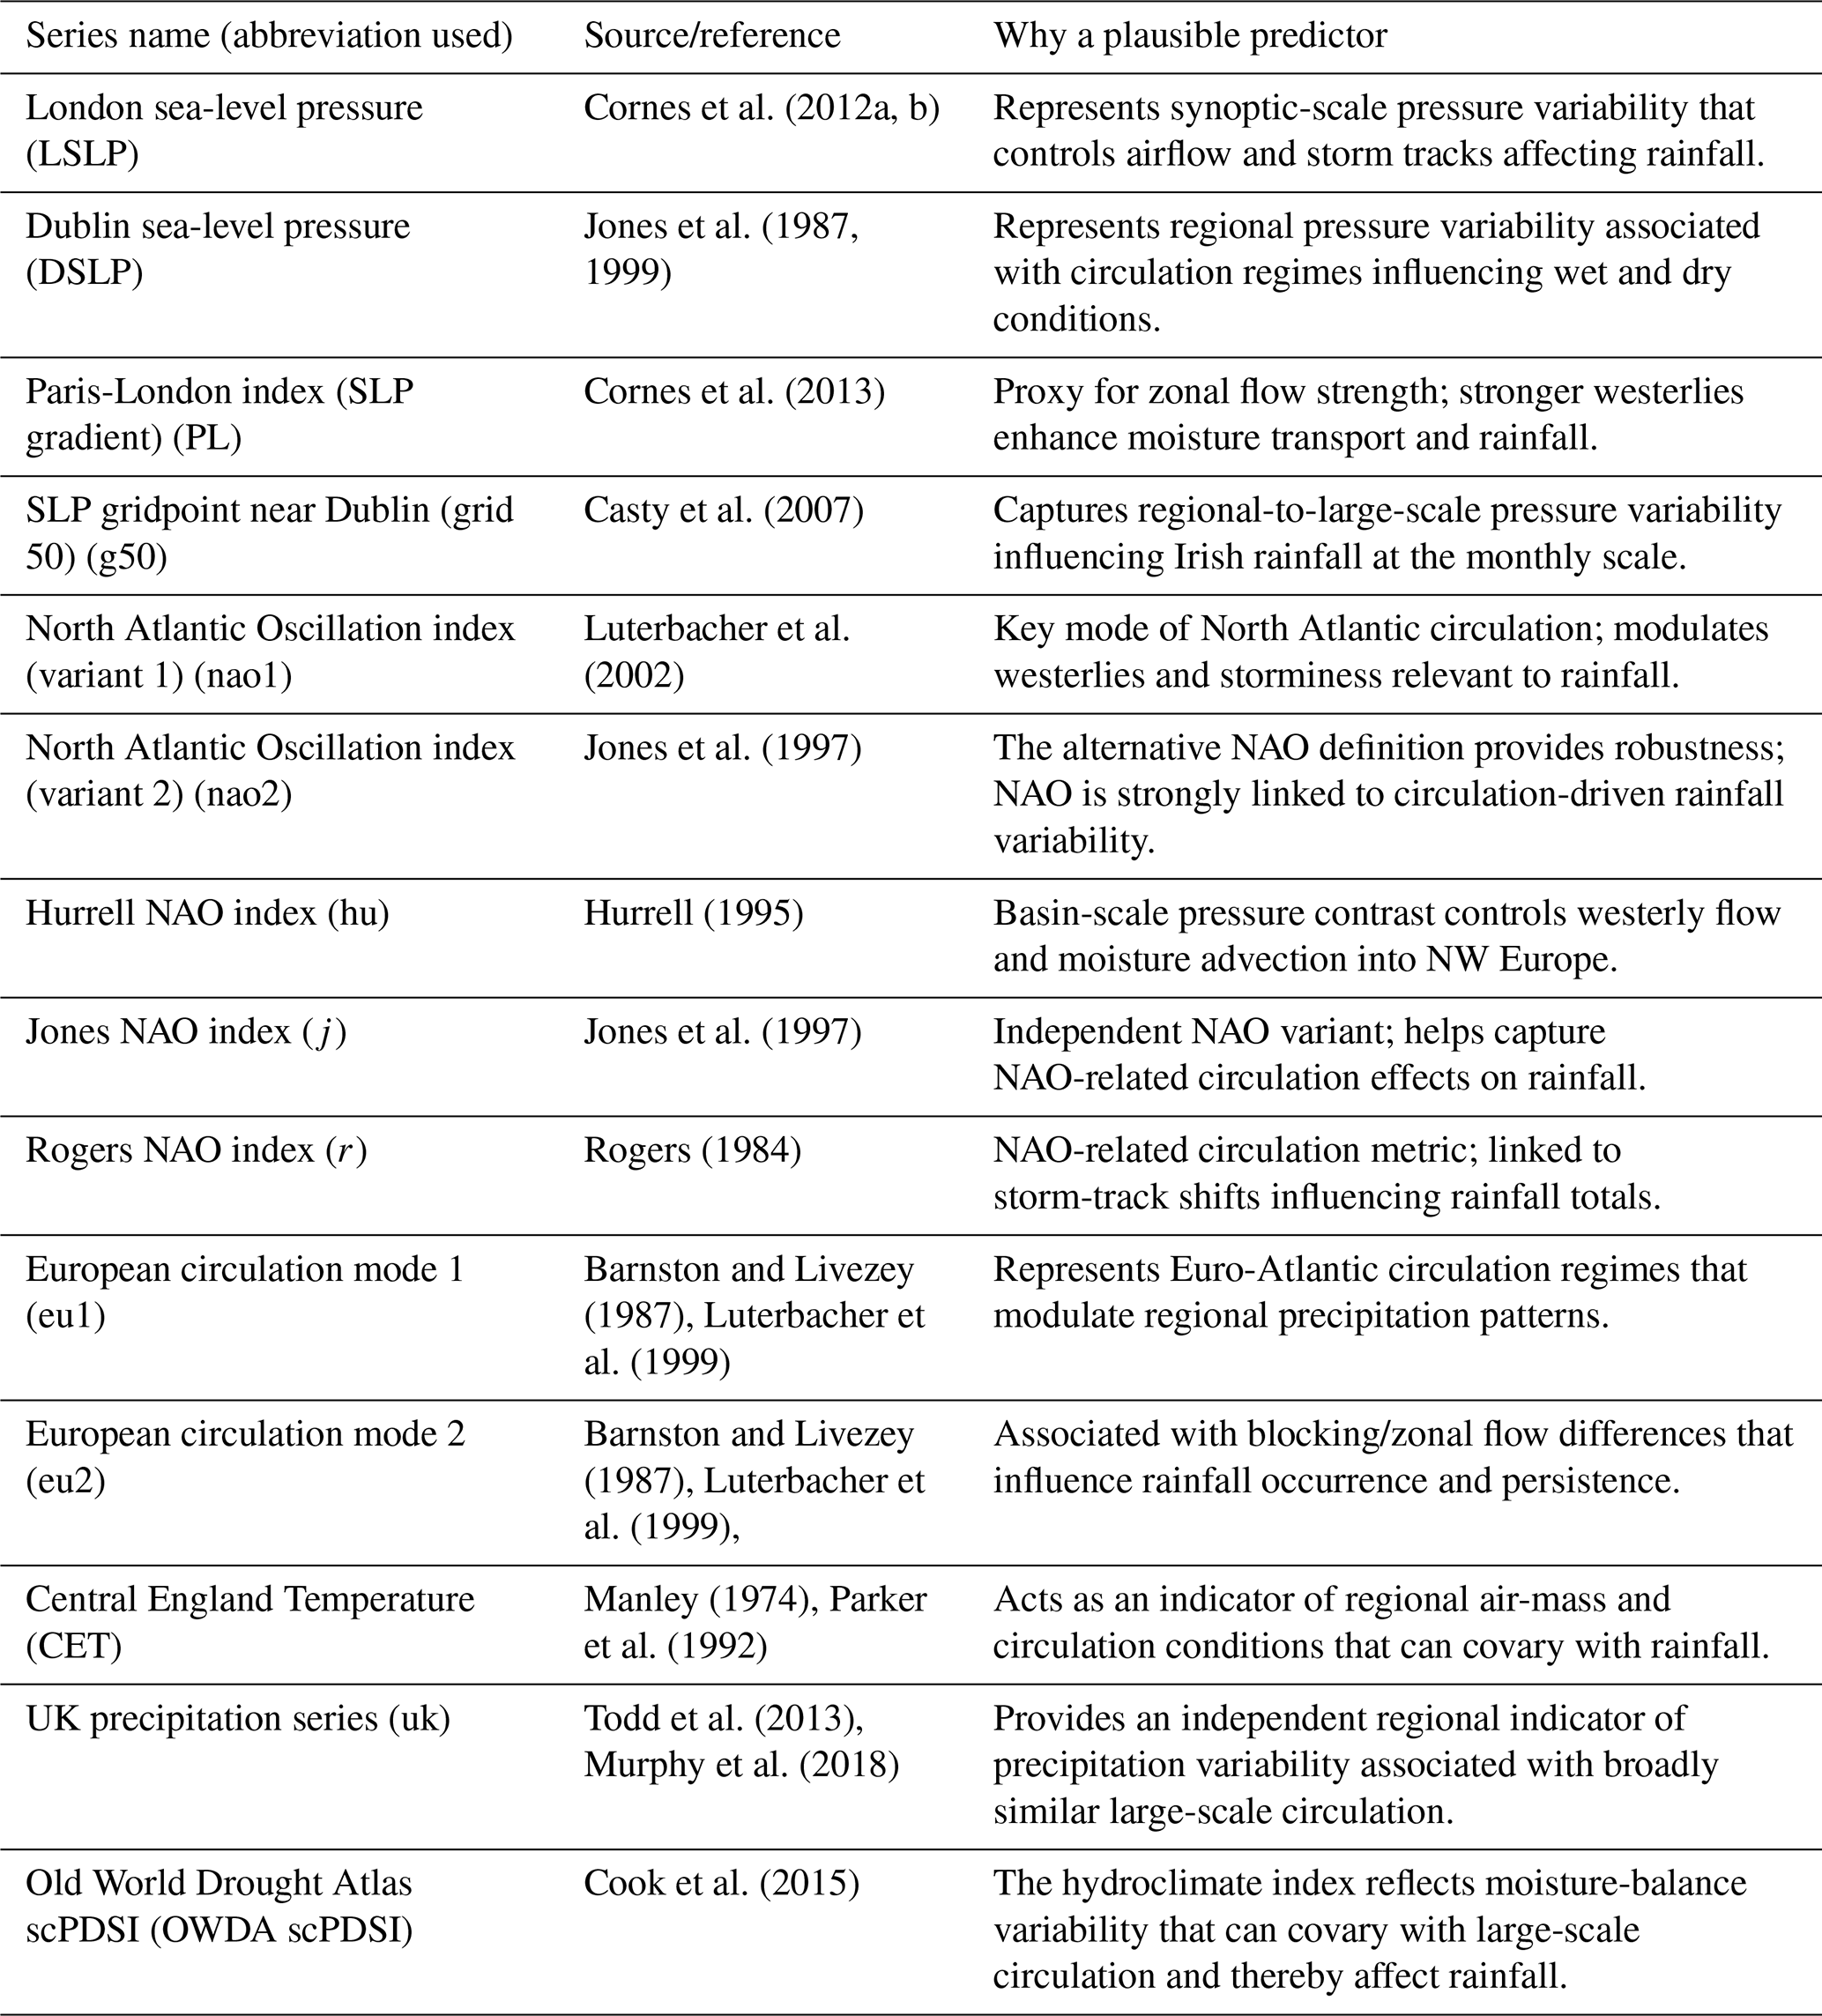
Plausible predictors with potential utility for reconstructing monthly precipitation were compiled to develop statistical reconstructions. The predictor set comprises quality-assured sea-level pressure (SLP) datasets, North Atlantic/European circulation indices, and auxiliary hydroclimate covariates, including Central England Temperature (CET), a monthly UK precipitation series, and the summer Palmer Drought Severity Index (PDSI) derived from the Old World Drought Atlas (Cook et al., 2015). All predictors used, their sources, and temporal coverage are summarised in Table 1. Reconstructions were undertaken from 1748 to 1994 given the overlap of available predictors.
Table 1The monthly predictor suite used in circulation-based statistical reconstructions. All series are extracted for the maximum overlap period of 1748–1994.
2.5 Oxygen-isotope proxy data (tree-ring cellulose δ18O) (1200–2000)
This study uses tree-ring oxygen isotope (δ18O) data from the master chronology compiled by Loader et al. (2019) for Central England, spanning 1200–2000 CE, based on δ18O measurements of oak tree-ring cellulose, to derive an annually resolved reconstruction of MJJA (May–August) precipitation variability. We use this dataset to provide an annually resolved proxy archive of growing-season hydroclimate variability from the wider British-Irish Isles region. Here, it is used to derive a MJJA precipitation reconstruction for the Dublin rainfall domains by calibrating against observed MJJA rainfall during the instrumental overlap period. The purpose of including the δ18O-based reconstruction is therefore twofold: first, to provide an independent proxy-based comparison for summer hydroclimate variability during the period of overlap with gridded observations and the documentary-instrumental reconstructions; and second, to extend the assessment of regional summer hydroclimatic variability beyond the documentary-instrumental window. Its interpretation is restricted to MJJA rainfall variability and the longer-term summer hydroclimate context.
2.6 Long-term comparative series
Eastern Ireland and much of the UK lie within a common North Atlantic circulation domain, where precipitation variability at monthly to seasonal scales is modulated by large-scale modes such as the North Atlantic Oscillation and associated moisture-transport regimes (Wilby et al., 1997; Parry et al., 2023). Long-term UK precipitation series were used as regional comparators for assessing the timing and persistence of reconstructed wet and dry periods, particularly before the start of the Irish instrumental record. Four long-term UK monthly precipitation series were employed, including records from Kew Gardens (southern England), the Spalding/Pode Hole composite series (East Midlands), alongside two additional long-duration series from Carlisle (northwest England) and Oxford (south-central England). These series extend into the eighteenth century and are derived from combinations of early instrumental observations and documentary-based reconstructions, with varying degrees of uncertainty in their earliest segments (Wales-Smith, 1971; Craddock and Wales-Smith, 1977; Tabony, 1980; Todd et al., 2013; Murphy et al., 2018). In addition, we compare seasonal totals from our reconstructions with those of Pauling et al. (2006). This comparison is limited to SA9 for the period 1700–2000, as the grid resolution of the Pauling et al. (2006) dataset does not allow for the adequate representation of SA-upland. Seasonal totals from Pauling et al. were extracted for two grids overlapping SA9 and a regional average derived across both cells. Together, these series provide independent regional benchmarks against which the timing, persistence and relative magnitude of reconstructed wet and dry periods can be assessed.
2.7 Dublin snow and sleet series (DSS) and Manley (MSS) snow and sleet series
To assess whether early winter rainfall measurements may be biased low because of undercatch of snow or mixed precipitation (Murphy et al., 2019), we use the Dublin snow and sleet dataset (DSS) developed for the GDA (Horvath et al., 2025). DSS summarises the number of days with snow and/or sleet at monthly, seasonal (October–May) and annual scales for 1867–2024, based on six long-running observing sites across the GDA, and is published as an aggregated regional series. Here, DSS is used as an independent indicator of precipitation phase. For analyses requiring longer temporal coverage, DSS is extended back to 1748 using the London snow and sleet series compiled by Gordon Manley (1969), which was subsequently digitised and extended to 1974 by Murphy et al. (2019). The Manley series is based on a synthesis of early instrumental observations and documentary evidence from the greater London area and provides one of the longest continuous records of snowfall and sleet occurrence in the North Atlantic region.
3.1 Statistical reconstruction (1748–1994)
Statistical reconstructions were developed separately for each rainfall domain and calendar month. Two regression approaches were applied: Lasso and Random Forest (RF) regression. Models were fitted using the 1930–1994 period, given the denser modern gauge network within the gridded observational dataset. Four-fold blocked cross-validation was used within the 1930–1994 period. Calibration years were ordered chronologically and divided into four contiguous blocks with out-of-fold predictions generated from temporally withheld data. These out-of-fold predictions were used to tune model parameters, derive ensemble weights and to summarise model development performance. Selected LASSO and RF models were then refitted using the full 1930–1994 period and applied to the full record to generate monthly reconstructions for 1748–1994. Monthly predictions were subsequently aggregated to annual and seasonal totals. Seasons were defined as DJF, MAM, JJA, SON and MJJA, with December assigned to the following winter season-year for DJF aggregation. The 1930–1994 out-of-fold results are interpreted as blocked cross-validation model development diagnostics rather than as fully independent validation, because the same model development period was used for hyperparameter selection and ensemble weight derivation. Independent temporal validation was undertaken separately over 1865–1929, which was not used for model fitting, hyperparameter tuning or ensemble weighting. Model performance was summarised using root mean square error (RMSE), mean absolute error (MAE), Pearson's correlation coefficient, Spearman's rank correlation coefficient and percent bias (PBIAS).
3.1.1 Lasso Regression
Lasso (least absolute shrinkage and selection operator) regression is an extension of ordinary least squares (OLS) that remains stable when predictors are collinear and numerous (Tibshirani, 1996; Hastie et al., 2009). Stability is achieved by adding a penalty on coefficient size, which shrinks some estimates towards zero and sets others exactly to zero, thereby reducing overfitting relative to unpenalised OLS (Tetko et al., 1995; Li et al., 2020). Lasso regression was implemented in R using glmnet (Friedman et al., 2010). For each month, the penalty parameter (λ) was selected using four-fold blocked cross-validation over the 1930–1994 calibration period. Out-of-fold predictions from this procedure were retained to assess model skill within the calibration period. Final monthly Lasso models were then refitted using the full 1930–1994 calibration period and applied to the complete predictor record. Predictor importance was summarised using the absolute values of coefficients from the final model fitted to the whole 1930–1994 calibration period.
3.1.2 Random Forests
Random forests (RFs) are supervised machine learning methods that learn the relationship between predictors and a target variable from training data. RF regression builds an ensemble of regression trees by fitting each tree to a bootstrap resample of the training data and averaging predictions across trees (Breiman, 2001). Within each tree, splits are selected to reduce prediction error, typically by minimising the residual sum of squares. RF can represent nonlinear responses and higher-order interactions, but is typically less interpretable than regression and can overfit in small samples without careful validation.
Random forest (RF) regression was implemented in R using randomForest (Liaw and Wiener, 2002). For each month, hyperparameters were tuned using the same four-fold blocked cross-validation scheme as for Lasso. A small grid search explored (i) mtry, the number of predictors randomly considered at each split, using three values based on p (the number of predictors) – the square root of p, , and (rounded) and (ii) minimum node size (5, 10, 20, 30), with the number of trees fixed at 300. For each setting, cross-validated predictions were generated, and RMSE was computed. The configuration with the lowest cross-validated RMSE was selected, and the model was refitted to the whole 1930–1994 calibration period. Predictor importance was quantified using permutation importance, expressed as the percentage increase in out-of-bag (OOB) error after permuting each predictor.
3.1.3 Ensemble Generation
For each domain and calendar month, monthly rainfall reconstructions from both the Lasso and RF models were combined into a two-member weighted ensemble. Ensemble weights were derived from the blocked cross-validation out-of-fold RMSE values calculated over the 1930–1994 model-development period. These were converted to weights using an inverse-squared RMSE rule and normalised to sum to 1. The final monthly ensemble estimate was calculated as the weighted average of the final full-refit LASSO and RF predictions. Because weights were derived separately by month and domain, the relative contribution of LASSO and RF was allowed to vary seasonally and between SA9 and SA-upland.
3.1.4 Uncertainty Estimation for the Statistical Ensemble
Uncertainty in the statistical ensemble was estimated using non-parametric bootstrap resampling of the 1930–1994 calibration years. For each domain and calendar month, 1000 bootstrap samples were generated by sampling calibration years with replacement. For each bootstrap replicate, LASSO and RF models were refitted using the selected monthly model settings: the selected LASSO λ, selected RF mtry, selected RF node size and 300 trees. The refitted models were then applied to the full predictor record, and the ensemble prediction was calculated using the previously derived month-specific inverse-RMSE2 weights. Pointwise 95 % uncertainty intervals were calculated as the 2.5th and 97.5th percentiles of the bootstrap ensemble of 1000 predictions. Monthly bootstrap predictions were aggregated to annual and seasonal totals to produce corresponding uncertainty intervals at those timescales. Any negative monthly rainfall predictions from the statistical models were truncated to zero before aggregation and the calculation of uncertainty intervals.
It should be noted that the derived intervals quantify uncertainty associated with calibration-sample resampling, conditional on the selected predictor set, gridded rainfall target, model structures, selected hyperparameters and ensemble-weighting scheme. They do not represent total reconstruction uncertainty. In particular, they do not fully account for uncertainty in predictor datasets, structural uncertainty associated with the choice of modelling framework, possible non-stationarity in predictor-rainfall relationships, or uncertainty in the gridded observational target itself.
3.2 Jenkinson monthly reconstruction (1711–1977)
Monthly rainfall totals for each study domain were reconstructed from the Jenkinson anomaly-distribution dataset (Jenkinson et al., 1979) for 1711–1977 by anchoring its annual anomalies to a domain-specific mean annual rainfall (AAR) estimated over 1865–1975. Uncertainty in AAR was quantified using a non-parametric bootstrap of the annual totals for each domain from 1865 to 1975. A total of 1000 resamples were generated by drawing years with replacement and calculating AAR for each resample. For each bootstrap AAR, Jenkinson annual percentage anomalies were converted to annual rainfall totals by scaling the AAR upward (for positive anomalies) or downward (for negative anomalies), thereby transferring the interannual variability encoded in Jenkinson onto the domain-specific climatological mean annual rainfall (AAR). Annual totals were then partitioned into monthly totals using the corresponding year's internal percentages (converted to proportions). Final monthly estimates were summarised across the 1000-member ensemble using the median and the 2.5th and 97.5th percentiles as uncertainty intervals. These intervals reflect uncertainty in the anchored AAR estimate and are conditional on the Jenkinson anomalies and internal-percentage fields.
3.3 Oxygen-isotope reconstruction of MJJA rainfall (1200–2000)
Extended summer rainfall (MJJA) for each GDA domain was reconstructed from an annually resolved oak cellulose δ18O master chronology for Central England using a reduced major axis variance-scaling approach as applied by Loader et al. (2020). For each domain, the calibration relationship was defined from the overlap period between δ18O and observed MJJA rainfall over the period 1930–2000. Calibration-period means and standard deviations of δ18O and MJJA rainfall, together with their correlation, were used to derive the transformation, which was then applied to all years with available δ18O to generate a reconstructed MJJA rainfall series.
Uncertainty in reconstructed MJJA rainfall was quantified using 1000 bootstrap resamples of annual calibration-year pairs (δ18O, MJJA rainfall) drawn with replacement (Efron and Tibshirani, 1993). For each replicate, calibration summary statistics and the δ18O-rainfall correlation were re-estimated, and a complete reconstruction was generated using the ensemble median and the 2.5th and 97.5th percentiles as 95 % uncertainty intervals. These intervals quantify uncertainty arising from calibration of the variance-scaling transformation and are conditional on the chosen target series and calibration window.
3.4 Extension of the Dublin Snow and Sleet series and residual-based analysis
To assess whether differences between the Jenkinson and statistical ensemble reconstructions may reflect snow- and sleet-related gauge undercatch in early observations, a residual-based diagnostic framework was adopted, following Murphy et al. (2019). The Dublin Snow and Sleet (DSS) series was first extended back to 1748 using the long-term London snow and sleet series (1668–1974) compiled by Gordon Manley (1969) and digitised by Murphy et al. (2019). A linear no-intercept transfer function between DSS and the Manley snow and sleet series was calibrated over their common period (1867–1974) using aggregated annual totals. The fitted relationship was then applied to the Manley series to estimate DSS values for 1748–1866.
Residual analysis was subsequently performed using the difference series between the Jenkinson and ensemble rainfall reconstructions with annual Pearson's r, 10-year Pearson's r and significance of 10-year p-value following adjustment for autocorrelation calculated. This approach enables assessment of whether systematic differences between reconstructions covary with an independent indicator of snowfall and sleet variability, thereby providing an indication of potential snow-related undercatch in early rainfall observations used in the Jenkinson reconstruction.
Decadal analysis was undertaken to account for noise in the annual reconstructions. Comparisons were undertaken for DJF, MAM and the October-May snow year, representing the periods most likely to be affected by solid precipitation. To facilitate comparison, the reconstruction residuals and extended snow and sleet series were converted to z-scores using their respective means and standard deviations.
3.5 Evaluation of reconstructions
Comparison of performance across the different reconstructions is undertaken using visual assessment and quantitative evaluation for the full period of overlap with observations. Key evaluation metrics include Pearson's r to assess covariation, R2 to examine the proportion of variance in the observations captured by each reconstruction and the Percent Bias (PBIAS) and Mean Absolute Error (MAE). The ability of each reconstruction to capture wet and dry extremes in the observations is evaluated using the Probability of Detection (POD) and False Alarm Ratio (FAR) (Murphy et al., 2020; Rudd et al., 2017). Based on threshold exceedances, the former measures the proportion of observed extremes successfully detected by the reconstructions, while the latter measures the proportion of extremes in the reconstructions that were not observed. The metrics are calculated as follows:
where hits (H) count the number of events which occurred in both the observations and the reconstruction, misses (M) indicate the number of events that occurred in the observed series but not in the reconstruction. The False Alarm (F) counts instances where an event occurred in the reconstruction but not in the observed series.
For continuous monthly reconstructions (Jenkinson and Statistical Ensemble), the Standardised Precipitation Index (SPI) was derived for both reconstructions and observations. SPI was fitted for accumulation periods of 1, 3, 6 and 12 months using a Gamma distribution. POD and FAR were evaluated at thresholds of ±1.0 and ±1.5, representing moderate and extreme droughts and pluvials. For MJJA precipitation, per cent anomalies relative to a fixed (1980–2000) baseline, were calculated for each series. Positive and negative thresholds of ±20 % and ±50 % of the baseline for each month were identified.
We separately assess the consistency of the 20 wettest and 20 driest years between 1865 and 1977 for each reconstruction relative to observations using the Jaccard Similarity Coefficient (Jaccard Index, JI). For our subset of the top 20 wet and dry years, the JI is used to measure the similarity/diversity of sample sets and is calculated as:
Where the numerator represents the intersection of the two sets or the number of events in common, and the denominator represents the total number of unique events present across both lists. A JI score of 1 indicates identical sets, 0 indicates complete disjoint (no overlap) while a value of ∼ 0.33 indicates 50 % overlap.
Wettest and driest years were evaluated separately as binary sets. For the wettest-year analysis, the two sets comprised the 20 wettest observed and reconstructed years, respectively; the same procedure was applied independently to the 20 driest years. Years outside the relevant top-20 lists were not assigned to a separate neutral category. For two binary sets, the Jaccard Index is related to the F1 score by JI = F1(2-F1).
In addition to quantitative evaluation against observations, reconstructed rainfall variability was assessed qualitatively using long-term UK precipitation series (Sect. 2.6). Seasonal totals (DJF, MAM, JJA, SON) were standardised (z-scores) separately for each station and season using the mean and standard deviation over 1711–1977 and then smoothed using 10 year forward running means. These series provide an independent regional benchmark for examining the timing, persistence, and relative magnitude of wet and dry periods in the Dublin pre-instrumental period. Comparisons are based on visual assessment of temporal alignment and consistency across series.
3.6 Assessment of trends in the final reconstructions
Neither monthly rainfall reconstruction extends to the present. The Jenkinson reconstruction ends in 1977, whereas the statistical ensemble ends in 1994. Gridded observational rainfall is available from 1865 onwards. Therefore, the reconstructed values before 1865 were combined with the common observed rainfall series for 1865–2024. The resulting appended products span 1711–2024 for Jenkinson and 1748–2024 for the statistical ensemble in both study domains. Trends in annual and seasonal rainfall series and their persistence were examined using the Mann-Kendall (MK) test (Mann, 1945; Kendall, 1975). For each series we first calculate the MK Z statistic for the full period of record and then for iteratively shorter record lengths by incrementally dropping the start year, down to a minimum record length of 30 years. This approach assesses the sensitivity of trends to the period analysed (Murphy et al., 2013). Positive and negative Z values indicate increasing and decreasing rainfall trends, respectively, while denotes statistical significance at the 5 % level.
4.1 Calibration and Evaluation
4.1.1 Statistical Reconstructions
Statistical reconstructions demonstrate clear skill in reproducing rainfall variability in both domains during the calibration (1930–1994) period. Cross-validation results for each domain and model are provided in the Supplement (Tables S1–S2), with only ensemble results for final models presented below. For both domains, Lasso regression marginally outperforms Random Forests in each month and for seasonal and annual aggregations and contributes slightly greater weight to the final ensemble.
Table 2 reports results for the weighted ensemble mean performance over the full calibration period (1930–1994) and the independent evaluation period (1865–1929), while Fig. 2 shows scatter plots of ensemble reconstructions by domain for each season and annually. For SA9 the weighted ensemble mean returns calibration period r values ranging from 0.84 to 0.91 across months, with PBIAS typically < 5 %. For the independent evaluation period, skill typically reduces slightly, with some months (April, July, October, and November) showing r values between 0.60 and 0.70. The largest PBIAS scores are evident for June (12.32 %) and September (16.55 %). For other months, PBIAS is well below 10 %. On a seasonal and annual basis, the ensemble reconstructions for SA9 typically show good performance and transferability between periods, with best performance in winter and the largest decrease in performance in autumn (SON), where r falls from 0.84 to 0.63. However, the PBIAS for all seasons and annual totals remains within 5 % for both calibration and validation periods. Similar performance characteristics are evident for SA-upland, but PBIAS scores are slightly higher. Here the largest decrease in correlation from calibration to validation occurs in autumn (SON), where r falls from 0.83 to 0.61. It is difficult to confirm whether decreases in performance moving from calibration to validation are due to data inhomogeneities in the early record or to overfitting. The strong performance of the models and the ensemble for cross-validation during the calibration window would suggest that data inhomogeneities cannot be ruled out.
There are notable differences in the predominant predictors used in each model between SA9 and SA-upland. For the majority of months in both domains, sea level pressure is the dominant predictor, most often LSLP, followed by g50. For SA9 in the winter months, the next most important predictor is the Paris-London index (pl), a surrogate for the NAO. However, in the SA-upland this is typically replaced by the EU index, whereas in spring and summer the pl index remains more important than in the lowland SA9.
Table 2Performance of monthly, annual and seasonal rainfall reconstructions for the weighted ensemble over the calibration (1930–1994) and independent validation (1865–1929) periods in the SA9 and SA-upland domains. Model skill is quantified using root mean square error (RMSE), mean absolute error (MAE), Pearson's correlation coefficient (R) and percent bias (PBIAS). Ensemble estimates are derived from a weighted combination of the Lasso and RF models based on inverse-squared RMSE. Seasons are defined as DJF (winter), MAM (spring), JJA (summer), SON (autumn), and MJJA (May–August).
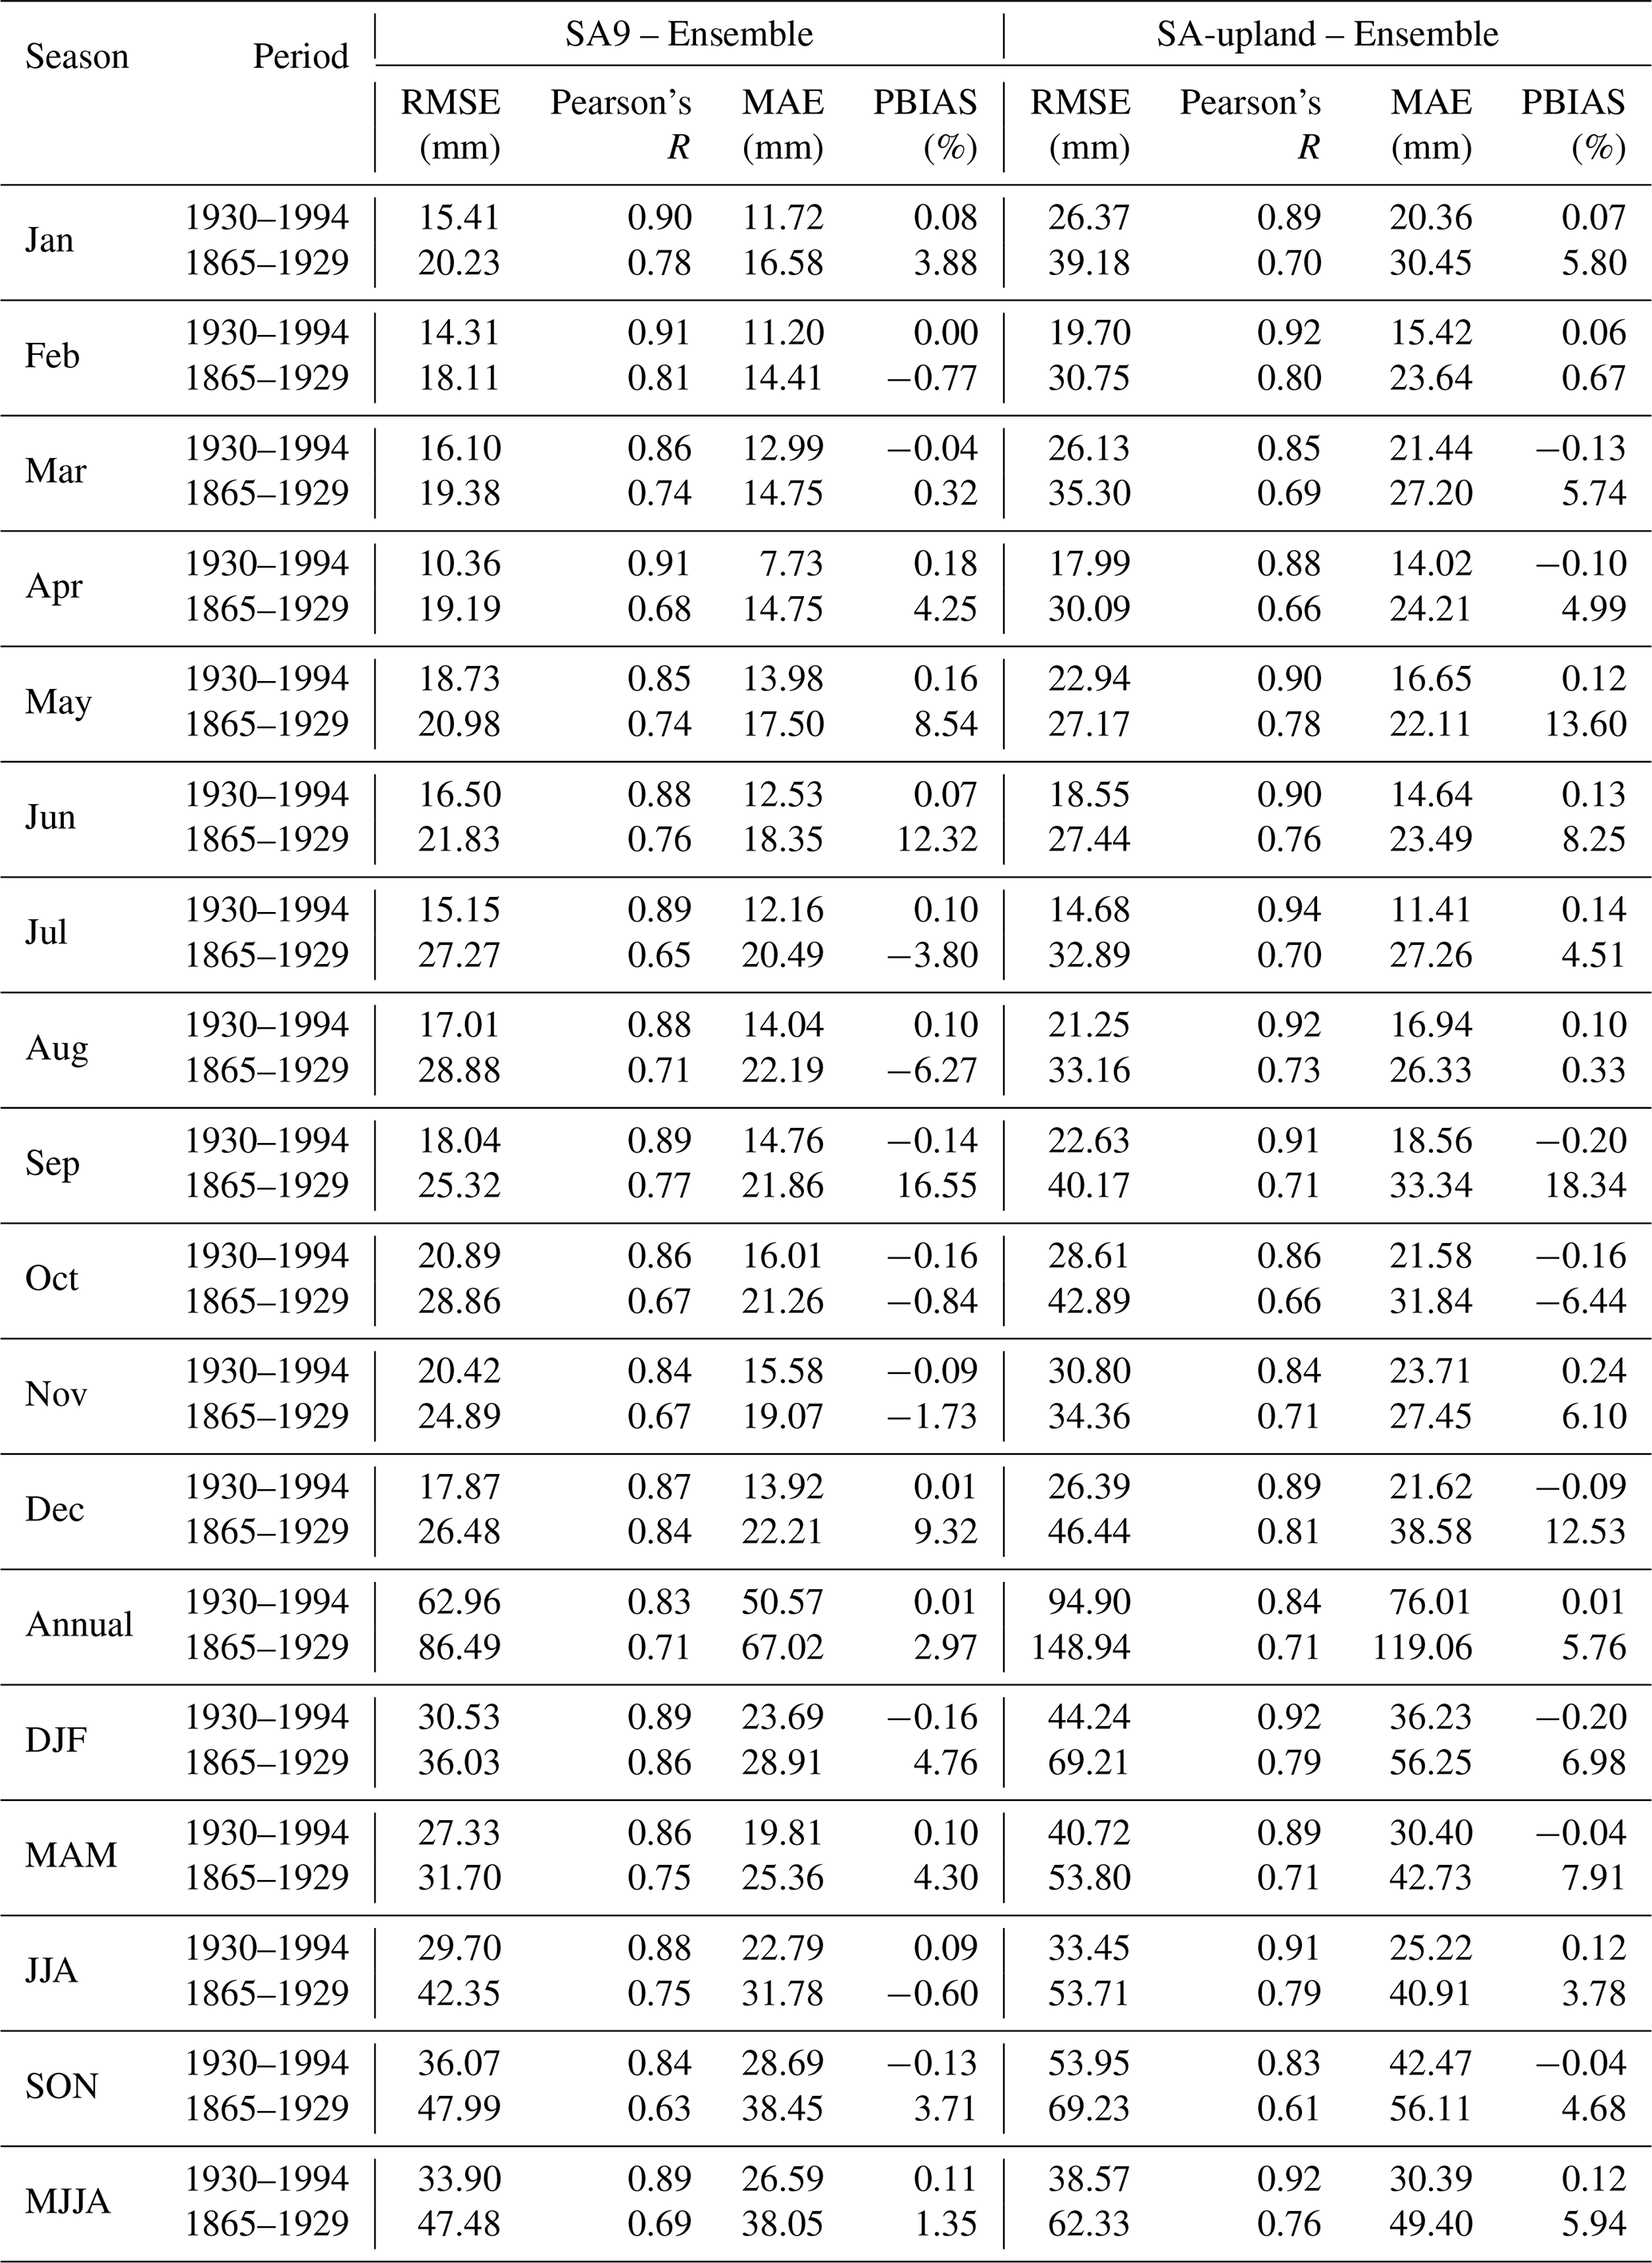
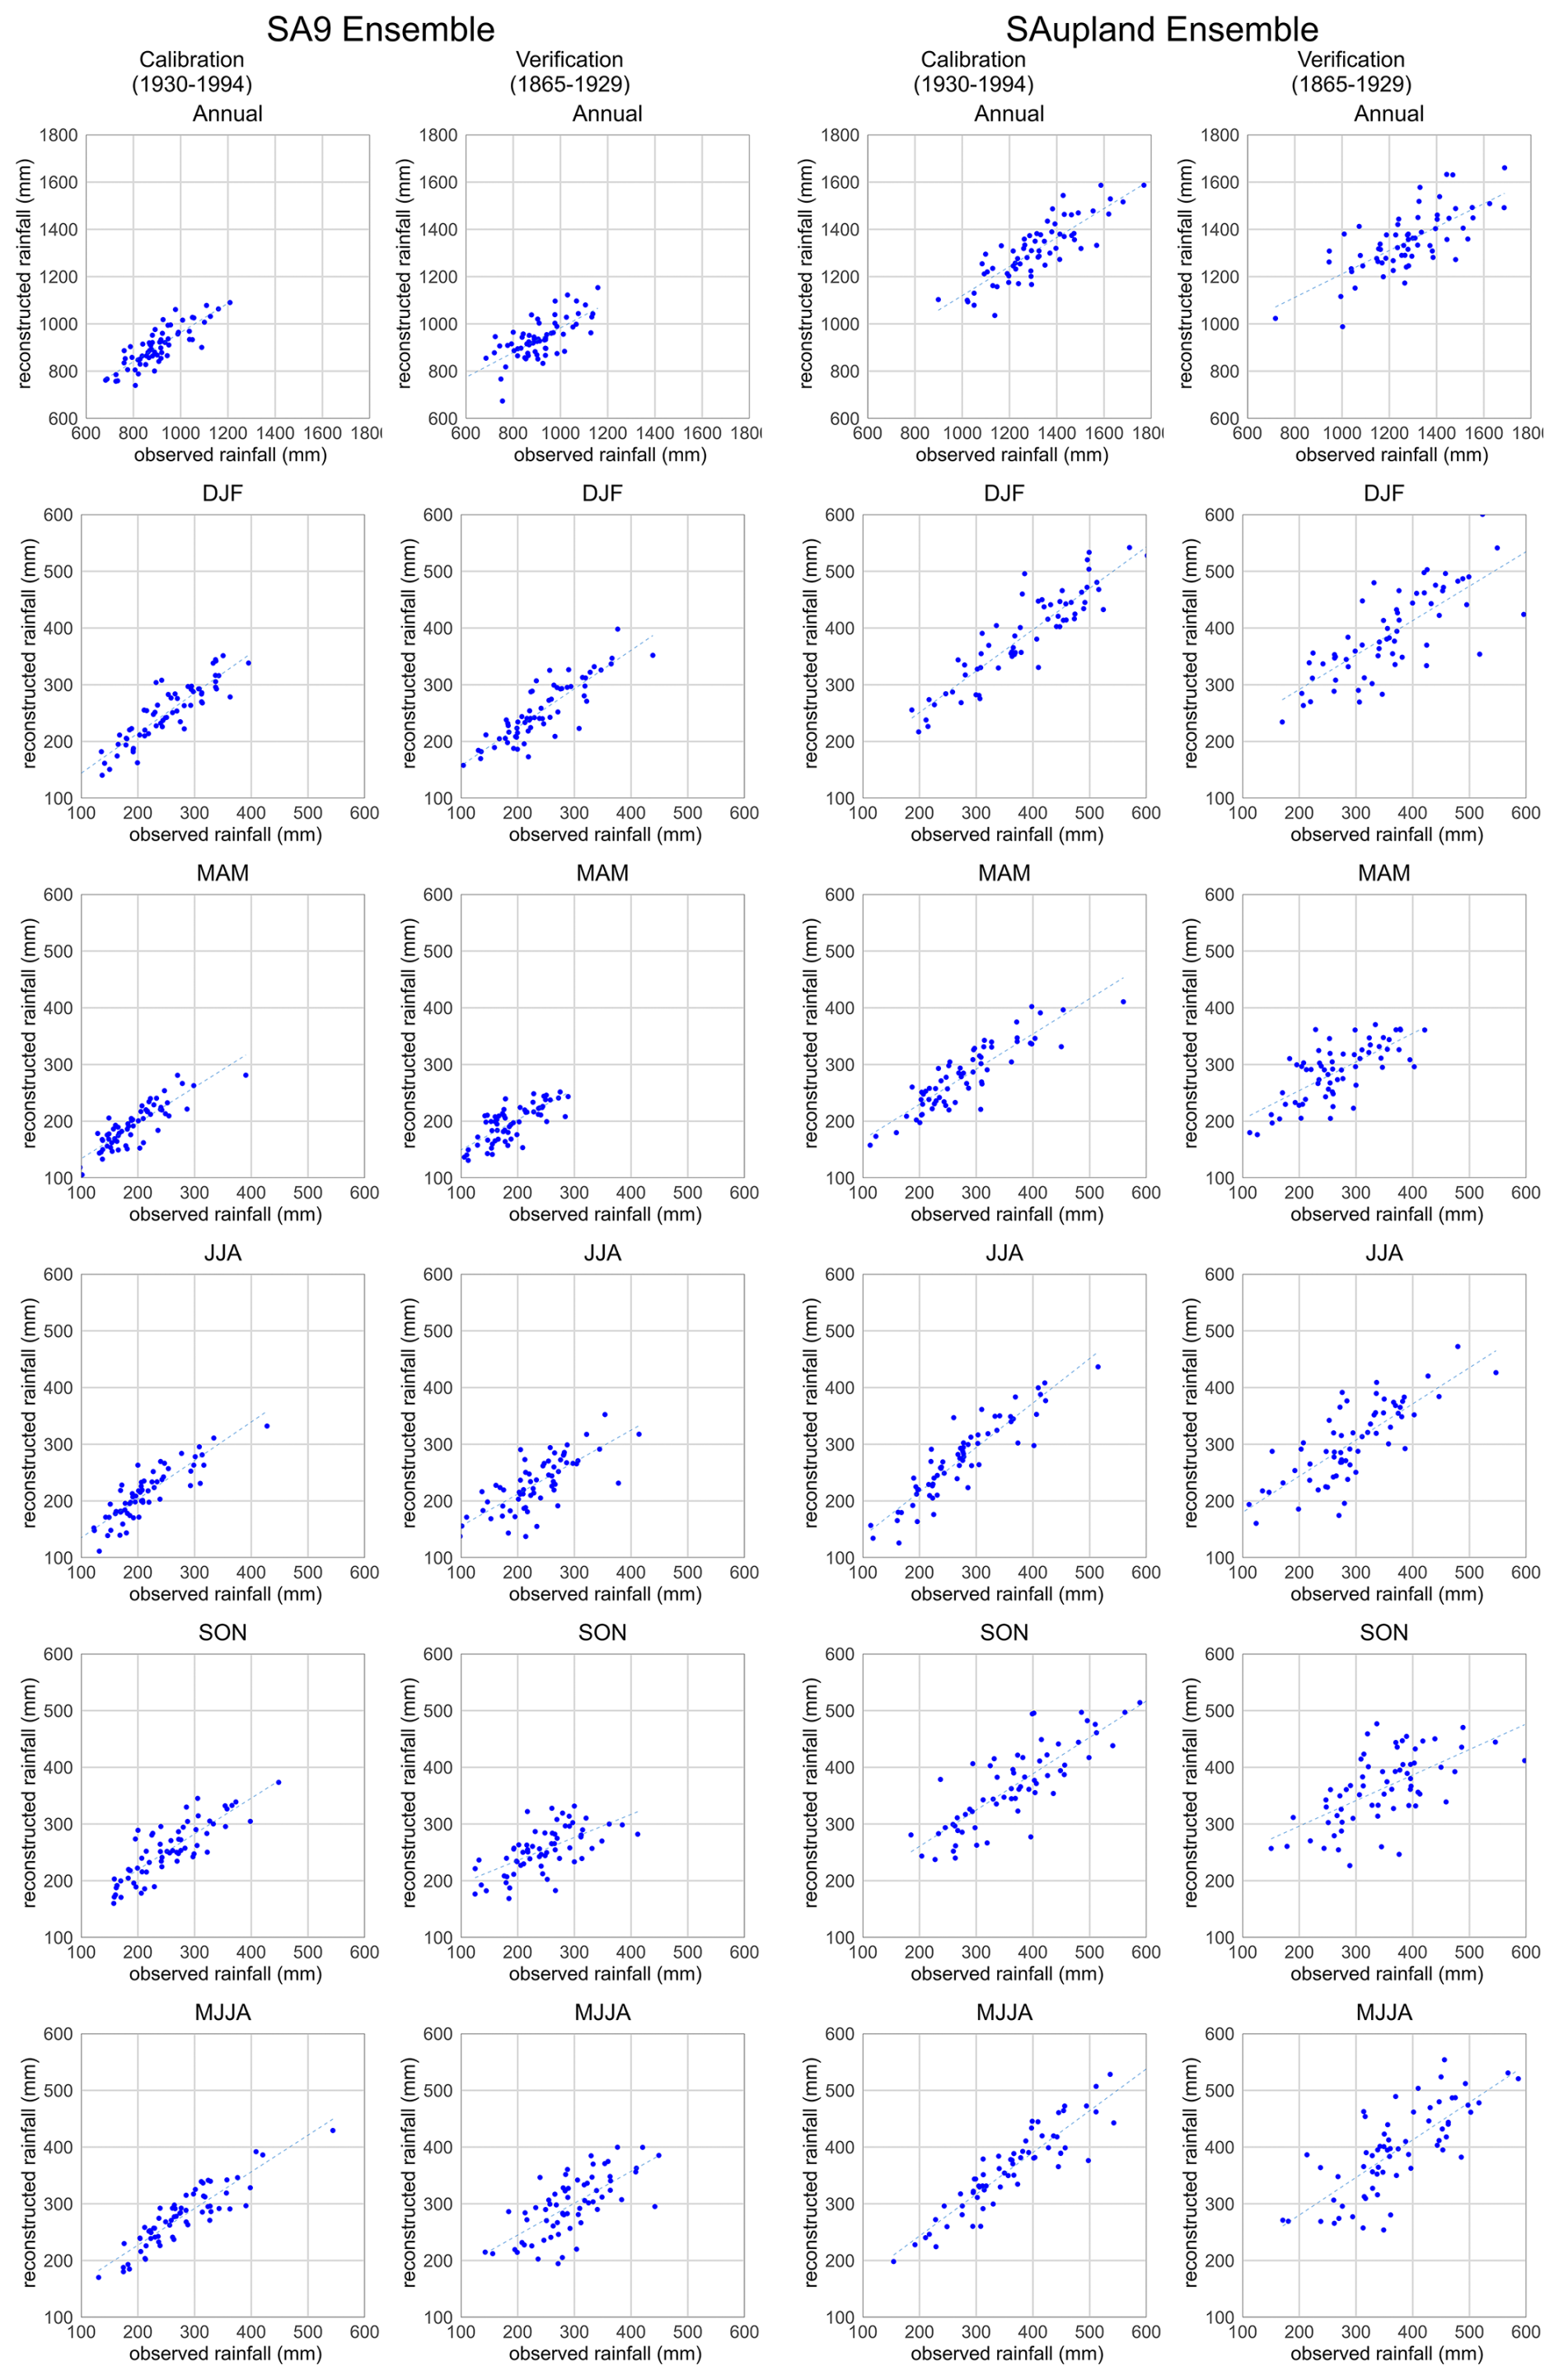
Figure 2Observed versus reconstructed rainfall for the weighted ensemble mean (weighted mean of LASSO and Random Forest) at annual and seasonal timescales (DJF, MAM, JJA, SON, and MJJA) in the SA9 (left) and SA-upland (right). Calibration results for 1930–1994 are shown in the left columns, and independent validation results for 1865–1929 in the right columns.
4.1.2 Jenkinson Reconstructions
The Jenkinson reconstruction is evaluated over the full overlap with observations (1865–1977). While this series lacks independence from the observations, it remains important to quantify its performance relative to the modern best estimate of rainfall across domains. The bootstrap distribution of annual average rainfall is shown in Fig. 3, indicating the higher totals in the SA-upland and greater variability in the AAR samples. Median reconstructions show clear skill at monthly and seasonal scales, with generally strong correlations and a large proportion of the variability explained, indicating that they reproduce the broad structure of SA9 rainfall variability (Table 3). Skill is strongest in winter (DJF) and summer (JJA), while SON is the weakest season in both domains. At the monthly scale, correlations are high throughout most of the year. In SA9 r ranges from 0.82 in October to 0.94 in June, while in SA-upland r ranges from 0.78 in October to 0.92 in June. PBIAS is greatest in January in SA9 (11.29 %) and in June in SA-upland (7.76 %). Figure 4 provides scatter plots between observed seasonal totals and Jenkinson reconstructions. The reconstructions good performance is evident, with some increased error at higher totals in MAM and MJJA in both domains.
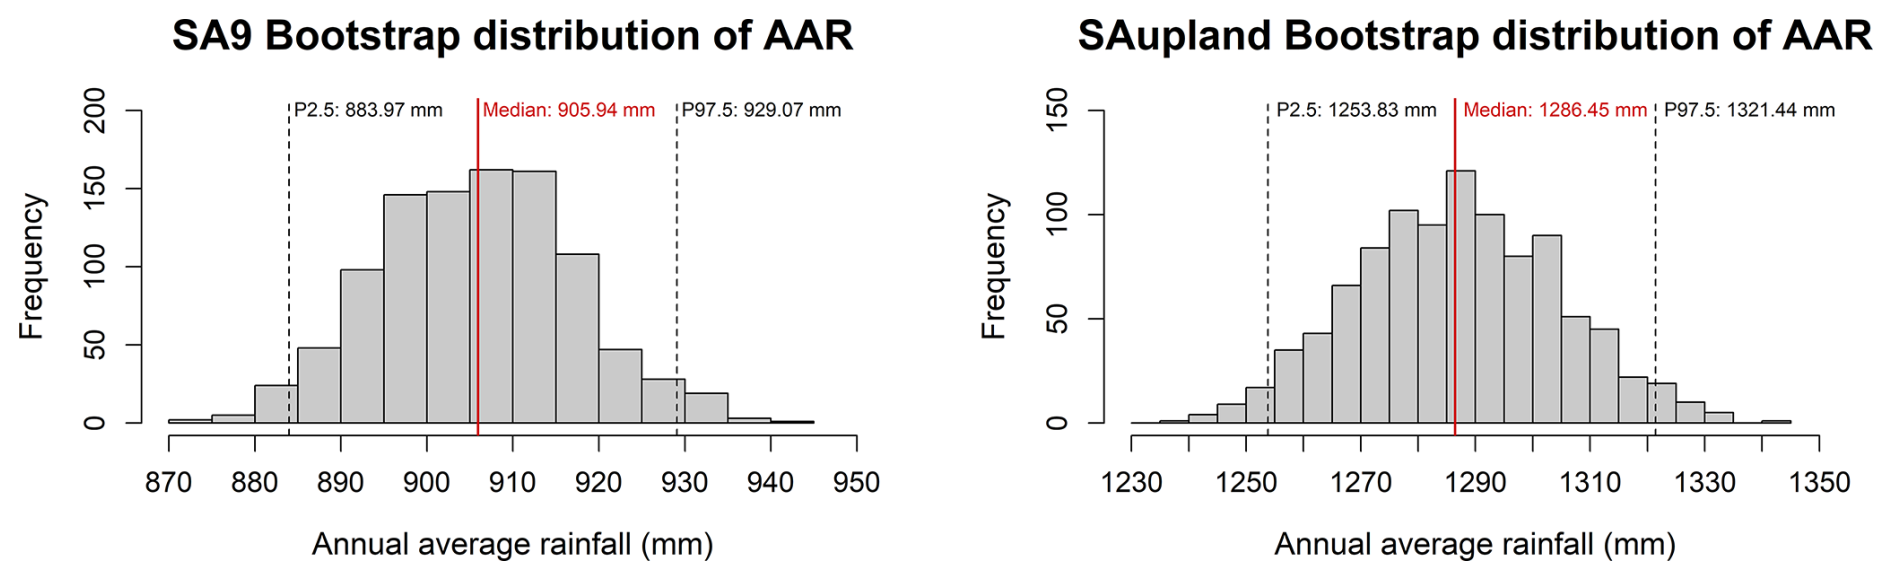
Figure 3Bootstrap distribution of the SA9 (left) and SA-upland (right) annual average rainfall (AAR), based on 1000 resamples of annual totals for the period 1865–1975, obtained by resampling with replacement from the observed annual totals.
Table 3Skill metrics for the SA9 and SA-upland Jenkinson rainfall reconstructions at monthly, annual and seasonal timescales, including MJJA (May–August). Model performance is evaluated using root mean square error (RMSE), Pearson's correlation coefficient (R), mean absolute error (MAE) and percent bias (PBIAS), computed from matched observed and reconstructed totals over the full period of overlap between observed and reconstructed series (1865–1977).
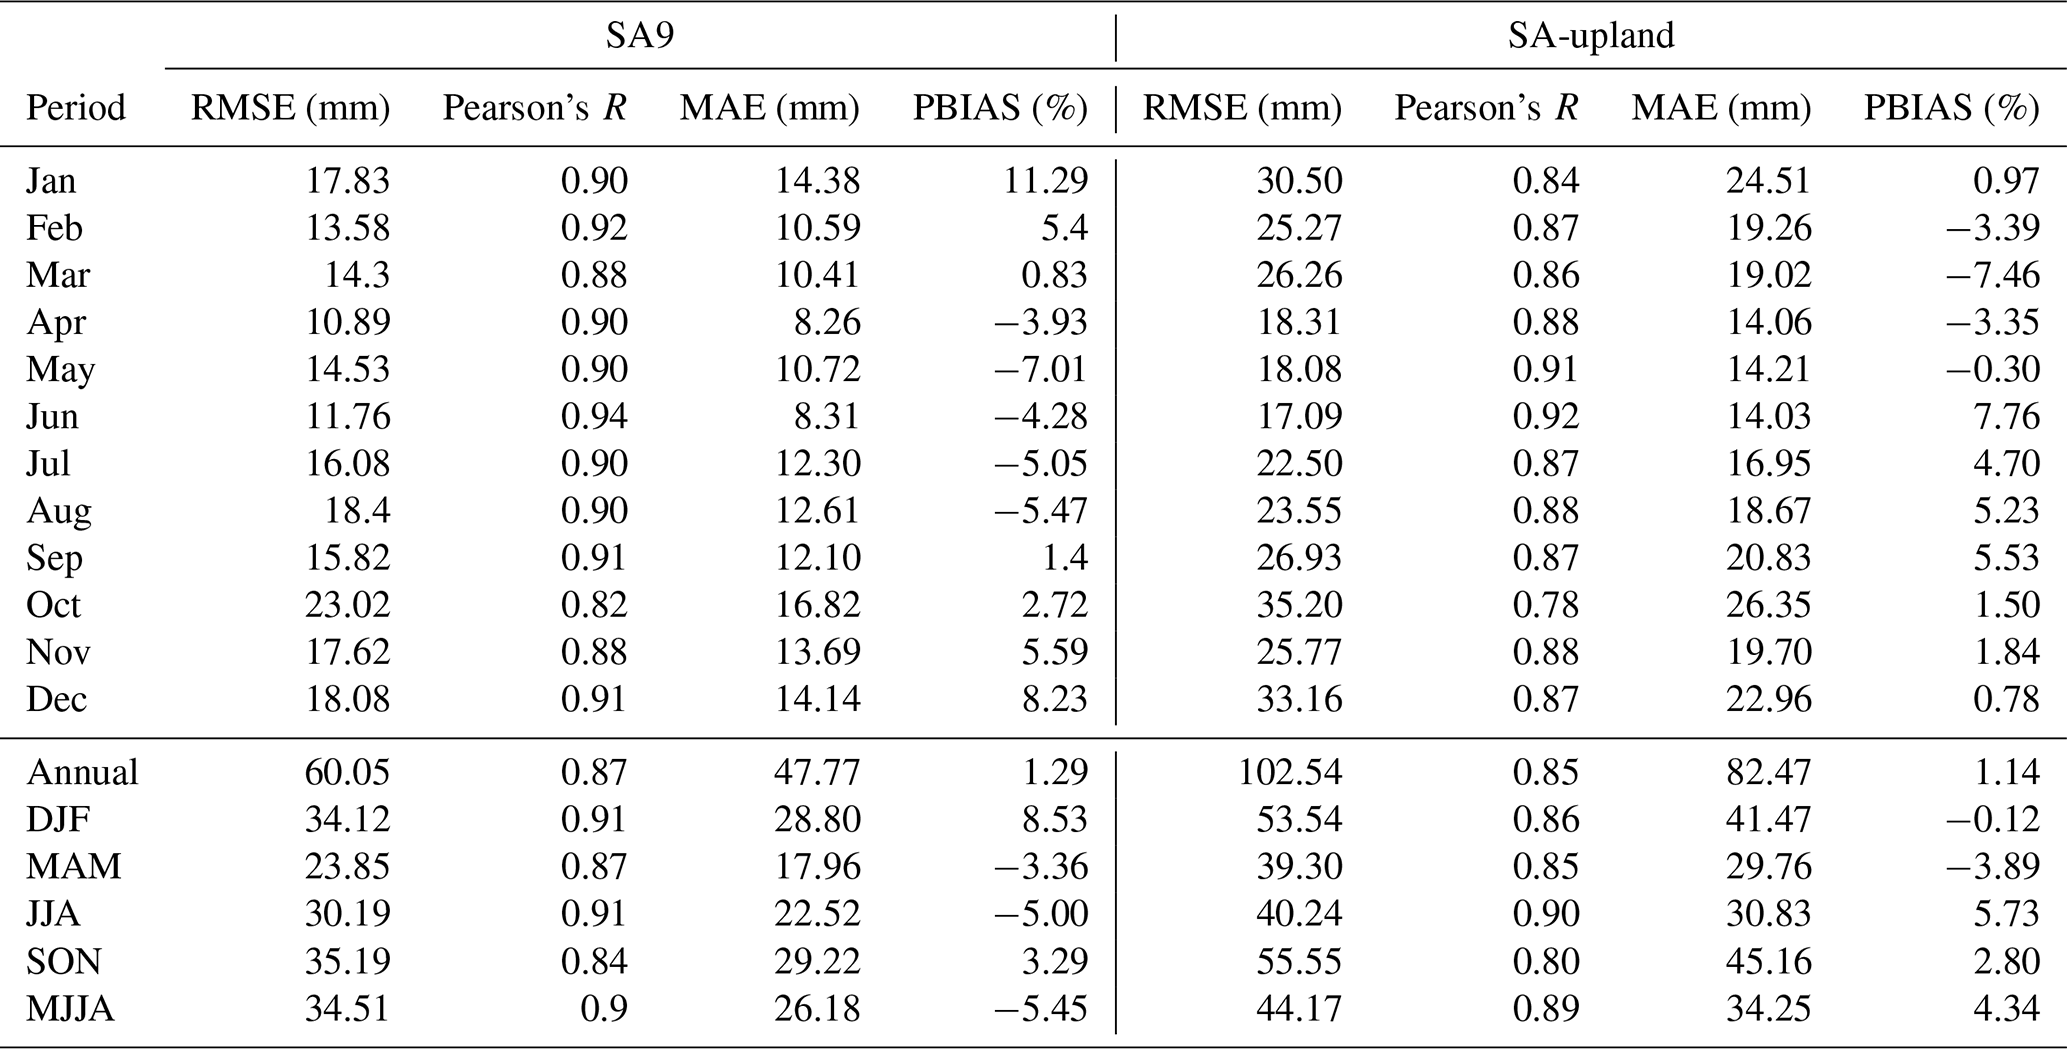
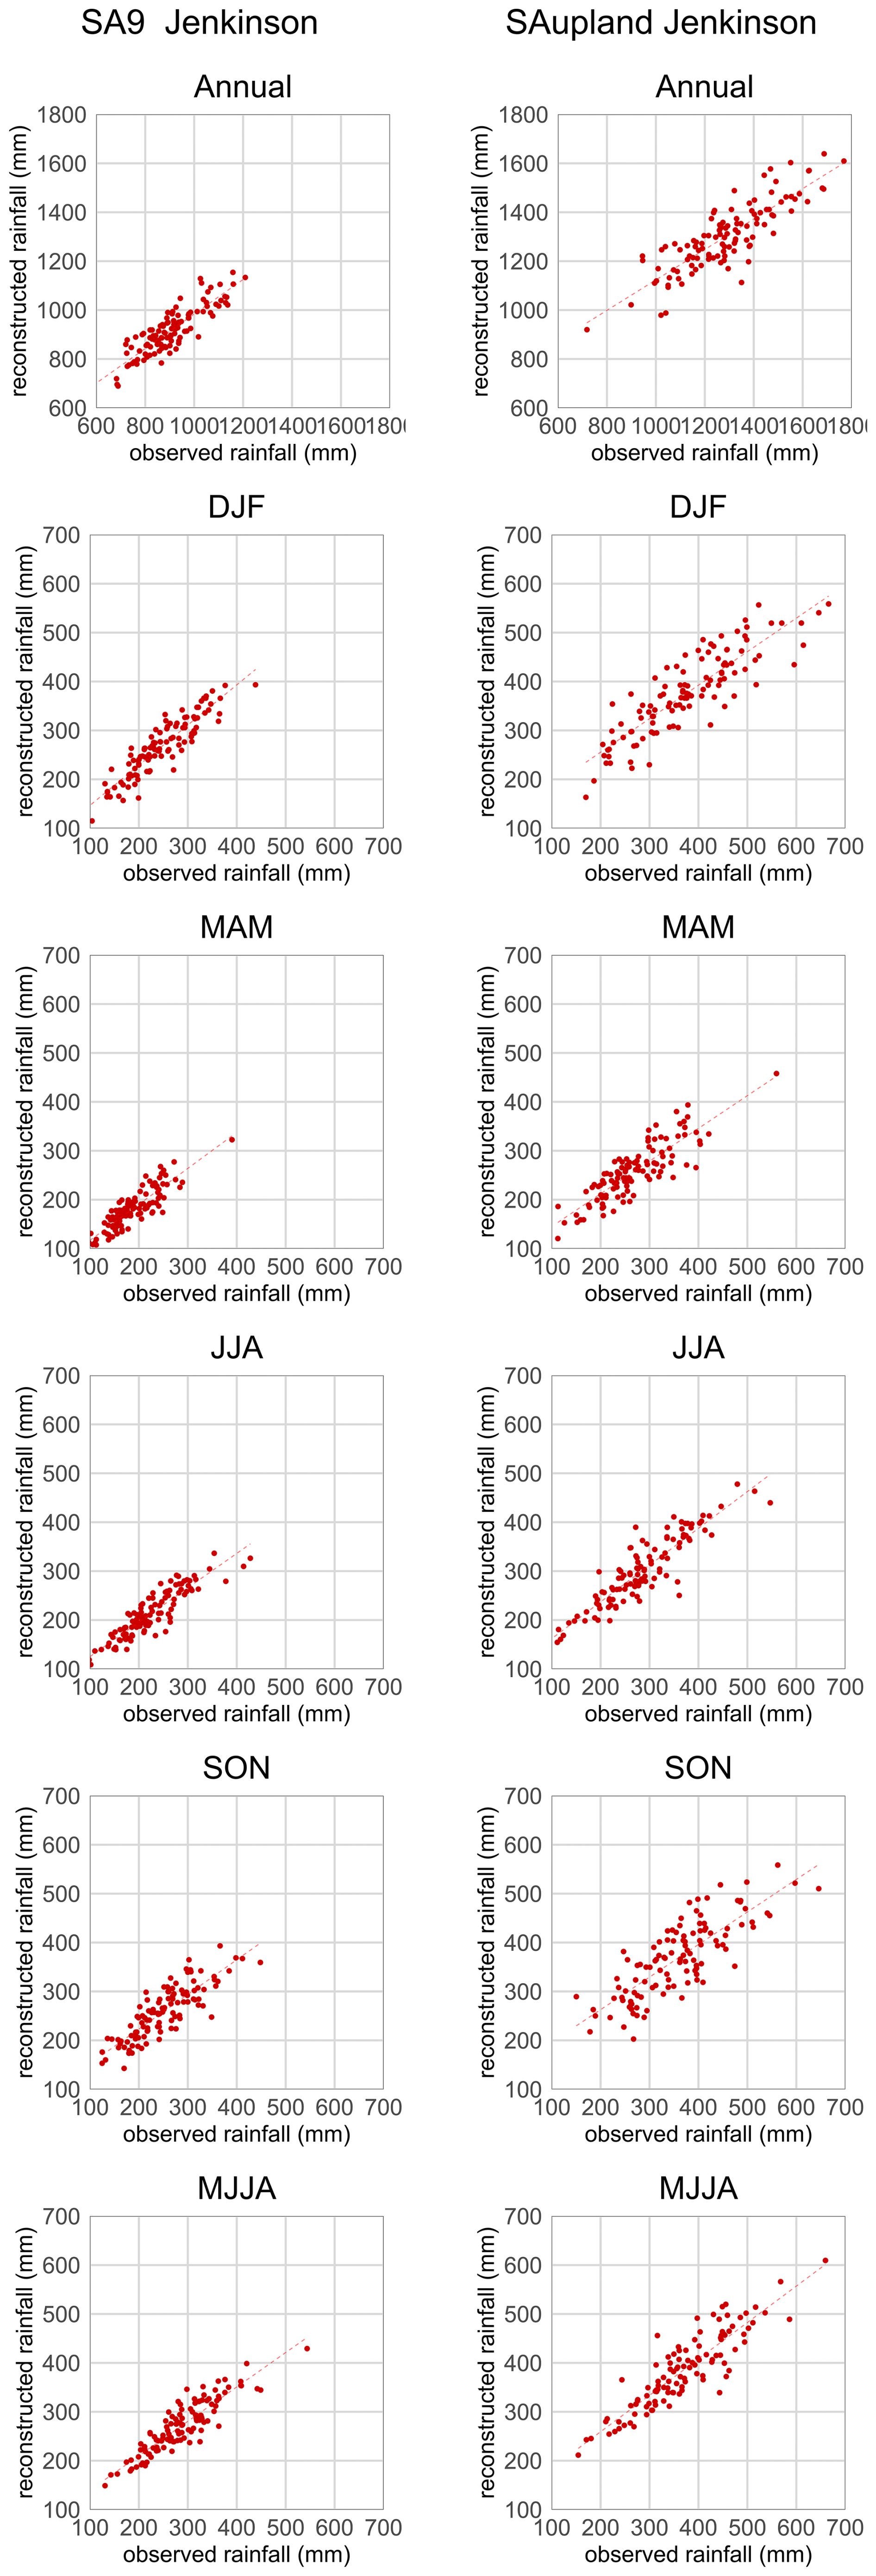
Figure 4Observed versus reconstructed SA9 (left) and SA-upland (right) rainfall for the Jenkinson-based reconstructions over 1865–1977 at annual and seasonal timescales (DJF, MAM, JJA, SON, and MJJA).
4.1.3 δ18O Reconstructions
The δ18O-based reconstruction provides an independent estimate of MJJA rainfall variability, calibrated over 1930–2000 and evaluated against observations for 1865–1929 (Table 4; Fig. 5). The reconstructed series shows a moderate and consistent relationship with observed MJJA rainfall in both domains across both calibration (SA9: r=0.56; SA-upland: r=0.54) and validation (SA9: r=0.52; SA-upland: r=0.54) periods. PBIAS scores are also very small for both domains. Split-period calibrations using early and late subsets of the overlap period (Table S3) yield comparable performance, indicating that the proxy-rainfall relationship is not strongly sensitive to the choice of calibration window.
Table 4Performance metrics for the δ18O-based MJJA (May–August) rainfall reconstruction in the SA9 and SA-upland domains. Model performance is reported for the calibration period (1930–2000) and an independent validation period (1865–1929). Metrics include root mean square error (RMSE), mean absolute error (MAE), Pearson's correlation coefficient (r), and percent bias (PBIAS), calculated from matched observed and reconstructed seasonal totals. Reconstructed values correspond to the median of the bootstrap ensemble.
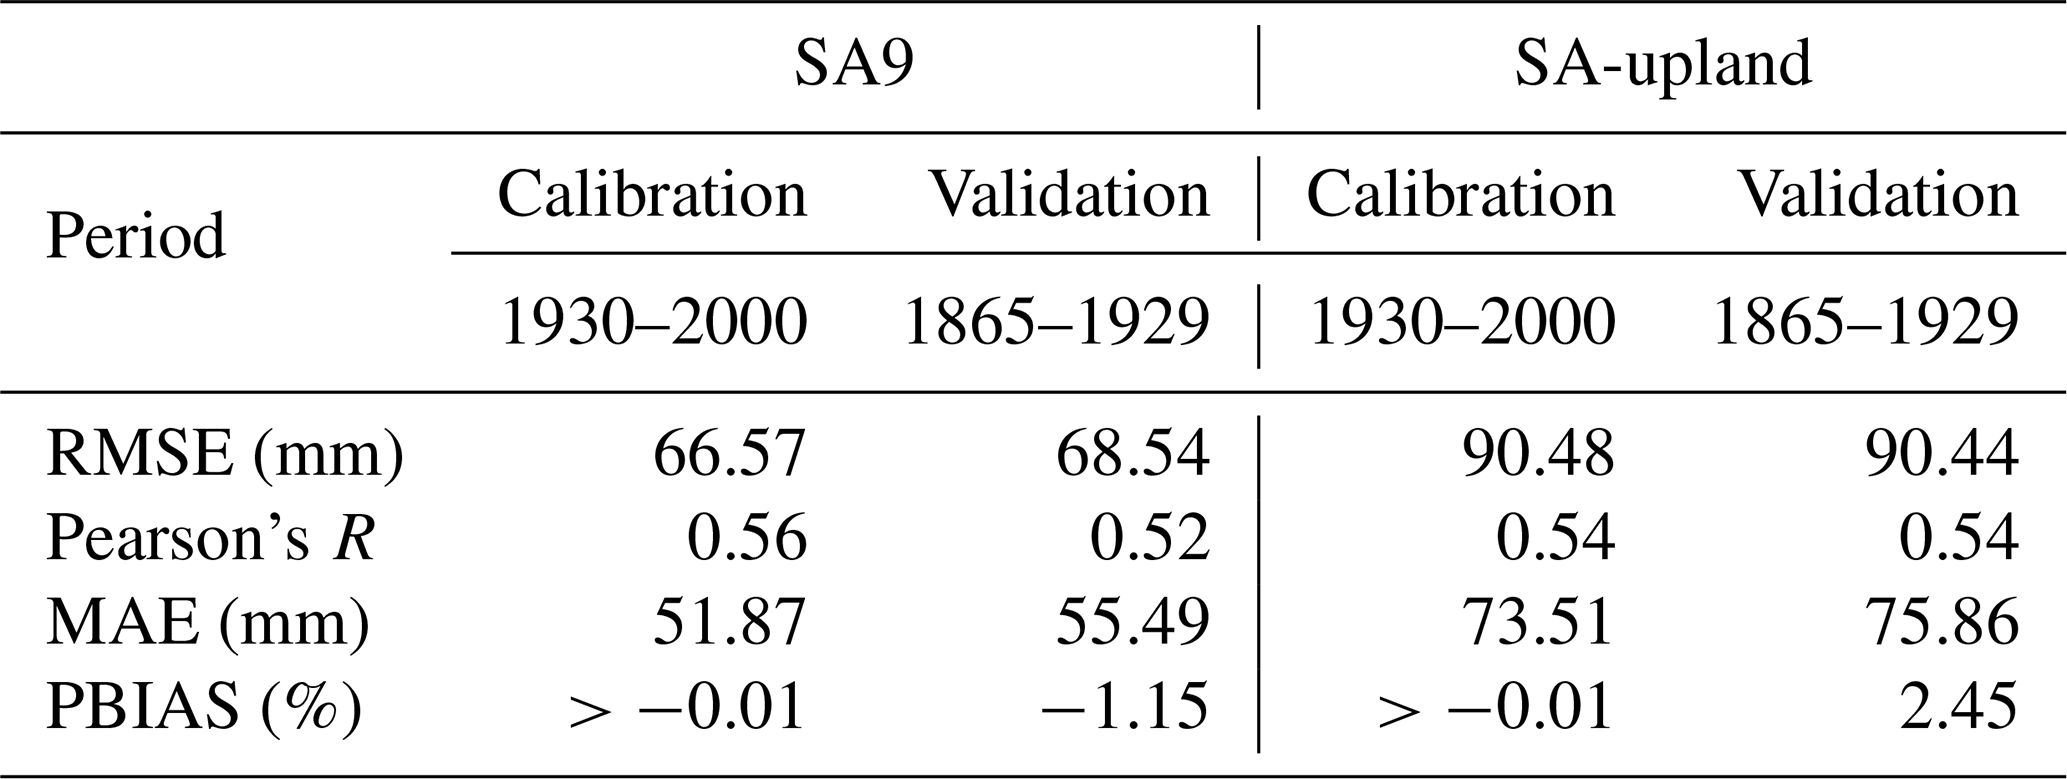
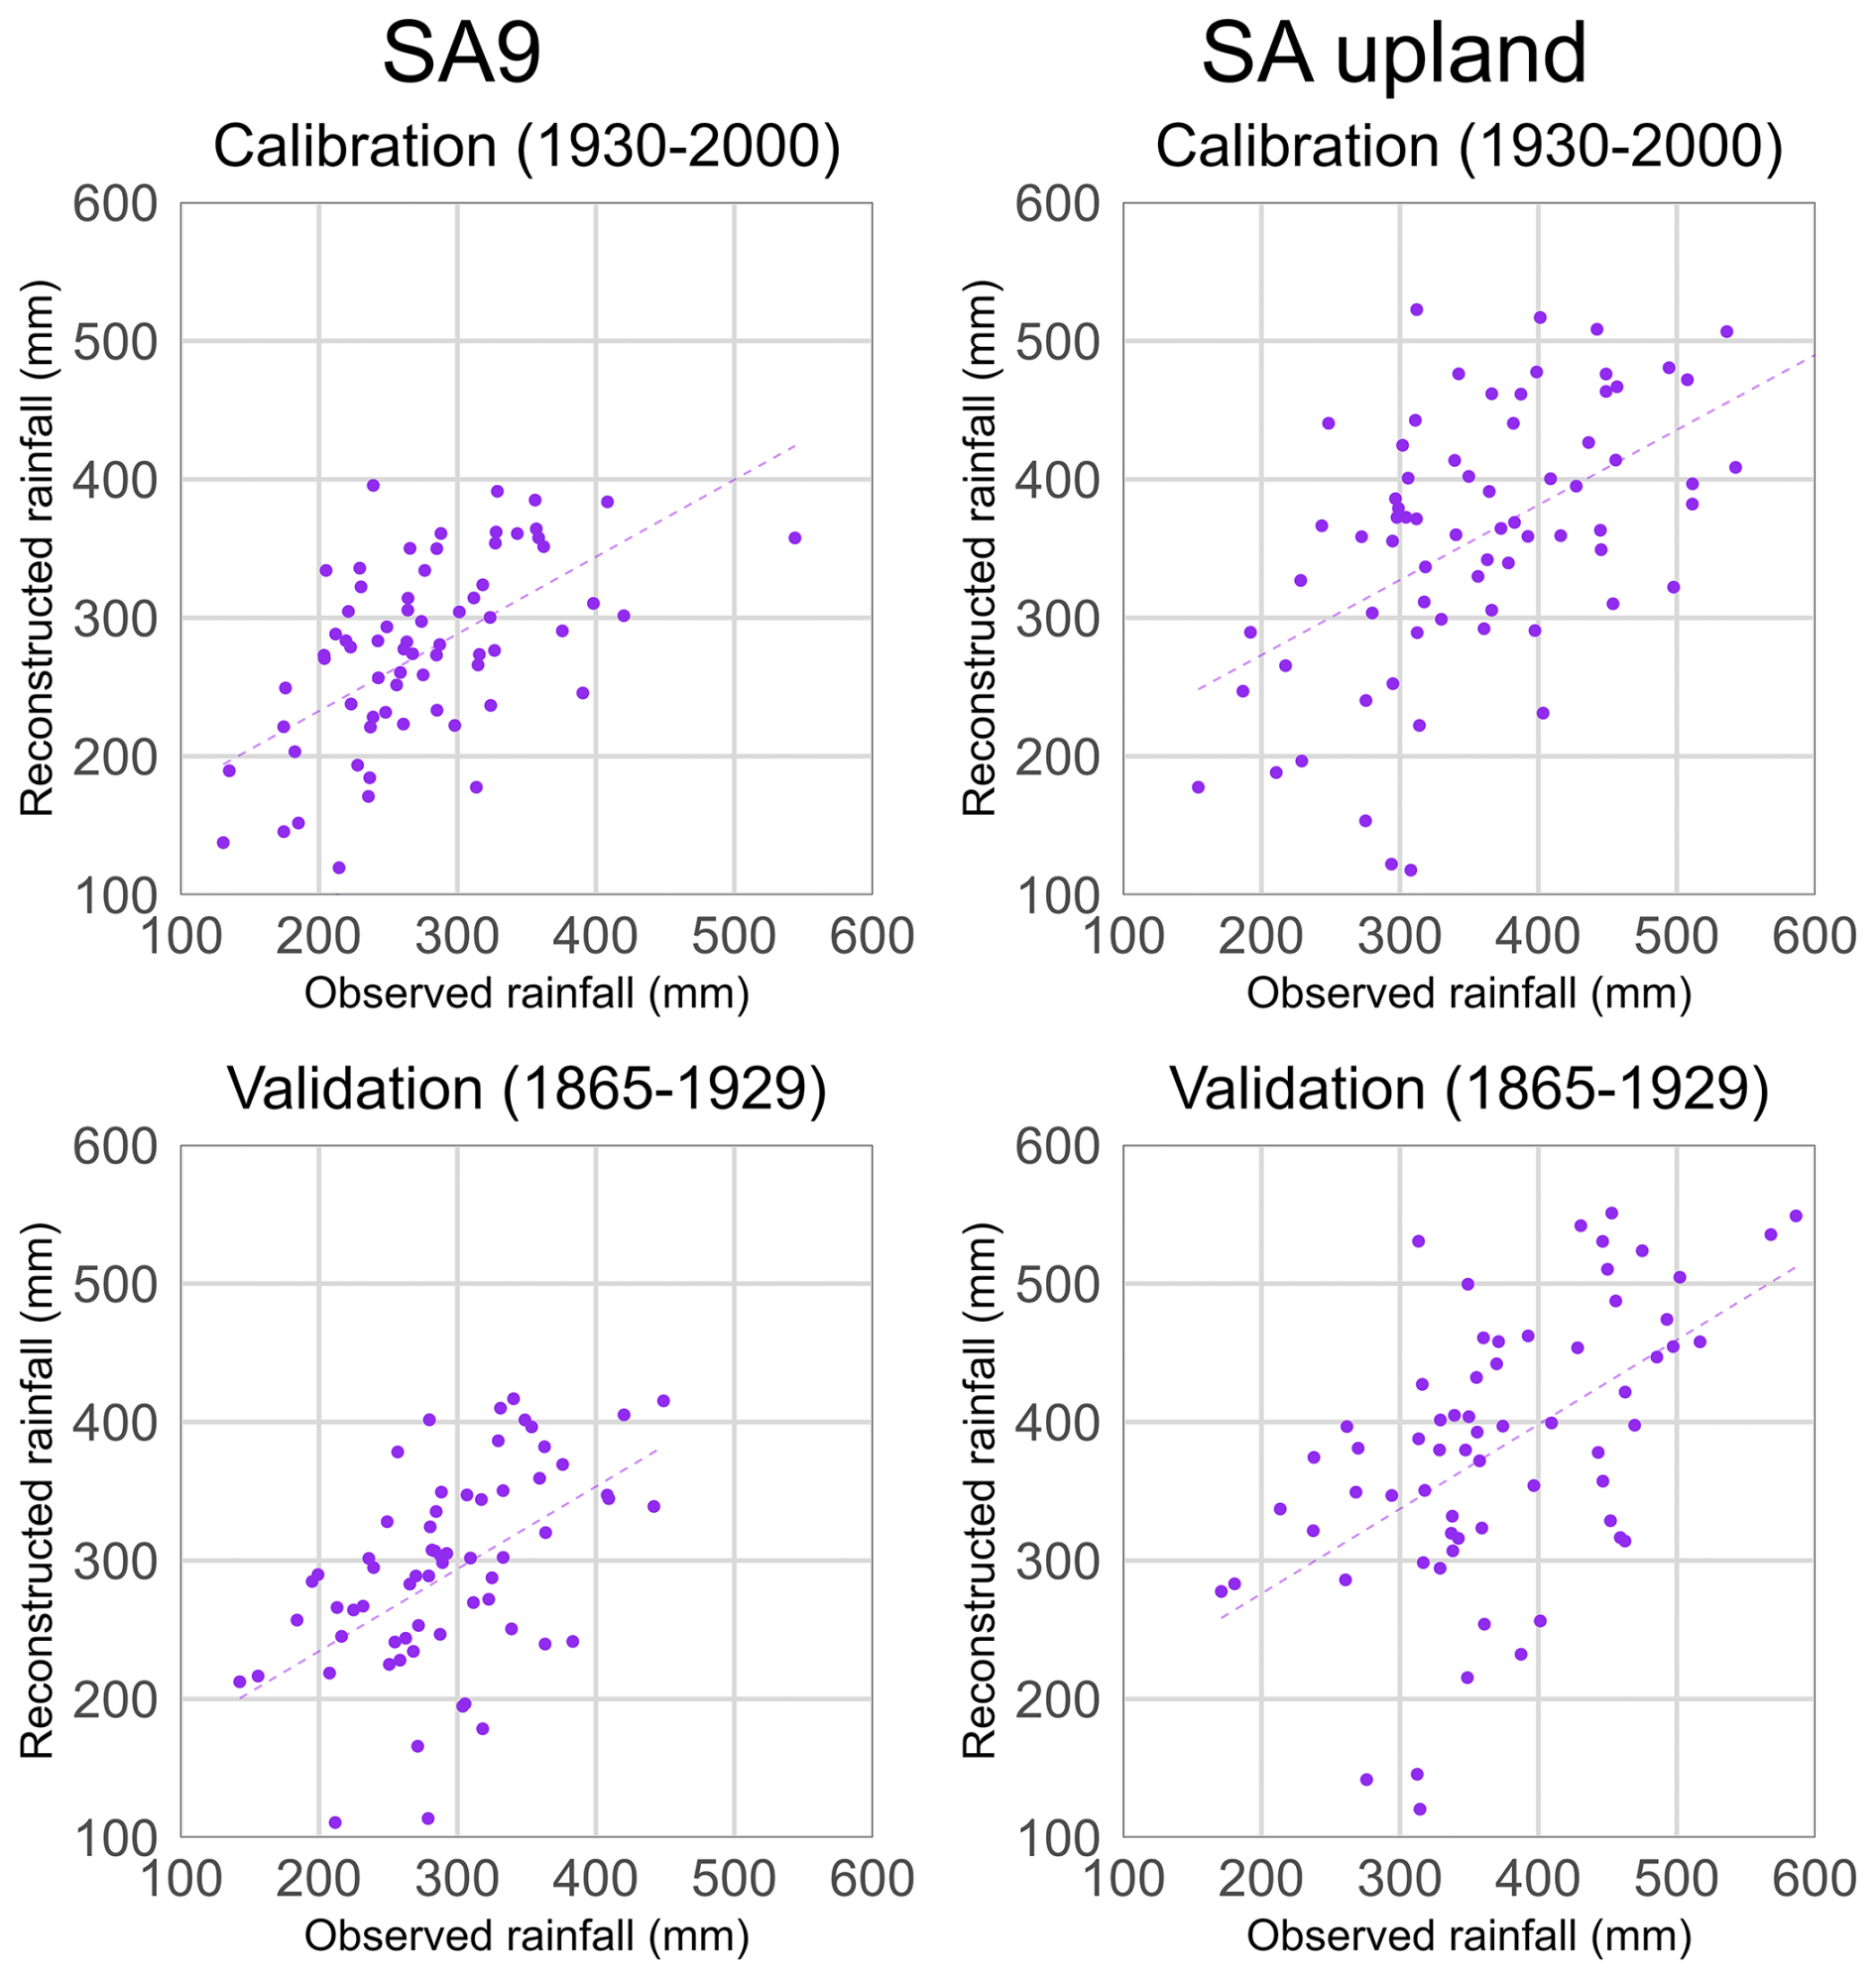
Figure 5Observed versus reconstructed MJJA rainfall totals for SA9 (left) and SA-upland (right) based on the tree-ring δ18O reconstruction. Panels show calibration (1930–2000; top) and validation (1865–1929; bottom) periods. Reconstructed values represent the median model estimates for each year. Each point corresponds to an individual year, and dashed lines indicate least-squares linear regression fits, illustrating model performance during calibration and independent validation.
4.2 Performance over a common period
Given that each method required different calibration approaches, we next compare the performance of each reconstruction across the common overlap with observations 1865–1977. Both the weighted ensemble and Jenkinson reconstructions reproduce observed rainfall variability in SA9 and SA-upland well at annual, seasonal and monthly scales. However, as expected, the Jenkinson reconstruction generally shows the stronger agreement with observations (Table 5). At the annual scale (Table 5 and Fig. 6), both reconstructions capture broad interannual rainfall variability in each domain. The Jenkinson reconstruction returns higher correlations and lower errors than the ensemble. In SA9, annual rainfall correlation is 0.87 for the Jenkinson reconstruction compared with 0.76 for the weighted ensemble, while RMSE falls from 78.62 mm for the ensemble to 60.05 mm for Jenkinson. In SA-upland annual correlation rises from 0.75 for the weighted ensemble to 0.85 for Jenkinson, accompanied by a reduction in RMSE from 130.64 to 102.54 mm. Biases are small for both methods, indicating that the main differences lie in their ability to capture year-to-year variability rather than mean totals.
Table 5Performance metrics for the weighted ensemble and Jenkinson reconstructions relative to observed rainfall in SA9 and SA-upland over the common period 1865–1977, evaluated at monthly, seasonal and annual scales. Metrics include root mean square error (RMSE), mean absolute error (MAE), Pearson's correlation coefficient (r), and percent bias (PBIAS).
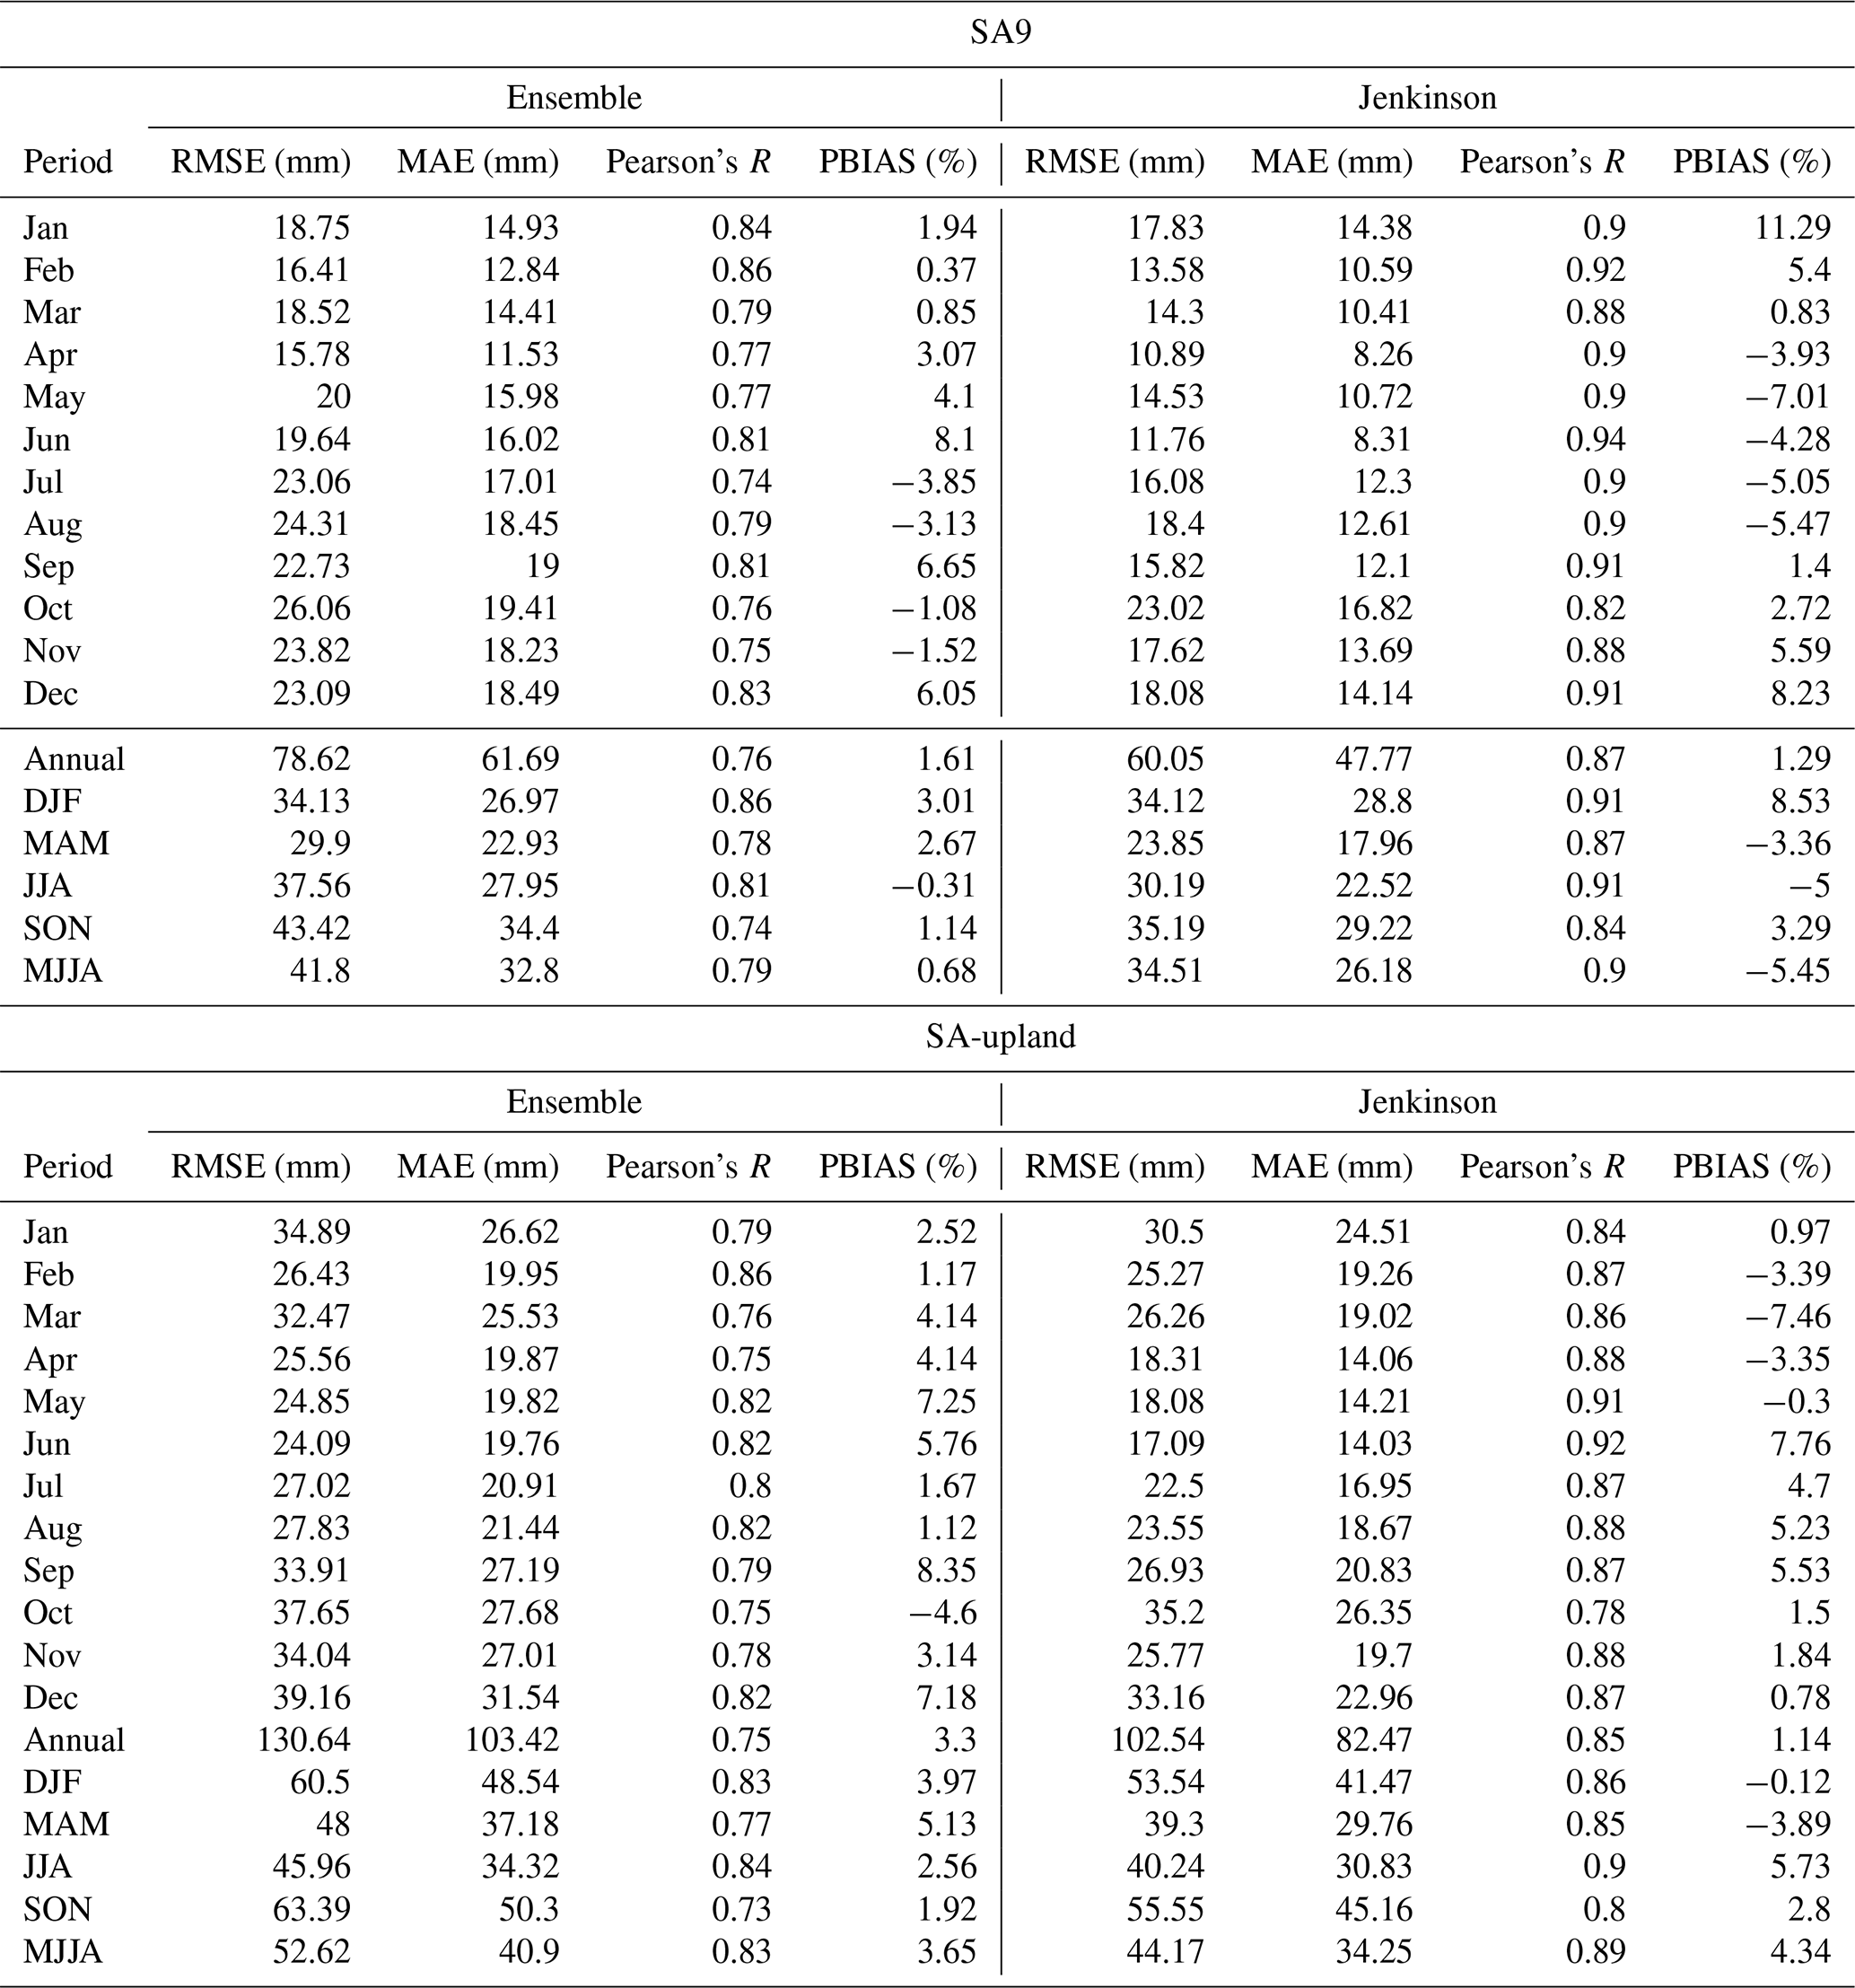
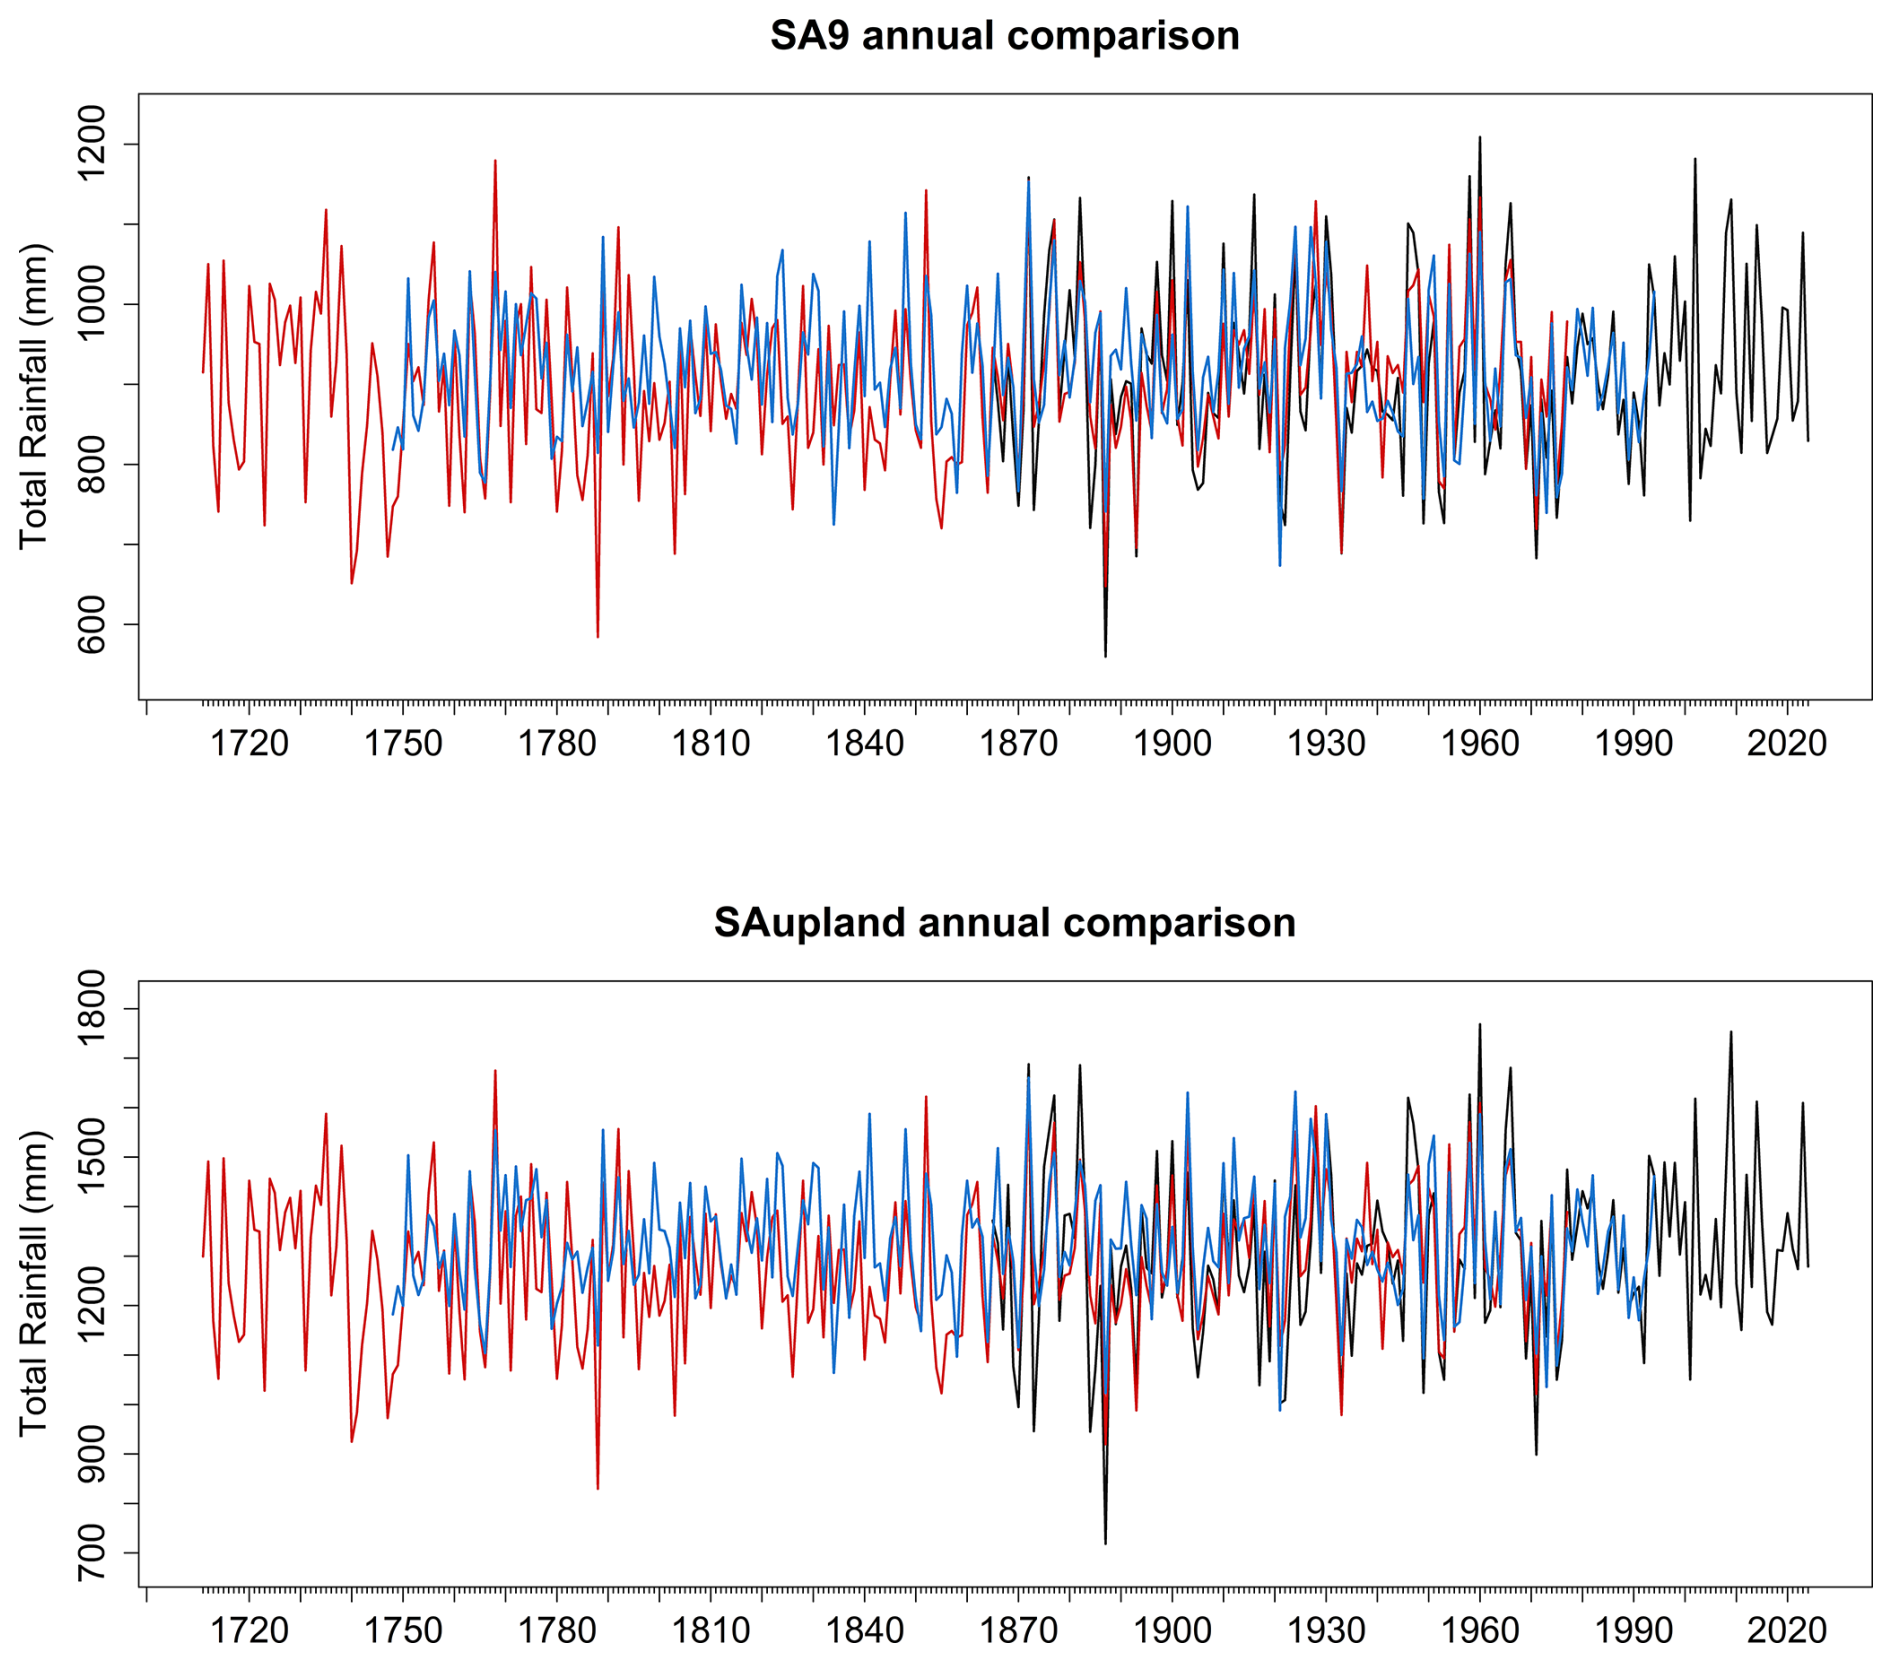
Figure 6Comparison of annual SA9 and SA-upland rainfall totals from the statistical and Jenkinson reconstructions and the observations. The blue line represents the weighted ensemble reconstruction (1748–1994), while the red line shows the Jenkinson-based reconstruction (1711–1977). The black line shows the observed rainfall (1865–2024). All values are expressed as annual totals (mm). Annual differences between each reconstruction and observations over their common period are shown in Fig. S3.
At the seasonal scale (Table 5 and Fig. 7), the Jenkinson reconstruction again outperforms the weighted ensemble across most seasons and in both domains. In SA9, the highest seasonal performance is obtained for winter and summer. For DJF, correlations are 0.91 for Jenkinson and 0.86 for the ensemble, while in JJA the contrast is larger, with correlations of 0.91 and 0.81, respectively. MAM and SON show the same ordering, with Jenkinson correlations of 0.87 and 0.84, compared with 0.78 and 0.74 for the ensemble. Errors are also consistently lower for Jenkinson, especially in spring, summer and autumn. The same broad pattern is evident in SA-upland. Correlations for the weighted ensemble range from 0.73 in SON to 0.84 in JJA, whereas Jenkinson correlations range from 0.80 in SON to 0.90 in JJA. Thus, although both reconstructions reproduce observed seasonality, the Jenkinson approach provides a closer representation of seasonal rainfall variability in both domains, given the integration of observed data.
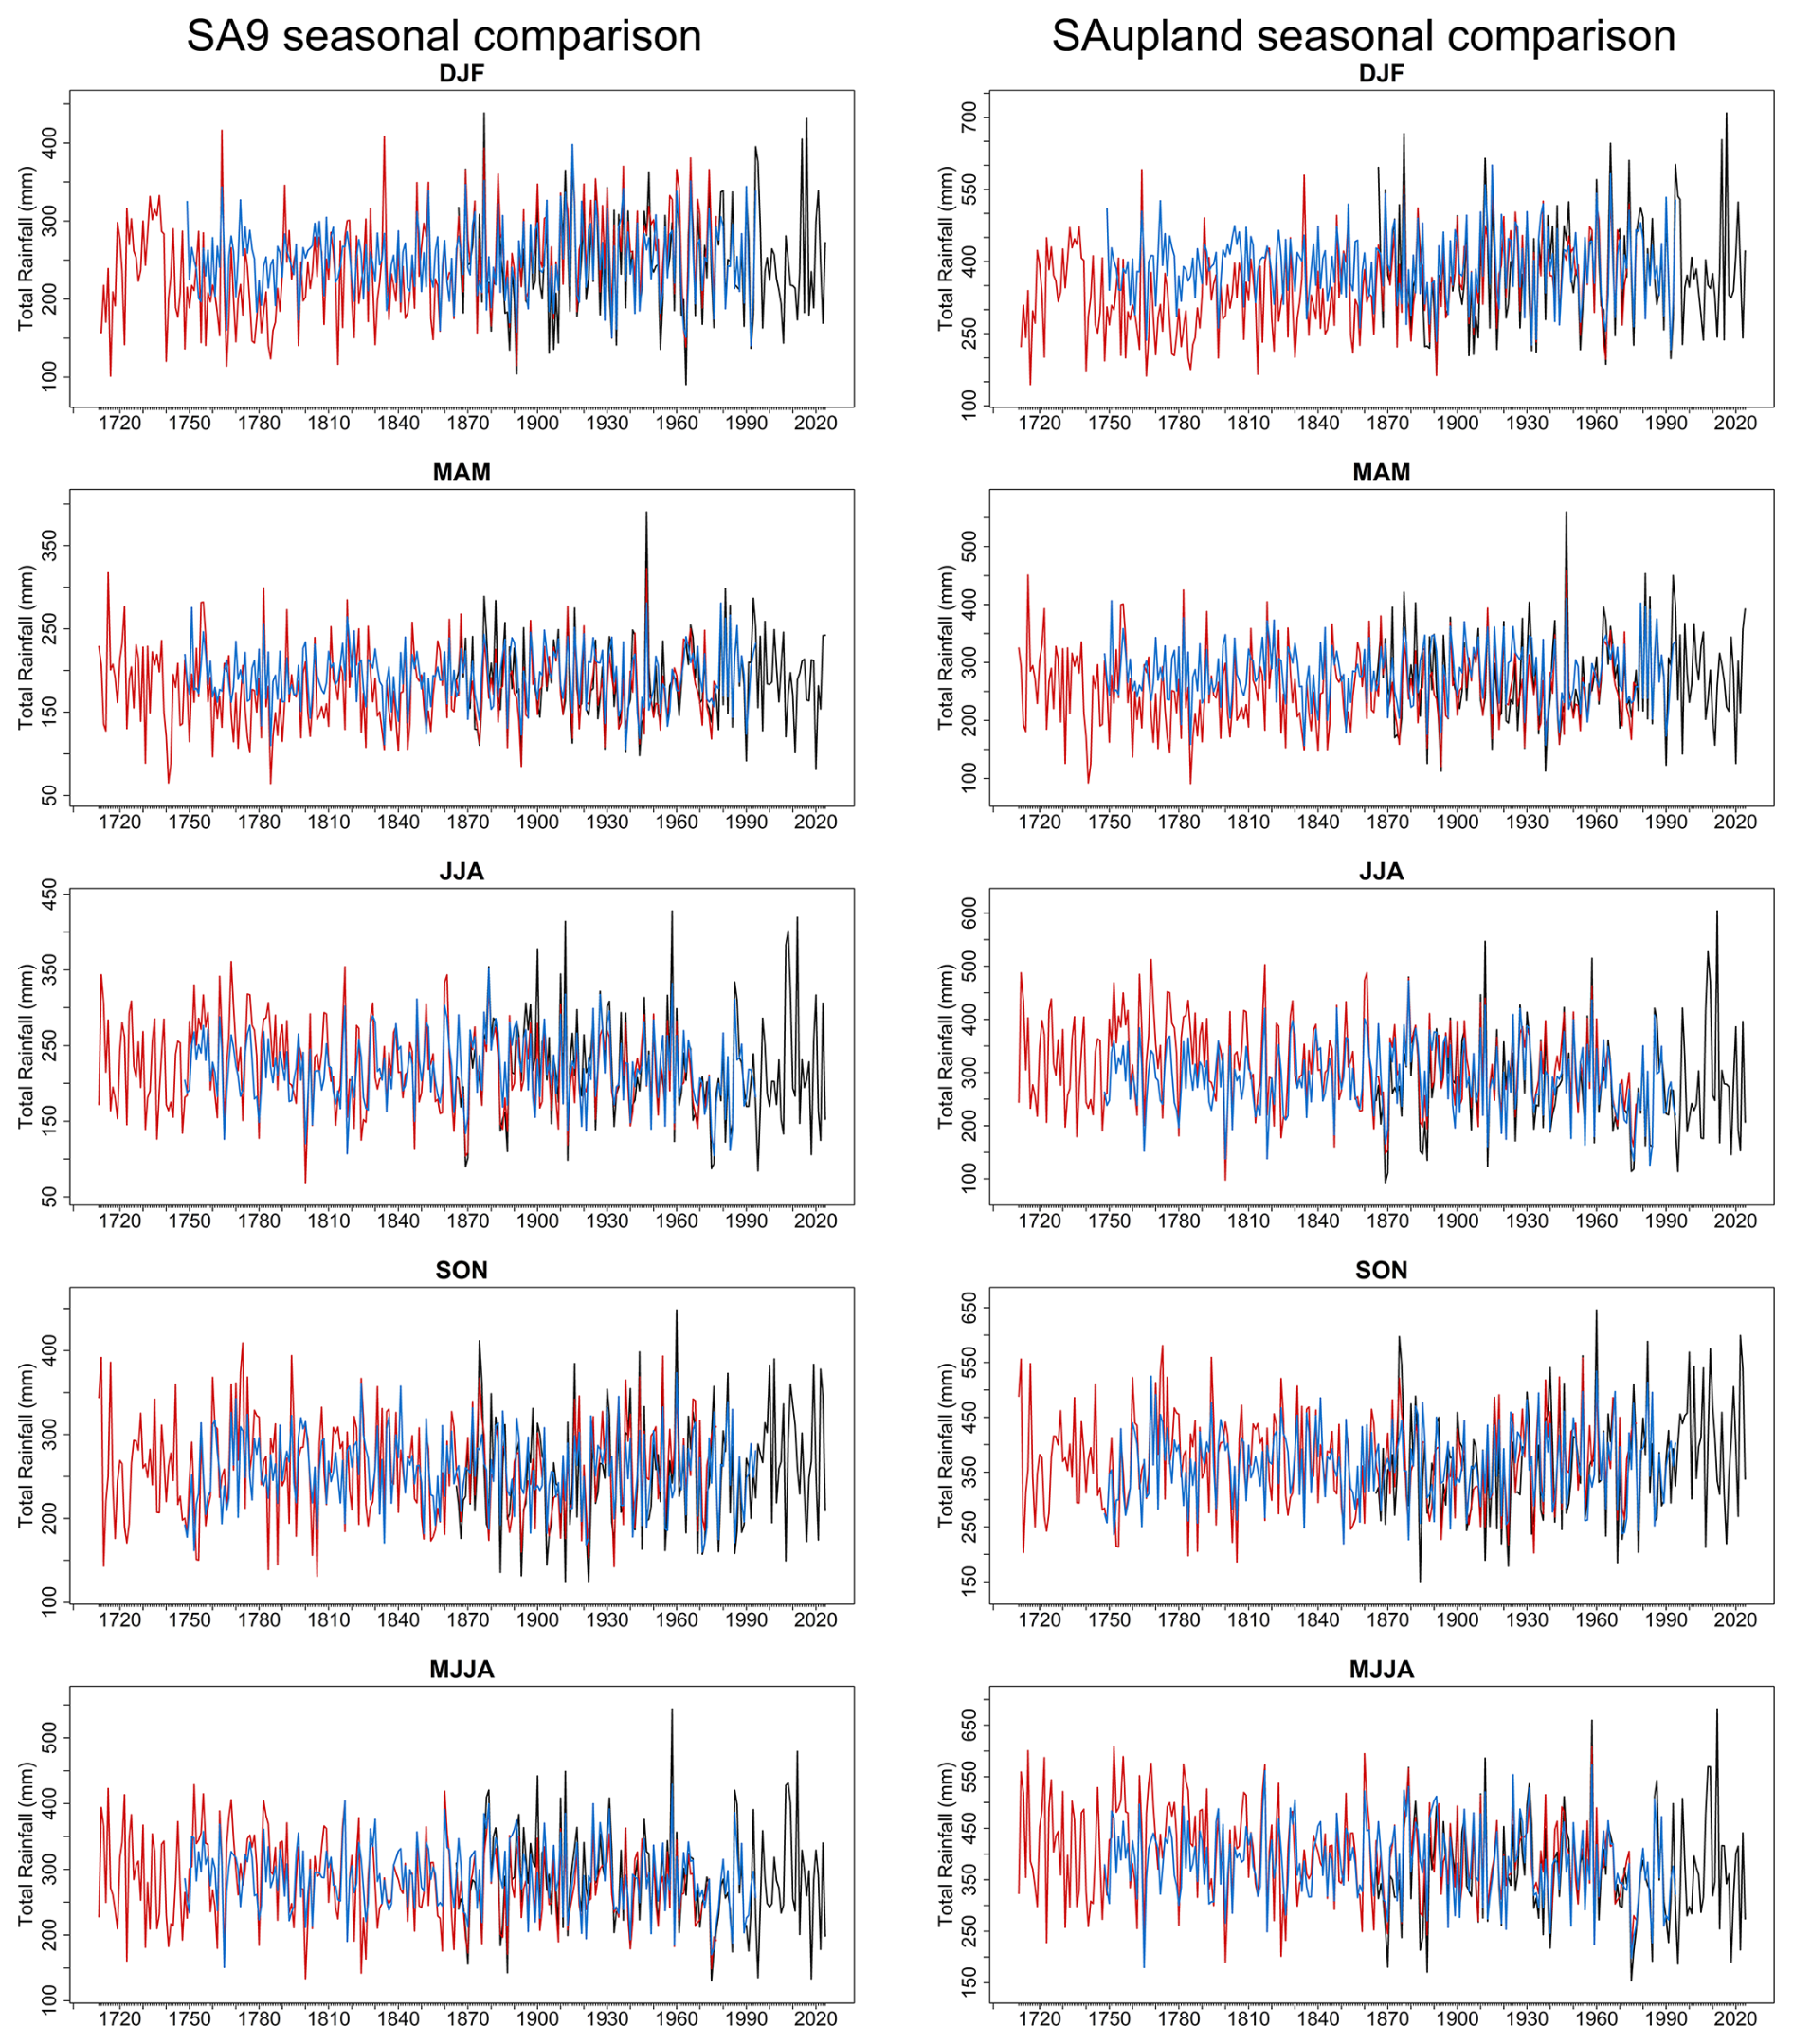
Figure 7Comparison of seasonal SA9 (left) and SA-upland (right) rainfall totals from the statistical and Jenkinson reconstructions and observations. Panel shows DJF, MAM, JJA, SON, and MJJA totals. The blue line represents the weighted ensemble mean reconstruction (1748–1994), while the red line shows the Jenkinson-based reconstruction (1711–1977). The black line shows observed rainfall (1865–2024). All values are expressed as seasonal totals (mm). Corresponding seasonal difference series are shown in Fig. S4.
The monthly results (Table 5) show a similar, and in some respects even clearer, contrast between the two approaches. For SA9, the weighted ensemble monthly correlations range from 0.74 in July to 0.86 in February, while Jenkinson ranges from 0.82 in October to 0.94 in June. In the SA-upland, ensemble correlations range from 0.75 in April and October to 0.86 in February, while Jenkinson ranges from 0.78 in October to 0.92 in June. Thus, monthly skill is consistently high for both reconstructions, but almost always higher for Jenkinson.
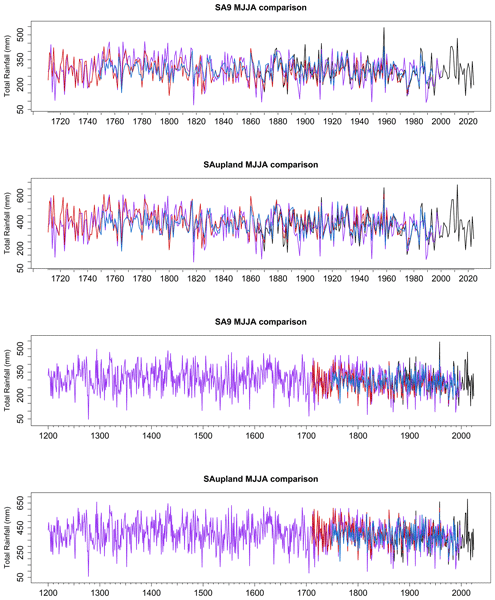
The MJJA season permits comparison among all three reconstruction approaches (Table 6 and Fig. 8). In SA9, the Jenkinson reconstruction shows the strongest agreement with observations, with r=0.90, RMSE = 34.51 mm and MAE = 26.18 mm. The weighted ensemble performs less well, with r = 0.79, RMSE = 41.80 mm and MAE = 32.80 mm. The δ18O reconstruction is markedly weaker, with a correlation of 0.54 and substantially larger errors (RMSE = 67.97 mm; MAE = 54.25 mm). In the SA-upland, the same ranking is observed: Jenkinson again performs best (r=0.89; RMSE = 44.17 mm), followed by the weighted ensemble (r=0.83; RMSE = 52.62 mm), while the δ18O reconstruction remains much weaker (r=0.54; RMSE = 90.91 mm). Notably, all three approaches show relatively small PBIAS values.
Table 6Performance metrics for the weighted ensemble mean, Jenkinson, and δ18O-based reconstructions relative to observed MJJA (May–August) rainfall in SA9 and SA-upland over the common period 1865–1977. Metrics include root mean square error (RMSE), mean absolute error (MAE), Pearson's correlation coefficient (r) and percent bias (PBIAS).
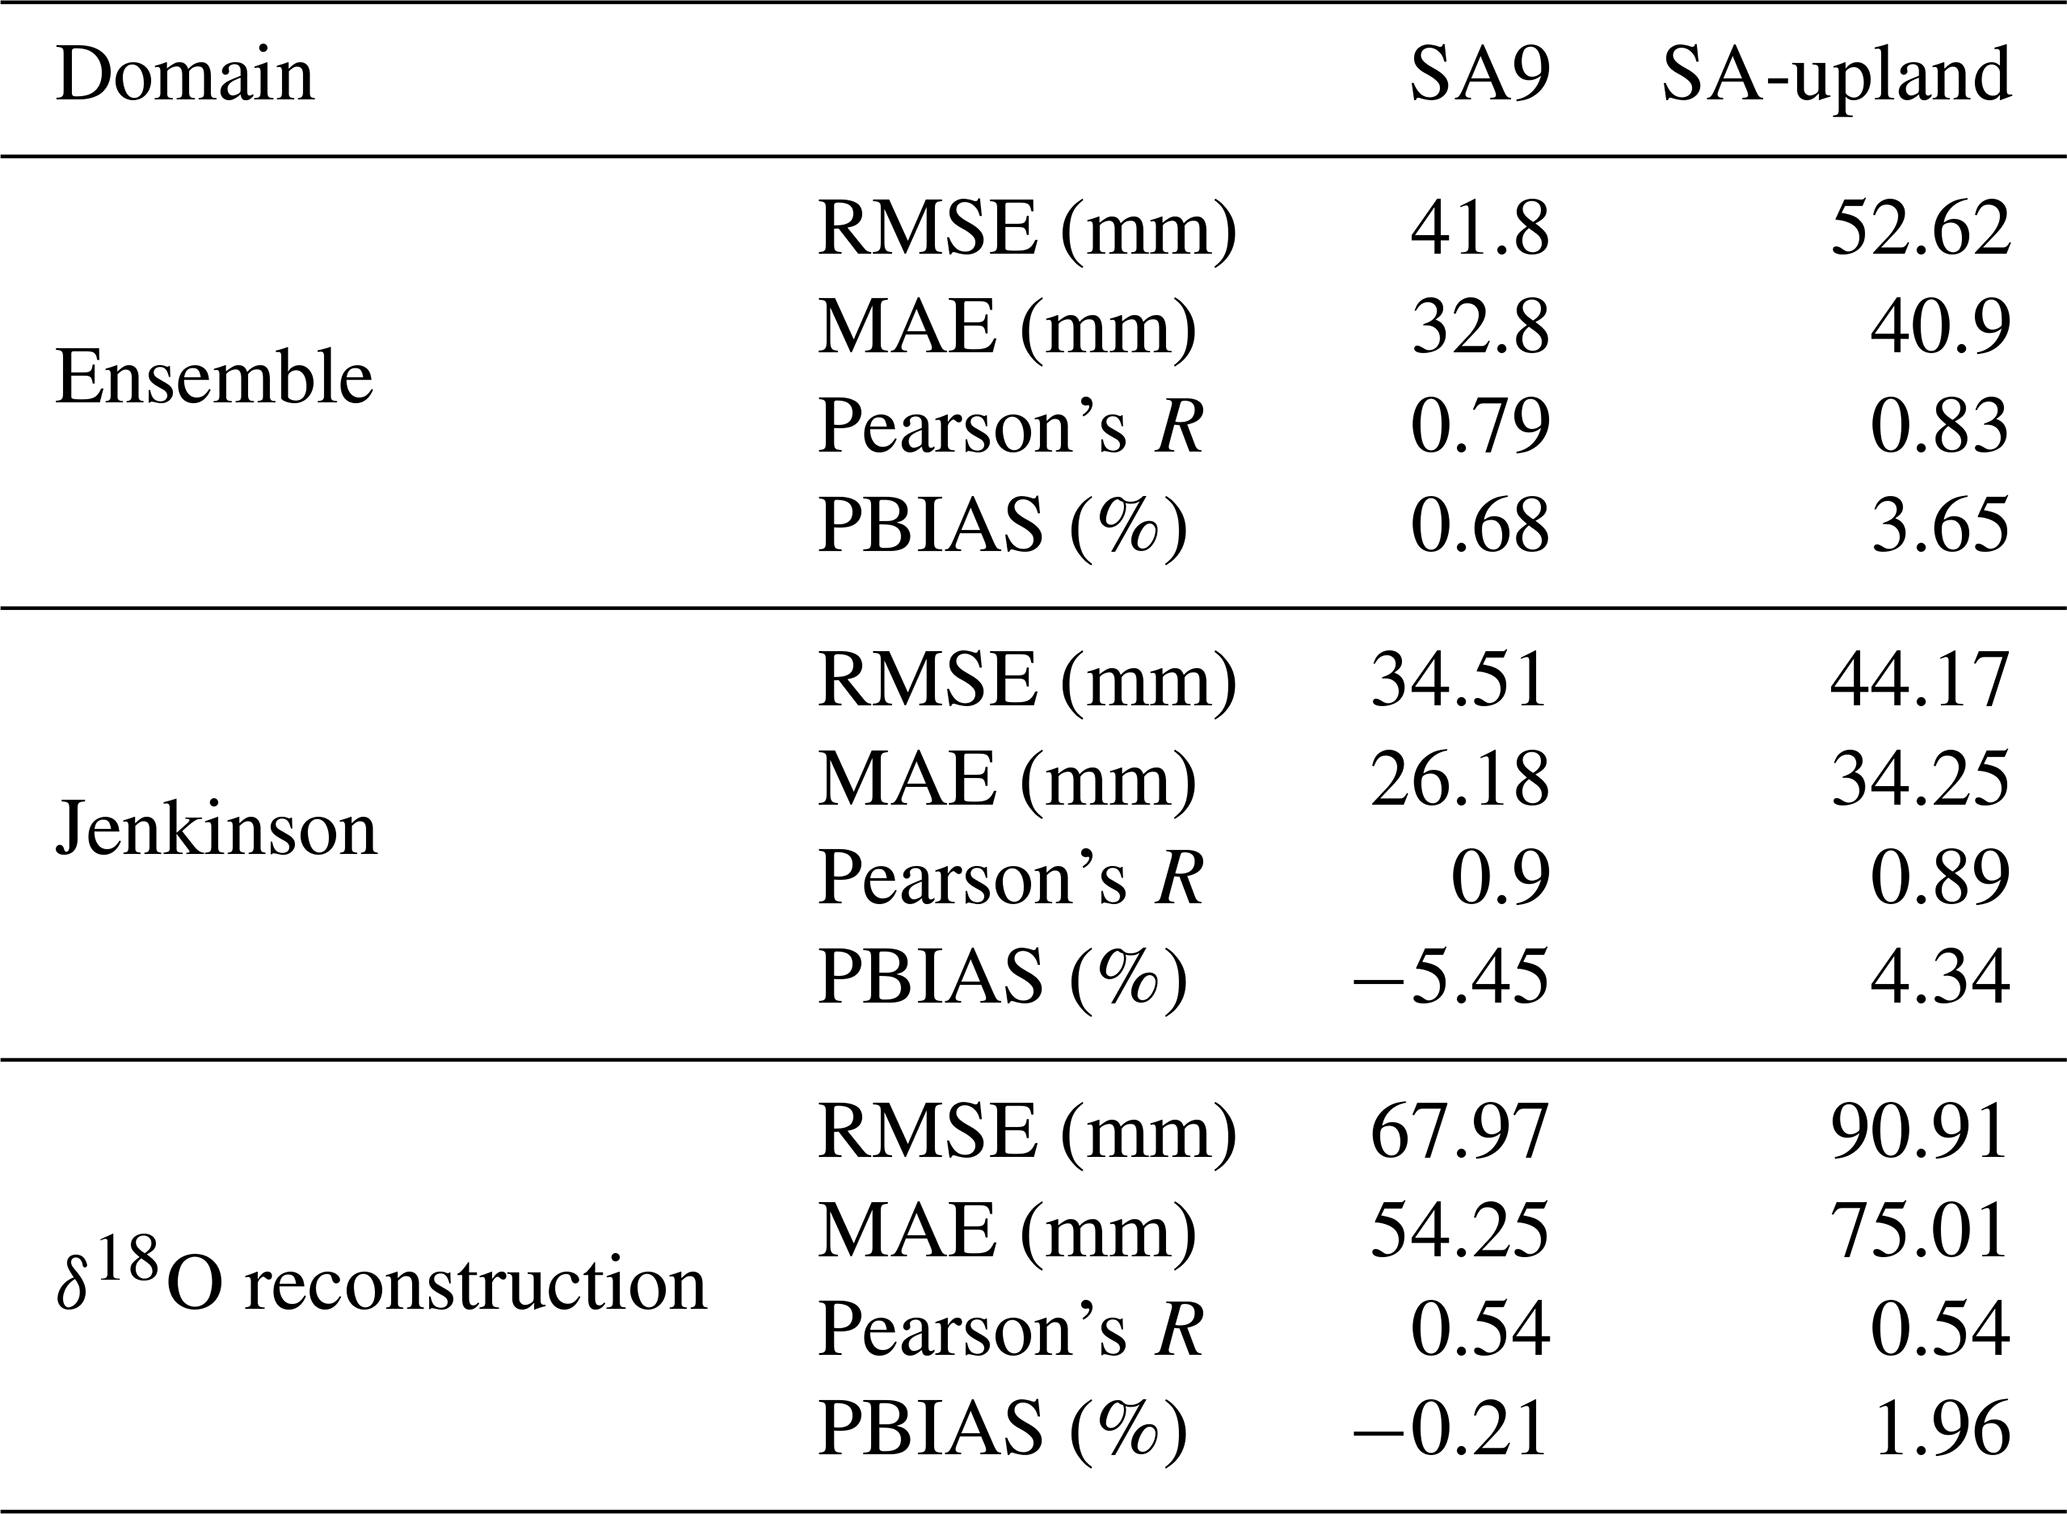
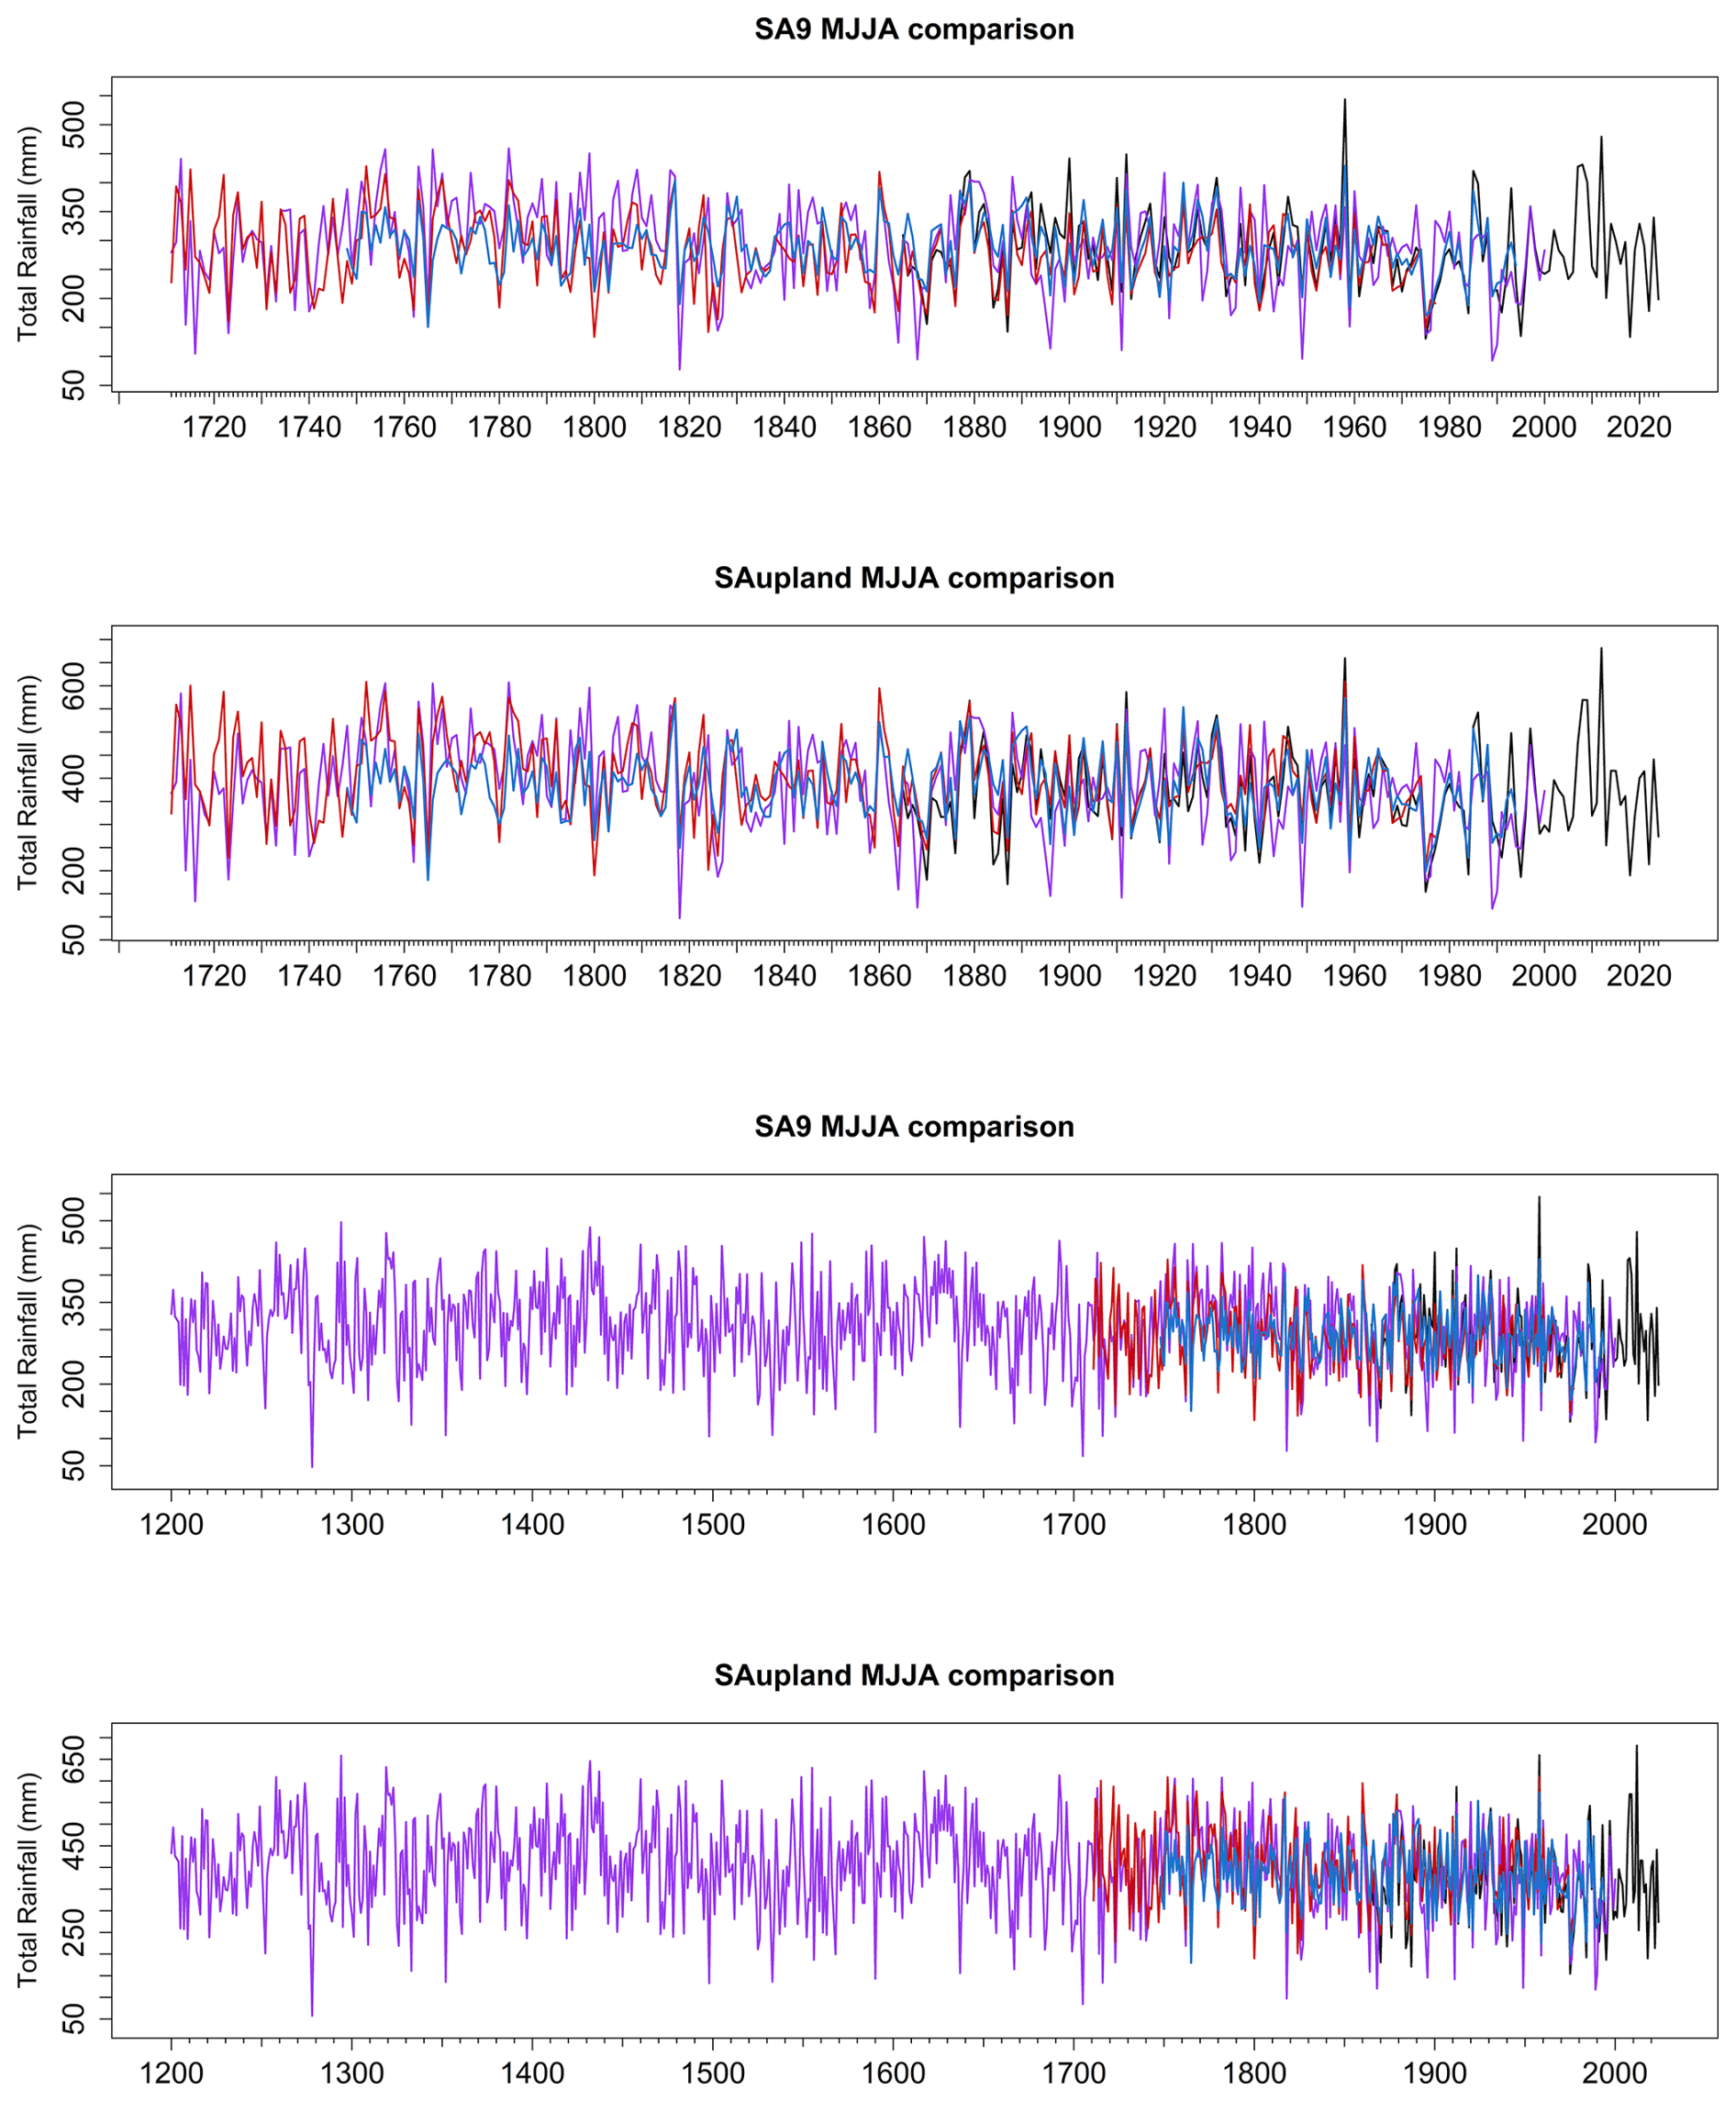
Figure 8Comparison of MJJA (May–August) SA9 and SA-upland rainfall totals from all three reconstruction approaches. The blue line represents the weighted ensemble reconstruction (1748–1994), the red line shows the Jenkinson-based reconstruction (1711–1977), and the purple line denotes the tree-ring δ18O-based reconstruction. The upper two panels show SA9 and SA-upland over 1711–2000, while the lower two show the respective domains over 1200–2000. Black segments indicate observed rainfall used to extend the reconstructions beyond their respective reconstruction periods (1978–2024 for the Jenkinson series, 1995–2024 for the ensemble, and 2001–2024 for the δ18O-based reconstruction). All values are expressed as seasonal totals (mm).
4.3 Representation of extremes 1865–1977
The ability of the Jenkinson and weighted ensemble to capture wet and dry extremes is evaluated for the common period of overlap across the reconstructions using SPI-based threshold exceedances (Fig. 9). Across all accumulation periods and thresholds, the Jenkinson reconstruction demonstrates the highest skill at identifying both wet and dry events, with a higher Probability of Detection (POD) and lower False Alarm Ratio (FAR) than the statistical models. This is evident for both moderate (± 1.0) and more extreme (± 1.5) thresholds, where Jenkinson retains comparatively high detection rates, particularly for dry events, which are generally detected more reliably than wet events across all reconstructions. Jenkinson reconstructions also achieve comparatively lower false alarm ratios, with POD values of 0.72 (wet) and 0.76 (dry) for Jenkinson compared to 0.56 and 0.67 for the ensemble for SPI-3, and correspondingly lower FAR values (0.32 and 0.26 vs. 0.43 and 0.39), with similar differences evident across SPI-1, SPI-6 and SPI-12 (Fig. 9).
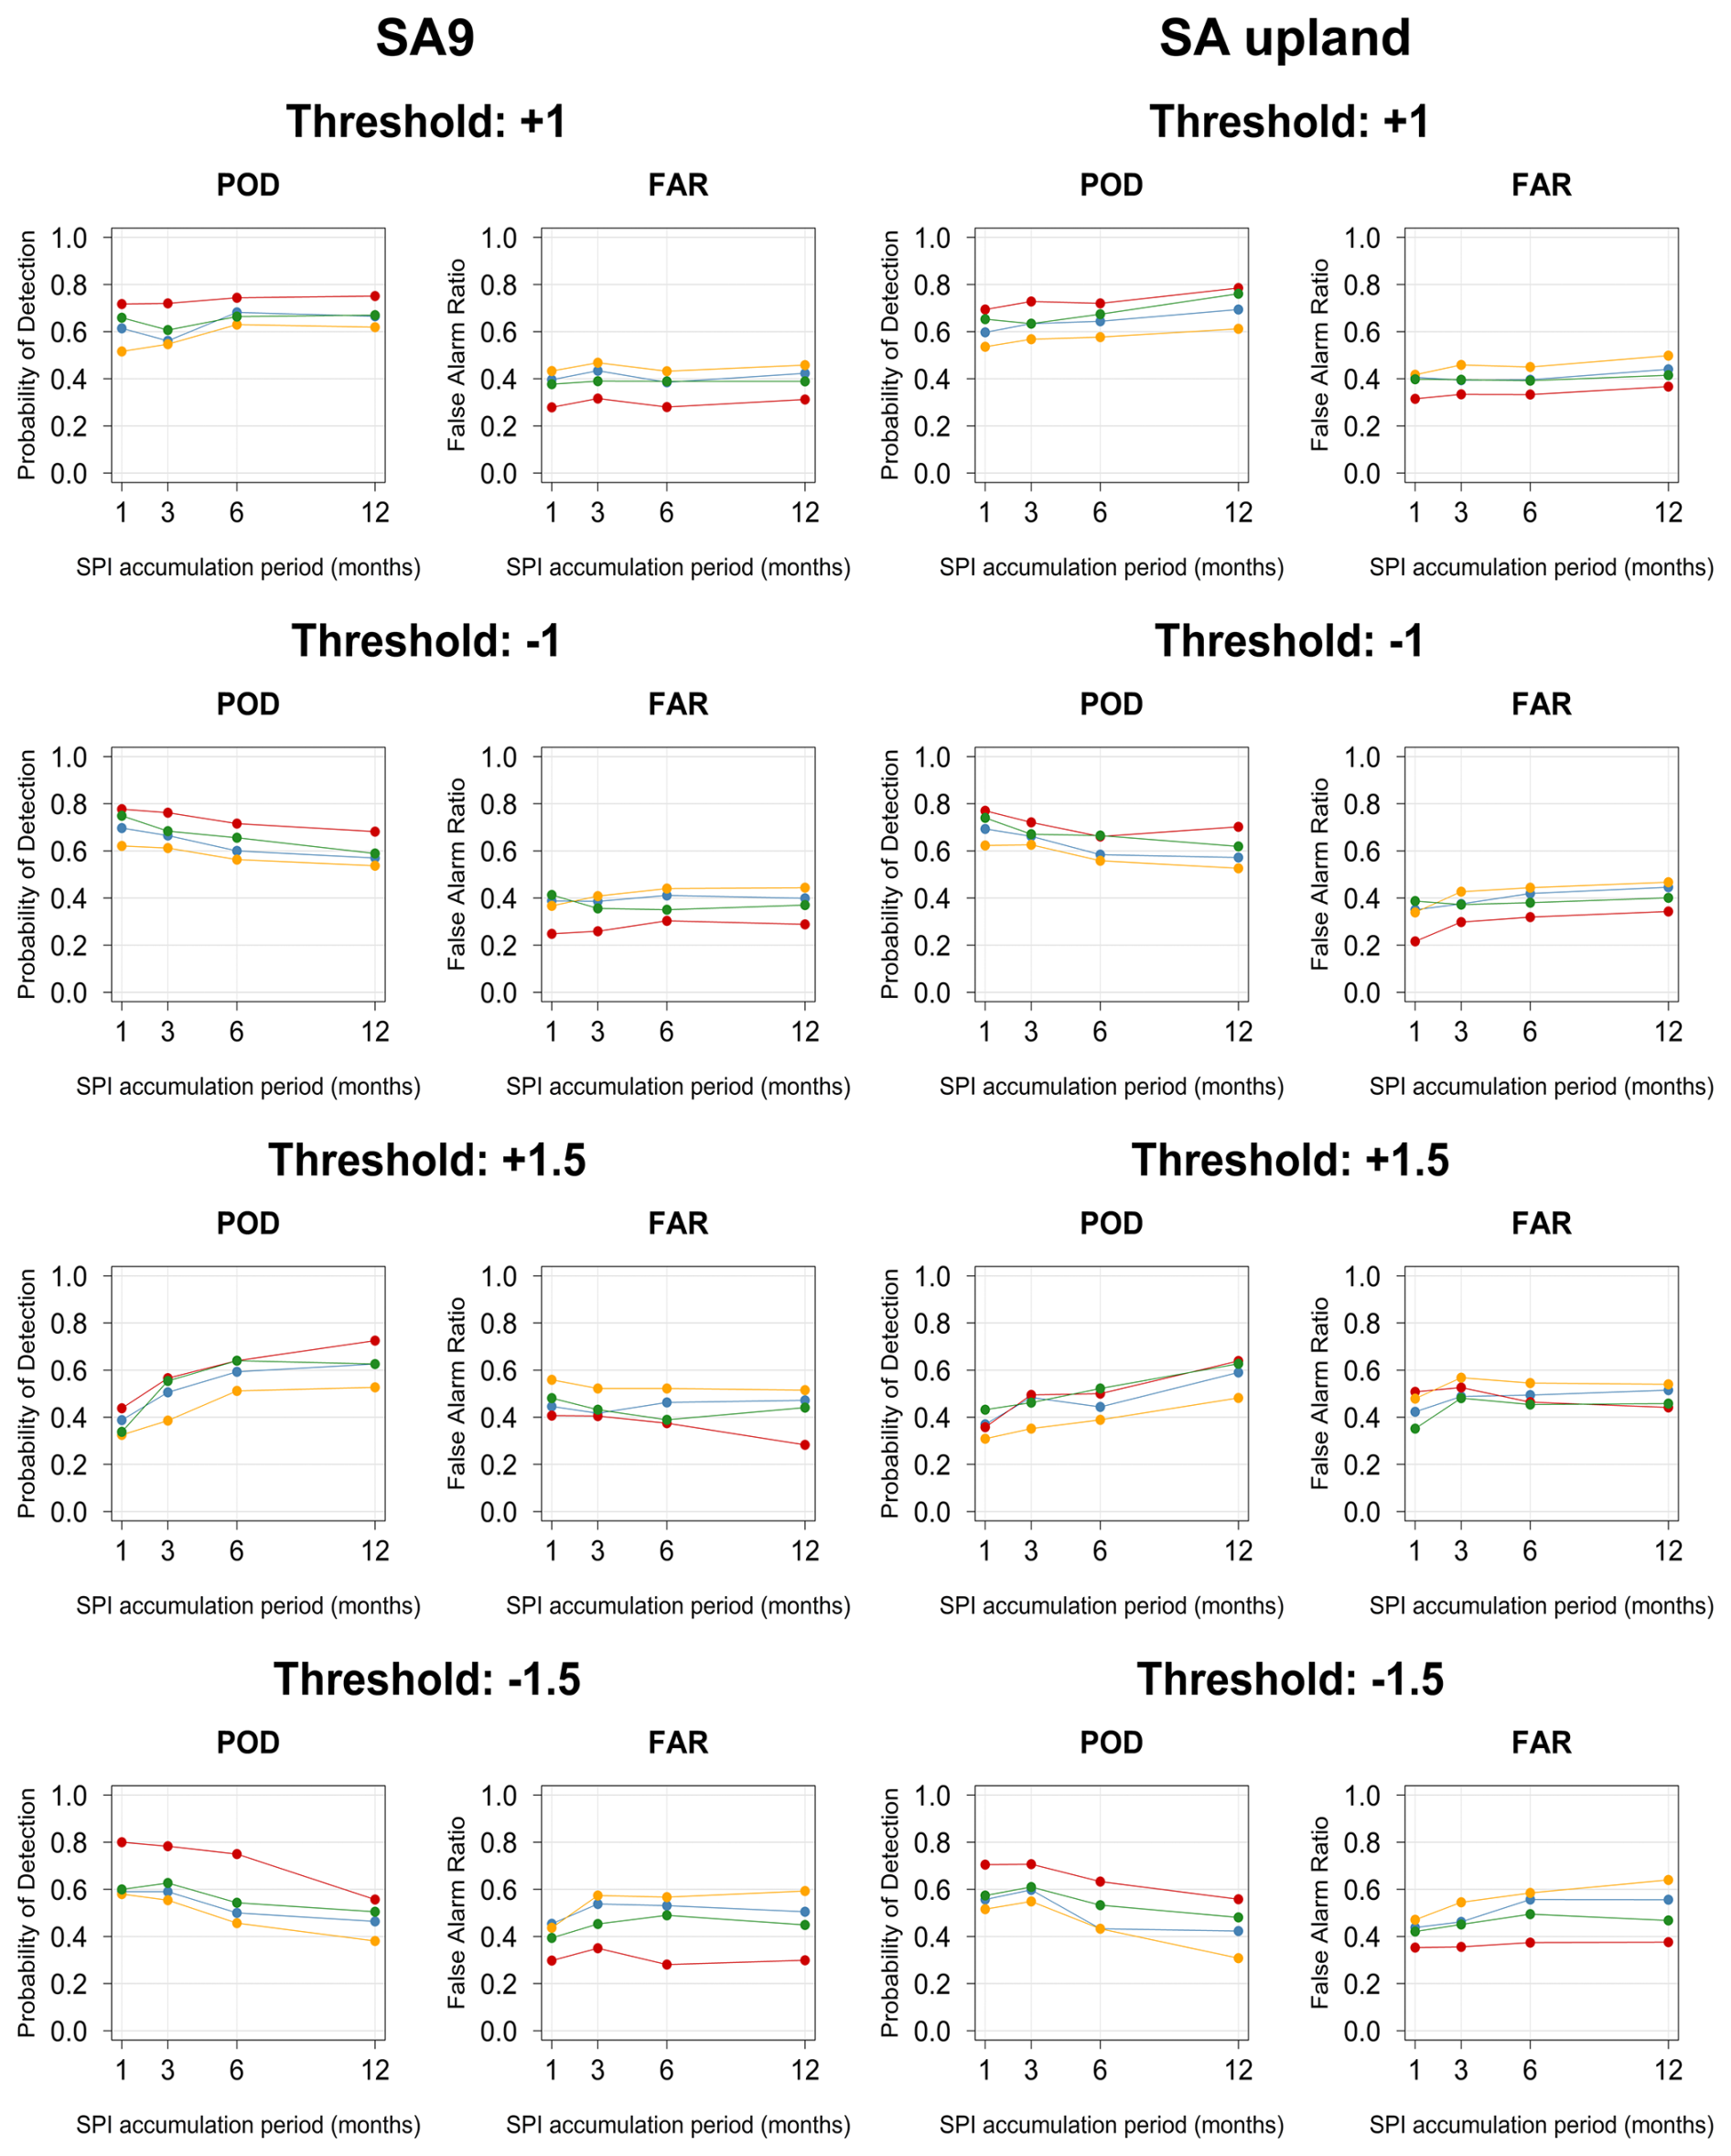
Figure 9Skill of the reconstruction methods in detecting wet and dry events, evaluated using the Probability of Detection (POD), False Alarm Ratio (FAR) for SA9 (left) and SA-upland (right). Results are shown for four threshold levels (± 1 and ± 1.5) and across SPI accumulation periods (1, 3, 6, and 12 months). Each panel displays the performance of the Jenkinson (red), Lasso (orange), Random Forest (green), and the ensemble (blue) reconstruction. Positive thresholds (+1, +1.5) represent wet extremes, while negative thresholds (−1, −1.5) represent dry extremes. Higher POD values indicate better skill, whereas lower FAR values indicate fewer false detections.
The statistical reconstructions exhibit lower skill and greater variability. Random Forest performs more favourably than LASSO, particularly for dry events, where POD values approach those of the Jenkinson reconstruction at longer accumulation periods. However, this is often accompanied by elevated FAR (Fig. 9). The weighted ensemble mean typically performs between the two methods, improving on Lasso but not fully matching the performance of Random Forest or Jenkinson. Differences between methods are most apparent at shorter accumulation periods (SPI-1 and SPI-3).
For the more extreme thresholds (± 1.5), detection skill decreases across all reconstructions, reflecting the increased difficulty in identifying rarer events. However, the relative ranking of model performance remains consistent, with Jenkinson retaining the highest POD and generally lower FAR. In contrast, the statistical models show reduced POD and increased false alarm rates, particularly for wet extremes. Dry extremes are generally better captured than wet extremes across all methods (Fig. 9).
The Jaccard Index is employed to evaluate the skill of all three reconstructions in capturing the top 20 wettest and driest years and seasons (Fig. 10), with the full lists of top 20 wettest and driest years provided in Table S4a–b. The Jenkinson reconstruction shows the highest agreement with observations in identifying the top 20 wettest and driest years across most seasons and at the annual scale, with JI values generally exceeding those of the weighted ensemble. For example, in SA9, the Jenkinson reconstruction captures 16 of the 20 wettest (JI = 0.67) and 14 of the 20 driest (JI = 0.54) years, compared to 13 (JI = 0.48) and 10 (JI = 0.33) years, respectively, for the ensemble. This pattern is consistent across seasons in both SA9 and SA-upland (Tables S5–S6), with the Jenkinson reconstruction typically identifying a larger proportion of extreme years than the weighted ensemble. The wettest years (1865–1977) in the observed series for both domains are 1960 and 1872 (ranked third in SA9 and second in SA-upland). Both reconstructions identify these years as exceptionally wet, with 1872 ranked as the wettest, and 1960 ranked second in the Jenkinson reconstruction in both domains, and fifth (SA9) and fourth (SA-upland) in the ensemble (Table S4a–b). The driest years in the observed record are 1887 and 1971. The Jenkinson reconstruction identifies 1887 as the driest year in both domains, while 1971 ranks fourth. The weighted ensemble reconstruction also identifies these years as exceptionally dry, ranking 1887 as the third- and second-driest year in the SA9 and SA-upland domains, respectively, and 1971 as the sixth- and seventh-driest year (Table S4a–b).
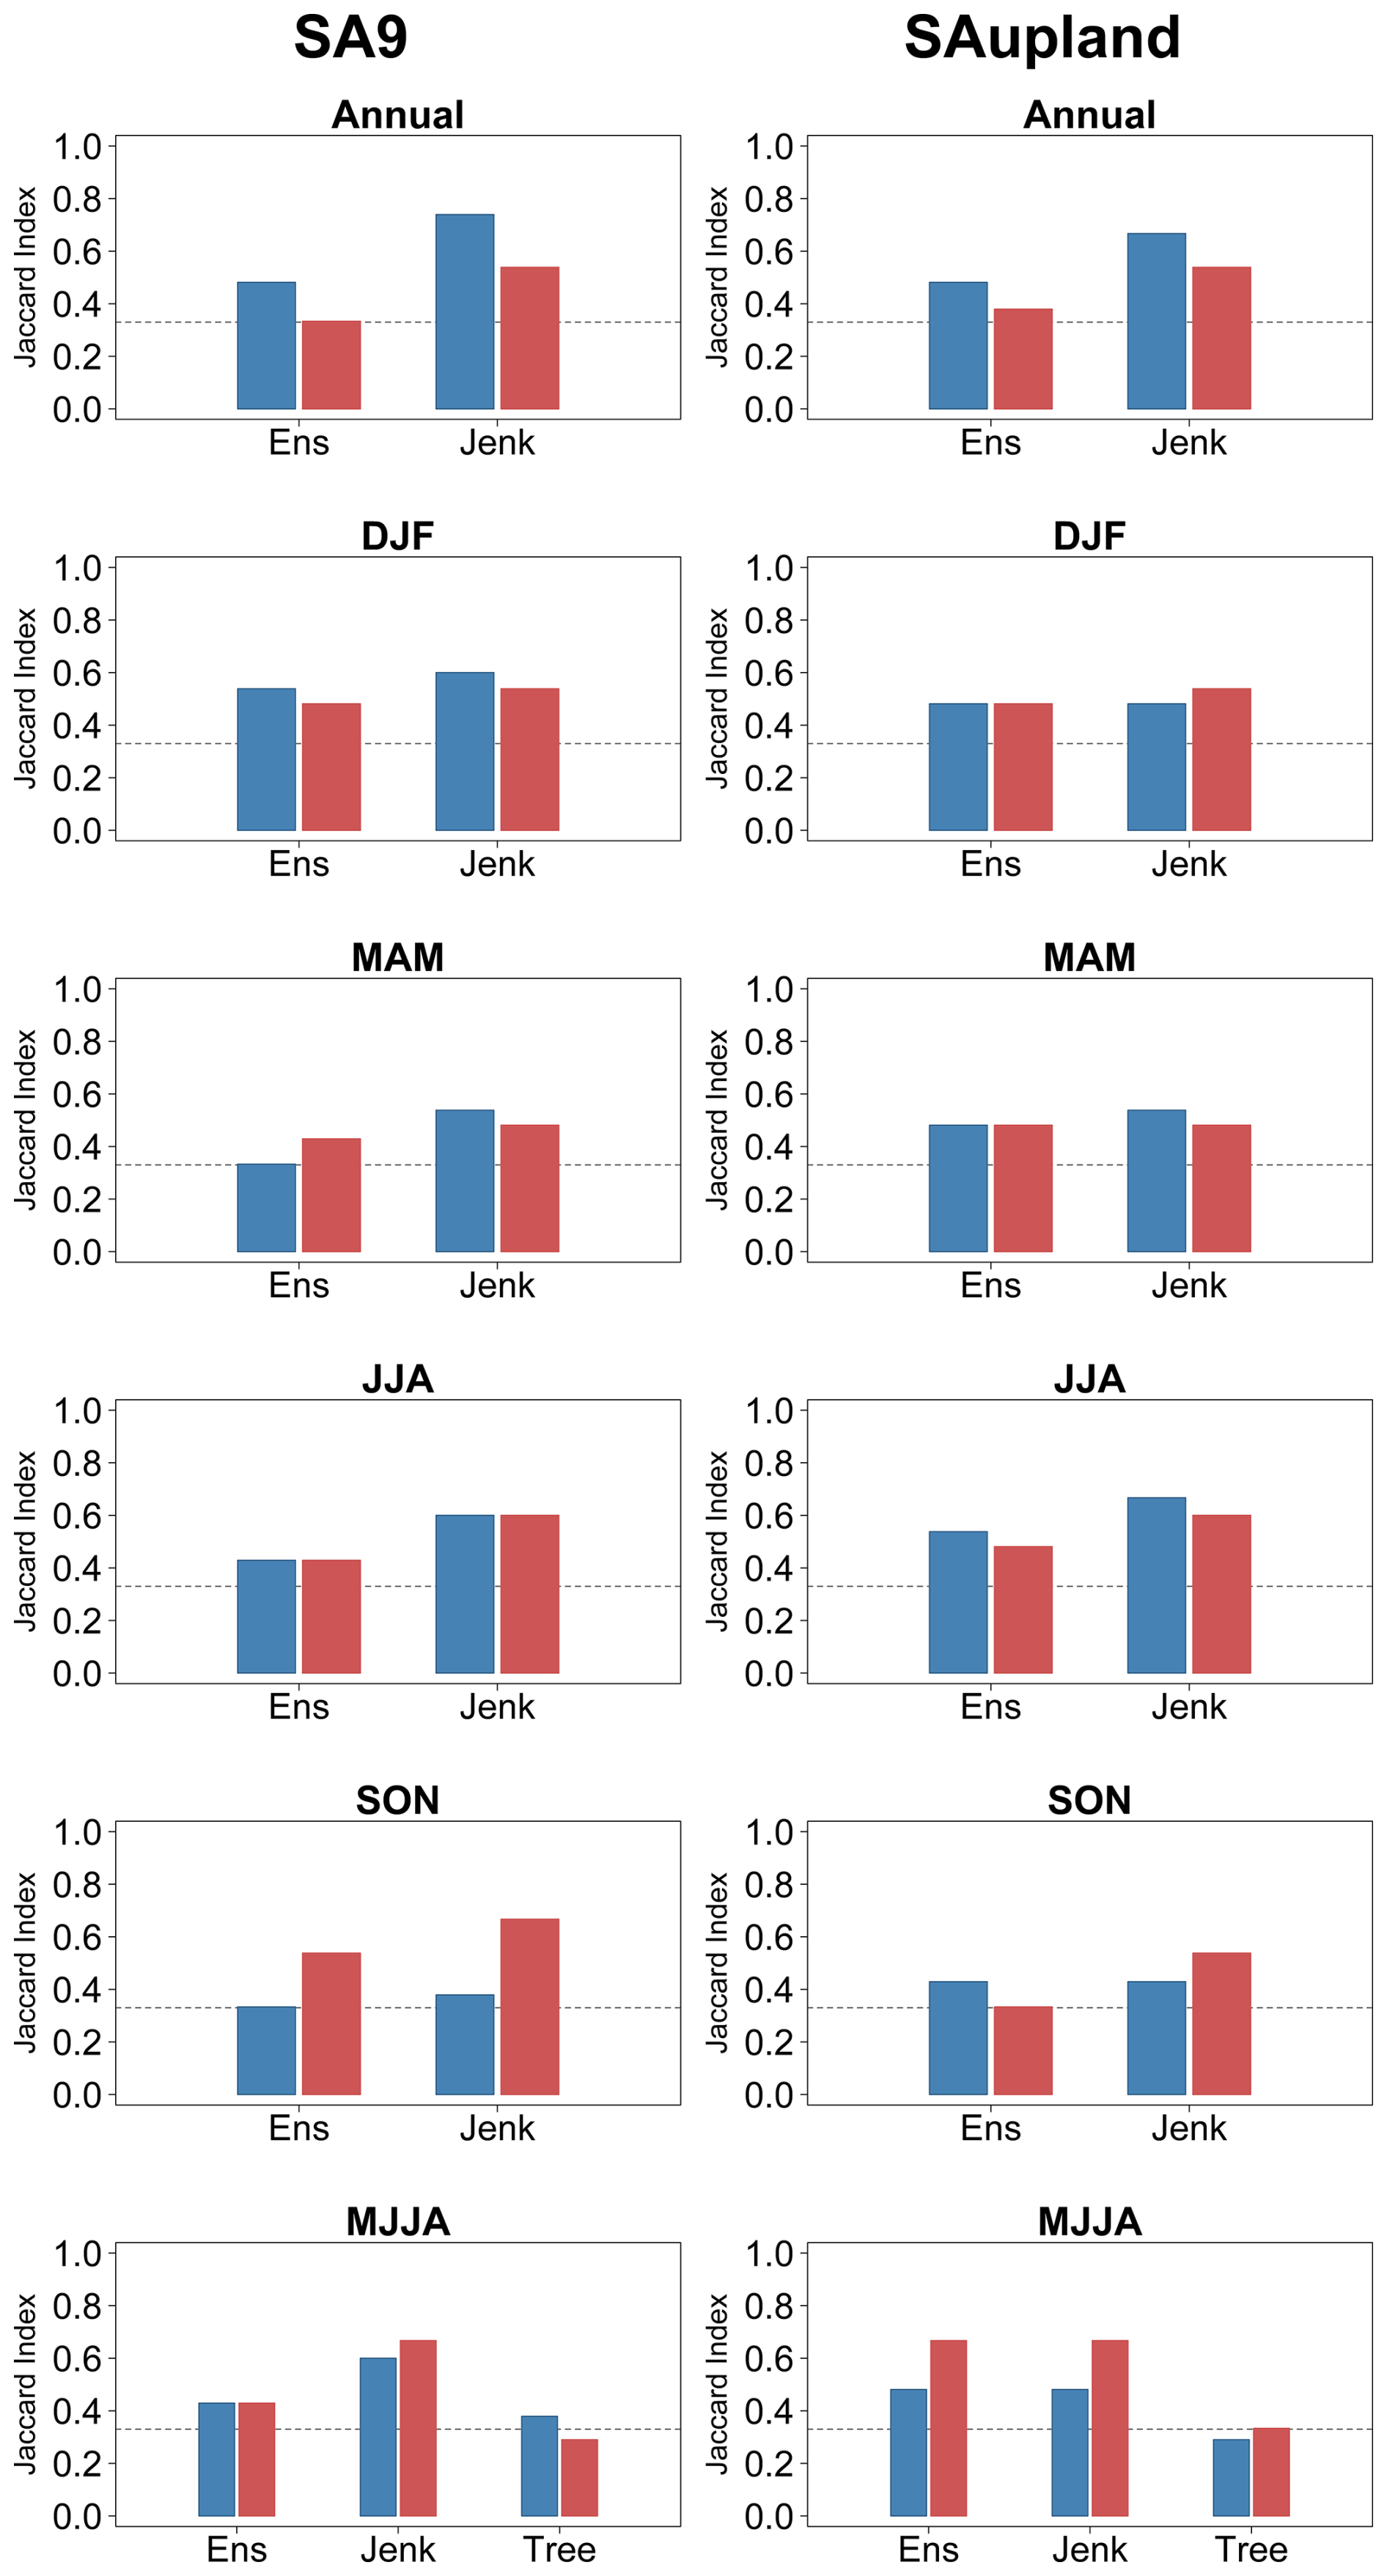
Figure 10Agreement between reconstructed and observed extreme precipitation years, expressed using the Jaccard Index (JI) for SA9 (left) and SA-upland (right) across six seasonal aggregations (Annual, DJF, MAM, JJA, SON, MJJA). Bars represent the agreement in the identification of the top wettest (blue) and driest (red) years between model reconstructions and observations. Higher JI values indicate stronger agreement between reconstructed and observed extreme years, while the dashed horizontal line indicates a JI value of 0.33, corresponding approximately to a 50 % overlap.
In winter (DJF), both reconstructions perform well, capturing 13–15 events (JI = 0.48–0.60), while in spring (MAM) and summer (JJA) the advantage of the Jenkinson reconstruction is more pronounced, identifying 14–15 events (JI = 0.48–0.60) compared to 10–12 events (JI = 0.33–0.43) for the weighted ensemble. In autumn (SON) wet extremes show the weakest agreement, with Jenkinson and the ensemble identifying 11 and 10 of the top 20 events, respectively (JI = 0.38 and 0.33). In contrast, dry extremes are captured more reliably, with 16 and 14 events identified (JI = 0.67 and 0.54, respectively).
Across both domains, dry extremes are generally captured more reliably than wet extremes, with higher Jaccard Index values and a greater number of correctly identified events across most seasons. This is particularly evident in autumn (SON), where dry extremes show the highest agreement (JI up to 0.67), while wet extremes exhibit the lowest agreement (JI typically 0.33–0.38). For MJJA, the δ18O reconstruction identifies 9–11 of the observed top-20 wettest or driest years across the two domains (JI = 0.29–0.38), compared with 12–16 for the weighted ensemble (JI = 0.43–0.67) and 13–16 for Jenkinson (JI = 0.48–0.67). JI values for the δ18O reconstruction are substantially lower than those of both Jenkinson and the ensemble, particularly for dry extremes, indicating reduced skill in identifying individual extreme years. Notably, for SA9, the δ18O reconstruction captures just under 50 % of the observed driest years in MJJA, and just over 50 % of the wettest years. In SA-upland, the δ18O reconstruction identifies nine wettest and ten driest years, while the weighted ensemble shows improved performance in the upland domain, particularly for dry extremes where agreement matches that of the Jenkinson reconstruction.
4.4 Full period reconstructions
For winter (DJF), while both Jenkinson and the weighted ensemble show good coherence over the instrumental period, there is evidence of divergence between reconstructions in both domains before circa 1850, with DJF totals for Jenkinson generally lower than for the ensemble (Fig. 7). The divergence is more apparent in the upland domain. A similar pattern is also evident in spring (MAM), but less marked. Given that the Jenkinson series is constructed directly from early observations and documentary sources (Dr John Rutty's weather diary), we explore whether these reconstructions are sensitive to observational bias through the under-representation of snow due to changes in gauge design, observational practice or reliance on documentary sources (Murphy et al., 2020). The weighted ensemble reconstruction is less likely to contain such biases, as it is derived from predictors such as sea level pressure, among others, rather than direct precipitation observations.
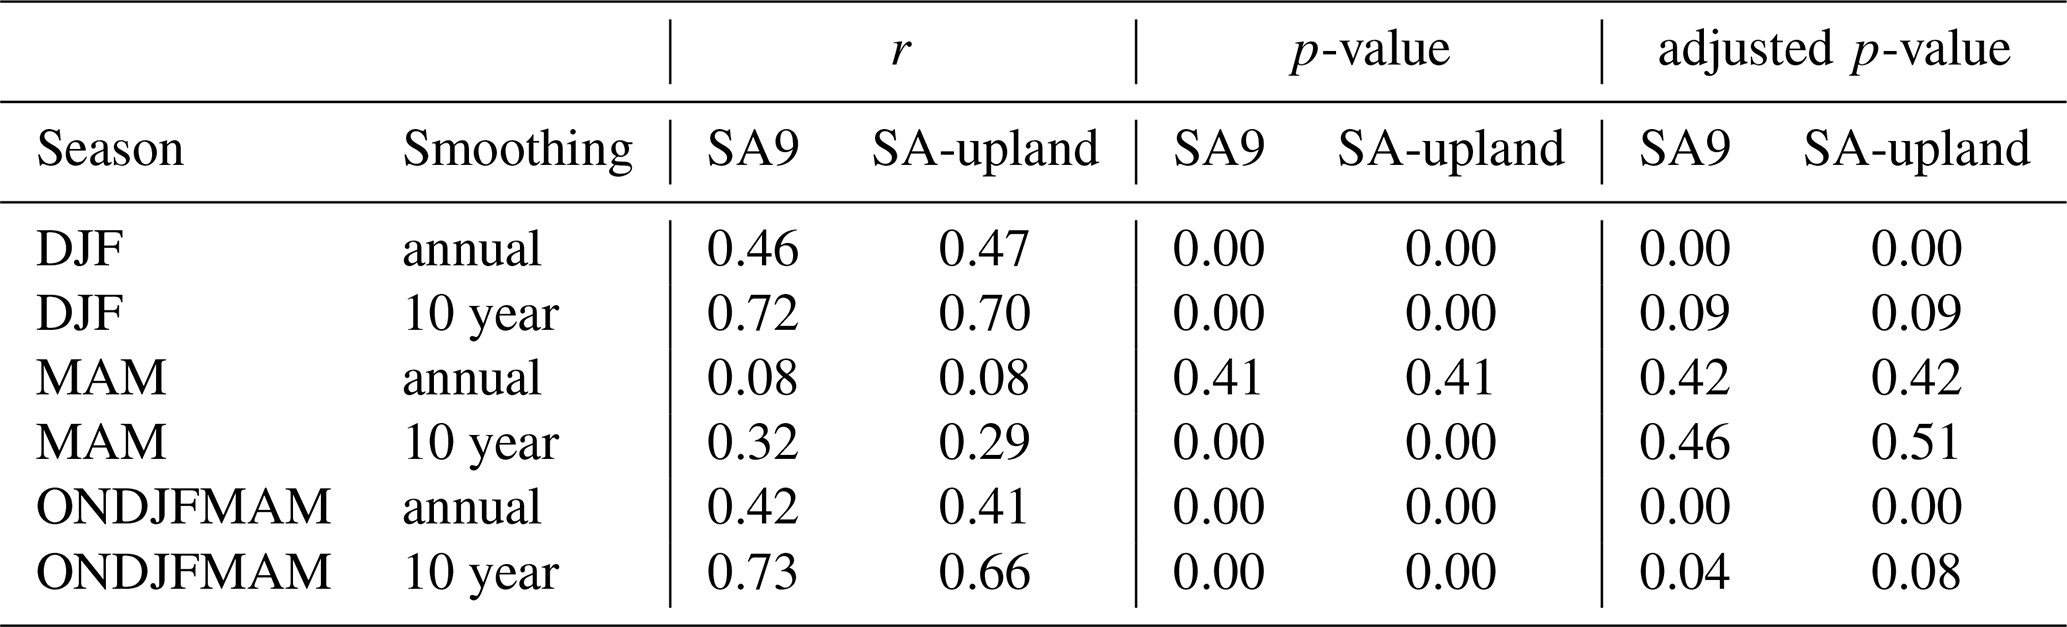
To explore whether snowfall and sleet variability may contribute to divergence between reconstructions, a residual series was calculated as the difference between the Jenkinson and weighted ensemble mean and compared with the extended Dublin Snow and Sleet (DSS). A linear transfer function (slope of 0.55 (95 % CI 0.51–0.60) calibrated over the common period (1867–1974) showed good agreement between the Dublin and Manley series (r=0.83; MAE = 4.8 d and Percent Bias of −6.48 %). The derived extended DSS series is shown in Fig. S2. Comparison of 10 year forward-running averages for reconstruction residuals and the inverted DSS series is presented in Table 7 and Fig. 11 for winter (DJF), spring (MAM), and the snow year (ONDJFMAM). For the unsmoothed series, DJF and the snow year show significant positive correlations in both domains after adjustment for autocorrelation, whereas MAM does not (Table 7). For the 10 year smoothed series, only the SA9 snow-year correlation remains significant at the 5 % level after adjustment (p=0.04); the corresponding SA-upland value is 0.08, and DJF values are 0.09 in both domains. Visual correspondence between the residual and DSS series is evident across all seasons and both domains, with periods of elevated snow and sleet occurrence generally coinciding with larger divergence between the reconstructions. Similar behaviour across both domains is consistent with the possibility that the pre-1865 Jenkinson winter and spring series may exhibit low biases due to snowfall undercatch, changing observational practices, or limitations in documentary and early instrumental sources. Comparison with reconstructions and available long-term series from the UK is broadly consistent with the interpretation that winter totals in the 18th-century Jenkinson series may be biased low relative to the weighted ensemble (Fig. 12), while also lending support to the large-scale hydroclimatic variability captured by the weighted ensemble mean. Comparison with Pauling et al. (2006) reconstructions for SA9 winter (DJF) totals provides further support for the possibility that early Jenkinson winter totals are biased low, with the Pauling reconstructions showing stronger agreement with the weighted ensemble reconstruction. The winter Jenkinson reconstruction for SA9 reveals a correlation of 0.68 with the Pauling reconstruction, while the equivalent correlation for the weighted ensemble is 0.73 (Fig. 13).
Table 7Pearson's correlations between annual and smoothed (10 year forward running mean) residuals and the inverse extended snow and sleet residuals for each domain. Also shown are the raw and adjusted p-values when the effective sample size is reduced due to autocorrelation from smoothing.
For Spring (MAM) good coherence is evident between reconstructions and longer-term reconstructions with the Jenkinson series showing lower decadal totals than the weighted ensemble during the 1700s, but consistent with some UK stations (Fig. 12). Comparison of the annual MAM series with Pauling et al. (2006) reconstructions shows strong agreement with the weighted ensemble mean, with Jenkinson revealing lower annual totals prior to 1780 (Fig. 13).
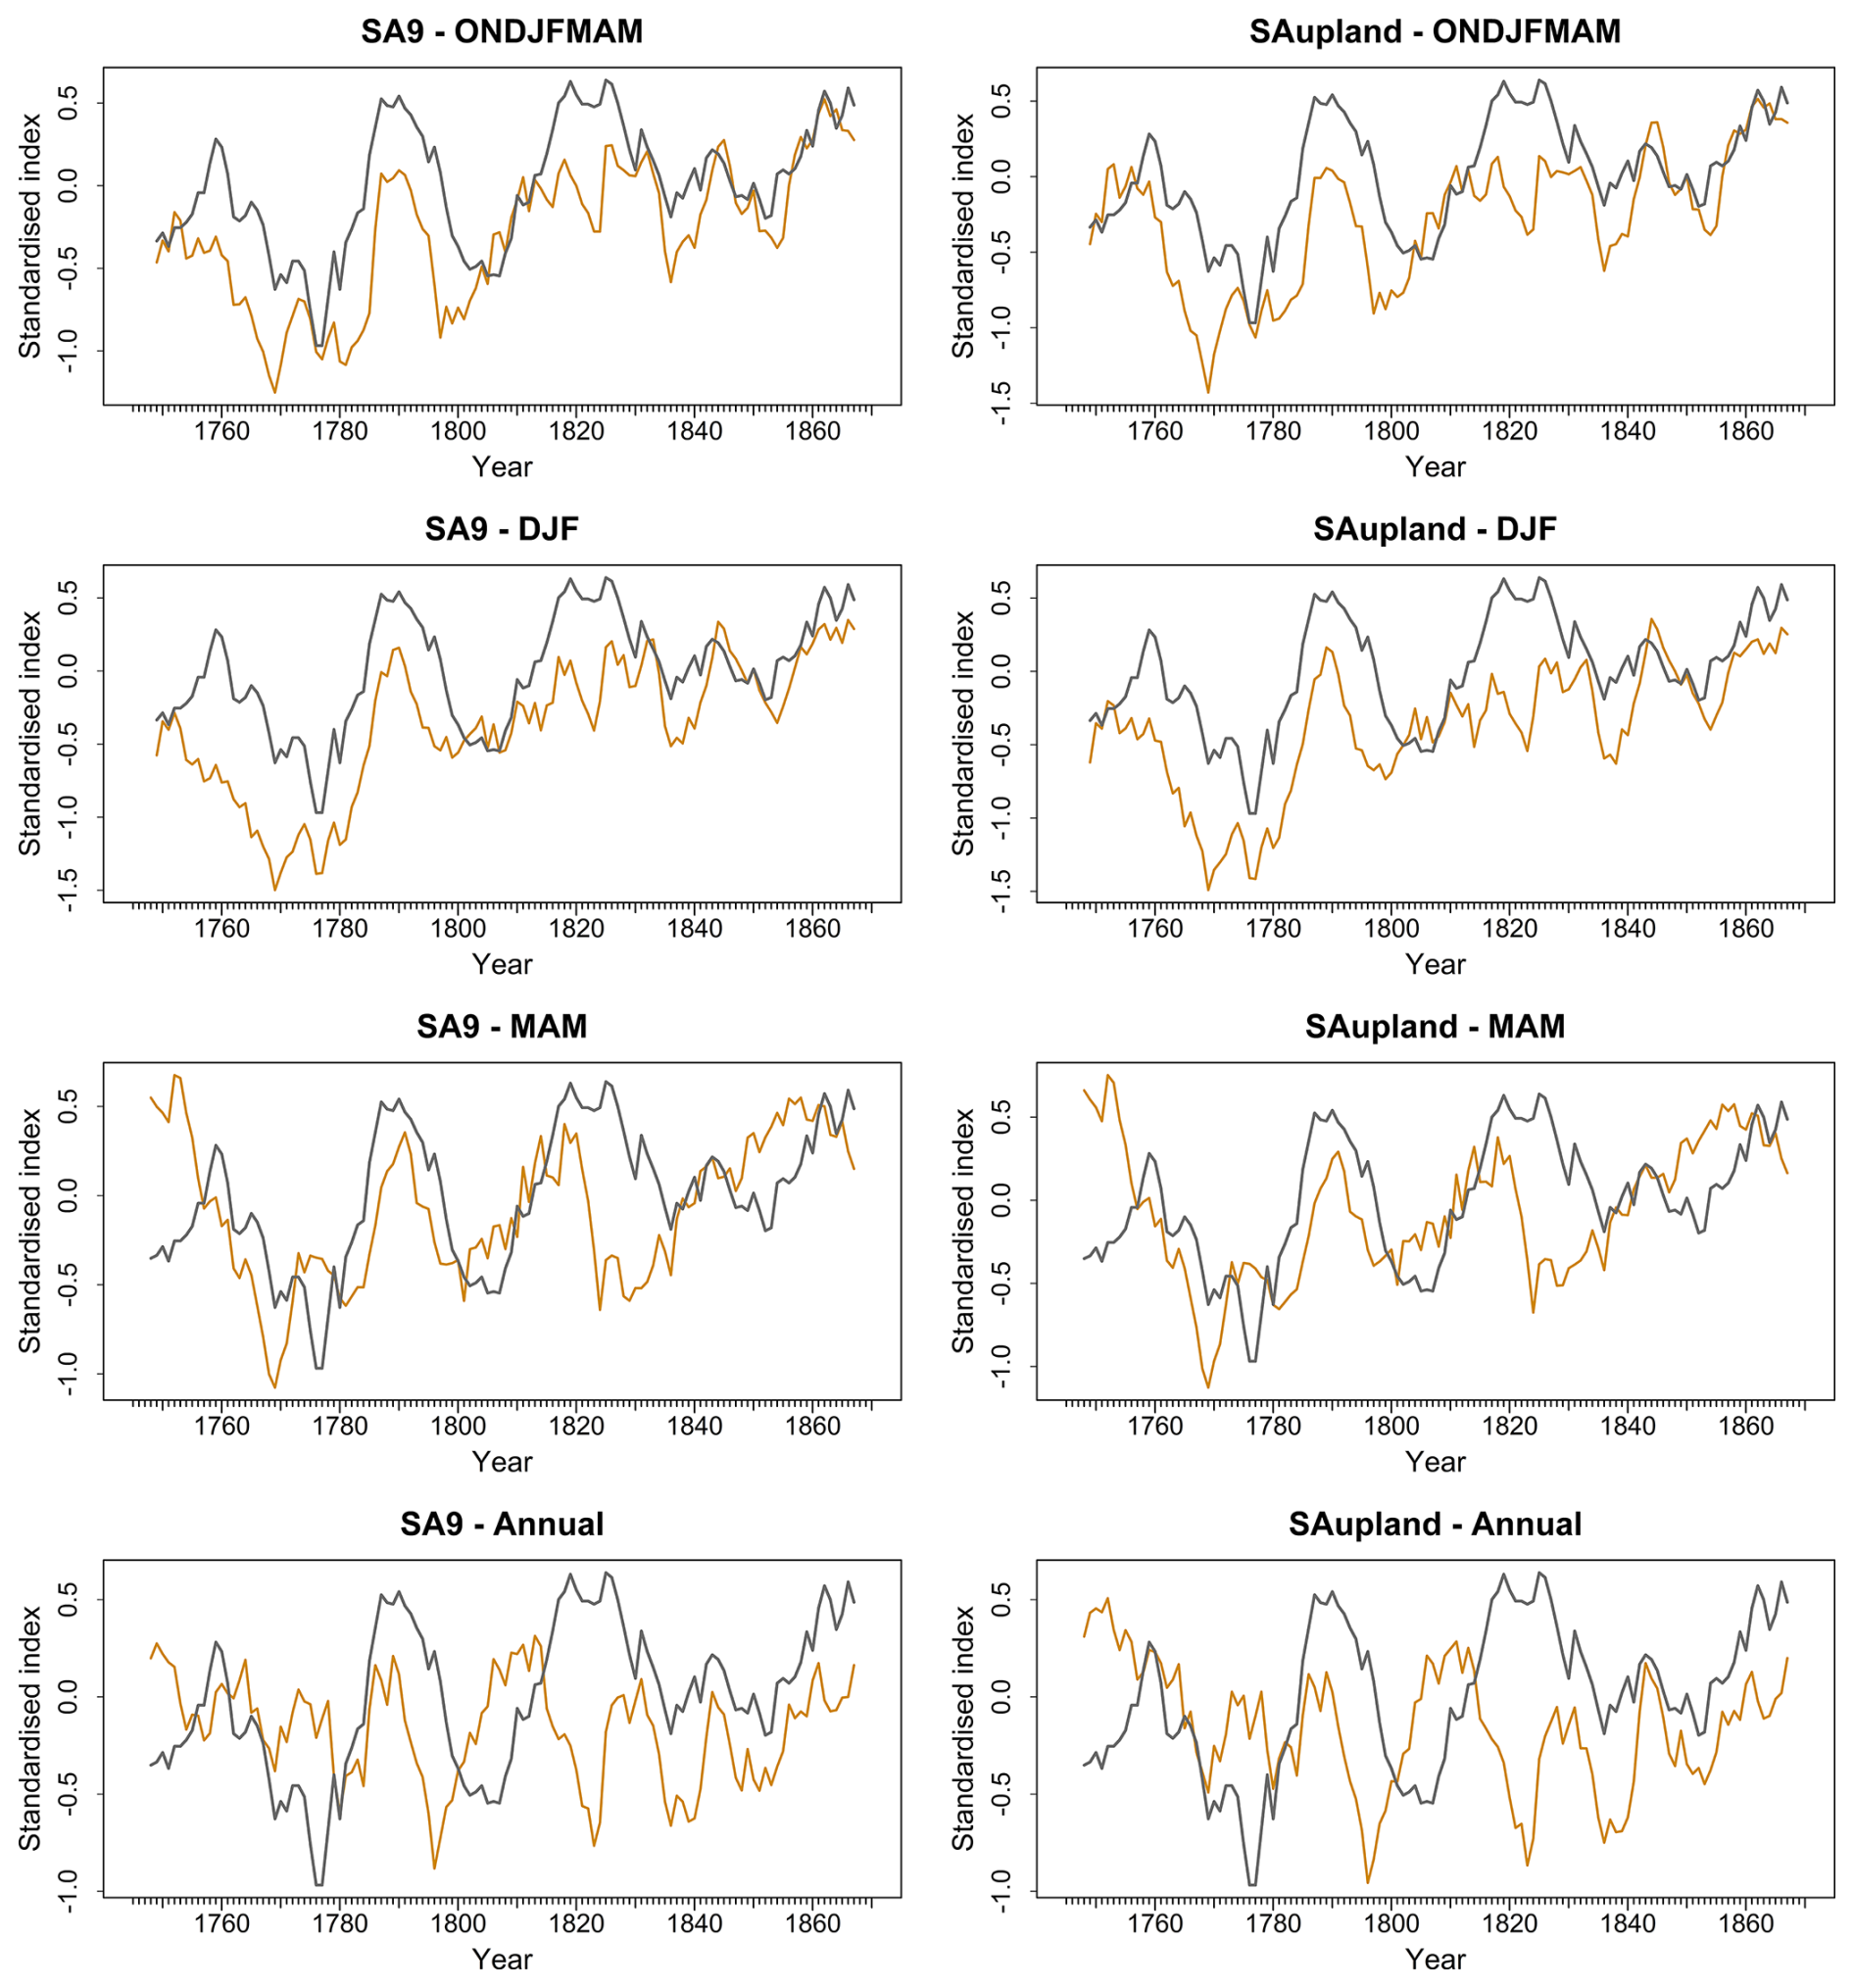
Figure 11Standardised residuals (Jenkinson minus weighted ensemble; black) and inverted extended Dublin Snow and Sleet (DSS) series (orange) for the SA9 and SA-upland domains across ONDJFMAM, DJF, MAM and annual aggregations, 1748–1867. Series are expressed as z-scores and smoothed using 10 year forward running means. The annually resolved extended DSS series was sign-inverted to facilitate visual comparison, such that periods of enhanced snow and sleet occurrence correspond to larger positive residuals.
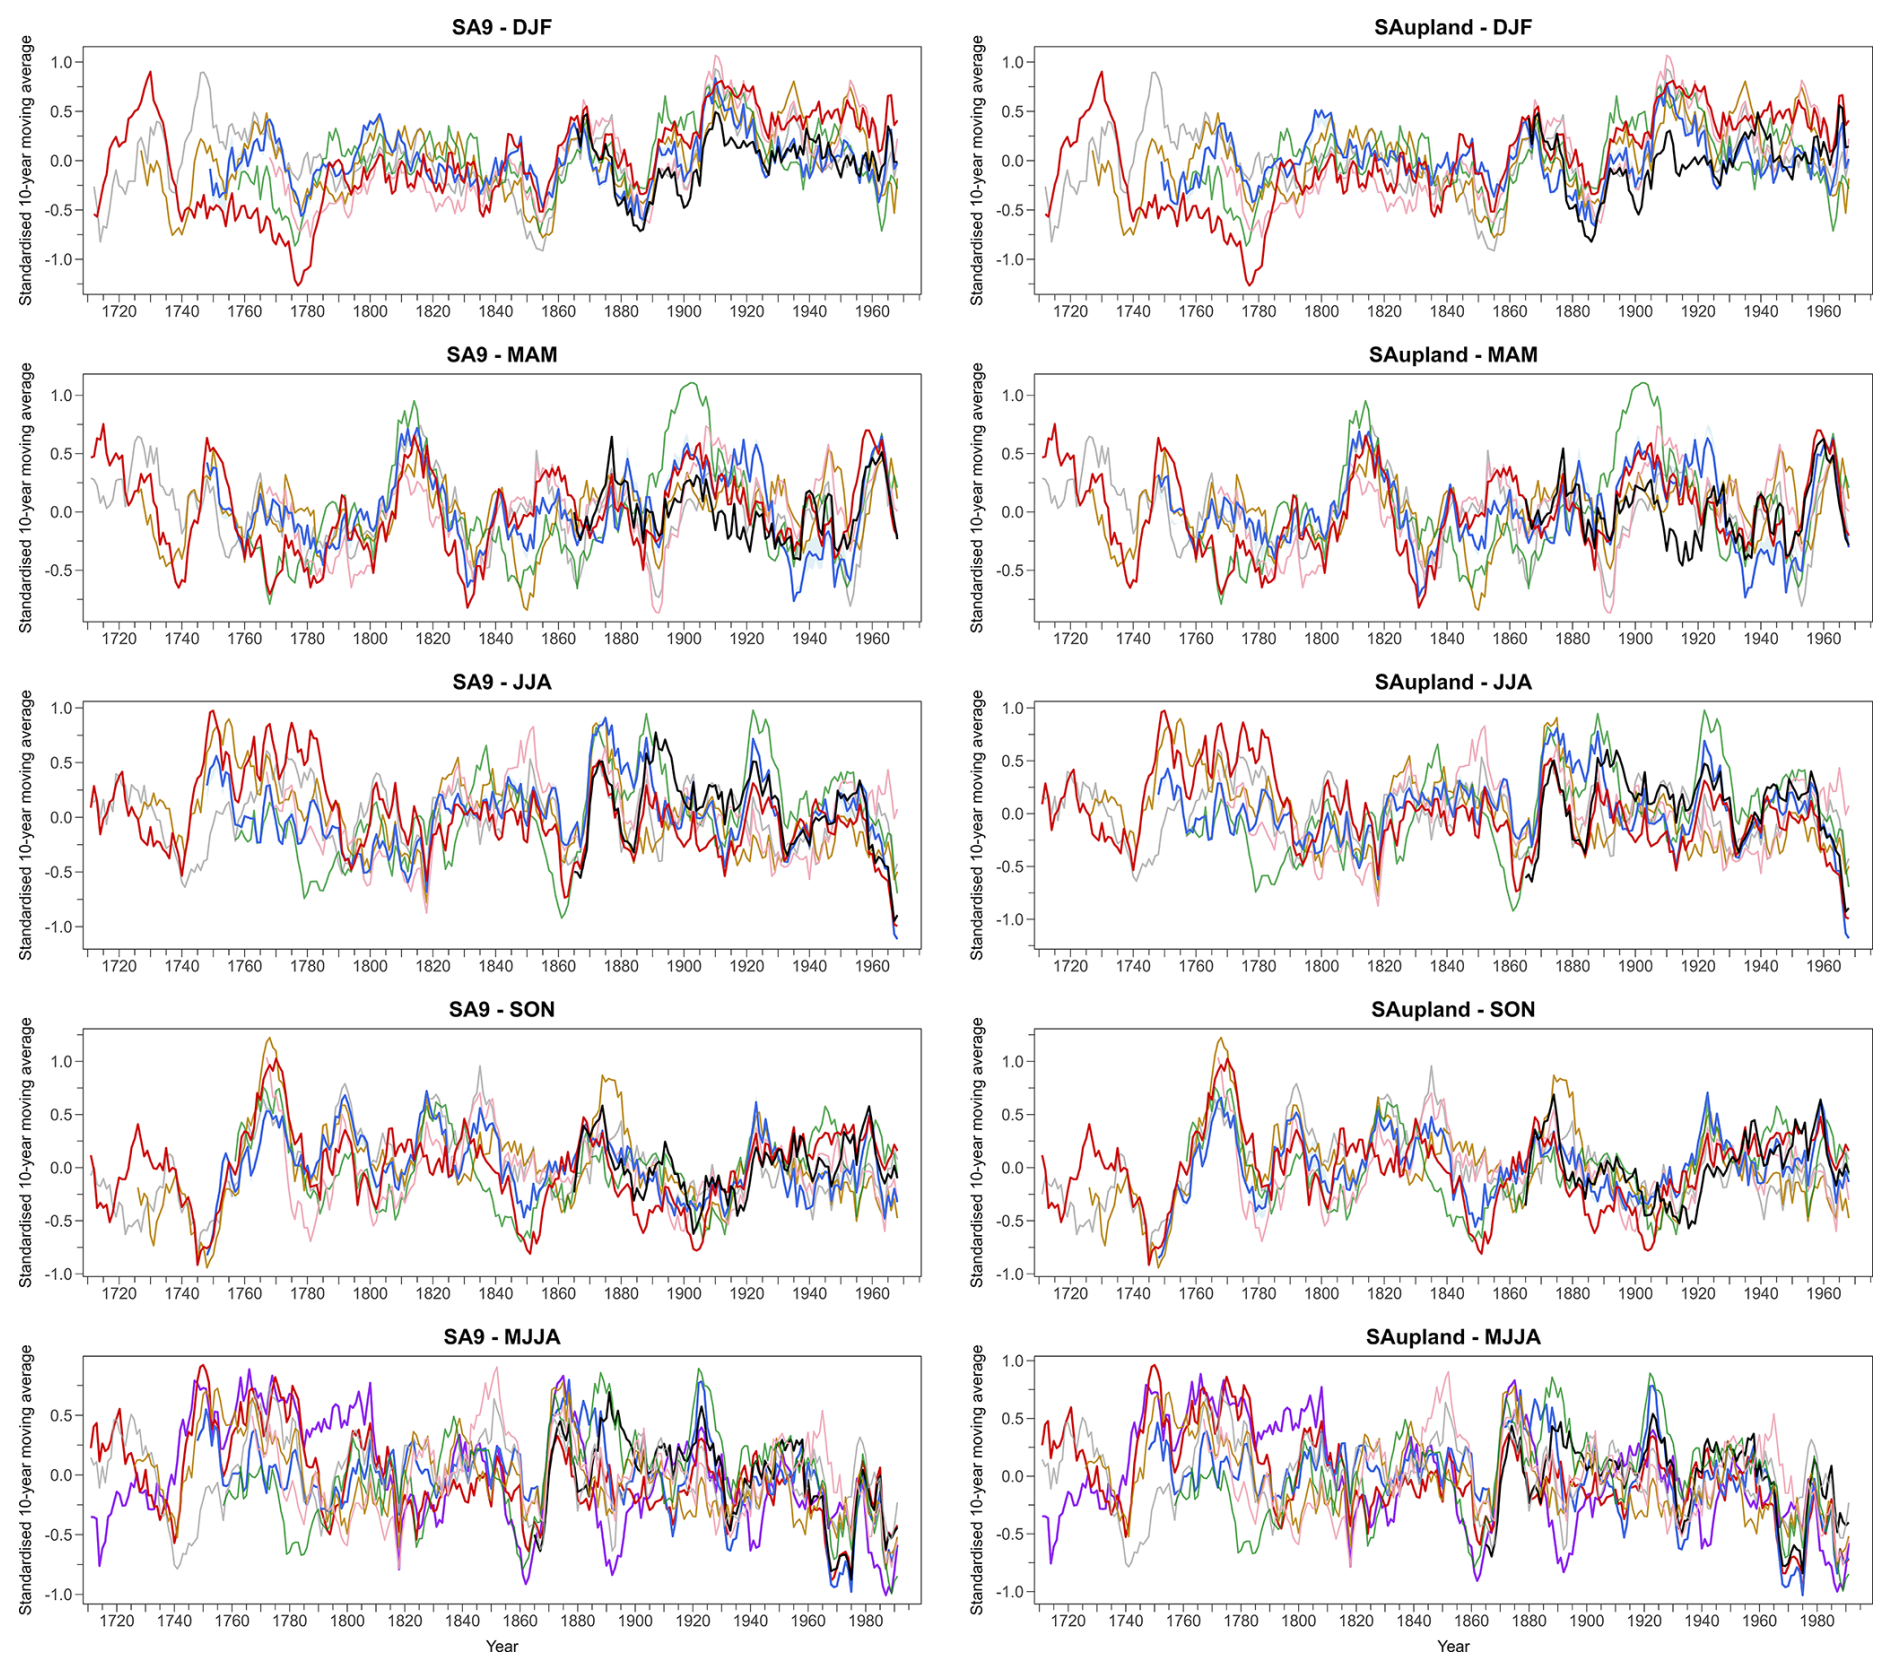
Figure 12Seasonal and MJJA standardised 10 year moving averages for the SA9 (left) and SA-upland (right) domains, compared with instrumental series from selected UK stations. Panels show winter (DJF), spring (MAM), summer (JJA), autumn (SON), and May-August (MJJA). Coloured lines represent individual station series (Kew – grey, Spalding – orange, Carlisle – green, Oxford – pink), weighted ensemble (blue) and Jenkinson-based reconstructions (red). The black line denotes the observed series, and the purple line in the MJJA panels represents the δ18O reconstruction. All series are standardised to a common baseline to facilitate comparison of variability across datasets. Note that the MJJA series extends over a longer period (1711–2000) than the seasonal panels (1711–1977).
In summer (JJA), both the Jenkinson and the weighted ensemble reconstructions show close agreement back to circa 1810. For earlier years, the Jenkinson series shows higher seasonal totals than the ensemble, especially in the upland domain. For extended summer (MJJA), better agreement is evident, but the Jenkinson series shows elevated totals relative to the ensemble for certain years in the latter half of the 18th-century. For autumn (SON), there is good agreement between the two approaches throughout the full reconstructions period.
Comparison of summer reconstructions with UK stations reveals that some UK stations (Spalding and Kew) show similarly high totals in the second half of the 1700s. Other stations (Oxford and Carlisle) tend to show closer correspondence to the weighted ensemble reconstructions in this period (Fig. 12). Comparison with Pauling et al. (2006) reconstructions for SA9 adds weight to the view that summer totals in this period may be overestimated in the Jenkinson reconstruction (Fig. 13). For MJJA the δ18O reconstruction tends to agree with the Jenkinson series during this period. However, divergence between the δ18O reconstruction and other observed and reconstructed series is evident in the early and late 1700s. The period 1730–1800 is subject to uncertainty about the extent and magnitude of wet summers. As the Jenkinson reconstruction during this period is strongly informed by Rutty's Dublin weather diary (1716–1765) and sparse early instrumental observations, it remains difficult to determine whether the elevated summer totals reflect genuine hydroclimatic conditions or uncertainties associated with documentary and early observational sources. This period is marked by notable spatial gradients in summer totals, which would be worth unpacking in future research. Autumn shows strong agreement across all reconstructions and available series throughout the record (Fig. 12).
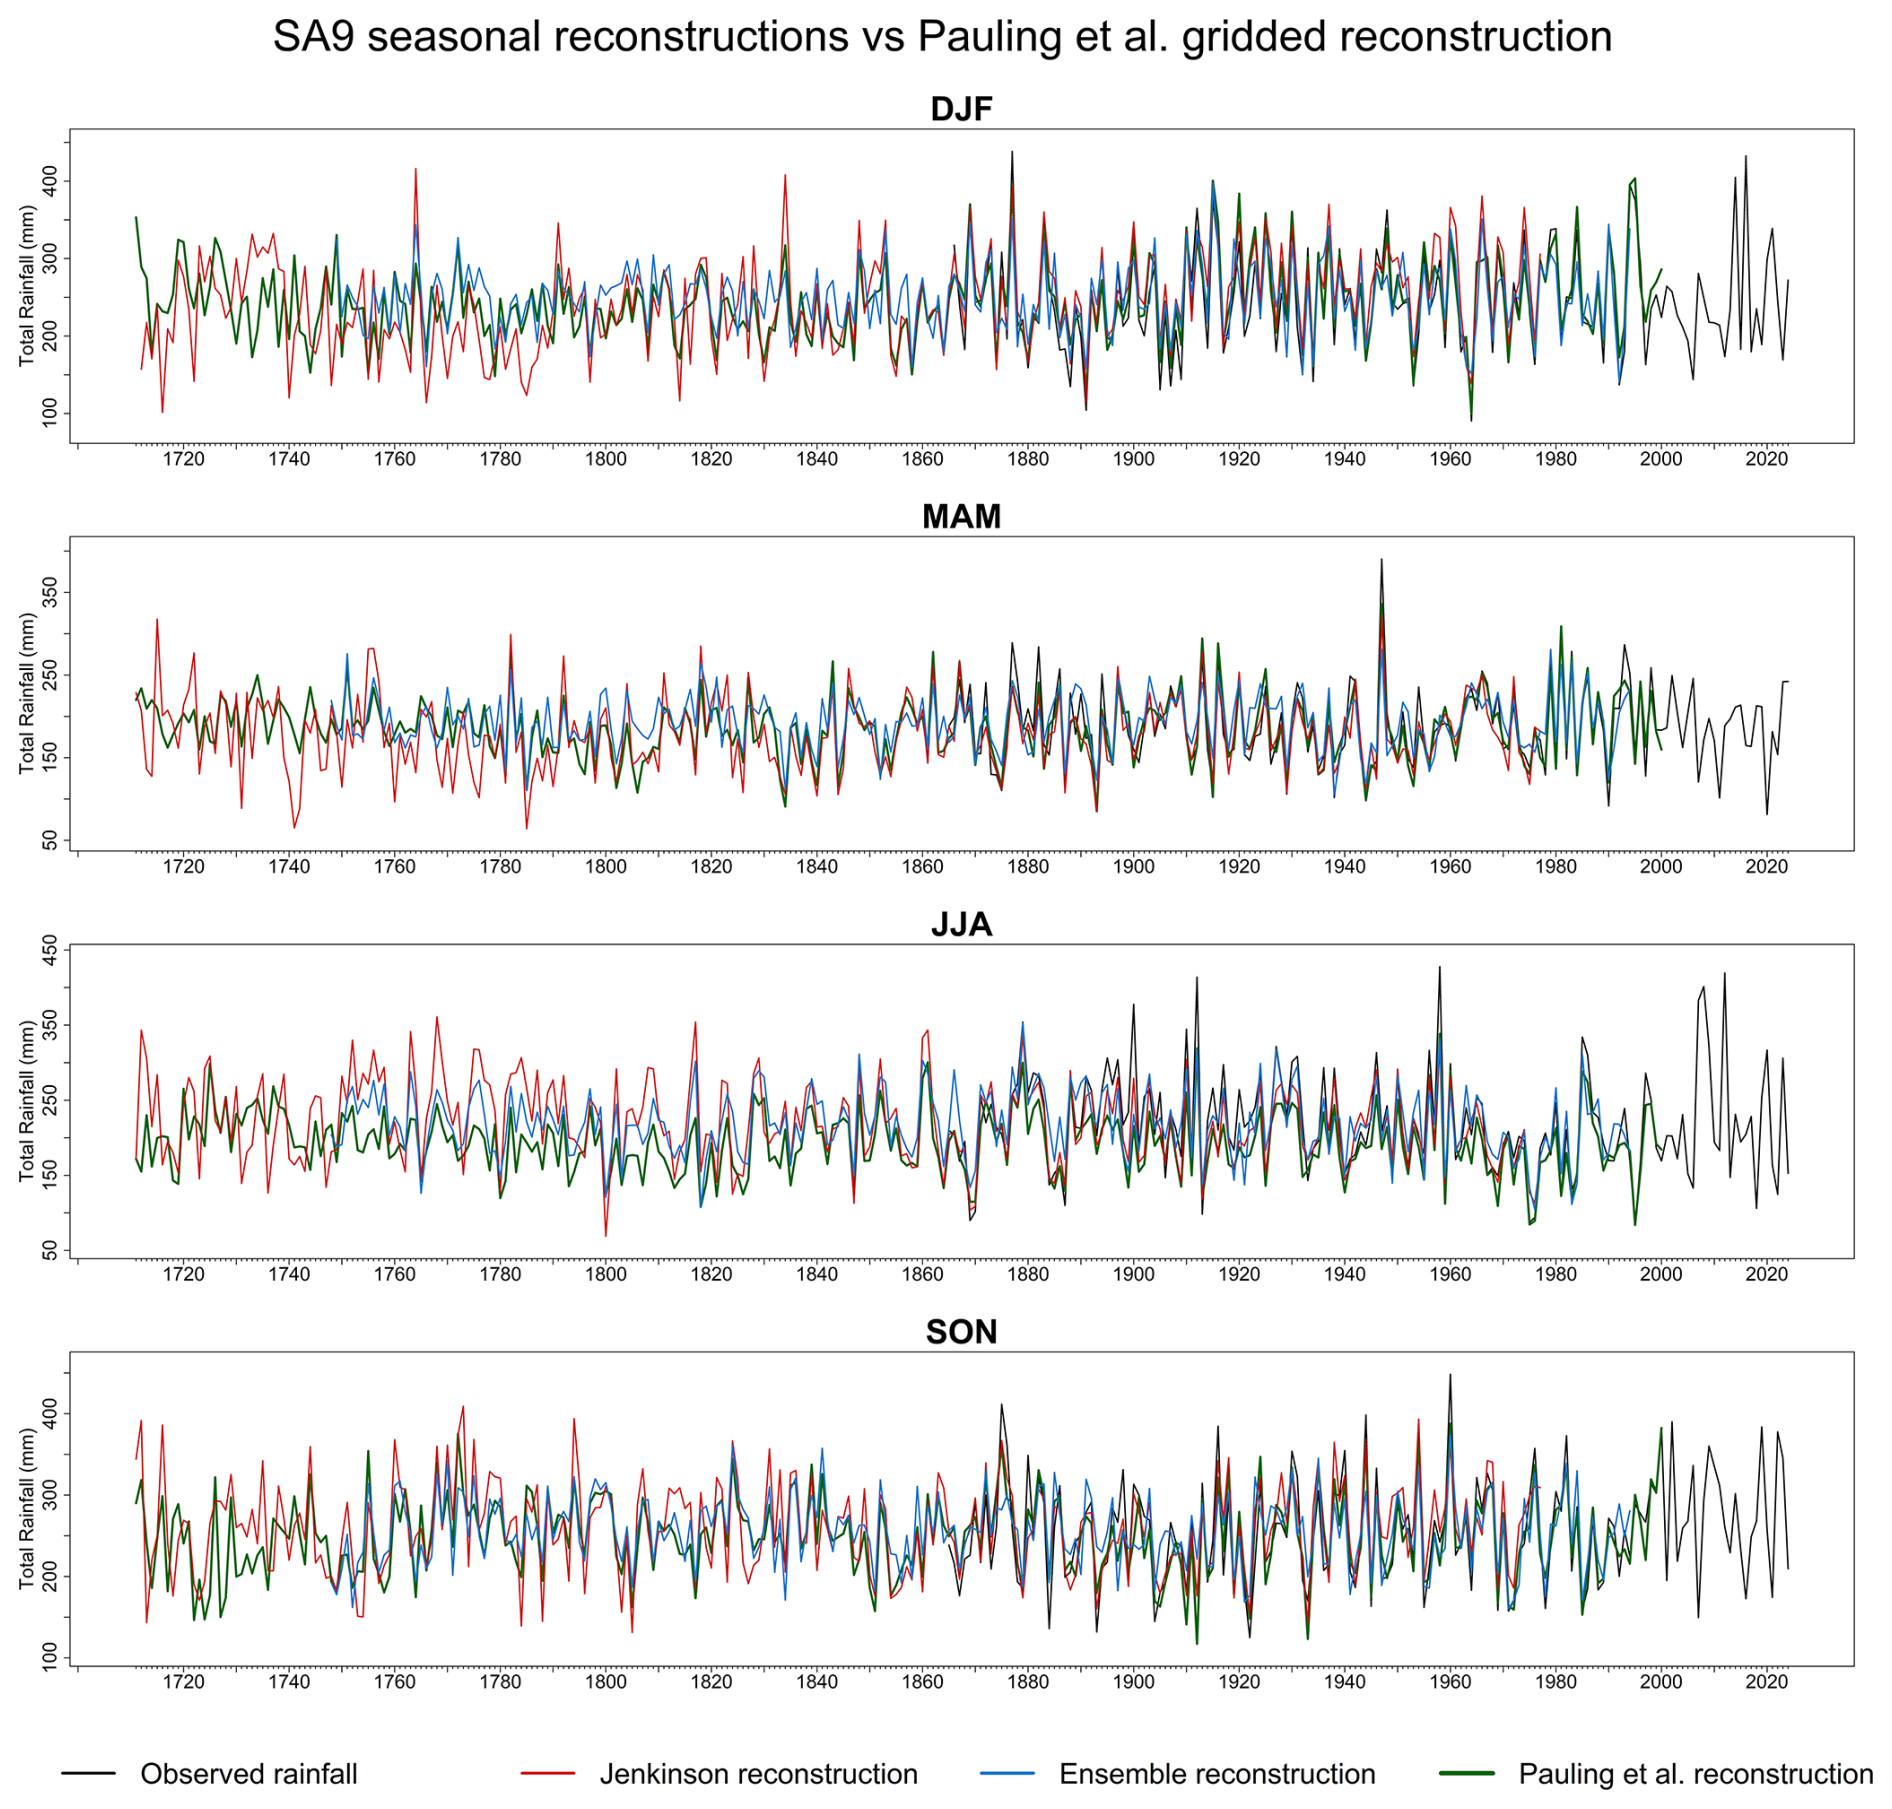
Figure 13Comparison of seasonal totals for SA9 from observations, Pauling et al. (2006) reconstructions, the weighted ensemble mean and the Jenkinson reconstruction from 1711 to 2024.
4.5 Trends in the rainfall reconstructions
Each monthly reconstruction was appended with observed rainfall from 1865 onwards, and annual and seasonal trends assessed for progressively later start years with a fixed end year of 2024 (Fig. 14). Both products contain identical observations from 1865 onwards, so their trends are identical for periods beginning in 1865 or later.
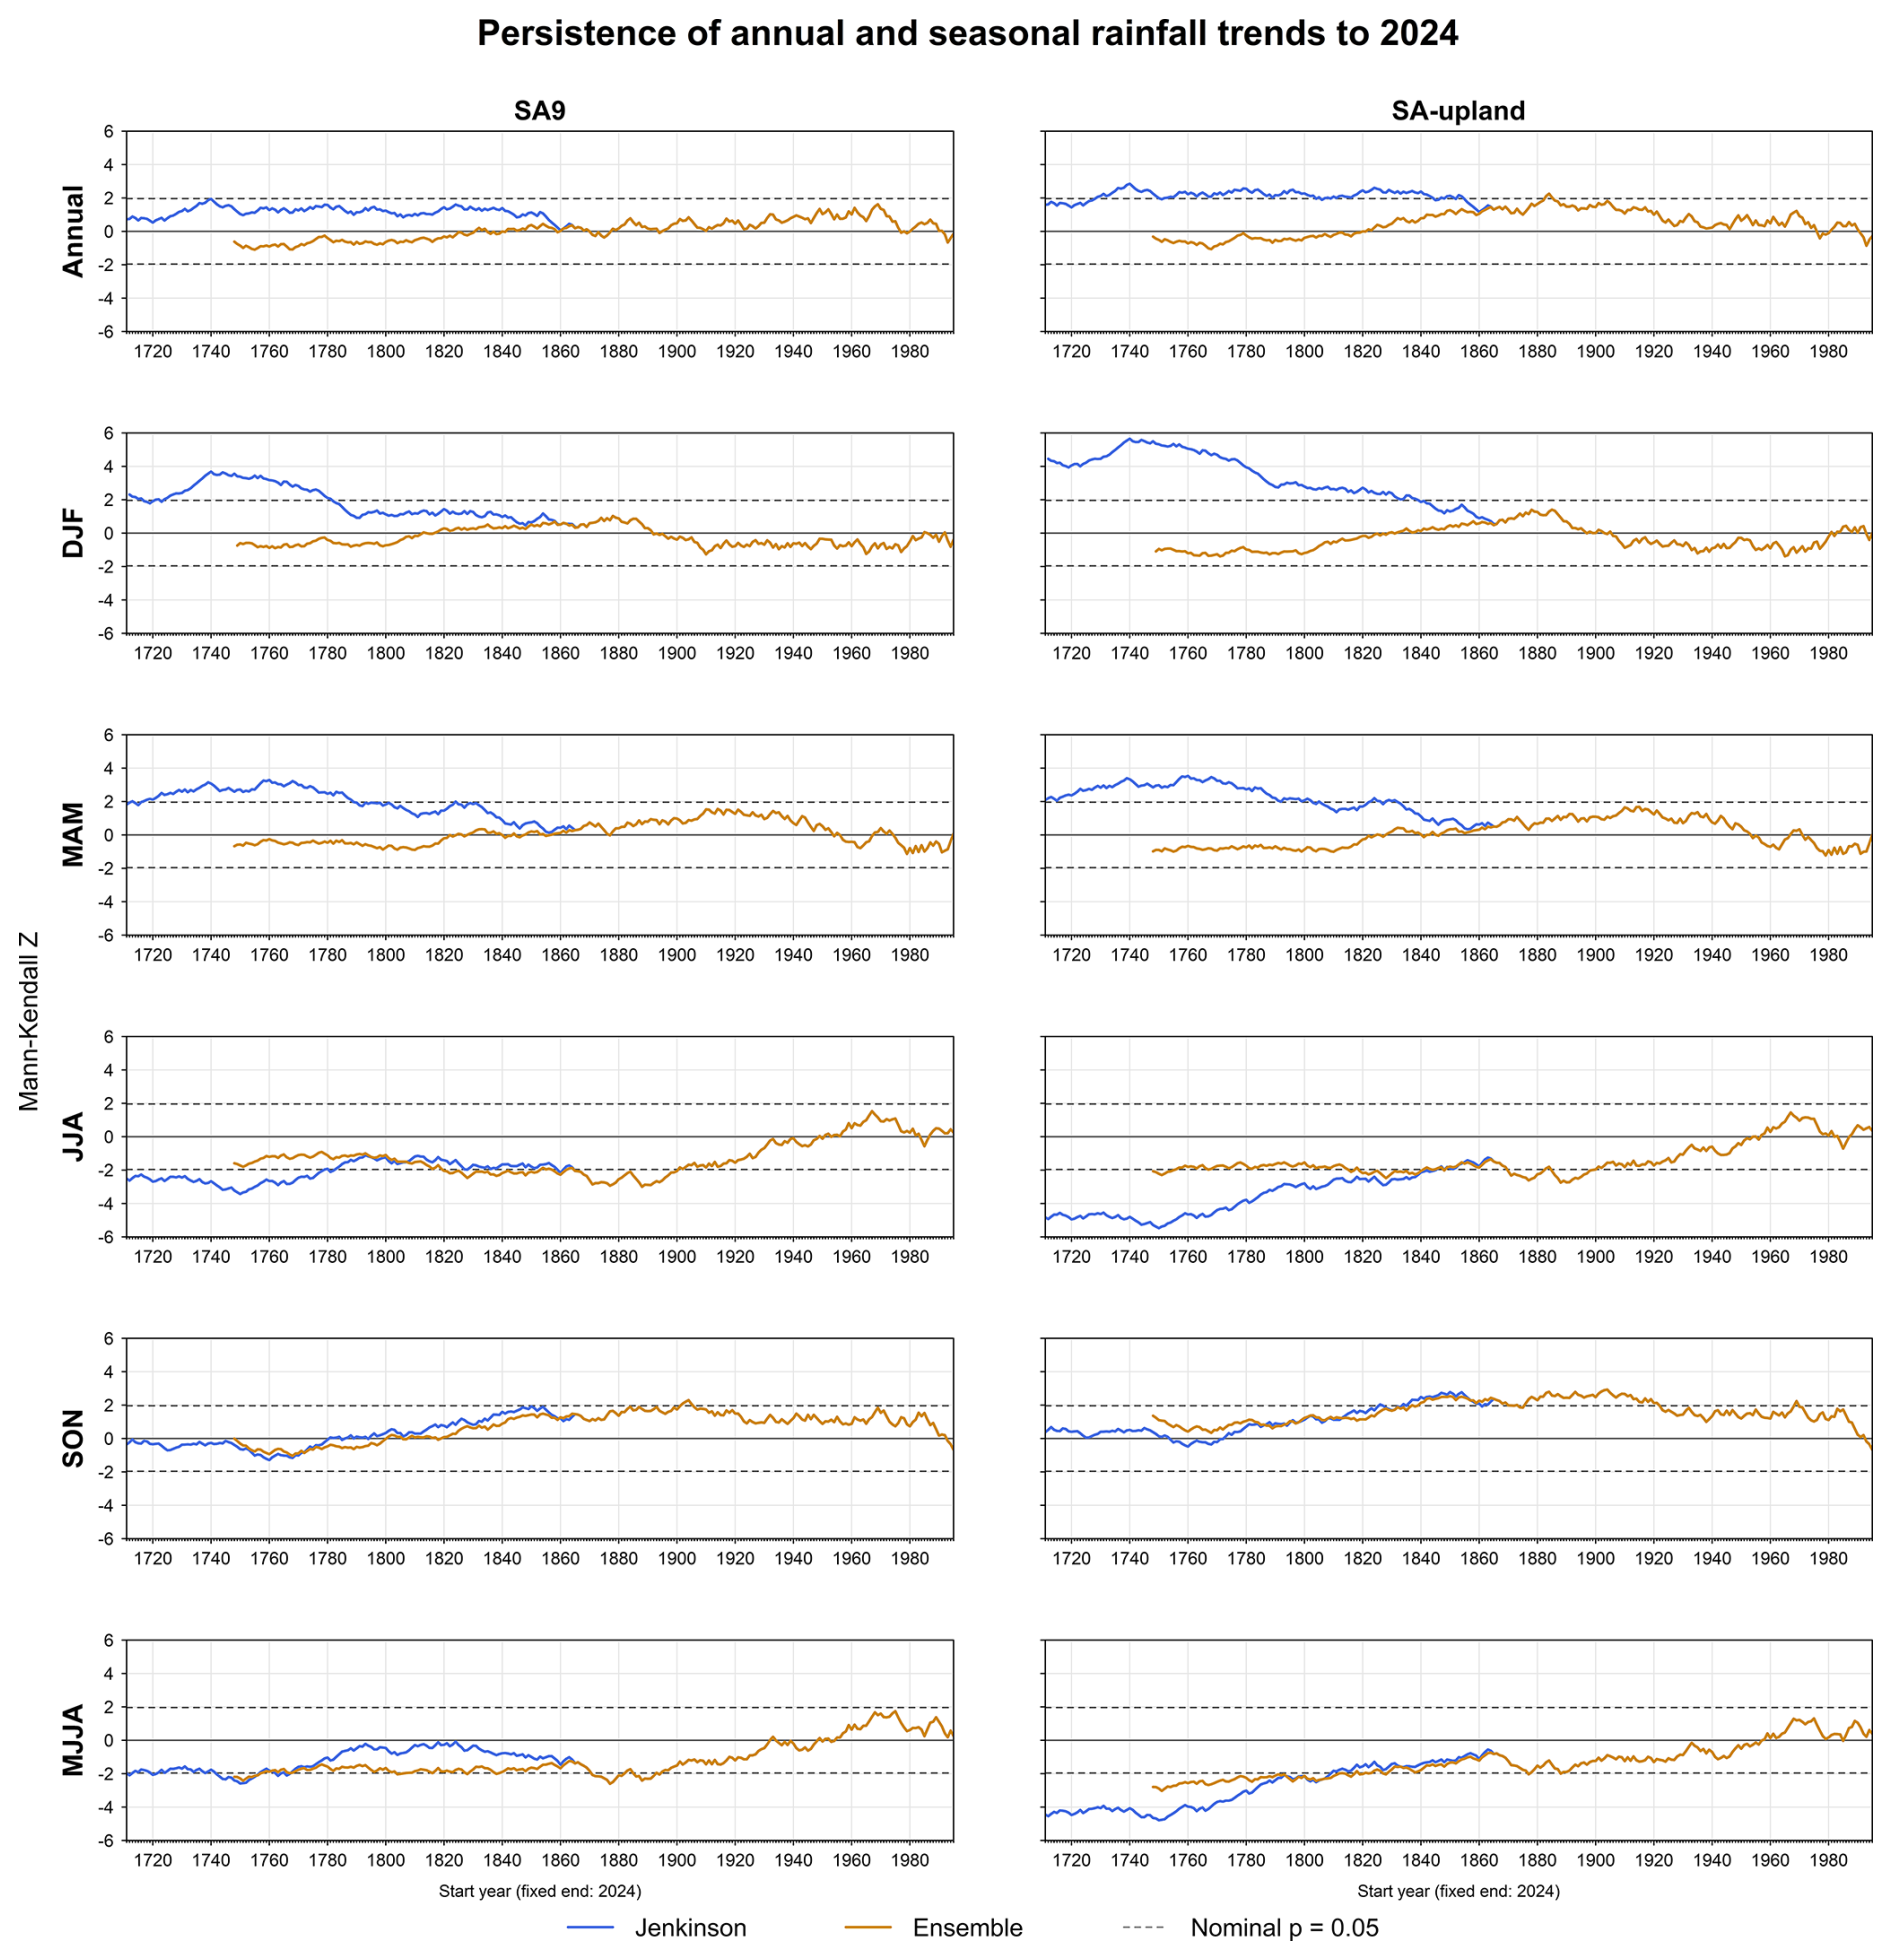
Figure 14Persistence of annual and seasonal rainfall trends in the appended Jenkinson and Ensemble series for SA9 and SA-upland. Mann-Kendall Z statistics are calculated for progressively later start years with a fixed end year of 2024. Dashed lines denote the nominal significance threshold (). Both reconstructions are appended with the same observed rainfall series from 1865 onwards; consequently, the Z values become identical once the analysis periods contain only the common observational record.
The largest differences in trends in both series occur in winter and spring. For tests beginning in the eighteenth century, Jenkinson generally indicates significant increases in DJF and MAM rainfall in both domains, whereas the ensemble indicates weak, non-significant decreases. The winter contrast is particularly pronounced in SA-upland. Annual rainfall also shows contrasting trend direction, magnitude and significance for tests commencing early in the record, with significant increases evident over many analysis periods in the SA-upland Jenkinson series but weak, non-significant decreases in the ensemble.
Both series indicate strong decreasing trends in JJA rainfall for tests commencing during their respective reconstruction periods. Decreasing trends are stronger and more persistently significant in the Jenkinson series, particularly in SA-upland. MJJA trends also generally indicate decreases for tests commencing throughout the reconstruction periods, although their significance depends on the domain and start year of the test. Autumn trends show the closest agreement between reconstructions, with trends commencing in the reconstruction period tending to show weak and non-significant trends relative to large and often significant increasing trends for tests commencing during the period of observations.
This study developed and evaluated complementary precipitation reconstructions for contrasting lowland and upland domains in the Greater Dublin Area (GDA). The documentary-instrumental and circulation-based reconstructions extend monthly rainfall into the early eighteenth century, while tree-ring oxygen-isotope evidence provides summer hydroclimatic context back to 1200 CE. Together, they broaden the regional evidence available for assessing rainfall variability and demonstrate the value of comparing documentary, instrumental, circulation-based and proxy information rather than relying on a single reconstruction (Pauling et al., 2006; Murphy et al., 2018; Brázdil et al., 2018; Brönnimann et al., 2019a, b).
Across the common observational period (1865–1977), Jenkinson shows the strongest agreement with observations at monthly, seasonal, annual and event-based scales. Its incorporation of instrumental rainfall helps preserve variability and extreme-event magnitude, although some station observations contribute to both datasets, limiting their independence. The statistical ensemble also performs well but smooths variability and compresses extremes, consistent with variance reduction in regression-based reconstructions (Bürger, 2007; Hastie et al., 2009). The δ18O reconstruction has weaker interannual agreement, reflecting both its central England location and the integration of growing-season hydroclimatic conditions within tree-ring isotope signals (McCarroll and Loader, 2004; Gessler et al., 2014; Klesse et al., 2018). Its principal contribution is therefore a longer perspective on low-frequency summer variability, rather than precise identification of individual rainfall extremes.
These performance differences must be interpreted alongside changes in the underlying evidence. Jenkinson benefits from increasingly dense instrumental coverage and more standardised observing practices in later periods, whereas earlier estimates depend more heavily on documentary sources and sparse gauges. Strong agreement during the observational overlap therefore does not establish equivalent reliability in the eighteenth century. A further limitation is that the Jenkinson estimates for both domains use the same Ireland-wide annual anomalies and monthly rainfall proportions, rescaled by domain-specific AAR. This adjusts rainfall amounts but preserves the same temporal pattern, so differences in historical rainfall variability between SA9 and SA-upland are not independently reconstructed. The ensemble is less dependent on early rainfall measurements, but assumes that relationships between its predictors and GDA rainfall remain sufficiently stable back to 1748. Neither reconstruction can consequently be judged uniformly superior from comparison with observations alone.
The greatest pre-observational divergence between reconstructions occurs in winter and spring, particularly in SA-upland. Broad correspondence between reconstruction residuals and the extended Dublin Snow and Sleet series suggests that solid-precipitation undercatch may contribute to low early Jenkinson totals. This interpretation is physically plausible because gauge exposure, wind and precipitation phase can affect measurement efficiency, while early observing practices were less standardised (Strangeways, 1996, 2010; Pollock et al., 2018). Comparable seasonal inhomogeneities have been identified in long Irish and UK rainfall records (Murphy et al., 2018, 2019). However, the extended snow and sleet series is itself reconstructed and annually resolved, so its correspondence with rainfall residuals cannot establish the magnitude of undercatch or explain every difference between the rainfall products.
Comparison with Pauling et al. (2006) and several long UK rainfall series lends additional support to the ensemble representation of eighteenth-century winter conditions. These comparisons are useful because cold-season rainfall across Britain and Ireland shares strong North Atlantic circulation influences. Nevertheless, agreement with external records does not constitute direct validation of Dublin rainfall, particularly in the uplands, where exposure and topography modify regional precipitation. The combined evidence supports considering undercatch and changing source coverage in the Jenkinson series as plausible contributors to early cold-season divergence, while leaving their relative importance unresolved. Such biases matter for trend evaluation as systematically low early winter and spring totals could exaggerate apparent long-term wetting and affect drought estimates derived from those totals. The trend persistence analysis illustrates this. For tests beginning in the eighteenth century, Jenkinson generally indicates significant increases in winter and spring rainfall, whereas the ensemble indicates weak, non-significant decreases. This contrast is particularly pronounced for upland winter rainfall and shows how uncertainty in early precipitation estimates affects inferred long-term trends.
Summer rainfall during 1730–1800 remains particularly uncertain. Within the period covered by both monthly reconstructions, divergence is substantial during the latter half of the eighteenth century, especially for upland JJA and MJJA. Spalding and Kew show elevated summer totals closer to Jenkinson, whereas Oxford and Carlisle align more closely with the ensemble. The δ18O chronology provides partial support for Jenkinson but does not resolve the disagreement, and the Pauling et al. (2006) comparison provides further evidence that some Jenkinson summer totals may be too high. The absence of a consistent external benchmark prevents selection of one reconstruction as definitive. Both reconstruction error and genuine spatial differences in summer rainfall may contribute, consistent with heterogeneous conditions in other European reconstructions (Pauling et al., 2006; Casty et al., 2007; Cook et al., 2015; Brázdil et al., 2020b). This period is therefore best interpreted through the range of available evidence. Despite these differences, both reconstructions show persistently large and often statistically significant decreasing trends in summer precipitation in both domains, a finding of relevance to water resource management.
Historical episodes illustrate how the reconstructions add climatic context without directly explaining societal impacts. During 1739–1741, encompassing the Irish “Year of the Slaughter”, Jenkinson indicates approximately average annual rainfall in 1739 followed by annual rainfall totals 30.5 % lower in 1740 and 26.1 % lower in 1741 than in 1739, alongside exceptional cold in CET during 1740. These conditions provide context for a famine shaped by climatic stress, harvest failure and social vulnerability (Jones and Briffa, 2006; Engler et al., 2013). Because the ensemble begins in 1748, this rainfall interpretation relies solely on Jenkinson and requires caution.
The practical contribution of these reconstructions is an extended rainfall baseline for subsequent drought assessment and water-resource stress testing. Jenkinson offers stronger overlap-period representation of event magnitude, the ensemble supplies a complementary circulation-informed estimate, and δ18O evidence extends summer context beyond the monthly records. Their suitability depends on season, period and application, making retention of alternative estimates preferable to treating one reconstruction as definitive. These complementary records also provide opportunities to investigate the climatic context of historical crises. For example, Jenkinson rainfall estimates could be combined with temperature and documentary evidence to examine conditions surrounding the Irish famine of 1740–1741 (Jones and Briffa, 2006; Engler et al., 2013), although the absence of ensemble estimates before 1748 limits comparison between reconstruction approaches. Both monthly reconstructions could support further investigation of the 1765–1768 drought, distinguishing seasonal rainfall deficits from the persistence of hydrological and societal impacts documented in historical sources and the Irish Drought Impacts Database (Murphy et al., 2017, 2020; Jobbová et al., 2024).
Hydrological and water-system modelling is needed to translate the climatic sequences into inflow, storage and supply consequences. Further Irish documentary and proxy evidence, more explicit quantification of reconstruction uncertainty and improved spatial representation would strengthen these applications (Brázdil et al., 2018; Peña-Angulo et al., 2022; Jobbová et al., 2024). Future research could also examine the contributions of external forcing and internal variability to reconstructed rainfall changes, distinguishing changes in seasonal totals from those in rainfall extremes (Fordham and Murphy, 2026) and accounting for the spatially and seasonally heterogeneous hydroclimatic responses to volcanic forcing (Rao et al., 2017).
This study presents a multi-method reconstruction of precipitation variability for the Greater Dublin Area, integrating documentary, instrumental, circulation-based indices, and tree-ring isotope evidence. Complementary monthly reconstructions were developed for lowland and upland water-resource domains using the Jenkinson rainfall dataset and a statistical ensemble based on Lasso and Random Forest models, while an oak cellulose δ18O chronology was used to extend May–August rainfall back to 1200 CE. Across the observational overlap period, both the Jenkinson reconstruction and the statistical ensemble reproduce broad rainfall variability, but the Jenkinson reconstruction shows the strongest agreement with observations at monthly, seasonal, annual, and event scales, given that this series integrates the earliest observations in Ireland. The statistical ensemble provides a physically interpretable, circulation-based reconstruction, although it tends to smooth variability and under-represent extremes. The δ18O reconstruction shows weaker interannual agreement with observed MJJA rainfall but provides an independent perspective on longer-term summer hydroclimatic variability.
Reconstruction performance over the instrumental overlap does not imply uniform reliability through time. Prior to the mid-nineteenth century, winter and spring divergence between the Jenkinson and weighted ensemble mean reconstructions is consistent with possible snow- and sleet-related undercatch in early precipitation sources. Summer rainfall during the eighteenth century is also uncertain, with differences among the Dublin reconstructions, the δ18O chronology, the long-term UK rainfall series, and other seasonal reconstructions suggesting genuine regional hydroclimatic heterogeneity. Used together, these reconstructions provide a stronger basis for contextualising droughts, pluvials, and seasonal rainfall variability affecting the Greater Dublin Area. For water-resource and climate-risk applications, the reconstructions extend the range of hydroclimatic variability available for stress-testing beyond the instrumental period and hydrological evaluation of reconstructed drought and pluvial episodes.
The datasets and code supporting this study are openly available through the Zenodo repository at https://doi.org/10.5281/zenodo.20605305 (Horvath et al., 2026).
The repository contains the input datasets used for the statistical, documentary and tree-ring rainfall reconstructions, R scripts required to reproduce the reconstruction workflows, calibration and uncertainty estimation procedures, and the derived reconstruction products for both the SA9 and SA-upland study domains. These include the monthly rainfall reconstructions, associated 95 % uncertainty intervals, extended snow and sleet (SS) series, tree-ring reconstructions, and accompanying documentation describing the repository structure and individual workflows. README files are provided to describe the required input data, folder structure, and execution workflow, thereby facilitating reproduction of the analyses.
The supplement related to this article is available online at https://doi.org/10.5194/cp-22-1963-2026-supplement.
Conceptualization and methodology, CM, CH; Formal analysis, CH; Resources, CR, CM; Data curation, CH, CR; Statistical analysis and visualisation, CH; Writing – original draft preparation, CH; Writing – review and editing, CH, CM, CR; Supervision, CM, CR; All authors contributed to interpretation of the findings and approved the final manuscript.
The contact author has declared that none of the authors has any competing interests.
Publisher's note: Copernicus Publications remains neutral with regard to jurisdictional claims made in the text, published maps, institutional affiliations, or any other geographical representation in this paper. The authors bear the ultimate responsibility for providing appropriate place names. Views expressed in the text are those of the authors and do not necessarily reflect the views of the publisher.
The authors gratefully acknowledge Met Éireann for providing the gridded precipitation dataset that formed an integral component of this study.
This research has been supported by the Irish Research Council (grant no. IRC/GOIPG/2022/1844).
This paper was edited by Jürg Luterbacher and reviewed by three anonymous referees.
Adam, J. C. and Lettenmaier, D.P.: Adjustment of global gridded precipitation for systematic bias, J. Geophys. Res.-Atmos., 108, 4257, https://doi.org/10.1029/2002JD002499, 2003.
Barnston, A. G. and Livezey, R. E.: Classification, Seasonality and Persistence of Low-Frequency Atmospheric Circulation Patterns, Mon. Weather Rev., 115, 1083–1126, https://doi.org/10.1175/1520-0493(1987)115<1083:CSAPOL>2.0.CO;2, 1987.
Blöschl, G., Kiss, A., Viglione, A., Barriendos, M., Böhm, O., Brázdil, R., Coeur, D., Demarée, G., Llasat, M. C., Macdonald, N., Retsö, D., Roald, L., Schmocker-Fackel, P., Amorim, I., Bělínová, M., Benito, G., Bertolin, C., Camuffo, D., Cornel, D., Doktor, R., Elleder, L., Enzi, S., Garcia, J. C., Glaser, R., Hall, J., Haslinger, K., Hofstätter, M., Komma, J., Limanówka, D., Lun, D., Panin, A., Parajka, J., Petrić, H., Rodrigo, F. S., Rohr, C., Schönbein, J., Schulte, L., Silva, L. P., Toonen, W. H. J., Valent, P., Waser, J., and Wetter, O.: Current European flood-rich period exceptional compared with past 500 years, Nature, 583, 560–566, https://doi.org/10.1038/s41586-020-2478-3, 2020.
Brázdil, R., Kiss, A., Luterbacher, J., Nash, D. J., and Řezníčková, L.: Documentary data and the study of past droughts: a global state of the art, Clim. Past, 14, 1915–1960, https://doi.org/10.5194/cp-14-1915-2018, 2018.
Brázdil, R., Dobrovolný, P., Bauch, M., Camenisch, C., Kiss, A., Kotyza, O., Oliński, P., and Řezníčková, L.: Central Europe, 1531–1540 CE: The driest summer decade of the past five centuries?, Clim. Past, 16, 2125–2151, https://doi.org/10.5194/cp-16-2125-2020, 2020a.
Brázdil, R., Kiss, A., Řezníčková, L., and Barriendos, M.: Droughts in Historical Times in Europe, as Derived from Documentary Evidence, in: Palaeohydrology – Traces, Tracks and Trails of Extreme Events, edited by: Herget, J. and Fontana, A., Springer, Cham, 65–96, https://doi.org/10.1007/978-3-030-23315-0_4, 2020b.
Breiman, L.: Random Forests, Mach. Learn., 45, 5–32, https://doi.org/10.1023/A:1010933404324, 2001.
Brönnimann, S., Allan, R., Ashcroft, L., Baer, S., Barriendos, M., Brázdil, R., Brugnara, Y., Brunet, M., Brunetti, M., Chimani, B., Cornes, R., Domínguez-Castro, F., Filipiak, J., Founda, D., Herrera, R., Gergis, J., Grab, S., Hannak, L., Huhtamaa, H., Jacobsen, K., Jones, P., Jourdain, S., Kiss, A., Lin, K., Lorrey, A., Lundstad, E., Luterbacher, J., Mauelshagen, F., Maugeri, M., Maughan, N., Moberg, A., Neukom, R., Nicholson, S., Noone, S., Nordli, Ø., Ólafsdóttir, K., Pearce, P., Pfister, L., Pribyl, K., Przybylak, R., Pudmenzky, C., Rasol, D., Reichenbach, D., Řezníčková, L., Rodrigo, F., Rohr, C., Skrynyk, O., Slonosky, V., Thorne, P., Valente, M., Vaquero, J., Westcott, N., Williamson, F., and Wyszyński, P.: Unlocking Pre-1850 Instrumental Meteorological Records: A Global Inventory, B. Am. Meteorol. Soc., 100, ES389–ES413, https://doi.org/10.1175/BAMS-D-19-0040.1, 2019a.
Brönnimann, S., Martius, O., Rohr, C., Bresch, D. N., and Lin, K.-H. E.: Historical weather data for climate risk assessment, Ann. NY Acad. Sci., 1436, 121–137, https://doi.org/10.1111/nyas.13966, 2019b.
Büntgen, U., Urban, O., Krusic, P. J., Rybníček, M., Kolář, T., Kyncl, T., Ač, A., Koňasová, E., Čáslavský, J., Esper, J., Wagner, S., Saurer, M., Tegel, W., Dobrovolný, P., Cherubini, P., Reinig, F., and Trnka, M.: Recent European drought extremes beyond Common Era background variability, Nat. Geosci., 14, 190–196, https://doi.org/10.1038/s41561-021-00698-0, 2021.
Bürger, G.: On the verification of climate reconstructions, Clim. Past, 3, 397–409, https://doi.org/10.5194/cp-3-397-2007, 2007.
Casty, C., Raible, C. C., Stocker, T. F., Wanner, H., and Luterbacher, J.: A European pattern climatology 1766–2000, Clim. Dynam., 29, 791–805, https://doi.org/10.1007/s00382-007-0257-6, 2007.
Cook, E. R., Seager, R., Kushnir, Y., Briffa, K. R., Büntgen, U., Frank, D., Krusic, P. J., Tegel, W., van der Schrier, G., Andreu-Hayles, L., Baillie, M., Baittinger, C., Bleicher, N., Bonde, N., Brown, D., Carrer, M., Cooper, R., Čufar, K., Dittmar, C., Esper, J., Griggs, C., Gunnarson, B., Günther, B., Gutierrez, E., Haneca, K., Helama, S., Herzig, F., Heussner, K.-U., Hofmann, J., Janda, P., Kontic, R., Köse, N., Kyncl, T., Levanič, T., Linderholm, H., Manning, S., Melvin, T. M., Miles, D., Neuwirth, B., Nicolussi, K., Nola, P., Panayotov, M., Popa, I., Rothe, A., Seftigen, K., Seim, A., Svarva, H., Svoboda, M., Thun, T., Timonen, M., Touchan, R., Trotsiuk, V., Trouet, V., Walder, F., Ważny, T., Wilson, R., and Zang, C.: Old World megadroughts and pluvials during the Common Era, Sci. Adv., 1, e1500561, https://doi.org/10.1126/sciadv.1500561, 2015.
Coonan, B., Curley, M., and Ryan, C.: Long-term rainfall averages for Ireland 1991–2020, Climatological Note No.22, Met Éireann, https://www.edepositireland.ie/entities/publication/440059f6-bba8-4d7e-bb67-ea712d8c70ae (last access: 19 December 2025), 2024.
Cornes, R. C., Jones, P. D., Briffa, K. R., and Osborn, T. J.: A daily series of mean sea-level pressure for London, 1692–2007, Int. J. Climatol., 32, 641–656, https://doi.org/10.1002/joc.2301, 2012a.
Cornes, R. C., Jones, P. D., Briffa, K. R., and Osborn, T. J.: A daily series of mean sea-level pressure for Paris, 1670–2007, Int. J. Climatol., 32, 1135–1150, https://doi.org/10.1002/joc.2349, 2012b.
Cornes, R. C., Jones, P. D., Briffa, K. R., and Osborn, T. J.: Estimates of the North Atlantic Oscillation back to 1692 using a Paris-London westerly index, Int. J. Climatol., 33, 228–248, https://doi.org/10.1002/joc.3416, 2013.
Cornes, R. C., van der Schrier, G., van den Besselaar, E. J. M., and Jones, P. D.: An ensemble version of the E-OBS temperature and precipitation data sets, J. Geophys. Res.-Atmos., 123, 9391–9409, https://doi.org/10.1029/2017JD028200, 2018.
Craddock, J. M. and Wales-Smith, B. G.: Monthly rainfall totals representing the East Midlands for the years 1726 to 1975, Meteorol. Magaz., 106, 97–111, https://digital.nmla.metoffice.gov.uk/IO_8fc7172f-50f8-4792-b7e9-f972b3963adc/ (last access: 26 December 2025), 1977.
Daly, C.: Guidelines for assessing the suitability of spatial climate data sets, Int. J. Climatol., 26, 707–721, https://doi.org/10.1002/joc.1322, 2006.
Daly, C., Doggett, M., Smith, J., Olson, K., Halbleib, M., Dimcovic, Z., Keon, D., Loiselle, R., Steinberg, B., Ryan, A., Pancake, C., and Kaspar, E.: Challenges in Observation-Based Mapping of Daily Precipitation across the Conterminous United States, J. Atmos. Ocean. Technol., 38, 1979–1992, https://doi.org/10.1175/JTECH-D-21-0054.1, 2021.
Dixon, F. E.: Weather in Old Dublin, Dublin Historical Record, 13, 94–107, https://www.jstor.org/stable/i30103806 (last access: 2 November 2026), 1953.
Efron, B. and Tibshirani, R. J.: An Introduction to the Bootstrap, New York: Chapman and Hall, https://doi.org/10.1201/9780429246593, 1993.
Engler, S., Mauelshagen, F., Werner, J., and Luterbacher, J.: The Irish famine of 1740–1741: famine vulnerability and ”climate migration”, Clim. Past, 9, 1161–1179, https://doi.org/10.5194/cp-9-1161-2013, 2013.
Fordham, S. and Murphy, C.: The Emergence of a Climate Change Signal in Ireland's Rainfall Extremes, Int. J. Climatol., 46, e70346, https://doi.org/10.1002/joc.70346, 2026.
Friedman, J. H., Hastie, T., and Tibshirani, R.: Regularization Paths for Generalized Linear Models via Coordinate Descent, J. Stat. Softw., 33, 1–22, https://doi.org/10.18637/jss.v033.i01, 2010.
Gessler, A., Ferrio, J. P., Hommel, R., Treydte, K., Werner, R. A., and Monson, R. K.: Stable isotopes in tree rings: towards a mechanistic understanding of isotope fractionation and mixing processes from the leaves to the wood, Tree Physiol., 34, 796–818, https://doi.org/10.1093/treephys/tpu040, 2014.
Hastie, T., Tibshirani, R., and Friedman, J.: The Elements of Statistical Learning: Data Mining, Inference, and Prediction, 2nd Edn., New York: Springer, https://doi.org/10.1007/978-0-387-84858-7, 2009.
Hawkins, E., Burt, S., McCarthy, M., Murphy, C., Ross, C., Baldock, M., Brazier, J., Hersee, G., Huntley, J., Meats, R., O'Grady, J., Scrimgeour, I., and Silk, T.: Millions of historical monthly rainfall observations taken in the UK and Ireland rescued by citizen scientists, Geosci. Data J., 10, 246–261, https://doi.org/10.1002/gdj3.157, 2023.
Herrera, S., Gutiérrez, J. M., Ancell, R., Pons, M. R., Frías, M. D., and Fernández, J.: Development and analysis of a 50-year high-resolution daily gridded precipitation dataset over Spain (Spain02), Int. J. Climatol., 32, 74–85, https://doi.org/10.1002/joc.2256, 2012.
Hofstra, N., Haylock, M., New, M., and Jones, P.D.: Testing E-OBS European high-resolution gridded data set of daily precipitation and surface temperature, J. Geophys. Res.-D: Atmos., 114, D21101, https://doi.org/10.1029/2009JD011799, 2009.
Horvath, C., Ryan, C., and Murphy, C.: A Monthly Snow and Sleet Series for the Greater Dublin Area 1867–2024, Geosci. Data J., 12, e70022, https://doi.org/10.1002/gdj3.70022, 2025.
Horvath, C., Ryan, C., and Murphy, C.: Multi-centennial Rainfall Reconstructions for the Greater Dublin Area, Ireland Version: 1.0., Zenodo [data set and code], https://doi.org/10.5281/zenodo.20605305, 2026.
Hurrell, J. W.: Decadal trends in the North Atlantic Oscillation: regional temperatures and precipitation, Science, 269, 676–679, https://doi.org/10.1126/science.269.5224.676, 1995.
Jenkinson, A. F., Shackleton, W., and Lawson, S.: Monthly and Annual Rainfall for Ireland, 1711–1977, UK Met Office Branch Memorandum, No. 77, unpublished, available as supplementary material to Murphy et al. (2018), https://doi.org/10.5194/cp-14-413-2018-supplement, 1979.
Jobbová, E., Crampsie, A., Murphy, C., Ludlow, F., McLeman, R., Horvath, C., Seifert, N., Myslinski, T., and Sente, L.: The Irish drought impacts database: A 287-year database of drought impacts derived from newspaper archives, Geosci. Data J., 11, 1007–1023, https://doi.org/10.1002/gdj3.272, 2024.
Jones, P. D. and Briffa, K. R.: Unusual Climate in Northwest Europe During the Period 1730 to 1745 Based on Instrumental and Documentary Data, Clim. Change, 79, 361–379, https://doi.org/10.1007/s10584-006-9078-6, 2006.
Jones, P. D., Wigley, T. M. L., and Briffa, K. R.: Monthly Mean Pressure Reconstructions for Europe (back to 1780) and North America (to 1858), Technical Note TR037, Washington, DC: U.S. Department of Energy, https://www.osti.gov/biblio/6848862 (last access: 3 November 2026), 1987.
Jones, P. D., Jónsson, T., and Wheeler, D.: Extension to the North Atlantic Oscillation using early instrumental pressure observations from Gibraltar and south-west Iceland, Int. J. Climatol., 17, 1433–1450, https://doi.org/10.1002/(SICI)1097-0088(19971115)17:13<1433::AID-JOC203>3.0.CO;2-P, 1997.
Jones, P. D., Davies, T. D., Lister, D. H., Slonosky, V., Jónsson, T., Bärring, L., Jönsson, P., Maheras, P., Kolyva-Machera, F., Barriendos, M., and Martin-Vide, J.: Monthly mean pressure reconstructions for Europe for the 1780–1995 period, Int. J. Climatol., 19, 347–364, https://doi.org/10.1002/(SICI)1097-0088(19990330)19:4<347::AID-JOC363>3.0.CO;2-S, 1999.
Kelly-Quinn, M., Blacklocke, S., Bruen, M., Earle, R., O'Neill, E., O'Sullivan, J., and Purcell, P.: Dublin Ireland: a city addressing challenging water supply, management, and governance issues, Ecol. Soc., 19, 10, https://doi.org/10.5751/ES-06921-190410, 2014.
Kendall, M. G.: Rank Correlation Methods, 4th edn., London: Charles Griffin, ISBN 9780852641996, 1975.
Kendon, L., Short, C., Cotterill, D., Pirret, J., Chan, S., and Pope, J.: UK Climate Projections: UKCP Local (2.2 km) Transient Projections, Met Office, https://www.metoffice.gov.uk/binaries/content/assets/metofficegovuk/pdf/research/ukcp/ukcp_local_report_2023.pdf (last access: 19 December 2025), 2023.
Klesse, S., Weigt, R., Treydte, K., Saurer, M., Schmid, L., Siegwolf, R. T. W., and Frank, D. C.: Oxygen isotopes in tree rings are less sensitive to changes in tree size and relative canopy position than carbon isotopes, Plant, Cell Environ., 41, 2899–2914, https://doi.org/10.1111/pce.13424, 2018.
Li, J., Pollinger, F., and Paeth, H.: Comparing the Lasso Predictor-Selection and Regression Method with Classical Approaches of Precipitation Bias Adjustment in Decadal Climate Predictions, Mon. Weather Rev., 148, 4339–4351, https://doi.org/10.1175/MWR-D-19-0302.1, 2020.
Liaw, A. and Wiener, M.: Classification and Regression by randomForest, R. News, 2, 18–22, https://journal.r-project.org/articles/RN-2002-022/RN-2002-022.pdf (last access: 30 December 2025), 2002.
Loader, N. J., Mccarroll, D., Miles, D., Young, G. H. F., Davies, D., and Ramsey, C. B.: Tree ring dating using oxygen isotopes: a master chronology for central England, J. Quaternary Sci., 34, 475–490, https://doi.org/10.1002/jqs.3115, 2019.
Loader, N. J., Young, G. H. F., McCarroll, D., Davies, D., Miles, D., and Bronk Ramsey, C.: Summer precipitation for the England and Wales region, 1201–2000 CE, from stable oxygen isotopes in oak tree rings, J. Quaternary Sci., 35, 731–736, https://doi.org/10.1002/jqs.3226, 2020.
Luterbacher, J., Schmutz, C., Gyalistras, D., Xoplaki, E., and Wanner, H.: Reconstruction back to AD 1675 of monthly NAO and EU indices, Geophys. Res. Lett., 26, 2745–2748, https://doi.org/10.1029/1999GL900576, 1999.
Luterbacher, J., Xoplaki, E., Dietrich, D., Rickli, R., Jacobeit, J., Beck, C., Gyalistras, D., Schmutz, C., and Wanner, H.: Reconstruction of sea level pressure fields over the Eastern North Atlantic and Europe back to 1500, Clim. Dynam., 18, 545–561, https://doi.org/10.1007/s00382-001-0196-6, 2002.
Manley, G.: Snowfall in Britain over the past 300 years, Weather, 24, 428–437, https://doi.org/10.1002/j.1477-8696.1969.tb03117.x, 1969.
Manley, G.: Central England temperatures: Monthly means 1659 to 1973, Q. J. Roy. Meteorol. Soc., 100, 389–405, https://doi.org/10.1002/qj.49710042511, 1974.
Mann, H. B.: Non-parametric tests against trend, Econometrica, 13, 245–259 https://doi.org/10.2307/1907187, 1945.
Matiu, M., Napoli, A., Kotlarski, S., Zardi, D., Bellin, A., and Majone, B.: Elevation-dependent biases of raw and bias-adjusted EURO-CORDEX regional climate models in the European Alps, Clim. Dynam., 62, 9013–9030, https://doi.org/10.1007/s00382-024-07376-y, 2024.
McCarroll, D. and Loader, N. J.: Stable isotopes in tree rings, Quaternary Sci. Rev., 23, 771–801, https://doi.org/10.1016/j.quascirev.2003.06.017, 2004.
Murphy, C., Harrigan, S., Hall, J., and Wilby, R. L.: Climate-driven trends in mean and high flows from a network of reference stations in Ireland, Hydrol. Sci. J., 58, 755–772, https://doi.org/10.1080/02626667.2013.782407, 2013.
Murphy, C., Noone, S., Duffy, C., Broderick, C., Matthews, T., and Wilby, R.L.: Irish droughts in newspaper archives: rediscovering forgotten hazards?, Weather, 72, 151–155, https://doi.org/10.1002/wea.2904, 2017.
Murphy, C., Broderick, C., Burt, T. P., Curley, M., Duffy, C., Hall, J., Harrigan, S., Matthews, T. K. R., Macdonald, N., McCarthy, G., McCarthy, M. P., Mullan, D., Noone, S., Osborn, T. J., Ryan, C., Sweeney, J., Thorne, P. W., Walsh, S., and Wilby, R. L.: A 305-year continuous monthly rainfall series for the island of Ireland (1711–2016), Clim. Past, 14, 413–440, https://doi.org/10.5194/cp-14-413-2018, 2018.
Murphy, C., Wilby, R.L., Matthews, T.K.R., Thorne, P., Broderick, C., Fealy, R., Hall, J., Harrigan, S., Jones, P., McCarthy, G., MacDonald, N., Noone, S., and Ryan, C.: Multi-century trends to wetter winters and drier summers in the England and Wales precipitation series explained by observational and sampling bias in early records, Int. J. Climatol., 40, 610–619, https://doi.org/10.1002/joc.6208, 2019.
Murphy, C., Wilby, R.L., Matthews, T., Horvath, C., Crampsie, A., Ludlow, F., Noone, S., Brannigan, S., Hannaford, J., McLeman, R., and Jobbova, E.: The forgotten drought of 1765–1768: Reconstructing and re-evaluating historical droughts in the British and Irish Isles, Int. J. Climatol., 40, 5329–5351, https://doi.org/10.1002/joc.6521, 2020.
Newman, A., Clark, M., Craig, J., Nijssen, B., Wood, A., Gutmann, E., Mizukami, N., Brekke, L., and Arnold, J.: Gridded Ensemble Precipitation and Temperature Estimates for the Contiguous United States, J. Hydrometeorol., 16, 2481–2500, https://doi.org/10.1175/JHM-D-15-0026.1, 2015.
Noone, S., Murphy, C., Coll, J., Matthews, T., Mullan, D., Wilby, R. L., and Walsh, S.: Homogenization and analysis of an expanded long-term monthly rainfall network for the Island of Ireland (1850–2010), Int. J. Climatol., 36, 2837–2853, https://doi.org/10.1002/joc.4522, 2016.
Noone, S., Broderick, C., Duffy, C., Matthews, T., Wilby, R. L., and Murphy, C.: A 250-year drought catalogue for the island of Ireland (1765–2015), Int. J. Climatol., 37, 239–254, https://doi.org/10.1002/joc.4999, 2017.
O'Connor, P., Murphy, C., Matthews, T., and Wilby, R.: Reconstructed monthly river flows for Irish catchments 1766–2016, Geosci. Data J., 8, 34–54, https://doi.org/10.1002/gdj3.107, 2021.
Parker, D. E., Legg, T. P., and Folland, C. K.: A new daily central England temperature series, 1772–1991, Int. J. Climatol., 12, 317–342, https://doi.org/10.1002/joc.3370120402, 1992.
Parry, S., Lavers, D., Wilby, R., Prudhomme, C., Wood, P., Murphy, C., and O'Connor, P.: Abrupt drought termination in the British-Irish Isles driven by high atmospheric vapour transport, Environ. Res. Lett., 18, 104050, https://doi.org/10.1088/1748-9326/acf145, 2023.
Pauling, A., Luterbacher, J., Casty, C., and Wanner, H.: Five hundred years of gridded high-resolution precipitation reconstructions over Europe and the connection to large-scale circulation, Clim. Dynam., 26, 387–405, https://doi.org/10.1007/s00382-005-0090-8, 2006.
Peña-Angulo, D., Vicente-Serrano, S. M., Domínguez-Castro, F., Lorenzo-Lacruz, J., Murphy, C., Hannaford, J., Allan, R. P., Tramblay, Y., Reig-Garcia, F., and El Kenway, A.: The complex and spatially diverse patterns of hydrological droughts across Europe, Water Resour. Res., 58, e2022WR031976, https://doi.org/10.1029/2022WR031976, 2022.
Pollock, M. D., O'Donnell, G., Quinn, P., Dutton, M., Black, A., Wilkinson, M. E., Colli, M., Stagnaro, M., Lanza, L. G., Lewis, E., Kilsby, C. G., and O'Connel, P. E.: Quantifying and mitigating wind-induced undercatch in rainfall measurements, Water Resour. Res., 54, 3863–3875, https://doi.org/10.1029/2017WR022421, 2018.
Rao, M. P., Cook, B. I., Cook, E. R., D'Arrigo, R. D., Krusic, P. J., Anchukaitis, K. J., LeGrande, A. N., Buckley, B. M., Davi, N. K., Leland, C., and Griffin, K. L.: European and Mediterranean hydroclimate responses to tropical volcanic forcing over the last millennium, Geophys. Res. Lett., 44, 5104–5112, https://doi.org/10.1002/2017GL073057, 2017.
Rogers, J. C.: The Association between the North Atlantic Oscillation and the Southern Oscillation in the Northern Hemisphere, Mon. Weather Rev., 112, 1999–2015, https://doi.org/10.1175/1520-0493(1984)112<1999:TABTNA>2.0.CO;2, 1984.
Rudd, A. C., Bell, V. A., and Kay, A. L.: National-scale analysis of simulated hydrological droughts (1891–2015), J. Hydrol., 550, 368–385, https://doi.org/10.1016/j.jhydrol.2017.05.018, 2017.
Rutty, J.: A Chronological History of the Weather and Seasons, and of the Prevailing Diseases in Dublin: With Their Various Periods, Successions, and Revolutions, During the Space of Forty Years With a Comparative View of the Difference of the Irish Climate and Diseases, and Those of England and Other Countries, London: Robinson and Roberts, https://wellcomecollection.org/works/xtgjfwsq/items (last access: 3 November 2026), 1770.
Ryan, C. and McGovern, R.: Irish Weather Rescue Project, Met Éireann, https://www.zooniverse.org/projects/met-rhonda/irish-weather-rescue (last access: 18 December 2025), 2025.
Ryan, C., Murphy, C., McGovern, R., Curley, M., Walsh, S., and 476 students: Ireland's pre-1940 daily rainfall records, Geosci. Data J., 8, 11–23, https://doi.org/10.1002/gdj3.103, 2021.
Ryan, C., Curley, M., Walsh, S., and Murphy, C.: Long-term trends in extreme precipitation indices in Ireland, Int. J. Climatol., 42, 4040–4061, https://doi.org/10.1002/joc.7475, 2022.
Shields, L.: The beginnings of scientific weather observation in Ireland (1684–1708), Weather, 38, 304–311, https://doi.org/10.1002/j.1477-8696.1983.tb04811.x, 1983.
Strangeways, I.: A history of rain gauges, Weather, 65, 133–138, https://doi.org/10.1002/wea.548, 2010.
Strangeways, I. C.: Back to basics: The met. enclosure Part 2(b) – Rain gauges, their errors, Weather, 51, 298–303, https://doi.org/10.1002/j.1477-8696.1996.tb06230.x, 1996.
Tabony, R. C.: A revised rainfall series for Spalding, Lincolnshire, Meteorological Magazine, 109, 152–157, https://digital.nmla.metoffice.gov.uk/IO_97b1364d-379d-4fe0-bf1f-87b52ff69af3/ (last access: 26 December 2025), 1980.
Tetko, I. V., Livingstone, D. J., and Luik, A. I.: Neural network studies. 1. Comparison of overfitting and overtraining, J. Chem. Info. Comput. Sci., 35, 826–833, https://doi.org/10.1021/ci00027a006, 1995.
Tibshirani, R.: Regression Shrinkage and Selection Via the Lasso, J. Roy. Stat. Soc. B (Methodological), 58, 267–288, https://doi.org/10.1111/j.2517-6161.1996.tb02080.x, 1996.
Todd, B., Macdonald, N., Chiverrell, R. C., Caminade, C., and Hooke, J. M.: Severity, duration and frequency of drought in SE England from 1697–2011, Clim. Change, 121, 673–687, https://doi.org/10.1007/s10584-013-0970-6, 2013.
Uisce Éireann: Regional Water Resources Plan-Eastern and Midlands Non-Technical Summary, Uisce Éireann, https://www.water.ie/sites/default/files/docs/rwrp-easternmidlands/2022/rwrp-em-nts/RWRP-EM-NTS.pdf (last access: 9 January 2026), 2022a.
Uisce Éireann: Regional Water Resources Plan- Eastern and Midlands Study Area 9 Technical Report, Uisce Éireann, https://www.water.ie/sites/default/files/projects/strategic-plans/national-water-resources/rwrp/eastern-midlands/RWRP-EM-Appendix-9-Study-Area-9-Technical-Report.pdf (last access: 16 October 2025), 2022b.
Wales-Smith, B. G.: Monthly and annual totals of rainfall representative of Kew, Surrey, from 1697 to 1970, Meteorol. Magaz., 100, 345–360, https://digital.nmla.metoffice.gov.uk/IO_e22505c4-c460-4833-8d3c-b0146537ab0e/ (last access: 26 December 2025), 1971.
Wetter, O., Pfister, C., Werner, J. P., Zorita, E., Wagner, S., Seneviratne, S. I., Herget, J., Grünewald, U., Luterbacher, J., Alcoforado, M. J., Barriendos, M., Bieber, U., Brázdil, R., Burmeister, K. H., Camenisch, C., Contino, A., Dobrovolný, P., Glaser, R., Himmelsbach, I., Kiss, A., Kotyza, O., Labbé, T., Limanówka, D., Litzenburger, L., Nordli, Ø., Pribyl, K., Retsö, D., Riemann, D., Rohr, C., Siegfried, W., Söderberg, J., and Spring, J.-L.: The year-long unprecedented European heat and drought of 1540 – a worst case, Clim. Change, 125, 349–363, https://doi.org/10.1007/s10584-014-1184-2, 2014.
Wilby, R., Prudhomme, C., Parry, S., and Muchan, K. G. L.: Persistence of Hydrometeorological Droughts in the United Kingdom: A Regional Analysis of Multi-Season Rainfall and River Flow Anomalies, J. Extreme Event., 2, 1550006, https://doi.org/10.1142/S2345737615500062, 2015.
Wilby, R. L. and Murphy, C.: Decision-making by water managers despite climate uncertainty, in: The Oxford Handbook of Planning for Climate Change Hazards, edited by: Pfeffer, W. T., Smith, J. B., and Ebi, K. L., Oxford: Oxford University Press, https://doi.org/10.1093/oxfordhb/9780190455811.013.52, 2019.
Wilby, R. L., O'Hare, G., and Barnsley, N.: The North Atlantic Oscillation and British Isles climate variability, 1865–1996, Weather, 52, 266–276, https://doi.org/10.1002/j.1477-8696.1997.tb06323.x, 1997.