the Creative Commons Attribution 4.0 License.
the Creative Commons Attribution 4.0 License.
 | 12 Jun 2026
Seasonal variations in flooding inferred from lake sediments in Western Norway
Pål Ringkjøb Nielsen
Jostein Bakke
Øyvind Paasche
Jan Magne Cederstrøm
Johannes Hardeng
George Edward Young
Holocene flood reconstructions from western and southern Norway indicate a non-stationary behaviour through time, with a major regime shift around 4000 years ago. Under the influence of global warming, flood frequency, seasonality, and magnitude are changing worldwide. The full range of natural variability in flood frequency and seasonality remains poorly constrained, underscoring the need for ultra-high-resolution records to place recent changes in a long-term context. This study presents an 8000-year flood record from Lake Vangsvatnet, Western Norway, that combines high-resolution computed tomography (CT) scanning, X-ray fluorescence (XRF), grain-size analysis, and radiocarbon dating to differentiate between seasonal flood deposits (spring snowmelt versus autumn rainfall). The 11 m sediment core reveals distinct flood layers (n = 230), linked to varying hydrological conditions, and validated by historical discharge data (1892–2016 CE). The record shows fluctuating flood frequencies, with peaks at 6000–5300 and 1400 cal yr BP to present. A seasonal shift from rainfall-dominated to snowmelt-dominated floods occurred around 3100 cal yr BP, coinciding with regional cooling. The last 500 years exhibit the highest flood frequency of the entire record. These findings highlight the sensitivity of flood regimes to climatic and, in the most recent centuries, human influence. Under future warming, reduced snowpack may diminish spring floods, while intensified autumn and winter rainfall could increase flood risks.
- Article
(20226 KB) - Full-text XML
- BibTeX
- EndNote


Flooding is among the most destructive and costly natural hazards globally, and its frequency and severity are projected to increase in many regions due to anthropogenic climate change (Kundzewicz et al., 2018). In Europe, the combination of rising temperatures and altered precipitation regimes is expected to intensify the hydrological cycle, leading to more frequent and extreme weather events such as heavy rainfall, storms, and associated fluvial flooding, even in seasons which normally do not experience such events (e.g. Fang et al., 2024; Blöschl et al., 2019). These changes pose significant risks to human populations, infrastructure, and ecosystems, particularly in regions with complex topography and dense settlement patterns. Norway experienced the most expensive flood ever in early August 2023. The low-pressure system “Hans” brought up to 200 mm of rain over 3 d to parts of eastern Norway. More than 4000 people were evacuated, and the total cost just shy of EUR 850 million (Giovannelli and Grydeland, 2024). Such events highlight the need for a better understanding of the underlying causes of flooding and for effective mitigation measures.
Globally, palaeoflood investigations have played a central role in extending the flood record far beyond the instrumental period, offering critical insights into the magnitude, frequency, and climatic sensitivity of extreme hydrological events (Baker, 2006). Flood variability across Scandinavia is far from uniform, yet our understanding of its spatial and temporal patterns remains limited (Hardeng et al., 2022). Existing palaeoflood archives are sparse and site-specific, making it challenging to disentangle regional drivers from local processes (Johansson et al., 2020). This lack of spatial coverage and methodological consistency hampers efforts to assess how flood regimes respond to climate variability and anthropogenic forcing. Critically, we do not know the full range of natural variability in flood frequency – whether recent decades represent an anomaly or fall within long-term norms. To address this gap, there is an urgent need for ultra-high-resolution, multiproxy records that can capture flood frequency and seasonality on time scales relevant to human societies. More datasets with broader geographical coverage are essential for reconstructing the natural range of flood variability, identifying regime shifts, and improving predictive models under future climate scenarios (Engeland et al., 2020).
Instrumental records indicate that precipitation has increased by 19 % over the last 120 years in Norway, with a notable increase after 1980 CE (Konstali and Sorteberg, 2022), but it is only during the last 20–30 years that a systematic shift and increase in floods is evident. This aligns well with European trends. Blöschl et al. (2020) show that the last three decades were among the most flood-rich periods in Europe in the past 500 years. They also see a pronounced shift in seasonality compared to earlier flood-rich periods. The observed rapid change in hydrology (both magnitude and frequency) highlights the need for improved understanding and updated risk assessments in catchments prone to flooding.
The increasing reliance on structural flood defences in some municipalities in western Norway underscores the urgency of understanding long-term flood variability and the natural range of flood magnitudes and frequencies (e.g. Amundsen and Dannevig, 2021; Pulg et al., 2024). However, instrumental records of flooding are typically limited to the past century, which constrains our ability to assess long-term trends and natural variability in flood occurrence (Engeland et al., 2018). To address this gap, palaeoflood reconstructions using lake sediment archives have emerged as a valuable tool for extending flood records beyond the instrumental period (Wilhelm et al., 2022).
A growing body of high-resolution palaeoflood records has been published over the last few decades, documenting significant changes in flood variability on a Holocene timescale, in both magnitude and frequency. Paasche and Støren (2014) suggest that a regime shift in flood frequencies may have occurred around 4000 years ago, transitioning from a quiescent to a more active phase. Recent flood reconstructions from southern and western Norway reproduce this regime shift (Hardeng et al., 2022; Støren et al., 2010; Vasskog et al., 2011; Støren et al., 2012; Engeland et al., 2020; Johansson et al., 2020; Nesje et al., 2001a; Bøe et al., 2006; Hardeng et al., 2024). The records also indicate that flood frequency is non-stationary across timescales but with increasing frequency over the last 4000 years (Engeland et al., 2020), and that this shift is linked to variations in winter precipitation (Støren and Paasche, 2014). Støren et al. (2016) were able to discriminate between spring snowmelt floods and rain-induced autumn floods showing a shift towards spring floods in eastern Norway around 2000 years ago compared to the earlier part of the record, a trend that Hardeng et al. (2022) reproduce for Southern Norway. The possibility to differentiate between spring and autumn floods allows for a better understanding of the underlying forces driving these trends.
Regardless of these well-recorded trends, several factors influence sediment erosion, transport, and deposition within a catchment, and selecting appropriate sites and analytical methods is a key step in reconstructing robust flood records (e.g. Schillereff et al., 2014). Of particular relevance here, is the combination of methods with different resolution and reliability (e.g. Støren et al., 2016), especially since one of the primary targets is to unmix seasonal flood patterns during intervals that cross the major shift around 4000 years ago.
In this paper, we present an 11 m-long sediment record from Lake Vangsvatnet, in Western Norway. The lake is well-suited for studying floods as previously documented (Paasche et al., 2021). Instrumental records date back to 1892 CE and historical flood descriptions to 1604 CE (Roald, 2013). To establish a credible high-resolution flood time series, we combine a novel CT-method that characterise physical and biological variations with a high degree of precision. The outcome is a new record documenting systematic changes in seasonal flood deposits over the last 8000 years, with unprecedented resolution enabled by a very high and stable sedimentation rate. Specifically, we aim to (1) reconstruct long-term changes in flood frequency, (2) distinguish between different seasonal flood types, and (3) place recent flood-rich decades in a Holocene-scale context.
Lake Vangsvatnet (7.6 km2, 44 m a.s.l.) is situated in Voss Herad, ∼ 90 km inland from the west coast of Norway (Fig. 1). At Voss, the Raundalselvi and Strandaelvi river systems (525 and 374 km2, respectively) coalesce into the Vosso river before entering Vangsvatnet, depositing a delta (Fig. 2). The delta consists of several old terrace levels (at 61 and 50 m a.s.l.), and at least two old river channels. There is exposed bedrock at the confluence of the Strandaelvi and Raundalselvi rivers that exerts a primary control on the local flow towards the main river channel. From the terrace level at 50 m a.s.l. (most part of Vossevangen), the delta has prograded into Lake Vangsvatnet approximately 400 m (Fig. 2).
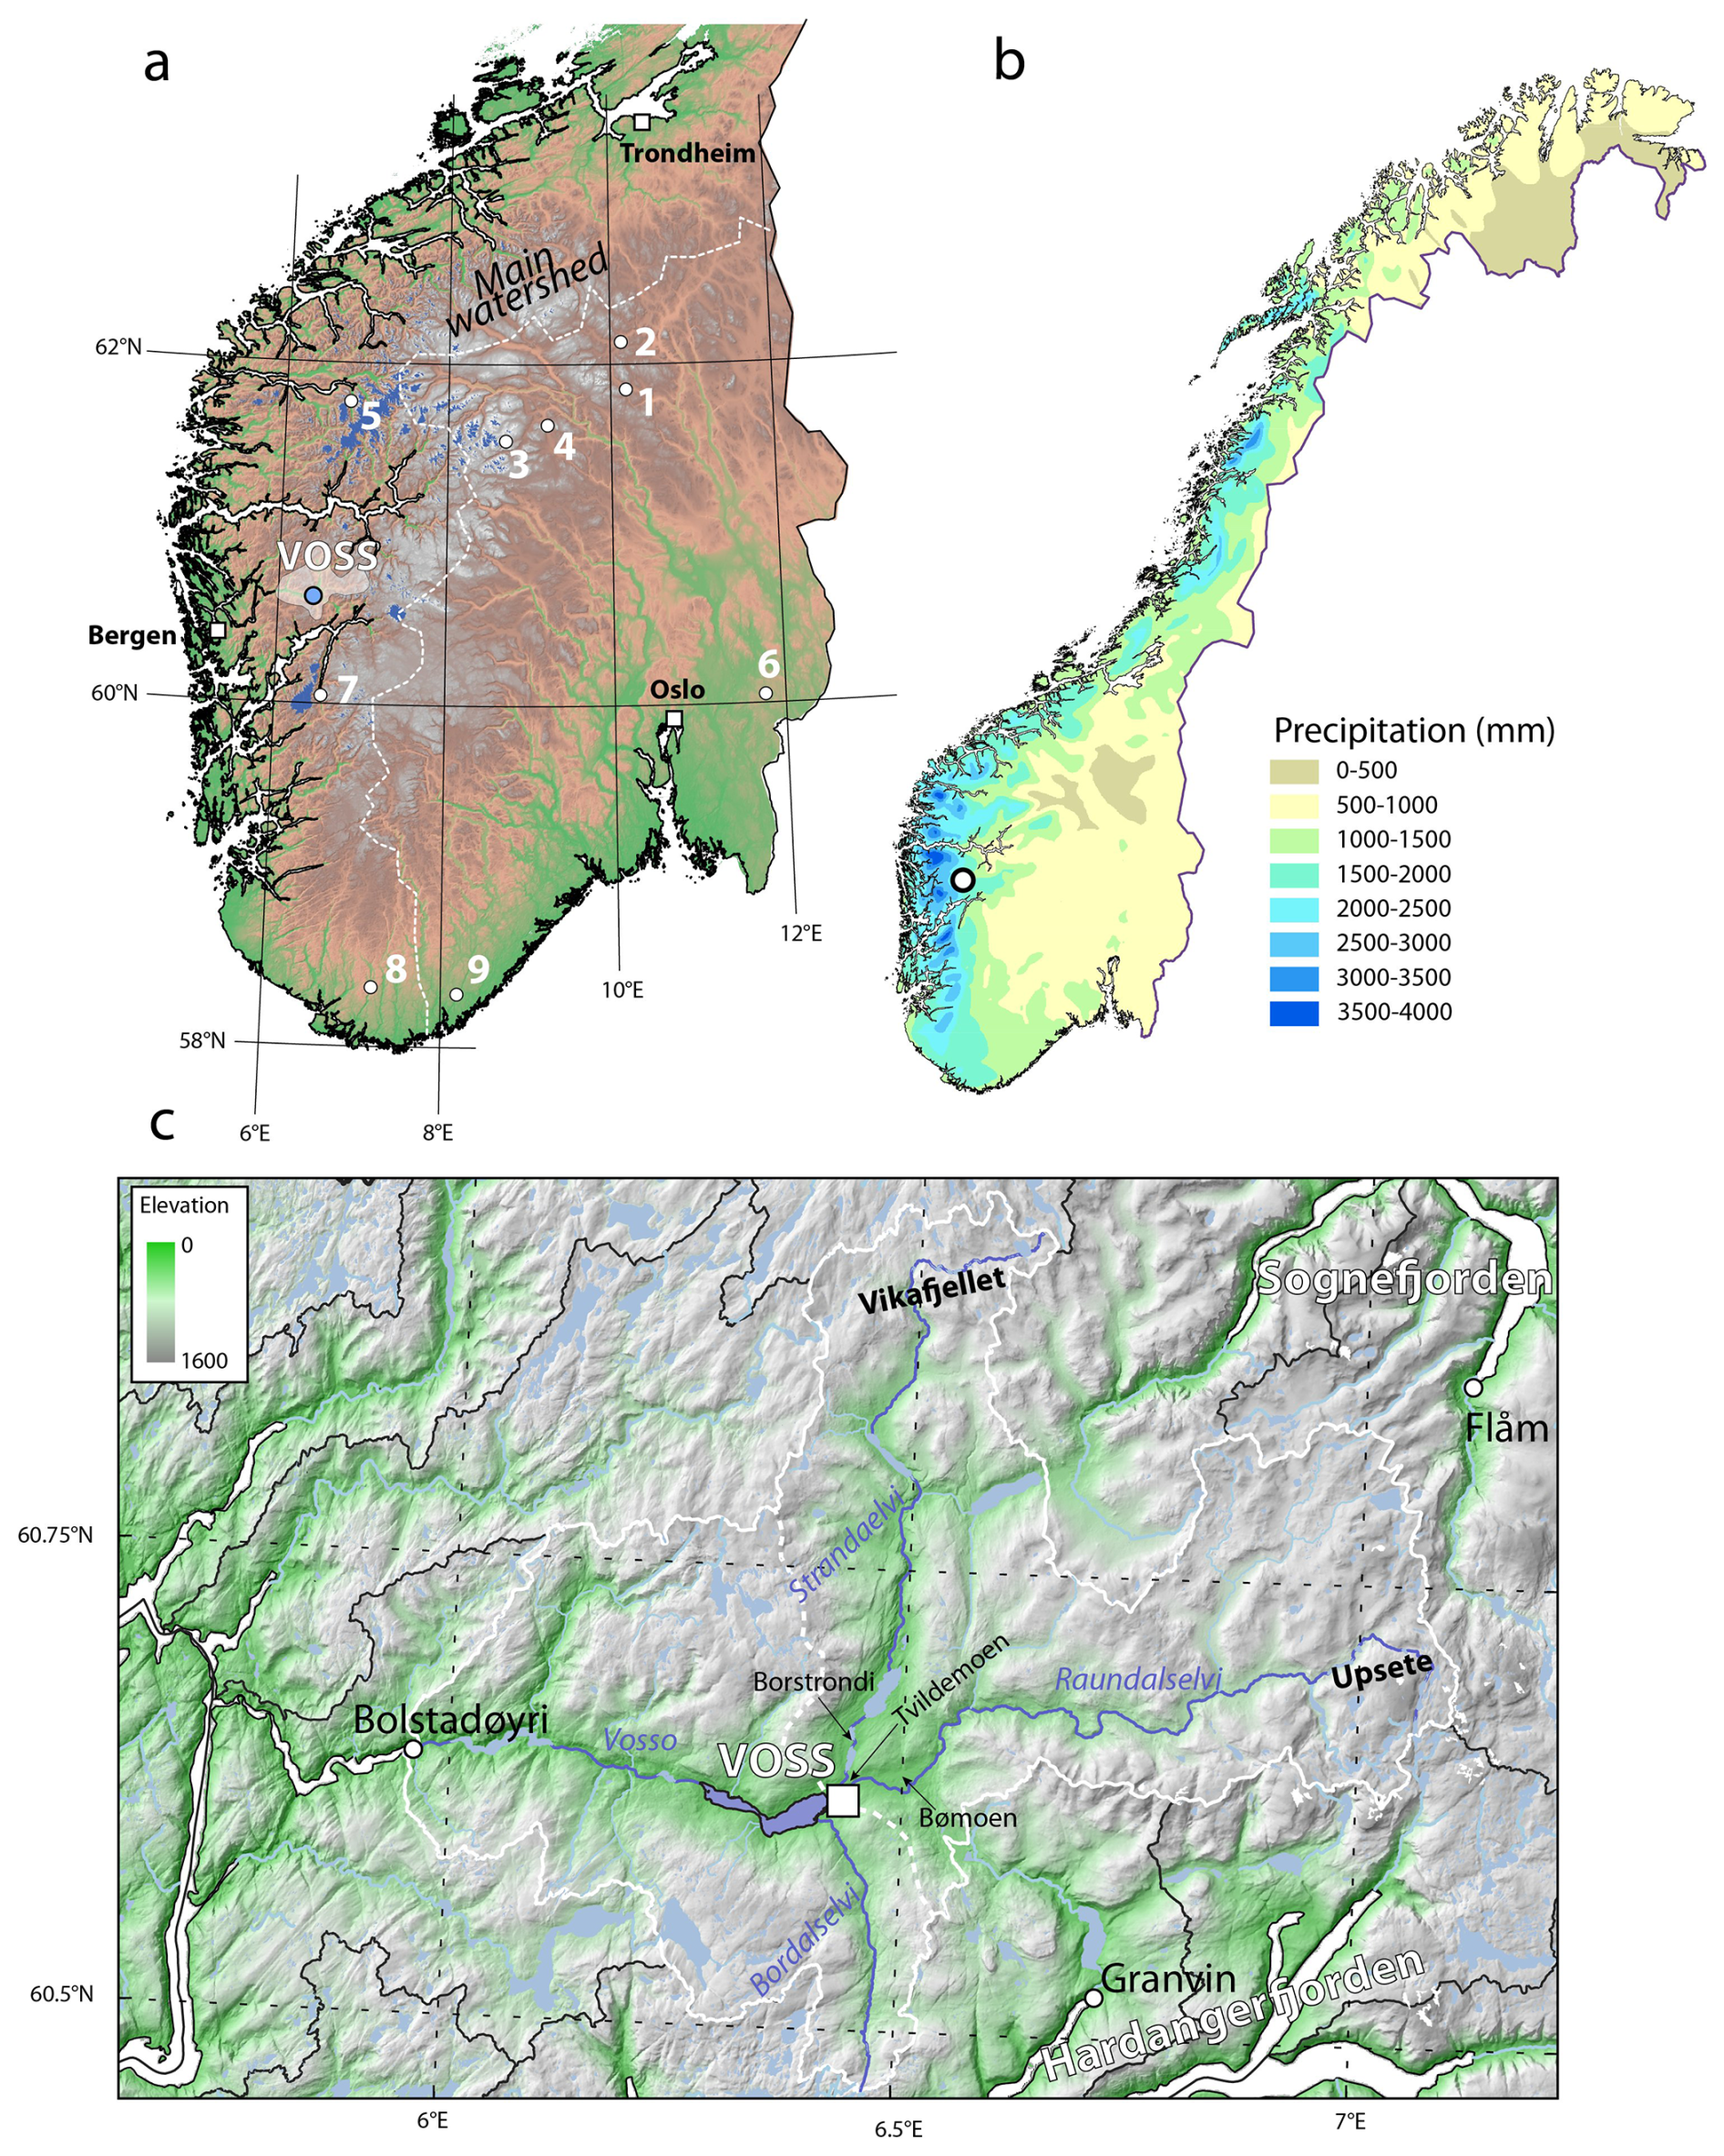
Figure 1(a) Map of south Norway showing the distribution of flood reconstructions (white dots) and the study area of this project: 1 – Atnsjøen (Nesje et al., 2001a), 2 – Butjønna (Bøe et al., 2006), 3 – Russvatnet (Støren et al., 2008), 4 – Meringdalsvatnet (Støren et al., 2010), 5 – Oldevatnet (Vasskog et al., 2011), 6 – Flyginnsjøen (Engeland et al., 2020), 7 – Sandvinvatnet (Johansson et al., 2020), 8 – Lygne (Hardeng et al., 2022), 9 – Berse (Hardeng et al., 2024) and this study (marked with a blue circle). (b) Present mean annual precipitation pattern in Norway. Voss is marked by a black circle. (c) Map showing Lake Vangsvatnet (this record) marked with dark blue color. The Vosso River catchment with its outlet at Bolstadøyri is delineated with a white line. The catchment for the Vosso river at the inlet to Lake Vangsvatnet is indicated by the dotted white line.
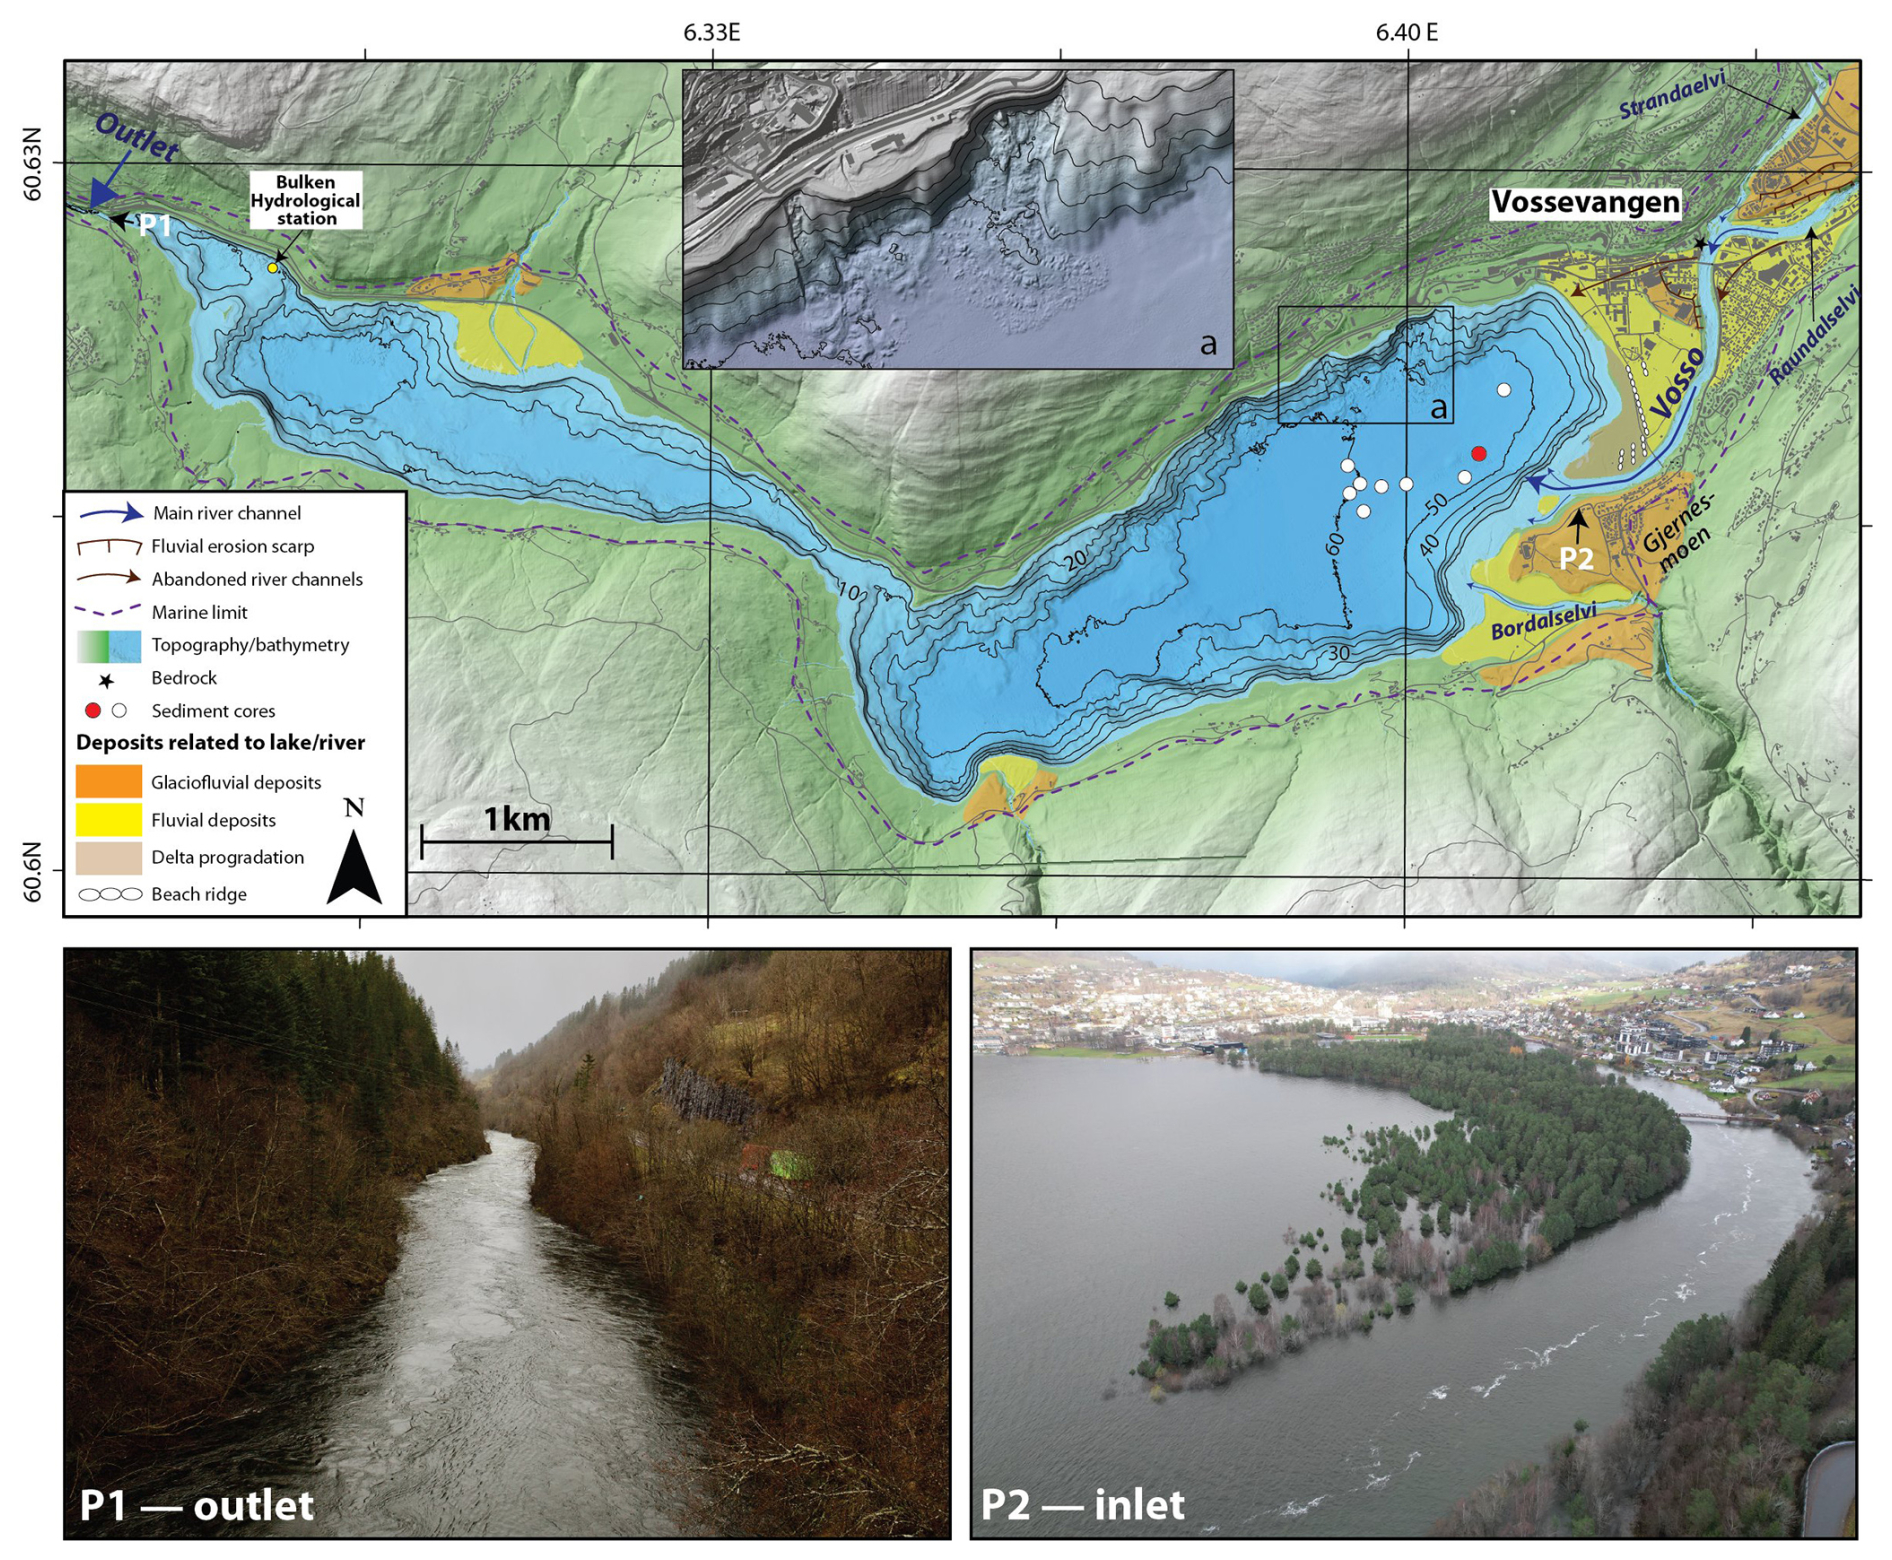
Figure 2Lake Vangsvatnet (7.6 km2, 44 m a.s.l.) has two main basins. Sediment cores for the Hordaflom project were retrieved in the eastern basin close to the main inlet (the Vosso River) (photo P2) and shown as white and red circles in the map. The red circle shows the coring location used in this study. Fluvial and glaciofluvial sediments dominate along the rivers, especially near the inlets. The marine limit at Voss is around 94 m a.s.l. (purple dotted line). The outlet in the west is a narrow gorge (photo P1), obstructing water drainage during flooding. The photos (P1 and P2) show the inlet and the outlet during the November 2024 flooding, reaching a discharge of 580 m3 s−1 at Bulken. Inset panel (a) shows two examples of large landslides along the northern slope, as seen in the bathymetric data.
The Vosso river accounts for 83 % of the total water volume in Vangsvatnet (Holmqvist, 2003). The third major river in the catchment is Bordalselvi (93 km2), with its inlet south of Vosso. In total, Lake Vangsvatnet has a drainage area of 1091 km2. The catchment drains large parts of the geographically varied area between Sognefjorden and Hardangerfjorden, of which 50 % of the catchment lies above 850 m a.s.l. (above the local tree limit), with a maximum altitude of 1602 m a.s.l. It stretches from Vikafjellet in the north, Upsete in the east and the drainage divide towards Hardangerfjorden (Bordalen) in the south (Fig. 1). Vosso continues westwards from Vangsvatnet through an 800 m-long narrow canyon, then widens and continues to the fjord at Bolstadøyri. In total, the river drains 1497 km2 and is among the largest rivers in western Norway, both in terms of discharge and drainage area.
The lithology and geomorphology within the catchment are varied and characterised by a mix of granite, gneiss, phyllite, and mica schist that were formed in the Precambrian and during the Caledonian orogeny (Sigmond, 1998; Kvale and Ingdahl, 1985). The area also has a varied quaternary geology with relatively thick sections of till and glaciofluvial sediments along the main valleys, especially the sandur plain/old deltas at Bømoen, Tvildemoen and Gjernesmoen, and till and glaciofluvial sediments at Borstrondi (e.g. Mæland, 1963; Skreden, 1967; Sindre, 1973). The deglaciation in this region is not well studied; however, the final deglaciation of the area appears to have occurred around 11 100–10 200 cal yr BP (Pre-Boreal) (Mangerud and Skreden, 1972; Mangerud et al., 2019). The marine limit at Voss is not well constrained, but glaciofluvial terraces at an elevation between 104–94 m a.s.l. at the mouth of Bordalen and at 97 m a.s.l. at Bømoen are regarded as the marine limit (Figs. 1 and 2) (Mangerud et al., 2019; Skreden, 1967). The relative sea-level fall after deglaciation (11 000–10 050 cal yr BP) was 5.2 cm yr−1, as reported from a study in Hardangerfjorden, ∼ 41 km south-west of Voss (Romundset et al., 2010).
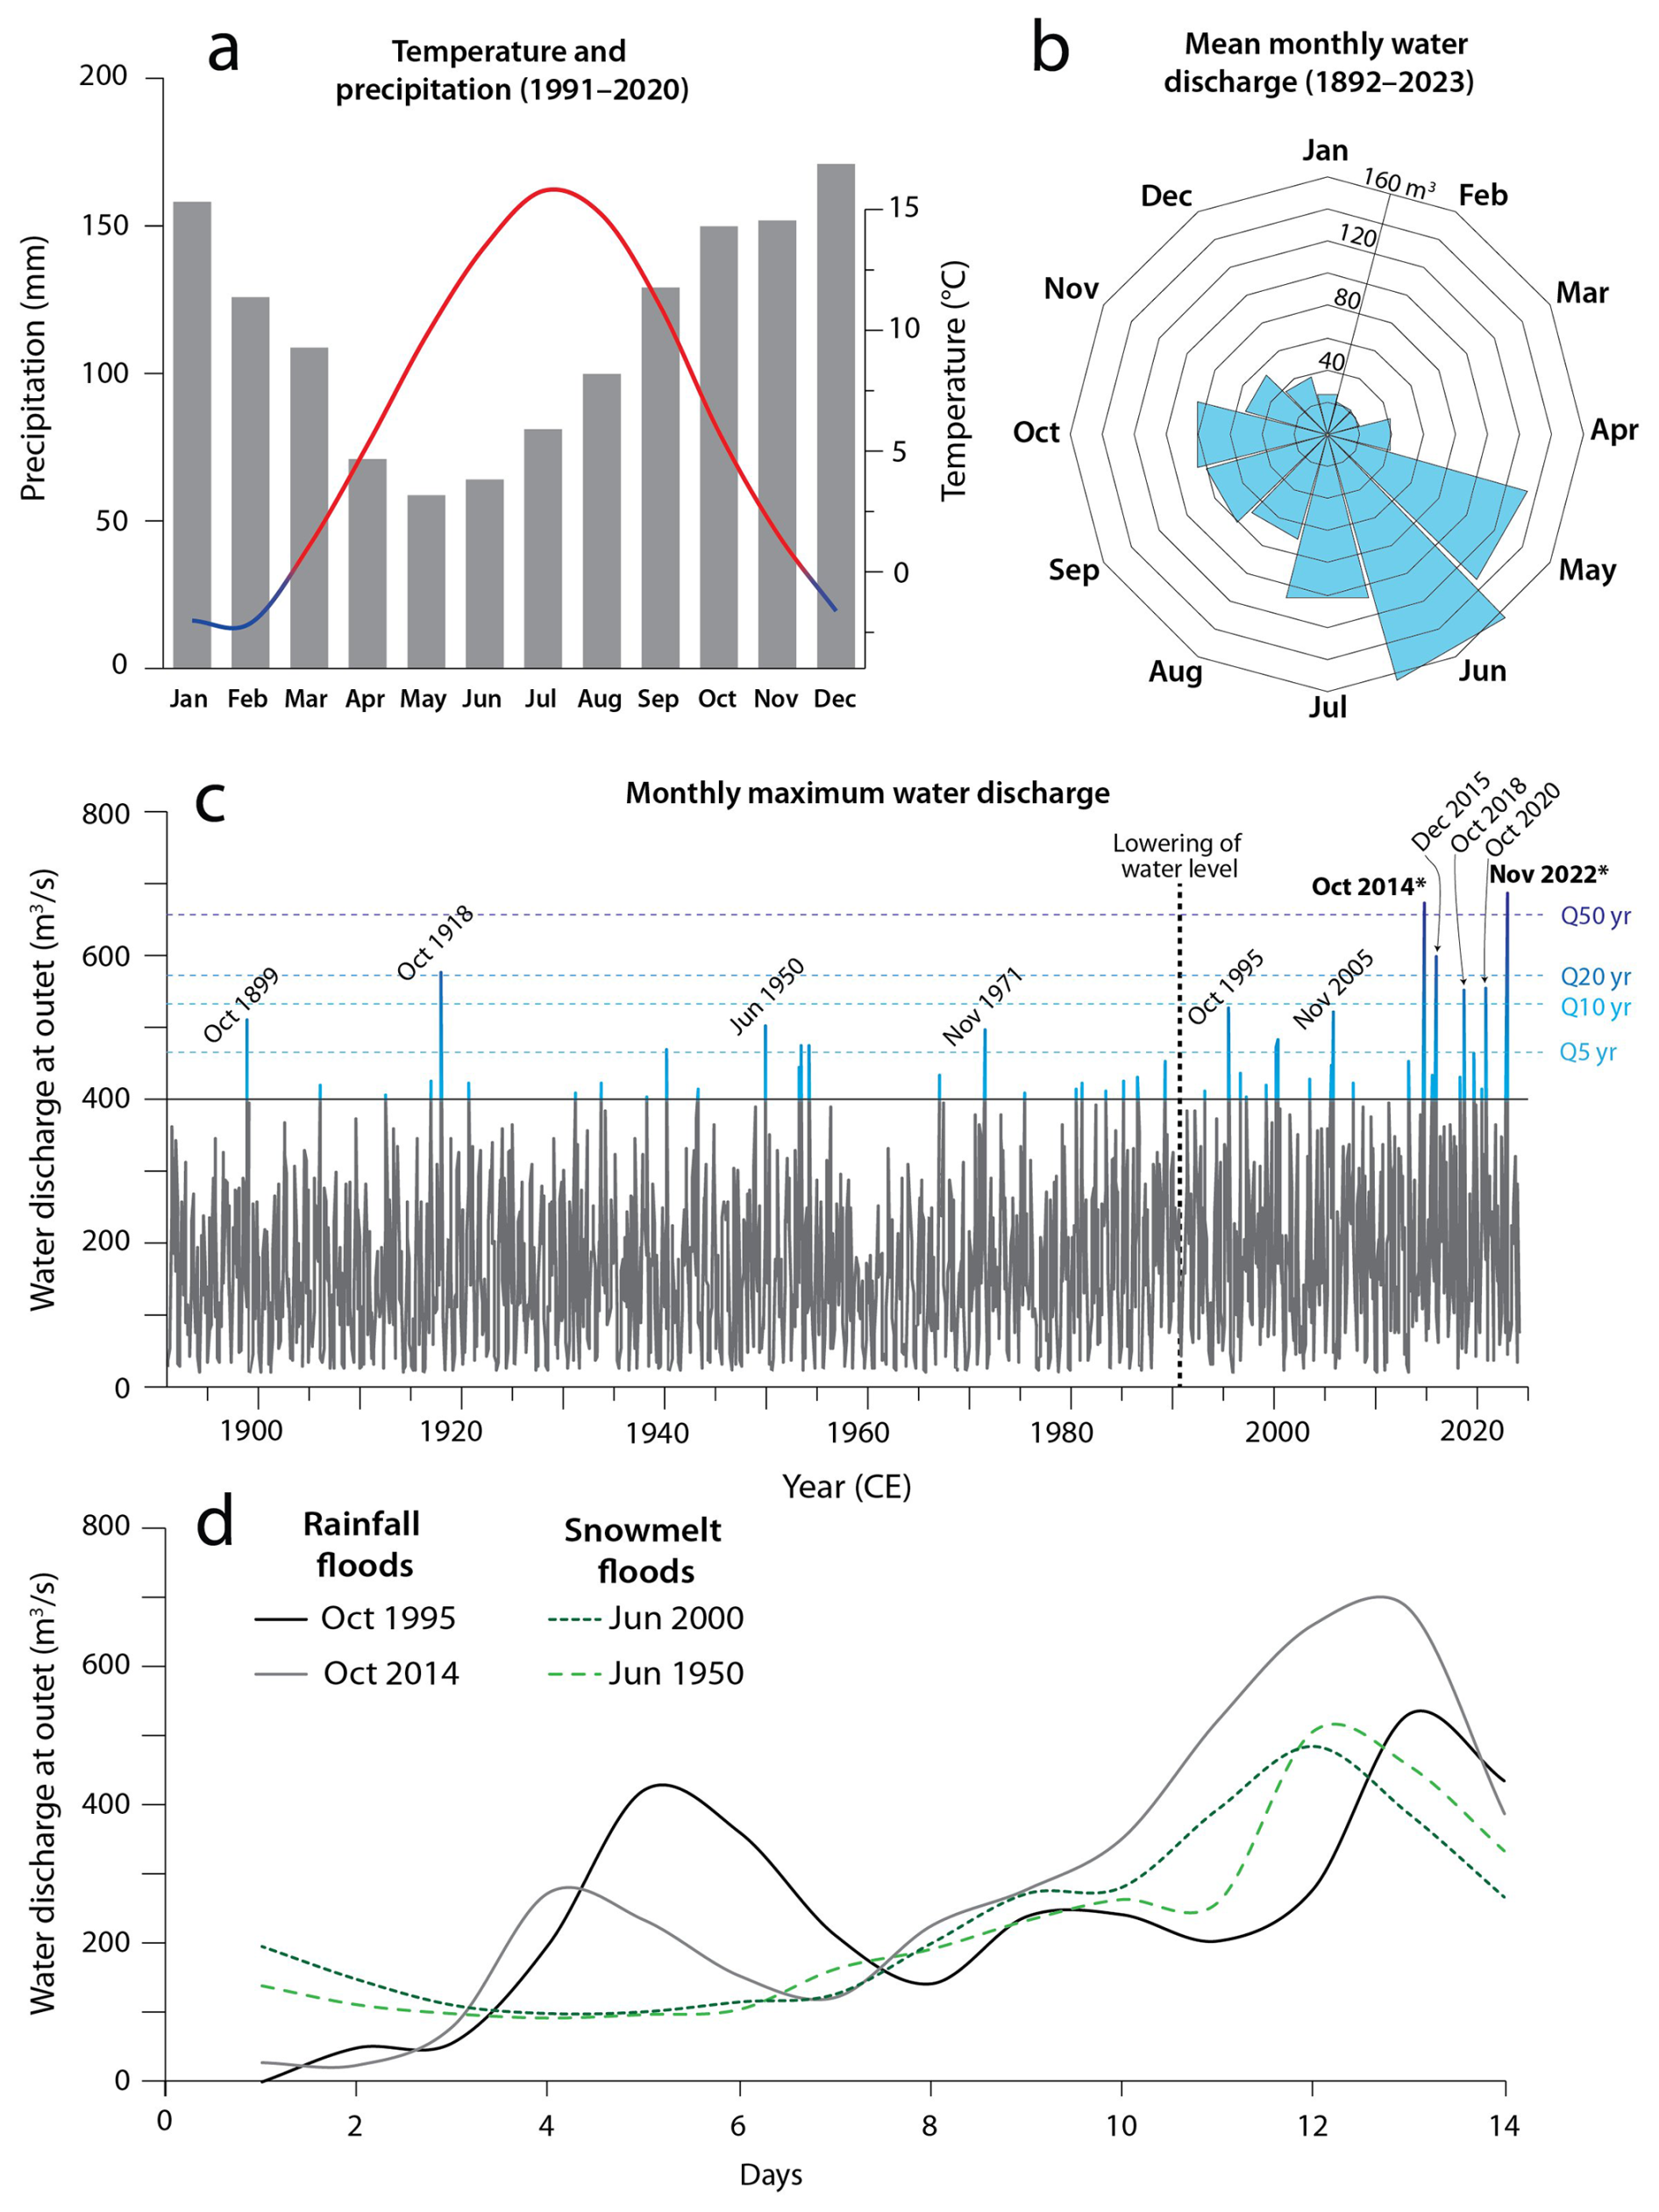
Figure 3(a) Temperature and precipitation at Voss for the 1991–2020 CE climate normal and mean (b) and maximum (c) monthly water discharge at Bulken (1892–2023 CE) (DNMI, 2024; NVE, 2024). The floods in October 2014 and November 2022 (both in bold) have the highest discharge values since the start of the measurements in 1892 CE. (d) 14 d of discharge data before four different floods.
The climate is classified as subarctic to boreal, with relatively cold winters and warm summers (Fig. 3). The average winter temperature (December–February) at Voss (Sta. no. 51590) is −2 °C, with occasional periods of extreme cold and heavy snowfall (1–4 m of snow in the mountains) (DNMI, 2024). The average summer temperature (June–August) is ∼ 15 °C, and the annual mean temperature is 4.9 °C. The precipitation pattern in Voss is bimodal: high monthly precipitation from September to March (100–160 mm), and drier conditions from April to August (50–90 mm). The annual precipitation at Voss for the 1991–2020-normal is 1370 mm.
Observations of the daily discharge and water level at Lilandsosen (outlet of Vangsvatnet) are available from the measuring station at Bulken (station number: 62.5.0) going back to 1892 CE (NVE, 2024). Daily measurements were recorded at 12 PM from 1892–1994 CE, and hourly data were recorded thereafter.
The Vosso river system has a bi-annual flooding regime (Fig. 3). Persistent low-pressure systems can trigger extreme rainfall events, especially during autumn, leading to a rapid increase in water discharge and subsequent flooding. As previously noted, much of the river catchment lies at high altitudes, draining large mountainous areas that typically accumulate a thick snow cover over the winter. In spring, snowmelt from these areas contributes to elevated mean monthly discharge, with floods during this period generally characterised by a gradual increase in discharge over time (Fig. 3d). The steep relief of this mountainous catchment also enables a relatively rapid response to torrential rain, especially when soils are already saturated.
A significant factor contributing to the flood risk at Voss is the narrow outlet of Vangsvatnet to the west. This narrow outlet creates a bottleneck, causing rapidly rising water levels during periods of high discharge. Currently, a 50-year flood typically increases the lake level by ∼ 7 m, inundating large parts of the delta and affecting buildings near the waterfront (Holmqvist, 2015). Living near the Vosso river and Vangsvatnet has historically posed a challenge, with major flood events repeatedly causing extensive damage to settlements (Kindem, 1933).
2.1 Historical floods
The Vosso river has a long historical flood archive documented in Roald (2013). However, only a few historical floods are dated to specific months. The earliest historical flood dates to May 1604 CE (Berg, 1977), marked on the NW pillar of the church (Vangskyrkja), and is estimated to have had a discharge of 900 m3 s−1 and a water level > 11 m above the normal lake level (Holmqvist, 2015). The first officially recorded flood occurred in 1719 CE (July), when it rose to the level of the church choir, allowing boats to reach the altar (Kindem, 1933). Several other large floods followed, specifically in 1743 (December), 1745, and 1790 CE. Notably, the 1743 flood, known as “Storeflaumen” (English: “The Great Flood”), stands out as the most significant documented historical flood in western Norway. During this event, water levels reached the choir in the church, with an estimated discharge of 700 m3 s−1, similar to the occurrences in 1719 and 1790 CE (Holmqvist, 2015). The conditions leading to Storeflaumen were optimal for a significant flood. The unusually cold autumn leading up to this December flood set the stage, with frozen ground in the mountains reducing water infiltration. Additionally, the November precipitation, mainly snow, transitioned to mild, wet southwestern weather, causing extensive snowmelt. The frozen ground contributed to a substantial flood, which was accompanied by numerous landslides.
In the first half of the 1800s, a total of nine large floods were recorded at Voss, prompting the decision to lower the sill and widen the outlet of Vangsvatnet between 1865 and 1866 CE. Holmqvist (2015) adjusted pre-1865 water flow calculations based on a 1.9 m (6 ft) higher water level in Vangsvatnet, as stated by the Canal Director. This adjustment was attributed to the likelihood that the flood in 1864 CE had been lowered by 1.2–1.8 m due to the sill modification (Kanalkontoret, 1888). However, high water levels persisted after the modifications, especially in 1871, 1873, 1874, 1884, and 1888 CE (Kindem, 1933).
Since 1892 CE, the hydrological station at Bulken (Station 62.5) has provided a detailed overview of the Vosso river basin (Fig. 3). The most significant flood since measurements started occurred in 2014 CE (peak of 800 m3 s−1). Only three other floods have been close to, or exceeded, the 50-year flood level at the outlet (660 m3 s−1 or 5.83 m increased lake level), which occurred in 1918 (598 m3 s−1), 2015 (603 m3 s−1), and 2022 CE (770 m3 s−1). Although modelling suggests that the floods in 1906, 1918, 1938, and 1971 CE had larger peak discharges at the inlet than the 2014 CE flood, their shorter peak durations resulted in a lower impact at the outlet due to the lake's natural self-regulation (Holmqvist, 2015). The floods are not a result of diurnal precipitation, but instead accumulated precipitation over a period. In both 2014 and 2022 CE, the accumulated precipitation over three days ranged from 200 to 300 mm in the catchment.
3.1 Lake surveying, chirp and coring
Following the flood in 2014 CE, the Norwegian Water Resources and Energy Directorate (NVE) carried out a comprehensive mapping campaign of the Vangsvatnet catchment. As a result, Lake Vangsvatnet and the Vosso river are mapped using a combination of high-resolution multibeam and LiDAR data, accessible through http://hoydedata.no (last access: 1 December 2025) (The Norwegian Mapping Authority).
Sediment distribution in Lake Vangsvatnet was mapped along several transects during different field campaigns using EdgeTech 3100 sub-bottom CHIRP technology at 4–16 kHz, mounted 1.5 m below the lake surface in front of a Zodiac rubber boat. The CHIRP data were viewed using the free software SeiSee.
Several cores have been retrieved from Lake Vangsvatnet using various coring techniques during multiple coring campaigns (Fig. 2). This project focuses on cores VATG316 and VV-17 (red circle in Fig. 2), extracted from Vangsvatnet in 2016 and 2017 CE using a raft and UWiTEC gravity- and re-entry coring system, respectively.
3.2 Laboratory analysis
The cores were first split and cleaned before being analysed for non-destructive measurements at EARTHLAB, University of Bergen. After this, the cores were wrapped in plastic and archived in a storage room (4 °C). The cores were then visually logged identifying lithofacies and sediment structure/texture aiming to identify and categorise event layers.
X-Ray Fluorescence (XRF) measurements were made at 500 µm resolution using an ITRAX XRF scanner from Cox Analytics, mounted with a molybdenum tube. The VV-17 was scanned at 29 kV and 28 mA with an exposure time of 10 s in 2018, while VATG-316 was scanned at 33 kV and 50 mA with an exposure time of 10 s in 2025. Magnetic susceptibility (MS) was measured using a GEOTEK Multi-Sensor Core logger (MSCL-S) equipped with a Bartington MS2E point sensor at a 2 mm resolution. To account for down-core fluctuations in instrumental offsets, water content and organic material, all XRF data were normalised in R using a centred log-ratio transformation with the code and formula: .
A ProCon Alpha Computed Tomography (CT) scanner was used to CT-scan the sediment cores (half-cores). The cores were scanned using 125 kV tube voltage, 825 µA current and an exposure time of 267 ms. A 0.5 mm Cu-filter was applied to prevent beam-hardening effects within the sediment core. The imagery was reconstructed using Volex CToffice with 4-binning, gaining a voxel size of ∼ 200 µm. To determine the volume percentages of minerogenic and organic content, a protocol was followed on all core sections at 2 mm resolution. The protocol involves segmenting both organic and minerogenic layers based on their greyscale values, before measuring the downcore volume percentage occupied by each layer type. To avoid partial volume artefacts at the air–sediment interface, which can produce greyscale values similar to those of organic material, the air was also segmented and then dilated to include the transition zone. This mask was subsequently subtracted from the organic data prior to calculating volume percentages. Visible artefacts, such as big twigs which are not part of a layer, were manually removed from the data.
After the non-destructive analyses, 167 samples comprising 38 layers with contiguous transitional and background samples were extracted for grain size analysis using a Malvern Mastersizer 3000 with a Hydro LV dispersion unit. Sample depths were selected to target event layers specifically, using visual logs and XRF data to identify areas of interest. Samples were prepared for Mastersizer analysis by undergoing a one-hour Loss-On-Ignition (LOI) procedure at 550 °C (Dean, 1974), which also provided data on water content (WC) and organic matter. However, dry-bulk density could not be assessed due to the irregular volume of the layers. After the LOI procedure, burnt minerogenic grains were delicately disaggregated and treated with Sodium polyphosphate before being suspended in the hydro-unit; subsequently, samples were exposed to 60 s of ultrasound and analysed during continuous stirring at 2500 RPM (Hardeng et al., 2022). The refractive index was 1.543, with an absorption index of 0.01, and the sample size was adjusted to achieve an obscuration of 10 %–15 %. Five analytical iterations were run before a mean average was computed. Grain-size statistics (median, mean, sorting, skewness) were calculated using GRADISTAT (Blott and Pye, 2001) based on the Method of Moments in geometric units.
3.3 Chronostratigraphy
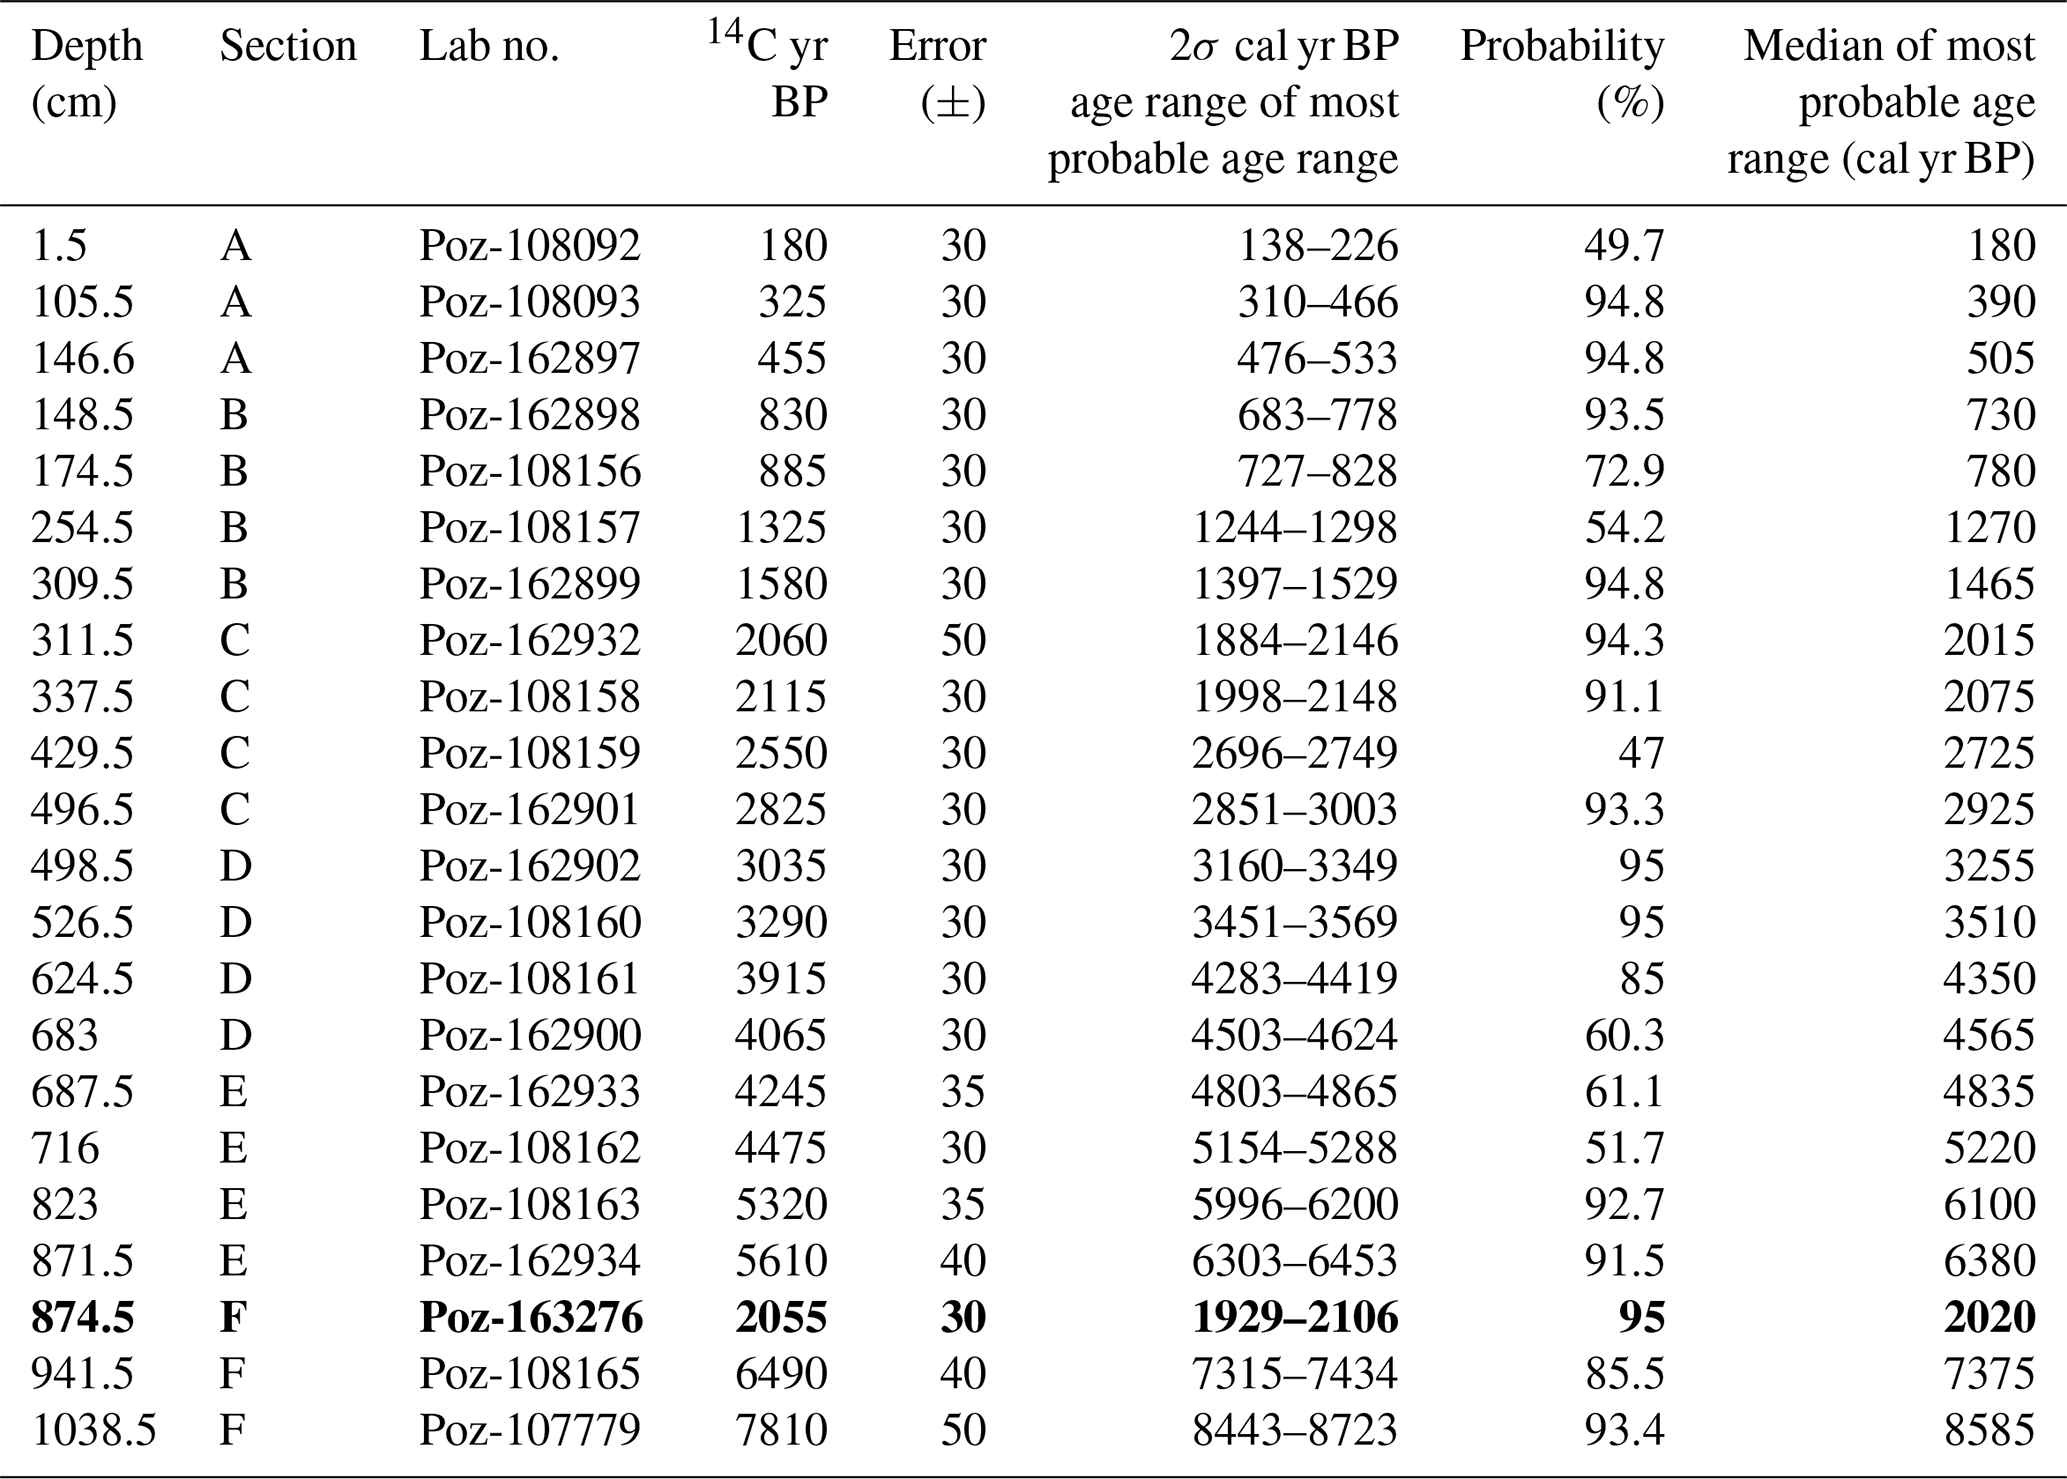
To develop age control for VV-17, 22 samples of terrestrial plant remain (seeds, leaves and needles) were extracted from 1 cm intervals (Table 1). The sampling was focused on the upper and lower parts of each ∼ 2 m section to identify potential hiatuses caused by the re-entry coring technique. The terrestrial plant remains were studied under a microscope, carefully extracted, and dried overnight at 50 °C. The samples were placed in sterilised vials and sent to the Poznan Radiocarbon Laboratory for Accelerator Mass Spectrometer (AMS) radiocarbon dating (14C-dating).
Table 1Radiocarbon ages from core VV-17. All samples are terrestrial plant remains. The sample in bold text has been rejected from the analysis.
The upper 39 cm of core VATG-316 was subsampled at intervals of 0.5 cm and dated with short-lived radionuclide dating (137Cs and 210Pb) (n = 43) to develop accurate age estimates of the historical part of the core. The samples were sent to the Department of Nuclear Physical Chemistry at the Henryk Niewodniczański Institute of Nuclear Physics in Kraków, Poland. The age-depth of the short-lived radionuclide was calculated using the constant rate of supply (CRS) model for 210 Pb in the serac R-package (Bruel and Sabatier, 2020).
The age-depth relationship was modelled with 95 % confidence intervals for the composite record, using Bayesian statistical approaches in the Bacon R-package (Blaauw and Christen, 2011) with the IntCal20 calibration curve for calibration to calendar years before present.
4.1 Bathymetry and geomorphology
Vangsvatnet is a glacially carved and over-deepened lake with two sub-basins. The easternmost (central) basin is the deepest, with a maximum depth of 61 m (Fig. 2). The central basin has low-relief topography and a relatively flat bottom. CHIRP measurements of this basin indicate low signal penetration, likely due to its high gas content. Several large collapses/landslides are observed along the shore of the lake, mainly close to the main road (E16) on the northern side (Fig. 2). Coring was conducted approximately 300 m northwest of the Vosso river delta front on a flat area to capture changes in sediment flux during floods from the main river. The coring location is sheltered from the inlet of Bordalselvi to the south, reducing the risk of sediments from Vosso being mixed with sediments from Bordalselva. The Vosso catchment is relatively large and complex, and several processes are active along the river and the lake. The Strandaelvi river drains the area around Vikafjellet to the north. Strandaelvi passes through a chain of lakes: Lønavatnet (76 m a.s.l.), Melsvatnet (75.7 m a.s.l.), and Lundarvatnet (71.5 m a.s.l.) on its way to Lake Vangsvatnet. In contrast, the Raundalselvi river has relatively few and small lakes in its catchment, with limited capacity for flood mitigation. Avalanching and erosion in the upper and steepest parts of both catchments produce sediments which are remobilised by the rivers. A mapping campaign after the 50-year flooding event in 2014 CE revealed fresh fluvial silty to sandy material deposited on vegetation between the coalescing rivers Strandaelvi and Raundalselvi and Lake Vangsvatnet, indicating high sediment transport in that area (Fjellheim, 2018). Small cirque glaciers (< 0.25 km2) along the highest peaks in Raundalen produce glacial flour that can be transported downstream. Regional glacier cover was more extensive during the Little Ice Age (Vasskog et al., 2012), which likely increased the supply of glacier flour to the catchment. Farmland covers most of the valley bottom along Strandaelvi on thick till and glaciofluvial sediments. In contrast, Raundalen is mostly covered by dense spruce and pine forest, and a thin till cover.
4.2 Lithostratigraphy
VATG316 measures 85 cm and records the undisturbed sediment-water interface in the lake. In contrast, VV-17 measures 10.47 m and was retrieved in 2 m sections (n = 6) from the same site and labelled alphabetically from uppermost to deepest sediment section (A, B1, B2, C1, C2, D1, D2, E1, E2, F1 and F2) (Fig. 4). The correlation between the two cores is based on trends in the MS data (Fig. 4a). Based on this correlation, the overlap begins at 65 cm, which is also supported by the sediments' age (see Sect. 4.4). A sandy bedding at 24 cm depth in VV-17, which is not present in VATG316, was likely too dense to penetrate with the lighter coring equipment used for VATG-316. As a composite, the record is 11.12 m long. Results from the sediment analyses and images of the cores are compiled in Fig. 5.
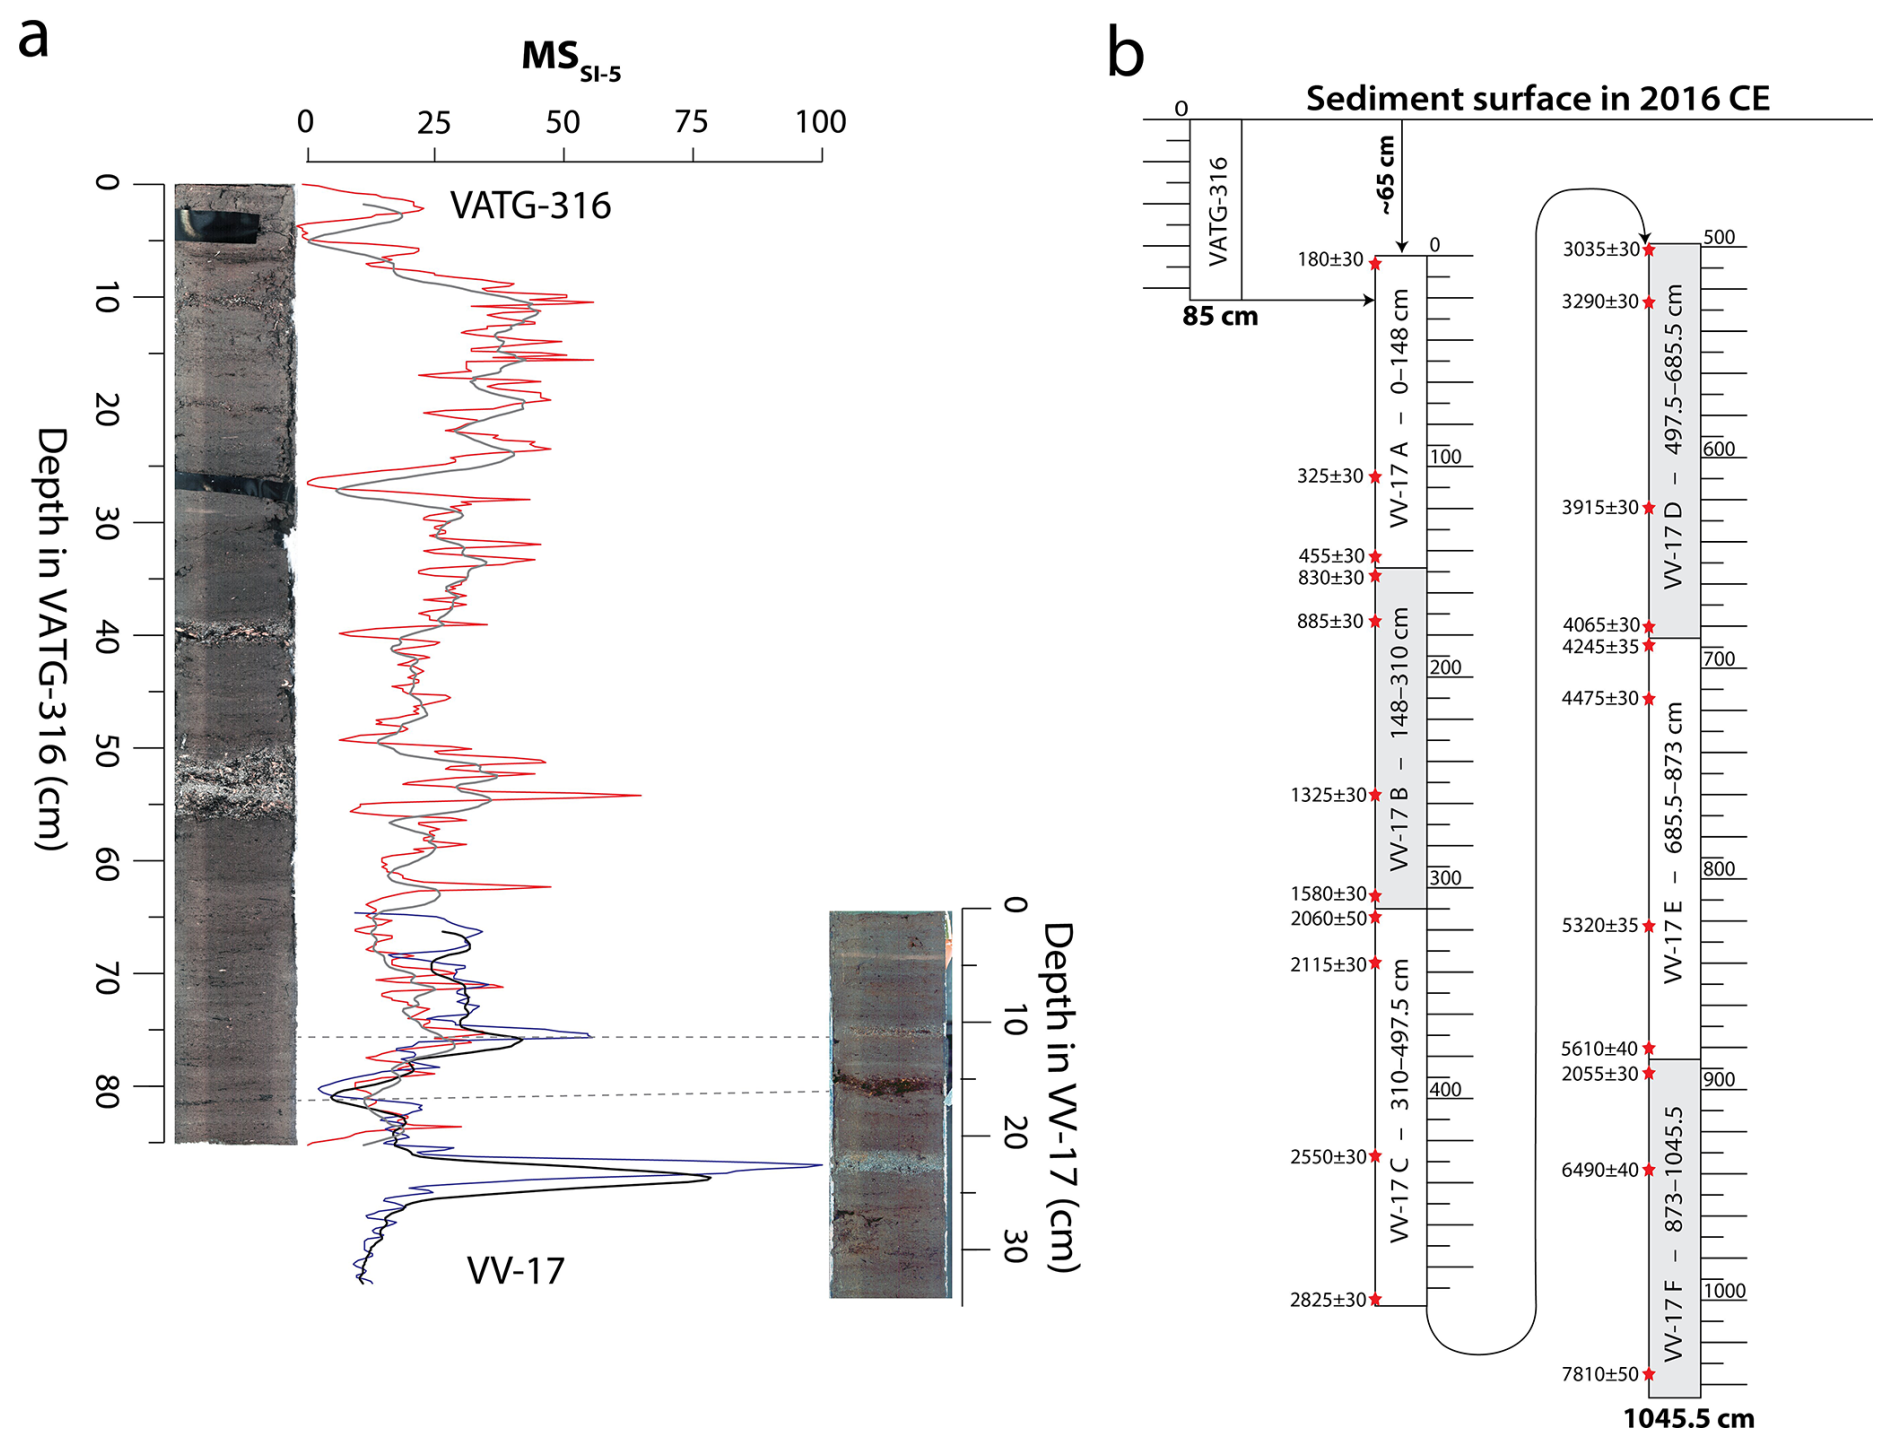
Figure 4(a) Magnetic susceptibility measurements of the gravity core (VATG-316: 85 cm) are plotted to match wiggles with VV-17. The correlation indicates that ∼ 65 cm was lost in the upper part of VV-17 during coring. (b) The composite record from Lake Vangsvatnet with C14-dates. As a composite, the record is 1116.1 cm long.
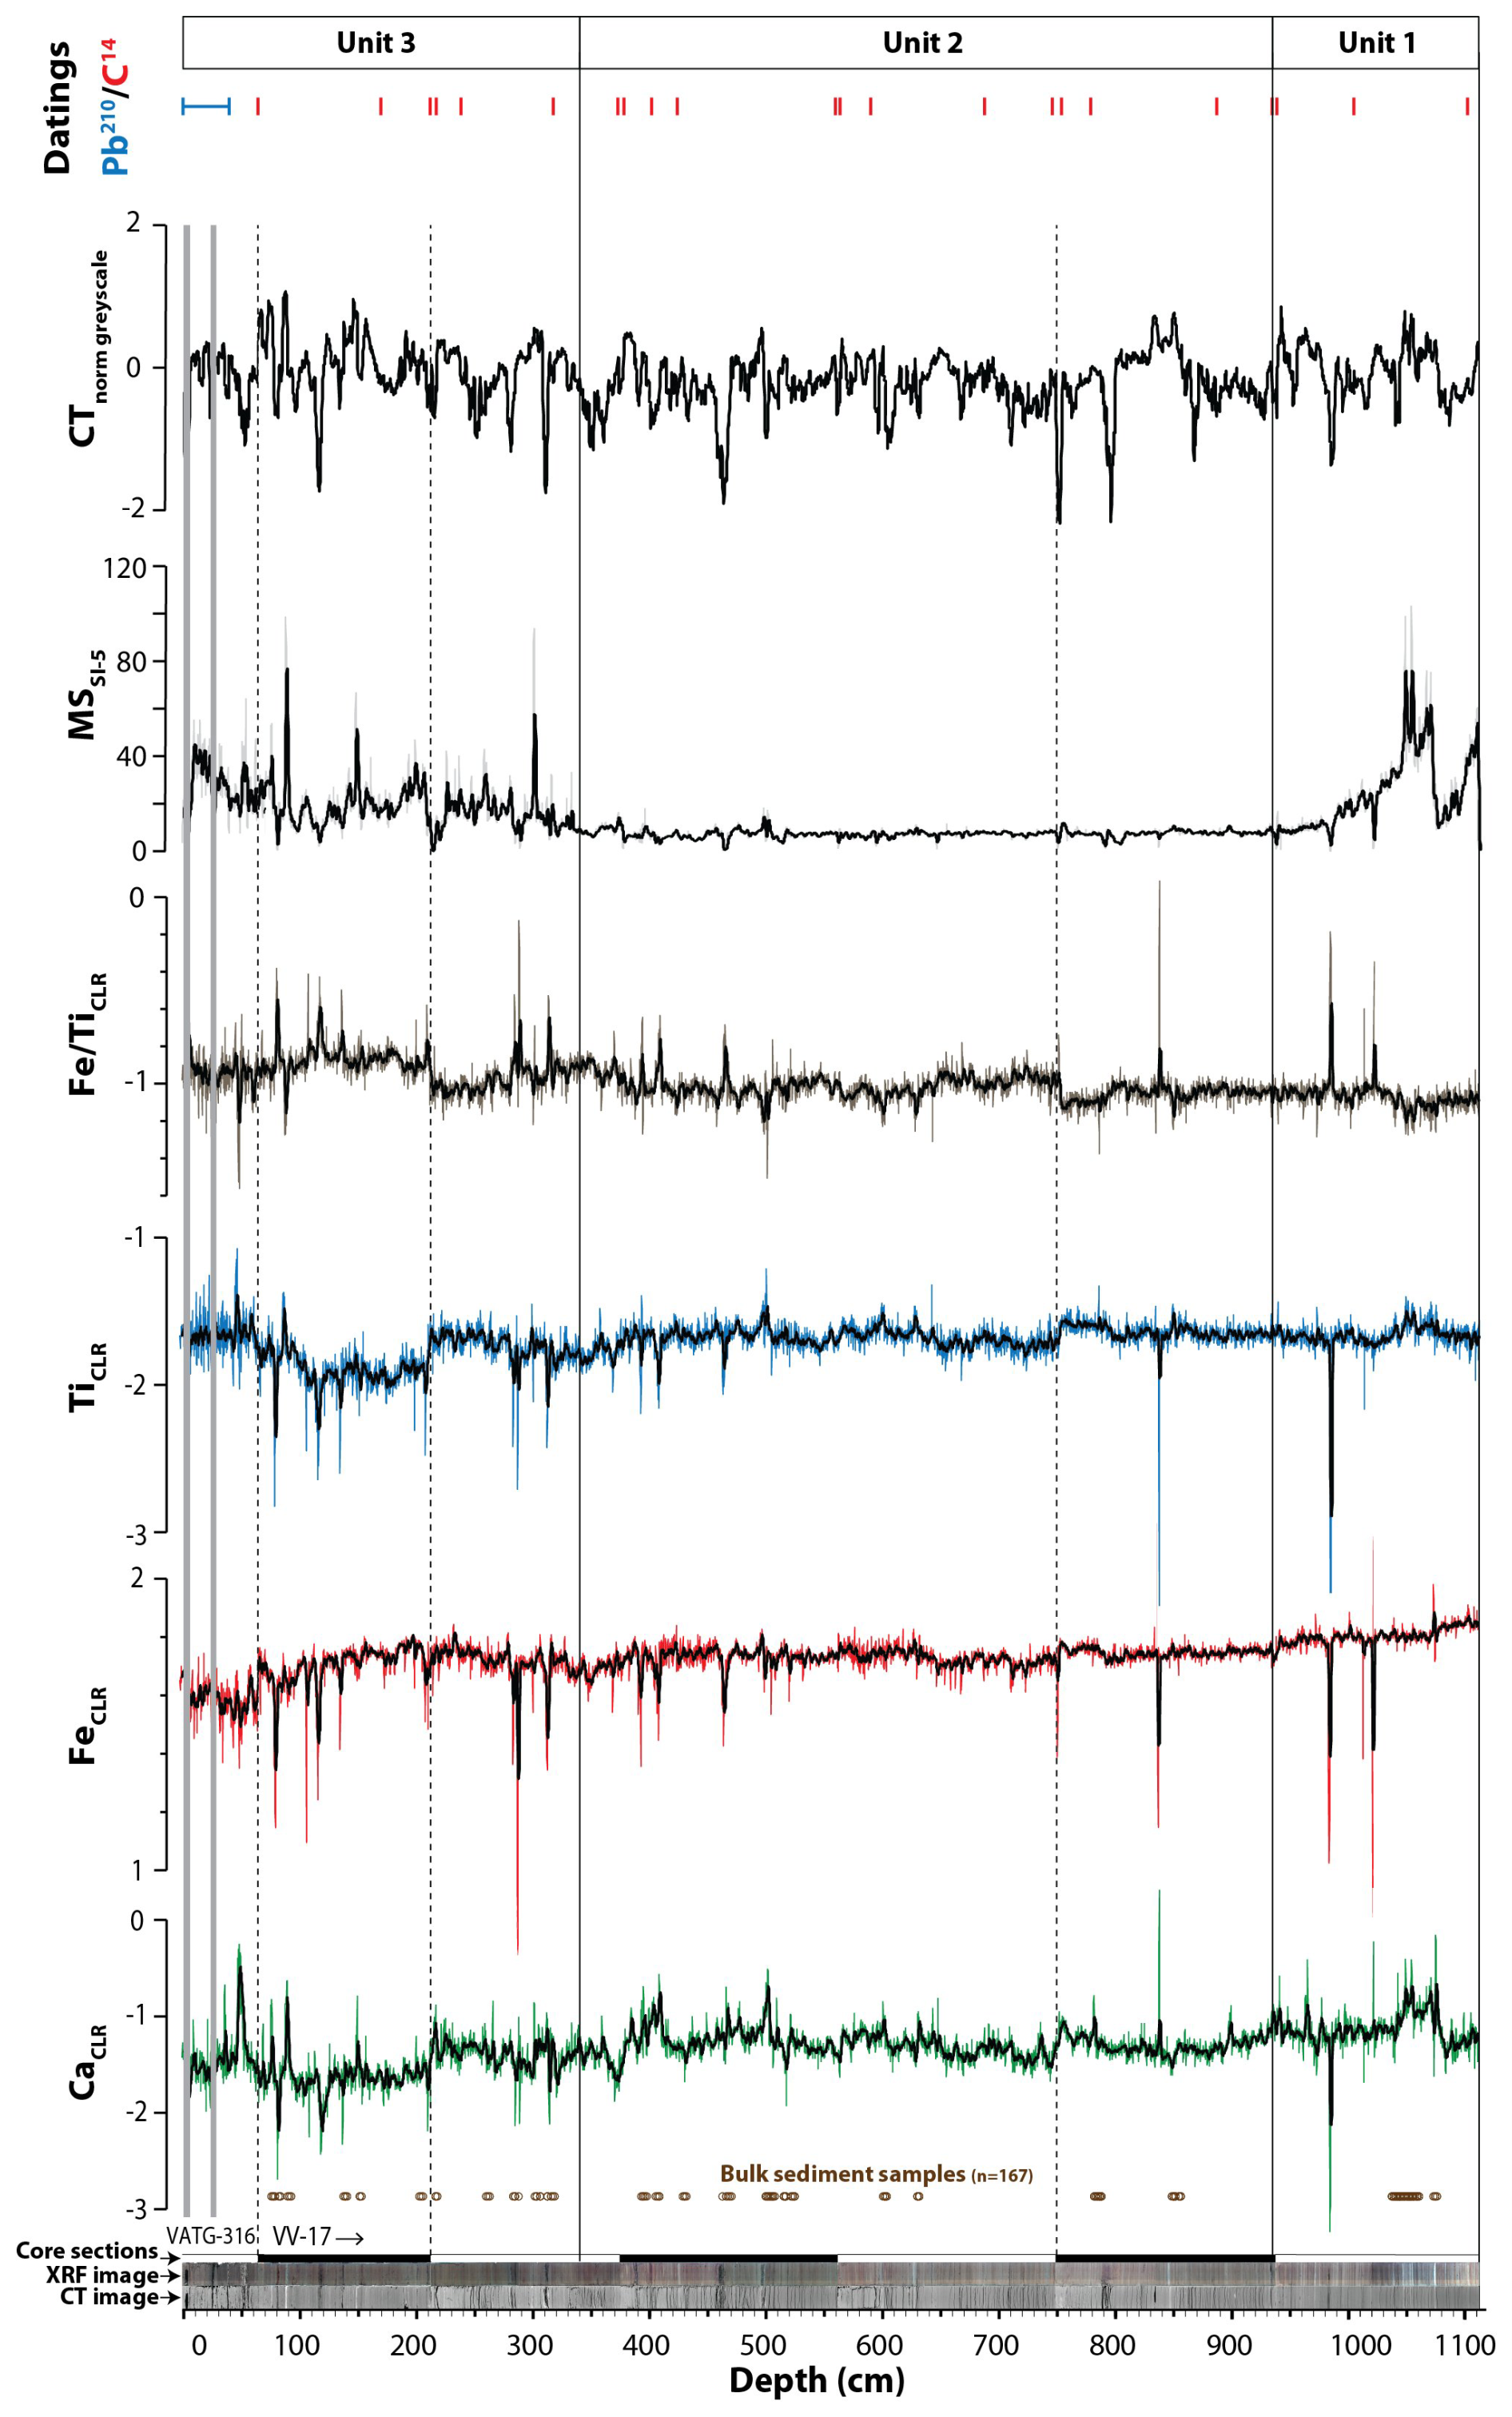
Figure 5Results and overview of selected core analyses from Vangsvatnet. CT- and XRF image, log-transformed XRF data (Ca, Fe, Ti, Fe Ti), Magnetic susceptibility (MS) measurements, and normalised CT-grey scale values. The subdivisions (Units 1–3) are based on the variations in MS. Brown open circles indicate where bulk sediments (n = 167) were retrieved. Red lines indicate radiocarbon samples (n = 22). The upper part of VATG-316 was sampled for Pb210 dating (blue line) (n = 44). Dotted lines indicate areas of rapid shifts in XRF-values, while the grey shaded areas in the uppermost section are missing data related to cracks/air in the core.
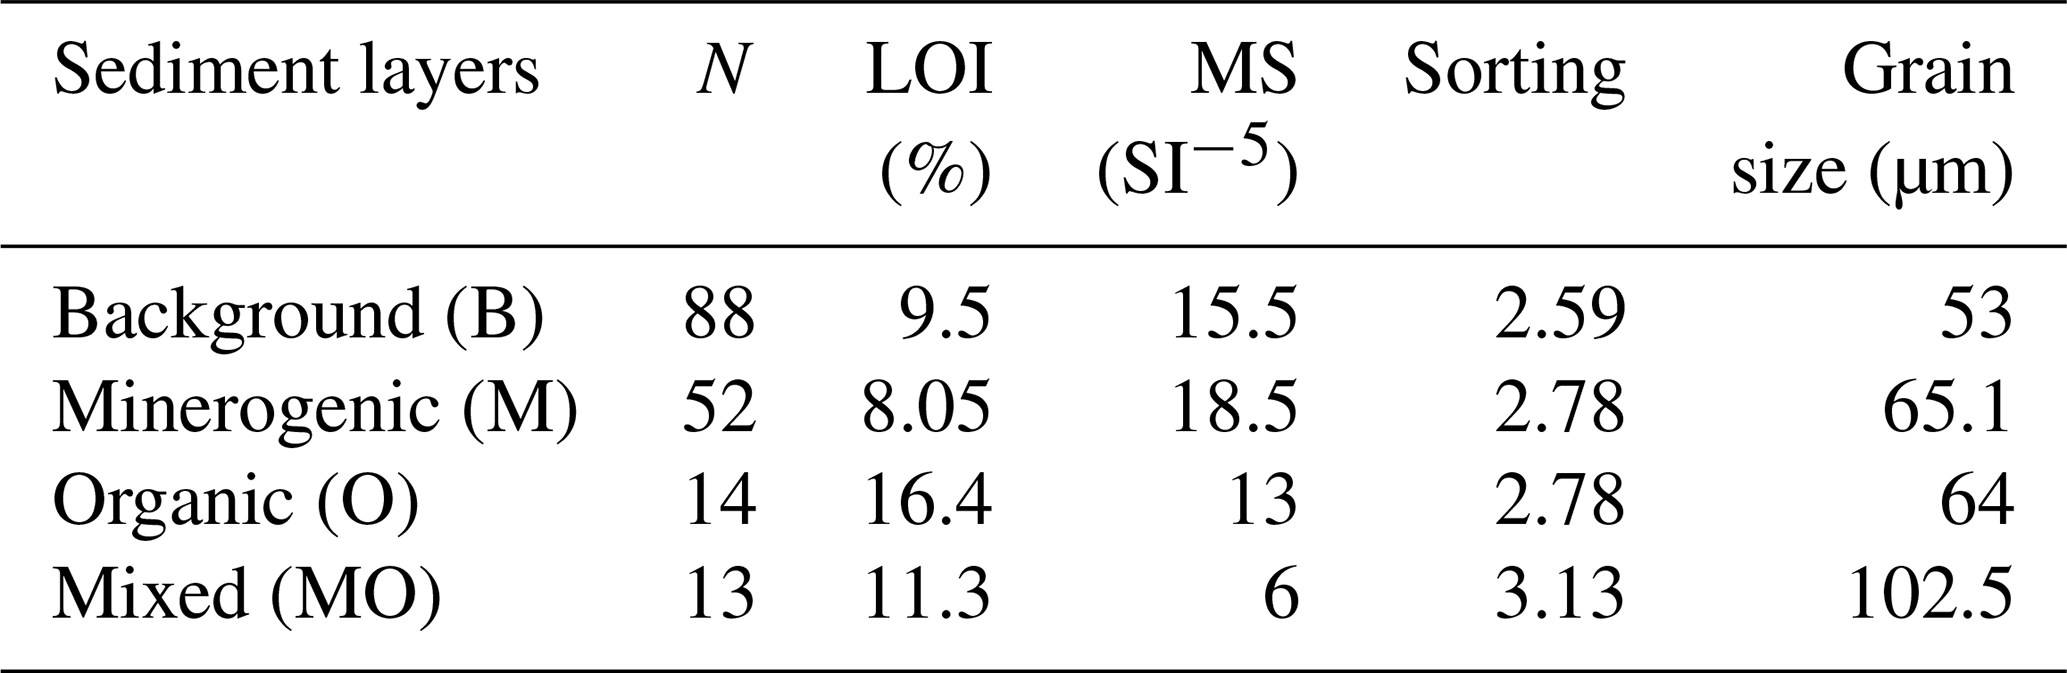
Visual inspection of the composite core shows four different sediment intervals/layers. The core is dominated by homogeneous dark-brown organic-rich silty sediments (B). Interspersed in the B-sediments are distinct grey coarse minerogenic (silty sand) layers (M), dark brown organic-rich layers with large macrofossil (O), and layers composed of a mix of plant detritus and coarse minerogenic material (MO). From 85 cm to the top of the composite core, some layers (M, O, and MO) contain visible sawdust. Table 2 summarises mean values from the bulk sediment samples extracted from the composite core.
Table 2Summary of the sediment analyses of the different sediment interval/layers in the composite core. The numbers are mean values for the respective layers.
The composite core was divided into three units (Units 1, 2, and 3) based on general trends in the MS data (Fig. 5). Unit 1 (1112–930 cm) and Unit 3 (336–0 cm) show high variability in MS data, with a mean value of 23 and 20 SI−5, respectively, while Unit 2 (930–336 cm) has generally low variability with a mean value of 7 SI−5 (Fig. 5).
The geochemical elements Ca, Ti, Fe, and the Fe Ti ratio have been used in the interpretation, as these high-energy peaks are stable across both scanning parameter sets in the two cores. The clr-transformed XRF data show high variability throughout the record, where troughs and peak values coincide with the layers (M, O, and MO) observed during visual inspection (Fig. 5), but no sustained trends. There are two prominent shifts in the XRF data (dotted lines in Fig. 5), corresponding to the intersection between two of the core sections in VV-17 (214 and 752 cm). The mismatch between VATG-316 and VV-17 is related to different settings (kV and mA) during core scanning. The other mismatches likely represent minor hiatuses related to the core splitting during fieldwork. To account for possible hiatuses, radiocarbon samples were picked from lower and upper levels of all core sections (see Sect. 4.4 for more details).
Generally, M- and MO-layers appear as peaks in Ca and Ti and a drop in Fe Ti values, while the O-layers are recorded as a drop in Ca and Fe and a spike in Fe Ti. The minerogenic layers (M and MO) are generally denser and have lower water content than the porous O-layers. The B-sediments show no distinct variations in the XRF data, indicating a rather stable sedimentation regime.
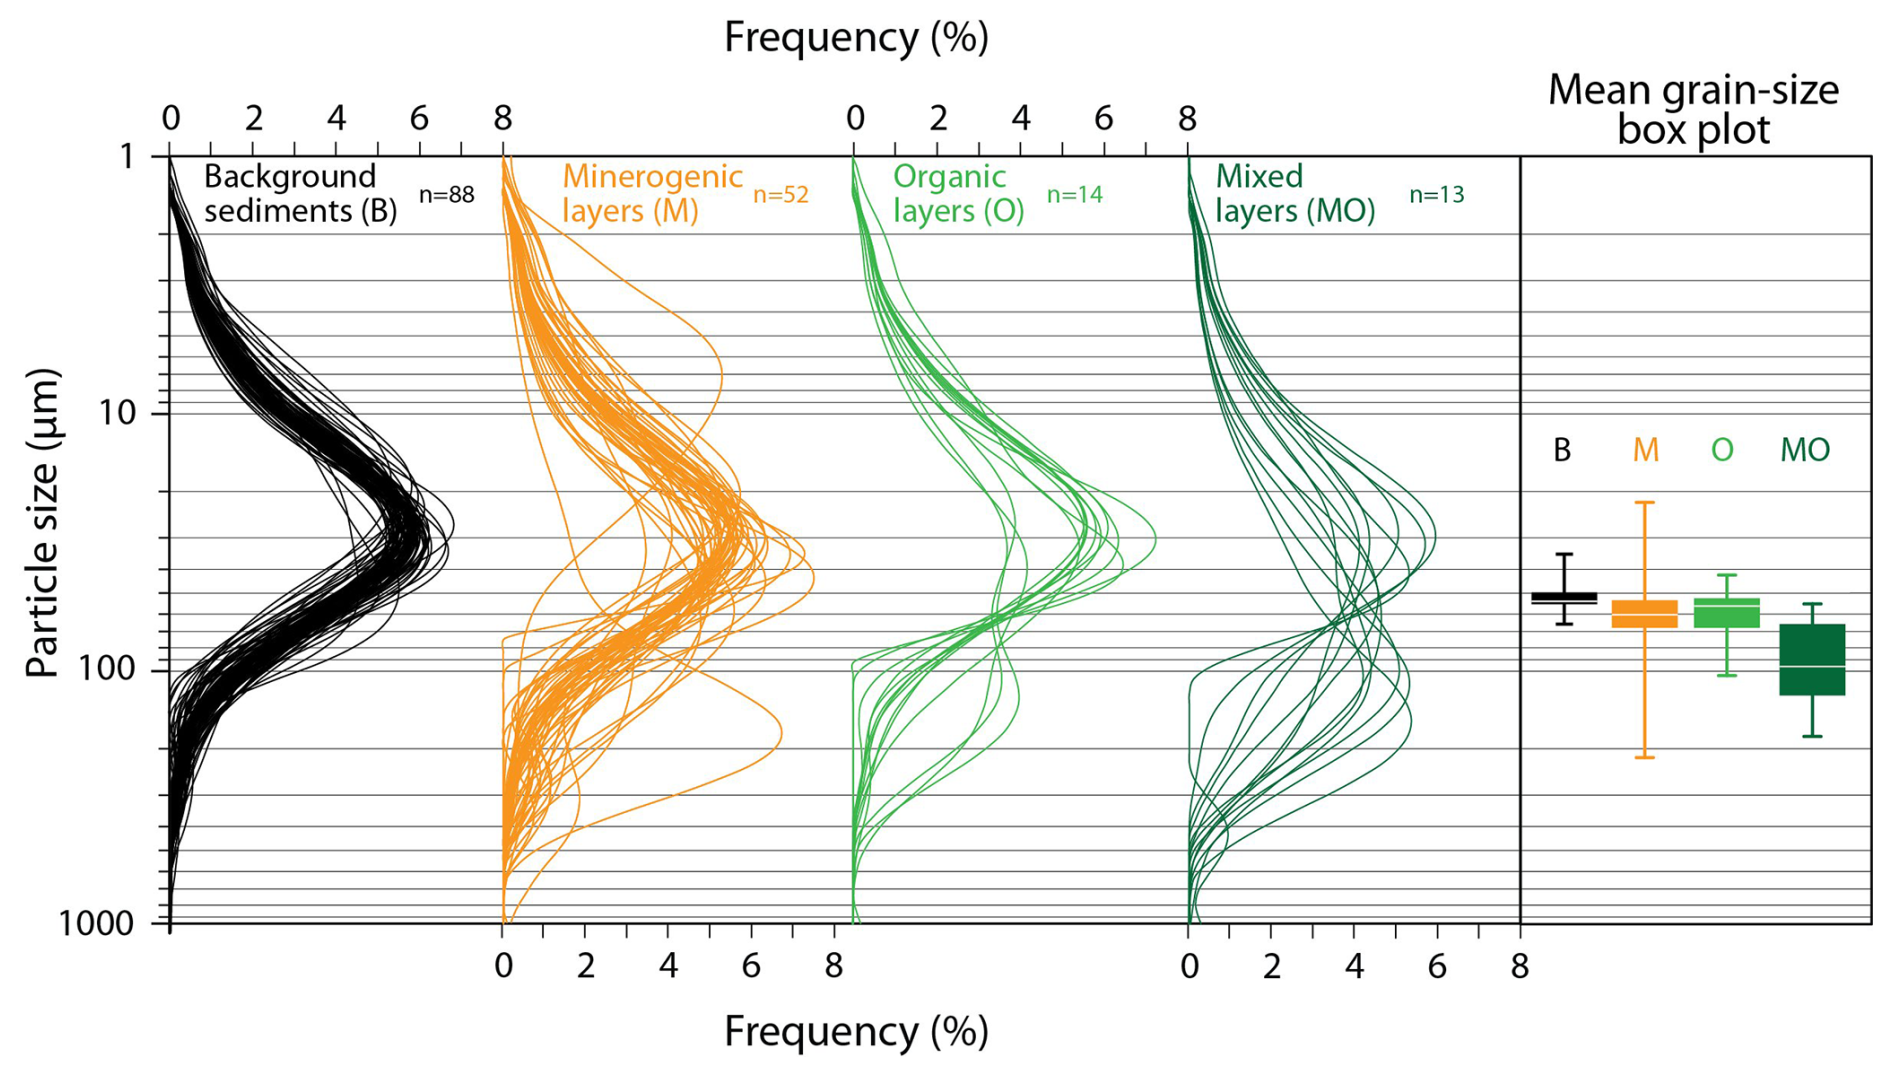
Figure 6Grain-size distribution and mean grain-size box plot of the different sediment layers (B-, M-, O- and MO) from the composite core. Most of the samples are poorly sorted with unimodal distribution. A few samples in M- (n = 3) and MO-layers (n = 1) are poorly sorted bimodal.
The grain-size variations show small differences between the layers (Fig. 6). Most samples display unimodal grain-size distributions. A small number of samples (three M-layers and one MO-layer) show minor bimodality and are visible in the distribution plots (Fig. 6). B-sediments have the smallest grain size (median of 54 µm) with the lowest variance, resulting in a relatively well-sorted grain size distribution (mean sorting = 2.59). M-layers have the largest grain size variance; however, most samples are 55–68 µm (0.25–0.75 percentile), with a median of 60 µm. O-layers have a lower variance but similar median values as the M-layers. The MO-layers have the coarsest median grain size (90 µm) and the poorest sorting (mean = 3.13), indicating high-energy events.
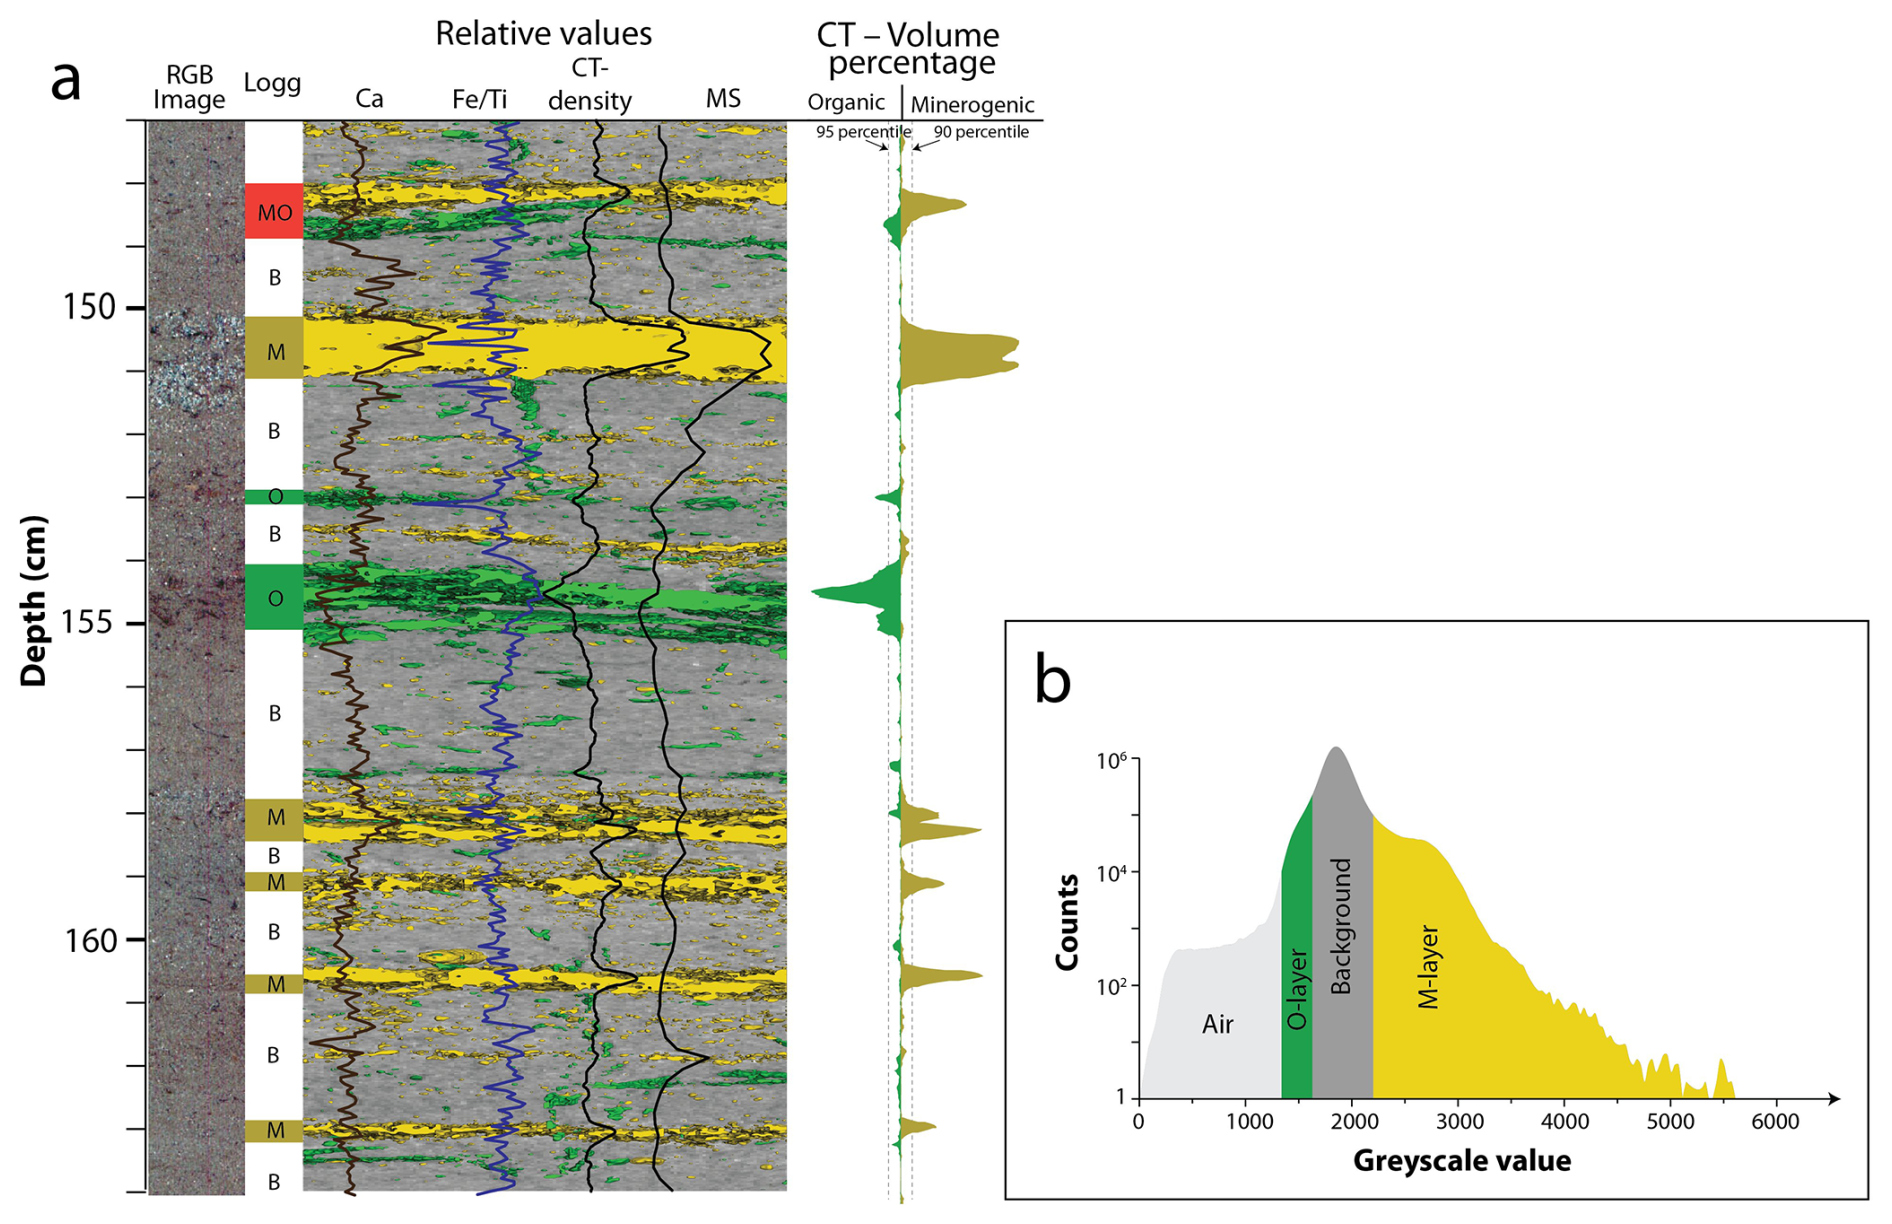
Figure 7(a) RGB- and CT-image with relative values of XRF-parameters (Ca and Fe Ti), CT-density and MS. A threshold analysis has been performed on the CT data, identifying the volume percentages of minerogenic (yellow) and organic (green) content related to the sediment layers in the image (B, M-, O- and MO-layers). (b) Histogram of CT-data showing the thresholding of the layers in panel (a).
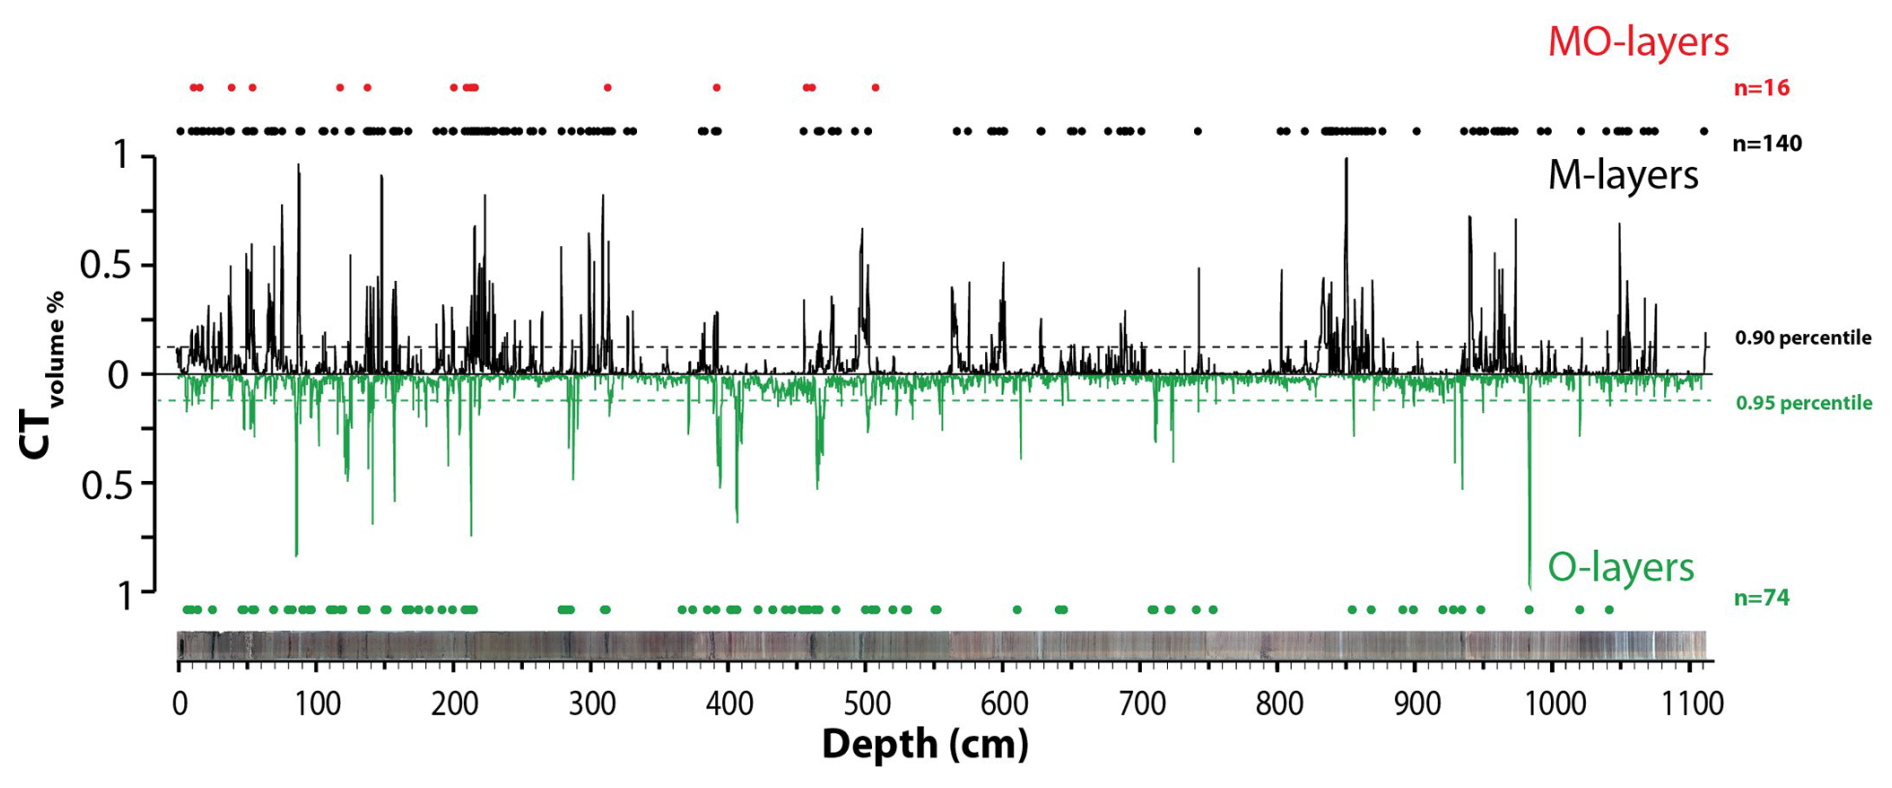
Figure 8Volume percent measurement of thresholded CT-data for the composite core showing organic content (green) and minerogenic content (black). The 90th percentile for the minerogenic content and the 95th percentile for the organic content is used to separate event layers from background sedimentation. MO layers (red) are events in which both organic and minerogenic material are present.
The CT greyscale values are proportional to density and exhibit substantial variation throughout the record (Fig. 5). By thresholding the CT greyscale data, it is possible to quantify the volume percentages of the low-density organic material and the high-density minerogenic particles (Fig. 7b). The M-layers are identified as having a higher volume percentage of minerogenic material, the O-layers by higher organic content, and the MO-layers by higher volumes of both minerogenic and organic material (Figs. 7 and 8). Averaging CT-derived values over the depth intervals of discrete LOI samples reveals a moderate positive correlation between LOI and CT-derived organic content (r = 0.57), whereas no correlation exists between LOI and the minerogenic CT content.
4.3 Event frequencies
The volume percentages derived from the thresholded CT data were used to identify and quantify the different sediment layers (M-, O-, and MO-layers) within the composite record. Thresholds were set at the 90th percentile for minerogenic content and the 95th percentile for organic content to distinguish event layers from the background signal (normal flow). The chosen thresholds fit well with visible layers in the core (Figs. 7 and 8). In total, 140 M-layers, 74 O-layers, and 16 MO-layers were detected. The event-layers are between 0.2–7.2 cm thick, with an average of 0.5 cm. MO-layers are generally the thickest layers (average of 2.5 cm), while O-layers are thinnest (average of 0.37 cm). The M-layers are on average 0.47 cm thick.
4.4 Chronostratigraphy
The 137Cs activity shows two distinct peaks in the core at 13.5 and 23 cm, attributed to the Chernobyl accident (C) and maximum nuclear weapon testing (MWP), respectively (Fig. 9b). The 210Pb excess is ∼ 250 mBq g−1 at the surface, with a short increase to 350 mBq g−1 at 7 cm. After this level, the value decreases to 77 mBq g−1 at 39.5 cm. A piecewise CRS model was applied to construct the age-depth relationship, as the record includes stepped changes in sedimentation (event layers).
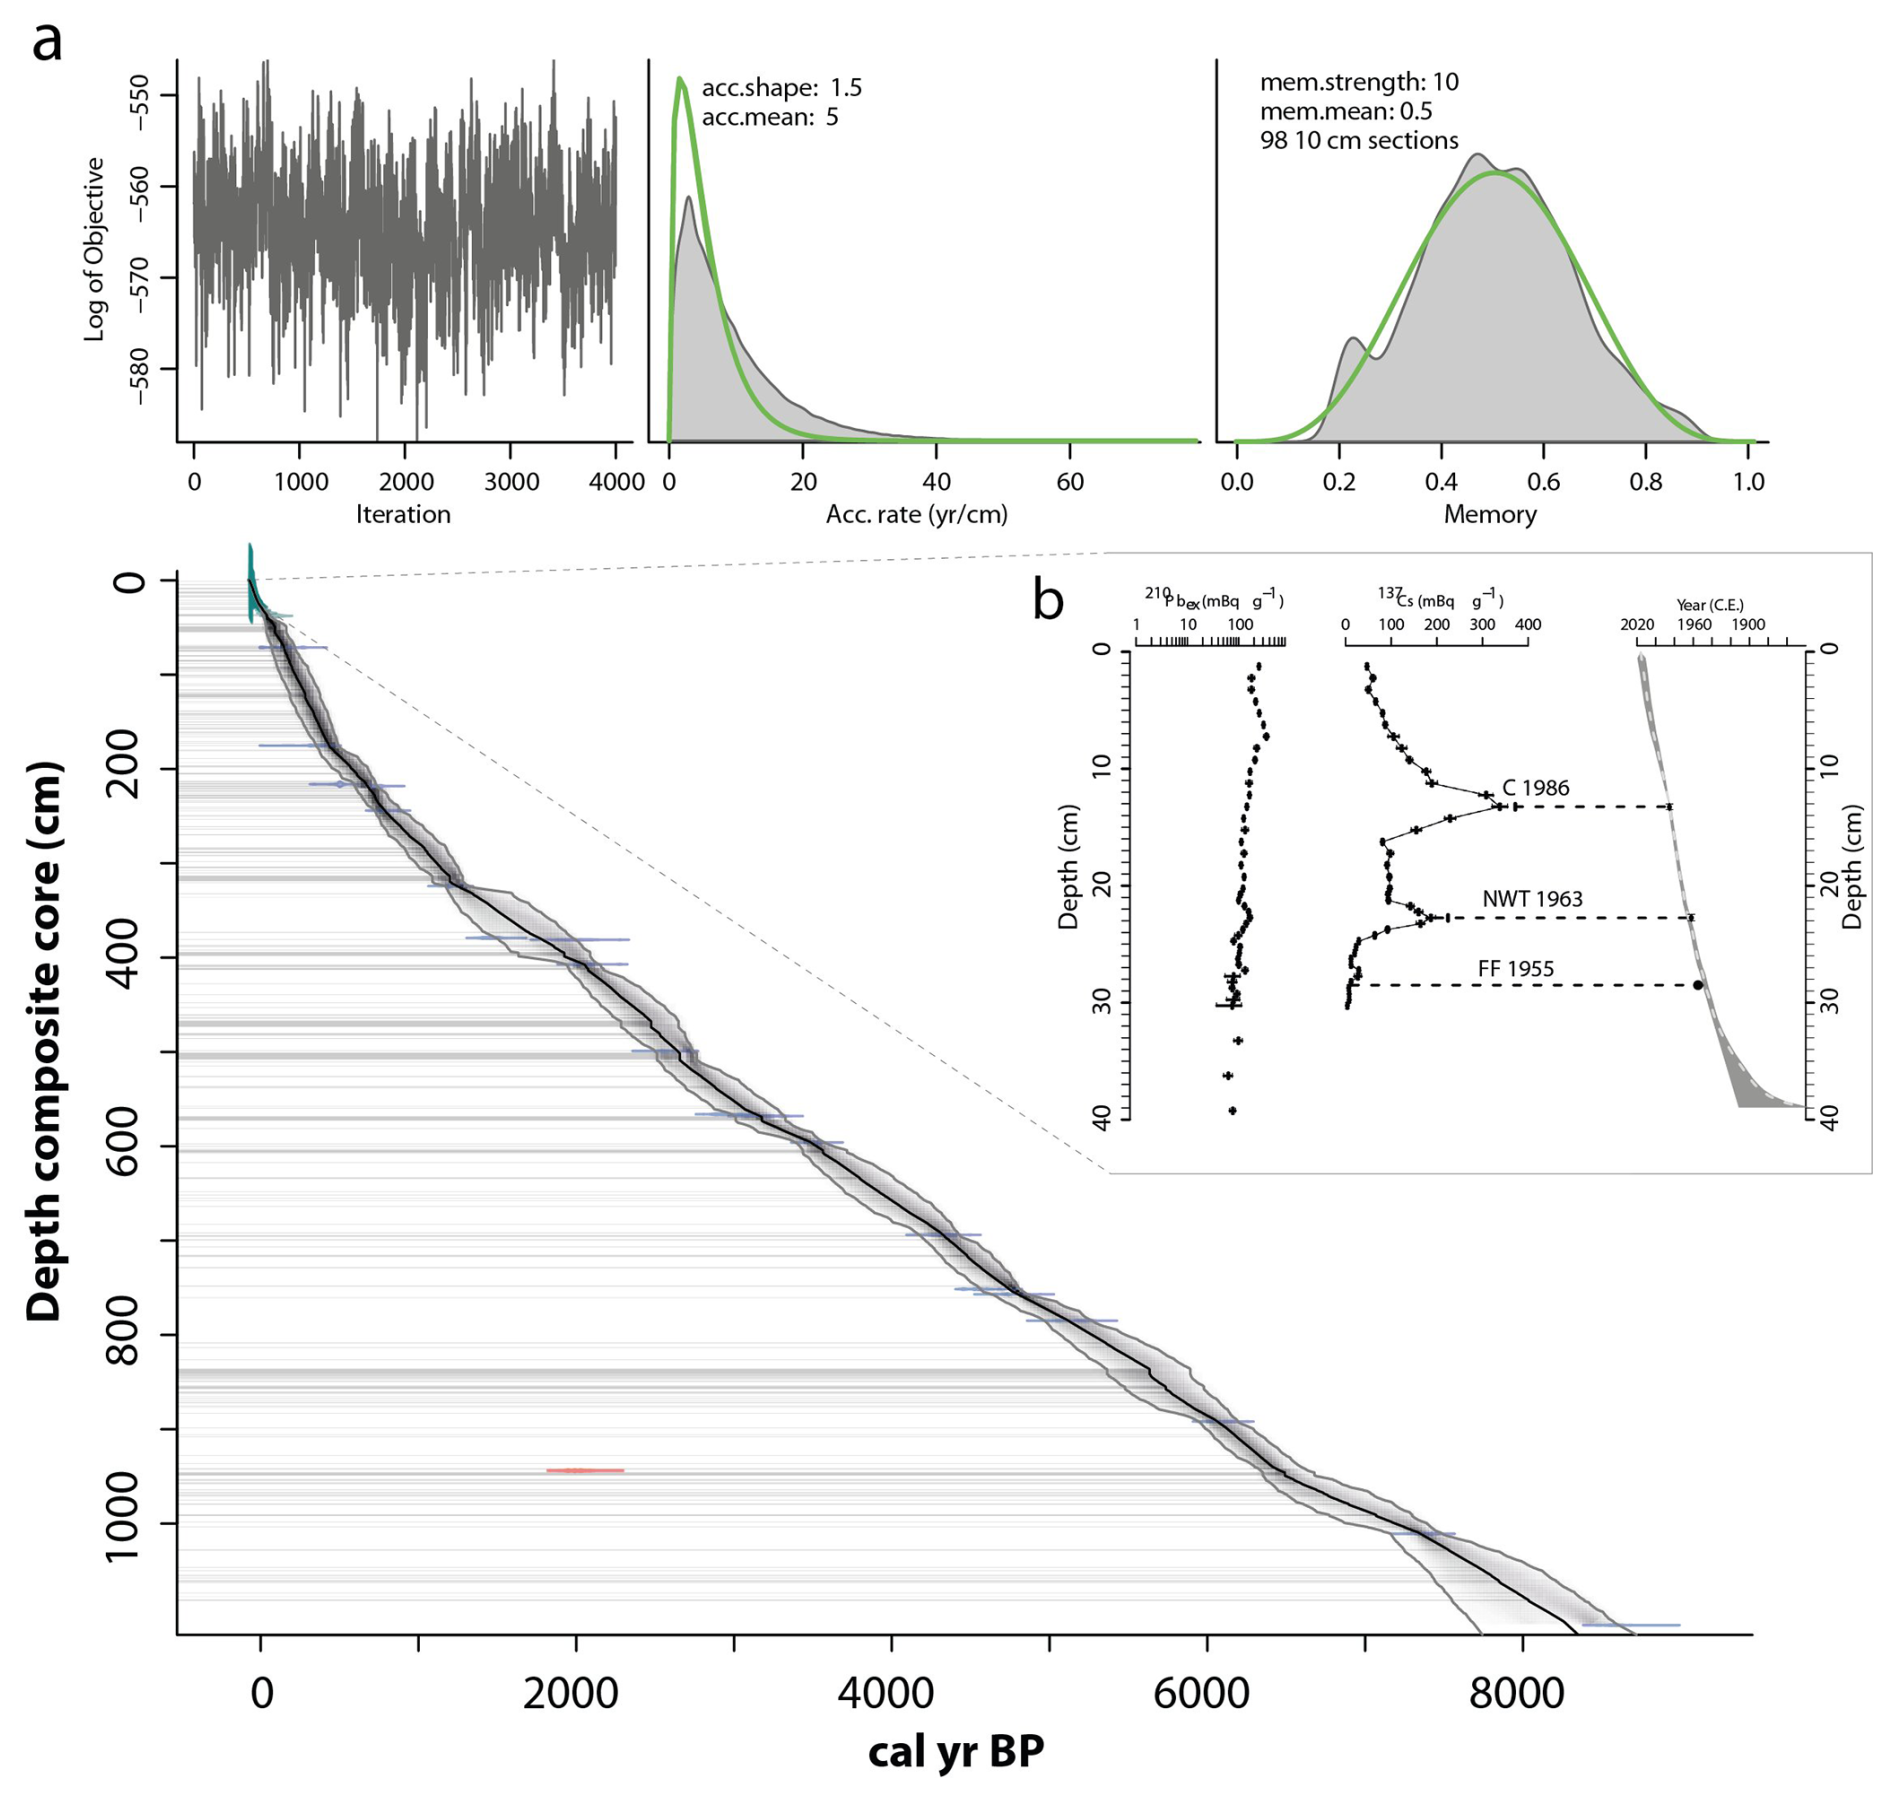
Figure 9(a) Age–depth relationship for the composite core obtained with the package Bacon (Blaauw and Christen, 2011) in R based on 14C-dating and the short-lived radionuclides (137Cs and 210Pb). The black line shows the best age–depth estimates with a 95 % confidence interval in grey shading. Red coloured date is left out of the model due to a likely disturbance/redeposition (see text). All the recorded event layers are treated as instantaneous events and are marked as slumps in the model (grey horizontal lines). (b) A piecewise CRS model produced with the R-based Serac package (Bruel and Sabatier, 2020) based on the short-lived radionuclides from the upper 39.5 cm of VATG316 (137Cs and 210Pb).
The uppermost 14C-dating was extracted from 1.5 cm in VV-17, corresponding to 67.5 cm in the composite record, and calibrated to 180 ± 40 cal yr BP. Based on the age–depth model derived from short-lived radionuclides, the sediment at 67.5 cm depth is estimated to date between 60 and 260 cal yr BP (Fig. 9). This indicates that the correlation between the cores (Fig. 4) is within the standard errors of the dating methods used.
Only one (Poz-163276) of the 22 14C-dates in VV-17 shows an age inconsistent with the general age trend, being several thousand years younger than nearby samples (Fig. 9a and Table 2). This sample was likely contaminated with younger material during processing and is considered an outlier. The final age-depth model indicates a relatively stable sedimentation rate of 1 mm yr−1 from 8200–3500 cal yr BP, increasing to an average of 2.1 mm yr−1 from 1000–0 cal yr BP. The uppermost unconsolidated sediments (0–30 cm) indicate the highest sedimentation rates of 4.7–2.6 mm yr−1 respectively.
The event layers in the composite core (M-, O- and MO-layers) are regarded as instantaneous events and were probably deposited within a few days or weeks. The age model can be corrected to account for instantaneous events by giving the whole layer the same age, thereby making a stepwise age-depth model (e.g. Hardeng et al., 2024; Nielsen et al., 2016). By conducting a stepwise model in Bacon using the slump function, the final model is corrected for instantaneous events (Fig. 9a). The difference between the corrected and uncorrected models for the combined core lies within 191 years, with a median of 7 years.
5.1 Sediment sources and human activity in the Lake Vangsvatnet catchment
Lake Vangsvatnet has a long history of flooding. Historical and current observations indicate that the lake colour at the inlet becomes brownish during flood events, in response to an increasing influx of detrital and organic material eroded, transported, and deposited in the lake (Fig. 2). However, finding ideal sites for extracting sediments with flood layers from lakes is challenging, as numerous processes within the lake and in the catchment can influence sedimentation over time (e.g., Schillereff et al., 2014). Some geomorphological conditions are necessary for adequate sediment supply during flood events. Among others, topographical relief and high sediment availability are preferred, as are a clearly defined and stable inlet and a deep lake basin. The area surrounding Vangsvatnet fulfils these criteria.
A large fluvial delta marks the Vosso river inlet at the eastern end of Lake Vangsvatnet. The significant volumes of silty sand deposited along Vosso during the 2014 event indicate that the river has a high sediment transport capacity during periods of increased discharge. Similar sediments were also found at Tvildemoen along Raundalselvi, suggesting that sediment transport from the Raundalen valley dominates, as the Strandaelvi river lacks the capacity due to multiple lake basins along its course before coalescing with Raundalselvi (Fjellheim, 2018). At Vossevangen, sediment deposition appears as thin layers of silty sand along the riverbanks, reflecting the river's competence to transport sediments to Lake Vangsvatnet.
The extensive delta at Vossevangen suggests that the lake has received sustained sediment input over time. Sediment input was most likely very high immediately following deglaciation (11 100–10 200 cal yr BP), with rapid isostatic rebound of the surface and considerable erosion of glaciofluvial deltas around Voss. The present delta and river channel became developed within the first millennia after deglaciation as sediment availability dropped dramatically, vegetation established, and the present outlet threshold at 44 m a.s.l. came into play. Following this, lake level has fluctuated around this fixed threshold, and the geomorphological configuration of the inlet appears to have remained stable throughout the Holocene. The present river channel is constrained by bedrock at the confluence of the Strandaelvi and Raundalselvi rivers and by the 61 m a.s.l. terrace surface at Vossavangen (Fig. 2), strongly limiting lateral migration. The delta has prograded approximately 400 m from the terrace level at ∼ 50 m a.s.l., indicating modest Holocene progradation relative to the timescale. Thus, while minor delta-front adjustments are inherent to any active delta system, there is no evidence for major Holocene shifts in inlet position that would have affected sediment focusing at the coring site. This interpretation is consistent with observations from comparable lacustrine systems where early Holocene reorganization is followed by long-term stability (e.g. Wilhelm et al., 2022).
The coring locations of VV-17 and VATG316 are situated relatively close to the present delta to capture flood sediments from the Vosso river. This location was selected due to large lake level variations during flooding (< 11 m historically), leading to a decrease in velocity (related to river gradient) and a lowering of the river's competence at the inlet as the lake fills up (Øksnes, 2019). There is no sign of erosion in the studied cores or avalanches close to the coring location on the bathymetric map (Fig. 2). However, several landslides are visible in the bathymetric data along the northern slopes of Lake Vangsvatnet, which appear to be associated with road construction carried out over the past 30 years (e.g. Aalbu, 2023).
The area around Voss has been populated for thousands of years and is one of the largest agricultural municipalities in the region. Archaeological and palaeoecological evidence indicates that agriculture was introduced during the Late Neolithic period (2200–1700 BCE; approximately 4000–3400 cal yr BP) (Hjelle et al., 2006). Human activities, including deforestation by means of forest fires and clearing, and the expansion of agricultural practices, can influence sediment dynamics by altering both sediment availability and hydrological runoff, thereby affecting sedimentation processes in lakes (e.g. Rapuc et al., 2024). Currently, only 3 % of the total land area in Voss municipality is classified as active farmland, predominantly used for grazing and forage production (Knutsen et al., 2022).
5.2 Interpretation of the sediments from Lake Vangsvatnet
Four main sedimentological components were identified in the composite core: (1) homogenous organic-rich silty sediments (B), (2) sediments dominated by minerogenic material (M), (3) sediments dominated by organic material (O) and (4) sediments containing both minerogenic and organic material (MO) (Table 2).
Background sedimentation (B) dominates the core and is characterised by rather small grain size, low variance (more sorted) and relatively stable geochemical and CT data (Figs. 6 and 7). MS data exhibits the most pronounced variability, particularly in Unit 3 (0–336 cm; 0–1400 cal yr BP) and the lower parts of Unit 1 (1000–1112 cm; 7000–8500 cal yr BP) (Fig. 5). Both periods could be a response to a more extensive snow cover and increased glacial activity in the catchment, producing fine-grained glacial flour that was continuously deposited in Lake Vangsvatnet. The interpretation aligns well with documented periods of increased glacial activity in western Norway (e.g. Vasskog et al., 2012; Røthe et al., 2019; Nesje et al., 2008). The B-intervals are therefore considered to represent phases of normal sedimentation to Lake Vangsvatnet.
Minerogenic layers (M) indicate a rapid influx of inorganic detrital material, marked by sharp transitions, peaks in Ca and Ti, lower LOI values, elevated MS in the thickest events (> 5 mm), and high CT density (Figs. 5 and 7). Grain size shows high variance, reaching up to 200 µm (fine to medium sand), with no grading (Fig. 6). These features suggest deposition under high-energy conditions, likely as interflows or underflows during flood events (e.g. Sabatier et al., 2022).
Organic-rich layers (O) represent rapid deposition of organic detritus, identified by high LOI, decreases in Ca and Fe, and spikes in Fe Ti. CT data indicate low density, although minerogenic grains of similar size to those in M layers are present. These layers are interpreted as flood-related overflows, where terrestrial organic material is remobilised and eventually settled in the lake (e.g. Hardeng et al., 2022).
Mixed layers (MO) combine characteristics of M and O layers, reflecting rapid input of both inorganic and organic material. They exhibit peaks in Ca and Ti, decreases in Fe Ti, the largest median grain size (90 µm), and are the thickest layers in the core. They are poorest sorted, but grain-size distributions remain mostly unimodal, lacking the very poorly sorted, multi-modal character typical of mass-flow deposits. CT imagery shows sharp basal contacts and abrupt upper boundaries, with no evidence of erosional scouring, load structures, shear planes, or soft-sediment deformation. The layers are structureless to faintly laminated, and their CT-density profiles show mixtures of dense minerogenic grains and low-density organic detritus. The sedimentological attributes of the MO layers closely resemble flood-derived mixed-density flow deposits described from other lakes (e.g. Kremer et al., 2015), where large floods introduce both coarse minerogenic sediment and abundant terrestrial organic material. MO layers likely formed during large or prolonged floods involving multiple flow types (over-, inter-, and underflows). They occur only in the uppermost 5 m of the core, corresponding to the last ∼ 2700 years.
All event layers (M, O, and MO) display sharp transitions from background sedimentation (B-interval) and occur sporadically throughout the record. They consistently exhibit coarser grain sizes than the background sediments (Fig. 6), indicating increased river competence during deposition.
5.3 Flood frequency and seasonality in the Vosso river
Reconstructing flood frequency from lake sedimentary archives benefits from an excellent chronology (Bøe et al., 2006) and an objective method for identifying and quantifying flood deposits (e.g. Hardeng et al., 2022; Støren et al., 2010). To detect and count the flood layers in Lake Vangsvatnet, CT data were analysed using specified statistical thresholds (90th percentile for minerogenic and 95th percentile for organic material).
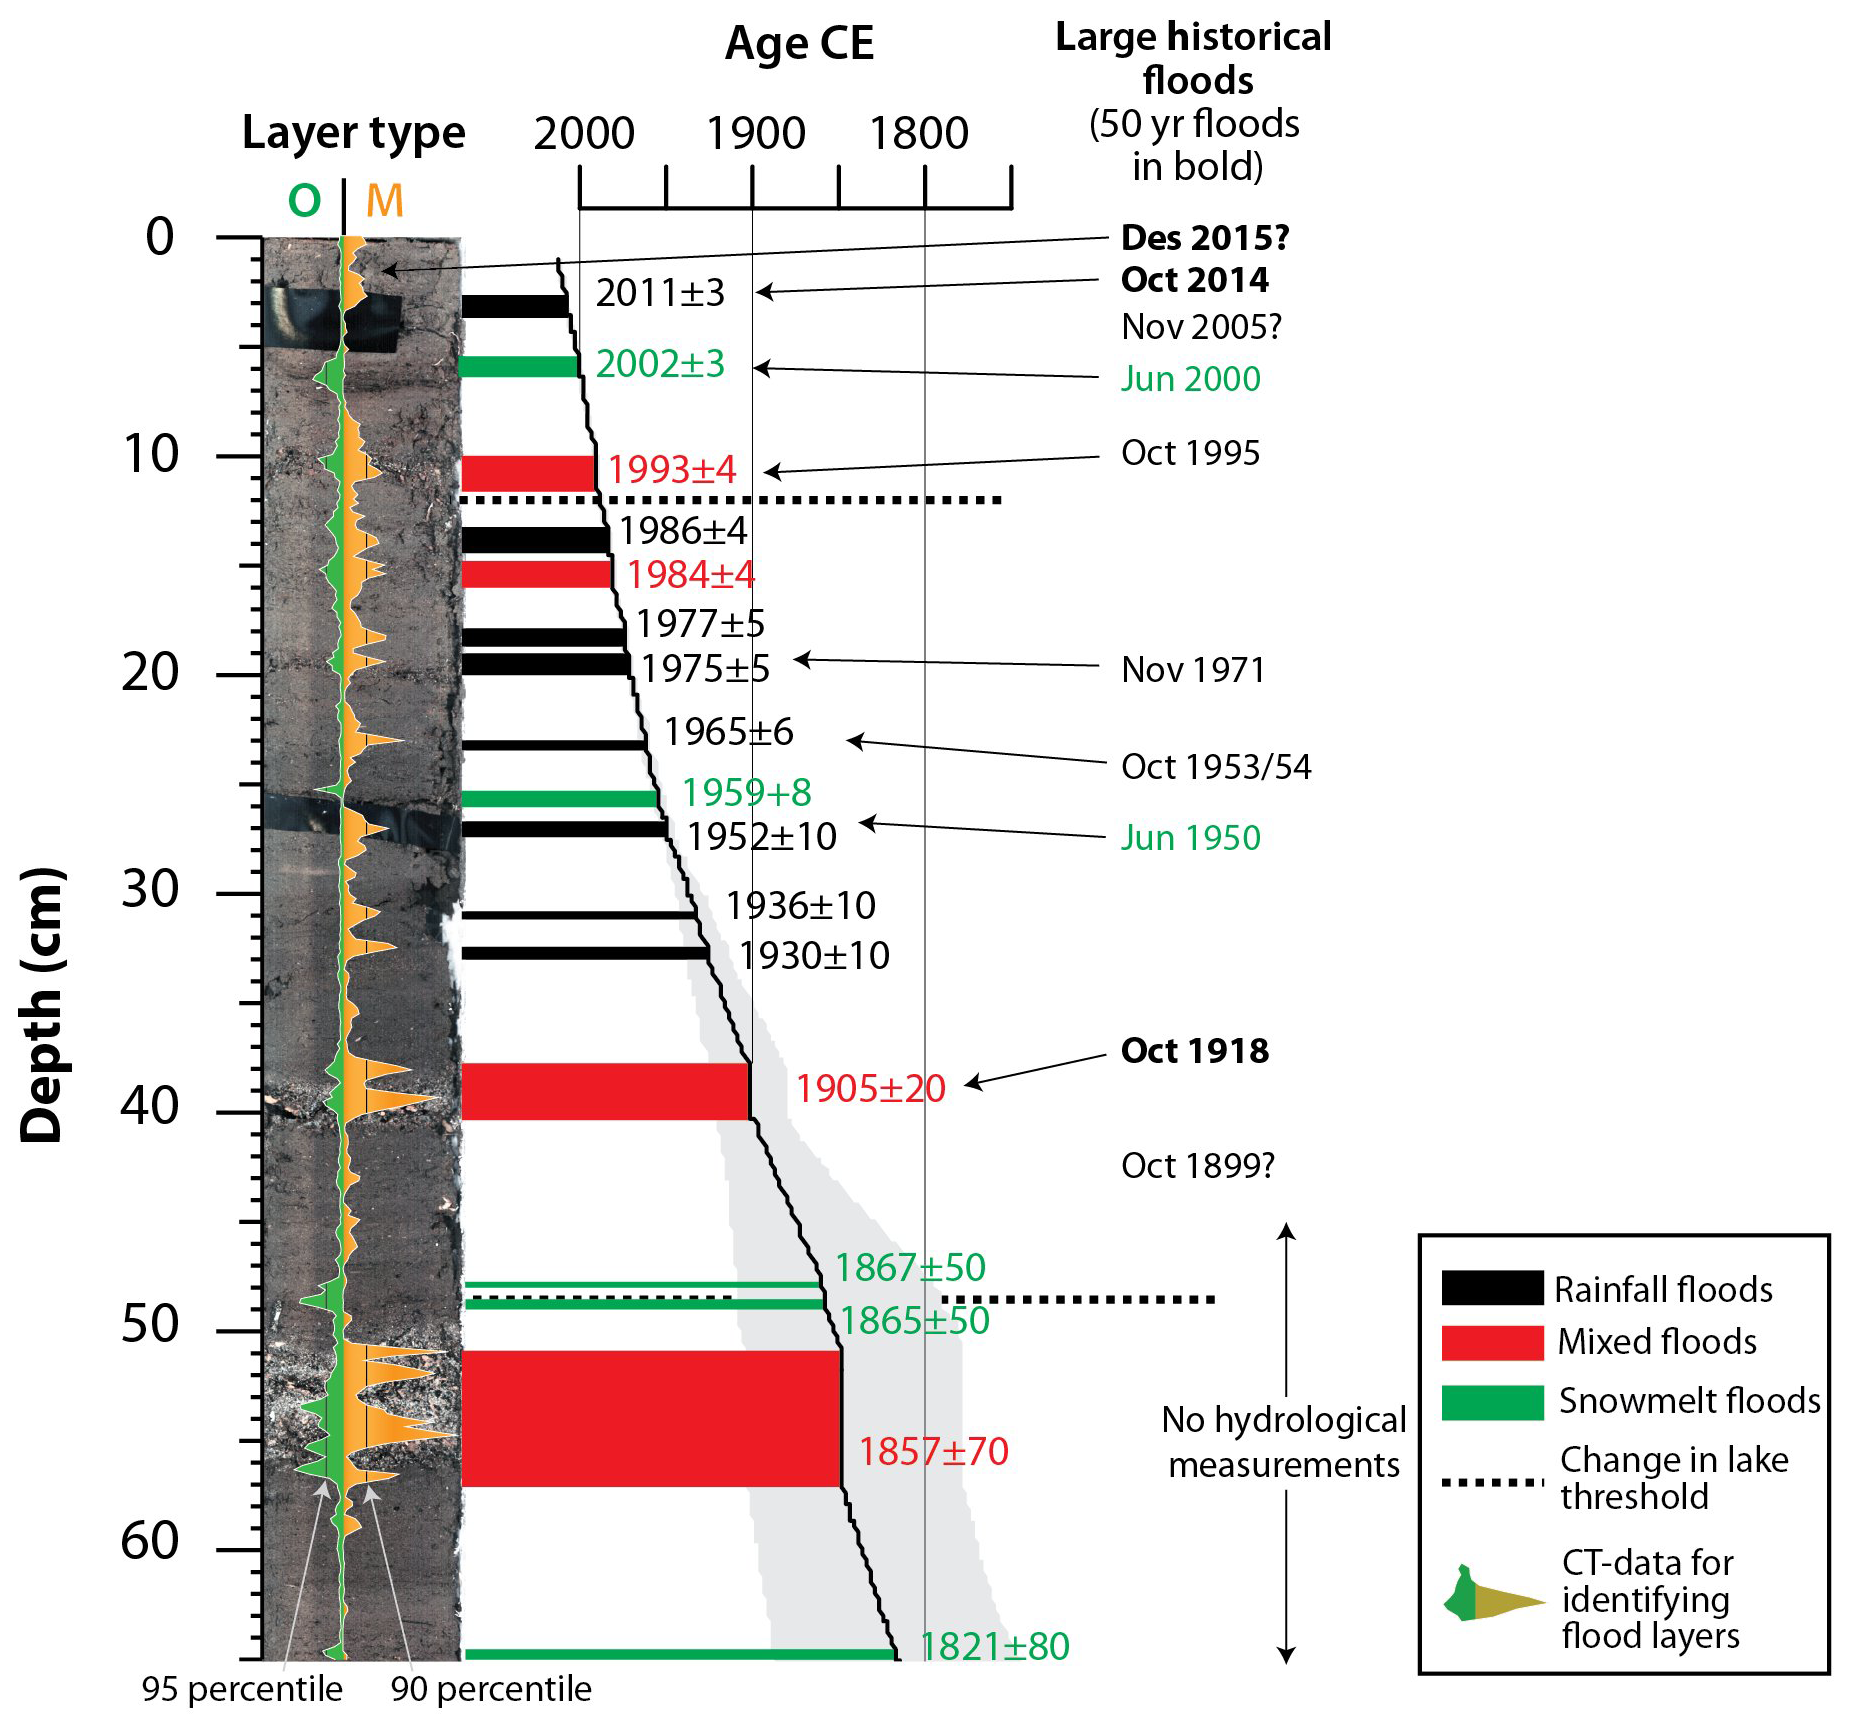
Figure 10Core image (VATG-316), CT-data and interpreted flood events in the record plotted along the age-depth model. Our flood proxy recorded 13 flood layers in the upper 45 cm of the core, corresponding to the instrumental period (1892 CE). Since records began, 12 large floods (> 5-year recurrence interval) have been recorded, most of which correspond to layers in the core within the age uncertainty interval. Black layers (M) are interpreted as autumn/winter events (minerogenic), green layers (O) are interpreted as spring/summer events (organic) and red layers (MO) are interpreted as large floods (mixed events). Note that most floods in the instrumental period occur during autumn/winter, except for two events (1950 and 2000 CE), which occurred during summer (green). The dotted lines indicate periods when the lake threshold was adjusted, reducing flood impacts at Voss.
To link, interpret, and validate the flood events in the composite core, the events are compared to discharge data from the hydrological station at Bulken (Fig. 10). From 1892–2016 CE (124 years), twelve floods larger than the 5-year flood level (470 m3 s−1) were recorded. Three of the floods occurred during spring and summer (once in 1950 and twice in 2000 CE), while the rest occurred during autumn and winter. Based on the age-depth model, the instrumental period corresponds to the top 45 cm of the core. In this interval, eight flood layers are classified as M-layers, two are O-layers, and three are MO-layers. The O-layers coincide with spring/summer floods in 1950 and 2000 CE, while five of the M- and MO-layers coincide with autumn/winter floods, indicating that the lake sediments record a seasonal signal.
Similar seasonal patterns are observed in southwestern Norway, in a similar lake and flood setting (Hardeng et al., 2022). Hardeng et al. (2022) propose that the organic flood layers identified at Lygne originate as organic material within the snowpack and are thus deposited during spring melt. The minerogenic flood layers are attributed to larger, more intense floods during fall/winter, which facilitated the erosion and transport of minerogenic particles from glaciofluvial deposits to the coring site.
At Vangsvatnet, a gradual rise in river discharge and lake level follows the winter low stand during the snowmelt season in April, May or June. This relatively slow and steady increase in water level (Fig. 3d) is suggested to facilitate the transportation and deposition of organic material that has accumulated in the snowpack and on riverbanks and around the lake during the winter. The organic matter, such as decaying vegetation and detritus, is mobilised by the rising water and carried buoyantly downstream and eventually deposited in the lake as distinct low-density layers. In contrast, precipitation-related floods, mainly triggered by intense rainfall events in autumn/winter (exceeding 250 mm in a few days), result in a rapid surge in river discharge and lake levels during this period. Under optimal conditions, such as a low initial lake stand and a steep increase in discharge, these floods can generate high river velocities due to the steeper gradient. The increased velocity enhances the river's erosive capacity, leading to erosion of riverbanks and mobilisation of minerogenic sediments. These sediments are then transported downstream and deposited in the lake, forming distinct high-density layers. Following this reasoning, the dominant flood regime and flood types for the Vangsvatnet record are presented in Fig. 11.
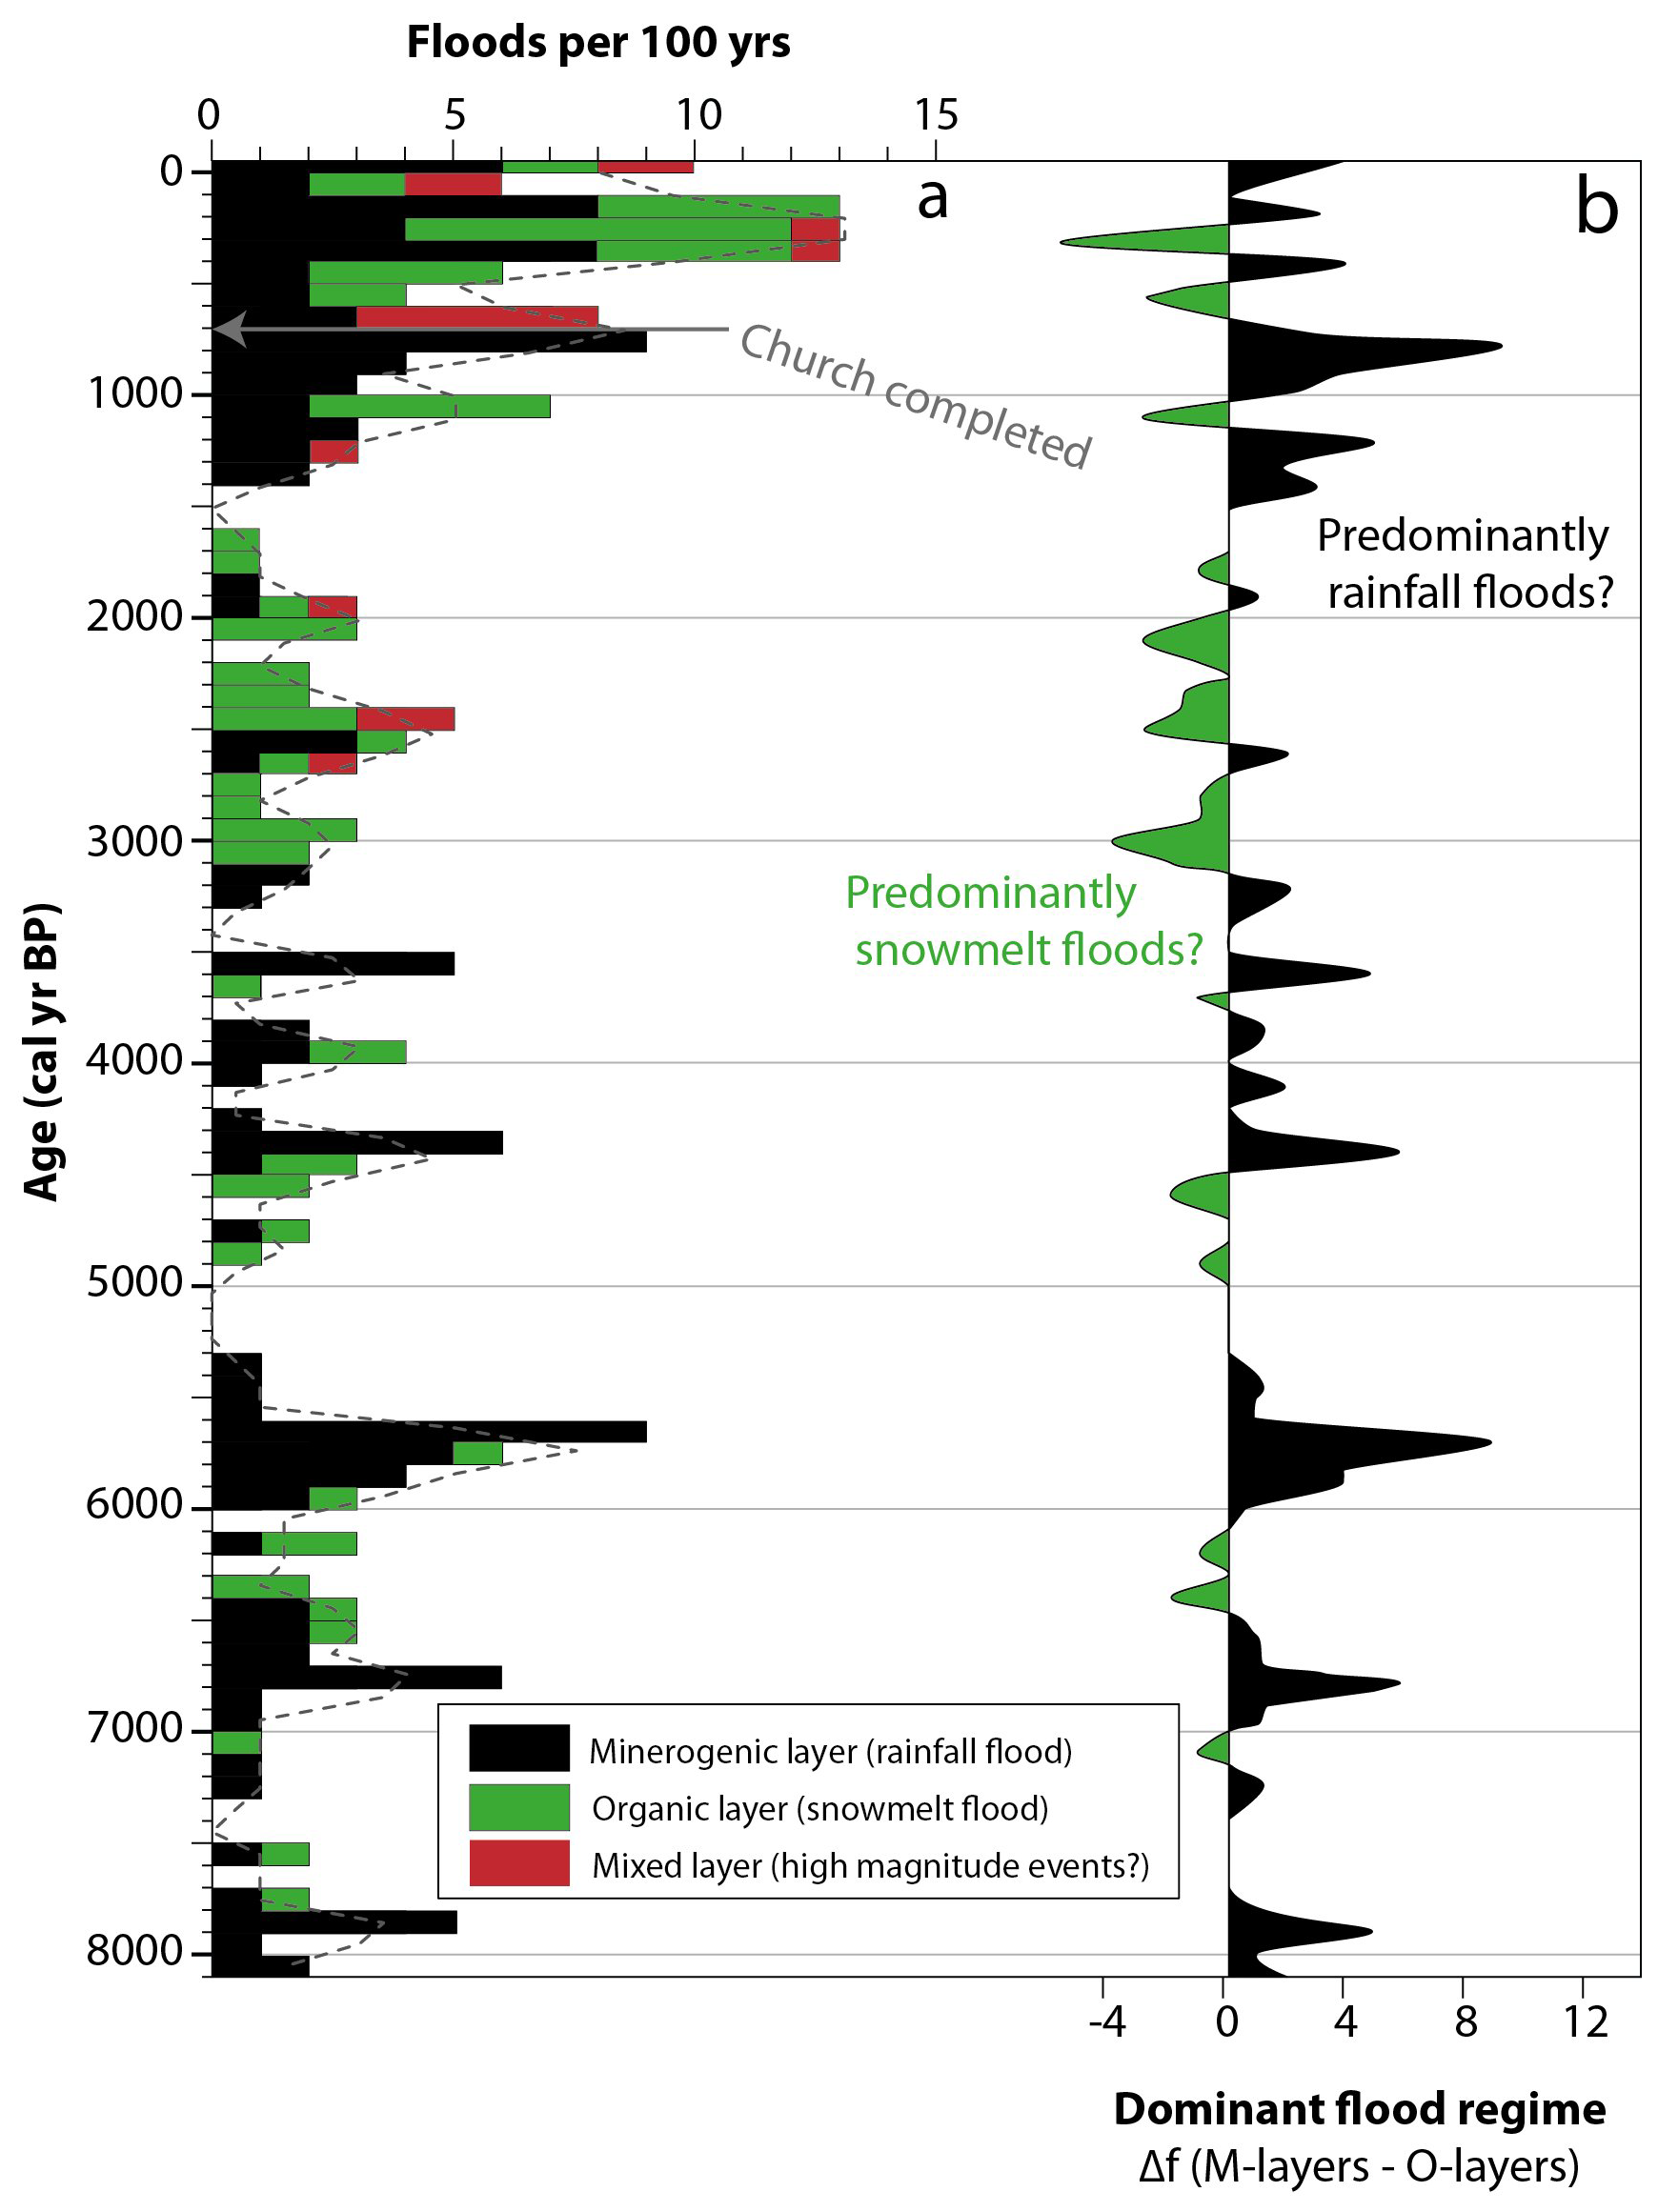
Figure 11(a) Flood layer count based on CT data, plotted as the stacked sum per 100 years for minerogenic (black), organic (green), and mixed floods (red). (b) The predominant flooding regime in Lake Vangsvatnet, showing the difference between the number of rainfall floods (black) and the number of snowmelt floods (green).
The introduction of sawdust in the flood layers in the upper part of the composite core is an interesting finding and is probably related to human activity in the catchment. Given the absence of this material in the rest of the combined core, it is inferred that there was a significant availability of sawdust along the river during this period. The sawmills at Voss emerged in the latter half of the 17th century, and from 1860 onwards, unrestricted timber harvesting in privately owned forests was permitted. Consequently, several sawmills were established along the Raundalselvi River, including sawmills at Palmafossen and Vangen (Gjerdåker, 1990). Since these sawmills were water-powered, they were situated along the riverbank, increasing the likelihood that sawdust was eroded and transported during flood events in this period. The lowermost flood layer containing sawdust is dated to the early 18th century.
5.4 Palaeoclimatic implications
The palaeoflood record from Lake Vangsvatnet reveals significant temporal and seasonal variability in flood occurrence over the past 8100 years (Figs. 11 and 12). From 8200–6000 cal yr BP, flood frequency was moderate, primarily driven by rainfall-induced floods (autumn/winter floods), with an occurrence rate of 0–6 floods per century (17 % of the floods in the record). A significant increase in flood frequency is observed from 6000–5600 cal yr BP, reaching a maximum of 9 events per century, predominantly consisting of rainfall floods (10 % of the floods in the record). Following this, a period of moderate flood frequency is observed between 4900–1400 cal yr BP (0–6 floods per century), marked by a distinct seasonal shift from rainfall-dominated events to snowmelt-dominated events around 3100 cal yr BP (28 % of the floods in the record). Three periods stand out with no recorded floods (5300–4900, 3500–3300, and 1600–1400 cal yr BP) and may be due to a hiatus in the core or to periods of low flood frequency. Peak flood frequency is recorded from 1400 cal yr BP to the present, ranging between 2–15 events per century, and accounting for 45 % of the floods in the record. This period also exhibits a mixture of seasonal flood types, with rainfall-related events dominating around 800 cal yr BP (Medieval Warm Period, MWP) and at present, and snowmelt-related events dominating around 300 cal yr BP (The Little Ice Age, LIA). The most significant historical flood at Voss, the 1604 CE flood (∼ 350 cal yr BP), occurred in spring as a snowmelt flood.
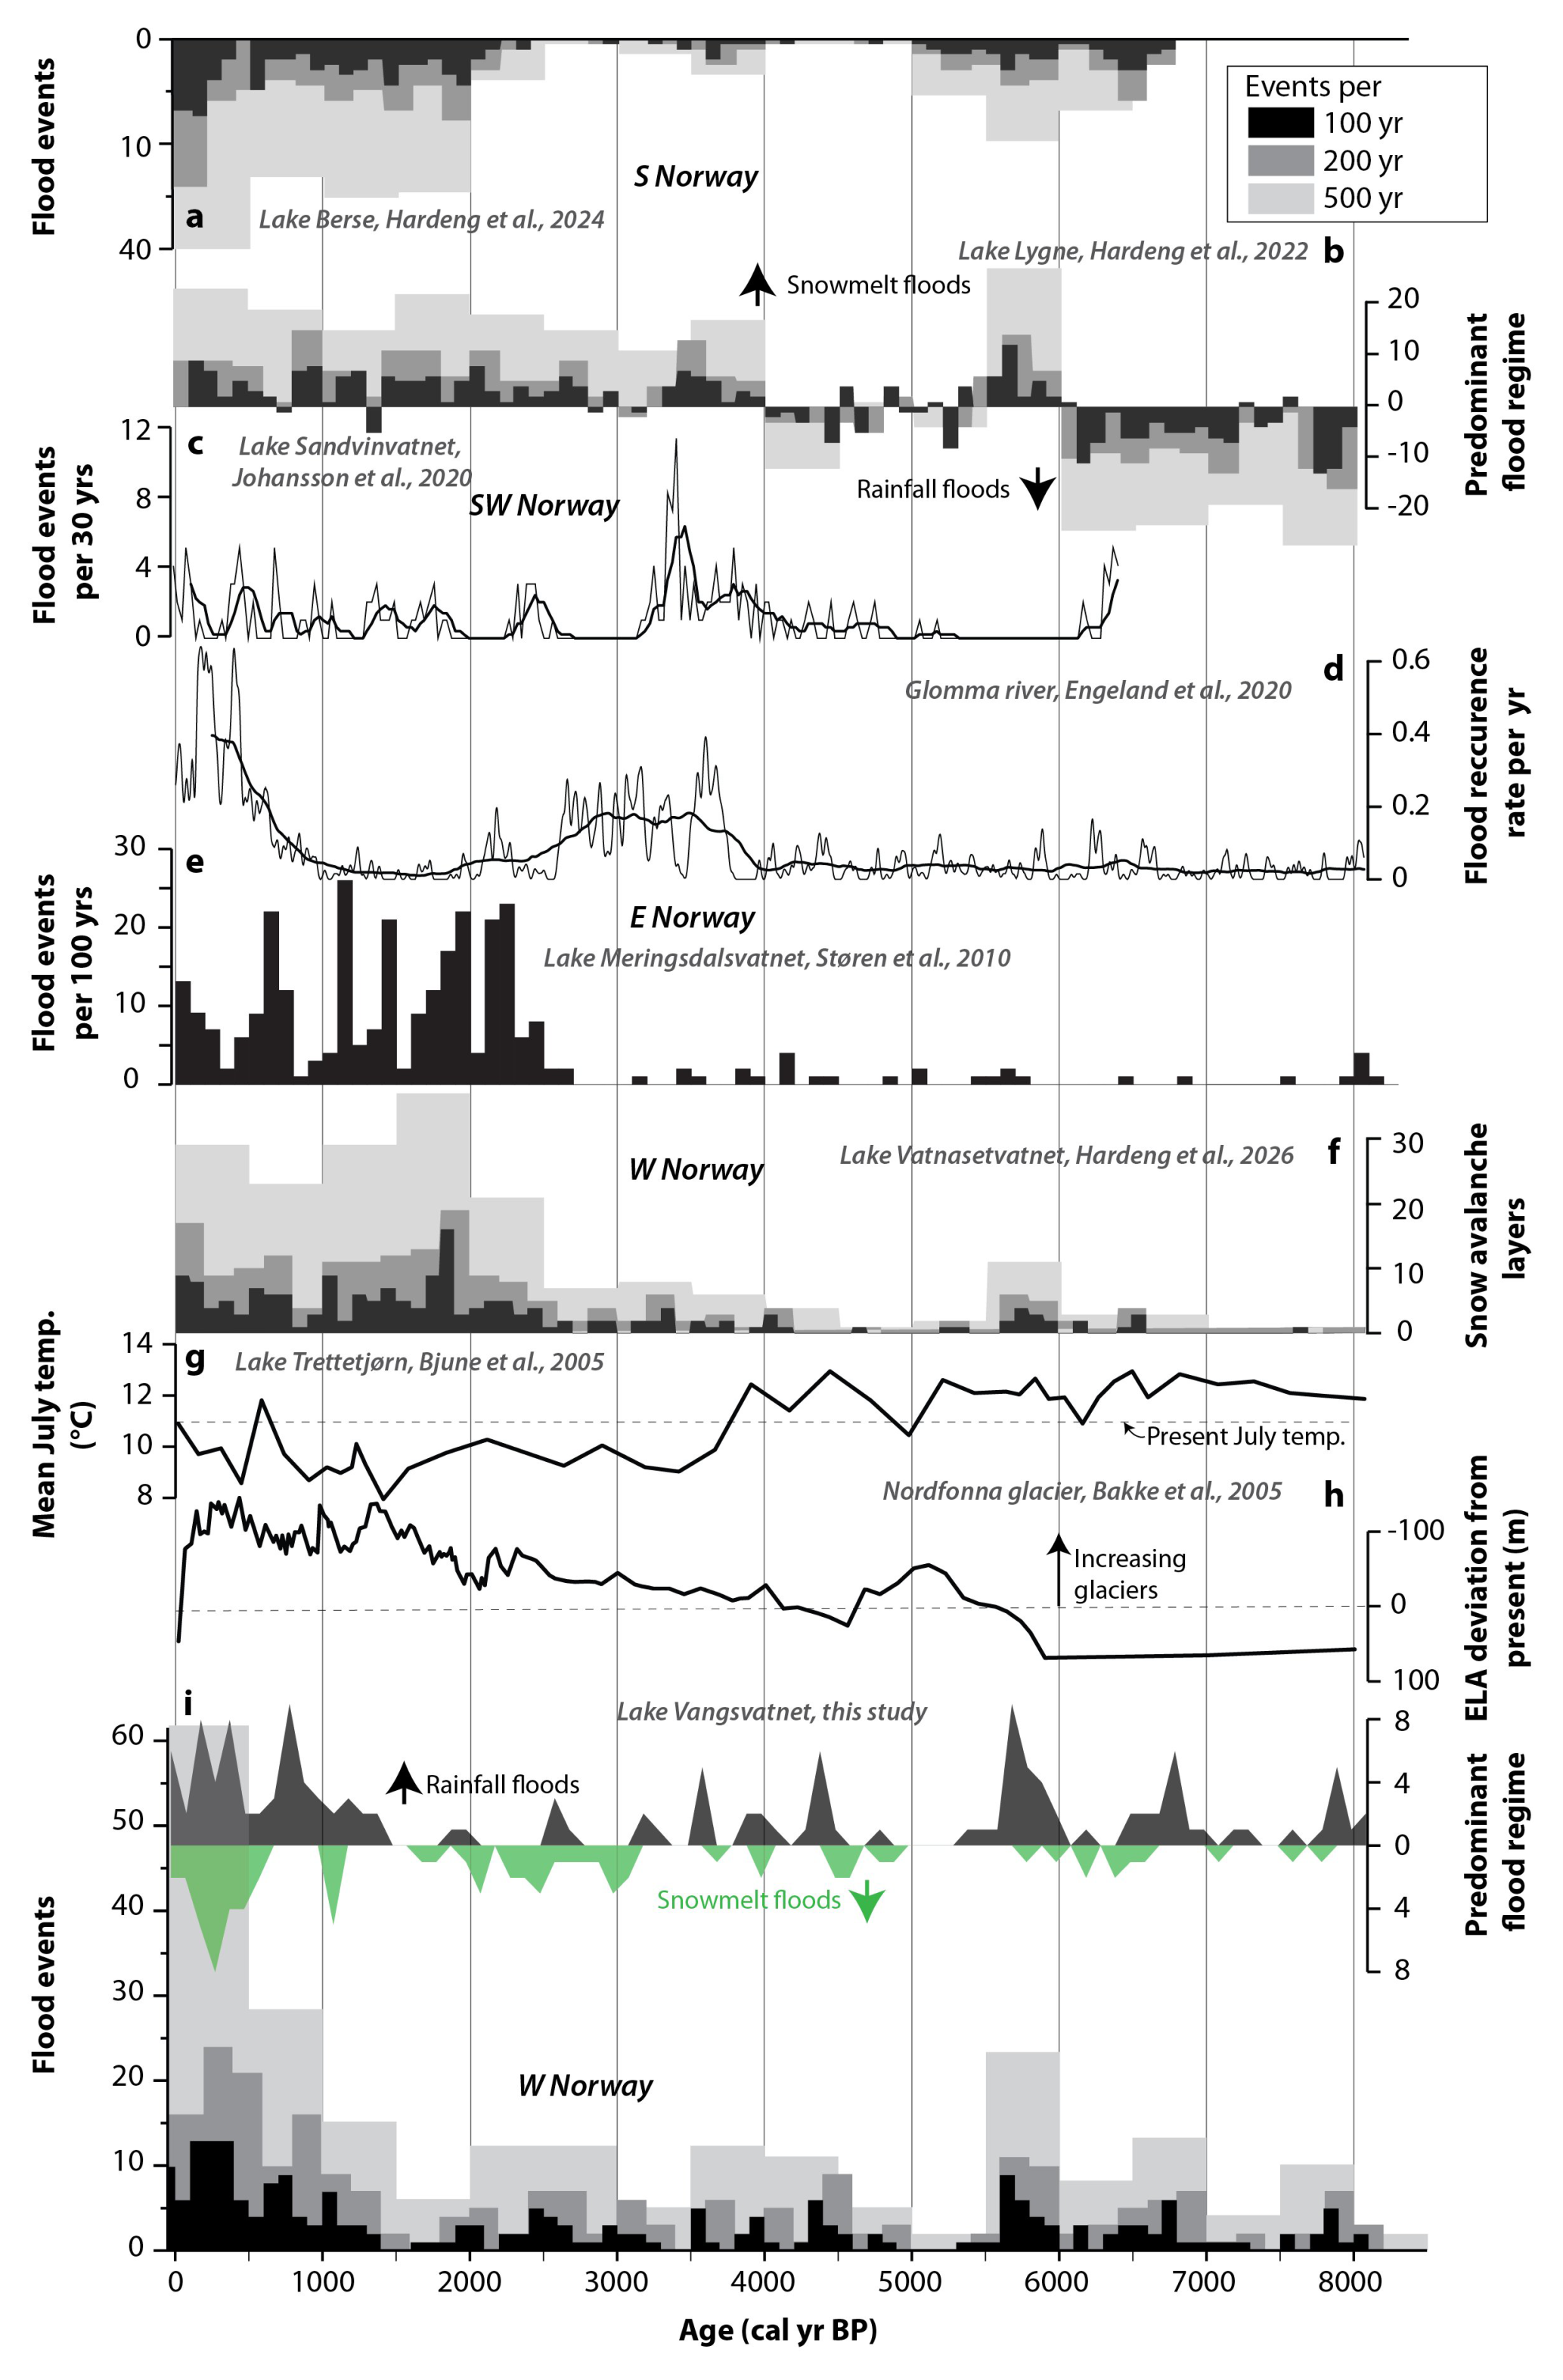
Figure 12Comparison between this record and other palaeoclimatic records from the region (a–i). (a) The record of extreme flood events reconstructed from Lake Berse as events per 100, 200 and 500 years (Hardeng et al., 2024). (b) Predominant flood regime in Lake Lygne, plotted as events per 100, 200 and 500 years (Hardeng et al., 2022). (c) Flood frequency diagram based on the rate of change (ROC) in Sandvinvatnet, SW-Norway (Johansson et al., 2020). (d) Flood frequency in Glomma with a 500-year running average (Engeland et al., 2020). (e) Flood events per 100 years from Lake Meringsdalsvatnet in Jotunheimen, east-central Norway, indicated as black bars (Støren et al., 2010). (f) Snow avalanche layers in lake Vatnasetvatnet (Hardeng et al., 2026). (g) Mean July temperature at Lake Trettetjørn (Bjune et al., 2005). (h) The deviation in equilibrium line altitude (ELA) from the present (m) for Nordfonna glacier, located in south-western Norway (Bakke et al., 2005). (i) The predominant flood regime (rainfall vs snowmelt floods) from this study and flood events per 100, 200 and 500 years.
The last 500 years represent the interval with the highest flood frequency in the record, exceeding that of the second-highest period by more than a factor of 2. This period also coincides with increased human activity in the Vosso catchment including deforestation, agricultural expansion, lowering of lake level, and the establishment of water-powered sawmills which would have increased sediment availability. Climatic cooling during the LIA, with increased winter snow accumulation, likely acted in parallel with enhanced anthropogenic disturbance, making the two drivers difficult to disentangle. Thus, the flood frequency increase during this interval should be interpreted as a combined climatic–anthropogenic signal rather than a purely climatic trend. Nevertheless, comparison with regional climate archives and independent indicators of land-use change could help clarify the extent to which human landscape modification contributed to the observed changes in flood activity.
The church at Voss (Vangskyrkja) was built in 1277 CE and is located in an area prone to flooding during major flood events. Constructing a large stone church requires significant knowledge and resources, making it unusual to place such an important building in a flood-prone location. This observation raises the possibility that flood magnitudes before the church's construction were significantly lower than those observed in subsequent centuries. Consequently, the flood frequency and magnitude recorded over the past 500 years may represent an anomaly within the broader context of the last 4000 years of human settlement in the region.
The Vangsvatnet record is compared to regional palaeoclimate archives to investigate potential correlations between flood activity and other climate-sensitive processes (Fig. 12). Cross-regional comparisons can be challenging due to contrasting climatic patterns, different lake sensitivities, threshold behaviour, sediment availability and different triggering mechanisms operating at various temporal and spatial scales. For example, floods in eastern Norway are strongly influenced by snowmelt, and the climatic driver of these floods is primarily linked to winter precipitation and a meridional component of the atmospheric circulation (Støren et al., 2012). Therefore, studies from the same geographical region with comparable climatic conditions are preferred.
Five flood records from other sites in Norway are presented in Fig. 12a–e: Lake Berse (Hardeng et al., 2024), Lake Lygne (Hardeng et al., 2022), Lake Sandvinvatnet (Johansson et al., 2020), the Glomma river (Engeland et al., 2020) and Lake Meringdalsvatnet (Støren et al., 2010). Many of these records are dominated by snowmelt floods (winter precipitation), showing high flood frequencies between 6000–5500 cal yr BP (S and SW Norway) and during the Late Holocene (neoglacial period) from ∼ 2500–0 cal yr BP (all records). This pattern is somewhat similar to that in Lake Vangsvatnet (Fig. 12i), but with a different seasonal signal. At Voss, the period from 6000–5500 cal yr BP and 1500–500 cal yr BP were dominated mainly by rainfall floods, while snowmelt floods dominated between 3000–2000 and 500-200 cal yr BP. This could indicate that the elevated winter precipitation spurring an increase in flood activity in eastern Norway fell as rain rather than snow in the Voss region. The notable shift in flood regime from rainfall-dominated to snowmelt-dominated floods in Lake Lygne (Fig. 12b) at 4200 cal yr BP has been linked to the gradual, orbitally driven temperature changes during the Holocene (Hardeng et al., 2022). This shift is characterised by a transition from warm summers and cold (dry) winters to cold summers and warm (wet) winters, as reflected in summer and winter insolation (Laskar et al., 2004). This pattern is not evident at Voss, which could be due to high relief and a complex catchment, as well as a more maritime-influenced climate. The flood record from Sandvinvatnet (Fig. 12c) differs from the other records in Fig. 12, especially the flood rich period between 3000–4000 cal yr BP. Johansson et al. (2020) interpret that atmospheric events with intense rainfall during autumn was the main triggering factor for floods in Sandvinvatnet, but with a complex interaction with melting from the Folgefonna ice cap.
For Western Norway, several studies have been conducted on glacier variations, particularly for coastal glaciers such as Folgefonna (Fig. 12h) (Bakke et al., 2005; Røthe et al., 2019), Jostedalsbreen (Nesje et al., 2001b; Vasskog et al., 2012) and Ålfotbreen (Gjerde et al., 2016). These studies provide valuable archives since the mass balance of glaciers in western Norway is strongly linked to increased winter precipitation and lower summer temperatures (Bakke et al., 2008). Additionally, reconstructions of snow avalanche activity at Vatnasetvatnet (Hardeng et al., 2026) and a pollen-based mean July temperature reconstruction from Lake Trettejørn in Upsete (Bjune et al., 2005) are available (Fig. 12f and g).
The ELA reconstruction from Folgefonna shows expanding glaciers from ∼ 4200 cal yr BP, with a significant drop in ELA occurring from 2000–1500 cal yr BP and reaching maximum size during the LIA. This is also reflected in the frequency of snow avalanches from the same area (Hardeng et al., 2026). A drop in summer temperature is recorded at Trettetjørn in Raundalen from ∼ 4200 cal yr BP, as shown by the disappearance of pine forest and the increase in birch woodland, indicating a cooler, wetter climate (Bjune et al., 2005).
The flood frequency at Voss does not indicate a major change at around 4000 cal yr BP; however, there is an increase in flood frequency from 1400 cal yr BP and onwards. Increased winter precipitation may have contributed to both a higher likelihood of rainfall-induced floods late in the year (November–December) and greater snow accumulation in the mountains, leading to more snowmelt floods in Voss during this period. Furthermore, the background sediments exhibit greater variability in MS data during this period (Unit 3) (Fig. 5), likely reflecting increased glacial activity in the cirques in Raundalen. Periods of increased run-off into Lake Trettetjørn also correlate closely with flooding in Lake Vangsvatnet, with three major episodes over the past 1500 years: the first peaking around 1250 cal yr BP, the second around 800 cal yr BP, and the third around 250 cal yr BP (Paasche and Larsen, 2010).
The pronounced non-stationarity observed in the Vangsvatnet flood record is consistent with a growing body of worldwide evidence showing that flood regimes vary substantially on centennial to millennial time scales (e.g. Chen et al., 2021; Šraj et al., 2016; Cunderlik and Burn, 2003; Engeland et al., 2020). These studies illustrate that flood occurrence is inherently non-stationary, driven by complex interactions between climate forcing, hydrological thresholds, and, in many cases, human modification of catchments. The Vangsvatnet record therefore contributes not only to a regional understanding of Holocene flood variability in western Norway but also aligns with global evidence demonstrating that flood frequency cannot be assumed to remain constant over long time-scales.
Climate models suggest that temperatures in Norway will increase by 2.7 °C under the RCP4.5 emission scenario and up to 4.5 °C under RCP8.5 by 2100 CE, shortening the snow season and consequently reducing snowmelt floods (Hanssen-Bauer et al., 2017). It is also predicted that precipitation will increase by 40 %, heightening flood risk in western Norway, especially during late autumn and winter. A recent flood risk mapping conducted by the Norwegian Energy Regulatory Authority indicates that a 200-year flood in 2100 CE could be 2 m higher than the 2014 CE flood, inundating large parts of Voss and reaching the church wall (Vingerhagen, 2020). Furthermore, if snowfall is followed by mild temperatures, the potential for a snowmelt flood increases significantly. In this context, snowmelt can exacerbate the flood risk, particularly when it coincides with mild temperatures and heavy rainfall during late autumn or winter.
A new high-resolution sedimentary record from Lake Vangsvatnet, Western Norway, reveal long-term variability and seasonality of flood events in the Vosso river catchment. Through a multiproxy approach combining CT scanning, XRF geochemistry, grain-size analysis, and radiocarbon dating, 230 flood-events have been identified and classified.
An age–depth model based on both radiocarbon and short-lived radionuclide chronologies was constructed to reconstruct local sedimentary dynamics over the past 8 000 years. The application of CT thresholding techniques has allowed for an objective identification of event layers associated with floods, and the subsequent separation of floods being dominated by minerogenic content, organic matter, or a combination of the two.
The detailed flood record (n = 230) reveals marked fluctuations in frequency and seasonality, including a shift from rainfall-dominated to snowmelt-dominated floods around 3100 cal yr BP with an additional amplification during LIA, coinciding with regional cooling, The last 500 years exhibits the highest flood frequency, accounting for approximately 26 % of all documented flood events in the record. This increase aligns with the Little Ice Age with increased snow availability in the watershed mountains, and human influences such as deforestation, agriculture, and sawmill operations, which likely enhanced sediment availability. We have not managed to quantify the potential impact of human activity.
Looking ahead, a continued warming and reduced snowpack may diminish spring snowmelt floods, while intensified autumn and winter rainfall could increase flood risks. These findings underscore the importance of long-term sediment archives in understanding hydrological responses to climate change and in informing future flood risk management strategies.
The data from Lake Vangsvatnet can be made available on request.
JB, PRN, ØP and JMC designed the conceptual framework for the project. JB and ØP coordinated the coring campaign. JMC, PRN and GY designed and carried out the laboratory analyses. PRN prepared the figures and led the manuscript writing. PRN, JB, ØP and JMC contributed to the analysis of the datasets. All authors contributed to the writing process and approved the final version of the manuscript.
The contact author has declared that none of the authors has any competing interests.
Publisher's note: Copernicus Publications remains neutral with regard to jurisdictional claims made in the text, published maps, institutional affiliations, or any other geographical representation in this paper. The authors bear the ultimate responsibility for providing appropriate place names. Views expressed in the text are those of the authors and do not necessarily reflect the views of the publisher.
Thanks to Eivind W. N. Støren and Aart Verhage who took part in the coring of Lake Vangsvatnet in 2017. Thanks also to the two master students, Helene Fjellheim and Monika Øksnes, who wrote their thesis on sediments from Lake Vangsvatnet which enhanced our understanding of the sedimentary processes in the catchment. All laboratory analyses, except for dating, were done at the National Infrastructure EARTHLAB (NRC 226171) at the University of Bergen. We sincerely thank Juan Pablo Corella and an anonymous reviewer for their thorough and constructive evaluations which greatly improved the manuscript.
Artificial intelligence support: Copilot was utilized to assist with language refinement, including improvements in phrasing, clarity, and tonal consistency. All scientific content, interpretations, and conclusions are exclusively the responsibility of the authors.
This research has been supported by the Hordaflom project (grant no. 269682).
This paper was edited by Pierre Francus and reviewed by Juan Pablo Corella and one anonymous referee.
Aalbu, J. H.: Vurdering av undersjøiske skred langs Vangsvatnet, Statens Vegvesen (Norwegian road authorities), 12, https://experience.arcgis.com/experience/1367a51b3cbc455ab0acfc9094b347c9 (last access: 29 May 2026), 2023.
Amundsen, H. and Dannevig, H.: Looking back and looking forward – adapting to extreme weather events in municipalities in western Norway, Reg. Environ. Change, 21, 108, https://doi.org/10.1007/s10113-021-01834-7, 2021.
Baker, V. R.: Palaeoflood hydrology in a global context, Catena, 66, 161–168, 2006.
Bakke, J., Lie, O., Nesje, A., Dahl, S. O., and Paasche, Ø.: Utilizing physical sediment variability in glacier-fed lakes for continuous glacier reconstructions during the Holocene, northern Folgefonna, western Norway, Holocene, 15, 161–176, 2005.
Bakke, J., Lie, Ø., Dahl, S. O., Nesje, A., and Bjune, A. E.: Strength and spatial patterns of the Holocene wintertime westerlies in the NE Atlantic region, Global Planet. Change, 60, 28–41, https://doi.org/10.1016/j.gloplacha.2006.07.030, 2008.
Berg, A.: Voss kyrkje, Kommunen, 206 pp., https://urn.nb.no/URN:NBN:no-nb_digibok_2014090108039 (last access: 29 May 2026), 1977.
Bjune, A. E., Bakke, J., Nesje, A., and Birks, H. J. B.: Holocene mean July temperature and winter precipitation in western Norway inferred from palynological and glaciological lake-sediment proxies, Holocene, 15, 177–189, https://doi.org/10.1191/0959683605hl798rp, 2005.
Blaauw, M. and Christen, J. A.: Flexible paleoclimate age-depth models using an autoregressive gamma process, Bayesian Analysis, 6, 457–474, https://doi.org/10.1214/11-BA618, 2011.
Blöschl, G., Hall, J., Viglione, A., Perdigão, R. A., Parajka, J., Merz, B., Lun, D., Arheimer, B., Aronica, G. T., and Bilibashi, A.: Changing climate both increases and decreases European river floods, Nature, 573, 108–111, 2019.
Blöschl, G., Kiss, A., Viglione, A., Barriendos, M., Böhm, O., Brázdil, R., Coeur, D., Demarée, G., Llasat, M. C., and Macdonald, N.: Current European flood-rich period exceptional compared with past 500 years, Nature, 583, 560–566, 2020.
Blott, S. J. and Pye, K.: GRADISTAT: A grain size distribution and statistics package for the analysis of unconsolidated sediments, Earth Surf. Proc. Land., 26, 1237–1248, 2001.
Bøe, A. G., Dahl, S. O., Lie, Ø., and Nesje, A.: Holocene river floods in the upper Glomma catchment, southern Norway: a high-resolution multiproxy record from lacustrine sediments, Holocene, 16, 445–455, https://doi.org/10.1191/0959683606hl940rp, 2006.
Bruel, R. and Sabatier, P.: serac: an R package for ShortlivEd RAdionuclide chronology of recent sediment cores, J. Environ. Radioactiv., 225, 106449, https://doi.org/10.1016/j.jenvrad.2020.106449, 2020.
Chen, M., Papadikis, K., and Jun, C.: An investigation on the non-stationarity of flood frequency across the UK, J. Hydrol., 597, 126309, https://doi.org/10.1016/j.jhydrol.2021.126309, 2021.
Cunderlik, J. M. and Burn, D. H.: Non-stationary pooled flood frequency analysis, J. Hydrol., 276, 210–223, 2003.
Dean, W. E.: Determination of Carbonate and Organic-Matter in Calcareous Sediments and Sedimentary-Rocks by Loss on Ignition – Comparison with Other Methods, J. Sediment. Petrol., 44, 242–248, 1974.
DNMI: Data from the Norwegian Meteorological Institute, https://klimaservicesenter.no (last access: 15 August 2024), 2024.
Engeland, K., Wilson, D., Borsányi, P., Roald, L., and Holmqvist, E.: Use of historical data in flood frequency analysis: a case study for four catchments in Norway, Hydrol. Res., 49, 466–486, 2018.
Engeland, K., Aano, A., Steffensen, I., Støren, E., and Paasche, Ø.: New flood frequency estimates for the largest river in Norway based on the combination of short and long time series, Hydrol. Earth Syst. Sci., 24, 5595–5619, https://doi.org/10.5194/hess-24-5595-2020, 2020.
Fang, B., Bevacqua, E., Rakovec, O., and Zscheischler, J.: An increase in the spatial extent of European floods over the last 70 years, Hydrol. Earth Syst. Sci., 28, 3755–3775, https://doi.org/10.5194/hess-28-3755-2024, 2024.
Fjellheim, H.: Rekonstruksjon av flommer i Vossovassdraget de siste tusen år, Unpublished master thesis, unpublished thesis, The University of Bergen, 2018.
Giovannelli, M. M. and Grydeland, I. Ø.: Prislappen på Hans, Norwegian School Of Economics, https://hdl.handle.net/11250/3184902 (last access: 29 May 2026), 2024.
Gjerdåker, J.: Ålmenn soge for Voss, Voss bygdeboknemnd, Voss, 375 pp., http://urn.nb.no/URN:NBN:no-nb_digibok_2010072008014 (last access: 29 May 2026), 1990.
Gjerde, M., Bakke, J., Vasskog, K., Nesje, A., and Hormes, A.: Holocene glacier variability and Neoglacial hydroclimate at Ålfotbreen, western Norway, Quaternary Sci. Rev., 133, 28–47, 2016.
Hanssen-Bauer, I., Førland, E., Haddeland, I., Hisdal, H., Lawrence, D., Mayer, S., Nesje, A., Nilsen, J., Sandven, S., and Sandø, A.: Climate in Norway 2100 – a knowledge base for climate adaptation, NCCS report, 1, 2017, https://www.miljodirektoratet.no/globalassets/publikasjoner/m741/m741.pdf (last access: 29 May 2026), 2017.
Hardeng, J., Bakke, J., Sabatier, P., Støren, E. W. N., and Van der Bilt, W.: Lake sediments from southern Norway capture Holocene variations in flood seasonality, Quaternary Sci. Rev., 290, 107643, https://doi.org/10.1016/j.quascirev.2022.107643, 2022.
Hardeng, J., Bakke, J., Cederstrøm, J. M., Forsmo, J., Haugen, T. A., Sabatier, P., Støren, E. W. N., and van der Bilt, W. G. M.: A 7000-year record of extreme flood events reconstructed from a threshold lake in southern Norway, Quaternary Sci. Rev., 331, 108659, https://doi.org/10.1016/j.quascirev.2024.108659, 2024.
Hardeng, J., Bakke, J., Cederstrøm, J. M., and Veste, M.: 10 000 years of snow avalanche activity in western Norway: a multiproxy lake sediment record from Lake Vatnasetvatnet, Hardanger, Clim. Past, 22, 265–286, https://doi.org/10.5194/cp-22-265-2026, 2026.
Hjelle, K. L., Hufthammer, A. K., and Bergsvik, K. A.: Hesitant hunters: a review of the introduction of agriculture in western Norway, Environ. Archaeol., 11, 147–170, 2006.
Holmqvist, E.: Flomberegninger i Vosso (062. Z), https://publikasjoner.nve.no/dokument/2003/dokument2003_01.pdf (last access: 29 May 2026), 2003.
Holmqvist, E.: Flomberegning for Vosso, 56–2015, https://publikasjoner.nve.no/rapport/2015/rapport2015_56.pdf (last access: 29 May 2026), 2015.
Johansson, F. E., Bakke, J., Støren, E. N., Paasche, Ø., Engeland, K., and Arnaud, F.: Lake sediments reveal large variations in flood frequency over the last 6,500 years in south-western Norway, Front. Earth Sci., 8, 239, https://doi.org/10.3389/feart.2020.00239, 2020.
Kanalkontoret: Kanalvæsenets Historie [s.n.], 536 pp., https://urn.nb.no/URN:NBN:no-nb_digibok_2014103124007 (last access: 29 May 2026), 1888.
Kindem, L.: Vossaboki, Bygdeboknemnda, 379 s. lfold.kart pp., https://www.nb.no/items/URN:NBN:no-nb_digibok_2008041004003 (last access: 29 May 2026), 1933.
Knutsen, H., Rye, S. K. P., Jenssen, E., Lund, P. O., Lerfald, M., and Bern, A.: Verdiskaping i landbruk og landbruksbasert industri i Vestland Oppdaterte berekningar basert på tal frå 2020, NIBIO Rapport, https://nva.sikt.no/registration/0198cc6485e7-894e636b-9f3d-4f1f-8c33-f9cbe3e9969f (last access: 29 May 2026), 2022.
Konstali, K. and Sorteberg, A.: Why has precipitation increased in the last 120 years in Norway?, J. Geophys. Res.-Atmos., 127, e2021JD036234, https://doi.org/10.1029/2021JD036234, 2022.
Kremer, K., Corella, J. P., Adatte, T., Garnier, E., Zenhäusern, G., and Girardclos, S.: Origin of turbidites in deep Lake Geneva (France–Switzerland) in the last 1500 years, J. Sediment. Res., 85, 1455–1465, 2015.
Kundzewicz, Z. W., Pińskwar, I., and Brakenridge, G. R.: Changes in river flood hazard in Europe: a review, Hydrol. Res., 49, 294–302, 2018.
Kvale, A. and Ingdahl, S.: Voss. Berggrunnskart; Voss; 13163; 1 : 50 000, trykt i farger, https://www.ngu.no/publikasjon/vossberggrunnskart-voss-13163-150-000-trykti-farger (last access: 29 May 2026), 1985.
Laskar, J., Robutel, P., Joutel, F., Gastineau, M., Correia, A. C., and Levrard, B.: A long-term numerical solution for the insolation quantities of the Earth, Astron. Astrophys., 428, 261–285, 2004.
Mæland, P. J.: Kvartærgeologiske studier i området mellom Granvin og Voss, The University of Bergen, https://nva.sikt.no/registration/0198f129a758-28d05c42-ec92-4882-836d-900539f22442 (last access: 29 May 2026), 1963.
Mangerud, J. and Skreden, S. A.: Fossil ice wedges and ground wedges in sediments below Till at Voss, western Norway, Norwegian J. Geol., 52, 71–96, 1972.
Mangerud, J., Hughes, A. L., Sæle, T. H., and Svendsen, J. I.: Ice-flow patterns and precise timing of ice sheet retreat across a dissected fjord landscape in western Norway, Quaternary Sci. Rev., 214, 139–163, 2019.
Nesje, A., Dahl, S. O., Matthews, J. A., and Berrisford, M. S.: A similar to 4500 yr record of river floods obtained from a sediment core in Lake Atnsjoen, eastern Norway, J. Paleolimnol., 25, 329–342, 2001a.
Nesje, A., Matthews, J. A., Dahl, S. O., Berrisford, M. S., and Andersson, C.: Holocene glacier fluctuations of Flatebreen and winter-precipitation changes in the Jostedalsbreen region, western Norway, based on glaciolacustrine sediment records, Holocene, 11, 267–280, 2001b.
Nesje, A., Bakke, J., Dahl, S. O., Lie, Ø., and Matthews, J. A.: Norwegian mountain glaciers in the past, present and future, Global Planet. Change, 60, 10–27, https://doi.org/10.1016/j.gloplacha.2006.08.004, 2008.
Nielsen, P. R., Dahl, S. O., Jansen, H. L., and Støren, E. N.: Holocene aeolian sedimentation and episodic mass-wasting events recorded in lacustrine sediments on Langøya in Vesterålen, northern Norway, Quaternary Sci. Rev., 148, 146–162, 2016.
NVE: Sildre hydrological data, https://sildre.nve.no/.PublisherisNorgesvassdrags-ogenergidirektorat (last access: 30 August 2024), 2024.
Øksnes, M.: Undersøking av forholdet mellom flaumstorleik og sediment i Vangsvatnet, The University of Bergen, https://nva.sikt.no/registration/0198f1621a84-59b8cba1-0778-4f0d-98ec-40cfcd0aa67b (last access: 29 May 2026), 2019.
Paasche, Ø. and Larsen, J.: Changes in lake stratification and oxygen distribution inferred from two contrasting records of magnetotactic bacteria and diatoms, J. Geophys. Res.-Biogeo., 115, https://doi.org/10.1029/2009JG001081, 2010.
Paasche, Ø. and Støren, E. W.: How does climate impact floods? Closing the knowledge gap, Eos, Transactions American Geophysical Union, 95, 253–254, 2014.
Paasche, Ø., Engeland, K., Støren, E. W. N., Bakke, J., Neby, S., Li, L., Gullestad, J., Knudsen, K. M., Ekblom Johansson, F., and Øksnes, M.: Hordaflom rapporten – Klima og flom, 25, https://hordaflom.norceresearch.no/forord/ (last access: 29 May 2026), 2021.
Pulg, U., Hauer, C., and Stranzl, S. F.: Potensial for naturbaserte løsninger ved flomrisikohåndtering i Vossovassdraget, LFI – Laboratorium for ferskvannsøkologi og innlandsfiske, https://nva.sikt.no/registration/0198cc42e26e-06a969bd-5943-4c56-938f-1d89664fc6d6 (last access: 29 May 2026), 2024.
Rapuc, W., Giguet-Covex, C., Bouchez, J., Sabatier, P., Gaillardet, J., Jacq, K., Genuite, K., Poulenard, J., Messager, E., and Arnaud, F.: Human-triggered magnification of erosion rates in European Alps since the Bronze Age, Nat. Commun., 15, 1246, https://doi.org/10.1038/s41467-024-45123-3, 2024.
Roald, L. A.: Flom i Norge, Tom & Tom, ISBN 9788292916155, 2013.
Romundset, A., Lohne, Ø. S., Mangerud, J., and Svendsen, J. I.: The first Holocene relative sea-level curve from the middle part of Hardangerfjorden, western Norway, Boreas, 39, 87–104, 2010.
Røthe, T. O., Bakke, J., and Støren, E. W. N.: Glacier outburst floods reconstructed from lake sediments and their implications for Holocene variations of the plateau glacier Folgefonna in western Norway, Boreas, 48, 616–634, 2019.
Sabatier, P., Moernaut, J., Bertrand, S., Van Daele, M., Kremer, K., Chaumillon, E., and Arnaud, F.: A review of event deposits in lake sediments, Quaternary, 5, 34, https://doi.org/10.3390/quat5030034, 2022.
Schillereff, D. N., Chiverrell, R. C., Macdonald, N., and Hooke, J. M.: Flood stratigraphies in lake sediments: A review, Earth-Sci. Rev., 135, 17–37, 2014.
Sigmond, E.: Odda. Berggrunnskart Odda M 1 : 250 000, trykt i farger, https://www.ngu.no/publikasjon/oddaberggrunnskart-odda-m-1250-000-trykt-ifarger (last access: 29 May 2026), 1998.
Sindre, E.: Kvartærgeologiske undersøkelser i området mellom Vossestrand og Nærøfjorden og tilgrensende fjellstrøk, The University of Bergen, https://nva.sikt.no/registration/0198f114872e-cb7facca-d52b-4020-9eb6-5fc6640f6c67 (last access: 29 May 2026), 1973.
Skreden, S. A.: Kvartærgeologiske undersøkelser i området Voss-Bolstadøyri samt Bordalen, The University of Bergen, https://nva.sikt.no/registration/0198f11e2ffa-4b2f8869-ec20-42ef-8a6b-64ce873ee800 (last access: 29 May 2026), 1967.
Šraj, M., Viglione, A., Parajka, J., and Blöschl, G.: The influence of non-stationarity in extreme hydrological events on flood frequency estimation, J. Hydrol. Hydromech., 64, 426–437, 2016.
Støren, E. N. and Paasche, Ø.: Scandinavian floods: From past observations to future trends, Global Planet. Change, 113, 34–43, 2014.
Støren, E. N., Dahl, S. O., and Lie, Ø.: Separation of late-Holocene episodic paraglacial events and glacier fluctuations in eastern Jotunheimen, central southern Norway, Holocene, 18, 1179–1191, https://doi.org/10.1177/0959683608096593, 2008.
Støren, E. N., Dahl, S. O., Nesje, A., and Paasche, Ø.: Identifying the sedimentary imprint of high-frequency Holocene river floods in lake sediments: development and application of a new method, Quaternary Sci. Rev., 29, 3021–3033, https://doi.org/10.1016/J.Quascirev.2010.06.038, 2010.
Støren, E. N., Kolstad, E. W., and Paasche, Ø.: Linking past flood frequencies in Norway to regional atmospheric circulation anomalies, J. Quaternary Sci., 27, 71–80, 2012.
Støren, E. W., Paasche, Ø., Hirt, A. M., and Kumari, M.: Magnetic and geochemical signatures of flood layers in a lake system, Geochem. Geophy. Geosy., 17, 4236–4253, 2016.
Vasskog, K., Nesje, A., Støren, E. N., Waldmann, N., Chapron, E., and Ariztegui, D.: A Holocene record of snow-avalanche and flood activity reconstructed from a lacustrine sedimentary sequence in Oldevatnet, western Norway, Holocene, 21, 597–614, https://doi.org/10.1177/0959683610391316, 2011.
Vasskog, K., Paasche, Ø., Nesje, A., Boyle, J. F., and Birks, H. J. B.: A new approach for reconstructing glacier variability based on lake sediments recording input from more than one glacier, Quaternary Res., 77, 192–204, https://doi.org/10.1016/J.Yqres.2011.10.001, 2012.
Vingerhagen, S.: Flomsonekart Delprosjekt Voss, https://publikasjoner.nve.no/eksternrapport/2020/eksternrapport2020_13.pdf (last access: 29 May 2026), 2020.
Wilhelm, B., Amann, B., Corella, J. P., Rapuc, W., Giguet-Covex, C., Merz, B., and Støren, E.: Reconstructing Paleoflood Occurrence and Magnitude from Lake Sediments, Quaternary, 5, 9, https://doi.org/10.3390/quat5010009, 2022.