the Creative Commons Attribution 4.0 License.
the Creative Commons Attribution 4.0 License.
 | 10 Apr 2025
Pattern scaling of simulated vegetation change in northern Africa during glacial cycles
Mateo Duque-Villegas
Martin Claussen
Thomas Kleinen
Jürgen Bader
Christian H. Reick
Over the last hundreds of millennia, natural rhythms in Earth's astronomical motions triggered large-scale climate changes and led periodically to humid conditions in much of northern Africa. Known as African Humid Periods (AHPs), such times sustained vast river networks, vegetation, wildlife, and prehistoric settlements. The mechanisms, extent, and timing of the changes remain poorly constrained. Although AHPs along glacial cycles are recognizable in marine sediment records, the related land cover changes are difficult to reconstruct due to the scarcity of proxy data over the continent. Moreover, most available information covers only the latest AHP during the Holocene. Here we use a comprehensive Earth system model to look at additional, much earlier, possible cases of AHPs. We simulate the full last glacial cycle, aiming to reproduce the last four AHPs as seen in available proxies. The simulated AHPs seem in broad agreement with geological records, especially in terms of timing and relative strength. We focus on the simulated vegetation coverage in northern Africa, and we detect a dominant change pattern that seems to scale linearly with known climate forcing variables. We use such scaling to approximate northern African vegetation fractions over the last eight glacial cycles. Although the simple linear estimation is based on a single mode of vegetation variability (that explains about 70 % of the variance), it helps to discuss some broad-scale spatial features that had only been considered for the Holocene AHP. Extending the climate simulation several millennia into the future reveals that such (palaeo-based) pattern scaling breaks when greenhouse gases (GHGs) become a stronger climate change driver.
- Article
(5685 KB) - Full-text XML
- BibTeX
- EndNote


Broad swings in environmental conditions over northern Africa have happened for at least the last 11 million years (Crocker et al., 2022). What is today the hyper-arid Sahara was formerly at times a much wetter region, adequate for sustaining perennial water bodies and vast expanses of vegetation cover that significantly reduced dust output to surrounding areas (Gasse, 2000; deMenocal et al., 2000). Such times, also known as African Humid Periods (AHPs), were recorded as quasi-periodic intervals of enhanced moist conditions in regional geological archives (Grant et al., 2017, 2022). Humid climates set in, along with changes in the land surface, which, via feedback loops, amplified the effects of changes in the Earth's orbit on the distribution of incoming solar radiation (Claussen et al., 2017; Pausata et al., 2020). The extent and timing of the changes remain uncertain due to proxy data limitations (Yacoub et al., 2023), while understanding of the causes and mechanisms is incomplete, as evinced in persistent discrepancies between existing geological records and climate simulations (Brierley et al., 2020).
The Holocene interglacial had the best-known case of an AHP, spanning roughly 11.7 to 4.2 ka (ka is thousands of years ago) (Claussen et al., 2017). Evidence collected for this period around northern Africa revealed the changes in past lake highstands (Lézine et al., 2011), river networks (Drake et al., 2011), dust fluxes (McGee et al., 2013), vegetation cover (Hély et al., 2014), and rainfall (Tierney et al., 2017b). In addition, numerical climate models were able to reproduce some of these changes during the Holocene AHP and hinted at basic mechanisms underpinning AHP dynamics (Claussen et al., 2017). Proxy data and models spurred an interesting debate that highlighted the spatial and temporal complexities of an AHP, since spatial heterogeneity resulted in marked differences in localized rates of change and asynchronous AHP termination across northern Africa (Brovkin and Claussen, 2008; Shanahan et al., 2015; Dallmeyer et al., 2020). Nevertheless, what happened before the Holocene and how known mechanisms played a role in even deeper times is relatively unknown. Repeated climate and land cover changes prevented the preservation of geological records older than the Holocene over land (Drake et al., 2018), while the costs of complexity and spatial and temporal resolutions limited in many cases the reach of simulations with comprehensive climate models (Tierney et al., 2020a).
What is known about pre-Holocene AHPs is mainly informed by signals recorded in marine sediments off the northern African coastline. Marine proxies, combined with the few surviving terrestrial signatures, and taking the Holocene AHP as a baseline, make it possible to examine the cases of AHPs along glacial cycles (Blome et al., 2012; Drake et al., 2013; Larrasoaña et al., 2013; Scerri et al., 2014). For instance, the multiple lines of geological evidence suggest that the previous interglacial during Marine Isotope Stage (MIS) 5e, around 127 ka, most likely had a much stronger AHP than the Holocene, in agreement with modelling results about the influence of changes in Earth's orbit. Likewise, marine proxies from around northern Africa show other potential AHPs during the last few glacial cycles (e.g. Rossignol-Strick, 1983; Ehrmann and Schmiedl, 2021a). However, limitations in projecting marine proxy signals far inland, compounded with scant terrestrial sources, restrict our understanding about the amplitude of northern African climate variability and AHP development. A clear outline of AHP changes is crucial to explain, for instance, regional geomorphology (Drake et al., 2022), ecological corridors during hominin evolution (Scerri et al., 2018), and long-term climate–land surface interactions (Pausata et al., 2020).
Climate models offer a theoretical window into possible spatial patterns of AHPs. For instance, early experiments with an atmosphere-only model already coarsely simulated four AHPs since 150 ka (Prell and Kutzbach, 1987), as many as indicated by marine proxies. However, modelling long glacial cycles to include multiple AHPs requires a compromise between model complexity, simulation length, and spatial resolution, which hinders the amount of detail that can be reproduced and evaluated. Studies that kept relatively complex models and higher spatial resolutions chose to either simulate discontinuous time slices (Singarayer and Burrough, 2015) or accelerate climate forcing rates (Kutzbach et al., 2008, 2020), in both cases reducing the effects of high-frequency variability. Other studies opted for intermediate-complexity models and large grid spacings to focus mostly on temporal patterns of average changes of AHPs (e.g. Tuenter et al., 2003; Tjallingii et al., 2008; Menviel et al., 2021). Although simulations broadly agreed with trends in the proxy records, underestimation of Saharan shrinking during AHPs and the associated rainfall increase is a consistent problem across models, leading us to question current understanding on the mechanisms and scale of the changes. Simulating a full glacial cycle with interactive climate and vegetation components at higher spatial resolution may reveal dominant AHP patterns underlying geological records or behind data–model mismatches.
We use the comprehensive Max Planck Institute for Meteorology Earth System Model (MPI-ESM; Giorgetta et al., 2013) to perform a transient global climate simulation since 134 ka at an affordable spatial resolution in order to see subcontinental changes in the vegetation cover of northern Africa. The main goal is to find general trends in simulated patterns during AHPs of the last glacial cycle. We evaluate the vegetation cover of different AHP responses and relate it explicitly with the large-scale climate drivers: (1) Earth's orbital parameters, (2) radiative effects of levels of atmospheric greenhouse gases (GHGs), and (3) high-latitude ice sheets. These drivers are known to set multiple controls on localized rain-bringing mechanisms (Dallmeyer et al., 2020; Blanchet et al., 2021), which could lead to diverse AHP biogeographies. Assuming local environments always reacted similarly to climate forcing, it is possible for AHP vegetation patterns to be approximated as a function of known forcing values. In addition, we also simulate and briefly assess the potential future evolution of northern African vegetation. In the following sections we describe the climate model, explain the experimental setup, present results focused on northern African vegetation cover during AHPs, and discuss the possibility of a forcing-based pattern scaling.
2.1 Model description
We use version 1.2 of MPI-ESM (Mauritsen et al., 2019). The model couples dynamical components representing the general circulations of the atmosphere (ECHAM6.3; Stevens et al., 2013) and ocean (MPIOM1.6; Jungclaus et al., 2013), along with changes in the land surface and vegetation cover (JSBACH3.2; Reick et al., 2013). The standard release of this model version participated in the Coupled Model Inter-comparison Project Phase Six (CMIP6; Eyring et al., 2016). Implementation of the coarse-resolution setup, T31GR30 (about 3.75° horizontally), with 31 atmospheric and 40 oceanic levels, enables long climate simulations at a maximum of about 700 simulated years per day (Mikolajewicz et al., 2018). Simulations covering several glacial cycles require updates during the runtime of the land–sea mask, glacier mask, and river routing that align with reconstructions of ice-sheet and sea-level changes. This is done once every decade, as described in Meccia and Mikolajewicz (2018) and Riddick et al. (2018). The specific model setup is actively maintained and performs well within the range of current general circulation models (Kapsch et al., 2022).
How the model computes natural vegetation cover is particularly relevant for this study. A detailed description is given in Reick et al. (2013), and a performance assessment is given in Brovkin et al. (2013). Briefly, the model uses a “mosaic” approach, where each land surface grid cell is tiled to be occupied by fractions of predefined plant functional types (PFTs). PFTs include eight cover classes between woody (tropical and extra-tropical trees plus shrubs) and herbaceous (C3 and C4 grasses) vegetation, each with different turnover timescales. When one vegetation type dies via natural causes (age) or via disturbances (fire or windthrow), the “void” it leaves is filled (or “colonized”) by the growth of the most competitive PFT in terms of net primary productivity (NPP), which is a function of climate and atmospheric CO2. Seeds for all PFTs are assumed to be universally present. Fractions of PFTs can only occupy the portion of a grid cell that is hospitable for growth, which is determined based on having sufficiently productive (NPP) vegetation over consecutive years. The distribution of inhospitable fractions across the globe corresponds to hot and cold deserts. Vegetation cover in the model has immediate effects on the exchange processes between land surface and the atmosphere, which can subsequently alter climate patterns and feedback on vegetation (Brovkin et al., 2009).
2.2 Experiments
We simulate a transient Earth system response to prescribed forcing for the last 134 kyr (kyr is thousand years as in duration), almost entirely as a single continuous run (120 to 0 ka), except for a 14 kyr interval spliced a posteriori to extend analysis until 134 ka (details about splicing are in Appendix A). Earth's orbital parameters are computed from Berger (1978). Atmospheric levels of GHGs (CO2, CH4, and N2O) are taken from the ice core record compilation of Köhler et al. (2017) and are updated every 10 model years as decadal means. Ice sheets from the GLAC-1D dataset (Tarasov and Peltier, 2002; Tarasov et al., 2012, 2014; Briggs et al., 2014; Abe-Ouchi et al., 2013) are interpolated spatially and temporally to suit model resolution and are also prescribed at decennial time steps, with corresponding adjustments in topography, bathymetry, and river routing (Meccia and Mikolajewicz, 2018; Riddick et al., 2018). Details about the GLAC-1D dataset extension until before the last interglacial are given in Menviel et al. (2019).
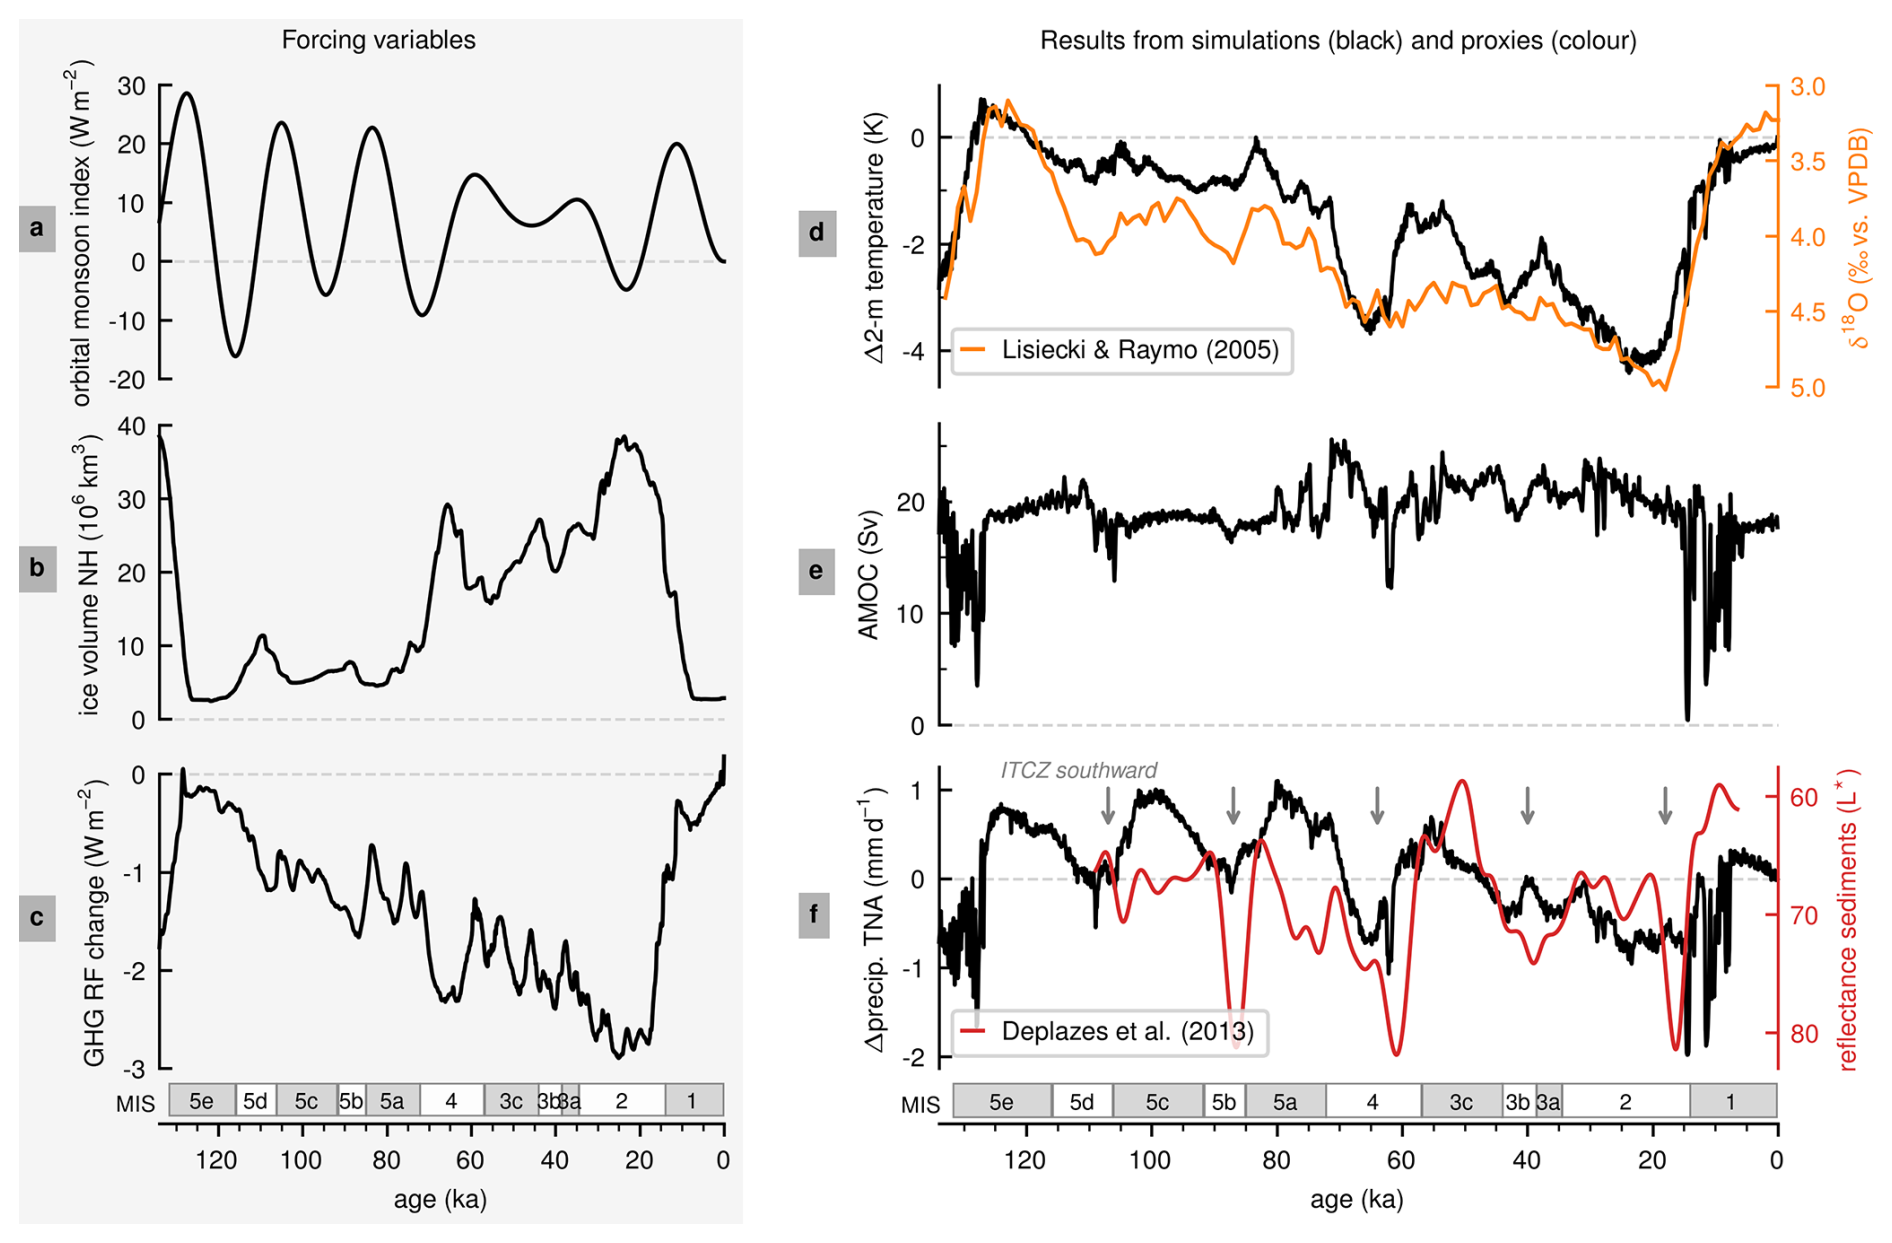
Figure 1Transient simulation of the last glacial cycle. Forcing variables (left) represent prescribed conditions driving the experiment: (a) orbital parameters following Berger (1978) are shown using the orbital monsoon index of Rossignol-Strick (1983), (b) ice sheets from the GLAC-1D dataset (references in main text) are shown with the total ice volume in the Northern Hemisphere (NH), and (c) greenhouse gases (GHGs) from Köhler et al. (2017) are shown as radiative forcing (RF) changes from the pre-industrial (PI) era. Simulation results compared with proxy records (right): (d) changes in global mean near-surface temperature relative to the PI, compared to isotopic data from Lisiecki and Raymo (2005a); (e) Atlantic meridional overturning circulation (AMOC) in the Atlantic Ocean (1000 m depth, basin mean at 26° N); and (f) changes in precipitation in the Tropical North Atlantic (TNA; defined in the main text) compared to marine sediment reflectance (L∗; smoothed with a third-order low-pass Butterworth filter with a cutoff frequency of kyr−1) data from Deplazes et al. (2013a), both related to shifts in the Intertropical Convergence Zone (ITCZ). We include labels for marine isotope stages (MISs) according to Railsback et al. (2015).
Figure 1 (left) compiles a set of variables directly linked to forcing factors: orbitally driven changes in low-latitude insolation in terms of the so-called orbital monsoon index (Fig. 1a), the Northern Hemisphere total volume of ice sheets (Fig. 1b), and the GHG radiative forcing change relative to the pre-industrial (PI) era (1850 CE; Fig. 1c). The monsoon index of Rossignol-Strick (1983) is an insolation difference between the Northern Tropic (23.4° N) and the Equator during the caloric summer season defined by Milankovitch (1941). Changes in the radiative forcing of GHGs are based on an “equivalent-CO2 concentration” explained in Ganopolski et al. (2010). We ignore any land use, and atmospheric aerosols remain at pre-industrial values (Kinne et al., 2013). Figure 1 also includes MIS labels according to Railsback et al. (2015), which we use throughout the text simply to refer to approximate ages of the late Quaternary when an AHP may have occurred.
Additionally, we run two transient experiments 10 kyr into the future. In both, the ice sheets remain unchanged from present-day conditions, while the orbital forcing continues to change according to Berger (1978). Such an approximation for the ice sheets is based on the study of Ganopolski et al. (2016), where they suggest no substantial changes are expected within the next several millennia. For GHG concentrations, we choose two alternative Shared Socioeconomic Pathway (SSP) scenarios from the Sixth Assessment Report (AR6) of the Intergovernmental Panel on Climate Change (IPCC): SSP1-1.9 and SSP3-7.0 (IPCC, 2023). The two scenarios are selected simply as contrasting cases of potential future GHG dominance. The GHG data for these scenarios come from Meinshausen et al. (2020) until the year 2500 CE, and data from 2500 CE onwards come from the previous modelling output of Brovkin et al. (2012), similarly to Kleinen et al. (2021).
We average the simulation results as annual means at centennial scale. In the following sections, we present our results firstly from a simulated global context, and then we focus on the past and future of AHPs. We analyse the simulated AHPs of the last glacial cycle and develop a pattern-scaling approach that is also useful for exploring much older AHPs of the late Quaternary. Then we look at simulated future AHPs and how they compare to the pattern-scaling method. Whenever possible, we compare model output to proxy results and insights from previous modelling experiences.
3.1 Earth system response
Figure 1 (right) shows some globally relevant mean climate variables. Global climate is the warmest during the MIS 5e interglacial around 127 ka (Fig. 1d). About 0.7 K warmer than simulated pre-industrial temperature, the last interglacial warming matches proxies in the sign of change, but the amount could be underestimated by up to 1.3 K (Turney et al., 2020), similarly to other climate models (Lunt et al., 2013; Otto-Bliesner et al., 2021). Minimum average temperature occurs during the Last Glacial Maximum (LGM) around 24 ka, roughly 4.4 K colder than during the PI, which is not far from recent estimates ranging from 5 to 7 K (Tierney et al., 2020b; Osman et al., 2021). The amplitude and timing of temperature changes seem in agreement with the isotopic data from Lisiecki and Raymo (2005a).
Ocean dynamics maintain an Atlantic meridional overturning circulation (AMOC) around 19 Sv (Fig. 1e), including millennial-scale fluctuations related to freshwater input from glacier run-off as the ice sheets change. The strongest AMOC variability occurs during late deglaciation phases around 130–128 and 15–9 ka. The last deglaciation includes an especially strong meltwater pulse around 14.4 ka that nearly collapses the AMOC in the simulation (Kleinen et al., 2023). After this meltwater pulse, the remainder of the simulation includes some unexpected AMOC variability during the early Holocene. The amplitude of this early Holocene AMOC variability is not represented in the meltwater release from the ice-sheet reconstruction, and it was not seen in previous deglaciation experiments with the same model (e.g. Kapsch et al., 2022; Kleinen et al., 2023). In our simulation, it appears to be related to a slight difference in the initial conditions of ocean volume that results in some shallow regions in the Arctic Ocean. The AMOC changes are associated with drops in global temperature and in precipitation in the tropics (see Fig. 1d and f).
As a proxy for large-scale circulation changes in the atmosphere, we also show in Fig. 1f the simulated precipitation changes in the Tropical North Atlantic (TNA; 10 to 20° N, 80 to 20° W), where changes are coupled to movements in the average position of the Intertropical Convergence Zone (ITCZ). Unlike global temperature, these changes follow more closely the oscillations of the orbital monsoon index, and the timing of the minima of precipitation (when the ITCZ is southernmost) broadly agrees with the Cariaco Basin record of Deplazes et al. (2013a). The Cariaco Basin record shows total reflectance values of dark/light segments in a sediment core extracted off the coast of Venezuela which relate to rather enhanced (low L*) or rather suppressed (high L*) rainfall rates and hence tracked displacements of the ITCZ (Deplazes et al., 2013a). However, the simulation is slightly out of phase with the proxy record, and not all excursions from mean values match, probably because of regional- or local-scale signals in the data and the issues in smoothing both time series.
3.2 African Humid Periods
3.2.1 Timing and strength
Marine sediments off the coast of northern Africa reveal four AHPs in the last 134 kyr (Fig. 2a–d). AHPs appear as times of pronounced depletion of deuterium (D) ratios in leaf waxes from around eastern Africa (Tierney et al., 2017a) as a result of increased rainfall (Fig. 2a). AHPs can also be seen as times of reduced Saharan dust output to the Atlantic Ocean (Skonieczny et al., 2019) and Mediterranean Sea (Ehrmann and Schmiedl, 2021a) because increased soil-stabilizing vegetation cover restricted dust deflation (Fig. 2b, c). Likewise, during AHPs, increased river discharge into the Mediterranean stratified seawater and promoted the formation of sapropel bands (Fig. 2d). In spite of notable differences in location and methods amongst proxy records, AHPs stand out rather consistently.
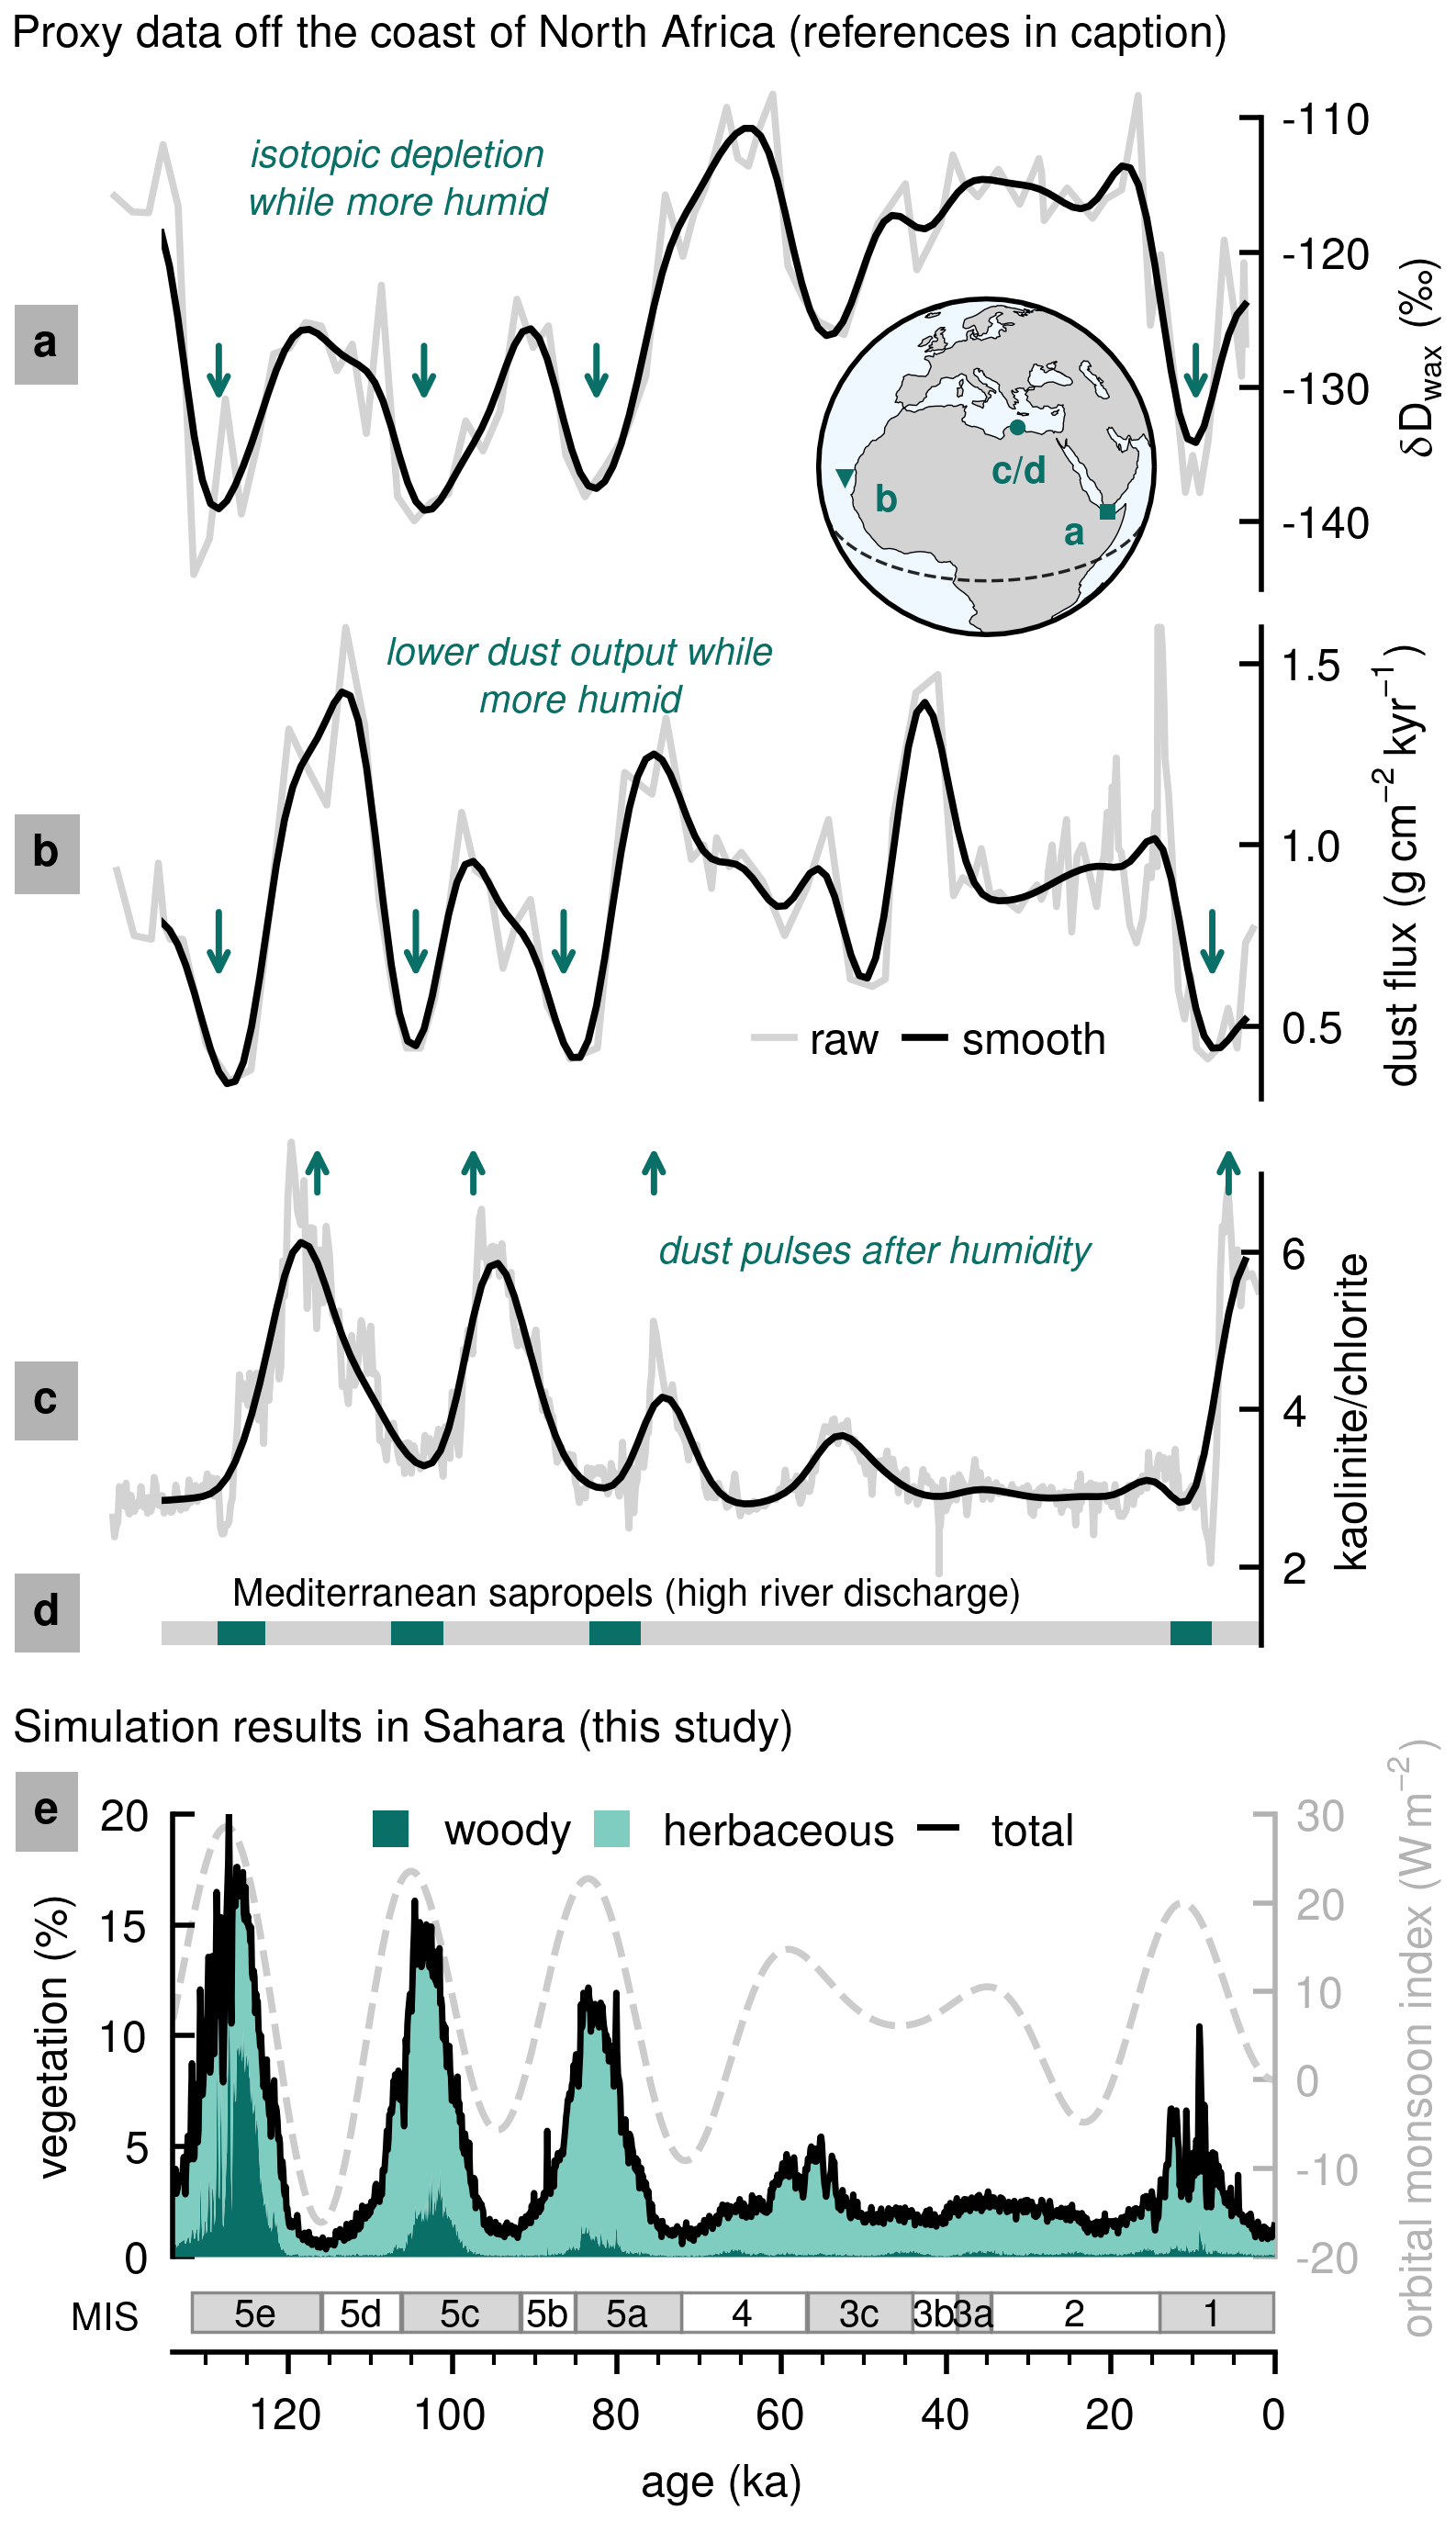
Figure 2Northern African climate in the last glacial cycle as seen in (a–d) marine proxies offshore and (e) average simulated vegetation coverage (woody, herbaceous, and total) in the Sahara (defined in main text). Proxy data (grey) are interpolated evenly at 1 kyr resolution and smoothed (black) with a third-order low-pass Butterworth filter with a cutoff frequency of kyr−1: (a) deuterium ratio changes (δD) in terrestrial plant lipids (wax) in core RC09-166 near eastern Africa (Tierney et al., 2017a); (b) 230Th-normalized Saharan dust flux into the Atlantic Ocean according to core MD03-2705 near western Africa (Skonieczny et al., 2019); and (c) influx of fine-sized dust to the eastern Mediterranean Sea according to the ratio of kaolinite and chlorite minerals in core SL99, with (d) its sapropel sequence (Ehrmann and Schmiedl, 2021a). In panel (e), we also show a secondary y axis with the orbital monsoon index. Proxy sites are shown in an inset globe.
Focusing on the kaolinite/chlorite proxy (Fig. 2c), it reveals details about the intensity of the AHPs, according to the amplitude of dust pulses, which depends on the degree of (rain-fed) weathering that accumulates the kaolinite mineral in water bodies while an AHP is active (Ehrmann et al., 2017). Accordingly, in Fig. 2c, the AHP of MIS 5e stands out clearly as the strongest (largest dust pulse around 118 ka), while the estimated magnitude of other AHPs based on kaolinite/chlorite has been indicated to vary with the core-to-shore distance (Ehrmann and Schmiedl, 2021a).
Figure 2e shows simulation results of total vegetation fraction in the Sahara (20–30° N, 20° W–25° E). The simulation appears well in phase with trends in the geological records. We find four AHP-like changes in northern African climate, seen as large peaks in average Saharan vegetation. The vegetation peaks track the orbital monsoon index but with a small lag of about 1 kyr, which is longer than required for the vegetation to expand over the region. Most of this lag probably appears because the orbital monsoon index is tied to the summer season only and to the Northern Tropic (23.4° N), while the simulated vegetation response is also affected by what happens in the extra-tropics, not only in the summer but also during the winter season. Saharan vegetation peaks happen sometime between peak boreal summer temperatures and mild boreal winter temperatures.
Simulated AHPs also appear as times of herbaceous cover expansion and woody-type invasion of the Sahara. The AHP of MIS 5e is the strongest event with more than 15 % Saharan vegetation cover, followed by two weaker AHPs during MIS 5c and 5a (around 103 and 83 ka, respectively), both clearly over 10 % total vegetation fraction. In the simulation, the Holocene has the weakest AHP, barely approaching 10 % of vegetation in the Sahara. Such a weak Holocene AHP is unexpected according to previous applications of the same model to the last deglaciation (e.g. Dallmeyer et al., 2022).
In our simulation, the Holocene climate is unexpectedly largely affected by pronounced AMOC variability (see Fig. 1e), whose amplitude is greater than prescribed with the ice-sheet reconstruction changes (unlike MIS 5e, where AMOC fluctuations are according to ice-sheet changes). The large AMOC fluctuations appear connected with a small ocean volume difference in the initial conditions of the experiment. To diagnose the weak Holocene AHP, we include Appendix B, where we show the global climate anomalies with respect to pre-industrial temperature and precipitation. The effects of the AMOC variability are clearly seen in the early Holocene having a much colder North Atlantic region (Fig. B1f). This ensures that the ITCZ and related rain bands move southward and explains the anomalously weak Holocene AHP (see Tjallingii et al., 2008).
Nevertheless, the strength of AHPs in Fig. 2e is meant only relative to other AHPs, since an overall Sahara greening below 20 % is still substantially less than previous estimates from intermediate-complexity models (e.g. Menviel et al., 2021; Duque-Villegas et al., 2022) and less than estimates from the same model but implemented at higher spatial resolution (Dallmeyer et al., 2020). In Appendix C, there is a brief comparison of the simulated climate around the present day (mean values for 1990–2020 CE) with current observational products. We find the model simulates less vegetation in the Sahel (despite neglecting land use in the simulation) and is overall much drier (about 1 mm d−1) over northern Africa than inferred from the observational data. Explaining the mismatch between different-complexity models or why there is a dry bias in the model at this spatial resolution is beyond the scope of this work; thus we focus on relative changes rather than absolute values.
3.2.2 Vegetation patterns
The intensity of an AHP should also manifest in the spatial extent of changes in vegetation coverage. Figure 3 shows maximum vegetation cover fraction in northern Africa during AHPs and changes from the PI. In this case, AHP values are selected from time slices around the vegetation optimum in the Sahara (see guide in figure). It is important to note that it is not trivial to define AHPs for the whole northern Africa, since it is a large region that responds with spatiotemporal heterogeneity (see Dallmeyer et al., 2020). For this reason, we show maximum values that may happen at different times (a few centuries earlier or later) for different sites (grid points) within an AHP time slice. Spatial heterogeneity leads to an interesting distinction about the changes in Fig. 3 between areas that are already “green” for pre-industrial conditions (like below the Sahel), which become “greener” during AHPs, and areas that are barren at the PI which turn “green” during AHPs (like in the Sahara).
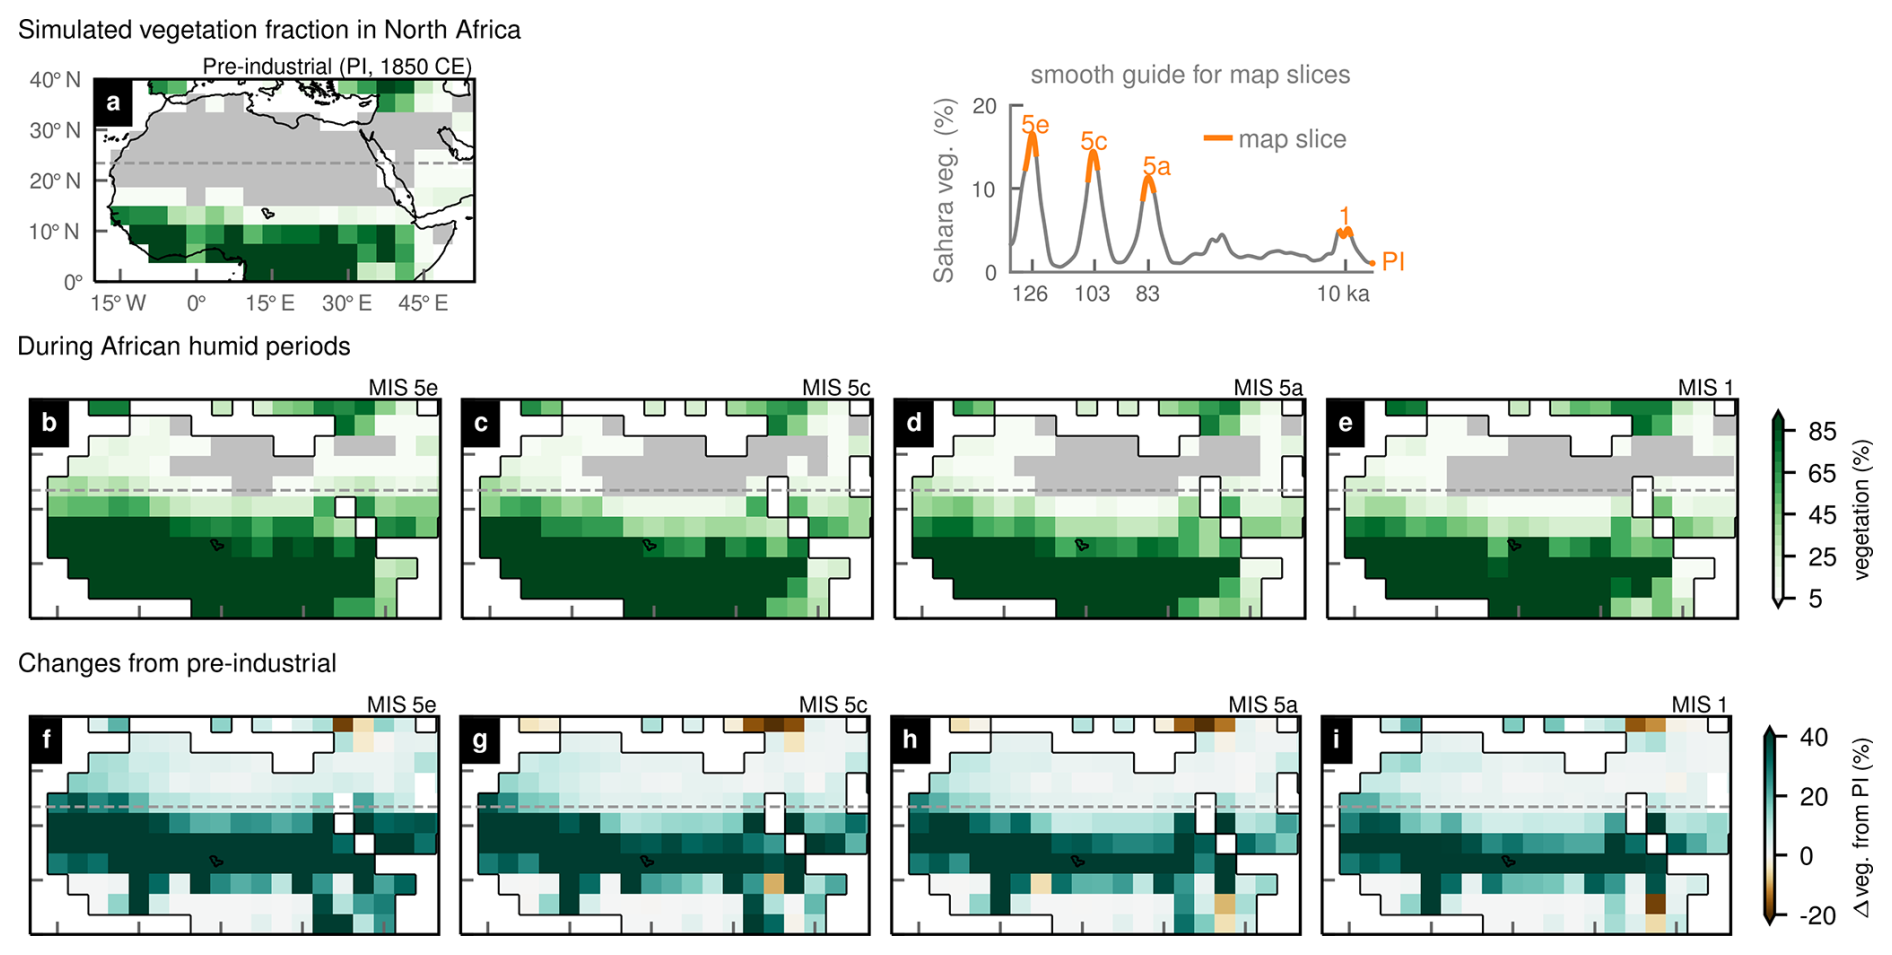
Figure 3Northern African vegetation coverage. (a–e) Maximum vegetation coverage during the pre-industrial (PI) era and AHPs and (f–i) the relative changes from the PI. A time series inset (top right) has marine isotope stage (MIS) labels to highlight mapped AHP time slices spanning about 4 kyr. On the maps, a horizontal line shows the Northern Tropic (23.4° N). Only the PI map shows modern coastlines, while others show the coastlines according to reconstructed sea-level changes. Lake Chad is shown in all maps as a point of reference.
Pre-industrial conditions in the simulation (Fig. 3a) already seem to underestimate zonal patterns of vegetation (like present-day dry bias in Appendix C), resulting in little vegetation in the Sahel (around 15° N) and an exaggerated Dahomey Gap (dividing the coast of Guinea) that is much less conspicuous in higher-resolution versions of the same climate model (e.g. Bathiany et al., 2014). During AHPs, there is a continent-wide increase in vegetation, closely approaching the Northern Tropic (23.4° N) and effectively shrinking the Sahara (Fig. 3b–e). The largest changes occur around the Sahel, within 10 to 20° N, with increases of over 40 % (Fig. 3f–i). The smallest changes seem to be cornered in the northeastern Sahara. Near the Equator, in places where there is already close to 100 % vegetation cover under pre-industrial forcing, there are also small or no changes during AHPs.
AHP patterns in Fig. 3b–e seem to become weaker sequentially, having the most intense changes during the AHP of MIS 5e on the left, followed by two relatively weaker intermediate cases, and ending with the mildest AHP case during the Holocene (around 10 ka during MIS 1) on the right. Most apparent is the fading of intense changes around the Sahel and a less pronounced northward push along the west coast. Such step-wise (ignoring long time gaps between AHPs) weakening of AHPs is also evident in the average vegetation fraction in the Sahara (see Fig. 2e). Incremental change occurs in the same direction as the orbital forcing (see Fig. 1a), thereby suggesting the possibility of a linear scaling of a baseline pattern with climate forcing variables. In the following section, we explore such a linear relationship for vegetation cover fractions.
3.3 Spatiotemporal analysis
AHPs seem quasi-periodic in response to natural rhythms of the Earth system. Possibly, there are preferred modes (patterns) of AHP variability (i.e. climate and biogeographies) that regularly appeared in the past during AHP development. In such cases, it may be assumed that the broadest patterns would tend to scale proportionally to large-scale climate forcing conditions. We investigate this possibility of pattern scaling in the simulated vegetation fractions in northern Africa during the last glacial cycle, with the main focus on the potential to capture with this method the simulated AHP patterns of Fig. 3.
We find a baseline pattern of northern African vegetation cover variability with an analysis of empirical orthogonal functions (EOFs) and their related principal components (PCs) for the entire last glacial cycle. In the analysis, the AHPs are simply the cases of maximum possible vegetation coverage. For this, we construct a covariance matrix with changes from the PI of annual maximum vegetation cover fraction for grid cells inside northern Africa (m=126) at centennial temporal resolution (n=1340). The covariance matrix (126×1340) is centred about its mean to remove trends and is factorized with a singular value decomposition to obtain its eigenvectors ordered according to explained variance. After decomposition we use only the first eigenvector (EOF1), which, together with its corresponding time series (PC1), explains the greatest variability.
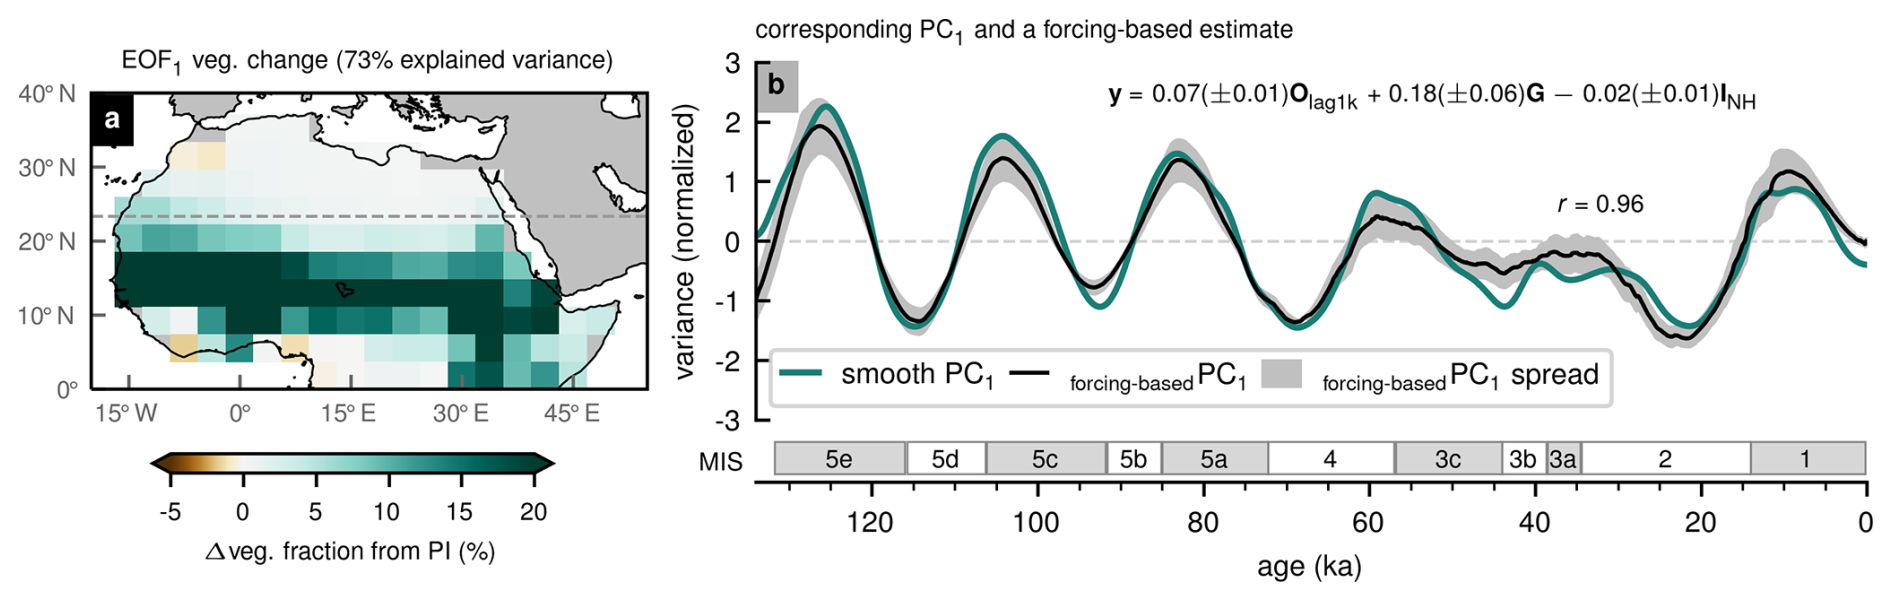
Figure 4EOF analysis of northern African changes in vegetation fraction from the pre-industrial (PI) era: (a) leading variability mode (EOF1) and (b) corresponding PC1 time series scaled to unit variance. PC1 is smoothed with a third-order low-pass Butterworth filter with a cutoff frequency of kyr−1. Panel (b) also includes a forcing-based estimate for the smooth PC1 (central trend and spread due to uncertainty of regression parameters in parentheses) whose linear regression model equation is shown, where Olag1k is the orbital forcing monsoon index lagged 1 kyr (cf. lag in Fig. 2e), G stands for the GHG radiative forcing change from the PI, and INH is the ice-sheet volume in the Northern Hemisphere. Modern coastlines are shown in panel (a).
Figure 4 shows the results of the EOF analysis. The dominant pattern of variability (EOF1) explains about 73 % of the variance in vegetation fraction changes (Fig. 4a). It is a mostly zonally coherent pattern with an action centre largely inside 10–20° N. Near eastern Africa, the pattern adopts a more meridional structure between 30 and 45° E. According to its corresponding PC1 (smoothed in Fig. 4b), this mode is related to uniform changes in vegetation fraction with respect to pre-industrial conditions, which are positive and of great amplitude usually during warm interstadials (shaded MIS boxes). PC1 also seems in phase with the orbital forcing monsoon index (compare Fig. 1a). The phasing with the monsoon index is a good indicator of the possibility of estimating PC1 as a function of external climate forcing.
Figure 4b also shows a linear model that combines the orbital monsoon index (lagged 1 kyr and symbolized as Olag1k), the GHG radiative forcing (symbolized as G), and the Northern Hemisphere ice-sheet volume (symbolized as INH). The model is fit to the smooth PC1 using an ordinary least-squares method. We choose to lag the orbital monsoon index as a predictor because of the lag in the vegetation peaks explained in Sect. 3.2.1. Fitting is done several times in different parts of the time series, using a sliding (every 10 kyr) window of 63 kyr (about three precession cycles), which explains the uncertainty in the regression parameters.
Overall, the linear model (forcing-basedPC1 in Fig. 4b) estimates a similar trend to the smooth PC1, with some uncertainty in the parameters that leads to some spread. It is possible that other more complicated fits could reproduce the smooth PC1 pattern better, or with less spread, but we restrict our analysis to the simplest fit. In the linear equation, it is interesting to note that, for the last glacial cycle, the standard deviation of Olag1k is close to 10.1 W m−2, while that of G is around 0.8 W m−2 and that of INH is around 11.0× 10⁶ km3. Multiplying these values by the absolute value of their respective fit parameters (0.07, 0.18, and 0.02), it shows that orbital, GHG, and ice-sheet variables influence about 66 %, 13 %, and 21 %, respectively, of the outcome of the linear model. The dominance of the orbital forcing is likewise clearly visible in the oscillating shape of the linear fit. The fitting seems to perform most poorly after 60 ka, when the orbital forcing becomes much weaker.
3.4 Pattern scaling
We can use the results of the previous section to obtain forcing-based estimates of the vegetation changes (relative to the PI) in northern Africa. Our method resembles a pattern scaling, where an invariant spatial pattern is assumed to scale linearly with a known forcing factor. The relationship to the climate forcing is based on the curve fit to the smooth PC1 time series in Fig. 4b, using the linear sum of the orbital monsoon index (lagged 1 kyr), GHG radiative forcing, and Northern Hemisphere ice-sheet volume. Because of the use of the principal component time series, another name for this method is also principal component emulator (Wilkinson, 2010), which has also been used before in palaeoclimate modelling contexts (e.g. Holden et al., 2019). Using EOF1 and forcing-basedPC1, we can approximate mean vegetation changes having forcing variables as predictors. We are especially interested in estimating the mean changes during AHPs.
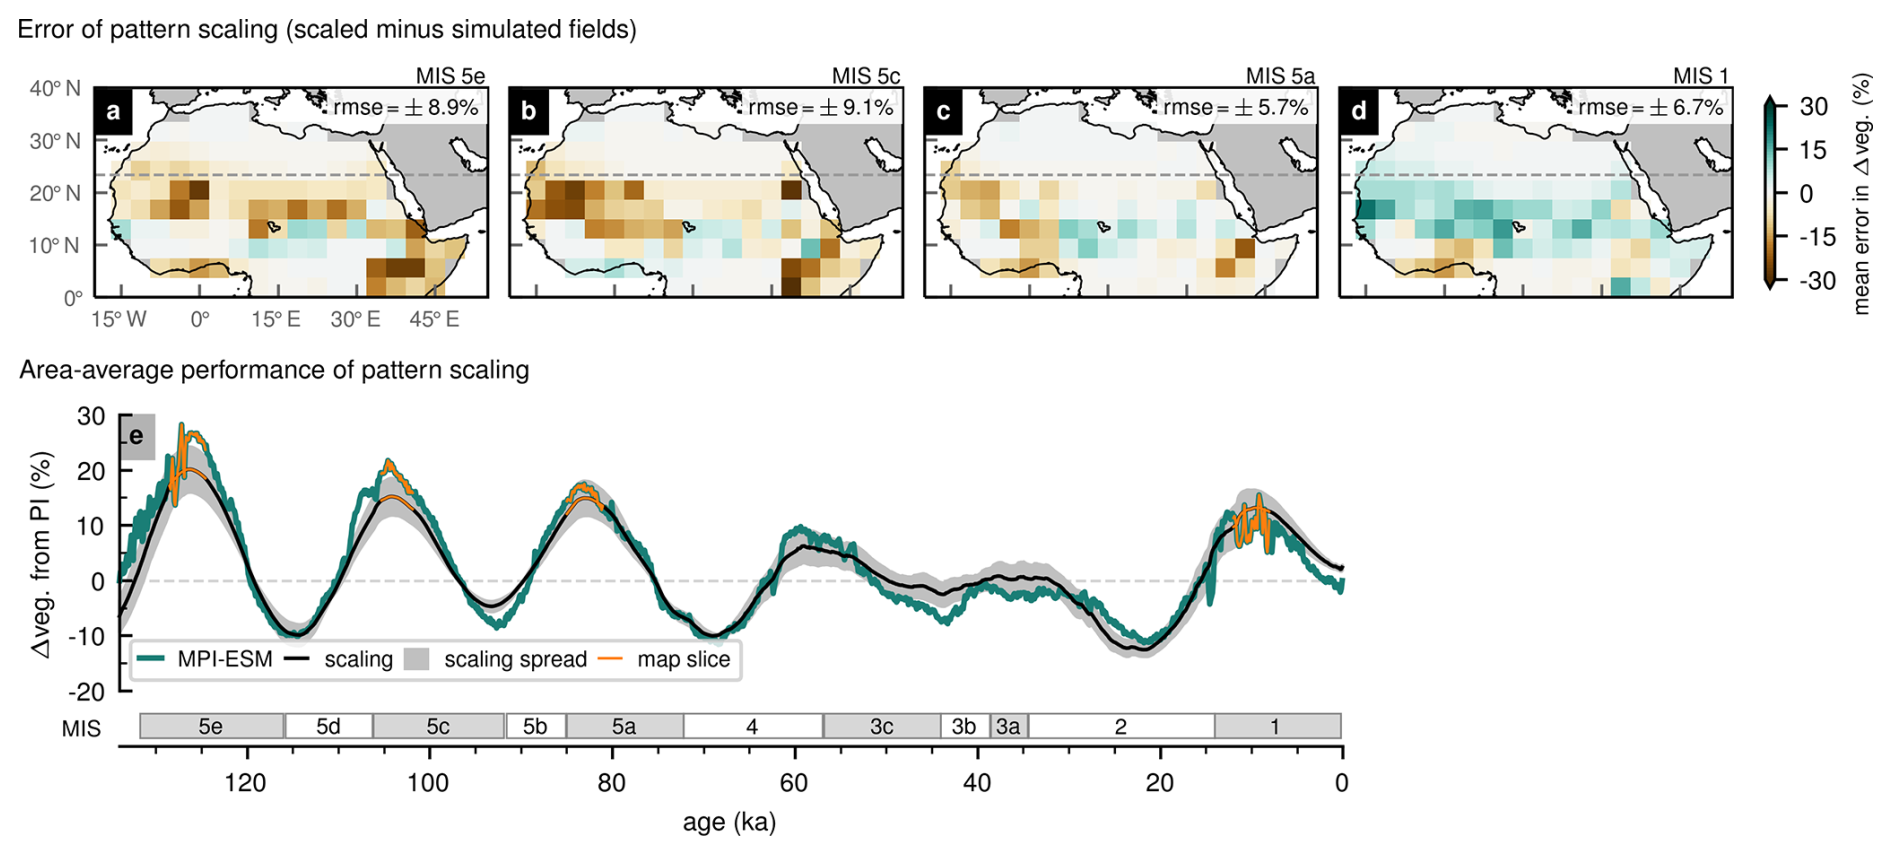
Figure 5Assessment of the pattern-scaling method for estimation of change in vegetation fraction from the pre-industrial (PI) era: (a–d) mean spatial errors during the AHP time slices highlighted in panel (e); (e) domain-wide average performance. This assessment uses the MPI-ESM simulated output as a reference (i.e. errors are scaled minus simulated patterns). In panels (a)–(d), the root-mean-square errors (RMSEs) are shown. Maps include modern coastlines only as a spatial reference.
In Fig. 5, we evaluate the skill of the pattern scaling to predict the simulated vegetation changes (from the PI) during the same AHP time slices as in Fig. 3. This means the climate model output acts as reference and that errors come from scaled minus simulated fields. We find that, for the AHPs of MIS 5 (Fig. 5a, b, and c), the pattern scaling underestimates the vegetation changes inside the Sahara, which is most noticeable in western Africa. Only for the Holocene (Fig. 5d) is there a slight overestimation of vegetation growth during the AHP. That our approach projects only limited changes in the Sahara (e.g. north of 20° N) is expected because the EOF1 pattern (Fig. 4b) has more pronounced loadings in the Sahel (around 15° N). We found other EOF patterns (not shown) that could have provided more changes in the Sahara; however, their associated temporal patterns were not simple to link to the external climate forcing. Nonetheless, considering the magnitude of some of the changes in northern Africa (above +40 % in Fig. 3), root-mean-square errors (RMSEs) below ±10 % vegetation cover change in Fig. 4a–d may be seen as acceptable.
Furthermore, Fig. 5e shows the average performance of the pattern scaling. We find a similar outcome: that the method predicts intermediate values between the rather strong AHPs during MIS 5 and the weaker Holocene AHP. We hypothesize that, if there had not been the unexpectedly strong AMOC variability during the early Holocene (also seen in Fig. 5e), which weakened the Holocene AHP, our method would find a curve fit able to predict slightly larger values closer to those during MIS 5. It is also interesting to see that the scaling spread, due to uncertain regression parameters, keeps the climate simulation largely within the reach of the pattern scaling.
3.5 Late Quaternary AHPs
The pattern-scaling method opens up the interesting possibility of quickly obtaining a rough estimate of the vegetation fraction distribution in much of northern Africa for other times for which reliable forcing data are available (and yet may lie outside of current modelling capabilities). It seems best suited for the Sahelian vegetation response (where the main loading of the EOF pattern lies); however, it still provides part of the vegetation change everywhere in northern Africa (e.g. the Sahara), such as a minimum probable estimate of the change. Two main assumptions underlying this approach are that (1) the EOF1 pattern captures much of the large-scale pattern of regional variability and that (2) the forcing-based linear model effectively emulates the long-term time dependence of variation at that scale and the climate forcing. Although it may likely be biased towards a single glacial cycle, proxy data suggest the last glacial cycle could be representative of large-scale climate changes happening for at least the last eight glacial cycles (Lüthi et al., 2008a). Therefore, it is plausible that the pattern scaling generalizes to many other cycles.
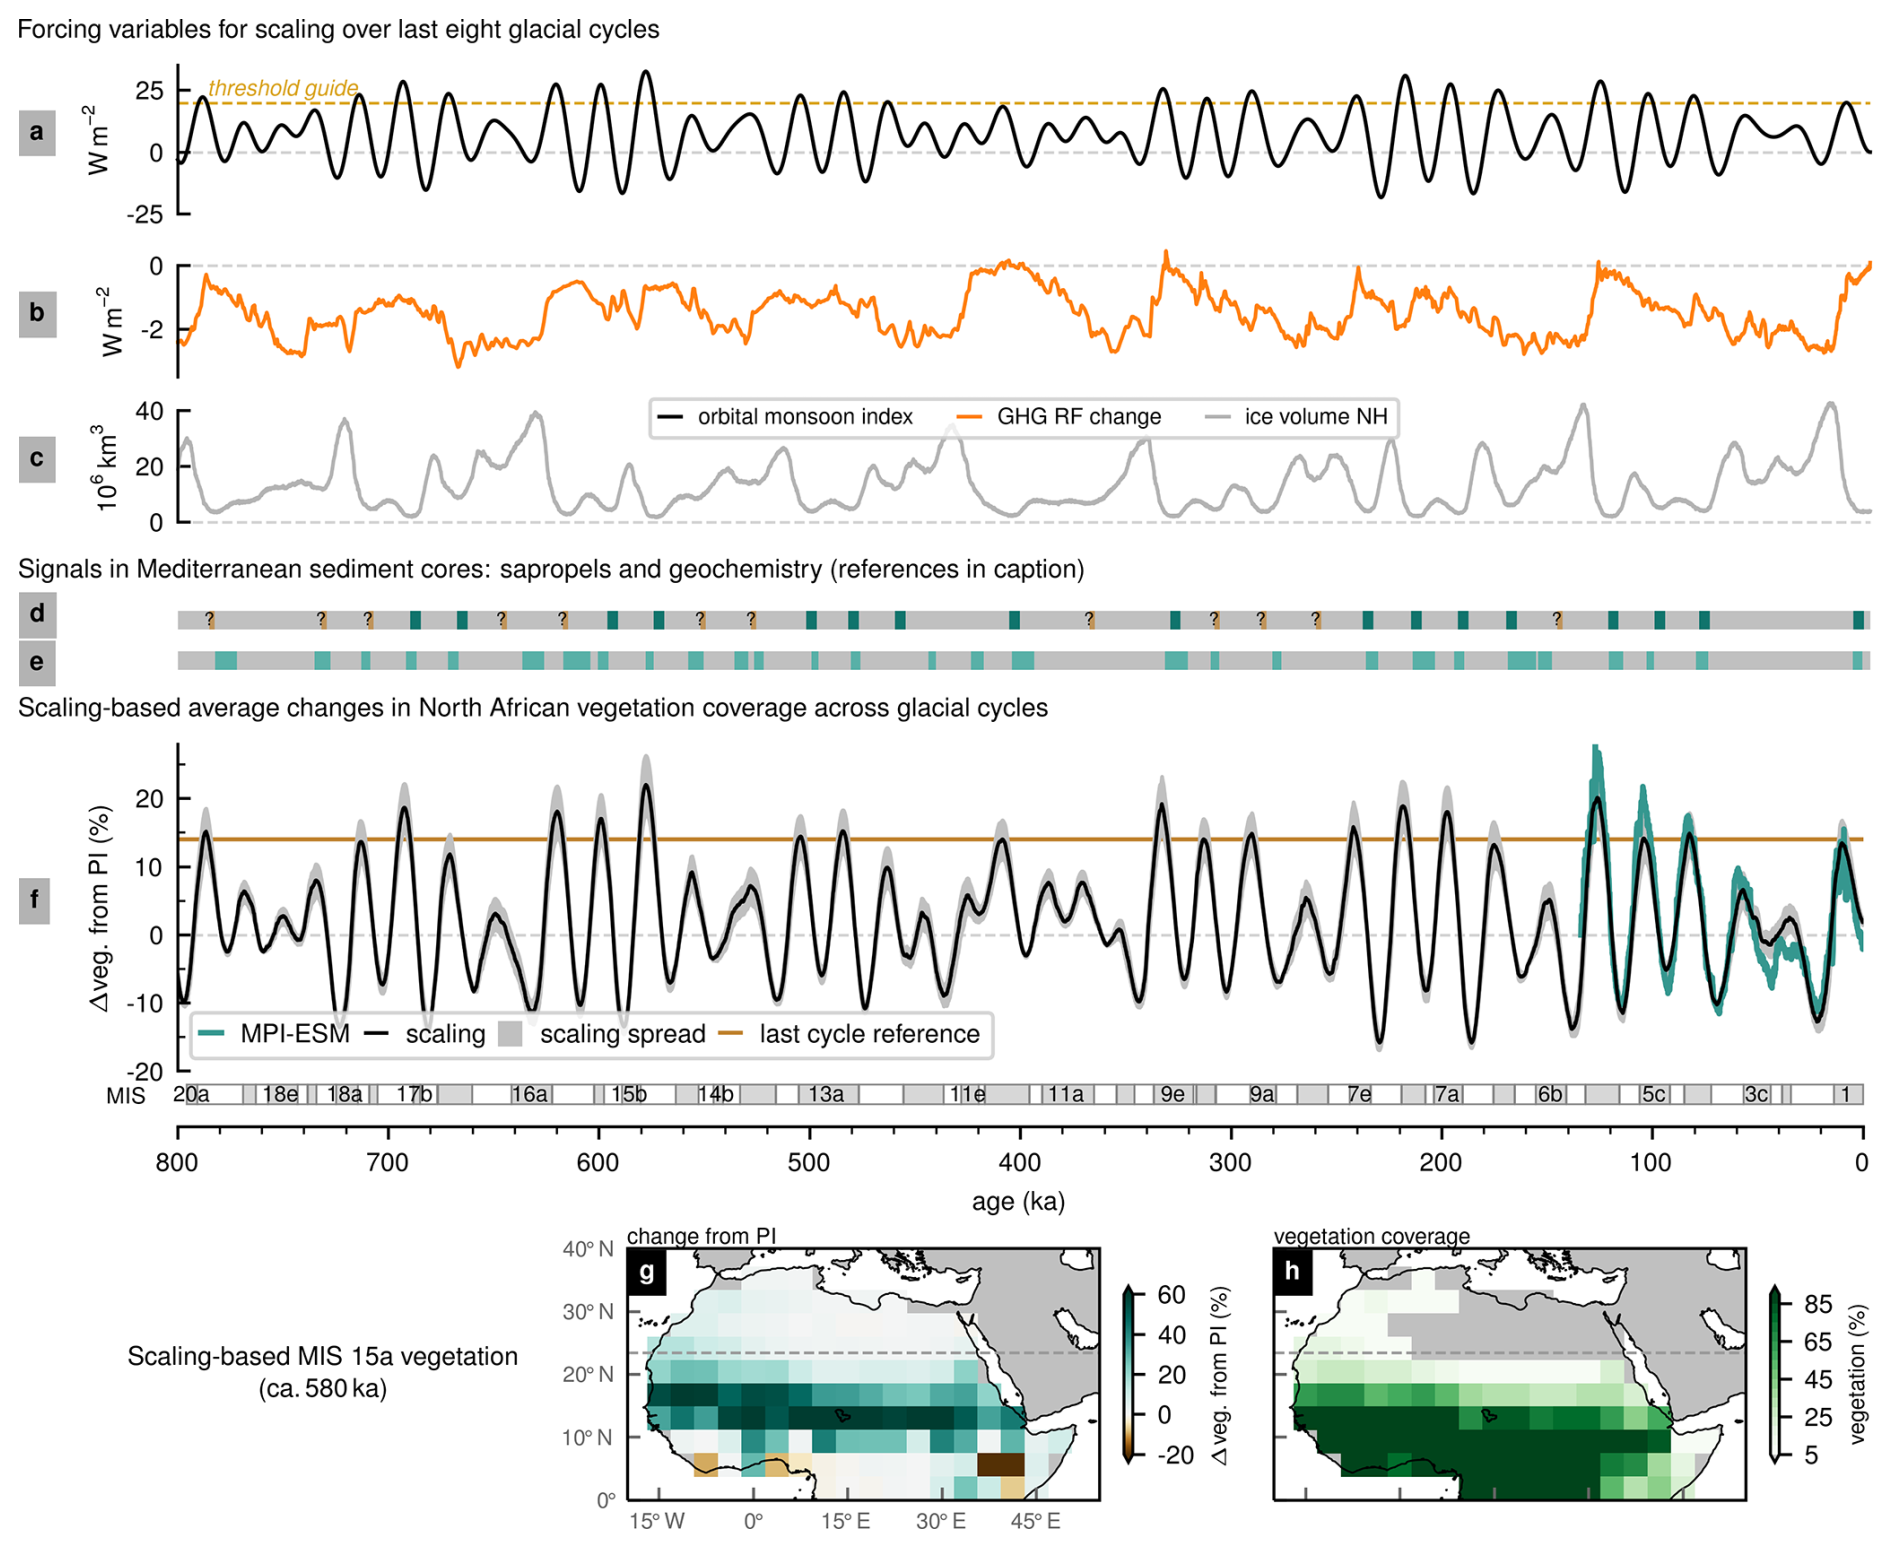
Figure 6Northern African vegetation fraction changes over the last 800 kyr. (a–c) Set of forcing factors used for scaling, including (a) in the Rossignol-Strick (1983) threshold for sapropel formation at 19.8 W m−2. (d) Composite sapropel record (cores ODP160-966/7), with wide, dark bands for clear sapropels and narrow, light bands for oxidized or missing sapropels (Emeis et al., 2000a). (e) Inferred AHPs (colour bands) from bulk elements in sediment core ODP160-967 (Grant et al., 2022). (f) Pattern-scaling results for area average changes from the pre-industrial (PI) era. A horizontal line at 14 % is an empirical threshold for counting potential AHPs based on AHPs of the last glacial cycle. (g, h) Scaled patterns during the potential ancient AHP of MIS 15a showing modern coastlines, even though they may differ at that time.
We use the scaling approach to estimate changes in northern Africa since 800 ka using available forcing data. The orbital monsoon index is computed for this interval based on the parameters of Berger (1978). The GHG radiative forcing and ice-sheet data come from Ganopolski and Calov (2011), who compiled the trace gas data from Antarctic ice core records (Petit et al., 1999; EPICA Community Members, 2004) and simulated the ice sheets with a coupled intermediate-complexity model and ice-sheet model. Figure 6a–c shows this longer set of forcing variables, where the new GHG and ice-sheet data agree with the forcing used in our simulation and to fit the linear model for the overlapping period of the last 134 kyr. In Fig. 6a, we also show, as a guide, the orbital monsoon index threshold at 19.8 W m−2, which relates to the occurrence of AHPs as detected by Rossignol-Strick (1983) and discussed more recently in Duque-Villegas et al. (2022).
Evidence of the AHPs of the last 800 kyr is available in marine proxies. Figure 6d and e depict Mediterranean proxy records linked to past AHPs: the sapropel record of Emeis et al. (2000a) and the bulk composition elements in the sediment core of Grant et al. (2022), respectively. Both long records agree on many events, although the geochemical analysis of Grant et al. (2022) detects several more AHPs. We compare such records with our simulation and pattern-scaling approach.
Figure 6f shows the last eight glacial cycles of average vegetation changes in northern Africa according to the pattern scaling and according to the forcing variables shown in Fig. 6a–c. Figure 6f also includes a reference line set at 14 % of average vegetation change, based on the AHPs of the last glacial cycle, which is useful to guess potential more ancient AHPs. According to this reference guide, two other potential AHPs stand out, possibly of a similar strength to the AHP during MIS 5e: one happening around 580 ka, within MIS 15a, and another one around 330 ka, within MIS 9e. The Mediterranean records also clearly contain these two events (Fig. 6d and e).
The average vegetation changes in Fig. 6f also compare well with the BIOME4 dataset generated with the statistical method in Krapp et al. (2021), although the reconstructed spatial patterns have differences in the zonal extent of the changes (not shown). Moreover, Fig. 6g and h show the estimated changes from the PI and vegetation fraction pattern, respectively, during one of the potentially strongest AHPs (around 580 ka). It is only one example of the pattern scaling for beyond-simulated AHPs. When considering such an ancient AHP, caution is important, and it is useful to know, for instance, that the land–sea mask and topography may differ from the ones used to calculate the EOF1 pattern.
Based on the empirical threshold line in Fig. 6f, the scaling approach can identify most clearly some 19 (potential and known) AHPs. This number agrees with the 21 possible AHPs based only on the orbital monsoon index threshold (see Fig. 6a) detected by Rossignol-Strick (1983). Considering the spread in the parameters of the linear fit, the number could be as low as 8 (including the Holocene AHP, despite its minimum spread value being under the empirical threshold) or as high as 21 (like the monsoon index threshold would predict). All 21 of the candidate AHPs would be in agreement with signals in Mediterranean sediment cores (combining Fig. 6d and e), neglecting small lags between monsoon index peaks and sedimentary signals. A similar number of 20 AHPs was reported from many independent equilibrium simulations along this time range (Armstrong et al., 2023). Likewise, a data synthesis by Larrasoaña et al. (2013) indicated 22 potential AHPs for this interval. The refined geochemical analyses by Grant et al. (2022), which read subtle humidity variations, estimated about 30 episodes of Saharan greening since 800 ka (see Fig. 6e). However, some of the events could perhaps be grouped into single cases of AHPs.
3.6 Future AHPs
Previous studies pointed out the differences between orbitally dominated AHPs in the past and predicted, GHG-modulated AHPs in the future (Claussen et al., 2003; D'Agostino et al., 2019; Duque-Villegas et al., 2022). For the next 100 kyr, Earth keeps a low eccentricity orbit (a cycle of about 400 kyr) that hinders the possibility of a new AHP inception. At most, there could be some mild greening in northern Africa around 66 kyr into the future (Duque-Villegas et al., 2022). The low eccentricity reflects in the small variation in the orbital monsoon index in Fig. 7a, which stays far from the threshold of about 19.8 W m−2 for the onset of an AHP detected by Rossignol-Strick (1983) and Duque-Villegas et al. (2022) (compare Fig. 7a with Fig. 6a). However, when compounded with increasing emission rates of GHGs, the strengthening of the planetary radiative forcing (as shown for the scenarios in Fig. 7b) enhances humidity levels globally, possibly enabling an earlier greening in northern Africa (Duque-Villegas et al., 2022).
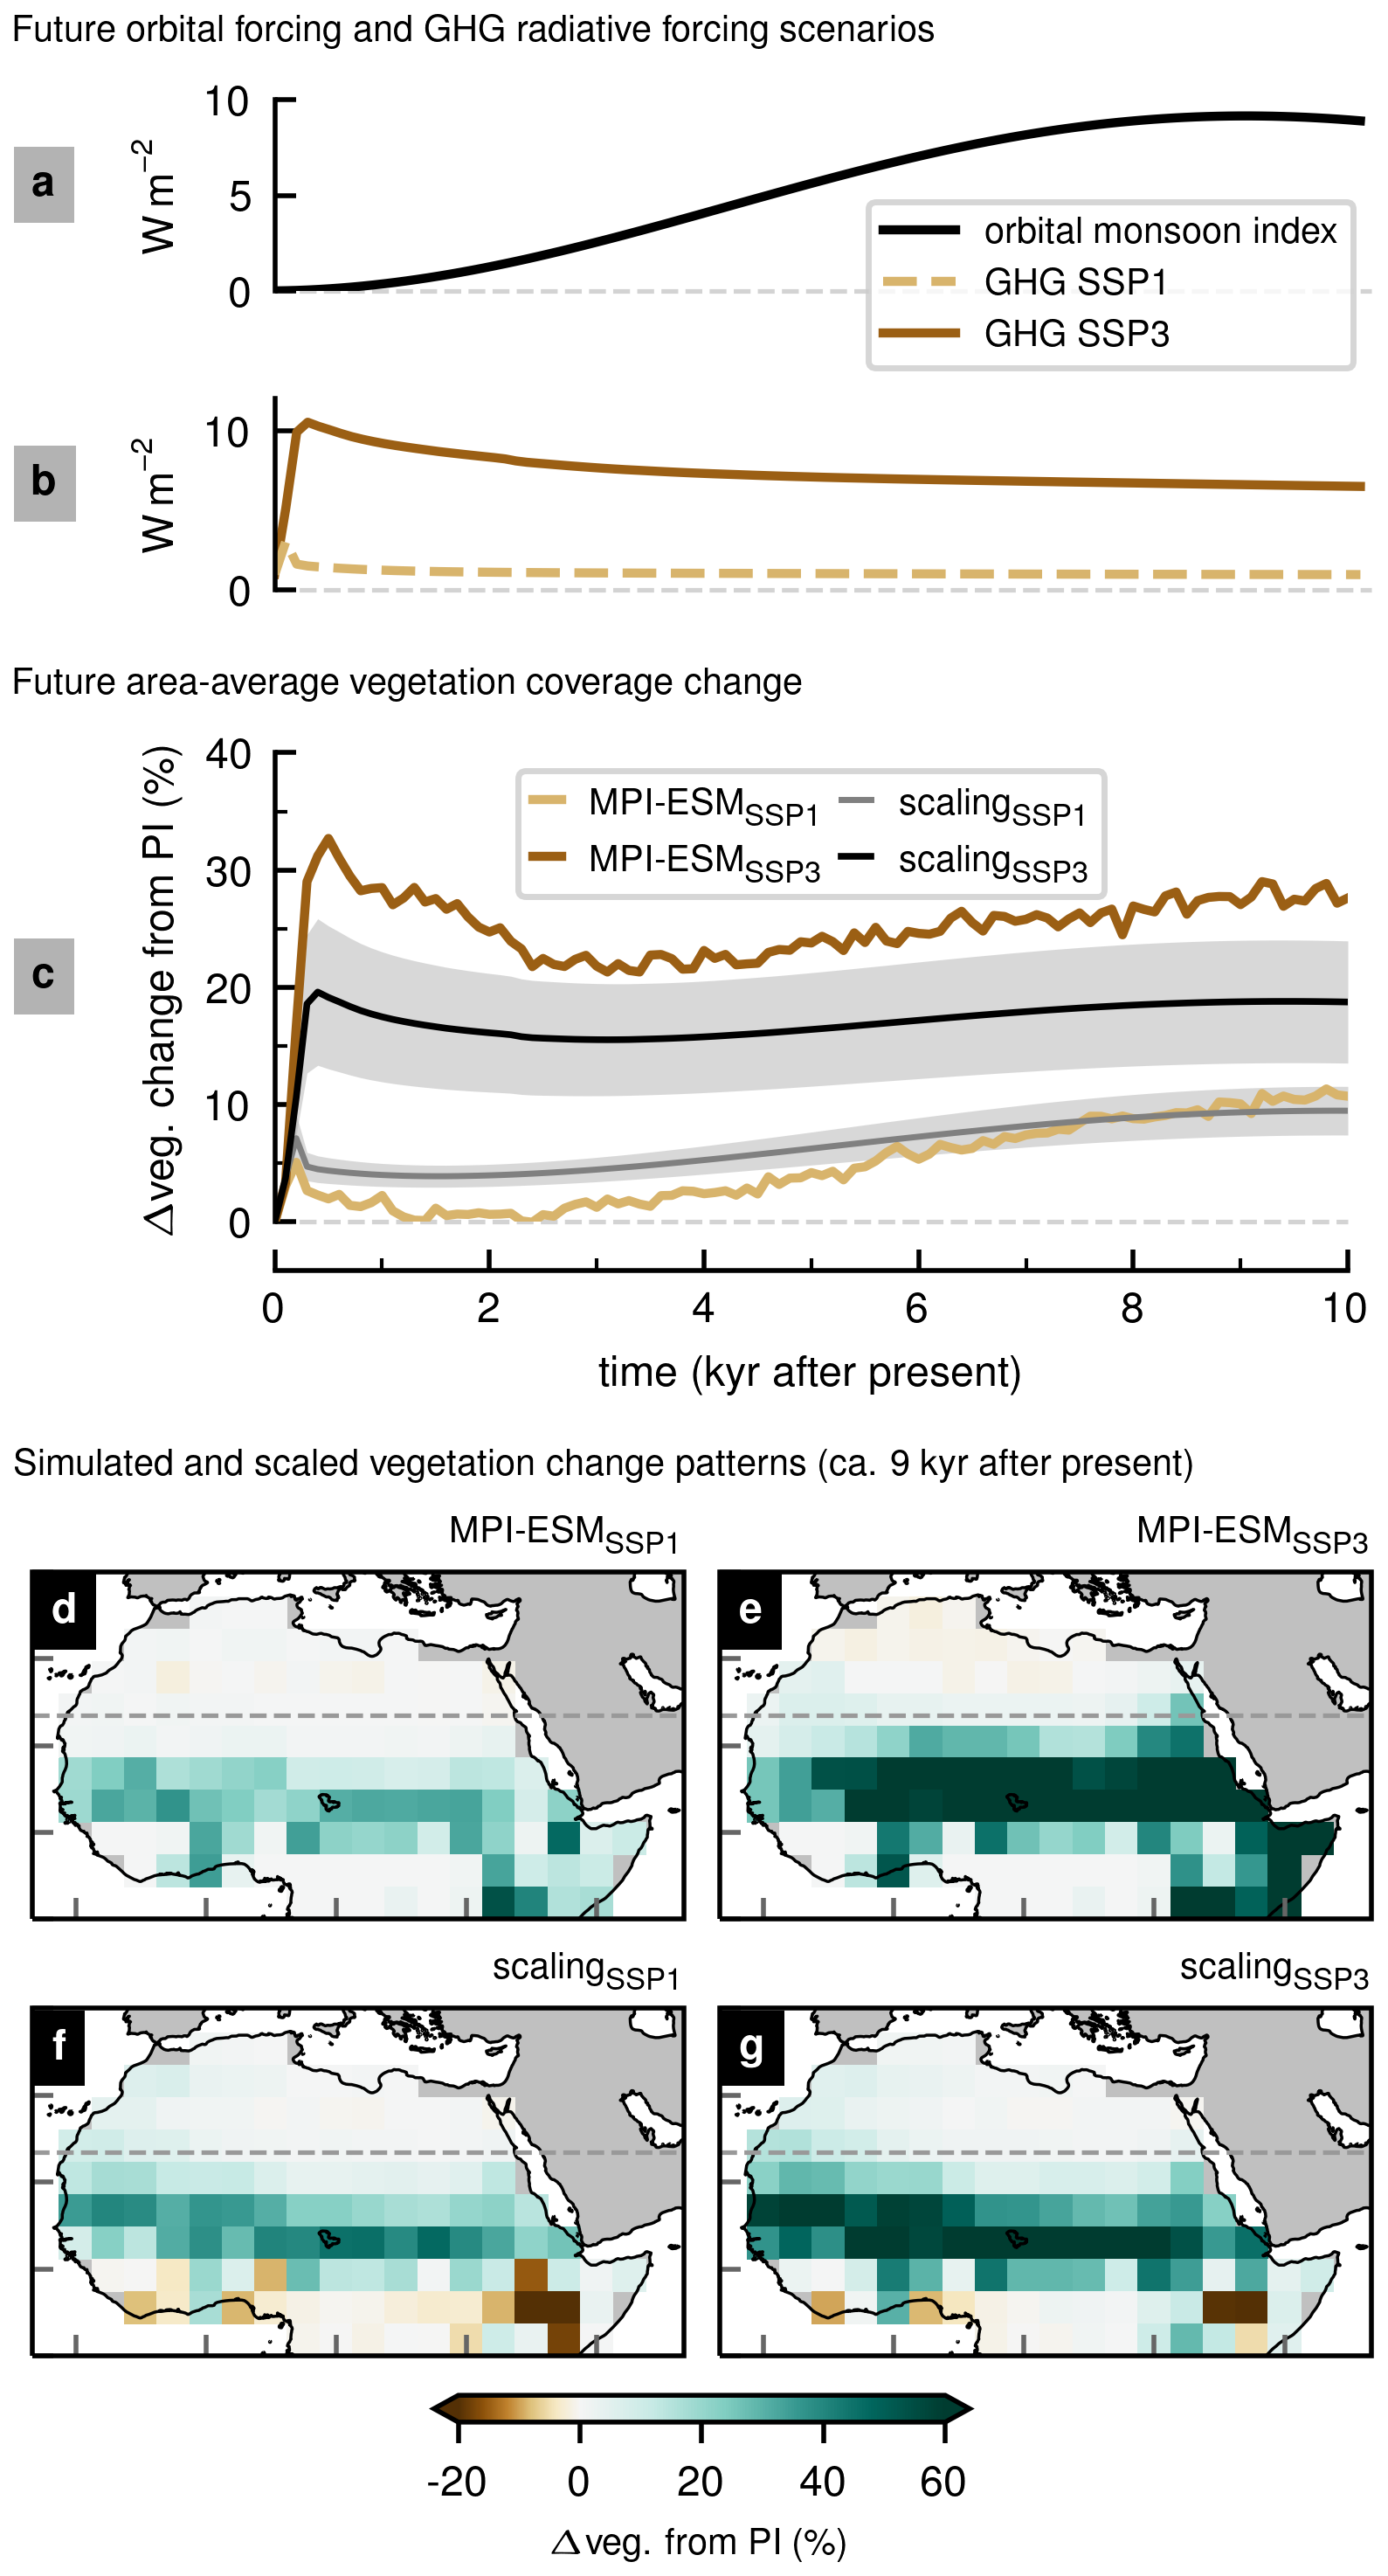
Figure 7Future vegetation coverage change in northern Africa: (a) orbital forcing monsoon index and (b) GHG radiative forcing scenarios; (c) simulated and scaling-based average vegetation fraction change from the pre-industrial (PI) era, where grey bands show the scaling spread; and (d, e) mean simulated and (f, g) scaling-based vegetation fraction under forcing scenarios around 9 kyr after the PI.
Scenarios in Fig. 7b have peak emissions in the near future (a few centuries) and later maintain a constant positive forcing, leading to an average global warming of about 7 K (SSP3) and 1 K (SSP1). Figure 7c shows simulated northern African vegetation response to those scenarios. SSP3 seems to arrive at AHP conditions with a similar level to that during MIS 5e (about 30 % average change from the PI), while SSP1 at about 10 % average vegetation change (which is smaller than during the Holocene) does not resemble an AHP (note the threshold at 14 % in the previous section).
Figure 7c also shows the average performance of the pattern scaling for future times. It performs relatively well for the SSP1 scenario, but it greatly underestimates the SSP3 changes (even considering the parameter spread). This means the method is rather conservative in terms of the GHG forcing, which could be related to the fitting being done within the narrow range of GHG variability of the last 134 kyr or could be because the model also includes the glacial changes in the ice sheets, which, for these future scenarios, are assumed to remain invariant at present-day conditions. Moreover, our estimate method is bound to the EOF1 pattern, which means it is not suited to account for greening related to possible future shifts in vegetation boundaries.
Figure 7d–g show the patterns of vegetation change (from the PI) that were dynamically simulated (with MPI-ESM), and those estimated with the pattern scaling, near the orbital monsoon index local maximum at 9 kyr after present. This local maximum in tropical insolation could see substantial greening in northern Africa, potentially developing the next AHP, depending on the GHG forcing. Under the relatively low GHG forcing scenario, SSP1, the pattern scaling (Fig. 7f) performs well in comparison to MPI-ESM (Fig. 7d). However, Fig. 7e shows that, under the high GHG forcing scenario, SSP3, the simulated vegetation change pattern differs from its AHP predecessors, since it is missing the northward vegetation push along the west coast. Such a difference agrees with first-order effects seen in previous comparisons of climate change projections and the Holocene AHP (e.g. Gaetani et al., 2017; D'Agostino et al., 2019), although such studies did not extend until 9 kyr after present. Evidently, our single-EOF pattern-scaling approach by design lacks in skill to predict vegetation patterns simulated under high GHG forcing, since it is based only on late Quaternary vegetation changes.
We present results of a coupled atmosphere–ocean–vegetation simulation for the last glacial cycle. To the best of our knowledge, the simulation is unique regarding model complexity and length and the absence of any acceleration technique. Other studies with similar times of interest opted for atmosphere-only models (Prell and Kutzbach, 1987), lesser-complexity models (Blanchet et al., 2021; Menviel et al., 2021; Duque-Villegas et al., 2022), ensembles of discontinuous equilibrium simulations (Singarayer and Burrough, 2015; Armstrong et al., 2023), or acceleration methods (Kutzbach et al., 2008, 2020). In this case, the simulation includes a realistic representation of interactions across a broad spectrum of variability frequencies, which means disturbances can propagate across the globe to superimpose climate forcing and local effects. However, for the same reason, it is not possible to implement a highly resolved grid in this long palaeo-experiment, which would enable a more refined comparison with the geological record and would more clearly capture shifts in vegetation boundaries (e.g. Dallmeyer et al., 2020).
We focus our analysis on vegetation cover in northern Africa, where continental-scale climate changes produce four AHPs and a northward greening reaching into the Sahara. The simulated vegetation changes generally agree with the timing and direction of change seen in available terrestrial and marine proxies (Blome et al., 2012; Drake et al., 2013; Tierney et al., 2017a; Skonieczny et al., 2019; Ehrmann and Schmiedl, 2021a). However, we detect a dry bias in the model that means Saharan greening is likely underestimated in our simulations. Most of the simulated greening happens within the Sahel region. Especially for the Holocene AHP, vegetation cover appears largely underestimated in our simulation because of unexpectedly large AMOC fluctuations, which resulted in a much colder North Atlantic and Northern Hemisphere while this AHP developed. Nonetheless, we keep this weakened Holocene AHP in our analyses because we still see considerable northern African greening, even if only for a few centuries.
Compared with previous modelling and reconstruction studies, the pattern of vegetation changes in the four simulated AHPs also seems consistent with recognized aspects of the Holocene AHP (Brierley et al., 2020; Dallmeyer et al., 2020). There is a northward progression of mostly zonal vegetation bands that extend east until about 40° E, with a slight northwest–southeast tilt related to further inland penetration of the West African Monsoon system. A “tilted” AHP development pattern is also detected in the simulations and reconstructions of Armstrong et al. (2023), and our results agree on the possibility that desert cover remains in a northeastern corner of northern Africa during AHPs, thereby breaking the zonal pattern of northward vegetation growth. Moreover, it was shown that palaeo-conditioning, or re-tuning a climate model to improve palaeo-modelling results, also led to a similar tilted vegetation pattern during the Holocene (Hopcroft and Valdes, 2021). In our case, however, such tuning is not applied.
Nevertheless, we also see differences with some of the few available sources that include not only the AHP of the Holocene, but also that of MIS 5e. The reconstructions of Larrasoaña (2021) show much more extensive greening of northern Africa and a more zonal pattern than our simulation. Also, for the AHP of MIS 5e, we are unable to simulate enough greening inside the Sahara, which would better fit the precipitation changes in the model–data comparison of Scussolini et al. (2019). We believe that part of the reason why these differences stand out is the dry bias in the model at the implemented resolution, but it is also possible that uncertainties and the sparse coverage in the geological record skew the reconstructions (see Otto-Bliesner et al., 2021).
Besides producing and evaluating vegetation patterns for the AHPs of the last glacial cycle, a most interesting outcome is the linear relationship we establish for simulated vegetation in northern Africa and the climate drivers forcing the simulations. We had found such a strong correlation previously but with a different climate model of intermediate complexity and only for Saharan greening (Duque-Villegas et al., 2022). Similarly to our previous work, the dominance of the orbital forcing is clear in our results, yet now, with the more comprehensive model, we are also able to extend this dependence to the spatial pattern predicted over northern Africa by the dynamical model via a simple linear scaling. The result is a cost-efficient estimation of northern African vegetation patterns for the late Quaternary, since simulating glacial cycles even at coarse resolution can take excessively long computing times.
We can compare the results of our pattern scaling with the global biome dataset generated by Krapp et al. (2021) for the last 800 kyr. In Krapp et al. (2021), authors also use model output for the last glacial cycle to create a linear regression model that can extend simulated variables much further back in time until 800 ka. Similarly, the predictor variables are forcing terms like orbital parameters and atmospheric CO2. However, in that case, the approach was implemented globally and the estimated changes in northern Africa seem more zonal in comparison to our results. Nonetheless, the average evolution of total vegetation changes (one minus the fraction of desert plus barren biomes) agrees well with the domain-average performance of our method, although the estimated number of AHPs seems to be lower in their case.
An important caveat must be considered in our pattern scaling of vegetation fraction. Because this quantity is bounded (0 % to 100 %), it can happen that, in some cases, the scaling “overshoots” the estimation of the changes, since there is some maximum possible amount of change (from the PI) leading to completely bare (0 %) or vegetated (100 %) grid cells. Overshooting could happen, for instance, under more intense forcing (than in the last glacial cycle) or in cases where there is a greater sensitivity to the forcing. This implies the linear scaling may work well for vegetation fraction in this study only because of a dry bias in the model that prevents simulation of stronger (non-linear) greening.
Another factor we neglect in the scaling approach is the role of non-linear effects. Critical thresholds related to the climate forcing may prevent the pattern-scaling approach from correctly representing parts of the changes in the domain (Brovkin et al., 1998; Claussen et al., 2003; Duque-Villegas et al., 2022), most likely near transition zones, such as around the southern fringe of the Sahara, or where there is steep topography, such as towards eastern Africa. Those are some of the places that stand out when we assess the errors in the pattern scaling (see Fig. 5). Moreover, the dynamical systems that govern northern African moisture changes are connected via Walker and Hadley circulations with remote locations, whose responses to changes in the background climate also could induce more or less greening during simulated AHPs (e.g. Kaboth-Bahr et al., 2021). In this case, we have not looked into such teleconnection mechanisms. Although it is possible that some of the other coherent modes of variance improve our estimates (i.e. reduce emulation minus simulation differences), we opt for the simplicity of capturing only the variance at the largest scales, at the cost of a mean error of about ±10 % vegetation fraction change. The fact that the dominant EOF explains about 73 % of the simulated variance justifies our unimodal approach.
In our simulations of millennial-scale future climate change, we see the contrast between GHG-enabled and orbital-driven vegetation patterns of AHPs. The vegetation pattern under high GHG forcing (Fig. 7e) is similar to 21st-century projections of Sahel rainfall changes (e.g. Bony et al., 2013; Gaetani et al., 2017). In both cases (high GHG and 21st-century projections), the largest positive anomalies concentrate near central and eastern Sahel. However, in our case (high GHG), a key distinction is that the orbital configuration is changed considerably from the present day; thus we also see some vegetation growth in western Africa and approaching the Northern Tropic. Still, the western and northward development of vegetation under high GHG forcing is not as extensive as in the orbital-driven AHPs of the late Quaternary. This is related to the differences in dynamical (circulation) and thermodynamical (water vapour) responses to each of these forcing factors (Claussen et al., 2003; D'Agostino et al., 2019). Such competing effects complicate AHP pattern predictions in future climates.
After simulating a realistic climate evolution for the last glacial cycle, we produce new estimates of the vegetation cover patterns during the last four AHPs. A comparison with available data sources from the geological record and relevant modelling studies indicates that the estimated patterns capture some known continental-scale features of AHPs reasonably well. Nevertheless, a dry bias in the model version at the resolution we use frames our results rather as probable minimum estimates. We reduce the high-dimensionality in the variability of the vegetation cover changes in northern Africa to a single dominant pattern that accounts for 73 % of the variations. We find this single dominant pattern correlates well with known forcing variables, and we use this linear relationship to approximate to an acceptable extent the simulated vegetation changes of glacial cycles. Considering the high computational costs of running glacial cycle simulations, we think our approach could be used as a quick diagnostic tool for palaeovegetation cover in northern Africa, which we demonstrate by estimating vegetation cover changes for the last eight glacial cycles with considerable success. Additionally, the extension of our analysis several millennia into the future suggests that patterns of northern African greening under projected strong GHG forcing should differ enough from the vegetation patterns of late Quaternary AHPs that it would not be useful to assume a simple linear scaling with climate forcing for predictions.
The complete 134 kyr simulation is mostly a single experiment that was run continuously from 125 to 0 ka. This interval is planned for studies about global climate of the last glacial cycle. However, because for this study we are particularly interested in the regional climate of northern Africa, we choose to complement this long experiment with another shorter, independent, and overlapping experiment that has an initial date slightly earlier, spanning 134 to 120 ka. We could use this to extend the longer experiment backwards in time. The main reason is to include in our analysis the tropical insolation maximum around 127 ka, which, according to available evidence, is an important time of extensive humidity over northern Africa. We opt for such an extension due to the computational expense and long waiting time (around 2 years) that it would take to re-run an entirely new simulation. The overlap in the experiments is to measure their level of agreement near a merging point. They should neither drift away from each other nor be at completely different states.
We find the splicing together of both experiments to have only a small consequence, producing a low-amplitude change that can be ignored for the study of the long-term climate signals we focus on for the study of AHPs. Figure A1 shows an example of the state evolution of both experiments for one grid cell in a highly variable region in the North Atlantic (Fig. A1a) and at the centre of our region of interest (Fig. A1b). The experiments are spliced together at 120 ka to produce the long simulation starting at 134 ka.
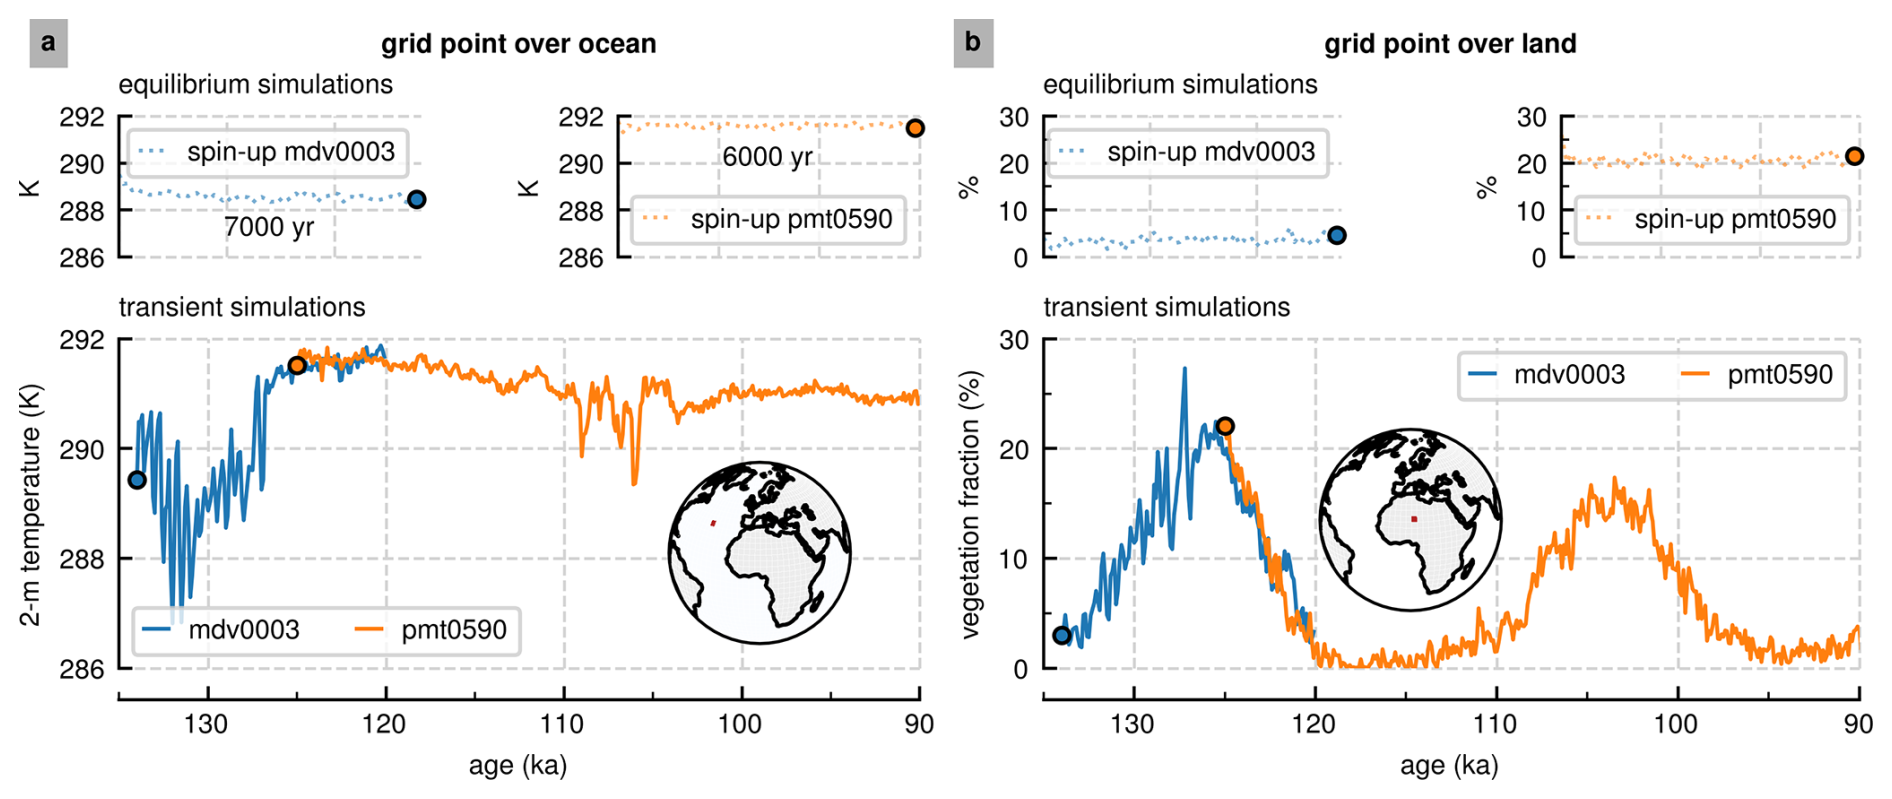
Figure A1Extending the simulation deeper in time by merging overlapping experiments. Comparison of equilibrium and transient experiments for single grid cells (a) over the North Atlantic (35.26° N, 33.75° W) and (b) over land in northern Africa (20.41° N, 7.5° E). Experiment “mdv0003” spans 134 to 120 ka, while experiment “pmt0590” spans 125 to 0 ka. We zoom time on the interval close to the merging point. Circle markers show the end state of the equilibrium experiments, which is also the starting point of the transient experiments.
To be able to compare more objectively the differences between simulated AHPs, we include Fig. B1, where we show the global conditions of near-surface temperature and precipitation near the times of the AHPs. The pre-industrial (PI) conditions (Fig. B1a), around the year 1850 CE, show the typical poleward temperature gradient profile and the precipitation maximum around the Equator. In Fig. B1b, we see that the climate during MIS 5e is overall much warmer than during the PI, except around the Sahel in northern Africa, where there is more transpiration because of the extended vegetation cover during the AHP. MIS 5c and MIS 5a show very similar conditions, also with slightly warmer conditions in the Arctic Ocean and Siberia. In great contrast, the Holocene (MIS 1) shows much colder temperatures over Greenland and the North Atlantic Ocean due to an excessive amount of sea ice that remains in this region after a strong meltwater pulse around 14.4 ka. Because of this, the Holocene AHP we present is not as green as seen in previous applications of the same model at the same spatial resolution. The precipitation changes (Fig. B1c) clearly show the shift in moisture and ITCZ towards the Northern Hemisphere during the AHPs. The largest increments in precipitation happen not only in northern Africa, but also over the Indian Ocean and over India. Precipitation changes during the Holocene AHP are much weaker than during the other AHPs.
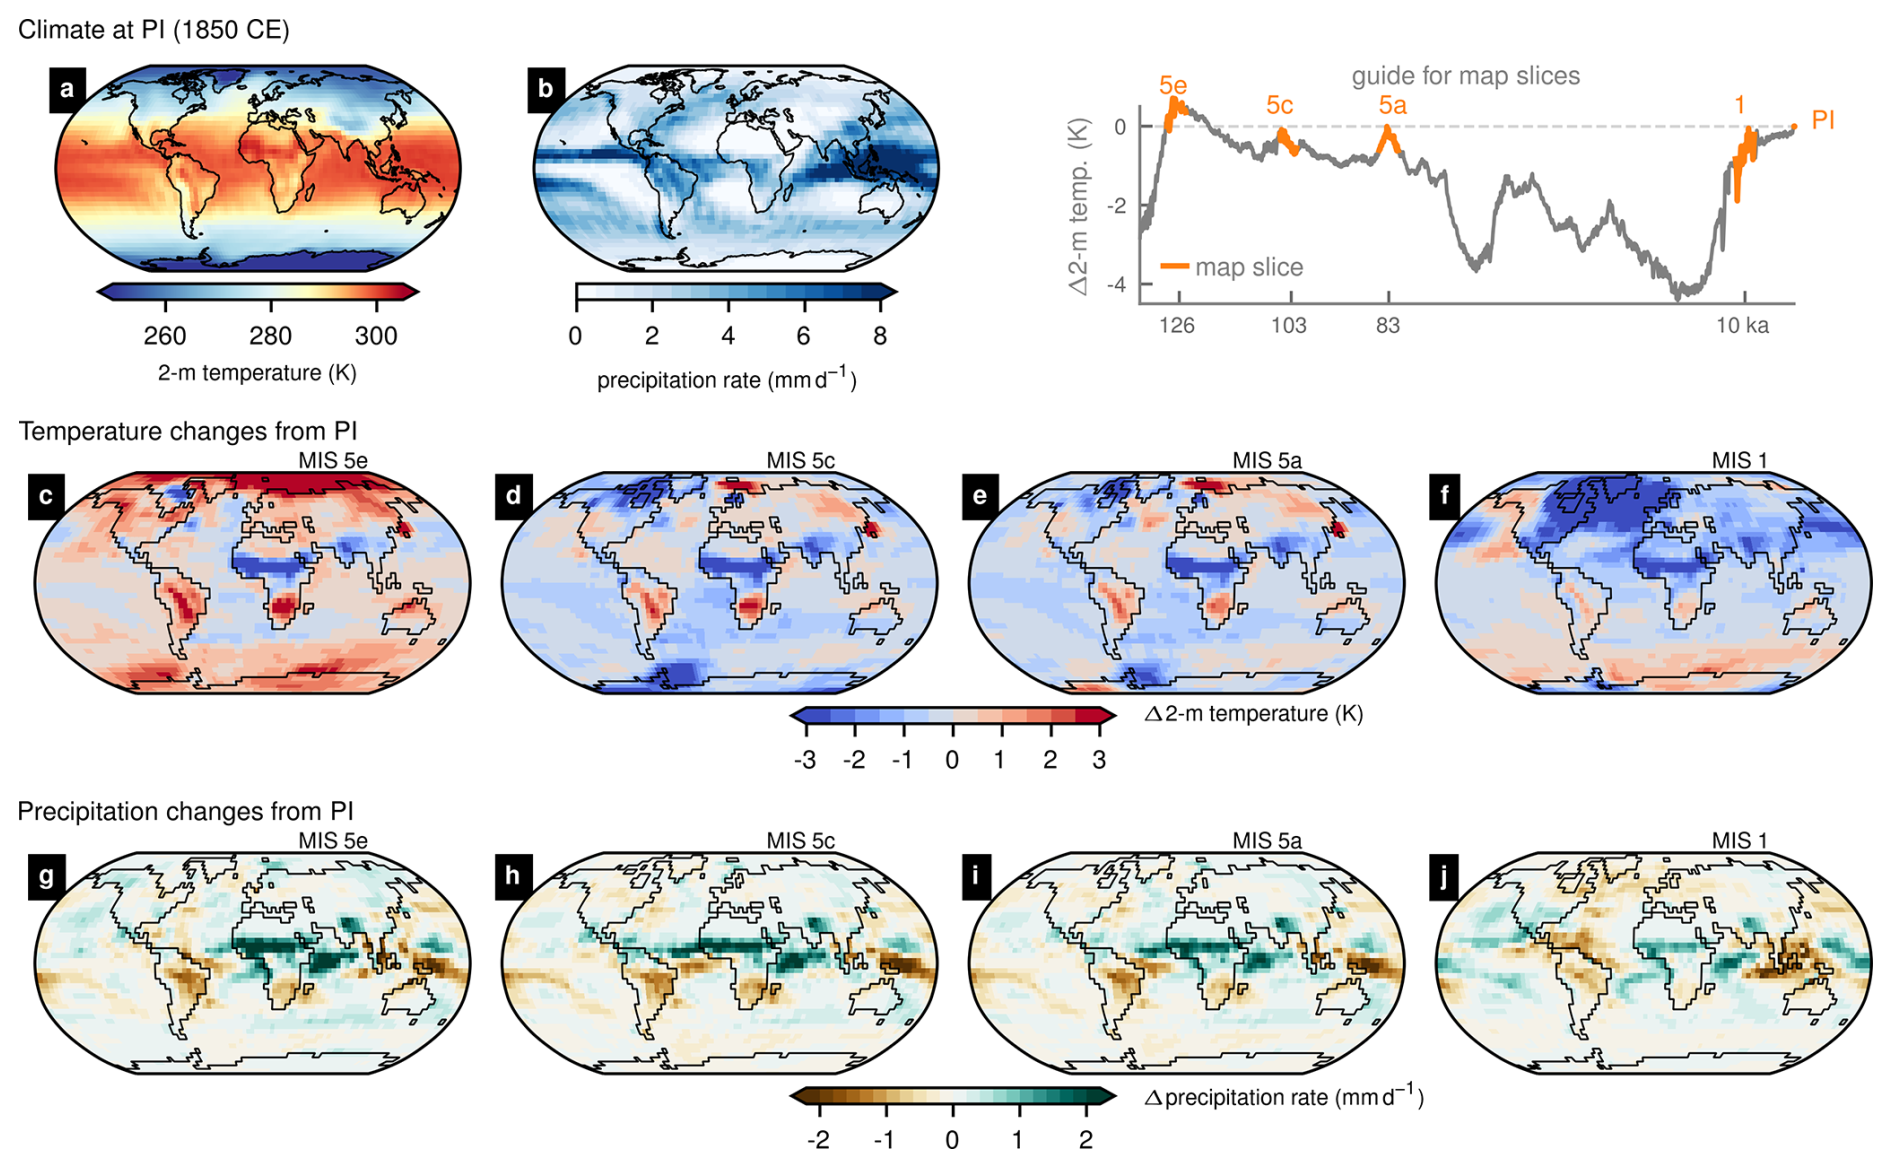
Figure B1Background climates during AHPs: the pre-industrial (PI) era means of (a) near-surface temperature and (b) daily precipitation rate fields, (c–f) temperature changes from the PI, and (g–j) precipitation rate changes from the PI. Modern coastlines are shown for the PI, while AHP time slices show the coastlines according to sea-level changes. An inset axis with global mean surface temperature highlights the AHP time slices.
For an assessment of the dry bias in this specific implementation of the MPI-ESM model, we also compared the simulated present-day conditions of vegetation cover fractions and precipitation with some observational products in Fig. C1. In this case, “present day” is defined as the climatological mean of 31 years of model output, corresponding to the interval from 1990 to 2020 CE. The observational products were remapped to the model grid using a bicubic interpolation and averaged in time to obtain climatologic values. It is important to note that the simulations did not include any anthropogenic land-use changes; therefore, in many places (like near the Equator), it is expected that the simulated vegetation cover is an overestimation (potential vegetation cover). Figure C1a–c show that the patterns of vegetation are similar but that the model underestimated the vegetation cover around the Sahel (in spite of not including land use changes). A dry bias is clearly seen in the precipitation differences in Fig. C1d–f, especially around the Sahel. The large positive anomalies at the Equator (almost the only positive anomalies) indicate that the maximum of precipitation in the simulation may be displaced southward, relative to the observational product data.
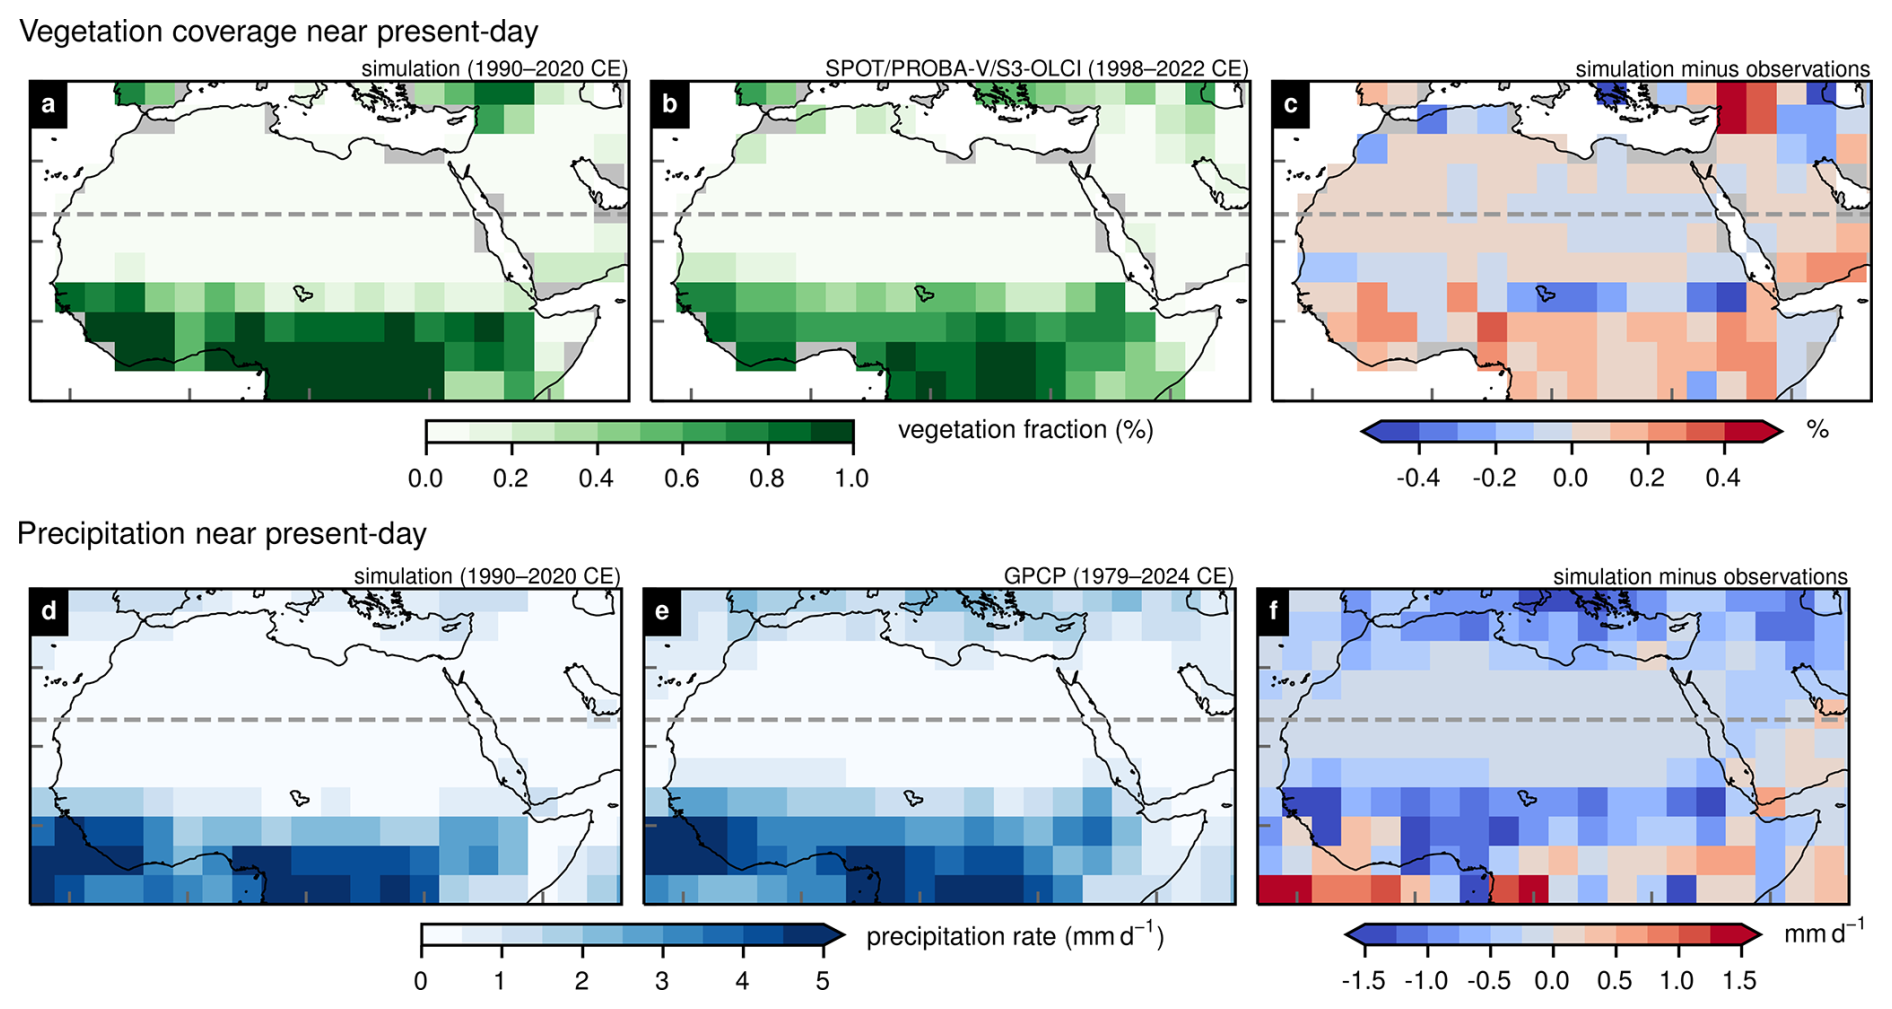
Figure C1Comparison in northern Africa of simulated present-day (1990–2020 CE) conditions to observational products for (a–c) vegetation cover fractions and (d–f) daily precipitation rates. (b) Vegetation cover data are from the SPOT/PROBA-V and PROBA-V/S3-OLCI products of the land service of Copernicus (Baret et al., 2013; Camacho et al., 2013). (e) Precipitation data are from the Global Precipitation Climatology Project (GPCP; Adler et al., 2016).
The model source code of MPI-ESM is available to the scientific community upon request to MPI-M. Model output data and post-processing Python scripts to reproduce numbers and figures in the article are archived at https://doi.org/10.17617/3.HQTV1J (Duque-Villegas, 2024). The Lisiecki and Raymo (2005a) data in Fig. 1d are available at https://doi.org/10.1594/PANGAEA.704257 (Lisiecki and Raymo, 2005b). The Deplazes et al. (2013a) data in Fig. 1f are available at https://doi.org/10.1594/PANGAEA.815882 (Deplazes et al., 2013b). The Tierney et al. (2017a) data in Fig. 2a are available at https://doi.org/10.25921/k92a-8583 (Tierney et al., 2017c). The Skonieczny et al. (2019) data in Fig. 2b are available as part of their supplementary material in the online publication. The Ehrmann and Schmiedl (2021a) data in Fig. 2c are available at https://doi.org/10.1594/PANGAEA.923491 (Ehrmann and Schmiedl, 2021b). Figure 6b includes data from Loulergue et al. (2008), Lüthi et al. (2008a), and Schilt et al. (2010a) available at https://doi.org/10.25921/gfsj-jc86 (Loulergue et al., 2009), https://doi.org/10.25921/xgzs-gd10 (Lüthi et al., 2008b), and https://doi.org/10.25921/yxhy-3g37 (Schilt et al., 2010b), respectively. The Emeis et al. (2000a) data in Fig. 6d are available at https://doi.org/10.1594/PANGAEA.704622 (Emeis et al., 2000b). The Grant et al. (2022) data in Fig. 6e are available as part of their supplementary material in the online publication. The Krapp et al. (2021) data used for comparison can be found at https://doi.org/10.17605/OSF.IO/8N43X (Krapp, 2023). The SPOT/PROBA-V/S3-OLCI and GPCP data in Fig. C1 were provided by the ICDC, CEN, at Universität Hamburg (https://www.cen.uni-hamburg.de/icdc/data/land/vegetation-cover-fraction, ICDC, 2024a; https://www.cen.uni-hamburg.de/icdc/data/atmosphere/gpcp, ICDC, 2024b).
MDV and MC developed the research idea. MDV and TK performed the climate simulations. MDV led the formal analysis and drafted the article. TK provided model code and input data. JB and CHK contributed to the methodology and formal analysis. All authors participated in the analysis of results and article composition.
At least one of the (co-)authors is a member of the editorial board of Climate of the Past. The peer-review process was guided by an independent editor, and the authors also have no other competing interests to declare.
Publisher's note: Copernicus Publications remains neutral with regard to jurisdictional claims made in the text, published maps, institutional affiliations, or any other geographical representation in this paper. While Copernicus Publications makes every effort to include appropriate place names, the final responsibility lies with the authors.
This article is part of the special issue “Past vegetation dynamics and their role in past climate changes”. It is not associated with a conference.
We thank Anne Dallmeyer (MPI-M) for valuable input in an earlier version of the article. Furthermore, we acknowledge the helpful insights from Manuel Chevalier as the handling editor, from Shivangi Tiwari, and from an anonymous referee. Simulations are part of the “PalMod” project, funded by the German Federal Ministry of Education and Research (BMBF) through the Research for Sustainability (FONA) initiative. This work also contributes to the project “African and Asian Monsoon Margins” of the Cluster of Excellence EXC 2037: Climate, Climatic Change, and Society (CLICCS). This work used resources of the Deutsches Klimarechenzentrum (DKRZ) granted by its Scientific Steering Committee (WLA) under project ID bm1030. We thank the Integrated Climate Data Center (ICDC) of CEN at the University of Hamburg for providing data for Fig. C1 via the DKRZ data pool. Analyses and figures were produced using Python, including libraries NumPy, Matplotlib, cartopy, xarray, SciPy, pandas, statsmodels, and cftime.
This research has been supported by the Bundesministerium für Bildung, Wissenschaft, Forschung und Technologie (grant nos. 01LP1921A and 01LP1921B).
The article processing charges for this open-access publication were covered by the Max Planck Society.
This paper was edited by Manuel Chevalier and reviewed by Shivangi Tiwari and one anonymous referee.
Abe-Ouchi, A., Saito, F., Kawamura, K., Raymo, M. E., Okuno, J., Takahashi, K., and Blatter, H.: Insolation-driven 100,000-year glacial cycles and hysteresis of ice-sheet volume, Nature, 500, 190–193, https://doi.org/10.1038/nature12374, 2013. a
Adler, R., Wang, J.-J., Sapiano, M., Huffman, G., Chiu, L., Xie, P. P., Ferraro, R., Schneider, U., Becker, A., Bolvin, D., Nelkin, E., Gu, G., and NOAA CDR Program: Global Precipitation Climatology Project (GPCP) Climate Data Record (CDR), Version 2.3 (Monthly), NOAA National Centers for Environmental Information, https://doi.org/10.7289/V56971M6, 2016. a
Armstrong, E., Tallavaara, M., Hopcroft, P. O., and Valdes, P. J.: North African humid periods over the past 800,000 years, Nat. Commun., 14, 1–11, https://doi.org/10.1038/s41467-023-41219-4, 2023. a, b, c
Baret, F., Weiss, M., Lacaze, R., Camacho, F., Makhmara, H., Pacholcyzk, P., and Smets, B.: GEOV1: LAI and FAPAR essential climate variables and FCOVER global time series capitalizing over existing products. Part 1: Principles of development and production, Remote Sens. Environ., 137, 299–309, https://doi.org/10.1016/j.rse.2012.12.027, 2013. a
Bathiany, S., Claussen, M., and Brovkin, V.: CO2-induced Sahel greening in three CMIP5 Earth System Models, J. Climate, 27, 7163–7184, https://doi.org/10.1175/jcli-d-13-00528.1, 2014. a
Berger, A.: Long-term variations of daily insolation and Quaternary climatic changes, J. Atmos. Sci., 35, 2362–2367, https://doi.org/10.1175/1520-0469(1978)035<2362:LTVODI>2.0.CO;2, 1978. a, b, c, d
Blanchet, C. L., Osborne, A. H., Tjallingii, R., Ehrmann, W., Friedrich, T., Timmermann, A., Brückmann, W., and Frank, M.: Drivers of river reactivation in North Africa during the last glacial cycle, Nat. Geosci., 14, 97–103, https://doi.org/10.1038/s41561-020-00671-3, 2021. a, b
Blome, M. W., Cohen, A. S., Tryon, C. A., Brooks, A. S., and Russell, J.: The environmental context for the origins of modern human diversity: A synthesis of regional variability in African climate 150 000-30 000 years ago, J. Hum. Evol., 62, 563–592, https://doi.org/10.1016/j.jhevol.2012.01.011, 2012. a, b
Bony, S., Bellon, G., Klocke, D., Sherwood, S., Fermepin, S., and Denvil, S.: Robust direct effect of carbon dioxide on tropical circulation and regional precipitation, Nat. Geosci., 6, 447–451, https://doi.org/10.1038/ngeo1799, 2013. a
Brierley, C. M., Zhao, A., Harrison, S. P., Braconnot, P., Williams, C. J. R., Thornalley, D. J. R., Shi, X., Peterschmitt, J.-Y., Ohgaito, R., Kaufman, D. S., Kageyama, M., Hargreaves, J. C., Erb, M. P., Emile-Geay, J., D'Agostino, R., Chandan, D., Carré, M., Bartlein, P. J., Zheng, W., Zhang, Z., Zhang, Q., Yang, H., Volodin, E. M., Tomas, R. A., Routson, C., Peltier, W. R., Otto-Bliesner, B., Morozova, P. A., McKay, N. P., Lohmann, G., Legrande, A. N., Guo, C., Cao, J., Brady, E., Annan, J. D., and Abe-Ouchi, A.: Large-scale features and evaluation of the PMIP4-CMIP6 midHolocene simulations, Clim. Past, 16, 1847–1872, https://doi.org/10.5194/cp-16-1847-2020, 2020. a, b
Briggs, R. D., Pollard, D., and Tarasov, L.: A data-constrained large ensemble analysis of Antarctic evolution since the Eemian, Quaternary Sci. Rev., 103, 91–115, https://doi.org/10.1016/j.quascirev.2014.09.003, 2014. a
Brovkin, V. and Claussen, M.: Comment on “Climate-driven ecosystem succession in the Sahara: the past 6000 years”, Science, 322, 1326–1326, https://doi.org/10.1126/science.1163381, 2008. a
Brovkin, V., Claussen, M., Petoukhov, V., and Ganopolski, A.: On the stability of the atmosphere-vegetation system in the Sahara/Sahel region, J. Geophys. Res.-Atmos., 103, 31613–31624, https://doi.org/10.1029/1998jd200006, 1998. a
Brovkin, V., Raddatz, T., Reick, C. H., Claussen, M., and Gayler, V.: Global biogeophysical interactions between forest and climate, Geophys. Res. Lett., 36, 1–5, https://doi.org/10.1029/2009gl037543, 2009. a
Brovkin, V., Ganopolski, A., Archer, D., and Munhoven, G.: Glacial CO2 cycle as a succession of key physical and biogeochemical processes, Clim. Past, 8, 251–264, https://doi.org/10.5194/cp-8-251-2012, 2012. a
Brovkin, V., Boysen, L., Raddatz, T., Gayler, V., Loew, A., and Claussen, M.: Evaluation of vegetation cover and land-surface albedo in MPI-ESM CMIP5 simulations, J. Adv. Model. Earth Sy., 5, 48–57, https://doi.org/10.1029/2012MS000169, 2013. a
Camacho, F., Cernicharo, J., Lacaze, R., Baret, F., and Weiss, M.: GEOV1: LAI, FAPAR essential climate variables and FCOVER global time series capitalizing over existing products. Part 2: Validation and intercomparison with reference products, Remote Sens. Environ., 137, 310–329, https://doi.org/10.1016/j.rse.2013.02.030, 2013. a
Claussen, M., Brovkin, V., Ganopolski, A., Kubatzki, C., and Petoukhov, V.: Climate change in Northern Africa: The past is not the future, Climatic Change, 57, 99–118, https://doi.org/10.1023/a:1022115604225, 2003. a, b, c
Claussen, M., Dallmeyer, A., and Bader, J.: Theory and modeling of the African Humid Period and the Green Sahara, in: Oxford Research Encyclopedia of Climate Science, Oxford University Press, 1–40, https://doi.org/10.1093/acrefore/9780190228620.013.532, 2017. a, b, c
Crocker, A. J., Naafs, B. D. A., Westerhold, T., James, R. H., Cooper, M. J., Röhl, U., Pancost, R. D., Xuan, C., Osborne, C. P., Beerling, D. J., and Wilson, P. A.: Astronomically controlled aridity in the Sahara since at least 11 million years ago, Nat. Geosci., 15, 671–676, https://doi.org/10.1038/s41561-022-00990-7, 2022. a
D'Agostino, R., Bader, J., Bordoni, S., Ferreira, D., and Jungclaus, J.: Northern Hemisphere monsoon response to mid-Holocene orbital forcing and greenhouse gas-induced global warming, Geophys. Res. Lett., 46, 1591–1601, https://doi.org/10.1029/2018GL081589, 2019. a, b, c
Dallmeyer, A., Claussen, M., Lorenz, S. J., and Shanahan, T.: The end of the African humid period as seen by a transient comprehensive Earth system model simulation of the last 8000 years, Clim. Past, 16, 117–140, https://doi.org/10.5194/cp-16-117-2020, 2020. a, b, c, d, e, f
Dallmeyer, A., Kleinen, T., Claussen, M., Weitzel, N., Cao, X., and Herzschuh, U.: The deglacial forest conundrum, Nat. Commun., 13, 1–10, https://doi.org/10.1038/s41467-022-33646-6, 2022. a
deMenocal, P. B., Ortiz, J., Guilderson, T., Adkins, J., Sarnthein, M., Baker, L., and Yarusinsky, M.: Abrupt onset and termination of the African Humid Period: rapid climate responses to gradual insolation forcing, Quaternary Sci. Rev., 19, 347–361, https://doi.org/10.1016/s0277-3791(99)00081-5, 2000. a
Deplazes, G., Lückge, A., Peterson, L. C., Timmermann, A., Hamann, Y., Hughen, K. A., Röhl, U., Laj, C., Cane, M. A., Sigman, D. M., and Haug, G. H.: Links between tropical rainfall and North Atlantic climate during the last glacial period, Nat. Geosci., 6, 213–217, https://doi.org/10.1038/ngeo1712, 2013a. a, b, c, d
Deplazes, G., Lückge, A., Peterson, L. C., Timmermann, A., Hamann, Y., Hughen, K. A., Röhl, U., Laj, C. E., Cane, M. A., Sigman, D. M., and Haug, G. H.: Sediment total reflectance measurements from the Cariaco Basin (MD03-2621) and northeastern Arabian Sea (SO130-289KL), PANGAEA [data set], https://doi.org/10.1594/PANGAEA.815882, 2013b. a
Drake, N. A., Blench, R. M., Armitage, S. J., Bristow, C. S., and White, K. H.: Ancient watercourses and biogeography of the Sahara explain the peopling of the desert, P. Natl. Acad. Sci. USA, 108, 458–462, https://doi.org/10.1073/pnas.1012231108, 2011. a
Drake, N. A., Breeze, P. S., and Parker, A.: Palaeoclimate in the Saharan and Arabian Deserts during the Middle Palaeolithic and the potential for hominin dispersals, Quatern. Int., 300, 48–61, https://doi.org/10.1016/j.quaint.2012.12.018, 2013. a, b
Drake, N. A., Lem, R. E., Armitage, S. J., Breeze, P. S., Francke, J., El-Hawat, A. S., Salem, M. J., Hounslow, M. W., and White, K.: Reconstructing palaeoclimate and hydrological fluctuations in the Fezzan Basin (southern Libya) since 130 ka: A catchment-based approach, Quaternary Sci. Rev., 200, 376–394, https://doi.org/10.1016/j.quascirev.2018.09.042, 2018. a
Drake, N. A., Candy, I., Breeze, P. S., Armitage, S. J., Gasmi, N., Schwenninger, J. L., Peat, D., and Manning, K.: Sedimentary and geomorphic evidence of Saharan megalakes: A synthesis, Quaternary Sci. Rev., 276, 1–20, https://doi.org/10.1016/j.quascirev.2021.107318, 2022. a
Duque-Villegas, M.: Post-processed data and scripts for “Pattern scaling of simulated vegetation change in North Africa during glacial cycles”, Edmond, V1 [data set], https://doi.org/10.17617/3.HQTV1J, 2024. a
Duque-Villegas, M., Claussen, M., Brovkin, V., and Kleinen, T.: Effects of orbital forcing, greenhouse gases and ice sheets on Saharan greening in past and future multi-millennia, Clim. Past, 18, 1897–1914, https://doi.org/10.5194/cp-18-1897-2022, 2022. a, b, c, d, e, f, g, h, i
Ehrmann, W. and Schmiedl, G.: Nature and dynamics of North African humid and dry periods during the last 200,000 years documented in the clay fraction of Eastern Mediterranean deep-sea sediments, Quaternary Sci. Rev., 260, 1–17, https://doi.org/10.1016/j.quascirev.2021.106925, 2021a. a, b, c, d, e, f
Ehrmann, W. and Schmiedl, G.: Clay mineralogy of three sediment cores from the Eastern Mediterranean Sea, PANGAEA [data set], https://doi.org/10.1594/PANGAEA.923491, 2021b. a
Ehrmann, W., Schmiedl, G., Beuscher, S., and Krüger, S.: Intensity of African humid periods estimated from Saharan dust fluxes, PloS ONE, 12, 1–18, https://doi.org/10.1371/journal.pone.0170989, 2017. a
Emeis, K.-C., Sakamoto, T., Wehausen, R., and Brumsack, H.-J.: The sapropel record of the eastern Mediterranean Sea – results of Ocean Drilling Program Leg 160, Palaeogeogr. Palaeocl., 158, 371–395, https://doi.org/10.1016/S0031-0182(00)00059-6, 2000a. a, b, c
Emeis, K.-C., Sakamoto, T., Wehausen, R., and Brumsack, H.-J.: The sapropel record of the eastern Mediterranean Sea, PANGAEA [data set], https://doi.org/10.1594/PANGAEA.704622, 2000b. a
EPICA Community Members: Eight glacial cycles from an Antarctic ice core, Nature, 429, 623–628, https://doi.org/10.1038/nature02599, 2004. a
Eyring, V., Bony, S., Meehl, G. A., Senior, C. A., Stevens, B., Stouffer, R. J., and Taylor, K. E.: Overview of the Coupled Model Intercomparison Project Phase 6 (CMIP6) experimental design and organization, Geosci. Model Dev., 9, 1937–1958, https://doi.org/10.5194/gmd-9-1937-2016, 2016. a
Gaetani, M., Flamant, C., Bastin, S., Janicot, S., Lavaysse, C., Hourdin, F., Braconnot, P., and Bony, S.: West African monsoon dynamics and precipitation: the competition between global SST warming and CO2 increase in CMIP5 idealized simulations, Clim. Dynam., 48, 1353–1373, https://doi.org/10.1007/s00382-016-3146-z, 2017. a, b
Ganopolski, A. and Calov, R.: The role of orbital forcing, carbon dioxide and regolith in 100 kyr glacial cycles, Clim. Past, 7, 1415–1425, https://doi.org/10.5194/cp-7-1415-2011, 2011. a
Ganopolski, A., Calov, R., and Claussen, M.: Simulation of the last glacial cycle with a coupled climate ice-sheet model of intermediate complexity, Clim. Past, 6, 229–244, https://doi.org/10.5194/cp-6-229-2010, 2010. a
Ganopolski, A., Winkelmann, R., and Schellnhuber, H. J.: Critical insolation–CO2 relation for diagnosing past and future glacial inception, Nature, 529, 200–203, https://doi.org/10.1038/nature16494, 2016. a
Gasse, F.: Hydrological changes in the African tropics since the Last Glacial Maximum, Quaternary Sci. Rev., 19, 189–211, https://doi.org/10.1016/s0277-3791(99)00061-x, 2000. a
Giorgetta, M. A., Jungclaus, J., Reick, C. H., Legutke, S., Bader, J., Böttinger, M., Brovkin, V., Crueger, T., Esch, M., Fieg, K., Glushak, K., Gayler, V., Haak, H., Hollweg, H. D., Ilyina, T., Kinne, S., Kornblueh, L., Matei, D., Mauritsen, T., Mikolajewicz, U., Mueller, W., Notz, D., Pithan, F., Raddatz, T., Rast, S., Redler, R., Roeckner, E., Schmidt, H., Schnur, R., Segschneider, J., Six, K. D., Stockhause, M., Timmreck, C., Wegner, J., Widmann, H., Wieners, K. H., Claussen, M., Marotzke, J., and Stevens, B.: Climate and carbon cycle changes from 1850 to 2100 in MPI-ESM simulations for the Coupled Model Intercomparison Project phase 5, J. Adv. Model. Earth Sy., 5, 572–597, https://doi.org/10.1002/jame.20038, 2013. a
Grant, K. M., Rohling, E. J., Westerhold, T., Zabel, M., Heslop, D., Konijnendijk, T., and Lourens, L.: A 3 million year index for North African humidity/aridity and the implication of potential pan-African Humid periods, Quaternary Sci. Rev., 171, 100–118, https://doi.org/10.1016/j.quascirev.2017.07.005, 2017. a
Grant, K. M., Amarathunga, U., Amies, J. D., Hu, P., Qian, Y., Penny, T., Rodriguez-Sanz, L., Zhao, X., Heslop, D., Liebrand, D., Hennekam, R., Westerhold, T., Gilmore, S., Lourens, L. J., Roberts, A. P., and Rohling, E. J.: Organic carbon burial in Mediterranean sapropels intensified during Green Sahara Periods since 3.2 Myr ago, Communications Earth & Environment, 3, 1–9, https://doi.org/10.1038/s43247-021-00339-9, 2022. a, b, c, d, e, f
Hély, C., Lézine, A.-M., and contributors, A.: Holocene changes in African vegetation: tradeoff between climate and water availability, Clim. Past, 10, 681–686, https://doi.org/10.5194/cp-10-681-2014, 2014. a
Holden, P. B., Edwards, N. R., Rangel, T. F., Pereira, E. B., Tran, G. T., and Wilkinson, R. D.: PALEO-PGEM v1.0: a statistical emulator of Pliocene–Pleistocene climate, Geosci. Model Dev., 12, 5137–5155, https://doi.org/10.5194/gmd-12-5137-2019, 2019. a
Hopcroft, P. O. and Valdes, P. J.: Paleoclimate-conditioning reveals a North Africa land-atmosphere tipping point, P. Natl. Acad. Sci. USA, 118, 1–7, https://doi.org/10.1073/pnas.2108783118, 2021. a
Integrated Climate Data Center (ICDC): Vegetation Cover Fraction from SPOT/PROBA-V/S3-OLCI, Center for Earth System Research and Sustainability (CEN), University of Hamburg [data set], https://www.cen.uni-hamburg.de/icdc/data/land/vegetation-cover-fraction, last access: 10 March 2024a. a
Integrated Climate Data Center (ICDC): Global Precipitation from satellite and gauge measurements from GPCP, Center for Earth System Research and Sustainability (CEN), University of Hamburg [data set], https://www.cen.uni-hamburg.de/icdc/data/atmosphere/gpcp, last access: 10 March 2024b. a
Intergovernmental Panel on Climate Change (IPCC): Climate Change 2021 – The Physical Science Basis: Working Group I Contribution to the Sixth Assessment Report of the Intergovernmental Panel on Climate Change, edited by: Masson-Delmotte, V., Zhai, P., Pirani, A., Connors, S. L., Péan, C., Chen, Y., Goldfarb, L., Gomis, M. I., Matthews, J. B. R., Berger, S., Huang, M., Yelekçi, O., Yu, R., Zhou, B., Lonnoy, E., Maycock, T. K., Waterfield, T., Leitzell, K., and Caud, N., Cambridge University Press, Cambridge, United Kingdom and New York, NY, USA, ISBN 9781009157896, https://doi.org/10.1017/9781009157896, 2023. a
Jungclaus, J. H., Fischer, N., Haak, H., Lohmann, K., Marotzke, J., Matei, D., Mikolajewicz, U., Notz, D., and von Storch, J. S.: Characteristics of the ocean simulations in the Max Planck Institute Ocean Model (MPIOM) the ocean component of the MPI-Earth system model, J. Adv. Model. Earth Sy., 5, 422–446, https://doi.org/10.1002/jame.20023, 2013. a
Kaboth-Bahr, S., Gosling, W. D., Vogelsang, R., Bahr, A., Scerri, E. M. L., Asrat, A., Cohen, A. S., Düsing, W., Foerster, V., Lamb, H. F., Maslin, M. A., Roberts, H. M., Schäbitz, F., and Trauth, M. H.: Paleo-ENSO influence on African environments and early modern humans, P. Natl. Acad. Sci. USA, 118, 1–6, https://doi.org/10.1073/pnas.2018277118, 2021. a
Kapsch, M.-L., Mikolajewicz, U., Ziemen, F., and Schannwell, C.: Ocean response in transient simulations of the last deglaciation dominated by underlying ice-sheet reconstruction and method of meltwater distribution, Geophys. Res. Lett., 49, 1–11, https://doi.org/10.1029/2021gl096767, 2022. a, b
Kinne, S., O'Donnel, D., Stier, P., Kloster, S., Zhang, K., Schmidt, H., Rast, S., Giorgetta, M., Eck, T. F., and Stevens, B.: MAC-v1: A new global aerosol climatology for climate studies, J. Adv. Model. Earth Sy., 5, 704–740, https://doi.org/10.1002/jame.20035, 2013. a
Kleinen, T., Gromov, S., Steil, B., and Brovkin, V.: Atmospheric methane underestimated in future climate projections, Environ. Res. Lett., 16, 1–12, https://doi.org/10.1088/1748-9326/ac1814, 2021. a
Kleinen, T., Gromov, S., Steil, B., and Brovkin, V.: Atmospheric methane since the last glacial maximum was driven by wetland sources, Clim. Past, 19, 1081–1099, https://doi.org/10.5194/cp-19-1081-2023, 2023. a, b
Köhler, P., Nehrbass-Ahles, C., Schmitt, J., Stocker, T. F., and Fischer, H.: A 156 kyr smoothed history of the atmospheric greenhouse gases CO2, CH4, and N2O and their radiative forcing, Earth Syst. Sci. Data, 9, 363–387, https://doi.org/10.5194/essd-9-363-2017, 2017. a, b
Krapp, M.: Terrestrial Climate of the Last 800,000 Years, OSF [data set], https://doi.org/10.17605/OSF.IO/8N43X, 2023. a
Krapp, M., Beyer, R. M., Edmundson, S. L., Valdes, P. J., and Manica, A.: A statistics-based reconstruction of high-resolution global terrestrial climate for the last 800,000 years, Scientific Data, 8, 1–18, https://doi.org/10.1038/s41597-021-01009-3, 2021. a, b, c, d
Kutzbach, J. E., Liu, X., Liu, Z., and Chen, G.: Simulation of the evolutionary response of global summer monsoons to orbital forcing over the past 280,000 years, Clim. Dynam., 30, 567–579, https://doi.org/10.1007/s00382-007-0308-z, 2008. a, b
Kutzbach, J. E., Guan, J., He, F., Cohen, A. S., Orland, I. J., and Chen, G.: African climate response to orbital and glacial forcing in 140,000-y simulation with implications for early modern human environments, P. Natl. Acad. Sci. USA, 117, 2255–2264, https://doi.org/10.1073/pnas.1917673117, 2020. a, b
Larrasoaña, J. C.: A review of West African monsoon penetration during Green Sahara periods – implications for human evolution and dispersals over the last three million years, Oxford Open Climate Change, 1, 1–19, https://doi.org/10.1093/oxfclm/kgab011, 2021. a
Larrasoaña, J. C., Roberts, A. P., and Rohling, E. J.: Dynamics of green Sahara periods and their role in hominin evolution, PLoS ONE, 8, 1–12, https://doi.org/10.1371/journal.pone.0076514, 2013. a, b
Lézine, A.-M., Hély, C., Grenier, C., Braconnot, P., and Krinner, G.: Sahara and Sahel vulnerability to climate changes, lessons from Holocene hydrological data, Quaternary Sci. Rev., 30, 3001–3012, https://doi.org/10.1016/j.quascirev.2011.07.006, 2011. a
Lisiecki, L. E. and Raymo, M. E.: A Pliocene-Pleistocene stack of 57 globally distributed benthic δ18O records, Paleoceanography, 20, 1–17, https://doi.org/10.1029/2004pa001071, 2005a. a, b, c
Lisiecki, L. E. and Raymo, M. E.: Pliocene-Pleistocene stack of globally distributed benthic stable oxygen isotope records, PANGAEA [data set], https://doi.org/10.1594/PANGAEA.704257, 2005b. a
Loulergue, L., Schilt, A., Spahni, R., Masson-Delmotte, V., Blunier, T., Lemieux, B., Barnola, J.-M., Raynaud, D., Stocker, T. F., and Chappellaz, J.: Orbital and millennial-scale features of atmospheric CH4 over the past 800,000 years, Nature, 453, 383–386, https://doi.org/10.1038/nature06950, 2008. a
Loulergue, L., Schilt, A., Spahni, R., Masson-Delmotte, V., Blunier, T., Lemieux-Dudon, B., Barnola, J.-M., Raynaud, D., Stocker, T. F., and Chappellaz, J. A.: NOAA/WDS Paleoclimatology – EPICA Dome C – 800KYr Methane Data, NOAA National Centers for Environmental Information [data set], https://doi.org/10.25921/gfsj-jc86, 2009. a
Lunt, D. J., Abe-Ouchi, A., Bakker, P., Berger, A., Braconnot, P., Charbit, S., Fischer, N., Herold, N., Jungclaus, J. H., Khon, V. C., Krebs-Kanzow, U., Langebroek, P. M., Lohmann, G., Nisancioglu, K. H., Otto-Bliesner, B. L., Park, W., Pfeiffer, M., Phipps, S. J., Prange, M., Rachmayani, R., Renssen, H., Rosenbloom, N., Schneider, B., Stone, E. J., Takahashi, K., Wei, W., Yin, Q., and Zhang, Z. S.: A multi-model assessment of last interglacial temperatures, Clim. Past, 9, 699–717, https://doi.org/10.5194/cp-9-699-2013, 2013. a
Lüthi, D., Floch, M. L., Bereiter, B., Blunier, T., Barnola, J.-M., Siegenthaler, U., Raynaud, D., Jouzel, J., Fischer, H., Kawamura, K., and Stocker, T. F.: High-resolution carbon dioxide concentration record 650,000–800,000 years before present, Nature, 453, 379–382, https://doi.org/10.1038/nature06949, 2008a. a, b
Lüthi, D., Le Floch, M., Bereiter, B., Blunier, T., Barnola, J.-M., Siegenthaler, U., Raynaud, D., Jouzel, J., Fischer, H., Kawamura, K., and Stocker, T. F.: NOAA/WDS Paleoclimatology – EPICA Dome C – 800KYr CO2 Data, NOAA National Centers for Environmental Information [data set], https://doi.org/10.25921/xgzs-gd10, 2008b. a
Mauritsen, T., Bader, J., Becker, T., Behrens, J., Bittner, M., Brokopf, R., Brovkin, V., Claussen, M., Crueger, T., Esch, M., Fast, I., Fiedler, S., Fläschner, D., Gayler, V., Giorgetta, M., Goll, D. S., Haak, H., Hagemann, S., Hedemann, C., Hohenegger, C., Ilyina, T., Jahns, T., Jimenéz-de-la-Cuesta, D., Jungclaus, J., Kleinen, T., Kloster, S., Kracher, D., Kinne, S., Kleberg, D., Lasslop, G., Kornblueh, L., Marotzke, J., Matei, D., Meraner, K., Mikolajewicz, U., Modali, K., Möbis, B., Müller, W. A., Nabel, J. E. M. S., Nam, C. C. W., Notz, D., Nyawira, S., Paulsen, H., Peters, K., Pincus, R., Pohlmann, H., Pongratz, J., Popp, M., Raddatz, T. J., Rast, S., Redler, R., Reick, C. H., Rohrschneider, T., Schemann, V., Schmidt, H., Schnur, R., Schulzweida, U., Six, K. D., Stein, L., Stemmler, I., Stevens, B., Storch, J. v., Tian, F., Voigt, A., Vrese, P., Wieners, K., Wilkenskjeld, S., Winkler, A., and Roeckner, E.: Developments in the MPI-M Earth System Model version 1.2 (MPI-ESM1.2) and its response to increasing CO2, J. Adv. Model. Earth Sy., 11, 998–1038, https://doi.org/10.1029/2018MS001400, 2019. a
McGee, D., deMenocal, P. B., Winckler, G., Stuut, J.-B. W., and Bradtmiller, L. I.: The magnitude, timing and abruptness of changes in North African dust deposition over the last 20,000 yr, Earth Planet. Sc. Lett., 371, 163–176, https://doi.org/10.1016/j.epsl.2013.03.054, 2013. a
Meccia, V. L. and Mikolajewicz, U.: Interactive ocean bathymetry and coastlines for simulating the last deglaciation with the Max Planck Institute Earth System Model (MPI-ESM-v1.2), Geosci. Model Dev., 11, 4677–4692, https://doi.org/10.5194/gmd-11-4677-2018, 2018. a, b
Meinshausen, M., Nicholls, Z. R. J., Lewis, J., Gidden, M. J., Vogel, E., Freund, M., Beyerle, U., Gessner, C., Nauels, A., Bauer, N., Canadell, J. G., Daniel, J. S., John, A., Krummel, P. B., Luderer, G., Meinshausen, N., Montzka, S. A., Rayner, P. J., Reimann, S., Smith, S. J., van den Berg, M., Velders, G. J. M., Vollmer, M. K., and Wang, R. H. J.: The shared socio-economic pathway (SSP) greenhouse gas concentrations and their extensions to 2500, Geosci. Model Dev., 13, 3571–3605, https://doi.org/10.5194/gmd-13-3571-2020, 2020. a
Menviel, L., Capron, E., Govin, A., Dutton, A., Tarasov, L., Abe-Ouchi, A., Drysdale, R. N., Gibbard, P. L., Gregoire, L., He, F., Ivanovic, R. F., Kageyama, M., Kawamura, K., Landais, A., Otto-Bliesner, B. L., Oyabu, I., Tzedakis, P. C., Wolff, E., and Zhang, X.: The penultimate deglaciation: protocol for Paleoclimate Modelling Intercomparison Project (PMIP) phase 4 transient numerical simulations between 140 and 127 ka, version 1.0, Geosci. Model Dev., 12, 3649–3685, https://doi.org/10.5194/gmd-12-3649-2019, 2019. a
Menviel, L., Govin, A., Avenas, A., Meissner, K. J., Grant, K. M., and Tzedakis, P. C.: Drivers of the evolution and amplitude of African Humid Periods, Communications Earth & Environment, 2, 1–11, https://doi.org/10.1038/s43247-021-00309-1, 2021. a, b, c
Mikolajewicz, U., Ziemen, F., Cioni, G., Claussen, M., Fraedrich, K., Heidkamp, M., Hohenegger, C., Jimenez de la Cuesta, D., Kapsch, M.-L., Lemburg, A., Mauritsen, T., Meraner, K., Röber, N., Schmidt, H., Six, K. D., Stemmler, I., Tamarin-Brodsky, T., Winkler, A., Zhu, X., and Stevens, B.: The climate of a retrograde rotating Earth, Earth Syst. Dynam., 9, 1191–1215, https://doi.org/10.5194/esd-9-1191-2018, 2018. a
Milankovitch, M.: Kanon der Erdbestrahlung und seine Anwendung auf das Eiszeitenproblem, vol. 33 of Section des sciences mathémathiques et naturelles, Königlich Serbische Akademie, Belgrad, 1941. a
Osman, M. B., Tierney, J. E., Zhu, J., Tardif, R., Hakim, G. J., King, J., and Poulsen, C. J.: Globally resolved surface temperatures since the Last Glacial Maximum, Nature, 599, 239–244, https://doi.org/10.1038/s41586-021-03984-4, 2021. a
Otto-Bliesner, B. L., Brady, E. C., Zhao, A., Brierley, C. M., Axford, Y., Capron, E., Govin, A., Hoffman, J. S., Isaacs, E., Kageyama, M., Scussolini, P., Tzedakis, P. C., Williams, C. J. R., Wolff, E., Abe-Ouchi, A., Braconnot, P., Ramos Buarque, S., Cao, J., de Vernal, A., Guarino, M. V., Guo, C., LeGrande, A. N., Lohmann, G., Meissner, K. J., Menviel, L., Morozova, P. A., Nisancioglu, K. H., O'ishi, R., Salas y Mélia, D., Shi, X., Sicard, M., Sime, L., Stepanek, C., Tomas, R., Volodin, E., Yeung, N. K. H., Zhang, Q., Zhang, Z., and Zheng, W.: Large-scale features of Last Interglacial climate: results from evaluating the lig127k simulations for the Coupled Model Intercomparison Project (CMIP6)–Paleoclimate Modeling Intercomparison Project (PMIP4), Clim. Past, 17, 63–94, https://doi.org/10.5194/cp-17-63-2021, 2021. a, b
Pausata, F. S. R., Gaetani, M., Messori, G., Berg, A., de Souza, D. M., Sage, R. F., and deMenocal, P. B.: The greening of the Sahara: Past changes and future implications, One Earth, 2, 235–250, https://doi.org/10.1016/j.oneear.2020.03.002, 2020. a, b
Petit, J. R., Jouzel, J., Raynaud, D., Barkov, N. I., Barnola, J.-M., Basile, I., Bender, M., Chappellaz, J., Davis, M., Delaygue, G., Delmotte, M., Kotlyakov, V. M., Legrand, M., Lipenkov, V. Y., Lorius, C., Pépin, L., Ritz, C., Saltzman, E., and Stievenard, M.: Climate and atmospheric history of the past 420,000 years from the Vostok ice core, Antarctica, Nature, 399, 429–436, https://doi.org/10.1038/20859, 1999. a
Prell, W. L. and Kutzbach, J. E.: Monsoon variability over the past 150,000 years, J. Geophys. Res., 92, 8411–8425, https://doi.org/10.1029/JD092iD07p08411, 1987. a, b
Railsback, L. B., Gibbard, P. L., Head, M. J., Voarintsoa, N. R. G., and Toucanne, S.: An optimized scheme of lettered marine isotope substages for the last 1.0 million years, and the climatostratigraphic nature of isotope stages and substages, Quaternary Sci. Rev., 111, 94–106, https://doi.org/10.1016/j.quascirev.2015.01.012, 2015. a, b
Reick, C. H., Raddatz, T., Brovkin, V., and Gayler, V.: Representation of natural and anthropogenic land cover change in MPI-ESM, J. Adv. Model. Earth Sy., 5, 459–482, https://doi.org/10.1002/jame.20022, 2013. a, b
Riddick, T., Brovkin, V., Hagemann, S., and Mikolajewicz, U.: Dynamic hydrological discharge modelling for coupled climate model simulations of the last glacial cycle: the MPI-DynamicHD model version 3.0, Geosci. Model Dev., 11, 4291–4316, https://doi.org/10.5194/gmd-11-4291-2018, 2018. a, b
Rossignol-Strick, M.: African monsoons, an immediate climate response to orbital insolation, Nature, 304, 46–49, https://doi.org/10.1038/304046a0, 1983. a, b, c, d, e, f, g
Scerri, E. M. L., Drake, N. A., Jennings, R., and Groucutt, H. S.: Earliest evidence for the structure of Homo sapiens populations in Africa, Quaternary Sci. Rev., 101, 207–216, https://doi.org/10.1016/j.quascirev.2014.07.019, 2014. a
Scerri, E. M. L., Thomas, M. G., Manica, A., Gunz, P., Stock, J. T., Stringer, C., Grove, M., Groucutt, H. S., Timmermann, A., Rightmire, G. P., d'Errico, F., Tryon, C. A., Drake, N. A., Brooks, A. S., Dennell, R. W., Durbin, R., Henn, B. M., Lee-Thorp, J., deMenocal, P. B., Petraglia, M. D., Thompson, J. C., Scally, A., and Chikhi, L.: Did our species evolve in subdivided populations across Africa, and why does it matter?, Trends Ecol. Evol., 33, 582–594, https://doi.org/10.1016/j.tree.2018.05.005, 2018. a
Schilt, A., Baumgartner, M., Blunier, T., Schwander, J., Spahni, R., Fischer, H., and Stocker, T. F.: Glacial-interglacial and millennial-scale variations in the atmospheric nitrous oxide concentration during the last 800,000 years, Quaternary Sci. Rev., 29, 182–192, https://doi.org/10.1016/j.quascirev.2009.03.011, 2010a. a
Schilt, A., Baumgartner, M., Blunier, T., Schwander, J., Spahni, R., Fischer, H., and Stocker, T. F.: NOAA/WDS Paleoclimatology – EPICA Dronning Maud Land,EPICA Dome C – 140KYr N2O Data, 800KYr N2O Data, NOAA National Centers for Environmental Information [data set], https://doi.org/10.25921/yxhy-3g37, 2010b. a
Scussolini, P., Bakker, P., Guo, C., Stepanek, C., Zhang, Q., Braconnot, P., Cao, J., Guarino, M.-V., Coumou, D., Prange, M., Ward, P. J., Renssen, H., Kageyama, M., Otto-Bliesner, B. L., and Aerts, J. C. J. H.: Agreement between reconstructed and modeled boreal precipitation of the Last Interglacial, Science Advances, 5, 1–11, https://doi.org/10.1126/sciadv.aax7047, 2019. a
Shanahan, T. M., McKay, N. P., Hughen, K. A., Overpeck, J. T., Otto-Bliesner, B. L., Heil, C. W., King, J., Scholz, C. A., and Peck, J.: The time-transgressive termination of the African Humid Period, Nat. Geosci., 8, 140–144, https://doi.org/10.1038/ngeo2329, 2015. a
Singarayer, J. S. and Burrough, S. L.: Interhemispheric dynamics of the African rainbelt during the late Quaternary, Quaternary Sci. Rev., 124, 48–67, https://doi.org/10.1016/j.quascirev.2015.06.021, 2015. a, b
Skonieczny, C., McGee, D., Winckler, G., Bory, A., Bradtmiller, L. I., Kinsley, C. W., Polissar, P. J., Pol-Holz, R. D., Rossignol, L., and Malaizé, B.: Monsoon-driven Saharan dust variability over the past 240,000 years, Science Advances, 5, 1–8, https://doi.org/10.1126/sciadv.aav1887, 2019. a, b, c, d
Stevens, B., Giorgetta, M., Esch, M., Mauritsen, T., Crueger, T., Rast, S., Salzmann, M., Schmidt, H., Bader, J., Block, K., Brokopf, R., Fast, I., Kinne, S., Kornblueh, L., Lohmann, U., Pincus, R., Reichler, T., and Roeckner, E.: Atmospheric component of the MPI-M Earth system model: ECHAM6, J. Adv. Model. Earth Sy., 5, 146–172, https://doi.org/10.1002/jame.20015, 2013. a
Tarasov, L. and Peltier, W. R.: Greenland glacial history and local geodynamic consequences, Geophys. J. Int., 150, 198–229, https://doi.org/10.1046/j.1365-246x.2002.01702.x, 2002. a
Tarasov, L., Dyke, A. S., Neal, R. M., and Peltier, W. R.: A data-calibrated distribution of deglacial chronologies for the North American ice complex from glaciological modeling, Earth Planet. Sc. Lett., 315, 30–40, https://doi.org/10.1016/j.epsl.2011.09.010, 2012. a
Tarasov, L., Hughes, A., Gyllencreutz, R., Lohne, O. S., Mangerud, J., and Svendsen, J.-I.: The global GLAC-1C deglaciation chronology, melwater pulse 1-a, and a question of missing ice, in: IGS Symposium on Contribution of Glaciers and Ice Sheets to Sea-Level Change, Chamonix-Mont-Blanc, France, 26–30 May 2014, https://web.archive.org/web/20151201210642/http://www.igsoc.org/symposia/2014/chamonix/proceedings/procsfiles/procabstracts_65.htm#A1112 (last access: 4 April 2025), 2014. a
Tierney, J. E., deMenocal, P. B., and Zander, P. D.: A climatic context for the out-of-Africa migration, Geology, 45, 1023–1026, https://doi.org/10.1130/G39457.1, 2017a. a, b, c, d
Tierney, J. E., Pausata, F. S. R., and deMenocal, P. B.: Rainfall regimes of the Green Sahara, Science Advances, 3, 1–9, https://doi.org/10.1126/sciadv.1601503, 2017b. a
Tierney, J. E., deMenocal, P. B., and Zander, P. D.: NOAA/WDS Paleoclimatology – Gulf of Aden 200,000 Year Stable Isotope and Alkenone SST Data, NOAA National Centers for Environmental Information [data set], https://doi.org/10.25921/k92a-8583, 2017c. a
Tierney, J. E., Poulsen, C. J., Montañez, I. P., Bhattacharya, T., Feng, R., Ford, H. L., Hönisch, B., Inglis, G. N., Petersen, S. V., Sagoo, N., Tabor, C. R., Thirumalai, K., Zhu, J., Burls, N. J., Foster, G. L., Goddéris, Y., Huber, B. T., Ivany, L. C., Turner, S. K., Lunt, D. J., McElwain, J. C., Mills, B. J. W., Otto-Bliesner, B. L., Ridgwell, A., and Zhang, Y. G.: Past climates inform our future, Science, 370, 1–9, https://doi.org/10.1126/science.aay3701, 2020a. a
Tierney, J. E., Zhu, J., King, J., Malevich, S. B., Hakim, G. J., and Poulsen, C. J.: Glacial cooling and climate sensitivity revisited, Nature, 584, 569–573, https://doi.org/10.1038/s41586-020-2617-x, 2020b. a
Tjallingii, R., Claussen, M., Stuut, J.-B. W., Fohlmeister, J., Jahn, A., Bickert, T., Lamy, F., and Röhl, U.: Coherent high- and low-latitude control of the northwest African hydrological balance, Nat. Geosci., 1, 670–675, https://doi.org/10.1038/ngeo289, 2008. a, b
Tuenter, E., Weber, S. L., Hilgen, F. J., and Lourens, L. J.: The response of the African summer monsoon to remote and local forcing due to precession and obliquity, Global Planet. Change, 36, 219–235, https://doi.org/10.1016/s0921-8181(02)00196-0, 2003. a
Turney, C. S. M., Jones, R. T., McKay, N. P., van Sebille, E., Thomas, Z. A., Hillenbrand, C.-D., and Fogwill, C. J.: A global mean sea surface temperature dataset for the Last Interglacial (129–116 ka) and contribution of thermal expansion to sea level change, Earth Syst. Sci. Data, 12, 3341–3356, https://doi.org/10.5194/essd-12-3341-2020, 2020. a
Wilkinson, R. D.: Bayesian calibration of expensive multivariate computer experiments, Chap. 10, in: Large‐Scale Inverse Problems and Quantification of Uncertainty, edited by: Biegler, L., Biros, G., Ghattas, O., Heinkenschloss, M., Keyes, D., Mallick, B., Marzouk, Y., Tenorio, L., van Bloemen Waanders, B., and Willcox, K., John Wiley & Sons, ISBN 9780470697436, 195–215, https://doi.org/10.1002/9780470685853.ch10, 2010. a
Yacoub, A. N., Sylvestre, F., Moussa, A., Hoelzmann, P., Alexandre, A., Dinies, M., Chalié, F., Vallet-Coulomb, C., Paillès, C., Darius, F., Sonzogni, C., Couapel, M., Mazur, J.-C., and Kröpelin, S.: The African Holocene Humid Period in the Tibesti mountains (central Sahara, Chad): Climate reconstruction inferred from fossil diatoms and their oxygen isotope composition, Quaternary Sci. Rev., 308, 1–17, https://doi.org/10.1016/j.quascirev.2023.108099, 2023. a
- Abstract
- Introduction
- Methods
- Results
- Discussion
- Conclusions
- Appendix A: Backwards extension of transient simulation
- Appendix B: Background climate near simulated AHPs
- Appendix C: Comparison to present-day observations
- Code and data availability
- Author contributions
- Competing interests
- Disclaimer
- Special issue statement
- Acknowledgements
- Financial support
- Review statement
- References